Exhibit 99.1
Renewable Energy as a Service
Legal Disclaimer * This presentation contains forward-looking statements within the meaning of the Private Securities Litigation Reform Act of 1995. These forward-looking statements include, but are not limited to, statements about (i) iSun’s plans, objectives, expectations and intentions and other statements contained in this presentation that are not historical facts; and (ii) other statements identified by words such as “expects” “anticipates,” “intends,” “plans,” “believes,” “seeks,” “estimates,” “targets,” “projects,” or words of similar meaning generally intended to identify forward-looking statements. These forward-looking statements are based upon the current beliefs and expectations of the respective management of iSun and are inherently subject to significant business, economic and competitive uncertainties and contingencies, many of which are beyond the control of iSun. In addition, these forward-looking statements are subject to assumptions with respect to future business strategies and decisions that are subject to change. Actual results may differ materially from the anticipated results discussed in these forward-looking statements because of possible uncertainties.
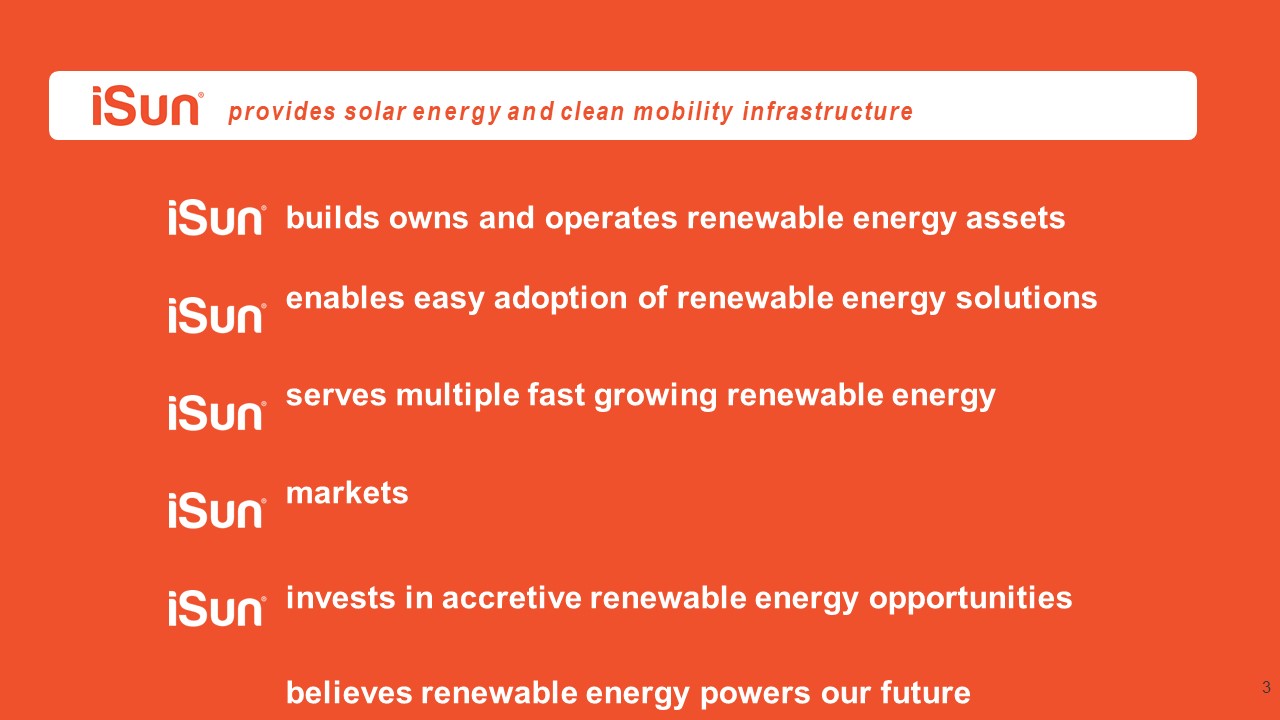
builds owns and operates renewable energy assetsenables easy adoption of renewable energy solutions serves multiple fast growing renewable energy marketsinvests in accretive renewable energy opportunities believes renewable energy powers our future provides solar energy and clean mobility infrastructure *

Leading Player In Clean Energy Infrastructure 1972Family owned and operated residential electric contractor 1979Transitioned from residential to commercial and industrial 1984Added data and communication services 1999Jeff Peck purchases the business 2009Adds solar installation services with 30KW solar project 1988 1994 Kip Myrick joins Jeff Peck joins company; Current EVP company; Current of Solar and COO Chairman and CEO 2019Listed on NASDAQ via SPAC 2020Peck Electric acquires iSUN Energy LLC; Rebrands as iSun, Inc 2020Expansion begins in North East Company Overview 2020 Revenue Mix by Market Key Market and Financial Data* Leading solar energy and clean mobility infrastructure company with 50 years of historyKey markets include commercial and utility scale solar, solar carports for electric vehicle charging (“EV”)Headquartered in Williston, VTListed on Nasdaq via SPAC merger in 2019;changed ticker in 2021 to ISUN Market Capitalization:Total Debt:Total Cash (March 12, 2021):2020 Revenue:2020 Backlog: $138 million$4.5 million$21 million$21million$61 million Solar82% Data & Networking 6% Electric 12% * * Market data as of March 22, 2021; Total debt as of 4Q20
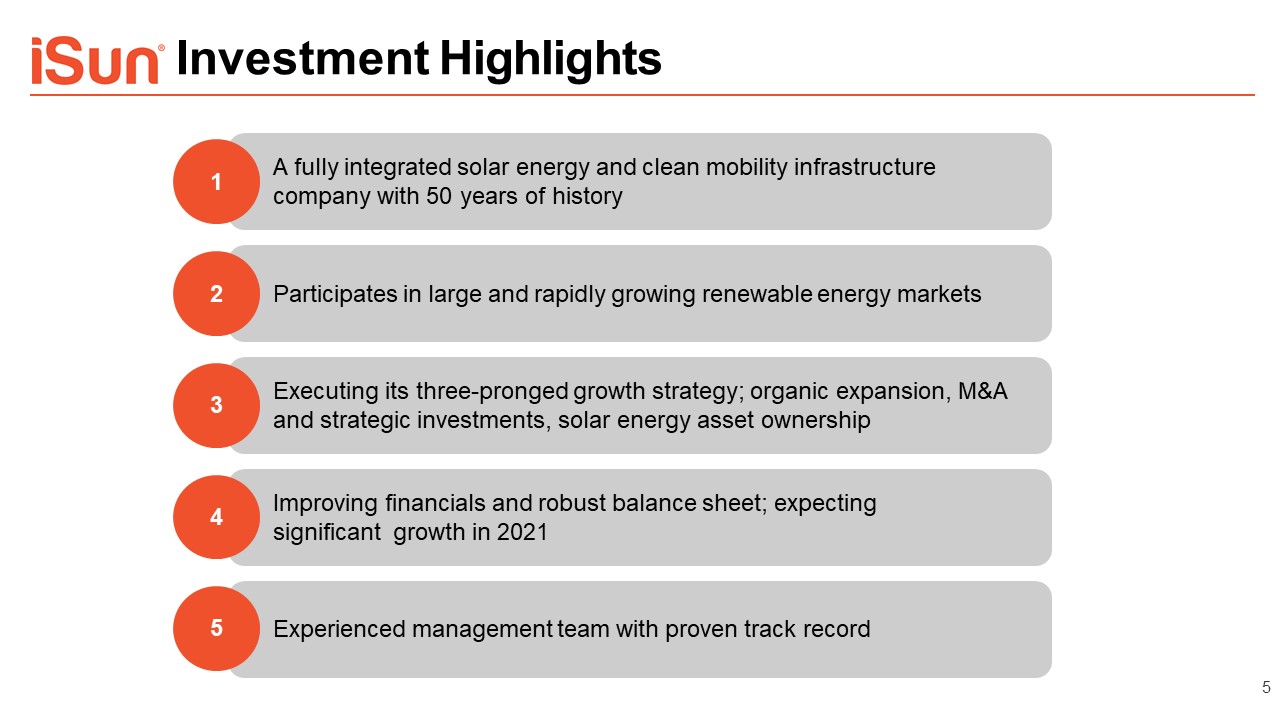
Investment Highlights A fully integrated solar energy and clean mobility infrastructure company with 50 years of history 2 Participates in large and rapidly growing renewable energy markets Executing its three-pronged growth strategy; organic expansion, M&A and strategic investments, solar energy asset ownership Improving financials and robust balance sheet; expecting significant growth in 2021 5 Experienced management team with proven track record 1 3 4 *
Investment Highlights and Strategy

EPCSolarElectricData + Telecom Renewable Energy as a ServiceSolar + Storage Smart Cities Microgrids DREV Charging/mobility/fleets Financing Company-Owned AssetsRecurring revenue Off-balance sheet 7 A Fully Integrated Renewable Energy Company Designs and engineers the site and renewable energy systemProcures all materials including solar panels, inverters, batteries, racking and equipmentProvides skilled labor and project managementOperations & maintenance Solar EV Carports + Storage (on and off grid)Smart City innovationsTurn-key EV infrastructure for high-mileage EV networksSoftware Enhances access to project growth capital through additional EPC opportunitiesOpportunity to own and operate solar assetsProvides stable base of recurring revenue and cash flow
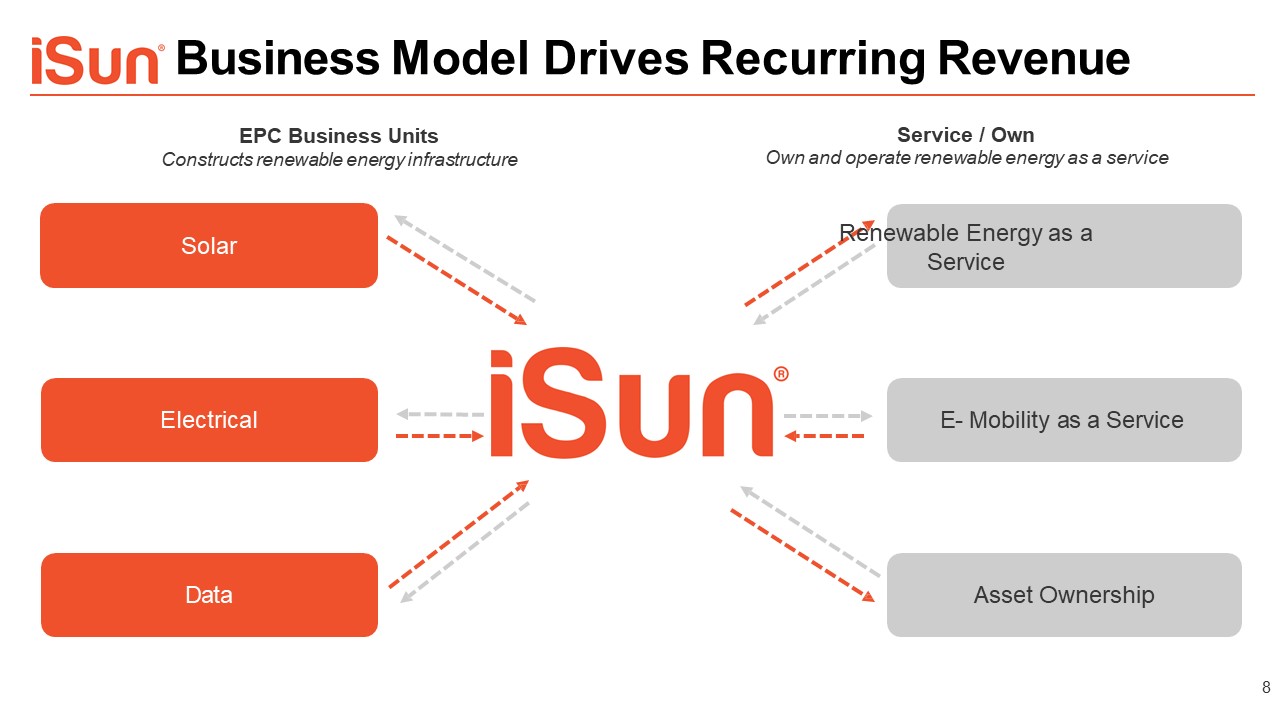
Business Model Drives Recurring Revenue EPC Business UnitsConstructs renewable energy infrastructure Solar Electrical Data Service / OwnOwn and operate renewable energy as a serviceRenewable Energy as aService E- Mobility as a Service Asset Ownership *

Solar Project Partnership Solar Project Partnership (“SPP”) Green Bond Platform GreenBonds GreenBonds Green Bonds Refinance to own or sell asset (COD) Construct(Value ↑) Buy / Develop to NTP Green Bonds provide capital to acquire a Solar Project LLC at notice to proceed (NTP) * iSun constructs to commercial operation date (COD) and recognizes all EPC revenue paid by SPP SPP can refinance Solar Project LLC to repay Green Bonds or sell/securitize Solar Project Portfolio Green Bond platform raises capital via Retail and Institutional Markets Green Bond pays competitive yields to Green Bond investors Green Bonds are asset- backed and follow ICMA Green Bond Principals Green Bonds Partnership is a Unique Differentiator
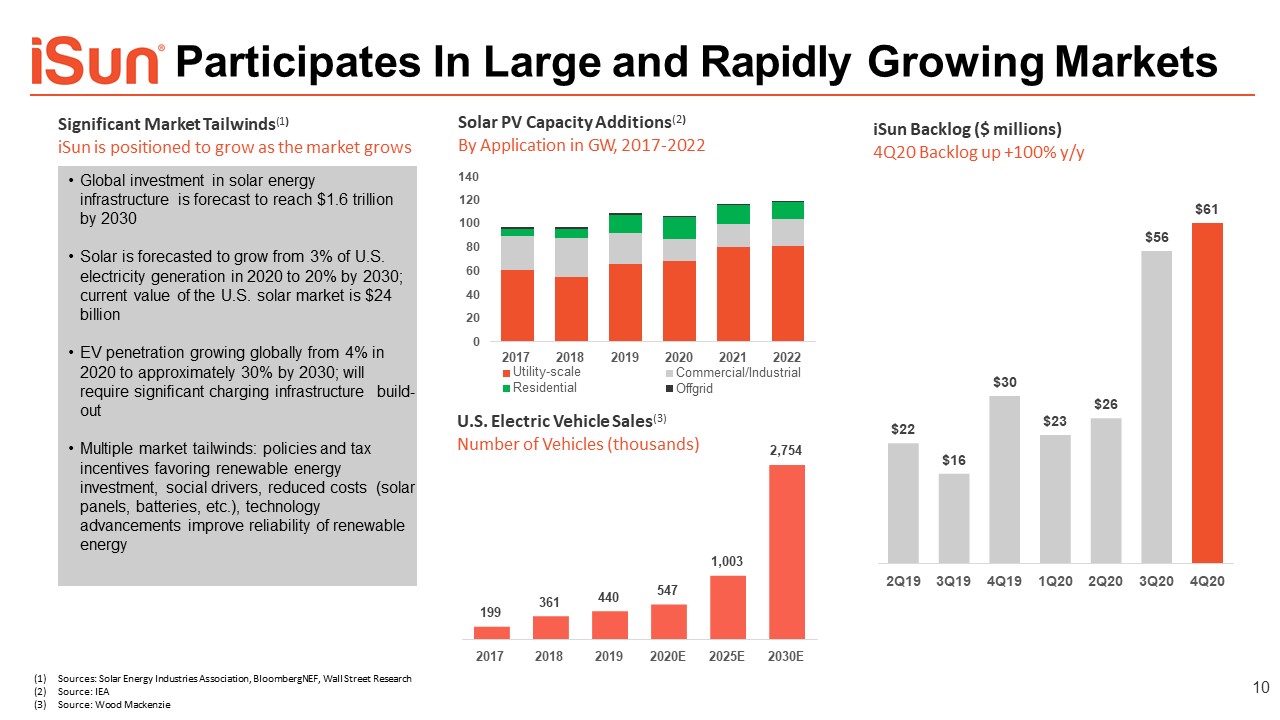
Solar PV Capacity Additions(2)By Application in GW, 2017-2022140 iSun Backlog ($ millions)4Q20 Backlog up +100% y/y Sources: Solar Energy Industries Association, BloombergNEF, Wall Street ResearchSource: IEASource: Wood Mackenzie 10 Participates In Large and Rapidly Growing Markets $22 $16 $30 $23 $26 $56 $61 2Q19 3Q19 4Q19 1Q20 2Q20 3Q20 4Q20 120100806040200 2017 2018 2019 2020 2021 2022Utility-scaleResidential Commercial/IndustrialOffgrid U.S. Electric Vehicle Sales(3)Number of Vehicles (thousands) 199 361 440 547 1,003 2,754 2017 2018 2019 2020E 2025E 2030E Significant Market Tailwinds(1)iSun is positioned to grow as the market grows Global investment in solar energy infrastructure is forecast to reach $1.6 trillion by 2030Solar is forecasted to grow from 3% of U.S. electricity generation in 2020 to 20% by 2030; current value of the U.S. solar market is $24 billionEV penetration growing globally from 4% in 2020 to approximately 30% by 2030; will require significant charging infrastructure build-outMultiple market tailwinds: policies and tax incentives favoring renewable energy investment, social drivers, reduced costs (solar panels, batteries, etc.), technology advancements improve reliability of renewable energy
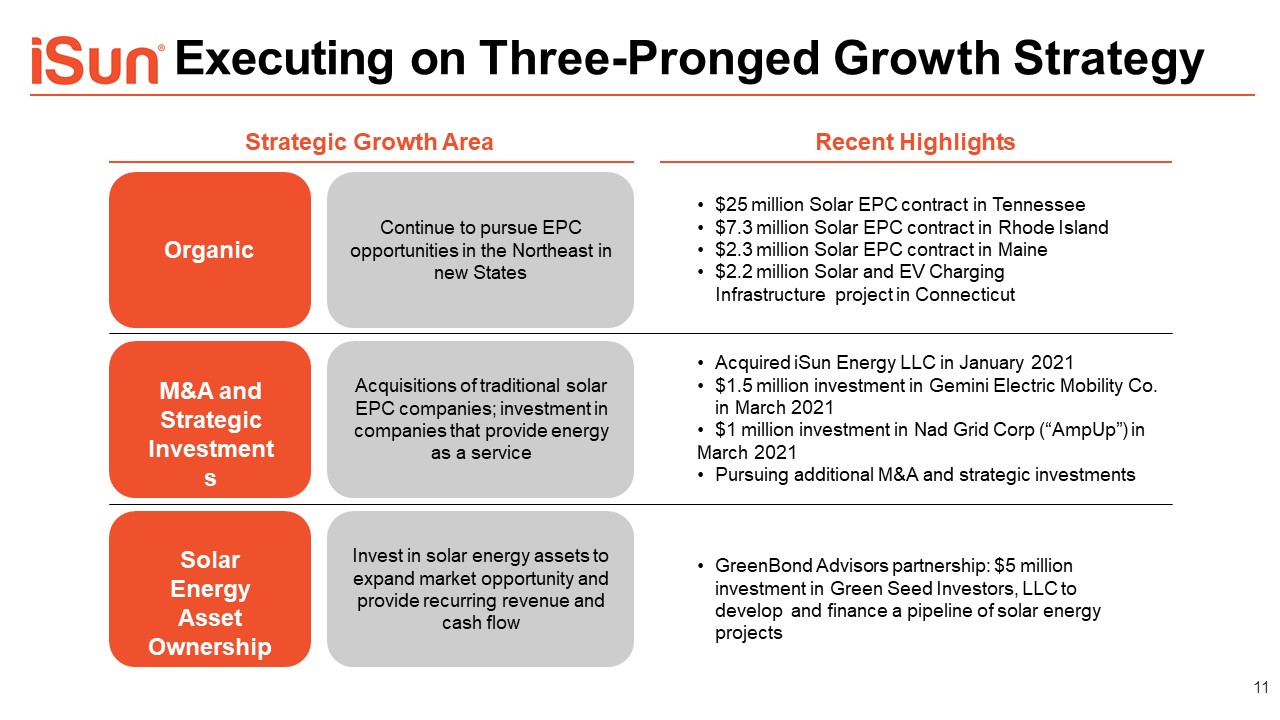
Executing on Three-Pronged Growth Strategy Strategic Growth Area Recent Highlights Organic M&A and Strategic Investments Solar Energy Asset Ownership Continue to pursue EPC opportunities in the Northeast in new States Acquisitions of traditional solar EPC companies; investment in companies that provide energy as a service Invest in solar energy assets to expand market opportunity and provide recurring revenue and cash flow $25 million Solar EPC contract in Tennessee$7.3 million Solar EPC contract in Rhode Island$2.3 million Solar EPC contract in Maine$2.2 million Solar and EV Charging Infrastructure project in Connecticut Acquired iSun Energy LLC in January 2021$1.5 million investment in Gemini Electric Mobility Co. in March 2021$1 million investment in Nad Grid Corp (“AmpUp”) inMarch 2021Pursuing additional M&A and strategic investments * GreenBond Advisors partnership: $5 million investment in Green Seed Investors, LLC to develop and finance a pipeline of solar energy projects
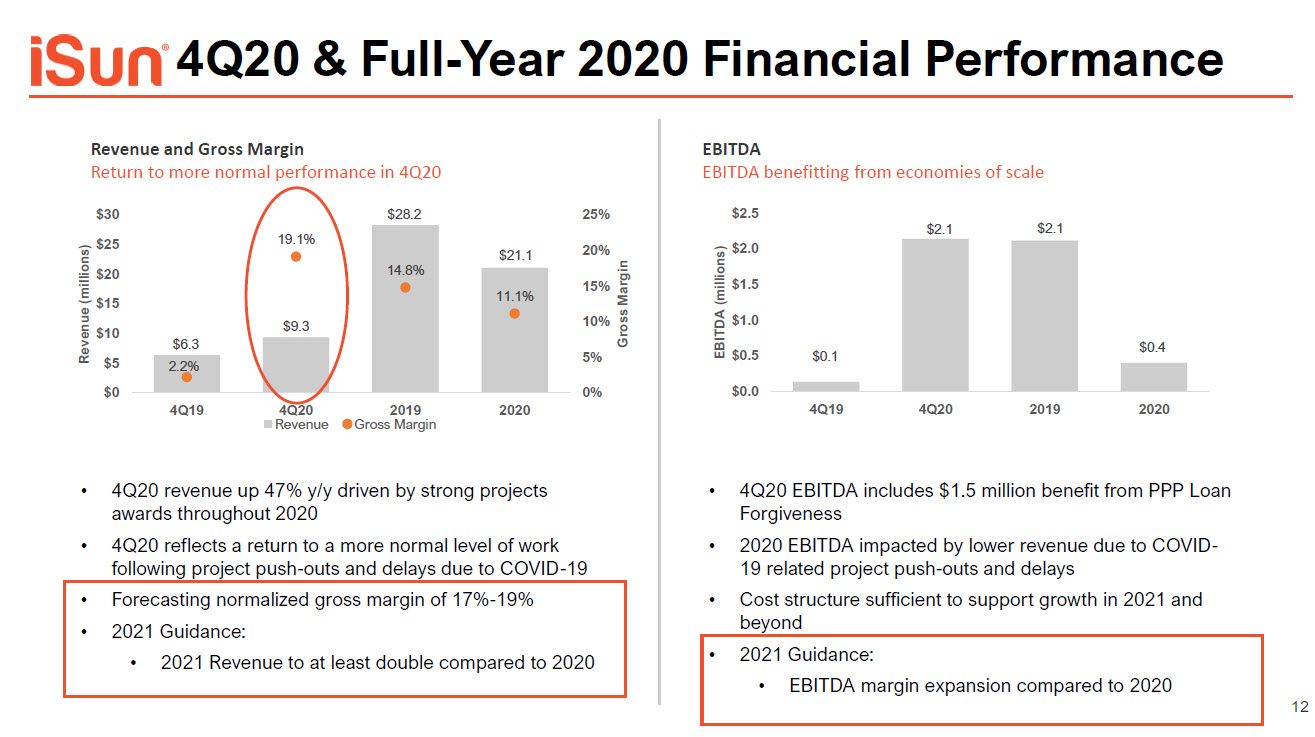
4Q20 & Full-Year 2020 Financial Performance $6.3 $9.3 $28.2 $21.1 2.2% 19.1% 14.8% 11.1% 0% 5% 10% 15% 20% 25% $10$5$0 $30$25$20$15 4Q19 2020 4Q20Revenue 2019Gross Margin Revenue and Gross MarginReturn to more normal performance in 4Q20 $0.1 $2.1 $2.1 $0.4 4Q20 2019 2020 $0.0 $0.5 $1.0 $1.5 $2.0 $2.5 4Q19 EBITDAEBITDA benefitting from economies of scale 4Q20 revenue up 47% y/y driven by strong projects awards throughout 20204Q20 reflects a return to a more normal level of workfollowing project push-outs and delays due to COVID-19 * Forecasting normalized gross margin of 17%-19%2021 Guidance:2021 Revenue to at least double compared to 2020 4Q20 EBITDA includes $1.5 million benefit from PPP Loan Forgiveness2020 EBITDA impacted by lower revenue due to COVID-19 related project push-outs and delaysCost structure sufficient to support growth in 2021 and beyond 2021 Guidance:EBITDA margin expansion compared to 2020
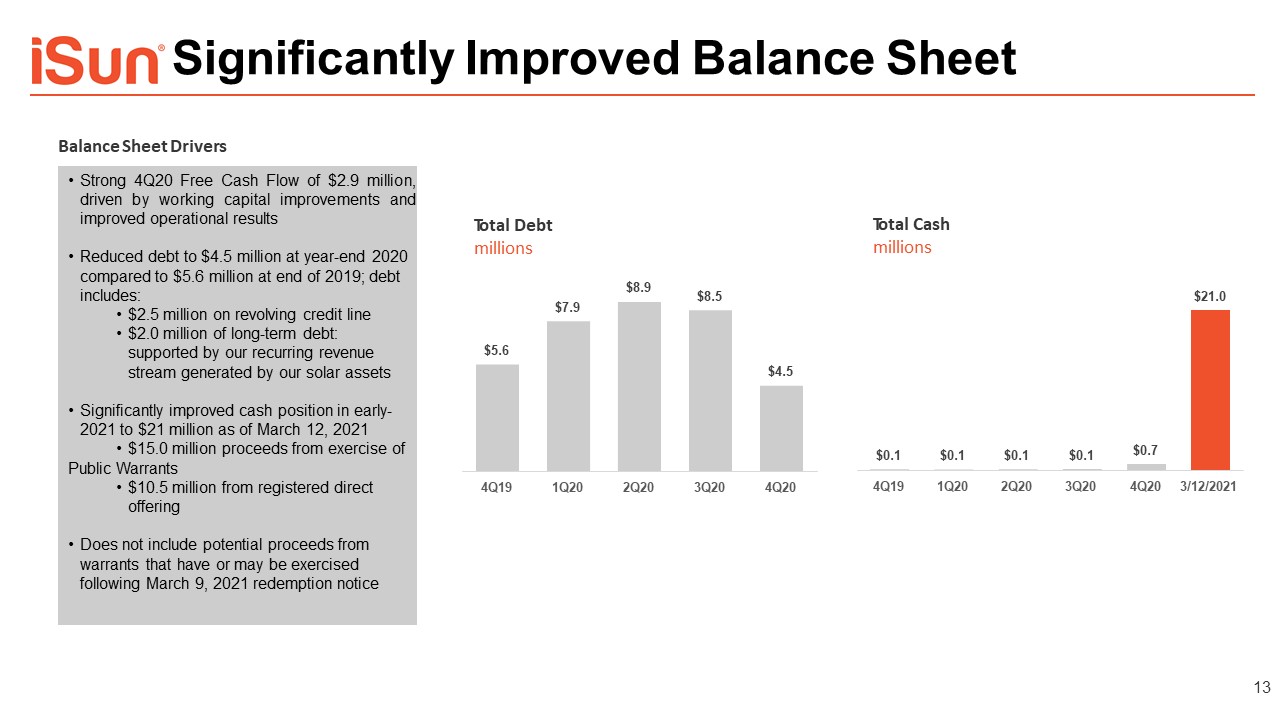
Total Cashmillions Significantly Improved Balance Sheet Total Debtmillions $5.6 $7.9 $8.9 $8.5 $4.5 4Q19 1Q20 2Q20 3Q20 4Q20 Balance Sheet Drivers Strong 4Q20 Free Cash Flow of $2.9 million, driven by working capital improvements and improved operational resultsReduced debt to $4.5 million at year-end 2020 compared to $5.6 million at end of 2019; debt includes:$2.5 million on revolving credit line$2.0 million of long-term debt: supported by our recurring revenue stream generated by our solar assetsSignificantly improved cash position in early- 2021 to $21 million as of March 12, 2021$15.0 million proceeds from exercise ofPublic Warrants$10.5 million from registered direct offeringDoes not include potential proceeds from warrants that have or may be exercised following March 9, 2021 redemption notice $0.1 * $0.1 $0.1 $0.1 $0.7 $21.0 4Q19 1Q20 2Q20 3Q20 4Q20 3/12/2021
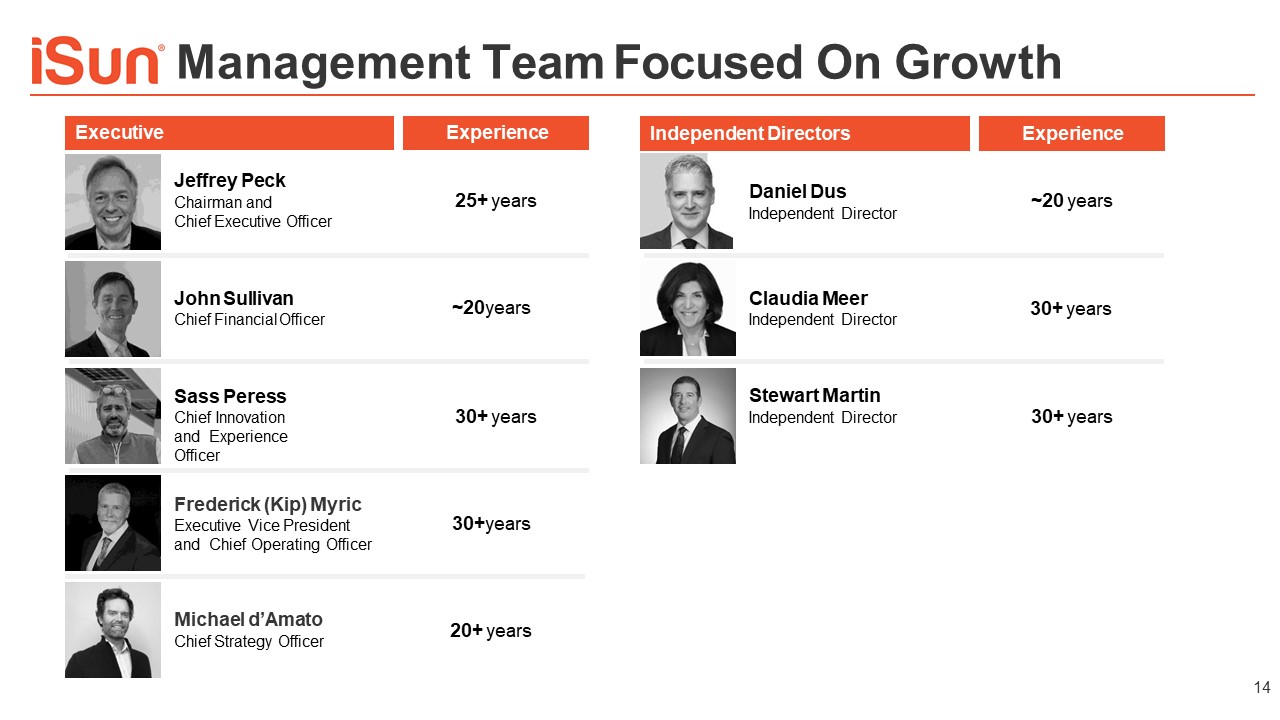
Management Team Focused On Growth Executive Experience Jeffrey PeckChairman andChief Executive Officer John SullivanChief Financial Officer Sass Peress Chief Innovation and Experience Officer Frederick (Kip) Myric Executive Vice President and Chief Operating Officer Michael d’AmatoChief Strategy Officer 25+ years ~20years 30+ years 30+years 20+ years Independent Directors Experience Daniel DusIndependent Director *�� Claudia MeerIndependent Director Stewart MartinIndependent Director ~20 years 30+ years 30+ years

Appendix

Non-GAAP Financial Reconciliations Three Months Ended Twelve Months Ended December 31, December 31, 2020 2019 2020 2019 Earned revenue $9,331,279 $6,343,399 $21,052,211 $28,221,569 Cost of earned revenue 7,546,635 6,203,516 18,709,074 24,050,197 Gross profit $1,784,644 $139,883 $2,343,137 $4,171,372 Warehouse and other operating expenses 127,742 (170,606) 684,669 864,359 General and administrative expenses 1,153,132 405,014 3,343,895 2,385,900 Total operating expenses 1,280,874 234,408 4,028,564 3,250,259 Operating income $503,770 ($94,525) ($1,685,427) $921,113 Other income (expenses) - Gain on forgiveness of PPP loan 1,496,468 - 1,496,468 Interest expense, net (83,812) (85,851) (302,542) (244,068) Income before income taxes 1,916,426 (180,376) (491,501) 677,045 (Benefit) provision for income taxes 143,412 (450,490) (487,173) 1,104,840 Net (loss) income $1,773,014 $270,114 ($4,328) ($427,795) Depreciation 138,164 160,570 585,690 621,233 Interest 83,812 85,851 302,542 244,068 Income tax 143,412 (450,490) (487,173) 1,104,840 EBITDA $2,138,402 $66,045 $396,731 $1,542,346 16