| FREE WRITING PROSPECTUS | ||
| FILED PURSUANT TO RULE 433 | ||
| REGISTRATION FILE NO.: 333-193376-17 | ||
| March 11, 2015 | |||||
| FREE WRITING PROSPECTUS | |||||
| STRUCTURAL AND COLLATERAL TERM SHEET | |||||
| $1,296,489,958 | |||||
| (Approximate Total Mortgage Pool Balance) | |||||
| $1,121,463,000 | |||||
| (Approximate Offered Certificates) | |||||
| COMM 2015-CCRE22 | |||||
| Deutsche Mortgage & Asset Receiving Corporation | |||||
| Depositor | |||||
| German American Capital Corporation | |||||
| Cantor Commercial Real Estate Lending, L.P. | |||||
| Natixis Real Estate Capital LLC | |||||
| The Bank of New York Mellon | |||||
| Sponsors and Mortgage Loan Sellers | |||||
| Deutsche Bank Securities | Cantor Fitzgerald & Co. | ||||
| Joint Bookrunning Managers and Co-Lead Managers | |||||
Natixis Securities Americas LLC CastleOak Securities, L.P. | KeyBanc Capital Markets Guggenheim Securities | ||||
| Co-Managers | |||||
| The depositor has filed a registration statement (including the prospectus) with the Securities and Exchange Commission (File No. 333-193376) for the offering to which this communication relates. Before you invest, you should read the prospectus in the registration statement and other documents the depositor has filed with the Securities and Exchange Commission for more complete information about the depositor, the issuing entity and this offering. You may get these documents for free by visiting EDGAR on the SEC website at www.sec.gov. Alternatively, the depositor or Deutsche Bank Securities Inc., any other underwriter, or any dealer participating in this offering will arrange to send you the prospectus if you request it by calling toll-free 1-800-503-4611 or by email to the following address: prospectus.cpdg@db.com. The offered certificates referred to in these materials, and the asset pool backing them, are subject to modification or revision (including the possibility that one or more classes of certificates may be split, combined or eliminated at any time prior to issuance or availability of a final prospectus) and are offered on a “when, as and if issued” basis. You understand that, when you are considering the purchase of these certificates, a contract of sale will come into being no sooner than the date on which the relevant class has been priced and we have verified the allocation of certificates to be made to you; any “indications of interest” expressed by you, and any “soft circles” generated by us, will not create binding contractual obligations for you or us. | |||||
COMM 2015-CCRE22 Mortgage Trust Capitalized terms used but not defined herein have the meanings assigned to them in the other Free Writing Prospectus expected to be dated March 12, 2015, relating to the offered certificates (hereinafter referred to as the “Free Writing Prospectus”). |
| KEY FEATURES OF SECURITIZATION |
| Offering Terms: | ||
| Joint Bookrunners and Co-Lead Managers: | Deutsche Bank Securities Inc. and Cantor Fitzgerald & Co. | |
| Co-Managers: | Natixis Securities Americas LLC, CastleOak Securities, L.P., Guggenheim Securities, LLC and KeyBanc Capital Markets Inc. | |
| Mortgage Loan Sellers: | German American Capital Corporation* (“GACC”) (50.1%), Cantor Commercial Real Estate Lending, L.P. (“CCRE”) (26.3%), Natixis Real Estate Capital LLC (“Natixis”) (15.9%), and The Bank of New York Mellon (“BNYM”) (7.7%). *An indirect wholly owned subsidiary of Deutsche Bank AG. | |
| Master Servicer: | Wells Fargo Bank, National Association | |
| Operating Advisor: | Park Bridge Lender Services LLC | |
| Special Servicers: | LNR Partners, LLC, and with respect to the 3 Columbus Circle loan combination, Midland Loan Services, a Division of PNC Bank, National Association | |
| Trustee: | Wilmington Trust, National Association | |
| Certificate Administrator: | Deutsche Bank Trust Company Americas | |
| Rating Agencies: | Moody’s Investors Service, Inc., Fitch Ratings, Inc. and Kroll Bond Rating Agency, Inc. | |
| Determination Date: | 6th day of each month, or if such 6th day is not a business day, the following business day, commencing in April 2015. | |
| Distribution Date: | 4th business day following the Determination Date in each month, commencing in April 2015. | |
| Cut-off Date: | Payment Date in March 2015 (or related origination date, if later). Unless otherwise noted, all Mortgage Loan statistics are based on balances as of the Cut-off Date. | |
| Settlement Date: | On or about March 26, 2015 | |
| Settlement Terms: | DTC, Euroclear and Clearstream, same day funds, with accrued interest. | |
| ERISA Eligible: | All of the Offered Certificates are expected to be ERISA eligible. | |
| SMMEA Eligible: | None of the Offered Certificates will be SMMEA eligible. | |
| Day Count: | 30/360 | |
| Tax Treatment: | REMIC | |
| Rated Final Distribution Date: | March 2048 | |
| Minimum Denominations: | $10,000 (or $100,000 with respect to Class X-A) and in each case in multiples of $1 thereafter. | |
| Clean-up Call: | 1% |
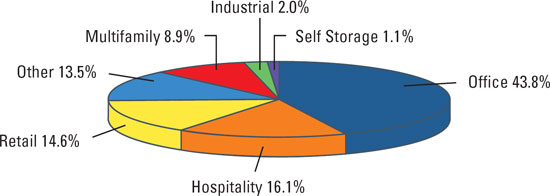
Distribution of Collateral by Property Type |
THE INFORMATION IN THIS STRUCTURAL AND COLLATERAL TERM SHEET IS NOT COMPLETE AND MAY BE AMENDED PRIOR TO THE TIME OF SALE. THIS TERM SHEET IS NOT AN OFFER TO SELL THESE SECURITIES AND IT IS NOT A SOLICITATION OF AN OFFER TO BUY THESE SECURITIES IN ANY JURISDICTION WHERE THE OFFER OR SALE IS NOT PERMITTED.
3
| COMM 2015-CCRE22 Mortgage Trust |
| TRANSACTION HIGHLIGHTS |
| Mortgage Loan Sellers | Number of Mortgage Loans | Number of Mortgaged Properties | Aggregate Cut-off Date Balance | % of Outstanding Pool Balance | ||||||||
| German American Capital Corporation | 24 | 27 | $650,037,029 | 50.1% | ||||||||
| Cantor Commercial Real Estate Lending, L.P. | 23 | 28 | $340,914,120 | 26.3% | ||||||||
| Natixis Real Estate Capital LLC | 10 | 10 | $205,629,665 | 15.9% | ||||||||
| The Bank of New York Mellon | 8 | 9 | $99,909,145 | 7.7% | ||||||||
| Total: | 65 | 74 | $1,296,489,958 | 100.0% | ||||||||
| Pooled Collateral Facts: | |||
| Initial Outstanding Pool Balance: | $1,296,489,958 | ||
| Number of Mortgage Loans: | 65 | ||
| Number of Mortgaged Properties: | 74 | ||
| Average Mortgage Loan Cut-off Date Balance: | $19,945,999 | ||
| Average Mortgaged Property Cut-off Date Balance: | $17,520,135 | ||
| Weighted Average Mortgage Rate: | 4.1469% | ||
| Weighted Average Mortgage Loan Original Term to Maturity Date or ARD (months): | 109 | ||
| Weighted Average Mortgage Loan Remaining Term to Maturity Date or ARD (months): | 107 | ||
| Weighted Average Mortgage Loan Seasoning (months): | 2 | ||
| % of Mortgaged Properties Leased to a Single Tenant: | 15.6% | ||
Credit Statistics(1): | |||
Weighted Average Mortgage Loan U/W NCF DSCR(2): | 1.60x | ||
Weighted Average Mortgage Loan Cut-off Date LTV(3): | 66.0% | ||
Weighted Average Mortgage Loan Maturity Date or ARD LTV(3): | 58.9% | ||
| Weighted Average U/W NOI Debt Yield: | 9.3% | ||
Amortization Overview: | |||
% Mortgage Loans with Amortization through Maturity Date or ARD(4): | 28.7% | ||
| % Mortgage Loans with Interest Only through Maturity Date or ARD: | 30.1% | ||
| % Mortgage Loans with Interest Only followed by Amortization: | 41.2% | ||
Weighted Average Remaining Amortization Term (months)(2)(4): | 349 | ||
| Loan Structural Features: | |||
| % Mortgage Loans with Upfront or Ongoing Tax Reserves: | 81.7% | ||
% Mortgage Loans with Upfront or Ongoing Replacement Reserves(5): | 73.8% | ||
| % Mortgage Loans with Upfront or Ongoing Insurance Reserves: | 54.4% | ||
% Mortgage Loans with Upfront or Ongoing TI/LC Reserves(6): | 84.4% | ||
| % Mortgage Loans with Upfront Engineering Reserves: | 46.7% | ||
| % Mortgage Loans with Upfront or Ongoing Other Reserves: | 62.3% | ||
| % Mortgage Loans with In Place Hard Lockboxes: | 75.3% | ||
| % Mortgage Loans with Cash Traps Triggered at Levels ≥ 1.05x: | 82.9% | ||
| % Mortgage Loans with Defeasance Only After a Lockout Period and Prior to an Open Period: | 93.5% | ||
| % Mortgage Loans with Prepayment with a Yield Maintenance Charge Only After a Lockout Period and Prior to an Open Period: | 3.3% | ||
| % Mortgage Loans with Prepayment with a Yield Maintenance Charge Prior to an Open Period and also Defeasance or Yield Maintenance After a Lockout Period and Prior to an Open Period: | 2.0% | ||
| % Mortgage Loans with Prepayment with a Yield Maintenance Charge or Defeasance After a Lockout Period and Prior to an Open Period | 1.2% |
| (1) | With respect to the 26 Broadway Loan, the 3 Columbus Circle Loan, the 100 West 57th Street Loan and the Patriots Park Loan, LTV, DSCR and debt yield calculations include the related pari passu companion loan(s). With respect to the two groups of cross-collateralized and cross-defaulted loans, LTV, DSCR and debt yield calculations are calculated on an aggregate basis unless otherwise specifically indicated. |
| (2) | With respect to one mortgage loan, representing approximately 5.4%, of the initial outstanding pool balance as of the cut-off date, following an initial interest only period of 36 months, the mortgage loan amortizes based on a non-standard amortization schedule. For additional information, see Annex H to the Free Writing Prospectus. |
| (3) | With respect to four mortgage loans, representing 6.0% of the initial outstanding principal balance, the Cut-off Date LTV and Maturity Date or ARD LTV have in certain cases been calculated based on the “as stabilized” or “as complete” value. For additional information, see the Footnotes to Annex A-1 in the Free Writing Prospectus. |
| (4) | Excludes loans which are interest only for the full loan term or through a related ARD. |
| (5) | Includes FF&E Reserves. |
| (6) | Represents the percent of the allocated initial outstanding principal balance of retail, office and industrial properties only. |
THE INFORMATION IN THIS STRUCTURAL AND COLLATERAL TERM SHEET IS NOT COMPLETE AND MAY BE AMENDED PRIOR TO THE TIME OF SALE. THIS TERM SHEET IS NOT AN OFFER TO SELL THESE SECURITIES AND IT IS NOT A SOLICITATION OF AN OFFER TO BUY THESE SECURITIES IN ANY JURISDICTION WHERE THE OFFER OR SALE IS NOT PERMITTED.
4
| COMM 2015-CCRE22 Mortgage Trust |
| SUMMARY OF THE CERTIFICATES |
| OFFERED CERTIFICATES | |||||||||||||||
Class(1) | Ratings (Moody’s/Fitch/KBRA) | Initial Certificate Balance or Notional Amount(2) | Initial Subordination Levels | Weighted Average Life (years)(3) | Principal Window (months)(3) | Certificate Principal to Value Ratio(4) | Underwritten NOI Debt Yield(5) | ||||||||
| Class A-1 | Aaa(sf)/AAAsf/AAA(sf) | $46,400,000 | 30.000%(6) | 2.66 | 1 - 55 | 46.2% | 13.3% | ||||||||
| Class A-2 | Aaa(sf)/AAAsf/AAA(sf) | $178,900,000 | 30.000%(6) | 4.70 | 55 - 60 | 46.2% | 13.3% | ||||||||
| Class A-3 | Aaa(sf)/AAAsf/AAA(sf) | $108,950,000 | 30.000%(6) | 6.80 | 82 - 83 | 46.2% | 13.3% | ||||||||
| Class A-SB | Aaa(sf)/AAAsf/AAA(sf) | $79,800,000 | 30.000%(6) | 7.35 | 60 - 115 | 46.2% | 13.3% | ||||||||
| Class A-4 | Aaa(sf)/AAAsf/AAA(sf) | $200,000,000 | 30.000%(6) | 9.68 | 115 - 118 | 46.2% | 13.3% | ||||||||
| Class A-5 | Aaa(sf)/AAAsf/AAA(sf) | $293,492,000 | 30.000%(6) | 9.84 | 118 - 119 | 46.2% | 13.3% | ||||||||
Class X-A(7) | NR/AAAsf/AAA(sf) | $988,573,000 | (8) | N/A | N/A | N/A | N/A | N/A | |||||||
Class A-M(9) | NR/AAAsf/AAA(sf) | $81,031,000 | (10) | 23.750% | 9.89 | 119 - 120 | 50.3% | 12.2% | |||||||
Class B(9) | NR/AA-sf/AA-(sf) | $76,169,000 | (10) | 17.875% | 9.96 | 120 - 120 | 54.2% | 11.3% | |||||||
Class PEZ(9) | NR/A-sf/A-(sf) | $213,921,000 | (10) | 13.500%(6) | 9.93 | 119 - 120 | 57.1% | 10.8% | |||||||
Class C(9) | NR/A-sf/A-(sf) | $56,721,000 | (10) | 13.500%(6) | 9.96 | 120 - 120 | 57.1% | 10.8% | |||||||
| NON-OFFERED CERTIFICATES | |||||||||||||||
Class(1) | Ratings (Moody’s/Fitch/KBRA) | Initial Certificate Balance or Notional Amount(2) | Initial Subordination Levels | Weighted Average Life (years)(3) | Principal Window (months)(3) | Certificate Principal to Value Ratio(4) | Underwritten NOI Debt Yield(5) | ||||||||
Class X-B(7) | NR/A-sf/AAA(sf) | $132,890,000 | (8) | N/A | N/A | N/A | N/A | N/A | |||||||
Class X-C(7) | NR/BBB-sf/BBB-(sf) | $68,066,000 | (8) | N/A | N/A | N/A | N/A | N/A | |||||||
Class X-D(7) | NR/NR/BB-(sf) | $43,757,000 | (8) | N/A | N/A | N/A | N/A | N/A | |||||||
| Class D | NR/BBB-sf/BBB-(sf) | $68,066,000 | 8.250% | 9.96 | 120 - 120 | 60.6% | 10.1% | ||||||||
| Class E | NR/BB-sf/BB(sf) | $27,550,000 | 6.125% | 9.96 | 120 - 120 | 62.0% | 9.9% | ||||||||
| Class F | NR/NR/BB-(sf) | $16,207,000 | 4.875% | 9.96 | 120 - 120 | 62.8% | 9.8% | ||||||||
| Class G | NR/NR/B-(sf) | $24,309,000 | 3.000% | 9.96 | 120 - 120 | 64.0% | 9.6% | ||||||||
| Class H | NR/NR/NR | $38,894,958 | 0.000% | 9.96 | 120 - 120 | 66.0% | 9.3% | ||||||||
| (1) | The pass-through rates applicable to the Class A-1, Class A-2, Class A-3, Class A-SB, Class A-4, Class A-5, Class A-M, Class B, Class C, Class D, Class E, Class F, Class G and Class H Certificates will equal one of: (i) a fixed per annum rate, (ii) the weighted average of the net mortgage rates on the mortgage loans (in each case, adjusted, if necessary, to accrue on the basis of a 360-day year consisting of twelve 30-day months) as of their respective due dates in the month preceding the month in which such distribution date occurs, (iii) a rate equal to the lesser of a specified pass-through rate and the weighted average of the net mortgage rates on the mortgage loans (in each case, adjusted, if necessary, to accrue on the basis of a 360-day year consisting of twelve 30-day months) as of their respective due dates in the month preceding the month in which such distribution date occurs, or (iv) the weighted average of the net mortgage rates on the mortgage loans (in each case, adjusted, if necessary, to accrue on the basis of a 360-day year consisting of twelve 30-day months) as of their respective due dates in the month preceding the month in which such distribution date occurs, less a specified rate. The Class PEZ Certificates will not have a pass-through rate, but will be entitled to receive the sum of the interest distributable on the percentage interest of the Class A-M, Class B and Class C trust components represented by the Class PEZ Certificates. The pass-through rates on the Class A-M, Class B and Class C trust components will at all times be the same as the pass-through rate of the Class A-M, Class B and Class C Certificates, respectively. |
| (2) | Approximate; subject to a permitted variance of plus or minus 5%. In addition, the notional amount of the Class X-A, Class X-B, Class X-C and Class X-D Certificates (collectively, the “Class X Certificates”) may vary depending upon the final pricing of the classes of certificates and/or trust components whose Certificate Balances comprise such notional amounts, and, if as a result of such pricing the pass-through rate of any Class of Class X Certificates would be equal to zero, such Class X Certificates will not be issued on the settlement date of this securitization. |
| (3) | The weighted average life and principal window during which distributions of principal would be received as set forth in the table with respect to each class of certificates with a Certificate Balance is based on (i) modeling assumptions described in the Free Writing Prospectus, (ii) assumptions that there are no prepayments, delinquencies or losses on the mortgage loans and (iii) assumptions that there are no extensions of maturity dates and mortgage loans with anticipated repayment dates are repaid on the respective anticipated repayment dates. |
| (4) | “Certificate Principal to Value Ratio” for any class with a Certificate Balance is calculated as the product of (a) the weighted average mortgage loan Cut-off Date LTV of the mortgage pool, multiplied by (b) a fraction, the numerator of which is the total initial Certificate Balance of the related class of Certificates and all other classes, if any, that are senior to such class, and the denominator of which is the total initial Certificate Balance of all Certificates. The Certificate Principal to Value Ratios of the Class A-1, Class A-2, Class A-3, Class A-SB, Class A-4 and Class A-5 Certificates are calculated in the aggregate for those classes as if they were a single class. |
| (5) | “Underwritten NOI Debt Yield” for any class with a Certificate Balance is calculated as the product of (a) the weighted average U/W NOI Debt Yield for the mortgage pool, multiplied by (b) a fraction, the numerator of which is the total initial Certificate Balance of all Certificates and the denominator of which is the total initial Certificate Balance of the related class of Certificates and all other classes, if any, that are senior to such class. The Underwritten NOI Debt Yields of the Class A-1, Class A-2, Class A-3, Class A-SB, Class A-4 and Class A-5 Certificates are calculated in the aggregate for those classes as if they were a single class. |
| (6) | The initial subordination levels for the Class A-1, Class A-2, Class A-3, Class A-SB, Class A-4 and Class A-5 Certificates are represented in the aggregate. The initial subordination levels for the Class PEZ and Class C Certificates are equal to the initial subordination level of the underlying Class C trust component which will have an initial outstanding balance on the settlement date of $56,721,000. |
| (7) | As further described in the Free Writing Prospectus, the pass-through rate applicable to each Class of Class X Certificates for each Distribution Date will generally be equal to the excess of (i) the weighted average of the net mortgage rates on the mortgage loans (in each case, adjusted, if necessary to accrue on the basis of a 360 day year consisting of twelve 30-day months), over (ii)(A) with respect to the Class X-A Certificates, the weighted average of the pass-through rates of the Class A-1, Class A-2, Class A-3, Class A-SB, Class A-4, Class A-5 Certificates and the Class A-M trust component (based on their Certificate Balances), (B) with respect to the Class X-B Certificates, the weighted average of the pass-through rates of the Class B and Class C trust components (based on their Certificate Balances), (C) with respect to the Class X-C Certificates, the pass-through rate of the Class D Certificates, and (D) with respect to the Class X-D Certificates, the weighted average of the pass-through rates of the Class E and Class F Certificates (based on their Certificate Balances). |
| (8) | The Class X Certificates will not have Certificate Balances. None of the Class X Certificates will be entitled to distributions of principal. The interest accrual amounts on the Class X-A Certificates will be calculated by reference to a notional amount equal to the sum of the total Certificate Balances of each of the Class A-1, Class A-2, Class A-3, Class A-SB, Class A-4 and Class A-5 Certificates and the Class A-M trust component. The interest accrual amounts on the Class X-B Certificates will be calculated by reference to a notional amount equal to the sum of the total Certificate Balances of each of the Class B and Class C trust components. The interest accrual amounts on the Class X-C Certificates will be calculated by reference to a notional amount equal to the Certificate Balance of the Class D Certificates. The interest |
THE INFORMATION IN THIS STRUCTURAL AND COLLATERAL TERM SHEET IS NOT COMPLETE AND MAY BE AMENDED PRIOR TO THE TIME OF SALE. THIS TERM SHEET IS NOT AN OFFER TO SELL THESE SECURITIES AND IT IS NOT A SOLICITATION OF AN OFFER TO BUY THESE SECURITIES IN ANY JURISDICTION WHERE THE OFFER OR SALE IS NOT PERMITTED.
5
| COMM 2015-CCRE22 Mortgage Trust |
| SUMMARY OF THE CERTIFICATES |
| accrual amounts on the Class X-D Certificates will be calculated by reference to a notional amount equal to the sum of the total Certificate Balances of each of the Class E and Class F Certificates. | |
| (9) | Up to the full Certificate Balance of the Class A-M, Class B and Class C Certificates may be exchanged for Class PEZ Certificates, and Class PEZ Certificates may be exchanged for up to the full Certificate Balance of the Class A-M, Class B and Class C Certificates. |
| (10) | On the settlement date, the issuing entity will issue the Class A-M, Class B and Class C trust components, which will have outstanding principal balances on the settlement date of $81,031,000, $76,169,000 and $56,721,000, respectively. The Class A-M, Class B, Class PEZ and Class C Certificates will, at all times, represent undivided beneficial ownership interests in a grantor trust that will hold such trust components. Each class of the Class A-M, Class B and Class C Certificates will, at all times, represent a beneficial interest in a percentage of the outstanding principal balance of the Class A-M, Class B and Class C trust components, respectively. The Class PEZ Certificates will, at all times, represent a beneficial interest in the remaining percentages of the outstanding principal balances of the Class A-M, Class B and Class C trust components. Following any exchange of Class A-M, Class B and Class C Certificates for Class PEZ Certificates or any exchange of Class PEZ Certificates for Class A-M, Class B and Class C Certificates as described in the Free Writing Prospectus, the percentage interest of the outstanding principal balances of the Class A-M, Class B and Class C trust component that is represented by the Class A-M, Class B, Class PEZ and Class C Certificates will be increased or decreased accordingly. The initial Certificate Balance of each of the Class A-M, Class B and Class C Certificates represents the Certificate Balance of such class without giving effect to any exchange. The initial Certificate Balance of the Class PEZ Certificates is equal to the aggregate of the initial Certificate Balance of the Class A-M, Class B and Class C Certificates and represents the maximum Certificate Balance of the Class PEZ Certificates that could be issued in an exchange; such initial Certificate Balance is not included in the aggregate certificate principal balance of the offered certificates set forth on the cover page of this Term Sheet. The Certificate Balances of the Class A-M, Class B and Class C Certificates to be issued on the settlement date will be reduced, in required proportions, by an amount equal to the Certificate Balance of the Class PEZ Certificates issued on the settlement date. |
Short-Term Certificate Principal Paydown Summary(1)(2) |
| Class | Mortgage Loan Seller | Mortgage Loan | Property Type | Cut-off Date Balance | Remaining Term to Maturity or ARD (Mos.) | Cut-off Date LTV Ratio | U/W NCF DSCR(3) | U/W NOI Debt Yield | ||||||||||
| A-1/A-2 | Natixis | Patriots Park | Office | $26,000,000 | 55 | 66.8% | 2.19x | 8.2% | ||||||||||
| A-2 | Natixis | 100 West 57th Street | Other | $60,000,000 | 56 | 60.0% | 1.00x | 2.3% | ||||||||||
| A-2 | GACC | Marriott Burbank | Hospitality | $70,000,000 | 58 | 60.3% | 1.98x | 13.0% | ||||||||||
| A-2 | CCRE | Hotel Casablanca | Hospitality | $7,937,716 | 58 | 56.7% | 1.42x | 16.2% | ||||||||||
| A-2 | Natixis | Fairfield Inn & Suites | Hospitality | $3,875,000 | 58 | 68.0% | 1.58x | 11.6% | ||||||||||
| A-2/A-SB | CCRE | Mooreland & Whitfield Shopping Centers | Retail | $9,000,000 | 60 | 59.6% | 1.57x | 11.5% | ||||||||||
| A-3/A-SB | GACC | 26 Broadway | Office | $100,000,000 | 82 | 59.5% | 1.59x | 7.4% | ||||||||||
| A-3/A-SB | CCRE | Geneva Square | Retail | $10,975,885 | 83 | 59.3% | 1.84x | 12.7% | ||||||||||
| (1) | This table identifies loans with balloon payments due during the principal paydown window assuming 0% CPR and no losses or extensions for the indicated Certificates. See “Yield and Maturity Considerations—Yield Considerations” in the Free Writing Prospectus. |
| (2) | With respect to the 26 Broadway loan, the 100 West 57th Street loan and the Patriots Park loan, LTV, DSCR and debt yield calculations include the related pari passu companion loan(s). |
| (3) | With respect to Marriott Burbank loan, following an interest only period of 36 months, the mortgage loan amortizes based on a non-standard amortization schedule. U/W NCF DSCR is calculated based on the average of the first 12 months of amortizing debt service payments. For additional information, see Annex H to the Free Writing Prospectus. |
THE INFORMATION IN THIS STRUCTURAL AND COLLATERAL TERM SHEET IS NOT COMPLETE AND MAY BE AMENDED PRIOR TO THE TIME OF SALE. THIS TERM SHEET IS NOT AN OFFER TO SELL THESE SECURITIES AND IT IS NOT A SOLICITATION OF AN OFFER TO BUY THESE SECURITIES IN ANY JURISDICTION WHERE THE OFFER OR SALE IS NOT PERMITTED.
6
| COMM 2015-CCRE22 Mortgage Trust |
STRUCTURE OVERVIEW |
| Principal Payments: | Payments in respect of principal of the Certificates will be distributed, first, to the Class A-SB Certificates, until the Certificate Balance of such Class is reduced to the planned principal balance for the related Distribution Date set forth on Annex A-3 to the Free Writing Prospectus, then, to the Class A-1, Class A-2, Class A-3, Class A-4, Class A-5 and Class A-SB Certificates, in that order, until the Certificate Balance of each such Class is reduced to zero, then, to the Class A-M trust component (and correspondingly to the Class A-M Certificates and the Class PEZ Certificates, pro rata, based on their respective percentage interests in the Class A-M trust component) until the principal balance of the Class A-M trust component has been reduced to zero, then, to the Class B trust component (and correspondingly to the Class B Certificates and the Class PEZ Certificates, pro rata, based on their respective percentage interests in the Class B trust component) until the principal balance of the Class B trust component has been reduced to zero, then, to the Class C trust component (and correspondingly to the Class C Certificates and the Class PEZ Certificates, pro rata, based on their respective percentage interests in the Class C trust component), until the principal balance of the Class C trust component has been reduced to zero, and then, to the Class D, Class E, Class F, Class G and Class H Certificates, in that order, until the Certificate Balance of each such Class is reduced to zero. Notwithstanding the foregoing, if the total principal balance of the Class A-M, Class B and Class C trust components and the Certificate Balances of the Class D through Class H Certificates have been reduced to zero as a result of loss allocation, payments in respect of principal of the Certificates will be distributed, first, to the Class A-1, Class A-2, Class A-3, Class A-SB, Class A-4 and Class A-5 Certificates, on a pro rata basis, based on the Certificate Balance of each such Class, then, to the extent of any recoveries on realized losses, to the Class A-M trust component (and correspondingly to the Class A-M Certificates and the Class PEZ Certificates, pro rata, based on their respective percentage interests in the Class A-M trust component), then, to the extent of any recoveries on realized losses, to the Class B trust component (and correspondingly to the Class B Certificates and the Class PEZ Certificates, pro rata, based on their respective percentage interests in the Class B trust component), then, to the extent of any recoveries on realized losses, to the Class C trust component (and correspondingly to the Class C Certificates and the Class PEZ Certificates, pro rata, based on their respective percentage interests in the Class C trust component), then, to the extent of any recoveries on realized losses, to the Class D, Class E, Class F, Class G and Class H Certificates, in that order, in each case until the Certificate Balance of each such Class or trust component is reduced to zero (or previously allocated realized losses have been fully reimbursed). Each Class of Class X Certificates will not be entitled to receive distributions of principal; however, (i) the notional amount of the Class X-A Certificates will be reduced by the aggregate amount of principal distributions and realized losses allocated to the Class A-1, Class A-2, Class A-3, Class A-SB, Class A-4 and Class A-5 Certificates and the Class A-M trust component; (ii) the notional amount of the Class X-B Certificates will be reduced by the aggregate amount of principal distributions and realized losses allocated to the Class B and Class C trust components; (iii) the notional amount of the Class X-C Certificates will be reduced by the principal distributions and realized losses allocated to the Class D Certificates; and (iv) the notional amount of the Class X-D Certificates will be reduced by the aggregate amount of principal distributions and realized losses allocated to the Class E and Class F Certificates. | |
| Interest Payments: | On each Distribution Date, interest accrued for each Class of the Certificates or trust component at the applicable pass-through rate will be distributed in the following order of priority, to the extent of available funds: first, to the Class A-1, Class A-2, Class A-3, Class A-SB, Class A-4, Class A-5, Class X-A, Class X-B, Class X-C and Class X-D Certificates, on a pro rata basis, based on the accrued and unpaid interest on each such Class, then, to the Class A-M trust component (and correspondingly to the Class A-M Certificates and the Class PEZ Certificates, pro rata, based on their respective percentage interests of the accrued and unpaid interest on the Class A-M trust component), then, to the Class B trust component (and correspondingly to the Class B Certificates and the Class PEZ Certificates, pro rata, based on their respective percentage interests of the accrued and unpaid interest on the Class B trust component), then, to the Class C trust component (and correspondingly to the Class C Certificates and the Class PEZ Certificates, pro rata, based on their respective percentage interests of the accrued and unpaid interest on the Class C trust component), and then, to the Class D, Class E, Class F, Class G and Class H Certificates, in that order, in each case until the interest payable to each such Class is paid in full. |
THE INFORMATION IN THIS STRUCTURAL AND COLLATERAL TERM SHEET IS NOT COMPLETE AND MAY BE AMENDED PRIOR TO THE TIME OF SALE. THIS TERM SHEET IS NOT AN OFFER TO SELL THESE SECURITIES AND IT IS NOT A SOLICITATION OF AN OFFER TO BUY THESE SECURITIES IN ANY JURISDICTION WHERE THE OFFER OR SALE IS NOT PERMITTED.
7
COMM 2015-CCRE22 Mortgage Trust |
STRUCTURE OVERVIEW |
The pass-through rates applicable to the Class A-1, Class A-2, Class A-3, Class A-SB, Class A-4, Class A-5, Class A-M, Class B, Class C, Class D, Class E, Class F, Class G and Class H Certificates for each Distribution Date will equal one of: (i) a fixed per annum rate, (ii) the weighted average of the net mortgage rates on the mortgage loans (in each case, adjusted, if necessary, to accrue on the basis of a 360-day year consisting of twelve 30-day months) as of their respective due dates in the month preceding the month in which such distribution date occurs, (iii) a rate equal to the lesser of a specified pass-through rate and the weighted average of the net mortgage rates on the mortgage loans (in each case, adjusted, if necessary, to accrue on the basis of a 360-day year consisting of twelve 30-day months) as of their respective due dates in the month preceding the month in which such distribution date occurs, or (iv) the weighted average of the net mortgage rates on the mortgage loans (in each case, adjusted, if necessary, to accrue on the basis of a 360-day year consisting of twelve 30-day months) as of their respective due dates in the month preceding the month in which such distribution date occurs, less a specified rate. The pass-through rate on the Class A-M, Class B and Class C trust components will at all times be the same as the pass-through rate of the Class A-M, Class B and Class C Certificates, respectively. The Class PEZ Certificates will not have a pass-through rate, but will be entitled to receive the sum of interest distributable on the percentage interest of the Class A-M, Class B and Class C trust components represented by the PEZ Certificates. As further described in the Free Writing Prospectus, the pass-through rate applicable to each Class of Class X Certificates for each Distribution Date will generally be equal to the excess of (i) the weighted average of the net mortgage rates on the mortgage loans (in each case, adjusted, if necessary, to accrue on the basis of a 360-day year consisting of twelve 30-day months), over (ii) (A) with respect to the Class X-A Certificates, the weighted average of the pass-through rates of the Class A-1, Class A-2, Class A-3, Class A-SB, Class A-4 and Class A-5 Certificates and the Class A-M trust component (based on their Certificate Balances), (B) with respect to the Class X-B Certificates, the weighted average of the pass-through rates of the Class B and Class C trust components (based on their Certificate Balances), (C) with respect to the Class X-C Certificates, the pass-through rate of the Class D Certificates, and (D) with respect to the Class X-D Certificates, the weighted average of the pass-through rates of the Class E and Class F Certificates (based on their Certificate Balances). | ||
| Prepayment Interest Shortfalls: | Prepayment interest shortfalls will be allocated pro rata based on interest entitlements, in reduction of the interest otherwise payable with respect to each of the interest-bearing certificate classes. | |
| Loss Allocation: | Losses will be allocated to each Class of Certificates in reverse alphabetical order starting with Class H through and including Class D, then, to the Class C trust component (and correspondingly to the Class C Certificates and the Class PEZ Certificates, pro rata, based on their respective percentage interests in the Class C trust component), then, to the Class B trust component (and correspondingly to the Class B Certificates and the Class PEZ Certificates, pro rata, based on their respective percentage interests in the Class B trust component), then, to the Class A-M trust component (and correspondingly to the Class A-M Certificates and the Class PEZ Certificates, pro rata, based on their respective percentage interests in the Class A-M trust component), and then to Class A-1, Class A-2, Class A-3, Class A-SB, Class A-4 and Class A-5 Certificates on a pro rata basis based on the Certificate Balance of each such class. The notional amount of any Class of Class X Certificates will be reduced by the aggregate amount of realized losses allocated to Certificates and trust components that are components of the notional amount of such Class of Class X Certificates. | |
Prepayment Premiums: | A percentage of all prepayment premiums (either fixed prepayment premiums or yield maintenance amounts) collected will be allocated to each of the Class A-1, Class A-2, Class A-3, Class A-SB, Class A-4, Class A-5 and Class D Certificates and the Class A-M, Class B and Class C trust components (the “YM P&I Certificates”) then entitled to principal distributions, which percentage will be equal to the product of (a) a fraction, not greater than one, the numerator of which is the amount of principal distributed to such Class or trust component on such Distribution Date and the denominator of which is the total amount of principal distributed to the holders of the Class A-1, Class A-2, Class A-3, Class A-SB, Class A-4, Class A-5 and Class D and the Class A-M, Class B and Class C trust components on such Distribution Date, and (b) a fraction (expressed as a percentage which can be no greater than 100% nor less than 0%), the numerator of which is the excess of the pass-through rate of each such Class of |
THE INFORMATION IN THIS STRUCTURAL AND COLLATERAL TERM SHEET IS NOT COMPLETE AND MAY BE AMENDED PRIOR TO THE TIME OF SALE. THIS TERM SHEET IS NOT AN OFFER TO SELL THESE SECURITIES AND IT IS NOT A SOLICITATION OF AN OFFER TO BUY THESE SECURITIES IN ANY JURISDICTION WHERE THE OFFER OR SALE IS NOT PERMITTED.
8
COMM 2015-CCRE22 Mortgage Trust |
STRUCTURE OVERVIEW |
Certificates or trust component currently receiving principal over the relevant Discount Rate, and the denominator of which is the excess of the Mortgage Rate of the related Mortgage Loan over the relevant Discount Rate. Prepayment Premium Allocation Percentage for all YM P&I Certificates = | ||||||
| (Pass-Through Rate - Discount Rate) | X | The percentage of the principal distribution amount to such Class or trust component as described in (a) above | ||||
(Mortgage Rate - Discount Rate) | ||||||
The remaining percentage of the prepayment premiums will be allocated to the Class X-A, Class X-B and Class X-C Certificates in the manner described in the Free Writing Prospectus. In general, this formula provides for an increase in the percentage of prepayment premiums allocated to the YM P&I Certificates then entitled to principal distributions relative to the Class X-A, Class X-B and Class X-C Certificates as Discount Rates decrease and a decrease in the percentage allocated to such Classes as Discount Rates rise. All prepayment premiums (either fixed prepayment premiums or yield maintenance amounts) allocated in respect of (i) the Class A-M trust component as described above will be allocated between the Class A-M Certificates and the Class PEZ Certificates, pro rata, based on their respective percentage interests in the Class A-M trust component, (ii) the Class B trust component as described above will be allocated between the Class B Certificates and the Class PEZ Certificates, pro rata, based on their respective percentage interests in the Class B trust component, and (iii) the Class C trust component as described above will be allocated between the Class C Certificates and the Class PEZ Certificates, pro rata, based on their respective percentage interests in the Class C trust component. | ||||||
| Loan Combinations: | The Mortgaged Property identified on Annex A–1 to the Free Writing Prospectus as 26 Broadway secures a Mortgage Loan with an outstanding principal balance as of the Cut–off Date of $100,000,000, evidenced by Note A-3, Note A-5 and Note A-6 (the “26 Broadway Loan”), representing approximately 7.7% of the Initial Outstanding Pool Balance, and also secures on a pari passu basis three companion loans that have an aggregate outstanding principal balance as of the Cut-off Date of $120,000,000, evidenced by Note A-1, Note A-2 and Note A-4 (the “26 Broadway Companion Loan”), each of which is currently held by the COMM 2015-DC1 Mortgage Trust. The 26 Broadway Loan and the 26 Broadway Companion Loan are pari passu in right of payment and are collectively referred to herein as the “26 Broadway Loan Combination.” The 26 Broadway Loan Combination is being serviced pursuant to the COMM 2015-DC1 pooling and servicing agreement and the related intercreditor agreement. For additional information regarding the 26 Broadway Loan Combination, see “Description of the Mortgage Pool—Loan Combinations—26 Broadway Loan Combination” in the Free Writing Prospectus. The Mortgaged Property identified on Annex A–1 to the Free Writing Prospectus as 3 Columbus Circle secures a Mortgage Loan with an outstanding principal balance as of the Cut–off Date of $85,000,000, evidenced by Note A-4 (the “3 Columbus Circle Loan”), representing approximately 6.6% of the Initial Outstanding Pool Balance, and also secures on a pari passu basis five companion loans evidenced by (1) Note A-1, in the outstanding principal balance of $90,000,000 (the “3 Columbus Circle Note A-1 Companion Loan”), which is currently held by German American Capital Corporation, (2) Note A-2 and Note A-5, in the aggregate outstanding principal amount of $100,000,000 (the “3 Columbus Circle Note A-2 Companion Loan” and the “3 Columbus Circle Note A-5 Companion Loan”, respectively), which are currently being held by Citigroup Global Markets Realty Corp., and (3) Note A-3 and Note A-6, in the aggregate outstanding principal amount of $75,000,000 (the “3 Columbus Circle Note A-3 Companion Loan” and the “3 Columbus Circle Note A-6 Companion Loan”, respectively, and, together with the 3 Columbus Circle Note A-1 Companion Loan, the 3 Columbus Circle Note A-2 Companion Loan and the 3 Columbus Circle Note A-5 Companion Loan, the “3 Columbus Circle Companion Loans”), which are currently being held by Wells Fargo Bank, National Association. Each of the 3 Columbus Circle Companion Loans may be sold or further divided at any time (subject to compliance with the terms of the related intercreditor agreement). The 3 Columbus Circle Loan and the 3 Columbus Circle Companion Loans are pari passu in right of payment and are collectively referred to herein as the “3 | |||||
THE INFORMATION IN THIS STRUCTURAL AND COLLATERAL TERM SHEET IS NOT COMPLETE AND MAY BE AMENDED PRIOR TO THE TIME OF SALE. THIS TERM SHEET IS NOT AN OFFER TO SELL THESE SECURITIES AND IT IS NOT A SOLICITATION OF AN OFFER TO BUY THESE SECURITIES IN ANY JURISDICTION WHERE THE OFFER OR SALE IS NOT PERMITTED.
9
COMM 2015-CCRE22 Mortgage Trust |
STRUCTURE OVERVIEW |
Columbus Circle Loan Combination.” The 3 Columbus Circle Loan Combination will initially be serviced pursuant to the pooling and servicing agreement for this transaction and the related intercreditor agreement. Upon securitization of the 3 Columbus Circle Note A-1 Companion Loan (the “3 Columbus Circle Note A-1 Securitization Date”), the servicing of the 3 Columbus Circle Loan Combination will transfer to the pooling and servicing agreement for that securitization. For additional information regarding the 3 Columbus Circle Loan Combination, see “Description of the Mortgage Pool—Loan Combinations—3 Columbus Circle Combination” in the Free Writing Prospectus. In addition, prior to the 3 Columbus Circle Note A-1 Securitization Date, Midland Loan Services, a Division of PNC Bank, National Association, if necessary, will be the special servicer for the 3 Columbus Circle Loan Combination. After the 3 Columbus Circle Note A-1 Securitization Date, the special servicer under the pooling and servicing related to such securitization will be the special servicer. The Mortgaged Property identified on Annex A–1 to the Free Writing Prospectus as 100 West 57th Street secures a Mortgage Loan with an outstanding principal balance as of the Cut–off Date of $60,000,000, evidenced by Note A-2 (the “100 West 57th Street Loan”), representing approximately 4.6% of the Initial Outstanding Pool Balance, and also secures on a pari passu basis two companion loans evidenced by (1) Note A-3, in the outstanding principal balance of $40,000,000 (the “100 West 57th Street Note A-3 Companion Loan”), which is currently being held by the COMM 2015-DC1 Mortgage Trust, and (2) Note A-1, in the outstanding principal balance of $80,000,000 (the “100 West 57th Street Note A-1 Companion Loan” and, together with the 100 West 57th Street Note A-3 Companion Loan, the “100 West 57th Street Companion Loans”), which is currently being held by Natixis Real Estate Capital LLC. The 100 West 57th Street Note A-1 Companion Loan may be sold or further divided at any time (subject to compliance with the terms of the related intercreditor agreement). The 100 West 57th Street Loan and the 100 West 57th Street Companion Loans are pari passu in right of payment and are collectively referred to herein as the “100 West 57th Street Loan Combination.” The 100 West 57th Street Loan Combination is initially being serviced pursuant to the COMM 2015-DC1 pooling and servicing agreement and the related intercreditor agreement. Upon securitization of the 100 West 57th Street Note A-1 Companion Loan, the servicing of the 100 West 57th Street Loan Combination will transfer to the pooling and servicing agreement for that securitization. For additional information regarding the 100 West 57th Street Loan Combination, see “Description of the Mortgage Pool—Loan Combinations—100 West 57th Street Loan Combination” in the Free Writing Prospectus. The Mortgaged Property identified on Annex A–1 to the Free Writing Prospectus as Patriots Park secures a Mortgage Loan with an outstanding principal balance as of the Cut–off Date of $26,000,000, evidenced by Note A-3 (the “Patriots Park Loan”), representing approximately 2.0% of the Initial Outstanding Pool Balance, and also secures on a pari passu basis two companion loans evidenced by (1) Note A-1, in the outstanding principal balance of $105,000,000 (the “Patriots Park Note A-1 Companion Loan”), and (2) Note A-2, in the outstanding principal balance of $84,070,000 (the “Patriots Park Note A-2 Companion Loan” and, together with the Patriots Park Note A-1 Companion Loan, the “Patriots Park Companion Loans”), each of which is currently held by Natixis Real Estate Capital LLC. Each of the Patriots Park Companion Loans may be sold or further divided at any time (subject to compliance with the terms of the related intercreditor agreement). The Patriots Park Loan and the Patriots Park Companion Loans are pari passu in right of payment and are collectively referred to herein as the “Patriots Park Loan Combination.” The Patriots Park Loan Combination will initially be serviced pursuant to the pooling and servicing agreement for this transaction and the related intercreditor agreement. Upon securitization of the Patriots Park Note A-1 Companion Loan, the servicing of the Patriots Park Loan Combination will transfer to the pooling and servicing agreement for that securitization. For additional information regarding the Patriots Park Loan Combination, see “Description of the Mortgage Pool—Loan Combinations—Patriots Park Combination” in the Free Writing Prospectus. The 26 Broadway Loan and the 100 West 57th Loan are collectively referred to as the “Non-Serviced Loans”, and the 26 Broadway Loan Combination and the 100 West 57th Loan Combination are collectively referred to as the “Non-Serviced Loan Combinations”. |
THE INFORMATION IN THIS STRUCTURAL AND COLLATERAL TERM SHEET IS NOT COMPLETE AND MAY BE AMENDED PRIOR TO THE TIME OF SALE. THIS TERM SHEET IS NOT AN OFFER TO SELL THESE SECURITIES AND IT IS NOT A SOLICITATION OF AN OFFER TO BUY THESE SECURITIES IN ANY JURISDICTION WHERE THE OFFER OR SALE IS NOT PERMITTED.
10
COMM 2015-CCRE22 Mortgage Trust |
STRUCTURE OVERVIEW |
| The 3 Columbus Loan and the Patriots Park Loan are collectively referred to as the “Servicing Shift Loans”, and the 3 Columbus Loan Combination and the Patriots Park Loan Combination are collectively referred to as the “Servicing Shift Loan Combinations”. | ||
| Control Rights and Directing Holder: | Certain Classes of Certificates (the “Control Eligible Certificates”) will have certain control rights over servicing matters with respect to each Mortgage Loan (other than the Non-Serviced Loans and the Servicing Shift Loans). The majority owner or appointed representative of the Class of Control Eligible Certificates that is the Controlling Class (such owner or representative, the “Directing Holder”), will be entitled to direct the Special Servicer to take, or refrain from taking certain actions with respect to each Mortgage Loan (other than the Non-Serviced Loans and the Servicing Shift Loans). Furthermore, the Directing Holder will also have the right to receive notice and consent to certain material actions that the Master Servicer and the Special Servicer proposes to take with respect to each Mortgage Loan (other than the Non-Serviced Loans and the Servicing Shift Loans). It is expected that LNR Securities Holdings, LLC or its affiliate will be the initial Directing Holder with respect to each Mortgage Loan (other than the Non-Serviced Loans and the Servicing Shift Loans). For a description of the directing holder for the Non-Serviced Loan Combinations and the Servicing Shift Loan Combinations, see “Description of the Mortgage Pool—Loan Combinations” and “Description of the Pooling and Servicing Agreement—The Directing Holder” in the Free Writing Prospectus. | |
| Control Eligible Certificates: | Class E, Class F, Class G and Class H Certificates. | |
| Controlling Class: | The Controlling Class will be the most subordinate Class of Control Eligible Certificates then outstanding that has an aggregate Certificate Balance, as notionally reduced by any Appraisal Reduction Amounts allocable to such Class, equal to no less than 25% of the initial Certificate Balance of such Class. The Controlling Class as of the Settlement Date will be the Class H Certificates. | |
| Appraised-Out Class: | Any Class of Control Eligible Certificates that has been determined, as a result of Appraisal Reductions Amounts allocable to such Class, to no longer be the Controlling Class. | |
Remedies Available to Holders of an Appraised-Out Class: | Holders of the majority of any Class of Control Eligible Certificates that is determined at any time of determination to no longer be the Controlling Class as a result of an allocation of an Appraisal Reduction Amounts in respect of such Class will have the right, at their sole expense, to require the Special Servicer to order a second appraisal for any Mortgage Loan (other than the Non-Serviced Loans and the Servicing Shift Loans) for which an Appraisal Reduction Event has occurred. Upon receipt of the second appraisal, the Special Servicer will be required to determine, in accordance with the Servicing Standard, whether, based on its assessment of the second appraisal, a recalculation of the Appraisal Reduction Amount is warranted. If warranted, the Special Servicer will direct the Master Servicer to recalculate the Appraisal Reduction Amount based on the second appraisal, and if required by such recalculation, the Special Servicer will reinstate the Appraised-Out Class as the Controlling Class. The Holders of an Appraised-Out Class requesting a second appraisal will not be entitled to exercise any rights of the Controlling Class until such time, if any, as the Class is reinstated as the Controlling Class. | |
| Control Termination Event: | Will occur with respect to any Mortgage Loan (other than the Non-Serviced Loans and the Servicing Shift Loans) when no Class of Control Eligible Certificates has an aggregate Certificate Balance (as notionally or actually reduced by any Appraisal Reduction Amounts and Realized Losses) equal to or greater than 25% of the initial Certificate Balance of such Class. Upon the occurrence and the continuance of a Control Termination Event, the Directing Holder will no longer have any Control Rights. The Directing Holder will no longer have the right to direct certain actions of the Special Servicer and will no longer have consent rights with respect to certain material actions that the Master Servicer or Special Servicer proposes to |
THE INFORMATION IN THIS STRUCTURAL AND COLLATERAL TERM SHEET IS NOT COMPLETE AND MAY BE AMENDED PRIOR TO THE TIME OF SALE. THIS TERM SHEET IS NOT AN OFFER TO SELL THESE SECURITIES AND IT IS NOT A SOLICITATION OF AN OFFER TO BUY THESE SECURITIES IN ANY JURISDICTION WHERE THE OFFER OR SALE IS NOT PERMITTED.
11
COMM 2015-CCRE22 Mortgage Trust |
STRUCTURE OVERVIEW |
take with respect to each Mortgage Loan (other than the Non-Serviced Loans and the Servicing Shift Loans). Upon the occurrence and continuation of a Control Termination Event, the Directing Holder will retain non-binding consultation rights with respect to certain material actions that the Special Servicer proposes to take with respect to each Mortgage Loan (other than the Non-Serviced Loans and the Servicing Shift Loans). Such consultation rights will continue until the occurrence of a Consultation Termination Event. | ||
| Consultation Termination Event: | Will occur with respect to each Mortgage Loan (other than the Non-Serviced Loans and the Servicing Shift Loans) when, without giving regard to the application of any Appraisal Reduction Amounts (i.e., giving effect to principal reduction through Realized Losses only), there is no Class of Control Eligible Certificates that has an aggregate Certificate Balance equal to 25% or more of the initial Certificate Balance of such Class. Upon the occurrence and continuance of a Consultation Termination Event, the Directing Holder will have no rights under the pooling and servicing for this securitization (the “Pooling and Servicing Agreement”) other than those rights that all Certificateholders have. | |
Appointment and Replacement of Special Servicer: | The Directing Holder will appoint the initial Special Servicer as of the Settlement Date. Prior to the occurrence and continuance of a Control Termination Event, the Special Servicer (other than with respect to the Non-Serviced Loans and the Servicing Shift Loans) may generally be replaced at any time by the Directing Holder. Upon the occurrence and during the continuance of a Control Termination Event, the Directing Holder will no longer have the right to replace the Special Servicer and such replacement (other than with respect to the Non-Serviced Loans and the Servicing Shift Loans) will occur based on a vote of holders of all voting eligible Classes of Certificates as described below. See “Description of the Mortgage Pool—Loan Combinations” and “Description of the Pooling and Servicing Agreement” in the Free Writing Prospectus for a description of the special servicer appointment and replacement rights with respect the Non-Serviced Loans and the Servicing Shift Loans. | |
| Replacement of Special Servicer by Vote of Certificateholders: | Other than with respect to the Non-Serviced Loans and the Servicing Shift Loans, if a Control Termination Event has occurred and is continuing, upon (i) the written direction of holders of Certificates evidencing not less than 25% of the voting rights of all Classes of Certificates entitled to principal (taking into account the application of Appraisal Reduction Amounts to notionally reduce the Certificate Balances of Classes to which such Appraisal Reduction Amounts are allocable) requesting a vote to replace the Special Servicer with a replacement Special Servicer, (ii) payment by such requesting holders to the Certificate Administrator of all reasonable fees and expenses to be incurred by the Certificate Administrator in connection with administering such vote and (iii) delivery by such holders to the Certificate Administrator of written confirmations from each Rating Agency that the appointment of the replacement Special Servicer will not result in a downgrade of the Certificates, the Certificate Administrator will be required to promptly provide written notice to all certificateholders of such request and conduct the solicitation of votes of all Certificates in such regard. Upon the written direction (within 180 days) of (i) Holders of at least 75% of a Certificateholder Quorum or (ii) the Holders of more than 50% of the voting rights of each Class of Non-Reduced Certificates, the Trustee will immediately replace the Special Servicer with the replacement Special Servicer (other than with respect to the Non-Serviced Loans and the Servicing Shift Loans). “Certificateholder Quorum” means, in connection with any solicitation of votes in connection with the replacement of the Special Servicer as described above, the holders of Certificates evidencing at least 75% of the aggregate voting rights (taking into account Realized Losses and the application of any Appraisal Reduction Amounts to notionally reduce the Certificate Balance of the Certificates) of all classes of Certificates entitled to principal, on an aggregate basis. In addition, other than with respect to the Non-Serviced Loans and the Servicing Shift Loans, after the occurrence of a Consultation Termination Event, if the Operating Advisor determines that the Special Servicer is not performing its duties in accordance with the Servicing |
THE INFORMATION IN THIS STRUCTURAL AND COLLATERAL TERM SHEET IS NOT COMPLETE AND MAY BE AMENDED PRIOR TO THE TIME OF SALE. THIS TERM SHEET IS NOT AN OFFER TO SELL THESE SECURITIES AND IT IS NOT A SOLICITATION OF AN OFFER TO BUY THESE SECURITIES IN ANY JURISDICTION WHERE THE OFFER OR SALE IS NOT PERMITTED.
12
COMM 2015-CCRE22 Mortgage Trust |
STRUCTURE OVERVIEW |
Standard, the Operating Advisor will have the right to recommend the replacement of the Special Servicer. The Operating Advisor’s recommendation to replace the Special Servicer (other than with respect to the Non-Serviced Loans and the Servicing Shift Loans) must be confirmed by a majority of the voting rights of all Classes of Certificates entitled to principal (taking into account the application of Appraisal Reduction Amounts to notionally reduce the Certificate Balances of Classes to which such Appraisal Reduction Amounts are allocable) within 180 days from the time such recommendation is posted to the Certificate Administrator website and is subject to the receipt of written confirmations from each Rating Agency that the appointment of the replacement Special Servicer will not result in a downgrade of the Certificates. See “Description of the Mortgage Pool—Loan Combinations” and “Description of the Pooling and Servicing Agreement” in the Free Writing Prospectus for a description of the special servicer appointment and replacement rights with respect to the Non-Serviced Loans and the Servicing Shift Loans. | ||
| Cap on Workout and Liquidation Fees: | The workout fees and liquidation fees payable to a Special Servicer under the Pooling and Servicing Agreement will be an amount equal to the lesser of: (1) 1.0% of each collection of interest and principal following a workout or liquidation and (2) $1,000,000 per workout or liquidation. All Modification Fees actually paid to the Special Servicer in connection with a workout or liquidation or in connection with any prior workout or partial liquidation that occurred within the prior 18 months will be deducted from the total workout and/or liquidation fees payable (other than Modification Fees earned while the Mortgage Loan was not in special servicing). In addition, the total amount of workout and liquidation fees actually payable by the Trust under the Pooling and Servicing Agreement will be capped in the aggregate at $1,000,000 for each related Mortgage Loan. If a new special servicer begins servicing the related Mortgage Loan, all amounts paid to the prior special servicer will be disregarded for purposes of calculating the cap. | |
| Special Servicer Compensation: | The special servicing fee will equal 0.25% per annum of the stated principal balance of the related specially serviced loan or REO property. The Special Servicer and its affiliates will be prohibited from receiving or retaining any compensation or any other remuneration under the Pooling and Servicing Agreement (including in the form of commissions, brokerage fees, rebates, or as a result of any other fee-sharing arrangement) from any person (including the issuing entity, any borrower, any manager, any guarantor or indemnitor in respect of a Mortgage Loan or Serviced Loan Combination, if any, and any purchaser of any Mortgage Loan, Serviced Companion Loan or REO Property) in connection with the disposition, workout or foreclosure of any Mortgage Loan or Serviced Loan Combination, the management or disposition of any REO Property, or the performance of any other special servicing duties under the Pooling and Servicing Agreement, other than as expressly permitted in the Pooling and Servicing Agreement and other than commercially reasonable treasury management fees, banking fees and insurance commissions or fees received or retained by the Special Servicer or any of its Affiliates in connection with any services performed by such party with respect to any mortgage loan. Subject to certain limited exceptions, the Special Servicer will also be required to report any compensation or other remuneration the Special Servicer or its affiliates have received from any person and such information will be disclosed in the Certificateholders’ monthly distribution date statement. | |
| Operating Advisor: | With respect to the Mortgage Loans (other the Non-Serviced Loans and the Servicing Shift Loans) and prior to the occurrence of a Control Termination Event, the Operating Advisor will have access to any final asset status report and all information available with respect to the transaction on the Certificate Administrator’s website but will not have any approval or consultation rights. After the occurrence and during the continuance of a Control Termination Event, the Operating Advisor will have consultation rights with respect to certain major decisions and will have additional monitoring responsibilities on behalf of the entire trust. The Operating Advisor will be subject to termination if holders of at least 15% of the aggregate voting rights of the Certificates (in connection with termination and replacement relating to the Mortgage Loans) vote to terminate and replace the Operating Advisor and such vote is approved by holders of more than 50% of the applicable voting rights that exercise their right to vote, provided that holders of at least 50% of the applicable voting rights have exercised their right to vote. The holders initiating such vote will be responsible for the fees and expenses in connection with the vote and replacement. |
THE INFORMATION IN THIS STRUCTURAL AND COLLATERAL TERM SHEET IS NOT COMPLETE AND MAY BE AMENDED PRIOR TO THE TIME OF SALE. THIS TERM SHEET IS NOT AN OFFER TO SELL THESE SECURITIES AND IT IS NOT A SOLICITATION OF AN OFFER TO BUY THESE SECURITIES IN ANY JURISDICTION WHERE THE OFFER OR SALE IS NOT PERMITTED.
13
COMM 2015-CCRE22 Mortgage Trust |
STRUCTURE OVERVIEW |
| The Operating Advisor will not have consultation rights in respect the Non-Serviced Loans and the Servicing Shift Loans. | ||
| Liquidated Loan Waterfall: | On liquidation of any Mortgage Loan, all net liquidation proceeds will be applied so that amounts allocated as a recovery of accrued and unpaid interest will not, in the first instance, include any amount by which the interest portion of P&I Advances previously made was reduced as a result of Appraisal Reduction Amounts. After the adjusted interest amount is so allocated, any remaining net liquidation proceeds will be allocated to pay principal on the Mortgage Loan until the unpaid principal amount of the Mortgage Loan has been reduced to zero. Any remaining liquidation proceeds would then be allocated as a recovery of accrued and unpaid interest corresponding to the amount by which the interest portion of P&I Advances previously made was reduced as a result of Appraisal Reduction Amounts. |
THE INFORMATION IN THIS STRUCTURAL AND COLLATERAL TERM SHEET IS NOT COMPLETE AND MAY BE AMENDED PRIOR TO THE TIME OF SALE. THIS TERM SHEET IS NOT AN OFFER TO SELL THESE SECURITIES AND IT IS NOT A SOLICITATION OF AN OFFER TO BUY THESE SECURITIES IN ANY JURISDICTION WHERE THE OFFER OR SALE IS NOT PERMITTED.
14
COMM 2015-CCRE22 Mortgage Trust
| OVERVIEW OF MORTGAGE POOL CHARACTERISTICS |
Distribution of Cut-off Date Balances(1) |
| Weighted Averages | |||||||||||||||||||||||||
| Range of Cut-off Date Balances | Number of Mortgage Loans | Aggregate Cut-off Date Balance | % of Initial Outstanding Pool Balance | Mortgage Rate | Stated Remaining Term (Mos.)(2) | U/W NCF DSCR(3) | Cut-off Date LTV Ratio(4) | Maturity Date or ARD LTV(4) | |||||||||||||||||
| $1,940,000 | - | $7,499,999 | 18 | $89,972,157 | 6.9% | 4.4707% | 116 | 1.68x | 66.2% | 53.2% | |||||||||||||||
| $7,500,000 | - | $14,999,999 | 22 | $237,723,709 | 18.3% | 4.3277% | 113 | 1.55x | 68.4% | 56.6% | |||||||||||||||
| $15,000,000 | - | $24,999,999 | 9 | $181,066,298 | 14.0% | 4.4033% | 119 | 1.45x | 64.9% | 54.3% | |||||||||||||||
| $25,000,000 | - | $49,999,999 | 10 | $341,052,795 | 26.3% | 4.2867% | 113 | 1.53x | 73.6% | 67.2% | |||||||||||||||
| $50,000,000 | - | $74,999,999 | 3 | $181,675,000 | 14.0% | 3.5673% | 74 | 1.54x | 61.4% | 59.1% | |||||||||||||||
| $75,000,000 | - | $100,000,000 | 3 | $265,000,000 | 20.4% | 3.9172% | 106 | 1.84x | 58.0% | 55.2% | |||||||||||||||
| Total/Weighted Average | 65 | $1,296,489,958 | 100.0% | 4.1469% | 107 | 1.60x | 66.0% | 58.9% | |||||||||||||||||
Distribution of Mortgage Rates(1) |
| Weighted Averages | |||||||||||||||||||||||||
| Range of Mortgage Rates | Number of Mortgage Loans | Aggregate Cut-off Date Balance | % of Initial Outstanding Pool Balance | Mortgage Rate | Stated Remaining Term (Mos.)(2) | U/W NCF DSCR(3) | Cut-off Date LTV Ratio(4) | Maturity Date or ARD LTV(4) | |||||||||||||||||
| 2.3069% | - | 3.9999% | 6 | $273,125,885 | 21.1% | 3.3646% | 98 | 1.76x | 59.6% | 56.0% | |||||||||||||||
| 4.0000% | - | 4.4999% | 39 | $781,527,274 | 60.3% | 4.2789% | 108 | 1.54x | 67.9% | 60.8% | |||||||||||||||
| 4.5000% | - | 5.2000% | 20 | $241,836,799 | 18.7% | 4.6040% | 114 | 1.60x | 67.2% | 56.0% | |||||||||||||||
| Total/Weighted Average | 65 | $1,296,489,958 | 100.0% | 4.1469% | 107 | 1.60x | 66.0% | 58.9% | |||||||||||||||||
Property Type Distribution(1)(5) |
| Weighted Averages | ||||||||||||||||||||||||||||||||
| Property Type | Number of Mortgaged Properties | Aggregate Cut-off Date Balance | % of Initial Outstanding Pool Balance | Number of Units/Rooms/ NRA | Cut-off Date Balance per Unit/Room/ NRA | Mortgage Rate | Stated Remaining Term (Mos.)(2) | Occupancy | U/W NCF DSCR(3) | Cut-off Date LTV Ratio(4) | Maturity Date or ARD LTV(4) | |||||||||||||||||||||
| Office | 21 | $567,799,743 | 43.8% | 5,653,909 | $249 | 4.0803% | 110 | 90.1% | 1.70x | 62.5% | 56.2% | |||||||||||||||||||||
| CBD | 9 | $287,457,206 | 22.2% | 2,333,887 | $357 | 4.0984% | 106 | 84.4% | 1.75x | 59.7% | 56.0% | |||||||||||||||||||||
| Suburban | 11 | $260,374,170 | 20.1% | 2,976,686 | $144 | 4.0343% | 113 | 95.7% | 1.67x | 65.6% | 56.9% | |||||||||||||||||||||
| Suburban/Data Center | 1 | $19,968,367 | 1.5% | 343,336 | $58 | 4.4200% | 119 | 100.0% | 1.50x | 62.7% | 50.6% | |||||||||||||||||||||
| Hospitality | 13 | $209,298,630 | 16.1% | 1,818 | $193,377 | 4.4480% | 95 | 76.9% | 1.77x | 61.7% | 51.9% | |||||||||||||||||||||
| Full Service | 3 | $122,811,551 | 9.5% | 848 | $258,017 | 4.4015% | 84 | 76.9% | 1.77x | 59.5% | 52.3% | |||||||||||||||||||||
| Extended Stay | 5 | $53,326,527 | 4.1% | 514 | $108,291 | 4.4610% | 118 | 79.9% | 1.86x | 67.4% | 54.1% | |||||||||||||||||||||
| Limited Service | 5 | $33,160,552 | 2.6% | 456 | $90,810 | 4.5993% | 97 | 72.2% | 1.61x | 61.0% | 47.2% | |||||||||||||||||||||
| Retail | 22 | $189,838,679 | 14.6% | 1,471,791 | $194 | 4.4092% | 114 | 95.1% | 1.48x | 69.0% | 59.4% | |||||||||||||||||||||
Anchored(6) | 11 | $109,138,679 | 8.4% | 962,838 | $150 | 4.3528% | 111 | 95.5% | 1.46x | 70.2% | 61.0% | |||||||||||||||||||||
| Unanchored | 11 | $80,700,000 | 6.2% | 508,953 | $253 | 4.4855% | 117 | 94.5% | 1.51x | 67.3% | 57.2% | |||||||||||||||||||||
| Other | 4 | $174,693,000 | 13.5% | 286,135 | $4,147 | 3.6117% | 97 | 100.0% | 1.37x | 73.9% | 73.9% | |||||||||||||||||||||
| Multifamily | 9 | $115,534,130 | 8.9% | 1,661 | $87,155 | 4.2782% | 120 | 93.2% | 1.37x | 74.3% | 62.5% | |||||||||||||||||||||
| Garden | 8 | $72,784,130 | 5.6% | 1,320 | $64,710 | 4.2445% | 119 | 94.4% | 1.38x | 74.2% | 62.0% | |||||||||||||||||||||
| Mid Rise | 1 | $42,750,000 | 3.3% | 341 | $125,367 | 4.3355% | 120 | 91.2% | 1.37x | 74.6% | 63.4% | |||||||||||||||||||||
| Industrial | 3 | $25,475,776 | 2.0% | 313,054 | $85 | 4.2134% | 119 | 95.0% | 1.45x | 67.2% | 56.9% | |||||||||||||||||||||
| Self Storage | 2 | $13,850,000 | 1.1% | 126,330 | $123 | 4.2675% | 119 | 90.5% | 1.38x | 63.7% | 50.8% | |||||||||||||||||||||
| Total/Weighted Average | 74 | $1,296,489,958 | 100.0% | 4.1469% | 107 | 89.4% | 1.60x | 66.0% | 58.9% | |||||||||||||||||||||||
THE INFORMATION IN THIS STRUCTURAL AND COLLATERAL TERM SHEET IS NOT COMPLETE AND MAY BE AMENDED PRIOR TO THE TIME OF SALE. THIS TERM SHEET IS NOT AN OFFER TO SELL THESE SECURITIES AND IT IS NOT A SOLICITATION OF AN OFFER TO BUY THESE SECURITIES IN ANY JURISDICTION WHERE THE OFFER OR SALE IS NOT PERMITTED.
15
COMM 2015-CCRE22 Mortgage Trust
OVERVIEW OF MORTGAGE POOL CHARACTERISTICS |
Geographic Distribution(1)(5) |
| Weighted Averages | |||||||||||||||||||||||
| State/Location | Number of Mortgaged Properties | Aggregate Cut-off Date Balance | % of Initial Outstanding Pool Balance | Mortgage Rate | Stated Remaining Term (Mos.)(2) | U/W NCF DSCR(3) | Cut-off Date LTV Ratio(4) | Maturity Date or ARD LTV(4) | |||||||||||||||
| New York | 7 | $365,987,673 | 28.2% | 3.8987% | 97 | 1.64x | 61.1% | 59.0% | |||||||||||||||
| New York City | 7 | $365,987,673 | 28.2% | 3.8987% | 97 | 1.64x | 61.1% | 59.0% | |||||||||||||||
| Texas | 7 | $149,214,805 | 11.5% | 3.9313% | 120 | 1.54x | 68.1% | 57.5% | |||||||||||||||
| California | 4 | $104,200,000 | 8.0% | 4.2739% | 78 | 1.80x | 61.9% | 58.4% | |||||||||||||||
Southern(7) | 3 | $88,200,000 | 6.8% | 4.2379% | 70 | 1.90x | 61.6% | 58.4% | |||||||||||||||
Northern(7) | 1 | $16,000,000 | 1.2% | 4.4720% | 117 | 1.21x | 63.5% | 58.1% | |||||||||||||||
| New Jersey | 6 | $95,843,500 | 7.4% | 4.3446% | 119 | 1.49x | 73.5% | 62.7% | |||||||||||||||
| Minnesota | 5 | $95,553,862 | 7.4% | 4.2837% | 118 | 1.70x | 66.3% | 56.8% | |||||||||||||||
| Other | 45 | $485,690,119 | 37.5% | 4.3071% | 112 | 1.54x | 68.5% | 59.0% | |||||||||||||||
| Total/Weighted Average | 74 | $1,296,489,958 | 100.0% | 4.1469% | 107 | 1.60x | 66.0% | 58.9% | |||||||||||||||
Distribution of Cut-off Date LTV Ratios(1)(4) |
| Weighted Averages | ||||||||||||||||||||||||||
Range of Cut-off Date LTV Ratios | Number of Mortgage Loans | Aggregate Cut-off Date Balance | % of Initial Outstanding Pool Balance | Mortgage Rate | Stated Remaining Term (Mos.)(2) | U/W NCF DSCR(3) | Cut-off Date LTV Ratio | Maturity Date or ARD LTV | ||||||||||||||||||
| 34.0% | - | 59.9% | 9 | $249,193,757 | 19.2% | 4.1301% | 99 | 1.89x | 54.3% | 51.7% | ||||||||||||||||
| 60.0% | - | 64.9% | 18 | $494,463,365 | 38.1% | 4.0028% | 103 | 1.57x | 62.7% | 55.7% | ||||||||||||||||
| 65.0% | - | 69.9% | 15 | $203,341,012 | 15.7% | 4.2302% | 109 | 1.61x | 68.2% | 57.7% | ||||||||||||||||
| 70.0% | - | 75.0% | 17 | $242,380,424 | 18.7% | 4.3783% | 119 | 1.41x | 73.7% | 63.4% | ||||||||||||||||
| 75.1% | - | 79.9% | 4 | $37,418,400 | 2.9% | 4.2464% | 119 | 1.54x | 77.0% | 64.5% | ||||||||||||||||
| 80.0% | - | 94.8% | 2 | $69,693,000 | 5.4% | 4.1291% | 117 | 1.41x | 92.0% | 92.0% | ||||||||||||||||
| Total/Weighted Average | 65 | $1,296,489,958 | 100.0% | 4.1469% | 107 | 1.60x | 66.0% | 58.9% | ||||||||||||||||||
Distribution of Maturity Date or ARD LTV Ratios(1)(4) |
| Weighted Averages | ||||||||||||||||||||||||||
Range of LTV Ratios at Maturity or ARD | Number of Mortgage Loans | Aggregate Cut-off Date Balance | % of Initial Outstanding Pool Balance | Mortgage Rate | Stated Remaining Term (Mos.)(2) | U/W NCF DSCR(3) | Cut-off Date LTV Ratio | Maturity Date or ARD LTV | ||||||||||||||||||
| 18.8% | - | 49.9% | 7 | $94,050,714 | 7.3% | 4.4740% | 109 | 1.66x | 55.7% | 42.5% | ||||||||||||||||
| 50.0% | - | 54.9% | 20 | $286,666,824 | 22.1% | 4.1543% | 117 | 1.75x | 59.9% | 51.0% | ||||||||||||||||
| 55.0% | - | 59.9% | 13 | $424,427,491 | 32.7% | 4.2049% | 100 | 1.65x | 64.1% | 57.8% | ||||||||||||||||
| 60.0% | - | 64.9% | 18 | $334,816,930 | 25.8% | 3.9918% | 107 | 1.42x | 69.5% | 62.7% | ||||||||||||||||
| 65.0% | - | 69.9% | 5 | $86,835,000 | 6.7% | 4.0975% | 98 | 1.61x | 72.5% | 67.0% | ||||||||||||||||
| 70.0% | - | 94.8% | 2 | $69,693,000 | 5.4% | 4.1291% | 117 | 1.41x | 92.0% | 92.0% | ||||||||||||||||
| Total/Weighted Average | 65 | $1,296,489,958 | 100.0% | 4.1469% | 107 | 1.60x | 66.0% | 58.9% | ||||||||||||||||||
Distribution of Underwritten NCF Debt Service Coverage Ratios(1)(3) |
| Weighted Averages | ||||||||||||||||||||||||||
Range of Underwritten NCF Debt Service Coverage Ratios | Number of Mortgage Loans | Aggregate Cut-off Date Balance | % of Initial Outstanding Pool Balance | Mortgage Rate | Stated Remaining Term (Mos.)(2) | U/W NCF DSCR | Cut-off Date LTV Ratio(4) | Maturity Date or ARD LTV(4) | ||||||||||||||||||
| 1.00x | - | 1.19x | 1 | $60,000,000 | 4.6% | 2.3069% | 56 | 1.00x | 60.0% | 60.0% | ||||||||||||||||
| 1.20x | - | 1.39x | 15 | $279,330,376 | 21.5% | 4.2904% | 118 | 1.34x | 73.8% | 64.6% | ||||||||||||||||
| 1.40x | - | 1.59x | 30 | $508,262,413 | 39.2% | 4.3623% | 109 | 1.51x | 66.9% | 58.8% | ||||||||||||||||
| 1.60x | - | 1.79x | 6 | $175,569,953 | 13.5% | 4.1001% | 119 | 1.73x | 63.8% | 56.3% | ||||||||||||||||
| 1.80x | - | 1.99x | 7 | $143,402,412 | 11.1% | 4.3094% | 86 | 1.91x | 63.5% | 56.6% | ||||||||||||||||
| 2.00x | - | 2.49x | 5 | $125,374,805 | 9.7% | 3.7121% | 106 | 2.25x | 54.3% | 52.7% | ||||||||||||||||
| 2.50x | - | 2.67x | 1 | $4,550,000 | 0.4% | 4.2200% | 119 | 2.67x | 49.7% | 49.7% | ||||||||||||||||
| Total/Weighted Average | 65 | $1,296,489,958 | 100.0% | 4.1469% | 107 | 1.60x | 66.0% | 58.9% | ||||||||||||||||||
THE INFORMATION IN THIS STRUCTURAL AND COLLATERAL TERM SHEET IS NOT COMPLETE AND MAY BE AMENDED PRIOR TO THE TIME OF SALE. THIS TERM SHEET IS NOT AN OFFER TO SELL THESE SECURITIES AND IT IS NOT A SOLICITATION OF AN OFFER TO BUY THESE SECURITIES IN ANY JURISDICTION WHERE THE OFFER OR SALE IS NOT PERMITTED.
16
COMM 2015-CCRE22 Mortgage Trust
OVERVIEW OF MORTGAGE POOL CHARACTERISTICS |
Original Terms to Maturity or ARD(1)(2) |
| Weighted Averages | ||||||||||||||||||||||||
Original Terms to Maturity or ARD | Number of Mortgage Loans | Aggregate Cut-off Date Balance | % of Initial Outstanding Pool Balance | Mortgage Rate | Stated Remaining Term (Mos.) | U/W NCF DSCR(3) | Cut-off Date LTV Ratio(4) | Maturity Date or ARD LTV(4) | ||||||||||||||||
| 60 | 6 | $176,812,716 | 13.6% | 3.5727% | 57 | 1.62x | 61.1% | 59.6% | ||||||||||||||||
| 84 | 2 | $110,975,885 | 8.6% | 4.3352% | 82 | 1.61x | 59.5% | 58.4% | ||||||||||||||||
| 120 | 57 | $1,008,701,358 | 77.8% | 4.2269% | 119 | 1.59x | 67.6% | 58.8% | ||||||||||||||||
| Total/Weighted Average | 65 | $1,296,489,958 | 100.0% | 4.1469% | 107 | 1.60x | 66.0% | 58.9% | ||||||||||||||||
Distribution of Remaining Terms to Maturity or ARD(1)(2) |
| Weighted Averages | ||||||||||||||||||||||||||
Range of Remaining Terms to Maturity or ARD | Number of Mortgage Loans | Aggregate Cut-off Date Balance | % of Initial Outstanding Pool Balance | Mortgage Rate | Stated Remaining Term (Mos.) | U/W NCF DSCR(3) | Cut-off Date LTV Ratio(4) | Maturity Date or ARD LTV(4) | ||||||||||||||||||
| 55 | - | 60 | 6 | $176,812,716 | 13.6% | 3.5727% | 57 | 1.62x | 61.1% | 59.6% | ||||||||||||||||
| 82 | - | 84 | 2 | $110,975,885 | 8.6% | 4.3352% | 82 | 1.61x | 59.5% | 58.4% | ||||||||||||||||
| 115 | - | 120 | 57 | $1,008,701,358 | 77.8% | 4.2269% | 119 | 1.59x | 67.6% | 58.8% | ||||||||||||||||
| Total/Weighted Average | 65 | $1,296,489,958 | 100.0% | 4.1469% | 107 | 1.60x | 66.0% | 58.9% | ||||||||||||||||||
Distribution of Underwritten NOI Debt Yields(1) |
| Weighted Averages | ||||||||||||||||||||||||||
Range of Underwritten NOI Debt Yields | Number of Mortgage Loans | Aggregate Cut-off Date Balance | % of Initial Outstanding Pool Balance | Mortgage Rate | Stated Remaining Term (Mos.)(2) | U/W NCF DSCR(3) | Cut-off Date LTV Ratio(4) | Maturity Date or ARD LTV(4) | ||||||||||||||||||
| 2.3% | - | 6.9% | 3 | $129,693,000 | 10.0% | 3.2861% | 89 | 1.22x | 77.2% | 77.2% | ||||||||||||||||
| 7.0% | - | 8.9% | 16 | $470,105,100 | 36.3% | 4.1683% | 108 | 1.65x | 64.0% | 59.4% | ||||||||||||||||
| 9.0% | - | 9.9% | 12 | $192,297,676 | 14.8% | 4.2597% | 118 | 1.46x | 69.5% | 59.8% | ||||||||||||||||
| 10.0% | - | 12.4% | 23 | $354,589,893 | 27.3% | 4.3026% | 117 | 1.59x | 66.2% | 54.5% | ||||||||||||||||
| 12.5% | - | 14.9% | 8 | $132,366,573 | 10.2% | 4.2797% | 83 | 1.95x | 58.6% | 52.4% | ||||||||||||||||
| 15.0% | - | 18.7% | 3 | $17,437,716 | 1.3% | 4.5565% | 92 | 1.81x | 52.2% | 38.2% | ||||||||||||||||
| Total/Weighted Average | 65 | $1,296,489,958 | 100.0% | 4.1469% | 107 | 1.60x | 66.0% | 58.9% | ||||||||||||||||||
Amortization Types(1) |
| Weighted Averages | ||||||||||||||||||||||||
| Amortization Type | Number of Mortgage Loans | Aggregate Cut-off Date Balance | % of Initial Outstanding Pool Balance | Mortgage Rate | Stated Remaining Term (Mos.)(2) | U/W NCF DSCR(3) | Cut-off Date LTV Ratio(4) | Maturity Date or ARD LTV(4) | ||||||||||||||||
| Interest Only, then Amortizing | 26 | $534,553,500 | 41.2% | 4.1710% | 110 | 1.55x | 68.1% | 60.1% | ||||||||||||||||
| Amortizing Balloon | 31 | $371,693,458 | 28.7% | 4.4561% | 115 | 1.56x | 64.9% | 51.5% | ||||||||||||||||
| Interest Only | 4 | $234,550,000 | 18.1% | 4.1322% | 104 | 1.91x | 56.8% | 56.8% | ||||||||||||||||
| Interest Only, ARD | 4 | $155,693,000 | 12.0% | 3.3482% | 83 | 1.38x | 75.5% | 75.5% | ||||||||||||||||
| Total/Weighted Average | 65 | $1,296,489,958 | 100.0% | 4.1469% | 107 | 1.60x | 66.0% | 58.9% | ||||||||||||||||
Footnotes:
| (1) | With respect to the 26 Broadway Loan, the 3 Columbus Circle Loan, the 100 West 57th Street Loan and the Patriots Park Loan, LTV, DSCR, debt yield and cut-off balance per Unit/Room/NRA calculations include the related pari passu companion loan(s). With respect to two groups of cross-collateralized and cross-defaulted loans, LTV, DSCR, debt yield and cut-off balance per Unit/Room/NRA calculations are calculated on an aggregate basis unless otherwise specifically indicated. |
| (2) | In the case of the four mortgage loans with anticipated repayment dates, Original Terms to Maturity or ARD and Remaining Terms to Maturity or ARD is through the related anticipated repayment date. |
| (3) | In the case of one mortgage loan, representing approximately 5.4%, of the initial outstanding pool balance as of the cut-off date, following an initial interest only period of 36 months, the mortgage loan amortizes based on a non-standard amortization. For additional information, see Annex H of the Free Writing Prospectus. |
| (4) | With respect to four mortgage loans, representing approximately 6.0% of the initial outstanding principal balance, the Cut-off Date LTV Ratio and Maturity Date or ARD LTV have in certain cases been calculated based on the “as stabilized” or “as complete” value. For additional information, see the Footnotes to Annex A-1 in the Free Writing Prospectus. |
| (5) | Reflects allocated loan amount for properties securing multi-property mortgage loans. |
| (6) | Includes anchored, single tenant and shadow anchored properties. |
| (7) | Northern California properties have a zip code greater than 93600. Southern California properties have a zip code less than or equal to 93600. |
THE INFORMATION IN THIS STRUCTURAL AND COLLATERAL TERM SHEET IS NOT COMPLETE AND MAY BE AMENDED PRIOR TO THE TIME OF SALE. THIS TERM SHEET IS NOT AN OFFER TO SELL THESE SECURITIES AND IT IS NOT A SOLICITATION OF AN OFFER TO BUY THESE SECURITIES IN ANY JURISDICTION WHERE THE OFFER OR SALE IS NOT PERMITTED.
17
COMM 2015-CCRE22 Mortgage Trust |
| OVERVIEW OF MORTGAGE POOL CHARACTERISTICS |
Previous Securitization History(1) |
| Mortgage Loan | Mortgage Loan Seller | City, State | Property Type | Cut-off Date Balance | % of Initial Outstanding Pool Balance | Previous Securitization | ||||||
| One Riverway | GACC | Houston, TX | Office | $80,000,000 | 6.2% | GMACC 2005-C1 | ||||||
| Marriott Burbank | GACC | Burbank, CA | Hospitality | $70,000,000 | 5.4% | LBFRC 2007-LLFA | ||||||
| Hotel Giraffe | CCRE | New York, NY | Hospitality | $38,856,957 | 3.0% | CSFB 2005-C1 | ||||||
| Fifield Portfolio | GACC | Various, TX | Multifamily | $33,000,000 | 2.5% | Various(2) | ||||||
| Shoppes at Paradise Isle | Natixis | Destin, FL | Retail | $25,000,000 | 1.9% | CSFB 2004-C5 | ||||||
| One Shoreline Plaza | GACC | Corpus Christi, TX | Office | $24,000,000 | 1.9% | COMM 2005-C6 | ||||||
| Springfield Hotels | BNYM | Springfield, IL | Hospitality | $20,931,891 | 1.6% | MSC 2007-T27 | ||||||
| Boulder Marketplace | CCRE | Las Vegas, NV | Retail | $19,000,000 | 1.5% | SMAP 2012-LV1 | ||||||
| University Village FSU | CCRE | Tallahassee, FL | Retail | $13,500,000 | 1.0% | MLMT 2005-CIP1 | ||||||
| 1424 K Street Northwest | BNYM | Washington, D.C. | Office | $13,325,000 | 1.0% | WBCMT 2005-C16 | ||||||
| Sand Lake Corners | BNYM | Orlando, FL | Retail | $11,850,000 | 0.9% | BACM 2007-2 | ||||||
| Geneva Square | CCRE | Lake Geneva, WI | Retail | $10,975,885 | 0.8% | JPMCC 2005-LDP2 | ||||||
| 200 Clifton | Natixis | Clifton, NJ | Industrial | $9,922,000 | 0.8% | BSCMS 2005-T18 | ||||||
| Residence Inn Frederick | Natixis | Frederick, MD | Hospitality | $9,447,665 | 0.7% | CSFB 2005-C1 | ||||||
| AA Universal Self Storage | CCRE | North Hollywood, CA | Self Storage | $9,100,000 | 0.7% | JPMCC 2005-LDP1 | ||||||
| TPI SpringHill Suites Rochester | GACC | Rochester, MN | Hospitality | $8,027,759 | 0.6% | COMM 2005-C6 | ||||||
| Hotel Casablanca | CCRE | New York, NY | Hospitality | $7,937,716 | 0.6% | CSFB 2005-C1 | ||||||
| Barrett Creek | CCRE | Marietta, GA | Retail | $6,700,000 | 0.5% | CSFB 2005-C6 | ||||||
| Edelweiss Village Shopping Center | GACC | Gaylord, MI | Retail | $6,481,894 | 0.5% | JPMCC 2005-LDP1 | ||||||
| TPI Staybridge Suites Eagan | GACC | Eagan, MN | Hospitality | $5,798,266 | 0.4% | MLCFC 2007-7 | ||||||
| Lions Run Apartments | CCRE | Harker Heights, TX | Multifamily | $5,400,000 | 0.4% | LBUBS 2005-C1 | ||||||
| Port of Sale | CCRE | Charlotte Amalie, USVI | Retail | $5,000,000 | 0.4% | BSCMS 2006-T22 | ||||||
| Plantation Royal Apartments | GACC | Dallas, TX | Multifamily | $4,874,805 | 0.4% | LASL 2006-MF3 | ||||||
| Northup Commerce Center | CCRE | Bellevue, WA | Retail | $4,550,000 | 0.4% | JPMCC 2005-LDP2 | ||||||
| Total | $443,679,837 | 34.2% |
| (1) | Includes mortgaged properties securing mortgage loans for which the most recent prior financing of all or a significant portion of such property was included in a securitization. The table above is based on information provided by the related borrower or obtained through searches of a third-party database. The information has not otherwise been confirmed by the depositor, the mortgage loan sellers or any underwriter. |
| (2) | With respect to the Fifield Portfolio loan, the McKamy Lake Apartments property was most recently securitized in the MLCFC 2006-1 transaction. The Creekside at Northlake property was most recently securitized in the WBCMT 2005-C21 transaction. |
| Ten Largest Mortgage Loans |
Mortgage Loan | Mortgage Loan Seller | City, State | Property Type | Cut-off Date Balance | % of Initial Outstanding Pool Balance | Cut-off Date Balance per Room/Unit/NRA(1) | Cut-off Date LTV Ratio(1) | U/W NCF DSCR(1)(2) | U/W NOI Debt Yield(1) | |||||||||
| 26 Broadway | GACC | New York, NY | Office | $100,000,000 | 7.7% | $262 | 59.5% | 1.59x | 7.4% | |||||||||
| Wells Fargo Crossed Portfolio | GACC | Various | Office | $94,849,743 | 7.3% | $58 | 62.7% | 1.50x | 10.8% | |||||||||
| 3 Columbus Circle | GACC | New York, NY | Office | $85,000,000 | 6.6% | $666 | 50.0% | 2.30x | 8.8% | |||||||||
| One Riverway | GACC | Houston, TX | Office | $80,000,000 | 6.2% | $165 | 64.5% | 1.67x | 10.1% | |||||||||
| Marriott Burbank | GACC | Burbank, CA | Hospitality | $70,000,000 | 5.4% | $143,443 | 60.3% | 1.98x | 13.0% | |||||||||
| 100 West 57th Street | Natixis | New York, NY | Other | $60,000,000 | 4.6% | $7,164 | 60.0% | 1.00x | 2.3% | |||||||||
| UnitedHealth Group HQ | GACC | Minnetonka, MN | Office | $51,675,000 | 4.0% | $150 | 64.6% | 1.58x | 9.7% | |||||||||
| Soho House NYC | CCRE | New York, NY | Other | $45,000,000 | 3.5% | $755 | 64.3% | 1.79x | 8.3% | |||||||||
| The Victor Waterfront Lofts | CCRE | Camden, NJ | Multifamily | $42,750,000 | 3.3% | $125,367 | 74.6% | 1.37x | 8.5% | |||||||||
| DoubleTree by Hilton Portland Leased Fee | CCRE | Portland, OR | Other | $40,500,000 | 3.1% | $205 | 90.0% | 1.45x | 6.1% | |||||||||
| Total/Weighted Average | $669,774,743 | 51.7% | 63.0% | 1.65x | 8.7% |
| (1) | With respect to the 26 Broadway loan, the 3 Columbus Circle loan and the 100 West 57th Street loan, LTV, DSCR, debt yield and cut-off date balance per Room/Unit/NRA calculations include the related pari passu companion loans. With respect to the Wells Fargo Crossed Portfolio, LTV, DSCR, debt yield and cut-off balance per Room/Unit/NRA calculations are calculated on an aggregate basis unless otherwise specifically indicated. |
| (2) | With respect to Marriott Burbank loan, following an initial interest only period of 36 months, the mortgage loan amortizes based on a non-standard amortization. U/W NCF DSCR is calculated based on the average of the first 12 amortizing payments. |
THE INFORMATION IN THIS STRUCTURAL AND COLLATERAL TERM SHEET IS NOT COMPLETE AND MAY BE AMENDED PRIOR TO THE TIME OF SALE. THIS TERM SHEET IS NOT AN OFFER TO SELL THESE SECURITIES AND IT IS NOT A SOLICITATION OF AN OFFER TO BUY THESE SECURITIES IN ANY JURISDICTION WHERE THE OFFER OR SALE IS NOT PERMITTED.
18
COMM 2015-CCRE22 Mortgage Trust |
| OVERVIEW OF MORTGAGE POOL CHARACTERISTICS |
Pari Passu Companion Loan Summary |
| Mortgage Loan | Mortgage Loan Cut-off Date Balance | Companion Loans Cut-off Date Balance | Loan Combination Cut-off Date Balance | Pooling & Servicing Agreement | Master Servicer | Special Servicer | Voting Rights | |||||||
| 26 Broadway | $100,000,000 | $120,000,000 | $220,000,000 | COMM 2015-DC1 | KeyBank | Rialto Capital Advisors, LLC | COMM 2015-DC1 | |||||||
| 3 Columbus Circle | $85,000,000 | $265,000,000 | $350,000,000 | See (1) below | Wells Fargo | See (1) below | See (1) below | |||||||
| 100 West 57th Street | $60,000,000 | $120,000,000 | $180,000,000 | See (2) below | See (2) below | See (2) below | See (2) below | |||||||
| Patriots Park | $26,000,000 | $189,070,000 | $215,070,000 | See (3) below | See (3) below | See (3) below | See (3) below |
| (1) | Prior to the securitization of the 3 Columbus Circle pari passu companion loan designated as Note A-1, the 3 Columbus Circle Loan Combination will be serviced under the pooling and servicing agreement for this securitization and the related intercreditor agreement, and the directing holder will be the holder of the 3 Columbus Circle Note A-1 Companion Loan, which initially is expected to be held by GACC or an affiliate thereof. After the securitization of the 3 Columbus Circle Note A-1 Companion Loan, it is expected that the 3 Columbus Circle Loan Combination will be serviced under the pooling and servicing agreement entered into in connection with that securitization and the related intercreditor agreement, and it is expected that the directing holder of the 3 Columbus Circle Loan Combination will be the directing holder or its equivalent under that securitization. See “Description of the Mortgage Pool—Loan Combinations—The 3 Columbus Circle Loan Combination” in the Free Writing Prospectus. |
| (2) | Prior to the securitization of the 100 West 57th Street Note A-1 Companion Loan, the 100 West 57th Street Loan Combination will be serviced under the pooling and servicing agreement for the COMM 2015-DC1 securitization and the related intercreditor agreement, and the directing holder will be the holder of the 100 West 57th Street Note A-1 Companion Loan, which initially is expected to be held by Natixis or an affiliate thereof. After the securitization of the 100 West 57th Street pari passu companion loan designated as Note A-1, it is expected that the 100 West 57th Street Loan Combination will be serviced under the pooling and servicing agreement entered into in connection with that securitization and the related intercreditor agreement, and it is expected that the directing holder of the 100 West 57th Street Loan Combination will be the directing holder or its equivalent under that securitization. See “Description of the Mortgage Pool—Loan Combinations—The 100 West 57th Street Loan Combination” in the Free Writing Prospectus. |
| (3) | Prior to the securitization of the Patriots Park Note A-1 Companion Loan, the Patriots Park Loan Combination will be serviced under the pooling and servicing agreement for this securitization and the related intercreditor agreement, and the directing holder will be the holder of the Patriots Park Note A-1 Companion Loan, which initially is expected to be held by Natixis or an affiliate thereof. After the securitization of the Patriots Park Patriots Park Note A-1 Companion Loan, it is expected that the Patriots Park Loan Combination will be serviced under the pooling and servicing agreement entered into in connection with that securitization and the related intercreditor agreement, and it is expected that the directing holder of the Patriots Park Loan Combination will be the directing holder or its equivalent under that securitization. See “Description of the Mortgage Pool—Loan Combinations—The Patriots Park Loan Combination” in the Free Writing Prospectus. |
Existing Mezzanine Debt Summary |
| Mortgage Loan | Mortgage Loan Cut-off Date Balance | Mezzanine Debt Cut-off Date Balance | Trust U/W NCF DSCR | Total Debt U/W NCF DSCR | Trust Cut-off Date LTV Ratio | Total Debt Cut-off Date LTV Ratio | Trust U/W NOI Debt Yield | Total Debt U/W NOI Debt Yield | |||||||||
26 Broadway(1) | $100,000,000 | $50,000,000 | 1.59x | 1.11x | 59.5% | 73.0% | 7.4% | 6.0% | |||||||||
Marriott Burbank(2) | $70,000,000 | $20,000,000 | 1.98x | 1.23x | 60.3% | 77.5% | 13.0% | 10.1% | |||||||||
| Soho House NYC | $45,000,000 | $22,500,000 | 1.79x | 1.00x | 64.3% | 96.4% | 8.3% | 5.5% | |||||||||
| The Victor Waterfront Lofts | $42,750,000 | $5,000,000 | 1.37x | 1.13x | 74.6% | 83.3% | 8.5% | 7.6% |
| (1) | With respect to the 26 Broadway loan, LTV, DSCR and debt yield calculations include the related pari passu companion loans. $46,000,000 has been funded by the lender under the 26 Broadway mezzanine loan. The mezzanine loan documents provide for an additional amount of up to $4,000,000 to be advanced on or prior to June 9, 2016, provided there is no event of default under the mezzanine loan documents. |
| (2) | With respect to Marriott Burbank loan, representing approximately 5.4% of the initial outstanding pool balance as of the cut-off date, following an initial interest only period of 36 months, the mortgage loan amortizes based on a non-standard amortization. Trust U/W NCF DSCR and Total Debt U/W NCF DSCR are calculated based on the average of the first 12 amortizing payments. |
THE INFORMATION IN THIS STRUCTURAL AND COLLATERAL TERM SHEET IS NOT COMPLETE AND MAY BE AMENDED PRIOR TO THE TIME OF SALE. THIS TERM SHEET IS NOT AN OFFER TO SELL THESE SECURITIES AND IT IS NOT A SOLICITATION OF AN OFFER TO BUY THESE SECURITIES IN ANY JURISDICTION WHERE THE OFFER OR SALE IS NOT PERMITTED.
19
26 Broadway New York, NY 10004 | Collateral Asset Summary – Loan No. 1 26 Broadway | Cut-off Date Balance: Cut-off Date LTV: U/W NCF DSCR: U/W NOI Debt Yield: | $100,000,000 59.5% 1.59x 7.4% |
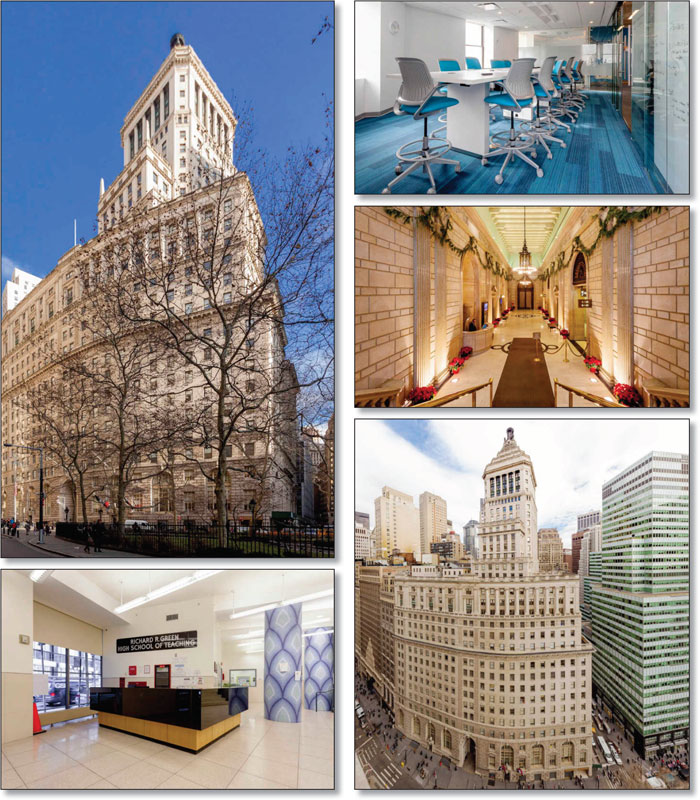
THE INFORMATION IN THIS STRUCTURAL AND COLLATERAL TERM SHEET IS NOT COMPLETE AND MAY BE AMENDED PRIOR TO THE TIME OF SALE. THIS TERM SHEET IS NOT AN OFFER TO SELL THESE SECURITIES AND IT IS NOT A SOLICITATION OF AN OFFER TO BUY THESE SECURITIES IN ANY JURISDICTION WHERE THE OFFER OR SALE IS NOT PERMITTED.
20
26 Broadway New York, NY 10004 | Collateral Asset Summary – Loan No. 1 26 Broadway | Cut-off Date Balance: Cut-off Date LTV: U/W NCF DSCR: U/W NOI Debt Yield: | $100,000,000 59.5% 1.59x 7.4% |
| Mortgage Loan Information | |
| Loan Seller: | GACC |
| Loan Purpose: | Refinance |
| Sponsor: | Jacob Chetrit |
| Borrower: | Broadway 26 Waterview LLC |
Original Balance(1): | $100,000,000 |
Cut-off Date Balance(1): | $100,000,000 |
| % by Initial UPB: | 7.7% |
| Interest Rate: | 4.384091% |
| Payment Date: | 6th of each month |
| First Payment Date: | February 6, 2015 |
| Maturity Date: | January 6, 2022 |
| Amortization: | Interest Only |
Additional Debt(1)(2): | $120,000,000 Pari Passu Debt; $50,000,000 Mezzanine Debt |
| Call Protection: | L(26), D(54), O(4) |
| Lockbox / Cash Management: | Hard / In Place |
Reserves(3) | ||
| Initial | Monthly | |
| Taxes: | $369,392 | $369,392 |
| Insurance: | $241,892 | $30,299 |
| Replacement: | $0 | $17,486 |
| TI/LC: | $6,740,000 | $34,972 |
| Required Repairs: | $1,175,000 | NAP |
| MLA: | $6,000,000 | Springing |
| Rent Holdback: | $4,550,000 | $0 |
Financial Information(4) | ||
| Mortgage Loan | Total Debt | |
| Cut-off Date Balance / Sq. Ft.: | $262 | $322 |
| Balloon Balance / Sq. Ft.: | $262 | $322 |
| Cut-off Date LTV: | 59.5% | 73.0% |
| As-Stabilized LTV: | 50.0% | 61.4% |
| Balloon LTV: | 59.5% | 73.0% |
Underwritten NOI DSCR(5): | 1.66x | 1.16x |
Underwritten NCF DSCR(5): | 1.59x | 1.11x |
| Underwritten NOI Debt Yield: | 7.4% | 6.0% |
| Underwritten NCF Debt Yield: | 7.1% | 5.8% |
| Underwritten NOI Debt Yield at Balloon: | 7.4% | 6.0% |
| Underwritten NCF Debt Yield at Balloon: | 7.1% | 5.8% |
| Property Information | ||
| Single Asset / Portfolio: | Single Asset | |
| Property Type: | CBD Office | |
Collateral(6): | Fee Simple | |
| Location: | New York, NY | |
| Year Built / Renovated: | 1923, 1925 / 1999 | |
| Total Sq. Ft.: | 839,316 | |
| Property Management: | Newmark & Company Real Estate, Inc. | |
| Underwritten NOI: | $16,185,856 | |
| Underwritten NCF: | $15,556,369 | |
| “As-Is” Appraised Value: | $370,000,000 | |
| “As-Is” Appraisal Date: | September 1, 2014 | |
| “As Stabilized” Value: | $440,000,000 | |
| “As Stabilized” Date: | September 1, 2017 | |
Historical NOI(7) | ||
| Most Recent NOI: | $10,292,134 (T-12 June 30, 2014) | |
| 2013 NOI: | $10,549,338 (December 31, 2013) | |
| 2012 NOI: | $12,926,213 (December 31, 2012) | |
| 2011 NOI: | $14,092,772 (December 31, 2011) | |
| 2010 NOI: | $10,018,906 (December 31, 2010) | |
Historical Occupancy(7) | ||
Most Recent Occupancy(8): | 79.3% (September 11, 2014) | |
| 2013 Occupancy: | 67.3% (December 31, 2013) | |
| 2012 Occupancy: | 76.9% (December 31, 2012) | |
| 2011 Occupancy: | 88.8% (December 31, 2011) | |
| 2010 Occupancy: | 90.2% (December 31, 2010) | |
| (1) | The Original Balance and Cut-off Date Balance of $100.0 million represent the non-controlling Note A-3, non-controlling Note A-5 and non-controlling Note A-6 of a $220.0 million whole loan (the “26 Broadway Loan Combination”) evidenced by six pari passu notes. The pari passu companion loan is comprised of the controlling Note A-1, non-controlling Note A-2 and non-controlling Note A-4, with an aggregate original principal amount of $120.0 million, which was securitized in the COMM 2015-DC1 transaction. |
| (2) | See “Current Mezzanine or Subordinate Indebtedness” herein. |
| (3) | See “Initial Reserves” and “Ongoing Reserves” herein. |
| (4) | DSCR, LTV, Debt Yield and Balance / Sq. Ft. calculations are based on the aggregate 26 Broadway Loan Combination. |
| (5) | Mortgage Loan Underwritten NOI DSCR and Underwritten NCF DSCR are based on the interest only debt service payment. Based on a 30-year amortization schedule, the Mortgage Loan Underwritten NOI DSCR and Underwritten NCF DSCR are 1.23x and 1.18x, respectively. |
| (6) | The 26 Broadway Property is subject to two ground leases and a sublease. The borrower holds the lessor’s and lessee’s interest under each ground lease and sublease. Collateral for the 26 Broadway Loan includes the entire fee and all of the borrower’s interests under the ground leases and the associated sublease. |
| (7) | In mid-2012, Bank of America vacated approximately 170,330 sq. ft. at the 26 Broadway Property upon the expiration of a lease executed in 2000. Approximately 77,330 sq. ft. of the space had been subleased prior to expiration and rolled into permanent tenancy. The remaining approximately 93,000 sq. ft. was recaptured by the sponsor resulting in a reduced occupancy and NOI in 2012 and 2013. Since November 2013, 11 new leases totaling 136,285 sq. ft., or 16.2% of total NRA, have been executed, resulting in the increase of Historical Occupancy from 67.3% in 2013 to 79.3% as of September 11, 2014. The increase of Most Recent NOI to Underwritten NOI and Underwritten NCF is primarily due to the expiration of free rent and rent abatements associated with the 11 newly executed leases. At closing, the lender escrowed approximately $6.7 million into a TI/LC reserve of which approximately (i) $4.0 million relates to re-leasing vacant space at the 26 Broadway Property and (ii) approximately $2.7 million relates to outstanding costs associated with newly executed lease obligations. |
| (8) | Most Recent Occupancy includes New York Film Academy (43,865 sq. ft.), Us Two Studio (18,476 sq. ft.), Cornell University (11,114 sq. ft.) and Insurance Global Operations, Inc. (7,127 sq. ft.), which have executed leases but have not taken occupancy. The lender reserved any amounts sufficient to satisfy any scheduled free or abated rent in addition to tenant improvements and leasing costs associated with these newly executed leases. |
THE INFORMATION IN THIS STRUCTURAL AND COLLATERAL TERM SHEET IS NOT COMPLETE AND MAY BE AMENDED PRIOR TO THE TIME OF SALE. THIS TERM SHEET IS NOT AN OFFER TO SELL THESE SECURITIES AND IT IS NOT A SOLICITATION OF AN OFFER TO BUY THESE SECURITIES IN ANY JURISDICTION WHERE THE OFFER OR SALE IS NOT PERMITTED.
21
26 Broadway New York, NY 10004 | Collateral Asset Summary – Loan No. 1 26 Broadway | Cut-off Date Balance: Cut-off Date LTV: U/W NCF DSCR: U/W NOI Debt Yield: | $100,000,000 59.5% 1.59x 7.4% |
| Tenant Summary | |||||||||||||
Tenant | Ratings (Fitch/Moody’s/S&P)(1) | Net Rentable Area (Sq. Ft.) | % of Net Rentable Area | U/W Base Rent PSF | % of Total U/W Base Rent | Lease Expiration | |||||||
| Office Tenants | |||||||||||||
| NYC Department of Education | AA/Aa2/AA | 288,090 | 34.3% | $41.36 | 46.5% | Various(2) | |||||||
Juvenile Diabetes Research Foundation(3) | NR/NR/NR | 84,582 | 10.1% | $32.00 | 10.6% | 12/31/2019 | |||||||
| State of New York Court of Claims | AA+/Aa1/AA+ | 48,687 | 5.8% | $39.80 | 7.6% | 9/30/2021 | |||||||
New York Film Academy(4) | NR/NR/NR | 43,865 | 5.2% | $34.85 | 6.0% | 1/14/2030 | |||||||
| Total Major Office Tenants | 465,224 | 55.4% | $38.88 | 70.6% | |||||||||
| Remaining Office Tenants | 192,881 | 23.0% | $35.83 | 27.0% | |||||||||
Total Occupied Office Tenants(5) | 658,105 | 78.4% | $37.99 | 97.5% | |||||||||
| Vacant Office | 136,036 | 16.2% | |||||||||||
| Total Office | 794,141 | 94.6% | |||||||||||
| Other Tenants | |||||||||||||
| Total Occupied Storage and Retail Tenants | 7,157 | 0.9% | $89.38 | 2.5% | |||||||||
| Vacant Retail | 12,724 | 1.5% | |||||||||||
| Vacant Storage | 25,294 | 3.0% | |||||||||||
| Total | 839,316 | 100.0% | |||||||||||
| (1) | Certain ratings are those of the parent company whether or not the parent company guarantees the lease. |
| (2) | NYC Department of Education executed two leases (2008 and 2010) totaling 288,090 sq. ft. that are currently utilized for the operation of three different NYC public schools. 181,659 sq. ft. expire January 26, 2039, approximately 17 years beyond the 26 Broadway Loan term, and 106,431 sq. ft. expire March 14, 2041, approximately 19 years beyond the 26 Broadway Loan term. NYC Department of Education has the right to terminate 181,659 sq. ft. at any time on or after January 26, 2029 (approximately seven years beyond the expiration of the 26 Broadway Loan term) with 15 months prior notice and the remaining 106,431 sq. ft. of its space at any time on or after March 14, 2031 (approximately nine years beyond the 26 Broadway Loan term) with 12 months prior notice. |
| (3) | Juvenile Diabetes Research Foundation is entitled to a rent credit in the amount of $444,026, a portion of which was applied as a rent credit in January 2015 and the rest will be applied in January 2016. The full rent credit amount was escrowed at origination. |
| (4) | New York Film Academy’s lease commenced January 15, 2015 but the tenant has not yet taken occupancy of its space and is expected to take possession in mid-2015. The lender reserved any free or abated rent in addition to tenant improvements and leasing costs associated with the New York Film Academy lease. |
| (5) | Total Occupied Office Tenants includes Us Two Studio (18,476 sq. ft.), Cornell University (11,114 sq. ft.) and Insurance Global Operations, Inc. (7,127 sq. ft.), which have executed leases but have not taken occupancy. The lender reserved any amounts sufficient to satisfy any scheduled free or abated rent in addition to tenant improvements and leasing costs associated with these newly executed leases. |
THE INFORMATION IN THIS STRUCTURAL AND COLLATERAL TERM SHEET IS NOT COMPLETE AND MAY BE AMENDED PRIOR TO THE TIME OF SALE. THIS TERM SHEET IS NOT AN OFFER TO SELL THESE SECURITIES AND IT IS NOT A SOLICITATION OF AN OFFER TO BUY THESE SECURITIES IN ANY JURISDICTION WHERE THE OFFER OR SALE IS NOT PERMITTED.
22
26 Broadway New York, NY 10004 | Collateral Asset Summary – Loan No. 1 26 Broadway | Cut-off Date Balance: Cut-off Date LTV: U/W NCF DSCR: U/W NOI Debt Yield: | $100,000,000 59.5% 1.59x 7.4% |
Lease Rollover Schedule(1) | ||||||||||||||||
| Year | # of Leases Expiring | Total Expiring Sq. Ft. | % of Total Sq. Ft. Expiring | Cumulative Sq. Ft. Expiring | Cumulative % of Sq. Ft. Expiring | Annual U/W Base Rent PSF | % U/W Base Rent Rolling | Cumulative % of U/W Base Rent | ||||||||
| MTM | 16 | 11,262 | 1.3% | 11,262 | 1.3% | $34.92 | 1.5% | 1.5% | ||||||||
2015(2) | 5 | 53,136 | 6.3% | 64,398 | 7.7% | $34.27 | 7.1% | 8.6% | ||||||||
| 2016 | 6 | 14,085 | 1.7% | 78,483 | 9.4% | $38.19 | 2.1% | 10.7% | ||||||||
| 2017 | 4 | 17,968 | 2.1% | 96,451 | 11.5% | $50.35 | 3.5% | 14.3% | ||||||||
| 2018 | 1 | 18,000 | 2.1% | 114,451 | 13.6% | $35.45 | 2.5% | 16.8% | ||||||||
| 2019 | 3 | 86,582 | 10.3% | 201,033 | 24.0% | $32.20 | 10.9% | 27.6% | ||||||||
| 2020 | 1 | 201 | 0.0% | 201,234 | 24.0% | $102.80 | 0.1% | 27.7% | ||||||||
| 2021 | 2 | 48,687 | 5.8% | 249,921 | 29.8% | $39.80 | 7.6% | 35.3% | ||||||||
2022(3) | 3 | 32,973 | 3.9% | 282,894 | 33.7% | $38.27 | 4.9% | 40.2% | ||||||||
| 2023 | 1 | 1,346 | 0.2% | 284,240 | 33.9% | $48.09 | 0.3% | 40.4% | ||||||||
| 2024 | 2 | 19,935 | 2.4% | 304,175 | 36.2% | $36.47 | 2.8% | 43.3% | ||||||||
| 2025 | 4 | 28,746 | 3.4% | 332,921 | 39.7% | $38.25 | 4.3% | 47.6% | ||||||||
| Thereafter | 4 | 331,955 | 39.6% | 664,876 | 79.2% | $40.50 | 52.4% | 100.0% | ||||||||
| Storage | 2 | 386 | 0.0% | 665,262 | 79.3% | $0.00 | 0.0% | 100.0% | ||||||||
| Vacant | NAP | 174,054 | 20.7% | 839,316 | 100.0% | NAP | NAP | |||||||||
| Total / Wtd. Avg. | 54 | 839,316 | 100.0% | $38.54 | 100.0% | |||||||||||
| (1) | Certain tenants have lease termination options that may become exercisable prior to the originally stated expiration date of the tenant lease that are not considered in the lease rollover schedule. |
| (2) | The Modern Language Association (“MLA”) leases 37,500 sq. ft. expiring in 2015 or 70.6% of the year 2015 total expiring sq. ft. The lender has reserved $6.0 million in connection with the expiration of the MLA lease. See “Initial Reserves” herein. |
| (3) | The 26 Broadway Loan matures January 6, 2022. |
The Loan. The 26 Broadway loan (the “26 Broadway Loan”) is a fixed rate loan secured by the borrower’s overlapping fee simple and leasehold interest in one office building totaling 839,316 sq. ft., located at 26 Broadway in New York City on the corner of Broadway and Beaver Street (the “26 Broadway Property”) with an original principal balance of $100.0 million. The 26 Broadway Loan is comprised of the non-controlling Note A-3, non-controlling Note A-5 and non-controlling Note A-6 of a $220.0 million whole loan that is evidenced by six pari passu notes (collectively, the “26 Broadway Loan Combination”). Only the $40.0 million non-controlling Note A-3, $30.0 million non-controlling Note A-5 and $30.0 million non-controlling Note A-6 will be included in the COMM 2015-CCRE22 trust. The controlling Note A-1, non-controlling Note A-2 and non-controlling Note A-4, with original principal balances of $50.0 million, $40.0 million and $30.0 million, respectively, were included in the COMM 2015-DC1 transaction. The 26 Broadway Loan has a seven-year term and interest only payments for the term of the loan. The 26 Broadway Loan accrues interest at a fixed rate equal to 4.384091% and has a cut-off date balance of $100.0 million. Loan proceeds were used to retire existing debt of approximately $184.2 million, cover closing costs, fund reserves and return approximately $58.5 million of equity to the borrower. Based on the appraised value of $370.0 million as of September 1, 2014, the cut-off date LTV is 59.5%. The most recent prior financing of the 26 Broadway Property was not included in a securitization.
The relationship between the holders of the Note A-1, Note A-2, Note A-3, Note A-4, Note A-5 and Note A-6 will be governed by a co-lender agreement as described under “Description of the Mortgage Pool—Loan Combinations—26 Broadway Loan Combination” in the accompanying Free Writing Prospectus.
| Pari Passu Note Summary | ||||||||
| Original Balance | Cut-off Date Balance | Note Holder | Controlling Piece | |||||
| Note A-3, A-5, A-6 | $100,000,000 | $100,000,000 | COMM 2015-CCRE22 | No | ||||
| Note A-1, A-2, A-4 | $120,000,000 | $120,000,000 | COMM 2015-DC1 | Yes | ||||
| Total | $220,000,000 | $220,000,000 | ||||||
THE INFORMATION IN THIS STRUCTURAL AND COLLATERAL TERM SHEET IS NOT COMPLETE AND MAY BE AMENDED PRIOR TO THE TIME OF SALE. THIS TERM SHEET IS NOT AN OFFER TO SELL THESE SECURITIES AND IT IS NOT A SOLICITATION OF AN OFFER TO BUY THESE SECURITIES IN ANY JURISDICTION WHERE THE OFFER OR SALE IS NOT PERMITTED.
23
26 Broadway New York, NY 10004 | Collateral Asset Summary – Loan No. 1 26 Broadway | Cut-off Date Balance: Cut-off Date LTV: U/W NCF DSCR: U/W NOI Debt Yield: | $100,000,000 59.5% 1.59x 7.4% |
| Sources and Uses | ||||||
| Sources | Proceeds | % of Total | Uses | Proceeds | % of Total | |
| Mortgage Loan Amount | $220,000,000 | 81.5% | Loan Payoff | $184,204,647 | 68.2% | |
Mezzanine Loan Amount(1) | $50,000,000 | 18.5% | Reserves | $19,076,284 | 7.1% | |
| Closing Costs | $8,258,737 | 3.1% | ||||
| Return of Equity | $58,460,333 | 21.7% | ||||
| Total Sources | $270,000,000 | 100.0% | Total Uses | $270,000,000 | 100.0% | |
| (1) | In conjunction with the origination of the 26 Broadway Loan, a third party mezzanine lender funded $46.0 million of a $50.0 million mezzanine loan to an affiliate of the borrower. On or prior to June 9, 2016, additional mezzanine loan advances (of up to $4.0 million) will be funded into a 26 Broadway Loan reserve upon request by the borrower to be disbursed in conjunction with the completion of ADA and/or fire protection repairs. On June 9, 2016, the remaining unfunded portion of the $4.0 million mezzanine loan advance will be forced funded into such reserve. |
The Borrower / Sponsor. The borrower, Broadway 26 Waterview LLC, is a single purpose Delaware limited liability company structured to be bankruptcy-remote with two independent directors in its organizational structure. The sponsor of the borrower and the non-recourse carveout guarantor is Jacob Chetrit.
Jacob Chetrit owns 14.6 million sq. ft. of commercial real estate and co-leads a privately held commercial real estate firm with Joseph Chetrit called The Chetrit Organization (“Chetrit”). Chetrit owns and operates a portfolio of over 10.0 million sq. ft. comprised of interests in all asset types including 550 Madison Avenue, also known as the Sony Building.
The Property. The 26 Broadway Property is a 29-story Class B+, multi-tenant, landmark office building that was constructed in 1923 and 1925 and most recently renovated in 1999. Construction of the 26 Broadway Property was completed in 1928, which served as the headquarters for John D. Rockefeller’s Standard Oil Company until 1956. The main entrance on Broadway faces Bowling Green Park and the Charging Bull sculpture by Arturo Di Modica, a popular tourist destination. The 26 Broadway Property totals 839,316 sq. ft. and is comprised of 794,141 sq. ft. of office space, 26,316 sq. ft. of storage space and 18,859 sq. ft. of retail space. As of September 11, 2014, the 26 Broadway Property was 79.3% occupied and the office space (97.5% of U/W Base Rent) was approximately 82.9% occupied. Office floor plates at the 26 Broadway Property range from 4,290 sq. ft. to 51,127 sq. ft. and offer views of the Statue of Liberty and Hudson River.
The 26 Broadway Property spans the entire end-block of the southwest intersection of Broadway and Beaver Street and extends north to Morris Street and east to New Street. The 26 Broadway Property has approximately 277.9 ft. of frontage along Broadway, 203.5 ft. of frontage along New Street and 159.1 ft. of frontage along Beaver Street. Additionally, the 26 Broadway Property is located adjacent to the Wall Street and Bowling Green subway stations along Broadway that service the 4 and 5 trains, the Rector Street station that services the N and R trains as well as the Broad Street station that services the J and Z trains.
The three largest tenants at the 26 Broadway Property occupy a total of 50.2% of the total net rentable area (“NRA”) and account for 64.6% of underwritten base revenue. The largest tenant, NYC Department of Education, occupies 288,090 sq. ft., or 34.3% of total NRA, and accounts for 46.5% of underwritten base rent. The second largest tenant, Juvenile Diabetes Research Foundation, occupies 84,582 sq. ft. or 10.1% of total NRA, and accounts for 10.6% of underwritten base rent. The third largest tenant, State of New York Court of Claims, occupies 48,687 sq. ft., or 5.8% of total NRA, and accounts for 7.6% of underwritten base rent. No other tenant at the 26 Broadway Property occupies more than 5.2% of total NRA or accounts for more than 6.0% of underwritten base rent. Approximately 41.4% of the total NRA is occupied by three tenants rated at least Aa2 by Moody’s and AA by S&P (“Investment Grade Tenants”), including NYC Department of Education, State of New York Court of Claims and Cornell University. Investment Grade Tenants have a weighted average remaining lease term of 21.9 years and total tenants excluding month to month tenants have a remaining lease term of approximately 14.5 years.
In mid-2012, Bank of America vacated approximately 170,330 sq. ft. at the 26 Broadway Property upon the expiration of a lease executed in 2000. Approximately 77,330 sq. ft. of the space had been subleased prior to expiration and rolled into permanent tenancy. The remaining approximately 93,000 sq. ft. was recaptured by the sponsor resulting in a reduced occupancy and NOI in 2012 and 2013. Since November 2013, 11 new leases totaling 136,285 sq. ft., or 16.2% of total NRA, have been executed, resulting in the increase of historical occupancy from 67.3% in 2013 to 79.3% as of September 11, 2014.
Environmental Matters. The Phase I environmental report dated December 9, 2014 recommended the continued implementation of an asbestos operation and maintenance plan at the 26 Broadway Property, which is currently in place, and the replacement of a leaking water tank.
THE INFORMATION IN THIS STRUCTURAL AND COLLATERAL TERM SHEET IS NOT COMPLETE AND MAY BE AMENDED PRIOR TO THE TIME OF SALE. THIS TERM SHEET IS NOT AN OFFER TO SELL THESE SECURITIES AND IT IS NOT A SOLICITATION OF AN OFFER TO BUY THESE SECURITIES IN ANY JURISDICTION WHERE THE OFFER OR SALE IS NOT PERMITTED.
24
26 Broadway New York, NY 10004 | Collateral Asset Summary – Loan No. 1 26 Broadway | Cut-off Date Balance: Cut-off Date LTV: U/W NCF DSCR: U/W NOI Debt Yield: | $100,000,000 59.5% 1.59x 7.4% |
Major Tenants.
NYC Department of Education (288,090 sq. ft.; 34.3% of NRA; 46.5% of U/W Base Rent; AA/Aa2/AA by Fitch/Moody’s/S&P) The NYC Department of Education (“NYC DOE”) is the largest school district in the United States, serving 1.1 million students across more than 1,200 schools. The 26 Broadway Property represents the NYC DOE’s Broadway Educational Campus of New York City and houses three separately operated public schools across six floors with an aggregate enrollment of over 1,200 students. The three schools benefit from separate entrances on Beaver and New Street, which are accessible via the Broadway office lobby, as well as an approximately $35.0 million interior renovation funded by NYC DOE. NYC DOE initially leased 181,659 sq. ft. at the 26 Broadway Property beginning in 2008 and later expanded an additional 106,431 sq. ft. in 2010. NYC DOE executed two leases (2008 and 2010) totaling 288,090 sq. ft. 181,659 sq. ft. expires January 26, 2039, approximately 17 years beyond the 26 Broadway Loan term, and 106,431 sq. ft. expires March 14, 2041, approximately 19 years beyond the 26 Broadway Loan term. NYC DOE has been a tenant at the 26 Broadway Property since 2008.
Juvenile Diabetes Research Foundation (84,582 sq. ft.; 10.1% of NRA; 10.6% of U/W Base Rent) (“JDRF”) JDRF is an organization dedicated to research and advocacy to end type 1 diabetes. JDRF is the largest charitable supporter of type 1 diabetes research and is currently sponsoring $568 million in scientific research in 17 countries. JDRF is funding more than 50 human clinical trials, several of which are in the advanced stages of clinical testing needed before FDA approvals can be sought. The organization currently operates 100 chapters, branches and affiliates around the world, with more than $100 million in researching funding annually. JDRF has occupied the 14th and 15th floor of the 26 Broadway Property as its headquarters since 2009. JDRF’s lease expires December 31, 2019 with one five-year renewal option.
State of New York Court of Claims (48,687 sq. ft.; 5.8% of NRA; 7.6% of U/W Base Rent; AA+/Aa1/AA+ by Fitch/Moody’s/S&P) The New York State Court of Claims (“NYS COC”) is the exclusive forum for civil litigation seeking damages against the State of New York or certain other State-related entities. NYS COC has been a tenant at the 26 Broadway Property since 2009 and its lease expires in 2021.
New York Film Academy (43,865 sq. ft.; 5.2% of NRA; 6.0% of U/W Base Rent) Founded in 1992, the New York Film Academy (“NYFA”) is a film and acting school that has grown to become one of the largest independent arts academies offering hands-on, intensive degree programs around the world. The NYFA has courses in 26 cities worldwide, including two other locations in New York City, with the 26 Broadway Property representing its most recent location. NYFA leases the entire 12th floor, which is expiring in 2030 (approximately eight years beyond the 26 Broadway Loan term).
The Market. The 26 Broadway Property is located in New York’s Downtown office market within the Financial East office submarket. As of the Q2 2014, Downtown Class A office inventory was comprised of approximately 50.3 million sq. ft. of office space with a vacancy rate of 11.0% and Downtown Class B office inventory was comprised of 26.8 million sq. ft. of office space with a vacancy rate of 6.7%. Specifically, Class A office inventory within the Financial East submarket was comprised of approximately 23.4 million sq. ft. of office space with a vacancy rate of 7.9% and Class B office inventory within the Financial East submarket was comprised of 10.9 million sq. ft. of office space with a vacancy rate of 7.2%. As of Q2 2014, Class A and Class B Financial East office submarket rental rates were $45.11 PSF and $38.37 PSF. The appraiser analyzed a set of eight comparable properties within the immediate competitive area of the 26 Broadway Property and concluded an office market rental range of $32.00 to $44.00. Underwritten weighted average office rents at the 26 Broadway Property are currently $37.99 PSF, slightly below the appraisal’s concluded office market rent for the 26 Broadway Property of $40.68 PSF. The chart below summarizes the comparable set as determined by the appraisal.
Comparable Set(1) | ||||||||||
| Building | Office Area | Available | % Occupied | Asking Rent Low | Asking Rent High | |||||
26 Broadway Property(2) | 794,141 | 136,036 | 82.9% | NAP | NAP | |||||
| 29 Broadway | 265,000 | 0 | 100.0% | NAP | NAP | |||||
| 39 Broadway | 401,370 | 38,396 | 90.4% | $35.00 | $39.00 | |||||
| 45 Broadway Atrium | 368,315 | 40,525 | 89.0% | $36.00 | $44.00 | |||||
| One Exchange Plaza | 295,000 | 15,545 | 94.7% | $40.00 | $43.00 | |||||
| 50 Broadway | 270,000 | 27,216 | 89.9% | $32.00 | $38.00 | |||||
| 52 Broadway | 388,000 | 0 | 100.0% | NAP | NAP | |||||
| 65 Broadway | 300,000 | 43,523 | 85.5% | $35.00 | $35.00 | |||||
| 111 Broadway | 427,598 | 27,118 | 93.7% | $40.00 | $40.00 | |||||
Total / Wtd. Avg.(3): | 2,715,283 | 192,323 | 92.9% | $32.00 | $44.00 | |||||
| (1) | Source: Appraisal. |
| (2) | Based on rent roll dated September 11, 2014. |
| (3) | Total / Wtd. Avg. excludes the 26 Broadway Property. |
THE INFORMATION IN THIS STRUCTURAL AND COLLATERAL TERM SHEET IS NOT COMPLETE AND MAY BE AMENDED PRIOR TO THE TIME OF SALE. THIS TERM SHEET IS NOT AN OFFER TO SELL THESE SECURITIES AND IT IS NOT A SOLICITATION OF AN OFFER TO BUY THESE SECURITIES IN ANY JURISDICTION WHERE THE OFFER OR SALE IS NOT PERMITTED.
25
26 Broadway New York, NY 10004 | Collateral Asset Summary – Loan No. 1 26 Broadway | Cut-off Date Balance: Cut-off Date LTV: U/W NCF DSCR: U/W NOI Debt Yield: | $100,000,000 59.5% 1.59x 7.4% |
Cash Flow Analysis.
Cash Flow Analysis(1) | ||||||||||||||
| 2011 | 2012 | 2013 | T-12 6/30/2014 | U/W | U/W PSF | Stabilized(5) | ||||||||
Base Rent(2) | $20,676,580 | $20,138,005 | $18,672,140 | $18,756,189 | $25,638,777 | $30.55 | $32,812,395 | |||||||
| Value of Vacant Space | 0 | 0 | 0 | 0 | 6,889,332 | 8.21 | 0 | |||||||
| Gross Potential Rent | $20,676,580 | $20,138,005 | $18,672,140 | $18,756,189 | $32,528,109 | $38.76 | $32,812,395 | |||||||
Total Recoveries(3) | 2,709,170 | 1,719,664 | 1,330,781 | 1,407,736 | 2,193,617 | 2.61 | 2,259,426 | |||||||
| Total % Rents | 0 | 0 | 0 | 0 | 0 | 0.00 | 0 | |||||||
| Total Other Income | 165,983 | 193,465 | 166,830 | 136,912 | 136,200 | 0.16 | 140,286 | |||||||
Less: Vacancy(4) | 0 | 0 | 0 | 0 | (6,889,332) | (8.21) | (2,451,873) | |||||||
| Effective Gross Income | $23,551,734 | $22,051,134 | $20,169,751 | $20,300,837 | $27,968,594 | $33.32 | $32,760,234 | |||||||
Total Operating Expenses(3) | 9,458,962 | 9,124,921 | 9,620,414 | 10,008,703 | 11,782,738 | 14.04 | 12,254,797 | |||||||
| Net Operating Income | $14,092,772 | $12,926,213 | $10,549,338 | $10,292,134 | $16,185,856 | $19.28 | $20,505,437 | |||||||
| TI/LC | 0 | 0 | 0 | 0 | 419,658 | 0.50 | 1,258,974 | |||||||
| Capital Expenditures | 0 | 0 | 0 | 0 | 209,829 | 0.25 | 209,829 | |||||||
| Net Cash Flow | $14,092,772 | $12,926,213 | $10,549,338 | $10,292,134 | $15,556,369 | $18.53 | $19,036,634 | |||||||
| (1) | In mid-2012, Bank of America vacated approximately 170,330 sq. ft. at the 26 Broadway Property upon the expiration of a lease executed in 2000. Approximately 77,330 sq. ft. of the space had been subleased prior to expiration and rolled into permanent tenancy. The remaining approximately 93,000 sq. ft. was recaptured by the sponsor resulting in a reduced occupancy and Net Operating Income in 2012 and 2013. Since November 2013, 11 new leases totaling 136,285 sq. ft., or 16.2% of total NRA, have been executed, resulting in the increase of historical occupancy from 67.3% in 2013 to 79.3% as of September 11, 2014. The increase of most recent Net Operating Income to U/W Net Operating Income and U/W Net Cash Flow is primarily due to the expiration of free rent and rent abatements associated with the 11 newly executed leases. At closing, the lender escrowed approximately $6.7 million to re-lease vacant space at the 26 Broadway Property and approximately $4.6 million for outstanding costs associated with newly executed lease obligations. |
| (2) | U/W Base Rent includes $1,928,023 of (i) contractual rent increases through December 2015 and (ii) the net present value of contractual rent increases through the earlier of lease expiration or effective termination date for Investment Grade Tenants. |
| (3) | The increase in total recoveries and total operating expenses from 2013 to U/W is primarily due to the recent leasing activity noted in Footnote (1) above. |
| (4) | U/W vacancy is based on the in-place physical vacancy of 20.7%. As of Q2 2014, the Class B office Financial East submarket direct vacancy rate was 7.2%. |
| (5) | Stabilized Net Cash Flow includes (i) contractual rent steps through December 2016 and the net present value of contractual rent increases through the earlier of lease expiration or effective termination date for Investment Grade Tenants, (ii) a stabilized market vacancy of 7.0%, in line with the second quarter 2014 Financial East office submarket vacancy of 7.9%, and (iii) year end 2015 expenses grown by 3.0% compounded over two years. |
Property Management. The 26 Broadway Property is managed by Newmark & Company Real Estate, Inc. Newmark & Company Real Estate, Inc. is owned by Newmark Grubb Knight Frank, which provides property and facilities management for 500 million sq. ft. in the U.S., Europe, Asia-Pacific, the Middle East and Africa.
Lockbox / Cash Management. The 26 Broadway Loan is structured with a hard lockbox and in place cash management. At closing, the borrower was required to instruct all tenants to deposit all rents and other payments into the lockbox account controlled by the lender for the term of the 26 Broadway Loan. All funds in the lockbox account are swept daily to a lender controlled cash management account and disbursed in accordance with the 26 Broadway Loan documents. All excess cash flow will be deposited into a lender controlled cash collateral account until the occurrence of a Cash Trap Exit (as defined below) and will re-commence upon any Cash Trap Period (as defined below). Additionally, all excess cash flow will be deposited into the rollover reserve account upon the commencement of a Major Lease Sweep Period (as defined below).
A “Cash Trap Period” will occur upon (i) an event of default or mezzanine event of default, (ii) any bankruptcy action of borrower, mezzanine borrower, guarantor or affiliated manager or (iii) the failure of the borrower after the end of two consecutive calendar quarters to maintain an aggregate 26 Broadway Loan and mezzanine loan debt service coverage ratio of at least 1.10x.
A “Cash Trap Exit” will occur upon (i) the lender or mezzanine lender accepts a cure of the event of default that caused the Cash Trap Period, (ii) with respect to a Cash Trap Period arising from property manager bankruptcy action, the borrower replacing the property manager with a qualified manager under a replacement management agreement or (iii) the borrower maintains after the end of two consecutive calendar quarters an aggregate 26 Broadway Loan and mezzanine loan debt service coverage ratio of at least 1.20x.
A “Major Lease Sweep Period” will occur upon (i) the failure by the borrower to maintain the Minimum Occupancy Threshold (as defined below) and (ii) the borrower or lender receives notice that a tenant under any Major Lease (as defined below) (a) has vacated or given notice of its intention to vacate, (b) has failed to pay rent or is in default of any monetary obligation for a period of 60 days or more, (c) is the subject of a bankruptcy action or (d) at least 12 months prior to the then stated expiration date of its lease, has not given notice of its intent to extend the lease term. Any excess cash flow sweep associated with a Major Lease Sweep Period will be capped at $50.00 multiplied by the total rentable sq. ft. of each affected Major Lease excluding a Major Lease Sweep Period caused by the NYC DOE lease, in which case there is no cap.
THE INFORMATION IN THIS STRUCTURAL AND COLLATERAL TERM SHEET IS NOT COMPLETE AND MAY BE AMENDED PRIOR TO THE TIME OF SALE. THIS TERM SHEET IS NOT AN OFFER TO SELL THESE SECURITIES AND IT IS NOT A SOLICITATION OF AN OFFER TO BUY THESE SECURITIES IN ANY JURISDICTION WHERE THE OFFER OR SALE IS NOT PERMITTED.
26
26 Broadway New York, NY 10004 | Collateral Asset Summary – Loan No. 1 26 Broadway | Cut-off Date Balance: Cut-off Date LTV: U/W NCF DSCR: U/W NOI Debt Yield: | $100,000,000 59.5% 1.59x 7.4% |
The “Minimum Occupancy Threshold” will be met provided (i) no event of default is then continuing, (ii) tenants have entered into leases, and are not in default with respect to such leases, totaling no less than 713,419 sq. ft. of net rentable area (85.0%) and (iii) the net cash flow debt yield of the aggregate 26 Broadway Loan and mezzanine loan is greater than or equal to 6.5%.
A “Major Lease” is any lease other than the ground lease which, individually or when taken together with any other lease with the same tenant or its affiliates, (a) demises an amount greater than or equal to 37,500 sq. ft. (4.5% of NRA) or (b) represents greater than or equal to 5.0% of gross income from operations.
Initial Reserves. At closing, the borrower deposited (i) $369,392 into a tax reserve account, (ii) $241,892 into an insurance reserve account, (iii) $6,740,000 into a TI/LC reserve account comprised of (a) $4,000,000 for expenses associated with future leasing activity and (b) $2,740,000 for outstanding leasing expenses associated with recently executed leases, (iv) $6,000,000 into a MLA reserve account comprised of (a) $4,125,000 (to be released in monthly amounts not to exceed $137,000) for monthly shortfalls for debt service, required deposits into reserve accounts, operating expenses or mezzanine debt service occurring after the expiration of the MLA lease in July 2015 (unless such lease is renewed or replaced) and (b) $1,875,000 for the payment of approved leasing expenses associated with the re-leasing of the premises under the MLA lease, (v) $4,550,000 into a free rent reserve account comprised of (a) $3,300,000 for rent credits and abatements and free rent associated with recently executed leases and (b) $1,250,000 to be released in any month where a shortfall exists for payment of debt service, required deposits into reserve accounts, operating expenses and mezzanine debt service, (vi) $1,100,000 into a special capital expenditures reserve account for work required to comply with ADA and fire code regulations and (vii) $75,000 into a required repairs account, which represents approximately 110% of the engineer’s estimated cost of the immediate repairs.
Ongoing Reserves. On a monthly basis, the borrower is required to deposit reserves of (i) 1/12 of the estimated annual real estate taxes, which currently equates to $369,392, into a tax reserve account, (ii) 1/12 of the annual insurance premiums, which currently equates to $30,299, into an insurance reserve account, (iii) (a) $34,972 ($0.50 PSF annually) into a TI/LC reserve account if the amount on deposit in the TI/LC reserve account is greater than $2,000,000 and (b) $69,943 ($1.00 PSF annually) into a TI/LC reserve account if the amount on deposit in the TI/LC reserve account is less than or equal to $2,000,000 (the “TI/LC Reserve Deposit”), and (iv) $17,486 ($0.25 PSF annually) into a capital expenditure account, subject to a cap of $750,000. Notwithstanding the foregoing, the borrower will not be required to deposit the TI/LC Reserve Deposit during any period in which (i) the Minimum Occupancy Threshold is met and (ii) amounts then on deposit in the TI/LC reserve account equals or exceeds $4,000,000, subject to additional provisions detailed in the 26 Broadway Loan documents. At any time prior to (i) the release of funds on deposit in the MLA reserve or (ii) the renewal of the MLA lease or re-leasing of the space under the MLA lease, the borrower will be required to deposit such amounts necessary to cover any monthly interest payment shortfalls then anticipated for the remainder of the 26 Broadway Loan.
Current Mezzanine or Subordinate Indebtedness. Concurrent with the origination of the 26 Broadway Loan, Paramount Group Fund VIII 26 Broadway Mezz LP (the “Mezzanine Lender”) funded $46.0 million of a $50.0 million mezzanine loan that is co-terminus with the 26 Broadway Loan. On or prior to June 9, 2016, the Mezzanine Lender is required to fund an additional mezzanine loan advance of up to $4.0 million into a 26 Broadway Loan reserve (the “Special Capital Expenditures Reserve”) upon request by borrower to be disbursed in conjunction with the completion of ADA and/or fire protection repairs. No later than June 9, 2016, the remaining portion of the unfunded $4.0 million mezzanine loan advance will be forced funded into the Special Capital Expenditures Reserve. The 26 Broadway mezzanine loan accrues interest at a rate of 8.2500% per annum. The 26 Broadway mezzanine loan has a seven-year term (coterminous with the 26 Broadway Loan) and is interest only for the duration of the term.
Paramount Group, Inc. (NYSE: PGRE) is a vertically-integrated real estate company that owns, manages, acquires and re-develops high quality, Class A office properties located in premier submarkets within Midtown Manhattan, Washington, D.C. and San Francisco.
Future Mezzanine or Subordinate Indebtedness Permitted. None.
THE INFORMATION IN THIS STRUCTURAL AND COLLATERAL TERM SHEET IS NOT COMPLETE AND MAY BE AMENDED PRIOR TO THE TIME OF SALE. THIS TERM SHEET IS NOT AN OFFER TO SELL THESE SECURITIES AND IT IS NOT A SOLICITATION OF AN OFFER TO BUY THESE SECURITIES IN ANY JURISDICTION WHERE THE OFFER OR SALE IS NOT PERMITTED.
27
26 Broadway New York, NY 10004 | Collateral Asset Summary – Loan No. 1 26 Broadway | Cut-off Date Balance: Cut-off Date LTV: U/W NCF DSCR: U/W NOI Debt Yield: | $100,000,000 59.5% 1.59x 7.4% |
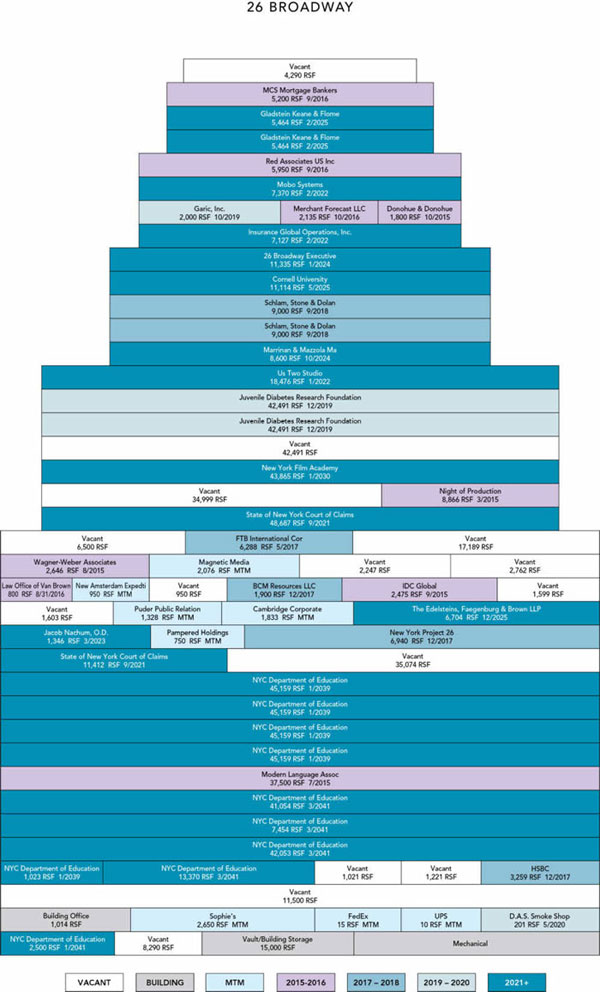
THE INFORMATION IN THIS STRUCTURAL AND COLLATERAL TERM SHEET IS NOT COMPLETE AND MAY BE AMENDED PRIOR TO THE TIME OF SALE. THIS TERM SHEET IS NOT AN OFFER TO SELL THESE SECURITIES AND IT IS NOT A SOLICITATION OF AN OFFER TO BUY THESE SECURITIES IN ANY JURISDICTION WHERE THE OFFER OR SALE IS NOT PERMITTED.
28
26 Broadway New York, NY 10004 | Collateral Asset Summary – Loan No. 1 26 Broadway | Cut-off Date Balance: Cut-off Date LTV: U/W NCF DSCR: U/W NOI Debt Yield: | $100,000,000 59.5% 1.59x 7.4% |

THE INFORMATION IN THIS STRUCTURAL AND COLLATERAL TERM SHEET IS NOT COMPLETE AND MAY BE AMENDED PRIOR TO THE TIME OF SALE. THIS TERM SHEET IS NOT AN OFFER TO SELL THESE SECURITIES AND IT IS NOT A SOLICITATION OF AN OFFER TO BUY THESE SECURITIES IN ANY JURISDICTION WHERE THE OFFER OR SALE IS NOT PERMITTED.
29
| Various | Collateral Asset Summary – Loan Nos. 2-7 Wells Fargo Crossed Portfolio | Cut-off Date Balance: Cut-off Date LTV: U/W NCF DSCR: U/W NOI Debt Yield: | $94,849,743 62.7% 1.50x 10.8% |

THE INFORMATION IN THIS STRUCTURAL AND COLLATERAL TERM SHEET IS NOT COMPLETE AND MAY BE AMENDED PRIOR TO THE TIME OF SALE. THIS TERM SHEET IS NOT AN OFFER TO SELL THESE SECURITIES AND IT IS NOT A SOLICITATION OF AN OFFER TO BUY THESE SECURITIES IN ANY JURISDICTION WHERE THE OFFER OR SALE IS NOT PERMITTED.
30
| Various | Collateral Asset Summary – Loan Nos. 2-7 Wells Fargo Crossed Portfolio | Cut-off Date Balance: Cut-off Date LTV: U/W NCF DSCR: U/W NOI Debt Yield: | $94,849,743 62.7% 1.50x 10.8% |
| Mortgage Loan Information | |
| Loan Seller: | GACC |
| Loan Purpose: | Acquisition |
| Sponsor: | EK 2013 Family Trust; Michael Klein |
| Borrower: | Mikeone EK Roanoke, LLC; Mikeone EK ATL OPS Center, LLC; Mikeone EK 809 West, LLC; Mikeone EK Columbia SC, LLC; Mikeone EK Linden, LLC; Mikeone EK 801 West, LLC |
Original Balance(1): | $95,000,000 |
Cut-off Date Balance(1): | $94,849,743 |
| % by Initial UPB: | 7.3% |
| Interest Rate: | 4.4200% |
| Payment Date: | 6th of each month |
| First Payment Date: | March 6, 2015 |
| Maturity Date: | February 6, 2025 |
| Amortization: | 360 months |
| Additional Debt: | None |
| Call Protection: | L(25), D(92), O(3) |
| Lockbox / Cash Management: | Hard / In Place |
Reserves(2) | ||
| Initial | Monthly | |
| Taxes: | $798,986 | $147,045 |
| Insurance: | $98,330 | $32,777 |
| Replacement: | $373,394 | $20,454 |
| TI/LC: | $0 | $170,448 |
Wells Fargo Lease Capital Expenditures(3): | $4,500,000 | $0 |
| Lease Sweep: | $0 | Springing |
| Environmental: | $25,000 | $0 |
| Financial Information | ||
| Cut-off Date Balance / Sq. Ft.: | $58 | |
| Balloon Balance / Sq. Ft.: | $47 | |
| Cut-off Date LTV: | 62.7% | |
| Balloon LTV: | 50.6% | |
| Underwritten NOI DSCR: | 1.79x | |
| Underwritten NCF DSCR: | 1.50x | |
| Underwritten NOI Debt Yield: | 10.8% | |
| Underwritten NCF Debt Yield: | 9.1% | |
| Underwritten NOI Debt Yield at Balloon: | 13.4% | |
| Underwritten NCF Debt Yield at Balloon: | 11.2% | |
| Property Information | |
| Single Asset / Portfolio: | Six crossed loans |
| Property Type: | Office |
| Collateral: | Fee Simple |
| Location: | Various |
| Year Built / Renovated: | Various / Various |
| Total Sq. Ft.: | 1,636,299 |
Property Management(4): | Self-managed |
| Underwritten NOI: | $10,255,663 |
| Underwritten NCF: | $8,586,638 |
| Appraised Value: | $151,300,000 |
| Appraisal Date: | December 2014 |
| Historical NOI | |
| 2014 NOI: | $10,249,035 (December 31, 2014) |
| 2013 NOI: | $9,973,083 (December 31, 2013) |
| 2012 NOI: | $10,071,806 (December 31, 2012) |
| Historical Occupancy | |
| Most Recent Occupancy: | 100.0% (March 6, 2015) |
| 2014 Occupancy: | 100.0% (December 31, 2014) |
| 2013 Occupancy: | 100.0% (December 31, 2013) |
| 2012 Occupancy: | 100.0% (December 31, 2012) |
| (1) | The Wells Fargo Crossed Portfolio is comprised of the Wells Fargo Roanoke loan, the Wells Fargo Atlanta loan, the Wells Fargo Winston-Salem West End I loan, the Wells Fargo Columbia loan, the Wells Fargo Winston-Salem Linden loan and the Wells Fargo Winston-Salem West End II loan, which are cross-collateralized and cross-defaulted with Original Balances of $23,200,000, $20,400,000, $20,000,000, $14,400,000, $11,250,000, and $5,750,000, respectively, and Cut-off Date Balances of $23,163,306, $20,367,734, $19,968,367, $14,377,224, $11,232,206 and $5,740,906, respectively. |
| (2) | See “Initial Reserves” and “Ongoing Reserves” herein. |
| (3) | See “Wells Fargo Lease Capital Expenditures” herein. |
| (4) | The tenant, Wells Fargo Bank, N.A. is the property manager. |
THE INFORMATION IN THIS STRUCTURAL AND COLLATERAL TERM SHEET IS NOT COMPLETE AND MAY BE AMENDED PRIOR TO THE TIME OF SALE. THIS TERM SHEET IS NOT AN OFFER TO SELL THESE SECURITIES AND IT IS NOT A SOLICITATION OF AN OFFER TO BUY THESE SECURITIES IN ANY JURISDICTION WHERE THE OFFER OR SALE IS NOT PERMITTED.
31
| Various | Collateral Asset Summary – Loan Nos. 2-7 Wells Fargo Crossed Portfolio | Cut-off Date Balance: Cut-off Date LTV: U/W NCF DSCR: U/W NOI Debt Yield: | $94,849,743 62.7% 1.50x 10.8% |
| Property Summary | ||||||||||||
| Property Name | Location | Sq. Ft. | Year Built / Renovated | Allocated Loan Amount | Appraised Value | Occupancy(1) | ||||||
| Wells Fargo Roanoke | Roanoke, VA | 443,181 | 1968 / 1974, 1984, 1989 | $23,163,306 | $37,800,000 | 100.0% | ||||||
| Wells Fargo Atlanta | Hapeville, GA | 335,608 | 1987, 2000 / NAP | $20,367,734 | $33,900,000 | 100.0% | ||||||
| Wells Fargo Winston-Salem West End I | Winston Salem, NC | 343,336 | 1984 / 1993 | $19,968,367 | $31,700,000 | 100.0% | ||||||
| Wells Fargo Columbia | Columbia, SC | 240,976 | 1976 / 1982, 2008, 2012, 2014 | $14,377,224 | $21,700,000 | 100.0% | ||||||
| Wells Fargo Winston-Salem Linden | Winston Salem, NC | 187,743 | 1983 / 1997 | $11,232,206 | $17,400,000 | 100.0% | ||||||
| Wells Fargo Winston-Salem West End II | Winston Salem, NC | 85,455 | 1948 / 1997 | $5,740,906 | $8,800,000 | 100.0% | ||||||
| Total / Wtd. Avg. | 1,636,299 | $94,849,743 | $151,300,000 | 100.0% | ||||||||
| (1) | Based on rent roll dated March 6, 2015. |
| Tenant Summary | ||||||||||
Tenant | Ratings (Fitch/Moody’s/S&P) | Net Rentable Area (Sq. Ft.) | % of Net Rentable Area | U/W Base Rent PSF | % of Total U/W Base Rent | Lease Expiration | ||||
Wells Fargo Bank, N.A.(1) | AA-/Aa3/AA- | 1,636,299 | 100.0% | $6.18 | 100.0% | 9/30/2024 | ||||
| Total Occupied Collateral | 1,636,299 | 100.0% | $6.18 | 100.0% | ||||||
| Vacant | 0 | 0.0% | ||||||||
| Total | 1,636,299 | 100.0% | ||||||||
| (1) | Wells Fargo Bank, N.A. (“Wells Fargo”) has six, five-year extension options. |
| Lease Rollover Schedule | ||||||||||||||||
| Year | # of Leases Expiring | Total Expiring Sq. Ft. | % of Total Sq. Ft. Expiring | Cumulative Sq. Ft. Expiring | Cumulative % of Sq. Ft. Expiring | Annual U/W Base Rent PSF | % U/W Base Rent Rolling | Cumulative % of U/W Base Rent | ||||||||
| MTM | 0 | 0 | 0.0% | 0 | 0.0% | $0.00 | 0.0% | 0.0% | ||||||||
| 2015 | 0 | 0 | 0.0% | 0 | 0.0% | $0.00 | 0.0% | 0.0% | ||||||||
| 2016 | 0 | 0 | 0.0% | 0 | 0.0% | $0.00 | 0.0% | 0.0% | ||||||||
| 2017 | 0 | 0 | 0.0% | 0 | 0.0% | $0.00 | 0.0% | 0.0% | ||||||||
| 2018 | 0 | 0 | 0.0% | 0 | 0.0% | $0.00 | 0.0% | 0.0% | ||||||||
| 2019 | 0 | 0 | 0.0% | 0 | 0.0% | $0.00 | 0.0% | 0.0% | ||||||||
| 2020 | 0 | 0 | 0.0% | 0 | 0.0% | $0.00 | 0.0% | 0.0% | ||||||||
| 2021 | 0 | 0 | 0.0% | 0 | 0.0% | $0.00 | 0.0% | 0.0% | ||||||||
| 2022 | 0 | 0 | 0.0% | 0 | 0.0% | $0.00 | 0.0% | 0.0% | ||||||||
| 2023 | 0 | 0 | 0.0% | 0 | 0.0% | $0.00 | 0.0% | 0.0% | ||||||||
| 2024 | 6 | 1,636,299 | 100.0% | 1,636,299 | 100.0% | $6.18 | 100.0% | 100.0% | ||||||||
| 2025 | 0 | 0 | 0.0% | 1,636,299 | 100.0% | $0.00 | 0.0% | 100.0% | ||||||||
| Thereafter | 0 | 0 | 0.0% | 1,636,299 | 100.0% | $0.00 | 0.0% | 100.0% | ||||||||
| Vacant | NAP | 0 | 0.0% | 1,636,299 | 100.0% | NAP | NAP | |||||||||
| Total / Wtd. Avg. | 6 | 1,636,299 | 100.0% | $6.18 | 100.0% | |||||||||||
The Loan. The Wells Fargo Roanoke loan, the Wells Fargo Atlanta loan, the Wells Fargo Winston-Salem West End I loan, the Wells Fargo Columbia loan, the Wells Fargo Winston-Salem Linden loan and the Wells Fargo Winston-Salem West End II loan are six cross-collateralized and cross-defaulted loans with current principal balances of $23,163,306, $20,367,734, $19,968,367, $14,377,224, $11,232,206 and $5,740,906, respectively, that are secured by the borrower’s fee simple interest in six single tenant office properties located in Roanoke, VA, Hapeville, GA, Winston Salem, NC, Columbia, SC, Winston Salem, NC, and Winston Salem, NC, respectively, containing an aggregate of 1,636,299 sq. ft. (each, a “Property”, and collectively, the “Wells Fargo Crossed Portfolio” or the “Portfolio”). The properties are currently 100.0% leased to Wells Fargo Bank, N.A. (AA-/Aa3/AA- by Fitch/Moody’s/S&P) under six individual space leases governed by a master agreement (“Master Agreement”), which also governs a multiple property portfolio, which originally covered approximately 7.6 million sq. ft. Each lease expires on September 30, 2024. The Wells Fargo Crossed Portfolio loans each have a 10-year term and amortize on a 30-year schedule. The Wells Fargo Crossed Portfolio loans each accrue interest at a fixed rate equal to 4.4200% and have an aggregate cut-off date balance of $94,849,743. Loan proceeds along with approximately $57.5 million of sponsor equity were used to acquire the Wells Fargo Crossed Portfolio for approximately $146.7 million. Based on the aggregate appraised value of $151.3 million as of December 2014, the cut-off date LTV is 62.7%. The most recent prior financings of the Wells Fargo Crossed Portfolio were not included in a securitization.
THE INFORMATION IN THIS STRUCTURAL AND COLLATERAL TERM SHEET IS NOT COMPLETE AND MAY BE AMENDED PRIOR TO THE TIME OF SALE. THIS TERM SHEET IS NOT AN OFFER TO SELL THESE SECURITIES AND IT IS NOT A SOLICITATION OF AN OFFER TO BUY THESE SECURITIES IN ANY JURISDICTION WHERE THE OFFER OR SALE IS NOT PERMITTED.
32
| Various | Collateral Asset Summary – Loan Nos. 2-7 Wells Fargo Crossed Portfolio | Cut-off Date Balance: Cut-off Date LTV: U/W NCF DSCR: U/W NOI Debt Yield: | $94,849,743 62.7% 1.50x 10.8% |
The Wells Fargo Crossed Portfolio was originally part of a sale lease back between American Financial Realty Trust and Wachovia Bank, National Association (“Wachovia”) in May 2004. The original Master Agreement covered over 100 properties totaling approximately 7.6 million sq. ft. In March 2010, when Wachovia merged into Wells Fargo, Wells Fargo became the tenant on the individual space leases and assumed all obligations of Wachovia. In March 2013, an affiliate of Oaktree Capital Management, L.P., in partnership with National Financial Realty Inc., acquired a portfolio of 40 office buildings totaling 3.4 million sq. ft. of space, which are covered by the Master Agreement. National Financial Realty – East Coast Portfolio I, LLC (“NFR”), an affiliate of Oaktree Real Estate Opportunities Fund VI, L.P., is currently the administrator across all properties governed by the Master Agreement, including the properties secured by the Wells Fargo Crossed Portfolio loans.
| Sources and Uses | ||||||
| Sources | Proceeds | % of Total | Uses | Proceeds | % of Total | |
| Loan Amount | $95,000,000 | 62.3% | Purchase | $146,708,000 | 96.2% | |
| Sponsor Equity | $57,525,306 | 37.7% | Reserves | $5,795,710 | 3.8% | |
| Closing Costs | $21,596 | 0.0% | ||||
| Total Sources | $152,525,306 | 100.0% | Total Uses | $152,525,306 | 100.0% | |
The Borrower / Sponsor. The borrowers are Mikeone EK Roanoke, LLC, Mikeone EK ATL OPS Center, LLC, Mikeone EK 809 West, LLC, Mikeone EK Columbia SC, LLC, Mikeone EK Linden, LLC, and Mikeone EK 801 West, LLC, each a single purpose Delaware limited liability company structured to be bankruptcy remote, with two independent directors in their organizational structure. The sponsors and the non-recourse carve-out guarantors are EK 2013 Family Trust and Michael Klein.
EK 2013 Family Trust is controlled by Eva Klein, Michael Klein’s sister. Eva and Michael Klein’s father, Samuel Klein, was the founder of Casas Bahia, a national retail operation, which merged with its primary competitor in 2010 to form Via Varejo, and in 2013 successfully completed the second largest public offering in Brazil. While Casas Bahia’s retail operations were merged and taken public, the real estate operations were not part of the merger and under Klein family control. The portfolio contains 422 properties, with approximately 22.8 million sq. ft.
Master Agreement Structure. Each Property is separately leased by Wells Fargo and each lease can be terminated at any time during the lease term subject to the terms of the Master Agreement between Wells Fargo and NFR which includes payment of a termination fee in certain circumstances.
Pursuant to the terms of the Master Agreement, Wells Fargo is able to terminate space leases, or portions of the leased premises thereof, without payment of a termination fee for a certain amount of rentable square footage across the entire portfolio governed by the Master Agreement (“Available Termination Rights Area”), which square footage amounts increase over the initial term of the space leases. Based on an estoppel from Wells Fargo, the current Available Termination Rights Area is 507 rentable square feet (“RSF”). On October 1, 2017 the Available Termination Rights Area is scheduled to increase by an additional 234,336 RSF (across the entire portfolio governed by the Master Agreement which originally covered approximately 7.6 million sq. ft.) with no currently scheduled additional increases thereafter.
Wells Fargo is permitted to terminate individual leases or portions thereof in excess of the Available Termination Rights Area at any time subject to payment of a termination fee equal to the net present value of the annual base rent that would have been payable for the balance of the initial term with respect to the area at the property being terminated with such net present value to be determined as of the day immediately following the termination date, using a discount rate equal to the prime rate (the “WF Termination Fee”). The WF Termination Fee is payable to NFR pursuant to the Master Agreement, however in connection with the acquisition of the Portfolio, NFR executed an assignment of termination payment agreement and agreed to transfer to each applicable borrower any WF Termination Fee received from Wells Fargo under any applicable lease so terminated.
In addition, Oaktree Real Estate Opportunities Fund VI, L.P. (“Oaktree”) provided each borrower with a termination protection agreement pursuant to which Oaktree agreed that upon the termination of space by Wells Fargo under its lease utilizes Available Termination Rights Area requiring no WF Termination Fee, Oaktree will either (a) make a payment to the affected borrower in the amount of the WF Termination Fee which would have otherwise been owed if Available Termination Rights Area were not utilized or (b) enter into (or have an affiliate enter into) a lease with such borrower for the space so terminated by Wells Fargo at the applicable Property.
Each of the foregoing agreements were assigned to the lender as additional collateral for the Wells Fargo Crossed Portfolio loans and the related non-recourse carveout guarantors have provided a guaranty to the lender for full payment of (i) an amount equal to all remaining rent payable for the remaining term following a termination of a lease by Wells Fargo, reduced by any amounts paid by NFR or Oaktree to borrower under the agreements described above and (ii) any amount owed to any borrower and not paid under the Wells Fargo leases or the agreements described above with Oaktree and NFR.
THE INFORMATION IN THIS STRUCTURAL AND COLLATERAL TERM SHEET IS NOT COMPLETE AND MAY BE AMENDED PRIOR TO THE TIME OF SALE. THIS TERM SHEET IS NOT AN OFFER TO SELL THESE SECURITIES AND IT IS NOT A SOLICITATION OF AN OFFER TO BUY THESE SECURITIES IN ANY JURISDICTION WHERE THE OFFER OR SALE IS NOT PERMITTED.
33
| Various | Collateral Asset Summary – Loan Nos. 2-7 Wells Fargo Crossed Portfolio | Cut-off Date Balance: Cut-off Date LTV: U/W NCF DSCR: U/W NOI Debt Yield: | $94,849,743 62.7% 1.50x 10.8% |
The Properties. The Wells Fargo Crossed Portfolio consists of six single tenant office properties that are 100.0% leased to Wells Fargo Bank, N.A. (AA-/Aa3/AA- by Fitch/Moody’s/S&P).
Wells Fargo Roanoke is a single-tenant Class B, multi-story office building located in Roanoke, Virginia. The property was developed in 1968 as a built-to-suit office for a predecessor bank which was subsequently acquired by Wells Fargo, and the property was renovated in 1974, 1984 and 1989. This property is comprised of one multi-story building, totaling 443,181 sq. ft., situated on a 31.18-acre site. The property is a significant customer care service center. Three shifts operate out of the facility (approximately 1,000 personnel per shift) keeping it running 24 hours a day, seven days a week. The property also serves as a large regional training center for the bank and houses approximately 2,000 employees.
Wells Fargo Atlanta is a single-tenant, Class B, office development located in Hapeville, Georgia that is 100.0% occupied by Wells Fargo. The entire property (comprised of three buildings) was developed in 1987 with an expansion completed in 2000, as a built-to-suit for a predecessor bank which was subsequently acquired by Wells Fargo. The property is comprised of three multi-story buildings, totaling 335,608 sq. ft., situated on a 15.63-acre site. The property is home to a secure wire facility that must remain operational for Wells Fargo to continue its operations in the Atlanta Metropolitan Statistical Area. Due to the importance of this property, high-level security measures have been installed as well as infrastructure to keep the building operational for a number of days without power supply (3 emergency generators). In addition, the property houses training operations for all retail banking employees in the state of Georgia south of Interstate 20. Additionally, the property functions as a large operations center housing support teams for various parts of Wells Fargo’s banking operations and includes a cafeteria and check processing center. The property contains approximately 400 employees.
Wells Fargo Winston-Salem West End I and Wells Fargo Winston-Salem West End II consist of two buildings located across the street from one another in Winston Salem, North Carolina. Wells Fargo Winston-Salem West End I was completed in 1984, renovated in 1993 and is comprised of one six-story building, totaling 343,336 sq. ft., situated on a 1.47-acre site. When the property was purchased by the predecessor bank, the two below-grade parking levels were renovated into office space. Wells Fargo Winston-Salem West End II was completed in 1948, was renovated in 1997 and is comprised of a two-story building, totaling 85,455 sq. ft. situated on a 2.85-acre site. The properties house a major data center that is responsible for protecting, handling and storing electronic data 24 hours a day, seven days a week. The data center features dual electrical utility service which is 100% generator backed-up for up to six days, N+1 redundancy, eight generators, three U.P.S. systems, two diesel fuel tanks, 93,000 sq. ft. of raised computer floor, dual fiber optic needs, and a Chiller Plant with a 3,250-ton capacity. This data center is essential to Wells Fargo’s operations in the Piedmont Triad region. Wells Fargo has invested a significant amount of capital not only into the data center itself but also in the security and infrastructure associated with these two properties. Additionally, a high-security money center as well as a significant call center and operation center are also located within this site.
Wells Fargo Columbia is a single-tenant office development located in Columbia, South Carolina that is 100.0% occupied by Wells Fargo. Completed in 1976 and renovated in 1982, 2008, 2012 and 2014, the property is comprised of one two-story building, totaling 240,976 sq. ft., situated on a 14.13-acre site. The call center portion of the property totals 176,740 sq. ft., which is connected to the data center by passageway. The call center supports up to four of Wells Fargo’s major divisions including fraud, treasury management, home mortgage, and “Banker’s Connection”. The data center totals 64,236 sq. ft. Wells Fargo has invested a significant amount of capital not only into the data center, but also in the security and infrastructure associated with the property. Wells Fargo recently made a $2 million corporate capital investment in order to maintain and improve the infrastructure associated with this asset. The property currently holds 1,000 employees and is undergoing renovations that would allow it to house an additional 150 employees this year.
Wells Fargo Winston-Salem Linden consists of three parcels of land totaling 4.06 acres, improved with a three-story office building totaling 187,743 sq. ft. The building, which was constructed in 1983 and renovated in 1997, is steel frame construction with glass and CMU exterior walls. The property was originally constructed for manufacturing purposes and has the infrastructure for a data center though it is now used exclusively as a call center/general office building. There are approximately 650 employees at this location and head count has recently increased at the property. Departments within the property are business banking, ACH and a general call center.
Environmental Matters. The Phase I environmental report for Wells Fargo Atlanta and Wells Fargo Winston-Salem Linden, dated November 7, 2014 and November 10, 2014, respectively, recommended no further action at the Properties. The Phase I environmental report for Wells Fargo Columbia, Wells Fargo Winston-Salem West End I and Wells Fargo Winston-Salem West End II, dated November 11, 2014, recommended no further action at the Properties other than the development and implementation of asbestos operation and maintenance plans, which are in place at such Properties. The Phase I environmental report for Wells Fargo Roanoke, dated November 11, 2014, recommended periodic file reviews of the adjoining property VADEQ files (Exelis Inc. – Night Vision and Communication Solutions) in order to keep track of the contaminant plume at Exelis and verify that it continues to remain peripheral to the subject Property. The environmental report also recommended the development and implementation of an asbestos operation and maintenance plan, which is in place at the Property. The lender escrowed $25,000 upfront for the cost of annual file reviews to be completed on the adjacent site.
THE INFORMATION IN THIS STRUCTURAL AND COLLATERAL TERM SHEET IS NOT COMPLETE AND MAY BE AMENDED PRIOR TO THE TIME OF SALE. THIS TERM SHEET IS NOT AN OFFER TO SELL THESE SECURITIES AND IT IS NOT A SOLICITATION OF AN OFFER TO BUY THESE SECURITIES IN ANY JURISDICTION WHERE THE OFFER OR SALE IS NOT PERMITTED.
34
| Various | Collateral Asset Summary – Loan Nos. 2-7 Wells Fargo Crossed Portfolio | Cut-off Date Balance: Cut-off Date LTV: U/W NCF DSCR: U/W NOI Debt Yield: | $94,849,743 62.7% 1.50x 10.8% |
Tenant. Wells Fargo Bank, N.A. (Fitch: AA-, Moody’s: Aa3; S&P: AA-), is a subsidiary of Wells Fargo & Company. Wells Fargo & Company is a diversified bank and financial holding company headquartered in San Francisco, CA. The company provides retail, commercial and corporate banking services, investment management, insurance, equipment leases, and venture capital investment services. The bank currently employs over 265,000 people and is ranked number 29 on the Fortune 500 list in 2014. Wells Fargo & Company is the fourth-largest bank holding company by assets in the US and is the largest mortgage originator, agriculture lender, bank-owned insurance brokerage, and commercial real estate lender among all major US banks.
Wells Fargo, N.A. provides both personal and commercial banking services, offering deposits and loan products. Headquartered in Sioux Falls, South Dakota, it operates as a subsidiary of Wells Fargo & Company.
As of December 31, 2014 Wells Fargo & Company had $1.7 trillion in assets, ranking the company the 4th largest in the US. Wells Fargo & Company also had $1.4 trillion in retail brokerage client assets, ranking it the 3rd largest US retail brokerage firm. Wells Fargo & Company produces more than $80 billion in annual revenues and operates in more than 8,700 branches across the U.S.
The Markets. Wells Fargo Roanoke is located approximately 5.5 miles north of Downtown Roanoke and approximately 0.5 miles south of Interstate-81 in Roanoke, Virginia. Roanoke is located midway between New York, NY and Atlanta, GA on Interstate-81, approximately 140 miles west of Richmond, VA. The largest municipality in Southwest Virginia with a population of 92,376, Roanoke is also the principal municipality of the Roanoke MSA, which is one of Virginia’s largest metropolitan regions. The city is a hub of transportation, finance and industry for the southwestern part of the state. Per the appraisal, the property is located in the Northeast Roanoke office submarket. The office inventory in the Northeast Roanoke submarket area amounted to approximately 1.5 million sq. ft. as of the end of Q3 2014. Northeast Roanoke submarket reported Q3 2014 vacancy of 6.7% and average rental rate of $11.93 PSF gross.
Wells Fargo Atlanta is located immediately adjacent to Atlanta’s Hartsfield Jackson International Airport. Additionally, just one mile from the property, Porsche Cars North America is currently constructing a $100 million headquarters campus that features a 150,000 sq. ft. office tower. The property provides easy access and is located between Interstate-75 and Intersate-85, and approximately 2.0 miles from where Interstate-285 intersects Interstate-75. Per the appraisal, the subject is located in the South Atlanta office submarket. The submarket contains approximately 24.5 million sq. ft. of office inventory and as of Q3 2014 the average rent was $16.15 PSF gross with an average vacancy of 14.3%.
Wells Fargo Winston-Salem Linden, Wells Fargo Winston-Salem West End I and Wells Fargo Winston-Salem West End II are located within Winston-Salem, North Carolina’s Central Business District office submarket. The metropolitan area benefits from its strategic location along the Interstate-85 corridor, halfway between Atlanta and Washington, D.C. Winston-Salem is the 4th largest city in North Carolina and is located in Forsyth County. Forsyth County currently has a population of 362,514. Per the appraisal, the three Winston Salem properties are located in the Winston Salem Central Business District office submarket. As of Q3 2014, the submarket contains approximately 2.0 million sq. ft. of office space with an average rent of $14.21 PSF gross and average vacancy of 12.4%. Per the appraiser, the concluded rent for the data center space at Wells Fargo Winston-Salem West End I is $25.00 PSF gross.
Wells Fargo Columbia is located on Greystone Boulevard and lies directly south of Route 176 in Columbia, South Carolina. Approximately 1.50 miles northwest on Route 176 is Highway 20, which extends west all the way to Atlanta. Columbia’s central location between the population centers of South Carolina has made it a transportation focal point with three interstate highways. Per the appraisal, the subject is located within the St. Andrews office submarket which contains approximately 4.7 million sq. ft. of office properties across 307 buildings. Average submarket vacancy as of Q3 2014 was 14.0% with average submarket rents of $13.20 PSF gross.
THE INFORMATION IN THIS STRUCTURAL AND COLLATERAL TERM SHEET IS NOT COMPLETE AND MAY BE AMENDED PRIOR TO THE TIME OF SALE. THIS TERM SHEET IS NOT AN OFFER TO SELL THESE SECURITIES AND IT IS NOT A SOLICITATION OF AN OFFER TO BUY THESE SECURITIES IN ANY JURISDICTION WHERE THE OFFER OR SALE IS NOT PERMITTED.
35
| Various | Collateral Asset Summary – Loan Nos. 2-7 Wells Fargo Crossed Portfolio | Cut-off Date Balance: Cut-off Date LTV: U/W NCF DSCR: U/W NOI Debt Yield: | $94,849,743 62.7% 1.50x 10.8% |
Cash Flow Analysis.
| Cash Flow Analysis | ||||||
| 2012 | 2013 | 2014 | U/W | U/W PSF | ||
Base Rent(1) | $9,882,018 | $9,882,019 | $9,916,997 | $10,112,328 | $6.18 | |
| Value of Vacant Space | 0 | 0 | 0 | 0 | 0.00 | |
| Gross Potential Rent | $9,882,018 | $9,882,019 | $9,916,997 | $10,112,328 | $6.18 | |
| Total Recoveries | 2,364,003 | 2,296,577 | 2,056,555 | 9,645,043 | 5.89 | |
Total Other Income(2) | 208,074 | 362,986 | 379,199 | 549,472 | 0.34 | |
Less: Vacancy(3) | 0 | 0 | 0 | (406,137) | (0.25) | |
| Effective Gross Income | $12,454,095 | $12,541,582 | $12,352,751 | $19,900,706 | $12.16 | |
| Total Operating Expenses | 2,382,289 | 2,568,499 | 2,103,715 | 9,645,043 | 5.89 | |
| Net Operating Income | $10,071,806 | $9,973,083 | $10,249,035 | $10,255,663 | $6.27 | |
| TI/LC | 0 | 0 | 0 | 1,341,765 | 0.82 | |
| Capital Expenditures | 0 | 0 | 0 | 327,260 | 0.20 | |
| Net Cash Flow | $10,071,806 | $9,973,083 | $10,249,035 | $8,586,638 | $5.25 | |
| (1) | U/W Base Rent reflects rent escalations averaged over the loan term. |
| (2) | U/W Total Other Income represents 2015 actual capital reimbursement amortization income and a 0.5% asset management fee payable by Wells Fargo to landlord. Lender escrowed $4.5 million upfront, which exceeds the remaining balance of capital expenditures to be reimbursed by Wells Fargo, into Wells Fargo Lease Capital Expenditures escrows as additional collateral for the loan. Wells Fargo Lease Capital Expenditures will be released to each borrower annually at an amount equal to of the lesser of one-tenth of the amount deposited by such borrower or the actual amount reimbursed by Wells Fargo during the calendar year. |
| (3) | U/W Vacancy represents 2.0% of gross potential income. The properties are 100.0% leased by Wells Fargo through September 30, 2024. |
Property Management. The Wells Fargo Crossed Portfolio is self-managed by Wells Fargo Bank, N.A.
Lockbox / Cash Management. The Wells Fargo Crossed Portfolio loans are structured with hard lockboxes and in place cash management. The tenant is required to deposit all rents directly into each clearing account controlled by the lender. Funds deposited in the clearing accounts are swept daily into deposit accounts controlled by the lender and disbursed in accordance with the Wells Fargo Crossed Portfolio loan documents. Any excess cash after all payments as required pursuant to the Wells Fargo Cross Portfolio loan documents is disbursed to the applicable borrower’s operating account, unless a Trigger Period (as defined below) exists with respect to the Wells Fargo Crossed Portfolio loan, in which case any transfer to the borrower’s operating account will cease.
A “Trigger Period” will commence, with respect to an individual Wells Fargo Crossed Portfolio loan upon the occurrence of (i) an event of default, (ii) the commencement of a Low Debt Service Period (as defined below) or (iii) a Lease Sweep Period (as defined below).
A “Low Debt Service Period” will commence with respect to an individual Wells Fargo Crossed Portfolio loan if, as of any calendar quarter, the debt service coverage ratio for such Property is less than 1.20x and will end if such Property achieves a debt service coverage ratio of at least 1.25x for two consecutive calendar quarters.
A “Lease Sweep Period” will commence with respect to an individual Wells Fargo Crossed Portfolio loan (a) upon the earlier of (i) the date that is 24 months prior to the expiration of a Major Lease (as defined below) or (ii) upon the date required under such Major Lease by which the Major Tenant (as defined below) is required to give notice of its exercise of a renewal option thereunder (and such renewal has not been exercised), (b) upon the downgrade of the Major Tenant’s credit rating below AA-/Aa3/AA- by Fitch/Moody’s/S&P, (c) upon a default under a Major Lease by a Major Tenant beyond any applicable notice and cure period, or (e) upon a bankruptcy or insolvency proceeding of a Major Tenant or its parent.
A “Major Lease” means each existing lease with Wells Fargo and any other lease at the Properties which covers 20,000 or more rentable sq. ft. A “Major Tenant” means the tenant under a Major Lease.
Initial Reserves. At closing, the borrowers collectively deposited (i) $798,986 into tax reserve accounts, (ii) $98,330 into insurance reserve accounts, (iii) $373,394 into replacement reserve accounts, (iv) $4,500,000 into Wells Fargo lease capital expenditures reserve accounts and (v) $25,000 into an environmental reserve account.
THE INFORMATION IN THIS STRUCTURAL AND COLLATERAL TERM SHEET IS NOT COMPLETE AND MAY BE AMENDED PRIOR TO THE TIME OF SALE. THIS TERM SHEET IS NOT AN OFFER TO SELL THESE SECURITIES AND IT IS NOT A SOLICITATION OF AN OFFER TO BUY THESE SECURITIES IN ANY JURISDICTION WHERE THE OFFER OR SALE IS NOT PERMITTED.
36
| Various | Collateral Asset Summary – Loan Nos. 2-7 Wells Fargo Crossed Portfolio | Cut-off Date Balance: Cut-off Date LTV: U/W NCF DSCR: U/W NOI Debt Yield: | $94,849,743 62.7% 1.50x 10.8% |
Ongoing Reserves. On a monthly basis, the borrowers collectively are required to deposit reserves of (i) 1/12 of the estimated annual real estate taxes, which currently equate to $147,045 for the Portfolio into tax reserve accounts, (ii) 1/12 of the estimated annual insurance premiums for the Portfolio, which currently equates to $32,777 into insurance reserve accounts, (iii) $170,448 into TI/LC reserve accounts and (iv) $20,454 into replacement reserve accounts. Upon the occurrence of a Lease Sweep Period, all excess cash flow will be deposited into specified lease sweep reserve accounts.
Wells Fargo Lease Capital Expenditures. On the origination date of the Wells Fargo Crossed Portfolio, the borrowers deposited $4.5 million into Wells Fargo lease capital expenditures reserves to be released to the borrowers upon receipt by lender of evidence of reimbursement by Wells Fargo for capital expenditures. The $4.5 million exceeds the remaining balance of capital expenditures to be reimbursed by Wells Fargo. The Wells Fargo lease capital expenditures reserves will be released to each borrower annually in an amount equal to the lesser of (i) one-tenth of the amount deposited on the origination date by such borrower or (ii) the actual amount to be reimbursed by Wells Fargo to such borrower during the calendar year.
Current Mezzanine or Subordinate Indebtedness. None.
Future Mezzanine or Subordinate Indebtedness Permitted. None.
Partial Release. None.
Substitution. None.
THE INFORMATION IN THIS STRUCTURAL AND COLLATERAL TERM SHEET IS NOT COMPLETE AND MAY BE AMENDED PRIOR TO THE TIME OF SALE. THIS TERM SHEET IS NOT AN OFFER TO SELL THESE SECURITIES AND IT IS NOT A SOLICITATION OF AN OFFER TO BUY THESE SECURITIES IN ANY JURISDICTION WHERE THE OFFER OR SALE IS NOT PERMITTED.
37
| Various | Collateral Asset Summary – Loan Nos. 2-7 Wells Fargo Crossed Portfolio | Cut-off Date Balance: Cut-off Date LTV: U/W NCF DSCR: U/W NOI Debt Yield: | $94,849,743 62.7% 1.50x 10.8% |
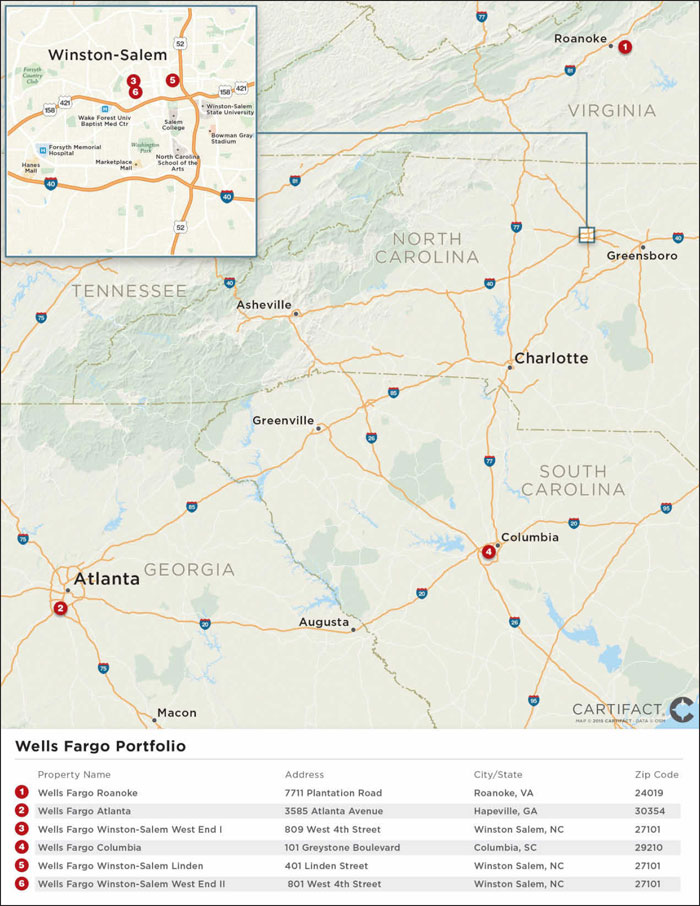
THE INFORMATION IN THIS STRUCTURAL AND COLLATERAL TERM SHEET IS NOT COMPLETE AND MAY BE AMENDED PRIOR TO THE TIME OF SALE. THIS TERM SHEET IS NOT AN OFFER TO SELL THESE SECURITIES AND IT IS NOT A SOLICITATION OF AN OFFER TO BUY THESE SECURITIES IN ANY JURISDICTION WHERE THE OFFER OR SALE IS NOT PERMITTED.
38
(THIS PAGE INTENTIONALLY LEFT BLANK)
39
3 Columbus Circle New York, NY 10019 | Collateral Asset Summary – Loan No. 8 3 Columbus Circle | Cut-off Date Balance: Cut-off Date LTV: U/W NCF DSCR: U/W NOI Debt Yield: | $85,000,000 50.0% 2.30x 8.8% |
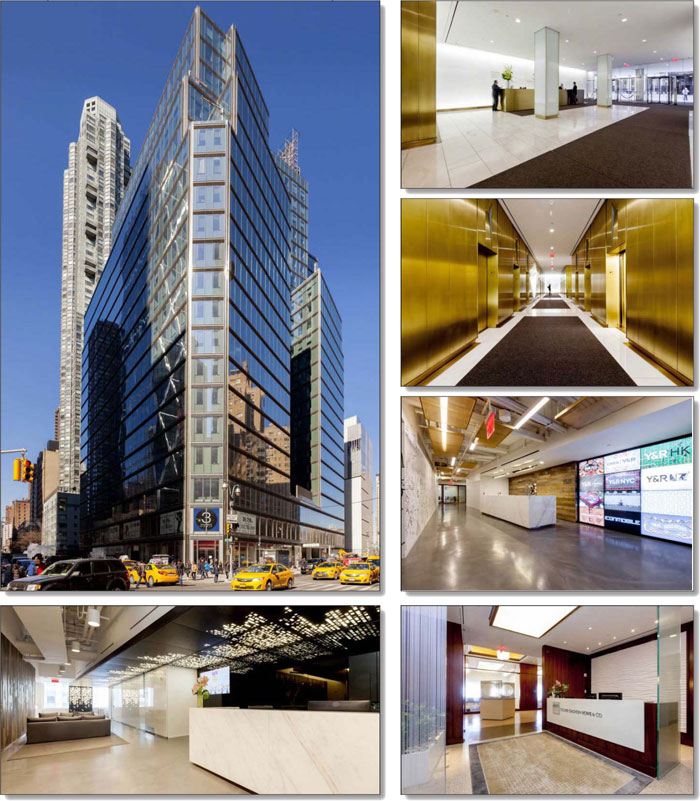
THE INFORMATION IN THIS STRUCTURAL AND COLLATERAL TERM SHEET IS NOT COMPLETE AND MAY BE AMENDED PRIOR TO THE TIME OF SALE. THIS TERM SHEET IS NOT AN OFFER TO SELL THESE SECURITIES AND IT IS NOT A SOLICITATION OF AN OFFER TO BUY THESE SECURITIES IN ANY JURISDICTION WHERE THE OFFER OR SALE IS NOT PERMITTED.
40
3 Columbus Circle New York, NY 10019 | Collateral Asset Summary – Loan No. 8 3 Columbus Circle | Cut-off Date Balance: Cut-off Date LTV: U/W NCF DSCR: U/W NOI Debt Yield: | $85,000,000 50.0% 2.30x 8.8% |
| Mortgage Loan Information | |
| Loan Seller: | GACC |
| Loan Purpose: | Refinance |
| Sponsor: | SL Green Realty Corp.; Joseph Moinian |
| Borrower: | 3 Columbus Circle LLC |
Original Balance(1): | $85,000,000 |
Cut-off Date Balance(1): | $85,000,000 |
| % by Initial UPB: | 6.6% |
| Interest Rate: | 3.6100% |
| Payment Date: | 6th of each month |
| First Payment Date: | April 6, 2015 |
| Maturity Date: | March 6, 2025 |
| Amortization: | Interest Only |
| Additional Debt: | $265,000,000 Pari Passu Debt |
Call Protection(2): | L(24), D(89), O(7) |
| Lockbox / Cash Management: | Hard / Springing |
Reserves(3) | ||
| Initial | Monthly | |
| Taxes: | $1,260,386 | $420,129 |
| Insurance: | $0 | Springing |
| TI/LC: | $4,405,062 | $0 |
| Required Repairs: | $3,500,000 | NAP |
| Rent Concession: | $840,248 | $0 |
| Signage Conversion: | $2,524,836 | $0 |
| Signage Rent: | $1,550,000 | $0 |
Financial Information(4) | ||
| Cut-off Date Balance / Sq. Ft.: | $666 | |
| Balloon Balance / Sq. Ft.: | $666 | |
| Cut-off Date LTV: | 50.0% | |
| Balloon LTV: | 50.0% | |
Underwritten NOI DSCR(5): | 2.39x | |
Underwritten NCF DSCR(5): | 2.30x | |
| Underwritten NOI Debt Yield: | 8.8% | |
| Underwritten NCF Debt Yield: | 8.4% | |
| Underwritten NOI Debt Yield at Balloon: | 8.8% | |
| Underwritten NCF Debt Yield at Balloon: | 8.4% | |
| Property Information | |
| Single Asset / Portfolio: | Single Asset |
| Property Type: | CBD Office |
| Collateral: | Fee Simple |
| Location: | New York, NY |
| Year Built / Renovated: | 1927 / 2011-2013 |
| Total Sq. Ft.: | 740,179 |
| Collateral Sq. Ft.: | 525,807 |
| Property Management: | Newmark & Company Real Estate, Inc. |
Underwritten NOI(6): | $30,648,061 |
| Underwritten NCF: | $29,494,350 |
| “As-is” Appraised Value: | $700,000,000 |
| “As-is” Appraisal Date: | February 1, 2015 |
| “As Stabilized” Value: | $820,000,000 |
| “As Stabilized” Date: | February 1, 2018 |
Historical NOI(6) | |
| Most Recent NOI: | $25,762,399 (T-12 September 30, 2014) |
| 2013 NOI: | $19,719,928 (December 31, 2013) |
| 2012 NOI: | $7,273,760 (December 31, 2012) |
| 2011 NOI: | $2,852,297 (December 31, 2011) |
Historical Occupancy(6) | |
Most Recent Occupancy(7): | 82.7% (February 28, 2015) |
| 2013 Occupancy: | 67.1% (December 31, 2013) |
| 2012 Occupancy: | 27.5% (December 31, 2012) |
| 2011 Occupancy: | 18.4% (December 31, 2011) |
| (1) | The Original Balance and Cut-off Date Balance of $85.0 million represent the non-controlling Note A-4 of a $350.0 million whole loan (the “3 Columbus Circle Loan Combination”) evidenced by six pari passu notes. The pari passu companion loans are comprised of the controlling Note A-1, non-controlling Note A-2, non-controlling Note A-3, non-controlling Note A-5 and non-controlling Note A-6, with an aggregate original principal amount of $265.0 million, which are expected to be securitized in future transactions. |
| (2) | The lockout period will be at least 24 payment dates beginning with and including the first payment date of April 6, 2015. Defeasance of the full $350.0 million 3 Columbus Circle Loan Combination is permitted on or after the date that is the earlier to occur of (i) two years after the closing date of the securitization that includes the last pari passu note to be securitized, and (ii) March 6, 2018. The assumed lockout period of 24 payments is based on the expected COMM 2015-CCRE22 securitization closing date in March 2015. |
| (3) | See “Initial Reserves” and “Ongoing Reserves” herein. |
| (4) | DSCR, LTV, Debt Yield and Balance / Sq. Ft. calculations are based on the aggregate 3 Columbus Circle Loan Combination. |
| (5) | Underwritten NOI DSCR and Underwritten NCF DSCR are based on the interest only debt service payment. Based on a hypothetical 30-year amortization schedule, the Underwritten NOI DSCR and Underwritten NCF DSCR are 1.60x and 1.54x, respectively, |
| (6) | From 2011 to 2013, the 3 Columbus Circle Property underwent an extensive repositioning, during which time the majority of the rent roll was turned over, including a capital improvement program that consisted of building-wide improvements totaling approximately $82.5 million and suite-specific improvements totaling approximately $18.5 million. The increase in Underwritten NOI over Most Recent NOI is due in part to approximately $2.2 million in underwritten straight-line rents for investment grade tenants and underwritten step rents through February 2016, as well as new leases dating back to the third quarter of 2014 which contribute approximately $2.7 million in underwritten base rent. |
| (7) | Most Recent Occupancy includes Laura & John Arnold Foundation (9,708 sq. ft.) and PS Broadway (4,533 sq. ft.), which have executed leases but have not taken occupancy. |
THE INFORMATION IN THIS STRUCTURAL AND COLLATERAL TERM SHEET IS NOT COMPLETE AND MAY BE AMENDED PRIOR TO THE TIME OF SALE. THIS TERM SHEET IS NOT AN OFFER TO SELL THESE SECURITIES AND IT IS NOT A SOLICITATION OF AN OFFER TO BUY THESE SECURITIES IN ANY JURISDICTION WHERE THE OFFER OR SALE IS NOT PERMITTED.
41
3 Columbus Circle New York, NY 10019 | Collateral Asset Summary – Loan No. 8 3 Columbus Circle | Cut-off Date Balance: Cut-off Date LTV: U/W NCF DSCR: U/W NOI Debt Yield: | $85,000,000 50.0% 2.30x 8.8% |
| Tenant Summary |
Tenant | Ratings (Fitch/Moody’s/S&P)(1) | Net Rentable Area (Sq. Ft.) | % of Net Rentable Area | U/W Base Rent PSF | % of Total U/W Base Rent | Lease Expiration | ||||||
| Non-Collateral Condo Tenant | ||||||||||||
| Y&R | BBB+/NR/BBB | 214,372 | NAP | $1.83(2) | 1.1% | NAP | ||||||
| Office Tenants | ||||||||||||
Y&R(3) | BBB+/NR/BBB | 159,394 | 30.3% | $62.17 | 28.0% | 7/31/2033 | ||||||
| Emerge212 | BBB-/Baa3/BB+ | 57,359 | 10.9% | $50.00 | 8.1% | 2/29/2028 | ||||||
| Gilder Gagnon Howe & Co. | NR/NR/NR | 36,076 | 6.9% | $114.93 | 11.7% | 1/31/2017 | ||||||
Jazz at Lincoln Center(4) | NR/NR/NR | 30,653 | 5.8% | $52.00 | 4.5% | 4/30/2028 | ||||||
Versace(5) | NR/NR/NR | 21,342 | 4.1% | $70.00 | 4.2% | 7/31/2025 | ||||||
| Total Major Office Tenants | 304,824 | 58.0% | $65.65 | 56.5% | ||||||||
| Remaining Office Tenants | 91,335 | 17.4% | $67.30 | 17.4% | ||||||||
| Total Occupied Office Tenants | 396,159 | 75.3% | $66.03 | 73.9% | ||||||||
| Vacant Office | 50,568 | 9.6% | ||||||||||
| Total Office | 446,727 | 85.0% | ||||||||||
| Retail Tenants | ||||||||||||
CVS(6) | NR/Baa1/BBB+ | 21,159 | 4.0% | $172.50 | 10.3% | 7/31/2028 | ||||||
Chase(7) | A+/A3/A | 10,000 | 1.9% | $357.50 | 10.1% | 4/30/2021 | ||||||
Bank of America(8) | A/Baa2/A- | 3,263 | 0.6% | $408.45 | 3.8% | 8/31/2017 | ||||||
| Francois Payard Bakery | NR/NR/NR | 1,025 | 0.2% | $245.85 | 0.7% | 1/31/2024 | ||||||
| Total Occupied Retail Tenants | 35,447 | 6.7% | $248.53 | 24.9% | ||||||||
| Vacant Retail | 40,286 | 7.7% | ||||||||||
| Total Retail | 75,733 | 14.4% | ||||||||||
| Storage/Telecom/Other | 202 | 0.0% | $150.59 | 0.1% | ||||||||
| Total Leased Collateral | 431,808 | 82.1% | $81.96 | 100.0% | ||||||||
| Management Office | 2,831 | 0.5% | ||||||||||
| Total Occupied Collateral | 434,639 | 82.7% | $81.42 | 100.0% | ||||||||
| Vacant Retail | 40,286 | 7.7% | ||||||||||
| Vacant Office | 50,568 | 9.6% | ||||||||||
| Vacant Other | 314 | 0.1% | ||||||||||
| Total | 525,807 | 100.0% | ||||||||||
| (1) | Certain ratings are those of the parent company whether or not the parent company guarantees the lease. |
| (2) | Represents underwritten cleaning fees of $391,956 due from the non-collateral Y&R condominium which have historically been accounted for separate from the non-collateral Y&R condo fee reimbursement. |
| (3) | Y&R has two, 10-year renewal options remaining, each at an amount equal to 100% of fair market rent. |
| (4) | Jazz at Lincoln Center has one, five-year renewal option remaining at fair market rent. |
| (5) | Versace has one, five-year renewal option remaining at fair market rent. |
| (6) | CVS has one, 10-year renewal option remaining at the greater of 100% of fair market rent or 115% of the rent then payable at the expiration of the CVS lease term. |
| (7) | Chase has one, five-year renewal option remaining at the greater of $3,932,500 and 95% of fair market rent. |
| (8) | Bank of America has one, five-year renewal option remaining at the greater of 100% of fair market rent or the rent then payable at the expiration of the Bank of America lease term. |
THE INFORMATION IN THIS STRUCTURAL AND COLLATERAL TERM SHEET IS NOT COMPLETE AND MAY BE AMENDED PRIOR TO THE TIME OF SALE. THIS TERM SHEET IS NOT AN OFFER TO SELL THESE SECURITIES AND IT IS NOT A SOLICITATION OF AN OFFER TO BUY THESE SECURITIES IN ANY JURISDICTION WHERE THE OFFER OR SALE IS NOT PERMITTED.
42
3 Columbus Circle New York, NY 10019 | Collateral Asset Summary – Loan No. 8 3 Columbus Circle | Cut-off Date Balance: Cut-off Date LTV: U/W NCF DSCR: U/W NOI Debt Yield: | $85,000,000 50.0% 2.30x 8.8% |
Lease Rollover Schedule(1) | ||||||||||||||||
| Year | # of Leases Expiring | Total Expiring Sq. Ft. | % of Total Sq. Ft. Expiring | Cumulative Sq. Ft. Expiring | Cumulative % of Sq. Ft. Expiring | Annual U/W Base Rent PSF | % U/W Base Rent Rolling | Cumulative % of U/W Base Rent | ||||||||
| MTM | 0 | 0 | 0.0% | 0 | 0.0% | $0.00 | 0.0% | 0.0% | ||||||||
| 2015 | 6 | 23,697 | 4.5% | 23,697 | 4.5% | $57.40 | 3.8% | 3.8% | ||||||||
| 2016 | 0 | 0 | 0.0% | 23697 | 4.5% | $0.00 | 0.0% | 3.8% | ||||||||
| 2017 | 5 | 46,282 | 8.8% | 69,979 | 13.3% | $130.08 | 17.0% | 20.9% | ||||||||
| 2018 | 2 | 5,704 | 1.1% | 75,683 | 14.4% | $72.62 | 1.2% | 22.0% | ||||||||
| 2019 | 3 | 13,735 | 2.6% | 89,418 | 17.0% | $76.14 | 3.0% | 25.0% | ||||||||
| 2020 | 1 | 4,533 | 0.9% | 93,951 | 17.9% | $78.45 | 1.0% | 26.0% | ||||||||
| 2021 | 1 | 10,000 | 1.9% | 103,951 | 19.8% | $357.50 | 10.1% | 36.1% | ||||||||
| 2022 | 0 | 0 | 0.0% | 103951 | 19.8% | $0.00 | 0.0% | 36.1% | ||||||||
| 2023 | 3 | 21,226 | 4.0% | 125,177 | 23.8% | $68.00 | 4.1% | 40.2% | ||||||||
| 2024 | 2 | 6,814 | 1.3% | 131,991 | 25.1% | $101.98 | 2.0% | 42.1% | ||||||||
| 2025 | 2 | 31,050 | 5.9% | 163,041 | 31.0% | $65.62 | 5.8% | 47.9% | ||||||||
| Thereafter | 5 | 268,565 | 51.1% | 431,606 | 82.1% | $67.10 | 50.9% | 98.8% | ||||||||
| Other | 8 | 3,033 | 0.6% | 434,639 | 82.7% | $139.26 | 1.2% | 100.0% | ||||||||
| Vacant | NAP | 91,168 | 17.3% | 525,807 | 100.0% | NAP | NAP | |||||||||
| Total / Wtd. Avg. | 38 | 525,807 | 100.0% | $81.42 | 100.0% | |||||||||||
| (1) | Certain tenants have lease termination options that may become exercisable prior to the originally stated expiration date of the tenant lease that are not considered in the lease rollover schedule. |
The Loan. The 3 Columbus Circle loan (the “3 Columbus Circle Loan”) is a fixed rate loan secured by the borrower’s fee simple interest in a 525,807 sq. ft. condominium portion of a 740,179 sq. ft. office building, located at 3 Columbus Circle, New York City on the block bounded by Broadway to the east, Eighth Avenue to the west, and West 58th and West 57th Streets to the north and south, respectively (the “3 Columbus Circle Property”) with an original principal balance of $85.0 million. The 3 Columbus Circle Loan is comprised of the non-controlling Note A-4 of a $350.0 million whole loan that is evidenced by six pari passu notes (collectively, the “3 Columbus Circle Loan Combination”). Only the $85.0 million non-controlling Note A-4 will be included in the COMM 2015-CCRE22 trust. The controlling Note A-1, non-controlling Note A-2, non-controlling Note A-3, non-controlling Note A-5 and non-controlling Note A-6, with an aggregate original principal balance of $265.0 million, are expected to be included in future securitizations. The 3 Columbus Circle Loan has a 10-year term and pays interest only for the term of the loan. The 3 Columbus Circle Loan accrues interest at a fixed rate equal to 3.6100% and has a cut-off date balance of $85.0 million. Loan proceeds were used to retire existing debt of approximately $228.2 million, pay closing costs of approximately $5.4 million, fund reserves of approximately $14.1 million and return approximately $102.3 million of equity to the borrower. Based on the appraised value of $700.0 million as of February 1, 2015, the cut-off date LTV is 50.0%. The most recent prior financing of the 3 Columbus Circle Property was not included in a securitization.
The relationship between the holders of the Note A-1, Note A-2, Note A-3, Note A-4, Note A-5 and Note A-6 will be governed by a co-lender agreement as described under “Description of the Mortgage Pool—Loan Combinations —3 Columbus Circle Loan Combination” in the accompanying Free Writing Prospectus.
| Pari Passu Note Summary | |||||
| Original Balance | Cut-off Date Balance | Note Holder | Controlling Piece | ||
| Note A-1 | $90,000,000 | $90,000,000 | GACC | Yes | |
| Note A-2 | $50,000,000 | $50,000,000 | CGMRC | No | |
| Note A-3 | $45,000,000 | $45,000,000 | WFB | No | |
| Note A-4 | $85,000,000 | $85,000,000 | COMM 2015-CCRE22 | No | |
| Note A-5 | $50,000,000 | $50,000,000 | CGMRC | No | |
| Note A-6 | $30,000,000 | $30,000,000 | WFB | No | |
| Total | $350,000,000 | $350,000,000 | |||
THE INFORMATION IN THIS STRUCTURAL AND COLLATERAL TERM SHEET IS NOT COMPLETE AND MAY BE AMENDED PRIOR TO THE TIME OF SALE. THIS TERM SHEET IS NOT AN OFFER TO SELL THESE SECURITIES AND IT IS NOT A SOLICITATION OF AN OFFER TO BUY THESE SECURITIES IN ANY JURISDICTION WHERE THE OFFER OR SALE IS NOT PERMITTED.
43
3 Columbus Circle New York, NY 10019 | Collateral Asset Summary – Loan No. 8 3 Columbus Circle | Cut-off Date Balance: Cut-off Date LTV: U/W NCF DSCR: U/W NOI Debt Yield: | $85,000,000 50.0% 2.30x 8.8% |
| Sources and Uses | ||||||
| Sources | Proceeds | % of Total | Uses | Proceeds | % of Total | |
| Loan Amount | $350,000,000 | 100.0% | Loan Payoff | $228,200,410 | 65.2% | |
| Reserves | $14,080,532 | 4.0% | ||||
| Closing Costs | $5,438,669 | 1.6% | ||||
| Return of Equity | $102,280,390 | 29.2% | ||||
| Total Sources | $350,000,000 | 100.0% | Total Uses | $350,000,000 | 100.0% | |
The Borrower / Sponsor. The borrower, 3 Columbus Circle LLC, is a single purpose Delaware limited liability company structured to be bankruptcy-remote with two independent directors in its organizational structure. The sponsor of the borrower and the non-recourse carveout guarantors are Joseph Moinian and SL Green Realty Corp., jointly and severally.
Joseph Moinian is the founder and CEO of The Moinian Group. Founded in 1982, The Moinian Group is a New York City-based developer, investor and long-term owner of prime real estate. The Moinian Group owns in excess of 20 million sq. ft. of residential, hotel, commercial and retail properties across major cities including New York, Chicago, Dallas and Los Angeles.
SL Green Realty Corp., New York City’s largest office landlord, is a fully integrated, publicly traded (NYSE: SLG) REIT that is focused primarily on the acquisition and management of Manhattan commercial properties. As of December 31, 2014, SL Green Realty Corp. held interests in 101 Manhattan buildings totaling 42.4 million sq. ft. of space. In addition to its Manhattan investments, SL Green Realty Corp. holds ownership interests in 36 suburban buildings totaling 5.9 million sq. ft. in Brooklyn, Long Island, Westchester County, Connecticut and New Jersey.
The Property. The 3 Columbus Circle Property consists of units 1 through 20 in a 21-unit condominium and is comprised of the basement through second floor, and ninth through 26th floors of a 26-story Class A, multi-tenant office building that was originally constructed in 1927 to serve as headquarters for General Motors Corporation. The remaining unit in the condominium (the “YR Unit”), which is comprised of floors three through eight, consisting of 214,372 sq. ft., is owner-occupied by Y&R and does not serve as collateral for the 3 Columbus Circle Loan. The borrower owns a 71.9927% undivided interest in the common elements of the condominium and appoints two of the three members of the Board of Managers of the condominium association.
From 2011 to 2013, the property underwent a large-scale renovation and modernization program including the installation of an entirely new glass curtain wall façade and a new lobby featuring backlit, frosted-glass walls, brushed bronze wall accents and white marble flooring. Other improvements to the building systems included new installation of a new cooling tower and HVAC equipment, air conditioning units and mechanical equipment rooms on all floors, as well as upgrades to the building’s fire, sprinkler, elevator and electrical systems. The reported cost of the renovation program was approximately $101.0 million ($136 PSF based on the total building sq. ft.). The 3 Columbus Circle Property totals 525,807 collateral sq. ft. and is comprised of 446,727 sq. ft. of office space, 75,733 sq. ft. of retail space and 3,347 sq. ft. of other building space. As of February 28, 2015, the 3 Columbus Circle Property was 82.7% occupied and the office space (73.9% of U/W Base Rent) was approximately 88.7% occupied. Office floor plates at the 3 Columbus Circle Property range from 9,200 sq. ft. to 41,202 sq. ft. with views of Central Park from the upper floors and terraces.
The 3 Columbus Circle Property spans the entire block bounded by Broadway to the east, Eighth Avenue to the west, and West 58th and West 57th Streets to the north and south, respectively. The 3 Columbus Circle Property has approximately 216.2 ft. of frontage along Broadway, 200.1 ft. of frontage along Eighth Avenue, 201.2 ft. of frontage along West 57th Street and 121.2 ft. of frontage along West 58th Street. The 3 Columbus Circle Property is served primarily by the 59th Street/Columbus Circle subway station, located to the northwest, which offers trains on the A, B, C, D and 1 lines, as well as the M20, M57 and M104 bus lines.
The three largest tenants at the 3 Columbus Circle Property occupy a total of 48.1% of the total net rentable area (“NRA”) and account for 47.8% of underwritten base revenue. The largest tenant, Y&R, occupies 159,394 sq. ft., or 30.3% of total NRA, and accounts for 28.0% of underwritten base rent. The second largest tenant, Emerge212, occupies 57,359 sq. ft. or 10.9% of total NRA, and accounts for 8.1% of underwritten base rent. The third largest tenant, Gilder Gagnon Howe & Co., occupies 36,076 sq. ft. on the top three floors of the 3 Columbus Circle Property, or 6.9% of total NRA, and accounts for 11.7% of underwritten base rent. No other tenant at the 3 Columbus Circle Property occupies more than 5.8% of total NRA or accounts for more than 10.3% of underwritten base rent. Tenants rated investment grade by at least one of Fitch/Moody’s/S&P comprise 47.8% of the NRA at the 3 Columbus Circle Property and account for 61.4% of underwritten base rent, with a weighted average remaining lease term of approximately 16.1 years.
In connection with the renovation and modernization of the property between 2011 and 2013, the majority of the 3 Columbus Circle Property’s tenant base was turned over, bringing the occupancy down to 18.4% as of December 2011. In 2012, Y&R took occupancy of 124,760 sq. ft. in addition to purchasing its 214,372 sq. ft. condominium on floors three through eight. During 2013, Emerge 212 took occupancy of 57,359 sq. ft. and Y&R expanded into an additional 34,634 sq. ft. Since then, occupancy at the 3 Columbus Circle Property has steadily increased to the current occupancy level of 82.7% as of February 28, 2015.
THE INFORMATION IN THIS STRUCTURAL AND COLLATERAL TERM SHEET IS NOT COMPLETE AND MAY BE AMENDED PRIOR TO THE TIME OF SALE. THIS TERM SHEET IS NOT AN OFFER TO SELL THESE SECURITIES AND IT IS NOT A SOLICITATION OF AN OFFER TO BUY THESE SECURITIES IN ANY JURISDICTION WHERE THE OFFER OR SALE IS NOT PERMITTED.
44
3 Columbus Circle New York, NY 10019 | Collateral Asset Summary – Loan No. 8 3 Columbus Circle | Cut-off Date Balance: Cut-off Date LTV: U/W NCF DSCR: U/W NOI Debt Yield: | $85,000,000 50.0% 2.30x 8.8% |
Environmental Matters. The Phase I environmental report dated February 9, 2015 recommended the continued implementation of an asbestos operation and maintenance plan at the 3 Columbus Circle Property, which is currently in place.
Major Tenants.
Y&R (159,394 sq. ft.; 30.3% of NRA; 28.0% of U/W Base Rent; BBB+/BBB by Fitch/S&P) Y&R is a global marketing and communications company with over 6,500 employees in 92 countries specializing in advertising, digital and social media, sales promotion, direct marketing and brand identity consulting. Y&R is a subsidiary of WPP plc, a British multinational advertising and public relations conglomerate. The 3 Columbus Circle Property represents Y&R’s world headquarters. Y&R initially leased 124,760 sq. ft. comprising all of floors 9, 10, 18 and 19 at the 3 Columbus Circle Property beginning in 2012 and later expanded into an additional 34,634 sq. ft. on the 11th floor in 2013, in addition to its non-collateral 214,372 sq. ft. of space. Y&R’s leases expire July 31, 2033, with no early termination options and two, ten-year renewal options.
Emerge212 (57,359 sq. ft.; 10.9% of NRA; 8.1% of U/W Base Rent; BBB-/Baa3/BB+ by Fitch/Moody’s/S&P) Emerge212, a wholly-owned subsidiary of SL Green Realty Corp., is a provider of Class A boutique shared office space across three locations in Midtown Manhattan. Emerge212 offers flexible leasing plans for its fully furnished offices, with amenities that include executive boardrooms and conference rooms available for rental by the hour or day, comprehensive catering services, office and meeting supplies, gigabit LAN internet connectivity with support staff, server rack room space, local and network printing as well as temporary business staffing assistance. Emerge212 has occupied the entire 15th and part of the 16th floor of the 3 Columbus Circle Property since 2013 and its lease expires in February 2028 with no early termination options.
Gilder Gagnon Howe & Co. (36,076 sq. ft.; 6.9% of NRA; 11.7% of U/W Base Rent) Gilder Gagnon Howe & Co., founded in 1968 as R. Gilder & Co., is a Registered Investment Advisor that manages investments for individuals on a discretionary basis. Gilder Gagnon Howe & Co. focuses on individual companies and invests based on its independent research, relying on fundamentals relating to a particular company and its industry. Gilder Gagnon Howe & Co.’s lease runs through January 31, 2017 with no early termination options.
Signage Conversion. The 3 Columbus Circle Property currently features a static electronic rooftop sign leased to Clear Channel through April 2015 at a rate of $1,550,000 per year which displays the CNN logo and the current time and temperature. The sponsor does not plan to renew the Clear Channel lease and intends to convert the signage to a dynamic digital LED sign. The full cost to install the digital display, in an amount equal to $2,524,836, along with $1,550,000 of signage rent was reserved at closing.
The Market. The 3 Columbus Circle Property is located in New York’s Midtown West office market within the Westside office submarket. As of Q3 2014, Midtown West Class A office inventory was comprised of approximately 37.7 million sq. ft. of office space with a vacancy rate of 10.7%. Specifically, Class A office inventory within the Westside submarket was comprised of approximately 23.8 million sq. ft. of office space with a vacancy rate of 11.1%. As of Q3 2014, Class A Midtown West office rents were $77.05 PSF with Westside office submarket rental rates of $79.66 PSF. The appraiser analyzed a set of seven directly competitive properties within the immediate competitive area of the 3 Columbus Circle Property and concluded an office market rental range of $65.00 to $135.00. Underwritten weighted average office rents at the 3 Columbus Circle Property are currently $66.03 PSF, slightly below the appraisal’s concluded office market rent for the 3 Columbus Circle Property of $73.77 PSF. The chart below summarizes the comparable set as determined by the appraisal.
Comparable Set(1) | |||||
Building | Office Area | Available | % Occupied | Asking Rent Low | Asking Rent High |
3 Columbus Circle Property(2) | 446,727 | 50,568 | 88.7% | NAP | NAP |
40 West 57th Street | 712,000 | 50,000 | 93.0% | $115.00 | $115.00 |
| 1740 Broadway | 412,704 | 0 | 100.0% | NAP | NAP |
| 810 Seventh Avenue | 748,023 | 107,937 | 85.6% | $85.00 | $85.00 |
| 888 Seventh Avenue | 841,000 | 100,442 | 88.1% | $70.00 | $135.00 |
| 1350 Avenue of the Americas | 424,000 | 23,605 | 94.4% | $65.00 | $85.00 |
| 1370 Avenue of the Americas | 339,000 | 34,316 | 89.9% | $70.00 | $80.00 |
| 1755 Broadway | 214,425 | 0 | 100.0% | NAP | NAP |
Total / Wtd. Avg.(3): | 3,691,152 | 316,300 | 91.4% | $65.00 | $135.00 |
| (1) | Source: Appraisal. |
| (2) | Based on rent roll dated February 28, 2015. |
| (3) | Total / Wtd. Avg. excludes the 3 Columbus Circle Property. |
THE INFORMATION IN THIS STRUCTURAL AND COLLATERAL TERM SHEET IS NOT COMPLETE AND MAY BE AMENDED PRIOR TO THE TIME OF SALE. THIS TERM SHEET IS NOT AN OFFER TO SELL THESE SECURITIES AND IT IS NOT A SOLICITATION OF AN OFFER TO BUY THESE SECURITIES IN ANY JURISDICTION WHERE THE OFFER OR SALE IS NOT PERMITTED.
45
3 Columbus Circle New York, NY 10019 | Collateral Asset Summary – Loan No. 8 3 Columbus Circle | Cut-off Date Balance: Cut-off Date LTV: U/W NCF DSCR: U/W NOI Debt Yield: | $85,000,000 50.0% 2.30x 8.8% |
The below chart summarizes the appraiser’s office market rent conclusion by floor.
| Office Market Rent | ||
| Floors | Average Floorplate (sq. ft.) | Rent PSF |
| 9 to 15 | 34,162 | $68.00 |
| 16 to 18 | 33,983 | $72.00 |
| 19 to 23 | 21,255 | $80.00 |
| 24 to 26 | 14,428 | $90.00 |
| Wtd. Avg. | 26,852 | $73.77 |
The 3 Columbus Circle Property features retail space located on the ground floor, lower level and second floor. The appraiser examined five comparable on-grade retail leases in the immediate area around the 3 Columbus Circle Property as well as eight large multi-level retail leases across Manhattan to conclude market rents for the retail space. A summary of the leases is presented below.
| Comparable Retail Leases – On-Grade | ||||||
| Address | Tenant | Frontage | Lease Sq. Ft. | Adjusted Rent PSF | Lease Term | Lease Type |
250 West 57th Street | HSBC | West 57th Street | 3,000 | $399.30 | 10 years | Gross |
| 1841 Broadway | Luggage Company | Broadway | 1,208 | $397.00 | 5 years | Gross |
| 836 Seventh Avenue | Dunkin Donuts | Eighth Avenue | 400 | $420.00 | 10 years | Gross |
250 West 57th Street | Starbucks | Eighth Avenue | 879 | $390.00 | 10 years | Gross |
250 West 57th Street | AT&T | West 57th Street | 3,797 | $408.00 | 10 years | Gross |
| Comparable Retail Leases – Multi-Level | ||||||
| Address | Tenant | Frontage | Lease Sq. Ft. | Adjusted Rent PSF | Lease Term | Lease Type |
| 545 Fifth Avenue | NBA | Fifth Avenue | 24,648 | $135.00 | 20 years | Gross |
| 635 Avenue of the Americas | Lowe’s | 6th Ave. & 19th St. | 28,351 | $202.00 | 15 years | Gross |
| 105 Fifth Avenue | Banana Republic | 5th Ave. & 18th St. | 28,800 | $118.00 | 10 years | Gross |
| 101 Seventh Avenue | Barney’s | Seventh Avenue | 50,450 | $134.00 | 10 years | Gross |
| 583 Broadway | Under Armour | Broadway | 20,144 | $116.00 | 10 years | Gross |
249 West 17th Street | Room & Board | 17th Street | 60,919 | $114.00 | 15 years | Gross |
| 1095 Avenue of the Americas | Whole Foods | 6th Ave. & 41st St. | 33,338 | $130.00 | 20 years | Gross |
| 608 Fifth Avenue | Top Shop | 5th Ave. & 49th St. | 44,287 | $182.00 | 8 years | Gross |
| Retail Market Rent | ||
| Floors | Area / Sq. Ft. | Rent PSF |
| Basement | 20,560 | $50.00 |
| Ground Floor | 25,906 | $392.93 |
| Second Floor | 29,267 | $100.00 |
| Total/Wtd. Avg. | 75,733 | $186.45 |
THE INFORMATION IN THIS STRUCTURAL AND COLLATERAL TERM SHEET IS NOT COMPLETE AND MAY BE AMENDED PRIOR TO THE TIME OF SALE. THIS TERM SHEET IS NOT AN OFFER TO SELL THESE SECURITIES AND IT IS NOT A SOLICITATION OF AN OFFER TO BUY THESE SECURITIES IN ANY JURISDICTION WHERE THE OFFER OR SALE IS NOT PERMITTED.
46
3 Columbus Circle New York, NY 10019 | Collateral Asset Summary – Loan No. 8 3 Columbus Circle | Cut-off Date Balance: Cut-off Date LTV: U/W NCF DSCR: U/W NOI Debt Yield: | $85,000,000 50.0% 2.30x 8.8% |
Cash Flow Analysis.
Cash Flow Analysis(1) | ||||||
| 2011 | 2012 | 2013 | T-12 9/30/2014 | U/W | U/W PSF | |
Base Rent(2) | $11,536,109 | $15,615,474 | $28,024,937 | $31,630,515 | $37,587,203 | $71.48 |
| Value of Vacant Space | 0 | 0 | 0 | 0 | 8,068,725 | 15.35 |
| Gross Potential Rent | $11,536,109 | $15,615,474 | $28,024,937 | $31,630,515 | $45,655,928 | $86.83 |
| Total Recoveries | 760,947 | 1,154,092 | 3,626,553 | 7,662,119 | 7,494,723 | 14.25 |
| Total Other Income | 1,568,146 | 1,739,456 | 1,607,205 | 1,810,923 | 1,573,077 | 2.99 |
Less: Vacancy/Bad Debt(3) | (259,017) | (61,698) | (99,510) | (118,581) | (8,068,725) | (15.35) |
| Effective Gross Income | $13,606,185 | $18,447,324 | $33,159,185 | $40,984,976 | $46,655,003 | $88.73 |
| Total Operating Expenses | 10,753,888 | 11,173,564 | 13,439,257 | 15,222,578 | 16,006,943 | 30.44 |
| Net Operating Income | $2,852,297 | $7,273,760 | $19,719,928 | $25,762,399 | $30,648,061 | $58.29 |
| TI/LC | 0 | 0 | 0 | 0 | 1,022,259 | 1.94 |
| Capital Expenditures | 0 | 0 | 0 | 0 | 131,452 | 0.25 |
| Net Cash Flow | $2,852,297 | $7,273,760 | $19,719,928 | $25,762,399 | $29,494,350 | $56.09 |
| (1) | From 2011 to 2013, the 3 Columbus Circle Property underwent an extensive repositioning, during which time the majority of the rent roll was turned over, including a capital improvement program that consisted of building-wide improvements totaling $82.5 million and suite-specific improvements totaling $18.5 million. The increase in U/W Net Operating Income over T-12 9/30/2014 Net Operating Income is due in part to approximately $2.2 million in U/W straight-line rents for investment grade tenants and underwritten step rents through February 2016, as well as new leases dating back to the third quarter of 2014 which contribute $2.7 million in U/W Base Rent. |
| (2) | U/W Base Rent includes $2,196,843 of (i) contractual rent increases through February 2, 2016 and (ii) straight line average rent increases through the earlier of lease expiration or effective termination date for investment grade tenants. |
| (3) | U/W Vacancy/Bad Debt is based on the in-place vacancy. |
Property Management. The 3 Columbus Circle Property is managed by Newmark & Company Real Estate, Inc. Newmark & Company Real Estate, Inc. is owned by Newmark Grubb Knight Frank, which provides property and facilities management for 500 million sq. ft. in the U.S., Europe, Asia-Pacific, the Middle East and Africa.
Lockbox / Cash Management. The 3 Columbus Circle Loan is structured with a hard lockbox and springing cash management. At closing, the borrower was required to instruct all tenants to deposit all rents and other payments into the lockbox account controlled by the lender for the term of the 3 Columbus Circle Loan. All funds in the lockbox account are swept daily to the cash management account controlled by the lender. Provided no Trigger Period (as defined below) is continuing, all funds in the cash management account are swept daily to the borrower’s operating account. Upon the occurrence and during the continuance of a Trigger Period, amounts in the cash management account will be disbursed monthly through the waterfall in the loan documents and excess cash swept and held as additional collateral for the loan.
A “Trigger Period” will occur upon (i) an event of default, or (ii) the debt service coverage ratio falling below 1.10x (based on an amortizing 30-year debt service payment). A Trigger Period will end: (a) with respect to clause (i) above, upon the cure of the event of default, or (b) with respect to clause (ii) above, upon the debt service coverage ratio being greater than 1.15x for two consecutive quarters or if the borrower delivers to the lender as additional collateral for the 3 Columbus Circle Loan either cash or a letter of credit in an amount by which the then outstanding principal balance would need to be reduced in order for the debt service coverage ratio to equal 1.10x.
Initial Reserves. At closing, the borrower deposited (i) $1,260,386 into a tax reserve account, (ii) $4,405,062 into a TI/LC reserve account for existing TI/LC obligations due to tenants as of the closing date, (iii) $3,500,000 into a required repairs reserve, (iv) $840,248 into a rent concession reserve for existing free rent obligations due to tenants as of the closing date, (v) $2,524,836 into the signage conversion work reserve and (vi) $1,550,000 into the signage rent reserve, which represents one year of prepaid signage rent under the in place lease.
Ongoing Reserves. On a monthly basis, the borrower is required to deposit reserves of (i) 1/12 of the estimated annual real estate taxes, which currently equates to $420,129, into a tax reserve account and (ii) 1/12 of the annual insurance premiums. Notwithstanding the foregoing, in the event that an acceptable blanket insurance policy is in effect, deposits into the insurance reserve account are suspended to the extent that insurance premiums relate to such acceptable blanket insurance policy. As of the loan closing date, an acceptable blanket insurance policy was in effect.
Current Mezzanine or Subordinate Indebtedness. None.
Future Mezzanine or Subordinate Indebtedness Permitted. None.
THE INFORMATION IN THIS STRUCTURAL AND COLLATERAL TERM SHEET IS NOT COMPLETE AND MAY BE AMENDED PRIOR TO THE TIME OF SALE. THIS TERM SHEET IS NOT AN OFFER TO SELL THESE SECURITIES AND IT IS NOT A SOLICITATION OF AN OFFER TO BUY THESE SECURITIES IN ANY JURISDICTION WHERE THE OFFER OR SALE IS NOT PERMITTED.
47
3 Columbus Circle New York, NY 10019 | Collateral Asset Summary – Loan No. 8 3 Columbus Circle | Cut-off Date Balance: Cut-off Date LTV: U/W NCF DSCR: U/W NOI Debt Yield: | $85,000,000 50.0% 2.30x 8.8% |
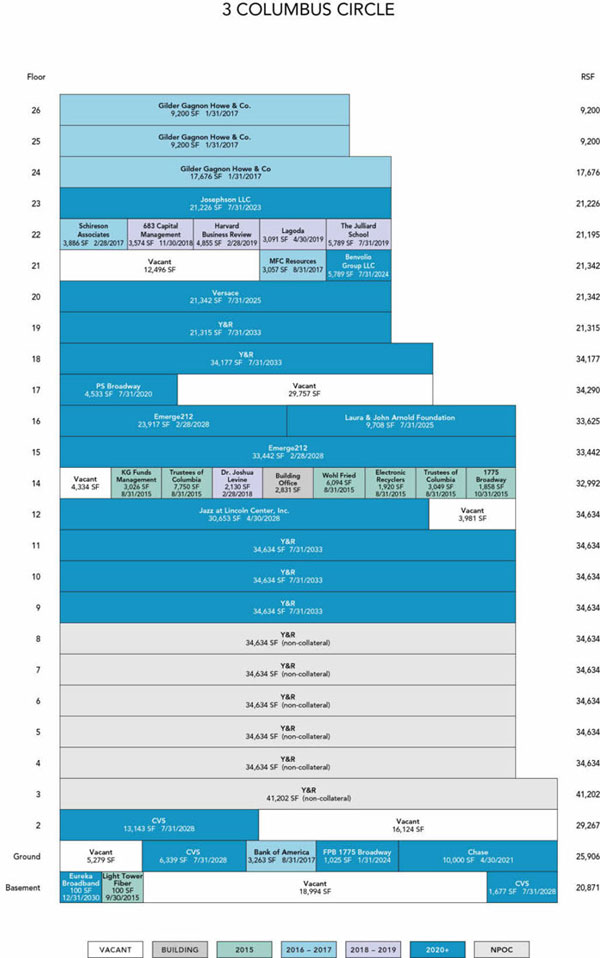
THE INFORMATION IN THIS STRUCTURAL AND COLLATERAL TERM SHEET IS NOT COMPLETE AND MAY BE AMENDED PRIOR TO THE TIME OF SALE. THIS TERM SHEET IS NOT AN OFFER TO SELL THESE SECURITIES AND IT IS NOT A SOLICITATION OF AN OFFER TO BUY THESE SECURITIES IN ANY JURISDICTION WHERE THE OFFER OR SALE IS NOT PERMITTED.
48
3 Columbus Circle New York, NY 10019 | Collateral Asset Summary – Loan No. 8 3 Columbus Circle | Cut-off Date Balance: Cut-off Date LTV: U/W NCF DSCR: U/W NOI Debt Yield: | $85,000,000 50.0% 2.30x 8.8% |
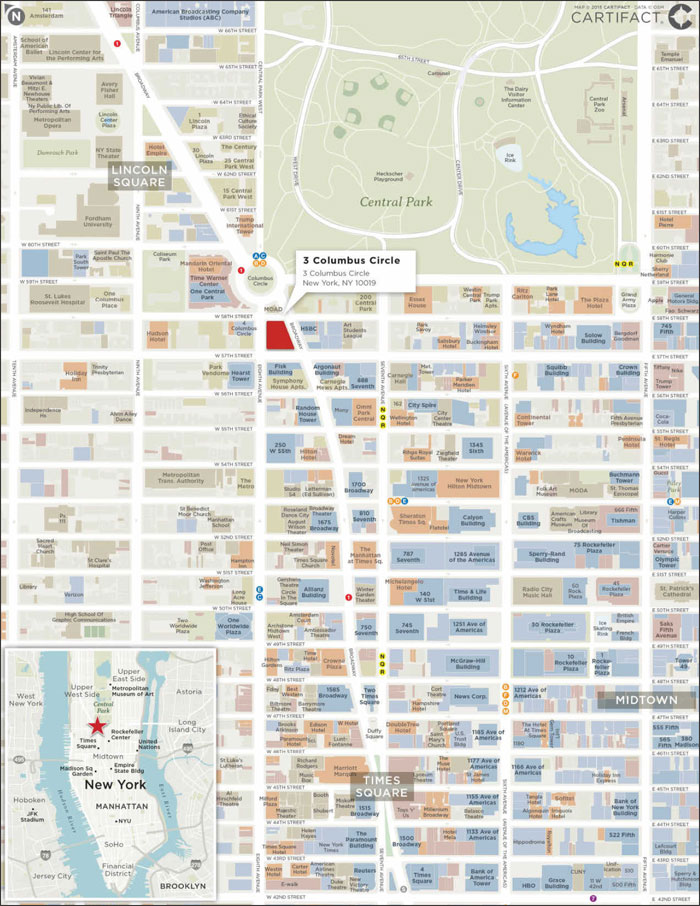
THE INFORMATION IN THIS STRUCTURAL AND COLLATERAL TERM SHEET IS NOT COMPLETE AND MAY BE AMENDED PRIOR TO THE TIME OF SALE. THIS TERM SHEET IS NOT AN OFFER TO SELL THESE SECURITIES AND IT IS NOT A SOLICITATION OF AN OFFER TO BUY THESE SECURITIES IN ANY JURISDICTION WHERE THE OFFER OR SALE IS NOT PERMITTED.
49
777 Post Oak Boulevard Houston, TX 77056 | Collateral Asset Summary – Loan No. 9 One Riverway | Cut-off Date Balance: Cut-off Date LTV: U/W NCF DSCR: U/W NOI Debt Yield: | $80,000,000 64.5% 1.67x 10.1% |
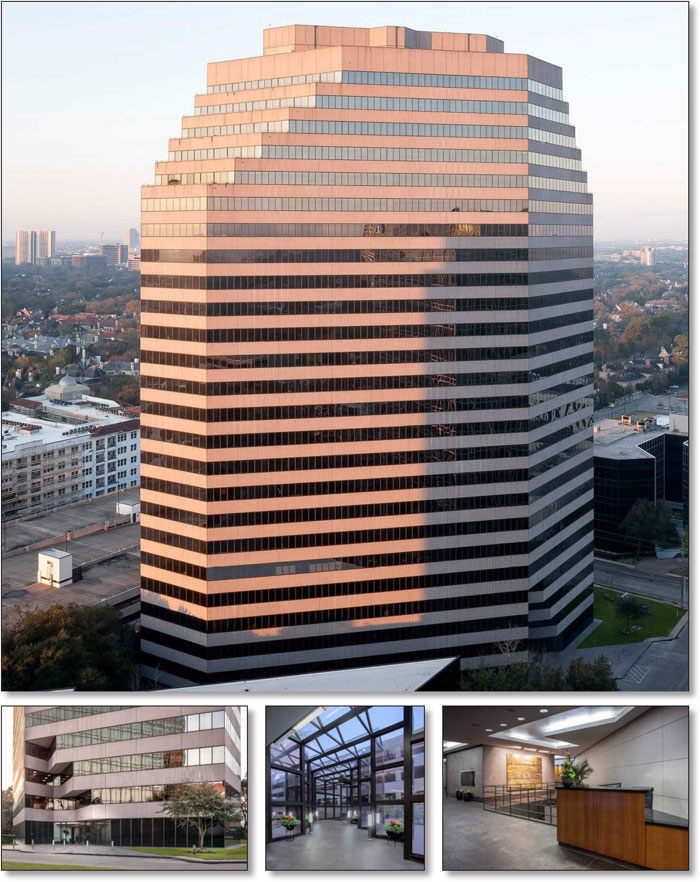
THE INFORMATION IN THIS STRUCTURAL AND COLLATERAL TERM SHEET IS NOT COMPLETE AND MAY BE AMENDED PRIOR TO THE TIME OF SALE. THIS TERM SHEET IS NOT AN OFFER TO SELL THESE SECURITIES AND IT IS NOT A SOLICITATION OF AN OFFER TO BUY THESE SECURITIES IN ANY JURISDICTION WHERE THE OFFER OR SALE IS NOT PERMITTED.
50
777 Post Oak Boulevard Houston, TX 77056 | Collateral Asset Summary – Loan No. 9 One Riverway | Cut-off Date Balance: Cut-off Date LTV: U/W NCF DSCR: U/W NOI Debt Yield: | $80,000,000 64.5% 1.67x 10.1% |
| Mortgage Loan Information | |
| Loan Seller: | GACC |
| Loan Purpose: | Refinance |
| Sponsor: | Dan Levy; Raymond Levy; Goldrich Trust #1; Azrieli Group Ltd. |
| Borrower: | Overland Riverway, L.P.; Riverway Holdings, L.P.; South Post Oak Holdings, L.P. |
| Original Balance: | $80,000,000 |
| Cut-off Date Balance: | $80,000,000 |
| % by Initial UPB: | 6.2% |
| Interest Rate: | 3.6600% |
| Payment Date: | 6th of each month |
| First Payment Date: | April 6, 2015 |
| Maturity Date: | March 6, 2025 |
| Amortization: | Interest only for first 36 months; 360 months thereafter |
| Additional Debt: | None |
| Call Protection: | L(24), D(92), O(4) |
| Lockbox / Cash Management: | Hard / Springing |
Reserves(1) | ||
| Initial | Monthly | |
| Taxes: | $397,936 | $198,968 |
| Insurance: | $0 | Springing |
| Replacement: | $0 | $8,863 |
| TI/LC: | $426,165 | $56,398 |
| Free Rent: | $15,305 | $0 |
| Financial Information | |
| Cut-off Date Balance / Sq. Ft.: | $165 |
| Balloon Balance / Sq. Ft.: | $142 |
| Cut-off Date LTV: | 64.5% |
| Balloon LTV: | 55.3% |
Underwritten NOI DSCR(2): | 1.84x |
Underwritten NCF DSCR(2): | 1.67x |
| Underwritten NOI Debt Yield: | 10.1% |
| Underwritten NCF Debt Yield: | 9.2% |
| Underwritten NOI Debt Yield at Balloon: | 11.8% |
| Underwritten NCF Debt Yield at Balloon: | 10.7% |
| Property Information | |
| Single Asset / Portfolio: | Single Asset |
| Property Type: | Suburban Office |
| Collateral: | Fee Simple |
| Location: | Houston, TX |
| Year Built / Renovated: | 1978 / 2009 |
| Total Sq. Ft.: | 483,410 |
| Property Management: | Unilev Management Corp. |
| Underwritten NOI: | $8,095,804 |
| Underwritten NCF: | $7,354,797 |
| Appraised Value: | $124,000,000 |
| Appraisal Date: | January 13, 2015 |
| Historical NOI | |
Most Recent NOI(3): | $7,025,742 (T-12 November 30, 2014) |
2013 NOI(3): | $4,662,250 (December 31, 2013) |
| 2012 NOI: | $5,461,489 (December 31, 2012) |
| 2011 NOI: | NAV |
| Historical Occupancy | |
| Most Recent Occupancy: | 88.6% (February 1, 2015) |
| 2013 Occupancy: | 80.0% (December 31, 2013) |
| 2012 Occupancy: | 83.0% (December 31, 2012) |
| 2011 Occupancy: | 88.7% (December 31, 2011) |
| (1) | See “Initial Reserves” and “Ongoing Reserves” herein. |
| (2) | Based on amortizing payments. Based on the current interest only debt service payments, the Underwritten NOI DSCR and Underwritten NCF DSCR are 2.73x and 2.48x, respectively. |
| (3) | The increase from 2013 NOI to most recent NOI reflects the sponsor’s leasing the One Riverway Property back up to historical levels. Additionally, the market has transitioned from a gross expense basis to a NNN expense basis over approximately the last five years. |
THE INFORMATION IN THIS STRUCTURAL AND COLLATERAL TERM SHEET IS NOT COMPLETE AND MAY BE AMENDED PRIOR TO THE TIME OF SALE. THIS TERM SHEET IS NOT AN OFFER TO SELL THESE SECURITIES AND IT IS NOT A SOLICITATION OF AN OFFER TO BUY THESE SECURITIES IN ANY JURISDICTION WHERE THE OFFER OR SALE IS NOT PERMITTED.
51
777 Post Oak Boulevard Houston, TX 77056 | Collateral Asset Summary – Loan No. 9 One Riverway | Cut-off Date Balance: Cut-off Date LTV: U/W NCF DSCR: U/W NOI Debt Yield: | $80,000,000 64.5% 1.67x 10.1% |
| Tenant Summary | ||||||||
Tenant | Ratings (Fitch/Moody’s/S&P)(1) | Net Rentable Area (Sq. Ft.) | % of Net Rentable Area | U/W Base Rent PSF | % of Total U/W Base Rent | Lease Expiration | ||
Texas Capital Bank(2) | NR/Baa2/BBB | 46,444 | 9.6% | $16.55 | 10.0% | 12/31/2020 | ||
Texas Financial Group(3) | AAA/Aaa/AA+ | 39,790 | 8.2% | $17.48 | 9.0% | 12/31/2024 | ||
Doeren Mayhew(4) | NR/NR/NR | 30,468 | 6.3% | $15.46 | 6.1% | 2/28/2022 | ||
Thompson Coe Cousins(5) | NR/NR/NR | 27,708 | 5.7% | $18.50 | 6.6% | 1/31/2024 | ||
Harper & Pearson Co.(6) | NR/NR/NR | 21,170 | 4.4% | $18.11 | 5.0% | 8/31/2023 | ||
| Total Major Tenants | 165,580 | 34.3% | $17.10 | 36.7% | ||||
| Non-Major Tenants | 262,718 | 54.3% | $18.58 | 63.3% | ||||
| Total Occupied Collateral | 428,298 | 88.6% | $18.00 | 100.0% | ||||
| Vacant | 55,112 | 11.4% | ||||||
| Total | 483,410 | 100.0% | ||||||
| (1) | Certain ratings are those of the parent company whether or not the parent company guarantees the lease. |
| (2) | The Texas Capital Bank lease contains two, five-year extension options with nine months’ prior notice at fair market rent. Texas Capital Bank has a one-time right to terminate its lease on May 1, 2019, 20 months before its lease expiration date, with payment of termination fees of approximately $1.2 million. |
| (3) | The Texas Financial Group lease contains one, five-year extension option with six months’ prior notice at fair market rent. Texas Financial Group does not have any early termination options. |
| (4) | The Doeren Mayhew lease contains two, five-year extension options with nine months’ prior notice at fair market rent. Doeren Mayhew does not have any early termination options. |
| (5) | The Thompson Coe Cousins lease contains one, five-year extension option with six months’ prior notice at fair market rent. Thompson Coe Cousins has a one-time right to terminate its lease on February 21, 2021, with payment of termination fees of approximately $640,000. |
| (6) | The Harper & Pearson Co. lease contains two, five-year extension options with nine months’ prior notice at fair market rent. Harper & Pearson Co. does not have any early termination options. |
Lease Rollover Schedule(1) | ||||||||
| Year | # of Leases Expiring | Total Expiring Sq. Ft. | % of Total Sq. Ft. Expiring | Cumulative Sq. Ft. Expiring | Cumulative % of Sq. Ft. Expiring | Annual U/W Base Rent PSF | % U/W Base Rent Rolling | Cumulative % of U/W Base Rent |
| MTM | 0 | 0 | 0.0% | 0 | 0.0% | $0.00 | 0.0% | 0.0% |
| 2015 | 2 | 39,868 | 8.2% | 39,868 | 8.2% | $18.53 | 9.6% | 9.6% |
| 2016 | 8 | 30,682 | 6.3% | 70,550 | 14.6% | $16.87 | 6.7% | 16.3% |
| 2017 | 13 | 52,820 | 10.9% | 123,370 | 25.5% | $17.68 | 12.1% | 28.4% |
| 2018 | 13 | 80,473 | 16.6% | 203,843 | 42.2% | $18.70 | 19.5% | 47.9% |
| 2019 | 8 | 26,860 | 5.6% | 230,703 | 47.7% | $20.13 | 7.0% | 54.9% |
| 2020 | 7 | 59,512 | 12.3% | 290,215 | 60.0% | $17.61 | 13.6% | 68.5% |
| 2021 | 1 | 18,947 | 3.9% | 309,162 | 64.0% | $19.25 | 4.7% | 73.3% |
| 2022 | 4 | 30,468 | 6.3% | 339,630 | 70.3% | $15.46 | 6.1% | 79.4% |
| 2023 | 3 | 21,170 | 4.4% | 360,800 | 74.6% | $18.11 | 5.0% | 84.3% |
| 2024 | 6 | 67,498 | 14.0% | 428,298 | 88.6% | $17.90 | 15.7% | 100.0% |
| 2025 | 0 | 0 | 0.0% | 428,298 | 88.6% | $0.00 | 0.0% | 100.0% |
| Thereafter | 0 | 0 | 0.0% | 428,298 | 88.6% | $0.00 | 0.0% | 100.0% |
| Vacant | NAP | 55,112 | 11.4% | 483,410 | 100.0% | NAP | NAP | |
| Total / Wtd. Avg. | 65 | 483,410 | 100.0% | $18.00 | 100.0% | |||
| (1) | Certain tenants have lease termination options that may become exercisable prior to the originally stated expiration date of the tenant lease and that are not considered in the lease rollover schedule. |
The Loan. The One Riverway loan (the “One Riverway Loan”) is an $80.0 million fixed rate loan secured by the borrowers’ fee simple interest in a 483,410 sq. ft., Class A office property located at 777 Post Oak Boulevard in Houston, Texas (the “One Riverway Property”). The One Riverway Loan has a 10-year term and is interest only for the first 36 months of the term and amortizes on a 30-year schedule thereafter. The One Riverway Loan accrues interest at a fixed rate equal to 3.6600%. Loan proceeds were used to retire existing debt of approximately $50.4 million, fund upfront reserves of approximately $0.8 million, pay closing costs of approximately $0.7 million and return equity of approximately $28.1 million to the borrowers. Based on the appraised value of $124.0 million as of January 13, 2015, the cut-off date LTV ratio is 64.5%. The most recent prior financing of the One Riverway Property was included in the GMACC 2005-C1 securitization.
THE INFORMATION IN THIS STRUCTURAL AND COLLATERAL TERM SHEET IS NOT COMPLETE AND MAY BE AMENDED PRIOR TO THE TIME OF SALE. THIS TERM SHEET IS NOT AN OFFER TO SELL THESE SECURITIES AND IT IS NOT A SOLICITATION OF AN OFFER TO BUY THESE SECURITIES IN ANY JURISDICTION WHERE THE OFFER OR SALE IS NOT PERMITTED.
52
777 Post Oak Boulevard Houston, TX 77056 | Collateral Asset Summary – Loan No. 9 One Riverway | Cut-off Date Balance: Cut-off Date LTV: U/W NCF DSCR: U/W NOI Debt Yield: | $80,000,000 64.5% 1.67x 10.1% |
| Sources and Uses | ||||||
| Sources | Proceeds | % of Total | Uses | Proceeds | % of Total | |
| Loan Amount | $80,000,000 | 100.0% | Loan Payoff | $50,351,943 | 62.9% | |
| Reserves | $839,406 | 1.0% | ||||
| Closing Costs | $722,763 | 0.9% | ||||
| Return of Equity | $28,085,888 | 35.1% | ||||
| Total Sources | $80,000,000 | 100.0% | Total Uses | $80,000,000 | 100.0% | |
The Borrowers / Sponsors. The borrowers are Overland Riverway, L.P., Riverway Holdings, L.P. and South Post Oak Holdings, L.P. as tenants-in-common, on a joint and several basis. The sponsors of the borrowers and the non-recourse carve out guarantors are Dan Levy, Raymond Levy, Goldrich Trust #1 and Azrieli Group Ltd., on a joint and several basis. Each borrower is a single purpose Texas limited partnership structured to be bankruptcy-remote, with two independent directors in its organizational structure.
Dan Levy and Raymond Levy are both principals at Unilev Capital Corporation, a privately held real estate investment company that invests with a select, limited group of private and institutional partners to acquire well-located, income-producing commercial properties. Founded in 1992, Unilev Capital Corporation is headquartered in Beverly Hills, California with affiliated offices in Texas, Colorado, Minnesota, Nevada, and New York. Goldrich & Kest was established in 1957 by Jona Goldrich. Goldrich & Kest’s portfolio consists of over 211 properties including over 12,000 apartment units, 26 congregate care facilities and 64 commercial, office and industrial properties containing over 11.4 million sq. ft. The majority of their real estate portfolio is located throughout California. The Azrieli Group is the largest commercial real estate company in Israel in terms of gross leasable area, net operating income, book value of real estate assets, funds from operations and market capitalization. The company also holds approximately 544,600 sq. ft. of assets within the United States with most of their investments concentrated in Houston, Texas.
The Property. The One Riverway Property consists of a 25-story, Class A office building totaling 483,410 sq. ft., located in the 28-acre master planned Riverway Office Park in Houston, Texas. The Riverway Office Park features three Class A office towers, a full service bank, a luxury high-rise apartment building and the 4-diamond Omni Hotel. The One Riverway Property was constructed in 1978 and includes a covered parking garage with 1830 parking spaces, which equates to a parking ratio of approximately 3.79 spaces per 1,000 sq. ft. The One Riverway Property features a variety of amenities including a conference and training facility, 24 hour security guard service, key-card access, professional on-site management, a full service bank, car wash services and two dining facilities, the Riverway Coffee Bar and the Garden Café at Riverway. The One Riverway Property has undergone approximately $5.3 million ($10.94 PSF) in capital improvements from 2005 to 2014. The capital improvements included upgrades to the corridors, restrooms and the addition of a fitness center and a coffee bar. In 2009, approximately $2.1 million was spent to renovate the first floor, the conference rooms and the café.
As of February 1, 2015, the One Riverway Property is 88.6% leased to a variety of tenants in financial services, real estate, energy and biotech industries with no tenant occupying greater than 9.6% of the net rentable area. Approximately 28.5% of the net rentable area is occupied by investment grade tenants. Since 2012, twenty tenants totaling 169,967 sq. ft. have renewed at expiration while nine tenants totaling 30,008 sq. ft. have expanded.
Environmental Matters. The Phase I environmental report dated January 23, 2015 recommended no further action at the One Riverway Property.
Major Tenants.
Texas Capital Bank (46,444 sq. ft., 9.6% of NRA, 10.0% of U/W Base Rent). Texas Capital Bank is a commercial bank that delivers financial services to businesses and entrepreneurs. Texas Capital Bank is a wholly owned subsidiary of Texas Capital Bancshares, Inc. (NASDAQ: TCBI) and is recognized as a Forbes Best Banks in America and in The Dallas Morning News’ Top 100 Places to Work. Texas Capital Bank took occupancy in 2003 and has expanded six times since their initial start date, most recently expanding by 19,815 sq. ft. in 2014. Texas Capital Bank has two, five-year extension options, with nine months’ prior notice at fair market rent and has a one-time right to terminate its lease on May 1, 2019, 20 months before its lease expiration date, with payment of termination fees of approximately $1.2 million.
Texas Financial Group (39,790 sq. ft., 8.2% of NRA, 9.0% of U/W Base Rent). Texas Financial Group is a Northwestern Mutual branch office offering insurance, investment products and services and retirement planning. Texas Financial Group has been a tenant at the property since December 2004 and recently signed an extension option through December 2024. Texas Financial Group has one, five-year extension option, with six months’ prior notice at fair market rent. Texas Financial Group does not have any early termination options.
Doeren Mayhew (30,468 sq. ft., 6.3% of NRA, 6.1% of U/W Base Rent). Doeren Mayhew is a CPA and advisory firm that was founded in 1932 and is now a top 100 firm recognized globally among INSIDE Public Accounting’s “Best of the Best”. Doeren Mayhew offers a full range of accounting, audit and advisory services to a variety of domestic and international clients and employs nearly 250 employees across offices in Michigan, Texas and Florida. Doeren Mayhew has been a tenant at the property since 2011 and has two,
THE INFORMATION IN THIS STRUCTURAL AND COLLATERAL TERM SHEET IS NOT COMPLETE AND MAY BE AMENDED PRIOR TO THE TIME OF SALE. THIS TERM SHEET IS NOT AN OFFER TO SELL THESE SECURITIES AND IT IS NOT A SOLICITATION OF AN OFFER TO BUY THESE SECURITIES IN ANY JURISDICTION WHERE THE OFFER OR SALE IS NOT PERMITTED.
53
777 Post Oak Boulevard Houston, TX 77056 | Collateral Asset Summary – Loan No. 9 One Riverway | Cut-off Date Balance: Cut-off Date LTV: U/W NCF DSCR: U/W NOI Debt Yield: | $80,000,000 64.5% 1.67x 10.1% |
five-year extension options with nine months’ prior notice at fair market rent. Doeren Mayhew does not have any early termination options.
The Market. The One Riverway Property is located in the West Loop submarket, within the Houston-Sugar Land-Baytown metropolitan statistical area (“Houston MSA”). The property is located in the western portion of the city within a suburban area that is bordered by Interstate 10 to the north; US-59 to the south; Kirby Drive to the east; and South Voss Road to the west. Primary access to the property’s neighborhood is provided by Interstate 10, US Highway 59 and Loop 610. The One Riverway Property is located approximately 8 miles from the Houston CBD and approximately 24 miles from the George Bush International Airport.
The Westloop submarket consists of Uptown Houston and Galleria area, which contains a mixture of office, retail, residential and hotel properties located along the West Loop from Richmond Avenue north to Buffalo Bayou and west to Yorktown. Located less than two miles south of the One Riverway Property is theGalleria mall, which is the largest mall in Texas and fourth largest nationally. Spanning approximately 2.4 million sq. ft. of space and housing over 400 stores and 34 restaurants, theGalleria mall hosts more than 26 million visitors each year.
Uptown Houston also provides more than 32 million sq. ft. of commercial office space, representing approximately 16% of Houston’s total Class A office space. Uptown Houston is the 15th largest business center in the U.S. and compares in size to the downtowns of Seattle and Denver. Uptown Houston is home to approximately 2,000 companies, ranging from small- to large-sized commercial businesses, representing a variety of diverse industries. In 2014, the Houston MSA was the best performing metropolitan area in Texas as total employment expanded at twice the national average with all industries participating in the gains while exhibiting an unemployment rate of 5.2%. The One Riverway Property’s submarket also benefits from an above-average income demographic with the surrounding area within a one, three and five mile radius reporting a 2014 average household income of $156,164, $112,629 and $99,801, respectively.
The vacancy rate in the Houston office market area decreased to 10.8% at the end of Q4 2014, representing a 3.6% decline from the previous quarter, while Class A office buildings reported a vacancy rate of 9.5% at the end of the Q4 2014, representing a 3.1% decline from the previous quarter. Asking rents for all available office space averaged $27.24 PSF as of Q4 2014, an approximately 0.3% PSF increase over Q3 2014 asking rents. The asking rent for Class A office space was $34.51 PSF at the end of Q4 2014, remaining almost unchanged from Q3 2014. Asking rents in Houston CBD and suburban areas were $38.27 PSF and $25.43 PSF, respectively, at the end of Q4 2014. The West Loop office submarket accounts for approximately 8.4% of the total office inventory in the Houston MSA. As of Q4 2014, West Loop office submarket vacancy was 10.0% with asking rent of $32.93 PSF. The appraisal considered the One Riverway Property’s submarket an upper tier submarket as compared to the other submarkets in the overall market area.
The appraisal identified 864,826 sq. ft. of office space under construction in the West Loop submarket, which is currently 73.6% preleased; however, the appraisal noted that it does not find new construction directly competitive with the One Riverway Property due to rent sensitivity among the tenant base. The comparable rental rates range from $21.50 PSF to $26.50 PSF with a weighted average rental rate of $24.06 PSF. Moreover, the appraisal noted that Class A office space within the submarket has transitioned from a gross expense basis to a NNN expense basis over recent years. The chart below summarizes the comparable set as determined by the appraisal:
Summary of Comparable Office Rentals(1) | |||||
| Name | One Riverway Property | 777 Post Oak | Two Riverway | 5151 San Felipe | Three Riverway |
| Distance from subject (miles) | NAP | 1.0 | 0.3 | 0.8 | 0.1 |
| Building Sq. Ft. | 483,410 | 176,776 | 363,888 | 520,423 | 398,413 |
| Year Built | 1978 | 1973 | 1981 | 1982 | 1980 |
| Occupancy | 88.6% | 100.0% | 94.0% | 99.0% | 93.0% |
| Rent PSF | $18.00(2) | $24.50 | $21.50 | $26.50 | $23.00 |
| Expense Basis | NNN | NNN | NNN | NNN | NNN |
| (1) | Source: Appraisal. |
| (2) | Rent PSF for the One Riverway Property represents the average rent for tenants paying rent per the February 1, 2015 rent roll. |
THE INFORMATION IN THIS STRUCTURAL AND COLLATERAL TERM SHEET IS NOT COMPLETE AND MAY BE AMENDED PRIOR TO THE TIME OF SALE. THIS TERM SHEET IS NOT AN OFFER TO SELL THESE SECURITIES AND IT IS NOT A SOLICITATION OF AN OFFER TO BUY THESE SECURITIES IN ANY JURISDICTION WHERE THE OFFER OR SALE IS NOT PERMITTED.
54
777 Post Oak Boulevard Houston, TX 77056 | Collateral Asset Summary – Loan No. 9 One Riverway | Cut-off Date Balance: Cut-off Date LTV: U/W NCF DSCR: U/W NOI Debt Yield: | $80,000,000 64.5% 1.67x 10.1% |
Cash Flow Analysis.
| Cash Flow Analysis | ||||||
| 2012 | 2013 | T-12 11/30/2014 | U/W | U/W PSF | ||
Base Rent(1) | $6,955,810 | $6,035,029 | $7,339,743 | $7,987,522 | $16.52 | |
| Value of Vacant Space | 0 | 0 | 0 | 1,873,808 | 3.88 | |
| Gross Potential Rent | $6,955,810 | $6,035,029 | $7,339,743 | $9,861,330 | $20.40 | |
| Total Recoveries | 3,205,875 | 3,857,825 | 5,283,534 | 6,188,442 | 12.80 | |
| Total Other Income | 740,432 | 757,275 | 763,302 | 868,968 | 1.80 | |
Less: Vacancy & Credit Loss(2) | 0 | (62,213) | (103,000) | (1,873,808) | (3.88) | |
| Effective Gross Income | $10,902,117 | $10,587,915 | $13,283,579 | $15,044,932 | $31.12 | |
| Total Operating Expenses | 5,440,629 | 5,925,666 | 6,257,837 | 6,949,128 | 14.38 | |
| Net Operating Income | $5,461,489 | $4,662,250 | $7,025,742 | $8,095,804 | $16.75 | |
| TI/LC | 0 | 0 | 0 | 634,657 | 1.31 | |
| Capital Expenditures | 0 | 0 | 0 | 106,350 | 0.22 | |
| Net Cash Flow | $5,461,489 | $4,662,250 | $7,025,742 | $7,354,797 | $15.21 | |
| (1) | U/W Base Rent includes $276,064 in base rent steps through May 2016. |
| (2) | U/W Vacancy represents 11.1% of gross income. The physical vacancy as of February 1, 2015 is 11.4%. |
Property Management. The One Riverway Property is managed by Unilev Management Corp., a borrower affiliate.
Lockbox / Cash Management. The One Riverway Loan is structured with a hard lockbox and springing cash management. The borrowers are required to direct all tenants to deposit all rents and other payments into the lockbox account controlled by the lender. Provided no Trigger Period (as defined below) exists, all funds in the lockbox account are swept daily to the borrowers operating account. Upon the occurrence and during the continuance of a Trigger Period, amounts on deposit in the clearing account will be swept to a cash management account established and maintained by the lender, and applied to payment of all required payments and reserves as set forth in the One Riverway Loan documents.
A “Trigger Period” will commence (i) upon an event of default or (ii) if the debt service coverage ratio falls below 1.15x as of the last day of any calendar quarter, until such time as (a) with respect to clause (i), the event of default has been cured, and (b) with respect to clause (ii), the debt service coverage ratio is at least 1.15x as of the end of any calendar quarter.
Initial Reserves. At closing, the borrowers deposited (i) $397,936 into a tax reserve account, (ii) $426,165 into the TI/LC reserve account for approved existing leasing expenses and (iii) $15,305 into a free rent reserve account.
Ongoing Reserves. On a monthly basis, the borrowers are required to deposit reserves of (i) 1/12 of the estimated annual real estate taxes, which currently equates to $198,968, into a tax reserve account, (ii) $8,863 into a replacement reserve account, subject to a cap of $425,401 and (iii) $56,398 into a TI/LC reserve account, subject to a cap of $2,707,096. In addition, 1/12 of the annual insurance premium will be required to be deposited into an insurance reserve account if an acceptable blanket insurance policy is no longer in place.
Current Mezzanine or Subordinate Indebtedness. None.
Future Mezzanine or Subordinate Indebtedness Permitted. None.
THE INFORMATION IN THIS STRUCTURAL AND COLLATERAL TERM SHEET IS NOT COMPLETE AND MAY BE AMENDED PRIOR TO THE TIME OF SALE. THIS TERM SHEET IS NOT AN OFFER TO SELL THESE SECURITIES AND IT IS NOT A SOLICITATION OF AN OFFER TO BUY THESE SECURITIES IN ANY JURISDICTION WHERE THE OFFER OR SALE IS NOT PERMITTED.
55
777 Post Oak Boulevard Houston, TX 77056 | Collateral Asset Summary – Loan No. 9 One Riverway | Cut-off Date Balance: Cut-off Date LTV: U/W NCF DSCR: U/W NOI Debt Yield: | $80,000,000 64.5% 1.67x 10.1% |
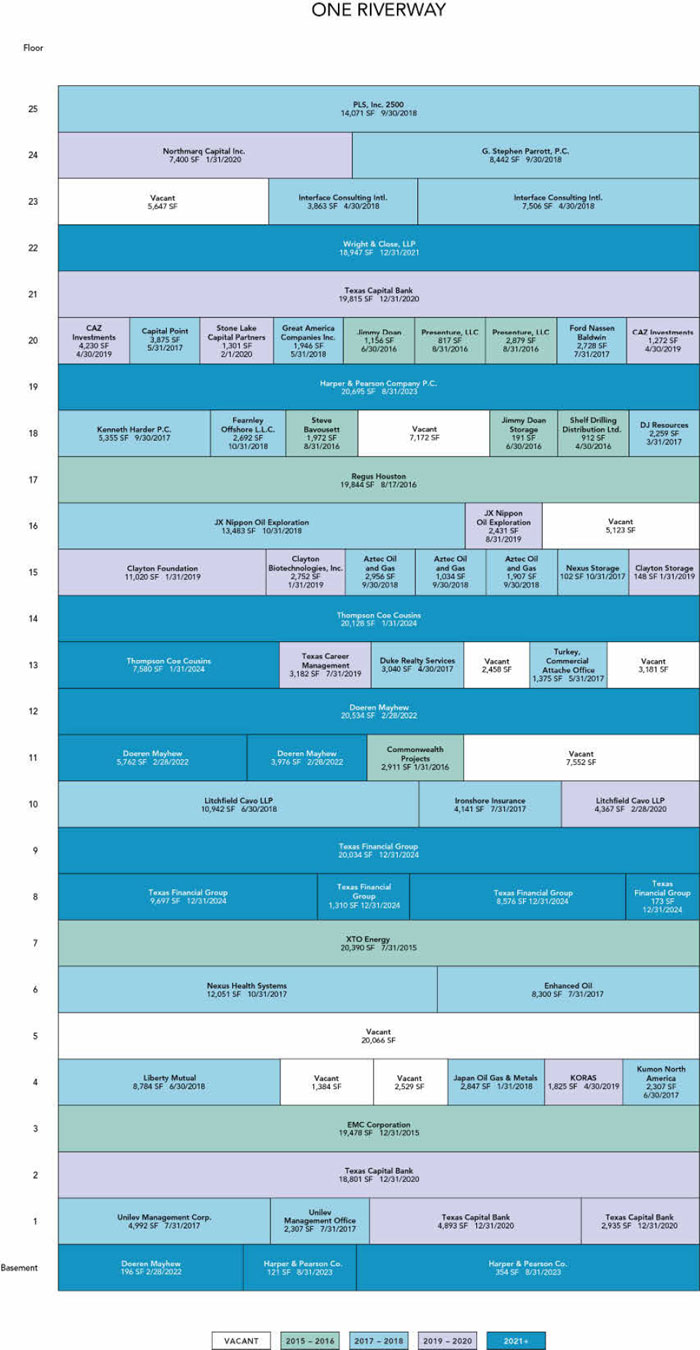
THE INFORMATION IN THIS STRUCTURAL AND COLLATERAL TERM SHEET IS NOT COMPLETE AND MAY BE AMENDED PRIOR TO THE TIME OF SALE. THIS TERM SHEET IS NOT AN OFFER TO SELL THESE SECURITIES AND IT IS NOT A SOLICITATION OF AN OFFER TO BUY THESE SECURITIES IN ANY JURISDICTION WHERE THE OFFER OR SALE IS NOT PERMITTED.
56
777 Post Oak Boulevard Houston, TX 77056 | Collateral Asset Summary – Loan No. 9 One Riverway | Cut-off Date Balance: Cut-off Date LTV: U/W NCF DSCR: U/W NOI Debt Yield: | $80,000,000 64.5% 1.67x 10.1% |
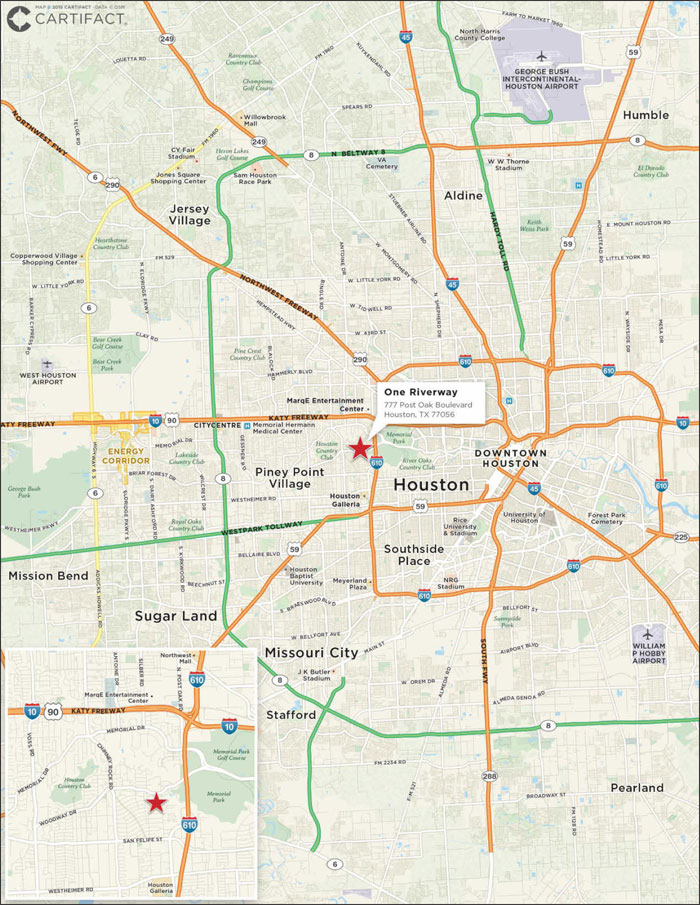
THE INFORMATION IN THIS STRUCTURAL AND COLLATERAL TERM SHEET IS NOT COMPLETE AND MAY BE AMENDED PRIOR TO THE TIME OF SALE. THIS TERM SHEET IS NOT AN OFFER TO SELL THESE SECURITIES AND IT IS NOT A SOLICITATION OF AN OFFER TO BUY THESE SECURITIES IN ANY JURISDICTION WHERE THE OFFER OR SALE IS NOT PERMITTED.
57
2500 North Hollywood Way Burbank, CA 91505 | Collateral Asset Summary – Loan No. 10 Marriott Burbank | Cut-off Date Balance: Cut-off Date LTV: U/W NCF DSCR: U/W NOI Debt Yield: | $70,000,000 60.3% 1.98x 13.0% |
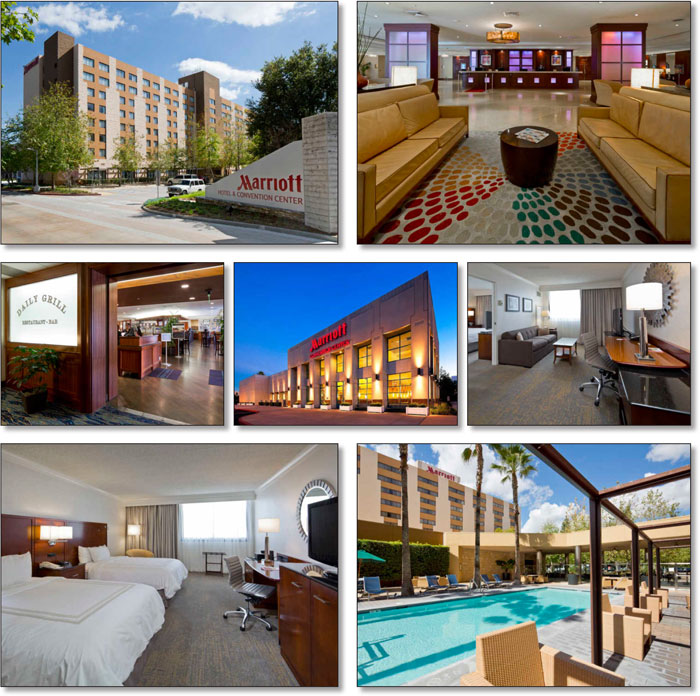
THE INFORMATION IN THIS STRUCTURAL AND COLLATERAL TERM SHEET IS NOT COMPLETE AND MAY BE AMENDED PRIOR TO THE TIME OF SALE. THIS TERM SHEET IS NOT AN OFFER TO SELL THESE SECURITIES AND IT IS NOT A SOLICITATION OF AN OFFER TO BUY THESE SECURITIES IN ANY JURISDICTION WHERE THE OFFER OR SALE IS NOT PERMITTED.
58
2500 North Hollywood Way Burbank, CA 91505 | Collateral Asset Summary – Loan No. 10 Marriott Burbank | Cut-off Date Balance: Cut-off Date LTV: U/W NCF DSCR: U/W NOI Debt Yield: | $70,000,000 60.3% 1.98x 13.0% |
| Mortgage Loan Information | |
| Loan Seller: | GACC |
| Loan Purpose: | Acquisition |
| Sponsor: | Chad Cooley; Russell Flicker; Jonathan Rosenfeld; Bernard Michael |
| Borrower: | AWH Burbank Hotel, LLC |
| Original Balance: | $70,000,000 |
| Cut-off Date Balance: | $70,000,000 |
| % by Initial UPB: | 5.4% |
| Interest Rate: | 4.25428% |
| Payment Date: | 6th of each month |
| First Payment Date: | February 6, 2015 |
| Maturity Date: | January 6, 2020 |
| Amortization: | Interest only for first 36 months; 360 months thereafter |
Additional Debt(1): | $20,000,000 Mezzanine Debt |
| Call Protection: | L(26), D(31), O(3) |
| Lockbox / Cash Management: | Hard / In Place |
Reserves(2) | ||
| Initial | Monthly | |
| Taxes: | $300,616 | $103,257 |
| Insurance: | $0 | Springing |
FF&E(3): | $0 | At least 4% of second preceding month’s gross revenues |
| Required Repairs: | $133,500 | NAP |
PIP(4): | $1,750,000 | Excess Cash Flow |
| SIA Repairs: | $106,250 | $0 |
| Financial Information | ||
| Mortgage Loan | Total Debt | |
| Cut-off Date Balance / Room: | $143,443 | $184,426 |
| Balloon Balance / Room: | $139,784 | $179,723 |
| Cut-off Date LTV: | 60.3% | 77.5% |
| Balloon LTV: | 58.8% | 75.5% |
Underwritten NOI DSCR(5): | 2.36x | 1.47x |
Underwritten NCF DSCR(5): | 1.98x | 1.23x |
| Underwritten NOI Debt Yield: | 13.0% | 10.1% |
| Underwritten NCF Debt Yield: | 10.9% | 8.5% |
| Underwritten NOI Debt Yield at Balloon: | 13.4% | 10.4% |
| Underwritten NCF Debt Yield at Balloon: | 11.2% | 8.7% |
| Property Information | |
| Single Asset / Portfolio: | Single Asset |
| Property Type: | Full Service Hospitality |
| Collateral: | Fee Simple |
| Location: | Burbank, CA |
| Year Built / Renovated: | 1982 / 2007, 2013-2015 |
| Total Rooms: | 488 |
| Property Management: | Spire Hospitality, LLC |
| Underwritten NOI: | $9,125,110 |
| Underwritten NCF: | $7,664,068 |
| Appraised Value: | $116,100,000 |
| Appraisal Date: | November 6, 2014 |
| Historical NOI | |
| Most Recent NOI: | $7,318,820 (T-12 January 31, 2015) |
| 2014 NOI: | $7,628,114 (December 31, 2014) |
| 2013 NOI: | $7,648,287 (December 31, 2013) |
| 2012 NOI: | $7,635,854 (December 31, 2012) |
| Historical Occupancy | |
| Most Recent Occupancy: | 75.7% (January 31, 2015) |
| 2014 Occupancy: | 76.9% (December 31, 2014) |
| 2013 Occupancy: | 82.1% (December 31, 2013) |
| 2012 Occupancy: | 79.7% (December 31, 2012) |
| (1) | See “Current Mezzanine or Subordinate Indebtedness” herein. |
| (2) | See “Initial Reserves” and “Ongoing Reserves” herein. |
| (3) | The borrower is required to deposit the greater of (i) until 12/11/2016, 4.0% of the property rent for the second preceding month and on 12/11/2016 and thereafter, 5% of the property rent for the second preceding month and (ii) any amount required under the management agreement or franchise agreement for FF&E work. |
| (4) | All excess cash flow will be swept into the PIP reserve until an additional $1,750,000 (for a total PIP reserve of $3,500,000) is reserved. |
| (5) | Based on amortizing debt service payments. Based on the current interest only payments, Underwritten NOI DSCR and Underwritten NCF DSCR are 3.02x and 2.54x, respectively for the mortgage loan and 1.78x and 1.49x, respectively for the total debt. |
THE INFORMATION IN THIS STRUCTURAL AND COLLATERAL TERM SHEET IS NOT COMPLETE AND MAY BE AMENDED PRIOR TO THE TIME OF SALE. THIS TERM SHEET IS NOT AN OFFER TO SELL THESE SECURITIES AND IT IS NOT A SOLICITATION OF AN OFFER TO BUY THESE SECURITIES IN ANY JURISDICTION WHERE THE OFFER OR SALE IS NOT PERMITTED.
59
2500 North Hollywood Way Burbank, CA 91505 | Collateral Asset Summary – Loan No. 10 Marriott Burbank | Cut-off Date Balance: Cut-off Date LTV: U/W NCF DSCR: U/W NOI Debt Yield: | $70,000,000 60.3% 1.98x 13.0% |
Historical Occupancy, ADR, RevPAR(1) | |||||||||
| Marriott Burbank Property | Competitive Set | Penetration Factor | |||||||
| Year | Occupancy | ADR | RevPAR | Occupancy | ADR | RevPAR | Occupancy | ADR | RevPAR |
| 2011 | 78.2% | $131.61 | $102.92 | 80.0% | $152.13 | $121.69 | 97.8% | 86.5% | 84.6% |
| 2012 | 79.7% | $135.11 | $107.74 | 81.6% | $158.57 | $129.36 | 97.8% | 85.2% | 83.3% |
| 2013 | 82.1% | $140.10 | $115.03 | 80.5% | $165.28 | $132.98 | 102.0% | 84.8% | 86.5% |
| 2014 | 76.9% | $156.23 | $138.33 | 80.3% | $169.30 | $135.99 | 110.2% | 92.3% | 101.7% |
| T-12 Jan 2015 | 75.7% | $155.06 | $117.37 | 79.9% | $174.89 | $139.68 | 94.8% | 88.7% | 84.0% |
| (1) | Source: Hospitality research report. |
The Loan. The Marriott Burbank loan (the “Marriott Burbank Loan”) is a $70.0 million fixed rate loan secured by the borrower’s fee simple interest in a 488-room full service hotel located at 2500 North Hollywood Way in Burbank, California (the “Marriott Burbank Property”). The Marriott Burbank Loan has a five-year term and is interest only for the first three years of the term and amortizes on a 30-year schedule thereafter. The Marriott Burbank Loan accrues interest at a fixed rate equal to 4.25428%. Loan proceeds, along with approximately $31.6 million in sponsor equity, were used to acquire the Marriott Burbank Property for $116.0 million, fund reserves of approximately $2.3 million, and pay closing costs of approximately $3.3 million. Based on the appraised value of $116.1 million as of November 6, 2014, the cut-off date LTV is 60.3%.
| Sources and Uses | ||||||||||
| Sources | Proceeds | % of Total | Uses | Proceeds | % of Total | |||||
| Loan Amount | $70,000,000 | 57.6% | Purchase Price | $116,000,000 | 95.4% | |||||
| Mezzanine Loan | $20,000,000 | 16.4% | Reserves | $2,290,366 | 1.9% | |||||
| Sponsor Equity | $31,593,172 | 26.0% | Closing Costs | $3,302,806 | 2.7% | |||||
| Total Sources | $121,593,172 | 100.0% | Total Uses | $121,593,172 | 100.0% | |||||
The Borrower / Sponsor. The borrower, AWH Burbank Hotel, LLC, is a single purpose Delaware limited liability company structured to be bankruptcy-remote, with two independent directors in the organizational structure. The sponsors of the borrower and nonrecourse carve-out guarantors, on a joint and several basis, are Chad Cooley, Russell Flicker, Jonathan Rosenfeld and Bernard Michael.
Chad Cooley, Russell Flicker, Jonathan Rosenfeld and Bernard Michael are each principals in AWH Partners, a privately held real estate investment, development and management firm. Since 2010, AWH Partners has completed in excess of $575 million of hotel investments and has managed hotel redevelopment projects totaling more than $165 million. In early 2012, AWH Partners acquired Lane Hospitality, a hospitality management company manager, which it rebranded as Spire Hospitality, LLC (“Spire Hospitality”), to expand AWH Partner’s capabilities in the hospitality sector. Spire Hospitality is the property manager at the Marriott Burbank Property.
The Property. The Marriott Burbank Property is a 488-room full service hotel located in Burbank, California within Los Angeles County. The Marriott Burbank Property was built in 1982 and renovated most recently in 2015. The Marriott Burbank Property also underwent a significant renovation in 2007, which included an approximately $28.4 million ($58,196 per room) complete renovation of all guestrooms and guest bathrooms, as well as improvements to the meeting and conference rooms. The Marriott Burbank Property is comprised of two towers, the West Tower and the East Tower, and a convention center. The West Tower includes two food and beverage outlets, Daily Grill and Media Lounge, the lobby and 288 guestrooms. The East Tower features 200 guestrooms as well as meeting space and a fitness facility. The convention center houses the 15,015 sq. ft. academy ballroom and 15,000 sq. ft. of pre-function space. The Marriott Burbank Property features 884 surface parking spaces which equates to approximately 1.81 spaces per room. The Marriott Burbank Property is operated under a franchise agreement with MIF, L.L.C., an affiliate of Marriott International, Inc., which expires in December 2036.
The Marriott Burbank Property is currently undergoing an approximately $13.6 million ($27,869 per room) capital improvement program that commenced in 2013 and is anticipated to conclude in the fourth quarter of 2015. The capital program includes upgrades to the guestrooms, convention center, corridors, meeting rooms, lobby, building exterior, and system technology. The guestrooms underwent a full soft goods replacement program that included new upholstered furniture and ergonomic desk chairs, carpets and baseboards, vinyl wall coverings, window treatments, decorative lighting, artwork and new mattresses and box springs. During the guestroom renovations, the Marriott Burbank Property had 16,982 room nights offline. As of October 31, 2014, approximately $10.1 million of the capital program has been invested.
THE INFORMATION IN THIS STRUCTURAL AND COLLATERAL TERM SHEET IS NOT COMPLETE AND MAY BE AMENDED PRIOR TO THE TIME OF SALE. THIS TERM SHEET IS NOT AN OFFER TO SELL THESE SECURITIES AND IT IS NOT A SOLICITATION OF AN OFFER TO BUY THESE SECURITIES IN ANY JURISDICTION WHERE THE OFFER OR SALE IS NOT PERMITTED.
60
2500 North Hollywood Way Burbank, CA 91505 | Collateral Asset Summary – Loan No. 10 Marriott Burbank | Cut-off Date Balance: Cut-off Date LTV: U/W NCF DSCR: U/W NOI Debt Yield: | $70,000,000 60.3% 1.98x 13.0% |
The subsequent table provides a more detailed summary of the remaining scheduled capital expenditures:
Budgeted Capital Expenditures(1) | ||
| Project | 2014-2015 Budget | |
| Lobby | $325,750 | |
| Meeting Space | $516,175 | |
| Cooling Tower | $100,000 | |
| Boilers / Pumps / Roof | $90,000 | |
| New Shuttle Bus | $75,000 | |
| Patio Bar / Fitness Center | $135,250 | |
| Logistics, Tax & Fees | $1,379,125 | |
| Miscellaneous FF&E | $878,700 | |
| Total | $3,500,000 | |
| (1) | Source: Borrower. |
The Marriott Burbank Property features various amenities including two food and beverage venues, 48,691 sq. ft. of meeting space, two outdoor pools, a fitness facility and a business center. The food and beverage venues are each owned by the borrower and are located on the first floor of the West Tower. The Daily Grill is a full service, upscale restaurant offering modern American cuisine and the Media Lounge is a bar/lounge located outside the main lobby. The Daily Grill is managed by a third party and requires a management fee of 8.5% of gross revenues generated by the restaurant and 30% of net income for each 12 month period beginning on May 15, 2014. The meeting space is predominately located in the convention center with the remaining meeting space located in the East Tower. The Marriott Burbank features 488 guestrooms including 92 suites and 20 PURE guestrooms, which are an allergy-friendly alternative guestroom. Each of the guestrooms features a television, work space, dresser, nightstands and a lounge chair. The Marriott Burbank Property features two types of guestrooms, a king room and a double bed room. The liquor license for the operation of the property is held for the benefit of the borrower by an affiliate, Spire Concessions, LLC, pursuant to a concession and service agreement. The sole member of the liquor license holder pledged its ownership interest in the liquor license holder to lender as additional collateral for the Marriott Burbank Loan.
Environmental Matters. The Phase I environmental report dated October 9, 2014 recommended no further action at the Marriott Burbank Property.
The Market. The Marriott Burbank Property is located in Burbank, California within Los Angeles County, approximately 12 miles northwest of downtown Los Angeles. Burbank was named the “Media Capital of the World” by Travel Magazine as many media and entertainment companies are headquartered or have a significant presence in Burbank, including The Walt Disney Company, Warner Brothers Entertainment, Warner Music Group, NBC, Nickelodeon and Cartoon Network, among others. The Marriott Burbank Property is located across the street from the Bob Hope Burbank Airport and less than three miles from downtown Burbank and five miles from Universal Studios Theme Park. Burbank is accessible by I-5 which bisects the city from northwest to southeast and the Ventura Freeway which connects Burbank to US 101 to the south and the Foothill Freeway to the East. Additionally, the Burbank Transportation Center is located adjacent to the Bob Hope Airport and the Marriott Burbank Property. The Burbank Transportation Center is served by Metrolink’s Antelope Valley Line to Lancaster and Ventura County Line to East Ventura, which both terminate at Los Angeles Union Station.
The Bob Hope Airport serves the local area with commercial, charter and private air service. The facility is a driver of leisure demand in the San Fernando Valley, including Dodger Stadium, the Rose Bowl and the many nearby entertainment studios and theme parks. In 2013, the airport served approximately four million passengers with over 70 flights daily. The airport is served by Alaska Airlines, Delta, JetBlue, Seaport Airlines, Southwest, United and US Airways.
The Marriott Burbank Property competes to varying degrees with numerous hotels in the Burbank area. Including the Marriott Burbank Property, the appraiser determined a primary competitive set of five hotels, spanning 1,872 rooms. Additionally, the appraiser identified one proposed hotel which will be competitive with the Marriot Burbank Property, the 210-room Hilton Garden Inn, which is anticipated to open in January 2016. The Hilton Garden Inn is not expected to be as competitive in the meeting and group segment as it has limited meeting space versus the Marriott Burbank Property’s 48,691 sq. ft. of meeting space, which includes 15,000 sq. ft. of convention space.
THE INFORMATION IN THIS STRUCTURAL AND COLLATERAL TERM SHEET IS NOT COMPLETE AND MAY BE AMENDED PRIOR TO THE TIME OF SALE. THIS TERM SHEET IS NOT AN OFFER TO SELL THESE SECURITIES AND IT IS NOT A SOLICITATION OF AN OFFER TO BUY THESE SECURITIES IN ANY JURISDICTION WHERE THE OFFER OR SALE IS NOT PERMITTED.
61
2500 North Hollywood Way Burbank, CA 91505 | Collateral Asset Summary – Loan No. 10 Marriott Burbank | Cut-off Date Balance: Cut-off Date LTV: U/W NCF DSCR: U/W NOI Debt Yield: | $70,000,000 60.3% 1.98x 13.0% |
The subsequent chart presents the primary competitive set to the Marriott Burbank Property:
Primary Competitive Set(1) | ||||||||||||
| Property | Rooms | Year Opened | Approximate Distance | 2013 Occupancy(2) | 2013 ADR(2) | 2013 RevPAR(2) | ||||||
| Marriott Burbank Property | 488 | 1982 | NAP | 83.3% | $138.17 | $115.08 | ||||||
| Hilton Universal City | 489 | 1983 | 4.8 miles | 85.0% | $178.00 | $151.30 | ||||||
| Sheraton Universal City | 449 | 1969 | 4.8 miles | 71.0% | $171.00 | $121.41 | ||||||
| The Beverly Garland Hotel | 256 | 1972 | 4.5 miles | 83.0% | $150.00 | $124.50 | ||||||
| Courtyard Burbank Airport | 190 | 2002 | 1.1 miles | 85.0% | $146.00 | $124.10 | ||||||
| Total / Wtd. Avg. | 1,872 | 80.9% | $158.86 | $128.26 | ||||||||
| (1) | Source: Appraisal. |
| (2) | 2013 Occupancy, 2013 ADR and 2013 RevPAR represent estimates from the appraisal. The minor variances between the underwriting, the hospitality research report and the above table with respect to 2013 Occupancy, 2013 ADR and 2013 RevPAR at the Marriott Burbank Property are attributable to variances in reporting methodologies and/or timing differences. |
The appraiser determined demand segmentation of 62% commercial, 23% meeting and group and 15% leisure travel for the Marriott Burbank Property, compared to 44% commercial, 26% meeting and group and 29% leisure travel for the primary competitive set. The market demand mix is presented in the table below:
Demand Segmentation(1) | ||||||||
| Property | Rooms | Commercial | Meeting and Group | Leisure | ||||
| Marriott Burbank Property | 488 | 62% | 23% | 15% | ||||
| Hilton Universal City | 489 | 32% | 23% | 45% | ||||
| Sheraton Universal City | 449 | 35% | 40% | 25% | ||||
| The Beverly Garland Hotel | 256 | 35% | 20% | 45% | ||||
| Courtyard Burbank Airport | 190 | 65% | 20% | 15% | ||||
| Total / Wtd. Avg. | 1,872 | 44% | 26% | 29% | ||||
| (1) | Source: Appraisal. |
Cash Flow Analysis.
| Cash Flow Analysis | ||||||||
| 2012 | 2013 | 2014 | T-12 3/31/2014(1) | T-12 1/31/2015(2) | U/W | U/W per Room | ||
| Occupancy | 79.7% | 82.1% | 76.9% | 85.2% | 75.7% | 85.2% | ||
| ADR | $135.09 | $140.17 | $154.07 | $142.41 | $154.28 | $154.28 | ||
| RevPAR | $107.72 | $115.08 | $118.43 | $121.37 | $116.77 | $131.48 | ||
| Room Revenue | $19,239,589 | $20,497,477 | $21,094,302 | $21,618,000 | $20,799,754 | $23,419,046 | $47,990 | |
| F&B Revenue | 9,026,597 | 9,444,159 | 9,762,822 | 9,879,000 | 9,671,503 | 10,702,043 | 21,930 | |
| Parking Income | 1,766,330 | 1,939,048 | 1,671,355 | 1,964,000 | 1,624,588 | 2,127,625 | 4,360 | |
| Other Revenue | 549,212 | 471,096 | 608,412 | 256,000 | 620,992 | 277,328 | 568 | |
| Total Revenue | $30,581,728 | $32,351,780 | $33,136,891 | $33,717,000 | $32,716,837 | $36,526,042 | $74,848 | |
| Operating Expenses | 11,822,818 | 13,419,905 | 13,493,319 | 13,620,000 | 13,419,448 | 14,754,714 | 30,235 | |
| Undistributed Expenses | 8,549,229 | 8,649,131 | 9,161,002 | 8,878,000 | 9,147,184 | 9,618,134 | 19,709 | |
| Gross Operating Profit | $10,209,681 | $10,282,744 | $10,482,570 | $11,219,000 | $10,150,205 | $12,153,194 | $24,904 | |
Management Fee(3) | 917,452 | 970,553 | 901,180 | 1,018,000 | 885,277 | 1,095,781 | 2,245 | |
| Total Fixed Charges | 1,656,375 | 1,663,904 | 1,953,276 | 1,697,000 | 1,946,108 | 1,932,303 | 3,960 | |
| Net Operating Income | $7,635,854 | $7,648,287 | $7,628,114 | $8,504,000 | $7,318,820 | $9,125,110 | $18,699 | |
FF&E(4) | 1,223,269 | 1,617,589 | 1,325,476 | 1,697,000 | 1,308,674 | 1,461,042 | 2,994 | |
| Net Cash Flow | $6,412,585 | $6,030,698 | $6,302,638 | $6,807,000 | $6,010,146 | $7,664,068 | $15,705 | |
| (1) | T-12 March 31, 2014 cash flows represent the 12 months prior to the capital improvement program. |
| (2) | T-12 January 31, 2015 cash flows include 16,982 offline room nights due to room renovations. |
| (3) | U/W Management Fee is 3.0% of gross revenues. |
| (4) | U/W FF&E represents 4.0% of gross revenues. The U/W FF&E steps to 5.0% in November 2016. |
THE INFORMATION IN THIS STRUCTURAL AND COLLATERAL TERM SHEET IS NOT COMPLETE AND MAY BE AMENDED PRIOR TO THE TIME OF SALE. THIS TERM SHEET IS NOT AN OFFER TO SELL THESE SECURITIES AND IT IS NOT A SOLICITATION OF AN OFFER TO BUY THESE SECURITIES IN ANY JURISDICTION WHERE THE OFFER OR SALE IS NOT PERMITTED.
62
2500 North Hollywood Way Burbank, CA 91505 | Collateral Asset Summary – Loan No. 10 Marriott Burbank | Cut-off Date Balance: Cut-off Date LTV: U/W NCF DSCR: U/W NOI Debt Yield: | $70,000,000 60.3% 1.98x 13.0% |
Property Management. The Marriott Burbank Property is managed by Spire Hospitality, LLC, a borrower affiliate.
Lockbox / Cash Management. The Marriott Burbank Loan is structured with a hard lockbox and in place cash management. All credit card receipts and commercial rents are required to be deposited by the credit card processing companies or tenants, as applicable, directly into a clearing account. All non-credit card receipts are required to be deposited in the clearing account within three business days of receipt by borrower, property manager or affiliated liquor license holder. All funds in the lockbox account are swept daily to a lender-controlled cash management account and disbursed in accordance with the Marriott Burbank Loan documents. Provided no Trigger Period (as defined below) exists and the cash flow sweep to fund the PIP reserve account has been completed, all excess cash flow (after payment of monthly debt service, monthly reserves, other amounts due and payable under the Marriott Burbank Loan and monthly mezzanine loan debt service) will be remitted to the borrower on a daily basis. During a Trigger Period, excess amounts will be transferred into the cash collateral account. Notwithstanding the foregoing, excess cash will be swept into a PIP reserve account until $1,750,000 (in addition to the $1,750,000 initial deposit made by borrower), has been deposited, prior to any amounts being remitted to borrower or transferred to cash collateral account.
A “Trigger Period” will commence upon the occurrence of (i) an event of default, (ii) if the debt service coverage ratio falls below 1.15x on the last day of any calendar quarter or (iii) an event of default under the mezzanine loan. A Trigger Event will cease to exist (a) with respect to clause (i) and (iii) above, if such event of default has been cured and (b) with respect to clause (ii) above, if the debt service coverage ratio equals or exceeds 1.20x for two consecutive quarters, or, not more than two times during the term of the Marriott Burbank Loan, the borrower deposits with lender cash or a letter of credit in an amount which, if applied to the outstanding principal balance of the Marriott Burbank Loan, would result in a debt service coverage ratio of 1.20x, to be held as additional collateral for the Marriott Burbank Loan, to be released upon the debt service coverage ratio equaling or exceeding 1.20x for two consecutive calendar quarters.
Initial Reserves. At closing, the borrower deposited (i) $300,616 into a tax reserve account, (ii) $133,500 into a required repairs account, (iii) $1,750,000 into a PIP reserve account for property improvements at the Marriott Burbank Property and (iv) $106,250 into a site improvement agreement repairs reserve account for work which may be required pursuant to a recorded site improvement plan for the Marriott Burbank Property and the adjacent property entered into by the previous owner.
Ongoing Reserves. On a monthly basis, the borrower is required to deposit monthly reserves of (i) 1/12 of the estimated annual real estate taxes, which currently equates to $103,257, into a tax reserve account and (ii) the greater of (a) until December 11, 2016, 4.0% of the property’s rent for the second preceding month and on December 11, 2016 and thereafter, 5.0% of the property’s rent for the second preceding month, (b) any amount required under the management agreement and (c) any amount required under the franchise agreement for FF&E work. In addition, the borrower is required to deposit 1/12 of the estimated annual insurance premiums into an insurance reserve account if an acceptable blanket policy is no longer in place.
Property Release. In connection with the acquisition of the Marriott Burbank Property, the borrower is obligated to seek entitlements on a certain portion of the parking lot at the Marriott Burbank Property (the “Release Parcel”) which, if obtained, would require borrower to pay the prior owner up to $5,023,750 as an additional purchase price payment. In addition, upon receipt of the necessary entitlements, the borrower may release the Release Parcel upon satisfaction of specified conditions including, among other things, that (i) there is no event of default, (ii) the Release Parcel is legally subdivided from the Marriott Burbank Property and it is not necessary for the remaining property to comply with zoning or legal requirements, (iii) there is no reduction in parking spaces except for a temporary reduction of parking spaces (as described below), (iv) borrower records a restrictive covenant prohibiting, for so long as the Marriott Burbank Loan is outstanding, the use of the Release Parcel for operation of a similar or competing full service hotel in the same or similar class as the Marriott Burbank Property and (v) the release will not result in an LTV ratio greater than 125%.
The borrower is not permitted to reduce the number of parking spaces available to the Marriott Burbank Property below 884 parking spaces, except that, in connection with a redevelopment (whether in connection with the Release Parcel or otherwise), and not more than one time during the term of the Marriott Burbank Loan, parking may, for no more than 12 consecutive months, be reduced by no more than 150 parking spaces (unless the debt yield based on the total debt calculated at the time of such reduction is at least 8.75%, in which case the reduction may be up to 250 parking spaces) so long as (i) no event of default is continuing and (ii) the debt yield based on the total debt is at least 8.5% (or 8.75% in the event the reduction is between 150 and 250 parking spaces).
Current Mezzanine or Subordinate Indebtedness. A $20,000,000 mezzanine loan was funded concurrently with the funding of the Marriott Burbank Loan. The mezzanine loan is coterminous with the Marriott Burbank Loan, accrues interest at a rate of 10.4000% and is interest only for the first three years of the loan term and amortizes on a planned schedule thereafter. The current holder of the mezzanine loan is ACREFI Mortgage Lending, LLC.
Future Mezzanine or Subordinate Indebtedness Permitted. None.
THE INFORMATION IN THIS STRUCTURAL AND COLLATERAL TERM SHEET IS NOT COMPLETE AND MAY BE AMENDED PRIOR TO THE TIME OF SALE. THIS TERM SHEET IS NOT AN OFFER TO SELL THESE SECURITIES AND IT IS NOT A SOLICITATION OF AN OFFER TO BUY THESE SECURITIES IN ANY JURISDICTION WHERE THE OFFER OR SALE IS NOT PERMITTED.
63
2500 North Hollywood Way Burbank, CA 91505 | Collateral Asset Summary – Loan No. 10 Marriott Burbank | Cut-off Date Balance: Cut-off Date LTV: U/W NCF DSCR: U/W NOI Debt Yield: | $70,000,000 60.3% 1.98x 13.0% |
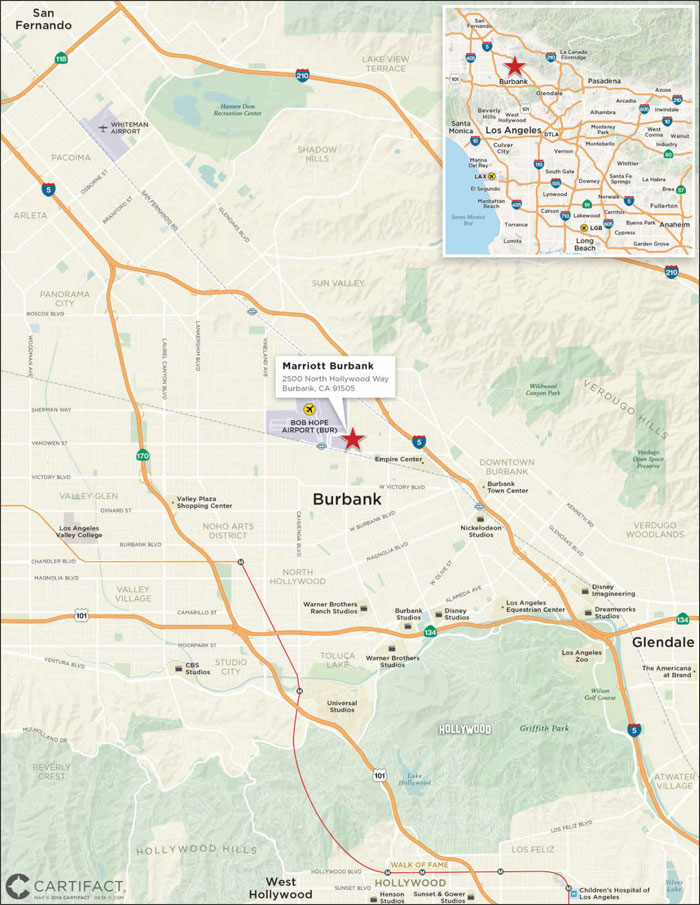
THE INFORMATION IN THIS STRUCTURAL AND COLLATERAL TERM SHEET IS NOT COMPLETE AND MAY BE AMENDED PRIOR TO THE TIME OF SALE. THIS TERM SHEET IS NOT AN OFFER TO SELL THESE SECURITIES AND IT IS NOT A SOLICITATION OF AN OFFER TO BUY THESE SECURITIES IN ANY JURISDICTION WHERE THE OFFER OR SALE IS NOT PERMITTED.
64
(THIS PAGE INTENTIONALLY LEFT BLANK)
65
100 West 57th Street New York, NY 10019 | Collateral Asset Summary – Loan No. 11 100 West 57th Street | Cut-off Date Balance: Cut-off Date LTV: U/W NCF DSCR: U/W NOI Debt Yield: | $60,000,000 60.0% 1.00x 2.3% |
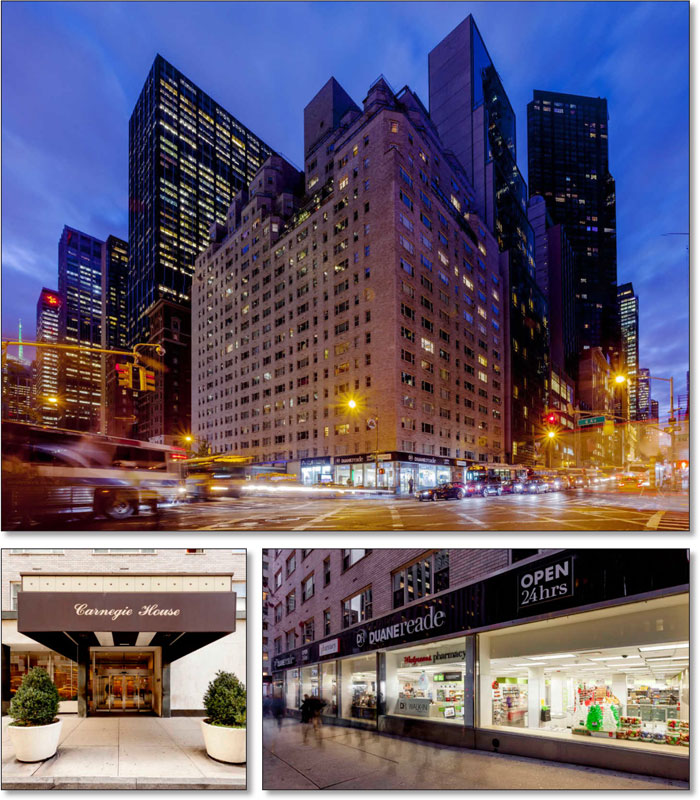
THE INFORMATION IN THIS STRUCTURAL AND COLLATERAL TERM SHEET IS NOT COMPLETE AND MAY BE AMENDED PRIOR TO THE TIME OF SALE. THIS TERM SHEET IS NOT AN OFFER TO SELL THESE SECURITIES AND IT IS NOT A SOLICITATION OF AN OFFER TO BUY THESE SECURITIES IN ANY JURISDICTION WHERE THE OFFER OR SALE IS NOT PERMITTED.
66
100 West 57th Street New York, NY 10019 | Collateral Asset Summary – Loan No. 11 100 West 57th Street | Cut-off Date Balance: Cut-off Date LTV: U/W NCF DSCR: U/W NOI Debt Yield: | $60,000,000 60.0% 1.00x 2.3% |
| Mortgage Loan Information | |||||||
| Loan Seller: | Natixis | ||||||
| Loan Purpose: | Acquisition | ||||||
| Sponsor: | David Werner; Eli Schron; Avi Schron; Mark Schron | ||||||
| Borrower: | 57th & 6th Ground LLC | ||||||
Original Balance(1): | $60,000,000 | ||||||
Cut-off Date Balance(1): | $60,000,000 | ||||||
| % by Initial UPB: | 4.6% | ||||||
Interest Rate(2): | 2.3069% | ||||||
| Payment Date: | 5th of each month | ||||||
| First Payment Date: | December 5, 2014 | ||||||
Anticipated Repayment Date(2): | November 5, 2019 | ||||||
| Maturity Date: | April 5, 2035 | ||||||
| Amortization: | Interest only, ARD | ||||||
Additional Debt(1): | $120,000,000 Pari Passu Debt | ||||||
Call Protection(3): | L(28), D(28), O(4) | ||||||
| Lockbox / Cash Management: | Hard / In Place | ||||||
Reserves(4) | |||||||
| Initial | Monthly | ||||||
| Taxes: | $0 | Springing | |||||
| Insurance: | $0 | Springing | |||||
| Quarterly Rent: | $0 | Quarterly | |||||
| Future Rent: | $605,510 | $0 | |||||
Financial Information – Fee (collateral)(5) | |||||||
Cut-off Date Balance / Sq. Ft.(6): | $7,164 | ||||||
Balloon Balance / Sq. Ft.(6): | $7,164 | ||||||
| Cut-off Date LTV: | 60.0% | ||||||
| Balloon LTV: | 60.0% | ||||||
| Underwritten NOI DSCR: | 1.00x | ||||||
| Underwritten NCF DSCR: | 1.00x | ||||||
| Underwritten NOI Debt Yield: | 2.3% | ||||||
| Underwritten NCF Debt Yield: | 2.3% | ||||||
| Underwritten NOI Debt Yield at Balloon: | 2.3% | ||||||
| Underwritten NCF Debt Yield at Balloon: | 2.3% | ||||||
Financial Information – Fee (collateral) and Leasehold (non-collateral)(5) | |||||||
Cut-off Date Balance / Sq. Ft.(7): | $144 | ||||||
Balloon Balance / Sq. Ft.(7): | $144 | ||||||
Cut-off Date LTV(8): | 40.0% | ||||||
Balloon LTV(8): | 40.0% | ||||||
Underwritten NOI DSCR(9): | 4.63x | ||||||
Underwritten NCF DSCR(10): | 4.54x | ||||||
Underwritten NOI Debt Yield(9): | 10.8% | ||||||
Underwritten NCF Debt Yield(10): | 10.6% | ||||||
| Property Information | ||
| Single Asset / Portfolio: | Single Asset | |
| Property Type: | Leased Fee | |
| Collateral: | Fee Simple | |
| Location: | New York, NY | |
| Year Built / Renovated: | NAP / NAP | |
Total Sq. Ft.(6): | 25,125 | |
| Property Management: | Self-managed | |
| Underwritten NOI: | $4,213,128 | |
| Underwritten NCF: | $4,213,128 | |
| “As-is” Appraised Value: | $300,000,000 | |
“Unencumbered Land” Appraised Value(11): | $260,000,000 | |
“Fee and Leasehold” Appraised Value(8): | $450,000,000 | |
| “As-is” Appraisal Date: | August 1, 2014 | |
| Ground Rent | ||
| In Place Contractual Ground Rent: | $4,070,655 | |
Estimated Ground Rent Reset(11): | $21,233,420 | |
| Historical Occupancy | ||
| Most Recent Occupancy: | NAP | |
| 2014 Occupancy: | NAP | |
| 2013 Occupancy: | NAP | |
| 2012 Occupancy: | NAP | |
| (1) | The Original Balance and Cut-off Date Balance of $60.0 million represent the non-controlling Note A-2 of the $180.0 million 100 West 57th Street Loan Combination, which is evidenced by three pari passu notes. The pari passu companion loans are comprised of the non-controlling Note A-3 with an original principal balance of $40.0 million, which was securitized in the COMM 2015-DC1 transaction, and the controlling Note A-1 with an original principal balance of $80.0 million, which is currently held by Natixis (although Natixis reserved the right to reapportion the balance or sub-divide such note) and is expected to be securitized in a future transaction. For additional information on the pari passu companion loans, see “The Loan” herein. |
| (2) | If the 100 West 57th Street Loan Combination is not repaid in full by the Anticipated Repayment Date, the interest rate will increase to 5.6169% to but excluding March 5, 2025. On the payment date occurring on March 5, 2025, the interest rate will increase to the greater of (i) 6.3669% and (ii) the then five-year swap spread on March 5, 2025 plus 4.0600%. |
| (3) | The lockout period will be at least 28 payment dates beginning with and including the first payment date of December 5, 2014. Defeasance of a portion of or the full $180.0 million 100 West 57th Street Loan Combination is permitted after the earlier to occur of (i) two years after the closing date of the securitization that includes the last pari passu note to be securitized and (ii) November 5, 2018. |
| (4) | See “Initial Reserves” and “Ongoing Reserves” herein. |
| (5) | DSCR, LTV, Debt Yield and Balance / Sq. Ft. calculations are based on the aggregate 100 West 57th Street Loan Combination. |
| (6) | Total Sq. Ft. represents the gross square footage of the land area. Balance / Sq. Ft. calculations for the fee interest (collateral) are based off the gross square footage of the land area. |
| (7) | Balance / Sq. Ft. calculations for the leasehold interest (non-collateral) are based off the improvements, which consist of 418,114 sq. ft. of mixed use residential cooperative and retail space. |
| (8) | Based on the “Fee and Leasehold” Appraised Value, which reflects the improvements of 418,114 sq. ft. of mixed use residential cooperative and retail space, which are not part of the collateral, plus the value of the land (collateral). |
| (9) | Based on estimated mark-to-market look-through NOI of $19,489,115 for the leasehold interest. |
| (10) | Based on estimated mark-to-market look-through NCF of $19,095,966 for the leasehold interest. |
| (11) | Calculated based on the “Unencumbered Land” Appraised Value of $260.0 million. The ground rent will reset on March 15, 2025 and per the ground lease, the annual ground rent will be calculated as 8.1667% of the then fair market value of the land as unimproved and unencumbered. |
THE INFORMATION IN THIS STRUCTURAL AND COLLATERAL TERM SHEET IS NOT COMPLETE AND MAY BE AMENDED PRIOR TO THE TIME OF SALE. THIS TERM SHEET IS NOT AN OFFER TO SELL THESE SECURITIES AND IT IS NOT A SOLICITATION OF AN OFFER TO BUY THESE SECURITIES IN ANY JURISDICTION WHERE THE OFFER OR SALE IS NOT PERMITTED.
67
100 West 57th Street New York, NY 10019 | Collateral Asset Summary – Loan No. 11 100 West 57th Street | Cut-off Date Balance: Cut-off Date LTV: U/W NCF DSCR: U/W NOI Debt Yield: | $60,000,000 60.0% 1.00x 2.3% |
The Loan. The 100 West 57th Street loan (the “100 West 57th Street Loan”) is the non-controlling Note A-2 portion, in the original principal amount of $60.0 million, of a fixed rate loan in the aggregate principal amount of $180.0 million (the “100 West 57th Street Loan Combination”). The 100 West 57th Street Loan Combination is secured by the borrower’s fee simple interest in a land parcel totaling 25,125 sq. ft. located at 100 West 57th Street (a.k.a. 1381-1399 Avenue of the Americas), in Midtown Manhattan (the “100 West 57th Street Property”). The leased fee interest is improved by a 21-story mixed-use residential cooperative and retail building also known as the Carnegie House, containing 323 cooperative apartment units, a below-grade parking garage and retail space (28,337 sq. ft.) anchored by Duane Reade (collectively the “Improvements” or “Leasehold Improvements”). The $180.0 million 100 West 57th Street Loan Combination is evidenced by three pari passu notes. Only the non-controlling Note A-2, with an original principal balance of $60.0 million, will be included in the COMM 2015-CCRE22 mortgage trust. The non-controlling Note A-3, with an original principal balance of $40.0 million, was securitized in COMM 2015-DC1. The controlling Note A-1, with an original principal balance of $80.0 million is expected to be included in a further securitization (although Natixis reserved the right to reapportion the balances between or sub-divide such notes).
The 100 West 57th Street Loan Combination has an anticipated repayment date of November 5, 2019 (the “Anticipated Repayment Date”) and a stated maturity date of April 5, 2035. Prior to the Anticipated Repayment Date, the interest on the 100 West 57th Street Loan Combination will accrue at a fixed rate of 2.3069% and debt service will be paid on an interest only basis. From and after the Anticipated Repayment Date, the interest rate will increase to 5.6169% through the payment date occurring on February 5, 2025. From and after the payment date occurring on March 5, 2025, the interest rate will increase to the greater of (i) 6.3669% and (ii) the then five-year swap spread as of March 5, 2025 plus 4.0600%. See “Anticipated Repayment Date” herein.
The proceeds of the 100 West 57th Street Loan Combination, along with approximately $124.1 million in equity from the sponsor, were used to purchase the 100 West 57th Street Property for $286.0 million, fund upfront reserves of approximately $0.6 million and pay closing costs of approximately $17.5 million. Based on the “As-is” appraised value of $300.0 million as of August 1, 2014, the cut-off date LTV ratio of the 100 West 57th Street Loan Combination is 60.0%. The most recent prior financing of the 100 West 57th Street Property was not included in a securitization.
The relationship between the holders of the Note A-1, Note A-2 and Note A-3 is governed by an intercreditor agreement described under “Description of the Mortgage Pool―Loan Combinations―The 100 West 57th Street Loan Combination” in the Free Writing Prospectus.
| Pari Passu Note Summary | ||||
| Original Balance | Cut-off Date Balance | Note Holder | Controlling Piece | |
| Note A-1 | $80,000,000 | $80,000,000 | Natixis | Yes |
| Note A-2 | $60,000,000 | $60,000,000 | COMM 2015-CCRE22 | No |
| Note A-3 | $40,000,000 | $40,000,000 | COMM 2015-DC1 | No |
| Total | $180,000,000 | $180,000,000 | ||
| Sources and Uses | ||||||
| Sources | Proceeds | % of Total | Uses | Proceeds | % of Total | |
| Loan Amount | $180,000,000 | 59.2% | Purchase Price | $286,000,000 | 94.0% | |
| Sponsor Equity | $124,138,000 | 40.8% | Reserves | $605,510 | 0.2% | |
| Closing Costs | $17,532,490 | 5.8% | ||||
| Total Sources | $304,138,000 | 100.0% | Total Uses | $304,138,000 | 100.0% | |
The Borrower / Sponsor. The borrower, 57th & 6th Ground LLC, is a single purpose Delaware limited liability company structured to be bankruptcy-remote, with two independent directors in its organizational structure. The sponsors of the borrower are David Werner of David Werner Real Estate Investments and Avi Schron, Eli Schron and Mark Schron of Cammeby’s International, Ltd. and the nonrecourse carve-out guarantors are Eli Schron, Avi Schron and Mark Schron.
David Werner is a real estate investor with over 30 years of experience in investment and development. According to the sponsors, selected projects include:
● | One Court Square (Citibank Building): a 1.5 million sq. ft. office building in Long Island City, New York. |
● | 300 South Riverside Plaza: a 1.1 million sq. ft. office building located in Chicago, Illinois. |
● | One Lincoln Street: a 1.1 million sq. ft. trophy office building located in Boston, Massachusetts. |
● | 909 Third Avenue: a fee position on a 1.4 million sq. ft. office building in New York, New York. |
● | Willis Tower (formerly Sears Tower): a 4.0 million sq. ft. office building located in Chicago, Illinois. |
● | Bank of America Tower: a 2.0 million sq. ft. office building located in San Francisco, California. |
● | 11 Madison Ave: a 2.3 million sq. ft. office building located in New York, New York. |
THE INFORMATION IN THIS STRUCTURAL AND COLLATERAL TERM SHEET IS NOT COMPLETE AND MAY BE AMENDED PRIOR TO THE TIME OF SALE. THIS TERM SHEET IS NOT AN OFFER TO SELL THESE SECURITIES AND IT IS NOT A SOLICITATION OF AN OFFER TO BUY THESE SECURITIES IN ANY JURISDICTION WHERE THE OFFER OR SALE IS NOT PERMITTED.
68
100 West 57th Street New York, NY 10019 | Collateral Asset Summary – Loan No. 11 100 West 57th Street | Cut-off Date Balance: Cut-off Date LTV: U/W NCF DSCR: U/W NOI Debt Yield: | $60,000,000 60.0% 1.00x 2.3% |
Cammeby’s International Ltd. (“Cammeby’s”), founded by Rubin Schron, owns, develops, operates and manages real estate throughout the United States and has been active in the industry for nearly 40 years. Avi Schron, Eli Schron and Mark Schron, three sons of Rubin Schron, support the company’s operations with important roles in the company. Cammeby’s owns and manages over 28,000 residential units, and over 20.0 million sq. ft. of commercial and industrial space. The majority of their holdings are located in the New York Metropolitan area.
According to the sponsors, Cammeby’s major properties include, among others, the following:
● | The Woolworth Building: a 1.0 million sq. ft. trophy office building located in Manhattan, New York. |
● | Industry City, Bush Terminal: an industrial park consisting of more than 5.0 million sq. ft. located in Brooklyn, New York. |
● | First Industrial and National Industrial Portfolio: two different portfolios containing over 9.5 million sq. ft. |
● | Apartment Management Associates: a portfolio of 26 properties with a total of over 8,250 apartments, located in Brooklyn, Queens, and Staten Island, New York. |
● | Broadway Portfolio: a group of office buildings consisting of more than 1.5 million sq. ft. located in the heart of the financial district in Lower Manhattan, New York. |
● | 866 3rd Ave: a newly constructed 330 room Marriott Hotel located in Midtown Manhattan, New York. |
● | Central Queens: a group of properties consisting of 3,300 units in 50 buildings located in Queens, New York. |
Ground Lease. The land is currently subject to a long term ground lease (the “Ground Lease”) that has an initial re-set date of March 15, 2025. The Ground Lease has fixed annual payments of $4,070,655 payable quarterly through March 14, 2019, $4,213,128 payable quarterly through March 14, 2024 and $4,360,587 payable quarterly through March 14, 2025. The ground lessee has the right to renew the Ground Lease for two renewal terms of 21 years each by giving written notice no later than 12 months and no more than 48 months prior to the commencement date of the particular renewal term, subject to a ground rent reset. Pursuant to the terms of the Ground Lease, the annual ground rent resets to 8.1667% of the fair market value of the land as unimproved and unencumbered as of a date six months prior to the commencement date of each renewal term but in no event will the renewal rent be less than that in effect for the immediately preceding term. Based on the appraisal dated August 1, 2014, the unencumbered value of the land without any improvements is $260.0 million and the rent is projected to increase to $21.2 million per annum by 2025. Pursuant the terms of the Ground Lease, if the parties cannot agree on the fair market value, they are required to resolve the dispute by arbitration. See “Risk Factors—Risks Related to The Mortgage Loans—Leased Fee Properties Entail Risks That May Adversely Affect Payments on Your Certificates” and “ —The 100 West 57th Street Ground Lease” in the free writing prospectus.
The ground lessee’s leasehold interest is held by (i) Carnegie House Tenants Corporation (“CHTC”), owner of a 75% tenant in common (“TIC”) interest in the tenancy and the exclusive use of the residential and garage space (“Apartment/Garage Premises”) and (ii) Georgetown 57, LLC, owner of a 25% TIC interest and the exclusive use and control of the retail space (“Retail Premises”). CHTC must (i) pay its fixed rent; (ii) pay its allocable share of any real estate taxes provided under the TIC Agreement; (iii) maintain and pay for the insurance; and (iv) perform any material repair or maintenance related to the Apartment/Garage Premises. Georgetown 57, LLC is required to (i) pay its fixed rent; (ii) pay its allocable share of any real estate taxes provided under the TIC Agreement; (iii) pay its allocable share of insurance premiums for the property under the TIC Agreement; and (iv) perform any material repair or maintenance related to the Apartment/Garage Premises.
The Property. The 100 West 57th Street Loan Combination is collateralized by the borrower’s fee interest in a 25,125 sq. ft. parcel of land located at 100 West 57th Street (a.k.a. 1381-1399 Avenue of the Americas) in Midtown Manhattan. The land is a through-block parcel located on the westerly block-front of Avenue of the Americas between West 56th and West 57th Street in the Plaza District of Midtown Manhattan. The borrower’s fee simple interest is subject to the Ground Lease pursuant to which the ground lessee constructed, developed and owns the improvements that sit on top of the ground. The improvements consist of a 21-story, Class A, mixed use building, known as the Carnegie House, comprised of 323 cooperative apartment units (including one superintendent’s unit) on floors 2 through 21, a 225-space parking garage on two sub-cellar levels with entrance on West 56th Street, and 28,337 sq. ft. of retail space on grade and basement levels. The Carnegie House mixed use building was constructed in 1962 on the subject land shortly after the original developer ground-leased it in 1959. All leasehold improvements were converted to cooperative ownership in 1978. The ground lessee’s interest in the improvements is not collateral for the 100 West 57th Street Loan Combination.
The residential entrance is located on Avenue of the Americas with a main lobby with an attended front desk. The apartment floors are serviced by three passenger elevators and two freight elevators. The building amenities include a full-time doorman, live-in superintendent, valet service, private storage, bike room, central laundry, and an on-site garage (which is leased to a third-party operator). The apartment unit mix is reported to include studio, one-bedroom, two-bedroom, three-bedroom and four-bedroom units based on the original co-op offering plan reviewed; however, the exact current unit mix is not available. Some apartment units have outdoor terraces or balconies.
The retail space contains approximately 28,337 sq. ft. on the ground and basement floors with a current occupancy of 92.0%. Duane Reade anchors approximately 7,316 sq. ft. grade-level corner space at Avenue of the Americas and West 57th Street with an additional 12,350 sq. ft. on the basement level. There are seven smaller in-line retail suites on the grade-level, of which six suites totaling 6,402 sq. ft. are currently occupied and one (2,269 sq. ft.) is vacant.
THE INFORMATION IN THIS STRUCTURAL AND COLLATERAL TERM SHEET IS NOT COMPLETE AND MAY BE AMENDED PRIOR TO THE TIME OF SALE. THIS TERM SHEET IS NOT AN OFFER TO SELL THESE SECURITIES AND IT IS NOT A SOLICITATION OF AN OFFER TO BUY THESE SECURITIES IN ANY JURISDICTION WHERE THE OFFER OR SALE IS NOT PERMITTED.
69
100 West 57th Street New York, NY 10019 | Collateral Asset Summary – Loan No. 11 100 West 57th Street | Cut-off Date Balance: Cut-off Date LTV: U/W NCF DSCR: U/W NOI Debt Yield: | $60,000,000 60.0% 1.00x 2.3% |
Retail Tenant Summary(1) | ||||||||
Tenant | Ratings (Fitch/Moody’s/S&P)(2) | Net Rentable Area (Sq. Ft.) | % of Net Rentable Area | In Place Rent PSF | % of Total In Place Base Rent | Market Rent PSF(3) | Lease Expiration | |
Duane Reade(4) | NR/Baa2/BBB | 7,316 | 25.8% | $140.11 | 30.9% | $350.00 | 2/28/2025 | |
Duane Reade (Basement)(4) (5) | NR/Baa2/BBB | 5,150 | 18.2% | $140.11 | 21.7% | $100.00 | 2/28/2025 | |
Duane Reade (Cellar)(4) | NR/Baa2/BBB | 7,200 | 25.4% | $25.00 | 5.4% | $25.00 | 2/28/2025 | |
| Total Major Tenants | 19,666 | 69.4% | $97.96 | 58.1% | $165.54 | |||
Jamba Juice(4) | NR/NR/NR | 1,702 | 6.0% | $224.74 | 11.5% | $275.00 | 8/31/2015 | |
| Coterie (1387 Sixth Avenue Inc) | NR/NR/NR | 1,364 | 4.8% | $178.13 | 7.3% | $250.00 | 10/31/2023 | |
| City Souvenirs on 6th | NR/NR/NR | 1,083 | 3.8% | $221.97 | 7.2% | $250.00 | 10/31/2021 | |
| NY Diva Nails & Spa | NR/NR/NR | 1,017 | 3.6% | $224.21 | 6.9% | $250.00 | 12/31/2015 | |
| Tucci Italia (Yaron H) | NR/NR/NR | 784 | 2.8% | $223.95 | 5.3% | $250.00 | 9/30/2021 | |
| Zibetto Espresso Bar | NR/NR/NR | 452 | 1.6% | $269.05 | 3.7% | $250.00 | 1/31/2016 | |
| Total In-Line Tenants | 6,402 | 22.6% | $217.29 | 41.9% | $256.65 | |||
| Total Occupied Collateral | 26,068 | 92.0% | $127.27 | 100.0% | $187.92 | |||
| Vacant | 2,269 | 8.0% | ||||||
| Total | 28,337 | 100.0% | ||||||
| (1) | Source: retail rent roll as of November 2014. |
| (2) | Certain ratings are those of the parent company whether or not the parent company guarantees the lease. |
| (3) | Source: Appraisal. |
| (4) | The Duane Reade lease has one five-year renewal option and the Jamba Juice lease has two five-year renewal options. |
| (5) | Duane Reade (Basement) space is a retail space and fully operational. |
Environmental Matters. The Phase I environmental report dated September 23, 2014 recommended the development and implementation of an asbestos and lead-based paint operation and maintenance plan at the 100 West 57th Street Property.
The Market. The 100 West 57th Street Property is located on the westerly block-front of Avenue of the Americas between West 56th and West 57th Street in the area of Midtown Manhattan. The 100 West 57th Street Property is surrounded by many of New York’s well known landmarks, restaurants, hotels, theatres, retail shops and tourist attractions, made accessible by the presence of several major transportation hubs. The F line stop located at 6th Avenue and West 57th Street in addition to several stops for the A, B, C, D, E, N, Q, R, 1, 2 and 3 lines are within short walking distance from the 100 West 57th Street Property. The 100 West 57th Street Property is located within the Plaza District, which is bounded by 47th Street to the south and 65th Street to the north, and from Avenue of the Americas to the west and Park Avenue to the east.
The 100 West 57th Street Property benefits from a location that attracts international and specialty retail stores along with creditworthy local retailers.
The appraisal identified six comparable land sales in the New York market, which are presented in the subsequent chart.
Land Sales Summary(1) | |||||||||
| Name | 100 West 57th Street Property | 985-989 Third Avenue | 118-122 East 59th Street | 950 Second Avenue | 101 Murray Street | 616 First Avenue | 961 First Avenue | ||
Distance from the Property | NAP | <1mile | <1mile | 1.2 miles | 4.2 miles | 2.0 miles | 1.1 miles | ||
| Sales Price | $286,000,000 | $102,500,000 | $49,000,000 | $61,000,000 | $223,000,000 | $172,125,000 | $64,000,000 | ||
| Transaction Date | 11 / 2014 | In Contract | 11 / 2013 | 8 / 2013 | 5 / 2013 | 2 / 2013 | 12 / 2012 | ||
| Size (Acres / Sq. Ft.) | 0.58 / 25,125 | 0.16 / 6,843 | 0.17 / 7,532 | 0.20 / 8,837 | 0.71 / 31,028 | 1.04 / 45,190 | 0.20 / 8,814 | ||
| Max. Buildable FAR (Sq. Ft.) | 376,875 | 89,480 | 76,693 | 118,726 | 310,280 | 523,930 | 159,153 | ||
| Price PSF (FAR) | $758.87 | $1,145.51 | $638.91 | $513.79 | $718.71 | $328.53 | $402.13 | ||
| (1) | Source: Appraisal. |
Mark-to-Market Look-Through Analysis. The appraisal concluded retail market rents of $350.00 PSF for the ground retail space on the corner of West 57th Street and Avenue of the Americas, $275.00 PSF for the ground retail space on the corner of West 56th Street and Avenue of the Americas and $250.00 PSF for in line retail space along Avenue of the Americas. Market rent for the lower level (basement) retail space is estimated to be $100.00 PSF, while the lower level storage retail space is estimated to be $25.00 PSF. Based on these market rents, estimated recoveries and a market vacancy factor of 3.0%, the market gross revenue for the retail space
THE INFORMATION IN THIS STRUCTURAL AND COLLATERAL TERM SHEET IS NOT COMPLETE AND MAY BE AMENDED PRIOR TO THE TIME OF SALE. THIS TERM SHEET IS NOT AN OFFER TO SELL THESE SECURITIES AND IT IS NOT A SOLICITATION OF AN OFFER TO BUY THESE SECURITIES IN ANY JURISDICTION WHERE THE OFFER OR SALE IS NOT PERMITTED.
70
100 West 57th Street New York, NY 10019 | Collateral Asset Summary – Loan No. 11 100 West 57th Street | Cut-off Date Balance: Cut-off Date LTV: U/W NCF DSCR: U/W NOI Debt Yield: | $60,000,000 60.0% 1.00x 2.3% |
is estimated to be approximately $5.3 million. Assuming underwritten expenses of $37.71 PSF, the retail space leasehold interest’s estimated market net operating income is approximately $4.3 million. The concluded rental market rents were $70 PSF on average. Based on these market rents, estimated recoveries and a market vacancy factor of 3.0%, the market gross revenue for the residential space is estimated to be approximately $23.0 million, including $2.6 million of parking revenue. Assuming underwritten expenses of $25.85 PSF, the residential space leasehold interest’s estimated market net operating income is approximately $15.2 million. The combined Leasehold Improvements interest’s estimated market net operating income is approximately $19.5 million resulting in a mark-to-market look-through debt yield and DSCR for the 100 West 57th Street Loan Combination of 10.8% and 4.63x, respectively. Replacement reserves were estimated at $0.10 PSF for the retail space and $150 per unit for the residential space. Leasing commissions were based on 40.0% of first year’s base rent including 125% override (paid in year one) with a 65.0% renewal probability, assuming equal tenant rollover throughout the 100 West 57th Street Loan term. The combined Leasehold Improvements interests estimated market net cash flow is approximately $19.1 million, resulting in a mark-to-market look-through underwritten debt yield and DSCR for the 100 West 57th Street Loan Combination of 10.6% and 4.54x, respectively.
Cash Flow Analysis.
| Cash Flow Analysis | ||||
In Place Contractual Ground Rent(1) | UW Ground Rent(1) | Estimated Ground Rent Reset(2) | Mark-to-Market Look- Through of Leasehold Interest (non-collateral)(3) | |
| Base Rent | $4,070,655 | $4,213,128 | $21,233,420 | $29,257,185 |
| Value of Vacant Space | 0 | 0 | 0 | 0 |
| Gross Potential Rent | $4,070,655 | $4,213,128 | $21,233,420 | $29,257,185 |
Less: Vacancy(4) | 0 | 0 | 0 | (932,188) |
| Effective Gross Income | $4,070,655 | $4,213,128 | $21,233,420 | $28,324,997 |
| Total Operating Expenses | 0 | 0 | 0 | 8,835,882 |
| Net Operating Income | $4,070,655 | $4,213,128 | $21,233,420 | $19,489,115 |
| TI/LC | 0 | 0 | 0 | 226,900 |
| Capital Expenditures | 0 | 0 | 0 | 166,249 |
| Net Cash Flow | $4,070,655 | $4,213,128 | $21,233,420 | $19,095,966 |
| (1) | Ground rent steps up from $4,070,655 to $4,213,128 beginning in March 15, 2019, then to $4,360,587 in March 15, 2024. |
| (2) | Calculated based on the unencumbered land appraised value of $260.0 million. The ground rent will reset on March 15, 2025 and per the ground lease is calculated as 8.1667% of the then fair market value of the land as unimproved and unencumbered. |
| (3) | Source: Appraisal. |
| (4) | Estimated Mark-to-Market Look-Through of Leasehold Interest (non-collateral) Vacancy represents 3.2% of gross income. |
Property Management. The 100 West 57th Street Property is self-managed.
Lockbox / Cash Management. The 100 West 57th Street Loan is structured with a hard lockbox and in place cash management. All rents, revenues and receipts from the 100 West 57th Street Property (which, for so long as the Ground Lease remains in effect, will primarily consist of the ground rent) will be deposited directly by the ground lessee into a lockbox account controlled by the lender. All funds in the lockbox account are swept daily to a cash management account under the control of the lender and disbursed in accordance with the 100 West 57th Street Loan documents. Upon a Cash Trap Period (as defined herein), excess cash flow will be collected by the lender. Additionally, from and after the Anticipated Repayment Date, all excess cash will be applied first to repay the outstanding principal of the 100 West 57th Street Loan Combination and then to repay all accrued additional interest.
A “Cash Trap Period” will commence upon the occurrence of: (i) an event of default, (ii) an event of default as defined in the Ground Lease by ground tenant under the ground lease beyond applicable notice, grace and cure periods, or (iii) the failure by the ground tenant, after the end of a calendar quarter, to maintain a ground rent coverage ratio of at least 1.10x, and will end upon the earlier to occur of (1) the 100 West 57th Street Loan and all other obligations under the loan documents have been repaid in full, (2) there has been a full defeasance of the 100 West 57th Street Loan, (3) with respect to a Cash Trap Period in effect due to clause (i) above, for six consecutive months since the commencement of the most recent Cash Trap Period (A) no event of default has occurred and (B) no event that would trigger another Cash Trap Period has occurred, (4) with respect to a Cash Trap Period in effect due to clause (ii) above, for six consecutive months since the commencement of the most recent Cash Trap Period (A) no ground tenant “event of default” as defined in the Ground Lease is continuing and (B) no event that would trigger another Cash Trap Period has occurred or (5) with respect to a Cash Trap Period in effect due to clause (iii) above, for six consecutive months since the commencement of the most recent Cash Trap Period (A) no event of default has occurred and remains uncured, (B) no event that would trigger another Cash Trap Period has occurred and (C) the ground rent coverage ratio is at least equal to 1.15x.
Initial Reserves. At closing, the borrower deposited $605,510 into the future rent reserve subaccount.
THE INFORMATION IN THIS STRUCTURAL AND COLLATERAL TERM SHEET IS NOT COMPLETE AND MAY BE AMENDED PRIOR TO THE TIME OF SALE. THIS TERM SHEET IS NOT AN OFFER TO SELL THESE SECURITIES AND IT IS NOT A SOLICITATION OF AN OFFER TO BUY THESE SECURITIES IN ANY JURISDICTION WHERE THE OFFER OR SALE IS NOT PERMITTED.
71
100 West 57th Street New York, NY 10019 | Collateral Asset Summary – Loan No. 11 100 West 57th Street | Cut-off Date Balance: Cut-off Date LTV: U/W NCF DSCR: U/W NOI Debt Yield: | $60,000,000 60.0% 1.00x 2.3% |
Ongoing Reserves. Ongoing tax and insurance reserves are not required as long as the Ground Lease remains in full force and effect and the borrower provides evidence as required by the lender that the ground lessee has provided timely payment of all property taxes and insurance premiums. On a quarterly basis, the borrower will cause the ground lessee to deposit with the deposit bank the quarterly rent payment due under the Ground Lease.
Current Mezzanine or Subordinate Indebtedness. None.
Future Mezzanine or Subordinate Indebtedness Permitted. None.
Anticipated Repayment Date. The 100 West 57th Street Loan Combination has an Anticipated Repayment Date of November 5, 2019 and a stated maturity date of April 5, 2035. From and after the Anticipated Repayment Date, the interest rate will increase to 5.6169% through the payment date occurring on February 5, 2025. From and after the payment date occurring on March 5, 2025, the interest rate will increase to the greater of (i) 6.3669% and (ii) the then five-year swap as of March 5, 2025 spread plus 4.0600%. The difference between the adjusted interest rate and the initial interest rate is the additional Anticipated Repayment Date interest. From and after the Anticipated Repayment Date, all excess cash flow from the 100 West 57th Street Property, after payment of reserves, the interest calculated at the initial interest rate, and 100 West 57th Street Property operating expenses, will be applied to the outstanding principal balance of the 100 West 57th Street Loan Combination until repaid in full. The additional Anticipated Repayment Date interest which is not paid current from and after the Anticipated Repayment Date will accrue but payments of the excess interest will be deferred and will be required to be repaid, with interest (to the extent permitted by applicable law) after the outstanding principal balance of the 100 West 57th Street Loan Combination has been paid in full.
THE INFORMATION IN THIS STRUCTURAL AND COLLATERAL TERM SHEET IS NOT COMPLETE AND MAY BE AMENDED PRIOR TO THE TIME OF SALE. THIS TERM SHEET IS NOT AN OFFER TO SELL THESE SECURITIES AND IT IS NOT A SOLICITATION OF AN OFFER TO BUY THESE SECURITIES IN ANY JURISDICTION WHERE THE OFFER OR SALE IS NOT PERMITTED.
72
100 West 57th Street New York, NY 10019 | Collateral Asset Summary – Loan No. 11 100 West 57th Street | Cut-off Date Balance: Cut-off Date LTV: U/W NCF DSCR: U/W NOI Debt Yield: | $60,000,000 60.0% 1.00x 2.3% |
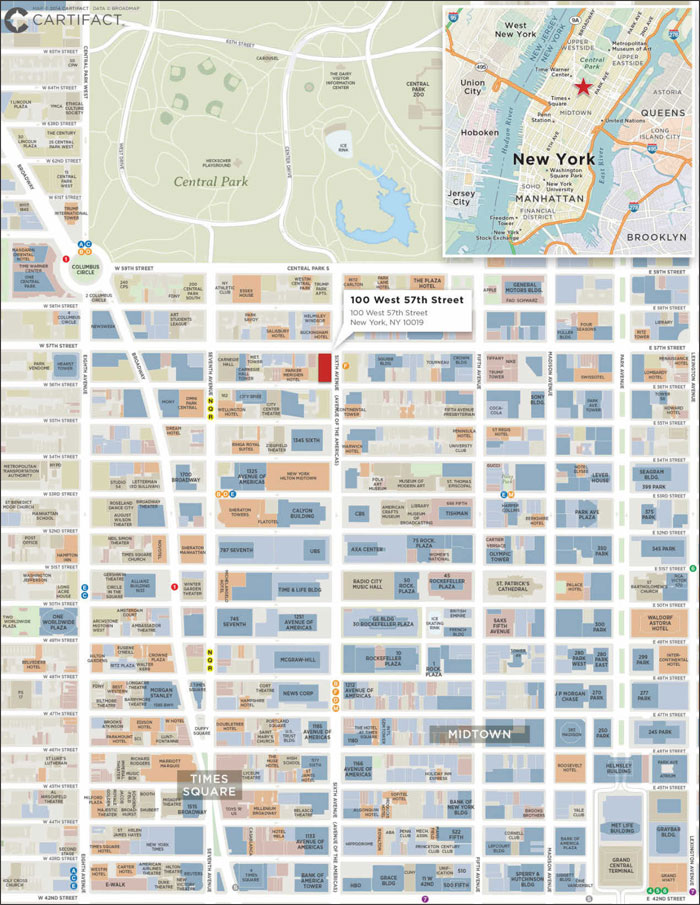
THE INFORMATION IN THIS STRUCTURAL AND COLLATERAL TERM SHEET IS NOT COMPLETE AND MAY BE AMENDED PRIOR TO THE TIME OF SALE. THIS TERM SHEET IS NOT AN OFFER TO SELL THESE SECURITIES AND IT IS NOT A SOLICITATION OF AN OFFER TO BUY THESE SECURITIES IN ANY JURISDICTION WHERE THE OFFER OR SALE IS NOT PERMITTED.
73
9900 Bren Road East Minnetonka, MN 55343 | Collateral Asset Summary – Loan No. 12 UnitedHealth Group HQ | Cut-off Date Balance: Cut-off Date LTV: U/W NCF DSCR: U/W NOI Debt Yield: | $51,675,000 64.6% 1.58x 9.7% |

THE INFORMATION IN THIS STRUCTURAL AND COLLATERAL TERM SHEET IS NOT COMPLETE AND MAY BE AMENDED PRIOR TO THE TIME OF SALE. THIS TERM SHEET IS NOT AN OFFER TO SELL THESE SECURITIES AND IT IS NOT A SOLICITATION OF AN OFFER TO BUY THESE SECURITIES IN ANY JURISDICTION WHERE THE OFFER OR SALE IS NOT PERMITTED.
74
9900 Bren Road East Minnetonka, MN 55343 | Collateral Asset Summary – Loan No. 12 UnitedHealth Group HQ | Cut-off Date Balance: Cut-off Date LTV: U/W NCF DSCR: U/W NOI Debt Yield: | $51,675,000 64.6% 1.58x 9.7% |
| Mortgage Loan Information | |
| Loan Seller: | GACC |
| Loan Purpose: | Acquisition |
| Sponsor: | LCN North American Fund REIT |
| Borrower: | LCN UHS Minnetonka (MN) LLC |
| Original Balance: | $51,675,000 |
| Cut-off Date Balance: | $51,675,000 |
| % by Initial UPB: | 4.0% |
| Interest Rate: | 4.1000% |
| Payment Date: | 6th of each month |
| First Payment Date: | February 6, 2015 |
| Maturity Date: | January 6, 2025 |
| Amortization: | Interest only for first 59 months; 360 months thereafter |
| Additional Debt: | None |
| Call Protection: | L(26), D(90), O(4) |
| Lockbox / Cash Management: | Hard / In Place |
Reserves(1) | ||
| Initial | Monthly | |
| Taxes: | $0 | Springing |
| Insurance: | $0 | Springing |
| TI/LC: | $0 | Springing |
| Lease Sweep: | $0 | Springing |
| Financial Information | ||
| Cut-off Date Balance / Sq. Ft.: | $150 | |
| Balloon Balance / Sq. Ft.: | $136 | |
| Cut-off Date LTV: | 64.6% | |
| Balloon LTV: | 58.6% | |
Underwritten NOI DSCR(2): | 1.67x | |
Underwritten NCF DSCR(2): | 1.58x | |
| Underwritten NOI Debt Yield: | 9.7% | |
| Underwritten NCF Debt Yield: | 9.1% | |
| Underwritten NOI Debt Yield at Balloon: | 10.7% | |
| Underwritten NCF Debt Yield at Balloon: | 10.1% | |
| Property Information | |
| Single Asset / Portfolio: | Single Asset |
| Property Type: | Suburban Office |
| Collateral: | Fee Simple |
| Location: | Minnetonka, MN |
| Year Built / Renovated: | 1982 / 2015 |
| Total Sq. Ft.: | 343,602 |
| Property Management: | Self-managed |
| Underwritten NOI: | $5,010,765 |
| Underwritten NCF: | $4,721,428 |
| Appraised Value: | $80,000,000 |
| Appraisal Date: | December 11, 2014 |
Historical NOI(3) | |
| Most Recent NOI: | NAV |
| 2013 NOI: | NAV |
| 2012 NOI: | NAV |
| 2011 NOI: | NAV |
Historical Occupancy(3) | |
| Most Recent Occupancy: | 100.0% (March 6, 2015) |
| 2013 Occupancy: | NAV |
| 2012 Occupancy: | NAV |
| 2011 Occupancy: | NAV |
| (1) | See “Initial Reserves” and “Ongoing Reserves” herein. |
| (2) | Based on amortizing debt service payments. Based on the current interest only payments, the Underwritten NOI DSCR and Underwritten NCF DSCR are 2.33x and 2.20x, respectively. |
| (3) | Prior to the acquisition by the sponsor, the UnitedHealth Group HQ Property was 100.0% owner-occupied by UnitedHealth Group. As such, Historical NOI and Historical Occupancy are not available. |
THE INFORMATION IN THIS STRUCTURAL AND COLLATERAL TERM SHEET IS NOT COMPLETE AND MAY BE AMENDED PRIOR TO THE TIME OF SALE. THIS TERM SHEET IS NOT AN OFFER TO SELL THESE SECURITIES AND IT IS NOT A SOLICITATION OF AN OFFER TO BUY THESE SECURITIES IN ANY JURISDICTION WHERE THE OFFER OR SALE IS NOT PERMITTED.
75
9900 Bren Road East Minnetonka, MN 55343 | Collateral Asset Summary – Loan No. 12 UnitedHealth Group HQ | Cut-off Date Balance: Cut-off Date LTV: U/W NCF DSCR: U/W NOI Debt Yield: | $51,675,000 64.6% 1.58x 9.7% |
| Tenant Summary | ||||||||
Tenant | Ratings (Fitch/Moody’s/S&P)(1) | Net Rentable Area (Sq. Ft.) | % of Net Rentable Area | U/W Base Rent PSF | % of Total U/W Base Rent | Lease Expiration | ||
United HealthCare Services, Inc.(2) | A-/A3/A+ | 343,602 | 100.0% | $13.61 | 100.0% | 12/31/2024 | ||
| Total Occupied Collateral | 343,602 | 100.0% | $13.61 | 100.0% | ||||
| Vacant | 0 | 0.0% | ||||||
| Total | 343,602 | 100.0% | ||||||
| (1) | Certain ratings are those of the parent company whether or not the parent company guarantees the lease. |
| (2) | United HealthCare Services, Inc. has three, 10-year extension options and no termination options. |
| Lease Rollover Schedule | ||||||||
| Year | # of Leases Expiring | Total Expiring Sq. Ft. | % of Total Sq. Ft. Expiring | Cumulative Sq. Ft. Expiring | Cumulative % of Sq. Ft. Expiring | Annual U/W Base Rent PSF | % U/W Base Rent Rolling | Cumulative % of U/W Base Rent |
| MTM | 0 | 0 | 0.0% | 0 | 0.0% | $0.00 | 0.0% | 0.0% |
| 2015 | 0 | 0 | 0.0% | 0 | 0.0% | $0.00 | 0.0% | 0.0% |
| 2016 | 0 | 0 | 0.0% | 0 | 0.0% | $0.00 | 0.0% | 0.0% |
| 2017 | 0 | 0 | 0.0% | 0 | 0.0% | $0.00 | 0.0% | 0.0% |
| 2018 | 0 | 0 | 0.0% | 0 | 0.0% | $0.00 | 0.0% | 0.0% |
| 2019 | 0 | 0 | 0.0% | 0 | 0.0% | $0.00 | 0.0% | 0.0% |
| 2020 | 0 | 0 | 0.0% | 0 | 0.0% | $0.00 | 0.0% | 0.0% |
| 2021 | 0 | 0 | 0.0% | 0 | 0.0% | $0.00 | 0.0% | 0.0% |
| 2022 | 0 | 0 | 0.0% | 0 | 0.0% | $0.00 | 0.0% | 0.0% |
| 2023 | 0 | 0 | 0.0% | 0 | 0.0% | $0.00 | 0.0% | 0.0% |
| 2024 | 1 | 343,602 | 100.0% | 343,602 | 100.0% | $13.61 | 100.0% | 100.0% |
| 2025 | 0 | 0 | 0.0% | 343,602 | 100.0% | $0.00 | 0.0% | 100.0% |
| Thereafter | 0 | 0 | 0.0% | 343,602 | 100.0% | $0.00 | 0.0% | 100.0% |
| Vacant | NAP | 0 | 0.0% | 343,602 | 100.0% | NAP | NAP | |
| Total / Wtd. Avg. | 1 | 343,602 | 100.0% | $13.61 | 100.0% | |||
The Loan. The UnitedHealth Group HQ loan (the “UnitedHealth Loan”) is a fixed rate loan secured by the borrower’s fee simple interest in a 343,602 sq. ft., Class A, office property located at 9900 Bren Road East in Minnetonka, Minnesota (the “UnitedHealth Property”) with an original principal balance of $51.675 million. The UnitedHealth Loan has a 10-year term and amortizes on a 30-year schedule after an initial 59-month interest only period. The UnitedHealth Loan accrues interest at a fixed rate equal to 4.1000% and has a cut-off date balance of $51.675 million. Loan proceeds, along with approximately $27.8 million in equity from the sponsor, were used to facilitate the sale-leaseback of the property for approximately $78.8 million and pay closing costs of approximately $0.8 million. Based on the appraised value of $80.0 million as of December 11, 2014, the cut-off date LTV ratio is 64.6%. The appraiser also determined a “Go Dark” appraised value of $75.6 million, which results in a cut-off date loan to dark value ratio of 68.4%. The most recent prior financing of the UnitedHealth Property was not included in a securitization.
| Sources and Uses | ||||||
| Sources | Proceeds | % of Total | Uses | Proceeds | % of Total | |
| Loan Amount | $51,675,000 | 65.0% | Purchase Price | $78,750,000 | 99.0% | |
| Sponsor Equity | $27,841,364 | 35.0% | Closing Costs | $766,364 | 1.0% | |
| Total Sources | $79,516,364 | 100.0% | Total Uses | $79,516,364 | 100.0% | |
The Borrower / Sponsor. The borrower, LCN UHS Minnetonka (MN) LLC, is a single purpose Delaware limited liability company structured to be bankruptcy-remote, with two independent directors in its organizational structure. The sponsor of the borrower and the nonrecourse carve-out guarantor is LCN North American Fund REIT, a real estate investment fund managed by LCN Capital Partners. LCN Capital Partners is a private equity firm with offices in New York and London that invests in operationally critical corporate real estate across certain industry sectors and commercial property types in North America and Europe. The senior management team at LCN Capital Partners has extensive experience in corporate and real estate finance, having held senior roles in investment banking, capital markets, asset management and commercial real estate.
THE INFORMATION IN THIS STRUCTURAL AND COLLATERAL TERM SHEET IS NOT COMPLETE AND MAY BE AMENDED PRIOR TO THE TIME OF SALE. THIS TERM SHEET IS NOT AN OFFER TO SELL THESE SECURITIES AND IT IS NOT A SOLICITATION OF AN OFFER TO BUY THESE SECURITIES IN ANY JURISDICTION WHERE THE OFFER OR SALE IS NOT PERMITTED.
76
9900 Bren Road East Minnetonka, MN 55343 | Collateral Asset Summary – Loan No. 12 UnitedHealth Group HQ | Cut-off Date Balance: Cut-off Date LTV: U/W NCF DSCR: U/W NOI Debt Yield: | $51,675,000 64.6% 1.58x 9.7% |
The Property. The UnitedHealth Property consists of a 10-story office tower that is interconnected with two, three-story office wings totaling 343,602 sq. ft. located within the Opus 2 Business Park in Minnetonka, Minnesota. The UnitedHealth Property was constructed in 1982 and has served as the corporate headquarters for UnitedHealth Group since 1998. UnitedHealth Group has invested $31.4 million ($91 PSF) towards capital improvements since 2008 and has an additional $6.5 million ($19 PSF) of planned improvements in 2015, approximately $2.4 million of which will be used for improvements to the exterior infrastructure and approximately $4.1 million for interior improvements.
The UnitedHealth Property is located at the northwest corner of State Highway 62 and U.S. Highway 169 within the I-494 corridor, which runs through the southern and western suburbs of the Twin Cities and is home to numerous Fortune 500 Companies. Parking at the UnitedHealth Property is provided via a 1,025 space parking garage as well as 29 surface parking spaces, which provides a parking ratio of 3.07 per 1,000 sq. ft. The UnitedHealth Property is part of a three-building UnitedHealth Group campus located within the 640-acre Opus 2 Business Park. The UnitedHealth Property features a fitness center, storage and a cafeteria with a full kitchen and patio. The Opus 2 Business Park is the largest employment center in Minnetonka and one of the largest in the Twin Cities and is home to tenants such as Comcast, Digital River, Datacard, American Medical and American Family Insurance.
As of March 6, 2015 the UnitedHealth Property is 100.0% leased to United HealthCare Services, Inc., a wholly-owned subsidiary of UnitedHealth Group.
Environmental Matters. The Phase I environmental report dated December 22, 2014 recommended no further action at the UnitedHealth Property.
Tenant. The UnitedHealth Property is fully leased to United HealthCare Services, Inc., a wholly-owned subsidiary of UnitedHealth Group (rated A-/A3/A+ by Fitch/Moody’s/S&P). UnitedHealth Group agreed to sell the UnitedHealth Property to the sponsor and lease it back for an initial 10-year term with three, 10-year extension options. The lease is NNN and has an initial rent of $13.61 PSF with 2.3% annual increases in years two through eight of the lease and 2.0% annual increases in years nine and 10. There are no termination options and the tenant must give 24 months written notice to vacate prior to lease expiration.
Founded in 1977, UnitedHealth Group is a diversified health and well-being company. The company offers a variety of products and services through two platforms: UnitedHealthcare, which provides healthcare coverage and benefits services, and Optum, which provides information and technology-enabled health services. Through these two platforms, UnitedHealth Group offers health plans and benefits, including employer group health plans, individual health plans, Medicare plans, Medicaid and state-sponsored plans, ancillary and specialty benefits, pharmacy benefits, and group retiree solutions, as well as public sector, labor and education solutions.
UnitedHealth Group is the largest health and well-being company in the U.S., managing over $160 billion in aggregate health care spending in 2013 on behalf of its 85 million constituents and customers throughout the U.S. and 125 countries worldwide. UnitedHealth Group reported approximately $122.5 billion in 2013 revenues, ranking 17th on the Fortune 500.
The Market. The UnitedHealth Property is located within the I-494 corridor submarket of the Minneapolis/St. Paul metropolitan statistical area (the “Minneapolis/St. Paul MSA”) in Minnetonka, Minnesota. Minnetonka is a community of over 51,000 people located about 6.5 miles southwest of downtown Minneapolis. The I-494 corridor is an approximately 10-mile stretch of interstate highway that contains the largest concentration of office, industrial and retail space in the Twin Cities suburbs.
The Minneapolis/St. Paul MSA has a diverse economic base with a high concentration of employment in the service industries as well as a sizeable manufacturing base. As of August 2014, the Minneapolis/St. Paul MSA seasonally-unadjusted employment rate was 3.8%, compared to the Minnesota average of 3.8% and the national average of 6.3%. Primary highway access to the area is provided by Highway 169, a major arterial that crosses the Twin Cities metro area in the north/south direction. The area is also served by the Crosstown Highway which is located to the south of the UnitedHealth Property.
The Minneapolis office market is comprised of approximately 187.5 million sq. ft., including 48.9 million sq. ft. of Class A office space. The I-494 submarket consists of approximately 10.8 million Class A rentable sq. ft. and recorded net absorption of 612,490 sq. ft. as of year-end 2014. As of year-end 2014, the I-494 submarket Class A vacancy rate was 6.1%, slightly below the Minneapolis/St. Paul MSA Class A vacancy rate of 7.9%. As of year-end 2014, the Class A market quoted rent was $25.93 PSF.
THE INFORMATION IN THIS STRUCTURAL AND COLLATERAL TERM SHEET IS NOT COMPLETE AND MAY BE AMENDED PRIOR TO THE TIME OF SALE. THIS TERM SHEET IS NOT AN OFFER TO SELL THESE SECURITIES AND IT IS NOT A SOLICITATION OF AN OFFER TO BUY THESE SECURITIES IN ANY JURISDICTION WHERE THE OFFER OR SALE IS NOT PERMITTED.
77
9900 Bren Road East Minnetonka, MN 55343 | Collateral Asset Summary – Loan No. 12 UnitedHealth Group HQ | Cut-off Date Balance: Cut-off Date LTV: U/W NCF DSCR: U/W NOI Debt Yield: | $51,675,000 64.6% 1.58x 9.7% |
The appraiser identified eight comparable office leases which are presented in the subsequent chart.
Lease Comparables(1) | |||||
| Property | Tenant | Year Built | Lease Area (Sq. Ft.) | Base Rent (PSF) | Lease Term (yrs) |
UnitedHealth Property(2) | United HealthCare Services, Inc. | 1982 | 343,602 | $13.61 | 10 |
| Norman Point II | GSA | 2006 | 244,561 | $20.55 | 5 |
| Interchange North | Aetna | 1980 | 43,308 | $13.75 | 3 |
| Crest Ridge | Syngenta | 2009 | 120,000 | $21.00 | 10 |
| Cargill Building | Cargill, Inc. | 1998 | 148,220 | $14.50 | 5 |
| Normandale 8200 Tower | Benfield | 2009 | 120,000 | $21.00 | 10 |
| MarketPointe II | CB Richard Ellis | 2008 | 70,000 | $19.00 | 10 |
| ATK Facility | ATK | 2008 | 107,209 | $19.76 | 15 |
| XATA Corporation Building | XATA | 1986 | 26,791 | $14.07 | 7 |
(1) Source: Appraisal.
(2) Based on rent roll dated March 6, 2015.
The appraiser determined the market rent for the UnitedHealth Property to be $19.00 PSF.
Cash Flow Analysis.
| Cash Flow Analysis | ||
| U/W | U/W PSF | |
| Base Rent | $4,675,000 | $13.61 |
| Rent Steps | 498,738 | 1.45 |
| Gross Potential Rent | $5,173,738 | $15.06 |
Less: Vacancy(1) | (162,973) | (0.47) |
| Effective Gross Income | $5,010,765 | $14.58 |
| Total Operating Expenses | 0 | 0.00 |
| Net Operating Income | $5,010,765 | $14.58 |
TI/LC(2) | 237,797 | 0.69 |
| Capital Reserves | 51,540 | 0.15 |
| Net Cash Flow | $4,721,428 | $13.74 |
| (1) | U/W Vacancy represents 3.2% of Gross Potential Rent compared with Class A market vacancy of 6.3%. A 50% benefit was given to UnitedHealth Group for its long term lease and A-/A3/A+ (Fitch/Moody’s/S&P) credit rating. |
| (2) | U/W TI/LC includes a structural offset credit of approximately $526,717 against U/W TI/LC, based on the expected proceeds or approximately $5.3 million from the excess cash flow sweep commencing 24 months prior to United HealthCare Services, Inc.’s lease expiration in the event that the tenant does not renew its lease. |
Property Management. Currently, there is no borrower-affiliated or third party manager engaged to manage the UnitedHealth Property. The lease with UnitedHealth Group obligates UnitedHealth Group to manage and operate the UnitedHealth Property. In the event of, and upon the earlier to occur of, an event of default or the date on which the UnitedHealth Property is no longer subject to a lease obligating UnitedHealth Group to manage the UnitedHealth Property, the borrower is required to (a) retain an unaffiliated qualified manager, another property manager chosen by the borrower and approved by the lender, or a manager affiliated with the borrower or Edward V. LaPuma or Bryan York Colwell (provided that Edward V. LaPuma and Bryan York Colwell control the borrower and no event of default is continuing); (b) enter into a management agreement with the proposed manager; (c) enter into an assignment and subordination of management agreement in a form reasonably acceptable to the lender; and (d) if the proposed manager is an affiliate of the borrower, deliver a non-consolidation opinion to the lender.
THE INFORMATION IN THIS STRUCTURAL AND COLLATERAL TERM SHEET IS NOT COMPLETE AND MAY BE AMENDED PRIOR TO THE TIME OF SALE. THIS TERM SHEET IS NOT AN OFFER TO SELL THESE SECURITIES AND IT IS NOT A SOLICITATION OF AN OFFER TO BUY THESE SECURITIES IN ANY JURISDICTION WHERE THE OFFER OR SALE IS NOT PERMITTED.
78
9900 Bren Road East Minnetonka, MN 55343 | Collateral Asset Summary – Loan No. 12 UnitedHealth Group HQ | Cut-off Date Balance: Cut-off Date LTV: U/W NCF DSCR: U/W NOI Debt Yield: | $51,675,000 64.6% 1.58x 9.7% |
Lockbox / Cash Management. The UnitedHealth Loan is structured with a hard lockbox and in place cash management. The tenant is required to deposit all rents directly into a clearing account controlled by the borrower. Funds deposited into the clearing account are swept daily into a deposit account controlled by the lender and disbursed in accordance with the UnitedHealth Loan documents. Any excess cash after all payments as required pursuant to the UnitedHealth Loan documents will be disbursed to the borrower’s operating account, unless a Trigger Period (as defined below) exists, in which case any transfer to the borrower’s operating account will cease. United HealthCare Services, Inc. currently pays rent on a quarterly (rather than monthly) basis. Such quarterly rental payments are swept from the clearing bank to the deposit account where, on the next monthly payment date, (i) the amounts due under the UnitedHealth Loan documents on such monthly payment date (the “Required Monthly Payment Amount”) are treated as rents and applied in accordance with the UnitedHealth Loan documents, (ii) an amount equal to two times the Required Monthly Payment amount will be transferred into a rent payment account (to be held and applied as rents on the next two succeeding monthly payment dates) and (iii) the remainder of the rent received on such date is distributed to borrower unless a Full Rent Hold Period (as defined below) is continuing.
A “Trigger Period” will commence upon the occurrence of (i) an event of default, (ii) the debt service coverage ratio being less than 1.15x or (iii) the commencement of a Lease Sweep Period. A Trigger Period will end upon, with respect to clause (i), the lender’s acceptance of the cure of the event of default; with respect to clause (ii), the achievement of a debt service coverage ratio of 1.20x; and with respect to clause (iii), the end of the Lease Sweep Period.
Initial Reserves. None.
Ongoing Reserves. Monthly deposits to the tax and insurance reserves will be waived so long as, among other things (i) the tenant lease is full force and effect and no event of default is occurring, (ii) the tenant (or replacement tenant, as permitted in the loan agreement) is obligated under its lease to pay the full tax payments and insurance premiums due and does pay such amounts and (iii) borrower furnishes to lender, upon request, receipts for such payments. During the continuance of a Trigger Period, the borrower will be required to deposit $28,634 to a TI/LC reserve account on each monthly payment date, subject to a reserve cap of $687,204. During the continuance of a Full Rent Hold Period, the entire quarterly rental payment received by lender is deposited into a rent payment account and on each monthly payment date, an amount equal to 33% of such quarterly rental payment is treated as rents and applied in accordance with the UnitedHealth Loan documents. On each monthly payment date during a Lease Sweep Period (as defined below), all excess cash flow will be deposited to the lease sweep reserve.
A “Full Rent Hold Period” is the period (i) during the continuance of the first Trigger Period (if any) which occurs under the UnitedHealth Loan and (ii) if a second Trigger Period occurs, from and after the commencement of such second Trigger Period.
A “Lease Sweep Period” will commence upon (i) the earlier of (a) 24 months prior to the earliest stated expiration of a Lease Sweep Lease (as defined below) and (b) the date required under a Lease Sweep Lease by which the tenant thereunder is required to give notice of its exercise of a renewal option, (ii) the date that a Lease Sweep Lease (or any material portion) is cancelled or terminated prior to its then current expiration date, (iii) the date that the tenant under a Lease Sweep Lease “goes dark” with respect to 25% or more of the space demised under such Lease Sweep Lease for 90 days (other than going dark due to a tenant build out or upgrade or a restoration of the space after a casualty), (iv) a monetary or material non-monetary default of a tenant under a Lease Sweep Lease, (v) the occurrence of any insolvency proceeding or certain insolvency-related admissions of a tenant (or its direct or indirect parent company) under a Lease Sweep Lease or (vi) the decline in the credit rating of the tenant under a Lease Sweep Lease (or its parent entity) below “BBB-” or equivalent by any of the rating agencies. A Lease Sweep Period ends upon, with respect to (i), (ii) and (iii) above, the leasing of certain space to pursuant to certain qualified leases and the lender agrees that sufficient funds have been accumulated to cover related leasing expenses, free rents, and other related costs described in the loan agreement; with respect to (i) above, the date the tenant of the Lease Sweep Lease irrevocably exercises its renewal or extension option with respect to all of the relevant space and the lender agrees that sufficient funds have been accumulated to cover related leasing expenses, free rents, and other related costs described in the loan agreement; with respect to (iv) above, the date on which the default has been cured; with respect to (v) above, the respective insolvency proceeding has terminated and the Lease Sweep Lease has been affirmed, assumed, or assigned in a manner reasonably satisfactory to the lender; and with respect to (vi) above, the earlier to occur of the date on which the credit rating of the tenant under the Lease Sweep Lease or its parent entity has been restored to at least “BBB-” or equivalent by the relevant ratings agencies and the date on which at least $3,436,020 has been reserved in an account relating to the Lease Sweep Lease.
A “Lease Sweep Lease” means (i) the United HealthCare Services, Inc. lease or (ii) any replacement lease that covers at least 50,000 sq. ft. at the UnitedHealth Property.
Current Mezzanine or Subordinate Indebtedness. None.
Future Mezzanine or Subordinate Indebtedness Permitted. None.
THE INFORMATION IN THIS STRUCTURAL AND COLLATERAL TERM SHEET IS NOT COMPLETE AND MAY BE AMENDED PRIOR TO THE TIME OF SALE. THIS TERM SHEET IS NOT AN OFFER TO SELL THESE SECURITIES AND IT IS NOT A SOLICITATION OF AN OFFER TO BUY THESE SECURITIES IN ANY JURISDICTION WHERE THE OFFER OR SALE IS NOT PERMITTED.
79
9900 Bren Road East Minnetonka, MN 55343 | Collateral Asset Summary – Loan No. 12 UnitedHealth Group HQ | Cut-off Date Balance: Cut-off Date LTV: U/W NCF DSCR: U/W NOI Debt Yield: | $51,675,000 64.6% 1.58x 9.7% |

THE INFORMATION IN THIS STRUCTURAL AND COLLATERAL TERM SHEET IS NOT COMPLETE AND MAY BE AMENDED PRIOR TO THE TIME OF SALE. THIS TERM SHEET IS NOT AN OFFER TO SELL THESE SECURITIES AND IT IS NOT A SOLICITATION OF AN OFFER TO BUY THESE SECURITIES IN ANY JURISDICTION WHERE THE OFFER OR SALE IS NOT PERMITTED.
80
(THIS PAGE INTENTIONALLY LEFT BLANK)
81
29-35 9th Avenue New York, NY 10011 | Collateral Asset Summary – Loan No. 13 Soho House NYC | Cut-off Date Balance: Cut-off Date LTV: U/W NCF DSCR: U/W NOI Debt Yield: | $45,000,000 64.3% 1.79x 8.3% |

THE INFORMATION IN THIS STRUCTURAL AND COLLATERAL TERM SHEET IS NOT COMPLETE AND MAY BE AMENDED PRIOR TO THE TIME OF SALE. THIS TERM SHEET IS NOT AN OFFER TO SELL THESE SECURITIES AND IT IS NOT A SOLICITATION OF AN OFFER TO BUY THESE SECURITIES IN ANY JURISDICTION WHERE THE OFFER OR SALE IS NOT PERMITTED.
82
29-35 9th Avenue New York, NY 10011 | Collateral Asset Summary – Loan No. 13 Soho House NYC | Cut-off Date Balance: Cut-off Date LTV: U/W NCF DSCR: U/W NOI Debt Yield: | $45,000,000 64.3% 1.79x 8.3% |
| Mortgage Loan Information | |
| Loan Seller: | CCRE |
| Loan Purpose: | Acquisition |
| Sponsor: | Joseph Cayre |
| Borrower: | 33 Ninth Commercial Owner LLC |
| Original Balance: | $45,000,000 |
| Cut-off Date Balance: | $45,000,000 |
| % by Initial UPB: | 3.5% |
| Interest Rate: | 4.5500% |
| Payment Date: | 6th of each month |
| First Payment Date: | March 6, 2015 |
| Maturity Date: | February 6, 2025 |
| Amortization: | Interest Only |
Additional Debt(1): | $22,500,000 Mezzanine Debt |
| Call Protection: | L(25), D(91), O(4) |
| Lockbox / Cash Management: | Hard / In Place |
Reserves(2) | ||
| Initial | Monthly | |
| Taxes: | $0 | Springing |
| Insurance: | $0 | Springing |
| Replacement: | $0 | $994 |
| Required Repairs: | $7,750 | NAP |
Condominium Common Charge(3): | $0 | Springing |
| Financial Information | ||
| Mortgage Loan | Total Debt | |
| Cut-off Date Balance / Sq. Ft.: | $755 | $1,132 |
| Balloon Balance / Sq. Ft.: | $755 | $1,132 |
Cut-off Date LTV(1): | 64.3% | 96.4% |
Balloon LTV(1): | 64.3% | 96.4% |
Underwritten NOI DSCR(1): | 1.79x | 1.00x |
Underwritten NCF DSCR(1): | 1.79x | 1.00x |
| Underwritten NOI Debt Yield: | 8.3% | 5.5% |
| Underwritten NCF Debt Yield: | 8.2% | 5.5% |
| Underwritten Balloon NOI Debt Yield: | 8.3% | 5.5% |
| Underwritten Balloon NCF Debt Yield: | 8.2% | 5.5% |
| Property Information | |
| Single Asset / Portfolio: | Single Asset |
| Property Type: | Other Mixed Use |
| Collateral: | Fee Simple |
| Location: | New York, NY |
| Year Built / Renovated: | 1910 / 2001 |
| Total Sq. Ft.: | 59,634 |
| Property Management: | Self-managed |
Underwritten NOI(4): | $3,721,893 |
| Underwritten NCF: | $3,709,966 |
| Appraised Value: | $70,000,000 |
| Appraisal Date: | January 1, 2015 |
Historical NOI(5) | |
| In-Place NOI: | $3,100,000 |
| 2014 NOI: | $1,621,716 (December 31, 2014) |
| 2013 NOI: | $1,582,164 (December 31, 2013) |
| 2012 NOI: | $1,543,572 (December 31, 2012) |
| Historical Occupancy | |
| Most Recent Occupancy: | 100.0% (March 6, 2015) |
| 2014 Occupancy: | 100.0% (December 31, 2014) |
| 2013 Occupancy: | 100.0% (December 31, 2013) |
| 2012 Occupancy: | 100.0% (December 31, 2012) |
| (1) | The mezzanine loan accrues interest at a base rate of 9.0000%, provided that only 3.0000% will be due on a current basis and if the net cash flow is not sufficient to pay the full interest due, the remaining interest will be deferred. Notwithstanding the foregoing, the mezzanine borrower is required to make monthly payments based on 3.0000% interest rate regardless of whether net cash flow is sufficient to pay such amount. See “Current Mezzanine or Subordinate Indebtedness” herein. |
| (2) | See “Initial Reserves” and “Ongoing Reserves” herein. |
| (3) | The Soho House NYC Property is subject to a condominium regime, of which the building is bifurcated into one retail unit (33.33%) and one commercial unit (66.67%). The borrower owns the commercial unit and an affiliate of the borrower owns the retail unit (not part of the collateral). |
| (4) | Underwritten NOI is based on the average of Soho House New York’s contractual rent through the Soho House NYC Loan term. |
| (5) | The borrower acquired the Soho House NYC Property in January 2015. Concurrent with the acquisition, Soho House New York executed a 15-year triple-net lease amendment. In-Place NOI represents the current annual base rent under the lease for 2015. 2012-2014 Historical NOI represents the annual base rent according to the prior lease terms. |
THE INFORMATION IN THIS STRUCTURAL AND COLLATERAL TERM SHEET IS NOT COMPLETE AND MAY BE AMENDED PRIOR TO THE TIME OF SALE. THIS TERM SHEET IS NOT AN OFFER TO SELL THESE SECURITIES AND IT IS NOT A SOLICITATION OF AN OFFER TO BUY THESE SECURITIES IN ANY JURISDICTION WHERE THE OFFER OR SALE IS NOT PERMITTED.
83
29-35 9th Avenue New York, NY 10011 | Collateral Asset Summary – Loan No. 13 Soho House NYC | Cut-off Date Balance: Cut-off Date LTV: U/W NCF DSCR: U/W NOI Debt Yield: | $45,000,000 64.3% 1.79x 8.3% |
| Tenant Summary | ||||||||
Tenant | Ratings (Fitch/Moody’s/S&P) | Net Rentable Area (Sq. Ft.) | % of Net Rentable Area | U/W Base Rent PSF(1) | % of Total U/W Base Rent | Lease Expiration(2) | ||
Soho House New York LLC(3) | NR/NR/NR | 59,634 | 100.0% | $62.41 | 100.0% | 1/31/2030 | ||
| Total Occupied Collateral | 59,634 | 100.0% | $62.41 | 100.0% | ||||
| Vacant | 0 | 0.0% | ||||||
| Total | 59,634 | 100.0% | ||||||
| (1) | U/W Base Rent PSF is based on the average of Soho House New York’s contractual rent through the Soho House NYC Loan term. Soho House New York’s current base rent is $3,100,000 ($51.98 PSF) with 4.0% contractual annual rent increases commencing January 1, 2016 through lease maturity. The in-place rent of $51.98 PSF is approximately 35.0% below the appraiser’s concluded market rent of $80.00 PSF and the Annual UW Base Rent PSF is approximately 22.0% below the appraiser’s concluded market rent. |
| (2) | Soho House New York’s lease expires on January 31, 2030. Soho House New York has one, five-year extension option and no termination options. The Soho House NYC Loan is structured with a cash flow sweep related to Soho House New York’s financial performance. See “Ongoing Reserves” herein. |
| (3) | The Soho House New York lease is guaranteed by US AcquireCo, Inc., the holding company for the Soho House U.S. operations, through the term of the Soho House NYC Loan. |
| Lease Rollover Schedule | ||||||||||||||||
| Year | # of Leases Expiring | Total Expiring Sq. Ft. | % of Total Sq. Ft. Expiring | Cumulative Sq. Ft. Expiring | Cumulative % of Sq. Ft. Expiring | Annual U/W Base Rent PSF | % U/W Base Rent Rolling | Cumulative % of U/W Base Rent | ||||||||
| MTM | 0 | 0 | 0.0% | 0 | 0.0% | $0.00 | 0.0% | 0.0% | ||||||||
| 2015 | 0 | 0 | 0.0% | 0 | 0.0% | $0.00 | 0.0% | 0.0% | ||||||||
| 2016 | 0 | 0 | 0.0% | 0 | 0.0% | $0.00 | 0.0% | 0.0% | ||||||||
| 2017 | 0 | 0 | 0.0% | 0 | 0.0% | $0.00 | 0.0% | 0.0% | ||||||||
| 2018 | 0 | 0 | 0.0% | 0 | 0.0% | $0.00 | 0.0% | 0.0% | ||||||||
| 2019 | 0 | 0 | 0.0% | 0 | 0.0% | $0.00 | 0.0% | 0.0% | ||||||||
| 2020 | 0 | 0 | 0.0% | 0 | 0.0% | $0.00 | 0.0% | 0.0% | ||||||||
| 2021 | 0 | 0 | 0.0% | 0 | 0.0% | $0.00 | 0.0% | 0.0% | ||||||||
| 2022 | 0 | 0 | 0.0% | 0 | 0.0% | $0.00 | 0.0% | 0.0% | ||||||||
| 2023 | 0 | 0 | 0.0% | 0 | 0.0% | $0.00 | 0.0% | 0.0% | ||||||||
| 2024 | 0 | 0 | 0.0% | 0 | 0.0% | $0.00 | 0.0% | 0.0% | ||||||||
| 2025 | 0 | 0 | 0.0% | 0 | 0.0% | $0.00 | 0.0% | 0.0% | ||||||||
Thereafter(1) | 1 | 59,634 | 100.0% | 59,634 | 100.0% | $62.41 | (2) | 100.0% | 100.0% | |||||||
| Vacant | NAP | 0 | 0.0% | 59,634 | 100.0% | NAP | NAP | |||||||||
| Total / Wtd. Avg. | 1 | 59,634 | 100.0% | $62.41 | 100.0% | |||||||||||
| (1) | Soho House New York’s lease expires in on January 31, 2030. Soho House New York LLC has one, five-year extension option and no termination options. The Soho House NYC Loan is structured with a cash flow sweep related to Soho House New York’s financial performance. See “Ongoing Reserves” herein. |
| (2) | Annual U/W Base Rent PSF is based on the average of Soho House New York’s contractual rent through the Soho House NYC Loan term. Soho House New York’s current base rent is $3,100,000 ($51.98 PSF) with 4.0% contractual annual rent increases commencing January 1, 2016 through lease maturity. The in-place rent of $51.98 PSF is approximately 35.0% below the appraiser’s concluded market rent of $80.00 PSF and the Annual UW Base Rent PSF is approximately 22.0% below the appraiser’s concluded market rent. |
The Loan. The Soho House NYC loan (the “Soho House NYC Loan”) is a fixed rate loan secured by the borrower’s fee simple interest in a 59,634 sq. ft. commercial condominium unit located in New York, New York (the “Soho House NYC Property”) with an original principal balance of $45.0 million. The Soho House NYC Loan has a 10-year term and is interest only throughout the term. The Soho House NYC Loan accrues interest at a fixed rate equal to 4.5500% and has a cut-off date balance of $45.0 million. Loan proceeds along with $22.5 million of mezzanine debt and approximately $0.6 million of sponsor equity were used to acquire the Soho House NYC Property for $67.0 million, fund upfront reserves and pay closing costs of approximately $1.1 million. Based on the as-is appraised value of $70.0 million as of January 1, 2015 the cut-off date LTV ratio is 64.3%. The most recent financing of the Soho House NYC Loan was not included in a securitization.
THE INFORMATION IN THIS STRUCTURAL AND COLLATERAL TERM SHEET IS NOT COMPLETE AND MAY BE AMENDED PRIOR TO THE TIME OF SALE. THIS TERM SHEET IS NOT AN OFFER TO SELL THESE SECURITIES AND IT IS NOT A SOLICITATION OF AN OFFER TO BUY THESE SECURITIES IN ANY JURISDICTION WHERE THE OFFER OR SALE IS NOT PERMITTED.
84
29-35 9th Avenue New York, NY 10011 | Collateral Asset Summary – Loan No. 13 Soho House NYC | Cut-off Date Balance: Cut-off Date LTV: U/W NCF DSCR: U/W NOI Debt Yield: | $45,000,000 64.3% 1.79x 8.3% |
| Sources and Uses | ||||||
| Sources | Proceeds | % of Total | Uses | Proceeds | % of Total | |
| Loan Amount | $45,000,000 | 66.0% | Purchase Price(1) | $67,000,000 | 98.3% | |
Mezzanine Debt(2) | $22,500,000 | 33.0% | Reserves | $7,750 | 0.0% | |
| Sponsor Equity | $633,242 | 0.9% | Closing Costs | $1,125,492 | 1.7% | |
| Total Sources | $68,133,242 | 100.0% | Total Uses | $68,133,242 | 100.0% | |
| (1) | In 2012, the sponsor and the prior owner entered into a joint venture to purchase the building. The purchase price represents the price to acquire the prior owner’s equity stake in the building. |
| (2) | Concurrent with the origination of the Soho House NYC Loan, RP 33 Ninth Holdings, L.L.C., a subsidiary of Rockpoint Group, L.L.C. (“Rockpoint”), funded a $22,500,000 mezzanine loan. See “Current Mezzanine or Subordinate Indebtedness” herein. |
The Borrower / Sponsor. The borrower, 33 Ninth Commercial Owner LLC, is a single purpose Delaware limited liability company structured to be bankruptcy-remote with two independent directors in its organizational structure. The sponsor of the borrower and non-recourse carve-out guarantor is Joseph Cayre, the founder and chairman of Midtown Equities.
Headquartered in New York, Midtown Equities is a privately-held real estate investment and development company with a portfolio of over 100 properties that encompass over 14.0 million sq. ft. in the retail, office, residential, industrial and hospitality sectors. With 35 years of operating history, Midtown Equities maintains holdings in urban markets such as New York, Washington DC, Miami, Chicago and Los Angeles as well as abroad.
The Property. The Soho House NYC Property is a 59,634 square foot multi-level commercial condominium unit (occupying a portion of the basement and ground floor and all of the 3rd, 4th, 5th and 6th floors, plus the rooftop) within a six-story loft building located in the Meatpacking District of New York, New York. The Soho House NYC Property is 100.0% leased to Soho House New York LLC (“Soho House New York”), a subsidiary of the Soho House Group.
The building was originally developed in 1910 as a warehouse. In 2001, the prior owner of the building conducted a complete property renovation that enhanced and modernized the interior and preserved the building’s pre-war architecture. Since 2001, Soho House New York has invested more than $15.0 million ($252 PSF) in upgrading its space. Soho House New York operates the Soho House NYC Property, a private members’ club comprised of a 30-room hotel and luxury spa as well as extensive facilities including a restaurant, bar, private dining room and a 44-seat cinema. It also offers a private rooftop featuring a heated pool, bar, dining area and lounge area. The hotel may be used by both members and non-members.
Environmental Matters. The Phase I environmental report dated January 16, 2015 recommended the development and implementation of an asbestos operations and maintenance plan at the Soho House NYC Property, which is currently in place.
Tenancy.
Soho House New York. (59,634 sq. ft.; 100.0% of NRA; 100.0% of U/W Base Rent) The Soho House NYC Property is 100.0% leased to Soho House New York, which opened in 2003 and is a subsidiary of Soho House Group. Soho House Group was founded in London, in 1995, as a private members’ club for those in film, media and creative industries and has since expanded to include hotel operations, restaurants and spas with locations across Europe and the United States. As of December 2013, Soho House Group had approximately 38,000 members with a waiting list of more than 20,000 individuals and operated 11 locations globally, 16 public restaurants and 10 spas.
According to the borrower, the Soho House NYC Property has approximately 6,000 members with an additional 4,000 on the wait list. Annual membership fees range from $1,000 to $2,800.
Soho House New York has occupied the Soho House NYC Property since 2002. Concurrent with the acquisition, Soho House New York executed a 15-year triple-net lease amendment, which will expire on January 31, 2030. Base rent for the lease amendment is $3,100,000 ($51.98 PSF) with contractual annual increases of 4.0% through lease maturity. The lease is structured with one, five-year renewal option and no termination options.
The Soho House New York lease is guaranteed by US AcquireCo, Inc., the holding company for the Soho House U.S. operations, through the term of the Soho House NYC Loan.
THE INFORMATION IN THIS STRUCTURAL AND COLLATERAL TERM SHEET IS NOT COMPLETE AND MAY BE AMENDED PRIOR TO THE TIME OF SALE. THIS TERM SHEET IS NOT AN OFFER TO SELL THESE SECURITIES AND IT IS NOT A SOLICITATION OF AN OFFER TO BUY THESE SECURITIES IN ANY JURISDICTION WHERE THE OFFER OR SALE IS NOT PERMITTED.
85
29-35 9th Avenue New York, NY 10011 | Collateral Asset Summary – Loan No. 13 Soho House NYC | Cut-off Date Balance: Cut-off Date LTV: U/W NCF DSCR: U/W NOI Debt Yield: | $45,000,000 64.3% 1.79x 8.3% |
The below analysis represents Soho House New York’s pre-rent earnings before interest, depreciation, lease rent and amortization (“EBIDA”) as provided by the borrower. The current annual base rent under the Soho House New York lease is $3.1 million. Soho House New York’s Ann. YTD 10/31/2014 pre-rent EBIDA of approximately $10.0 million represents approximately 3.0x coverage to the tenant’s year-one required rent payment of $3.1 million.
Soho House NYC Tenant Property Cash Flows(1) | |||||
| 2011 | 2012 | 2013 | Ann. YTD 10/31/2014 | ||
| Room Revenue | $4,516,479 | $4,175,112 | $4,689,952 | $5,455,355 | |
| Food & Beverage Revenue | 10,515,211 | 11,708,681 | 13,697,875 | 14,609,083 | |
Other Revenue(2) | 8,254,169 | 8,978,562 | 9,886,790 | 11,135,278 | |
| Total Revenue | $23,285,859 | $24,862,354 | $28,274,617 | $31,199,716 | |
| Operating Expenses | 12,708,700 | 13,575,044 | 14,624,687 | 15,880,458 | |
| Undistributed Expenses | 3,218,419 | 2,544,554 | 3,654,570 | 3,831,493 | |
| Gross Operating Profit | $7,358,740 | $8,742,756 | $9,995,359 | $11,487,765 | |
Total Fixed Charges(3) | 913,925 | 1,141,945 | 1,211,571 | 1,454,847 | |
| Pre-Rent EBIDA | $6,444,815 | $7,600,811 | $8,783,789 | $10,032,918 | |
| (1) | Provided by the borrower. |
| (2) | Other Revenue includes membership and registration fees as well as meeting space revenue, among other things. |
| (3) | Total Fixed Charges represents real estate taxes and insurance premiums. |
The Market. The Soho House NYC Property is located on the northwest corner of West 13th Street and Ninth Avenue in the Meatpacking District of New York, New York. The Meatpacking District is located in Midtown South and is characterized by high-end boutique shops, retailers, restaurants, nightclubs and residences. Nearby developments include Chelsea Market, the High Line Park, Google’s New York headquarters and the recently constructed Whitney Museum.
According to the appraisal, Midtown South is one of the strongest office markets in the United States due to its steady rent growth and low vacancy rate. As of Q3 2014, Midtown South exhibited one of the lowest vacancy rates at 8.5% of any CBD office market in the United States. In particular, as of Q3 2014, Class A office space had an average rent of $91.22 PSF with a vacancy rate of 5.0%. As of Q3 2014, the Midtown South retail market had an average rent of $105.33 with a vacancy rate of 3.2%.
Based on the Soho House NYC Property’s current configuration, which includes approximately 700 sq. ft. of grade level retail space, the appraiser analyzed leases in six comparable retail buildings and concluded a blended triple-net market rent of $80.00 PSF. The current rent at the Soho House NYC Property is $51.98 PSF.
Comparable Set(1) | |||||||
| Name | Soho House NYC Property | 9 Ninth Avenue | 837 Washington Street | 412 West 14th Street | 155 Mercer Street | 151 Mercer Street | 437 West 16th Street |
| Tenant | Soho House New York | Restoration Hardware | Samsung | Intersect by Lexus | Dolce & Gabbana | Tory Burch | Restoration Hardware |
| Lease Start Date | Jan-15 | Sep-14 | July-14 | March-14 | Oct-13 | Oct-13 | Apr-13 |
| Term (Years) | 15.0 | 10.0 | 10.0 | 6.0 | 7.0 | 15.0 | 15.8 |
| Adjusted Rent PSF | $51.98 | $86.76 | $81.05 | $88.35 | $79.11 | $72.53 | $77.50 |
| (1) | Source: Appraisal |
Based on the Soho House NYC Property’s central location in the Meatpacking District, manageable floor plates and superior amenity space, the appraiser noted that the highest and best use of the building is for the current interim use, as a membership club for the duration of the net lease, and ultimately a redevelopment into a mixed retail and office property consistent with market demand in the immediate area. The appraiser concluded office market rents for upper floors of $100 PSF and retail rents for grade level of $400 PSF and $75 PSF to $125 PSF for upper floors. Based on these assumptions, the appraiser concluded an as-converted value of $75.0 million and as-stabilized converted value of $100.0 million.
THE INFORMATION IN THIS STRUCTURAL AND COLLATERAL TERM SHEET IS NOT COMPLETE AND MAY BE AMENDED PRIOR TO THE TIME OF SALE. THIS TERM SHEET IS NOT AN OFFER TO SELL THESE SECURITIES AND IT IS NOT A SOLICITATION OF AN OFFER TO BUY THESE SECURITIES IN ANY JURISDICTION WHERE THE OFFER OR SALE IS NOT PERMITTED.
86
29-35 9th Avenue New York, NY 10011 | Collateral Asset Summary – Loan No. 13 Soho House NYC | Cut-off Date Balance: Cut-off Date LTV: U/W NCF DSCR: U/W NOI Debt Yield: | $45,000,000 64.3% 1.79x 8.3% |
Cash Flow Analysis.
Cash Flow Analysis(1) | ||||||
| 2013 | 2014 | In Place | U/W | U/W PSF | ||
Base Rent(2) | $1,582,164 | $1,621,716 | $3,100,000 | $3,721,893 | $62.41 | |
| Value of Vacant Space | 0 | 0 | 0 | 0 | 0.00 | |
| Gross Potential Rent | $1,582,164 | $1,621,716 | $3,100,000 | $3,721,893 | $62.41 | |
| Total Recoveries | 0 | 0 | 0 | 0 | 0.00 | |
| Total Other Income | 0 | 0 | 0 | 0 | 0.00 | |
| Less: Vacancy | 0 | 0 | 0 | 0 | 0.00 | |
| Effective Gross Income | $1,582,164 | $1,621,716 | $3,100,000 | $3,721,893 | $62.41 | |
| Total Operating Expenses | 0 | 0 | 0 | 0 | 0.00 | |
| Net Operating Income | $1,582,164 | $1,621,716 | $3,100,000 | $3,721,893 | $62.41 | |
| TI/LC | 0 | 0 | 0 | 0 | 0.00 | |
| Capital Expenditures | 0 | 0 | 0 | 11,927 | 0.20 | |
| Net Cash Flow | $1,582,164 | $1,621,716 | $3,100,000 | $3,709,966 | $62.21 | |
| (1) | In-Place NOI represents the current annual base rent under the lease for 2015. 2012-2014 Historical NOI represents the annual base rent according to the prior lease terms. |
| (2) | U/W Base Rent is based on the average of Soho House New York’s contractual rent through the Soho House NYC Loan term. Soho House New York’s current base rent is $3,100,000 ($51.98 PSF) with 4.0% contractual annual rent increases commencing January 1, 2016 through lease maturity. The in-place rent of $51.98 PSF is approximately 35.0% below the appraiser’s concluded market rent of $80.00 PSF and the UW Base Rent PSF is approximately 22.0% below the appraiser’s concluded market rent. |
Property Management. The Soho House NYC Property is self-managed.
Lockbox / Cash Management. The Soho House NYC Loan is structured with a hard lockbox and in place cash management. The borrower sent a tenant direction letter to the tenant instructing it to deposit all rents and other payments directly into the lockbox account controlled by the lender. All amounts in the lockbox account are transferred on each business day to a cash management account controlled by the lender. Prior to the occurrence of a Cash Trap Period (as defined below), all excess funds on deposit in the cash management account after payment of debt service, lender approved operating expenses (which include condominium common charges) and required deposits into reserve accounts are disbursed to the Mezzanine Lender (as defined below) to be applied in accordance with the terms of the mezzanine loan documents. During a Cash Trap Period, a full excess cash flow sweep will occur and all such amounts will be held by lender as additional collateral for the Soho House NYC Loan.
A “Cash Trap Period” will commence upon (i) an event of default under the Soho House NYC Loan, (ii) any bankruptcy action of the borrower, guarantor or property manager (iii) an event of default under the Soho House New York lease (iv) the Soho House New York (a) terminates or gives notice of its intent to terminate its lease, (b) is involved in a bankruptcy action or becomes insolvent, (c) “goes dark”, or (d) fails to operate the premises as described in the related lease, (v) lender’s determination that the tenant’s EBIDAR Ratio is less than 1.50x on a trailing-twelve month basis or (vi) the borrower’s failure to deliver to lender any financial statements of Soho House New York, as required under the Soho House NYC Loan documents.
The “EBIDAR Ratio” is the ratio of the earnings of Soho House New York before interest, depreciation, lease rent, amortization and non-cash stock-based compensation to the then-annual Soho House New York lease rent, as determined by lender.
Initial Reserves. At closing, the borrower deposited $7,750 into an immediate repairs reserve account, which represents 125% of the engineer’s recommendation.
Ongoing Reserves. The borrower is required to deposit $994 monthly ($0.20 PSF annually) into the replacement reserve. The tenant is responsible for paying taxes and the condominium association is responsible for paying insurance premiums. As such, the borrower is not required to deposit 1/12 of the annual taxes and annual insurance premiums unless (i) there is an event of default under the Soho House NYC Loan, (ii) Soho House New York fails to pay taxes directly or (iii) the condominium association fails to pay insurance premiums directly. Additionally, if the borrower fails to pay condominium common charges when due and payable, the borrower will be required to deposit monthly the condominium common charges that will be payable for the following month into a condominium common charge reserve account.
THE INFORMATION IN THIS STRUCTURAL AND COLLATERAL TERM SHEET IS NOT COMPLETE AND MAY BE AMENDED PRIOR TO THE TIME OF SALE. THIS TERM SHEET IS NOT AN OFFER TO SELL THESE SECURITIES AND IT IS NOT A SOLICITATION OF AN OFFER TO BUY THESE SECURITIES IN ANY JURISDICTION WHERE THE OFFER OR SALE IS NOT PERMITTED.
87
29-35 9th Avenue New York, NY 10011 | Collateral Asset Summary – Loan No. 13 Soho House NYC | Cut-off Date Balance: Cut-off Date LTV: U/W NCF DSCR: U/W NOI Debt Yield: | $45,000,000 64.3% 1.79x 8.3% |
Current Mezzanine or Subordinate Indebtedness. Concurrent with the origination of the Soho House NYC Loan, RP 33 Ninth Holdings, L.L.C. (the “Mezzanine Lender”), a subsidiary of Rockpoint Group, L.L.C. (“Rockpoint”), funded a $22.5 million mezzanine loan. The mezzanine loan is coterminous with the Soho House NYC Loan and is interest only. The mezzanine loan accrues interest at a base rate of 9.0000%, provided that only 3.0000% will be due on a current basis if the net cash flow is not sufficient to pay the full interest due and the remaining interest will be deferred. Notwithstanding the foregoing, the mezzanine borrower is required to make monthly payments based on a 3.0000% interest rate regardless of whether net cash flow is sufficient to pay such amount. So long as no Cash Trap Period is in effect, all excess cash flow after payment of debt service for the Soho House NYC Loan and any other amounts then due and payable under the Soho House NYC Loan will be disbursed to the Mezzanine Lender for payment of mezzanine debt service and other amounts due under the mezzanine loan documents. So long as the mezzanine loan is outstanding, no disbursements will be remitted by lender to the borrower.
Rockpoint is a real estate private equity firm and investment advisor headquartered in Boston. Since its inception in 2003, Rockpoint has sponsored seven commingled funds and four co-investment vehicles, raising more than $9.0 billion in capital commitments. Recent transactions in New York, New York include 299 Park Avenue, 1440 Broadway, Manhattan at Times Square, One SoHo Square and Park Central Hotel.
Future Mezzanine or Subordinate Indebtedness Permitted. None.
THE INFORMATION IN THIS STRUCTURAL AND COLLATERAL TERM SHEET IS NOT COMPLETE AND MAY BE AMENDED PRIOR TO THE TIME OF SALE. THIS TERM SHEET IS NOT AN OFFER TO SELL THESE SECURITIES AND IT IS NOT A SOLICITATION OF AN OFFER TO BUY THESE SECURITIES IN ANY JURISDICTION WHERE THE OFFER OR SALE IS NOT PERMITTED.
88
29-35 9th Avenue New York, NY 10011 | Collateral Asset Summary – Loan No. 13 Soho House NYC | Cut-off Date Balance: Cut-off Date LTV: U/W NCF DSCR: U/W NOI Debt Yield: | $45,000,000 64.3% 1.79x 8.3% |
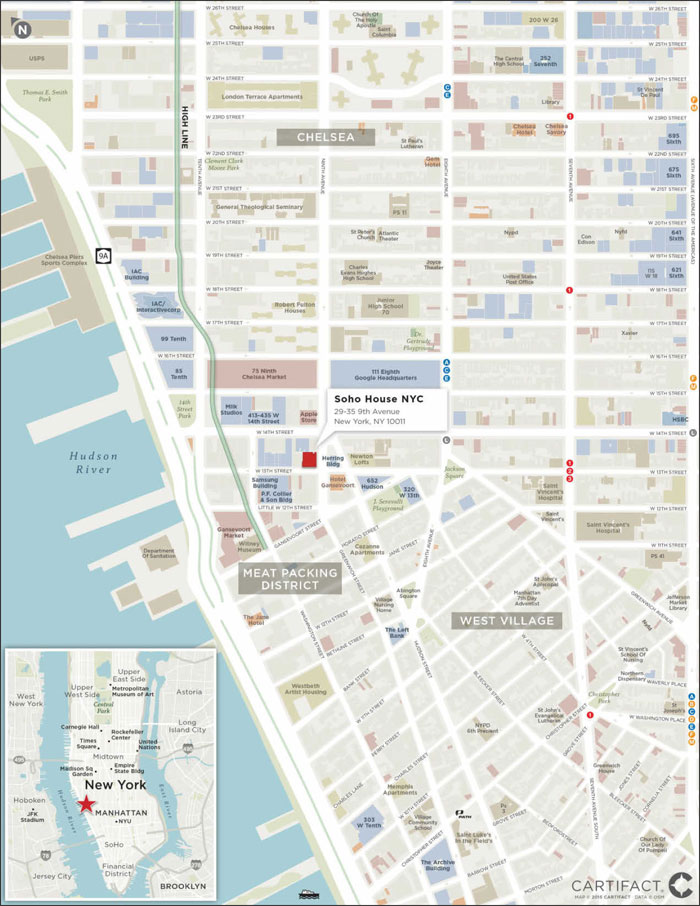
THE INFORMATION IN THIS STRUCTURAL AND COLLATERAL TERM SHEET IS NOT COMPLETE AND MAY BE AMENDED PRIOR TO THE TIME OF SALE. THIS TERM SHEET IS NOT AN OFFER TO SELL THESE SECURITIES AND IT IS NOT A SOLICITATION OF AN OFFER TO BUY THESE SECURITIES IN ANY JURISDICTION WHERE THE OFFER OR SALE IS NOT PERMITTED.
89
1 Market Street Camden, NJ 08102 | Collateral Asset Summary – Loan No. 14 The Victor Waterfront Lofts | Cut-off Date Balance: Cut-off Date LTV: U/W NCF DSCR: U/W NOI Debt Yield: | $42,750,000 74.6% 1.37x 8.5% |
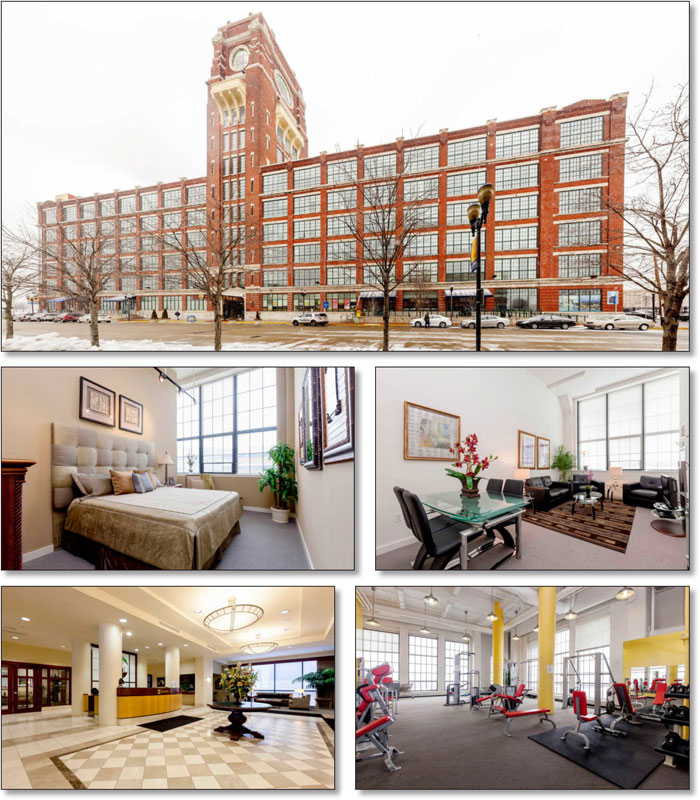
THE INFORMATION IN THIS STRUCTURAL AND COLLATERAL TERM SHEET IS NOT COMPLETE AND MAY BE AMENDED PRIOR TO THE TIME OF SALE. THIS TERM SHEET IS NOT AN OFFER TO SELL THESE SECURITIES AND IT IS NOT A SOLICITATION OF AN OFFER TO BUY THESE SECURITIES IN ANY JURISDICTION WHERE THE OFFER OR SALE IS NOT PERMITTED.
90
1 Market Street Camden, NJ 08102 | Collateral Asset Summary – Loan No. 14 The Victor Waterfront Lofts | Cut-off Date Balance: Cut-off Date LTV: U/W NCF DSCR: U/W NOI Debt Yield: | $42,750,000 74.6% 1.37x 8.5% |
| Mortgage Loan Information | |
| Loan Seller: | CCRE |
| Loan Purpose: | Refinance |
| Sponsor: | Carl E. Dranoff |
| Borrower: | Victor Urban Renewal Group LLC; Victor Associates, L.P. |
| Original Balance: | $42,750,000 |
| Cut-off Date Balance: | $42,750,000 |
| % by Initial UPB: | 3.3% |
| Interest Rate: | 4.3355% |
| Payment Date: | 6th of each month |
| First Payment Date: | April 6, 2015 |
| Maturity Date: | March 6, 2025 |
| Amortization: | Interest only for first 24 months; 360 months thereafter |
Additional Debt(1): | $5,000,000 Mezzanine Debt |
| Call Protection: | L(24), D(92), O(4) |
Lockbox / Cash Management(2): | Soft / In Place |
Reserves(3) | ||
| Initial | Monthly | |
| Taxes: | $83,335 | $16,667 |
| Insurance: | $182,522 | $15,402 |
| Replacement: | $0 | $11,668 |
| TI/LC: | $0 | $2,012 |
| Required Repairs: | $55,000 | NAP |
| Financial Information | ||
| Mortgage Loan | Total Debt | |
| Cut-off Date Balance / Unit: | $125,367 | $140,029 |
| Balloon Balance / Unit: | $106,605 | $121,267 |
| Cut-off Date LTV: | 74.6% | 83.3% |
| Balloon LTV: | 63.4% | 72.2% |
Underwritten NOI DSCR(4): | 1.42x | 1.18x |
Underwritten NCF DSCR(4): | 1.37x | 1.13x |
| Underwritten NOI Debt Yield: | 8.5% | 7.6% |
| Underwritten NCF Debt Yield: | 8.2% | 7.3% |
| Underwritten NOI Debt Yield at Balloon: | 10.0% | 8.8% |
| Underwritten NCF Debt Yield at Balloon: | 9.6% | 8.5% |
| Property Information | |
| Single Asset / Portfolio: | Single Asset |
| Property Type: | Mid Rise Multifamily |
Collateral(5): | Fee Simple |
| Location: | Camden, NJ |
| Year Built / Renovated: | 1918 / 2004 |
Total Units(6): | 341 |
| Property Management: | Dranoff Properties, Inc. |
| Underwritten NOI: | $3,626,273 |
| Underwritten NCF: | $3,497,026 |
| Appraised Value: | $57,300,000 |
| Appraisal Date: | December 5, 2014 |
Historical NOI(7) | |
| Most Recent NOI: | $3,410,325 (T-12 November 30, 2014) |
| 2013 NOI: | $3,274,242 (December 31, 2013) |
| 2012 NOI: | $3,127,078 (December 31, 2012) |
| 2011 NOI: | $3,618,613 (December 31, 2011) |
Historical Occupancy(7)(8) | |
| Most Recent Occupancy: | 91.2% (February 24, 2015) |
| 2013 Occupancy: | 86.2% (December 31, 2013) |
| 2012 Occupancy: | 83.9% (December 31, 2012) |
| 2011 Occupancy: | 91.8% (December 31, 2011) |
| (1) | See “Current Mezzanine or Subordinate Indebtedness” herein. |
| (2) | A hard lockbox is required for all commercial tenants at the Victor Waterfront Lofts Property. |
| (3) | See “Initial Reserves” and “Ongoing Reserves” herein. |
| (4) | Based on amortizing debt service payments. Based on the current interest only payments, Mortgage Loan Underwritten NOI DSCR and Mortgage Loan Underwritten NCF DSCR are 1.93x and 1.86x, respectively. |
| (5) | Collateral for the Victor Waterfront Lofts Loan includes both the fee simple and leasehold interests in the Victor Waterfront Lofts Property. See “The Borrower / Sponsor” herein. |
| (6) | The Victor Waterfront Lofts Property includes 341 residential units, 24,141 sq. ft. of commercial space and 362 parking spaces. See “The Property” herein. |
| (7) | The decrease in Historical NOI and Historical Occupancy is primarily the result of a proposed merger between Rutgers-Camden Law School and Rowan University that was announced in January 2012. If the merger had taken place, the Rutgers Law School would have become part of Rowan University. The uncertainty of the merger resulted in a decline in enrollment and consequently decreased graduate student occupants at the Victor Waterfront Lofts Property. The merger was called off by the New Jersey state legislature in June 2012 and occupancy levels and income levels began to stabilize. |
| (8) | Historical Occupancy represents only the multifamily component of the Victor Waterfront Lofts Loan. |
THE INFORMATION IN THIS STRUCTURAL AND COLLATERAL TERM SHEET IS NOT COMPLETE AND MAY BE AMENDED PRIOR TO THE TIME OF SALE. THIS TERM SHEET IS NOT AN OFFER TO SELL THESE SECURITIES AND IT IS NOT A SOLICITATION OF AN OFFER TO BUY THESE SECURITIES IN ANY JURISDICTION WHERE THE OFFER OR SALE IS NOT PERMITTED.
91
1 Market Street Camden, NJ 08102 | Collateral Asset Summary – Loan No. 14 The Victor Waterfront Lofts | Cut-off Date Balance: Cut-off Date LTV: U/W NCF DSCR: U/W NOI Debt Yield: | $42,750,000 74.6% 1.37x 8.5% |
Multifamily Unit Mix Summary(1) | |||||||
| Unit Type | # of Units | % of Total | Avg. Unit Size (Sq. Ft.) | Avg. Monthly Rental Rate | Avg. Monthly Rental Rate PSF | Market Monthly Rental Rate | Market Monthly Rate PSF |
| Studio | 10 | 2.9% | 614 | $895 | $1.46 | $995 | $1.62 |
| 1 Bed | 235 | 68.9% | 943 | $1,154 | $1.22 | $1,186 | $1.26 |
| 2 Bed | 78 | 22.9% | 1,269 | $1,293 | $1.02 | $1,684 | $1.33 |
| 3 Bed | 18 | 5.3% | 1,426 | $1,593 | $1.12 | $1,690 | $1.19 |
| Total / Wtd. Avg. | 341 | 100.0% | 1,034 | $1,201 | $1.16 | $1,321 | $1.28 |
| (1) | Source: Underwritten Rent Roll. |
The Loan. The Victor Waterfront Lofts loan (the “Victor Waterfront Lofts Loan”) is a fixed rate loan secured by the borrowers’ fee simple and leasehold interest in a 341 unit midrise multifamily building with nine ground floor retail units and 362 parking spaces located at One Market Street in Camden, New Jersey (the “Victor Waterfront Lofts Property”) with an original and cut-off date principal balance of $42.75 million. The Victor Waterfront Lofts Loan has a 10-year term and amortizes on a 30-year schedule after an initial 24-month interest only period. The Victor Waterfront Lofts Loan accrues interest at a fixed rate equal to 4.3355%. Loan proceeds along with a $5.0 million mezzanine loan were used to retire existing debt of approximately $35.2 million, fund upfront reserves of approximately $321,000 and pay closing costs. Based on the appraised value of $57.3 million as of December 5, 2014, the cut-off date LTV ratio is 74.6%. The most recent prior financing of the Victor Waterfront Lofts Property was not included in a prior conduit securitization.
| Sources and Uses | |||||||
| Sources | Proceeds | % of Total | Uses | Proceeds | % of Total | ||
| Mortgage Loan Amount | $42,750,000 | 89.5% | Loan Payoff | $35,229,478 | 73.8% | ||
| Mezzanine Loan Amount | $5,000,000 | 10.5% | Closing Costs | $904,059 | 1.9% | ||
| Reserves | $320,857 | 0.7% | |||||
| Return of Equity | $11,295,607 | 23.7% | |||||
| Total Sources | $47,750,000 | 100.0% | Total Uses | $47,750,000 | 100.0% | ||
The Borrower / Sponsor. The borrowers are Victor Urban Renewal Group LLC, a single purpose New Jersey limited liability company (the “Fee Borrower”), and Victor Associates, L.P., a single purpose New Jersey limited partnership (the “Leasehold Borrower”), each structured to be bankruptcy-remote, with two independent directors in its organizational structure. The Fee Borrower’s interest in the Victor Waterfront Lofts Property is subject to a Ground Lease (as defined and described below under “Ground Lease”) with the Leasehold Borrower for the purpose of maintaining a PILOT Agreement (as defined and described below under “PILOT Agreement”) with The City of Camden. The Leasehold Borrower is the sole member of the Fee Borrower. The Victor Waterfront Lofts Loan is secured by a first priority lien on both the Fee Borrower’s interest and Leasehold Borrower’s interest in the Victor Waterfront Lofts Property. The sponsor of the borrowers and the nonrecourse carve-out guarantor is Carl E. Dranoff.
Carl E. Dranoff is the president and founder of Dranoff Properties, a full-service real estate company specializing in designing, constructing, managing, and owning core urban residential properties. Carl E. Dranoff currently owns and manages a real estate portfolio of approximately 1.8 million sq. ft. of multifamily and mixed use properties located in Pennsylvania and New Jersey. Dranoff Properties is based in Philadelphia and Mr. Dranoff has over 30 years of experience in multifamily and mixed use development and ownership. Dranoff Properties leases approximately 6,228 sq. ft., or approximately 1.6% of the total building net rentable area and 1.7% of gross potential residential and commercial rent, of the ground floor retail space located at the Victor Waterfront Lofts Property that will be utilized as an administrative and leasing office by the sponsor.
The Property. The Victor Waterfront Lofts Property is comprised of a class-A, six-story multifamily building containing 341 residential units and 9 ground-floor commercial units as well as 362 parking spaces located in Camden, New Jersey. Building amenities include 272 open parking spaces and 90 covered parking spaces, 24-hour concierge service, private storage rooms, hospitality suites, two-story fitness center, clubroom, furnished lounge areas and rooftop terrace. Individual unit amenities include 14-20 foot ceilings and oversized closets as well as unobstructed views of the City of Philadelphia and the surrounding area for riverfront units. Interior units on the second floor also offer private patios.
The Victor Waterfront Lofts Property was previously used as a manufacturing facility by RCA and is now listed on the National Register of Historic Places. The sponsor acquired the Victor Waterfront Lofts Property in 2002 as a vacant industrial building and converted the Victor Waterfront Lofts Property in 2004 into the first luxury rental community on the Camden Waterfront for approximately $61.2 million. The Victor Waterfront Lofts Property multifamily units were 91.2% occupied as of February 24, 2015. The nine commercial units located at the Victor Waterfront Lofts Property total 24,141 sq. ft. and represents 6.3% of the total building SF and 8.3% of gross potential residential and commercial income. As of February 24, 2015, the Victor Apartment Property commercial units were 95.7% occupied.
THE INFORMATION IN THIS STRUCTURAL AND COLLATERAL TERM SHEET IS NOT COMPLETE AND MAY BE AMENDED PRIOR TO THE TIME OF SALE. THIS TERM SHEET IS NOT AN OFFER TO SELL THESE SECURITIES AND IT IS NOT A SOLICITATION OF AN OFFER TO BUY THESE SECURITIES IN ANY JURISDICTION WHERE THE OFFER OR SALE IS NOT PERMITTED.
92
1 Market Street Camden, NJ 08102 | Collateral Asset Summary – Loan No. 14 The Victor Waterfront Lofts | Cut-off Date Balance: Cut-off Date LTV: U/W NCF DSCR: U/W NOI Debt Yield: | $42,750,000 74.6% 1.37x 8.5% |
The Victor Waterfront Lofts Property is located on an entire city block with frontage along three arterials, Market Street, Delaware Avenue and Cooper Street, and one connector street, Front Street. Riverline light rail system stops are located three blocks south and east of the Victor Riverfront Lofts Property at the Aquarium as well as the Cooper Street/Rutgers University stop, which provide access to Trenton and the New Jersey Transit system. The PATCO line is also available five blocks east on Market Street at the intersection of 5th street, which provides access to Philadelphia. The Victor Waterfront Lofts Property is located proximate to the L3 Communications Building, Copper University Hospital and Susquehanna Bank Center. Several noteworthy universities and colleges are located throughout the city and surrounding area, including Rowan University and Rutgers University, which have campuses in Camden located in close proximity to The Victor Waterfront Lofts Property. Approximately 90 colleges and universities in Greater Philadelphia provide higher education for roughly 368,000 full and part-time students. These institutions graduate more than 66,000 students each year, and employ tens of thousands of more people. Within a 1-, 3- and 5-mile radius, the 2014 population was 20,126, 368,180 and 803,011, respectively, and the 2014 average household income was $62,499, $56,352 and $49,520, respectively.
Environmental Matters. The Phase I environmental report dated February 24, 2015 recommended the development and implementation of an asbestos operations and maintenance plan and a lead-based paint operations and maintenance plan, which are in place. Certain environmental conditions exist at the Victor Waterfront Lofts Property and, according to the Phase I environmental report, the remediation is the responsibility of the local government. For more information, see “Risk Factors—Commercial and Multifamily Mortgage Loans Are Subject to Certain Risks Which Could Adversely Affect the Performance of Your Offered Certificates—Environmental Issues at the Mortgaged Properties May Adversely Affect Payments on Your Certificates” and “—Potential Issuing Entity Liability Related to a Materially Adverse Environmental Condition” and “Certain Legal Aspects of Mortgage Loans—Environmental Considerations” in the Free Writing Prospectus.
The Market. The Victor Waterfront Lofts Property is located in the Camden/Cherry Hill submarket of the Philadelphia area multifamily market. As of 3Q 2014, significant development plans in the Philadelphia region had begun, specifically within the City of Camden. Holtec International, an Evesham, New Jersey based nuclear products provider, received $260 million in tax credits over ten years to relocate to Camden City. Additionally, Holtec is expected to spend $260 million on the construction of a 600,000 sq. ft. plant on the Camden Waterfront. Another addition to the Camden Waterfront is the arrival of the Philadelphia 76’ers training facility. The 76’ers received $82 million in tax credits to move its facility over the Ben Franklin Bridge to the Camden Waterfront. A 110,000 square foot facility with an anticipated completion date of 2016 is expected to house the team’s practice facility as well as the team’s business operations. Most recently, in December 2014, Subaru of America had been approved by the state for $118 million in tax credits to move to Camden and is planning on constructing a 250,000 sq. ft. headquarters and a 70,000 sq. ft. service engineering center at the Camden site. Subaru would be the first occupant of a 45-acre redevelopment project totaling 1.0 million sq. ft., the Gateway District, overseen by the master developer Campbell Soup. Campbell Soup was founded in and currently maintains its world corporate headquarters in Camden, where it employs 1,200 people.
As of 3Q 2014, the Philadelphia area multifamily market was 95.3% occupied for buildings constructed after 2000 with effective rents of $1,635 per unit per month. Midrise properties with the Philadelphia multifamily market were 96.1% occupied with effective rents of $1,310 per unit per month. As of 3Q 2014, the Camden/Cherry Hill multifamily market was 95.7% occupied for buildings constructed after 2000 with effective rents of $1,537 per unit per month. Midrise properties within the Camden/Cherry Hill multifamily submarket were 96.4% occupied with effective rents of $1,294 per unit per month. The appraiser concluded studio, one-bedroom, two-bedroom and three-bedroom rents per unit per month of $995, $1,186, $1,684 and $1,690, respectively, above the Victor Waterfront Lofts Property underwritten studio, one-bedroom, two-bedroom and three-bedroom rents per unit per month of $895, $1,154, $1,293 and $1,593, respectively.
THE INFORMATION IN THIS STRUCTURAL AND COLLATERAL TERM SHEET IS NOT COMPLETE AND MAY BE AMENDED PRIOR TO THE TIME OF SALE. THIS TERM SHEET IS NOT AN OFFER TO SELL THESE SECURITIES AND IT IS NOT A SOLICITATION OF AN OFFER TO BUY THESE SECURITIES IN ANY JURISDICTION WHERE THE OFFER OR SALE IS NOT PERMITTED.
93
1 Market Street Camden, NJ 08102 | Collateral Asset Summary – Loan No. 14 The Victor Waterfront Lofts | Cut-off Date Balance: Cut-off Date LTV: U/W NCF DSCR: U/W NOI Debt Yield: | $42,750,000 74.6% 1.37x 8.5% |
Cash Flow Analysis.
| Cash Flow Analysis | |||||||
| 2010 | 2011 | 2012 | 2013 | T-12 11/30/2014 | U/W | U/W per Unit | |
| Gross Potential Rent | $5,090,178 | $4,941,019 | $4,743,219 | $4,767,874 | $4,879,935 | $5,481,680 | $16,075 |
Total Other Income(1) | 456,425 | 438,178 | 447,295 | 462,015 | 506,823 | 506,823 | 1,486 |
Net Commercial Income(2) | 389,593 | 406,555 | 373,964 | 390,689 | 351,816 | 505,152 | 1,481 |
Less: Vacancy, Credit Loss & Concessions (3) | 0 | 0 | 0 | 0 | 0 | (527,259) | (1,546) |
| Effective Gross Income | $5,936,196 | $5,785,751 | $5,564,478 | $5,620,578 | $5,738,574 | $5,966,396 | $17,497 |
| Total Operating Expenses | 2,235,749 | 2,167,139 | 2,437,401 | 2,346,336 | 2,328,249 | 2,340,123 | 6,863 |
| Net Operating Income | $3,700,446 | $3,618,613 | $3,127,078 | $3,274,242 | $3,410,325 | $3,626,273 | $10,634 |
Capital Expenditures(4) | 0 | 0 | 0 | 0 | 0 | 129,247 | 379 |
| Net Cash Flow | $3,700,446 | $3,618,613 | $3,127,078 | $3,274,242 | $3,410,325 | $3,497,026 | $10,255 |
| (1) | Total Other Income consists of parking income, maintenance income, move out fees, fitness room fees, vending machine income, late fees, application fees, lock/key income and other miscellaneous income. |
| (2) | Net Commercial Income represents the gross potential commercial rent with an underwritten vacancy of 10.0%. The increase in Net Commercial Income from T-12 11/30/2014 to U/W is primarily the result of newly executed commercial leases with the affiliated property manager (approximately 6,228 sq. ft.). The Victor Waterfront Lofts Property commercial units are currently 95.7% occupied. |
| (3) | U/W Vacancy, Credit Loss & Concessions represents 9.6% of U/W Gross Potential Rent, which is greater than the appraiser’s concluded vacancy rate of 8.0% and the in-place physical vacancy of 8.8%. The 9.6% U/W Vacancy & Credit Loss results in an U/W multifamily unit only effective gross income equal to the T-12 11/30/2014 multifamily only effective gross income. |
| (4) | Capital Expenditures is comprised of (i) $298 per unit as recommended by the property condition report for each residential unit, (ii) $1.00 PSF for future TI/LCs for each commercial unit and (iii) $0.15 PSF for each commercial unit. |
Property Management. The Victor Waterfront Lofts Property is managed by Dranoff Properties, Inc., an affiliate of the borrowers.
Lockbox / Cash Management. The Victor Waterfront Lofts Loan is structured with (i) a soft lockbox for residential units, (ii) a hard lockbox for commercial units and (iii) in place cash management. A full excess cash flow sweep is required upon (i) an event of default, (ii) the failure by the borrowers to maintain a debt service coverage ratio of at least 1.05x for two consecutive calendar quarters, (iii) the commencement of an event of default under the Victor Waterfront Lofts Mezzanine Loan (as defined and described below under “Current Mezzanine or Subordinate Indebtedness”), or (iv) the failure of Dranoff Properties Inc. to take physical occupancy of, and open for business in, the Dranoff Space (as defined below), and commence paying rent required under the Dranoff Properties Inc. leases associated with the Dranoff Space, within 90 days of the origination of the Victor Waterfront Lofts Loan pursuant to the Dranoff Properties Inc. leases.
The “Dranoff Space” represents approximately 6,228 sq. ft., or approximately 1.6% of the total building net rentable area and 1.7% of gross potential residential and commercial rent, of the ground floor retail space located at the Victor Waterfront Lofts Property that will be utilized as an administrative and leasing office by the sponsor.
Initial Reserves. At closing, the borrowers deposited (i) $83,335 into a tax reserve account, (ii) $182,522 into an insurance reserve account and (iii) $55,000 into a required repairs reserve account, which represents 125% of the engineer’s recommendation.
Ongoing Reserves. On a monthly basis, the borrowers are required to deposit (i) (a) if the PILOT Agreement (as defined below) is then in effect and there are any payments due and owing thereunder, an amount equal to 1/12 of the Annual Service Charge (as defined under the PILOT Agreement), which currently equates to $16,667, or otherwise (b) 1/12 of the taxes that the lender estimates will be payable during the next ensuing 12 months in order to pay all taxes at least 30 days prior to their respective due dates, into a tax reserve account, (ii) 1/12 of the annual insurance premiums, which currently equates to $15,402, into an insurance reserve account, (iii) $11,367 (approximately $400 per residential unit annually) into a replacement reserve account for residential capital expenditures, (iv) $302 (approximately $0.15 per commercial sq. ft. annually) into a replacement reserve account for commercial capital expenditures and (v) $2,012 (approximately $1.00 per commercial sq. ft. annually) into a TI/LC reserve account for possible future TILC’s related to the commercial space.
Current Mezzanine or Subordinate Indebtedness. A $5,000,000 mezzanine loan (the “Victor Waterfront Lofts Mezzanine Loan”) was funded concurrently with the origination of the Victor Waterfront Lofts Loan. The Victor Waterfront Lofts Mezzanine Loan is co-terminous with the Victor Waterfront Lofts Loan, accrues interest at a rate of 10.5000% and is interest only for the duration of the term. An intercreditor agreement with respect the Victor Apartments Mezzanine Loan is in place with respect to the Victor Waterfront Lofts Loan and the Victor Waterfront Lofts Mezzanine Loan. The current holder of the Victor Waterfront Lofts Mezzanine Loan is Soma Specialty Finance LLC, an affiliate of Axonic Capital LLC. Axonic Capital LLC is a New York based trading and investment firm
THE INFORMATION IN THIS STRUCTURAL AND COLLATERAL TERM SHEET IS NOT COMPLETE AND MAY BE AMENDED PRIOR TO THE TIME OF SALE. THIS TERM SHEET IS NOT AN OFFER TO SELL THESE SECURITIES AND IT IS NOT A SOLICITATION OF AN OFFER TO BUY THESE SECURITIES IN ANY JURISDICTION WHERE THE OFFER OR SALE IS NOT PERMITTED.
94
1 Market Street Camden, NJ 08102 | Collateral Asset Summary – Loan No. 14 The Victor Waterfront Lofts | Cut-off Date Balance: Cut-off Date LTV: U/W NCF DSCR: U/W NOI Debt Yield: | $42,750,000 74.6% 1.37x 8.5% |
founded in 2010 that manages client capital through structured credit strategies. Axonic Capital LLC and its affiliates currently manage over $2.5 billion in assets.
Future Mezzanine or Subordinate Indebtedness Permitted. None.
Ground Lease. The Victor Waterfront Lofts Property is subject to a long term ground lease (the “Ground Lease”) between the Fee Owner and Leasehold Owner that commenced on October 17, 2002 (the “Commencement Date”) and expires on October 17, 2052. The Ground Lease obligates the Leasehold Borrower to make annual payments of $1,333,333 (payable monthly) to the Fee Borrower (the “Ground Lease Payment”) for the duration of the Ground Lease term. Additionally, as a co-borrower, the Fee Owner’s interest in the Victor Waterfront Lofts Property is encumbered by the mortgage securing the Victor Waterfront Lofts Loan.
PILOT Agreement. The Fee Borrower is subject to a PILOT Agreement (the “PILOT Agreement”) with The City of Camden that commenced August 21, 2002 and expires on the earlier (i) August 21, 2037 and (ii) 30 years from the date of the completion of the Victor Waterfront Lofts Property. The PILOT Agreement grants to the Fee Borrower an exemption from all real property taxation on Victor Waterfront Lofts Property. In lieu of paying any existing or new real estate or other taxes against the Victor Waterfront Lofts Property, the Fee Borrower is required to make an annual payment to The City of Camden (payable quarterly) in an amount equal to the Annual Service Charge (as defined below). The “Annual Service Charge” is equal to (i) 15.0% of the Ground Lease Payment during years one through 15 of the Pilot Agreement term, (ii) the greater of 15.0% of the Ground Lease Payment during years 16 through 20 and 20.0% of taxes otherwise due with respect to the Victor Waterfront Lofts Property, (iii) the greater of 15.0% of the Ground Lease Payment during years 21 through 27 and 40.0% of taxes otherwise due with respect to the Victor Waterfront Lofts Property, and (iv) the greater of 15.0% of the Ground Lease Payment during years 28 through 30 and 60.0% of taxes otherwise due with respect to the Victor Waterfront Lofts Property. Notwithstanding the foregoing, the minimum Annual Service Charge will be equal to the last full tax year in which the Victor Waterfront Lofts Property was subject to taxation.
THE INFORMATION IN THIS STRUCTURAL AND COLLATERAL TERM SHEET IS NOT COMPLETE AND MAY BE AMENDED PRIOR TO THE TIME OF SALE. THIS TERM SHEET IS NOT AN OFFER TO SELL THESE SECURITIES AND IT IS NOT A SOLICITATION OF AN OFFER TO BUY THESE SECURITIES IN ANY JURISDICTION WHERE THE OFFER OR SALE IS NOT PERMITTED.
95
1 Market Street Camden, NJ 08102 | Collateral Asset Summary – Loan No. 14 The Victor Waterfront Lofts | Cut-off Date Balance: Cut-off Date LTV: U/W NCF DSCR: U/W NOI Debt Yield: | $42,750,000 74.6% 1.37x 8.5% |

THE INFORMATION IN THIS STRUCTURAL AND COLLATERAL TERM SHEET IS NOT COMPLETE AND MAY BE AMENDED PRIOR TO THE TIME OF SALE. THIS TERM SHEET IS NOT AN OFFER TO SELL THESE SECURITIES AND IT IS NOT A SOLICITATION OF AN OFFER TO BUY THESE SECURITIES IN ANY JURISDICTION WHERE THE OFFER OR SALE IS NOT PERMITTED.
96
(THIS PAGE INTENTIONALLY LEFT BLANK)
97
1000 Northeast Multnomah Street Portland, OR 97232 | Collateral Asset Summary – Loan No. 15 DoubleTree by Hilton Portland Leased Fee | Cut-off Date Balance: Cut-off Date LTV: U/W NCF DSCR: U/W NOI Debt Yield: | $40,500,000 90.0% 1.45x 6.1% |
THE INFORMATION IN THIS STRUCTURAL AND COLLATERAL TERM SHEET IS NOT COMPLETE AND MAY BE AMENDED PRIOR TO THE TIME OF SALE. THIS TERM SHEET IS NOT AN OFFER TO SELL THESE SECURITIES AND IT IS NOT A SOLICITATION OF AN OFFER TO BUY THESE SECURITIES IN ANY JURISDICTION WHERE THE OFFER OR SALE IS NOT PERMITTED.
98
1000 Northeast Multnomah Street Portland, OR 97232 | Collateral Asset Summary – Loan No. 15 DoubleTree by Hilton Portland Leased Fee | Cut-off Date Balance: Cut-off Date LTV: U/W NCF DSCR: U/W NOI Debt Yield: | $40,500,000 90.0% 1.45x 6.1% |
| Mortgage Loan Information | |
| Loan Seller: | CCRE |
| Loan Purpose: | Acquisition |
| Sponsor: | OZNJ Real Estate Opportunities, L.P. |
| Borrower: | Portland ON Owner LLC |
| Original Balance: | $40,500,000 |
| Cut-off Date Balance: | $40,500,000 |
| % by Initial UPB: | 3.1% |
| Interest Rate: | 4.1500% |
| Payment Date: | 6th of each month |
| First Payment Date: | January 6, 2015 |
| Anticipated Repayment Date: | December 6, 2024 |
| Maturity Date: | December 6, 2029 |
Amortization(1): | Interest Only, ARD |
| Additional Debt: | None |
Call Protection(2): | L(27), D(87), O(6) |
| Lockbox / Cash Management: | Springing Hard / Springing |
Reserves(3) | ||
| Initial | Monthly | |
| Taxes: | $0 | Springing |
| Insurance: | $0 | Springing |
| FF&E: | $0 | Springing |
| Financial Information | ||||
Cut-off Date Balance / Sq. Ft.(4): | $205 | |||
Balloon Balance / Sq. Ft.(4): | $205 | |||
| Cut-off Date LTV: | 90.0% | |||
| Balloon LTV: | 90.0% | |||
| Underwritten NOI DSCR: | 1.45x | |||
| Underwritten NCF DSCR: | 1.45x | |||
| Underwritten NOI Debt Yield: | 6.1% | |||
| Underwritten NCF Debt Yield: | 6.1% | |||
| Underwritten NOI Debt Yield at ARD: | 6.1% | |||
| Underwritten NCF Debt Yield at ARD: | 6.1% | |||
Financial Information – Look-Through(5) | ||||
Cut-off Date Balance / Key(6): | $84,906 | |||
Balloon Balance / Key(6): | $84,906 | |||
| 2014 NOI DSCR: | 5.28x | |||
| 2014 NCF DSCR: | 4.61x | |||
| 2014 NOI Debt Yield: | 22.2% | |||
| 2014 NCF Debt Yield: | 19.4% | |||
| Property Information | ||
| Single Asset / Portfolio: | Single Asset | |
| Property Type: | Leased Fee | |
Collateral(7): | Fee Simple | |
| Location: | Portland, OR | |
Year Built / Renovated(7): | NAP | |
Total Sq. Ft. (4): | 197,999 | |
| Property Management: | NAP | |
Underwritten NOI(8): | $2,472,329 | |
Underwritten NCF(8): | $2,472,329 | |
| Appraised Value: | $45,000,000 | |
| Appraisal Date: | December 1, 2014 | |
| Ground Lease | ||
| In Place Contractual Ground Rent: | $2,310,000 | |
| Loan Term Average Ground Rent: | $2,472,329 | |
| Ground Lease Expiration Date: | November 23, 2113 | |
Historical Occupancy(9) | ||
| Most Recent Occupancy: | NAP | |
| 2014 Occupancy: | NAP | |
| 2013 Occupancy: | NAP | |
| 2012 Occupancy: | NAP | |
| (1) | See “The Loan” herein for a description of the ARD. |
| (2) | Based on the Anticipated Repayment Date. |
| (3) | See “Initial Reserves” and “Ongoing Reserves” herein. |
| (4) | Total Sq. Ft. represents the gross square footage of the land area. Balance / Sq. Ft. calculations for the fee interest (collateral) are based off the gross square footage of the land area. |
| (5) | Financial Information - Look-Through is based on the trailing-twelve months ending September 30, 2014 NOI and NCF generated by the DoubleTree by Hilton Portland Hotel, excluding the ground rent payment. |
| (6) | The DoubleTree by Hilton Portland Hotel has 477 rooms. |
| (7) | The collateral for the DoubleTree by Hilton Portland Leased Fee Loan represents the fee interest in the land (and not the related improvements). The land is improved by the DoubleTree by Hilton Portland Hotel, which was built in 1960 and most recently renovated in 2013. |
| (8) | UW NOI and UW NCF represent the average of the in-place ground rent payment increased at the minimum contractual rate of 1.5% through the anticipated repayment date. |
| (9) | The collateral for the DoubleTree Portland Leased Fee Loan represents the fee interest in the land (and not the related improvements). The DoubleTree by Hilton Portland Hotel’s historical occupancy was 71.0%, 72.1%, 75.9% and 77.8% for the full years ending December 31 of 2011, 2012, 2013 and the trailing-twelve months ending September 30, 2014, respectively. |
THE INFORMATION IN THIS STRUCTURAL AND COLLATERAL TERM SHEET IS NOT COMPLETE AND MAY BE AMENDED PRIOR TO THE TIME OF SALE. THIS TERM SHEET IS NOT AN OFFER TO SELL THESE SECURITIES AND IT IS NOT A SOLICITATION OF AN OFFER TO BUY THESE SECURITIES IN ANY JURISDICTION WHERE THE OFFER OR SALE IS NOT PERMITTED.
99
1000 Northeast Multnomah Street Portland, OR 97232 | Collateral Asset Summary – Loan No. 15 DoubleTree by Hilton Portland Leased Fee | Cut-off Date Balance: Cut-off Date LTV: U/W NCF DSCR: U/W NOI Debt Yield: | $40,500,000 90.0% 1.45x 6.1% |
The Loan. The DoubleTree by Hilton Portland Leased Fee loan (the “DoubleTree Portland Leased Fee Loan”) is a fixed rate loan with an original principal balance of $40.5 million secured by the borrower’s fee simple interest in a 4.55 acre parcel of land (197,999 sq. ft.) located at 1000 Northeast Multnomah Street in Portland, Oregon (the “DoubleTree Portland Leased Fee Property”), subject to a ground lease secured by a 477-key full service hotel (which hotel is not collateral for the DoubleTree Portland Leased Fee Loan). The DoubleTree Portland Leased Fee Loan does not amortize prior to the Anticipated Repayment Date (as described below under the “Anticipated Repayment Date”).
The DoubleTree Portland Leased Fee Loan has an anticipated repayment date of December 6, 2024 (the “Anticipated Repayment Date” or “ARD”) and a stated maturity date of December 6, 2029. Prior to the Anticipated Repayment Date, the interest on the DoubleTree Portland Leased Fee Loan will accrue at a fixed rate of 4.1500% and debt service will be paid on an interest only basis. From and after the Anticipated Repayment Date, interest will accrue at an increased rate equal to the greater of (i) 7.1500% and (ii) 3.0000% above the swap yield on the Anticipated Repayment Date.
Loan proceeds along with approximately $4.3 million of sponsor equity were used to acquire the DoubleTree Portland Leased Fee Property for $44.0 million and pay closing costs. Based on the appraised value of $45.0 million as of December 1, 2014, the cut-off date LTV of the DoubleTree Portland Leased Fee Loan is 90.0%. Based on the T-12 September 30, 2014 NOI and using an 8.0% capitalization rate, the estimated look-through value of the collapsed fee simple and leasehold interests would be approximately $112,000,000 resulting in a look-through LTV of approximately 36.2%. The most recent prior financing of the DoubleTree Portland Leased Fee Property was not included in a securitization.
| Sources and Uses | ||||||
| Sources | Proceeds | % of Total | Uses | Proceeds | % of Total | |
| Loan Amount | $40,500,000 | 90.4% | Purchase Price | $44,000,000 | 98.2% | |
| Sponsor Equity | $4,312,333 | 9.6% | Closing Costs | $812,333 | 1.8% | |
| Total Sources | $44,812,333 | 100.0% | Total Uses | $44,812,333 | 100.0% | |
The Borrower / Sponsor. The borrower, Portland ON Owner LLC, is a single purpose Delaware limited liability company structured to be bankruptcy-remote with two independent directors in its organizational structure. The sponsor of the borrower and nonrecourse carve-out guarantor is OZNJ Real Estate Opportunities, L.P (“Och-Ziff Real Estate”). In lieu of an environmental indemnity from the guarantor, the borrower provided an environmental insurance policy from Great American Insurance Group with $3.0 million coverage (per loss and per event). The policy has a term through November 24, 2027. The policy premiums have been paid in full.
Och-Ziff Real Estate is an affiliate of Och-Ziff Capital Management Group (“Och-Ziff”). Och-Ziff was founded in 1994 by Daniel Och and is one of the largest institutional alternative asset managers in the world. Och-Ziff has approximately $46.7 billion in assets under management as of February 1, 2015. Och-Ziff Real Estate is an affiliate of Och-Ziff and was founded by Steven E. Orbuch to make investments in real estate and real estate related assets. Och-Ziff Real Estate has acquired over $5 billion of real estate assets including eight million square feet of office and industrial property, over 10,000 multifamily and senior housing units, 7,000 hotel rooms and seven million square feet of retail assets throughout the United States.
The Property. The DoubleTree Portland Leased Fee Loan is collateralized by the borrower’s fee simple interest in a 4.55 acre (197,999 sq. ft.) parcel of land located at 1000 Northeast Multnomah Street in Portland, Oregon. The borrower’s fee simple interest is subject to a Ground Lease (as defined and described below under “Ground Lease”), which expires on November 23, 2113. The tenant under the Ground Lease owns the improvements on the DoubleTree Portland Leased Fee Property that consist of two hotel buildings totaling 382,330 sq. ft., with 477 guest rooms, 18 meeting rooms (totaling 38,500 sq. ft.) and a parking garage totaling 264,900 sq. ft. (the “DoubleTree by Hilton Portland Hotel”). Dining options include Gather Food & Drink, which serves lunch and dinner, as well as the Multnomah Grille, which serves breakfast.
The DoubleTree by Hilton Portland Hotel is located within walking distance of the Oregon Convention Center, the Rose Garden Arena, Lloyd Center Mall and Memorial Coliseum as well as near the intersection of the Interstate-84 and Interstate-5 freeways, which provide access to Portland International Airport. Access to shopping and entertainment districts is provided via the MAX Light Rail System, which runs directly from the DoubleTree by Hilton Portland Hotel to historic Old Town and other downtown attractions. Major businesses in the area include BPA, PacificCorp, Liberty Northwest and Nationwide Insurance. The Lloyd Center Mall is located across the street from the DoubleTree by Hilton Portland Hotel, which features over 200 stores, 18 movie screens and an ice skating rink.
THE INFORMATION IN THIS STRUCTURAL AND COLLATERAL TERM SHEET IS NOT COMPLETE AND MAY BE AMENDED PRIOR TO THE TIME OF SALE. THIS TERM SHEET IS NOT AN OFFER TO SELL THESE SECURITIES AND IT IS NOT A SOLICITATION OF AN OFFER TO BUY THESE SECURITIES IN ANY JURISDICTION WHERE THE OFFER OR SALE IS NOT PERMITTED.
100
1000 Northeast Multnomah Street Portland, OR 97232 | Collateral Asset Summary – Loan No. 15 DoubleTree by Hilton Portland Leased Fee | Cut-off Date Balance: Cut-off Date LTV: U/W NCF DSCR: U/W NOI Debt Yield: | $40,500,000 90.0% 1.45x 6.1% |
The DoubleTree by Hilton Portland Hotel is subject to a franchise agreement with a subsidiary of Hilton Worldwide through May 31, 2023. Hilton Worldwide is a global hospitality company, spanning the lodging sector from luxury and full-service hotels and resorts to extended-stay suites and focused-service hotels. The company’s portfolio includes twelve world-class global brands and an award-winning customer loyalty program, Hilton HHonors. Hilton Worldwide currently owns, operates or manages 4,221 hotels totaling 698,402 rooms across 93 countries and territories.
Mount Kellett Capital Management, LP (“Mount Kellett”) and Westmont Hospitality Group (together, the “Hotel Owner”) acquired the fee simple interest in the DoubleTree by Hilton Portland Hotel in 2011 as part of a six property portfolio with an allocated purchase price of approximately $67.2 million. The DoubleTree Portland Leased Fee Loan financed the borrower’s purchase of the fee from the Hotel Owner and simultaneous leaseback of the ground lease interest to the Hotel Owner.
Environmental Matters. The Phase I environmental report dated November 21, 2014 recommended no further action at the DoubleTree Portland Leased Fee Property.
The Market. The DoubleTree Portland Leased Fee Property is located in Portland, Oregon, in Multnomah County, which is in Northwest Oregon. The DoubleTree Portland Leased Fee Property is in the Lloyd sub-district, which is one of three submarkets in downtown Portland. The Lloyd sub-district is located approximately two miles from Portland’s central business district across the Willamette River and is becoming an emerging corporate and entertainment destination within Portland due to significant capital being invested into the area in recent years by government municipalities.
The market mix for the DoubleTree by Hilton Portland Hotel consists of 51.0% transient and 49.0% meeting and group. The main demand drivers for the hotel include the Oregon Convention Center, which is the largest convention center in the Pacific Northwest and attracted 530,300 individuals in 2013, the Moda Center, which is home to the Portland Trailblazers basketball team and Holladay Park.
According to hospitality research reports, the DoubleTree by Hilton Portland Hotel competes directly with five hotels totaling 2,048 keys located in Portland, Oregon including Marriott Portland Downtown Waterfront, Crowne Plaza Portland Downtown Convention Center, Red Lion Hotel On the River Jantzen Beach, Hilton Portland & Executive Tower and Courtyard Portland Lloyd Center Downtown. As of September 2014, according to hospitality research reports, the DoubleTree Portland Leased Fee Property exhibited Occupancy, ADR and RevPAR of 77.8%, $134.39 and $104.54, respectively, resulting in competitive set penetration rates of 102.0%, 95.9% and 97.8%, respectively.
Historical Occupancy, ADR, RevPAR – Competitive Set(1) | |||||||||
DoubleTree Portland Leased Fee Property | Competitive Set | Penetration Factor | |||||||
| Year | Occupancy | ADR | RevPAR | Occupancy | ADR | RevPAR | Occupancy | ADR | RevPAR |
| T-12 September 30, 2014 | 77.8% | $134.39 | $104.54 | 76.3% | $140.09 | $106.86 | 102.0% | 95.9% | 97.8% |
| December 31, 2013 | 75.9% | $127.05 | $96.45 | 74.9% | $130.93 | $98.05 | 101.4% | 97.0% | 98.4% |
| December 31, 2012 | 71.5% | $124.76 | $89.21 | 73.1% | $122.93 | $89.90 | 97.8% | 101.5% | 99.2% |
| December 31, 2011 | 71.0% | $119.46 | $84.83 | 69.7% | $116.42 | $81.20 | 101.8% | 102.6% | 104.5% |
| (1) | Source: Hospitality research report. |
THE INFORMATION IN THIS STRUCTURAL AND COLLATERAL TERM SHEET IS NOT COMPLETE AND MAY BE AMENDED PRIOR TO THE TIME OF SALE. THIS TERM SHEET IS NOT AN OFFER TO SELL THESE SECURITIES AND IT IS NOT A SOLICITATION OF AN OFFER TO BUY THESE SECURITIES IN ANY JURISDICTION WHERE THE OFFER OR SALE IS NOT PERMITTED.
101
1000 Northeast Multnomah Street Portland, OR 97232 | Collateral Asset Summary – Loan No. 15 DoubleTree by Hilton Portland Leased Fee | Cut-off Date Balance: Cut-off Date LTV: U/W NCF DSCR: U/W NOI Debt Yield: | $40,500,000 90.0% 1.45x 6.1% |
Cash Flow Analysis.
| Cash Flow Analysis | |||||
T-12 9/30/2014(1) | In Place Contractual Ground Rent(2) | U/W(3) | U/W PSF (4) | ||
| Room Revenue | $18,200,320 | $2,310,000 | $2,472,329 | $12.49 | |
| F&B Revenue | 8,863,352 | 0 | 0 | 0 | |
| Other Revenue | 1,288,904 | 0 | 0 | 0 | |
| Total Revenue | $28,352,576 | $2,310,000 | $2,472,329 | $12.49 | |
| Operating Expenses | 9,876,155 | 0 | 0 | 0 | |
| Undistributed Expenses | 8,341,044 | 0 | 0 | 0 | |
| Gross Operating Profit | $10,135,377 | $2,310,000 | $2,472,329 | $12.49 | |
| Total Fixed Charges | 1,141,652 | 0 | 0 | 0 | |
| Net Operating Income | $8,993,725 | $2,310,000 | $2,472,329 | $12.49 | |
| FF&E | $1,134,103 | 0 | 0 | 0 | |
| Net Cash Flow | $7,859,622 | $2,310,000 | $2,472,329 | $12.49 | |
| (1) | The T-12 9/30/2014 cash flow represents the performance of the DoubleTree by Hilton Portland Hotel (non-collateral) excluding the ground lease expense (“look-through cash flows”). The look-through cash flow for FYE 2012 and 2013 was approximately $6.4 million and $7.1 million, respectively. The NCF DSCR for FYE 2012, FYE 2013 and T-12 9/30/2014 based on the look-through cash flows were 3.76x, 4.18x and 4.61x, respectively with NOI DY’s over the same periods of 18.3%, 20.2% and 22.2%, respectively. The ground rent multiple based on the U/W Ground Lease payment and the T-12 9/30/2014 look-through cash flow is approximately 3.2x. |
| (2) | Based on the in-place ground lease payment as of February 2015. |
| (3) | U/W represents the 10-year average of future ground lease payments increased at the minimum contractual rate of 1.5% through the term of the DoubleTree Portland Leased Fee Loan. |
| (4) | U/W PSF is based on a total of 197,999 sq. ft. |
Property Management. None for the DoubleTree Portland Leased Fee Property. The DoubleTree by Hilton Portland Hotel is managed by WMK Management LLC.
Lockbox / Cash Management. The DoubleTree Portland Leased Fee Loan is structured with a springing hard lockbox and springing cash management. A hard lockbox, in-place cash management and an excess cash flow sweep will be triggered upon (i) the failure by the borrower to pay the DoubleTree Portland Leased Fee Loan in full on or before December 6, 2024 (the Anticipated Repayment Date), (ii) a Ground Lease Trigger Period (as defined below), (iii) any event of default, or (iv) a bankruptcy action of the borrower, principal, guarantor or manager (if a manager is engaged for the DoubleTree Portland Leased Fee Property).
A “Ground Lease Trigger Period” will commence upon the earliest of (i) the occurrence of an event of default under the Ground Lease, (ii) the ground lessee’s delivery of written notice of its intention to terminate the Ground Lease, (iii) the institution of legal action by borrower or ground lessee seeking to terminate or cancel the Ground Lease without lender consent, (iv) the termination of the Ground Lease or (v) the occurrence of any bankruptcy action of the ground lessee.
Initial Reserves. None.
Ongoing Reserves. Ongoing tax and insurance reserves are not required as long as the Ground Lease remains in full force and effect and the borrower provides evidence as required by the lender that the Ground Lease tenant has (i) provided timely payment of all property taxes and insurance premiums and (ii) a Ground Lease Trigger Period has not commenced. Ongoing FF&E reserves of 1/12 of 4.0% of such year’s gross income from operations are not required so long as the Ground Lease remains in full force and effect.
Current Mezzanine or Subordinate Indebtedness. None.
Future Mezzanine or Subordinate Indebtedness Permitted. None.
Anticipated Repayment Date. The DoubleTree Portland Leased Fee Loan has an Anticipated Repayment Date of December 6, 2024 and a stated maturity date of December 6, 2029. From and after the Anticipated Repayment Date, the interest rate will increase to the greater of (i) 7.1500% and (ii) 3.0000% above the swap yield on the Anticipated Repayment Date. The difference between the adjusted interest rate and the initial interest rate is the additional ARD interest. From and after the Anticipated Repayment Date, all excess cash flow from the DoubleTree Portland Leased Fee Property, after payment of reserves (if the Ground Lease is no longer in effect), the interest calculated at the initial interest rate, and DoubleTree Portland Hotel operating expenses, will be applied to the
THE INFORMATION IN THIS STRUCTURAL AND COLLATERAL TERM SHEET IS NOT COMPLETE AND MAY BE AMENDED PRIOR TO THE TIME OF SALE. THIS TERM SHEET IS NOT AN OFFER TO SELL THESE SECURITIES AND IT IS NOT A SOLICITATION OF AN OFFER TO BUY THESE SECURITIES IN ANY JURISDICTION WHERE THE OFFER OR SALE IS NOT PERMITTED.
102
1000 Northeast Multnomah Street Portland, OR 97232 | Collateral Asset Summary – Loan No. 15 DoubleTree by Hilton Portland Leased Fee | Cut-off Date Balance: Cut-off Date LTV: U/W NCF DSCR: U/W NOI Debt Yield: | $40,500,000 90.0% 1.45x 6.1% |
outstanding principal balance of the DoubleTree Portland Leased Fee Loan until repaid in full. The additional Anticipated Repayment Date interest which is not paid current from and after the Anticipated Repayment Date will accrue and bear interest at the adjusted interest rate.
Ground Lease. The DoubleTree Portland Leased Fee Property is subject to a long term ground lease (the “Ground Lease”) that commenced on November 24, 2014 (the “Commencement Date”) and expires on November 23, 2113. The Ground Lease obligates the tenant under the Ground Lease to make annual payments of $2,310,000 (payable monthly) to the borrower. Ground rent will increase annually by the CPI, subject to a minimum increase of 1.5% and a maximum increase of 3.0% of the annual rent in effect immediately prior any adjustment.
The tenant under the Ground Lease, WMK Portland LLC, has a one-time option to purchase the DoubleTree Portland Leased Fee Property on or about November 24, 2024 (the “Purchase Option Date”), which is during the open period under the DoubleTree Portland Leased Fee Loan, with no less than 30 days prior notice and for a purchase price equal to the Option Price. The “Option Price” is an amount equal to the difference of (i) $44,500,000 plus interest thereon at a rate of 7.2500% per annum, compounded monthly, from the Commencement Date through the Purchase Option Date, minus (ii) the aggregate of each annual rental payment under the Ground Lease plus interest thereon at a rate of 7.2500% per annum, compounded monthly, from the first day of the calendar month in which each such payment is made through the Purchase Option Date. Additionally, the Ground Lease tenant has a right of first offer to purchase the DoubleTree Portland Leased Fee Property at any time in the event the borrower elects to sell the DoubleTree Portland Leased Fee Property or any portion thereof to any person other than an affiliate of the borrower.
WMK Portland LLC is a joint venture between Mount Kellett and Westmont Hospitality Group. Mount Kellett Capital Management LP (“Mount Kellett”) is a multi-strategy investment firm focused on global distressed, special situations and opportunistic investing. Founded in 2008, Mount Kellett has offices in New York, Dallas, Hong Kong, London, Mumbai and Mauritius. The firm closed its first fund, Mount Kellett Capital Partners, in December 2009 and currently manages approximately $7 billion. Mark McGoldrick, Managing Partner and Chief Investment Officer of Mount Kellett, was the co-founder and head of Goldman Sachs Global Special Situations Group from 1997 to 2007.
Westmont Hospitality Group, Inc. owns and operates hotels in North America, Europe, and Asia. It offers hotels ranging from budget and aparthotels to mid-market business and large conference hotels to boutique hotels and luxury resorts. The company has strategic alliances with Fairmont, InterContinental Hotels Group, Hilton, Accor, Starwood, Wyndham, Choice Hotels, Renaissance, Radisson, and Best Western. Westmont Hospitality Group, Inc. was founded in 1975 and is based in Mississauga, Canada
THE INFORMATION IN THIS STRUCTURAL AND COLLATERAL TERM SHEET IS NOT COMPLETE AND MAY BE AMENDED PRIOR TO THE TIME OF SALE. THIS TERM SHEET IS NOT AN OFFER TO SELL THESE SECURITIES AND IT IS NOT A SOLICITATION OF AN OFFER TO BUY THESE SECURITIES IN ANY JURISDICTION WHERE THE OFFER OR SALE IS NOT PERMITTED.
103
1000 Northeast Multnomah Street Portland, OR 97232 | Collateral Asset Summary – Loan No. 15 DoubleTree by Hilton Portland Leased Fee | Cut-off Date Balance: Cut-off Date LTV: U/W NCF DSCR: U/W NOI Debt Yield: | $40,500,000 90.0% 1.45x 6.1% |
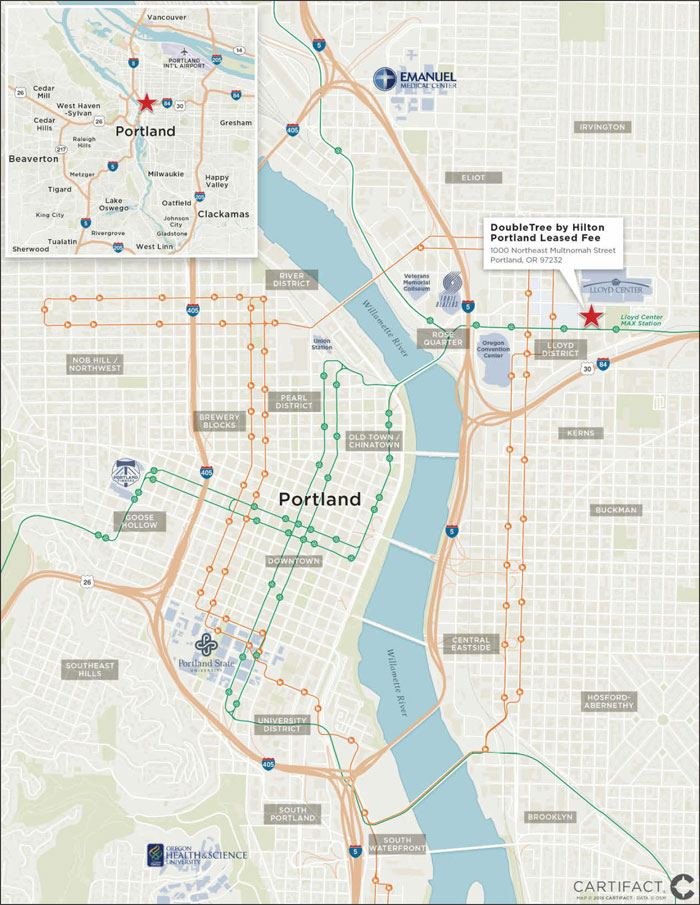
THE INFORMATION IN THIS STRUCTURAL AND COLLATERAL TERM SHEET IS NOT COMPLETE AND MAY BE AMENDED PRIOR TO THE TIME OF SALE. THIS TERM SHEET IS NOT AN OFFER TO SELL THESE SECURITIES AND IT IS NOT A SOLICITATION OF AN OFFER TO BUY THESE SECURITIES IN ANY JURISDICTION WHERE THE OFFER OR SALE IS NOT PERMITTED.
104
(THIS PAGE INTENTIONALLY LEFT BLANK)
105
365 Park Avenue South New York, NY 10016 | Collateral Asset Summary – Loan No. 16 Hotel Giraffe | Cut-off Date Balance: Cut-off Date LTV: U/W NCF DSCR: U/W NOI Debt Yield: | $38,856,957 62.7% 1.40x 10.5% |
| Mortgage Loan Information | |
| Loan Seller: | CCRE |
| Loan Purpose: | Refinance |
Sponsor(1): | Imrich Henry Kallan |
| Borrower: | East 26th Street & Park Avenue Realty LLC |
| Original Balance: | $39,000,000 |
| Cut-off Date Balance: | $38,856,957 |
| % by Initial UPB: | 3.0% |
| Interest Rate: | 4.6600% |
| Payment Date: | 6th of each month |
| First Payment Date: | February 6, 2015 |
| Maturity Date: | January 6, 2025 |
| Amortization: | 300 months |
| Additional Debt: | None |
| Call Protection: | L(26), D(91), O(3) |
Lockbox / Cash Management(2): | Hard / Springing |
| Reserves | ||
| Initial | Monthly | |
| Taxes: | $76,298 | $76,298 |
| Insurance: | $9,865 | $4,933 |
Replacement(3): | $0 | Springing |
| Required Repairs: | $1,000 | NAP |
| Financial Information | ||
| Cut-off Date Balance / Room: | $539,680 | |
| Balloon Balance / Room: | $399,937 | |
| Cut-off Date LTV: | 62.7% | |
| Balloon LTV: | 46.4% | |
| Underwritten NOI DSCR: | 1.55x | |
| Underwritten NCF DSCR: | 1.40x | |
| Underwritten NOI Debt Yield: | 10.5% | |
| Underwritten NCF Debt Yield: | 9.5% | |
| Property Information | ||
| Single Asset / Portfolio: | Single Asset | |
| Property Type: | Full Service Hospitality | |
| Collateral: | Fee Simple | |
| Location: | New York, NY | |
| Year Built / Renovated: | 1999 / 2014 | |
| Total Rooms: | 72 | |
| Property Management: | HK Hotels, LLC | |
| Underwritten NOI: | $4,089,309 | |
| Underwritten NCF: | $3,699,151 | |
| Appraised Value: | $62,000,000 | |
| Appraisal Date: | October 1, 2014 | |
| Historical NOI | ||
| Most Recent NOI: | $4,330,534 (T-12 September 30, 2014) | |
| 2013 NOI: | $4,300,495 (December 31, 2013) | |
| 2012 NOI: | $4,124,480 (December 31, 2012) | |
| 2011 NOI: | $3,825,489 (December 31, 2011) | |
| Historical Occupancy / ADR / RevPAR | ||
| Most Recent Occupancy: | 88.1% / $385.39 / $339.34 (September 30, 2014) | |
| 2013 Occupancy: | 88.1% / $380.54 / $335.10 (December 31, 2013) | |
| 2012 Occupancy: | 87.7% / $336.40 / $321.41 (December 31, 2012) | |
| 2011 Occupancy: | 87.0% / $368.59 / $320.67 (December 31, 2011) | |
| (1) | The sponsor is also the sponsor of the mortgage loan identified on Annex A-1 to the Free Writing Prospectus as Hotel Casablanca, which has a Cut-off Date Balance of $7,937,716. |
| (2) | Cash management and an excess cash flow sweep will be triggered upon a Cash Management Period. A “Cash Management Period” will commence upon (i) an event of default, (ii) any property manager bankruptcy or (iii) the failure by the borrower to maintain a debt service coverage ratio of at least 1.10x for four consecutive calendar quarters, until the debt service coverage ratio is at least 1.25x for two consecutive calendar quarters. |
| (3) | The borrower will not be required to make monthly deposits equal to 1/12 of 4.0% of gross income from operations provided (i) no event of default has occurred, (ii) no Cash Management Period exists, (iii) the Hotel Giraffe property is being maintained in good repair, free and clear of any material damage and (iv) the borrower has completed the required repairs outlined in the Hotel Giraffe loan documents on or before the required deadline. |
| TRANSACTION HIGHLIGHTS |
| § | Property. Hotel Giraffe is a full service hotel located in New York, New York that was constructed in 1999 and is located on the northeast corner of 26th street and Park Avenue South. The property contains 72 guestrooms, approximately 1,300 sq. ft. of meeting space, and two food & beverage operations including Bread & Tulips (a third party leased restaurant) and a rooftop garden bar. |
| § | Market. As of August 2014, Hotel Giraffe exhibited trailing 12-month occupancy, ADR and RevPAR of 88.7%, $385.95 and $342.51, respectively, resulting in occupancy, ADR and RevPAR penetration rates of 103.8%, 109.2% and 113.4%, respectively. Since 2007, Hotel Giraffe has maintained an occupancy of greater than 84.0%. |
| § | Land Value. Given Hotel Giraffe’s location on the northeast corner of 26th street and Park Avenue South, the appraiser concluded a land value of $29.0 million and a land value to Hotel Giraffe loan ratio of 74.4%. |
| § | Sponsorship. Imrich Henry Kallan is the president and owner of the Library Hotel Collection, a boutique hospitality company that owns and manages Casablanca Hotel, Library Hotel, Hotel Giraffe and Hotel Elysee, all located in Manhattan, and Aria Hotel, located in Prague. |
THE INFORMATION IN THIS STRUCTURAL AND COLLATERAL TERM SHEET IS NOT COMPLETE AND MAY BE AMENDED PRIOR TO THE TIME OF SALE. THIS TERM SHEET IS NOT AN OFFER TO SELL THESE SECURITIES AND IT IS NOT A SOLICITATION OF AN OFFER TO BUY THESE SECURITIES IN ANY JURISDICTION WHERE THE OFFER OR SALE IS NOT PERMITTED.
106
| Various, TX | Collateral Asset Summary – Loan No. 17 Fifield Portfolio | Cut-off Date Balance: Cut-off Date LTV: U/W NCF DSCR: U/W NOI Debt Yield: | $33,000,000 74.2% 1.27x 7.7% |
| Mortgage Loan Information | |
| Loan Seller: | GACC |
| Loan Purpose: | Acquisition |
| Sponsor: | Edward I. Biskind |
| Borrower: | Intercapital McKamy, LLC; Intercapital Creekside, LLC |
| Original Balance: | $33,000,000 |
| Cut-off Date Balance: | $33,000,000 |
| % by Initial UPB: | 2.5% |
| Interest Rate: | 4.0800% |
| Payment Date: | 6th of each month |
| First Payment Date: | April 6, 2015 |
| Maturity Date: | March 6, 2025 |
| Amortization: | Interest only for first 36 months; 360 months thereafter |
| Additional Debt: | None |
| Call Protection: | L(24), D(92), O(4) |
Lockbox / Cash Management(1): | Hard / Springing |
| Reserves | ||
| Initial | Monthly | |
| Taxes: | $169,999 | $56,666 |
Insurance(2): | $0 | Springing |
| Replacement: | $0 | $9,208 |
| Required Repairs: | $31,750 | NAP |
Capital Expenditure Holdback(3): | $2,295,206 | $0 |
| Financial Information | ||
| Cut-off Date Balance / Unit: | $74,661 | |
| Balloon Balance / Unit: | $64,714 | |
Cut-off Date LTV(4): | 74.2% | |
| Balloon LTV: | 64.4% | |
Underwritten NOI DSCR(5): | 1.33x | |
Underwritten NCF DSCR(5): | 1.27x | |
| Underwritten NOI Debt Yield: | 7.7% | |
| Underwritten NCF Debt Yield: | 7.3% | |
| Property Information | |
| Single Asset / Portfolio: | Portfolio of two properties |
| Property Type: | Garden Multifamily |
| Collateral: | Fee Simple |
| Location: | Various, TX |
| Year Built / Renovated: | Various / 2015 |
| Total Units: | 442 |
| Property Management: | Vesta Management Services, LLC |
| Underwritten NOI: | $2,531,573 |
| Underwritten NCF: | $2,421,073 |
| “As-is” Appraised Value: | $41,525,000 |
| “As-is” Appraisal Date: | October 28, 2014 |
“As Complete” Appraised Value(4): | $44,450,000 |
“As Complete” Appraisal Date(4): | November 1, 2015 |
| Historical NOI | |
| Most Recent NOI: | $2,432,880 (December 31, 2014) |
| 2013 NOI: | $2,547,030 (December 31, 2013) |
| 2012 NOI: | $2,240,081 (December 31, 2012) |
| Historical Occupancy | |
| Most Recent Occupancy: | 92.5% (Various) |
| 2013 Occupancy: | NAV |
| 2012 Occupancy: | NAV |
| (1) | Cash management will be triggered (i) upon an event of default, (ii) if the DSCR falls below 1.10x until such time that the DSCR is at least 1.20x for two consecutive calendar quarters or (iii) if any new mezzanine loan is outstanding. |
| (2) | The borrowers will be required to deposit 1/12 of the annual insurance premiums into the insurance reserve if an acceptable blanket policy is no longer in place. |
| (3) | $750,000 of the capital expenditure holdback reserve is available for immediate release. The remaining capital expenditure holdback funds may be released, provided, among other things per the loan documents, the property has a debt yield, as defined in the loan documents, of at least 8.0% as of any calendar month. |
| (4) | Cut-off Date LTV is based on the “As Complete” Appraised Value, which takes into account planned upgrades to be performed at each property. At closing, approximately $2.3 million was deposited in escrows for capital improvements. Based on the “As-is” Appraised Value of $41,525,000, the Cut-off Date LTV for the mortgage loan is 79.5%. |
| (5) | Based on the amortizing debt service payments. Based on interest only payments, the Underwritten NOI DSCR and the Underwritten NCF DSCR are 1.85x and 1.77x, respectively. |
| TRANSACTION HIGHLIGHTS |
| § | Properties. The Fifield Portfolio consists of two garden-style multifamily properties containing a total of 442 units. The properties in the portfolio include Creekside at Northlake, a 228-unit, Class BC apartment community built in 2001 situated on a 19.09-acre site in Northlake, Texas and McKamy Lake Apartments, a 214-unit, Class BC apartment community built in 2000 situated on a 9.88-acre site in Lewisville, Texas. Each property features a variety of amenities, including a clubhouse with a leasing office, fitness center and business center, a swimming pool with cabana, billiards room, laundry facilities and covered parking. |
| § | Market. Creekside at Northlake is located in Northlake, Texas approximately 35 miles outside of the Dallas Central Business District within the Dallas-Fort Worth-Arlington metropolitan statistical area (“Dallas MSA”). The area is served by I-35 West, a north-south thoroughfare that provides access to Fort Worth to the south and Denton to the North, and is in close proximity to the Texas Motor Speedway. The area had a population of 52,170 in 2014 within a five-mile radius of the Creekside at Northlake property and an average household income of $97,346 within the same range. McKamy Lake Apartments is located in Lewisville, Texas approximately 35 miles outside of the Forth Worth Central Business District within the Dallas MSA. Lewisville is served by I-35 East which provides access to Dallas to the south and Denton the North. The area is nearby significant retail developments, including a Wal-Mart Neighborhood Market less than two miles west of the McKamy Lake Apartments property. The area had a 2014 population of 160,525 within a five-mile radius of the McKamy Lake Apartments property and an average household income of $102,702 within the same range. |
| § | Capital Expenditure Holdback. The Fifield Portfolio loan contains an approximately $2.3 million capital expenditure holdback for capital improvements and upgrades at the Fifield Portfolio properties. The capital improvement reserve will be used for balcony and stair improvements, clubhouse and fitness room renovations, landscaping upgrades, new dog parks, exterior lighting, exterior painting and woodwork improvements, model unit renovations and pool upgrades at each property. |
THE INFORMATION IN THIS STRUCTURAL AND COLLATERAL TERM SHEET IS NOT COMPLETE AND MAY BE AMENDED PRIOR TO THE TIME OF SALE. THIS TERM SHEET IS NOT AN OFFER TO SELL THESE SECURITIES AND IT IS NOT A SOLICITATION OF AN OFFER TO BUY THESE SECURITIES IN ANY JURISDICTION WHERE THE OFFER OR SALE IS NOT PERMITTED.
107
641 South Street Northwest Washington, DC 20001 | Collateral Asset Summary – Loan No. 18 Wonder Bread | Cut-off Date Balance: Cut-off Date LTV: U/W NCF DSCR: U/W NOI Debt Yield: | $30,700,000 67.3% 1.34x 8.2% |
| Mortgage Loan Information | |
| Loan Seller: | Natixis |
| Loan Purpose: | Refinance |
Sponsor(1): | Norman Jemal |
| Borrower: | Jemal’s Wonder L.L.C. |
| Original Balance: | $30,700,000 |
| Cut-off Date Balance: | $30,700,000 |
| % by Initial UPB: | 2.4% |
| Interest Rate: | 4.1270% |
| Payment Date: | 5th of each month |
| First Payment Date: | December 5, 2014 |
| Maturity Date: | November 5, 2024 |
| Amortization: | Interest only for first 60 months; 360 months thereafter |
Additional Debt(2): | Future Mezzanine Debt Permitted |
Call Protection: | L(28), D(88), O(4) |
Lockbox / Cash Management(3): | Hard / Springing |
| Reserves | ||
| Initial | Monthly | |
| Taxes: | $123,172 | $41,057 |
| Insurance: | $4,828 | $603 |
| Replacement: | $0 | $1,027 |
TI/LC(4): | $2,600,527 | Springing |
| Free Rent: | $585,235 | $0 |
| Landlord Work: | $360,278 | $0 |
| Outstanding LC: | $168,040 | $0 |
Lease Buyout(5): | $0 | Springing |
Tenant Cash Trap(6): | $0 | Springing |
| Financial Information | ||
| Cut-off Date Balance / Sq. Ft.: | $374 | |
| Balloon Balance / Sq. Ft.: | $340 | |
| Cut-off Date LTV: | 67.3% | |
| Balloon LTV: | 61.2% | |
Underwritten NOI DSCR(7): | 1.42x | |
Underwritten NCF DSCR(7): | 1.34x | |
| Underwritten NOI Debt Yield: | 8.2% | |
| Underwritten NCF Debt Yield: | 7.8% | |
| Property Information | |
| Single Asset / Portfolio: | Single Asset |
| Property Type: | CBD Office |
| Collateral: | Fee Simple |
| Location: | Washington, DC |
| Year Built / Renovated: | 1919 / 2012-2014 |
| Total Sq. Ft.: | 82,132 |
| Property Management: | Douglas Development Corp. |
| Underwritten NOI: | $2,531,428 |
| Underwritten NCF: | $2,395,911 |
| Appraised Value: | $45,600,000 |
| Appraisal Date: | February 13, 2015 |
Historical NOI(8) | |
| Most Recent NOI: | NAV |
| 2013 NOI: | NAV |
Historical Occupancy(8) | |
| Most Recent Occupancy: | 100.0% (February 28, 2015) |
| 2013 Occupancy: | NAV |
| (1) | The sponsor is related to the borrowers under the mortgage loans identified on Annex A-1 to the Free Writing Prospectus as 1424 K Street Northwest and 3300-3340 New York Ave, which have an aggregate Cut-off Date Balance of $23,544,776. |
| (2) | Future mezzanine debt is permitted subject to, among other things, a maximum combined LTV of 80.0% and a minimum combined DSCR of 1.10x. |
| (3) | Cash management will be triggered upon (i) an event of default, (ii) the failure by the borrower, after the end of a calendar quarter, to maintain a DSCR of at least 1.10x or (iii) the commencement of a Tenant Cash Trap Period. A “Tenant Cash Trap Period” will commence upon the occurrence of (i) a Tenant goes bankrupt, (ii) a Tenant vacates, surrenders or otherwise “goes dark”, (iii) a monetary default by a Tenant under its lease which continues for more than 30 days, (iv) a Lease Buyout Cash Trap Period (as defined in the loan documents) or (v) the date that is 12 months prior to the effective termination date of the iStrategy Lease in the event that iStrategy exercises its termination option thereunder. A “Tenant” means WeWork Companies or Youth For Understanding. |
| (4) | The borrower is required to make monthly deposits of $10,266.50 beginning with the monthly payment date in December 2019. |
| (5) | The borrower is required to deposit the tenant buyout payment in to the lease buyout reserve upon the lease buyout conditions being met. |
| (6) | On each monthly payment date during a Tenant Cash Trap Period, the borrower is required to deposit all excess cash into a tenant cash trap reserve. |
| (7) | Based on amortizing debt service payments. Based on the current interest only payments, the Underwritten NOI DSCR and Underwritten NCF DSCR are 1.97x and 1.87x, respectively. |
| (8) | The borrower began a complete renovation/redevelopment of the Wonder Bread property in 2012. The rehabilitation of the Wonder Bread property included the complete removal and reconstruction of the interior, the addition of an entire fourth floor and multiple outdoor patios, the rebuilding of the roof and the implementation of new mechanicals/HVAC, etc. The borrower began leasing up the property in 2014. As of February 28, 2015, the property was 100.0% leased. |
| TRANSACTION HIGHLIGHTS |
| § | Tenancy. The Wonder Bread property is 100.0% leased by three long term tenants as of February 28, 2015. The major tenant, WeWork Companies (“WeWork”) (33,439 sq. ft. or 40.7% of NRA) designs, develops and manages workspace communities for entrepreneurs, start-ups, and small businesses. In just over four years since its inception in 2010, WeWork has become a premier solution for creative and collaborative communities in New York, San Francisco, Boston, Washington, DC, Los Angeles, and Seattle with over 38,000 members. The company also has plans to expand globally into London and Israel. The company now operates 19 locations with six additional locations scheduled to open in the near future. WeWork’s lease commenced in March 2014 and runs through September 2026 with one 90-month extension option. The second major tenant, Youth For Understanding (“YFU”) (31,971 sq. ft. or 38.9% of NRA) is a not-for-profit that offers international educational exchange programs with offices in 54 countries around the globe. Founded 1951, YFU organizations around the world have exchanged close to 250,000 students. YFU’s lease commenced in August 2014 and runs through July 2029 with one five-year extension option. The third largest tenant, iStrategyLabs (“ISL”) (16,722 sq. ft. or 20.4% of NRA) is a digital agency founded in 2007. ISL is experiencing rapid growth in sales since its inception. In 2013, ISL was included in the prestigious Inc 5000, with a three year growth rate of 579%, making it the 12th fastest growing company in Washington, DC and #787 nationally. ISL was recently recognized by the industry’s preeminent 2014 Small Agency of the Year award. In addition to its location at the subject, ISL recently announced it will be opening its second location in Brooklyn, New York. ISL’s lease commenced in January 2015 and runs through July 31, 2025 with one five-year extension option. |
| § | Sponsor and Property Management. The sponsor and nonrecourse guarantor of the Wonder Bread loan is Norman Jemal. Norman and Douglas Jemal are the principals of Douglas Development Corp. (“DDC”), the property manager of the Wonder Bread property. DDC is a large real estate developer in the Washington, DC area founded in 1990 with a current portfolio of nearly 9.0 million leasable sq. ft. and over 8.0 million sq. ft. of developable real estate in the pipeline. DDC is comprised of 85 full time employees. |
| § | Location. The Wonder Bread property is located within Washington, DC’s Shaw neighborhood just steps from the Shaw-Howard University Metro station (Green and Yellow lines). Shaw is experiencing an urban renaissance and is quickly emerging as one of Washington, DC’s most dynamic neighborhoods. The neighborhood is recognized as a transitional community dominated and shaped by the major landmarks of Howard University and the U Street Corridor. The Shaw neighborhood’s resurgence features new, Class A office development, high-end residential projects and a thriving nightlife, dining and shopping environment. |
THE INFORMATION IN THIS STRUCTURAL AND COLLATERAL TERM SHEET IS NOT COMPLETE AND MAY BE AMENDED PRIOR TO THE TIME OF SALE. THIS TERM SHEET IS NOT AN OFFER TO SELL THESE SECURITIES AND IT IS NOT A SOLICITATION OF AN OFFER TO BUY THESE SECURITIES IN ANY JURISDICTION WHERE THE OFFER OR SALE IS NOT PERMITTED.
108
| Various, MN | Collateral Asset Summary – Loan No. 19 TPI Hospitality Pool A | Cut-off Date Balance: Cut-off Date LTV: U/W NCF DSCR: U/W NOI Debt Yield: | $30,052,838 69.9% 1.82x 12.4% |
| Mortgage Loan Information | |
| Loan Seller: | GACC |
| Loan Purpose: | Refinance |
Sponsor(1): | Thomas R. Torgerson |
| Borrower: | HSNB, LLC; HSSLP, LLC |
| Original Balance: | $30,100,000 |
| Cut-off Date Balance: | $30,052,838 |
| % by Initial UPB: | 2.3% |
| Interest Rate: | 4.5000% |
| Payment Date: | 6th of each month |
| First Payment Date: | March 6, 2015 |
| Maturity Date: | February 6, 2025 |
| Amortization: | 360 months |
| Additional Debt: | None |
Call Protection(2): | L(25), D(91), O(4) |
Lockbox / Cash Management(3): | Hard / Springing |
| Reserves | ||
| Initial | Monthly | |
| Taxes: | $192,652 | $38,530 |
Insurance(4): | $21,695 | Springing |
FF&E(5): | $0 | At least 1/12 of 4% of prior year’s gross revenues |
Fee Purchase(6): | $2,000,000 | $0 |
| Ground Rent: | $98,083 | Amount payable under ground lease |
| Financial Information | ||
| Cut-off Date Balance / Room: | $120,694 | |
| Balloon Balance / Room: | $97,727 | |
| Cut-off Date LTV: | 69.9% | |
| Balloon LTV: | 56.6% | |
| Underwritten NOI DSCR: | 2.04x | |
| Underwritten NCF DSCR: | 1.82x | |
| Underwritten NOI Debt Yield: | 12.4% | |
| Underwritten NCF Debt Yield: | 11.1% | |
| Property Information | |
| Single Asset / Portfolio: | Portfolio of two properties |
| Property Type: | Extended Stay Hospitality |
| Collateral: | Various |
| Location: | Various, MN |
| Year Built / Renovated: | Various / NAP |
| Total Rooms: | 249 |
| Property Management: | Torgerson Properties, Inc. |
| Underwritten NOI: | $3,725,588 |
| Underwritten NCF: | $3,337,482 |
| Appraised Value: | $43,000,000 |
| Appraisal Date: | October 1, 2014 |
| Historical NOI | |
| Most Recent NOI: | $3,596,291 (T-12 September 30, 2014) |
| 2013 NOI: | $3,174,386 (December 31, 2013) |
| 2012 NOI: | $2,447,011 (December 31, 2012) |
| 2011 NOI: | $2,617,684 (December 31, 2011) |
| Historical Occupancy / ADR / RevPAR | |
| Most Recent: | 80.3% / $130.56 / $104.76 (September 30, 2014) |
| 2013: | 79.5% / $123.19 / $97.94 (December 31, 2013) |
| 2012: | 72.1% / $118.68 / $85.55 (December 31, 2012) |
| 2011: | 77.2% / $111.42 / $86.03 (December 31, 2011) |
| (1) | The sponsor is related to the borrower under the mortgage loans identified on Annex A-1 to the Free Writing Prospectus as TPI SpringHill Suites Rochester and TPI Staybridge Suites Eagan, which have an aggregate Cut-off Date Balance of $13,826,024. |
| (2) | Any time after the expiration of the lockout period, the borrower may obtain the release of an individual property upon a bona fide third-party sale provided, among other things, (i) the LTV for the remaining property does not exceed the lesser of the LTV immediately preceding such release and 70.0%, (ii) the DSCR for the remaining property is not less than the greater of the DSCR immediately preceding the partial release and 1.82x, (iii) borrower partially defeases the loan in an amount equal to the greater of 125% of the allocated loan amount for the released property or 100% of the net sales proceeds from the released property. |
| (3) | Cash management will be triggered (i) upon an event of default, (ii) if the DSCR falls below 1.20x, (iii) if any mezzanine loan is outstanding, and (iv) the date that is 12 months prior to the expiration of any franchise agreement relating to an individual property. |
| (4) | The borrower will be required to deposit 1/12 of the annual insurance premiums into the insurance reserve if (i) an acceptable blanket policy is no longer in place and (ii) the balance on deposit falls below $21,695. |
| (5) | The borrower will be required to deposit the greater of (i) 1/12 of 4.0% of prior year’s gross revenues and (ii) any amount required under the management agreement or franchise agreement for FF&E work. |
| (6) | Fee Purchase reserve is established to fund the acquisition of the fee interest in the Homewood Suites St. Louis Park property in the event the landlord exercises its put option under the ground lease or the applicable borrower’s exercise of its purchase option. |
| TRANSACTION HIGHLIGHTS |
| § | Properties. The TPI Hospitality Pool A consists of two hotel properties containing a total of 249 guestrooms. The properties in the portfolio include the Homewood Suites New Brighton and the Homewood Suites St. Louis Park. The Homewood Suites New Brighton is a 124-room, extended stay hotel that opened in 2010. The hotel features complimentary breakfast, a fitness room, an indoor pool, laundry service, a business center and 636 sq. ft. of meeting space. The Homewood Suites St. Louis Park is a 125-room extended stay hotel that opened in 2010. The hotel features a complimentary breakfast, a fitness room, an indoor pool, laundry service, a business center and 918 sq. ft. of meeting space. |
| § | Location. The Homewood Suites New Brighton property is located off I-35, a north-south arterial in New Brighton, Minnesota. I-35 provides direct access to the Minneapolis central business district and the Minneapolis Saint Paul International Airport (“MSP Airport”). The hotel is in close proximity to a number of large cap and private sector employers headquartered in the area, including 3M, Land O’Lakes, AgriBank, Securian Fianancial, Boston Scientific, Medtronic, Target and API Group. The hotel also benefits from its proximity to the National Sports Center, located in nearby Blaine, Minnesota. The Homewood Suites St. Louis Park property is located in the “West End”, an area approximately seven miles west of Downtown Minneapolis. The St. Louis Park area is home to a number of major employers in the health care, consumer goods and agriculture industries, including General Mills, Target, Tennant Company, Syngenta, Allianz Life Insurance, Pentair and AstraZeneca, among others. The hotel is also in close proximity to the MSP Airport and the University of Minnesota. |
| § | Sponsor. Thomas R. Torgerson is the CEO and Chairman of the Board of TPI Hospitality and has over 30 years of hospitality industry experience. TPI Hospitality develops, builds and manages hotels and restaurants throughout the Twin Cities metro area, greater Minnesota and Naples, Florida. TPI Hospitality aligns with nationally recognized hotel and restaurant franchise companies like Hilton Hotels, Marriott Hotels, InterContinental Hotels Group (IHG), Best Western and Green Mill Restaurants. |
| § | Performance. For the trailing 12-month period ending September 2014, TPI Hospitality Pool A achieved an occupancy, ADR, and RevPAR of 80.3%, $130.56, and $104.76, respectively. In the same period, TPI Hospitality Pool A’s competitive set achieved an occupancy, ADR and RevPAR of 71.1%, $108.27 and $76.97, respectively, resulting in penetration rates of 112.9%, 120.6% and 136.1%. |
THE INFORMATION IN THIS STRUCTURAL AND COLLATERAL TERM SHEET IS NOT COMPLETE AND MAY BE AMENDED PRIOR TO THE TIME OF SALE. THIS TERM SHEET IS NOT AN OFFER TO SELL THESE SECURITIES AND IT IS NOT A SOLICITATION OF AN OFFER TO BUY THESE SECURITIES IN ANY JURISDICTION WHERE THE OFFER OR SALE IS NOT PERMITTED.
109
15 West 45th Street New York, NY 10036 | Collateral Asset Summary – Loan No. 20 Holiday Inn Express Manhattan Leased Fee | Cut-off Date Balance: Cut-off Date LTV: U/W NCF DSCR: U/W NOI Debt Yield: | $29,193,000 94.8% 1.35x 5.6% |
| Mortgage Loan Information | |
| Loan Seller: | CCRE |
| Loan Purpose: | Recapitalization |
| Sponsor: | Lexington Realty Trust |
| Borrower: | Lex 45th Street L.P. |
| Original Balance: | $29,193,000 |
| Cut-off Date Balance: | $29,193,000 |
| % by Initial UPB: | 2.3% |
| Interest Rate: | 4.1000% |
| Payment Date: | 6th of each month |
| First Payment Date: | February 6, 2015 |
Anticipated Repayment Date(1): | January 6, 2025 |
| Maturity Date: | January 6, 2030 |
Amortization(1): | Interest Only, ARD |
| Additional Debt: | None |
| Call Protection: | L(26), D(90), O(4) |
Lockbox / Cash Management(2): | Hard / Springing |
| Reserves | ||
| Initial | Monthly | |
Taxes(3): | $0 | Springing |
Insurance(3): | $0 | Springing |
FF&E(4): | $0 | Springing |
| Financial Information | ||
| Cut-off Date Balance / Sq. Ft.: | $8,645 | |
| Balloon Balance / Sq. Ft.: | $8,645 | |
| Cut-off Date LTV: | 94.8% | |
Balloon LTV(1): | 94.8% | |
| Underwritten NOI DSCR: | 1.35x | |
| Underwritten NCF DSCR: | 1.35x | |
| Underwritten NOI Debt Yield: | 5.6% | |
| Underwritten NCF Debt Yield: | 5.6% | |
| Financial Information – Fee (collateral) and Leasehold (non-collateral) | ||
Cut-off Date Balance / Key(5): | $233,544 | |
Balloon Balance / Key(5): | $233,544 | |
2014 NOI DSCR(6): | 3.63x | |
2014 NCF DSCR(6): | 3.28x | |
2014 NOI Debt Yield(6): | 15.1% | |
2014 NCF Debt Yield(6): | 13.6% | |
| Property Information | ||
| Single Asset / Portfolio: | Single Asset | |
| Property Type: | Leased Fee | |
| Collateral: | Fee Simple | |
| Location: | New York, NY | |
| Year Built / Renovated: | NAP | |
Total Sq. Ft.(7): | 3,377 | |
| Property Management: | NAP | |
Underwritten NOI(8): | $1,642,458 | |
Underwritten NCF(8): | $1,642,458 | |
| Appraised Value: | $30,800,000 | |
| Appraisal Date: | December 1, 2014 | |
| Ground Lease | |
| In Place Contractual Ground Rent: | $1,500,000 |
| Loan Term Average Ground Rent: | $1,642,458 |
| Ground Lease Expiration Date: | October 31, 2113 |
| Historical Occupancy | ||
| Most Recent Occupancy: | NAP | |
| 2014 Occupancy: | NAP | |
| 2013 Occupancy: | NAP | |
| (1) | The Holiday Inn Express Manhattan Leased Fee loan is structured with an anticipated repayment date (“ARD”). If the debt is not paid on or prior to the ARD, all excess cash flow will be swept to amortize existing principal and pay a monthly debt service payment of interest only on the then outstanding principal balance. After the ARD, the borrower will continue to pay interest at the initial rate, while the balance of the interest accrues and is applied to the outstanding principal debt balance. The Balloon LTV is based on the outstanding balance as of the ARD. |
| (2) | Cash management and an excess cash flow sweep will be triggered upon (i) an event of default, (ii) any bankruptcy action of borrower, principal, guarantor or property manager has occurred and is not discharged within 90 days, (iii) the ARD has occurred, (iv) a Ground Lease Trigger has occurred and the debt yield falls below 10.0% for two consecutive quarters. A “Ground Lease Trigger” will commence upon (i) an event of default under the ground lease, (ii) receipt of written notice by the ground lessee of its intention to terminate the ground lease, (iii) the termination or cancellation of the ground lease by either borrower or ground lessee through the institution of legal action without the lender’s consent or (iv) the occurrence of a bankruptcy action with respect to the ground lessee which is not discharged within 90 days. |
| (3) | The borrower will not be required to deposit monthly tax and insurance escrow funds into the tax and insurance escrow account provided (i) the ground lessee is required to pay and actually pays all taxes and insurance applicable to the Holiday Inn Express Manhattan Leased Fee property and (ii) no Ground Lease Trigger has occurred and is continuing. |
| (4) | The borrower will not be required to deposit monthly 1/12 of 4.0% of the leasehold gross revenue into the FF&E reserve account provided the ground lease has not been terminated. |
| (5) | The Holiday Inn Express Manhattan hotel has 125 keys. |
| (6) | 2014 NOI and 2014 NCF exclude payment of the underwritten $1,642,458 loan term average ground rent. |
| (7) | Total Sq. Ft. represents the gross sq. ft. of the land area. Balance / Sq. Ft. calculations for the fee interest (collateral) are based off the gross sq. ft. of the land area. |
| (8) | Underwritten NOI and Underwritten NCF is based on the average of the contractual ground rent payments during Holiday Inn Express Manhattan Leased Fee loan. |
| TRANSACTION HIGHLIGHTS |
§ | Property. The Holiday Inn Express Manhattan Leased Fee property consists of the land below the Holiday Inn Express Manhattan hotel, located at 15 West 45th Street. The Holiday Inn Express Manhattan hotel is a 21-story, 125 key limited service hotel owned and managed by an affiliate of the Magna Hospitality Group. Magna Hospitality Group is a privately held hotel real estate investment firm founded in 1998 with over $1.0 billion under development and management. Magna Hospitality Group is dedicated exclusively to hospitality investment development and management and currently owns and/or operates 19 hotels comprised of over 3,800 rooms. |
§ | Leasehold Interest. As of October 2014, the Holiday Inn Express Manhattan hotel exhibited trailing-twelve month occupancy, ADR and RevPAR of 92.4%, $247.55 and $228.73, respectively, resulting in occupancy, ADR and RevPar penetration rates of 96.2%, 94.6% and 91.0%, respectively. |
§ | Sponsorship. The Holiday Inn Express Manhattan Leased Fee property is owned by Lexington Property Trust (NYSE: LXP), a real estate investment trust that owns a diversified portfolio of equity and debt interests in single-tenant commercial properties and land. |
THE INFORMATION IN THIS STRUCTURAL AND COLLATERAL TERM SHEET IS NOT COMPLETE AND MAY BE AMENDED PRIOR TO THE TIME OF SALE. THIS TERM SHEET IS NOT AN OFFER TO SELL THESE SECURITIES AND IT IS NOT A SOLICITATION OF AN OFFER TO BUY THESE SECURITIES IN ANY JURISDICTION WHERE THE OFFER OR SALE IS NOT PERMITTED.
110
12290, 12300 and 12310 Sunrise Valley Drive Reston, VA 20191 | Collateral Asset Summary – Loan No. 21 Patriots Park | Cut-off Date Balance: Cut-off Date LTV: U/W NCF DSCR: U/W NOI Debt Yield: | $26,000,000 66.8% 2.19x 8.2% |
| Mortgage Loan Information | |
| Loan Seller: | Natixis |
| Loan Purpose: | Acquisition |
| Sponsor: | Hyundai Securities Co. Ltd.; Hyundai Able Investment, REIT |
| Borrower: | Hyundai Able Patriots Park, LLC |
Original Balance(1): | $26,000,000 |
Cut-off Date Balance(1): | $26,000,000 |
| % by Initial UPB: | 2.0% |
Interest Rate(2): | 3.6580% |
| Payment Date: | 5th of each month |
| First Payment Date: | November 5, 2014 |
Anticipated Repayment Date(2): | October 5, 2019 |
| Maturity Date: | March 5, 2033 |
Amortization(2): | Interest Only, ARD |
Additional Debt(1): | $189,070,000 Pari Passu Debt |
| Call Protection: | YM(29), DorYM(27), O(4) |
Lockbox / Cash Management(3): | Hard / Springing |
| Reserves | ||
| Initial | Monthly | |
| Taxes: | $1,101,043 | $220,209 |
| Insurance: | $18,896 | $18,896 |
Replacement(4): | $4,187,856 | Springing |
Parking Payment(5): | $0 | Springing |
| Financial Information | ||
| Cut-off Date Balance / Sq. Ft.: | $297 | |
| Balloon Balance / Sq. Ft.: | $297 | |
| Cut-off Date LTV: | 66.8% | |
| Balloon LTV: | 66.8% | |
| Underwritten NOI DSCR: | 2.20x | |
| Underwritten NCF DSCR: | 2.19x | |
| Underwritten NOI Debt Yield: | 8.2% | |
| Underwritten NCF Debt Yield: | 8.1% | |
| Property Information | |
| Single Asset / Portfolio: | Single Asset |
| Property Type: | Suburban Office |
| Collateral: | Fee Simple |
| Location: | Reston, VA |
| Year Built / Renovated: | 1986, 1987, 2006 / 2012 - 2013 |
Total Sq. Ft.(6): | 723,667 |
| Property Management: | Boston Properties Limited Partnership |
| Underwritten NOI: | $17,568,877 |
| Underwritten NCF: | $17,460,327 |
| Appraised Value: | $322,000,000 |
| Appraisal Date: | July 14, 2014 |
| Historical NOI | |
| Most Recent NOI: | $16,826,561 (T-12 June 30, 2014) |
| 2013 NOI: | NAV |
| 2012 NOI: | NAV |
Historical Occupancy(6) | |
| Most Recent Occupancy: | 97.5% (September 26, 2014) |
| 2013 Occupancy: | 97.5% (December 31, 2013) |
| 2012 Occupancy: | 97.5% (December 31, 2012) |
| (1) | The Original Balance and Cut-off Date Balance of $26.0 million represent the non-controlling Note A-3 of the $215.07 million Patriots Park loan combination, which is evidenced by three pari passu notes. The pari passu companion loans are comprised of the controlling Note A-1 with an original principal balance of $105.0 million and the non-controlling Note A-2 with an original principal balance of $84.07 million (although Natixis reserved the right to reapportion the balances between or sub-divide such notes). |
| (2) | The Patriots Park Loan is interest only through the Anticipated Repayment Date. If the Patriots Park loan combination is not repaid in full by the Anticipated Repayment Date, the interest rate will equal to the sum of (a) 3.5000% and (b) 2.5000% plus the greater of (i) 0.0000% and the amount by which the five-year treasury rate exceeds 3.0000%. |
| (3) | Cash management will be triggered upon (i) an event of default, (ii) the failure by the borrower, after the end of a calendar quarter, to maintain a DSCR of at least 1.10x, (iii) the delivery by the GSA to the borrower of a confidentiality breach termination notice (which is required to be at least eighteen months prior to GSA’s intention to vacate) or (iv) the failure by the borrower to repay the loan in full at least one month prior the Anticipated Repayment Date. |
| (4) | Monthly payments of $9,045.84 will be required if the amount in the replacement reserve account falls below $4,187,856 until the cap of $4,187,856 is met. |
| (5) | The borrower is required to deposit the parking termination prepayment to the Parking Payment reserve upon (i) the borrower receiving a parking payment from Boston Properties Limited Partnership (“BPLP”) and/or (ii) BPLP failing to make payments to the borrower as required under the parking rent support agreement. |
| (6) | The Patriots Park property is comprised of 705,905 sq. ft. of office space (97.5% of NRA) and 17,762 sq. ft. of warehouse (2.5% of NRA). GSA is in negotiation to lease the warehouse space. |
| TRANSACTION HIGHLIGHTS |
§ | Tenancy. The Patriots Park property is 97.5% leased by the United States of America (AA+/Aaa by S&P/Moody’s) via the General Services Administration (“GSA”) on behalf of its tenants under long-term 20-year leases expiring on September 30, 2032 (72.3% of the NRA) and March 6, 2033 (25.2% of the NRA). Both leases do not include appropriations clauses. The GSA and the seller have invested approximately $55.0 million ($76.0 per sq. ft.) and $40.5 million ($56.0 per sq. ft.), respectively, into the space in 2012 and 2013. GSA is in negotiation to lease the warehouse space. |
§ | Property. The Patriots Park property is a highly secured class A office campus situated on 22.7 acres and comprised of three office buildings (Patriots Park I, II and III) totaling 705,905 sq. ft.. There are two parking garages and a small surface lot with a combined total of 2,660 parking spaces. A 17,762 sq. ft. warehouse is nearing construction completion next to one of the parking garages. Patriots Park I and II were built in 1986 and 1987, respectively, and were fully renovated in 2012 and 2013, receiving a full façade replacement and complete replacement of all building systems including new HVAC, new elevators and refurbishment of the electrical systems. Patriots Park I & II have been certified LEED Silver. Patriots Park III, built in 2006, received minor renovations in 2013. The campus also received significant security upgrades commensurate with GSA protocol. Patriots Park II has a large cafeteria with commercial seating that can seat over 500 employees. The buildings also have numerous break rooms, as well as a convenience store, coffee counter and ATM machine. Each building has a full fitness center. |
§ | Location. The Patriots Park property is located at the intersection of Fairfax County Parkway and the Dulles Toll Road (Route 267) along Sunrise Valley Drive in Reston, Virginia, just east of the Washington Dulles International Airport. The property is in close proximity to the Reston Town Center which offers a wide variety of amenities such as restaurants, shopping, and open space. The property is located about one mile west of the Wiehle-Reston East Metrorail station, the terminus of the first phase of the Silver Line. In addition, the property will be in close proximity to the Reston Town Center and Herndon stations once the second phase is completed. Upon completion, the Silver Line will link the subject with Dulles International Airport. |
§ | Sponsor and Property Management. The sponsors of the Patriots Park property are Hyundai Able Investment, REIT and Hyundai Securities Co. Ltd., a leading South Korea-based financial company and an experienced owner of office, retail and residential properties in London, Tokyo, Shanghai and South Korea. The Patriots Park property is managed by Boston Properties Limited Partnership (“BPLP”) (Baa2/A-/BBB+ by Moody’s/S&P/Fitch). BPLP is a self-administered and self-managed real estate investment trust (REIT), traded on the New York Stock Exchange under the symbol “BXP.” BPLP is one of the largest owners, managers, and developers of first-class office properties in the United States, with significant presence in four markets: Boston, New York, San Francisco and Washington, DC. |
THE INFORMATION IN THIS STRUCTURAL AND COLLATERAL TERM SHEET IS NOT COMPLETE AND MAY BE AMENDED PRIOR TO THE TIME OF SALE. THIS TERM SHEET IS NOT AN OFFER TO SELL THESE SECURITIES AND IT IS NOT A SOLICITATION OF AN OFFER TO BUY THESE SECURITIES IN ANY JURISDICTION WHERE THE OFFER OR SALE IS NOT PERMITTED.
111
34940 Emerald Coast Parkway Destin, FL 32541 | Collateral Asset Summary – Loan No. 22 Shoppes at Paradise Isle | Cut-off Date Balance: Cut-off Date LTV: U/W NCF DSCR: U/W NOI Debt Yield: | $25,000,000 72.7% 1.38x 9.2% |
| Mortgage Loan Information | |
| Loan Seller: | Natixis |
| Loan Purpose: | Acquisition |
Sponsor(1): | Stoltz Real Estate Fund V, L.P. |
| Borrower: | Paradise Isle Destin LLC |
| Original Balance: | $25,000,000 |
| Cut-off Date Balance: | $25,000,000 |
| % by Initial UPB: | 1.9% |
| Interest Rate: | 4.4550% |
| Payment Date: | 5th of each month |
| First Payment Date: | November 5, 2014 |
| Maturity Date: | October 5, 2024 |
| Amortization: | Interest only for first 60 months; 360 months thereafter |
| Additional Debt: | None |
| Call Protection: | L(29), D(88), O(3) |
Lockbox / Cash Management(2): | Hard / Springing |
| Reserves | ||
| Initial | Monthly | |
| Taxes: | $131,333 | $11,939 |
| Insurance: | $34,300 | $5,717 |
| Replacement: | $0 | $2,146 |
TI/LC(3): | $0 | $14,306 |
| Required Repairs: | $2,500 | NAP |
Holdback(4): | $1,000,000 | $0 |
Rug-Décor(5): | $0 | Springing |
| Financial Information | ||
| Cut-off Date Balance / Sq. Ft.: | $146 | |
| Balloon Balance / Sq. Ft.: | $133 | |
| Cut-off Date LTV: | 72.7% | |
| Balloon LTV: | 66.5% | |
Underwritten NOI DSCR(6): | 1.51x | |
Underwritten NCF DSCR(6): | 1.38x | |
| Underwritten NOI Debt Yield: | 9.2% | |
| Underwritten NCF Debt Yield: | 8.4% | |
| Property Information | |
| Single Asset / Portfolio: | Single Asset |
| Property Type: | Anchored Retail |
| Collateral: | Fee Simple |
| Location: | Destin, FL |
| Year Built / Renovated: | 2004 / NAP |
| Total Sq. Ft.: | 171,669 |
| Property Management: | Stoltz Management of Delaware, Inc. |
| Underwritten NOI: | $2,288,865 |
| Underwritten NCF: | $2,091,446 |
| Appraised Value: | $34,370,000 |
| Appraisal Date: | September 6, 2014 |
| Historical NOI | |
| Most Recent NOI: | $2,350,950 (T-12 July 31, 2014) |
| 2013 NOI: | $2,459,644 (December 31, 2013) |
| 2012 NOI: | $2,555,955 (December 31, 2012) |
| Historical Occupancy | |
| Most Recent Occupancy: | 88.1% (October 1, 2014) |
| 2013 Occupancy: | 100.0% (December 31, 2013) |
| 2012 Occupancy: | 100.0% (December 31, 2012) |
| (1) | The sponsor is related to the borrower under the mortgage loan identified on Annex A-1 to the Free Writing Prospectus as 2 North Shore, which has a Cut-off Date Balance of $18,935,000. |
| (2) | Cash management will be triggered upon (i) an event of default, (ii) the failure by the borrower, after the end of a calendar quarter, to maintain a DSCR of at least 1.20x, (iii) the occurrence of a Major Tenant Trigger Event, (iv) the occurrence of a Major Tenant Renewal Trigger Event or (v) the occurrence of a Rug-Décor Trigger Event. A “Major Tenant Trigger Event” will commence if (i) a Major Tenant “goes dark”, (ii) a Major Tenant goes bankrupt or (iii) a Major Tenant defaults under its lease. A “Major Tenant Renewal Trigger Event” will commence upon the earlier of (i) six months prior to the expiration of a Major Tenant lease and (ii) the termination option date of a Major Tenant. A “Major Tenant” means Best Buy Stores, L.P. or Petsmart, Inc. A “Rug-Décor Trigger Event” will commence if Rug-Décor either (i) “goes dark”, (ii) gives notice to the borrower to terminate its lease or (iii) terminates its lease. |
| (3) | The TI/LC reserve is subject to a cap of $686,676 and a floor of $14,306. Monthly deposits increase to $343,338 when the floor is hit and continue until the cap is reached. |
| (4) | The borrower deposited at origination $1,000,000 in the Holdback reserve account so long as no event of default is continuing. Funds will be released on each payment date in an amount equal to the Holdback Distribution Amount, not to exceed $1,000,000. The “Holdback Distribution Amount” is, if any, equal to the excess of (i) allowable rents received during the preceding calendar month over (ii) $198,281 (which equates to $2,379,373 annually) multiplied by 0.97% (for 3% management fee) divided by 8.75%. |
| (5) | Upon the occurrence of a Rug-Décor Trigger Event, all excess cash flow will be deposited into the Rug-Décor reserve, subject to a cap of $75,000. |
| (6) | Based on amortizing debt service payments. Based on the current interest only payments, the Underwritten NOI DSCR and Underwritten NCF DSCR are 2.03x and 1.85x, respectively. |
| TRANSACTION HIGHLIGHTS |
§ | Tenancy. The Shoppes at Paradise Isle property is 88.1% leased as of October 1, 2014. All five anchor tenants are publicly traded companies rated at least B- or better by S&P. The largest tenant, Best Buy Stores, L.P. (29,920 sq. ft.; 17.4% of NRA; S&P/Moody’s/Fitch: BB/Baa2/BB), has been at the property since 2004. Best Buy Stores, L.P. is the largest consumer electronics outlet in the US. The company operates more than 1,400 stores throughout the US and Canada, and another 2,600 stores in Europe and China, mostly under the Best Buy, Best Buy Mobile, and The Car Phone Warehouse banners. In lieu of sales, Best Buy Stores, L.P. has informed the sponsor that the Destin, Florida location is the #1 performing Best Buy Stores, L.P. in the district. The other major tenant, Petsmart, Inc. (20,620 sq. ft.; 12.0% of NRA; S&P/Moody’s/Fitch: B+/NR/NR), was founded in 1986 and is the largest specialty retailer of services and solutions for the lifetime needs of pets. Petsmart, Inc. operates more than 1,232 pet stores in the US, Canada, and Puerto Rico, over 192 in-store PetsHotels and Doggie Day Camps, and is a leading online provider of pet supplies and pet care information. In lieu of sales, Petsmart, Inc. has informed the sponsor that the Destin, Florida location is the #1 performing Petsmart, Inc. in the district. |
§ | Sponsor and Property Management. Stoltz Real Estate Partners manages a diverse national portfolio of retail, office, industrial and land assets nationwide totaling approximately 10 million sq. ft. across 45 office, industrial, retail and mixed use properties with an aggregate asset value of more than $1.3 billion. The non-recourse carve out guarantor for the loan is Stoltz Real Estate Fund V, L.P. The fund was formed in 2014 and has a life of seven years with three one-year extension options. This will be the first property in the fund. Additionally, the fund has $55.0 million remaining of unconditionally committed but uncalled capital. The fund is still in the process of raising capital and anticipates a total equity raise of $300-$500 million during the 18-month capital commitment phase. For the term of the loan, the fund will covenant to maintain a net worth equal to at least 100% of the loan (excluding its investment in the properties) with no liquidity requirements. In the event the fund’s remaining investments can no longer satisfy the ongoing financial covenants or the properties are the last properties owned by the fund, the sponsor will be required to replace the fund with an acceptable guarantor. |
§ | Property and Location. The Shoppes at Paradise Isle property is comprised of a 171,669 sq. ft. anchored shopping center located in Destin, Florida, along the Gulf Coast about halfway between Panama City and Pensacola. The property is strategically located near the signalized intersection of US Highway 98 and Danny Wuerffel Way and approximately 0.5 miles north of the Gulf of Mexico. The area has a thriving tourism industry, which generated 4.4 million visitors in 2013 and brought over $2 billion to the area. Three military bases make up the Elgin Complex and comprise the largest air force base in the world, providing 72,000 jobs. |
THE INFORMATION IN THIS STRUCTURAL AND COLLATERAL TERM SHEET IS NOT COMPLETE AND MAY BE AMENDED PRIOR TO THE TIME OF SALE. THIS TERM SHEET IS NOT AN OFFER TO SELL THESE SECURITIES AND IT IS NOT A SOLICITATION OF AN OFFER TO BUY THESE SECURITIES IN ANY JURISDICTION WHERE THE OFFER OR SALE IS NOT PERMITTED.
112
800 North Shoreline Boulevard Corpus Christi, TX 78401 | Collateral Asset Summary – Loan No. 23 One Shoreline Plaza | Cut-off Date Balance: Cut-off Date LTV: U/W NCF DSCR: U/W NOI Debt Yield: | $24,000,000 68.6% 1.42x 9.7% |
| Mortgage Loan Information | |
| Loan Seller: | GACC |
| Loan Purpose: | Refinance |
| Sponsor: | Kamyar Mateen |
| Borrower: | One Shoreline Plaza, LLC |
| Original Balance: | $24,000,000 |
| Cut-off Date Balance: | $24,000,000 |
| % by Initial UPB: | 1.9% |
| Interest Rate: | 4.2500% |
| Payment Date: | 6th of each month |
| First Payment Date: | April 6, 2015 |
| Maturity Date: | March 6, 2025 |
| Amortization: | 360 months |
| Additional Debt: | None |
| Call Protection: | L(24), D(92), O(4) |
Lockbox / Cash Management(1): | Hard / Springing |
| Reserves | ||
| Initial | Monthly | |
| Taxes: | $85,140 | $42,570 |
Insurance(2): | $0 | Springing |
| Replacement: | $0 | $6,659 |
TI/LC(3): | $483,088 | $25,000 |
Lease Sweep(4): | $0 | Springing |
| Financial Information | ||
| Cut-off Date Balance / Sq. Ft.: | $66 | |
| Balloon Balance / Sq. Ft.: | $53 | |
| Cut-off Date LTV: | 68.6% | |
| Balloon LTV: | 55.0% | |
| Underwritten NOI DSCR: | 1.64x | |
| Underwritten NCF DSCR: | 1.42x | |
| Underwritten NOI Debt Yield: | 9.7% | |
| Underwritten NCF Debt Yield: | 8.4% | |
| Property Information | |
| Single Asset / Portfolio: | Single Asset |
| Property Type: | CBD Office |
| Collateral: | Fee Simple |
| Location: | Corpus Christi, TX |
| Year Built / Renovated: | 1985 / 2013 |
| Total Sq. Ft.: | 363,222 |
| Property Management: | One Shoreline GP, LLC |
| Underwritten NOI: | $2,322,240 |
| Underwritten NCF: | $2,009,353 |
| Appraised Value: | $35,000,000 |
| Appraisal Date: | November 10, 2014 |
| Historical NOI | |
| Most Recent NOI: | $2,305,922 (T-12 January 31, 2015) |
| 2014 NOI: | $2,284,078 (December 31, 2014) |
| 2013 NOI: | $2,749,797 (December 31, 2013) |
| 2012 NOI: | $2,710,322 (December 31, 2012) |
| Historical Occupancy | |
| Most Recent Occupancy: | 74.4% (January 27, 2015) |
| 2014 Occupancy: | 74.4% (December 31, 2014) |
| 2013 Occupancy: | 80.3% (December 31, 2013) |
| 2012 Occupancy: | 80.3% (December 31, 2012) |
| (1) | Cash management will be triggered (i) upon an event of default, (ii) if the DSCR falls below 1.20x until such time that the DSCR is at least 1.25x for two consecutive calendar quarters or (iii) the commencement of a Lease Sweep Period (as defined below). |
| (2) | The borrower will be required to deposit 1/12 of the annual insurance premiums into the insurance reserve if an acceptable blanket policy is no longer in place. |
| (3) | TI/LC reserve account is subject to a $550,000 cap. |
| (4) | On each monthly payment date during a Lease Sweep Period, the borrower is required to deposit all excess cash into the Lease Sweep Reserve. A “Lease Sweep Period” will commence upon, among other things, the date that is 12 months prior to the expiration of American Bank’s lease or any equivalent replacement lease. |
| TRANSACTION HIGHLIGHTS |
§ | Property. The One Shoreline Plaza property is a distinct and recognizable building in the Corpus Christi skyline, providing unobstructed, panoramic views of the Corpus Christi Bay. The property consists of two Class A office towers, one 22-story North Tower and one 28-story South Tower connected by a nine-story atrium totaling 363,222 sq. ft. with an attached 7-story parking garage containing 917 parking spaces (2.5 parking spaces per 1,000 sq. ft.). Furthermore, the One Shoreline Plaza property is located near the Omni Corpus Christi Hotel Bayfront Tower and the Holiday Inn Corpus Christi Downtown Marina. The One Shoreline Plaza property is also a high-end development that features ground-floor retail and lifestyle amenities for residents including the Corpus Christi Town Club, Corpus Christi’s finest and only private dining club. |
§ | Tenancy. The One Shoreline Plaza property is currently 74.4% occupied as of January 27, 2015 to a diverse rent roll of approximately 43 tenants with only one tenant occupying more than 6.1% of NRA. Within the rent roll, there are several investment grade and national tenants such as, Baker Hughes (rated NR/A2/A by Fitch/Moody’s/S&P), Merrill Lynch Pierce Fenner (rated A/Baa2/A- by Fitch/Moody’s/S&P), Reliant Energy (rated NR/B1/BB- by Fitch/Moody’s/S&P), UBS (rated A/NR/BBB+ by Fitch/Moody’s/S&P), and the US Attorney (rated AAA/Aaa/AA+ by Fitch/Moody’s/S&P), all of which have been at the property for more than 10 years. The US Attorney has been at the One Shoreline Plaza property since December 2000 and currently occupies the entire 5th floor at both towers. The property has attracted 4 new tenants in the last twelve months adding a total of 2.2% of NRA. Only six tenants, occupying 50,962 sq. ft. (14.0% of NRA) operate in the oil and gas industry. |
§ | Market. The One Shoreline Plaza property is located along North Shoreline Boulevard in between Twigg Street and Taylor Street within the city of Corpus Christi, Texas. The property has close accessibility to Highway 35, Highway 286 and Interstate 37. The One Shoreline Plaza property is located within the Corpus Christi central business district (“CBD”) submarket, which is the primary office submarket in Corpus Christi. Adjacent to the property is the Port of Corpus Christi, the fifth largest U.S. port and the deepest inshore port on the Gulf of Mexico. The Corpus Christi office market has been historically stable with an overall, five-year average occupancy of 92.5% in the CBD and a five-year average of 91% across the greater Corpus Christi office market. According to an industry report, as of Q4 2014, the overall Corpus Christi market vacancy was 9.6% and average rents were $15.27 PSF. |
§ | Sponsorship. Kamyar Mateen acquired the One Shoreline Plaza property in 2005 has completed approximately $4.6 million in capital improvements. The sponsor has a competitive advantage given that two of the three Class A office properties in the Corpus Christi CBD are owned by Kamyar Mateen. The sponsor currently manages and leases over 16 office buildings comprising approximately 4 million sq. ft. and 13 retail buildings comprising approximately 8 million sq. ft. |
THE INFORMATION IN THIS STRUCTURAL AND COLLATERAL TERM SHEET IS NOT COMPLETE AND MAY BE AMENDED PRIOR TO THE TIME OF SALE. THIS TERM SHEET IS NOT AN OFFER TO SELL THESE SECURITIES AND IT IS NOT A SOLICITATION OF AN OFFER TO BUY THESE SECURITIES IN ANY JURISDICTION WHERE THE OFFER OR SALE IS NOT PERMITTED.
113
| Washington, DC | Collateral Asset Summary – Loan Nos. 24-25 1424 K Street Northwest & 3300-3340 New York Ave Crossed Loans | Cut-off Date Balance: Cut-off Date LTV: U/W NCF DSCR: U/W NOI Debt Yield: | $23,544,776 67.6% 1.39x 9.3% |
| Mortgage Loan Information | |
| Loan Seller: | BNYM |
| Loan Purpose: | Refinance |
Sponsor(1): | Norman Jemal |
| Borrower: | Jemal’s Premium L.L.C.; Jemal’s Orme L.L.C. |
Original Balance(2): | $23,575,000 |
Cut-off Date Balance(2): | $23,544,776 |
| % by Initial UPB: | 1.8% |
| Interest Rate: | 4.0000% |
| Payment Date: | 6th of each month |
| First Payment Date: | March 6, 2015 |
| Maturity Date: | February 6, 2025 |
Amortization(2): | Various |
| Additional Debt: | None |
Call Protection(3): | L(25), D(91), O(4) |
Lockbox / Cash Management(4): | Hard / Springing |
| Reserves | ||
| Initial | Monthly | |
| Taxes: | $198,850 | $33,142 |
Insurance(5): | $0 | Springing |
| Replacement: | $0 | $5,608 |
| TI/LC: | $250,000 | $5,217 |
| Required Repairs: | $32,713 | NAP |
Lease Buyout(6): | $0 | Springing |
Tenant Cash Trap(7): | $0 | Springing |
Financial Information | ||
| Cut-off Date Balance /Sq. Ft.: | $167 | |
| Balloon Balance / Sq. Ft.: | $129 | |
| Cut-off Date LTV: | 67.6% | |
| Balloon LTV: | 52.5% | |
Underwritten NOI DSCR(8): | 1.46x | |
Underwritten NCF DSCR(8): | 1.39x | |
| Underwritten NOI Debt Yield: | 9.3% | |
| Underwritten NCF Debt Yield: | 8.9% | |
| Property Information | ||
| Single Asset / Portfolio: | Two crossed loans | |
| Property Type: | Industrial & Office | |
| Collateral: | Fee Simple | |
| Location: | Washington, DC | |
| Year Built / Renovated: | 1959; 1905 / Various | |
| Total Sq. Ft.: | 141,312 | |
| Property Management: | Douglas Development Corp. | |
| Underwritten NOI: | $2,200,165 | |
| Underwritten NCF: | $2,095,296 | |
| Appraised Value: | $34,840,000 | |
| Appraisal Date: | December 3, 2014 | |
| Historical NOI | ||
| 2014 NOI: | $1,317,415 (December 31, 2014) | |
| 2013 NOI: | $1,319,285 (December 31, 2013) | |
| 2012 NOI: | $1,587,936 (December 31, 2012) | |
| Historical Occupancy | ||
| Most Recent Occupancy: | 91.6% (Various) | |
| Second Most Recent Occupancy: | 69.1% (Various) | |
| Third Most Recent Occupancy: | 67.9% (Various) | |
| (1) | The sponsor is related to the borrower under the mortgage loan identified on Annex A-1 to the Free Writing Prospectus as Wonder Bread, which has a Cut-off Date Balance of $30,700,000. |
| (2) | The 1424 K Street Northwest and 3300-3340 New York Ave crossed loans are comprised of two loans that are cross-collateralized. The 1424 K Street loan has an original balance of $13.325 million with a five-year interest-only period followed by a 30-year amortization schedule. The 3300-3340 New York Ave loan has an original balance of $10.25 million and is structured with a 20-year amortization schedule. |
| (3) | If the borrower obtains the release of the cross-collateralized 3300-3340 New York Ave mortgage loan through a full defeasance under the mortgage loan documents, the borrower is also required to partially defease the 1424 K Street Northwest mortgage loan in an amount equal to the greater of (a) 10% of the allocated loan amount of the 3300-3340 New York Ave mortgage loan and (b) an amount such that, after giving effect to such partial defeasance, (i) the post-defeasance DSCR will be no less than 1.25x, (ii) the post-defeasance debt yield will be no less than 7.3% and (iii) the post-defeasance LTV will not exceed 72.4%. |
| (4) | Cash management will be triggered (i) upon an event of default, or (ii) if the DSCR falls below 1.10x until such time that the DSCR is at least 1.20x for two consecutive calendar quarters. With respect to the 1424 K Street Northwest mortgage loan, cash management will be triggered upon a Lease Buyout Cash Trap Period (as defined in the loan documents). |
| (5) | The borrower will be required to deposit 1/12 of the annual insurance premiums into the insurance accounts upon (i) an event of default, (ii) if an acceptable blanket insurance policy is no longer in place, or (iii) if the borrower fails to provide evidence that such insurance policies have been renewed, (iv) the insurance premiums are not paid within 10 days prior to the date they are due. |
| (6) | The 1424 K Street Northwest loan has a lease buyout reserve which requires the borrower to deposit the Tenant Buyout Payment (as defined in the loan documents) upon the Lease Buyout Conditions being met. |
| (7) | The 1424 K Street Northwest loan requires the borrower to deposit, on each monthly payment date during a Lease Buyout Cash Trap Period (as defined in the loan documents), all excess cash to the tenant cash trap reserve. |
| (8) | Based on the amortizing debt service payments. Based on interest only payments, the Underwritten NOI DSCR and the Underwritten NCF DSCR are 1.46x and 1.39x respectively. |
| TRANSACTION HIGHLIGHTS |
§ | Properties. The 1424 K Street Northwest & 3300-3340 New York Ave Crossed Loans consist of one industrial property and one office building containing a total of 141,312 sq. ft. The two properties are 3300-3340 New York Ave, a 97,790 sq. ft., Class B industrial property built in 1959 situated in northeast Washington, DC and 1424 K Street Northwest, a 43,522 sq. ft, Class B office building built in 1905, renovated in 2008 and situated at the intersection of the East End submarket and central business district of Washington, DC. |
§ | Market. 3300-3340 New York Ave is located within the city limits of Washington, DC. The industrial market within the District of Columbia is driven by tenants who are required by their government contracts to be located within the district limits. According to the appraisal, the industrial market ended Q3 2014 with a vacancy rate of 9.95%, net absorption of 140,517 sq. ft. and rental rates of $9.86 per sq. ft. 1424 K Street Northwest is located on the border of the central business district office submarket, which contains 38.7 million sq. ft. of office space. According to the appraisal, the submarket reported a vacancy level of 12.0% and market rates for office of $40 PSF and lower level space of $18 PSF. |
§ | Sponsor. Douglas Development Corp. (“DDC”) is one of the most successful real estate developers in the Washington area. Today, the company controls in excess of 8.5 million sq. ft. DDC and its principals have earned a national reputation for their redevelopment of historic properties, primarily in the East End submarket of DC. |
THE INFORMATION IN THIS STRUCTURAL AND COLLATERAL TERM SHEET IS NOT COMPLETE AND MAY BE AMENDED PRIOR TO THE TIME OF SALE. THIS TERM SHEET IS NOT AN OFFER TO SELL THESE SECURITIES AND IT IS NOT A SOLICITATION OF AN OFFER TO BUY THESE SECURITIES IN ANY JURISDICTION WHERE THE OFFER OR SALE IS NOT PERMITTED.
114
| Springfield, IL | Collateral Asset Summary – Loan No. 26 Springfield Hotels | Cut-off Date Balance: Cut-off Date LTV: U/W NCF DSCR: U/W NOI Debt Yield: | $20,931,891 46.5% 1.78x 13.8% |
| Mortgage Loan Information | |
| Loan Seller: | BNYM |
| Loan Purpose: | Acquisition |
| Sponsor: | Carlos J. Rodriguez; Carlos Rodriguez Living Trust; Daniel Klinger; Sami Shiro |
| Borrower: | 3000 South Dirksen, LP; 3050 South Dirksen, LP |
| Original Balance: | $21,000,000 |
| Cut-off Date Balance: | $20,931,891 |
| % by Initial UPB: | 1.6% |
| Interest Rate: | 4.4200% |
| Payment Date: | 6th of each month |
| First Payment Date: | February 6, 2015 |
| Maturity Date: | January 6, 2025 |
| Amortization: | 330 months |
| Additional Debt: | None |
| Call Protection: | L(26), D(89), O(5) |
Lockbox / Cash Management(1): | Springing Hard / Springing |
| Reserves | ||
| Initial | Monthly | |
| Taxes: | $249,630 | $41,605 |
Insurance(2): | $110,912 | Springing |
FF&E(3): | $0 | Springing |
PIP(4): | $11,400,000 | $0 |
| Financial Information | ||
| Cut-off Date Balance / Room: | $48,906 | |
| Balloon Balance / Room: | $37,916 | |
Cut-off Date LTV(4): | 46.5% | |
| Balloon LTV: | 36.1% | |
| Underwritten NOI DSCR: | 2.19x | |
| Underwritten NCF DSCR: | 1.78x | |
| Underwritten NOI Debt Yield: | 13.8% | |
| Underwritten NCF Debt Yield: | 11.2% | |
| Property Information | ||
| Single Asset / Portfolio: | Portfolio of two properties | |
| Property Type: | Full Service and Limited Service Hospitality | |
| Collateral: | Fee Simple | |
| Location: | Springfield, IL | |
| Year Built / Renovated: | Various / NAP | |
| Total Rooms: | 428 | |
| Property Management: | Driftwood Hospitality Management, LLC | |
| Underwritten NOI: | $2,893,737 | |
| Underwritten NCF: | $2,344,969 | |
“As Complete” Appraised Value(4): | $45,000,000 | |
| “As Complete” Appraisal Date: | January 1, 2016 | |
| Historical NOI | ||
| Most Recent NOI: | $2,487,047 (T-12 November 30, 2014) | |
| 2013 NOI: | $3,202,815 (December 31, 2013) | |
| 2012 NOI: | $3,235,682 (December 31, 2012) | |
| 2011 NOI: | $3,888,100 (December 31, 2011) | |
| Historical Occupancy / ADR / RevPAR | ||
| Most Recent: | 55.8% / $100.30 / $55.93 (November 30, 2014) | |
| 2013: | 58.5% / $100.42 / $58.79 (December 31, 2013) | |
| 2012: | 55.9% / $98.43 / $55.08 (December 31, 2012) | |
| 2011: | 60.9% / $94.96 / $57.84 (December 31, 2011) | |
| (1) | Cash management will be triggered (i) upon an event of default, or (ii) if the DSCR falls below 1.20x. |
| (2) | The borrower will be required to deposit 1/12 of the annual insurance premiums into the insurance reserve if an acceptable blanket policy is no longer in place. |
| (3) | Beginning on January 6, 2017, the borrower will be required to deposit 1/12 of 4.0% of prior year’s gross revenues. Ongoing FF&E reserves are waived for the initial 23 months due to the large upfront PIP reserve. |
| (4) | The appraisal was done on an “As Complete” basis after the completion of the PIP, which is fully reserved for. Based on the “As-is” appraised value of $29,500,000, the Cut-off Date LTV is 71.0%. |
| TRANSACTION HIGHLIGHTS |
§ | Properties. The Springfield Hotels loan consists of two hotel properties containing a total of 428 guestrooms. The properties in the portfolio include the Springfield Crowne Plaza and the Springfield Holiday Inn Express. The Springfield Crowne Plaza is a 288-room, fourteen story, full service hotel that opened in 1997. The hotel features one bar and two restaurants, a fitness center, a rooftop indoor pool, a business center and meeting space totaling 67,959 sq. ft. (including a 28,000 sq. ft. exhibition hall and a 13,332 sq. ft. ballroom). The Springfield Holiday Inn Express is a 140-room limited service hotel that opened in 1998. The hotel features a breakfast room, a fitness room, a business center and 1,206 sq. ft. of meeting space. |
§ | Location. The properties sit adjacent to each other just north of the I-55/I-72 interchange in Springfield, Illinois. The properties enjoy good visibility and easy access from the interstate. Springfield, Illinois is the state capital of Illinois and acts as a regional hub. Springfield, Illinois has a stable and growing economy which is based on healthcare and government employment. Crowne Plaza’s large conference amenities attract a substantial amount of group business which drives approximately 50% of its room’s revenue. The conference room capacity at the Crowne Plaza is greater than the Springfield Conference Center and contains two separate meeting rooms that have capacity over 1,200 people. Conferences held in Springfield attract attendees from across the Midwest due to Springfield’s central location and easy access to both north/south and east/west interstates. |
§ | Sponsor / Manager. Driftwood Hospitality Management, LLC is the property manager and is also providing a completion guarantee for the PIP. Driftwood Hospitality Management, LLC is the manager for over 45 hotels and carries a market value in excess of $40 million. The guarantors are three high net worth individuals, Carlos J. Rodriguez, Sami Shiro and Daniel Klinger, who are each the non-recourse guarantors for this transaction. Carlos Rodriguez Living Trust is also a non-recourse guarantor. Carlos J. Rodriguez is a principal and EVP of Driftwood Hospitality. Mr. Rodriguez has over 30 years of real estate investment and management experience and has been a guarantor on at least six CMBS 2.0 deals. Collectively, the guarantors have a net worth over $20 million and a liquidity of over $1.1 million. |
§ | PIP. The properties are both undergoing extensive property improvement plans that have a combined budget of $10.5 million including a $1.0 million contingency. The loan was structured with an upfront PIP reserve of $11.4 million. |
THE INFORMATION IN THIS STRUCTURAL AND COLLATERAL TERM SHEET IS NOT COMPLETE AND MAY BE AMENDED PRIOR TO THE TIME OF SALE. THIS TERM SHEET IS NOT AN OFFER TO SELL THESE SECURITIES AND IT IS NOT A SOLICITATION OF AN OFFER TO BUY THESE SECURITIES IN ANY JURISDICTION WHERE THE OFFER OR SALE IS NOT PERMITTED.
115
STATEMENT REGARDING ASSUMPTIONS AS TO
SECURITIES, PRICING ESTIMATES AND OTHER INFORMATION
This material is for your information, and none of Deutsche Bank Securities Inc., Cantor Fitzgerald & Co., Natixis Securities Americas LLC, CastleOak Securities, L.P., Guggenheim Securities, LLC and KeyBanc Capital Markets Inc. (the “Underwriters”) are soliciting any action based upon it. This material is not to be construed as an offer to sell or the solicitation of any offer to buy any security in any jurisdiction where such an offer or solicitation would be illegal.
Neither this document nor anything contained herein shall form the basis for any contract or commitment whatsoever. The information contained herein is preliminary as of the date hereof. These materials are subject to change, completion or amendment from time to time. The information contained herein will be superseded by similar information delivered to you as part of the offering document relating to the COMM 2015-CCRE22 Mortgage Trust Commercial Mortgage Pass-Through Certificates (the “Offering Document”). The Information supersedes any such information previously delivered. The Information should be reviewed only in conjunction with the entire Offering Document. All of the information contained herein is subject to the same limitations and qualifications contained in the Offering Document. The Information contained herein does not contain all relevant information relating to the underlying mortgage loans or mortgaged properties. Such information is described elsewhere in the Offering Document. The information contained herein will be more fully described elsewhere in the Offering Document. The information contained herein should not be viewed as projections, forecasts, predictions or opinions with respect to value. Prior to making any investment decision, prospective investors are strongly urged to read the Offering Document its entirety. Neither the Securities and Exchange Commission nor any state securities commission has approved or disapproved of these securities or determined if this free writing prospectus is truthful or complete. Any representation to the contrary is a criminal offense.
The attached information contains certain tables and other statistical analyses (the “Computational Materials”) which have been prepared in reliance upon information furnished by the Mortgage Loan Sellers. Numerous assumptions were used in preparing the Computational Materials, which may or may not be reflected herein. As such, no assurance can be given as to the Computational Materials’ accuracy, appropriateness or completeness in any particular context; or as to whether the Computational Materials and/or the assumptions upon which they are based reflect present market conditions or future market performance. The Computational Materials should not be construed as either projections or predictions or as legal, tax, financial or accounting advice. You should consult your own counsel, accountant and other advisors as to the legal, tax, business, financial and related aspects of a purchase of these securities. Any weighted average lives, yields and principal payment periods shown in the Computational Materials are based on prepayment and/or loss assumptions, and changes in such prepayment and/or loss assumptions may dramatically affect such weighted average lives, yields and principal payment periods. In addition, it is possible that prepayments or losses on the underlying assets will occur at rates higher or lower than the rates shown in the attached Computational Materials. The specific characteristics of the securities may differ from those shown in the Computational Materials due to differences between the final underlying assets and the preliminary underlying assets used in preparing the Computational Materials. The principal amount and designation of any security described in the Computational Materials are subject to change prior to issuance. None of Underwriters or any of their respective affiliates makes any representation or warranty as to the actual rate or timing of payments or losses on any of the underlying assets or the payments or yield on the securities.
This document contains forward-looking statements. Those statements are subject to certain risks and uncertainties that could cause the success of collections and the actual cash flow generated to differ materially from the information set forth herein. While such information reflects projections prepared in good faith based upon methods and data that are believed to be reasonable and accurate as of the dates thereof, the depositor undertakes no obligation to revise these forward-looking statements to reflect subsequent events or circumstances. Individuals should not place undue reliance on forward-looking statements and are advised to make their own independent analysis and determination with respect to the forecasted periods, which reflect the issuer’s view only as of the date hereof.
IMPORTANT NOTICE RELATING TO AUTOMATICALLY GENERATED EMAIL DISCLAIMERS
Any legends, disclaimers or other notices that may appear at the bottom of the email communication to which this free writing prospectus is attached relating to (1) these materials not constituting an offer (or a solicitation of an offer), (2) no representation being made that these materials are accurate or complete and may not be updated or (3) these materials possibly being confidential, are not applicable to these materials and should be disregarded. Such legends, disclaimers or other notices have been automatically generated as a result of these materials having been sent via Bloomberg or another system.