2016 Investor Day February 22, 2016 Exhibit 99.2
AVANGRID Investor Day Legal Notices FORWARD LOOKING STATEMENTS Certain statements in this presentation may relate to our future business and financial performance and future events or developments involving us and our subsidiaries that are not purely historical and may constitute “forward-looking statements” within the meaning of the Private Securities Litigation Reform Act of 1995. Forward-looking statements may be identified by the use of forward-looking terms such as “may,” “will,” “should,” “can,” “expects,” “believes,” “anticipates,” “intends,” “plans,” “estimates,” “projects,” “assumes,” “guides,” “targets,” “forecasts,” “is confident that” and “seeks” or the negative of such terms or other variations on such terms or comparable terminology. Such forward-looking statements include, but are not limited to, statements about our plans, objectives and intentions, outlooks or expectations for earnings, revenues, expenses or other future financial or business performance, strategies or expectations, or the impact of legal or regulatory matters on our business, results of operations or financial condition. Such statements are based upon the current beliefs and expectations of our management and are subject to significant risks and uncertainties that could cause actual outcomes and results to differ materially. Important factors that could cause actual results to differ materially from those indicated by such forward-looking statements include, without limitation, the risks and uncertainties set forth under the section entitled “Risk Factors” and “Management’s Discussion and Analysis of Financial Condition and Results of Operations” in our Quarterly Report on Form 10-Q, which is on file with the SEC and available on our investor relations website at www.avangrid.com and on the SEC website at www.sec.gov. Additional information will also be set forth in filings with the SEC. Should one or more of these risks or uncertainties materialize, or should any of the underlying assumptions prove incorrect, actual results may vary in material respects from those expressed or implied by these forward-looking statements. You should not place undue reliance on these forward-looking statements. We do not undertake any obligation to update or revise any forward-looking statements to reflect events or circumstances after the date of the communication, whether as a result of new information, future events or otherwise, except as may be required under applicable securities laws.
AVANGRID Investor Day Legal Notices Use of Non-GAAP Measures AVANGRID believes that a breakdown presented on a net income and per share basis by line of business is useful in understanding the change in the results of operations of AVANGRID’s lines of business from one reporting period to another and in evaluating the actual and projected financial performance and contribution of AVANGRID’s lines of businesses. Earnings per share (EPS) by business is a non-GAAP (not determined using generally accepted accounting principles) measure that is calculated by taking the pre-tax amounts determined in accordance with GAAP of each line of business, and applying the effective statutory federal and state tax rate and then dividing the results by the average number of diluted shares of AVANGRID’s common stock outstanding for the periods presented. Any such amounts provided are provided for informational purposes only and are not intended to be used to calculate "Pro-forma" amounts. AVANGRID also believe presenting earnings excluding certain non-recurring items, including as presented in the net income discussion and in the earnings guidance section, is useful in understanding and evaluating actual and projected financial performance and contribution of AVANGRID and to more fully compare and explain our results without including the impact of the non-recurring items. Lastly, AVANGRID, believes that presenting certain non-GAAP metrics (as defined in the Appendix) is useful because it can be used to analyze and compare profitability between companies and industries because it eliminates the impact of financing and certain non-cash charges. Non-GAAP financial measures should not be considered as alternatives to AVANGRID’s consolidated net income or EPS determined in accordance with GAAP as indicators of AVANGRID’s operating performance. About AVANGRID AVANGRID, Inc. (NYSE:AGR) is a diversified energy and utility company with $31 billion in assets and operations in 23 states. The company operates regulated utilities and electricity generation through two primary lines of business. AVANGRID Networks includes eight electric and natural gas utilities serving 3.1 million customers in New York and New England. AVANGRID Renewables operates 6.3 gigawatts of electricity capacity, primarily through wind power, in states across the U.S. AVANGRID employs 7,000 people. The company was formed as a business combination between Iberdrola USA and UIL holdings in 2015. AVANGRID remains an affiliate of the Iberdrola Group, a worldwide leader in the energy industry.
Presenters James P. TorgersonChief Executive Officer Richard J. NicholasChief Financial Officer Robert D. Kump Chief Executive Officer of AVANGRID Networks, Inc. Frank Burkhartsmeyer Chief Executive Officer of AVANGRID Renewables, LLC. AVANGRID Investor Day AVANGRID 2016 Investor Day IR Contacts: Patricia Cosgel, Vice President Investor and Shareholder Relations Michelle Hanson, Manager Investor Relations Carlota Lopez Lumbierres, Manager Investor Relations Investors@AVANGRID.com
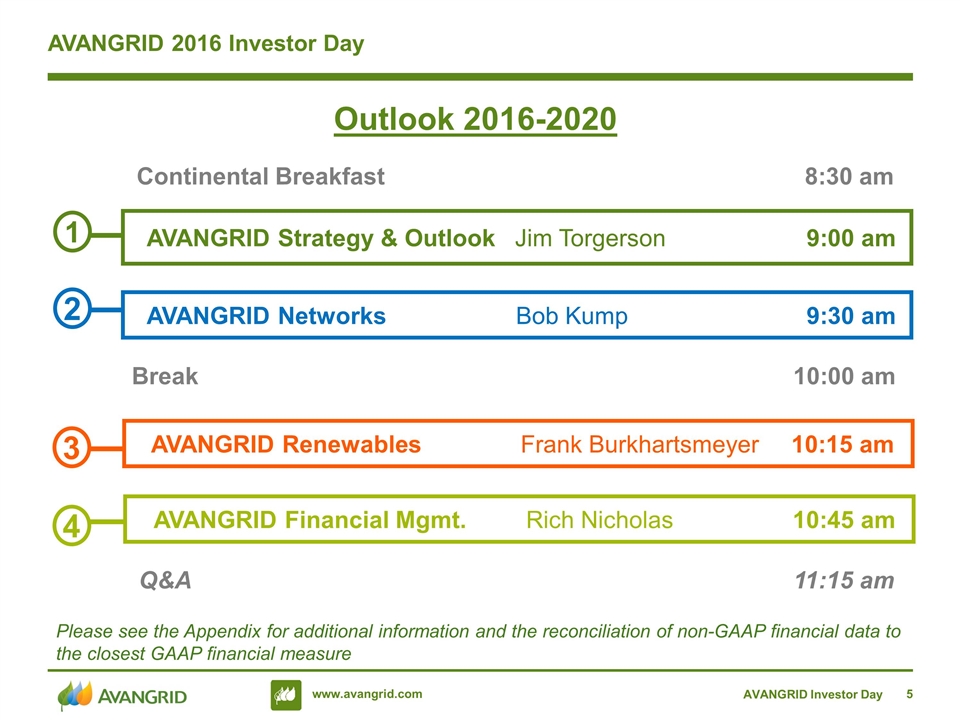
AVANGRID 2016 Investor Day 1 AVANGRID Strategy & Outlook Jim Torgerson 9:00 am Outlook 2016-2020 2 AVANGRID Networks Bob Kump 9:30 am 3 AVANGRID Renewables Frank Burkhartsmeyer 10:15 am 4 AVANGRID Financial Mgmt. Rich Nicholas 10:45 am Q&A 11:15 am Break 10:00 am Continental Breakfast 8:30 am AVANGRID Investor Day Please see the Appendix for additional information and the reconciliation of non-GAAP financial data to the closest GAAP financial measure
Jim Torgerson AVANGRID Strategy and Outlook AVANGRID Investor Day 1
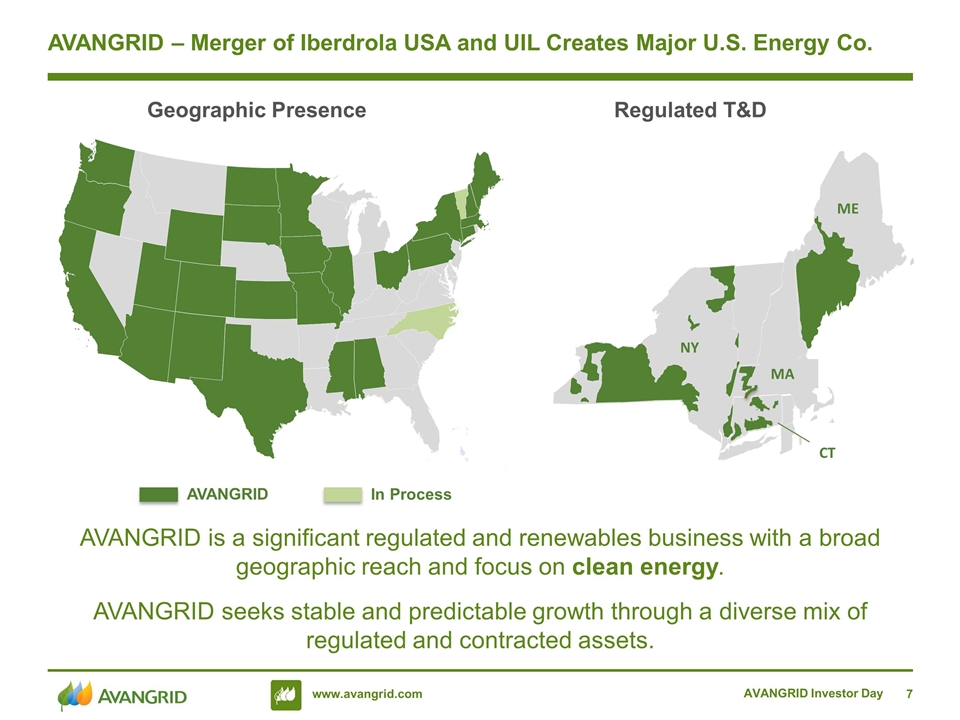
AVANGRID Investor Day AVANGRID – Merger of Iberdrola USA and UIL Creates Major U.S. Energy Co. AVANGRID is a significant regulated and renewables business with a broad geographic reach and focus on clean energy. AVANGRID seeks stable and predictable growth through a diverse mix of regulated and contracted assets. NY ME MA CT Geographic Presence Regulated T&D AVANGRID In Process
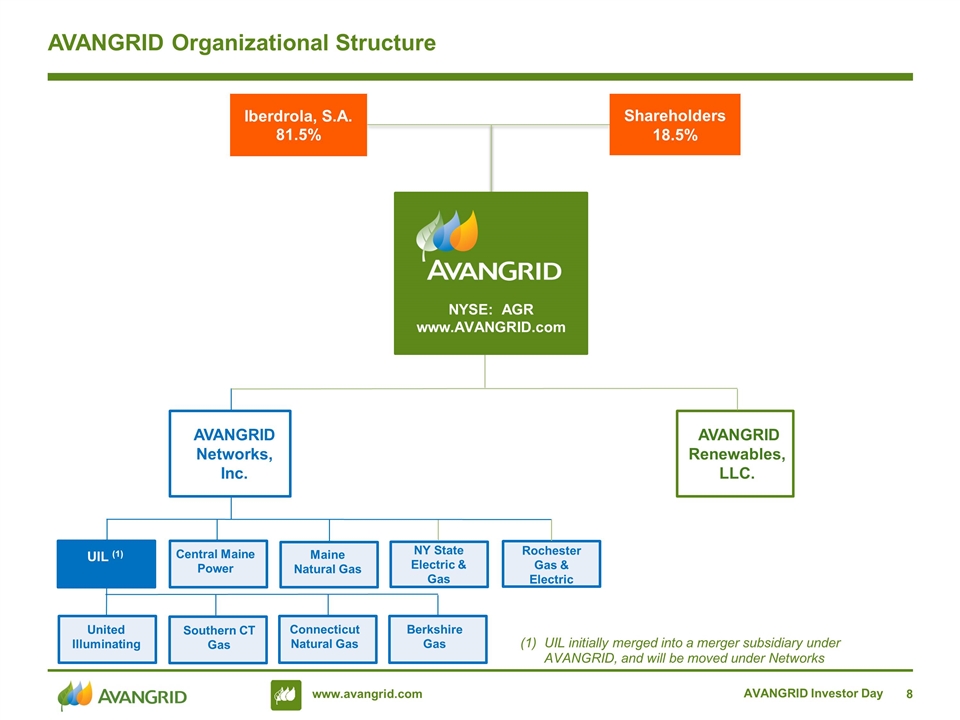
NY State Electric & Gas AVANGRID Investor Day AVANGRID Organizational Structure AVANGRID Networks, Inc. NYSE: AGR www.AVANGRID.com AVANGRID Renewables, LLC. Iberdrola, S.A. 81.5% Shareholders 18.5% Maine Natural Gas Central Maine Power UIL (1) Rochester Gas & Electric Southern CT Gas Connecticut Natural Gas Berkshire Gas United Illuminating (1)UIL initially merged into a merger subsidiary under AVANGRID, and will be moved under Networks
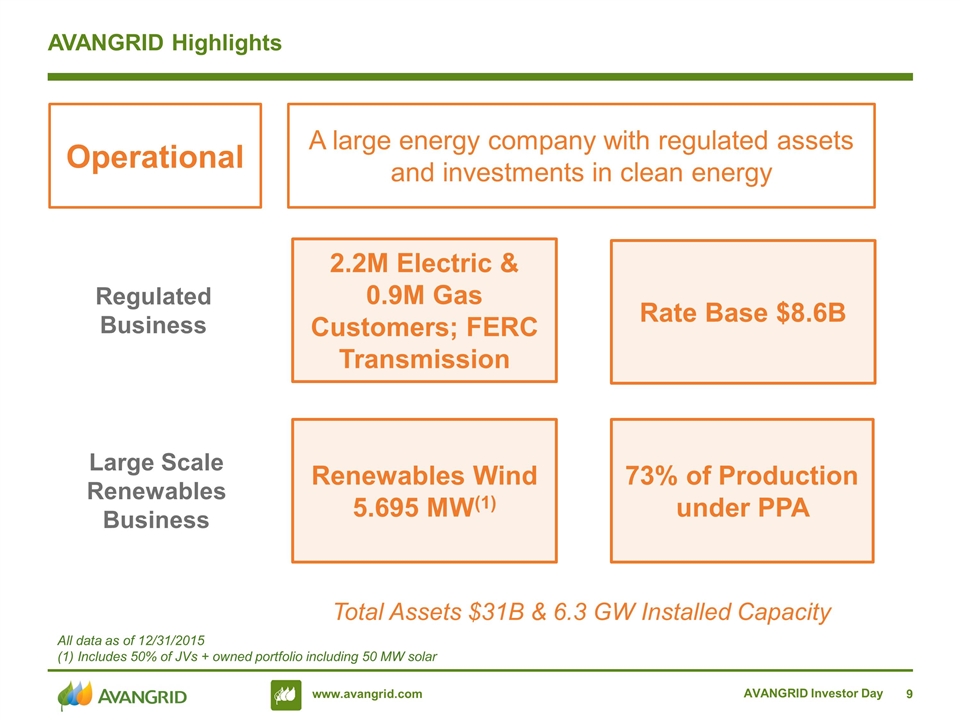
AVANGRID Investor Day AVANGRID Highlights Operational A large energy company with regulated assets and investments in clean energy Regulated Business Large Scale Renewables Business Rate Base $8.6B 2.2M Electric & 0.9M Gas Customers; FERC Transmission 73% of Production under PPA Renewables Wind 5.695 MW(1) All data as of 12/31/2015 (1) Includes 50% of JVs + owned portfolio including 50 MW solar Total Assets $31B & 6.3 GW Installed Capacity
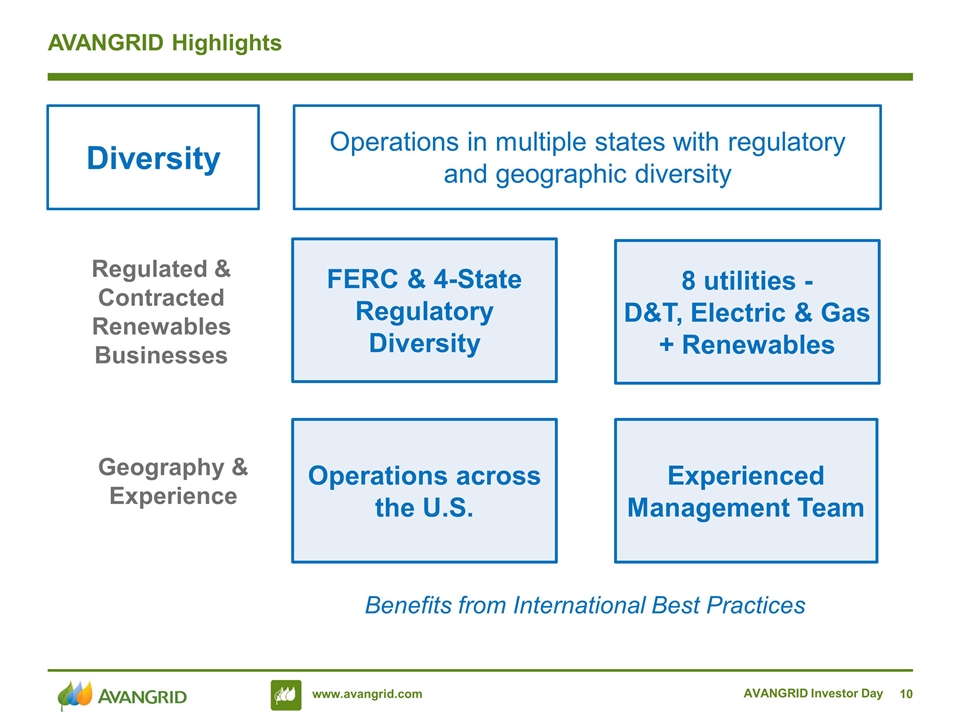
AVANGRID Investor Day AVANGRID Highlights Diversity Operations in multiple states with regulatory and geographic diversity Regulated & Contracted Renewables Businesses 8 utilities - D&T, Electric & Gas + Renewables FERC & 4-State Regulatory Diversity Experienced Management Team Operations across the U.S. Geography & Experience Benefits from International Best Practices
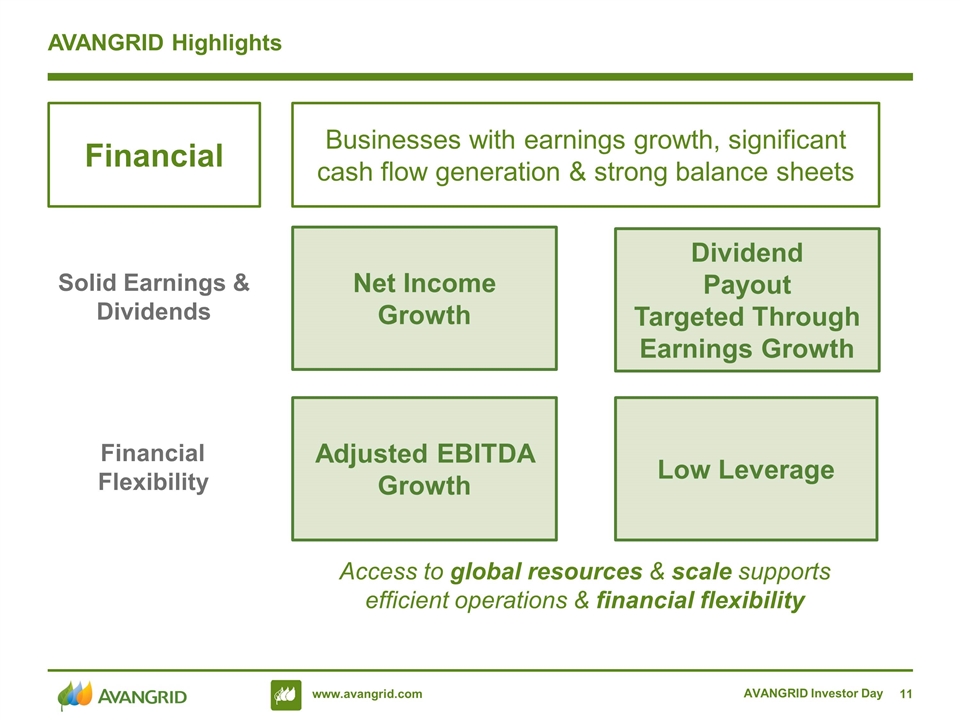
AVANGRID Investor Day AVANGRID Highlights Financial Businesses with earnings growth, significant cash flow generation & strong balance sheets Dividend Payout Targeted Through Earnings Growth Solid Earnings & Dividends Financial Flexibility Net Income Growth Low Leverage Adjusted EBITDA Growth Access to global resources & scale supports efficient operations & financial flexibility
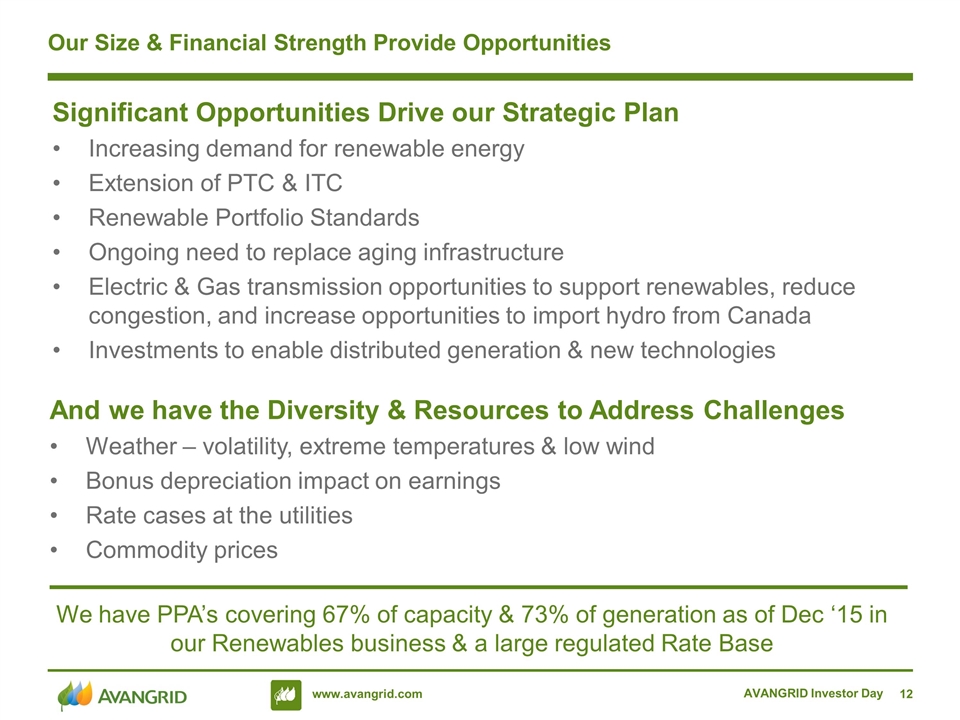
And we have the Diversity & Resources to Address Challenges Weather – volatility, extreme temperatures & low wind Bonus depreciation impact on earnings Rate cases at the utilities Commodity prices Significant Opportunities Drive our Strategic Plan Increasing demand for renewable energy Extension of PTC & ITC Renewable Portfolio Standards Ongoing need to replace aging infrastructure Electric & Gas transmission opportunities to support renewables, reduce congestion, and increase opportunities to import hydro from Canada Investments to enable distributed generation & new technologies AVANGRID Investor Day Our Size & Financial Strength Provide Opportunities We have PPA’s covering 67% of capacity & 73% of generation as of Dec ‘15 in our Renewables business & a large regulated Rate Base
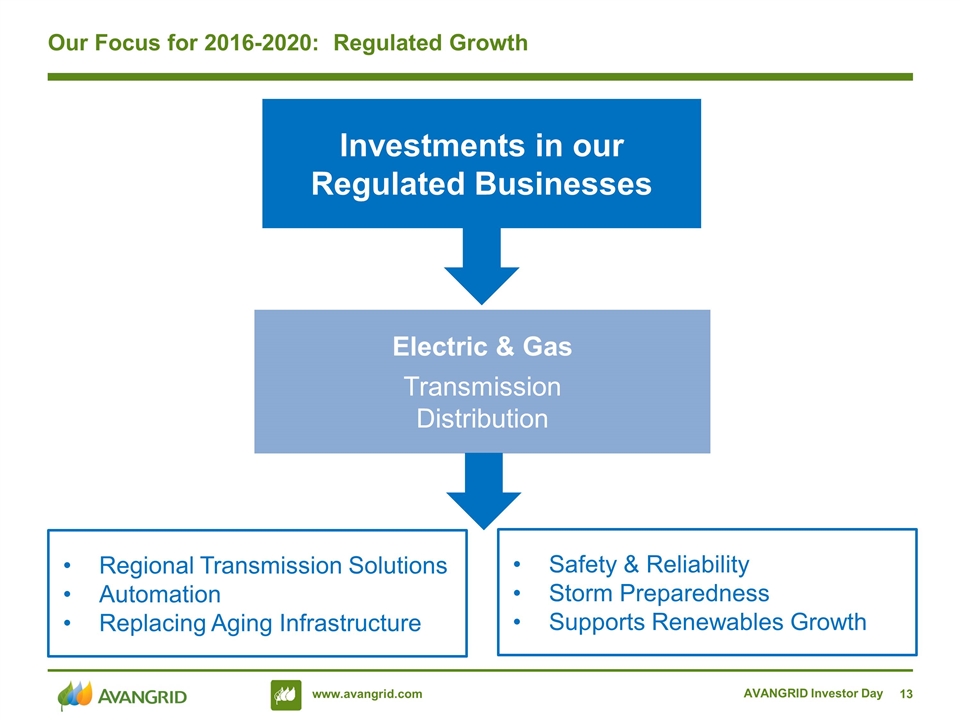
AVANGRID Investor Day Our Focus for 2016-2020: Regulated Growth Investments in our Regulated Businesses Electric & Gas Transmission Distribution Safety & Reliability Storm Preparedness Supports Renewables Growth Regional Transmission Solutions Automation Replacing Aging Infrastructure
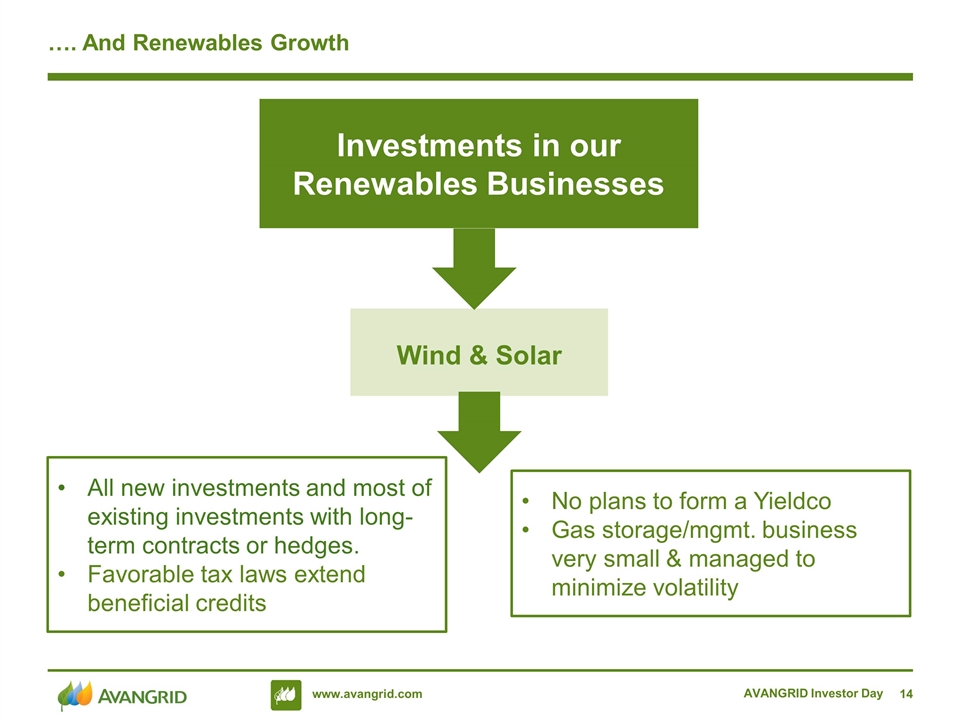
AVANGRID Investor Day …. And Renewables Growth Investments in our Renewables Businesses Wind & Solar All new investments and most of existing investments with long-term contracts or hedges. Favorable tax laws extend beneficial credits No plans to form a Yieldco Gas storage/mgmt. business very small & managed to minimize volatility
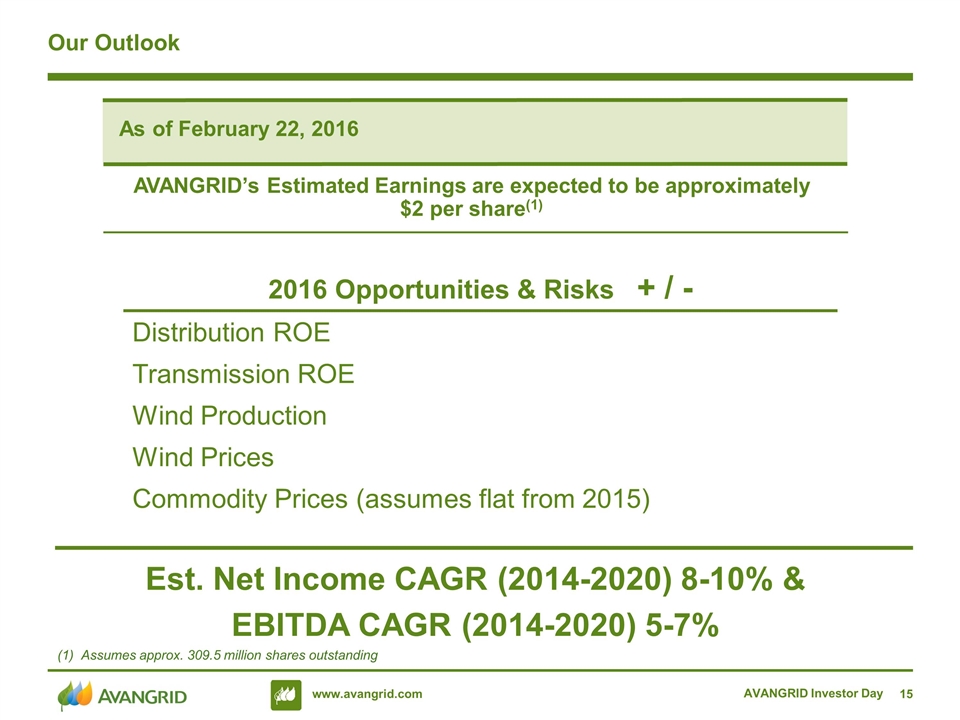
AVANGRID Investor Day Our Outlook AVANGRID’s Estimated Earnings are expected to be approximately $2 per share(1) As of February 22, 2016 2016 Opportunities & Risks + / - Distribution ROE Transmission ROE Wind Production Wind Prices Commodity Prices (assumes flat from 2015) Est. Net Income CAGR (2014-2020) 8-10% & EBITDA CAGR (2014-2020) 5-7% (1) Assumes approx. 309.5 million shares outstanding
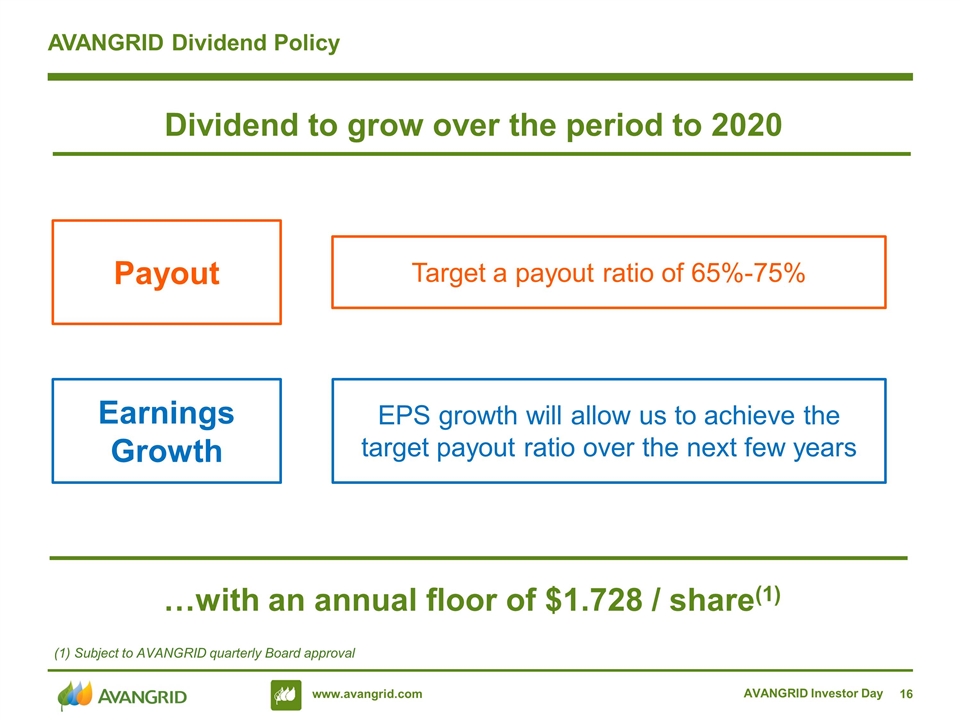
AVANGRID Investor Day AVANGRID Dividend Policy Payout Earnings Growth Target a payout ratio of 65%-75% EPS growth will allow us to achieve the target payout ratio over the next few years …with an annual floor of $1.728 / share(1) Dividend to grow over the period to 2020 (1) Subject to AVANGRID quarterly Board approval
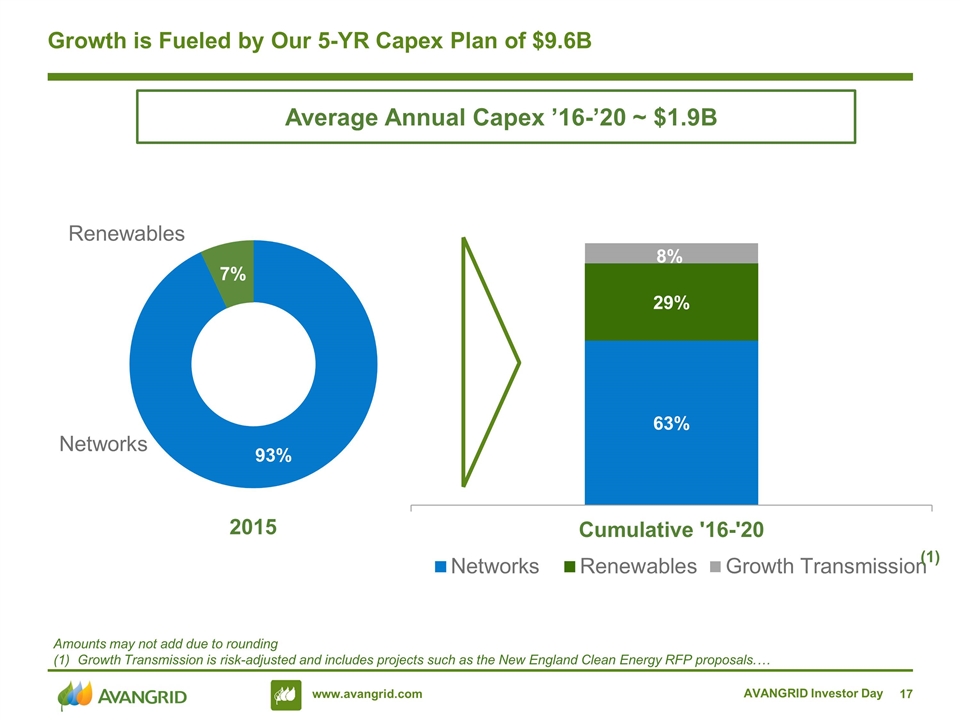
AVANGRID Investor Day Growth is Fueled by Our 5-YR Capex Plan of $9.6B Amounts may not add due to rounding Growth Transmission is risk-adjusted and includes projects such as the New England Clean Energy RFP proposals.… (1) Average Annual Capex ’16-’20 ~ $1.9B Networks 2015
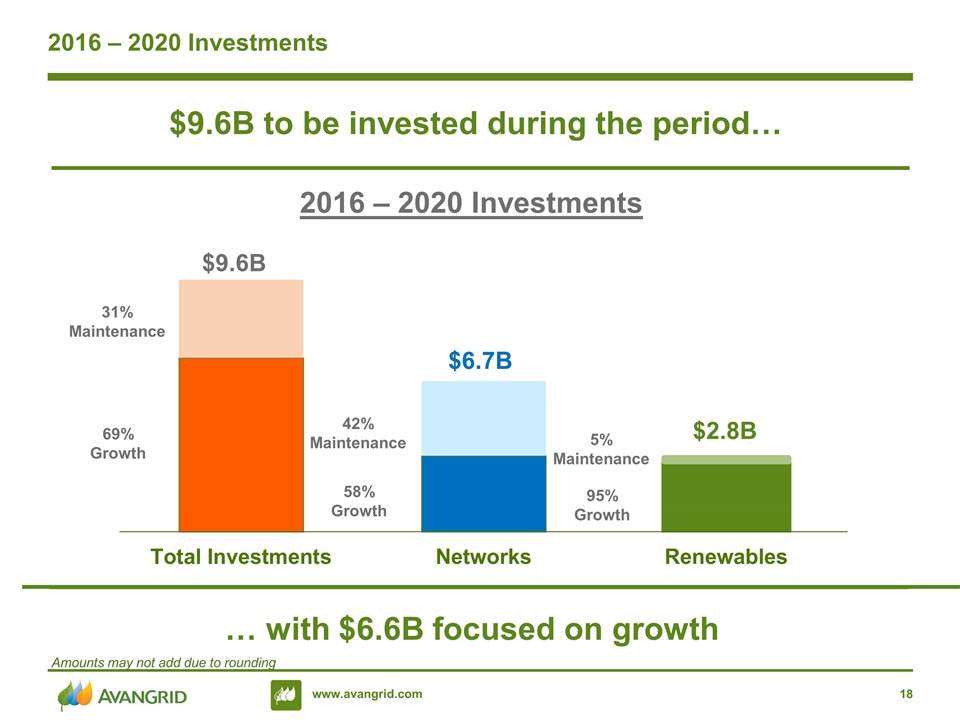
2016 – 2020 Investments 2016 – 2020 Investments $9.6B $9.6B to be invested during the period… … with $6.6B focused on growth 31% Maintenance 69% Growth 42% Maintenance 58% Growth 5% Maintenance 95% Growth Amounts may not add due to rounding
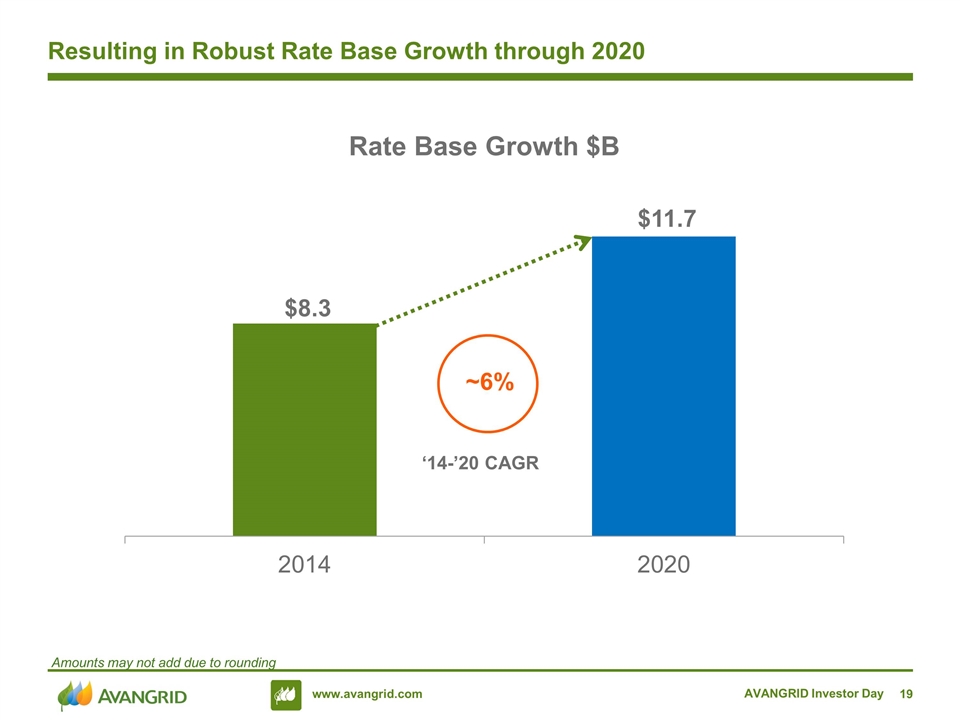
AVANGRID Investor Day Resulting in Robust Rate Base Growth through 2020 Amounts may not add due to rounding
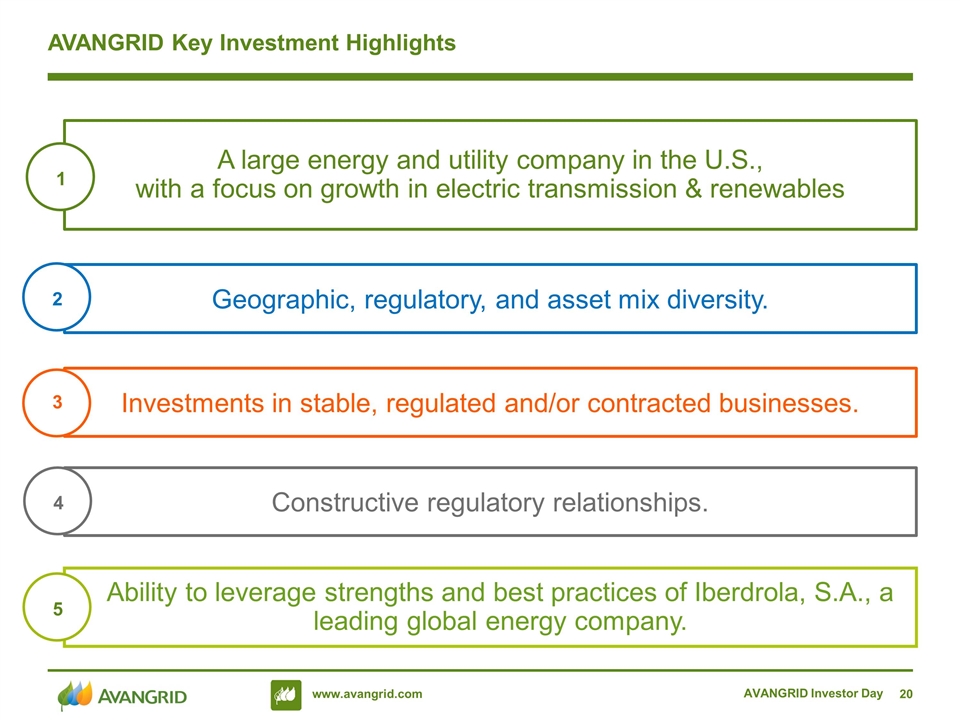
AVANGRID Investor Day AVANGRID Key Investment Highlights Ability to leverage strengths and best practices of Iberdrola, S.A., a leading global energy company. Geographic, regulatory, and asset mix diversity. A large energy and utility company in the U.S., with a focus on growth in electric transmission & renewables Investments in stable, regulated and/or contracted businesses. Constructive regulatory relationships. 1 2 3 4 5
Robert Kump AVANGRID Networks AVANGRID Investor Day 2
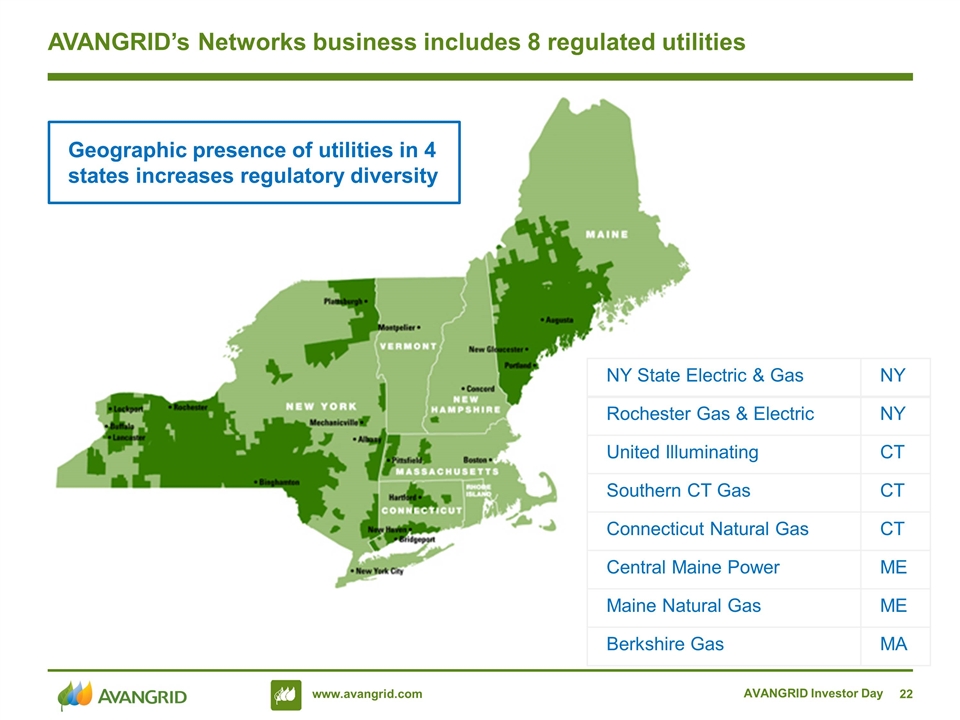
AVANGRID Investor Day AVANGRID’s Networks business includes 8 regulated utilities NY State Electric & Gas NY Rochester Gas & Electric NY United Illuminating CT Southern CT Gas CT Connecticut Natural Gas CT Central Maine Power ME Maine Natural Gas ME Berkshire Gas MA Geographic presence of utilities in 4 states increases regulatory diversity
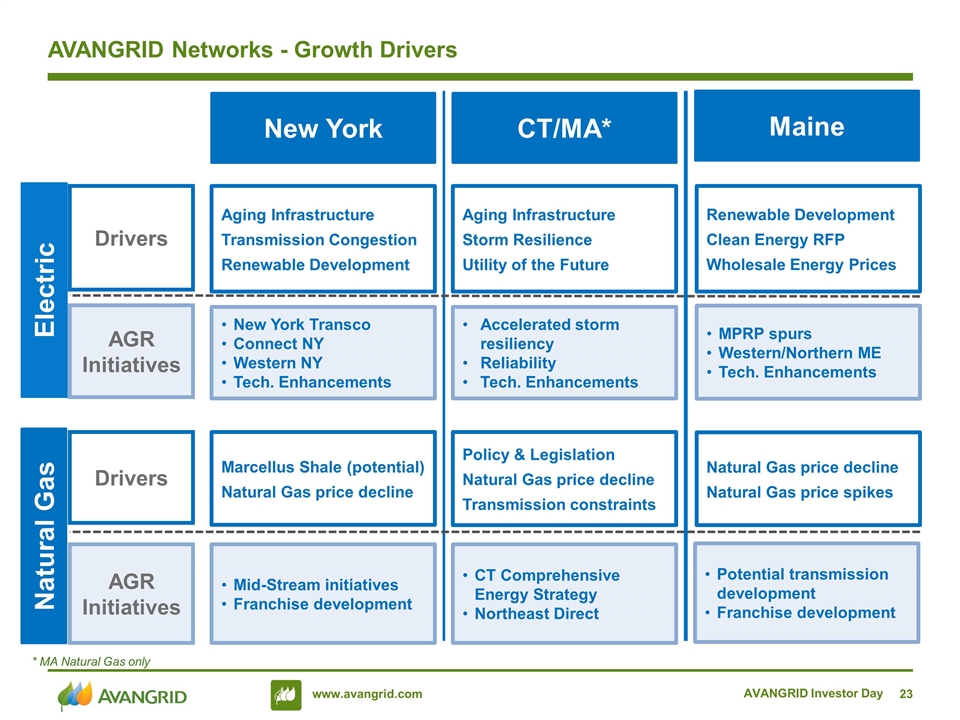
AVANGRID Investor Day AVANGRID Networks - Growth Drivers AGR Initiatives Drivers AGR Initiatives Drivers * MA Natural Gas only New York Maine Electric Natural Gas Aging Infrastructure Transmission Congestion Renewable Development New York Transco Connect NY Western NY Tech. Enhancements Marcellus Shale (potential) Natural Gas price decline Mid-Stream initiatives Franchise development Potential transmission development Franchise development Natural Gas price decline Natural Gas price spikes MPRP spurs Western/Northern ME Tech. Enhancements Renewable Development Clean Energy RFP Wholesale Energy Prices CT/MA* Aging Infrastructure Storm Resilience Utility of the Future Accelerated storm resiliency Reliability Tech. Enhancements Policy & Legislation Natural Gas price decline Transmission constraints CT Comprehensive Energy Strategy Northeast Direct
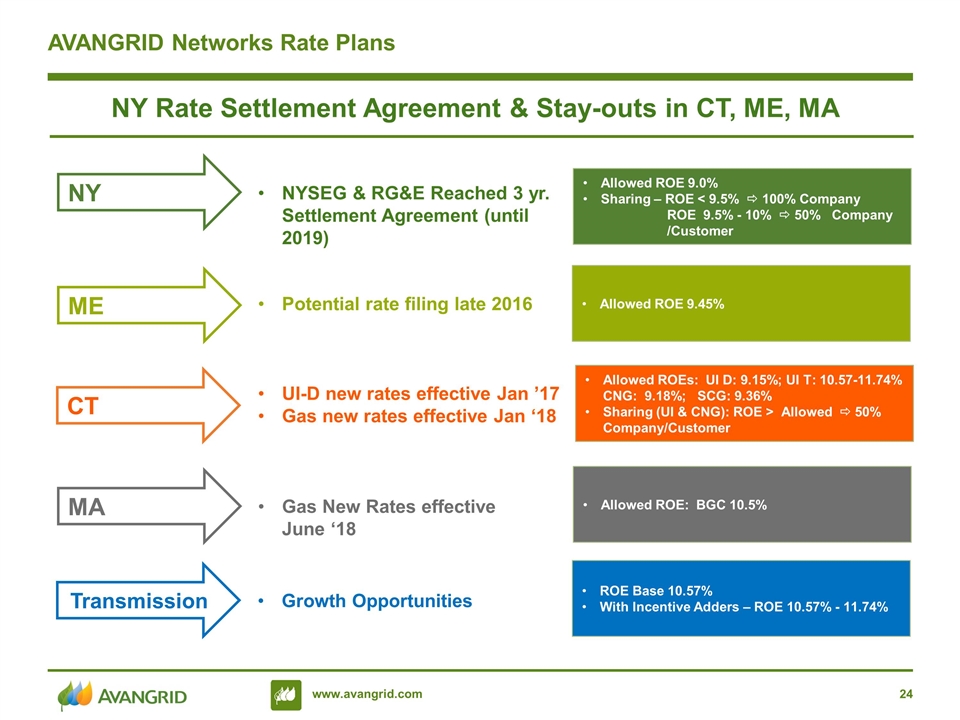
AVANGRID Networks Rate Plans NY Rate Settlement Agreement & Stay-outs in CT, ME, MA NY CT ME Transmission MA NYSEG & RG&E Reached 3 yr. Settlement Agreement (until 2019) Gas New Rates effective June ‘18 Potential rate filing late 2016 UI-D new rates effective Jan ’17 Gas new rates effective Jan ‘18 Growth Opportunities Allowed ROE 9.0% Sharing – ROE < 9.5% ð 100% Company ROE 9.5% - 10% ð 50% Company /Customer Allowed ROE 9.45% Allowed ROEs: UI D: 9.15%; UI T: 10.57-11.74% CNG: 9.18%; SCG: 9.36% Sharing (UI & CNG): ROE > Allowed ð 50% Company/Customer Allowed ROE: BGC 10.5% ROE Base 10.57% With Incentive Adders – ROE 10.57% - 11.74%
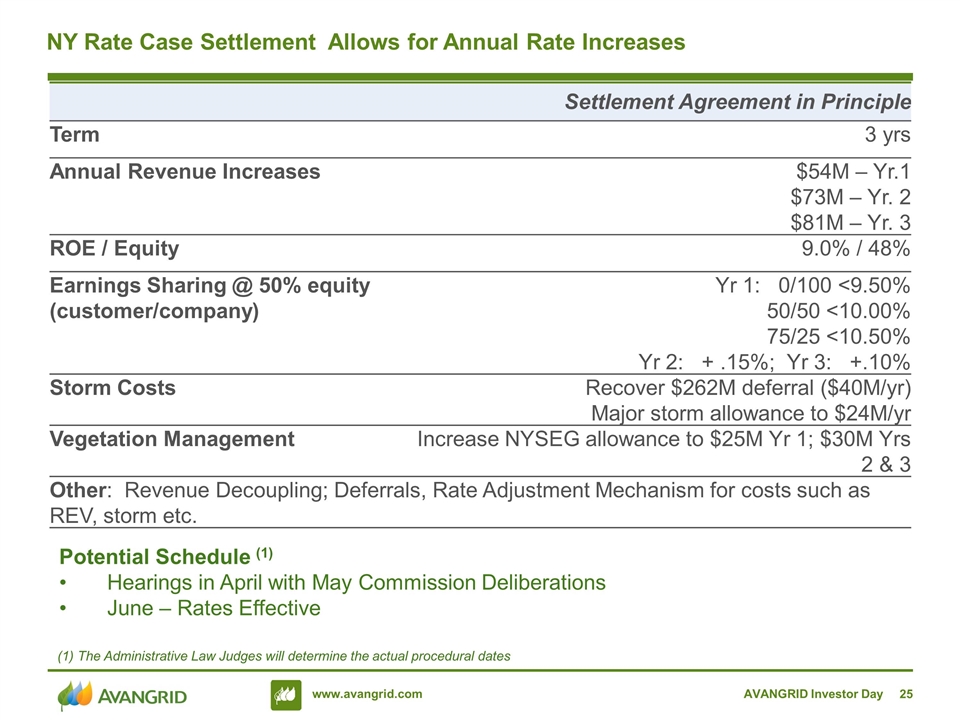
AVANGRID Investor Day NY Rate Case Settlement Allows for Annual Rate Increases Settlement Agreement in Principle Term 3 yrs Annual Revenue Increases $54M – Yr.1 $73M – Yr. 2 $81M – Yr. 3 ROE / Equity 9.0% / 48% Earnings Sharing @ 50% equity (customer/company) Yr 1: 0/100 <9.50% 50/50 <10.00% 75/25 <10.50% Yr 2: + .15%; Yr 3: +.10% Storm Costs Recover $262M deferral ($40M/yr) Major storm allowance to $24M/yr Vegetation Management Increase NYSEG allowance to $25M Yr 1; $30M Yrs 2 & 3 Other: Revenue Decoupling; Deferrals, Rate Adjustment Mechanism for costs such as REV, storm etc. Potential Schedule (1) Hearings in April with May Commission Deliberations June – Rates Effective (1) The Administrative Law Judges will determine the actual procedural dates
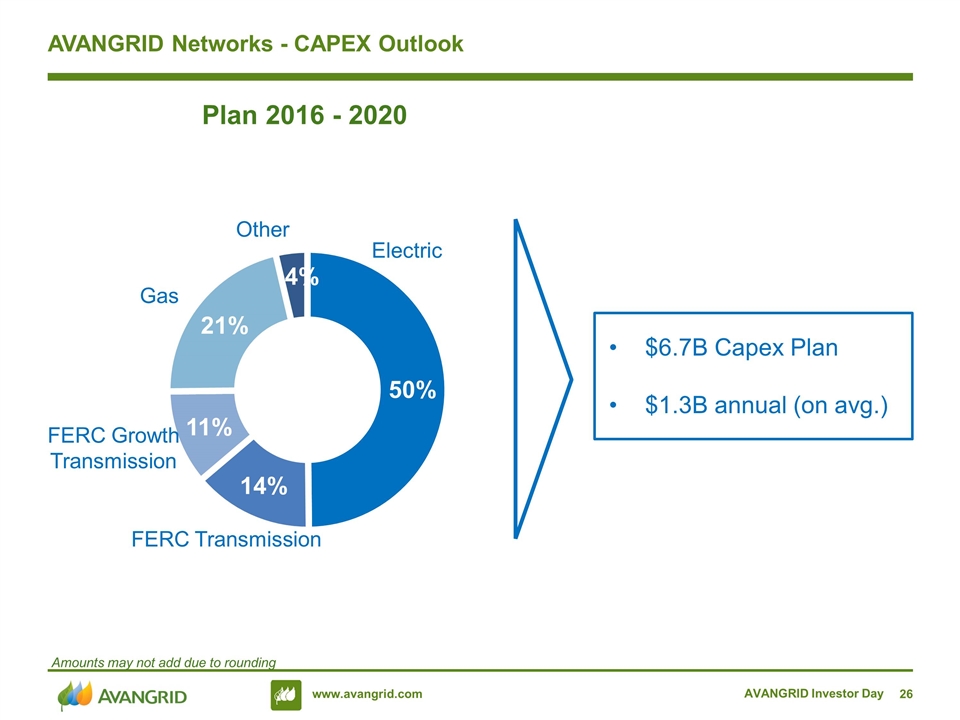
AVANGRID Networks - CAPEX Outlook Plan 2016 - 2020 FERC Transmission Gas FERC Growth Transmission $6.7B Capex Plan $1.3B annual (on avg.) Other AVANGRID Investor Day Amounts may not add due to rounding
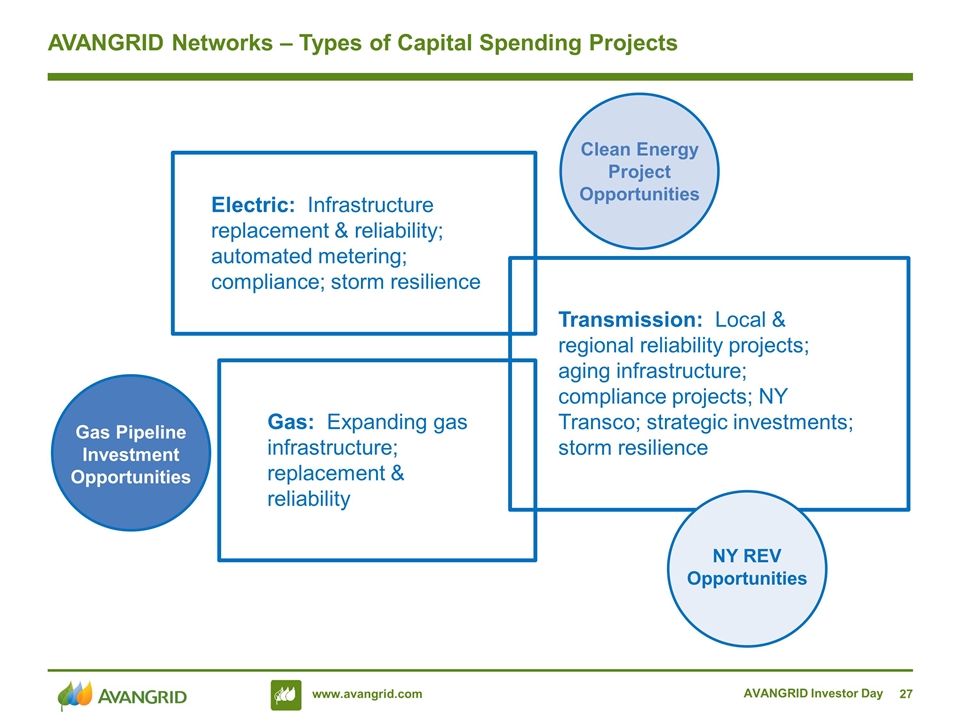
AVANGRID Investor Day AVANGRID Networks – Types of Capital Spending Projects Electric: Infrastructure replacement & reliability; automated metering; compliance; storm resilience Gas: Expanding gas infrastructure; replacement & reliability Transmission: Local & regional reliability projects; aging infrastructure; compliance projects; NY Transco; strategic investments; storm resilience NY REV Opportunities Clean Energy Project Opportunities Gas Pipeline Investment Opportunities
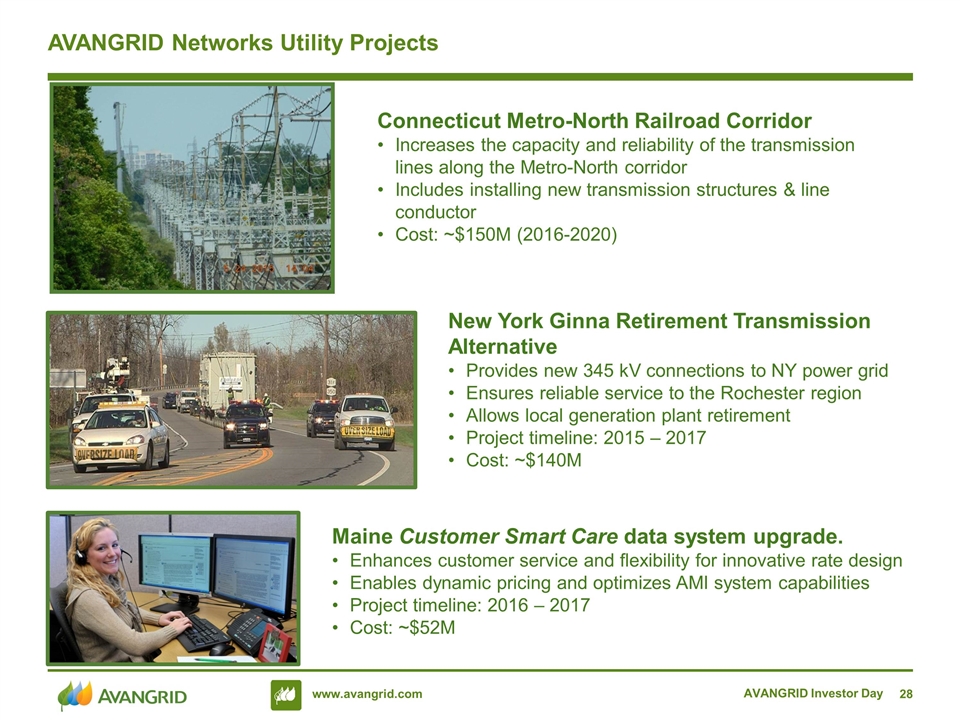
AVANGRID Investor Day AVANGRID Networks Utility Projects Connecticut Metro-North Railroad Corridor Increases the capacity and reliability of the transmission lines along the Metro-North corridor Includes installing new transmission structures & line conductor Cost: ~$150M (2016-2020) Maine Customer Smart Care data system upgrade. Enhances customer service and flexibility for innovative rate design Enables dynamic pricing and optimizes AMI system capabilities Project timeline: 2016 – 2017 Cost: ~$52M New York Ginna Retirement Transmission Alternative Provides new 345 kV connections to NY power grid Ensures reliable service to the Rochester region Allows local generation plant retirement Project timeline: 2015 – 2017 Cost: ~$140M
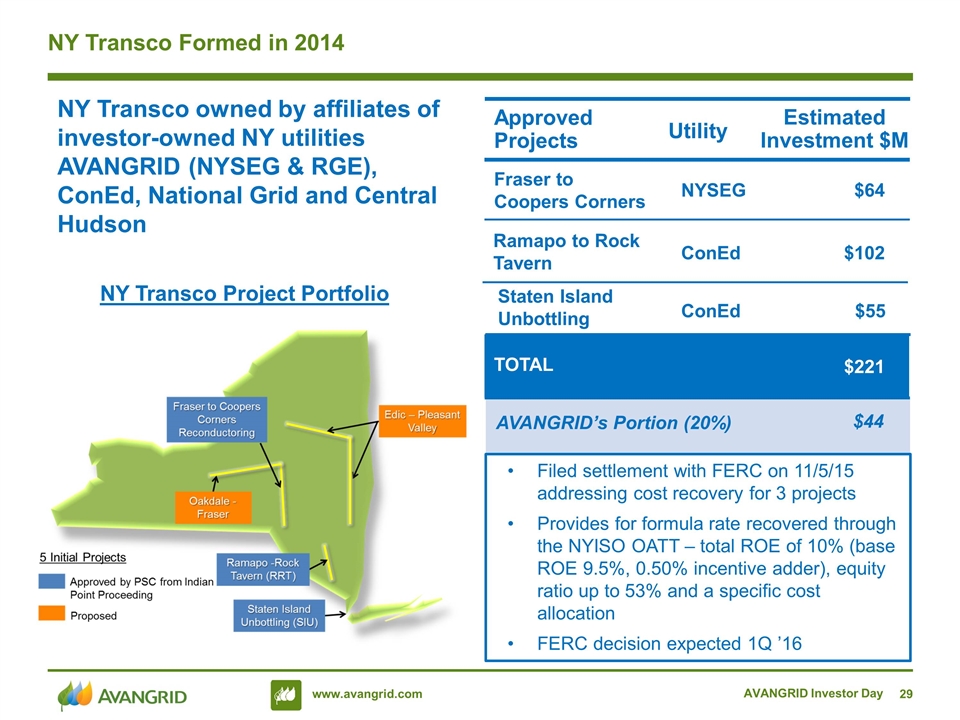
AVANGRID Investor Day NY Transco Formed in 2014 NY Transco Project Portfolio Fraser to Coopers Corners Ramapo to Rock Tavern NYSEG ConEd $64 $102 $221 Estimated Investment $M Utility TOTAL Approved Projects Staten Island Unbottling ConEd $55 AVANGRID’s Portion (20%) $44 NY Transco owned by affiliates of investor-owned NY utilities AVANGRID (NYSEG & RGE), ConEd, National Grid and Central Hudson Filed settlement with FERC on 11/5/15 addressing cost recovery for 3 projects Provides for formula rate recovered through the NYISO OATT – total ROE of 10% (base ROE 9.5%, 0.50% incentive adder), equity ratio up to 53% and a specific cost allocation FERC decision expected 1Q ’16
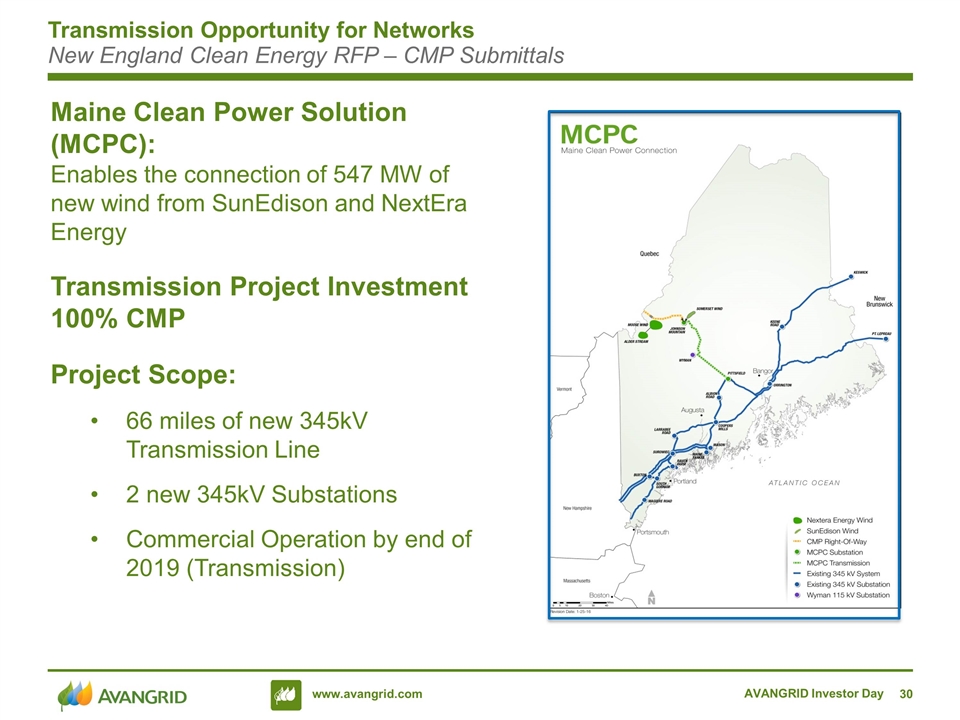
Transmission Opportunity for Networks New England Clean Energy RFP – CMP Submittals Maine Clean Power Solution (MCPC): Enables the connection of 547 MW of new wind from SunEdison and NextEra Energy Transmission Project Investment 100% CMP Project Scope: 66 miles of new 345kV Transmission Line 2 new 345kV Substations Commercial Operation by end of 2019 (Transmission) AVANGRID Investor Day
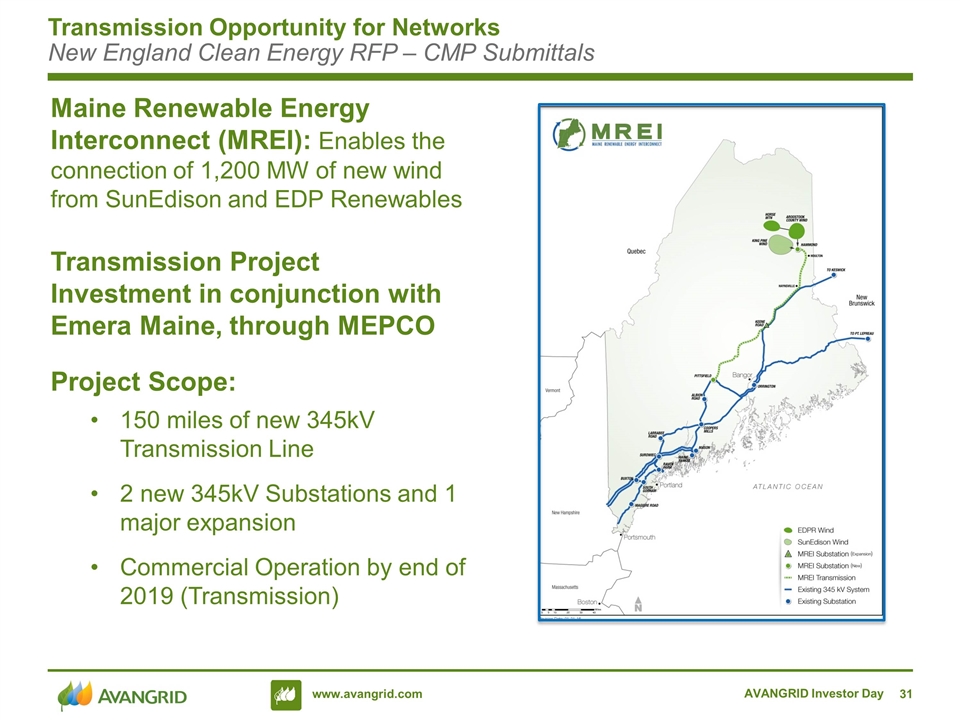
Maine Renewable Energy Interconnect (MREI): Enables the connection of 1,200 MW of new wind from SunEdison and EDP Renewables Transmission Project Investment in conjunction with Emera Maine, through MEPCO Project Scope: 150 miles of new 345kV Transmission Line 2 new 345kV Substations and 1 major expansion Commercial Operation by end of 2019 (Transmission) Transmission Opportunity for Networks New England Clean Energy RFP – CMP Submittals AVANGRID Investor Day
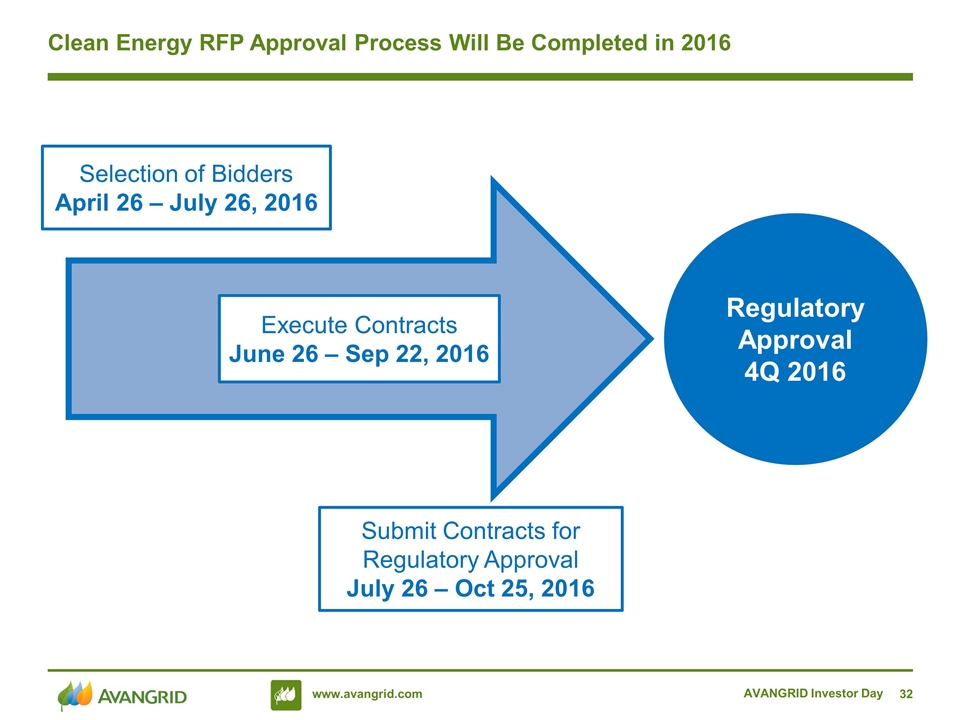
AVANGRID Investor Day Clean Energy RFP Approval Process Will Be Completed in 2016 Regulatory Approval 4Q 2016 Selection of Bidders April 26 – July 26, 2016 Execute Contracts June 26 – Sep 22, 2016 Submit Contracts for Regulatory Approval July 26 – Oct 25, 2016
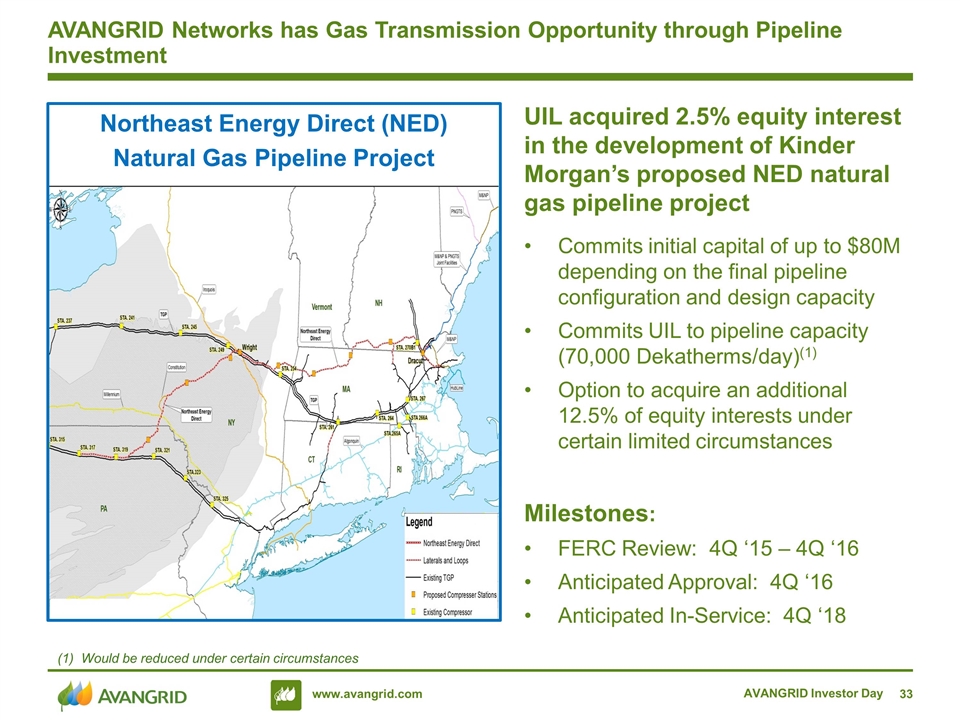
AVANGRID Investor Day AVANGRID Networks has Gas Transmission Opportunity through Pipeline Investment Northeast Energy Direct (NED) Natural Gas Pipeline Project UIL acquired 2.5% equity interest in the development of Kinder Morgan’s proposed NED natural gas pipeline project Commits initial capital of up to $80M depending on the final pipeline configuration and design capacity Commits UIL to pipeline capacity (70,000 Dekatherms/day)(1) Option to acquire an additional 12.5% of equity interests under certain limited circumstances Milestones: FERC Review: 4Q ‘15 – 4Q ‘16 Anticipated Approval: 4Q ‘16 Anticipated In-Service: 4Q ‘18 (1) Would be reduced under certain circumstances
AVANGRID Investor Day NY’s Reforming the Energy Vision (REV) is an Opportunity REV consists of multiple, complex initiatives Certain initiatives are already underway Community Distributed Generation Retail-level demand response program Utility demonstration projects Track 1 February 2015: Utilities will be the Distribution System Platform Provider (DSP) Utilities must file a DSP implementation plan by June ‘16 (includes capital costs for the utility platform (AMI, etc.)) Governor’s Clean Energy Standard (50% Renewables by 2030) – an opportunity for our Renewables business Track 2 in process Ratemaking and regulation; earnings impact mechanisms
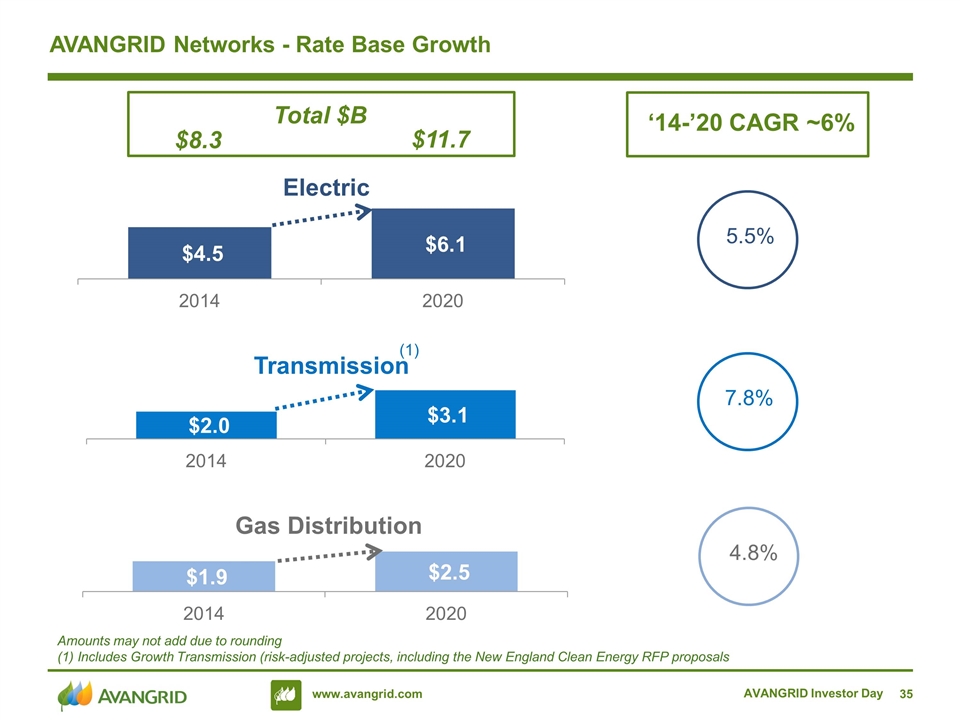
Total $B AVANGRID Investor Day 7.8% 4.8% Amounts may not add due to rounding (1) Includes Growth Transmission (risk-adjusted projects, including the New England Clean Energy RFP proposals $8.3 $11.7 AVANGRID Networks - Rate Base Growth 5.5% ‘14-’20 CAGR ~6%
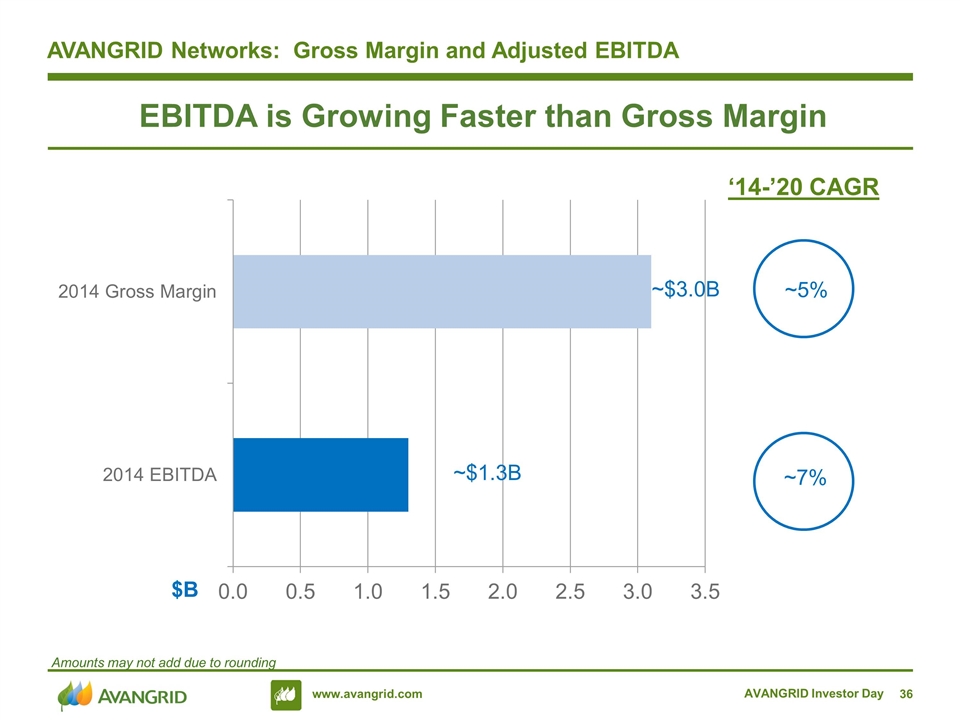
AVANGRID Networks: Gross Margin and Adjusted EBITDA AVANGRID Investor Day ~7% ~5% ‘14-’20 CAGR EBITDA is Growing Faster than Gross Margin Amounts may not add due to rounding $B
Frank Burkhartsmeyer AVANGRID Renewables AVANGRID Investor Day 3
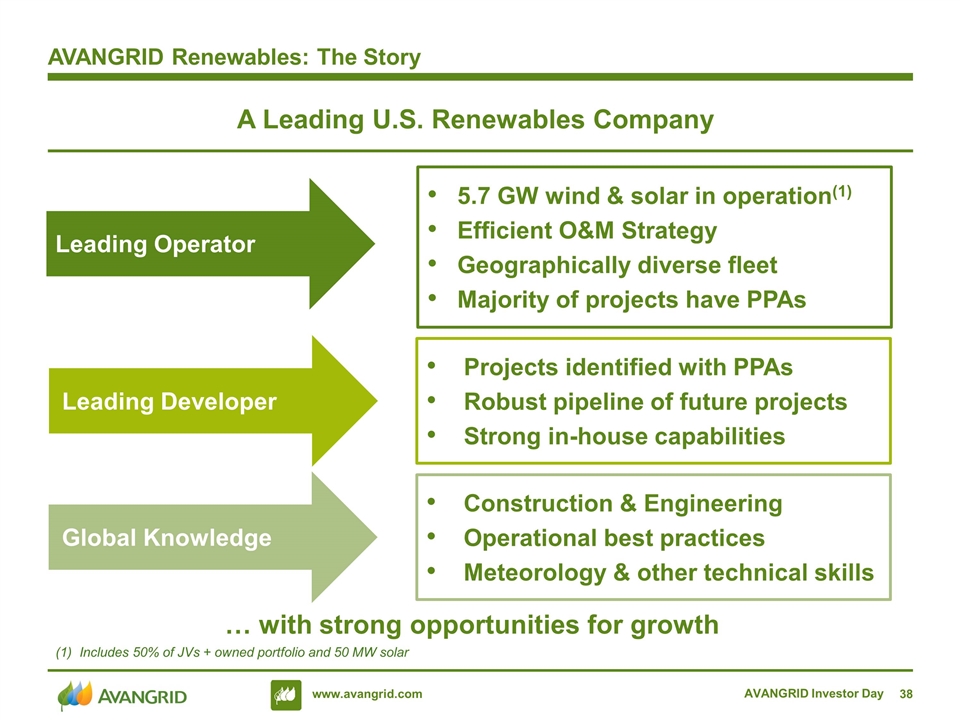
A Leading U.S. Renewables Company AVANGRID Renewables: The Story … with strong opportunities for growth Leading Operator Leading Developer 5.7 GW wind & solar in operation(1) Efficient O&M Strategy Geographically diverse fleet Majority of projects have PPAs Projects identified with PPAs Robust pipeline of future projects Strong in-house capabilities Global Knowledge Construction & Engineering Operational best practices Meteorology & other technical skills AVANGRID Investor Day Includes 50% of JVs + owned portfolio and 50 MW solar
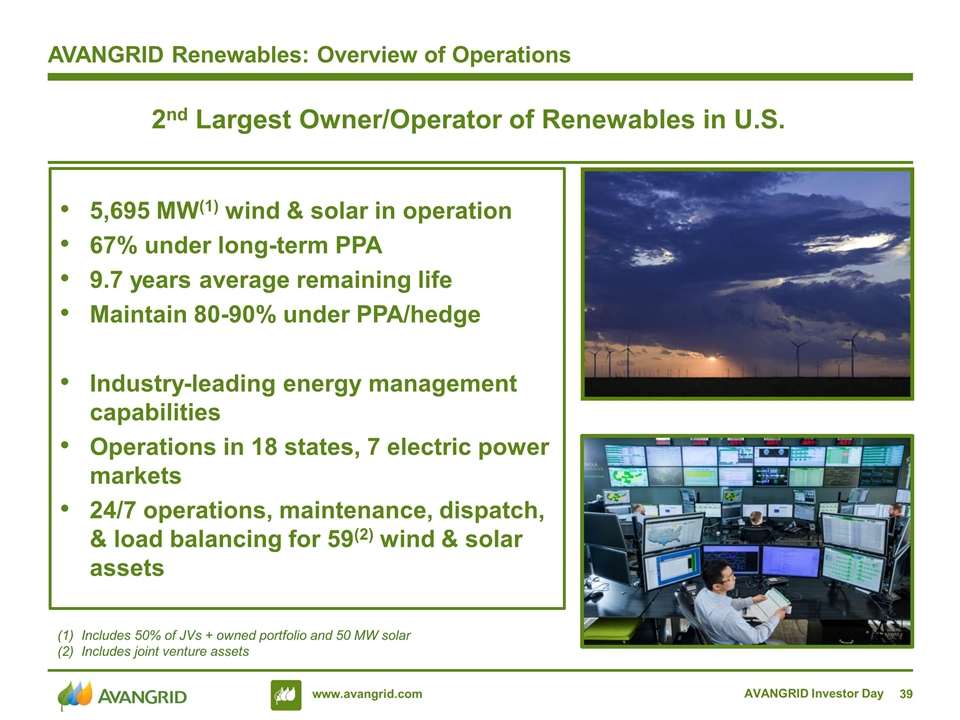
2nd Largest Owner/Operator of Renewables in U.S. AVANGRID Renewables: Overview of Operations 5,695 MW(1) wind & solar in operation 67% under long-term PPA 9.7 years average remaining life Maintain 80-90% under PPA/hedge Industry-leading energy management capabilities Operations in 18 states, 7 electric power markets 24/7 operations, maintenance, dispatch, & load balancing for 59(2) wind & solar assets AVANGRID Investor Day Includes 50% of JVs + owned portfolio and 50 MW solar Includes joint venture assets
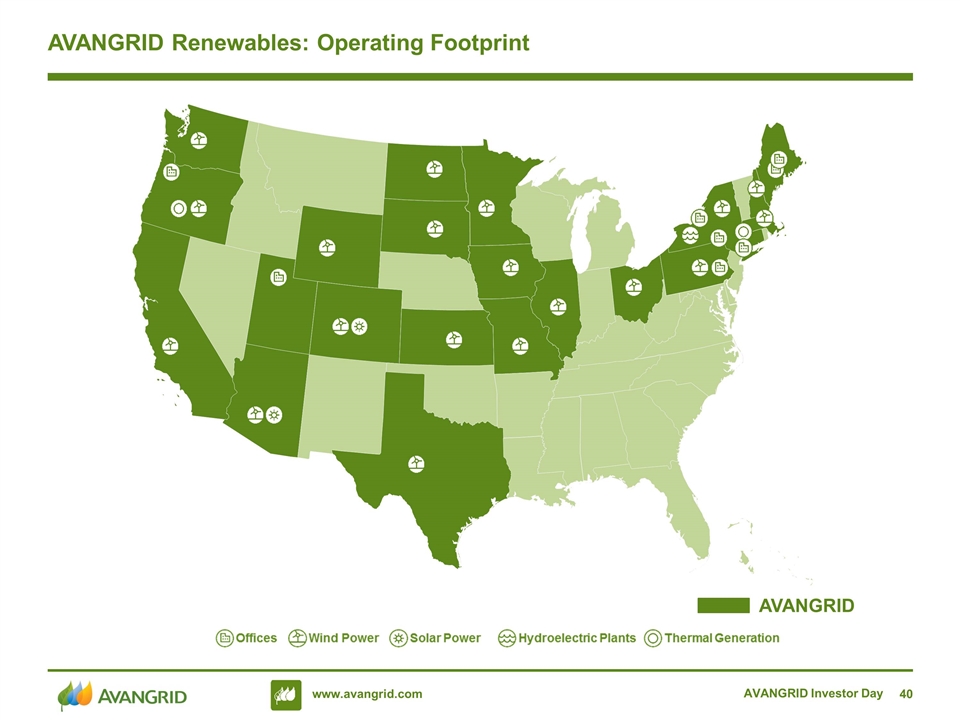
AVANGRID Investor Day AVANGRID Renewables: Operating Footprint AVANGRID
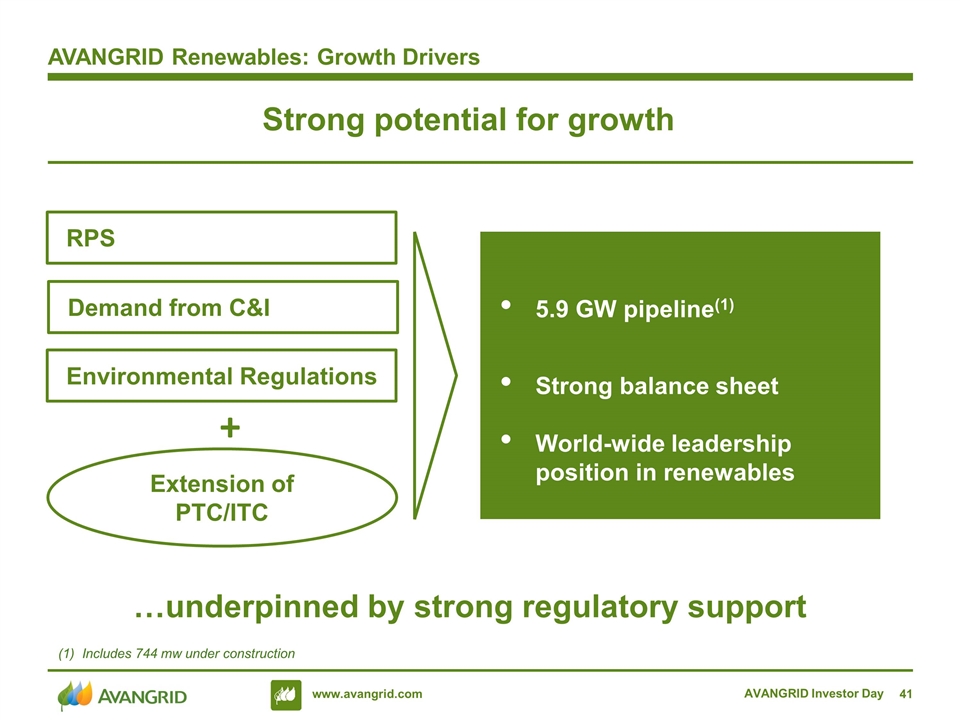
Strong potential for growth …underpinned by strong regulatory support Environmental Regulations 5.9 GW pipeline(1) Strong balance sheet World-wide leadership position in renewables RPS Demand from C&I + Extension of PTC/ITC AVANGRID Renewables: Growth Drivers AVANGRID Investor Day Includes 744 mw under construction
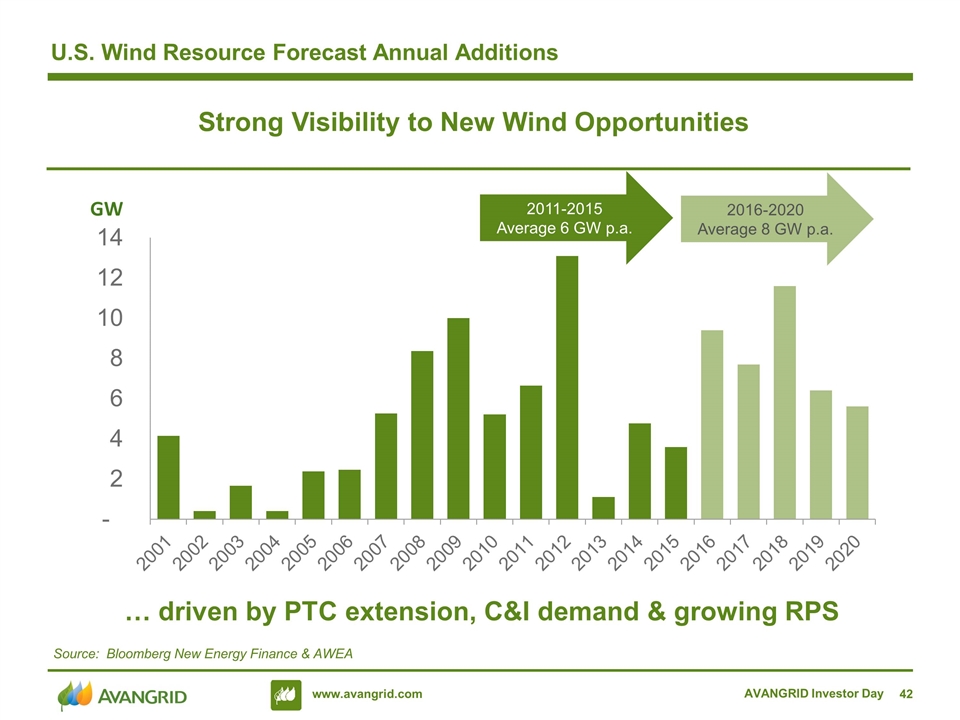
U.S. Wind Resource Forecast Annual Additions 2016-2020 Average 8 GW p.a. GW 2011-2015 Average 6 GW p.a. … driven by PTC extension, C&I demand & growing RPS Strong Visibility to New Wind Opportunities Source: Bloomberg New Energy Finance & AWEA AVANGRID Investor Day
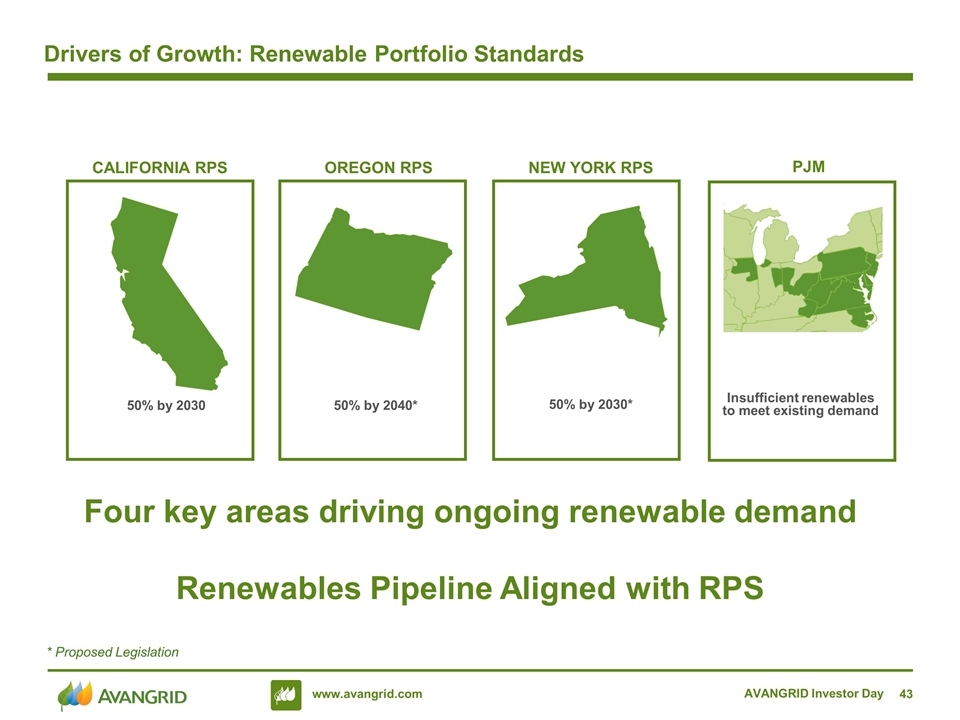
Drivers of Growth: Renewable Portfolio Standards Four key areas driving ongoing renewable demand Renewables Pipeline Aligned with RPS CALIFORNIA RPS OREGON RPS NEW YORK RPS 50% by 2030 50% by 2040* 50% by 2030* PJM Insufficient renewables to meet existing demand * Proposed Legislation AVANGRID Investor Day
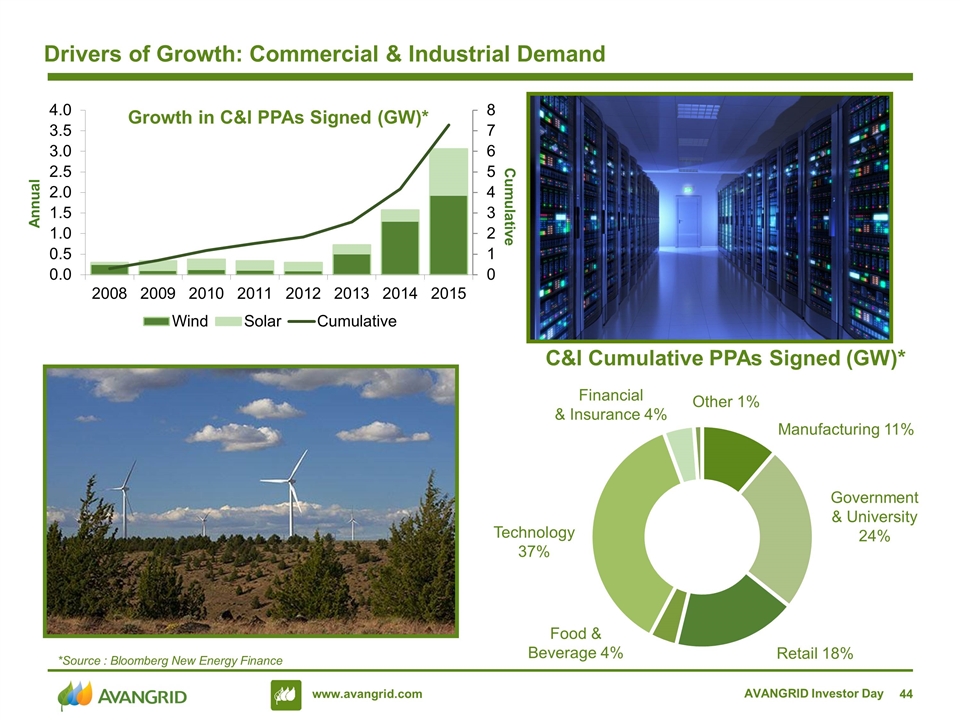
Drivers of Growth: Commercial & Industrial Demand *Source : Bloomberg New Energy Finance Other 1% Government & University 24% Manufacturing 11% Retail 18% Technology 37% Financial & Insurance 4% C&I Cumulative PPAs Signed (GW)* AVANGRID Investor Day Food & Beverage 4% Cumulative Annual
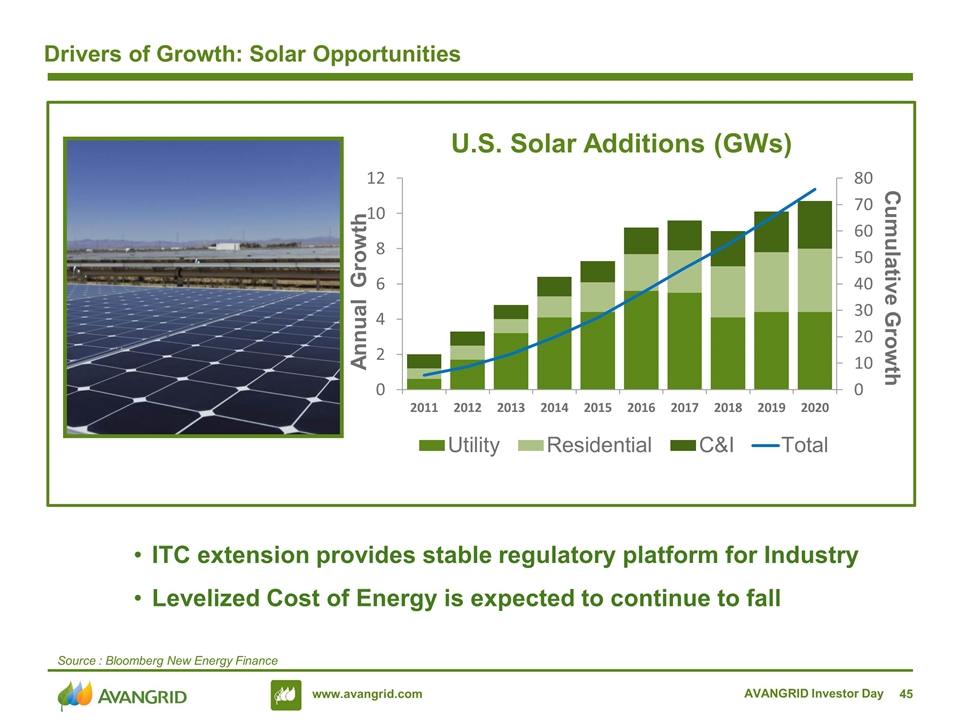
Drivers of Growth: Solar Opportunities Source : Bloomberg New Energy Finance ITC extension provides stable regulatory platform for Industry Levelized Cost of Energy is expected to continue to fall AVANGRID Investor Day Annual Growth Cumulative Growth
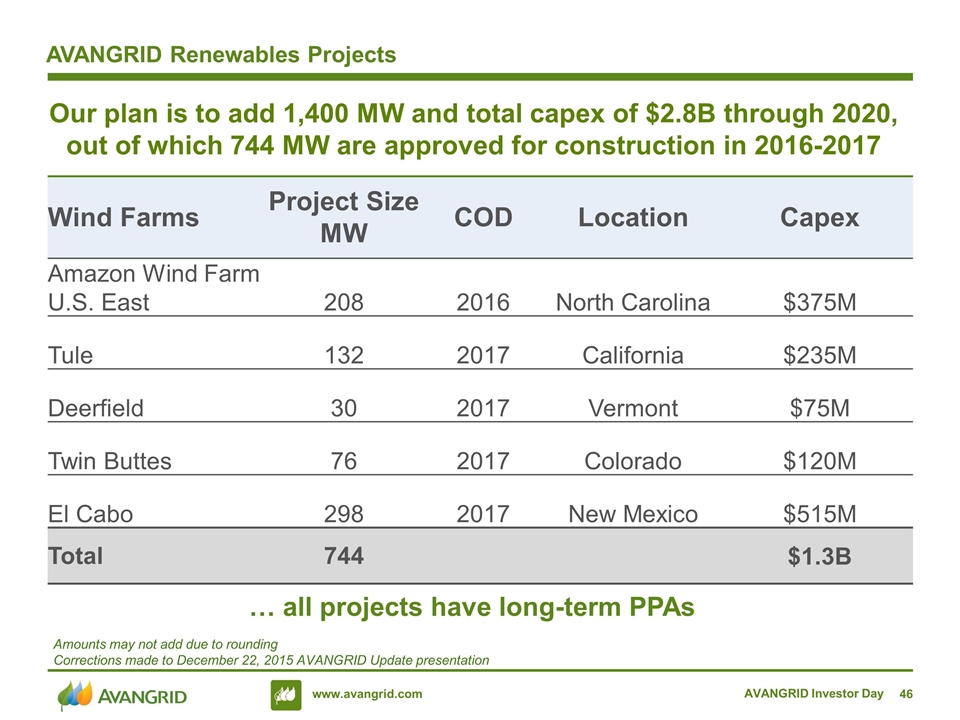
AVANGRID Renewables Projects Our plan is to add 1,400 MW and total capex of $2.8B through 2020, out of which 744 MW are approved for construction in 2016-2017 … all projects have long-term PPAs AVANGRID Investor Day Wind Farms Project Size MW COD Location Capex Amazon Wind Farm U.S. East 208 2016 North Carolina $375M Tule 132 2017 California $235M Deerfield 30 2017 Vermont $75M Twin Buttes 76 2017 Colorado $120M El Cabo 298 2017 New Mexico $515M Total 744 $1.3B Amounts may not add due to rounding Corrections made to December 22, 2015 AVANGRID Update presentation
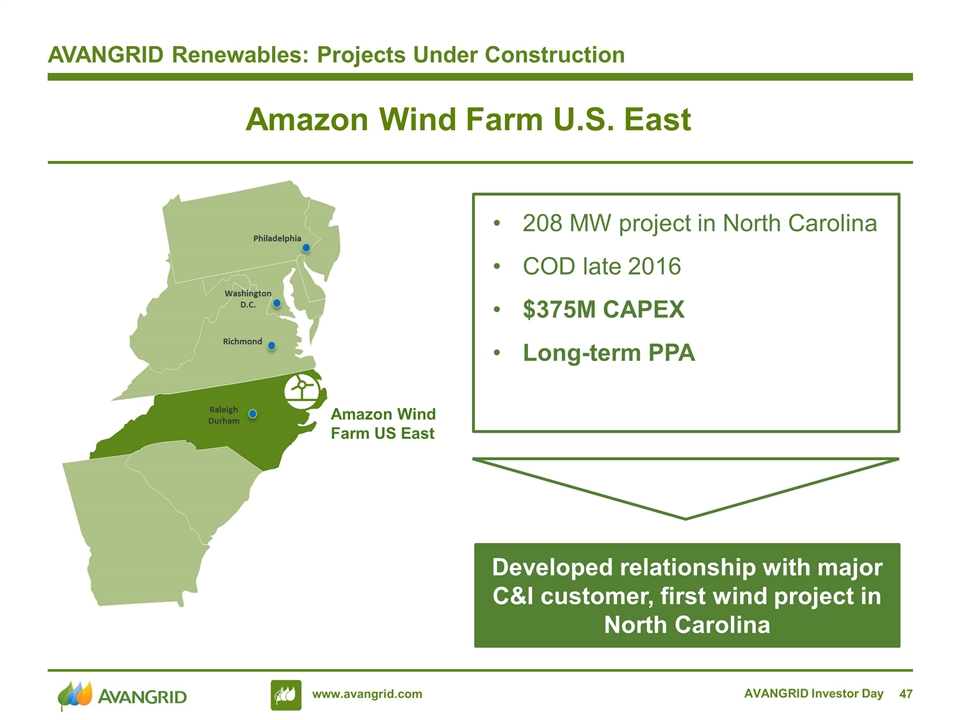
208 MW project in North Carolina COD late 2016 $375M CAPEX Long-term PPA Developed relationship with major C&I customer, first wind project in North Carolina Amazon Wind Farm U.S. East AVANGRID Renewables: Projects Under Construction Philadelphia Washington D.C. Richmond Raleigh Durham Amazon Wind Farm US East AVANGRID Investor Day
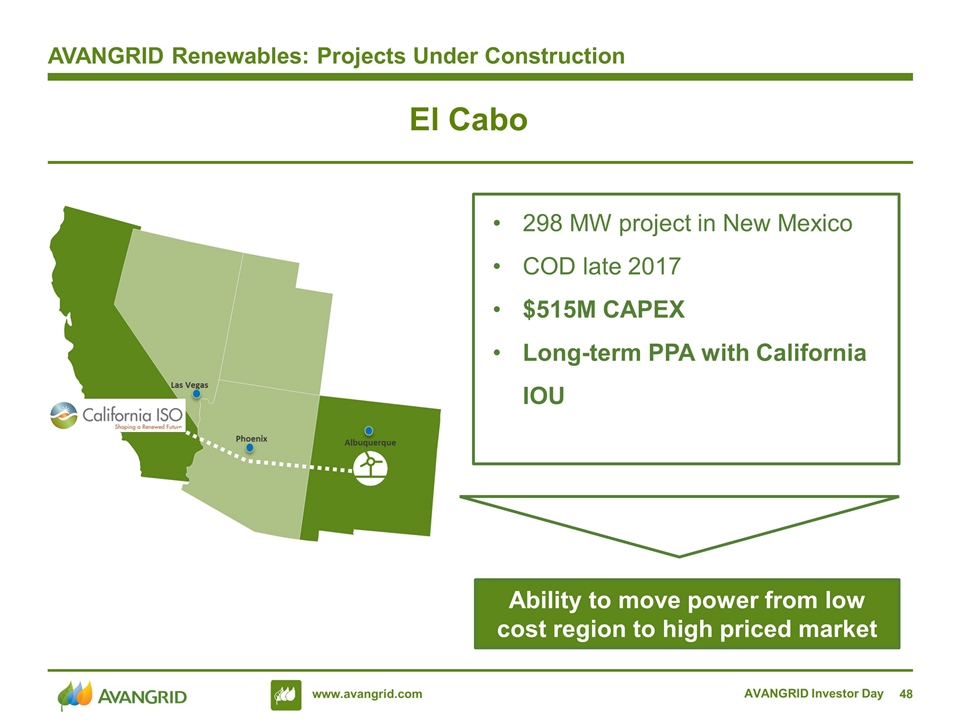
298 MW project in New Mexico COD late 2017 $515M CAPEX Long-term PPA with California IOU Ability to move power from low cost region to high priced market El Cabo AVANGRID Renewables: Projects Under Construction Albuquerque Phoenix Las Vegas AVANGRID Investor Day
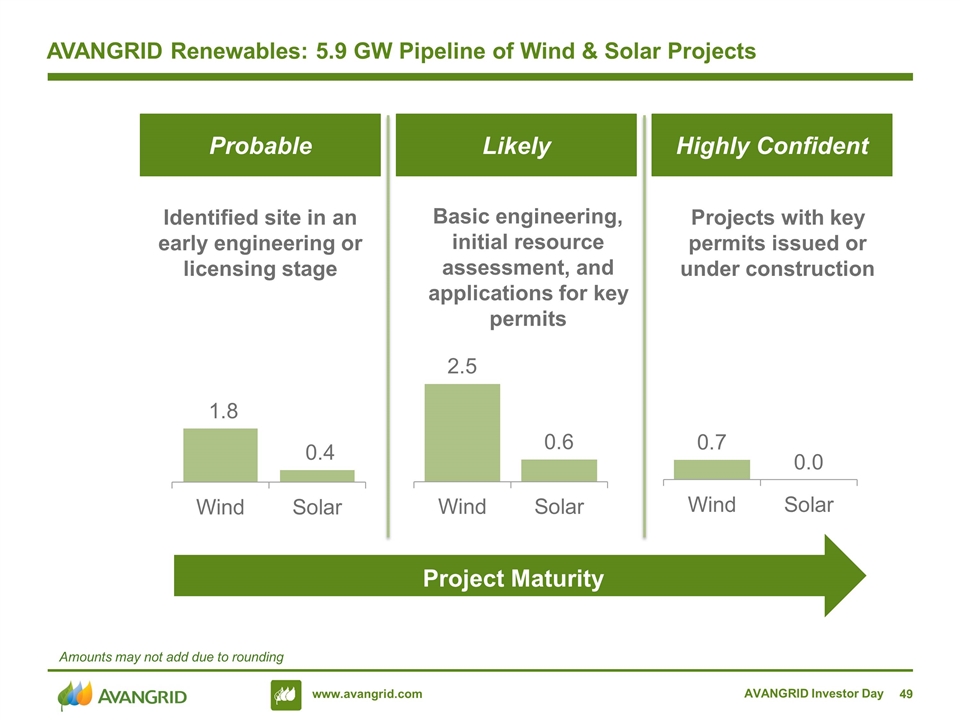
Identified site in an early engineering or licensing stage Basic engineering, initial resource assessment, and applications for key permits Projects with key permits issued or under construction AVANGRID Renewables: 5.9 GW Pipeline of Wind & Solar Projects Project Maturity Probable Highly Confident Likely AVANGRID Investor Day Amounts may not add due to rounding
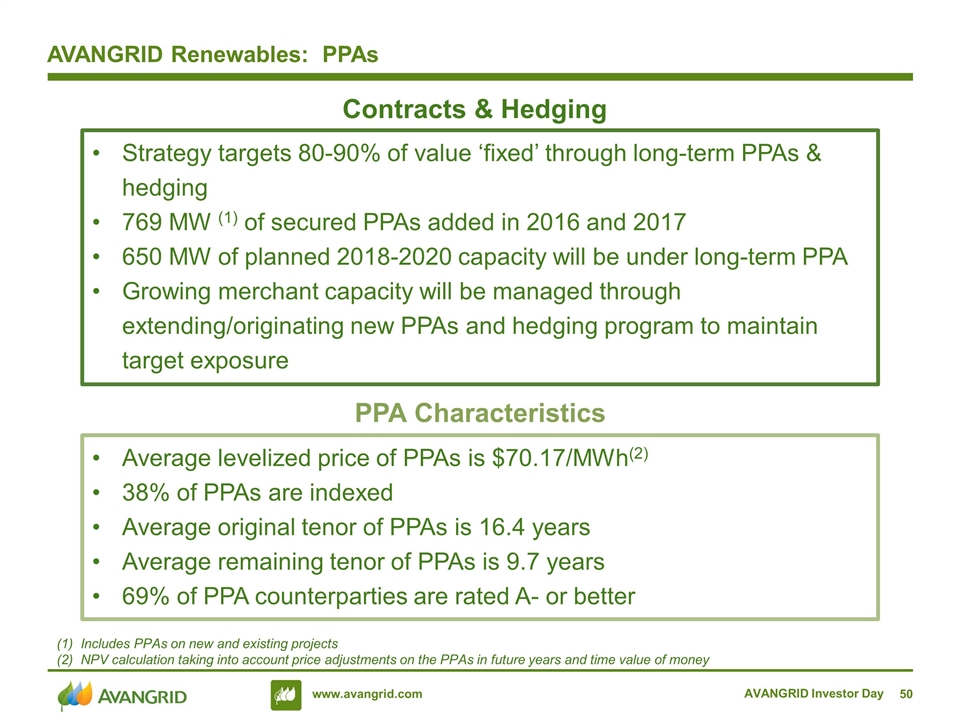
AVANGRID Renewables: PPAs AVANGRID Investor Day Strategy targets 80-90% of value ‘fixed’ through long-term PPAs & hedging 769 MW (1) of secured PPAs added in 2016 and 2017 650 MW of planned 2018-2020 capacity will be under long-term PPA Growing merchant capacity will be managed through extending/originating new PPAs and hedging program to maintain target exposure Average levelized price of PPAs is $70.17/MWh(2) 38% of PPAs are indexed Average original tenor of PPAs is 16.4 years Average remaining tenor of PPAs is 9.7 years 69% of PPA counterparties are rated A- or better Contracts & Hedging PPA Characteristics Includes PPAs on new and existing projects NPV calculation taking into account price adjustments on the PPAs in future years and time value of money
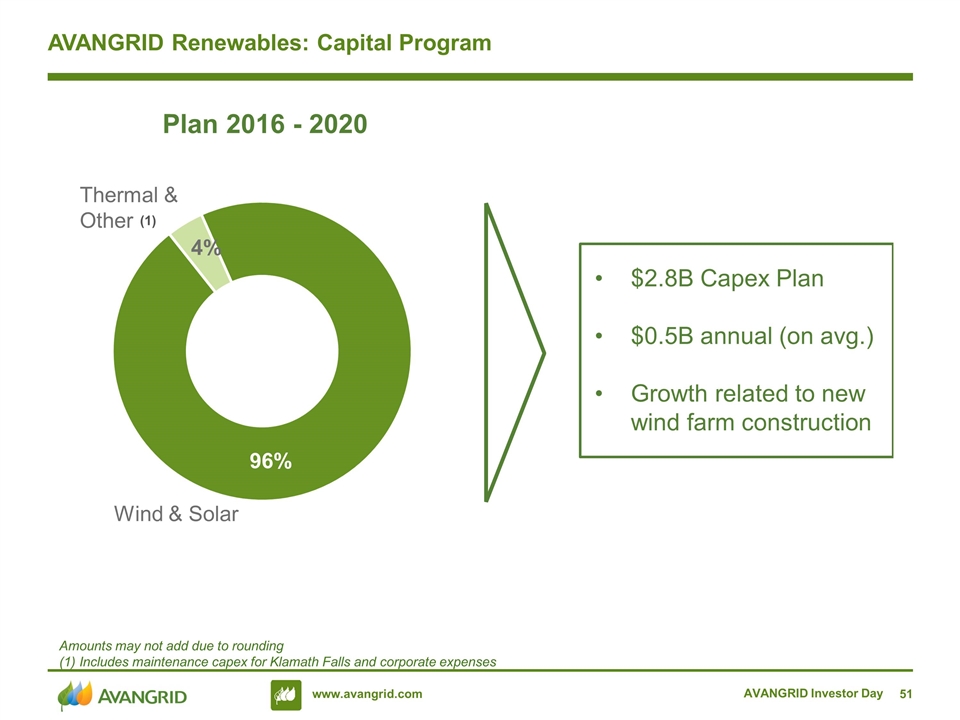
AVANGRID Investor Day AVANGRID Renewables: Capital Program Amounts may not add due to rounding (1) Includes maintenance capex for Klamath Falls and corporate expenses Plan 2016 - 2020 (1) Wind & Solar
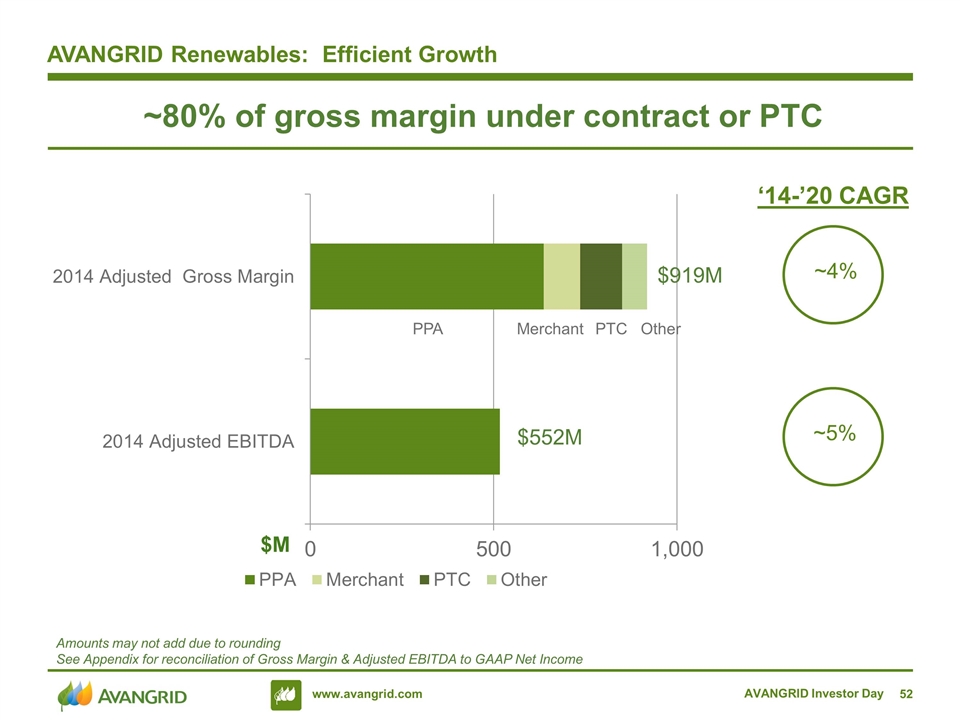
AVANGRID Renewables: Efficient Growth AVANGRID Investor Day Amounts may not add due to rounding See Appendix for reconciliation of Gross Margin & Adjusted EBITDA to GAAP Net Income ~5% ~4% ‘14-’20 CAGR ~80% of gross margin under contract or PTC $M
Richard Nicholas Financial Management AVANGRID Investor Day 4
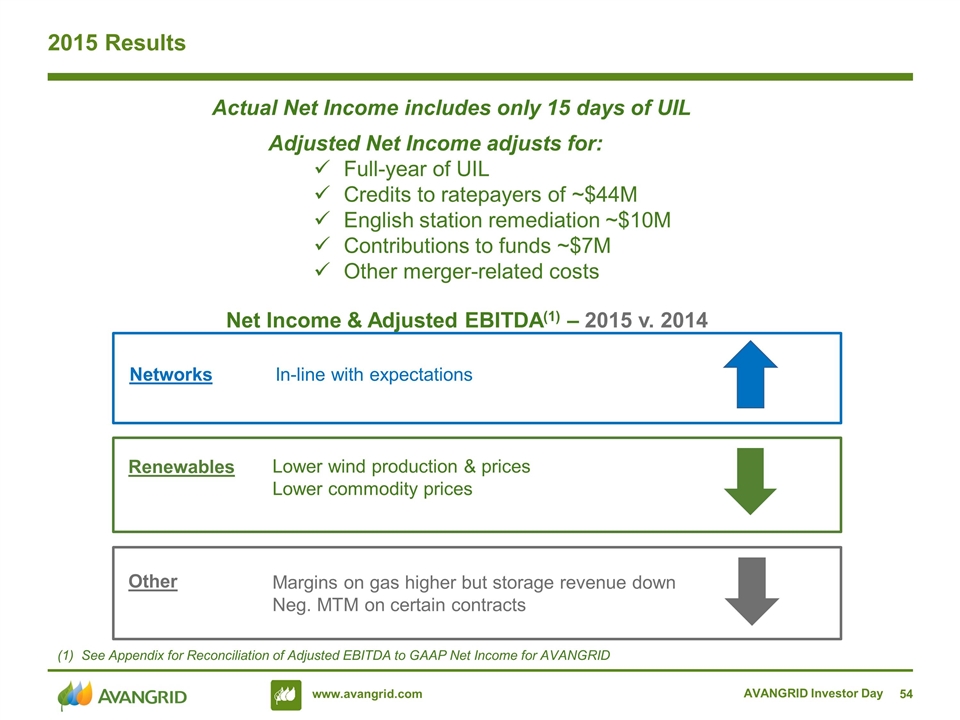
AVANGRID Investor Day 2015 Results Actual Net Income includes only 15 days of UIL Networks Renewables Other In-line with expectations Lower wind production & prices Lower commodity prices Margins on gas higher but storage revenue down Neg. MTM on certain contracts Net Income & Adjusted EBITDA(1) – 2015 v. 2014 Adjusted Net Income adjusts for: Full-year of UIL Credits to ratepayers of ~$44M English station remediation ~$10M Contributions to funds ~$7M Other merger-related costs See Appendix for Reconciliation of Adjusted EBITDA to GAAP Net Income for AVANGRID

AVANGRID Investor Day 2015 Earnings Results 2015 Results include the impacts of regulatory commitments related to the merger & merger completion costs. Net Income ($M) (1) Amounts may not add due to rounding Actual includes only 15 days of UIL Adjusted to reflect combination of AVANGRID with UIL (2)
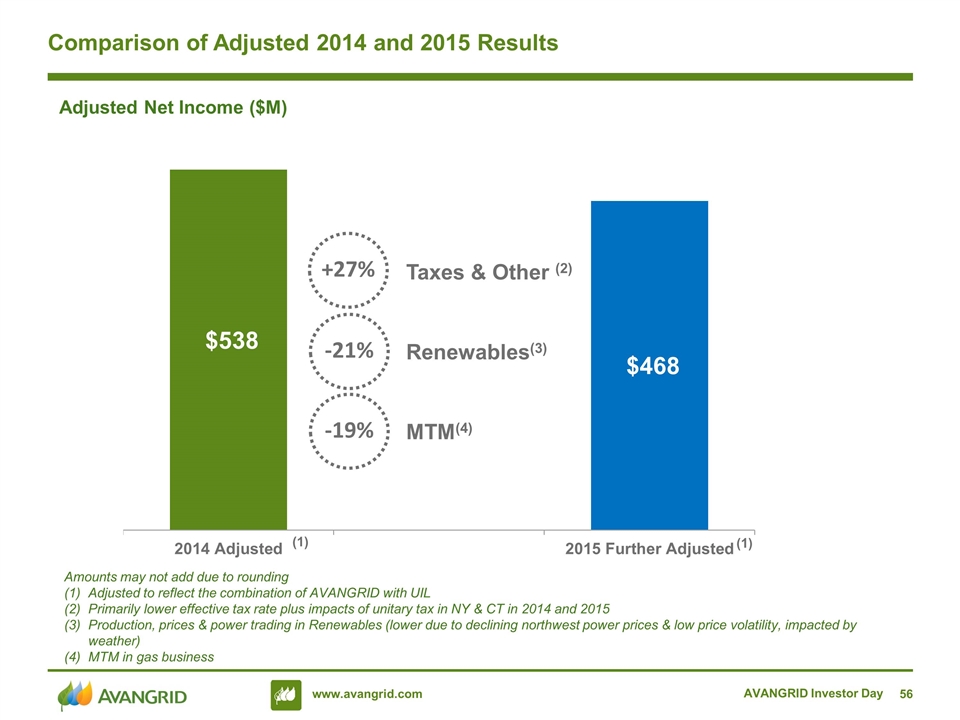
AVANGRID Investor Day Comparison of Adjusted 2014 and 2015 Results Amounts may not add due to rounding Adjusted to reflect the combination of AVANGRID with UIL Primarily lower effective tax rate plus impacts of unitary tax in NY & CT in 2014 and 2015 Production, prices & power trading in Renewables (lower due to declining northwest power prices & low price volatility, impacted by weather) MTM in gas business Adjusted Net Income ($M) MTM(4) Taxes & Other (2) Renewables(3) -19% -21% +27%
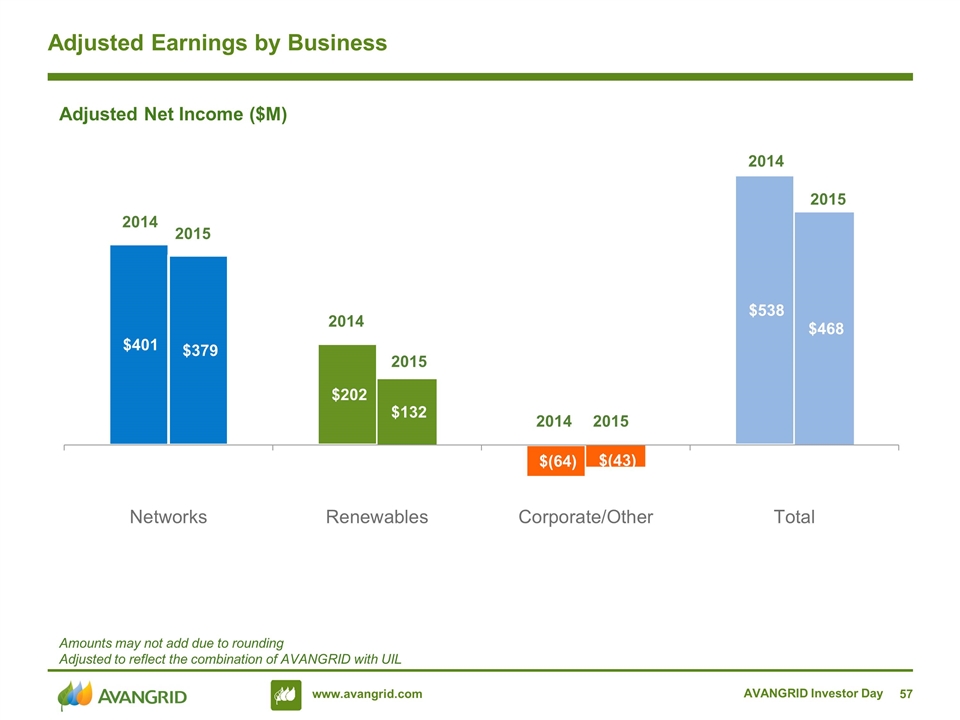
AVANGRID Investor Day Adjusted Earnings by Business Amounts may not add due to rounding Adjusted to reflect the combination of AVANGRID with UIL Adjusted Net Income ($M)
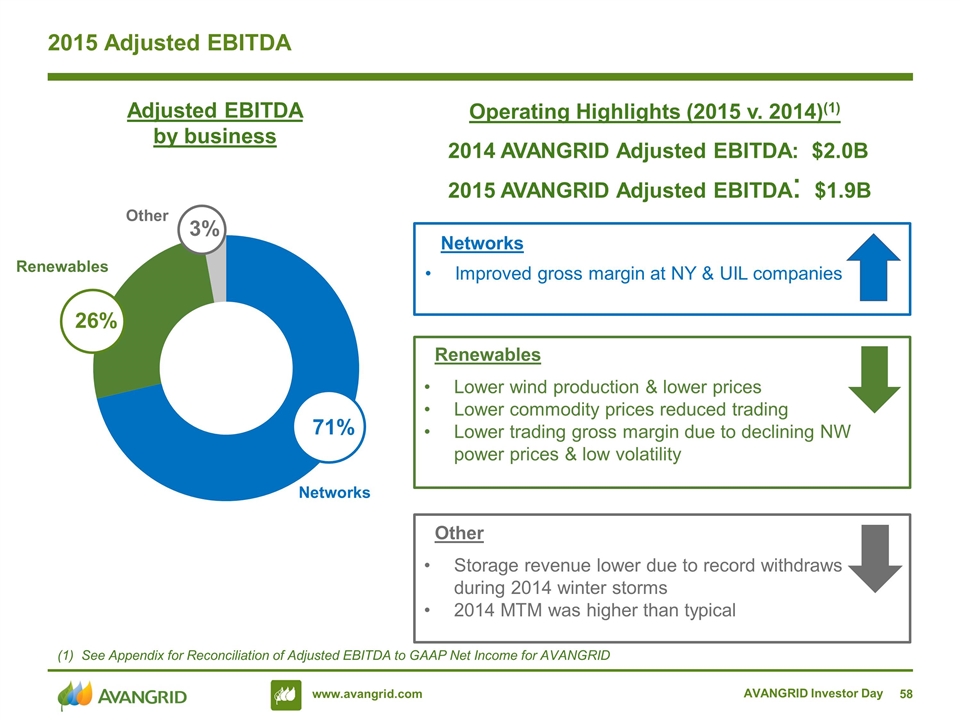
Improved gross margin at NY & UIL companies AVANGRID Investor Day 2015 Adjusted EBITDA Adjusted EBITDA by business Operating Highlights (2015 v. 2014)(1) 26% 71% 3% Networks Renewables Lower wind production & lower prices Lower commodity prices reduced trading Lower trading gross margin due to declining NW power prices & low volatility Other Storage revenue lower due to record withdraws during 2014 winter storms 2014 MTM was higher than typical 2014 AVANGRID Adjusted EBITDA: $2.0B 2015 AVANGRID Adjusted EBITDA: $1.9B See Appendix for Reconciliation of Adjusted EBITDA to GAAP Net Income for AVANGRID
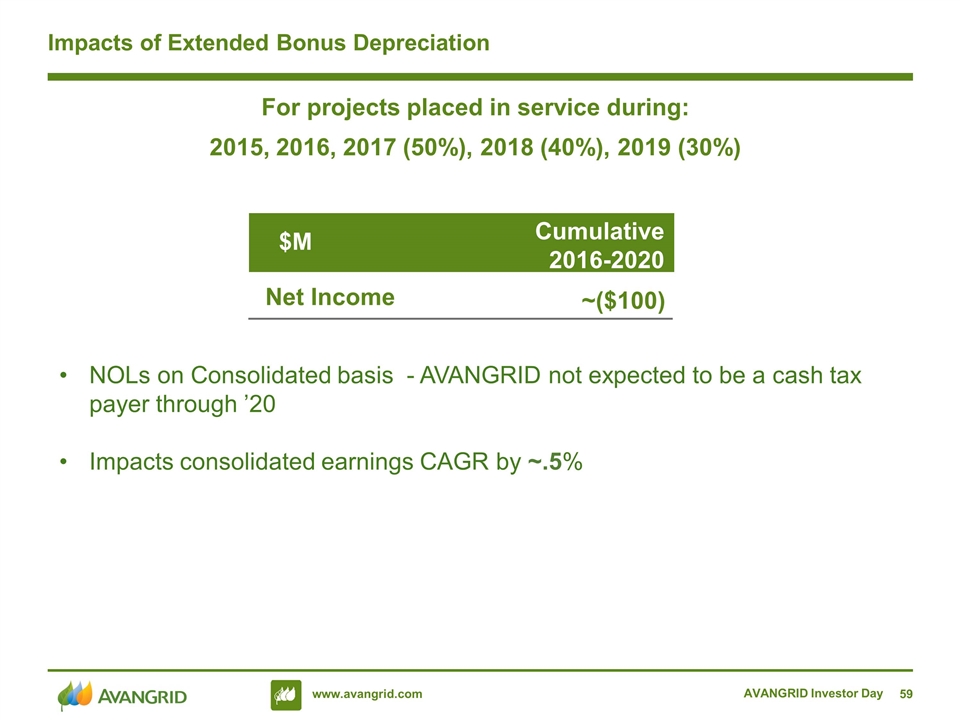
AVANGRID Investor Day Impacts of Extended Bonus Depreciation NOLs on Consolidated basis - AVANGRID not expected to be a cash tax payer through ’20 Impacts consolidated earnings CAGR by ~.5% $M ~($100) Net Income Cumulative 2016-2020 For projects placed in service during: 2015, 2016, 2017 (50%), 2018 (40%), 2019 (30%)
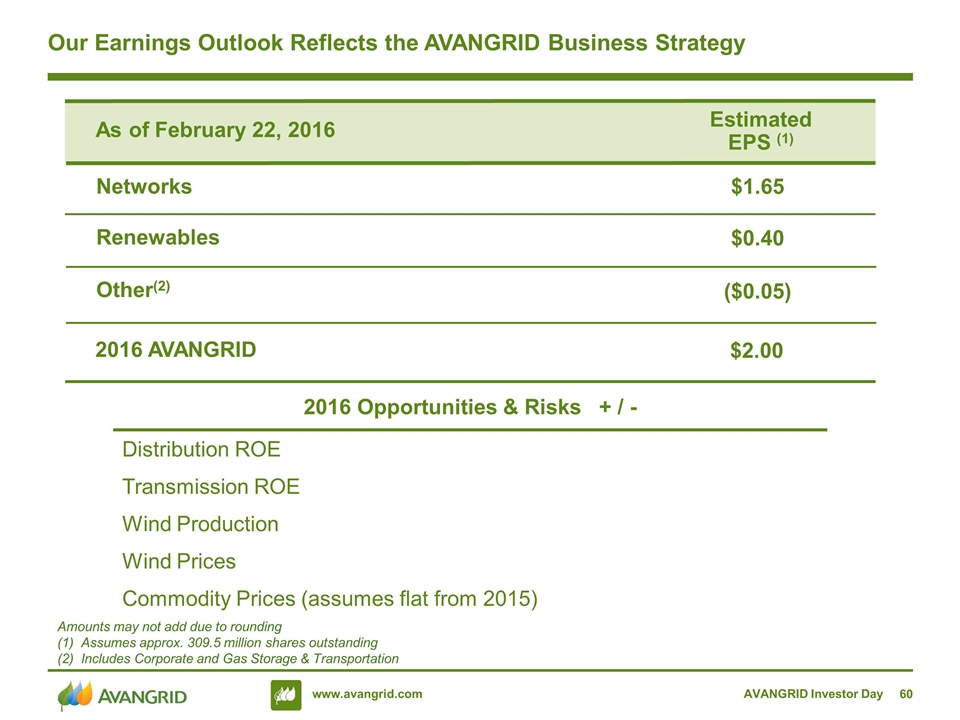
AVANGRID Investor Day Our Earnings Outlook Reflects the AVANGRID Business Strategy $0.40 Renewables Estimated EPS (1) $1.65 As of February 22, 2016 Networks ($0.05) Other(2) $2.00 2016 AVANGRID Amounts may not add due to rounding (1) Assumes approx. 309.5 million shares outstanding (2) Includes Corporate and Gas Storage & Transportation 2016 Opportunities & Risks + / - Distribution ROE Transmission ROE Wind Production Wind Prices Commodity Prices (assumes flat from 2015)
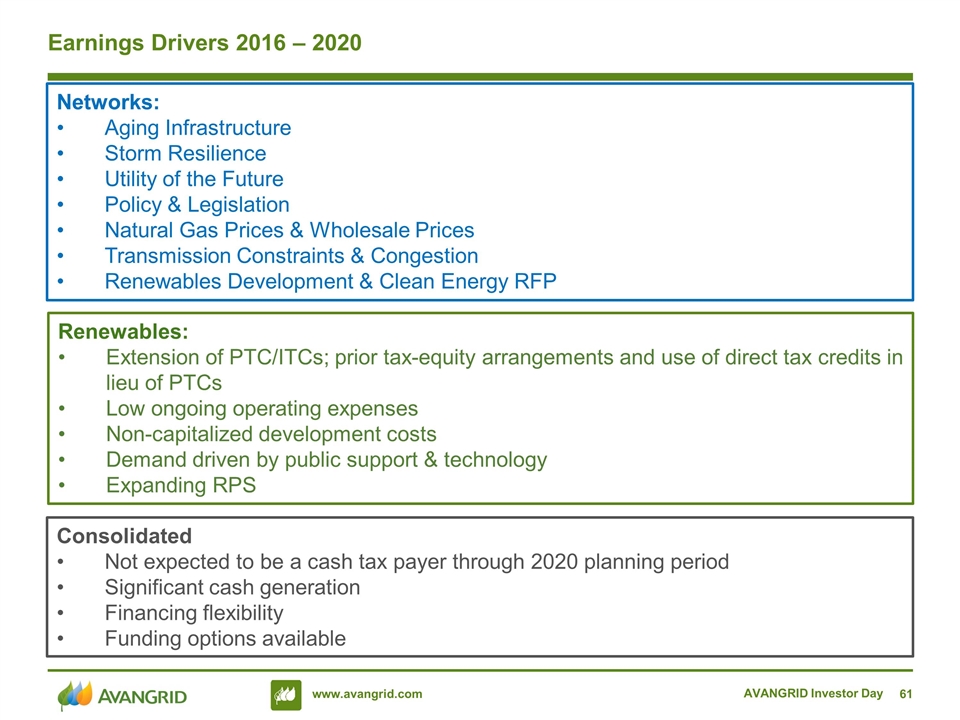
AVANGRID Investor Day Earnings Drivers 2016 – 2020 Renewables: Extension of PTC/ITCs; prior tax-equity arrangements and use of direct tax credits in lieu of PTCs Low ongoing operating expenses Non-capitalized development costs Demand driven by public support & technology Expanding RPS Networks: Aging Infrastructure Storm Resilience Utility of the Future Policy & Legislation Natural Gas Prices & Wholesale Prices Transmission Constraints & Congestion Renewables Development & Clean Energy RFP Consolidated Not expected to be a cash tax payer through 2020 planning period Significant cash generation Financing flexibility Funding options available
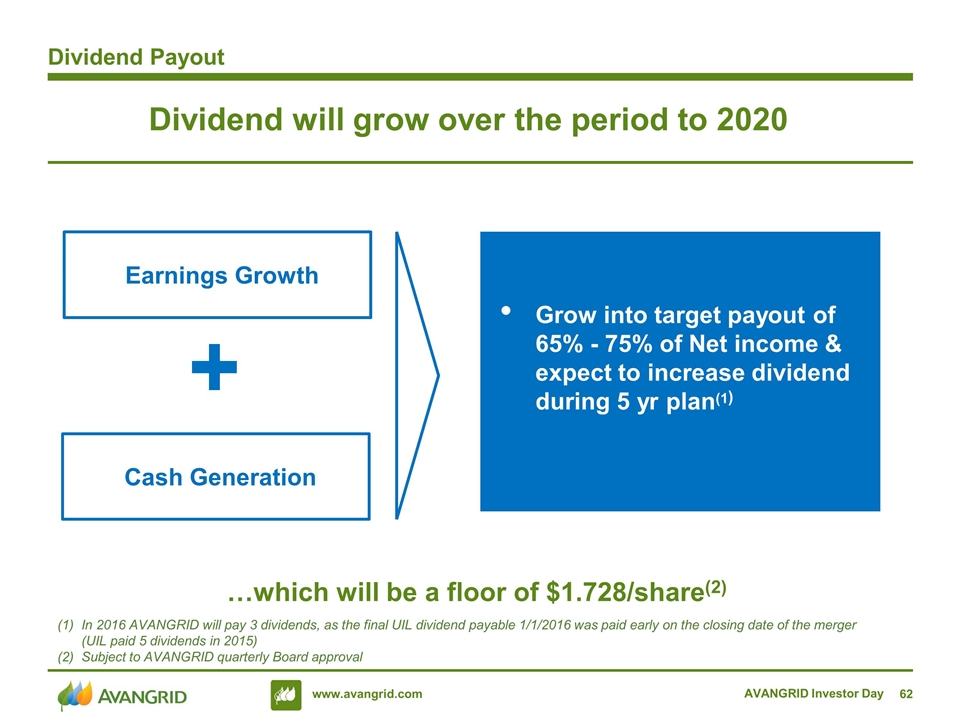
Dividend will grow over the period to 2020 …which will be a floor of $1.728/share(2) Earnings Growth Grow into target payout of 65% - 75% of Net income & expect to increase dividend during 5 yr plan(1) Cash Generation Dividend Payout AVANGRID Investor Day In 2016 AVANGRID will pay 3 dividends, as the final UIL dividend payable 1/1/2016 was paid early on the closing date of the merger (UIL paid 5 dividends in 2015) Subject to AVANGRID quarterly Board approval
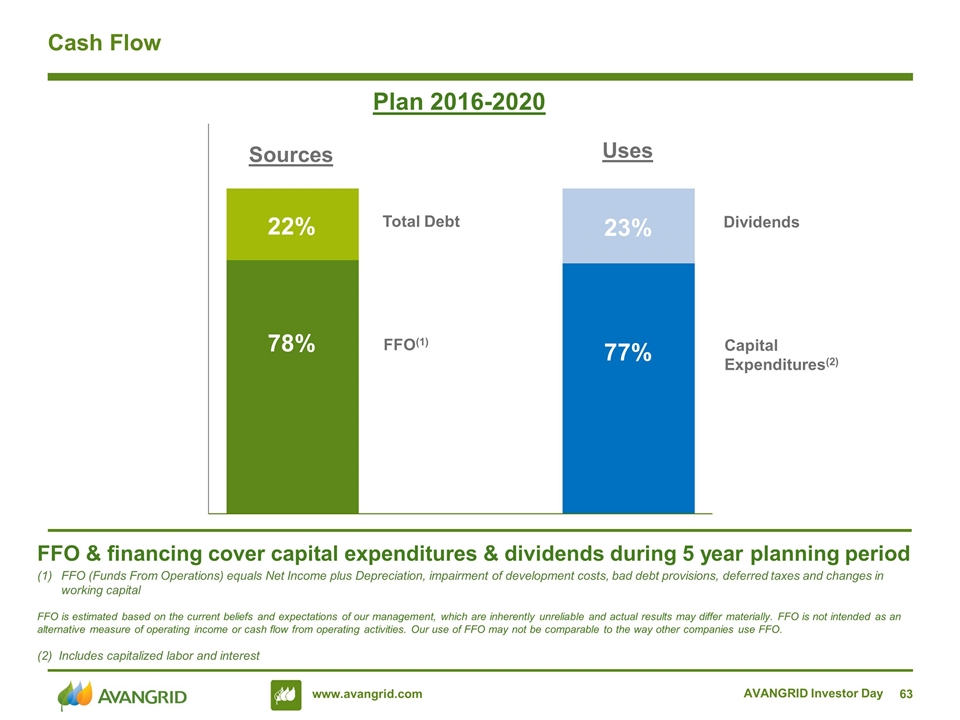
AVANGRID Investor Day Cash Flow FFO & financing cover capital expenditures & dividends during 5 year planning period FFO (Funds From Operations) equals Net Income plus Depreciation, impairment of development costs, bad debt provisions, deferred taxes and changes in working capital FFO is estimated based on the current beliefs and expectations of our management, which are inherently unreliable and actual results may differ materially. FFO is not intended as an alternative measure of operating income or cash flow from operating activities. Our use of FFO may not be comparable to the way other companies use FFO. (2) Includes capitalized labor and interest Plan 2016-2020 78% 77% 23% 22% FFO(1) Total Debt Capital Expenditures(2) Dividends Sources Uses
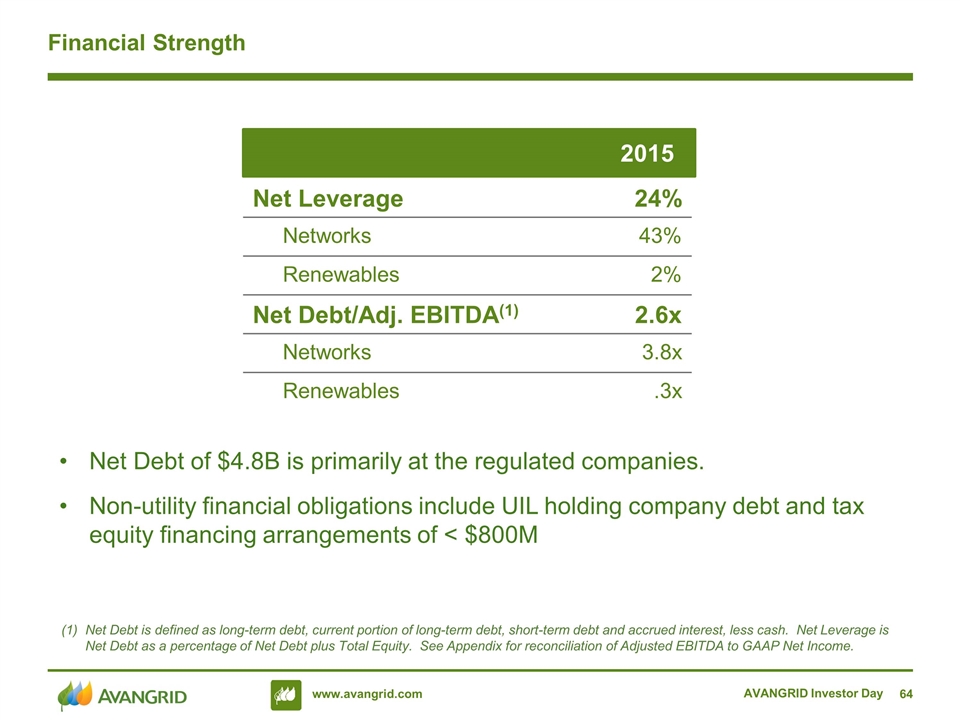
AVANGRID Investor Day Financial Strength Net Debt is defined as long-term debt, current portion of long-term debt, short-term debt and accrued interest, less cash. Net Leverage is Net Debt as a percentage of Net Debt plus Total Equity. See Appendix for reconciliation of Adjusted EBITDA to GAAP Net Income. 2016-2020 2016-2020 $B $B Net Leverage 24% Networks 43% Renewables 2% Net Debt/Adj. EBITDA(1) 2.6x Networks 3.8x Renewables .3x 2015 Net Debt of $4.8B is primarily at the regulated companies. Non-utility financial obligations include UIL holding company debt and tax equity financing arrangements of < $800M
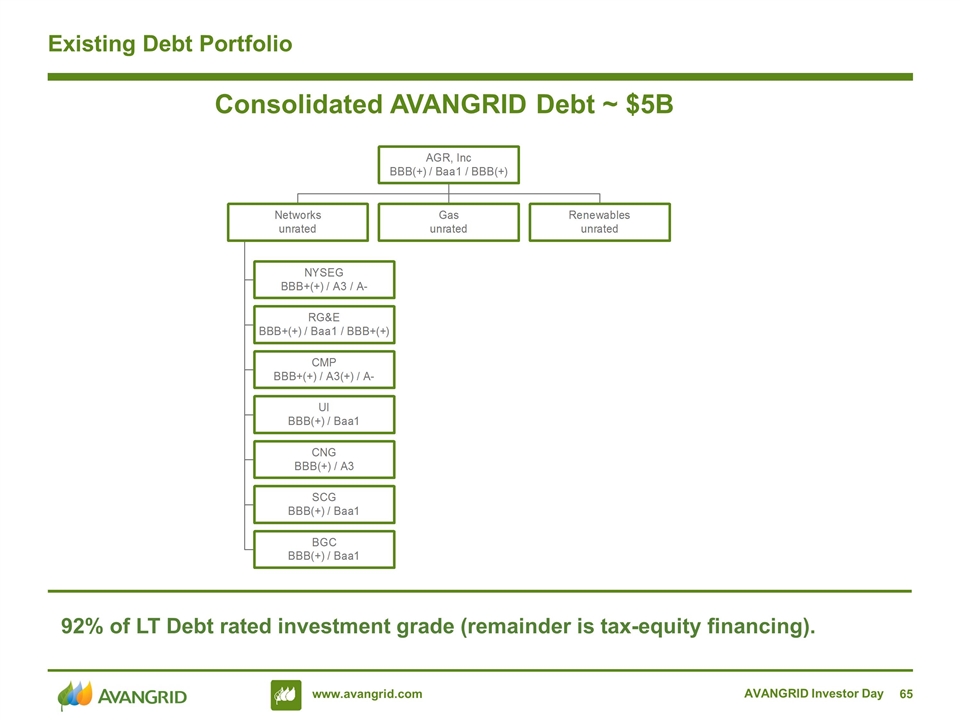
Existing Debt Portfolio Consolidated AVANGRID Debt ~ $5B AVANGRID Investor Day 92% of LT Debt rated investment grade (remainder is tax-equity financing).
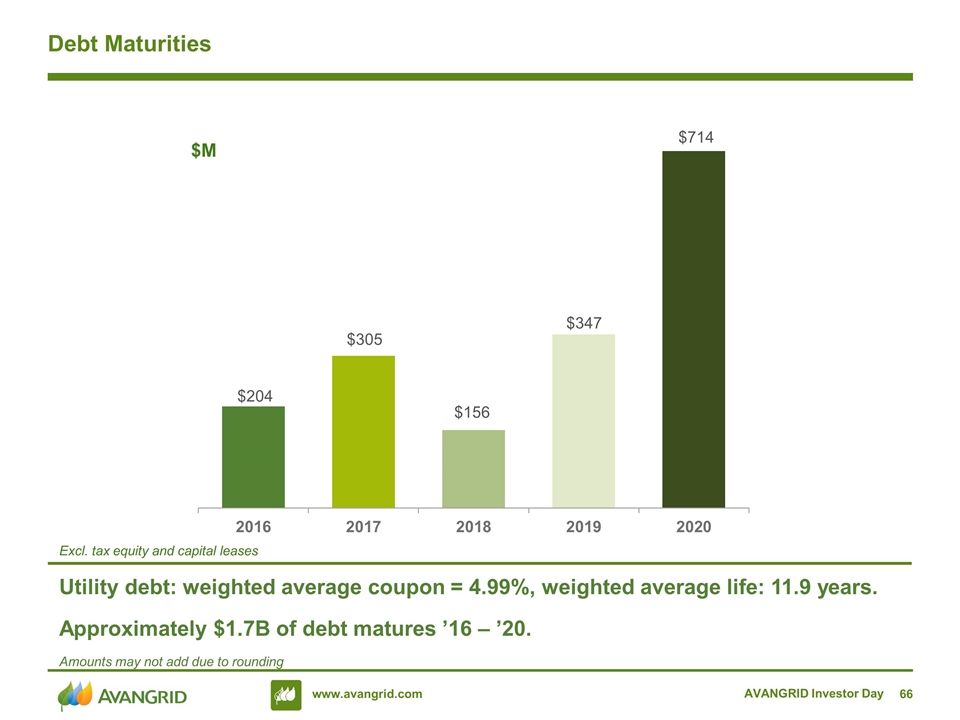
Debt Maturities AVANGRID Investor Day Utility debt: weighted average coupon = 4.99%, weighted average life: 11.9 years. Approximately $1.7B of debt matures ’16 – ’20. $M Excl. tax equity and capital leases Amounts may not add due to rounding
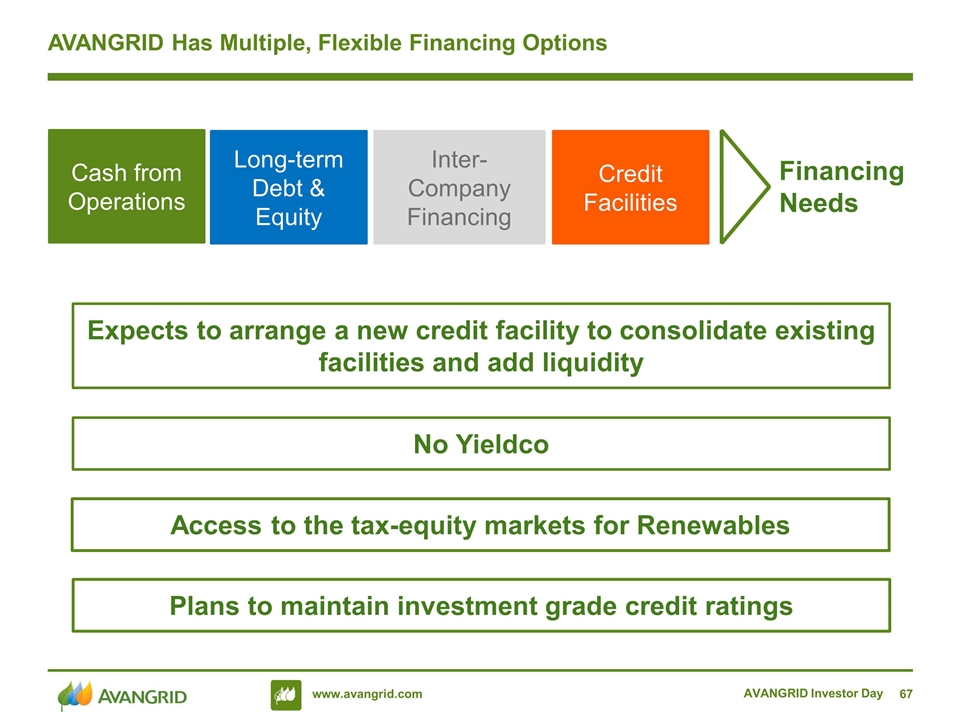
AVANGRID Investor Day AVANGRID Has Multiple, Flexible Financing Options Plans to maintain investment grade credit ratings No Yieldco Cash from Operations Credit Facilities Long-term Debt & Equity Inter-Company Financing Financing Needs Expects to arrange a new credit facility to consolidate existing facilities and add liquidity Access to the tax-equity markets for Renewables
Financing & Liquidity Manage utility capital structures to optimize the regulated capital structures and to achieve strong investment grade ratings Utility equity ratios ~50% Utility dividends/contributions and debt driven by business funding needs and capital structure targets Minimal leverage outside of utilities = capacity to fund growth Centralized approach to liquidity management In process of consolidating multiple credit facilities into single facility Optimize use of cash across the organization, short-term regulatory restrictions applicable to utilities Party to notional cash pooling arrangement with Iberdrola Group affiliates AVANGRID has access to tax equity financing, if advantageous for future funding of capital projects AVANGRID Investor Day
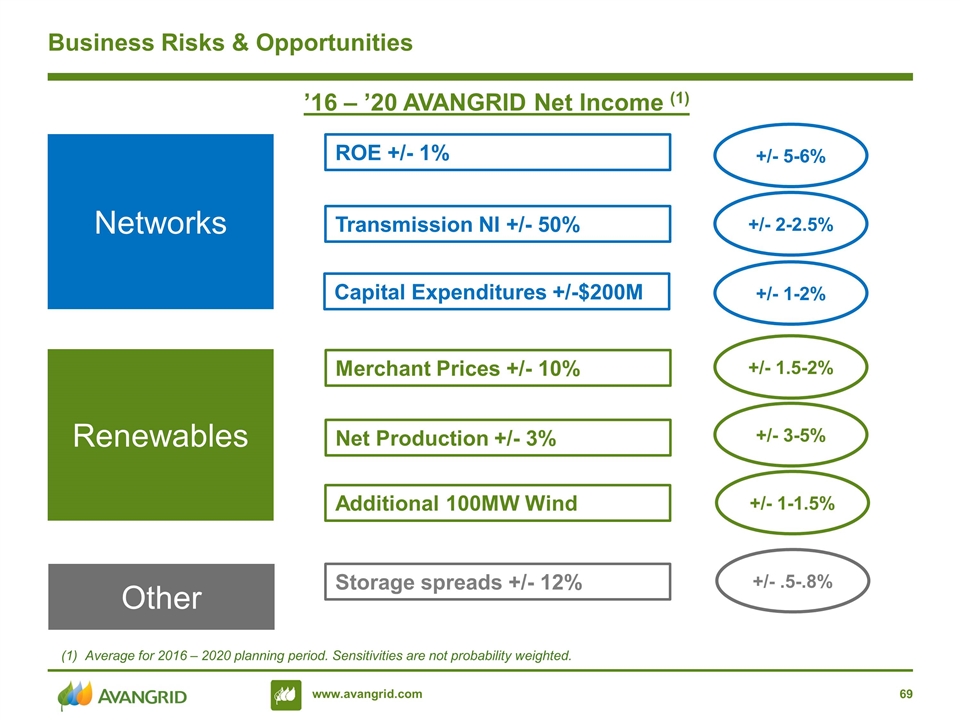
Business Risks & Opportunities Average for 2016 – 2020 planning period. Sensitivities are not probability weighted. Networks Renewables ROE +/- 1% Transmission NI +/- 50% Capital Expenditures +/-$200M Merchant Prices +/- 10% Net Production +/- 3% Additional 100MW Wind +/- 5-6% ’16 – ’20 AVANGRID Net Income (1) +/- 2-2.5% +/- 1-2% +/- 1.5-2% +/- 3-5% +/- 1-1.5% Other Storage spreads +/- 12% +/- .5-.8%
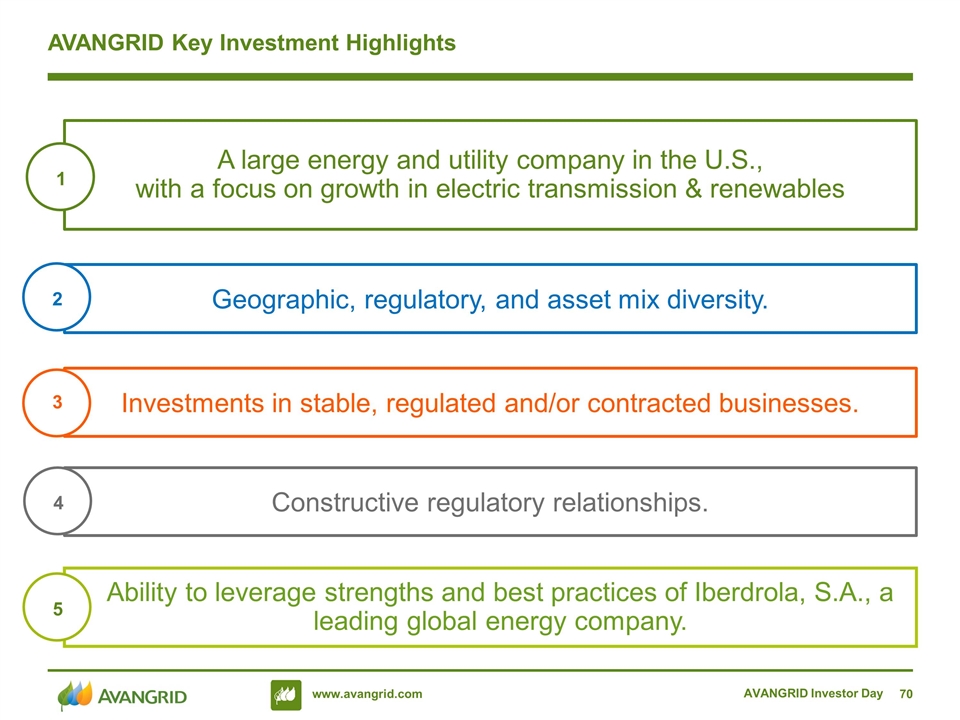
AVANGRID Investor Day AVANGRID Key Investment Highlights Ability to leverage strengths and best practices of Iberdrola, S.A., a leading global energy company. Geographic, regulatory, and asset mix diversity. A large energy and utility company in the U.S., with a focus on growth in electric transmission & renewables Investments in stable, regulated and/or contracted businesses. Constructive regulatory relationships. 1 2 3 4 5
Appendix AVANGRID Investor Day

Appendix Management Biographies AVANGRID Investor Day
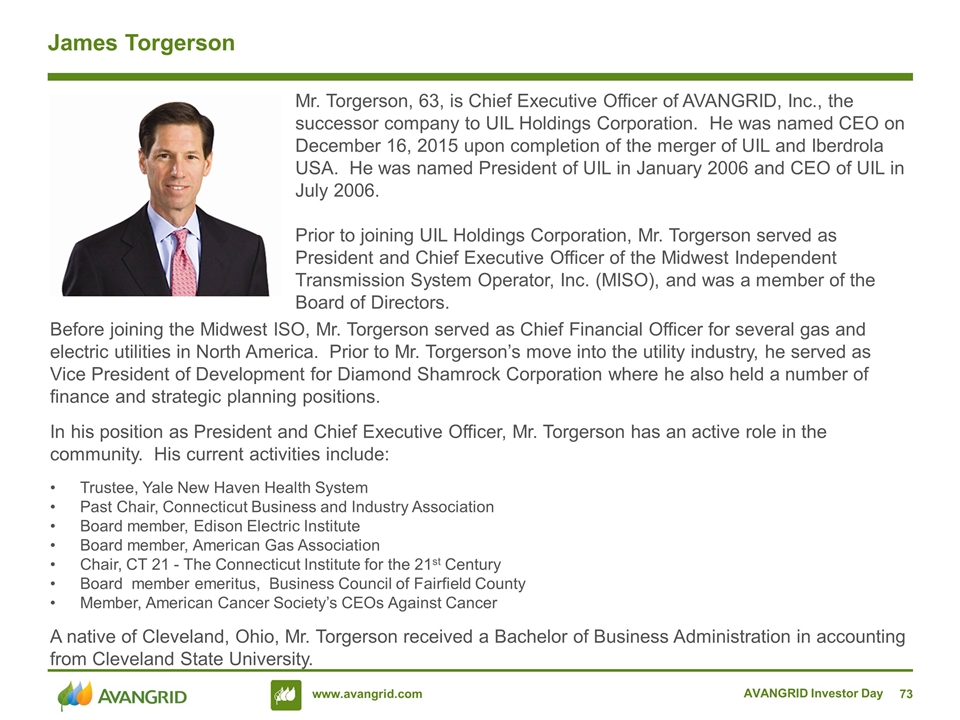
AVANGRID Investor Day James Torgerson Mr. Torgerson, 63, is Chief Executive Officer of AVANGRID, Inc., the successor company to UIL Holdings Corporation. He was named CEO on December 16, 2015 upon completion of the merger of UIL and Iberdrola USA. He was named President of UIL in January 2006 and CEO of UIL in July 2006. Prior to joining UIL Holdings Corporation, Mr. Torgerson served as President and Chief Executive Officer of the Midwest Independent Transmission System Operator, Inc. (MISO), and was a member of the Board of Directors. Before joining the Midwest ISO, Mr. Torgerson served as Chief Financial Officer for several gas and electric utilities in North America. Prior to Mr. Torgerson’s move into the utility industry, he served as Vice President of Development for Diamond Shamrock Corporation where he also held a number of finance and strategic planning positions. In his position as President and Chief Executive Officer, Mr. Torgerson has an active role in the community. His current activities include: Trustee, Yale New Haven Health System Past Chair, Connecticut Business and Industry Association Board member, Edison Electric Institute Board member, American Gas Association Chair, CT 21 - The Connecticut Institute for the 21st Century Board member emeritus, Business Council of Fairfield County Member, American Cancer Society’s CEOs Against Cancer A native of Cleveland, Ohio, Mr. Torgerson received a Bachelor of Business Administration in accounting from Cleveland State University.
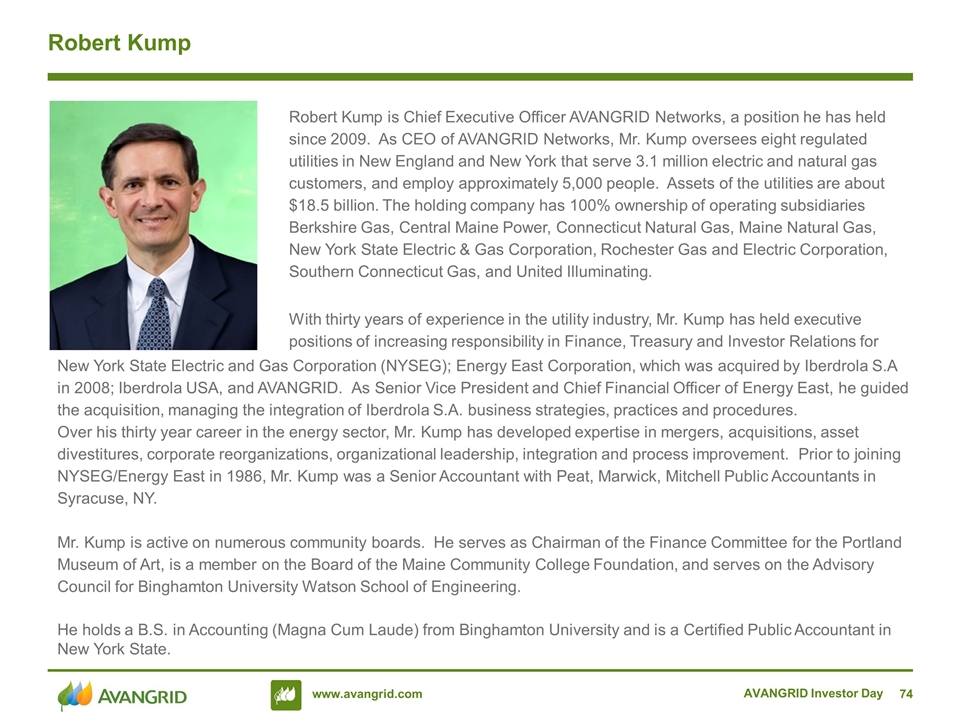
AVANGRID Investor Day Robert Kump Robert Kump is Chief Executive Officer AVANGRID Networks, a position he has held since 2009. As CEO of AVANGRID Networks, Mr. Kump oversees eight regulated utilities in New England and New York that serve 3.1 million electric and natural gas customers, and employ approximately 5,000 people. Assets of the utilities are about $18.5 billion. The holding company has 100% ownership of operating subsidiaries Berkshire Gas, Central Maine Power, Connecticut Natural Gas, Maine Natural Gas, New York State Electric & Gas Corporation, Rochester Gas and Electric Corporation, Southern Connecticut Gas, and United Illuminating. With thirty years of experience in the utility industry, Mr. Kump has held executive positions of increasing responsibility in Finance, Treasury and Investor Relations for New York State Electric and Gas Corporation (NYSEG); Energy East Corporation, which was acquired by Iberdrola S.A in 2008; Iberdrola USA, and AVANGRID. As Senior Vice President and Chief Financial Officer of Energy East, he guided the acquisition, managing the integration of Iberdrola S.A. business strategies, practices and procedures. Over his thirty year career in the energy sector, Mr. Kump has developed expertise in mergers, acquisitions, asset divestitures, corporate reorganizations, organizational leadership, integration and process improvement. Prior to joining NYSEG/Energy East in 1986, Mr. Kump was a Senior Accountant with Peat, Marwick, Mitchell Public Accountants in Syracuse, NY. Mr. Kump is active on numerous community boards. He serves as Chairman of the Finance Committee for the Portland Museum of Art, is a member on the Board of the Maine Community College Foundation, and serves on the Advisory Council for Binghamton University Watson School of Engineering. He holds a B.S. in Accounting (Magna Cum Laude) from Binghamton University and is a Certified Public Accountant in New York State.
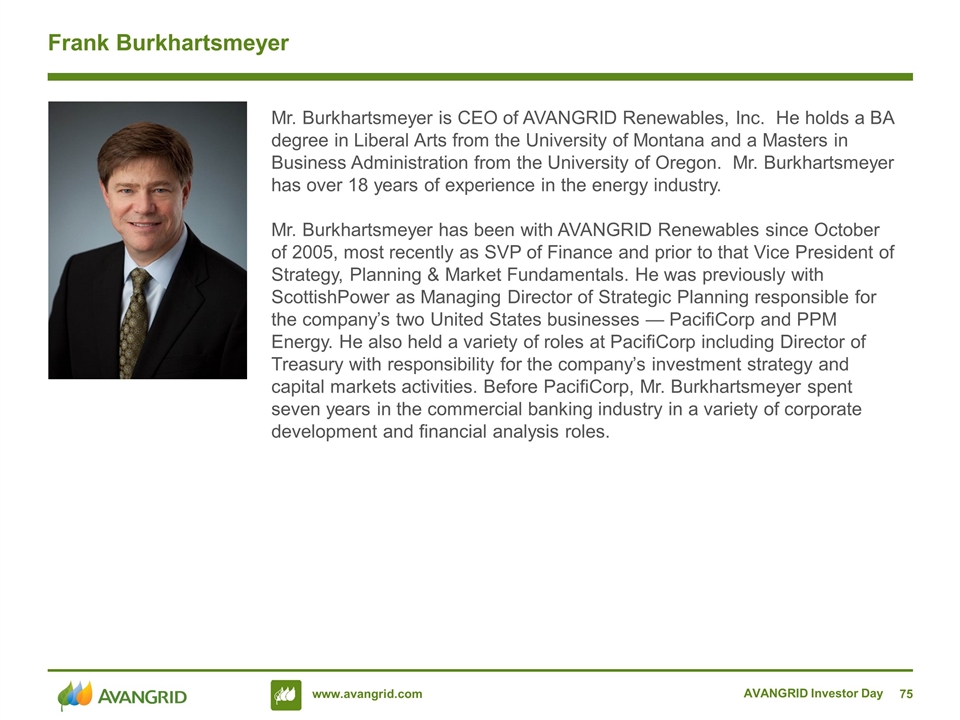
AVANGRID Investor Day Frank Burkhartsmeyer Mr. Burkhartsmeyer is CEO of AVANGRID Renewables, Inc. He holds a BA degree in Liberal Arts from the University of Montana and a Masters in Business Administration from the University of Oregon. Mr. Burkhartsmeyer has over 18 years of experience in the energy industry. Mr. Burkhartsmeyer has been with AVANGRID Renewables since October of 2005, most recently as SVP of Finance and prior to that Vice President of Strategy, Planning & Market Fundamentals. He was previously with ScottishPower as Managing Director of Strategic Planning responsible for the company’s two United States businesses — PacifiCorp and PPM Energy. He also held a variety of roles at PacifiCorp including Director of Treasury with responsibility for the company’s investment strategy and capital markets activities. Before PacifiCorp, Mr. Burkhartsmeyer spent seven years in the commercial banking industry in a variety of corporate development and financial analysis roles.
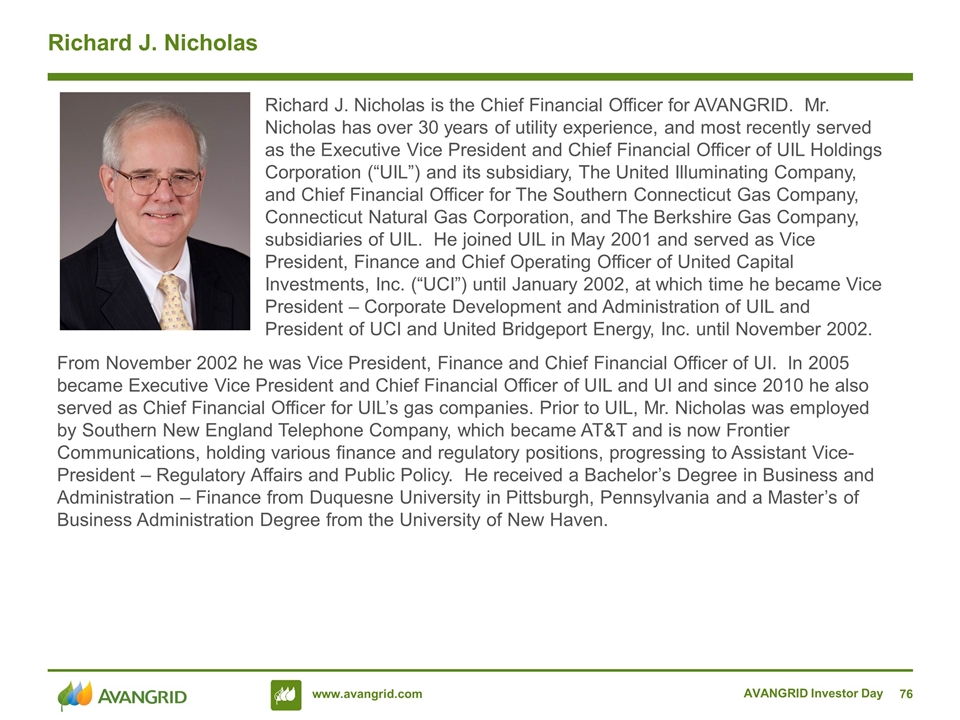
AVANGRID Investor Day Richard J. Nicholas Richard J. Nicholas is the Chief Financial Officer for AVANGRID. Mr. Nicholas has over 30 years of utility experience, and most recently served as the Executive Vice President and Chief Financial Officer of UIL Holdings Corporation (“UIL”) and its subsidiary, The United Illuminating Company, and Chief Financial Officer for The Southern Connecticut Gas Company, Connecticut Natural Gas Corporation, and The Berkshire Gas Company, subsidiaries of UIL. He joined UIL in May 2001 and served as Vice President, Finance and Chief Operating Officer of United Capital Investments, Inc. (“UCI”) until January 2002, at which time he became Vice President – Corporate Development and Administration of UIL and President of UCI and United Bridgeport Energy, Inc. until November 2002. From November 2002 he was Vice President, Finance and Chief Financial Officer of UI. In 2005 became Executive Vice President and Chief Financial Officer of UIL and UI and since 2010 he also served as Chief Financial Officer for UIL’s gas companies. Prior to UIL, Mr. Nicholas was employed by Southern New England Telephone Company, which became AT&T and is now Frontier Communications, holding various finance and regulatory positions, progressing to Assistant Vice-President – Regulatory Affairs and Public Policy. He received a Bachelor’s Degree in Business and Administration – Finance from Duquesne University in Pittsburgh, Pennsylvania and a Master’s of Business Administration Degree from the University of New Haven.
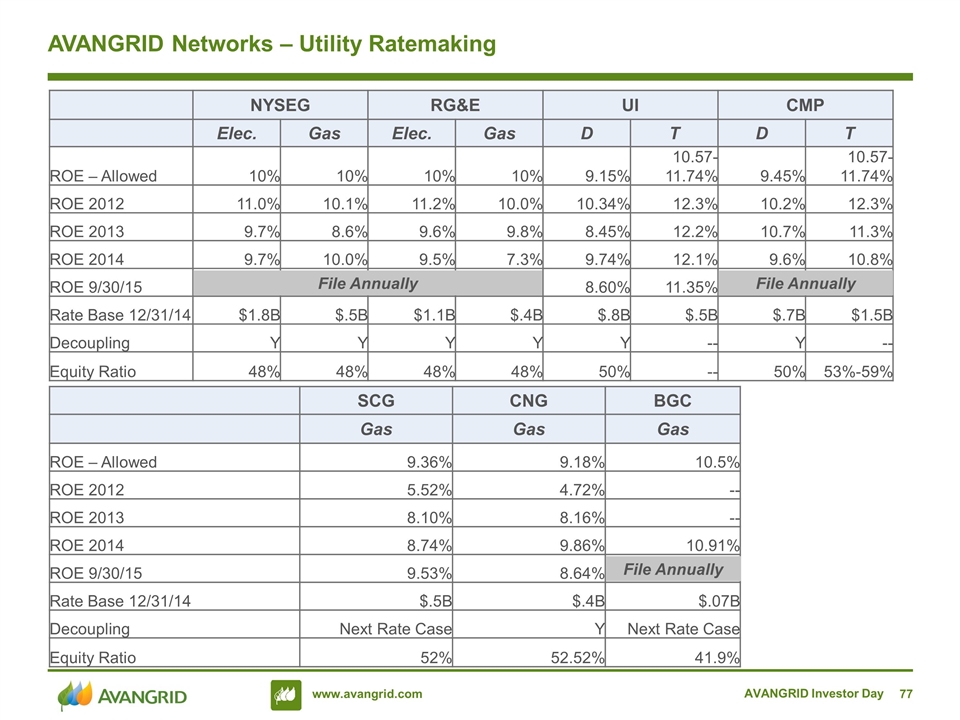
AVANGRID Networks – Utility Ratemaking AVANGRID Investor Day NYSEG RG&E UI CMP Elec. Gas Elec. Gas D T D T ROE – Allowed 10% 10% 10% 10% 9.15% 10.57-11.74% 9.45% 10.57-11.74% ROE 2012 11.0% 10.1% 11.2% 10.0% 10.34% 12.3% 10.2% 12.3% ROE 2013 9.7% 8.6% 9.6% 9.8% 8.45% 12.2% 10.7% 11.3% ROE 2014 9.7% 10.0% 9.5% 7.3% 9.74% 12.1% 9.6% 10.8% ROE 9/30/15 8.60% 11.35% Rate Base 12/31/14 $1.8B $.5B $1.1B $.4B $.8B $.5B $.7B $1.5B Decoupling Y Y Y Y Y -- Y -- Equity Ratio 48% 48% 48% 48% 50% -- 50% 53%-59% SCG CNG BGC Gas Gas Gas ROE – Allowed 9.36% 9.18% 10.5% ROE 2012 5.52% 4.72% -- ROE 2013 8.10% 8.16% -- ROE 2014 8.74% 9.86% 10.91% ROE 9/30/15 9.53% 8.64% Rate Base 12/31/14 $.5B $.4B $.07B Decoupling Next Rate Case Y Next Rate Case Equity Ratio 52% 52.52% 41.9% File Annually File Annually File Annually
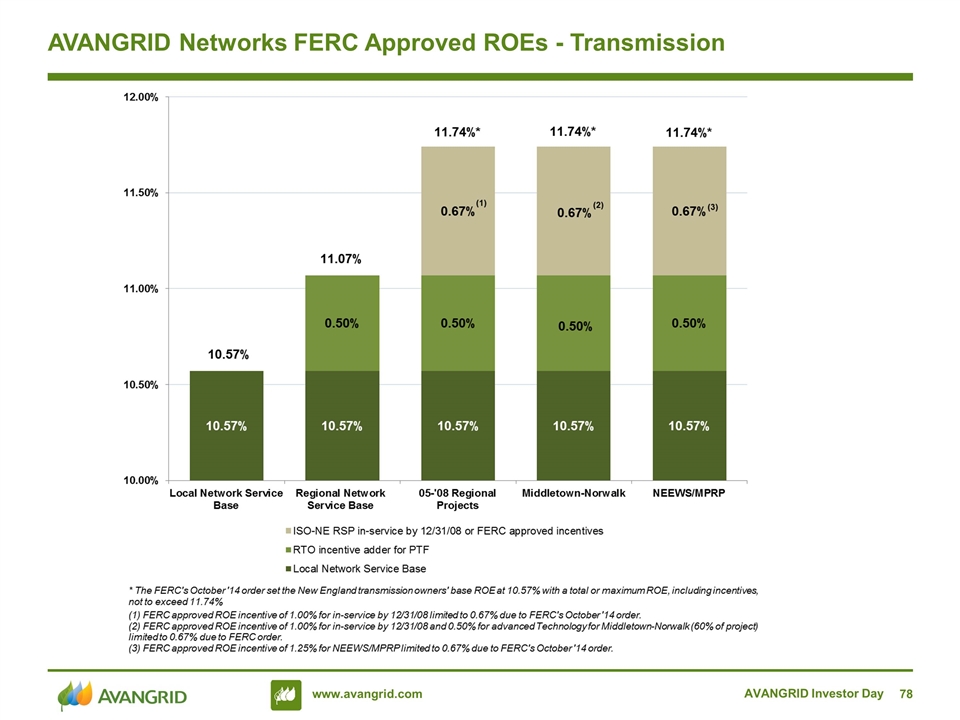
AVANGRID Networks FERC Approved ROEs - Transmission AVANGRID Investor Day
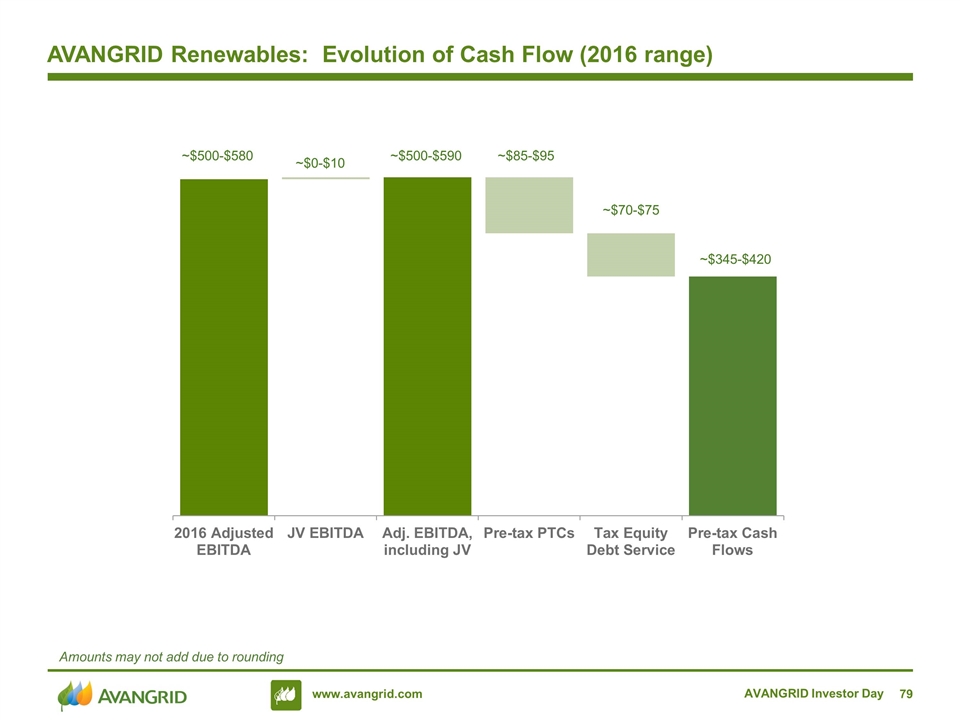
AVANGRID Renewables: Evolution of Cash Flow (2016 range) AVANGRID Investor Day ~$500-$580 ~$0-$10 ~$500-$590 ~$85-$95 ~$70-$75 ~$345-$420 Amounts may not add due to rounding
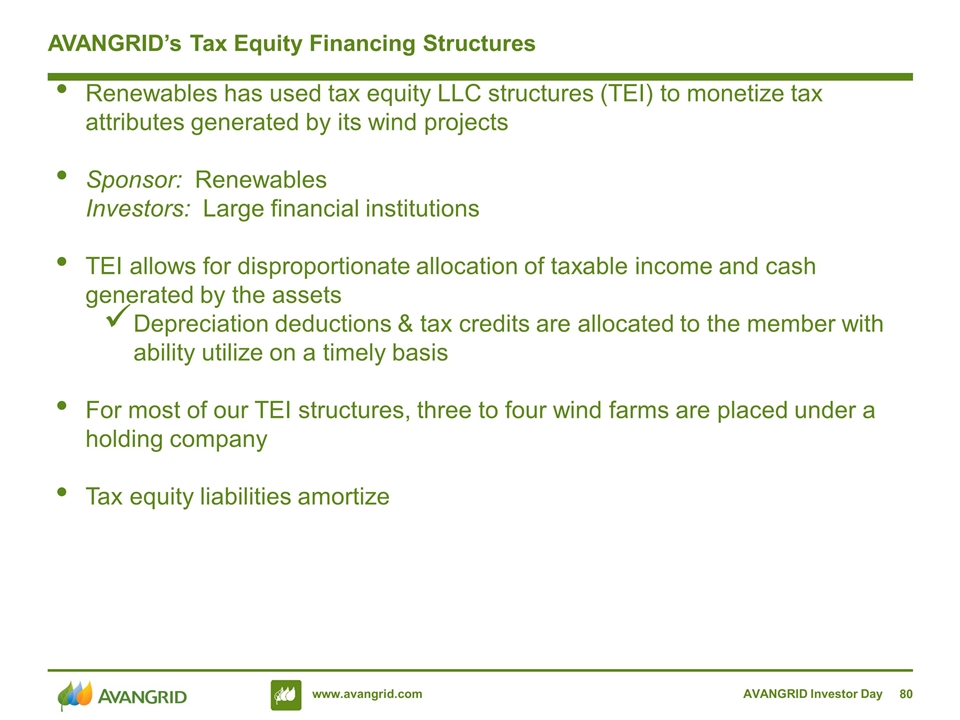
AVANGRID Investor Day AVANGRID’s Tax Equity Financing Structures Renewables has used tax equity LLC structures (TEI) to monetize tax attributes generated by its wind projects Sponsor: Renewables Investors: Large financial institutions TEI allows for disproportionate allocation of taxable income and cash generated by the assets Depreciation deductions & tax credits are allocated to the member with ability utilize on a timely basis For most of our TEI structures, three to four wind farms are placed under a holding company Tax equity liabilities amortize
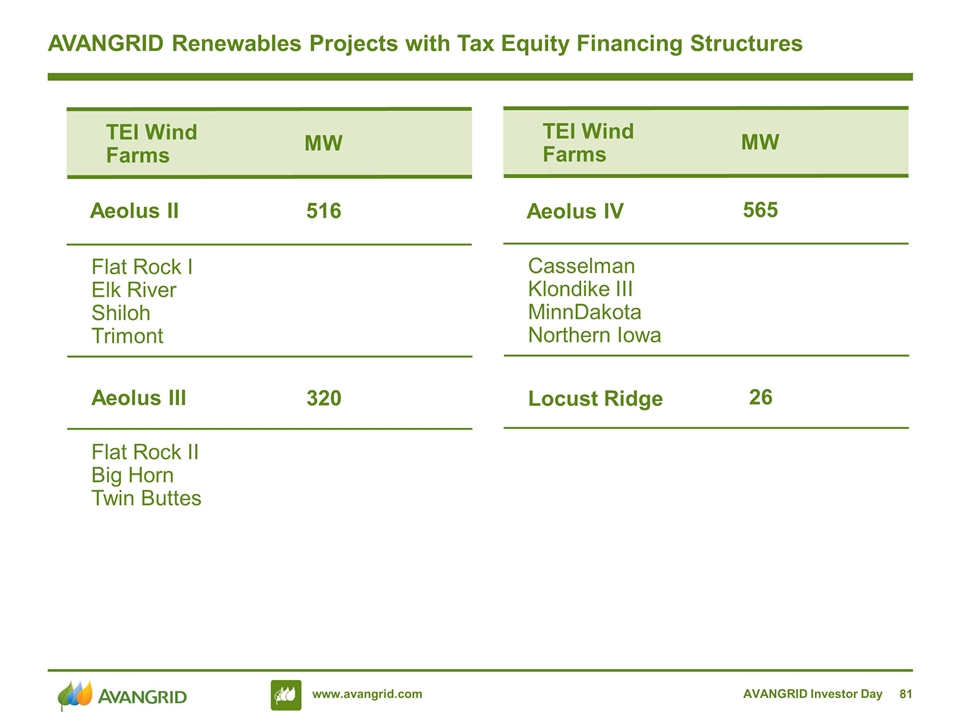
AVANGRID Investor Day AVANGRID Renewables Projects with Tax Equity Financing Structures MW 516 Aeolus II TEI Wind Farms Flat Rock I Elk River Shiloh Trimont 320 Aeolus III Flat Rock II Big Horn Twin Buttes MW 565 Aeolus IV TEI Wind Farms Casselman Klondike III MinnDakota Northern Iowa 26 Locust Ridge
Appendix Reconciliations AVANGRID Investor Day
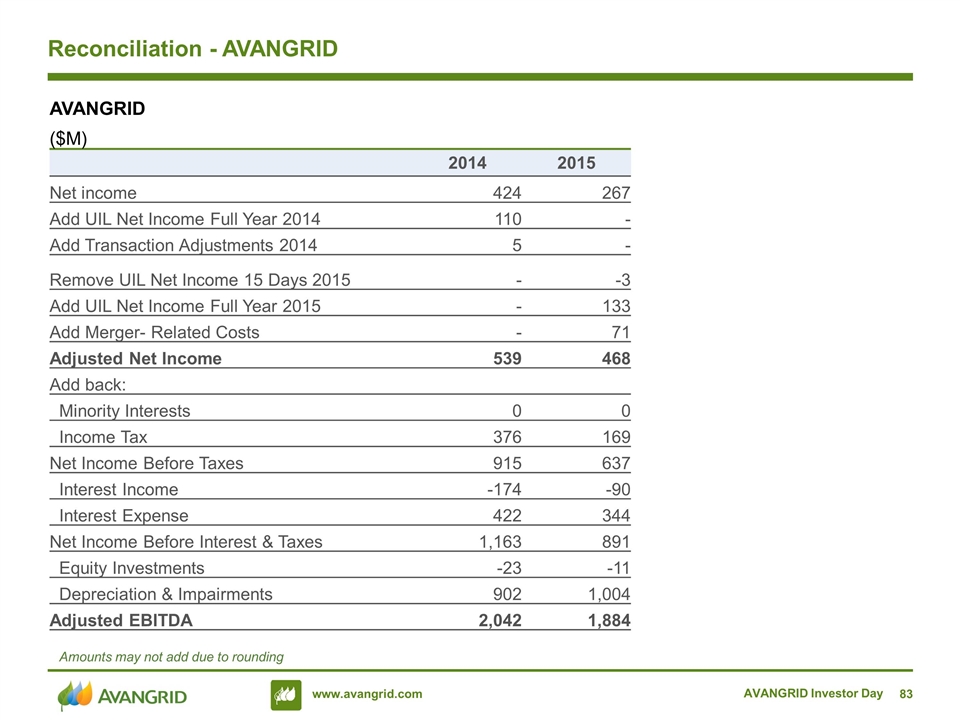
AVANGRID Investor Day Reconciliation - AVANGRID Amounts may not add due to rounding AVANGRID ($M) 2014 2015 Net income 424 267 Add UIL Net Income Full Year 2014 110 - Add Transaction Adjustments 2014 5 - Remove UIL Net Income 15 Days 2015 - -3 Add UIL Net Income Full Year 2015 - 133 Add Merger- Related Costs - 71 Adjusted Net Income 539 468 Add back: Minority Interests 0 0 Income Tax 376 169 Net Income Before Taxes 915 637 Interest Income -174 -90 Interest Expense 422 344 Net Income Before Interest & Taxes 1,163 891 Equity Investments -23 -11 Depreciation & Impairments 902 1,004 Adjusted EBITDA 2,042 1,884
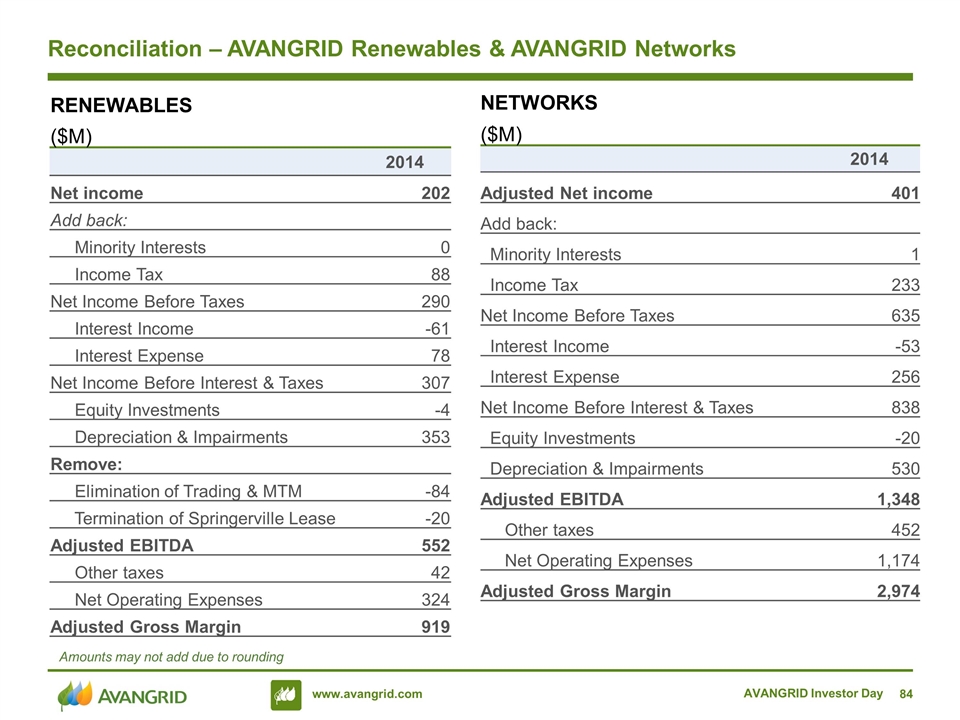
AVANGRID Investor Day Reconciliation – AVANGRID Renewables & AVANGRID Networks Amounts may not add due to rounding NETWORKS ($M) 2014 Adjusted Net income 401 Add back: Minority Interests 1 Income Tax 233 Net Income Before Taxes 635 Interest Income -53 Interest Expense 256 Net Income Before Interest & Taxes 838 Equity Investments -20 Depreciation & Impairments 530 Adjusted EBITDA 1,348 Other taxes 452 Net Operating Expenses 1,174 Adjusted Gross Margin 2,974 RENEWABLES ($M) 2014 Net income 202 Add back: Minority Interests 0 Income Tax 88 Net Income Before Taxes 290 Interest Income -61 Interest Expense 78 Net Income Before Interest & Taxes 307 Equity Investments -4 Depreciation & Impairments 353 Remove: Elimination of Trading & MTM -84 Termination of Springerville Lease -20 Adjusted EBITDA 552 Other taxes 42 Net Operating Expenses 324 Adjusted Gross Margin 919


