1Q 2016 Earnings Presentation April 26, 2016 EXHIBIT 99.2
Legal Notices FORWARD LOOKING STATEMENTS Certain statements in this presentation may relate to AVANGRID’s future business and financial performance and future events or developments involving us and our subsidiaries that are not purely historical and may constitute “forward-looking statements” within the meaning of the Private Securities Litigation Reform Act of 1995. Forward-looking statements may be identified by the use of forward-looking terms such as “may,” “will,” “should,” “can,” “expects,” “believes,” “anticipates,” “intends,” “plans,” “estimates,” “projects,” “assumes,” “guides,” “targets,” “forecasts,” “is confident that” and “seeks” or the negative of such terms or other variations on such terms or comparable terminology. Such forward-looking statements include, but are not limited to, statements about our plans, objectives and intentions, outlooks or expectations for earnings, revenues, expenses or other future financial or business performance, strategies or expectations, or the impact of legal or regulatory matters on our business, results of operations or financial condition. Such statements are based upon the current beliefs and expectations of our management and are subject to significant risks and uncertainties that could cause actual outcomes and results to differ materially. Important factors that could cause actual results to differ materially from those indicated by such forward-looking statements include, without limitation, the risks and uncertainties set forth under the section entitled “Risk Factors” and “Management’s Discussion and Analysis of Financial Condition and Results of Operations” in our Annual Report on Form 10-K, which is on file with the Securities and Exchange Commission (SEC) and available on our investor relations website at www.avangrid.com and on the SEC website at www.sec.gov. Additional information will also be set forth in filings with the SEC. Should one or more of these risks or uncertainties materialize, or should any of the underlying assumptions prove incorrect, actual results may vary in material respects from those expressed or implied by these forward-looking statements. You should not place undue reliance on these forward-looking statements. We do not undertake any obligation to update or revise any forward-looking statements to reflect events or circumstances after the date of the communication, whether as a result of new information, future events or otherwise, except as may be required under applicable securities laws.
Legal Notices Use of Non-GAAP Measures AVANGRID believes that a breakdown presented on a net income and per share basis by line of business is useful in understanding the change in the results of operations of AVANGRID’s lines of business from one reporting period to another and in evaluating the actual and projected financial performance and contribution of AVANGRID’s lines of businesses. Earnings per share (EPS) by business is a non-GAAP (not determined using generally accepted accounting principles) measure that is calculated by taking the pre-tax amounts determined in accordance with GAAP of each line of business, and applying the effective statutory federal and state tax rate and then dividing the results by the average number of diluted shares of AVANGRID’s common stock outstanding for the periods presented. Any such amounts provided are provided for informational purposes only and are not intended to be used to calculate "Pro-forma" amounts. AVANGRID also believes presenting earnings excluding certain non-recurring items, including as presented in the net income discussion, is useful in understanding and evaluating actual and projected financial performance of AVANGRID and to more fully compare and explain our results without including the impact of the non-recurring items. Lastly, AVANGRID, believes that presenting certain non-GAAP metrics (as defined in the Appendix) is useful because such measures can be used to analyze and compare profitability between companies and industries because it eliminates the impact of financing and certain non-cash charges. Non-GAAP financial measures should not be considered as alternatives to AVANGRID’s consolidated net income or EPS determined in accordance with GAAP as indicators of AVANGRID’s operating performance. About AVANGRID Avangrid, Inc. (NYSE: AGR) is a diversified energy and utility company with more than $30 billion in assets and operations in 25 states. The company operates regulated utilities and electricity generation through two primary lines of business. Avangrid Networks includes eight electric and natural gas utilities, serving 3.1 million customers in New York and New England. Avangrid Renewables operates approximately 6.6 gigawatts of electricity capacity, primarily through wind power, in states across the United States. AVANGRID employs approximately 7,000 people. The company was formed through a merger between Iberdrola USA, Inc. and UIL Holdings Corporation in 2015. Iberdrola S.A. (Madrid: IBE), a worldwide leader in the energy industry, owns 81.5% of AVANGRID. For more information, visit www.avangrid.com.
Presenters James P. TorgersonChief Executive Officer Richard J. NicholasChief Financial Officer AVANGRID 1Q ‘16 Earnings IR Contacts: Patricia Cosgel Vice President Investor and Shareholder Relations Michelle Hanson Manager Investor Relations Carlota Lopez Manager Investor Relations Investors@AVANGRID.com
AVANGRID Earnings Summary 1Q ‘16
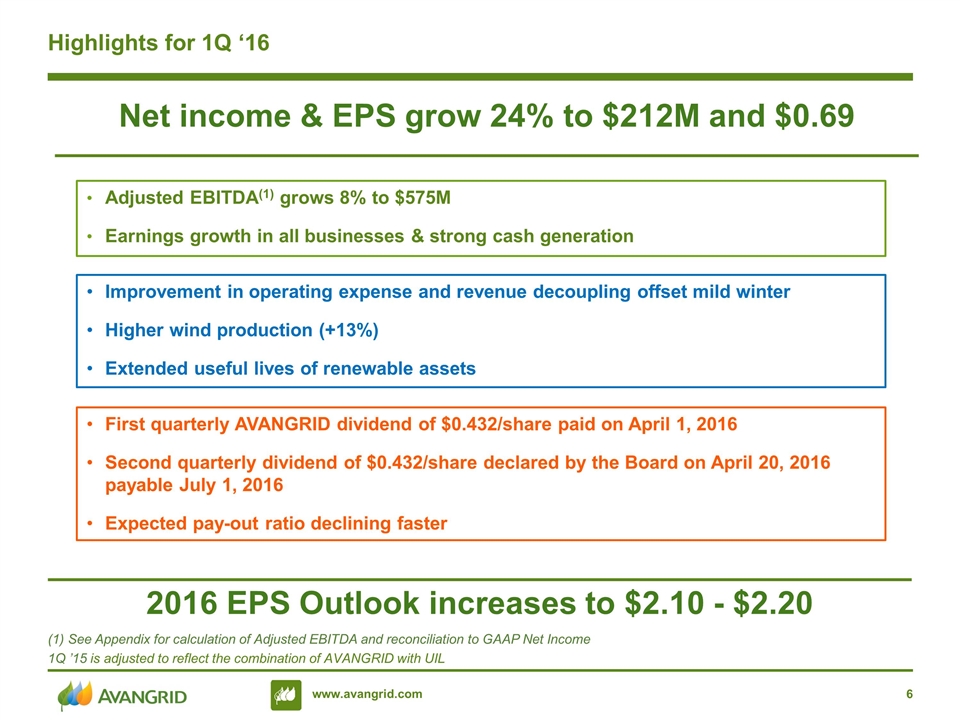
Highlights for 1Q ‘16 (1) See Appendix for calculation of Adjusted EBITDA and reconciliation to GAAP Net Income 1Q ’15 is adjusted to reflect the combination of AVANGRID with UIL Net income & EPS grow 24% to $212M and $0.69 2016 EPS Outlook increases to $2.10 - $2.20 Adjusted EBITDA(1) grows 8% to $575M Earnings growth in all businesses & strong cash generation Improvement in operating expense and revenue decoupling offset mild winter Higher wind production (+13%) Extended useful lives of renewable assets First quarterly AVANGRID dividend of $0.432/share paid on April 1, 2016 Second quarterly dividend of $0.432/share declared by the Board on April 20, 2016 payable July 1, 2016 Expected pay-out ratio declining faster
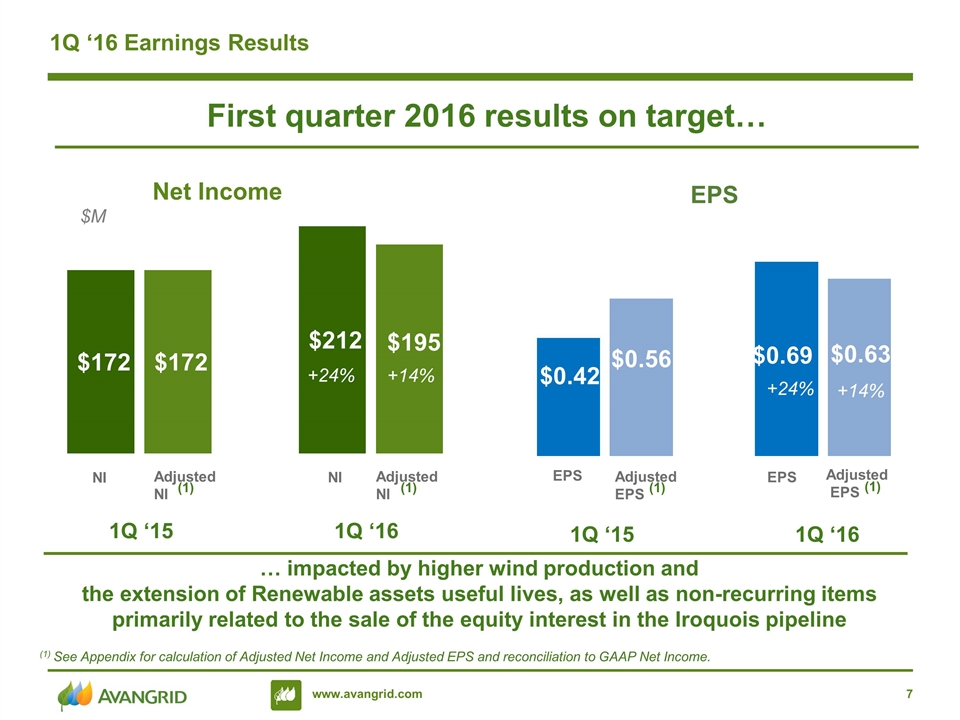
1Q ‘16 Earnings Results … impacted by higher wind production and the extension of Renewable assets useful lives, as well as non-recurring items primarily related to the sale of the equity interest in the Iroquois pipeline (1) (1) See Appendix for calculation of Adjusted Net Income and Adjusted EPS and reconciliation to GAAP Net Income. (1) 1Q ‘15 1Q ‘16 1Q ‘15 1Q ‘16 First quarter 2016 results on target… +24% +14% +24% +14% $M (1) (1) 7
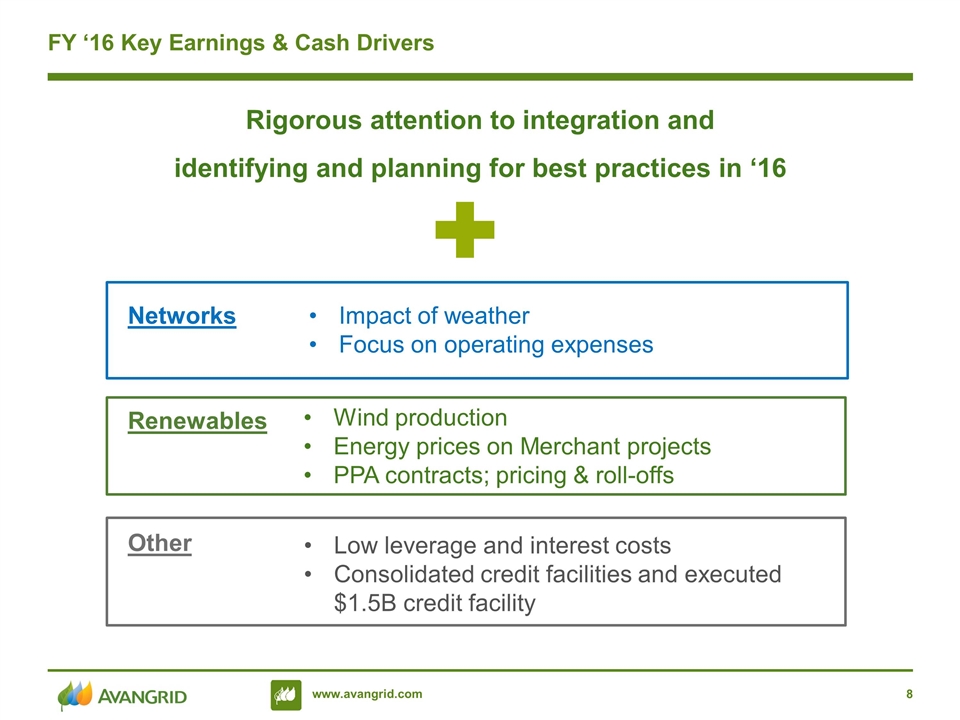
FY ‘16 Key Earnings & Cash Drivers Networks Renewables Other Rigorous attention to integration and identifying and planning for best practices in ‘16 Impact of weather Focus on operating expenses Wind production Energy prices on Merchant projects PPA contracts; pricing & roll-offs Low leverage and interest costs Consolidated credit facilities and executed $1.5B credit facility
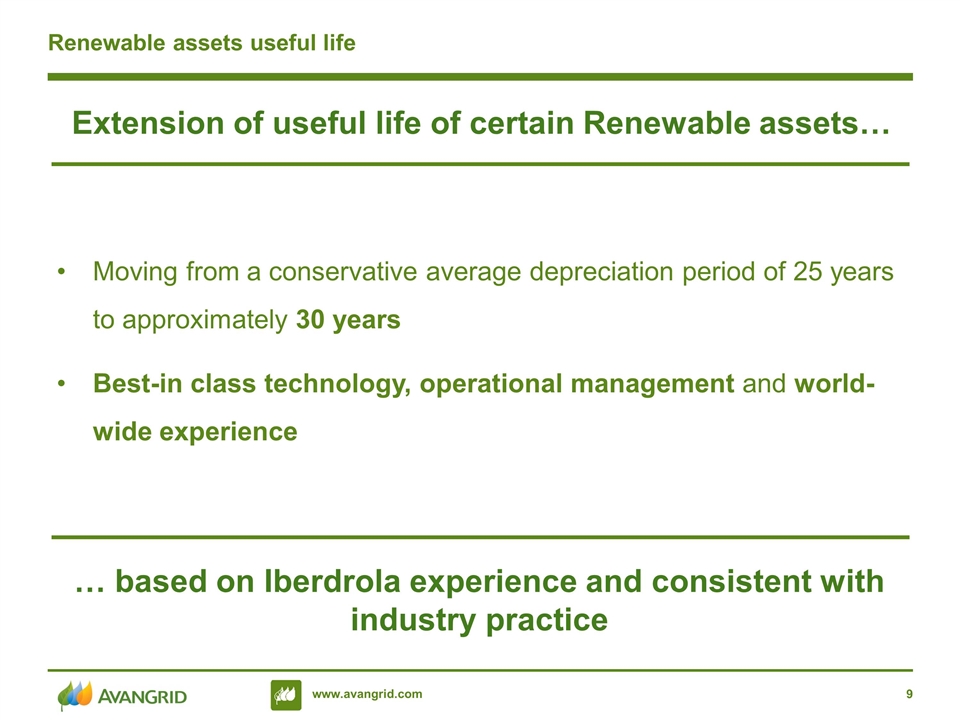
Renewable assets useful life … based on Iberdrola experience and consistent with industry practice Moving from a conservative average depreciation period of 25 years to approximately 30 years Best-in class technology, operational management and world-wide experience Extension of useful life of certain Renewable assets…
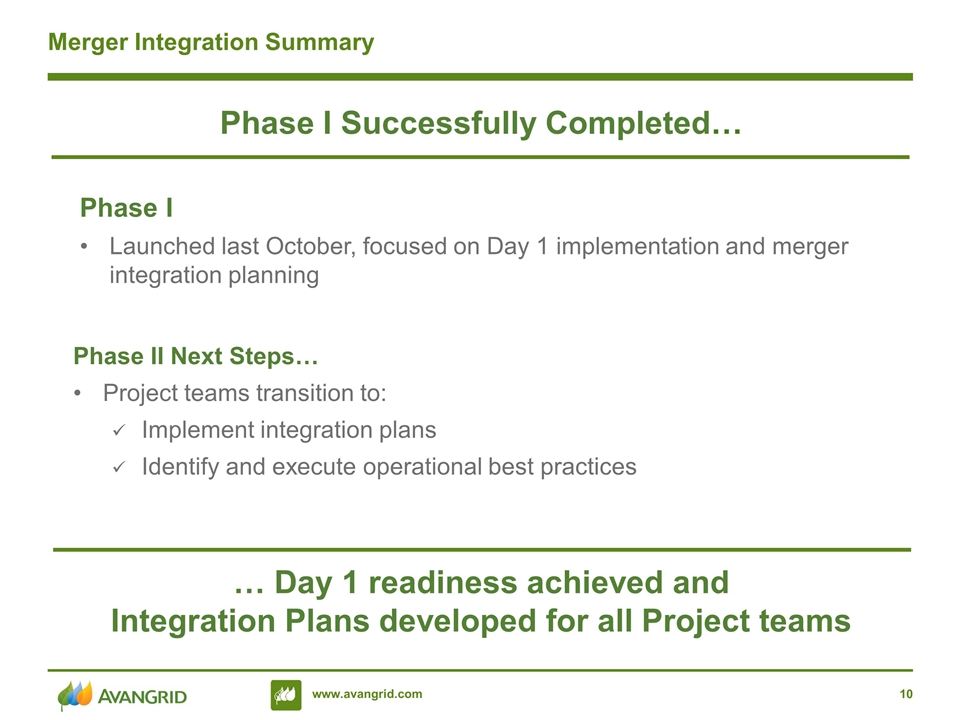
Merger Integration Summary Phase I Launched last October, focused on Day 1 implementation and merger integration planning Phase II Next Steps… Project teams transition to: Implement integration plans Identify and execute operational best practices Phase I Successfully Completed… … Day 1 readiness achieved and Integration Plans developed for all Project teams
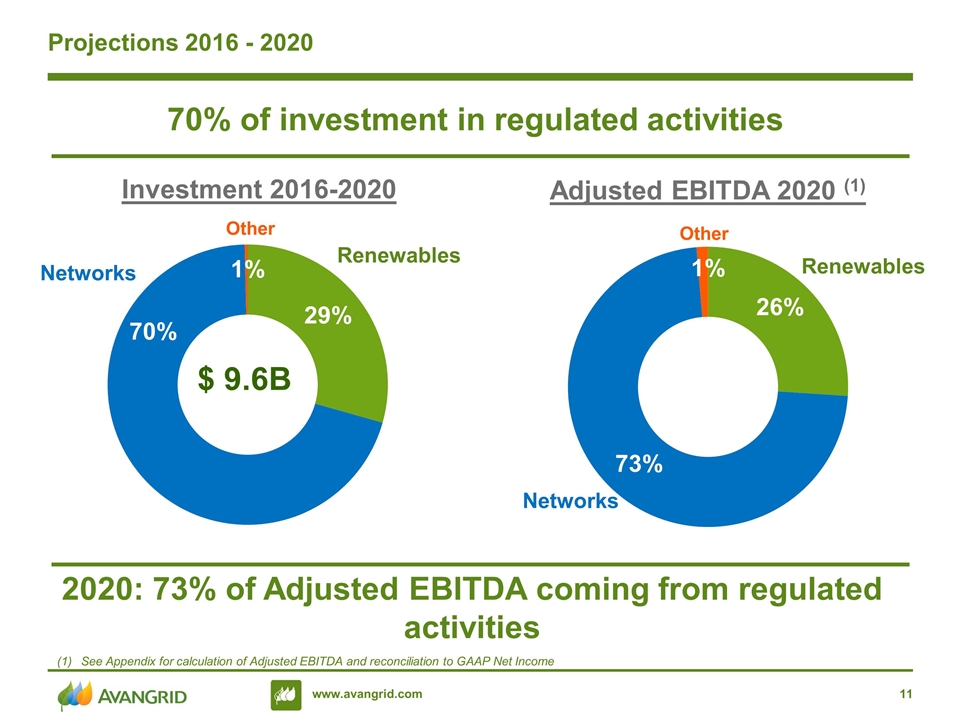
Projections 2016 - 2020 Investment 2016-2020 70% of investment in regulated activities 2020: 73% of Adjusted EBITDA coming from regulated activities Networks Renewables 29% 70% $ 9.6B Adjusted EBITDA 2020 (1) Networks Renewables Other 73% 26% 1% Other See Appendix for calculation of Adjusted EBITDA and reconciliation to GAAP Net Income
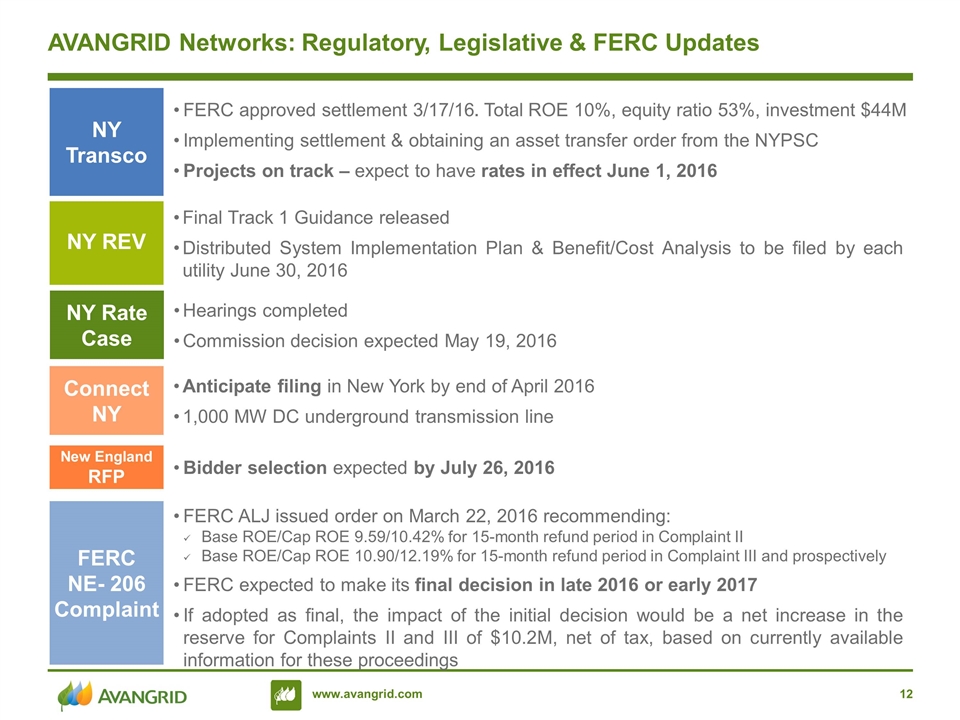
NY Transco FERC approved settlement 3/17/16. Total ROE 10%, equity ratio 53%, investment $44M Implementing settlement & obtaining an asset transfer order from the NYPSC Projects on track – expect to have rates in effect June 1, 2016 NY REV Final Track 1 Guidance released Distributed System Implementation Plan & Benefit/Cost Analysis to be filed by each utility June 30, 2016 New England RFP Bidder selection expected by July 26, 2016 Connect NY Anticipate filing in New York by end of April 2016 1,000 MW DC underground transmission line FERC NE- 206 Complaint FERC ALJ issued order on March 22, 2016 recommending: Base ROE/Cap ROE 9.59/10.42% for 15-month refund period in Complaint II Base ROE/Cap ROE 10.90/12.19% for 15-month refund period in Complaint III and prospectively FERC expected to make its final decision in late 2016 or early 2017 If adopted as final, the impact of the initial decision would be a net increase in the reserve for Complaints II and III of $10.2M, net of tax, based on currently available information for these proceedings AVANGRID Networks: Regulatory, Legislative & FERC Updates NY Rate Case Hearings completed Commission decision expected May 19, 2016
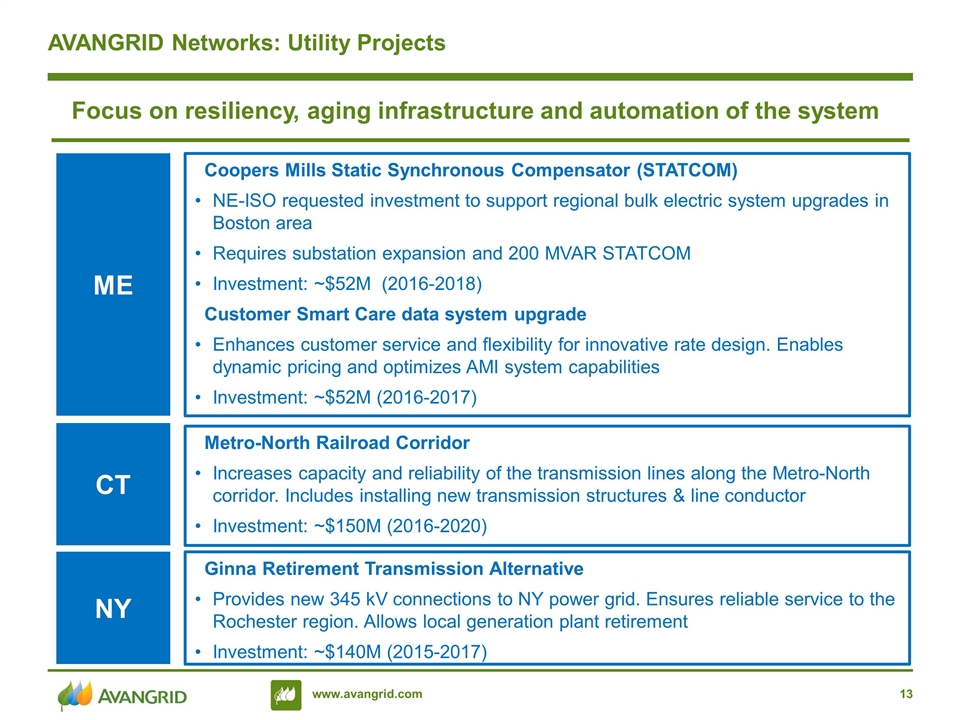
AVANGRID Networks: Utility Projects Metro-North Railroad Corridor Increases capacity and reliability of the transmission lines along the Metro-North corridor. Includes installing new transmission structures & line conductor Investment: ~$150M (2016-2020) Ginna Retirement Transmission Alternative Provides new 345 kV connections to NY power grid. Ensures reliable service to the Rochester region. Allows local generation plant retirement Investment: ~$140M (2015-2017) Focus on resiliency, aging infrastructure and automation of the system CT NY Coopers Mills Static Synchronous Compensator (STATCOM) NE-ISO requested investment to support regional bulk electric system upgrades in Boston area Requires substation expansion and 200 MVAR STATCOM Investment: ~$52M (2016-2018) Customer Smart Care data system upgrade Enhances customer service and flexibility for innovative rate design. Enables dynamic pricing and optimizes AMI system capabilities Investment: ~$52M (2016-2017) ME
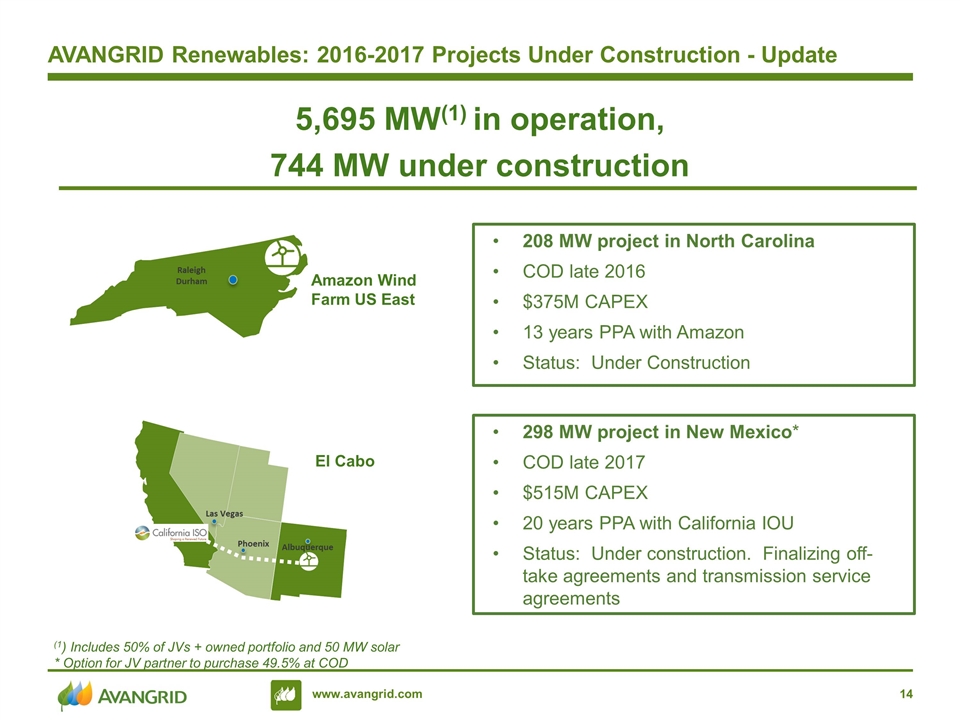
208 MW project in North Carolina COD late 2016 $375M CAPEX 13 years PPA with Amazon Status: Under Construction AVANGRID Renewables: 2016-2017 Projects Under Construction - Update Amazon Wind Farm US East Raleigh Durham Albuquerque Phoenix Las Vegas 298 MW project in New Mexico* COD late 2017 $515M CAPEX 20 years PPA with California IOU Status: Under construction. Finalizing off-take agreements and transmission service agreements El Cabo (1) Includes 50% of JVs + owned portfolio and 50 MW solar * Option for JV partner to purchase 49.5% at COD 5,695 MW(1) in operation, 744 MW under construction
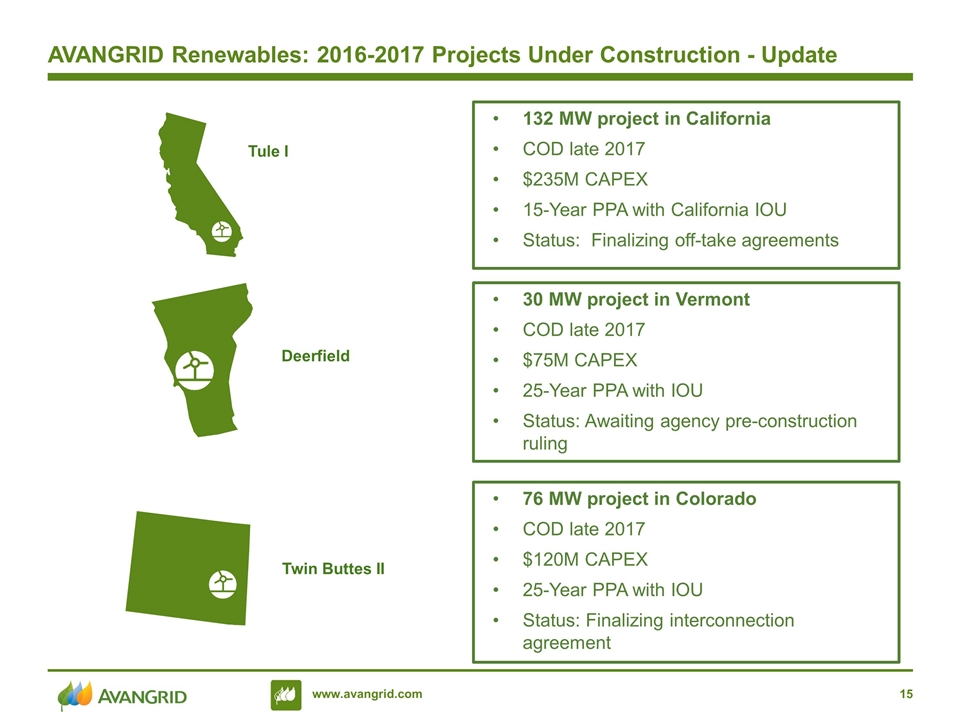
30 MW project in Vermont COD late 2017 $75M CAPEX 25-Year PPA with IOU Status: Awaiting agency pre-construction ruling AVANGRID Renewables: 2016-2017 Projects Under Construction - Update Deerfield 76 MW project in Colorado COD late 2017 $120M CAPEX 25-Year PPA with IOU Status: Finalizing interconnection agreement Twin Buttes II 132 MW project in California COD late 2017 $235M CAPEX 15-Year PPA with California IOU Status: Finalizing off-take agreements Tule I
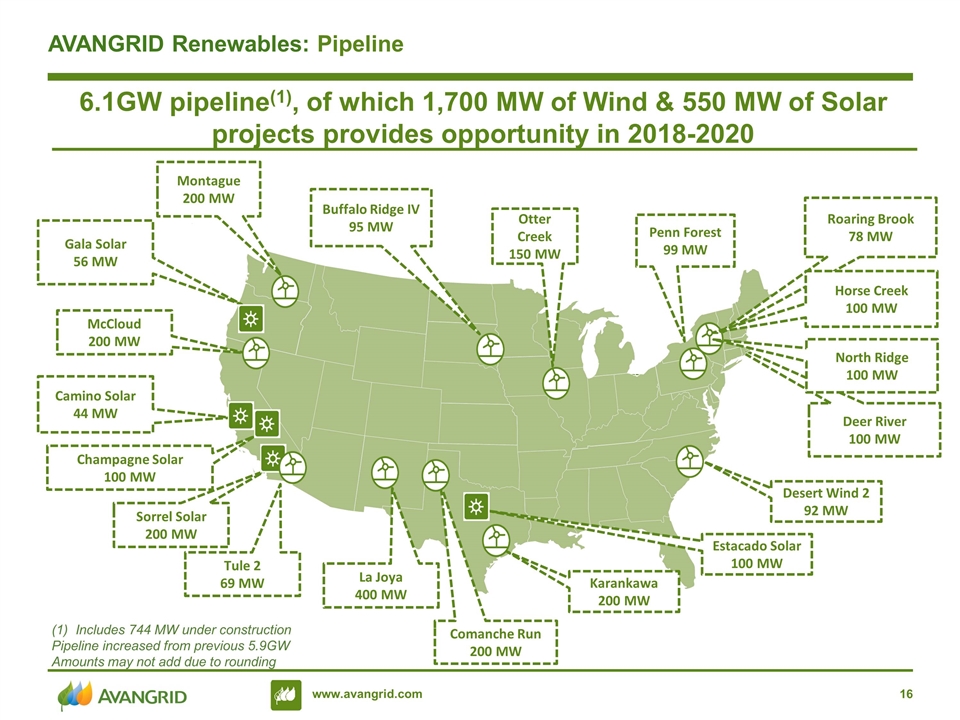
Deer River 100 MW Desert Wind 2 92 MW La Joya 400 MW Otter Creek 150 MW Buffalo Ridge IV 95 MW Penn Forest 99 MW Tule 2 69 MW McCloud 200 MW Karankawa 200 MW Sorrel Solar 200 MW Champagne Solar 100 MW Estacado Solar 100 MW Montague 200 MW Comanche Run 200 MW Roaring Brook 78 MW Camino Solar 44 MW Gala Solar 56 MW 6.1GW pipeline(1), of which 1,700 MW of Wind & 550 MW of Solar projects provides opportunity in 2018-2020 AVANGRID Renewables: Pipeline Includes 744 MW under construction Pipeline increased from previous 5.9GW Amounts may not add due to rounding Horse Creek 100 MW North Ridge 100 MW
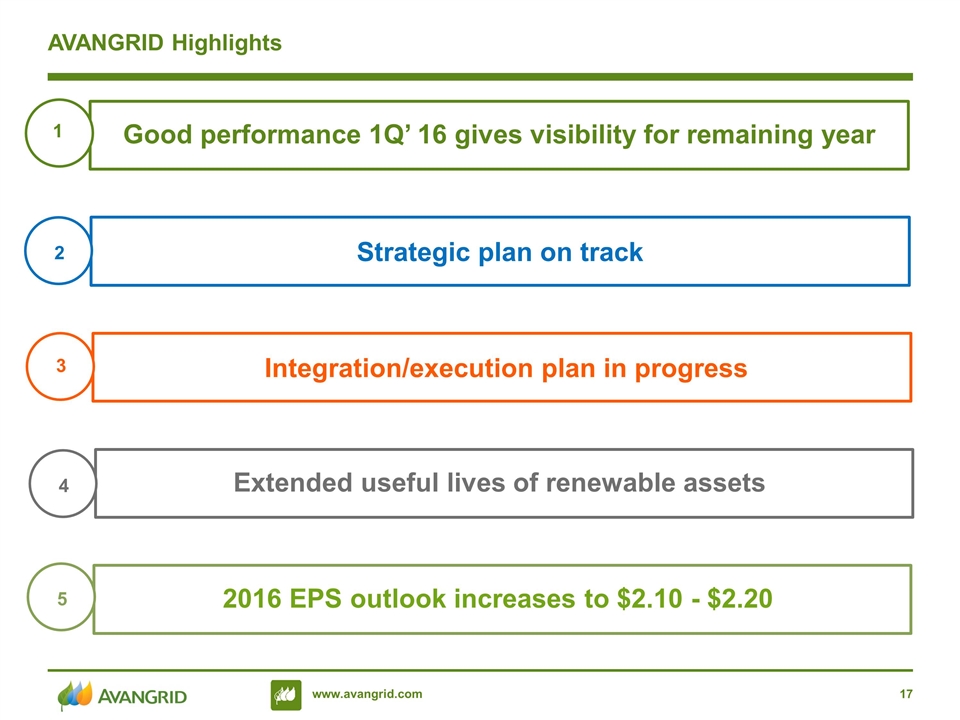
AVANGRID Highlights Strategic plan on track Good performance 1Q’ 16 gives visibility for remaining year Integration/execution plan in progress Extended useful lives of renewable assets 1 2 3 4 2016 EPS outlook increases to $2.10 - $2.20 5
1Q ‘16 AVANGRID 1Q ‘16 Financial Updates
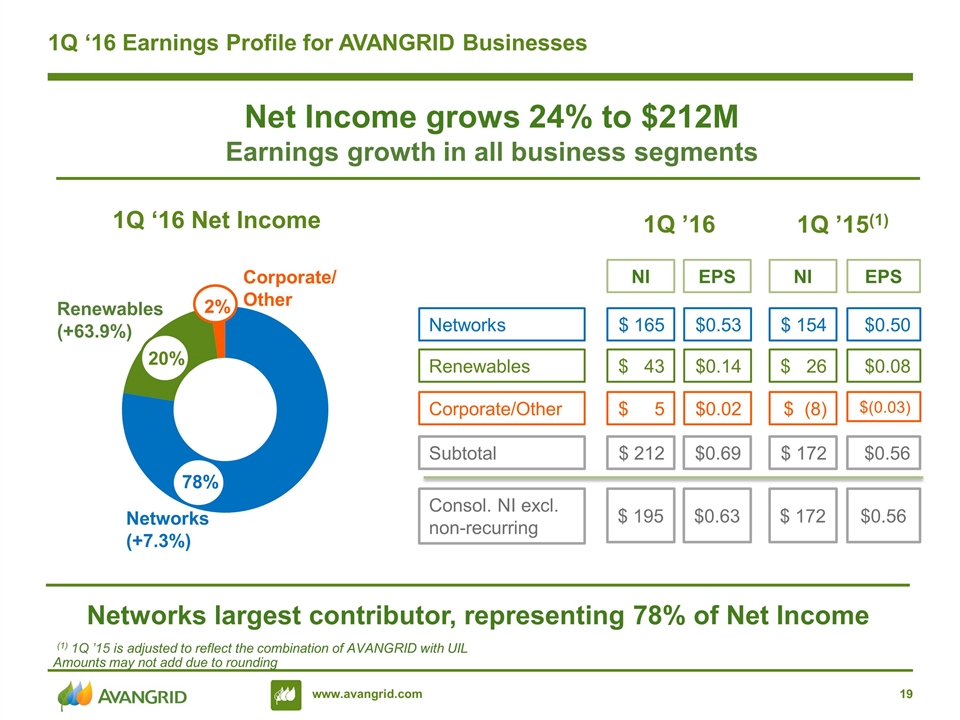
1Q ‘16 Earnings Profile for AVANGRID Businesses 1Q ‘16 Net Income Networks largest contributor, representing 78% of Net Income Renewables (+63.9%) Networks (+7.3%) 20% 78% 2% Corporate/ Other 1Q ’16 Networks Renewables Corporate/Other NI EPS $ 165 $ 43 $ 5 $0.53 $0.14 $0.02 $ 212 $0.69 Subtotal $ 195 $0.63 Consol. NI excl. non-recurring Net Income grows 24% to $212M Earnings growth in all business segments 1Q ’15(1) NI EPS $ 154 $ 26 $ (8) $0.50 $0.08 $(0.03) $ 172 $0.56 $ 172 $0.56 Amounts may not add due to rounding (1) 1Q ’15 is adjusted to reflect the combination of AVANGRID with UIL
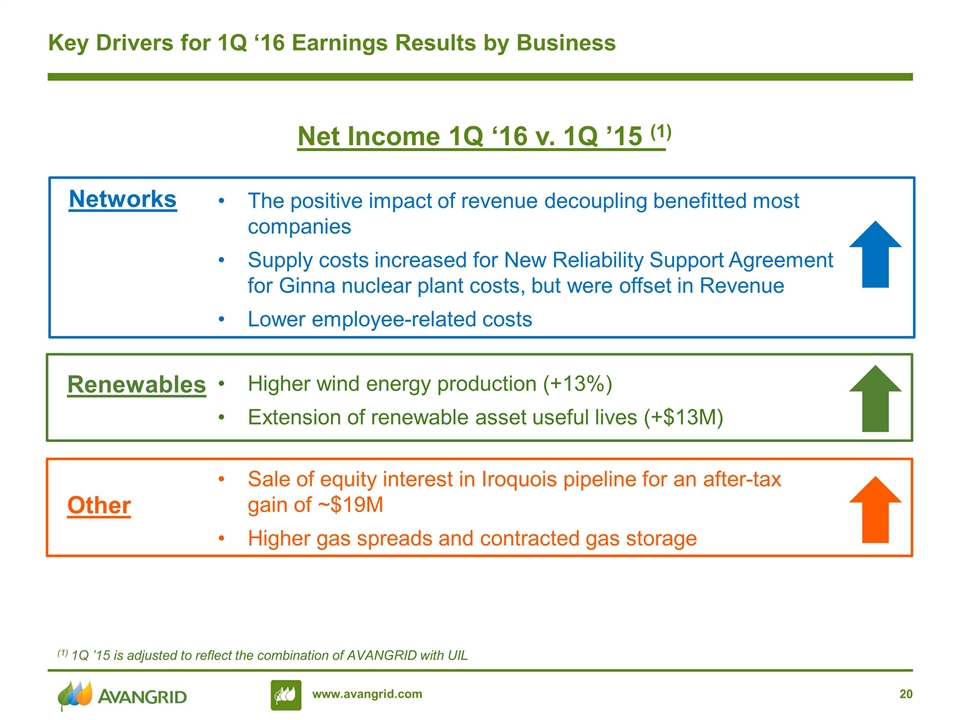
Key Drivers for 1Q ‘16 Earnings Results by Business Networks Renewables Other Higher wind energy production (+13%) Extension of renewable asset useful lives (+$13M) Sale of equity interest in Iroquois pipeline for an after-tax gain of ~$19M Higher gas spreads and contracted gas storage (1) 1Q ’15 is adjusted to reflect the combination of AVANGRID with UIL The positive impact of revenue decoupling benefitted most companies Supply costs increased for New Reliability Support Agreement for Ginna nuclear plant costs, but were offset in Revenue Lower employee-related costs Net Income 1Q ‘16 v. 1Q ’15 (1)
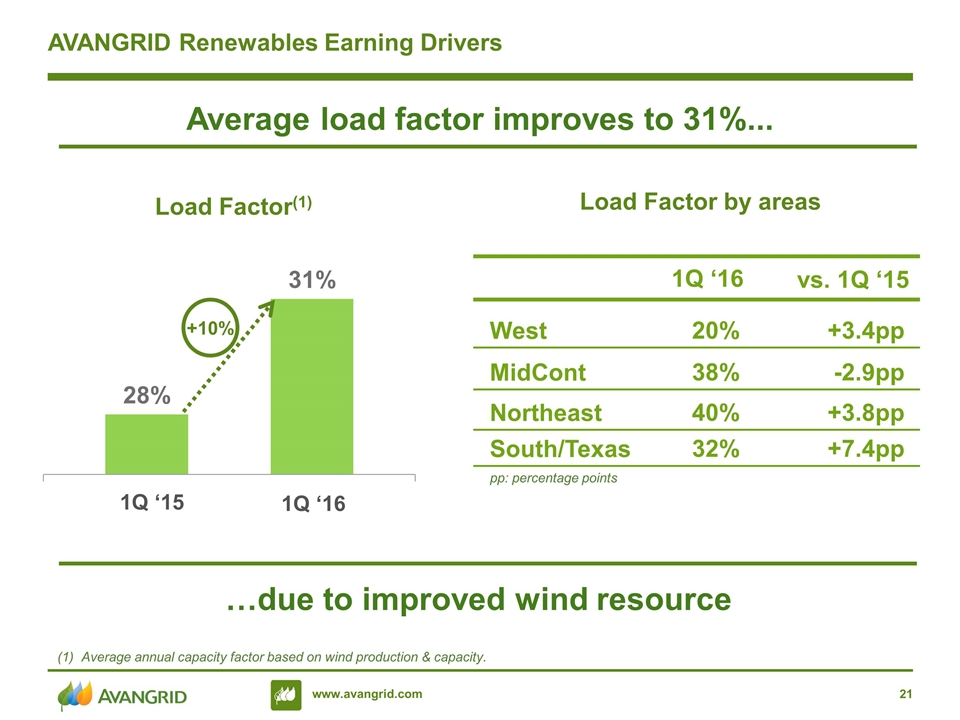
AVANGRID Renewables Earning Drivers Average load factor improves to 31%... Load Factor(1) 1Q ‘15 1Q ‘16 West 20% +3.4pp vs. 1Q ‘15 1Q ‘16 Load Factor by areas Average annual capacity factor based on wind production & capacity. MidCont 38% -2.9pp Northeast 40% +3.8pp South/Texas 32% +7.4pp …due to improved wind resource +10% pp: percentage points
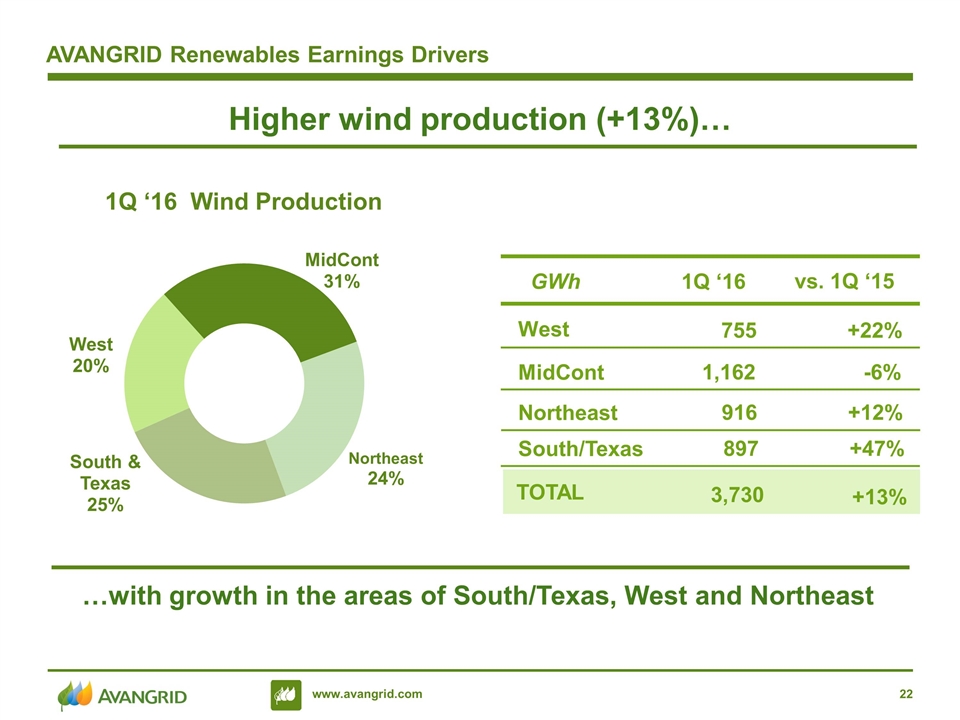
AVANGRID Renewables Earnings Drivers Higher wind production (+13%)… West 755 +22% vs. 1Q ‘15 1Q ‘16 MidCont 1,162 -6% Northeast 916 +12% South/Texas 897 +47% GWh 3,730 +13% TOTAL …with growth in the areas of South/Texas, West and Northeast 1Q ‘16 Wind Production
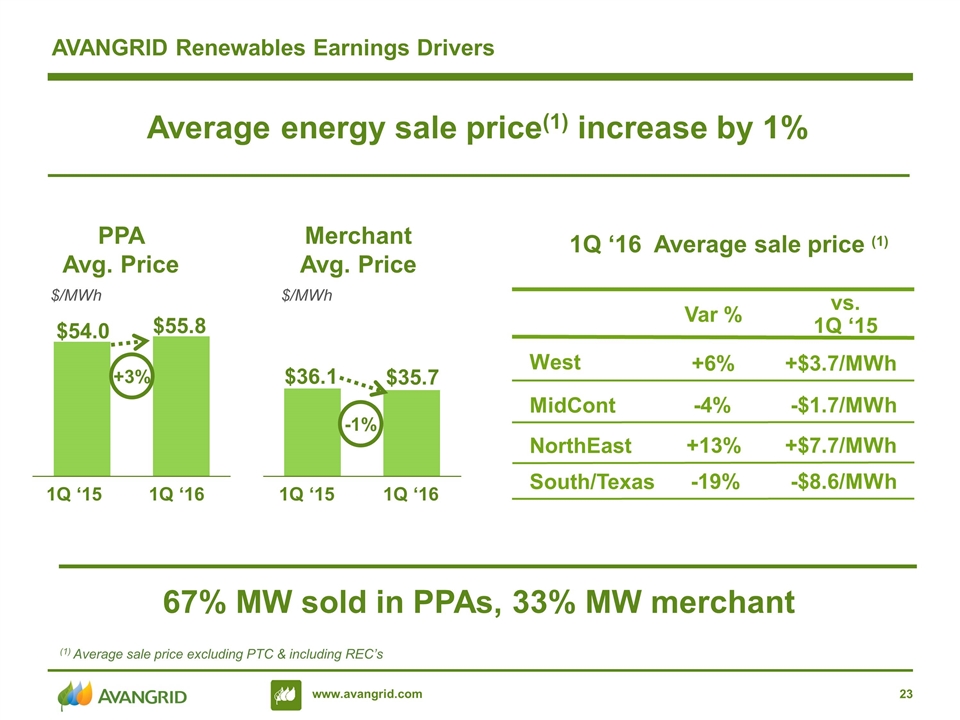
AVANGRID Renewables Earnings Drivers Average energy sale price(1) increase by 1% PPA Avg. Price Merchant Avg. Price $/MWh $/MWh 1Q ‘15 1Q ‘16 1Q ‘15 1Q ‘16 West +6% +$3.7/MWh vs. 1Q ‘15 Var % MidCont -4% -$1.7/MWh NorthEast +13% +$7.7/MWh South/Texas -19% -$8.6/MWh 1Q ‘16 Average sale price (1) (1) Average sale price excluding PTC & including REC’s 67% MW sold in PPAs, 33% MW merchant +3% -1% $36.1 $35.7 $54.0 $55.8
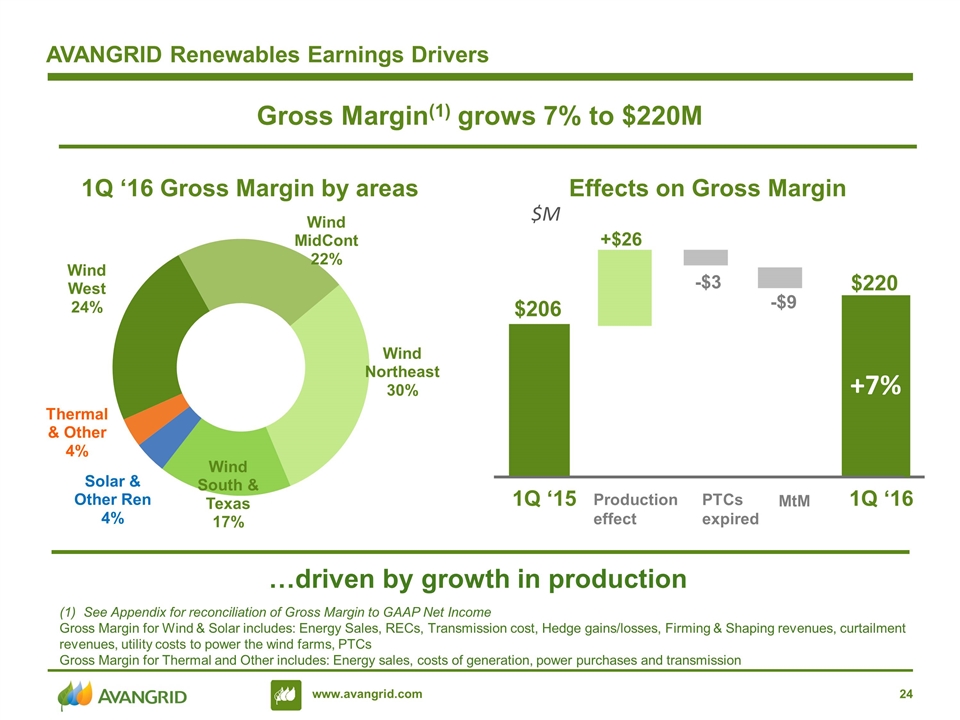
AVANGRID Renewables Earnings Drivers Gross Margin(1) grows 7% to $220M …driven by growth in production Effects on Gross Margin 1Q ‘16 Gross Margin by areas $M 1Q ‘16 PTCs expired 1Q ‘15 Production effect +7% $220 $206 +$26 -$3 -$9 MtM See Appendix for reconciliation of Gross Margin to GAAP Net Income Gross Margin for Wind & Solar includes: Energy Sales, RECs, Transmission cost, Hedge gains/losses, Firming & Shaping revenues, curtailment revenues, utility costs to power the wind farms, PTCs Gross Margin for Thermal and Other includes: Energy sales, costs of generation, power purchases and transmission
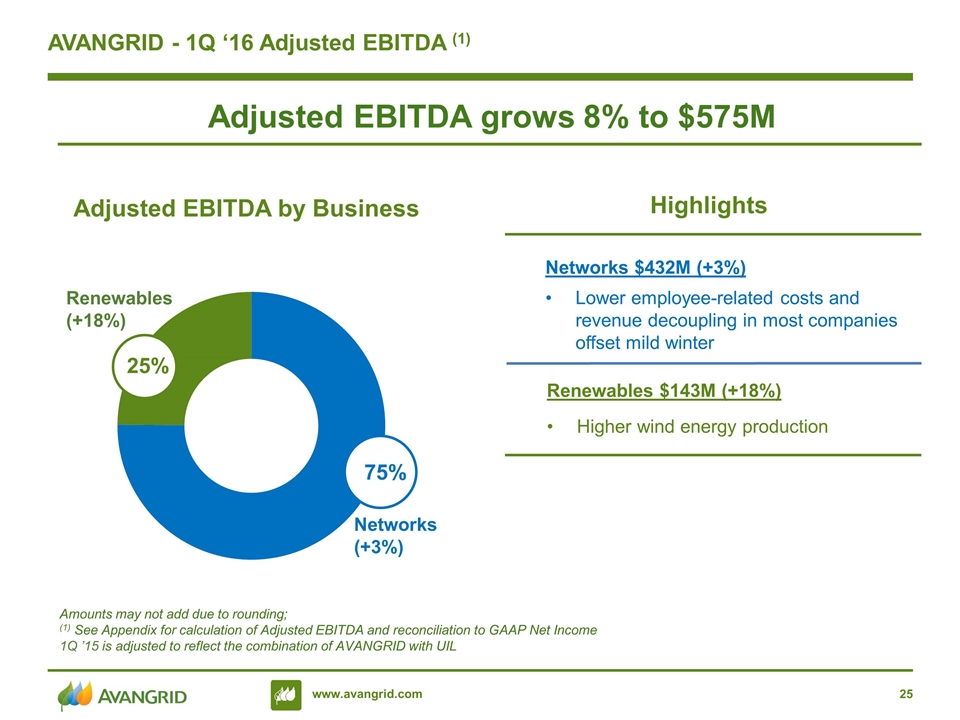
AVANGRID - 1Q ‘16 Adjusted EBITDA (1) Amounts may not add due to rounding; (1) See Appendix for calculation of Adjusted EBITDA and reconciliation to GAAP Net Income 1Q ’15 is adjusted to reflect the combination of AVANGRID with UIL Adjusted EBITDA by Business Renewables (+18%) Networks (+3%) 25% 75% Networks $432M (+3%) Lower employee-related costs and revenue decoupling in most companies offset mild winter Renewables $143M (+18%) Higher wind energy production Adjusted EBITDA grows 8% to $575M Highlights
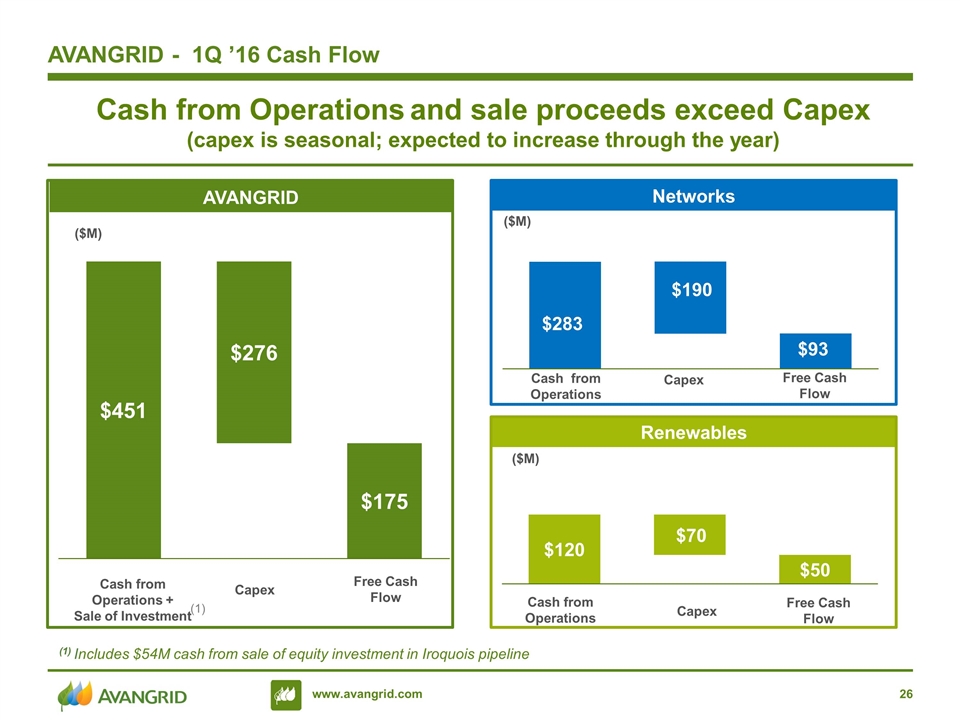
($M) Cash from Operations and sale proceeds exceed Capex (capex is seasonal; expected to increase through the year) Free Cash Flow AVANGRID - 1Q ’16 Cash Flow Capex Cash from Operations + Sale of Investment (1) Includes $54M cash from sale of equity investment in Iroquois pipeline (1) AVANGRID Networks Renewables Free Cash Flow Capex Cash from Operations Free Cash Flow Capex Cash from Operations ($M) ($M)
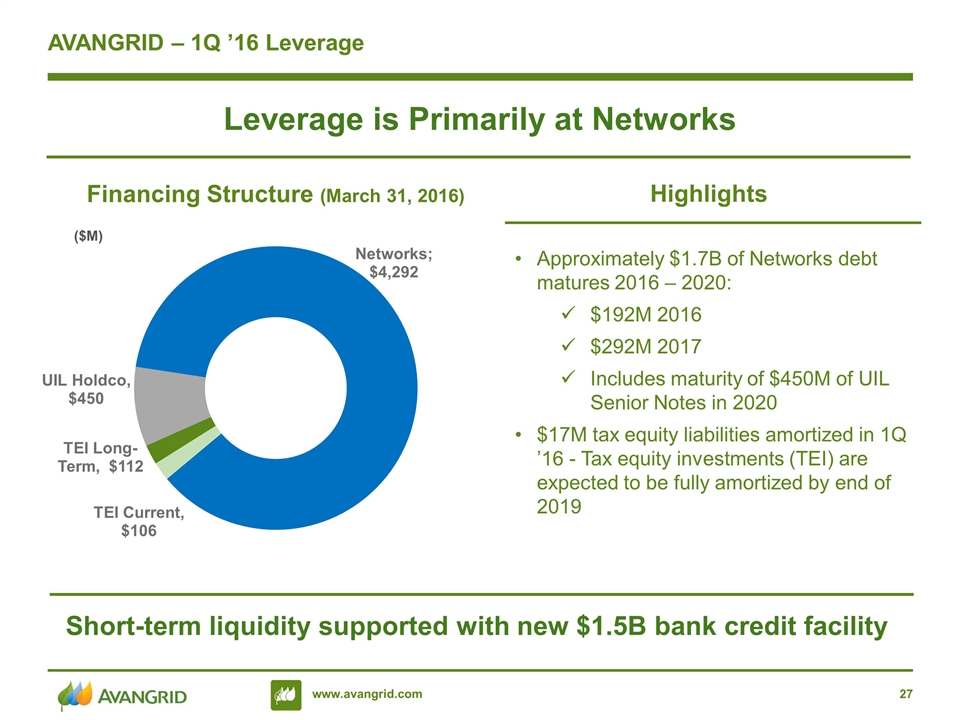
AVANGRID – 1Q ’16 Leverage Approximately $1.7B of Networks debt matures 2016 – 2020: $192M 2016 $292M 2017 Includes maturity of $450M of UIL Senior Notes in 2020 $17M tax equity liabilities amortized in 1Q ’16 - Tax equity investments (TEI) are expected to be fully amortized by end of 2019 Leverage is Primarily at Networks Short-term liquidity supported with new $1.5B bank credit facility Highlights ($M)
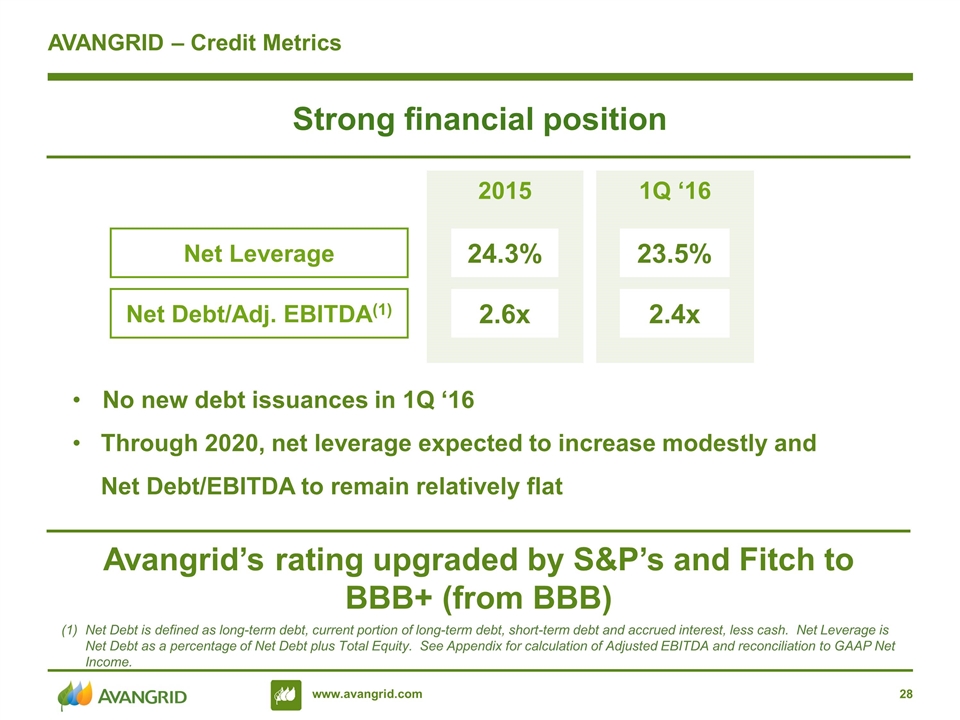
AVANGRID – Credit Metrics Net Debt is defined as long-term debt, current portion of long-term debt, short-term debt and accrued interest, less cash. Net Leverage is Net Debt as a percentage of Net Debt plus Total Equity. See Appendix for calculation of Adjusted EBITDA and reconciliation to GAAP Net Income. No new debt issuances in 1Q ‘16 Through 2020, net leverage expected to increase modestly and Net Debt/EBITDA to remain relatively flat Strong financial position 2015 Net Leverage 24.3% 1Q ‘16 Net Debt/Adj. EBITDA(1) 2.6x 23.5% 2.4x Avangrid’s rating upgraded by S&P’s and Fitch to BBB+ (from BBB)
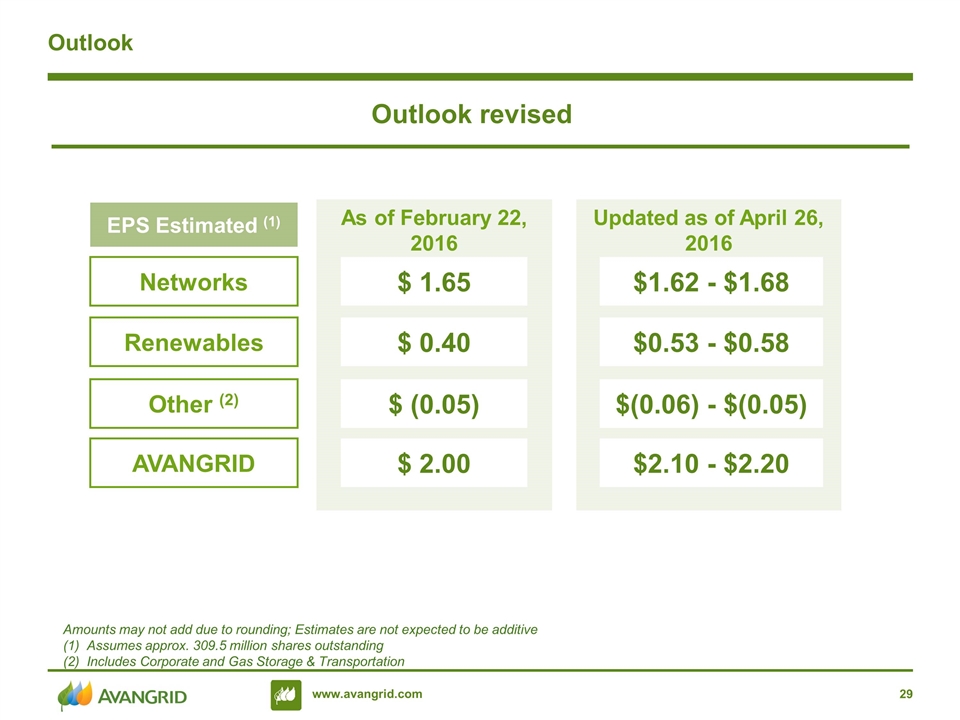
Outlook Amounts may not add due to rounding; Estimates are not expected to be additive (1) Assumes approx. 309.5 million shares outstanding (2) Includes Corporate and Gas Storage & Transportation Outlook revised As of February 22, 2016 Networks EPS Estimated (1) $ 1.65 Updated as of April 26, 2016 Renewables $ 0.40 Other (2) $ (0.05) AVANGRID $ 2.00 $1.62 - $1.68 $0.53 - $0.58 $(0.06) - $(0.05) $2.10 - $2.20
Appendix
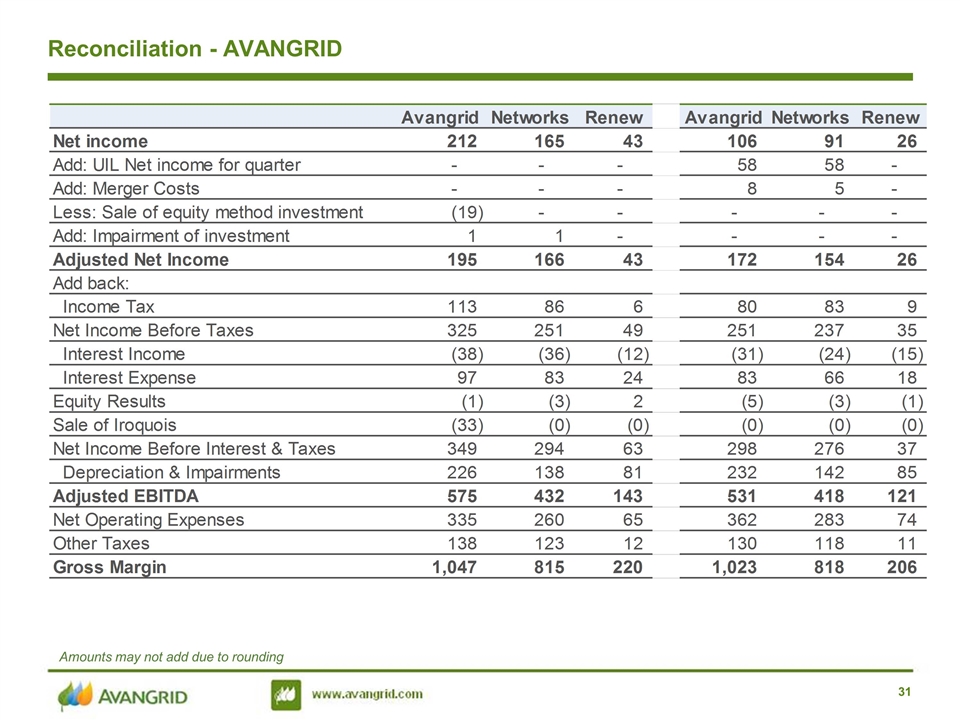
Reconciliation - AVANGRID Amounts may not add due to rounding 31
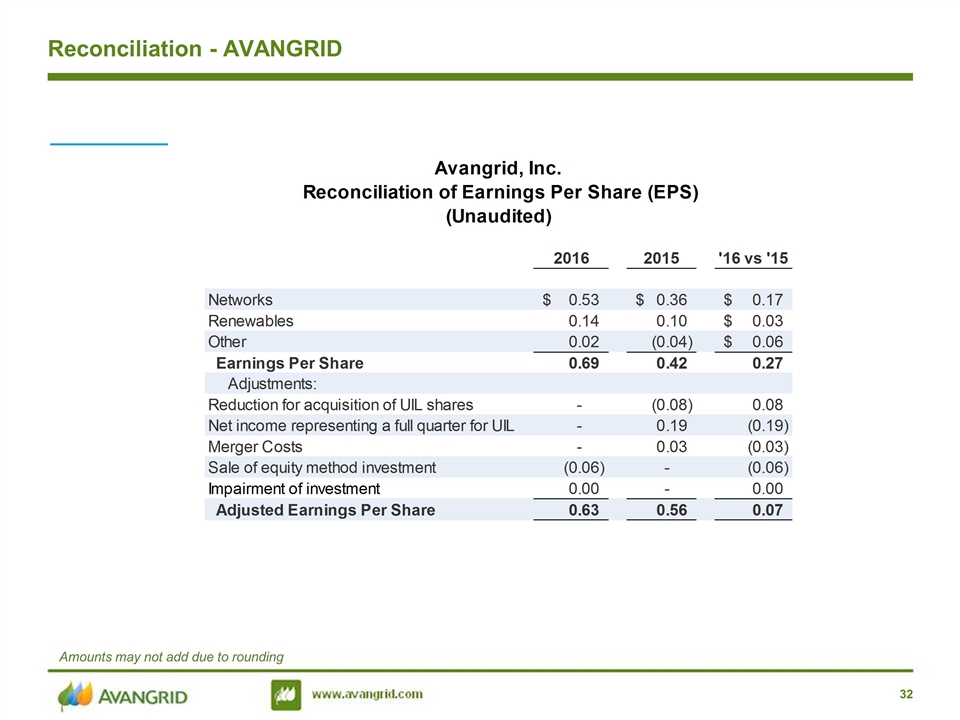
Reconciliation - AVANGRID Amounts may not add due to rounding 32
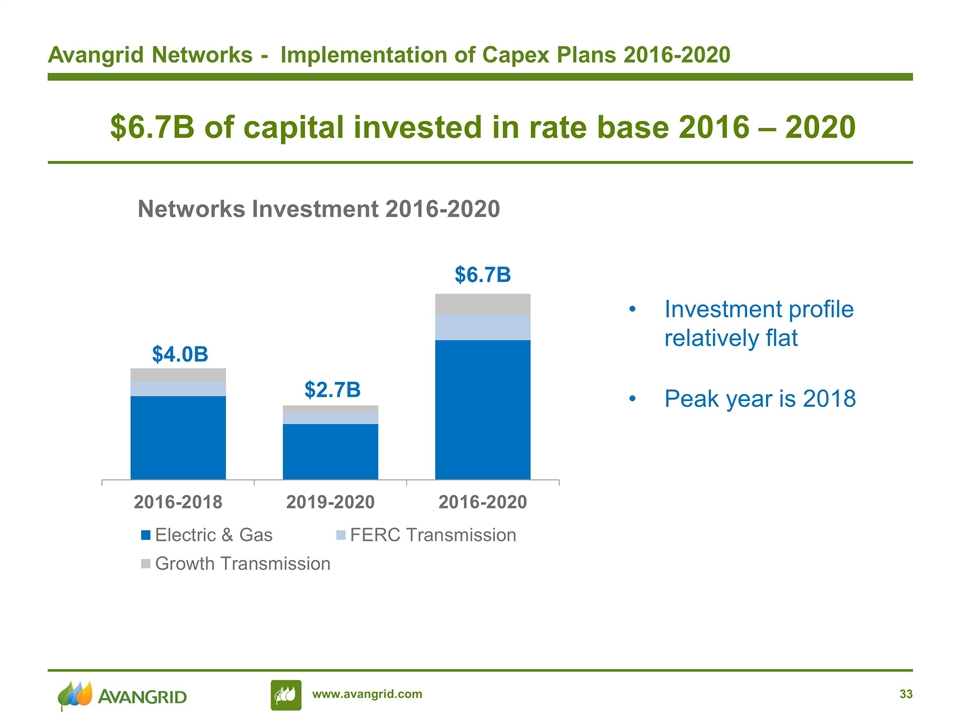
$6.7B of capital invested in rate base 2016 – 2020 Avangrid Networks - Implementation of Capex Plans 2016-2020 Investment profile relatively flat Peak year is 2018 $4.0B $2.7B $6.7B Networks Investment 2016-2020
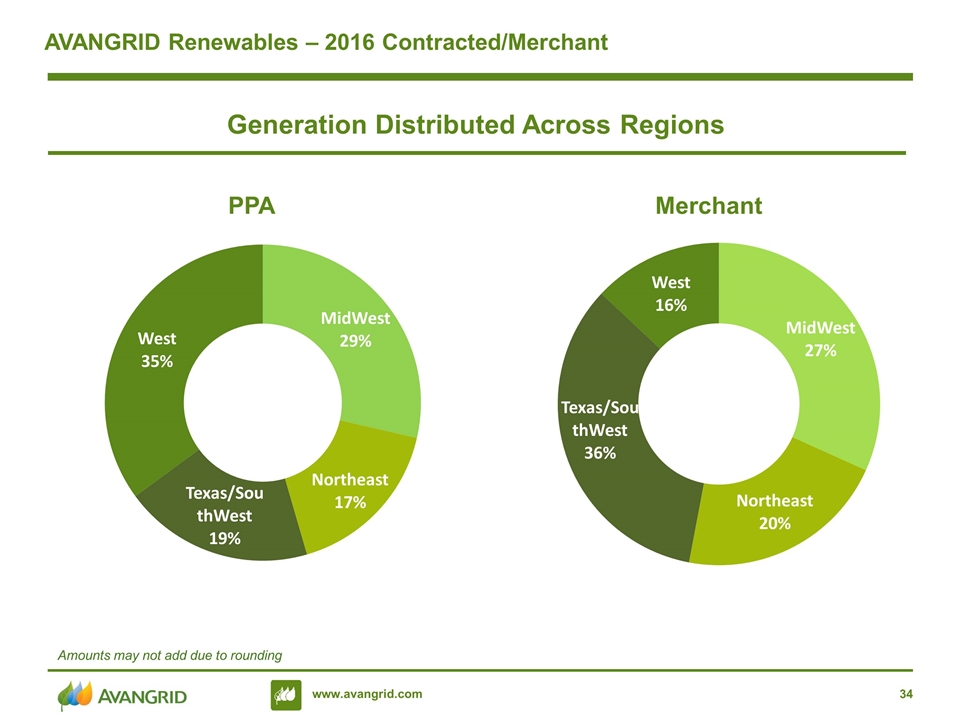
AVANGRID Renewables – 2016 Contracted/Merchant Generation Distributed Across Regions PPA Merchant Amounts may not add due to rounding
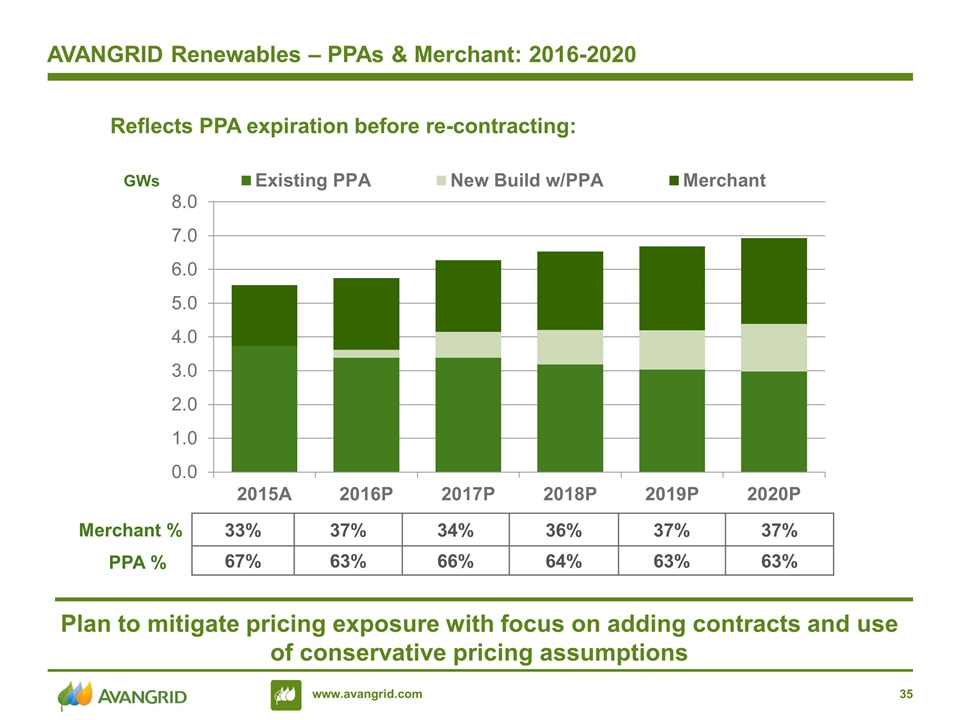
AVANGRID Renewables – PPAs & Merchant: 2016-2020 GWs 33% 37% 34% 36% 37% 37% 67% 63% 66% 64% 63% 63% Merchant % PPA % Plan to mitigate pricing exposure with focus on adding contracts and use of conservative pricing assumptions Reflects PPA expiration before re-contracting:
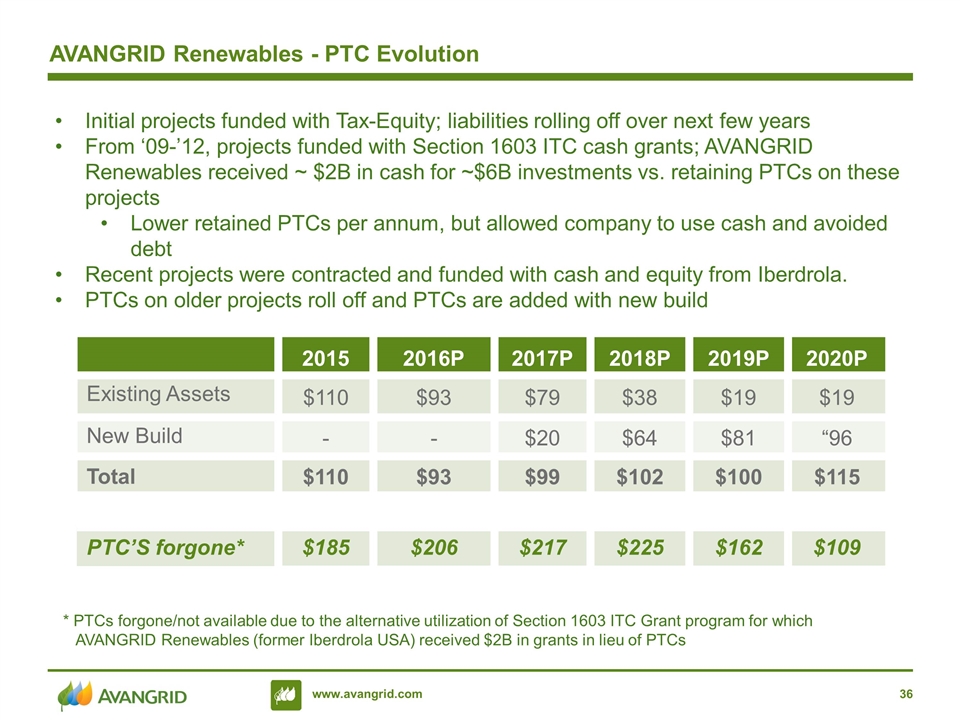
AVANGRID Renewables - PTC Evolution 2015 2016P 2017P 2018P 2019P 2020P Existing Assets $110 $93 $79 $38 $19 $19 New Build - - $20 $64 $81 “96 Total $110 $93 $99 $102 $100 $115 PTC’S forgone* $185 $206 $217 $225 $162 $109 * PTCs forgone/not available due to the alternative utilization of Section 1603 ITC Grant program for which AVANGRID Renewables (former Iberdrola USA) received $2B in grants in lieu of PTCs $ Millions Initial projects funded with Tax-Equity; liabilities rolling off over next few years From ‘09-’12, projects funded with Section 1603 ITC cash grants; AVANGRID Renewables received ~ $2B in cash for ~$6B investments vs. retaining PTCs on these projects Lower retained PTCs per annum, but allowed company to use cash and avoided debt Recent projects were contracted and funded with cash and equity from Iberdrola. PTCs on older projects roll off and PTCs are added with new build
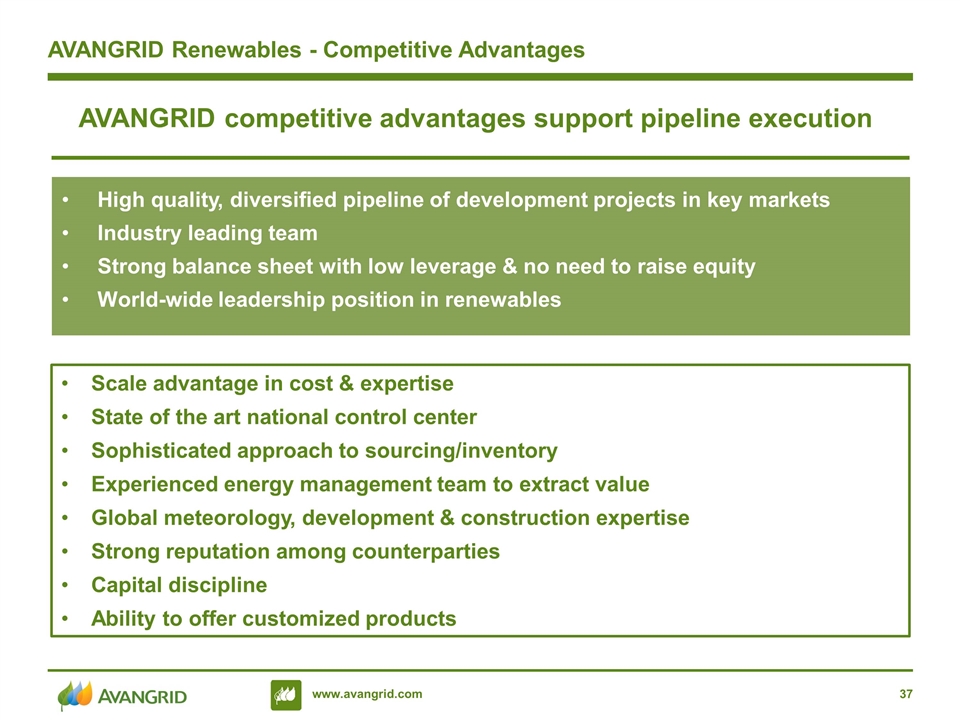
High quality, diversified pipeline of development projects in key markets Industry leading team Strong balance sheet with low leverage & no need to raise equity World-wide leadership position in renewables AVANGRID competitive advantages support pipeline execution AVANGRID Renewables - Competitive Advantages Scale advantage in cost & expertise State of the art national control center Sophisticated approach to sourcing/inventory Experienced energy management team to extract value Global meteorology, development & construction expertise Strong reputation among counterparties Capital discipline Ability to offer customized products


