2Q 2016 Earnings Presentation July 19, 2016 EXHIBIT 99.2
Legal Notices FORWARD LOOKING STATEMENTS Certain statements in this presentation may relate to our future business and financial performance and future events or developments involving us and our subsidiaries that are not purely historical and may constitute “forward-looking statements” within the meaning of the Private Securities Litigation Reform Act of 1995. Forward-looking statements may be identified by the use of forward-looking terms such as “may,” “will,” “should,” “can,” “expects,” “believes,” “anticipates,” “intends,” “plans,” “estimates,” “projects,” “assumes,” “guides,” “targets,” “forecasts,” “is confident that” and “seeks” or the negative of such terms or other variations on such terms or comparable terminology. Such forward-looking statements include, but are not limited to, statements about our plans, objectives and intentions, outlooks or expectations for earnings, revenues, expenses or other future financial or business performance, strategies or expectations, or the impact of legal or regulatory matters on our business, results of operations or financial condition. Such statements are based upon the current beliefs and expectations of our management and are subject to significant risks and uncertainties that could cause actual outcomes and results to differ materially. Important factors that could cause actual results to differ materially from those indicated by such forward-looking statements include, without limitation, the risks and uncertainties set forth under the section entitled “Risk Factors” and “Management’s Discussion and Analysis of Financial Condition and Results of Operations” in our Annual Report on Form 10-K for the year ended December 31, 2015 and our Quarterly Report on Form 10-Q for the three months ended March 31, 2016, which are on file with the Securities and Exchange Commission (SEC) and available on our investor relations website at www.avangrid.com and on the SEC website at www.sec.gov. Additional information will also be set forth in subsequent filings with the SEC. You should consider these factors carefully in evaluating for-ward looking statements. Should one or more of these risks or uncertainties materialize, or should any of the underlying assumptions prove incorrect, actual results may vary in material respects from those expressed or implied by these forward-looking statements. You should not place undue reliance on these forward-looking statements. We do not undertake any obligation to update or revise any forward-looking statements to reflect events or circumstances after the date of this presentation whether as a result of new information, future events or otherwise, except as may be required under applicable securities laws.
Legal Notices Use of Non-GAAP Measures AVANGRID believes that a breakdown presented on a net income and per share basis by line of business is useful in understanding the change in the results of operations of AVANGRID’s lines of business from one reporting period to another and in evaluating the actual and projected financial performance and contribution of AVANGRID’s lines of businesses. Adjusted earnings per share (EPS) by business is a non-GAAP (not determined using generally accepted accounting principles) measure that is calculated by taking the pre-tax amounts determined in accordance with GAAP of each line of business, and applying the effective statutory federal and state tax rate and then dividing the results by the average number of diluted shares of AVANGRID’s common stock outstanding for the periods presented. Any such amounts provided are provided for informational purposes only and are not intended to be used to calculate "Pro-forma" amounts. AVANGRID also believes presenting earnings with certain adjustments, including, without limitation, adjustments for the combination with UIL Holdings Corporation (“UIL”), the impairment of investments, the sale of certain investments, tax credits, depreciation and amortization, and regulatory amounts is useful in understanding and evaluating actual and projected financial performance of AVANGRID and to more fully compare and explain our results without including such items. Lastly, AVANGRID, believes that presenting certain non-GAAP metrics (as defined in the Appendix) is useful because such measures can be used to analyze and compare profitability between companies and industries because it eliminates the impact of financing and certain non-cash charges. The use of non-GAAP financial measures is not intended to be considered in isolation or as a substitute for, or superior to, AVANGRID’s U.S. GAAP financial information, and investors are cautioned that the non-GAAP financial measures are limited in their usefulness, may be unique to AVANGRID, should be considered only as a supplement to AVANGRID’s U.S. GAAP financial measures. The non-GAAP financial measures may not be comparable to other similarly titled measures of other companies and have limitations as analytical tools. About AVANGRID Avangrid, Inc. (NYSE: AGR) is a diversified energy and utility company with more than $30 billion in assets and operations in 25 states. The company operates regulated utilities and electricity generation through two primary lines of business. Avangrid Networks includes eight electric and natural gas utilities, serving 3.1 million customers in New York and New England. Avangrid Renewables operates approximately 6.6 gigawatts of electricity capacity, primarily through wind power, in states across the United States. AVANGRID employs approximately 7,000 people. The company was formed through a merger between Iberdrola USA, Inc. and UIL Holdings Corporation in 2015. Iberdrola S.A. (Madrid: IBE), a worldwide leader in the energy industry, owns 81.5% of AVANGRID. For more information, visit www.avangrid.com.
Presenters James P. TorgersonChief Executive Officer Richard J. NicholasChief Financial Officer AVANGRID 2Q ‘16 Earnings IR Contacts: Patricia Cosgel Vice President Investor and Shareholder Relations Michelle Hanson Manager Investor Relations Carlota Lopez Manager Investor Relations Investors@AVANGRID.com
AVANGRID Quarterly Update 2Q ’16 & YTD ‘16
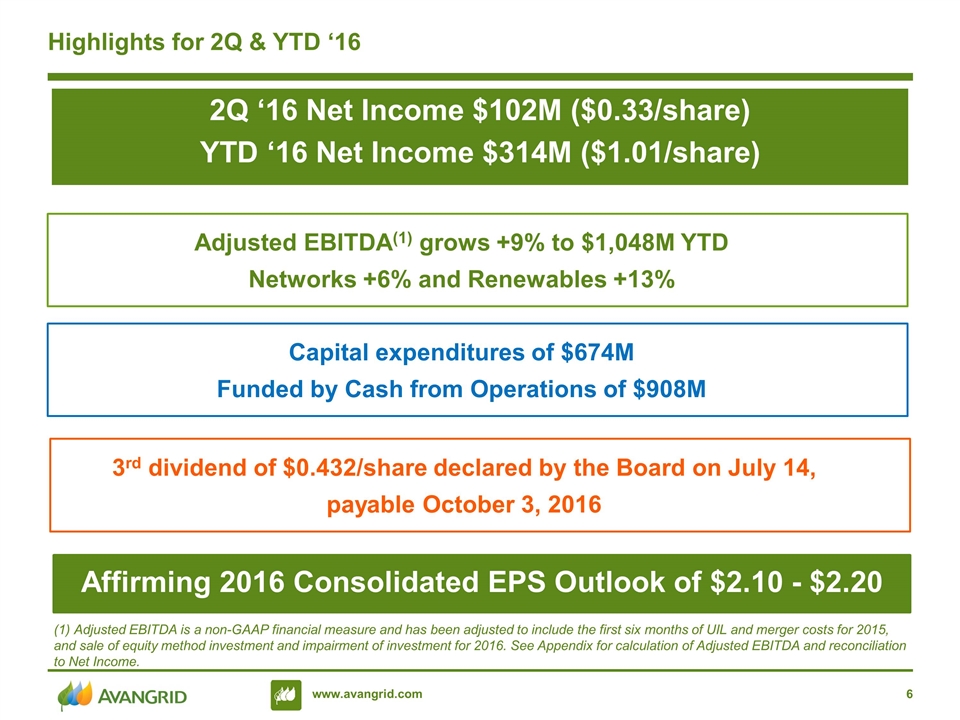
Highlights for 2Q & YTD ‘16 (1) Adjusted EBITDA is a non-GAAP financial measure and has been adjusted to include the first six months of UIL and merger costs for 2015, and sale of equity method investment and impairment of investment for 2016. See Appendix for calculation of Adjusted EBITDA and reconciliation to Net Income. Adjusted EBITDA(1) grows +9% to $1,048M YTD Networks +6% and Renewables +13% Capital expenditures of $674M Funded by Cash from Operations of $908M 3rd dividend of $0.432/share declared by the Board on July 14, payable October 3, 2016 Affirming 2016 Consolidated EPS Outlook of $2.10 - $2.20 2Q ‘16 Net Income $102M ($0.33/share) YTD ‘16 Net Income $314M ($1.01/share)
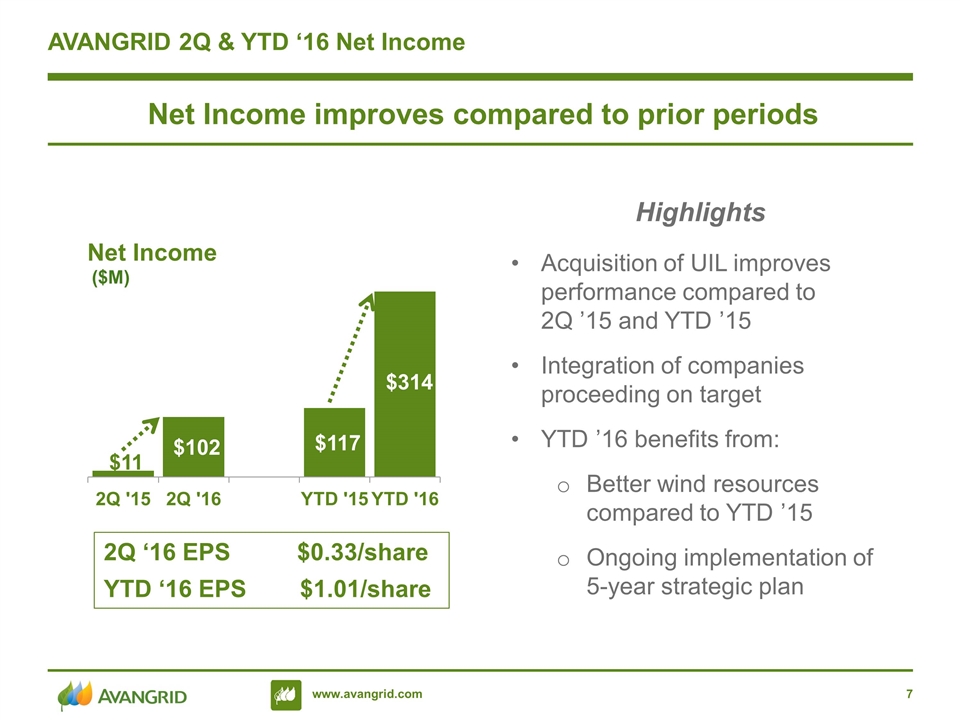
AVANGRID 2Q & YTD ‘16 Net Income Acquisition of UIL improves performance compared to 2Q ’15 and YTD ’15 Integration of companies proceeding on target YTD ’16 benefits from: Better wind resources compared to YTD ’15 Ongoing implementation of 5-year strategic plan Highlights ($M) Net Income improves compared to prior periods 2Q ‘16 EPS $0.33/share YTD ‘16 EPS $1.01/share
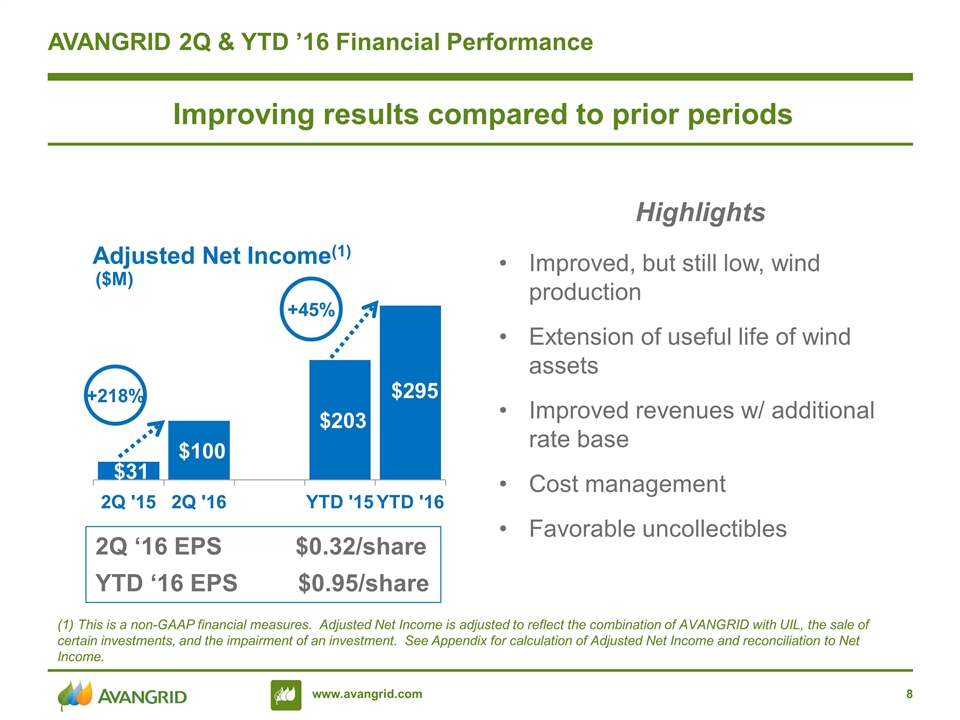
AVANGRID 2Q & YTD ’16 Financial Performance (1) This is a non-GAAP financial measures. Adjusted Net Income is adjusted to reflect the combination of AVANGRID with UIL, the sale of certain investments, and the impairment of an investment. See Appendix for calculation of Adjusted Net Income and reconciliation to Net Income. Improved, but still low, wind production Extension of useful life of wind assets Improved revenues w/ additional rate base Cost management Favorable uncollectibles Highlights +218% +45% ($M) Improving results compared to prior periods 2Q ‘16 EPS $0.32/share YTD ‘16 EPS $0.95/share
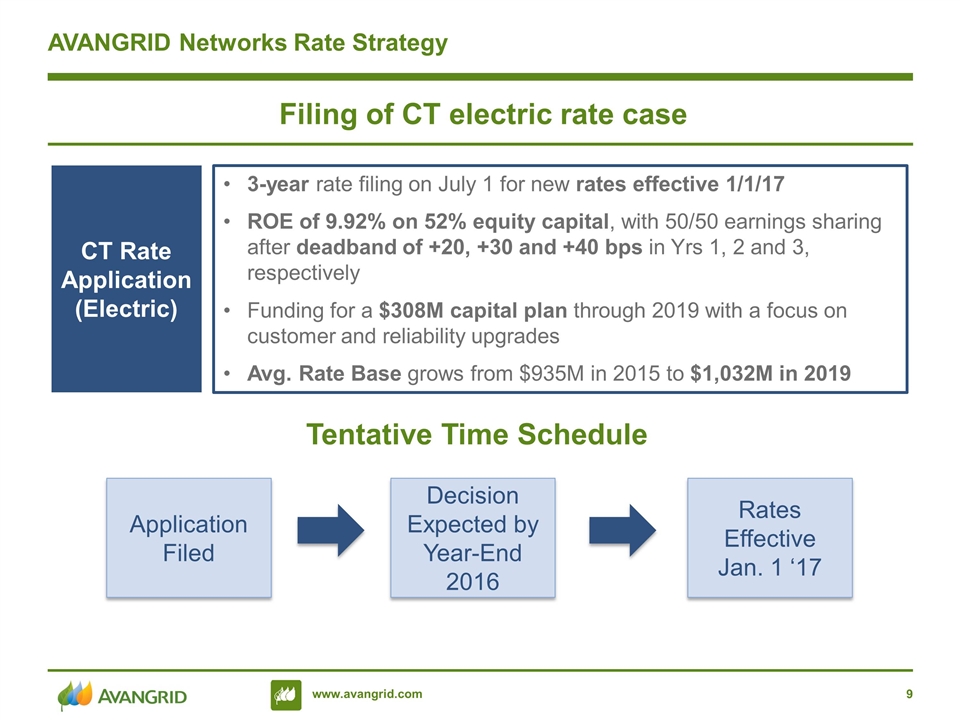
3-year rate filing on July 1 for new rates effective 1/1/17 ROE of 9.92% on 52% equity capital, with 50/50 earnings sharing after deadband of +20, +30 and +40 bps in Yrs 1, 2 and 3, respectively Funding for a $308M capital plan through 2019 with a focus on customer and reliability upgrades Avg. Rate Base grows from $935M in 2015 to $1,032M in 2019 AVANGRID Networks Rate Strategy CT Rate Application (Electric) Filing of CT electric rate case Application Filed Decision Expected by Year-End 2016 Rates Effective Jan. 1 ‘17 Tentative Time Schedule
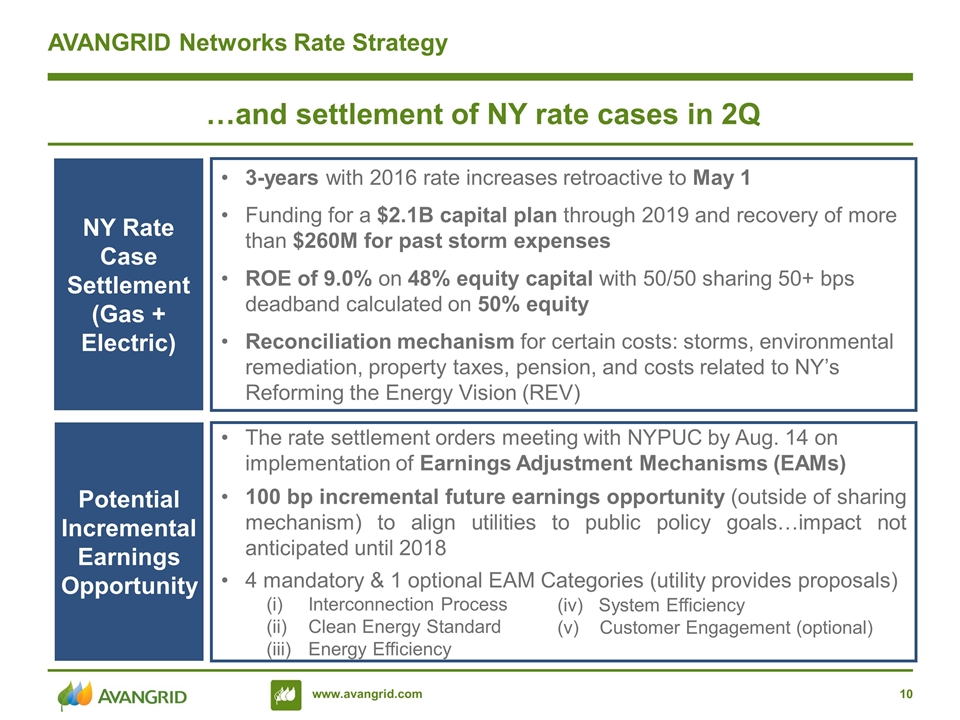
AVANGRID Networks Rate Strategy NY Rate Case Settlement (Gas + Electric) …and settlement of NY rate cases in 2Q The rate settlement orders meeting with NYPUC by Aug. 14 on implementation of Earnings Adjustment Mechanisms (EAMs) 100 bp incremental future earnings opportunity (outside of sharing mechanism) to align utilities to public policy goals…impact not anticipated until 2018 4 mandatory & 1 optional EAM Categories (utility provides proposals) Interconnection Process Clean Energy Standard Energy Efficiency (iv) System Efficiency (v) Customer Engagement (optional) 3-years with 2016 rate increases retroactive to May 1 Funding for a $2.1B capital plan through 2019 and recovery of more than $260M for past storm expenses ROE of 9.0% on 48% equity capital with 50/50 sharing 50+ bps deadband calculated on 50% equity Reconciliation mechanism for certain costs: storms, environmental remediation, property taxes, pension, and costs related to NY’s Reforming the Energy Vision (REV) Potential Incremental Earnings Opportunity
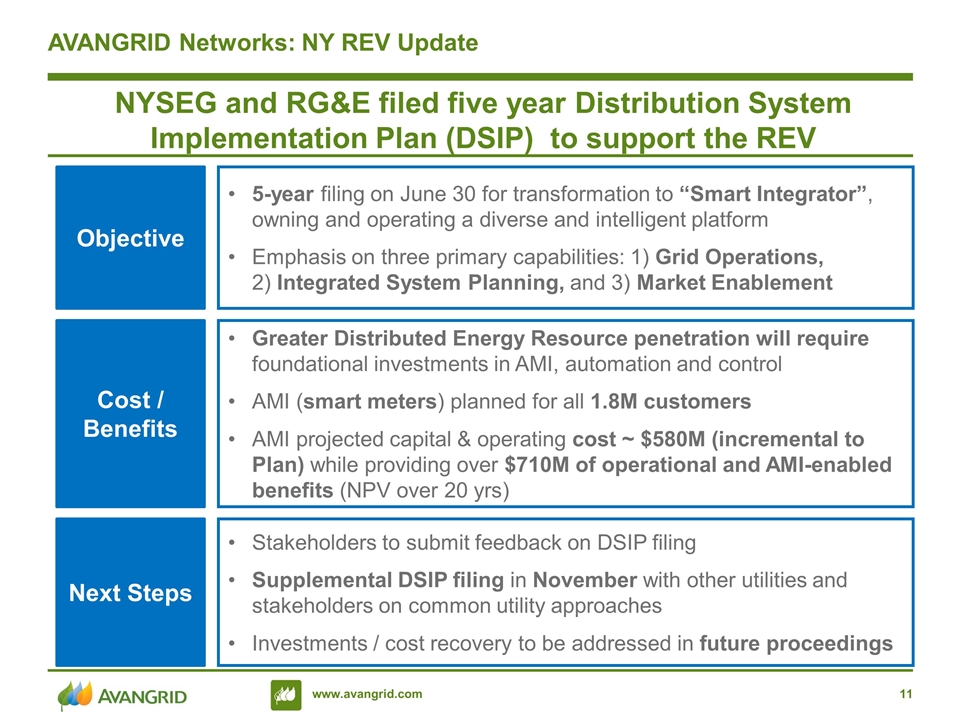
5-year filing on June 30 for transformation to “Smart Integrator”, owning and operating a diverse and intelligent platform Emphasis on three primary capabilities: 1) Grid Operations, 2) Integrated System Planning, and 3) Market Enablement AVANGRID Networks: NY REV Update Objective Greater Distributed Energy Resource penetration will require foundational investments in AMI, automation and control AMI (smart meters) planned for all 1.8M customers AMI projected capital & operating cost ~ $580M (incremental to Plan) while providing over $710M of operational and AMI-enabled benefits (NPV over 20 yrs) Cost / Benefits Stakeholders to submit feedback on DSIP filing Supplemental DSIP filing in November with other utilities and stakeholders on common utility approaches Investments / cost recovery to be addressed in future proceedings Next Steps NYSEG and RG&E filed five year Distribution System Implementation Plan (DSIP) to support the REV
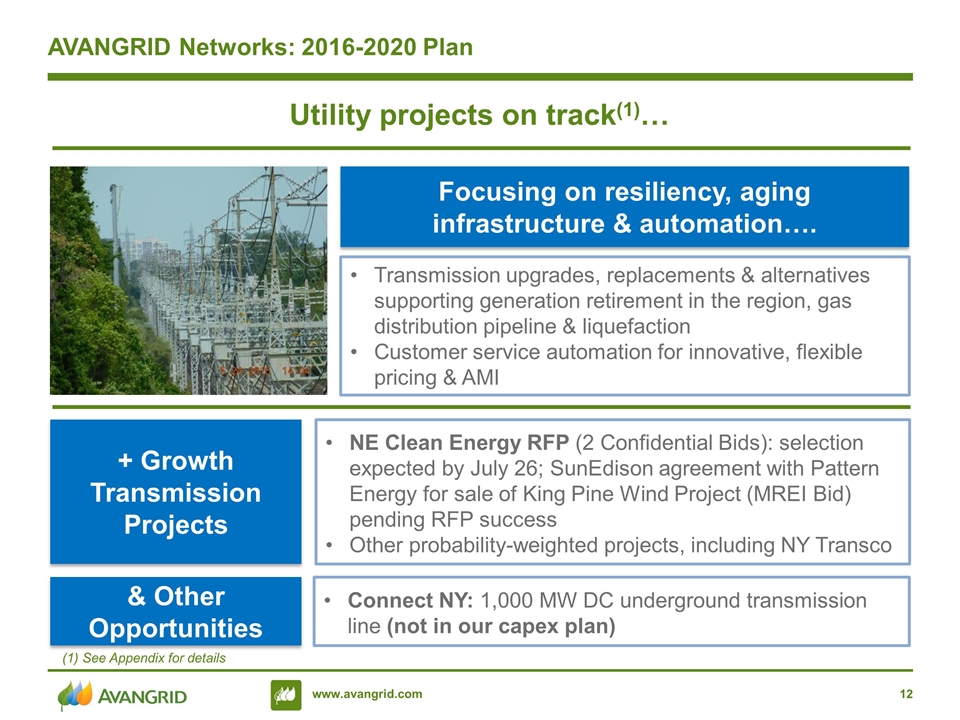
AVANGRID Networks: 2016-2020 Plan Utility projects on track(1)… Focusing on resiliency, aging infrastructure & automation…. Transmission upgrades, replacements & alternatives supporting generation retirement in the region, gas distribution pipeline & liquefaction Customer service automation for innovative, flexible pricing & AMI + Growth Transmission Projects NE Clean Energy RFP (2 Confidential Bids): selection expected by July 26; SunEdison agreement with Pattern Energy for sale of King Pine Wind Project (MREI Bid) pending RFP success Other probability-weighted projects, including NY Transco & Other Opportunities Connect NY: 1,000 MW DC underground transmission line (not in our capex plan) (1) See Appendix for details

AVANGRID Current Networks Utility Projects Metro-North RR Corridor (FERC T) ~ $175M(1) (2016-2020) Increases capacity and reliability of the transmission lines along the Metro-North corridor with investments such as Baird to Congress 115kV reconductoring Rocky Hill Liquefaction Replacement (Gas D) ~$40M (2016-2018) New 6M cf/day liquefier and purification system for economic peak load servicing RG&E Rochester Area Reliability Project (RARP) (NY T) ~$290M (2016-2020) 23 miles of 115kV, 1.9 miles of 345kV & substation Projects in 5 year plan include electric, gas distribution & FERC transmission, such as… CT MEPCO Section 388 Rebuild ~$80M (Begin construction 2017, in-service early 2020) Rebuild 46-yr old structures on 50-mile 345kV circuit; All state approvals received, present to ISO-NE Planning Committee in August Lewiston Loop ~ $70M (Expected in service 2Q ‘18) Originally part of MPRP Construction of 2 substations, 11.3 miles of 345kV and 1.4 miles of 115kV Western NY (Public policy T need; final selection expected early in 2017) NYISO completed sufficiency test, project advances to cost assessment phase …as well as Growth Transmission opportunities CT NY NY ME ME (1) Revised from $150M
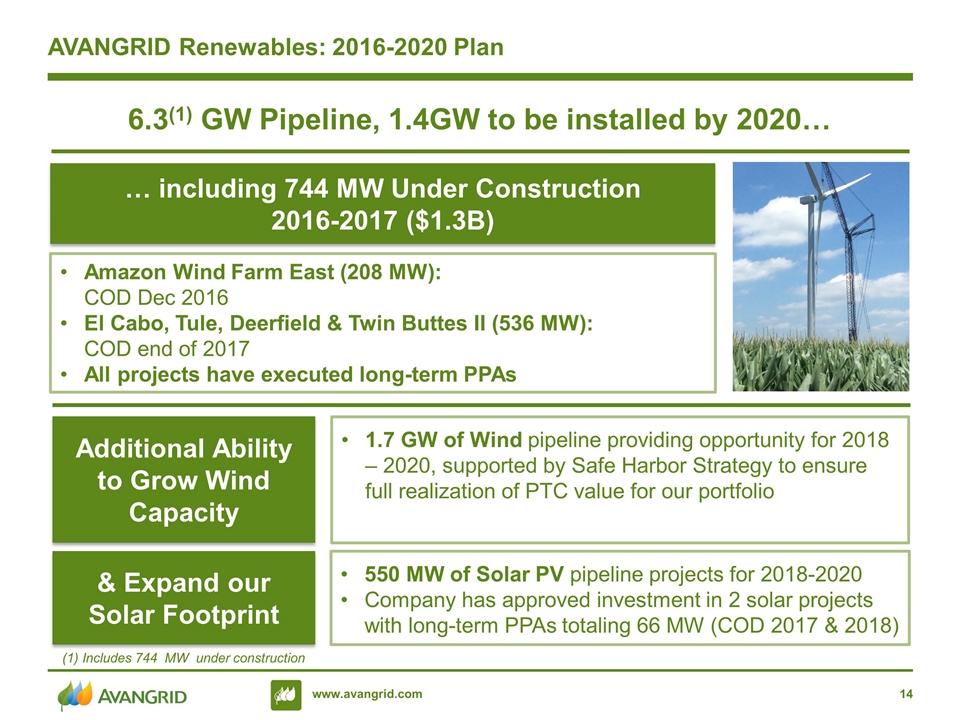
AVANGRID Renewables: 2016-2020 Plan 6.3(1) GW Pipeline, 1.4GW to be installed by 2020… … including 744 MW Under Construction 2016-2017 ($1.3B) Amazon Wind Farm East (208 MW): COD Dec 2016 El Cabo, Tule, Deerfield & Twin Buttes II (536 MW): COD end of 2017 All projects have executed long-term PPAs 1.7 GW of Wind pipeline providing opportunity for 2018 – 2020, supported by Safe Harbor Strategy to ensure full realization of PTC value for our portfolio & Expand our Solar Footprint 550 MW of Solar PV pipeline projects for 2018-2020 Company has approved investment in 2 solar projects with long-term PPAs totaling 66 MW (COD 2017 & 2018) Additional Ability to Grow Wind Capacity (1) Includes 744 MW under construction
AVANGRID Renewables Counterparties Successfully executing PPAs off of existing wind farms at attractive prices to reduce merchant exposure Executed nearly 100 MW of new and extended PPAs in 2016 to date AGR to supply 100% renewable energy to meet global C&I world headquarters for 10 years Variable MW, increasing over contract term (equivalent to ~70 MW) Increases PPAs by ~ 120 bps by 2017 Contract can be served with any of 3 merchant projects in the Northwest Extending PPAs with Traditional Utilities Global C&I Customer has selected AGR to supply Renewable energy
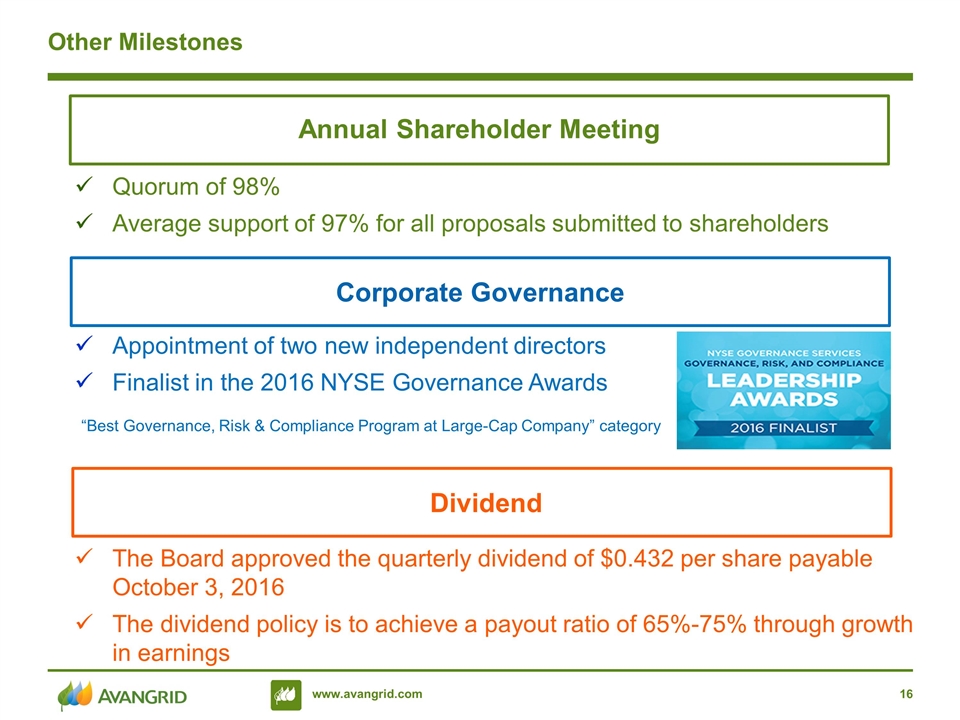
Other Milestones Annual Shareholder Meeting Corporate Governance Dividend Quorum of 98% Average support of 97% for all proposals submitted to shareholders Appointment of two new independent directors Finalist in the 2016 NYSE Governance Awards “Best Governance, Risk & Compliance Program at Large-Cap Company” category The Board approved the quarterly dividend of $0.432 per share payable October 3, 2016 The dividend policy is to achieve a payout ratio of 65%-75% through growth in earnings
Plan Execution Focused on our Growth Objectives Our priority is Executing on the Plan CAPEX plan on track Growing our regulated and contracted assets Affirming 2016 Consolidated EPS Outlook of $2.10 - $2.20 Integration plan in progress Good performance YTD’ 16 gives visibility for remaining year
2Q & YTD ‘16 AVANGRID 2Q & YTD ‘16 Financial Updates
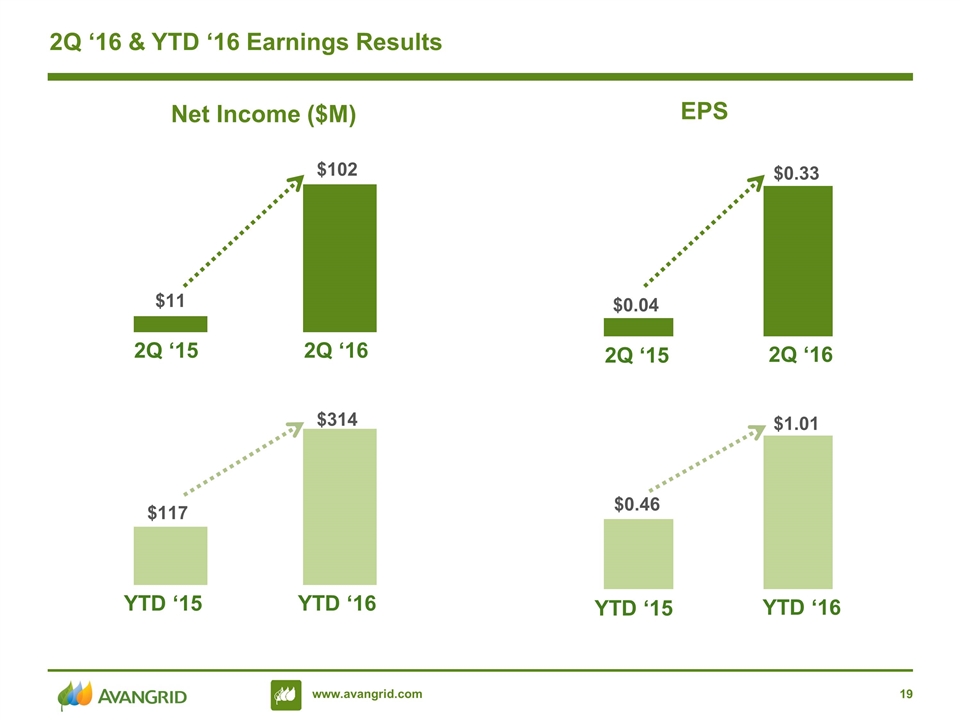
2Q ‘16 & YTD ‘16 Earnings Results 2Q ‘15 2Q ‘16 2Q ‘15 2Q ‘16 Net Income ($M) EPS YTD ‘15 YTD ‘16 YTD ‘15 YTD ‘16 $0.33
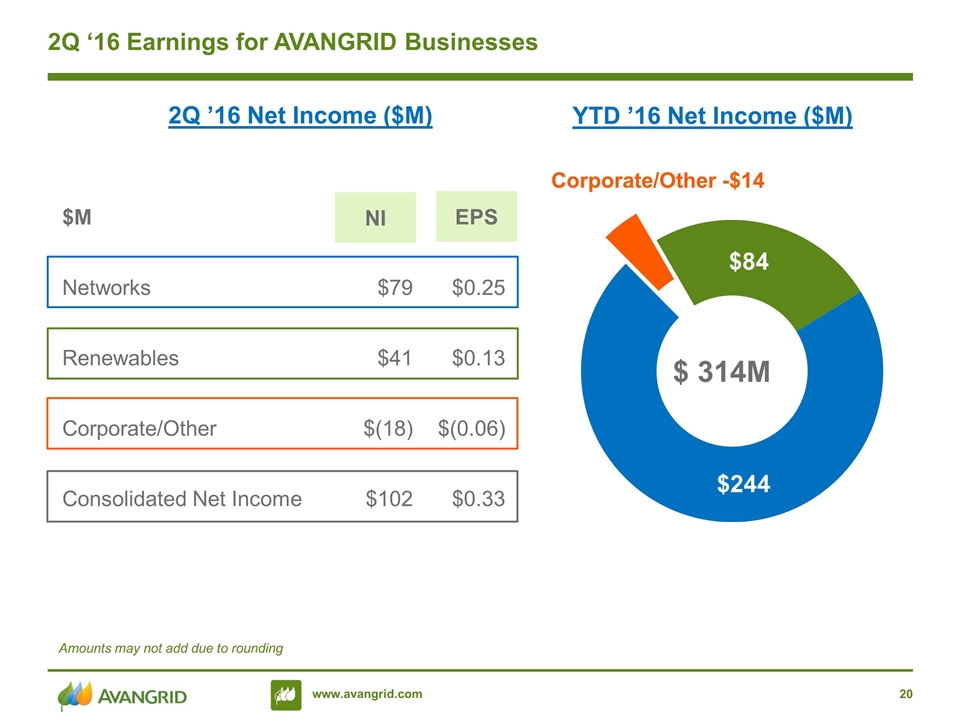
$M NI EPS Networks $79 $0.25 Renewables $41 $0.13 Corporate/Other $(18) $(0.06) Consolidated Net Income $102 $0.33 NI EPS 2Q ‘16 Earnings for AVANGRID Businesses Amounts may not add due to rounding Corporate/Other -$14 YTD ’16 Net Income ($M) 2Q ’16 Net Income ($M)
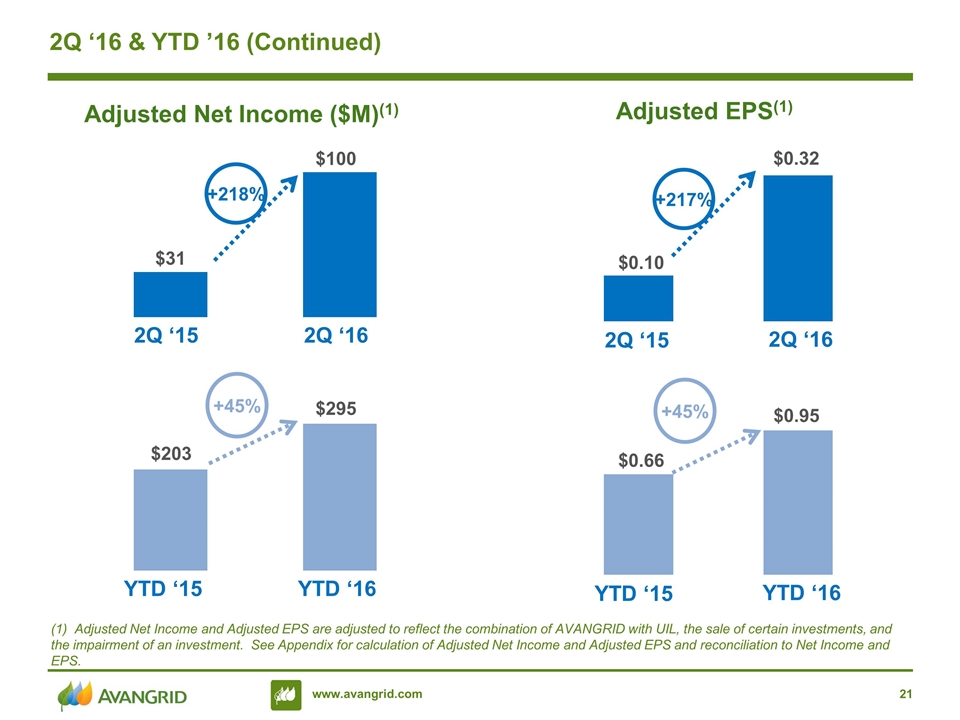
2Q ‘16 & YTD ’16 (Continued) 2Q ‘15 2Q ‘16 2Q ‘15 2Q ‘16 Adjusted Net Income ($M)(1) Adjusted EPS(1) YTD ‘15 YTD ‘16 YTD ‘15 YTD ‘16 (1) Adjusted Net Income and Adjusted EPS are adjusted to reflect the combination of AVANGRID with UIL, the sale of certain investments, and the impairment of an investment. See Appendix for calculation of Adjusted Net Income and Adjusted EPS and reconciliation to Net Income and EPS. +218% +45% +217% +45%
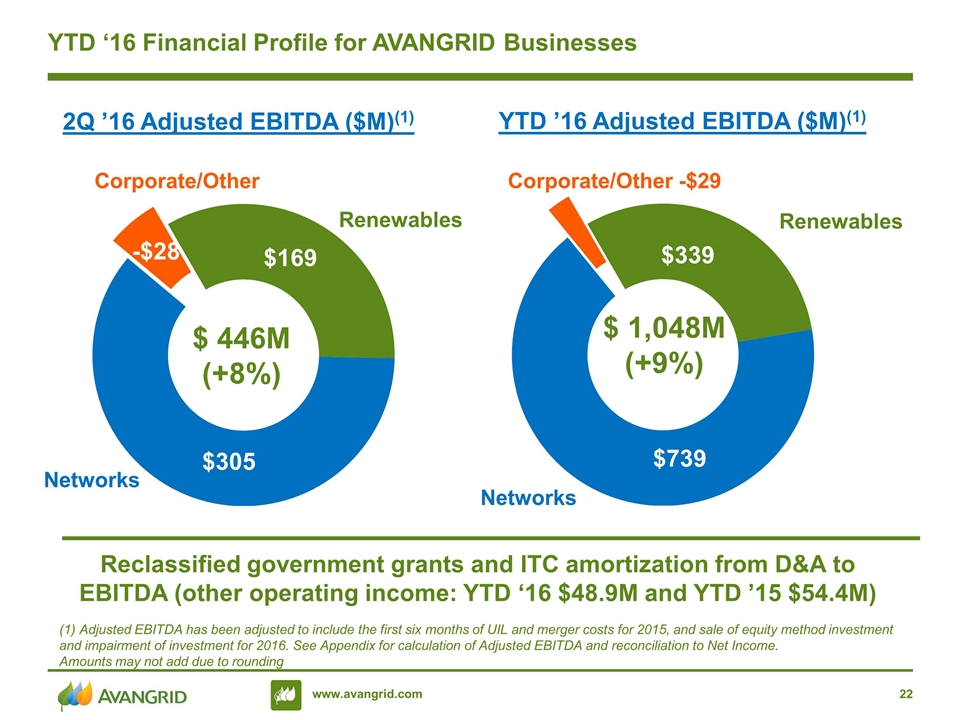
YTD ‘16 Financial Profile for AVANGRID Businesses YTD ’16 Adjusted EBITDA ($M)(1) Reclassified government grants and ITC amortization from D&A to EBITDA (other operating income: YTD ‘16 $48.9M and YTD ’15 $54.4M) Networks Renewables $ 1,048M (+9%) (1) Adjusted EBITDA has been adjusted to include the first six months of UIL and merger costs for 2015, and sale of equity method investment and impairment of investment for 2016. See Appendix for calculation of Adjusted EBITDA and reconciliation to Net Income. Amounts may not add due to rounding Networks Renewables Corporate/Other 2Q ’16 Adjusted EBITDA ($M)(1) Corporate/Other -$29

2Q ‘16 & YTD ‘16 Reconciliation 2015 Adjusted EPS(1) $0.10 Change in Est. Useful Lives $0.02 Key impacts: Revenue & Rate Base $0.08 Wind Production $0.02 Favorable Uncollectibles $0.01 Other (2) $0.03 2016 Adjusted EPS(1) $0.32 $0.66 $0.06 $0.13 $0.07 $0.01 $--- $0.95 2Q YTD (1) Adjusted EPS is adjusted to reflect the combination of AVANGRID with UIL, the sale of certain investments, and the impairment of an investment. See Appendix for calculation of Adjusted EPS and reconciliation to EPS. (2) Other includes the net impact of smaller impacts , including taxes, timing impacts, and intercompany settlements with no consolidated impact Amounts may not add due to rounding Energy Mgmt & MTM $0.05 $0.01 Renewables Networks Cost Management $0.01 $0.01
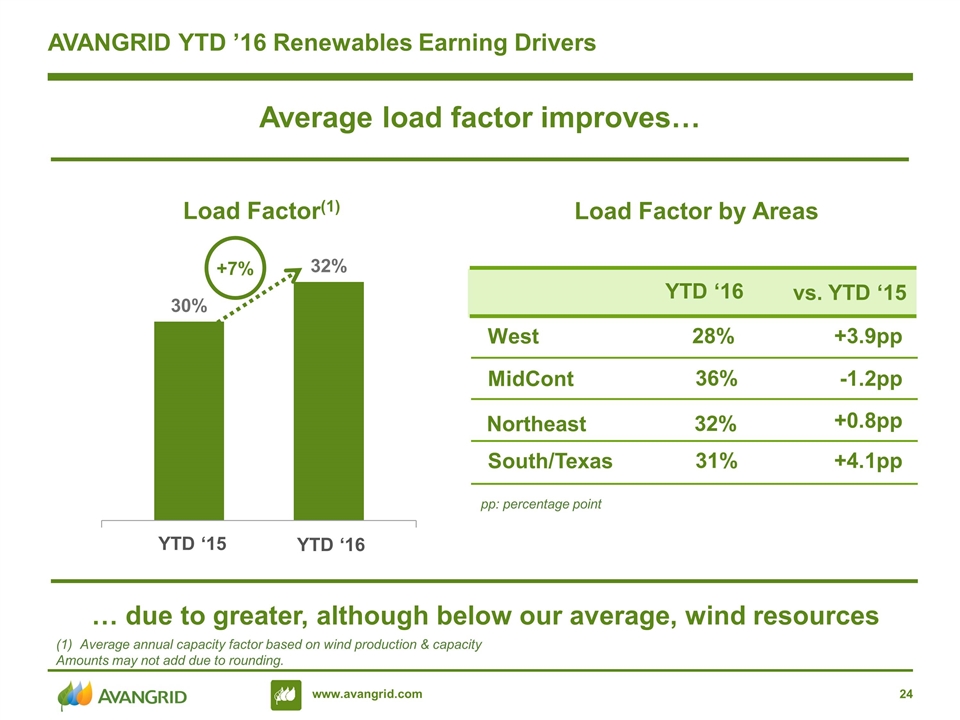
AVANGRID YTD ’16 Renewables Earning Drivers Average load factor improves… Load Factor(1) Average annual capacity factor based on wind production & capacity Amounts may not add due to rounding. … due to greater, although below our average, wind resources YTD ‘15 YTD ‘16 +7% Load Factor by Areas West 28% +3.9pp vs. YTD ‘15 YTD ‘16 MidCont 36% -1.2pp Northeast 32% +0.8pp South/Texas 31% +4.1pp pp: percentage point
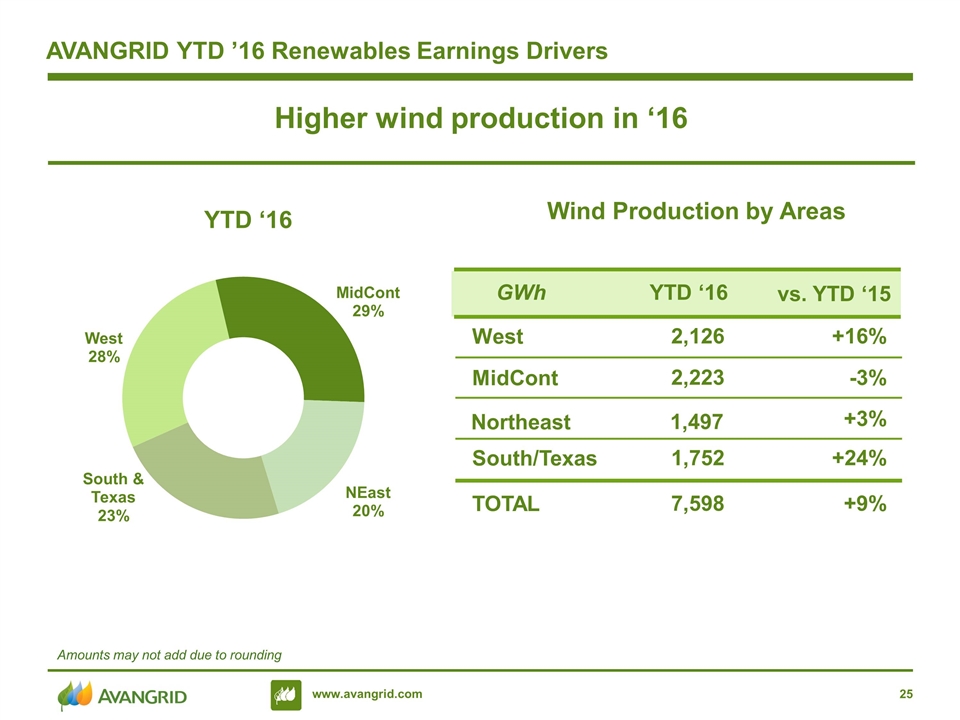
AVANGRID YTD ’16 Renewables Earnings Drivers Higher wind production in ‘16 YTD ‘16 West 2,126 +16% vs. YTD ‘15 YTD ‘16 MidCont 2,223 -3% Northeast 1,497 +3% South/Texas 1,752 +24% GWh TOTAL 7,598 +9% Amounts may not add due to rounding Wind Production by Areas
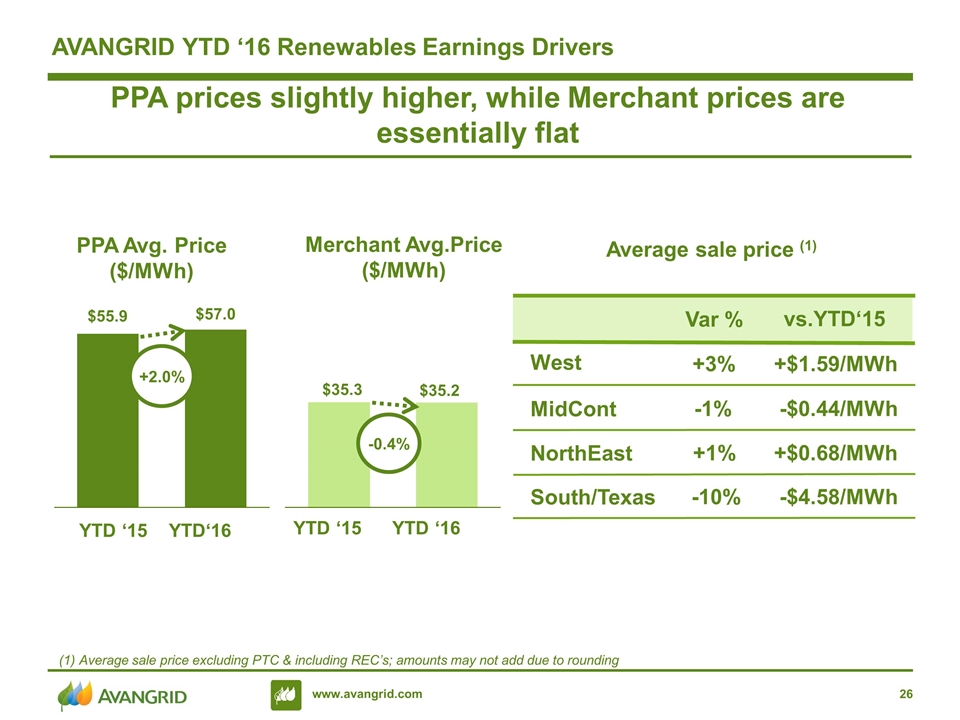
AVANGRID YTD ‘16 Renewables Earnings Drivers PPA prices slightly higher, while Merchant prices are essentially flat Average sale price (1) (1) Average sale price excluding PTC & including REC’s; amounts may not add due to rounding West +3% +$1.59/MWh vs.YTD‘15 Var % MidCont -1% -$0.44/MWh NorthEast +1% +$0.68/MWh South/Texas -10% -$4.58/MWh YTD ‘15 YTD ‘16 -0.4% YTD ‘15 YTD‘16 +2.0% $55.9 $57.0 PPA Avg. Price ($/MWh) Merchant Avg.Price ($/MWh)
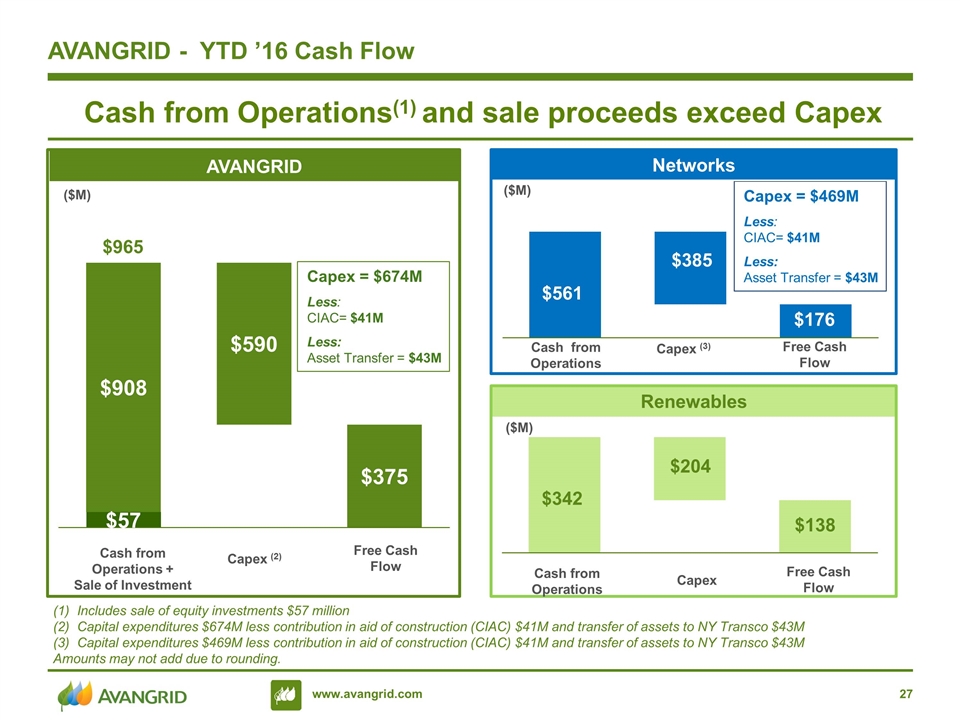
($M) Cash from Operations(1) and sale proceeds exceed Capex Free Cash Flow AVANGRID - YTD ’16 Cash Flow Capex (2) Cash from Operations + Sale of Investment AVANGRID Networks Renewables Free Cash Flow Capex Cash from Operations Free Cash Flow Capex (3) Cash from Operations ($M) ($M) Includes sale of equity investments $57 million Capital expenditures $674M less contribution in aid of construction (CIAC) $41M and transfer of assets to NY Transco $43M Capital expenditures $469M less contribution in aid of construction (CIAC) $41M and transfer of assets to NY Transco $43M Amounts may not add due to rounding. $204 $342 $138 $965 Capex = $674M Less: CIAC= $41M Less: Asset Transfer = $43M
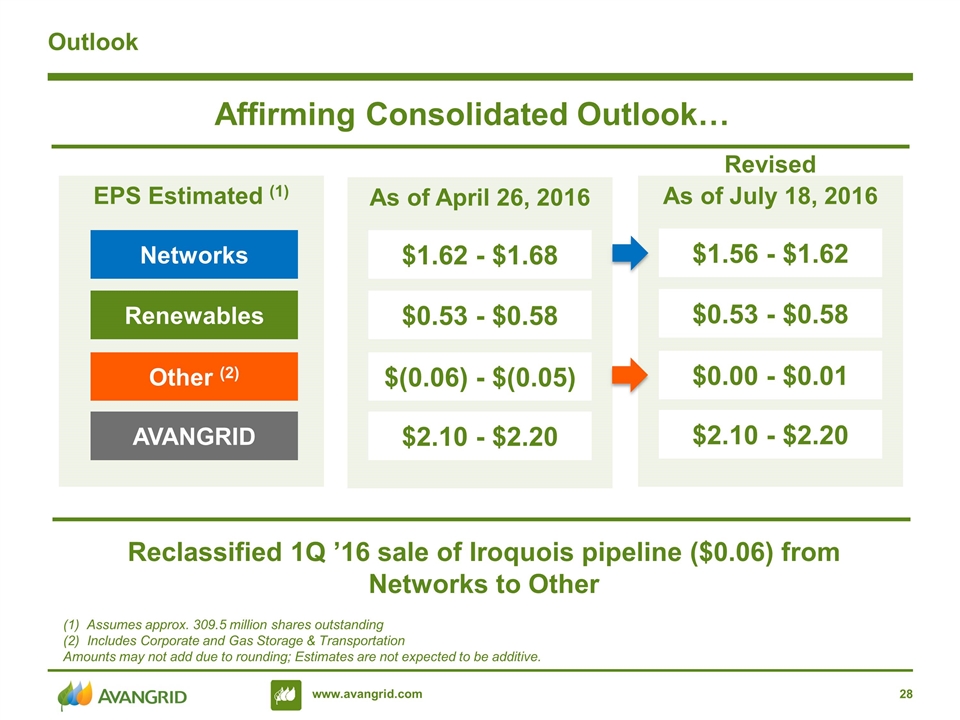
EPS Estimated (1) Outlook (1) Assumes approx. 309.5 million shares outstanding Includes Corporate and Gas Storage & Transportation Amounts may not add due to rounding; Estimates are not expected to be additive. Affirming Consolidated Outlook… Networks As of April 26, 2016 Renewables Other (2) AVANGRID $1.62 - $1.68 $0.53 - $0.58 $(0.06) - $(0.05) $2.10 - $2.20 As of July 18, 2016 $1.56 - $1.62 $0.53 - $0.58 $0.00 - $0.01 $2.10 - $2.20 Reclassified 1Q ’16 sale of Iroquois pipeline ($0.06) from Networks to Other Revised
Appendix
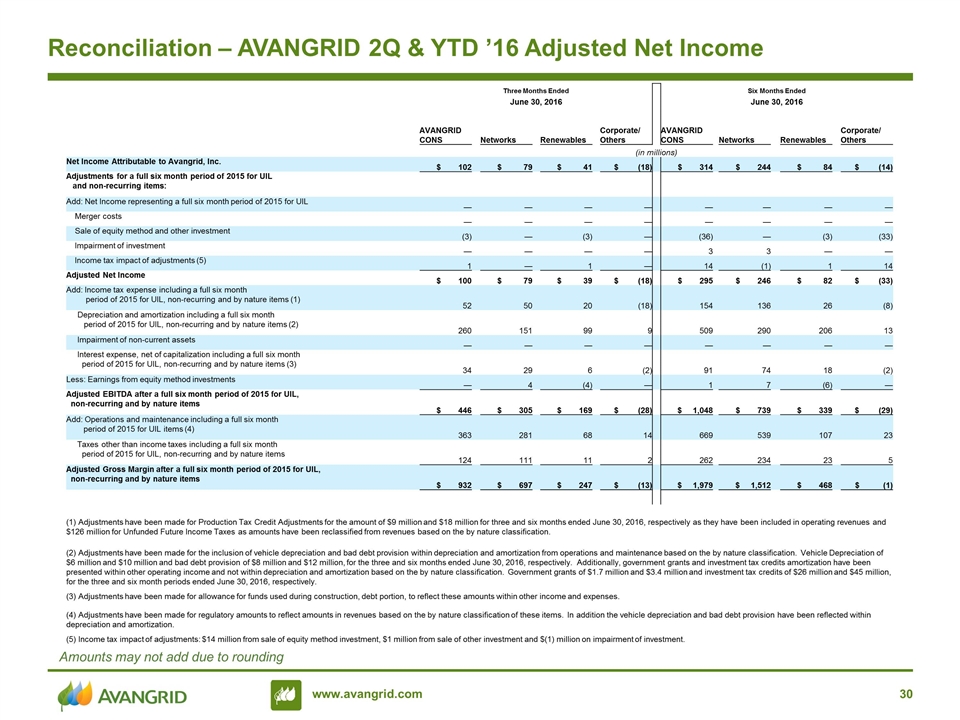
Reconciliation – AVANGRID 2Q & YTD ’16 Adjusted Net Income Amounts may not add due to rounding Three Months Ended Six Months Ended June 30, 2016 June 30, 2016 AVANGRID CONS Networks Renewables Corporate/ Others AVANGRID CONS Networks Renewables Corporate/ Others (in millions) Net Income Attributable to Avangrid, Inc. $ 102 $ 79 $ 41 $ (18) $ 314 $ 244 $ 84 $ (14) Adjustments for a full six month period of 2015 for UIL and non-recurring items: Add: Net Income representing a full six month period of 2015 for UIL — — — — — — — — Merger costs — — — — — — — — Sale of equity method and other investment (3) — (3) — (36) — (3) (33) Impairment of investment — — — — 3 3 — — Income tax impact of adjustments (5) 1 — 1 — 14 (1) 1 14 Adjusted Net Income $ 100 $ 79 $ 39 $ (18) $ 295 $ 246 $ 82 $ (33) Add: Income tax expense including a full six month period of 2015 for UIL, non-recurring and by nature items (1) 52 50 20 (18) 154 136 26 (8) Depreciation and amortization including a full six month period of 2015 for UIL, non-recurring and by nature items (2) 260 151 99 9 509 290 206 13 Impairment of non-current assets — — — — — — — — Interest expense, net of capitalization including a full six month period of 2015 for UIL, non-recurring and by nature items (3) 34 29 6 (2) 91 74 18 (2) Less: Earnings from equity method investments — 4 (4) — 1 7 (6) — Adjusted EBITDA after a full six month period of 2015 for UIL, non-recurring and by nature items $ 446 $ 305 $ 169 $ (28) $ 1,048 $ 739 $ 339 $ (29) Add: Operations and maintenance including a full six month period of 2015 for UIL items (4) 363 281 68 14 669 539 107 23 Taxes other than income taxes including a full six month period of 2015 for UIL, non-recurring and by nature items 124 111 11 2 262 234 23 5 Adjusted Gross Margin after a full six month period of 2015 for UIL, non-recurring and by nature items $ 932 $ 697 $ 247 $ (13) $ 1,979 $ 1,512 $ 468 $ (1) (1) Adjustments have been made for Production Tax Credit Adjustments for the amount of $9 million and $18 million for three and six months ended June 30, 2016, respectively as they have been included in operating revenues and $126 million for Unfunded Future Income Taxes as amounts have been reclassified from revenues based on the by nature classification. (2) Adjustments have been made for the inclusion of vehicle depreciation and bad debt provision within depreciation and amortization from operations and maintenance based on the by nature classification. Vehicle Depreciation of $6 million and $10 million and bad debt provision of $8 million and $12 million, for the three and six months ended June 30, 2016, respectively. Additionally, government grants and investment tax credits amortization have been presented within other operating income and not within depreciation and amortization based on the by nature classification. Government grants of $1.7 million and $3.4 million and investment tax credits of $26 million and $45 million, for the three and six month periods ended June 30, 2016, respectively. (3) Adjustments have been made for allowance for funds used during construction, debt portion, to reflect these amounts within other income and expenses. (4) Adjustments have been made for regulatory amounts to reflect amounts in revenues based on the by nature classification of these items. In addition the vehicle depreciation and bad debt provision have been reflected within depreciation and amortization. (5) Income tax impact of adjustments: $14 million from sale of equity method investment, $1 million from sale of other investment and $(1) million on impairment of investment.
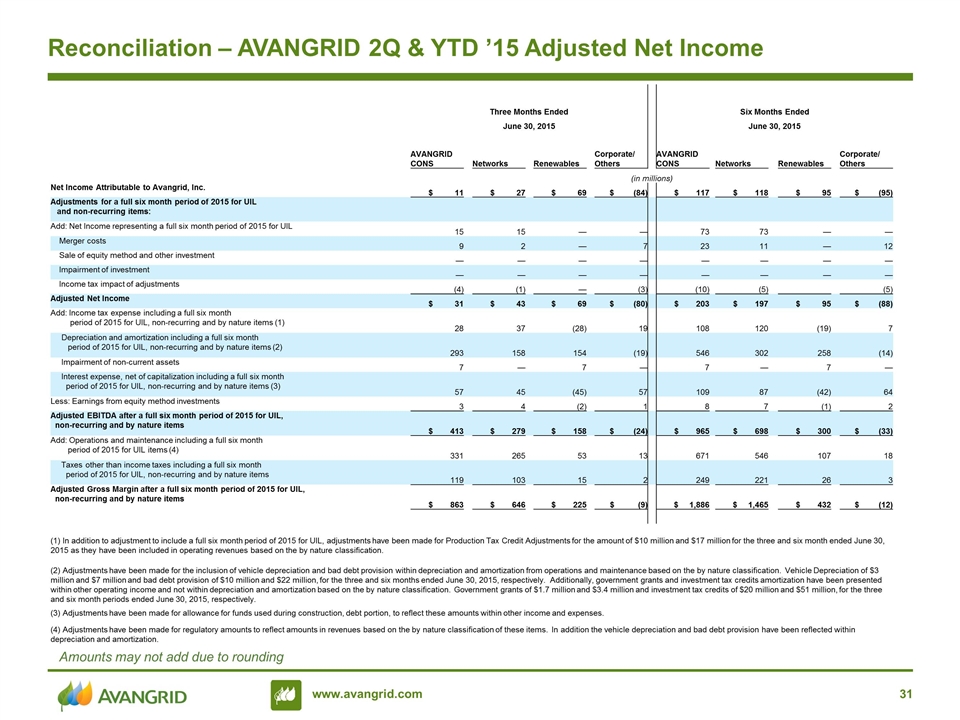
Reconciliation – AVANGRID 2Q & YTD ’15 Adjusted Net Income Amounts may not add due to rounding Three Months Ended Six Months Ended June 30, 2015 June 30, 2015 AVANGRID CONS Networks Renewables Corporate/ Others AVANGRID CONS Networks Renewables Corporate/ Others (in millions) Net Income Attributable to Avangrid, Inc. $ 11 $ 27 $ 69 $ (84) $ 117 $ 118 $ 95 $ (95) Adjustments for a full six month period of 2015 for UIL and non-recurring items: Add: Net Income representing a full six month period of 2015 for UIL 15 15 — — 73 73 — — Merger costs 9 2 — 7 23 11 — 12 Sale of equity method and other investment — — — — — — — — Impairment of investment — — — — — — — — Income tax impact of adjustments (4) (1) — (3) (10) (5) (5) Adjusted Net Income $ 31 $ 43 $ 69 $ (80) $ 203 $ 197 $ 95 $ (88) Add: Income tax expense including a full six month period of 2015 for UIL, non-recurring and by nature items (1) 28 37 (28) 19 108 120 (19) 7 Depreciation and amortization including a full six month period of 2015 for UIL, non-recurring and by nature items (2) 293 158 154 (19) 546 302 258 (14) Impairment of non-current assets 7 — 7 — 7 — 7 — Interest expense, net of capitalization including a full six month period of 2015 for UIL, non-recurring and by nature items (3) 57 45 (45) 57 109 87 (42) 64 Less: Earnings from equity method investments 3 4 (2) 1 8 7 (1) 2 Adjusted EBITDA after a full six month period of 2015 for UIL, non-recurring and by nature items $ 413 $ 279 $ 158 $ (24) $ 965 $ 698 $ 300 $ (33) Add: Operations and maintenance including a full six month period of 2015 for UIL items (4) 331 265 53 13 671 546 107 18 Taxes other than income taxes including a full six month period of 2015 for UIL, non-recurring and by nature items 119 103 15 2 249 221 26 3 Adjusted Gross Margin after a full six month period of 2015 for UIL, non-recurring and by nature items $ 863 $ 646 $ 225 $ (9) $ 1,886 $ 1,465 $ 432 $ (12) (1) In addition to adjustment to include a full six month period of 2015 for UIL, adjustments have been made for Production Tax Credit Adjustments for the amount of $10 million and $17 million for the three and six month ended June 30, 2015 as they have been included in operating revenues based on the by nature classification. (2) Adjustments have been made for the inclusion of vehicle depreciation and bad debt provision within depreciation and amortization from operations and maintenance based on the by nature classification. Vehicle Depreciation of $3 million and $7 million and bad debt provision of $10 million and $22 million, for the three and six months ended June 30, 2015, respectively. Additionally, government grants and investment tax credits amortization have been presented within other operating income and not within depreciation and amortization based on the by nature classification. Government grants of $1.7 million and $3.4 million and investment tax credits of $20 million and $51 million, for the three and six month periods ended June 30, 2015, respectively. (3) Adjustments have been made for allowance for funds used during construction, debt portion, to reflect these amounts within other income and expenses. (4) Adjustments have been made for regulatory amounts to reflect amounts in revenues based on the by nature classification of these items. In addition the vehicle depreciation and bad debt provision have been reflected within depreciation and amortization.
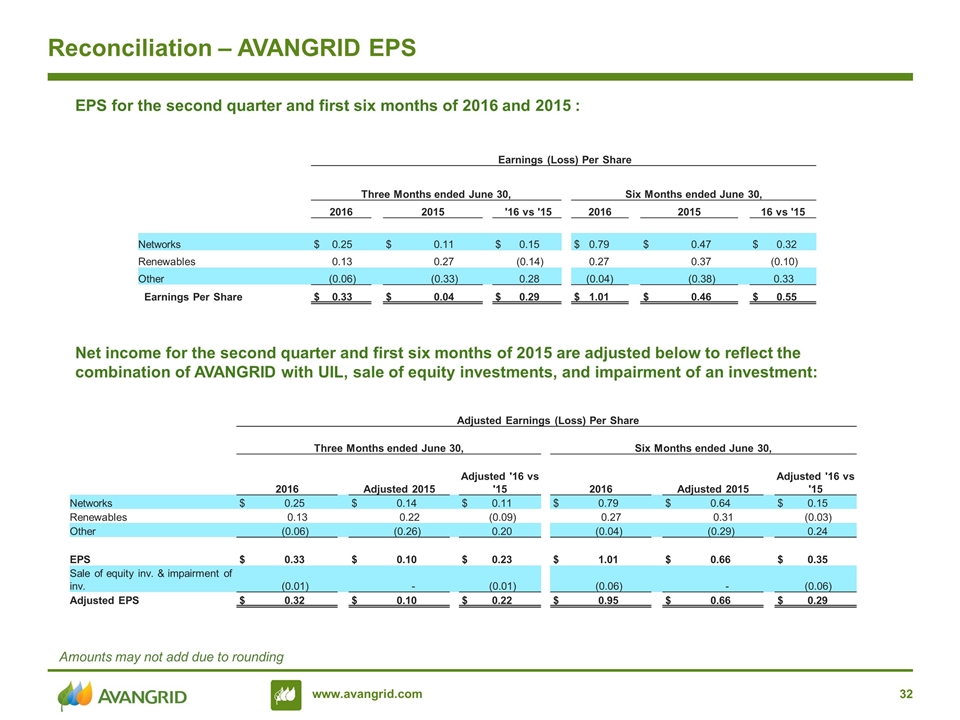
Reconciliation – AVANGRID EPS Amounts may not add due to rounding EPS for the second quarter and first six months of 2016 and 2015 : Net income for the second quarter and first six months of 2015 are adjusted below to reflect the combination of AVANGRID with UIL, sale of equity investments, and impairment of an investment: Earnings (Loss) Per Share Three Months ended June 30, Six Months ended June 30, 2016 2015 '16 vs '15 2016 2015 16 vs '15 Networks $ 0.25 $ 0.11 $ 0.15 $ 0.79 $ 0.47 $ 0.32 Renewables 0.13 0.27 (0.14) 0.27 0.37 (0.10) Other (0.06) (0.33) 0.28 (0.04) (0.38) 0.33 Earnings Per Share $ 0.33 $ 0.04 $ 0.29 $ 1.01 $ 0.46 $ 0.55 Adjusted Earnings (Loss) Per Share Three Months ended June 30, Six Months ended June 30, 2016 Adjusted 2015 Adjusted '16 vs '15 2016 Adjusted 2015 Adjusted '16 vs '15 Networks $ 0.25 $ 0.14 $ 0.11 $ 0.79 $ 0.64 $ 0.15 Renewables 0.13 0.22 (0.09) 0.27 0.31 (0.03) Other (0.06) (0.26) 0.20 (0.04) (0.29) 0.24 EPS $ 0.33 $ 0.10 $ 0.23 $ 1.01 $ 0.66 $ 0.35 Sale of equity inv. & impairment of inv. (0.01) - (0.01) (0.06) - (0.06) Adjusted EPS $ 0.32 $ 0.10 $ 0.22 $ 0.95 $ 0.66 $ 0.29
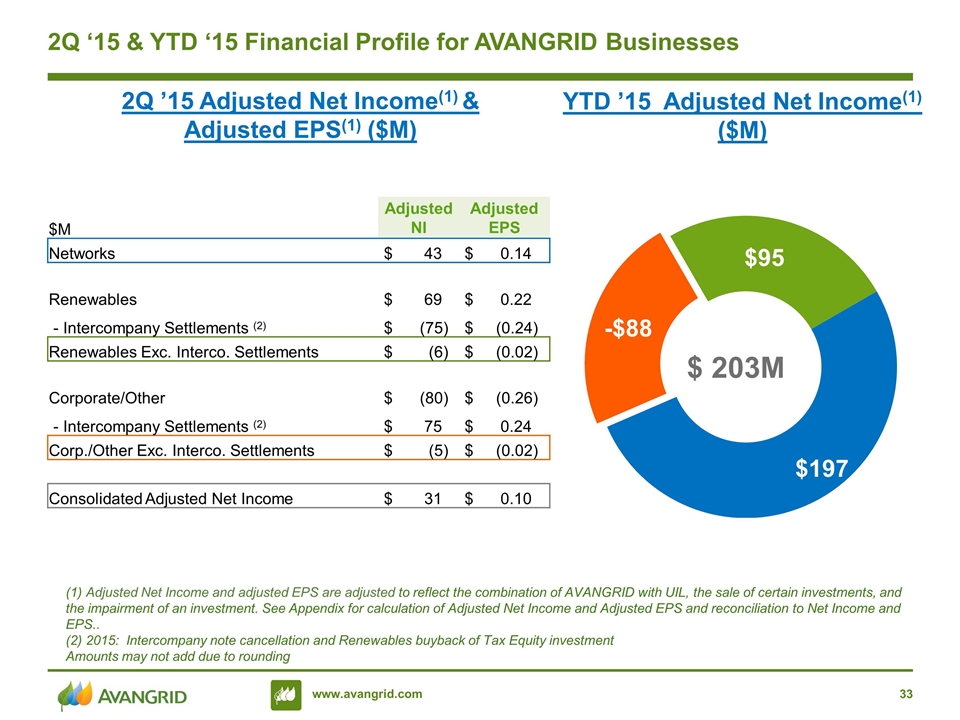
2Q ‘15 & YTD ‘15 Financial Profile for AVANGRID Businesses (1) Adjusted Net Income and adjusted EPS are adjusted to reflect the combination of AVANGRID with UIL, the sale of certain investments, and the impairment of an investment. See Appendix for calculation of Adjusted Net Income and Adjusted EPS and reconciliation to Net Income and EPS.. (2) 2015: Intercompany note cancellation and Renewables buyback of Tax Equity investment Amounts may not add due to rounding $M AdjustedNI Adjusted EPS Networks $ 43 $ 0.14 Renewables $ 69 $ 0.22 - Intercompany Settlements (2) $ (75) $ (0.24) Renewables Exc. Interco. Settlements $ (6) $ (0.02) Corporate/Other $ (80) $ (0.26) - Intercompany Settlements (2) $ 75 $ 0.24 Corp./Other Exc. Interco. Settlements $ (5) $ (0.02) Consolidated Adjusted Net Income $ 31 $ 0.10 YTD ’15 Adjusted Net Income(1) ($M) 2Q ’15 Adjusted Net Income(1) & Adjusted EPS(1) ($M)
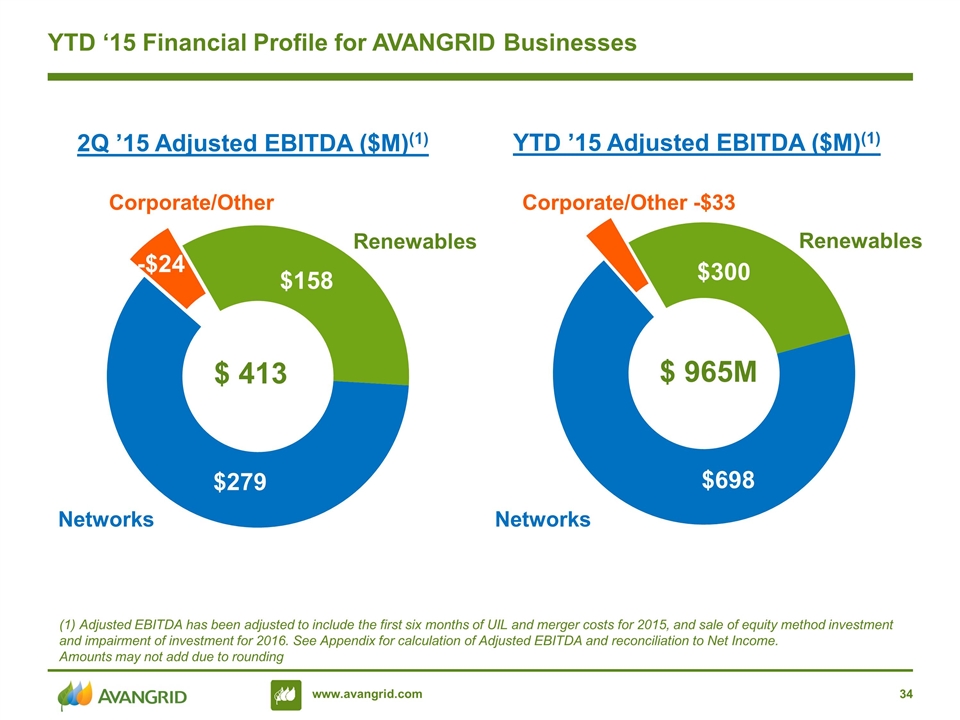
YTD ‘15 Financial Profile for AVANGRID Businesses YTD ’15 Adjusted EBITDA ($M)(1) Networks Renewables $ 965M Networks Renewables Corporate/Other 2Q ’15 Adjusted EBITDA ($M)(1) Corporate/Other -$33 (1) Adjusted EBITDA has been adjusted to include the first six months of UIL and merger costs for 2015, and sale of equity method investment and impairment of investment for 2016. See Appendix for calculation of Adjusted EBITDA and reconciliation to Net Income. Amounts may not add due to rounding
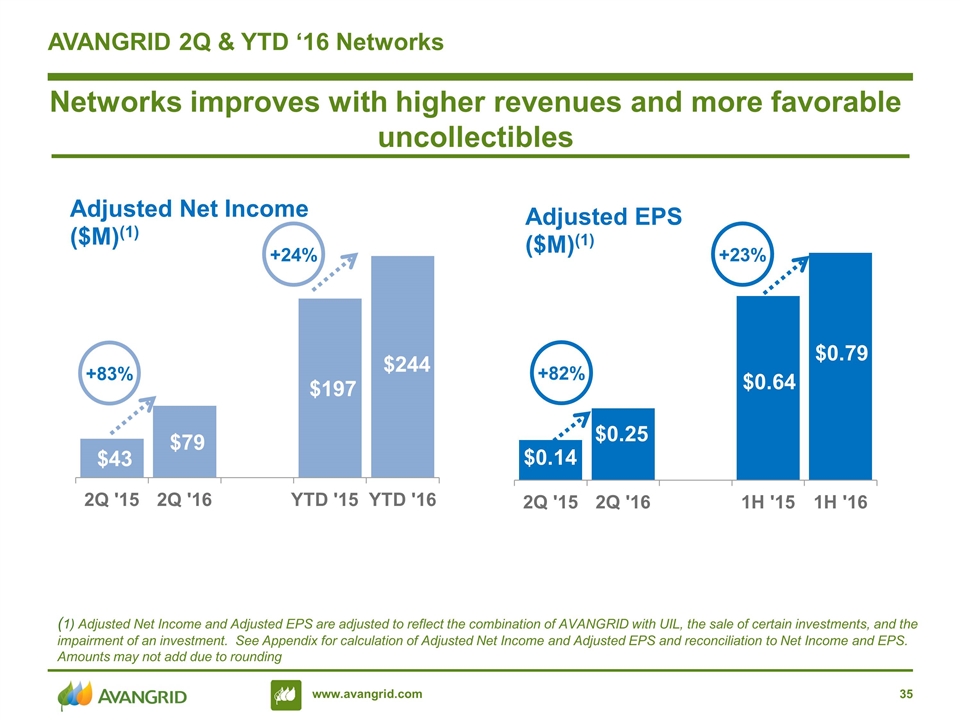
AVANGRID 2Q & YTD ‘16 Networks (1) Adjusted Net Income and Adjusted EPS are adjusted to reflect the combination of AVANGRID with UIL, the sale of certain investments, and the impairment of an investment. See Appendix for calculation of Adjusted Net Income and Adjusted EPS and reconciliation to Net Income and EPS. Amounts may not add due to rounding +83% +24% Networks improves with higher revenues and more favorable uncollectibles +82% +23%
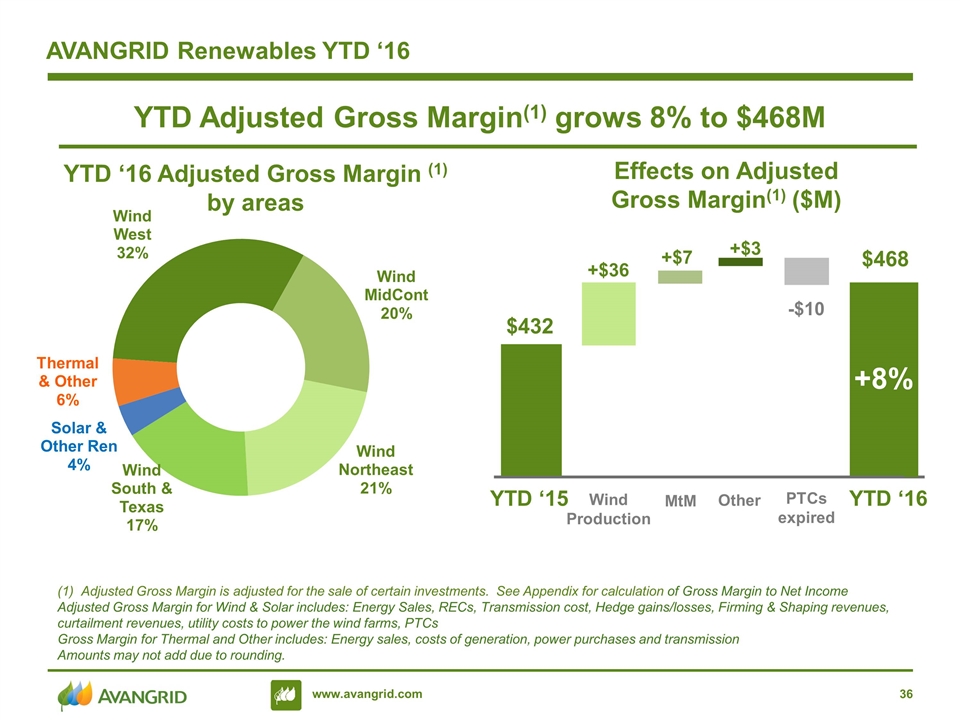
AVANGRID Renewables YTD ‘16 YTD Adjusted Gross Margin(1) grows 8% to $468M Effects on Adjusted Gross Margin(1) ($M) YTD ‘16 Adjusted Gross Margin (1) by areas YTD ‘16 PTCs expired YTD ‘15 Wind Production +8% $468 $432 +$36 +$7 -$10 MtM Adjusted Gross Margin is adjusted for the sale of certain investments. See Appendix for calculation of Gross Margin to Net Income Adjusted Gross Margin for Wind & Solar includes: Energy Sales, RECs, Transmission cost, Hedge gains/losses, Firming & Shaping revenues, curtailment revenues, utility costs to power the wind farms, PTCs Gross Margin for Thermal and Other includes: Energy sales, costs of generation, power purchases and transmission Amounts may not add due to rounding. +$3 Other
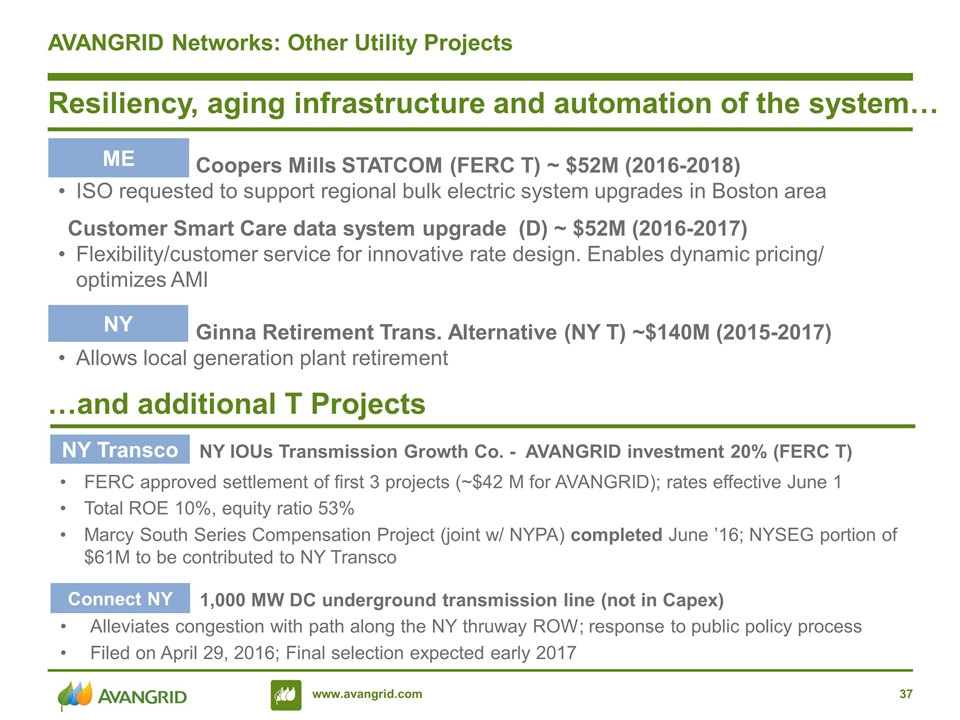
AVANGRID Networks: Other Utility Projects Resiliency, aging infrastructure and automation of the system… Connecticut Coopers Mills STATCOM (FERC T) ~ $52M (2016-2018) ISO requested to support regional bulk electric system upgrades in Boston area Customer Smart Care data system upgrade (D) ~ $52M (2016-2017) Flexibility/customer service for innovative rate design. Enables dynamic pricing/ optimizes AMI ME Connecticut Ginna Retirement Trans. Alternative (NY T) ~$140M (2015-2017) Allows local generation plant retirement NY …and additional T Projects NY IOUs Transmission Growth Co. - AVANGRID investment 20% (FERC T) FERC approved settlement of first 3 projects (~$42 M for AVANGRID); rates effective June 1 Total ROE 10%, equity ratio 53% Marcy South Series Compensation Project (joint w/ NYPA) completed June ’16; NYSEG portion of $61M to be contributed to NY Transco NY Transco 1,000 MW DC underground transmission line (not in Capex) Alleviates congestion with path along the NY thruway ROW; response to public policy process Filed on April 29, 2016; Final selection expected early 2017 Connect NY
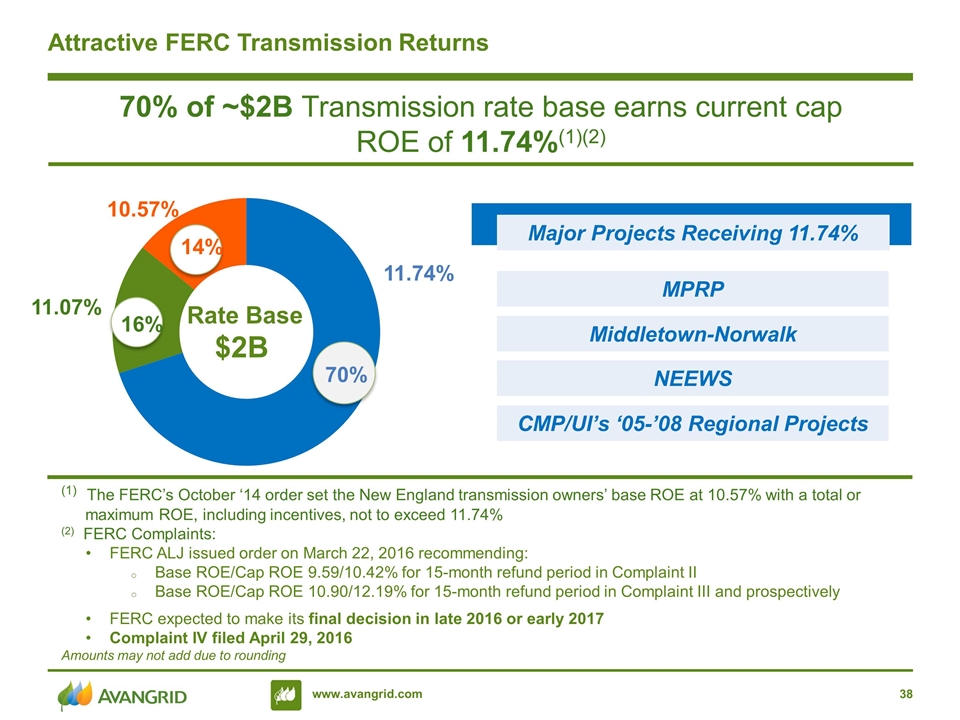
Attractive FERC Transmission Returns 70% of ~$2B Transmission rate base earns current cap ROE of 11.74%(1)(2) (1) The FERC’s October ‘14 order set the New England transmission owners’ base ROE at 10.57% with a total or maximum ROE, including incentives, not to exceed 11.74% (2) FERC Complaints: FERC ALJ issued order on March 22, 2016 recommending: Base ROE/Cap ROE 9.59/10.42% for 15-month refund period in Complaint II Base ROE/Cap ROE 10.90/12.19% for 15-month refund period in Complaint III and prospectively FERC expected to make its final decision in late 2016 or early 2017 Complaint IV filed April 29, 2016 Amounts may not add due to rounding 14% 11.74% 10.57% 11.07% Major Projects Receiving 11.74% MPRP Middletown-Norwalk NEEWS CMP/UI’s ‘05-’08 Regional Projects


