Exhibit 99.2
Legal Notice FORWARD LOOKING STATEMENTS Certain statements in this presentation may relate to our future business and financial performance and future events or developments involving us and our subsidiaries that are not purely historical and may constitute “forward-looking statements” within the meaning of the Private Securities Litigation Reform Act of 1995. Forward-looking statements may be identified by the use of forward-looking terms such as “may,” “will,” “should,” “can,” “expects,” “believes,” “anticipates,” “intends,” “plans,” “estimates,” “projects,” “assumes,” “guides,” “targets,” “forecasts,” “is confident that” and “seeks” or the negative of such terms or other variations on such terms or comparable terminology. Such forward looking statements include, but are not limited to, statements about our plans, objectives and intentions, outlooks or expectations for earnings, revenues, expenses or other future financial or business performance, strategies or expectations, or the impact of legal or regulatory matters on our business, results of operations or financial condition. Such statements are based upon the current beliefs and expectations of our management and are subject to significant risks and uncertainties that could cause actual outcomes and results to differ materially. Important factors that could cause actual results to differ materially from those indicated by such forward-looking statements include, without limitation, the risks and uncertainties set forth under the section entitled “Risk Factors” and “Management’s Discussion and Analysis of Financial Condition and Results of Operations” in our Annual Report on Form 10-K for the year ended December 31, 2016, which on file with the Securities and Exchange Commission (SEC) and available on our investor relations website at www.avangrid.com and on the SEC website at www.sec.gov. Additional information will also be set forth in subsequent filings with the SEC. You should consider these factors carefully in evaluating for-ward looking statements. Should one or more of these risks or uncertainties materialize, or should any of the underlying assumptions prove incorrect, actual results may vary in material respects from those expressed or implied by these forward-looking statements. You should not place undue reliance on these forward-looking statements. We do not undertake any obligation to update or revise any forward-looking statements to reflect events or circumstances after the date of this presentation whether as a result of new information, future events or otherwise, except as may be required under applicable securities laws. About AVANGRID Avangrid, Inc. (NYSE: AGR) is a diversified energy and utility company with more than $31 billion in assets and operations in 27 states. The company owns regulated utilities and electricity generation assets through two primary lines of business, Avangrid Networks and Avangrid Renewables. Avangrid Networks is comprised of eight electric and natural gas utilities, serving approximately 3.2 million customers in New York and New England. Avangrid Renewables operates 6.5 gigawatts of electricity capacity, primarily through wind power, in 22 states across the United States. AVANGRID employs approximately 6,800 people. For more information, visit www.avangrid.com Investors@AVANGRID.com James Torgerson Chief Executive Officer Richard Nicholas Chief Financial Officer
Legal Notice Use of Non-GAAP Financial Measures To supplement our consolidated financial statements presented in accordance with U.S. GAAP, AVANGRID considers certain non-GAAP financial measures that are not prepared in accordance with U.S. GAAP, including adjusted net income, adjusted EPS, adjusted gross margin and adjusted EBITDA. The non-GAAP financial measures we use are specific to AVANGRID and the non-GAAP financial measures of other companies may not be calculated in the same manner. We use these non-GAAP financial measures, in addition to U.S. GAAP measures, to establish operating budgets and operational goals to manage and monitor our business, evaluate our operating and financial performance and to compare such performance to prior periods and to the performance of our competitors. We believe that presenting such non-GAAP financial measures is useful because such measures can be used to analyze and compare profitability between companies and industries because it eliminates the impact of financing and certain non-cash charges as well as allow for an evaluation of AVANGRID with a focus on the performance of its core operations. In addition, we present non-GAAP financial measures because we believe that they and other similar measures are widely used by certain investors, securities analysts and other interested parties as supplemental measures of performance. We provide adjusted net income, which is adjusted to reflect the effect of mark-to-market changes in the fair value of derivative instruments used by AVANGRID to economically hedge market price fluctuations in related underlying physical transactions for the purchase and sale of electricity, adjustments for the non-core Gas Storage business, and the impairment of certain investments and excludes the sale of certain equity investments. We define adjusted EBITDA as net income attributable to AVANGRID, adding back income tax expense, depreciation, amortization, impairment of non-current assets and interest expense, net of capitalization, and then subtracting other income and earnings from equity method investments. We also define adjusted gross margin as adjusted EBITDA adding back operations and maintenance and taxes other than income taxes and then subtracting transmission wheeling. The most directly comparable U.S. GAAP measure to adjusted EBITDA and adjusted gross margin is net income. We believe that presenting these non-GAAP financial measures is more useful in understanding and evaluating actual and projected financial performance and contribution of AVANGRID core lines of business and to more fully compare and explain our results. The most directly comparable U.S. GAAP measure to adjusted net income is net income. We also provide adjusted EPS, which is adjusted net income converted to an earnings per share amount. The use of non-GAAP financial measures is not intended to be considered in isolation or as a substitute for, or superior to, AVANGRID’s U.S. GAAP financial information, and investors are cautioned that the non-GAAP financial measures are limited in their usefulness, may be unique to AVANGRID, and should be considered only as a supplement to AVANGRID’s U.S. GAAP financial measures. The non-GAAP financial measures may not be comparable to other similarly titled measures of other companies and have limitations as analytical tools. Non-GAAP financial measures are not primary measurements of our performance under U.S. GAAP and should not be considered as alternatives to operating income, net income or any other performance measures determined in accordance with U.S. GAAP.
1Q 2017 Highlights James Torgerson
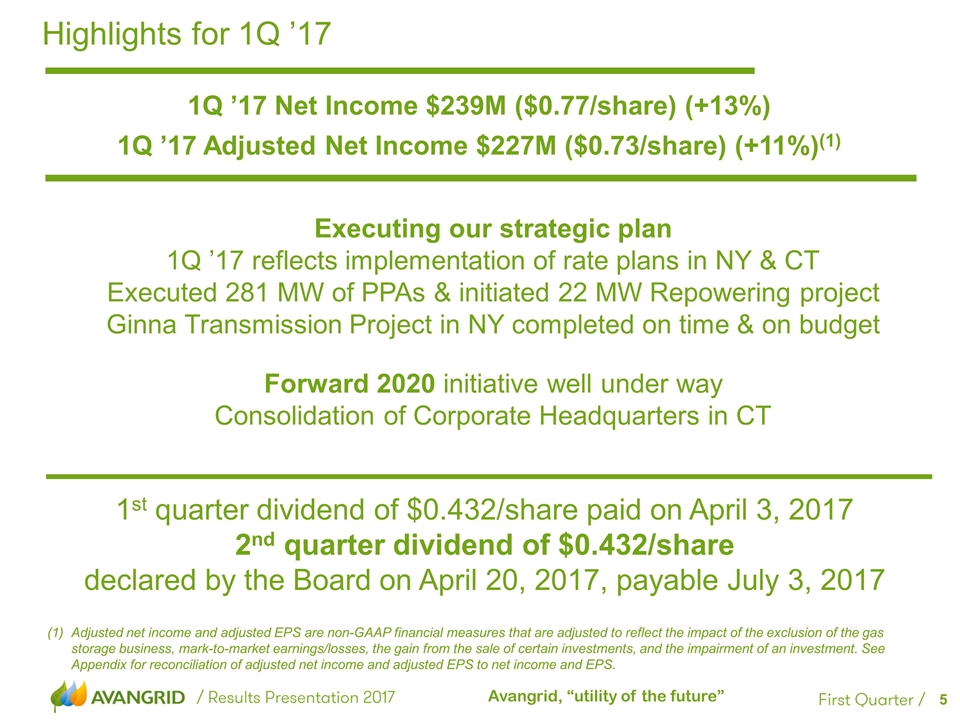
1Q ’17 Net Income $239M ($0.77/share) (+13%) 1Q ’17 Adjusted Net Income $227M ($0.73/share) (+11%)(1) Highlights for 1Q ’17 Executing our strategic plan 1Q ’17 reflects implementation of rate plans in NY & CT Executed 281 MW of PPAs & initiated 22 MW Repowering project Ginna Transmission Project in NY completed on time & on budget Forward 2020 initiative well under way Consolidation of Corporate Headquarters in CT 1st quarter dividend of $0.432/share paid on April 3, 2017 2nd quarter dividend of $0.432/share declared by the Board on April 20, 2017, payable July 3, 2017 Adjusted net income and adjusted EPS are non-GAAP financial measures that are adjusted to reflect the impact of the exclusion of the gas storage business, mark-to-market earnings/losses, the gain from the sale of certain investments, and the impairment of an investment. See Appendix for reconciliation of adjusted net income and adjusted EPS to net income and EPS.
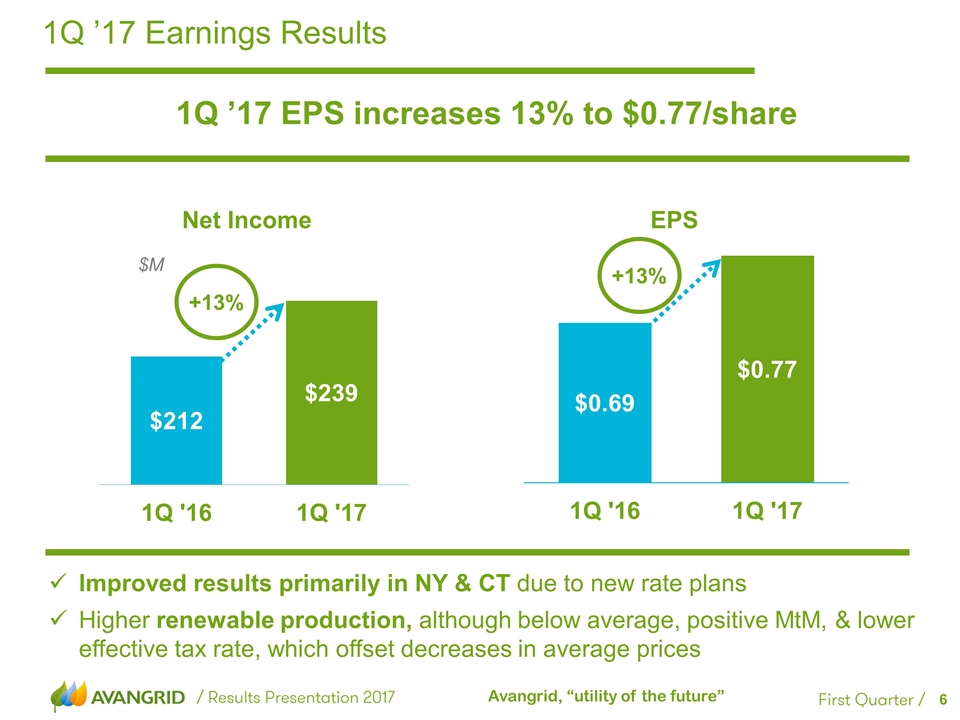
1Q ’17 Earnings Results 1Q ’17 EPS increases 13% to $0.77/share $M Net Income EPS +13% +13% Improved results primarily in NY & CT due to new rate plans Higher renewable production, although below average, positive MtM, & lower effective tax rate, which offset decreases in average prices
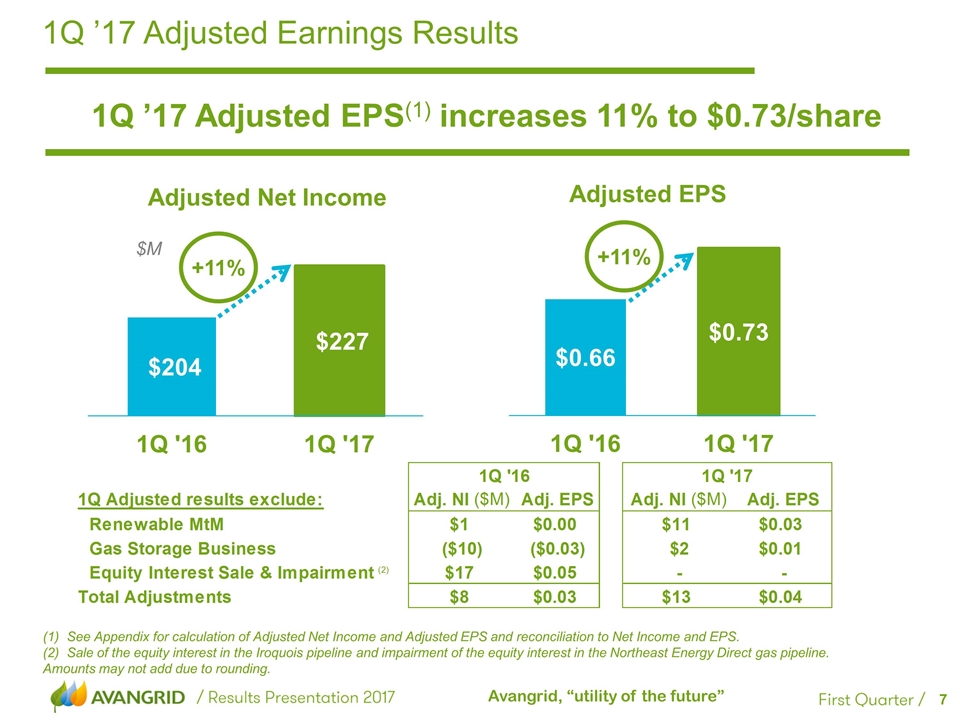
1Q ’17 Adjusted Earnings Results 1Q ’17 Adjusted EPS(1) increases 11% to $0.73/share $M Adjusted Net Income Adjusted EPS See Appendix for calculation of Adjusted Net Income and Adjusted EPS and reconciliation to Net Income and EPS. Sale of the equity interest in the Iroquois pipeline and impairment of the equity interest in the Northeast Energy Direct gas pipeline. Amounts may not add due to rounding. +11% +11%
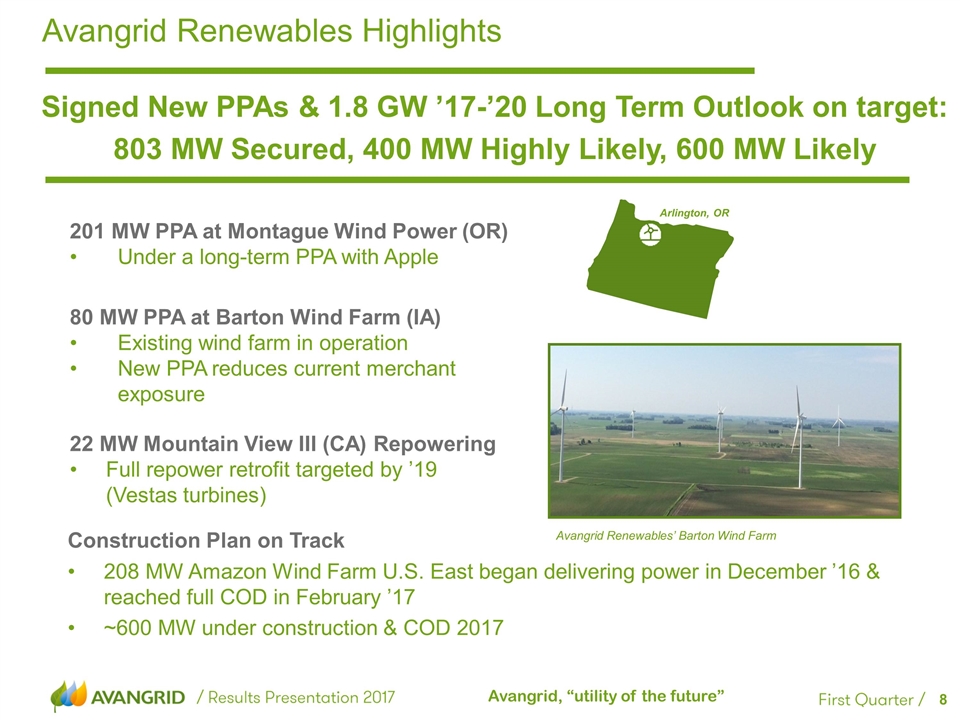
Avangrid Renewables Highlights Arlington, OR Signed New PPAs & 1.8 GW ’17-’20 Long Term Outlook on target: 803 MW Secured, 400 MW Highly Likely, 600 MW Likely 80 MW PPA at Barton Wind Farm (IA) Existing wind farm in operation New PPA reduces current merchant exposure Construction Plan on Track 208 MW Amazon Wind Farm U.S. East began delivering power in December ’16 & reached full COD in February ’17 ~600 MW under construction & COD 2017 22 MW Mountain View III (CA) Repowering Full repower retrofit targeted by ’19 (Vestas turbines) Avangrid Renewables’ Barton Wind Farm 201 MW PPA at Montague Wind Power (OR) Under a long-term PPA with Apple
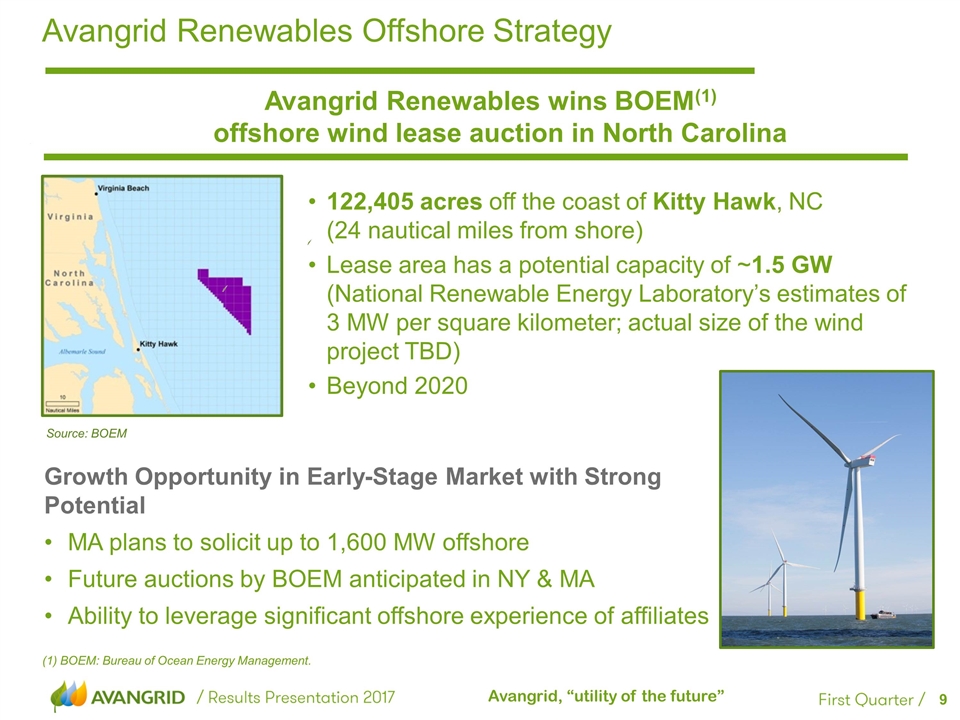
Avangrid Renewables Offshore Strategy Avangrid Renewables wins BOEM(1) offshore wind lease auction in North Carolina 122,405 acres off the coast of Kitty Hawk, NC (24 nautical miles from shore) Lease area has a potential capacity of ~1.5 GW (National Renewable Energy Laboratory’s estimates of 3 MW per square kilometer; actual size of the wind project TBD) Beyond 2020 Growth Opportunity in Early-Stage Market with Strong Potential MA plans to solicit up to 1,600 MW offshore Future auctions by BOEM anticipated in NY & MA Ability to leverage significant offshore experience of affiliates (1) BOEM: Bureau of Ocean Energy Management. Source: BOEM
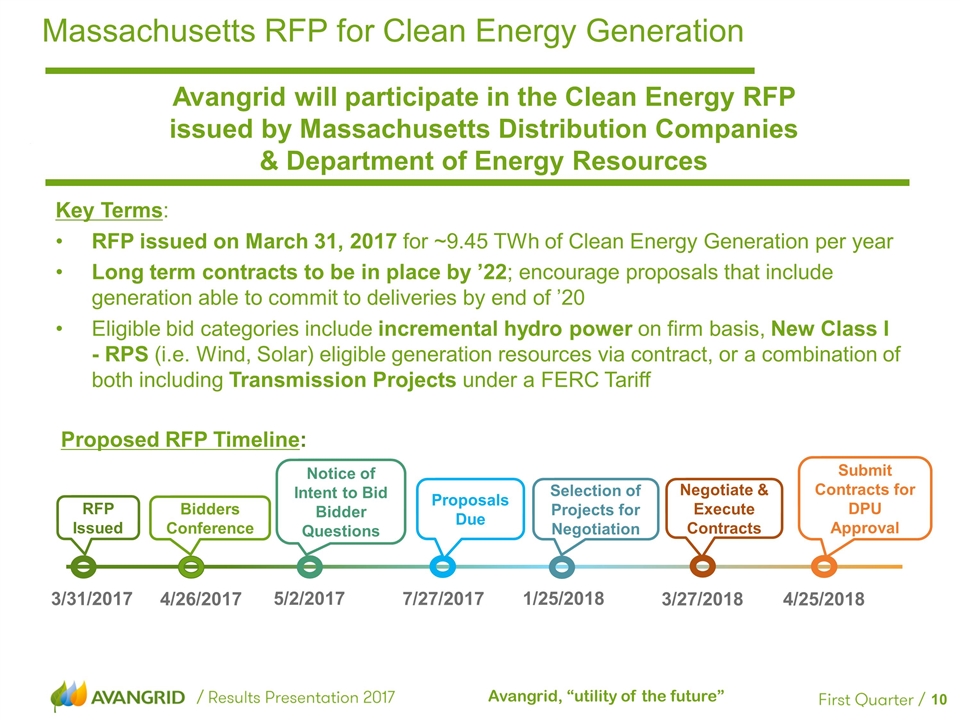
Key Terms: RFP issued on March 31, 2017 for ~9.45 TWh of Clean Energy Generation per year Long term contracts to be in place by ’22; encourage proposals that include generation able to commit to deliveries by end of ’20 Eligible bid categories include incremental hydro power on firm basis, New Class I - RPS (i.e. Wind, Solar) eligible generation resources via contract, or a combination of both including Transmission Projects under a FERC Tariff Massachusetts RFP for Clean Energy Generation Avangrid will participate in the Clean Energy RFP issued by Massachusetts Distribution Companies & Department of Energy Resources Proposed RFP Timeline: RFP Issued Notice of Intent to Bid Bidder Questions Proposals Due Negotiate & Execute Contracts Submit Contracts for DPU Approval Selection of Projects for Negotiation 3/31/2017 5/2/2017 7/27/2017 1/25/2018 3/27/2018 4/25/2018 Bidders Conference 4/26/2017
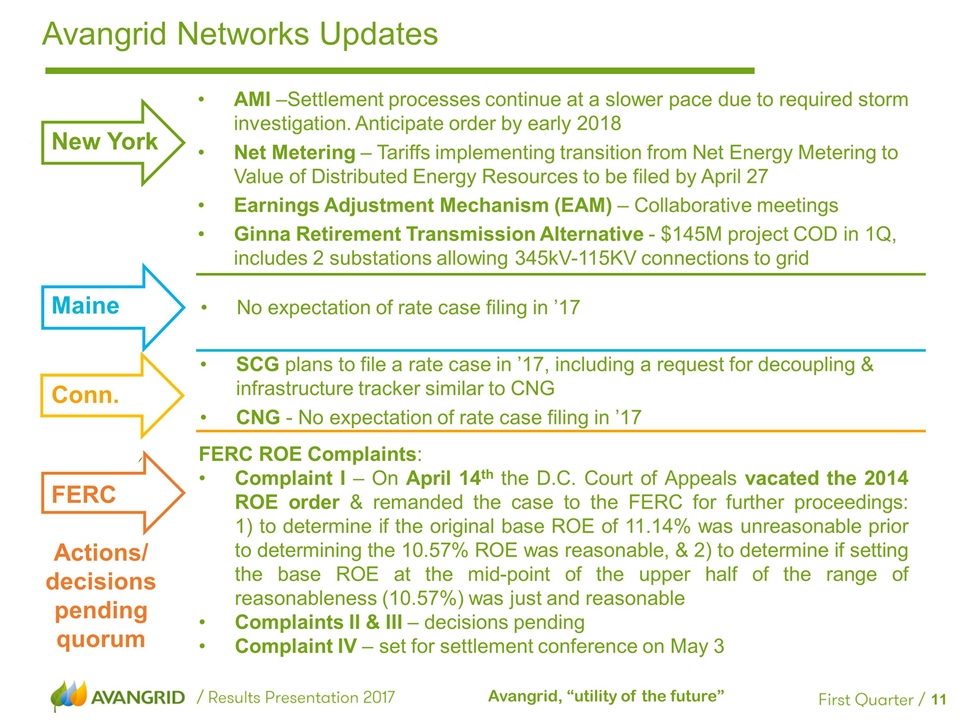
Avangrid Networks Updates AMI –Settlement processes continue at a slower pace due to required storm investigation. Anticipate order by early 2018 Net Metering – Tariffs implementing transition from Net Energy Metering to Value of Distributed Energy Resources to be filed by April 27 Earnings Adjustment Mechanism (EAM) – Collaborative meetings Ginna Retirement Transmission Alternative - $145M project COD in 1Q, includes 2 substations allowing 345kV-115KV connections to grid FERC ROE Complaints: Complaint I – On April 14th the D.C. Court of Appeals vacated the 2014 ROE order & remanded the case to the FERC for further proceedings: 1) to determine if the original base ROE of 11.14% was unreasonable prior to determining the 10.57% ROE was reasonable, & 2) to determine if setting the base ROE at the mid-point of the upper half of the range of reasonableness (10.57%) was just and reasonable Complaints II & III – decisions pending Complaint IV – set for settlement conference on May 3 SCG plans to file a rate case in ’17, including a request for decoupling & infrastructure tracker similar to CNG CNG - No expectation of rate case filing in ’17 No expectation of rate case filing in ’17 New York Maine Conn. FERC Actions/ decisions pending quorum
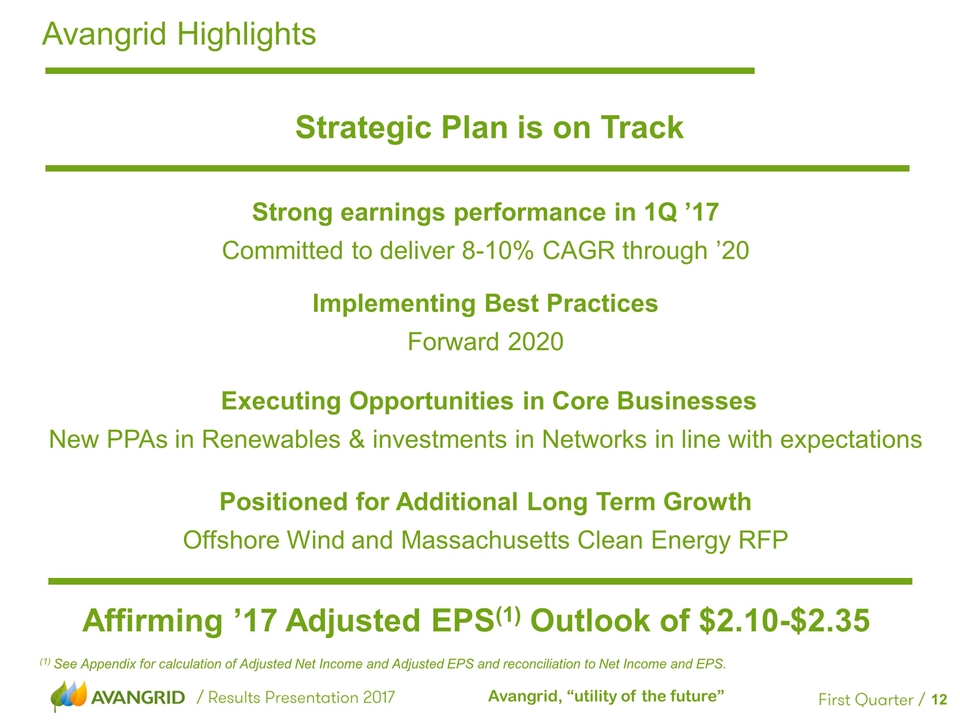
Avangrid Highlights Strong earnings performance in 1Q ’17 Committed to deliver 8-10% CAGR through ’20 Implementing Best Practices Forward 2020 Executing Opportunities in Core Businesses New PPAs in Renewables & investments in Networks in line with expectations Positioned for Additional Long Term Growth Offshore Wind and Massachusetts Clean Energy RFP Strategic Plan is on Track Affirming ’17 Adjusted EPS(1) Outlook of $2.10-$2.35 (1) See Appendix for calculation of Adjusted Net Income and Adjusted EPS and reconciliation to Net Income and EPS.
1Q 2017 Financial Results Richard Nicholas
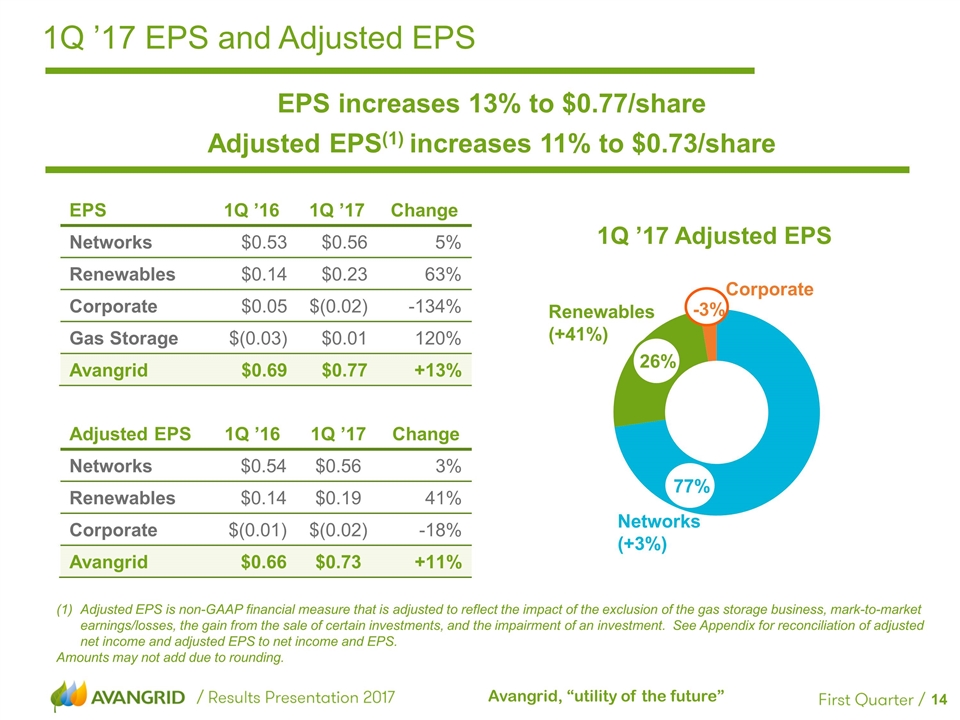
1Q ’17 EPS and Adjusted EPS EPS increases 13% to $0.77/share Adjusted EPS(1) increases 11% to $0.73/share EPS 1Q ’16 1Q ’17 Change Networks $0.53 $0.56 5% Renewables $0.14 $0.23 63% Corporate $0.05 $(0.02) -134% Gas Storage $(0.03) $0.01 120% Avangrid $0.69 $0.77 +13% Adjusted EPS 1Q ’16 1Q ’17 Change Networks $0.54 $0.56 3% Renewables $0.14 $0.19 41% Corporate $(0.01) $(0.02) -18% Avangrid $0.66 $0.73 +11% Adjusted EPS is non-GAAP financial measure that is adjusted to reflect the impact of the exclusion of the gas storage business, mark-to-market earnings/losses, the gain from the sale of certain investments, and the impairment of an investment. See Appendix for reconciliation of adjusted net income and adjusted EPS to net income and EPS. Amounts may not add due to rounding. 1Q ’17 Adjusted EPS Renewables (+41%) Networks (+3%) 26% 77% -3% Corporate
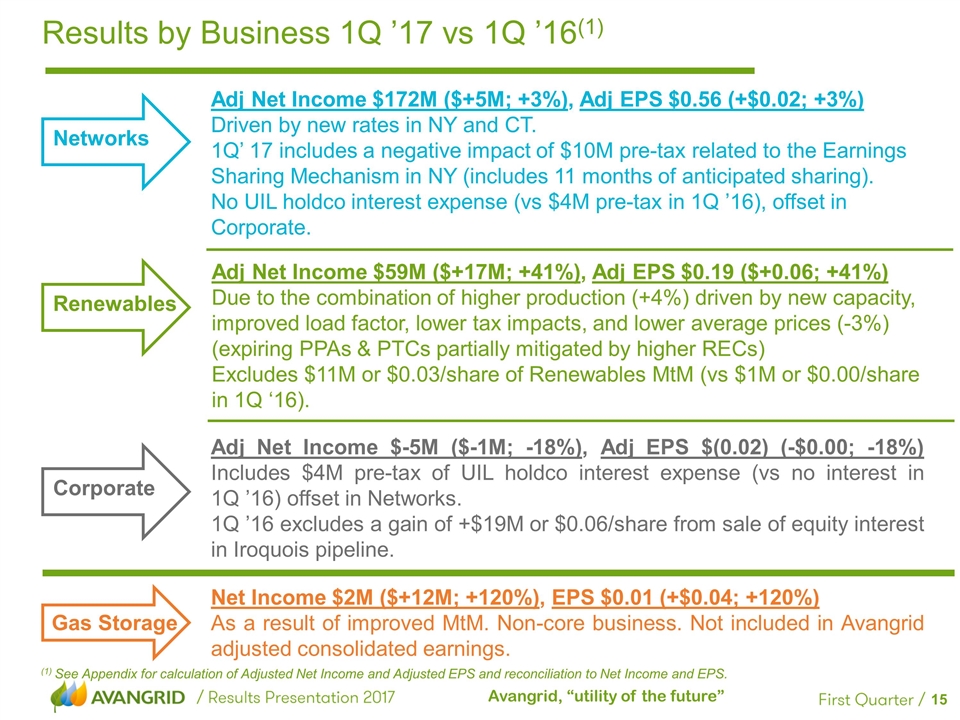
Net Income $2M ($+12M; +120%), EPS $0.01 (+$0.04; +120%) As a result of improved MtM. Non-core business. Not included in Avangrid adjusted consolidated earnings. Adj Net Income $172M ($+5M; +3%), Adj EPS $0.56 (+$0.02; +3%) Driven by new rates in NY and CT. 1Q’ 17 includes a negative impact of $10M pre-tax related to the Earnings Sharing Mechanism in NY (includes 11 months of anticipated sharing). No UIL holdco interest expense (vs $4M pre-tax in 1Q ’16), offset in Corporate. Adj Net Income $59M ($+17M; +41%), Adj EPS $0.19 ($+0.06; +41%) Due to the combination of higher production (+4%) driven by new capacity, improved load factor, lower tax impacts, and lower average prices (-3%) (expiring PPAs & PTCs partially mitigated by higher RECs) Excludes $11M or $0.03/share of Renewables MtM (vs $1M or $0.00/share in 1Q ‘16). Adj Net Income $-5M ($-1M; -18%), Adj EPS $(0.02) (-$0.00; -18%) Includes $4M pre-tax of UIL holdco interest expense (vs no interest in 1Q ’16) offset in Networks. 1Q ’16 excludes a gain of +$19M or $0.06/share from sale of equity interest in Iroquois pipeline. Results by Business 1Q ’17 vs 1Q ’16(1) Gas Storage Networks Renewables Corporate (1) See Appendix for calculation of Adjusted Net Income and Adjusted EPS and reconciliation to Net Income and EPS.
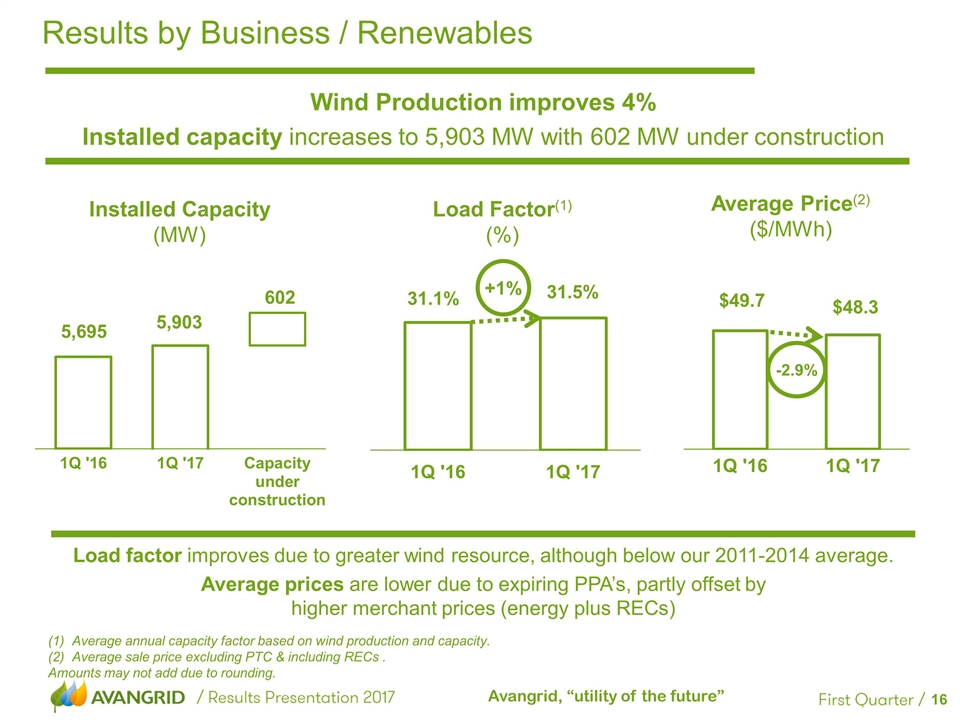
Results by Business / Renewables Wind Production improves 4% Installed capacity increases to 5,903 MW with 602 MW under construction Load factor improves due to greater wind resource, although below our 2011-2014 average. Average prices are lower due to expiring PPA’s, partly offset by higher merchant prices (energy plus RECs) Load Factor(1) (%) Installed Capacity (MW) Average Price(2) ($/MWh) Average annual capacity factor based on wind production and capacity. Average sale price excluding PTC & including RECs . Amounts may not add due to rounding. +1% -2.9% 31.1% 31.5%
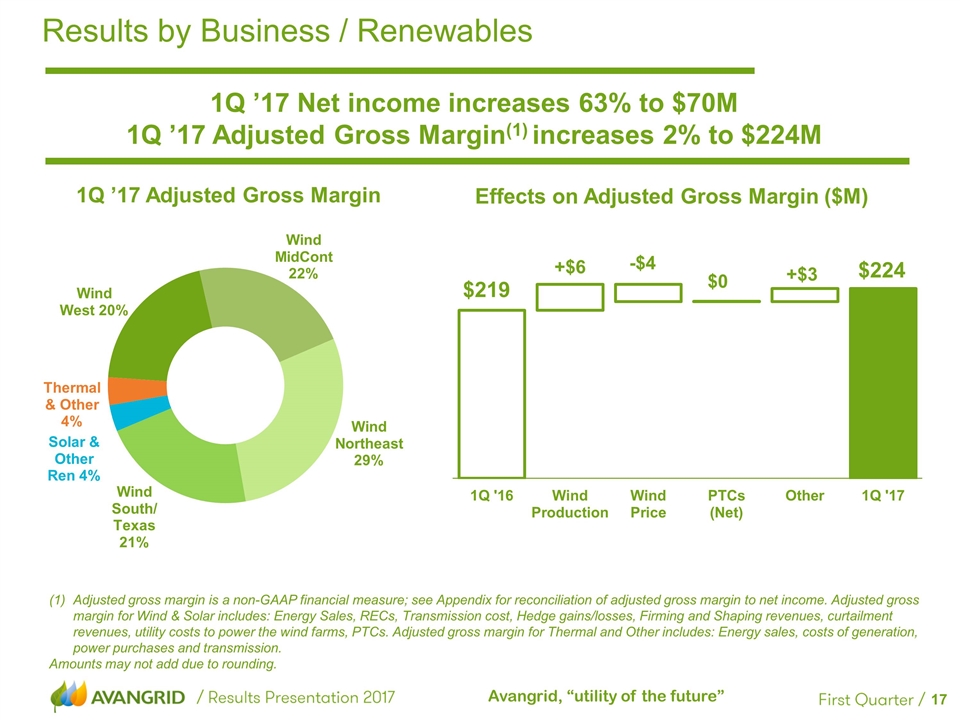
Results by Business / Renewables 1Q ’17 Net income increases 63% to $70M 1Q ’17 Adjusted Gross Margin(1) increases 2% to $224M $219 +$6 Adjusted gross margin is a non-GAAP financial measure; see Appendix for reconciliation of adjusted gross margin to net income. Adjusted gross margin for Wind & Solar includes: Energy Sales, RECs, Transmission cost, Hedge gains/losses, Firming and Shaping revenues, curtailment revenues, utility costs to power the wind farms, PTCs. Adjusted gross margin for Thermal and Other includes: Energy sales, costs of generation, power purchases and transmission. Amounts may not add due to rounding. $224 -$4 Effects on Adjusted Gross Margin ($M) 1Q ’17 Adjusted Gross Margin $0
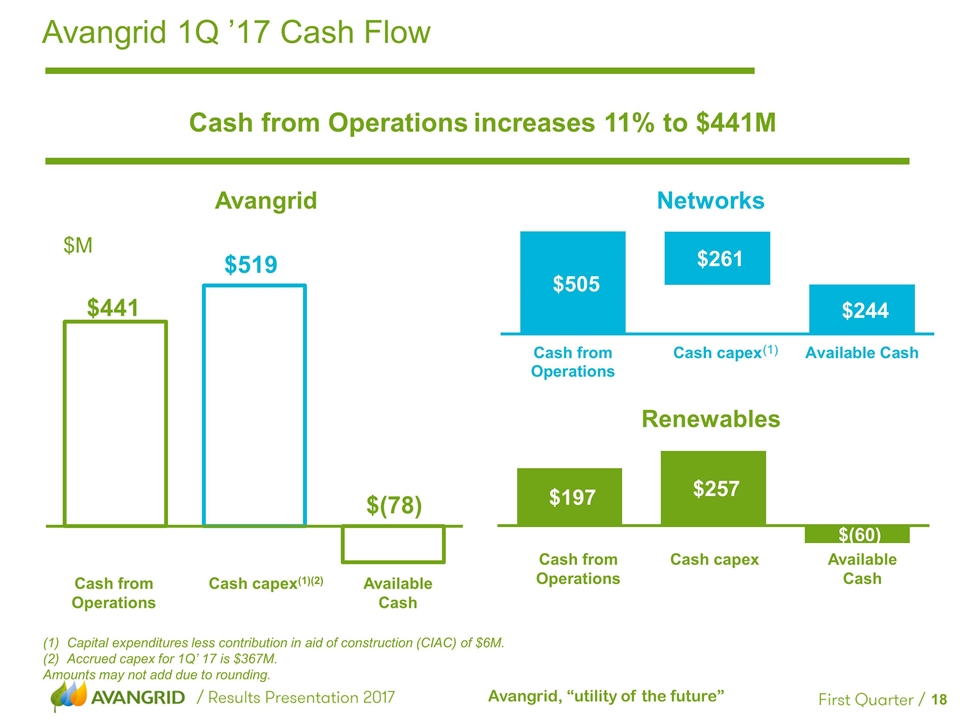
Avangrid 1Q ’17 Cash Flow Cash from Operations increases 11% to $441M 965 $M Renewables Networks Avangrid Capital expenditures less contribution in aid of construction (CIAC) of $6M. Accrued capex for 1Q’ 17 is $367M. Amounts may not add due to rounding. Cash from Operations Cash capex(1)(2) Available Cash $441 Cash from Operations Cash capex Available Cash (1)
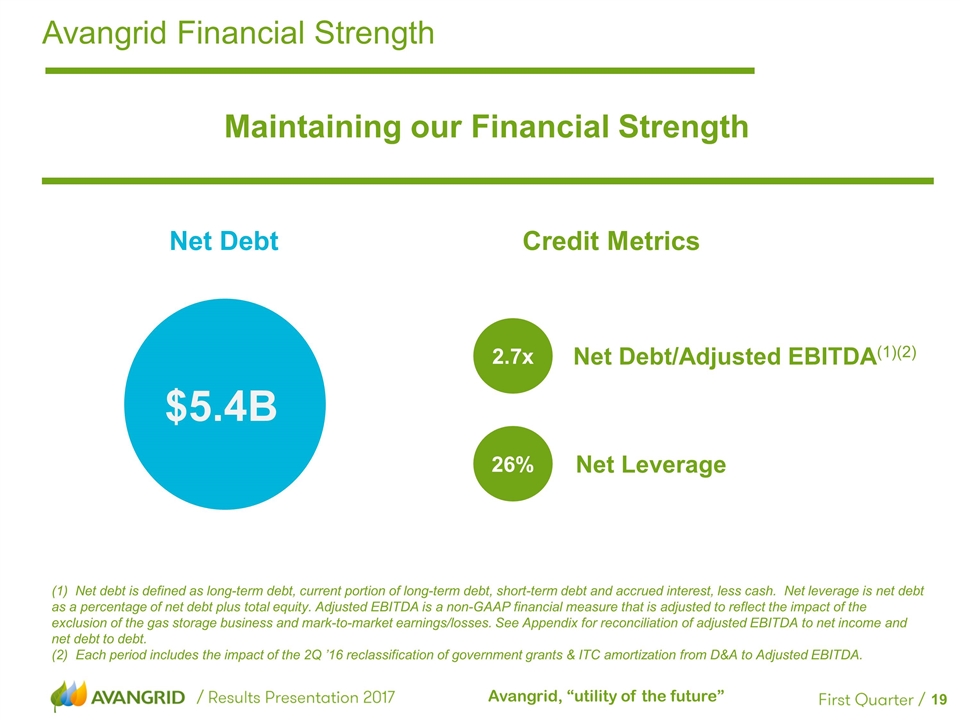
Avangrid Financial Strength Maintaining our Financial Strength $5.4B Net Debt Credit Metrics Net Debt/Adjusted EBITDA(1)(2) Net Leverage 2.7x 26% Net debt is defined as long-term debt, current portion of long-term debt, short-term debt and accrued interest, less cash. Net leverage is net debt as a percentage of net debt plus total equity. Adjusted EBITDA is a non-GAAP financial measure that is adjusted to reflect the impact of the exclusion of the gas storage business and mark-to-market earnings/losses. See Appendix for reconciliation of adjusted EBITDA to net income and net debt to debt. Each period includes the impact of the 2Q ’16 reclassification of government grants & ITC amortization from D&A to Adjusted EBITDA.
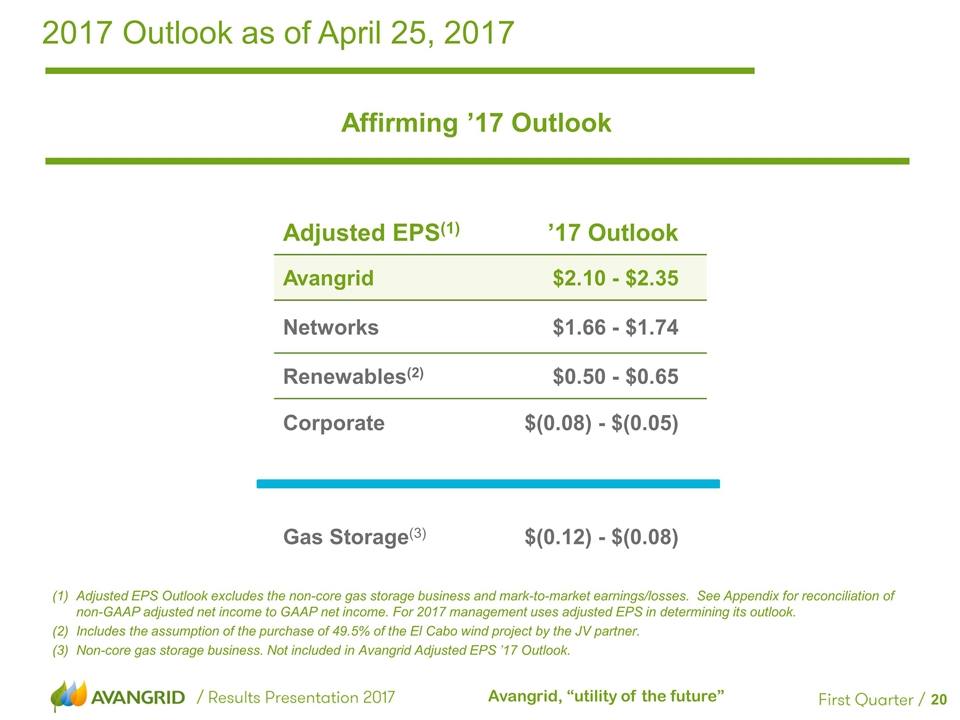
2017 Outlook as of April 25, 2017 Adjusted EPS Outlook excludes the non-core gas storage business and mark-to-market earnings/losses. See Appendix for reconciliation of non-GAAP adjusted net income to GAAP net income. For 2017 management uses adjusted EPS in determining its outlook. Includes the assumption of the purchase of 49.5% of the El Cabo wind project by the JV partner. Non-core gas storage business. Not included in Avangrid Adjusted EPS ’17 Outlook. Adjusted EPS(1) ’17 Outlook Avangrid $2.10 - $2.35 Networks $1.66 - $1.74 Renewables(2) $0.50 - $0.65 Corporate $(0.08) - $(0.05) Gas Storage(3) $(0.12) - $(0.08) Affirming ’17 Outlook
Appendix
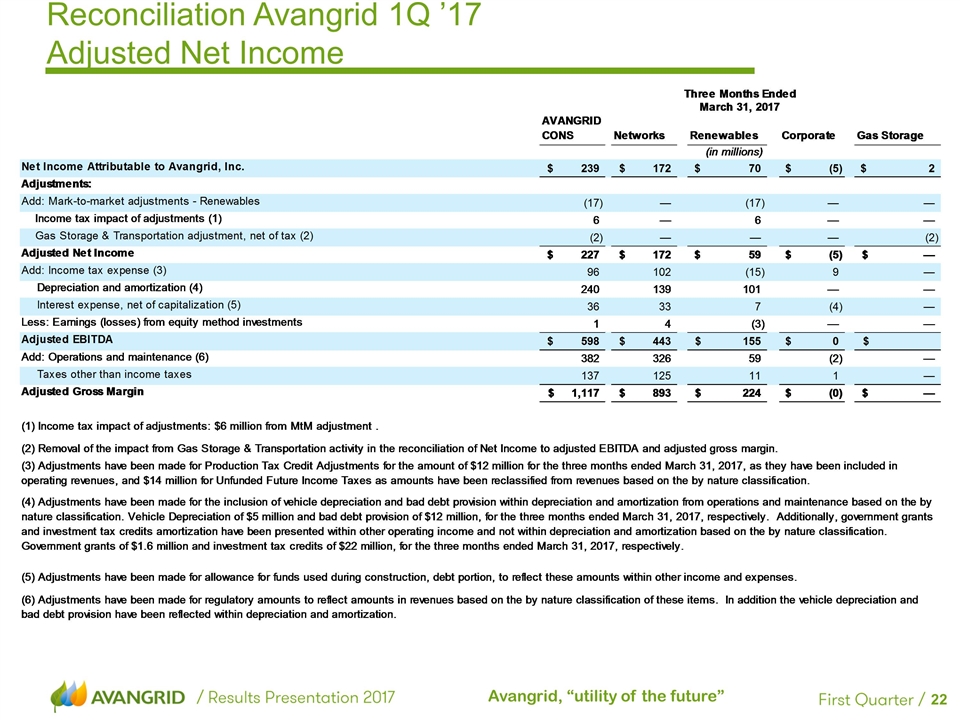
Reconciliation Avangrid 1Q ’17 Adjusted Net Income
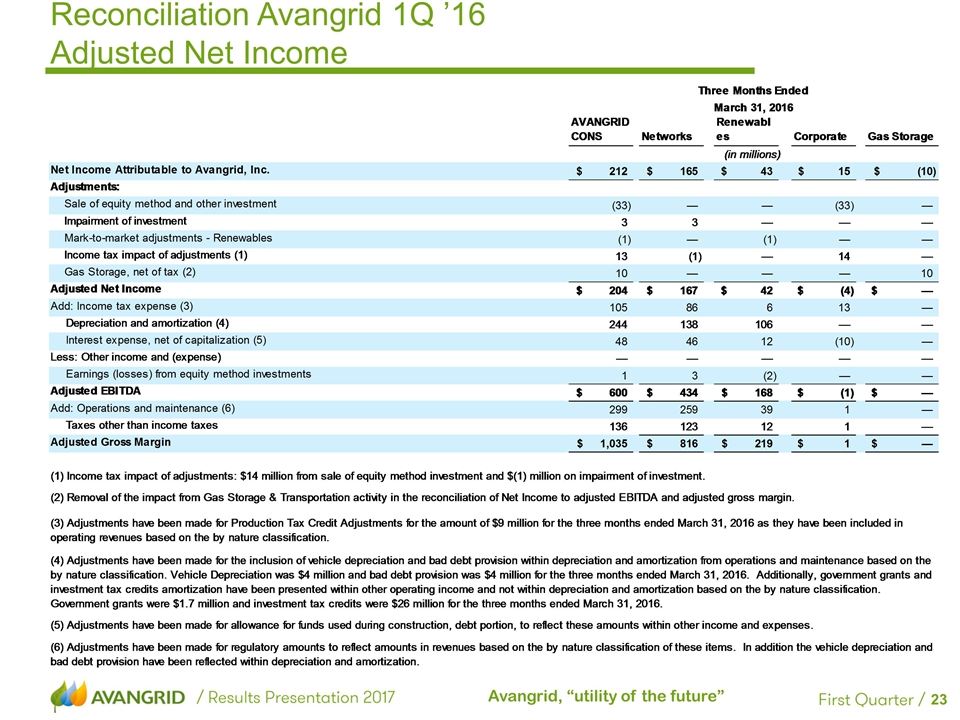
Reconciliation Avangrid 1Q ’16 Adjusted Net Income
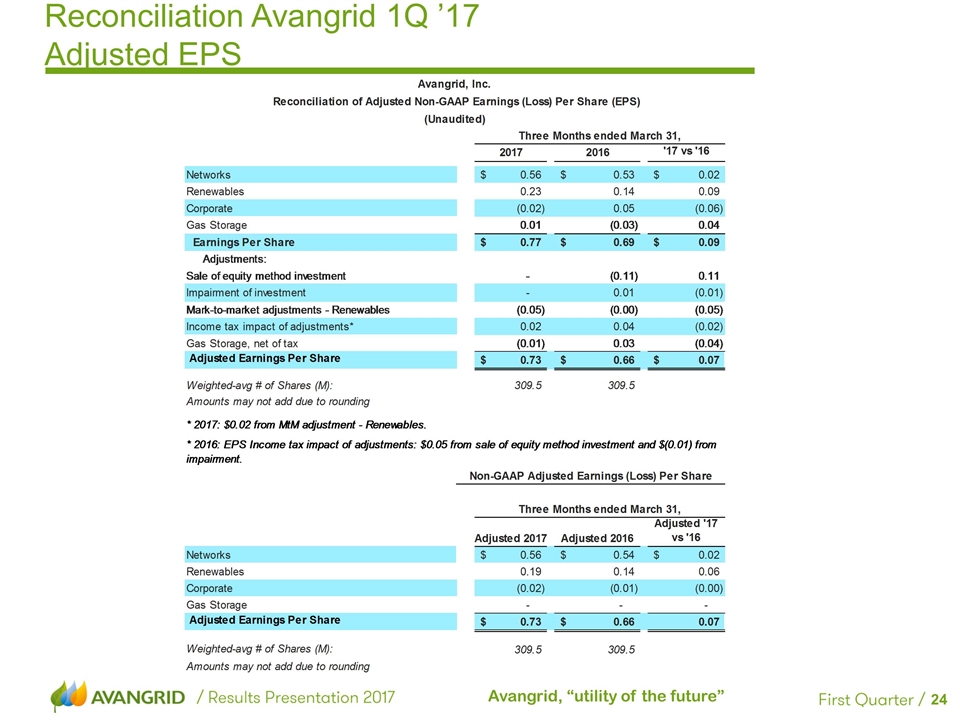
Reconciliation Avangrid 1Q ’17 Adjusted EPS
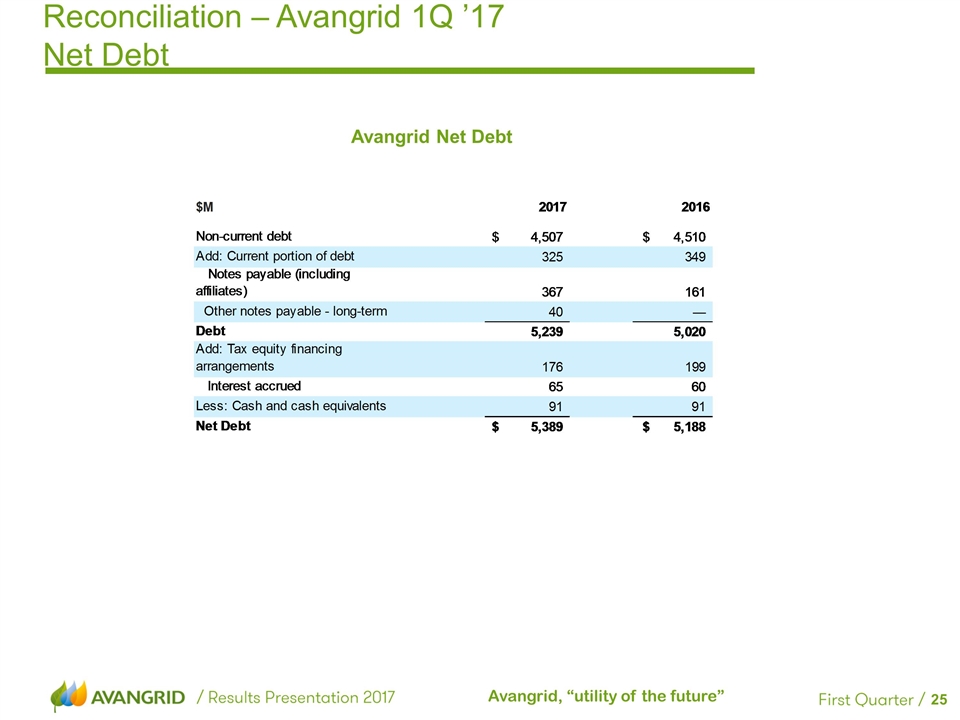
Reconciliation – Avangrid 1Q ’17 Net Debt Avangrid Net Debt
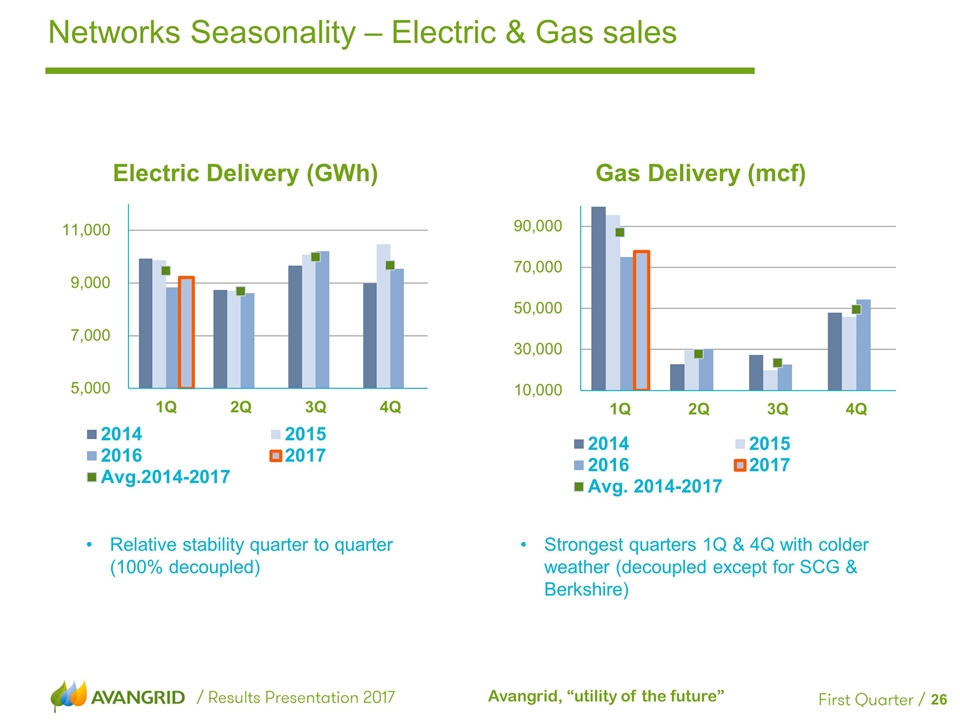
Networks Seasonality – Electric & Gas sales Relative stability quarter to quarter (100% decoupled) Strongest quarters 1Q & 4Q with colder weather (decoupled except for SCG & Berkshire)
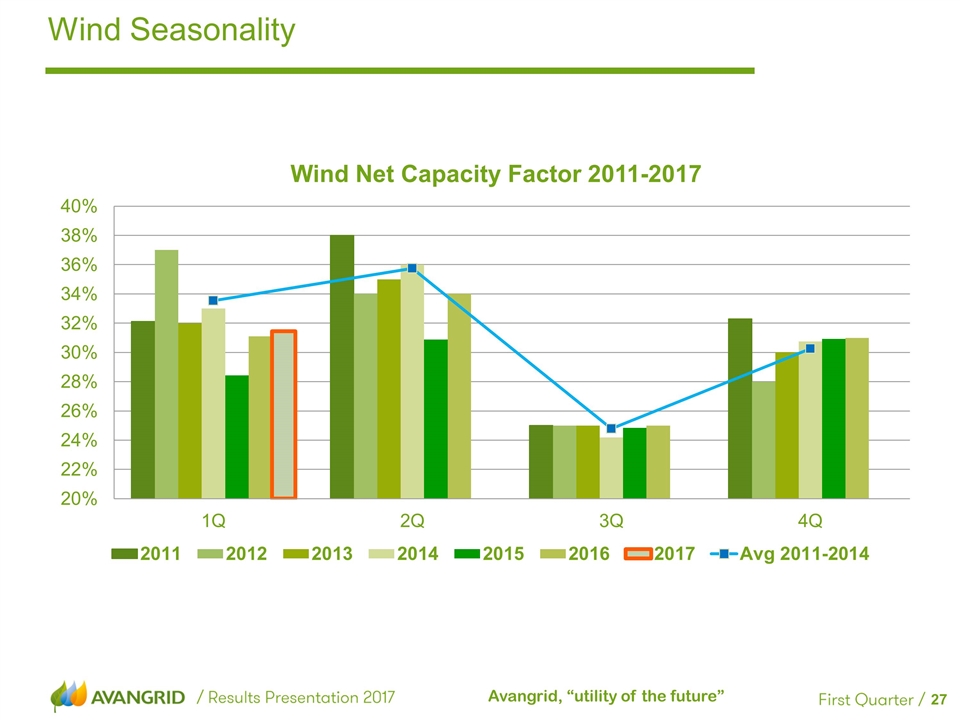
Wind Seasonality
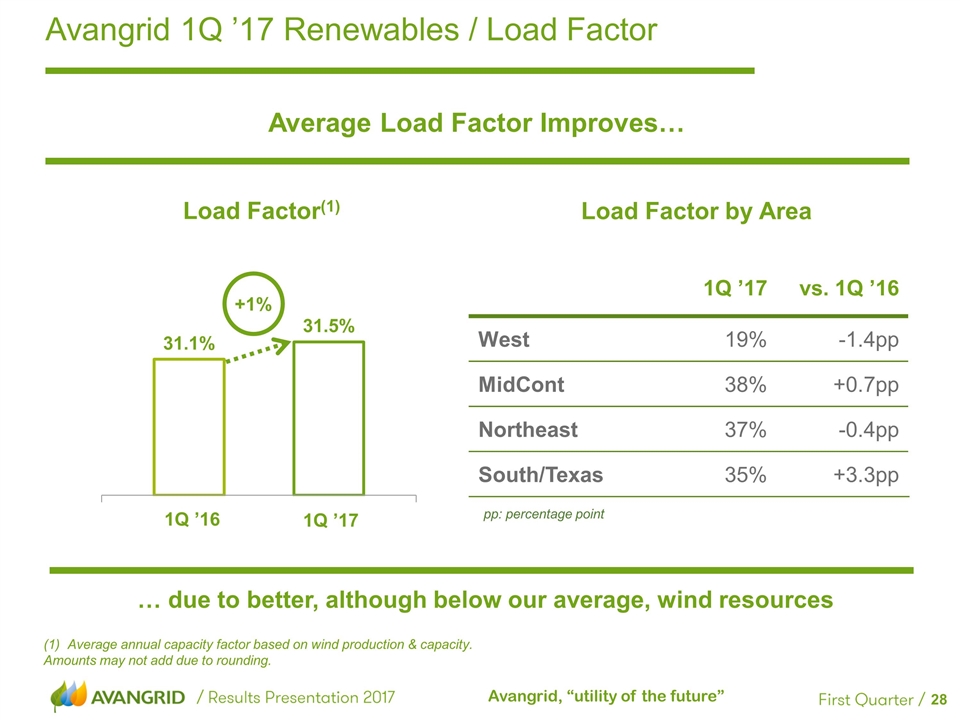
Avangrid 1Q ’17 Renewables / Load Factor Average Load Factor Improves… Load Factor(1) Average annual capacity factor based on wind production & capacity. Amounts may not add due to rounding. … due to better, although below our average, wind resources 1Q ’16 1Q ’17 +1% Load Factor by Area pp: percentage point 1Q ’17 vs. 1Q ’16 West 19% -1.4pp MidCont 38% +0.7pp Northeast 37% -0.4pp South/Texas 35% +3.3pp
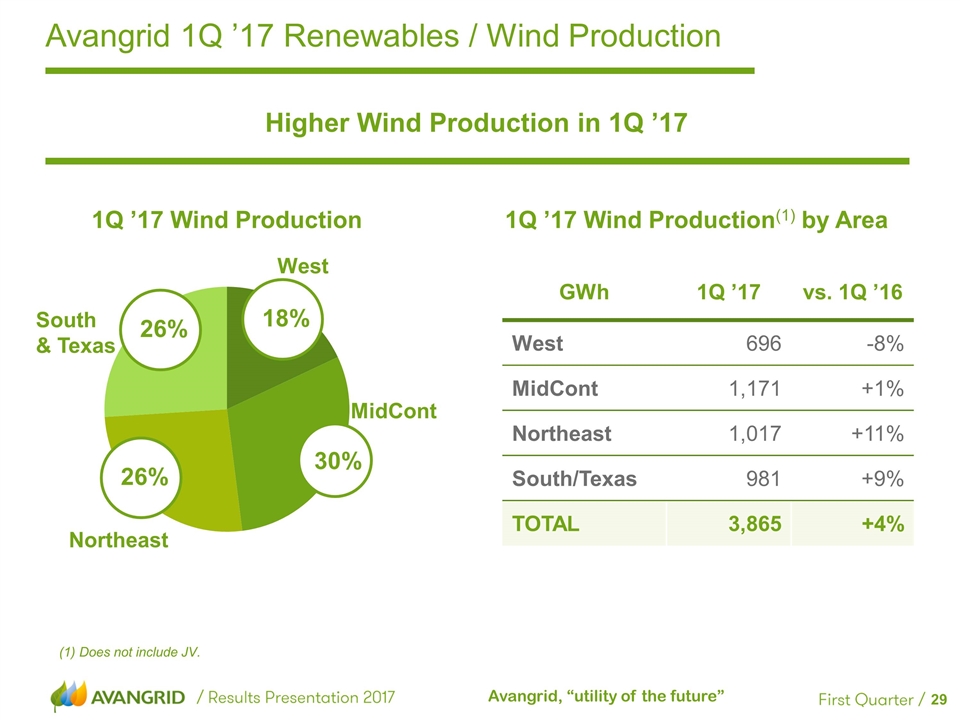
Avangrid 1Q ’17 Renewables / Wind Production Higher Wind Production in 1Q ’17 1Q ’17 Wind Production (1) Does not include JV. 1Q ’17 Wind Production(1) by Area GWh 1Q ’17 vs. 1Q ’16 West 696 -8% MidCont 1,171 +1% Northeast 1,017 +11% South/Texas 981 +9% TOTAL 3,865 +4% Northeast MidCont South & Texas West 18% 26% 30% 26%
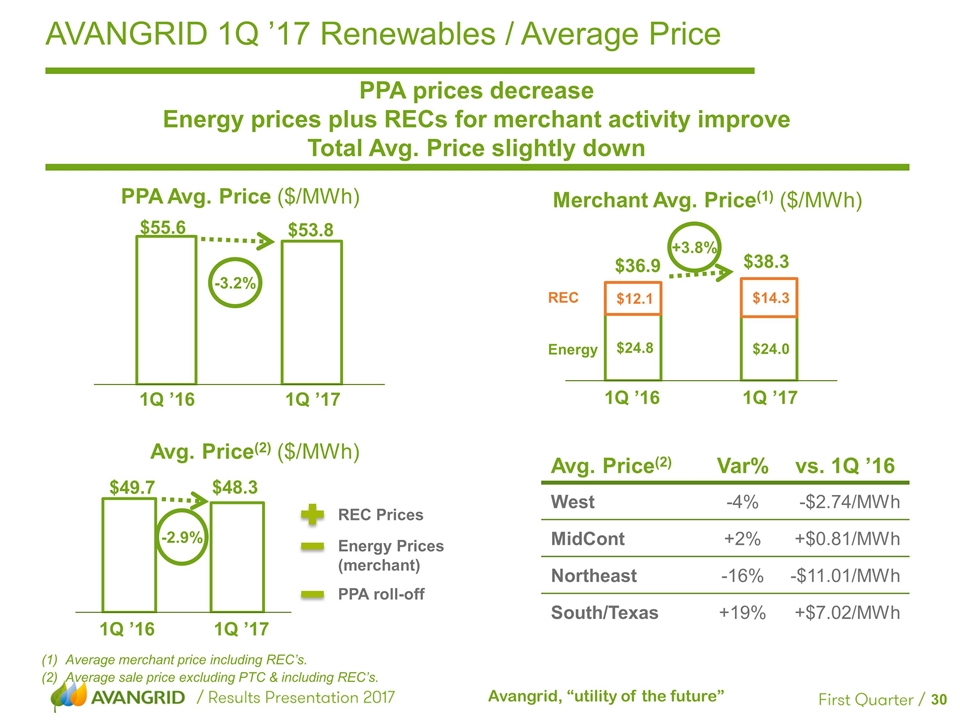
AVANGRID 1Q ’17 Renewables / Average Price PPA prices decrease Energy prices plus RECs for merchant activity improve Total Avg. Price slightly down Average merchant price including REC’s. Average sale price excluding PTC & including REC’s. 1Q ’16 1Q ’17 +3.8% 1Q ’16 1Q ’17 $55.6 $53.8 PPA Avg. Price ($/MWh) Merchant Avg. Price(1) ($/MWh) 1Q ’16 1Q ’17 -2.9% $49.7 $48.3 Avg. Price(2) ($/MWh) REC Prices PPA roll-off Avg. Price(2) Var% vs. 1Q ’16 West -4% -$2.74/MWh MidCont +2% +$0.81/MWh Northeast -16% -$11.01/MWh South/Texas +19% +$7.02/MWh -3.2% Energy Prices (merchant) REC Energy


