Exhibit 99.2
Legal Notice FORWARD LOOKING STATEMENTS Certain statements in this presentation may relate to our future business and financial performance and future events or developments involving us and our subsidiaries that are not purely historical and may constitute “forward-looking statements” within the meaning of the Private Securities Litigation Reform Act of 1995. Forward-looking statements may be identified by the use of forward-looking terms such as “may,” “will,” “should,” “can,” “expects,” “believes,” “anticipates,” “intends,” “plans,” “estimates,” “projects,” “assumes,” “guides,” “targets,” “forecasts,” “is confident that” and “seeks” or the negative of such terms or other variations on such terms or comparable terminology. Such forward looking statements include, but are not limited to, statements about our plans, objectives and intentions, outlooks or expectations for earnings, revenues, expenses or other future financial or business performance, strategies or expectations, or the impact of legal or regulatory matters on our business, results of operations or financial condition. Such statements are based upon the current beliefs and expectations of our management and are subject to significant risks and uncertainties that could cause actual outcomes and results to differ materially. Important factors that could cause actual results to differ materially from those indicated by such forward-looking statements include, without limitation, the risks and uncertainties set forth under the section entitled “Risk Factors” and “Management’s Discussion and Analysis of Financial Condition and Results of Operations” in our Annual Report on Form 10-K for the year ended December 31, 2016 and our Quarterly Report on Form 10-Q for the three months ended March 31, 2017, which is on file with the Securities and Exchange Commission (SEC) and available on our investor relations website at www.Avangrid.com and on the SEC website at www.sec.gov. Additional information will also be set forth in subsequent filings with the SEC. You should consider these factors carefully in evaluating for-ward looking statements. Should one or more of these risks or uncertainties materialize, or should any of the underlying assumptions prove incorrect, actual results may vary in material respects from those expressed or implied by these forward-looking statements. You should not place undue reliance on these forward-looking statements. We do not undertake any obligation to update or revise any forward-looking statements to reflect events or circumstances after the date of this presentation whether as a result of new information, future events or otherwise, except as may be required under applicable securities laws. About AVANGRID Avangrid, Inc. (NYSE: AGR) is a diversified energy and utility company with more than $31 billion in assets and operations in 27 states. The company owns regulated utilities and electricity generation assets through two primary lines of business, Avangrid Networks and Avangrid Renewables. Avangrid Networks is comprised of eight electric and natural gas utilities, serving approximately 3.2 million customers in New York and New England. Avangrid Renewables operates 6.6 gigawatts of electricity capacity, primarily through wind power, in 23 states across the United States. AVANGRID employs approximately 6,800 people. For more information, visit www.avangrid.com. Investors@AVANGRID.com James Torgerson Chief Executive Officer Richard Nicholas Chief Financial Officer
Legal Notice Use of Non-GAAP Financial Measures To supplement our consolidated financial statements presented in accordance with U.S. GAAP, AVANGRID considers certain non-GAAP financial measures that are not prepared in accordance with U.S. GAAP, including adjusted net income, adjusted EPS, adjusted gross margin and adjusted EBITDA. The non-GAAP financial measures we use are specific to AVANGRID and the non-GAAP financial measures of other companies may not be calculated in the same manner. We use these non-GAAP financial measures, in addition to U.S. GAAP measures, to establish operating budgets and operational goals to manage and monitor our business, evaluate our operating and financial performance and to compare such performance to prior periods and to the performance of our competitors. We believe that presenting such non-GAAP financial measures is useful because such measures can be used to analyze and compare profitability between companies and industries because it eliminates the impact of financing and certain non-cash charges as well as allow for an evaluation of AVANGRID with a focus on the performance of its core operations. In addition, we present non-GAAP financial measures because we believe that they and other similar measures are widely used by certain investors, securities analysts and other interested parties as supplemental measures of performance. We provide adjusted net income, which is adjusted to reflect the effect of mark-to-market changes in the fair value of derivative instruments used by AVANGRID to economically hedge market price fluctuations in related underlying physical transactions for the purchase and sale of electricity, adjustments for the non-core Gas Storage business, and the impairment of certain investments and excludes the sale of certain equity investments. We define adjusted EBITDA as net income attributable to AVANGRID, adding back income tax expense, depreciation, amortization, impairment of non-current assets and interest expense, net of capitalization, and then subtracting other income and earnings from equity method investments. We also define adjusted gross margin as adjusted EBITDA adding back operations and maintenance and taxes other than income taxes and then subtracting transmission wheeling. The most directly comparable U.S. GAAP measure to adjusted EBITDA and adjusted gross margin is net income. We believe that presenting these non-GAAP financial measures is useful in understanding and evaluating actual and projected financial performance and contribution of AVANGRID core lines of business and to more fully compare and explain our results. The most directly comparable U.S. GAAP measure to adjusted net income is net income. We also provide adjusted EPS, which is adjusted net income converted to an earnings per share amount. The use of non-GAAP financial measures is not intended to be considered in isolation or as a substitute for, or superior to, AVANGRID’s U.S. GAAP financial information, and investors are cautioned that the non-GAAP financial measures are limited in their usefulness, may be unique to AVANGRID, and should be considered only as a supplement to AVANGRID’s U.S. GAAP financial measures. The non-GAAP financial measures may not be comparable to other similarly titled measures of other companies and have limitations as analytical tools. Non-GAAP financial measures are not primary measurements of our performance under U.S. GAAP and should not be considered as alternatives to operating income, net income or any other performance measures determined in accordance with U.S. GAAP.
2Q & YTD ’17 Highlights James Torgerson
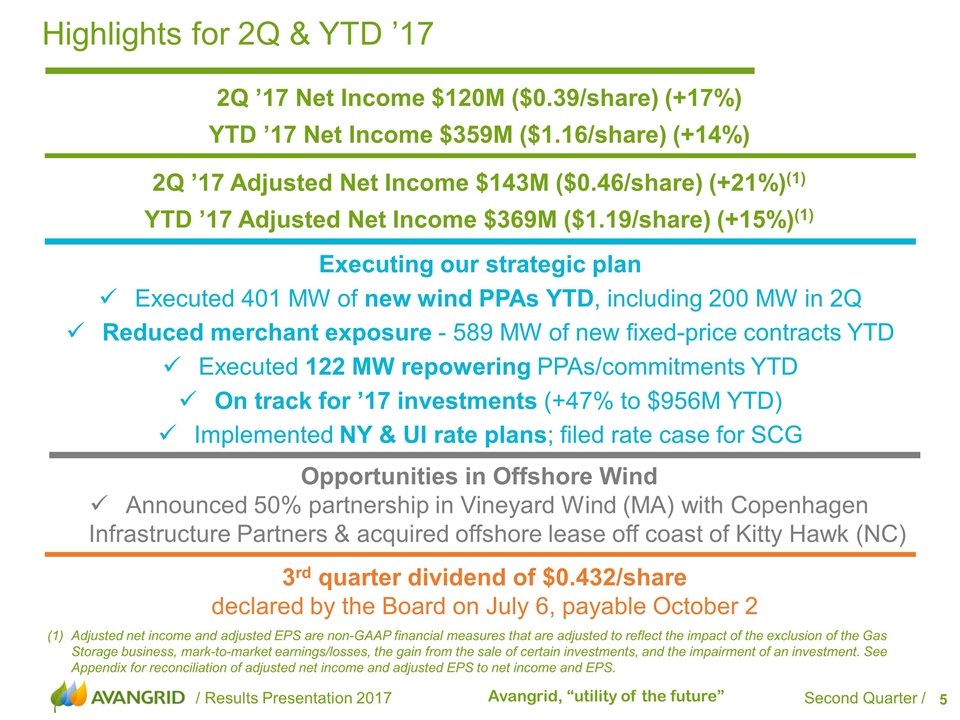
Opportunities in Offshore Wind Announced 50% partnership in Vineyard Wind (MA) with Copenhagen Infrastructure Partners & acquired offshore lease off coast of Kitty Hawk (NC) 2Q ’17 Net Income $120M ($0.39/share) (+17%) YTD ’17 Net Income $359M ($1.16/share) (+14%) Highlights for 2Q & YTD ’17 Executing our strategic plan Executed 401 MW of new wind PPAs YTD, including 200 MW in 2Q Reduced merchant exposure - 589 MW of new fixed-price contracts YTD Executed 122 MW repowering PPAs/commitments YTD On track for ’17 investments (+47% to $956M YTD) Implemented NY & UI rate plans; filed rate case for SCG 3rd quarter dividend of $0.432/share declared by the Board on July 6, payable October 2 Adjusted net income and adjusted EPS are non-GAAP financial measures that are adjusted to reflect the impact of the exclusion of the Gas Storage business, mark-to-market earnings/losses, the gain from the sale of certain investments, and the impairment of an investment. See Appendix for reconciliation of adjusted net income and adjusted EPS to net income and EPS. 2Q ’17 Adjusted Net Income $143M ($0.46/share) (+21%)(1) YTD ’17 Adjusted Net Income $369M ($1.19/share) (+15%)(1)
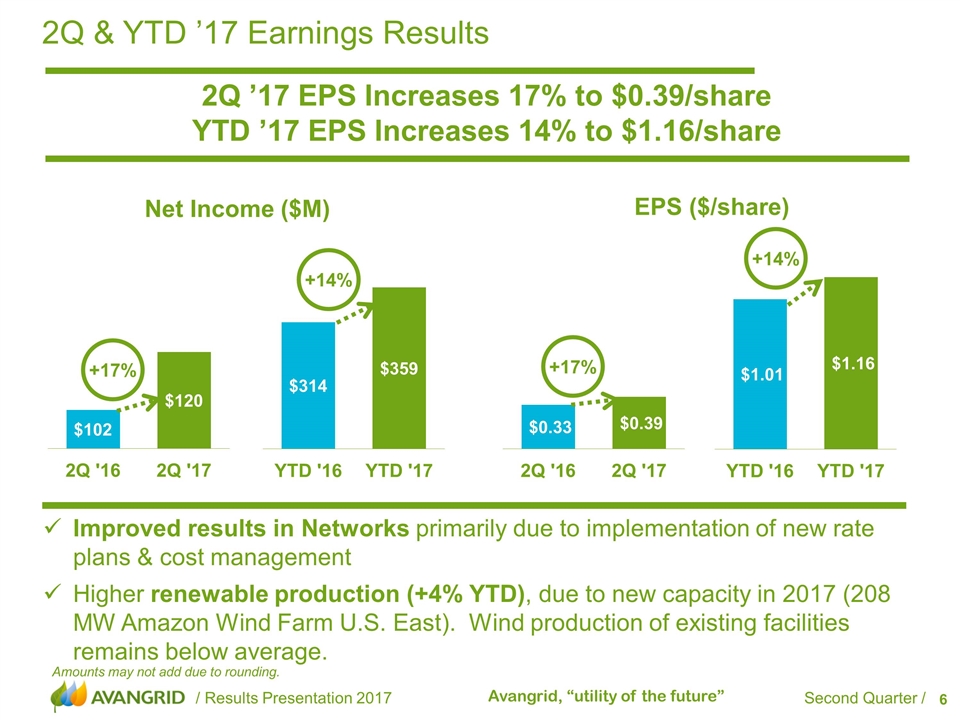
2Q & YTD ’17 Earnings Results 2Q ’17 EPS Increases 17% to $0.39/share YTD ’17 EPS Increases 14% to $1.16/share Net Income ($M) EPS ($/share) Improved results in Networks primarily due to implementation of new rate plans & cost management Higher renewable production (+4% YTD), due to new capacity in 2017 (208 MW Amazon Wind Farm U.S. East). Wind production of existing facilities remains below average. +17% +14% +17% +14% Amounts may not add due to rounding.
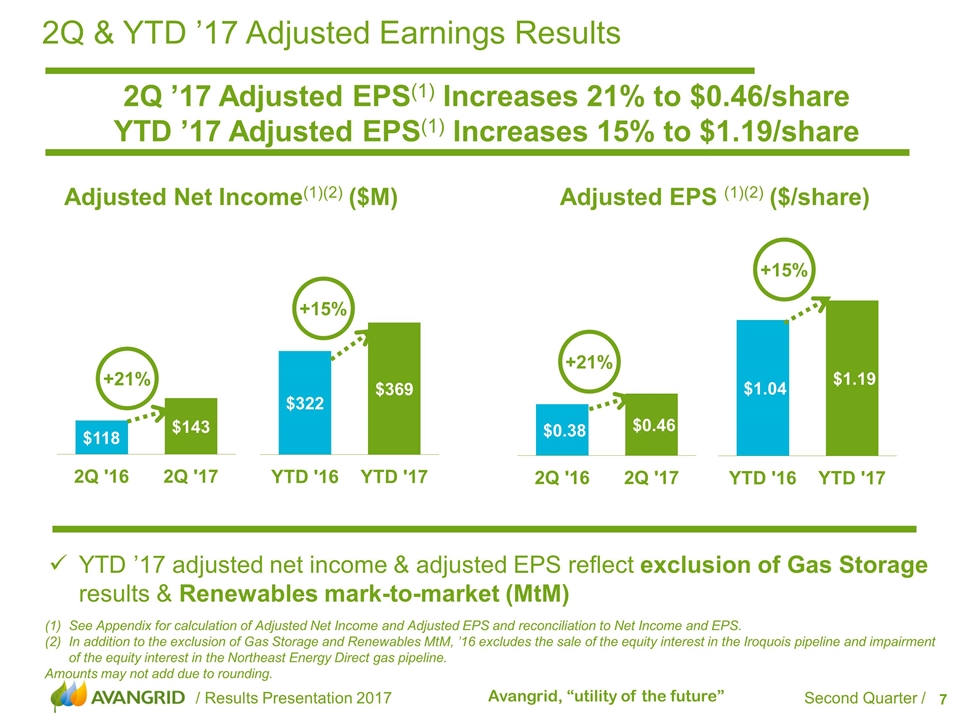
2Q & YTD ’17 Adjusted Earnings Results 2Q ’17 Adjusted EPS(1) Increases 21% to $0.46/share YTD ’17 Adjusted EPS(1) Increases 15% to $1.19/share See Appendix for calculation of Adjusted Net Income and Adjusted EPS and reconciliation to Net Income and EPS. In addition to the exclusion of Gas Storage and Renewables MtM, ’16 excludes the sale of the equity interest in the Iroquois pipeline and impairment of the equity interest in the Northeast Energy Direct gas pipeline. Amounts may not add due to rounding. Adjusted Net Income(1)(2) ($M) Adjusted EPS (1)(2) ($/share) +21% +15% +21% +15% YTD ’17 adjusted net income & adjusted EPS reflect exclusion of Gas Storage results & Renewables mark-to-market (MtM)
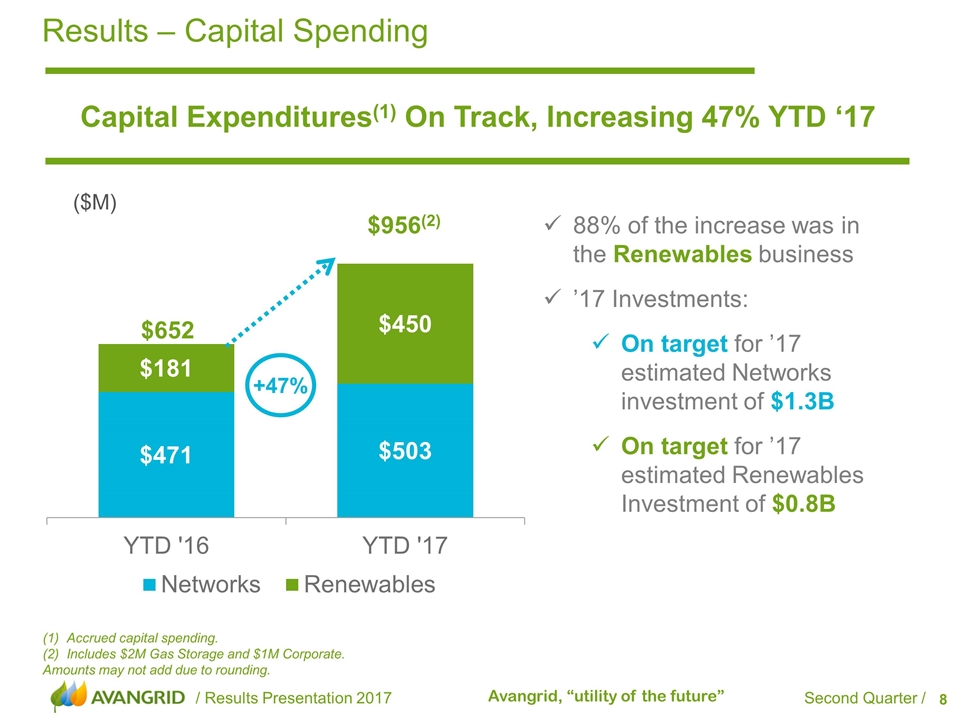
Results – Capital Spending Capital Expenditures(1) On Track, Increasing 47% YTD ‘17 Accrued capital spending. Includes $2M Gas Storage and $1M Corporate. Amounts may not add due to rounding. +47% 88% of the increase was in the Renewables business ’17 Investments: On target for ’17 estimated Networks investment of $1.3B On target for ’17 estimated Renewables Investment of $0.8B ($M) $956(2) $652
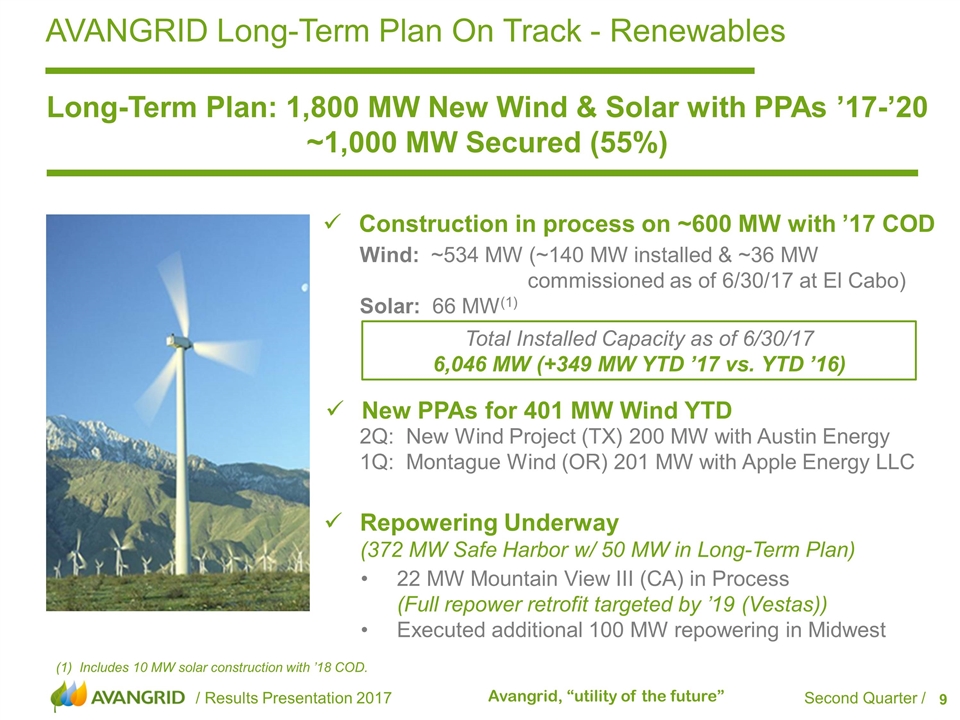
AVANGRID Long-Term Plan On Track - Renewables New PPAs for 401 MW Wind YTD 22 MW Mountain View III (CA) in Process (Full repower retrofit targeted by ’19 (Vestas)) Executed additional 100 MW repowering in Midwest 2Q: New Wind Project (TX) 200 MW with Austin Energy 1Q: Montague Wind (OR) 201 MW with Apple Energy LLC Wind: ~534 MW (~140 MW installed & ~36 MW commissioned as of 6/30/17 at El Cabo) Solar: 66 MW(1) Repowering Underway (372 MW Safe Harbor w/ 50 MW in Long-Term Plan) Construction in process on ~600 MW with ’17 COD Long-Term Plan: 1,800 MW New Wind & Solar with PPAs ’17-’20 ~1,000 MW Secured (55%) (1) Includes 10 MW solar construction with ’18 COD. Total Installed Capacity as of 6/30/17 6,046 MW (+349 MW YTD ’17 vs. YTD ’16)
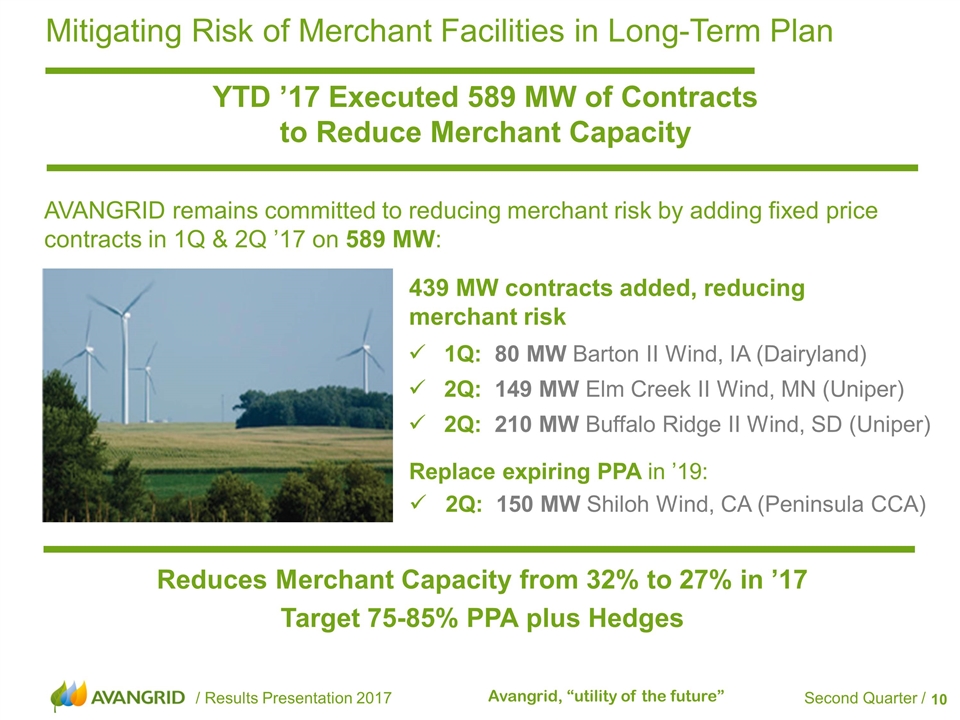
Mitigating Risk of Merchant Facilities in Long-Term Plan YTD ’17 Executed 589 MW of Contracts to Reduce Merchant Capacity AVANGRID remains committed to reducing merchant risk by adding fixed price contracts in 1Q & 2Q ’17 on 589 MW: 1Q: 80 MW Barton II Wind, IA (Dairyland) 2Q: 149 MW Elm Creek II Wind, MN (Uniper) 2Q: 210 MW Buffalo Ridge II Wind, SD (Uniper) 439 MW contracts added, reducing merchant risk Reduces Merchant Capacity from 32% to 27% in ’17 Target 75-85% PPA plus Hedges Replace expiring PPA in ’19: 2Q: 150 MW Shiloh Wind, CA (Peninsula CCA)
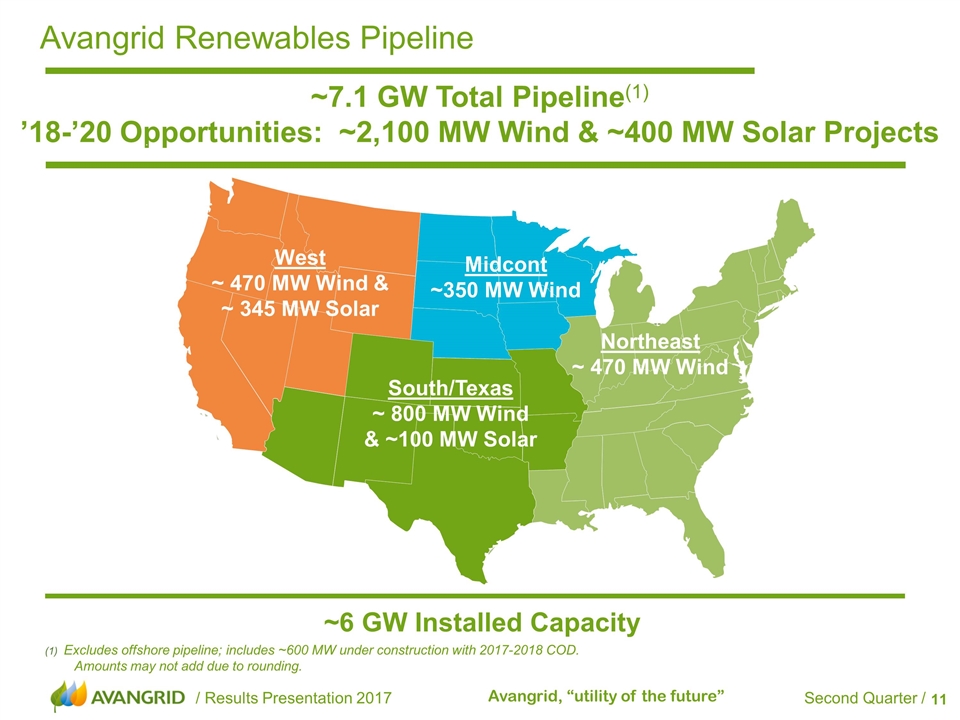
Avangrid Renewables Pipeline ~7.1 GW Total Pipeline(1) ’18-’20 Opportunities: ~2,100 MW Wind & ~400 MW Solar Projects (1) Excludes offshore pipeline; includes ~600 MW under construction with 2017-2018 COD. Amounts may not add due to rounding. West ~ 470 MW Wind & ~ 345 MW Solar South/Texas ~ 800 MW Wind & ~100 MW Solar Midcont ~350 MW Wind Northeast ~ 470 MW Wind ~6 GW Installed Capacity
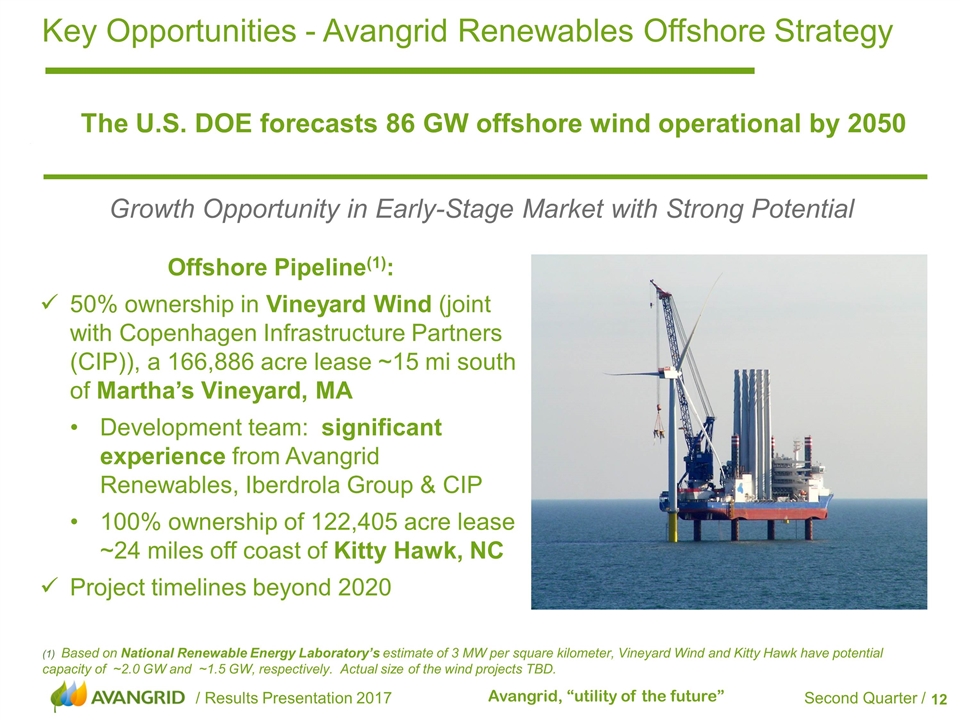
Growth Opportunity in Early-Stage Market with Strong Potential Key Opportunities - Avangrid Renewables Offshore Strategy The U.S. DOE forecasts 86 GW offshore wind operational by 2050 Offshore Pipeline(1): 50% ownership in Vineyard Wind (joint with Copenhagen Infrastructure Partners (CIP)), a 166,886 acre lease ~15 mi south of Martha’s Vineyard, MA Development team: significant experience from Avangrid Renewables, Iberdrola Group & CIP 100% ownership of 122,405 acre lease ~24 miles off coast of Kitty Hawk, NC Project timelines beyond 2020 (1) Based on National Renewable Energy Laboratory’s estimate of 3 MW per square kilometer, Vineyard Wind and Kitty Hawk have potential capacity of ~2.0 GW and ~1.5 GW, respectively. Actual size of the wind projects TBD.
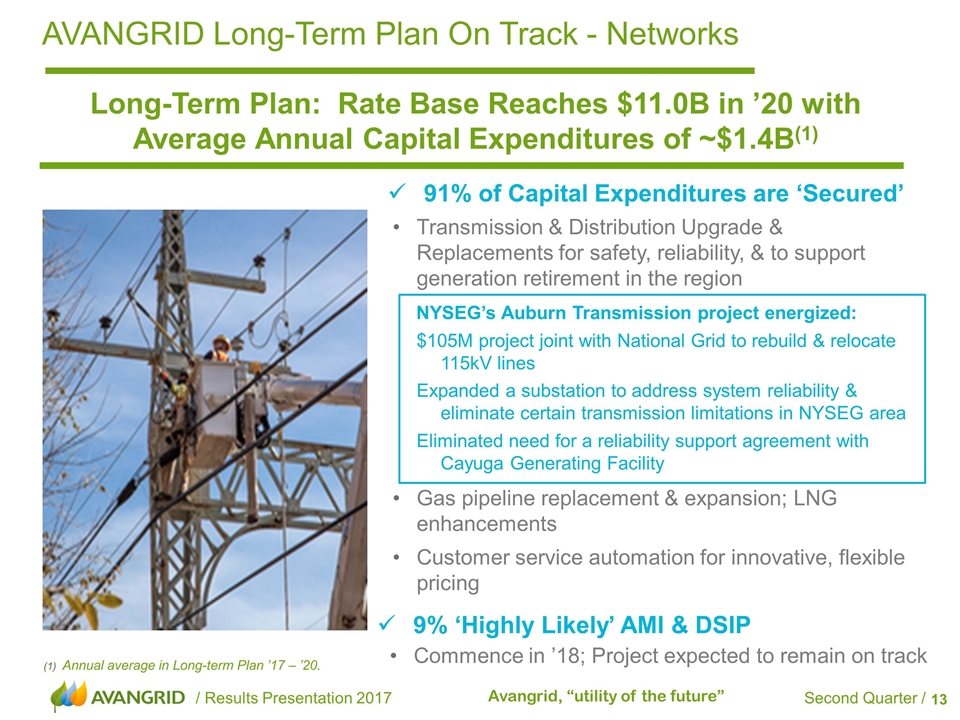
91% of Capital Expenditures are ‘Secured’ AVANGRID Long-Term Plan On Track - Networks Long-Term Plan: Rate Base Reaches $11.0B in ’20 with Average Annual Capital Expenditures of ~$1.4B(1) Transmission & Distribution Upgrade & Replacements for safety, reliability, & to support generation retirement in the region NYSEG’s Auburn Transmission project energized: $105M project joint with National Grid to rebuild & relocate 115kV lines Expanded a substation to address system reliability & eliminate certain transmission limitations in NYSEG area Eliminated need for a reliability support agreement with Cayuga Generating Facility Gas pipeline replacement & expansion; LNG enhancements Customer service automation for innovative, flexible pricing 9% ‘Highly Likely’ AMI & DSIP Commence in ’18; Project expected to remain on track (1) Annual average in Long-term Plan ’17 – ’20.
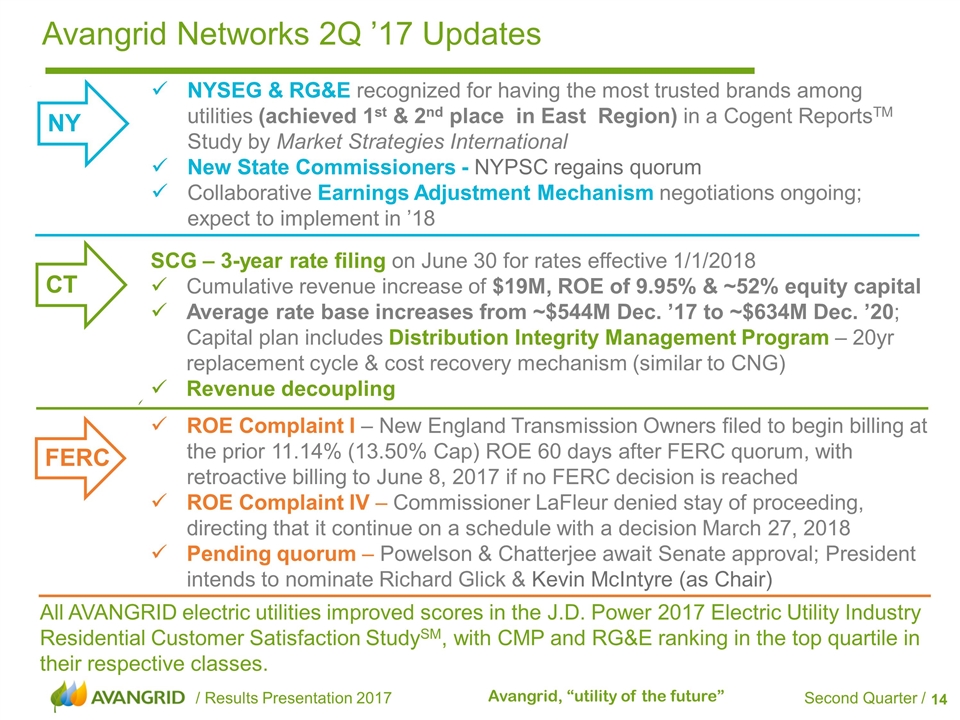
Avangrid Networks 2Q ’17 Updates NYSEG & RG&E recognized for having the most trusted brands among utilities (achieved 1st & 2nd place in East Region) in a Cogent ReportsTM Study by Market Strategies International New State Commissioners - NYPSC regains quorum Collaborative Earnings Adjustment Mechanism negotiations ongoing; expect to implement in ’18 NY ROE Complaint I – New England Transmission Owners filed to begin billing at the prior 11.14% (13.50% Cap) ROE 60 days after FERC quorum, with retroactive billing to June 8, 2017 if no FERC decision is reached ROE Complaint IV – Commissioner LaFleur denied stay of proceeding, directing that it continue on a schedule with a decision March 27, 2018 Pending quorum – Powelson & Chatterjee await Senate approval; President intends to nominate Richard Glick & Kevin McIntyre (as Chair) SCG – 3-year rate filing on June 30 for rates effective 1/1/2018 Cumulative revenue increase of $19M, ROE of 9.95% & ~52% equity capital Average rate base increases from ~$544M Dec. ’17 to ~$634M Dec. ’20; Capital plan includes Distribution Integrity Management Program – 20yr replacement cycle & cost recovery mechanism (similar to CNG) Revenue decoupling CT FERC All AVANGRID electric utilities improved scores in the J.D. Power 2017 Electric Utility Industry Residential Customer Satisfaction StudySM, with CMP and RG&E ranking in the top quartile in their respective classes.
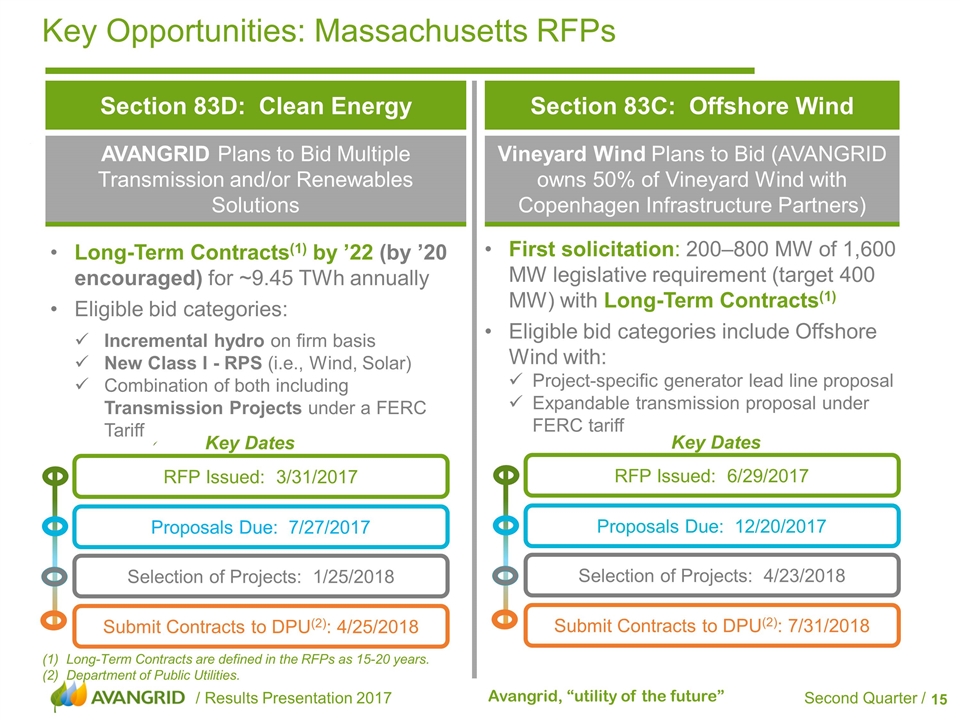
Long-Term Contracts(1) by ’22 (by ’20 encouraged) for ~9.45 TWh annually Eligible bid categories: Incremental hydro on firm basis New Class I - RPS (i.e., Wind, Solar) Combination of both including Transmission Projects under a FERC Tariff Key Opportunities: Massachusetts RFPs Section 83D: Clean Energy Key Dates RFP Issued: 3/31/2017 Proposals Due: 7/27/2017 Selection of Projects: 1/25/2018 Submit Contracts to DPU(2): 4/25/2018 AVANGRID Plans to Bid Multiple Transmission and/or Renewables Solutions Section 83C: Offshore Wind Vineyard Wind Plans to Bid (AVANGRID owns 50% of Vineyard Wind with Copenhagen Infrastructure Partners) First solicitation: 200–800 MW of 1,600 MW legislative requirement (target 400 MW) with Long-Term Contracts(1) Eligible bid categories include Offshore Wind with: Project-specific generator lead line proposal Expandable transmission proposal under FERC tariff Key Dates RFP Issued: 6/29/2017 Proposals Due: 12/20/2017 Selection of Projects: 4/23/2018 Submit Contracts to DPU(2): 7/31/2018 Long-Term Contracts are defined in the RFPs as 15-20 years. Department of Public Utilities.
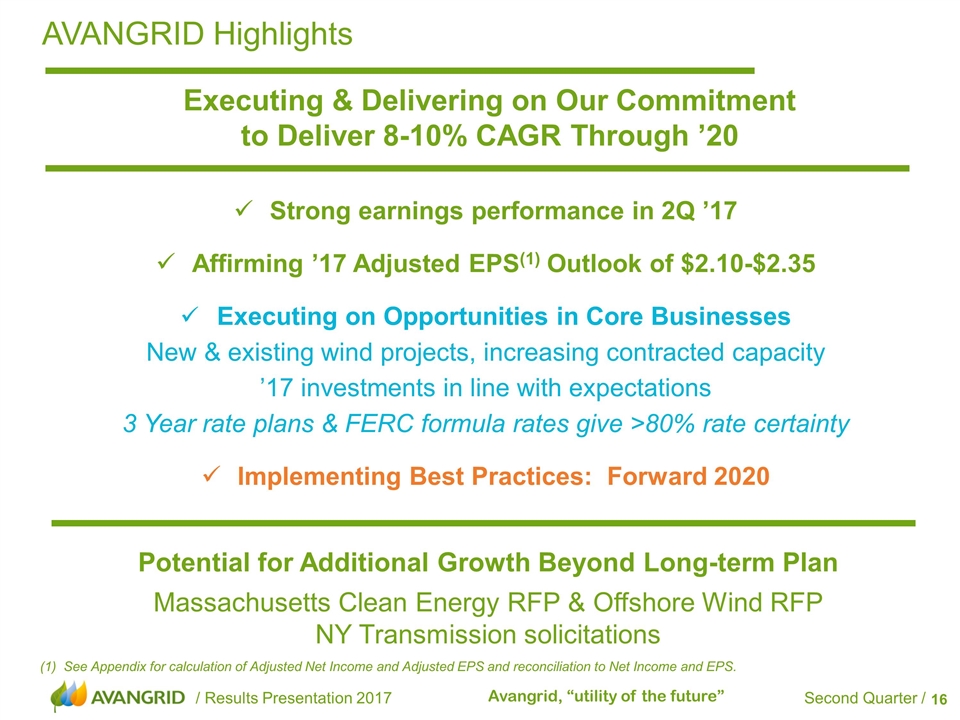
Strong earnings performance in 2Q ’17 Affirming ’17 Adjusted EPS(1) Outlook of $2.10-$2.35 Executing on Opportunities in Core Businesses New & existing wind projects, increasing contracted capacity ’17 investments in line with expectations 3 Year rate plans & FERC formula rates give >80% rate certainty Implementing Best Practices: Forward 2020 AVANGRID Highlights Executing & Delivering on Our Commitment to Deliver 8-10% CAGR Through ’20 Potential for Additional Growth Beyond Long-term Plan Massachusetts Clean Energy RFP & Offshore Wind RFP NY Transmission solicitations (1) See Appendix for calculation of Adjusted Net Income and Adjusted EPS and reconciliation to Net Income and EPS.
2Q & YTD ’17 Financial Results Richard Nicholas
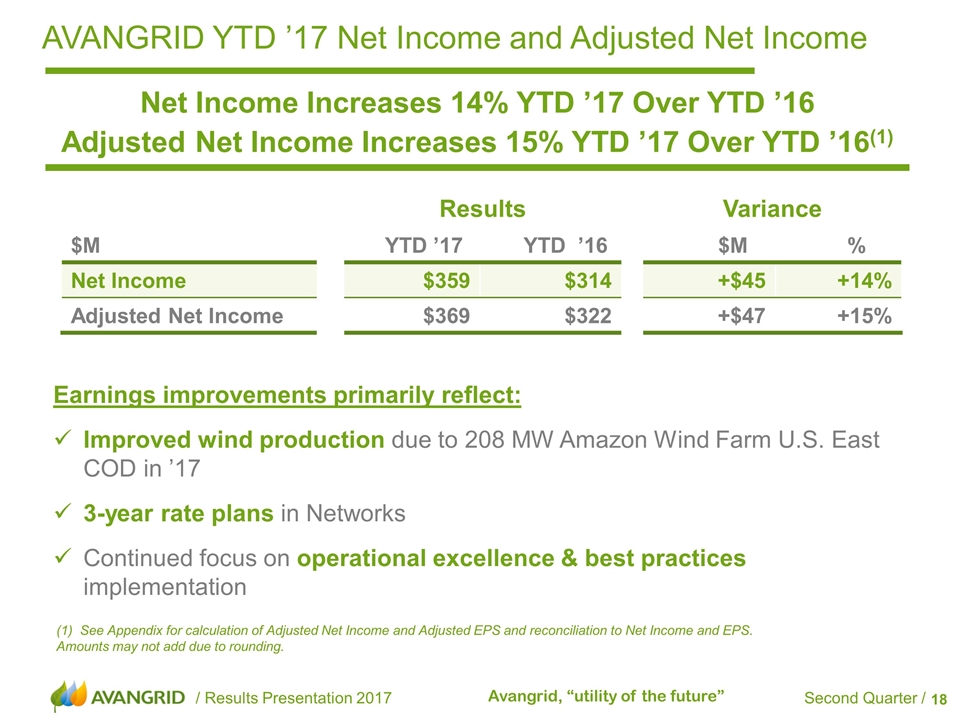
AVANGRID YTD ’17 Net Income and Adjusted Net Income Net Income Increases 14% YTD ’17 Over YTD ’16 Adjusted Net Income Increases 15% YTD ’17 Over YTD ’16(1) (1) See Appendix for calculation of Adjusted Net Income and Adjusted EPS and reconciliation to Net Income and EPS. Amounts may not add due to rounding. Results Variance $M YTD ’17 YTD ’16 $M % Net Income $359 $314 +$45 +14% Adjusted Net Income $369 $322 +$47 +15% Earnings improvements primarily reflect: Improved wind production due to 208 MW Amazon Wind Farm U.S. East COD in ’17 3-year rate plans in Networks Continued focus on operational excellence & best practices implementation
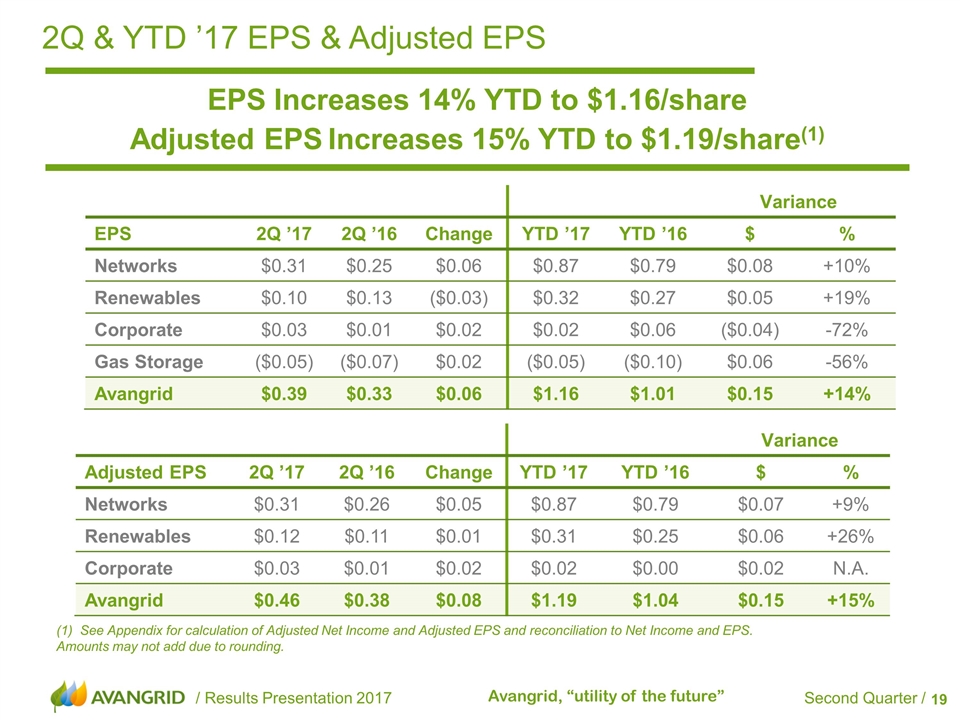
2Q & YTD ’17 EPS & Adjusted EPS EPS Increases 14% YTD to $1.16/share Adjusted EPS Increases 15% YTD to $1.19/share(1) (1) See Appendix for calculation of Adjusted Net Income and Adjusted EPS and reconciliation to Net Income and EPS. Amounts may not add due to rounding. Variance EPS 2Q ’17 2Q ’16 Change YTD ’17 YTD ’16 $ % Networks $0.31 $0.25 $0.06 $0.87 $0.79 $0.08 +10% Renewables $0.10 $0.13 ($0.03) $0.32 $0.27 $0.05 +19% Corporate $0.03 $0.01 $0.02 $0.02 $0.06 ($0.04) -72% Gas Storage ($0.05) ($0.07) $0.02 ($0.05) ($0.10) $0.06 -56% Avangrid $0.39 $0.33 $0.06 $1.16 $1.01 $0.15 +14% Variance Adjusted EPS 2Q ’17 2Q ’16 Change YTD ’17 YTD ’16 $ % Networks $0.31 $0.26 $0.05 $0.87 $0.79 $0.07 +9% Renewables $0.12 $0.11 $0.01 $0.31 $0.25 $0.06 +26% Corporate $0.03 $0.01 $0.02 $0.02 $0.00 $0.02 N.A. Avangrid $0.46 $0.38 $0.08 $1.19 $1.04 $0.15 +15%
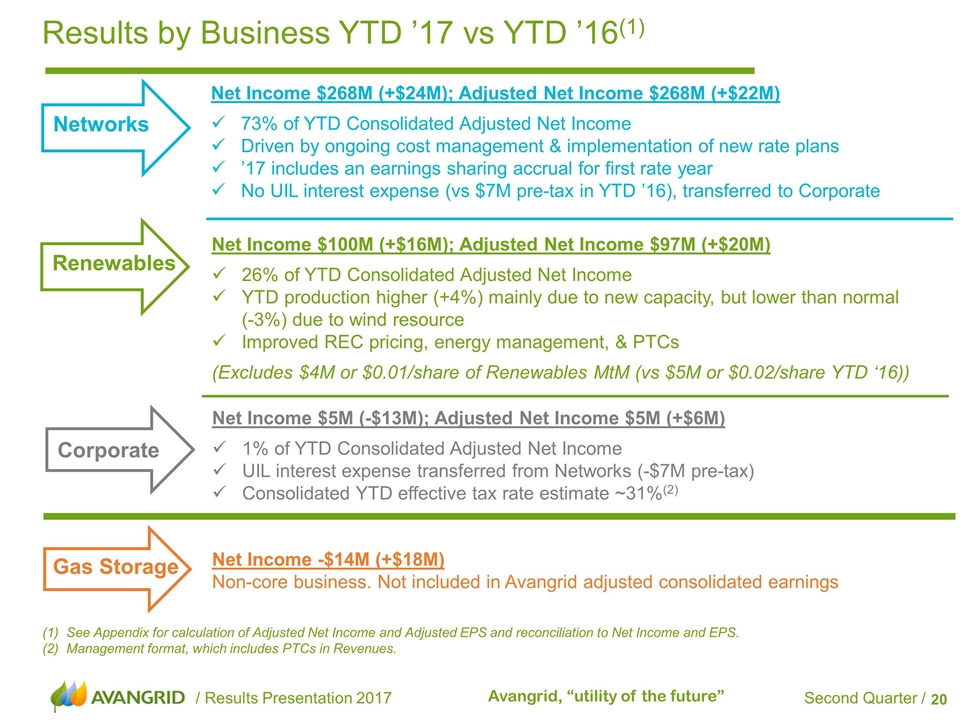
Net Income $5M (-$13M); Adjusted Net Income $5M (+$6M) 1% of YTD Consolidated Adjusted Net Income UIL interest expense transferred from Networks (-$7M pre-tax) Consolidated YTD effective tax rate estimate ~31%(2) See Appendix for calculation of Adjusted Net Income and Adjusted EPS and reconciliation to Net Income and EPS. Management format, which includes PTCs in Revenues. Net Income $100M (+$16M); Adjusted Net Income $97M (+$20M) 26% of YTD Consolidated Adjusted Net Income YTD production higher (+4%) mainly due to new capacity, but lower than normal (-3%) due to wind resource Improved REC pricing, energy management, & PTCs (Excludes $4M or $0.01/share of Renewables MtM (vs $5M or $0.02/share YTD ‘16)) Net Income -$14M (+$18M) Non-core business. Not included in Avangrid adjusted consolidated earnings Net Income $268M (+$24M); Adjusted Net Income $268M (+$22M) 73% of YTD Consolidated Adjusted Net Income Driven by ongoing cost management & implementation of new rate plans ’17 includes an earnings sharing accrual for first rate year No UIL interest expense (vs $7M pre-tax in YTD ’16), transferred to Corporate Results by Business YTD ’17 vs YTD ’16(1) Gas Storage Networks Renewables Corporate
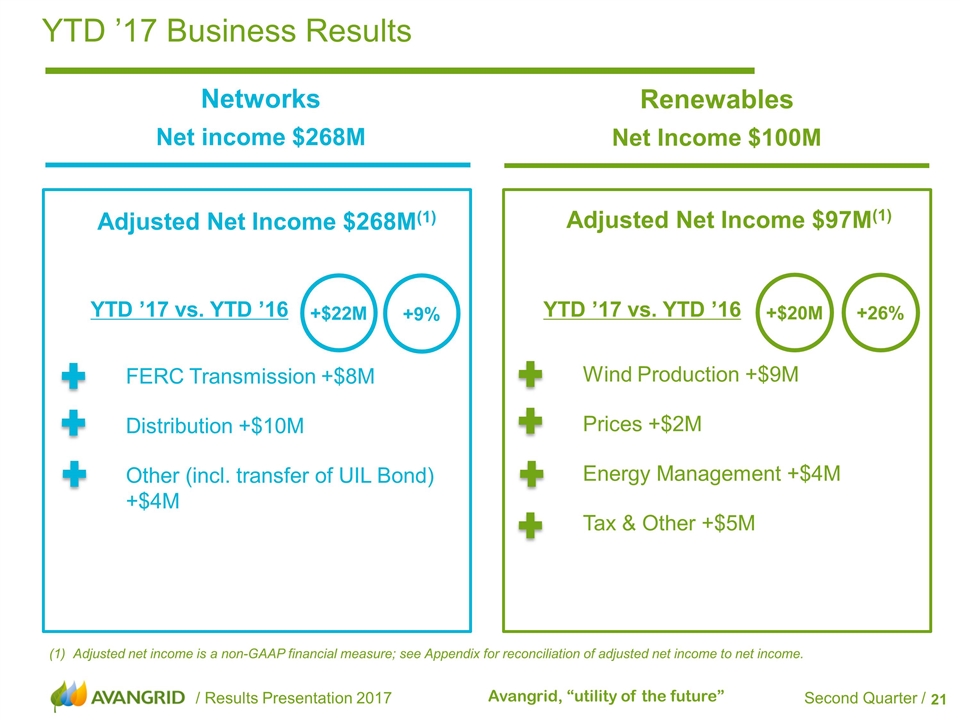
YTD ’17 Business Results Adjusted net income is a non-GAAP financial measure; see Appendix for reconciliation of adjusted net income to net income. Renewables Net Income $100M Networks Net income $268M Adjusted Net Income $97M(1) Adjusted Net Income $268M(1) FERC Transmission +$8M Distribution +$10M Other (incl. transfer of UIL Bond) +$4M YTD ’17 vs. YTD ’16 YTD ’17 vs. YTD ’16 +26% Wind Production +$9M Prices +$2M Energy Management +$4M Tax & Other +$5M +$20M +9% +$22M
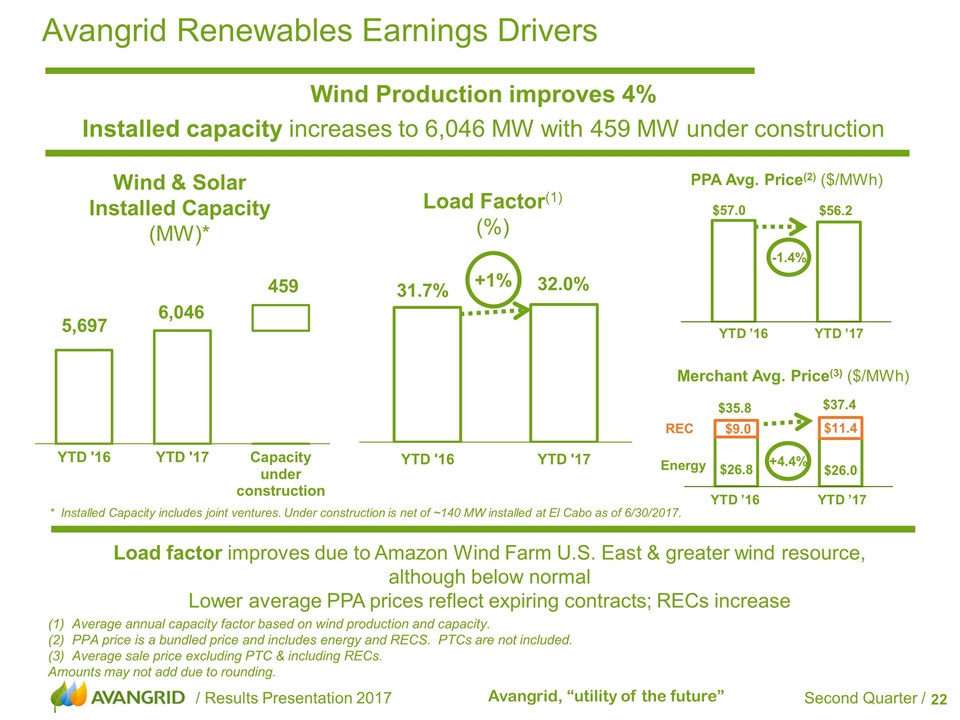
Avangrid Renewables Earnings Drivers Wind Production improves 4% Installed capacity increases to 6,046 MW with 459 MW under construction Load factor improves due to Amazon Wind Farm U.S. East & greater wind resource, although below normal Lower average PPA prices reflect expiring contracts; RECs increase Wind & Solar Installed Capacity (MW)* Average annual capacity factor based on wind production and capacity. PPA price is a bundled price and includes energy and RECS. PTCs are not included. Average sale price excluding PTC & including RECs. Amounts may not add due to rounding. Load Factor(1) (%) +1% 31.7% 32.0% * Installed Capacity includes joint ventures. Under construction is net of ~140 MW installed at El Cabo as of 6/30/2017. YTD ’16 YTD ’17 PPA Avg. Price(2) ($/MWh) -1.4% YTD ’16 YTD ’17 +4.4% Merchant Avg. Price(3) ($/MWh) REC Energy $57.0 $56.2
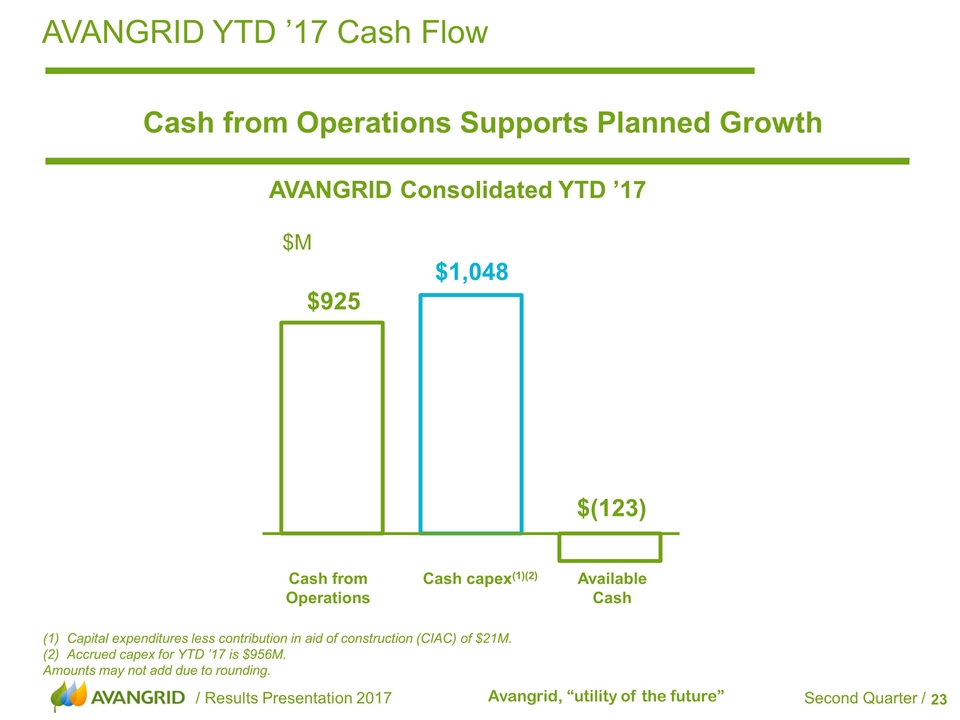
Capital expenditures less contribution in aid of construction (CIAC) of $21M. Accrued capex for YTD ’17 is $956M. Amounts may not add due to rounding. AVANGRID YTD ’17 Cash Flow Cash from Operations Supports Planned Growth $M AVANGRID Consolidated YTD ’17 Cash from Operations Cash capex(1)(2) Available Cash $925
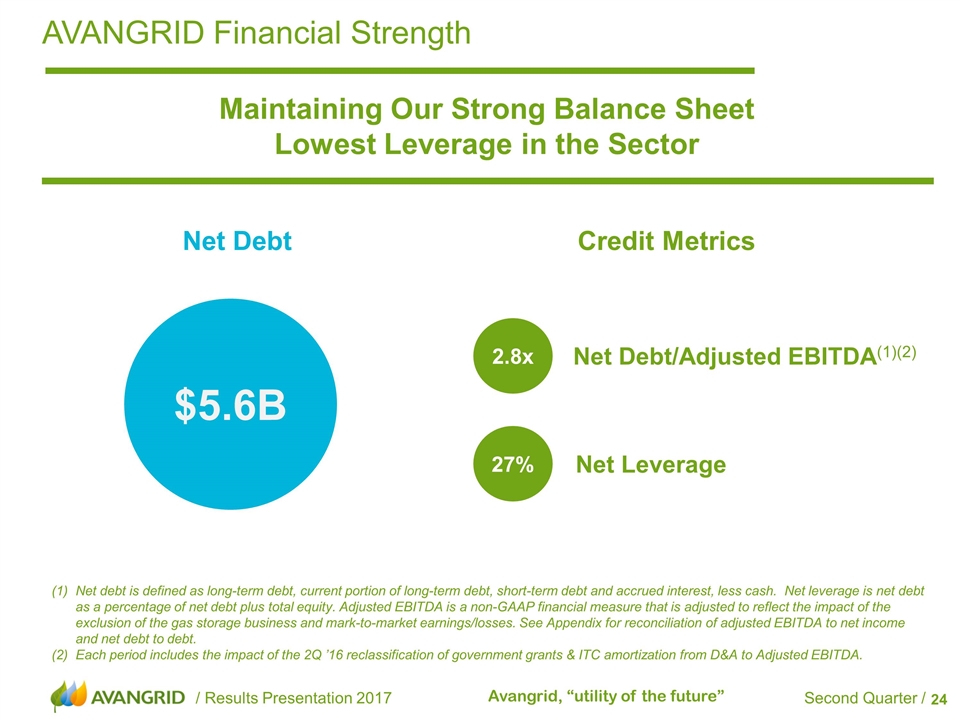
AVANGRID Financial Strength Maintaining Our Strong Balance Sheet Lowest Leverage in the Sector $5.6B Net Debt Credit Metrics Net Debt/Adjusted EBITDA(1)(2) Net Leverage 2.8x 27% Net debt is defined as long-term debt, current portion of long-term debt, short-term debt and accrued interest, less cash. Net leverage is net debt as a percentage of net debt plus total equity. Adjusted EBITDA is a non-GAAP financial measure that is adjusted to reflect the impact of the exclusion of the gas storage business and mark-to-market earnings/losses. See Appendix for reconciliation of adjusted EBITDA to net income and net debt to debt. Each period includes the impact of the 2Q ’16 reclassification of government grants & ITC amortization from D&A to Adjusted EBITDA.
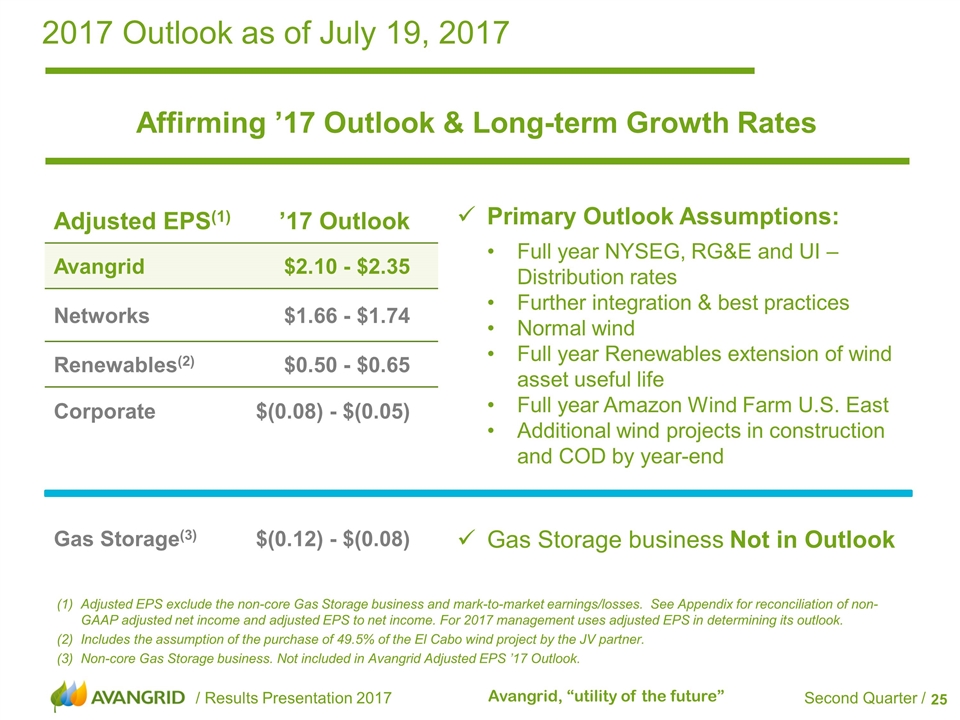
2017 Outlook as of July 19, 2017 Adjusted EPS exclude the non-core Gas Storage business and mark-to-market earnings/losses. See Appendix for reconciliation of non-GAAP adjusted net income and adjusted EPS to net income. For 2017 management uses adjusted EPS in determining its outlook. Includes the assumption of the purchase of 49.5% of the El Cabo wind project by the JV partner. Non-core Gas Storage business. Not included in Avangrid Adjusted EPS ’17 Outlook. Adjusted EPS(1) ’17 Outlook Avangrid $2.10 - $2.35 Networks $1.66 - $1.74 Renewables(2) $0.50 - $0.65 Corporate $(0.08) - $(0.05) Gas Storage(3) $(0.12) - $(0.08) Affirming ’17 Outlook & Long-term Growth Rates Primary Outlook Assumptions: Full year NYSEG, RG&E and UI – Distribution rates Further integration & best practices Normal wind Full year Renewables extension of wind asset useful life Full year Amazon Wind Farm U.S. East Additional wind projects in construction and COD by year-end Gas Storage business Not in Outlook
Appendix
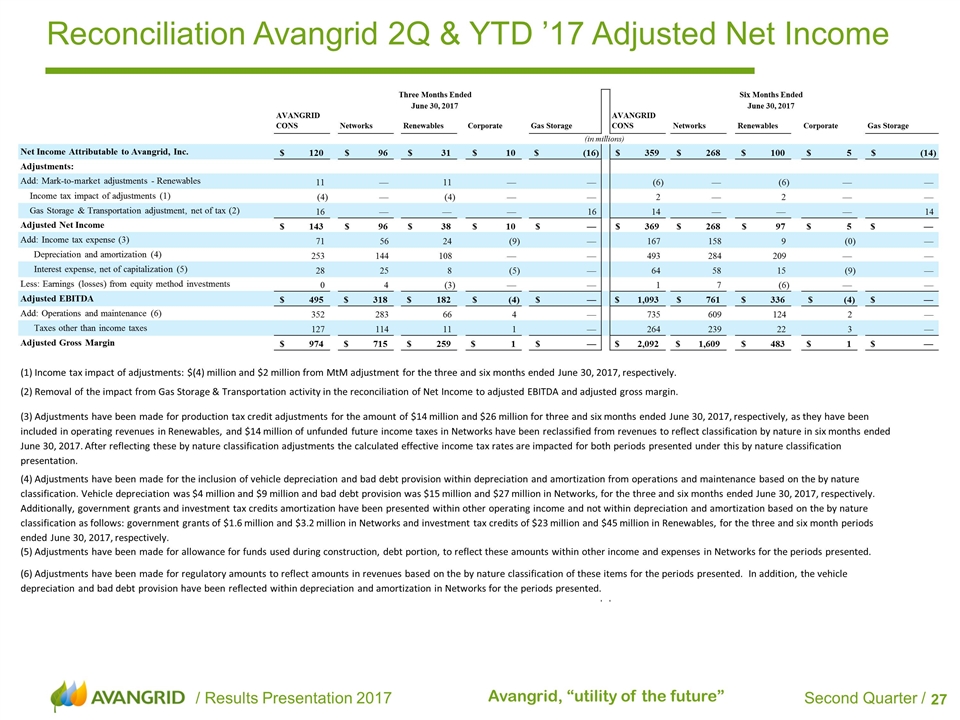
Reconciliation Avangrid 2Q & YTD ’17 Adjusted Net Income AVANGRID CONS Networks Renewables Corporate Gas Storage AVANGRID CONS Networks Renewables Corporate Gas Storage Net Income Attributable to Avangrid, Inc. 120 $ 96 $ 31 $ 10 $ (16) $ 359 $ 268 $ 100 $ 5 $ (14) $ Adjustments: Add: Mark-to-market adjustments - Renewables 11 — 11 — — (6) — (6) — — Income tax impact of adjustments (1) (4) — (4) — — 2 — 2 — — Gas Storage & Transportation adjustment, net of tax (2) 16 — — — 16 14 — — — 14 Adjusted Net Income 143 $ 96 $ 38 $ 10 $ — $ 369 $ 268 $ 97 $ 5 $ — $ Add: Income tax expense (3) 71 56 24 (9) — 167 158 9 (0) — Depreciation and amortization (4) 253 144 108 — — 493 284 209 — — Interest expense, net of capitalization (5) 28 25 8 (5) — 64 58 15 (9) — Less: Earnings (losses) from equity method investments 0 4 (3) — — 1 7 (6) — — Adjusted EBITDA 495 $ 318 $ 182 $ (4) $ — $ 1,093 $ 761 $ 336 $ (4) $ — $ Add: Operations and maintenance (6) 352 283 66 4 — 735 609 124 2 — Taxes other than income taxes 127 114 11 1 — 264 239 22 3 — Adjusted Gross Margin 974 $ 715 $ 259 $ 1 $ — $ 2,092 $ 1,609 $ 483 $ 1 $ — $ (1) Income tax impact of adjustments: $(4) million and $2 million from MtM adjustment for the three and six months ended June 30, 2017, respectively. (5) Adjustments have been made for allowance for funds used during construction, debt portion, to reflect these amounts within other income and expenses in Networks for the periods presented. (4) Adjustments have been made for the inclusion of vehicle depreciation and bad debt provision within depreciation and amortization from operations and maintenance based on the by nature classification. Vehicle depreciation was $4 million and $9 million and bad debt provision was $15 million and $27 million in Networks, for the three and six months ended June 30, 2017, respectively. Additionally, government grants and investment tax credits amortization have been presented within other operating income and not within depreciation and amortization based on the by nature classification as follows: government grants of $1.6 million and $3.2 million in Networks and investment tax credits of $23 million and $45 million in Renewables, for the three and six month periods ended June 30, 2017, respectively. (6) Adjustments have been made for regulatory amounts to reflect amounts in revenues based on the by nature classification of these items for the periods presented. In addition, the vehicle depreciation and bad debt provision have been reflected within depreciation and amortization in Networks for the periods presented. Three Months Ended Six Months Ended June 30, 2017 June 30, 2017 (in millions) (2) Removal of the impact from Gas Storage & Transportation activity in the reconciliation of Net Income to adjusted EBITDA and adjusted gross margin. (3) Adjustments have been made for production tax credit adjustments for the amount of $14 million and $26 million for three and six months ended June 30, 2017, respectively, as they have been included in operating revenues in Renewables, and $14 million of unfunded future income taxes in Networks have been reclassified from revenues to reflect classification by nature in six months ended June 30, 2017. After reflecting these by nature classification adjustments the calculated effective income tax rates are impacted for both periods presented under this by nature classification presentation.
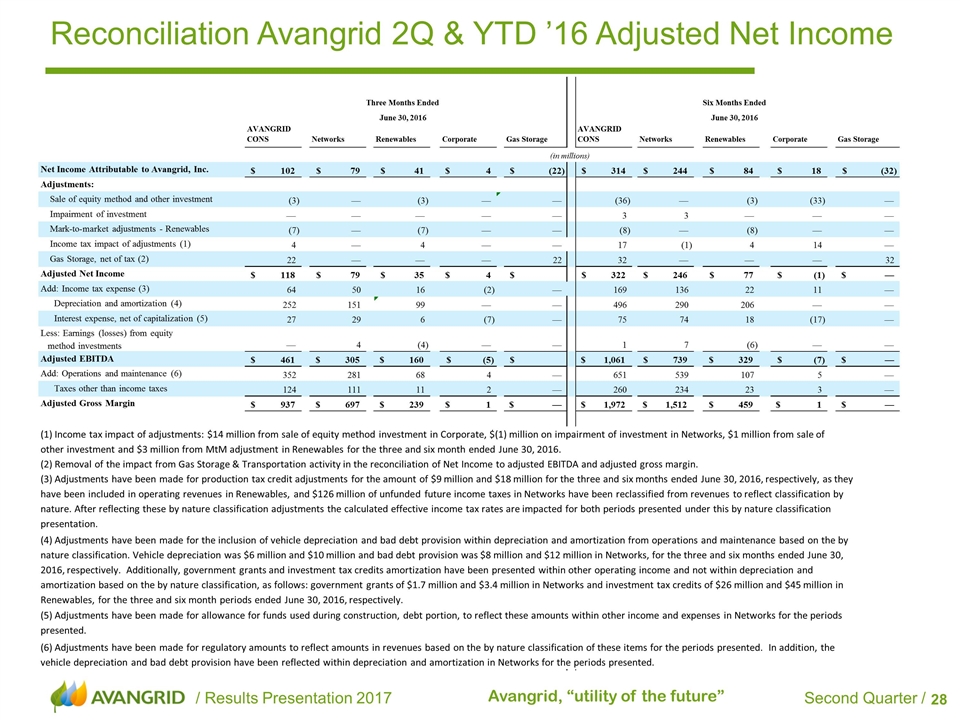
Reconciliation Avangrid 2Q & YTD ’16 Adjusted Net Income AVANGRID CONS Networks Renewables Corporate Gas Storage AVANGRID CONS Networks Renewables Corporate Gas Storage Net Income Attributable to Avangrid, Inc. 102 $ 79 $ 41 $ 4 $ (22) $ 314 $ 244 $ 84 $ 18 $ (32) $ Adjustments: Sale of equity method and other investment (3) — (3) — — (36) — (3) (33) — Impairment of investment — — — — — 3 3 — — — Mark-to-market adjustments - Renewables (7) — (7) — — (8) — (8) — — Income tax impact of adjustments (1) 4 — 4 — — 17 (1) 4 14 — Gas Storage, net of tax (2) 22 — — — 22 32 — — — 32 Adjusted Net Income 118 $ 79 $ 35 $ 4 $ $ 322 $ 246 $ 77 $ (1) $ — $ Add: Income tax expense (3) 64 50 16 (2) — 169 136 22 11 — Depreciation and amortization (4) 252 151 99 — — 496 290 206 — — Interest expense, net of capitalization (5) 27 29 6 (7) — 75 74 18 (17) — Less: Earnings (losses) from equity method investments — 4 (4) — — 1 7 (6) — — Adjusted EBITDA 461 $ 305 $ 160 $ (5) $ $ 1,061 $ 739 $ 329 $ (7) $ — $ Add: Operations and maintenance (6) 352 281 68 4 — 651 539 107 5 — Taxes other than income taxes 124 111 11 2 — 260 234 23 3 — Adjusted Gross Margin 937 $ 697 $ 239 $ 1 $ — $ 1,972 $ 1,512 $ 459 $ 1 $ — $ (2) Removal of the impact from Gas Storage & Transportation activity in the reconciliation of Net Income to adjusted EBITDA and adjusted gross margin. (6) Adjustments have been made for regulatory amounts to reflect amounts in revenues based on the by nature classification of these items for the periods presented. In addition, the vehicle depreciation and bad debt provision have been reflected within depreciation and amortization in Networks for the periods presented. Three Months Ended Six Months Ended June 30, 2016 June 30, 2016 (in millions) (3) Adjustments have been made for production tax credit adjustments for the amount of $9 million and $18 million for the three and six months ended June 30, 2016, respectively, as they have been included in operating revenues in Renewables, and $126 million of unfunded future income taxes in Networks have been reclassified from revenues to reflect classification by nature. After reflecting these by nature classification adjustments the calculated effective income tax rates are impacted for both periods presented under this by nature classification presentation. (4) Adjustments have been made for the inclusion of vehicle depreciation and bad debt provision within depreciation and amortization from operations and maintenance based on the by nature classification. Vehicle depreciation was $6 million and $10 million and bad debt provision was $8 million and $12 million in Networks, for the three and six months ended June 30, 2016, respectively. Additionally, government grants and investment tax credits amortization have been presented within other operating income and not within depreciation and amortization based on the by nature classification, as follows: government grants of $1.7 million and $3.4 million in Networks and investment tax credits of $26 million and $45 million in Renewables, for the three and six month periods ended June 30, 2016, respectively. (1) Income tax impact of adjustments: $14 million from sale of equity method investment in Corporate, $(1) million on impairment of investment in Networks, $1 million from sale of other investment and $3 million from MtM adjustment in Renewables for the three and six month ended June 30, 2016. (5) Adjustments have been made for allowance for funds used during construction, debt portion, to reflect these amounts within other income and expenses in Networks for the periods presented.
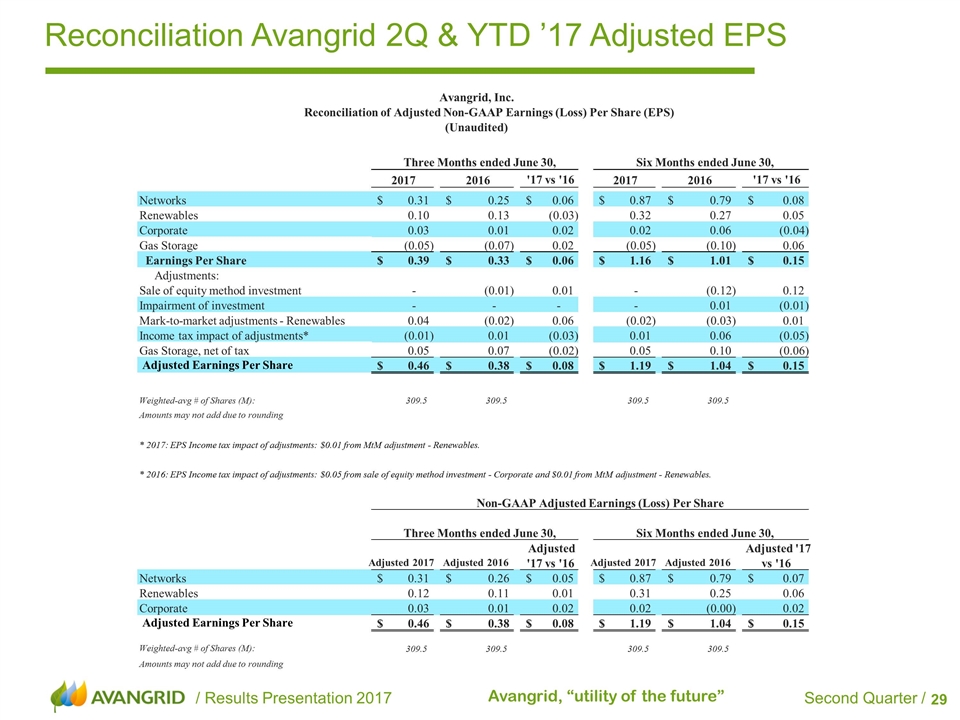
Reconciliation Avangrid 2Q & YTD ’17 Adjusted EPS 2017 2016 '17 vs '16 2017 2016 '17 vs '16 Networks 0.31 $ 0.25 $ 0.06 $ 0.87 $ 0.79 $ 0.08 $ Renewables 0.10 0.13 (0.03) 0.32 0.27 0.05 Corporate 0.03 0.01 0.02 0.02 0.06 (0.04) Gas Storage (0.05) (0.07) 0.02 (0.05) (0.10) 0.06 Earnings Per Share 0.39 $ 0.33 $ 0.06 $ 1.16 $ 1.01 $ 0.15 $ Adjustments: Sale of equity method investment - (0.01) 0.01 - (0.12) 0.12 Impairment of investment - - - - 0.01 (0.01) Mark-to-market adjustments - Renewables 0.04 (0.02) 0.06 (0.02) (0.03) 0.01 Income tax impact of adjustments* (0.01) 0.01 (0.03) 0.01 0.06 (0.05) Gas Storage, net of tax 0.05 0.07 (0.02) 0.05 0.10 (0.06) Adjusted Earnings Per Share 0.46 $ 0.38 $ 0.08 $ 1.19 $ 1.04 $ 0.15 $ Weighted-avg # of Shares (M): 309.5 309.5 309.5 309.5 Amounts may not add due to rounding Adjusted 2017 Adjusted 2016 Adjusted '17 vs '16 Adjusted 2017 Adjusted 2016 Adjusted '17 vs '16 Networks 0.31 $ 0.26 $ 0.05 $ 0.87 $ 0.79 $ 0.07 $ Renewables 0.12 0.11 0.01 0.31 0.25 0.06 Corporate 0.03 0.01 0.02 0.02 (0.00) 0.02 Adjusted Earnings Per Share 0.46 $ 0.38 $ 0.08 $ 1.19 $ 1.04 $ 0.15 $ Weighted-avg # of Shares (M): 309.5 309.5 309.5 309.5 Amounts may not add due to rounding Non-GAAP Adjusted Earnings (Loss) Per Share Three Months ended June 30, Six Months ended June 30, * 2017: EPS Income tax impact of adjustments: $0.01 from MtM adjustment - Renewables. * 2016: EPS Income tax impact of adjustments: $0.05 from sale of equity method investment - Corporate and $0.01 from MtM adjustment - Renewables. Six Months ended June 30, Avangrid, Inc. Reconciliation of Adjusted Non-GAAP Earnings (Loss) Per Share (EPS) (Unaudited) Three Months ended June 30,
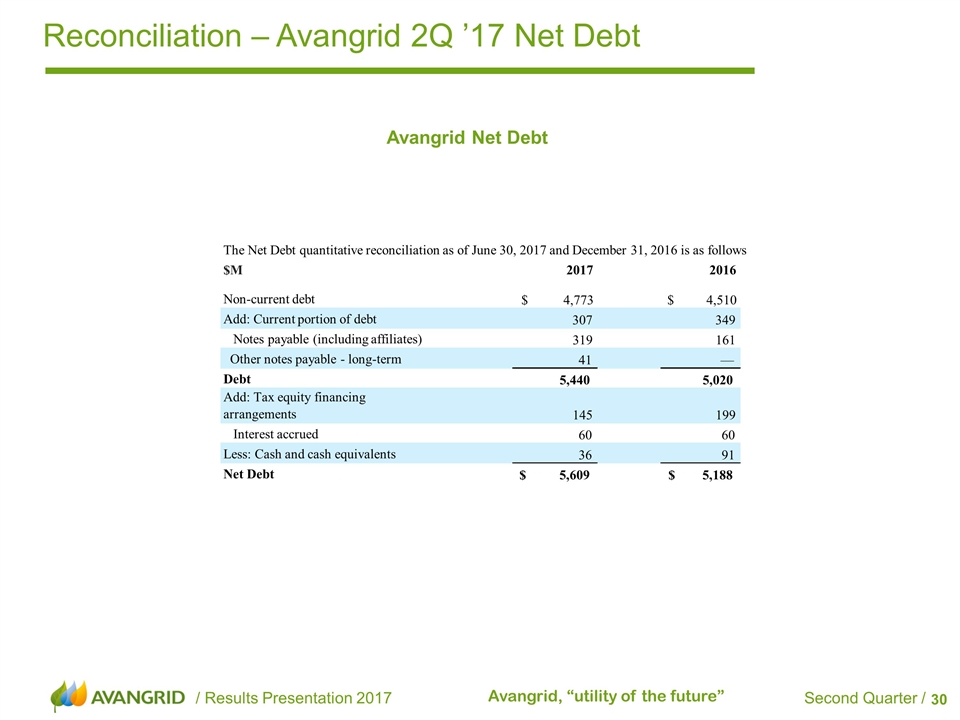
Reconciliation – Avangrid 2Q ’17 Net Debt Avangrid Net Debt The Net Debt quantitative reconciliation as of June 30, 2017 and December 31, 2016 is as follows $M 2017 2016 Non-current debt 4,773 $ 4,510 $ Add: Current portion of debt 307 349 Notes payable (including affiliates) 319 161 Other notes payable - long-term 41 — Debt 5,440 5,020 Add: Tax equity financing arrangements 145 199 Interest accrued 60 60 Less: Cash and cash equivalents 36 91 Net Debt 5,609 $ 5,188 $
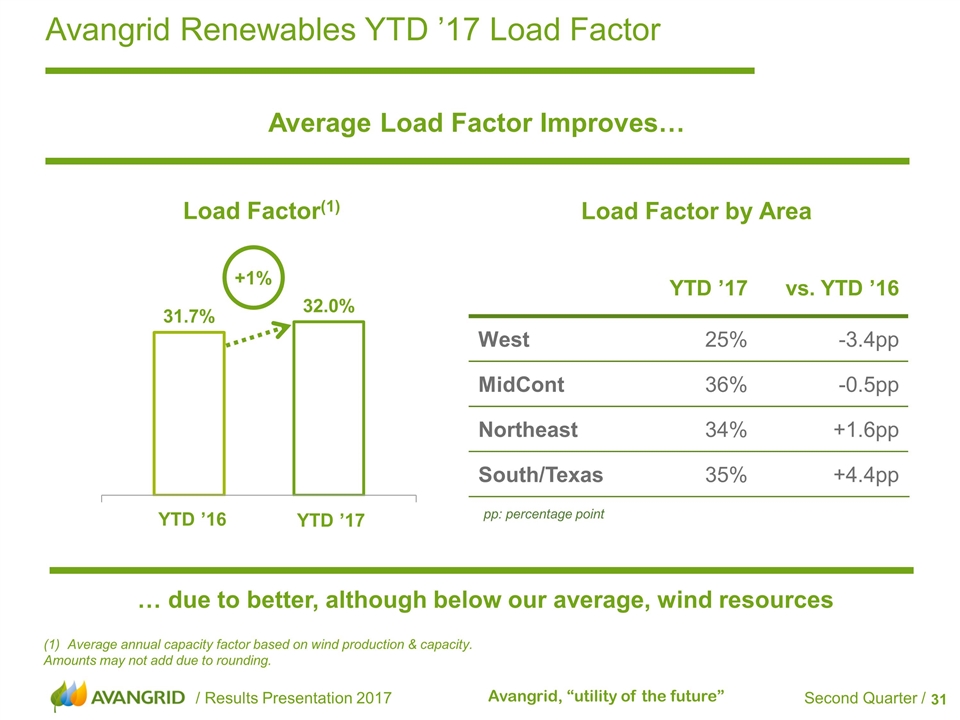
Avangrid Renewables YTD ’17 Load Factor Average Load Factor Improves… Load Factor(1) Average annual capacity factor based on wind production & capacity. Amounts may not add due to rounding. … due to better, although below our average, wind resources YTD ’16 YTD ’17 +1% Load Factor by Area pp: percentage point YTD ’17 vs. YTD ’16 West 25% -3.4pp MidCont 36% -0.5pp Northeast 34% +1.6pp South/Texas 35% +4.4pp
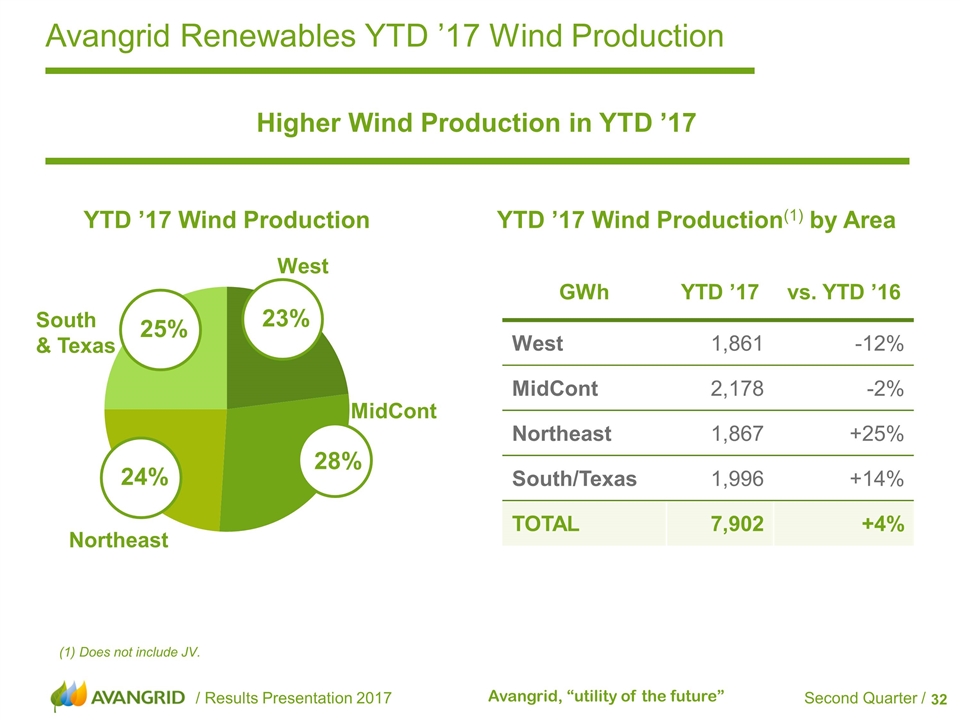
Avangrid Renewables YTD ’17 Wind Production Higher Wind Production in YTD ’17 YTD ’17 Wind Production (1) Does not include JV. YTD ’17 Wind Production(1) by Area GWh YTD ’17 vs. YTD ’16 West 1,861 -12% MidCont 2,178 -2% Northeast 1,867 +25% South/Texas 1,996 +14% TOTAL 7,902 +4% Northeast MidCont South & Texas West 23% 24% 28% 25%
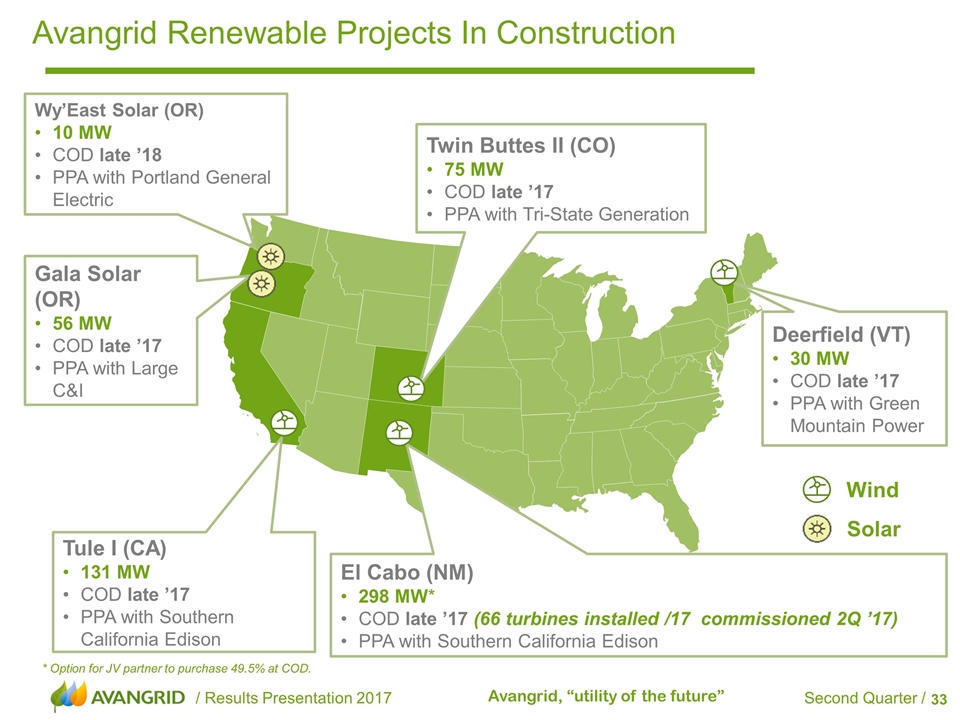
Avangrid Renewable Projects In Construction * Option for JV partner to purchase 49.5% at COD. Gala Solar (OR) 56 MW COD late ’17 PPA with Large C&I El Cabo (NM) 298 MW* COD late ’17 (66 turbines installed /17 commissioned 2Q ’17) PPA with Southern California Edison Deerfield (VT) 30 MW COD late ’17 PPA with Green Mountain Power Twin Buttes II (CO) 75 MW COD late ’17 PPA with Tri-State Generation Wy’East Solar (OR) 10 MW COD late ’18 PPA with Portland General Electric Tule I (CA) 131 MW COD late ’17 PPA with Southern California Edison Wind Solar
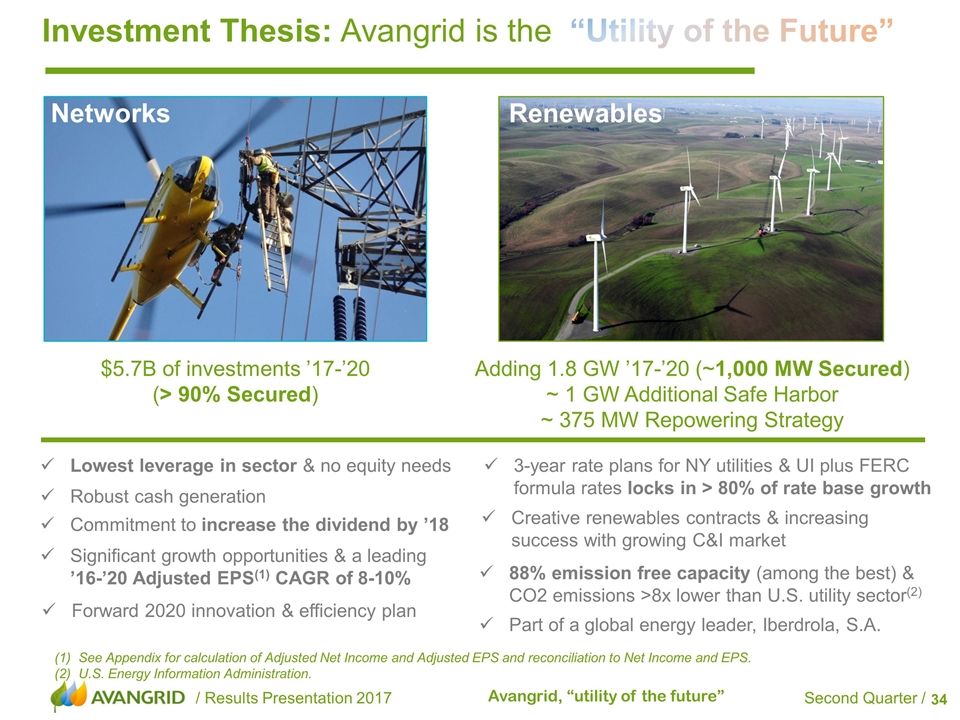
$5.7B of investments ’17-’20 (> 90% Secured) Adding 1.8 GW ’17-’20 (~1,000 MW Secured) ~ 1 GW Additional Safe Harbor ~ 375 MW Repowering Strategy Investment Thesis: Avangrid is the “Utility of the Future” Networks Renewables Lowest leverage in sector & no equity needs 88% emission free capacity (among the best) & CO2 emissions >8x lower than U.S. utility sector(2) Creative renewables contracts & increasing success with growing C&I market Forward 2020 innovation & efficiency plan 3-year rate plans for NY utilities & UI plus FERC formula rates locks in > 80% of rate base growth Part of a global energy leader, Iberdrola, S.A. Robust cash generation Significant growth opportunities & a leading ’16-’20 Adjusted EPS(1) CAGR of 8-10% Commitment to increase the dividend by ’18 See Appendix for calculation of Adjusted Net Income and Adjusted EPS and reconciliation to Net Income and EPS. U.S. Energy Information Administration.


