Exhibit 99.2
Legal Notice Investors@AVANGRID.com FORWARD LOOKING STATEMENTS Certain statements in this presentation may relate to our future business and financial performance and future events or developments involving us and our subsidiaries that are not purely historical and may constitute “forward-looking statements” within the meaning of the Private Securities Litigation Reform Act of 1995. Forward-looking statements may be identified by the use of forward-looking terms such as “may,” “will,” “should,” “would,” “could,” “can,” “expect(s,)” “believe(s),” “anticipate(s),” “intend(s),” “plan(s),” “estimate(s),” “project(s),”“assume(s),” “guide(s),” “target(s),” “forecast(s),” “are (is) confident that” and “seek(s)” or the negative of such terms or other variations on such terms or comparable terminology. Such forward looking statements include, but are not limited to, statements about our plans, objectives and intentions, outlooks or expectations for earnings, revenues, expenses or other future financial or business performance, strategies or expectations, or the impact of legal or regulatory matters on our business, results of operations or financial condition. Such statements are based upon the current reasonable beliefs, expectations and assumptions of our management and are subject to significant risks and uncertainties that could cause actual outcomes and results to differ materially. Important factors that could cause actual results to differ materially from those indicated by such forward-looking statements include, without limitation, the risks and uncertainties set forth under the section entitled “Risk Factors” and “Management’s Discussion and Analysis of Financial Condition and Results of Operations” in our Annual Report on Form 10-K for the year ended December 31, 2017 and our Quarterly Report on form 10-Q for the nine months ended September 31, 2018, which are on file with the U.S. Securities and Exchange Commission (SEC) and available on our investor relations website at www.Avangrid.com and on the SEC website at www.sec.gov. Additional information will also be set forth in subsequent filings with the SEC. You should consider these factors carefully in evaluating for-ward looking statements. Should one or more of these risks or uncertainties materialize, or should any of the underlying assumptions prove incorrect, actual results may vary in material respects from those expressed or implied by these forward-looking statements. You should not place undue reliance on these forward-looking statements. We do not undertake any obligation to update or revise any forward-looking statements to reflect events or circumstances after the date of this presentation whether as a result of new information, future events or otherwise, except as may be required under applicable securities laws. About AVANGRID AVANGRID, Inc. (NYSE: AGR) is a leading, sustainable energy company with approximately $32 billion in assets and operations in 24 U.S. states. AVANGRID has two primary lines of business: Avangrid Networks and Avangrid Renewables. Avangrid Networks owns eight electric and natural gas utilities, serving 3.2 million customers in New York and New England. Avangrid Renewables owns and operates 7.2 gigawatts of electricity capacity, primarily through wind power, with a presence in 22 states across the United States. AVANGRID supports the achievement of the Sustainable Development Goals approved by the member states of the United Nations, and earned the Compliance Leader Verification, a third party verification of its ethics and compliance program, from the Ethisphere Institute. AVANGRID employs approximately 6,500 people. For more information, visit www.avangrid.com.
Legal Notice Use of Non-U.S. GAAP Financial Measures To supplement our consolidated financial statements presented in accordance with U.S. GAAP, AVANGRID considers certain non-GAAP financial measures that are not prepared in accordance with U.S. GAAP, including adjusted net income, adjusted EPS, adjusted gross margin and adjusted EBITDA. The non-GAAP financial measures we use are specific to AVANGRID and the non-GAAP financial measures of other companies may not be calculated in the same manner. We use these non-GAAP financial measures, in addition to U.S. GAAP measures, to establish operating budgets and operational goals to manage and monitor our business, evaluate our operating and financial performance and to compare such performance to prior periods and to the performance of our competitors. We believe that presenting such non-GAAP financial measures is useful because such measures can be used to analyze and compare profitability between companies and industries because it eliminates the impact of financing and certain non-cash charges as well as allow for an evaluation of AVANGRID with a focus on the performance of its core operations. In addition, we present non-GAAP financial measures because we believe that they and other similar measures are widely used by certain investors, securities analysts and other interested parties as supplemental measures of performance. We provide adjusted net income and adjusted earnings per share, which are adjusted to reflect the effect of mark-to-market changes in the fair value of derivative instruments used by AVANGRID to economically hedge market price fluctuations in related underlying physical transactions for the purchase and sale of electricity, adjustments for the non-core Gas Storage business including certain losses related to its sale, restructuring charges primarily associated with reorganizing to better align our people resources with business demands and priorities as part of the Forward 2020+ program, impact from measurement of deferred income tax balances as a result of the Tax Act enacted by the U.S. federal Government on December 22, 2017, impact of accelerated depreciation on the repowering of certain Renewables assets and the impairment of equity method investments. We define adjusted EBITDA as net income attributable to AVANGRID, adding back income tax expense, depreciation, amortization, impairment of non-current assets and interest expense, net of capitalization, and then subtracting other income and earnings from equity method investments. We also define adjusted gross margin as adjusted EBITDA adding back operations and maintenance and taxes other than income taxes and then subtracting transmission wheeling. The most directly comparable U.S. GAAP measure to adjusted EBITDA and adjusted gross margin is net income. We believe that presenting these non-GAAP financial measures is useful in understanding and evaluating actual and projected financial performance and contribution of AVANGRID core lines of business and to more fully compare and explain our results. The most directly comparable U.S. GAAP measure to adjusted net income is net income. We also provide adjusted EPS, which is adjusted net income converted to an earnings per share amount. The use of non-GAAP financial measures is not intended to be considered in isolation or as a substitute for, or superior to, AVANGRID’s U.S. GAAP financial information, and investors are cautioned that the non-GAAP financial measures are limited in their usefulness, may be unique to AVANGRID, and should be considered only as a supplement to AVANGRID’s U.S. GAAP financial measures. The non-GAAP financial measures may not be comparable to other similarly titled measures of other companies and have limitations as analytical tools. Non-GAAP financial measures are not primary measurements of our performance under U.S. GAAP and should not be considered as alternatives to operating income, net income or any other performance measures determined in accordance with U.S. GAAP.
James Torgerson 4Q & FY 2018 Highlights James Torgerson
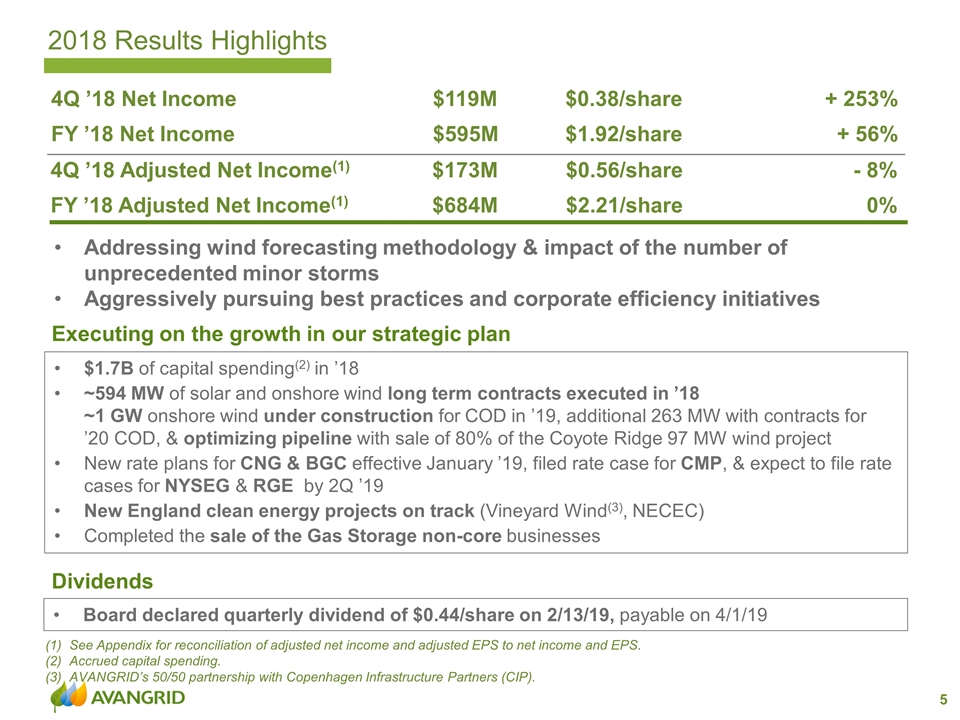
Executing on the growth in our strategic plan $1.7B of capital spending(2) in ’18 ~594 MW of solar and onshore wind long term contracts executed in ’18 ~1 GW onshore wind under construction for COD in ’19, additional 263 MW with contracts for ’20 COD, & optimizing pipeline with sale of 80% of the Coyote Ridge 97 MW wind project New rate plans for CNG & BGC effective January ’19, filed rate case for CMP, & expect to file rate cases for NYSEG & RGE by 2Q ’19 New England clean energy projects on track (Vineyard Wind(3), NECEC) Completed the sale of the Gas Storage non-core businesses Dividends Board declared quarterly dividend of $0.44/share on 2/13/19, payable on 4/1/19 Addressing wind forecasting methodology & impact of the number of unprecedented minor storms Aggressively pursuing best practices and corporate efficiency initiatives 2018 Results Highlights 4Q ’18 Adjusted Net Income(1) $173M $0.56/share - 8% FY ’18 Adjusted Net Income(1) $684M $2.21/share 0% 4Q ’18 Net Income $119M $0.38/share + 253% FY ’18 Net Income $595M $1.92/share + 56% See Appendix for reconciliation of adjusted net income and adjusted EPS to net income and EPS. Accrued capital spending. AVANGRID’s 50/50 partnership with Copenhagen Infrastructure Partners (CIP).
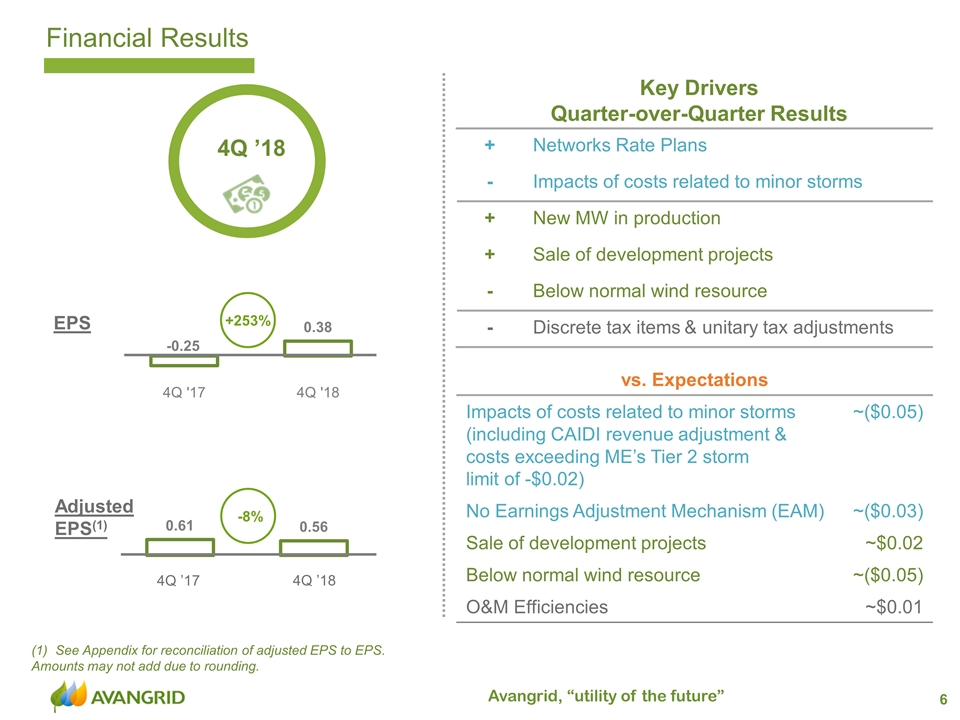
Financial Results See Appendix for reconciliation of adjusted EPS to EPS. Amounts may not add due to rounding. +253% -8% 4Q ’17 4Q ’18 EPS Adjusted EPS(1) Key Drivers Quarter-over-Quarter Results + Networks Rate Plans - Impacts of costs related to minor storms + New MW in production + Sale of development projects - Below normal wind resource - Discrete tax items & unitary tax adjustments 4Q ’18 vs. Expectations Impacts of costs related to minor storms (including CAIDI revenue adjustment & costs exceeding ME’s Tier 2 storm limit of -$0.02) ~($0.05) No Earnings Adjustment Mechanism (EAM) ~($0.03) Sale of development projects ~$0.02 Below normal wind resource ~($0.05) O&M Efficiencies ~$0.01
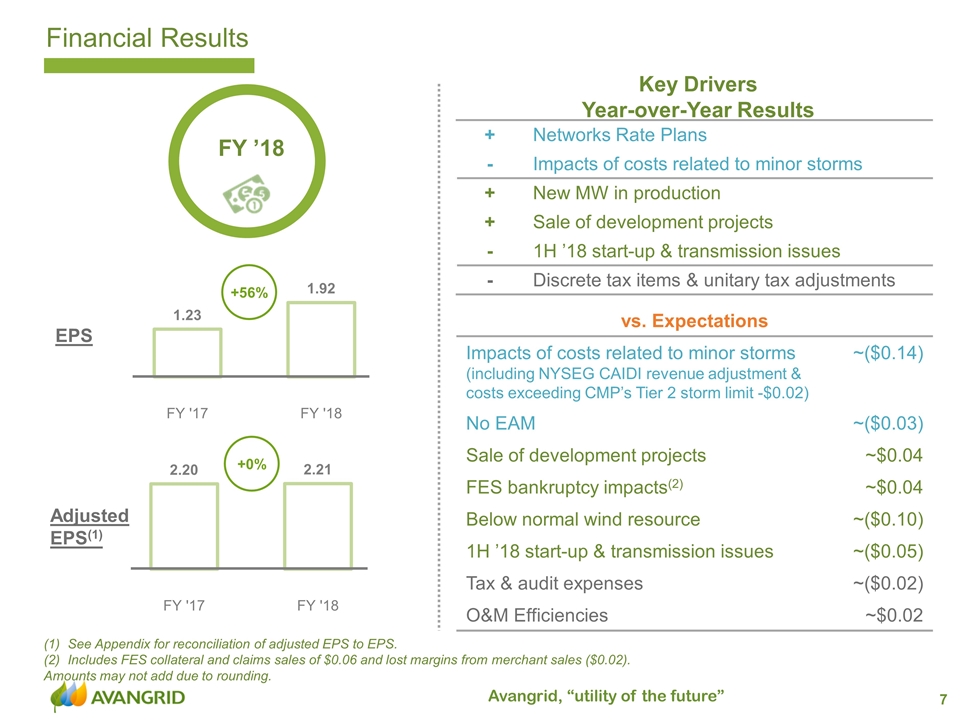
Financial Results FY ’18 Key Drivers Year-over-Year Results +56% +0% EPS Adjusted EPS(1) See Appendix for reconciliation of adjusted EPS to EPS. Includes FES collateral and claims sales of $0.06 and lost margins from merchant sales ($0.02). Amounts may not add due to rounding. + Networks Rate Plans - Impacts of costs related to minor storms + New MW in production + Sale of development projects - 1H ’18 start-up & transmission issues - Discrete tax items & unitary tax adjustments vs. Expectations Impacts of costs related to minor storms (including NYSEG CAIDI revenue adjustment & costs exceeding CMP’s Tier 2 storm limit -$0.02) ~($0.14) No EAM ~($0.03) Sale of development projects ~$0.04 FES bankruptcy impacts(2) ~$0.04 Below normal wind resource ~($0.10) 1H ’18 start-up & transmission issues ~($0.05) Tax & audit expenses ~($0.02) O&M Efficiencies ~$0.02
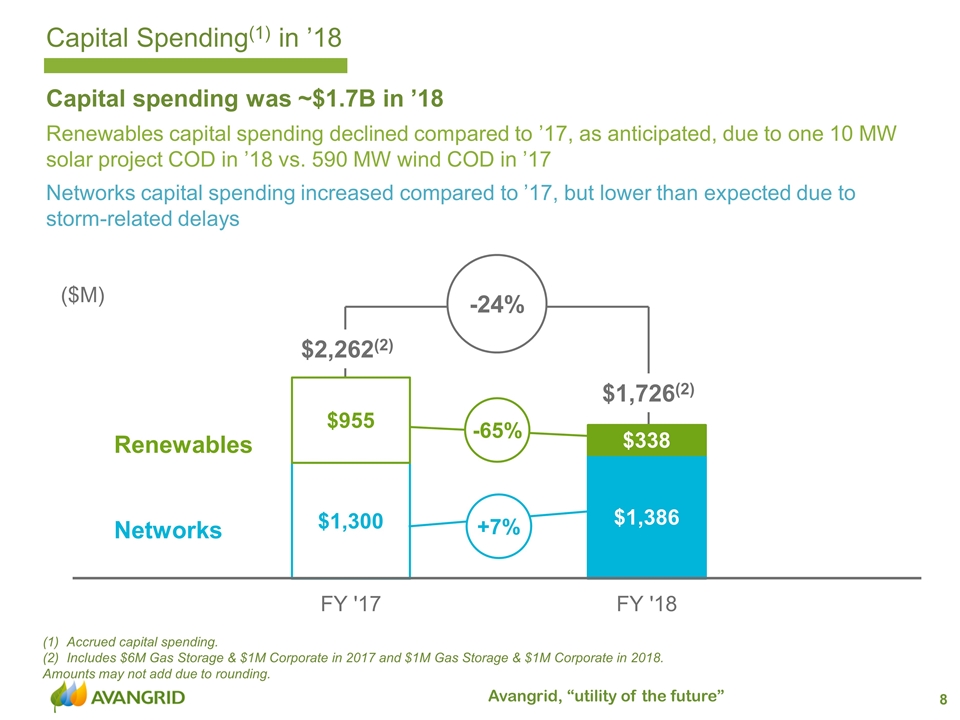
-24% Capital Spending(1) in ’18 Capital spending was ~$1.7B in ’18 Renewables capital spending declined compared to ’17, as anticipated, due to one 10 MW solar project COD in ’18 vs. 590 MW wind COD in ’17 Networks capital spending increased compared to ’17, but lower than expected due to storm-related delays Accrued capital spending. Includes $6M Gas Storage & $1M Corporate in 2017 and $1M Gas Storage & $1M Corporate in 2018. Amounts may not add due to rounding. ($M) $1,726(2) $2,262(2) Networks Renewables -65% +7%
Networks Execution of Strategy - Networks Filed rate case for CMP 4Q ’18 Final rate case decisions for CNG received 4Q ’18 & BGC 1Q ’19 (make-whole to 1/1/19) NY companies 3 year rate periods end April 30; expect to file rate cases by 2Q ’19, effective May ’20 New rate years in ’19 for UI & SCG New projects in service: $51M Coopers Mills STATCOM & $85M Lewiston Loop transmission in ME & $39M LNG modernization in CT Completed Smart Community investment in Ithaca, NY & battery storage/EV pilots NYISO concluded that a NY Transco AC project was the most efficient, cost effective solution. Final determination in March 2019 (~$110M investment for Networks) NECEC Transmission project is ON TRACK: Maine Certificate of Public Convenience & Necessity in process; settlement discussions ongoing Decision expected March ’19 Expect receipt of all project approvals by year-end ’19 Networks rate settlements & planned filings support its strategic initiatives & request authorization for resiliency spending NECEC project is moving forward as planned
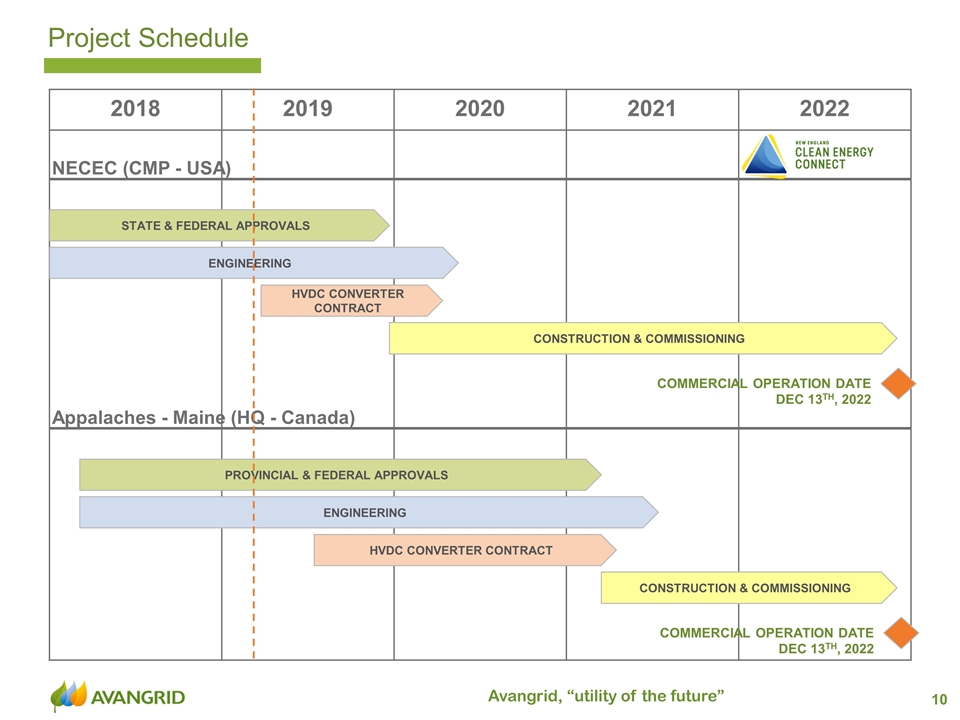
2018 2019 2020 2021 2022 STATE & FEDERAL APPROVALS CONSTRUCTION & COMMISSIONING HVDC CONVERTER CONTRACT NECEC (CMP - USA) PROVINCIAL & FEDERAL APPROVALS CONSTRUCTION & COMMISSIONING ENGINEERING HVDC CONVERTER CONTRACT Appalaches - Maine (HQ - Canada) COMMERCIAL OPERATION DATE DEC 13TH, 2022 COMMERCIAL OPERATION DATE DEC 13TH, 2022 ENGINEERING Project Schedule
Maine CMP rate case Filed October 15; expect final decision in 4Q ’19 1-year revenue increase of $24M with no net increase in rates due to offset by tax reform liabilities Requests: 10% ROE, 55% Equity with continued decoupling Initial $16M capex & $5M vegetation for rate year related to Resiliency Program Storm costs – proposed to lower normal storms threshold from $3.5M to $1.5M per event triggering charging against the large storm reserve Inclusion of all 2017 Tax Act considerations MPUC Order found that CMP acted reasonably in its preparation for & response to a major wind & rain storm in October ’17 Independent audit of CMP’s new SmartCare customer information, metering & billing system conducted by the Liberty Consulting Group at the direction of the MPUC found that the system & meters were measuring customer usage accurately & appropriately & that all components of the system were collecting & transmitting data accurately MPUC to open a docket to review the audit findings Customer communications & service questions raised by the audit will be addressed through the rate case Networks Regulatory Highlights Multiple, key regulatory proceedings are completed or in process in ME
New York Expect to file rate cases for NYSEG & RGE in 2Q ’19 Filing will include companies’ requests for Resiliency, Advanced Metering Infrastructure (AMI), the EAM & enhanced cost recovery for storms including staging costs Connecticut CNG rate case final decision: $19.7M for ’19-’21 9.3% ROE 54-55% equity Continued decoupling, trackers for system expansion & distribution integrity management program Massachusetts BGC rate case final decision: $2.3M in ’19, rate freeze in ’20 & ’21 9.70% ROE 55% equity ratio Decoupling, pension tracker, gas system enhancement program Networks Regulatory Highlights – Other Tax Act impacts, including refunds of benefits of lower tax rates has been determined in all regulatory jurisdictions. The process for addressing excess deferred tax liabilities has been determined in CT and MA and the timing & amounts will be determined in current & upcoming rate cases for ME and NY, respectively. Recent rate case settled in CT; NY filing expected in 2Q ’19
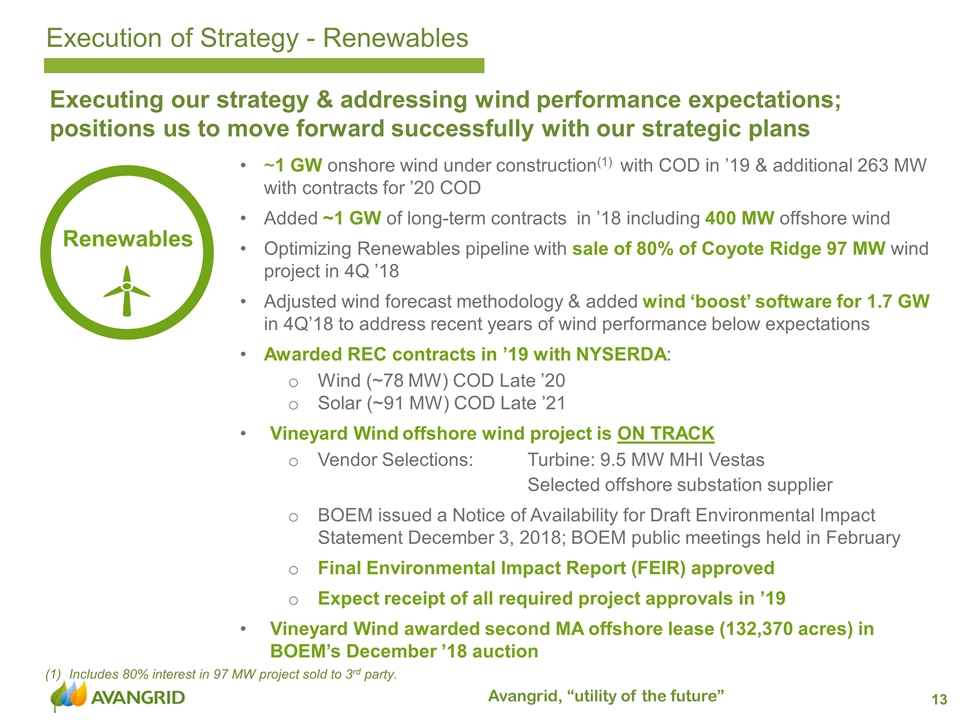
Renewables Execution of Strategy - Renewables ~1 GW onshore wind under construction(1) with COD in ’19 & additional 263 MW with contracts for ’20 COD Added ~1 GW of long-term contracts in ’18 including 400 MW offshore wind Optimizing Renewables pipeline with sale of 80% of Coyote Ridge 97 MW wind project in 4Q ’18 Adjusted wind forecast methodology & added wind ‘boost’ software for 1.7 GW in 4Q’18 to address recent years of wind performance below expectations Awarded REC contracts in ’19 with NYSERDA: Wind (~78 MW) COD Late ’20 Solar (~91 MW) COD Late ’21 Vineyard Wind offshore wind project is ON TRACK Vendor Selections: Turbine: 9.5 MW MHI Vestas Selected offshore substation supplier BOEM issued a Notice of Availability for Draft Environmental Impact Statement December 3, 2018; BOEM public meetings held in February Final Environmental Impact Report (FEIR) approved Expect receipt of all required project approvals in ’19 Vineyard Wind awarded second MA offshore lease (132,370 acres) in BOEM’s December ’18 auction Executing our strategy & addressing wind performance expectations; positions us to move forward successfully with our strategic plans Includes 80% interest in 97 MW project sold to 3rd party.
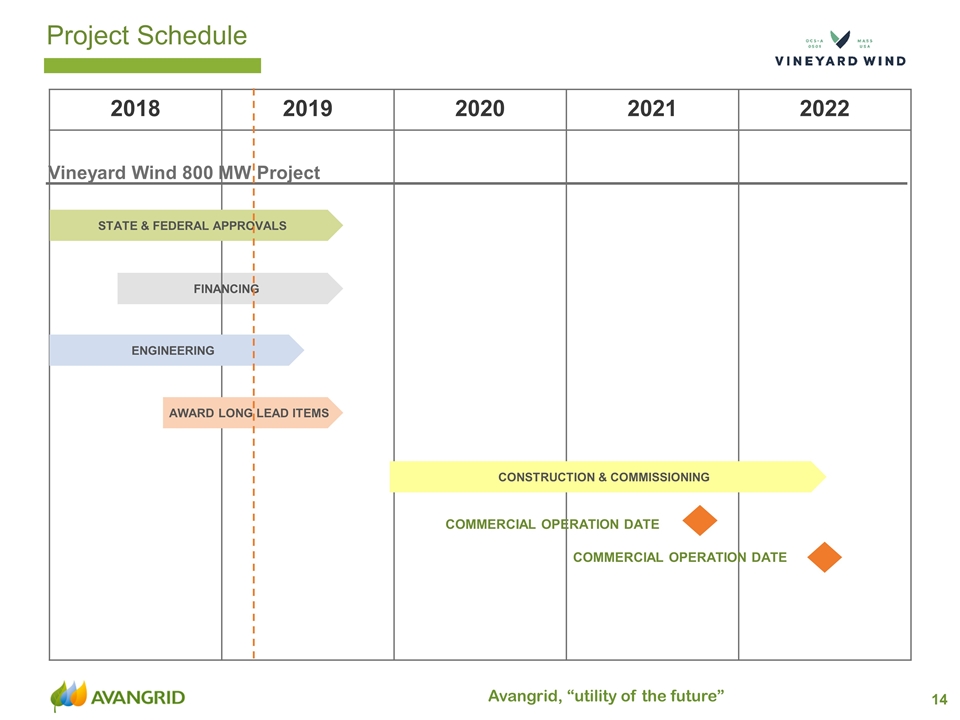
FINANCING 2018 2019 2020 2021 2022 STATE & FEDERAL APPROVALS CONSTRUCTION & COMMISSIONING ENGINEERING AWARD LONG LEAD ITEMS Vineyard Wind 800 MW Project COMMERCIAL OPERATION DATE Project Schedule COMMERCIAL OPERATION DATE
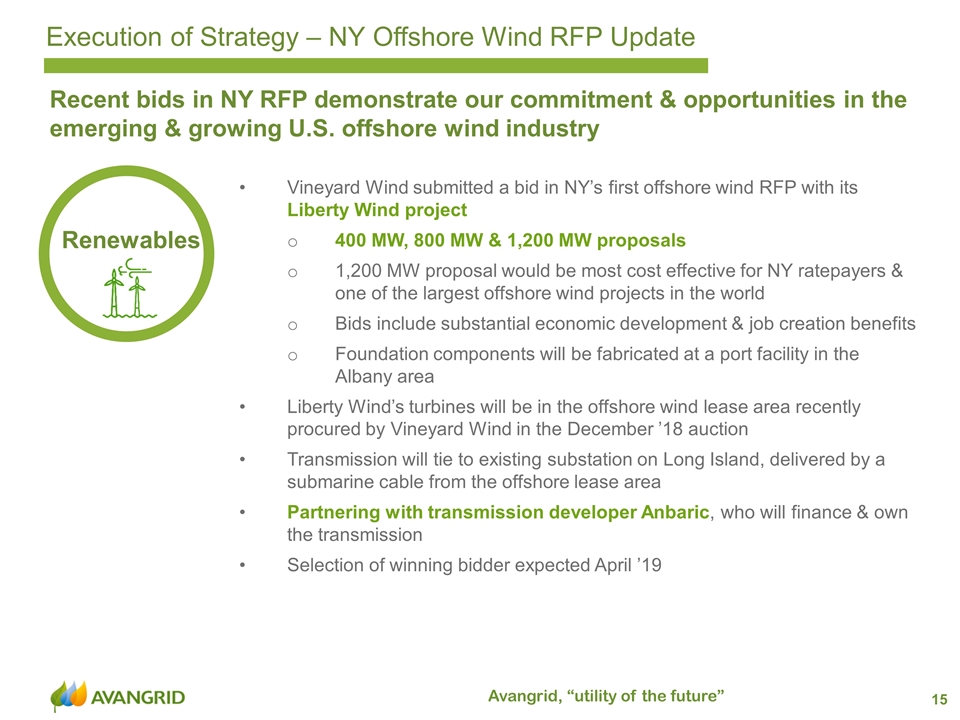
Execution of Strategy – NY Offshore Wind RFP Update Vineyard Wind submitted a bid in NY’s first offshore wind RFP with its Liberty Wind project 400 MW, 800 MW & 1,200 MW proposals 1,200 MW proposal would be most cost effective for NY ratepayers & one of the largest offshore wind projects in the world Bids include substantial economic development & job creation benefits Foundation components will be fabricated at a port facility in the Albany area Liberty Wind’s turbines will be in the offshore wind lease area recently procured by Vineyard Wind in the December ’18 auction Transmission will tie to existing substation on Long Island, delivered by a submarine cable from the offshore lease area Partnering with transmission developer Anbaric, who will finance & own the transmission Selection of winning bidder expected April ’19 Renewables Recent bids in NY RFP demonstrate our commitment & opportunities in the emerging & growing U.S. offshore wind industry
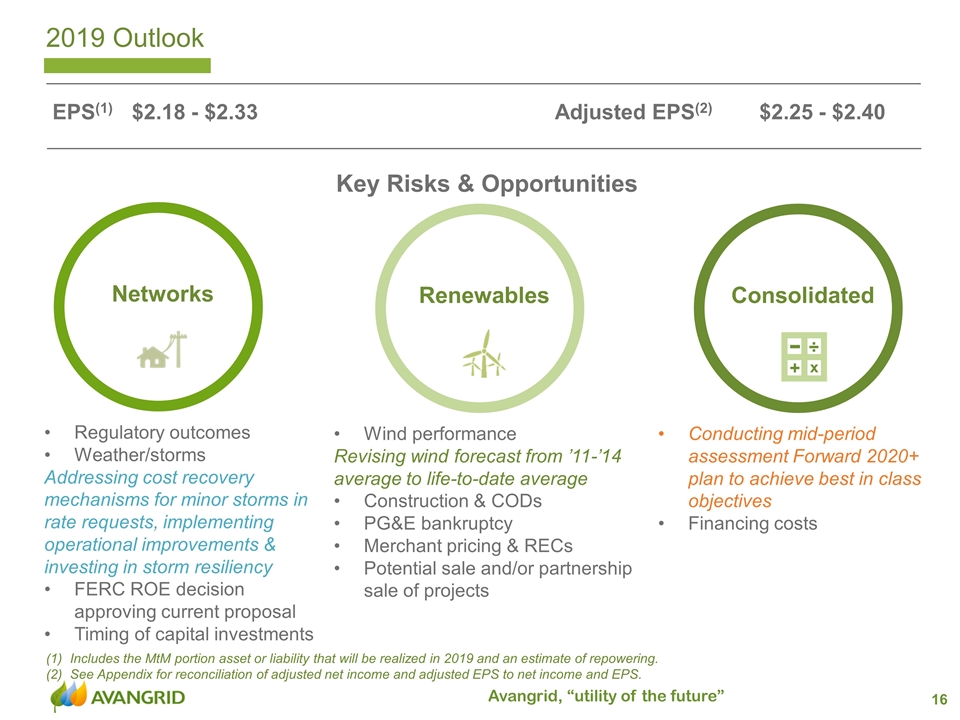
2019 Outlook Renewables Regulatory outcomes Weather/storms Addressing cost recovery mechanisms for minor storms in rate requests, implementing operational improvements & investing in storm resiliency FERC ROE decision approving current proposal Timing of capital investments Wind performance Revising wind forecast from ’11-’14 average to life-to-date average Construction & CODs PG&E bankruptcy Merchant pricing & RECs Potential sale and/or partnership sale of projects Conducting mid-period assessment Forward 2020+ plan to achieve best in class objectives Financing costs Adjusted EPS(2) $2.25 - $2.40 EPS(1) $2.18 - $2.33 Consolidated Networks Key Risks & Opportunities Includes the MtM portion asset or liability that will be realized in 2019 and an estimate of repowering. See Appendix for reconciliation of adjusted net income and adjusted EPS to net income and EPS.
James Torgerson 4Q & FY 2018 Financial Results Doug Stuver
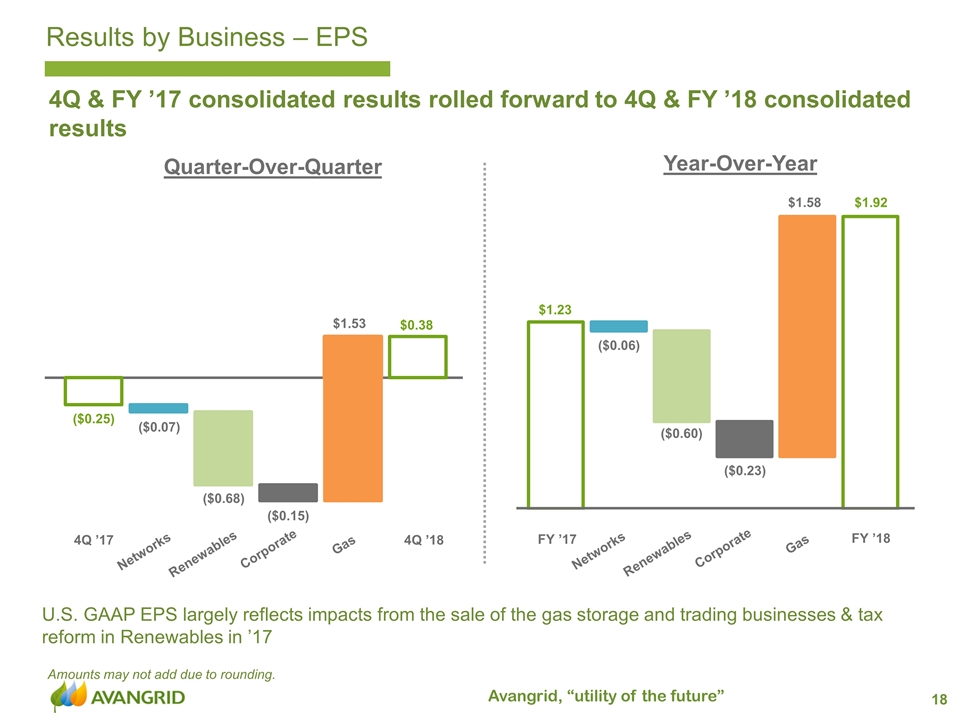
($0.25) $0.38 ($0.07) ($0.68) $1.53 ($0.15) 4Q & FY ’17 consolidated results rolled forward to 4Q & FY ’18 consolidated results Amounts may not add due to rounding. Results by Business – EPS $1.23 $1.92 ($0.06) ($0.60) $1.58 ($0.23) U.S. GAAP EPS largely reflects impacts from the sale of the gas storage and trading businesses & tax reform in Renewables in ’17 Quarter-Over-Quarter Year-Over-Year 4Q ’17 Networks Renewables Corporate 4Q ’18 Gas FY ’17 Networks Renewables Corporate FY ’18 Gas
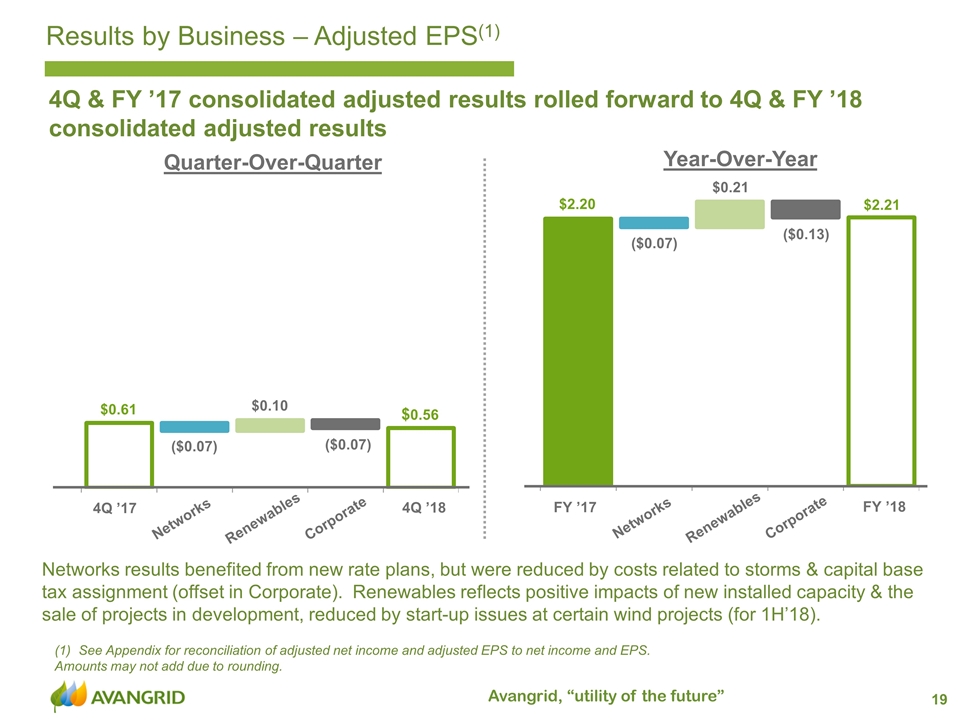
4Q & FY ’17 consolidated adjusted results rolled forward to 4Q & FY ’18 consolidated adjusted results Results by Business – Adjusted EPS(1) Networks results benefited from new rate plans, but were reduced by costs related to storms & capital base tax assignment (offset in Corporate). Renewables reflects positive impacts of new installed capacity & the sale of projects in development, reduced by start-up issues at certain wind projects (for 1H’18). $0.61 $0.56 ($0.07) $0.10 ($0.07) $2.20 $2.21 ($0.07) $0.21 ($0.13) Quarter-Over-Quarter Year-Over-Year 4Q ’17 Networks Renewables Corporate 4Q ’18 FY ’17 Networks Renewables Corporate FY ’18 See Appendix for reconciliation of adjusted net income and adjusted EPS to net income and EPS. Amounts may not add due to rounding.
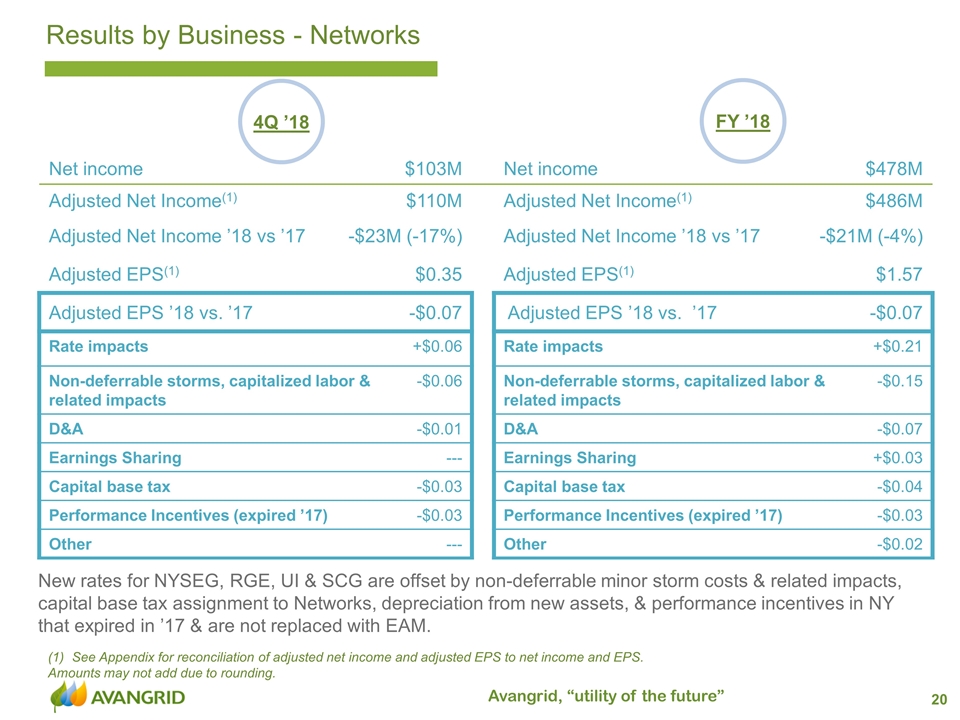
Net income $103M Net income $478M Adjusted Net Income(1) $110M Adjusted Net Income(1) $486M Adjusted Net Income ’18 vs ’17 -$23M (-17%) Adjusted Net Income ’18 vs ’17 -$21M (-4%) Adjusted EPS(1) $0.35 Adjusted EPS(1) $1.57 Adjusted EPS ’18 vs. ’17 -$0.07 Adjusted EPS ’18 vs. ’17 -$0.07 Rate impacts +$0.06 Rate impacts +$0.21 Non-deferrable storms, capitalized labor & related impacts -$0.06 Non-deferrable storms, capitalized labor & related impacts -$0.15 D&A -$0.01 D&A -$0.07 Earnings Sharing --- Earnings Sharing +$0.03 Capital base tax -$0.03 Capital base tax -$0.04 Performance Incentives (expired ’17) -$0.03 Performance Incentives (expired ’17) -$0.03 Other --- Other -$0.02 See Appendix for reconciliation of adjusted net income and adjusted EPS to net income and EPS. Amounts may not add due to rounding. 4Q ’18 Results by Business - Networks New rates for NYSEG, RGE, UI & SCG are offset by non-deferrable minor storm costs & related impacts, capital base tax assignment to Networks, depreciation from new assets, & performance incentives in NY that expired in ’17 & are not replaced with EAM. FY ’18
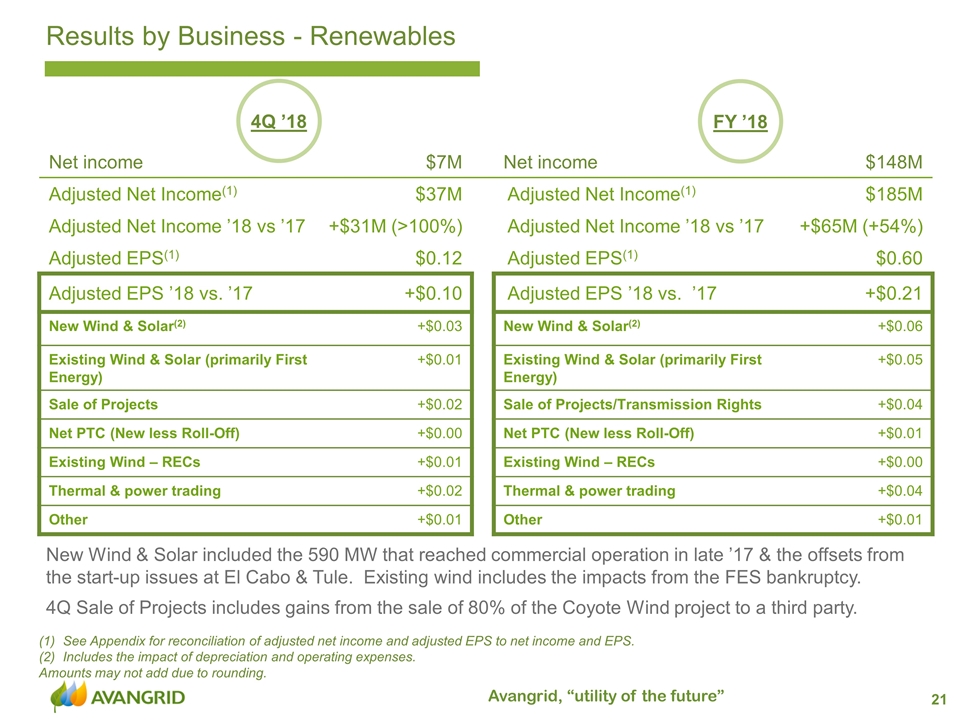
Net income $7M Net income $148M Adjusted Net Income(1) $37M Adjusted Net Income(1) $185M Adjusted Net Income ’18 vs ’17 +$31M (>100%) Adjusted Net Income ’18 vs ’17 +$65M (+54%) Adjusted EPS(1) $0.12 Adjusted EPS(1) $0.60 Adjusted EPS ’18 vs. ’17 +$0.10 Adjusted EPS ’18 vs. ’17 +$0.21 New Wind & Solar(2) +$0.03 New Wind & Solar(2) +$0.06 Existing Wind & Solar (primarily First Energy) +$0.01 Existing Wind & Solar (primarily First Energy) +$0.05 Sale of Projects +$0.02 Sale of Projects/Transmission Rights +$0.04 Net PTC (New less Roll-Off) +$0.00 Net PTC (New less Roll-Off) +$0.01 Existing Wind – RECs +$0.01 Existing Wind – RECs +$0.00 Thermal & power trading +$0.02 Thermal & power trading +$0.04 Other +$0.01 Other +$0.01 See Appendix for reconciliation of adjusted net income and adjusted EPS to net income and EPS. Includes the impact of depreciation and operating expenses. Amounts may not add due to rounding. 4Q ’18 Results by Business - Renewables New Wind & Solar included the 590 MW that reached commercial operation in late ’17 & the offsets from the start-up issues at El Cabo & Tule. Existing wind includes the impacts from the FES bankruptcy. 4Q Sale of Projects includes gains from the sale of 80% of the Coyote Wind project to a third party. FY ’18
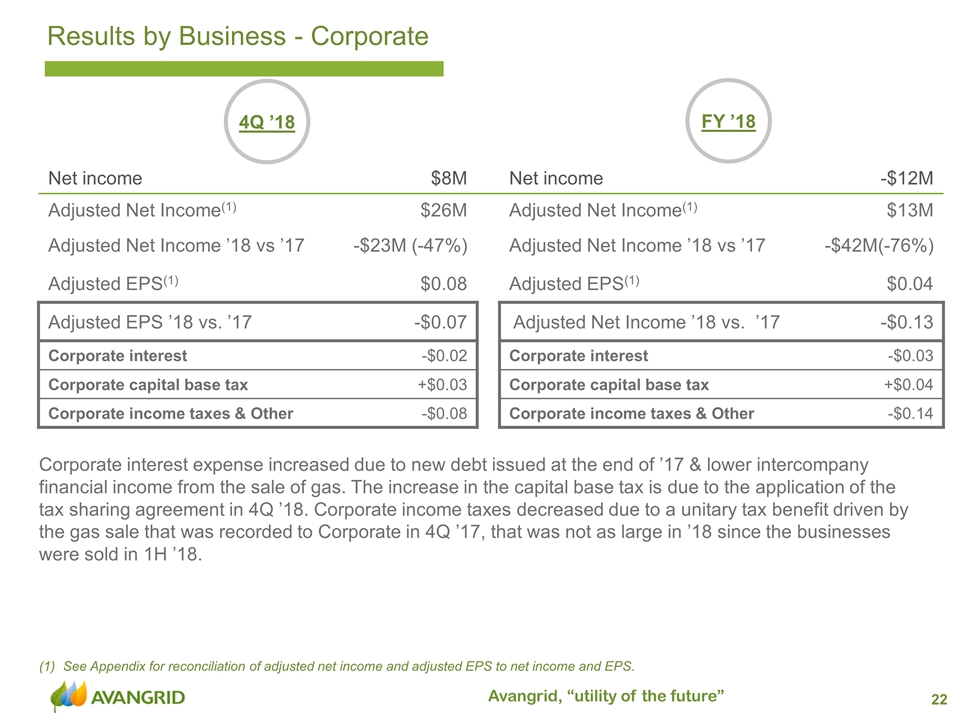
Net income $8M Net income -$12M Adjusted Net Income(1) $26M Adjusted Net Income(1) $13M Adjusted Net Income ’18 vs ’17 -$23M (-47%) Adjusted Net Income ’18 vs ’17 -$42M(-76%) Adjusted EPS(1) $0.08 Adjusted EPS(1) $0.04 Adjusted EPS ’18 vs. ’17 -$0.07 Adjusted Net Income ’18 vs. ’17 -$0.13 Corporate interest -$0.02 Corporate interest -$0.03 Corporate capital base tax +$0.03 Corporate capital base tax +$0.04 Corporate income taxes & Other -$0.08 Corporate income taxes & Other -$0.14 See Appendix for reconciliation of adjusted net income and adjusted EPS to net income and EPS. 4Q ’18 Results by Business - Corporate Corporate interest expense increased due to new debt issued at the end of ’17 & lower intercompany financial income from the sale of gas. The increase in the capital base tax is due to the application of the tax sharing agreement in 4Q ’18. Corporate income taxes decreased due to a unitary tax benefit driven by the gas sale that was recorded to Corporate in 4Q ’17, that was not as large in ’18 since the businesses were sold in 1H ’18. FY ’18
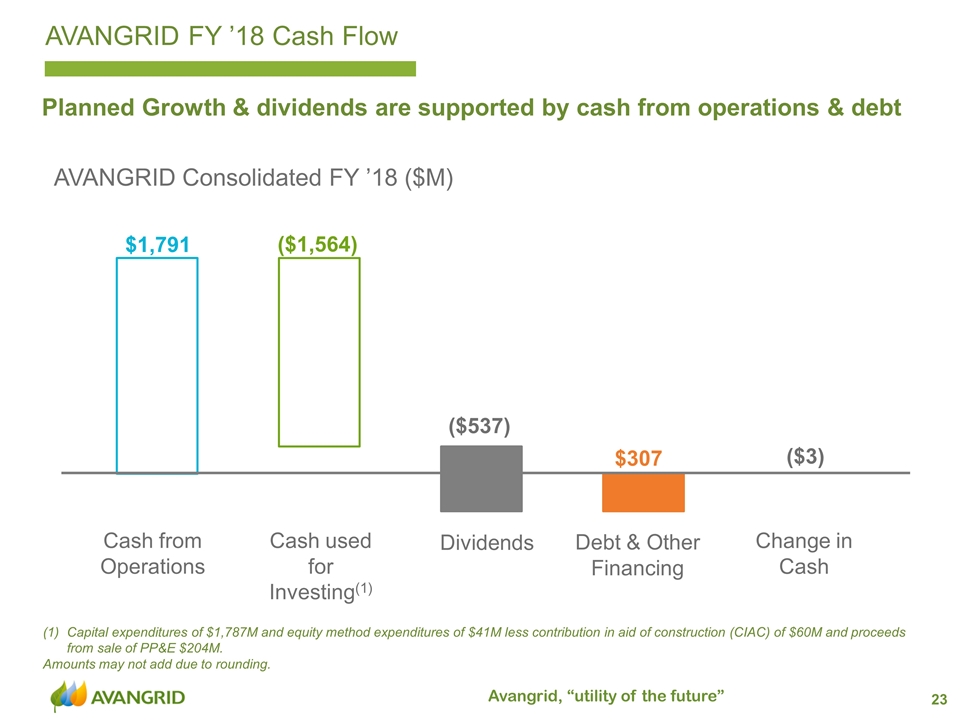
Capital expenditures of $1,787M and equity method expenditures of $41M less contribution in aid of construction (CIAC) of $60M and proceeds from sale of PP&E $204M. Amounts may not add due to rounding. AVANGRID FY ’18 Cash Flow Planned Growth & dividends are supported by cash from operations & debt AVANGRID Consolidated FY ’18 ($M) Cash from Operations Cash used for Investing(1) Change in Cash Dividends Debt & Other Financing
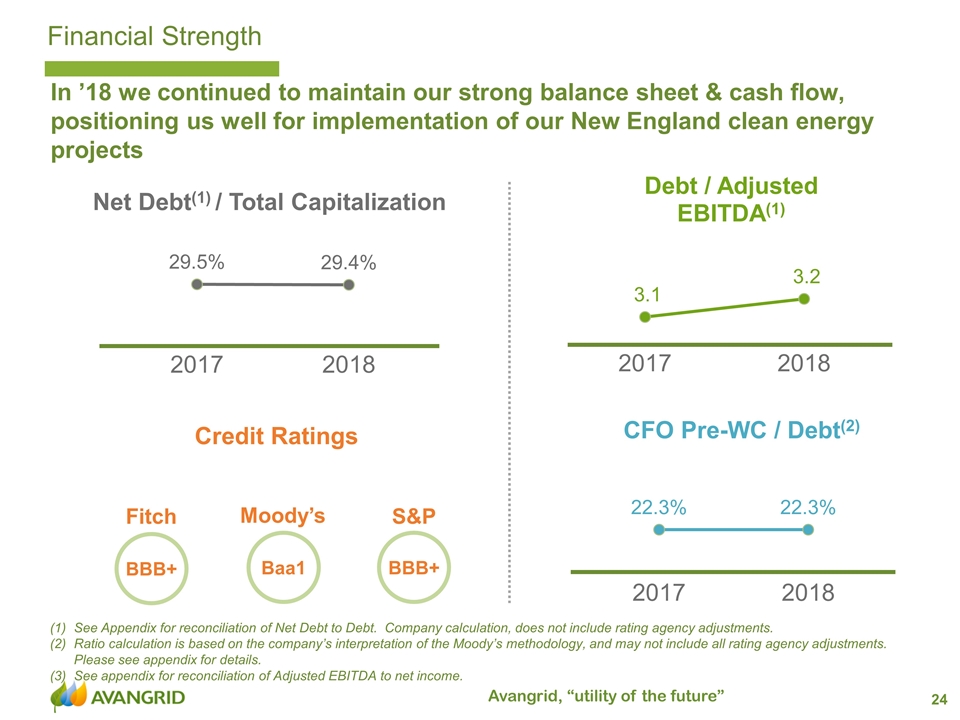
Financial Strength See Appendix for reconciliation of Net Debt to Debt. Company calculation, does not include rating agency adjustments. Ratio calculation is based on the company’s interpretation of the Moody’s methodology, and may not include all rating agency adjustments. Please see appendix for details. See appendix for reconciliation of Adjusted EBITDA to net income. In ’18 we continued to maintain our strong balance sheet & cash flow, positioning us well for implementation of our New England clean energy projects Credit Ratings BBB+ Baa1 BBB+ Fitch Moody’s S&P Net Debt(1) / Total Capitalization CFO Pre-WC / Debt(2)
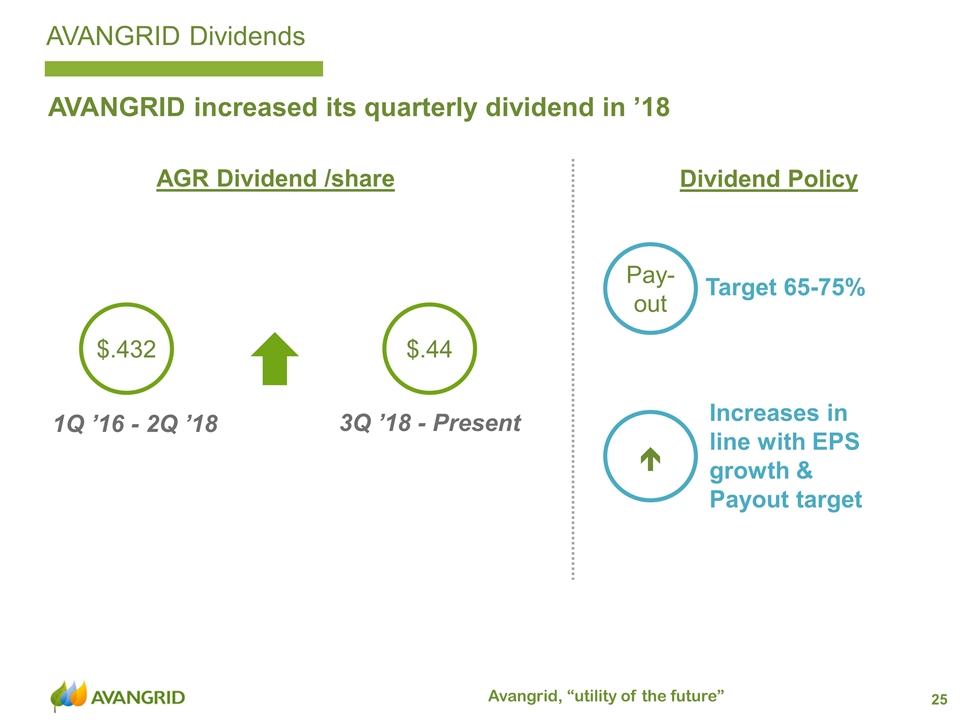
AVANGRID Dividends AVANGRID increased its quarterly dividend in ’18 Target 65-75% Increases in line with EPS growth & Payout target Pay-out é Dividend Policy $.432 3Q ’18 - Present $.44 1Q ’16 - 2Q ’18 AGR Dividend /share
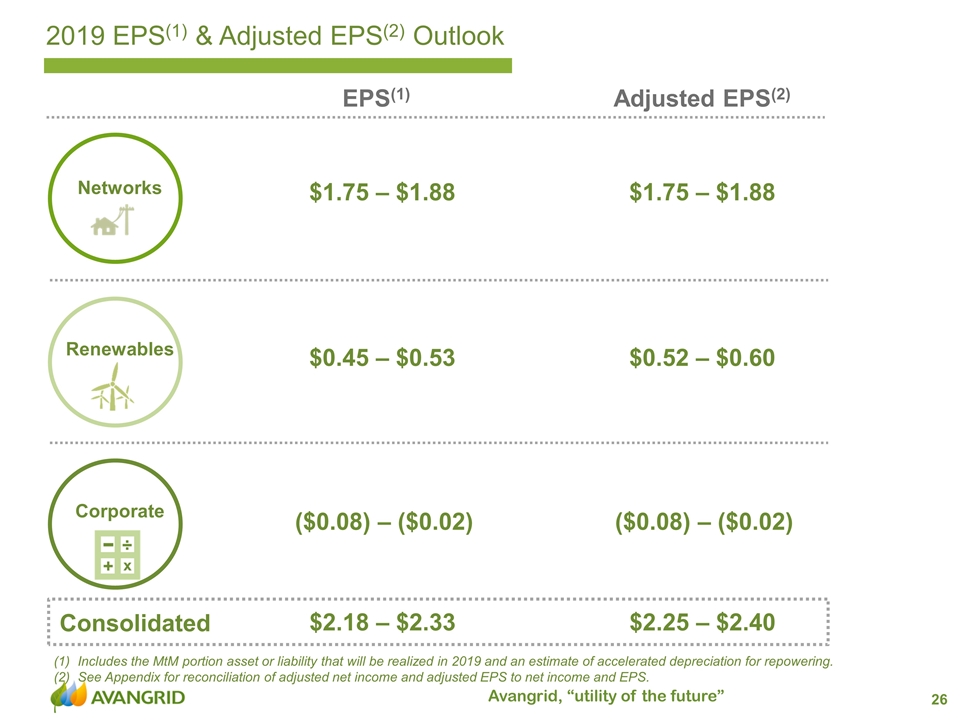
2019 EPS(1) & Adjusted EPS(2) Outlook Includes the MtM portion asset or liability that will be realized in 2019 and an estimate of accelerated depreciation for repowering. See Appendix for reconciliation of adjusted net income and adjusted EPS to net income and EPS. Consolidated Renewables Corporate Networks $1.75 – $1.88 $1.75 – $1.88 $0.45 – $0.53 $0.52 – $0.60 ($0.08) – ($0.02) ($0.08) – ($0.02) $2.18 – $2.33 $2.25 – $2.40 EPS(1) Adjusted EPS(2)
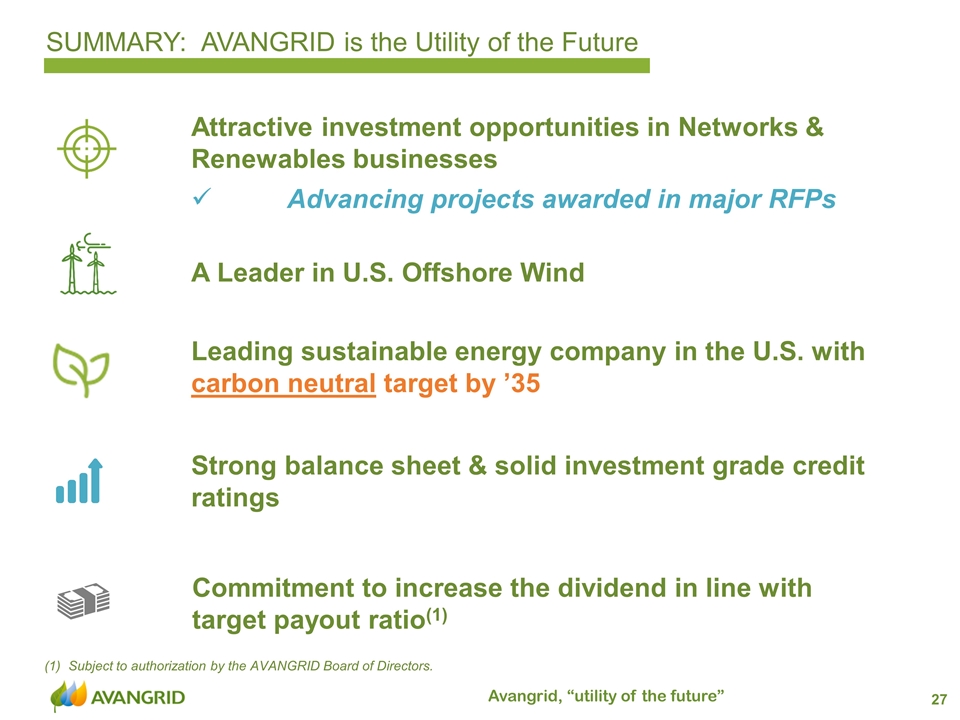
Subject to authorization by the AVANGRID Board of Directors. SUMMARY: AVANGRID is the Utility of the Future Leading sustainable energy company in the U.S. with carbon neutral target by ’35 Attractive investment opportunities in Networks & Renewables businesses Advancing projects awarded in major RFPs Strong balance sheet & solid investment grade credit ratings Commitment to increase the dividend in line with target payout ratio(1) A Leader in U.S. Offshore Wind
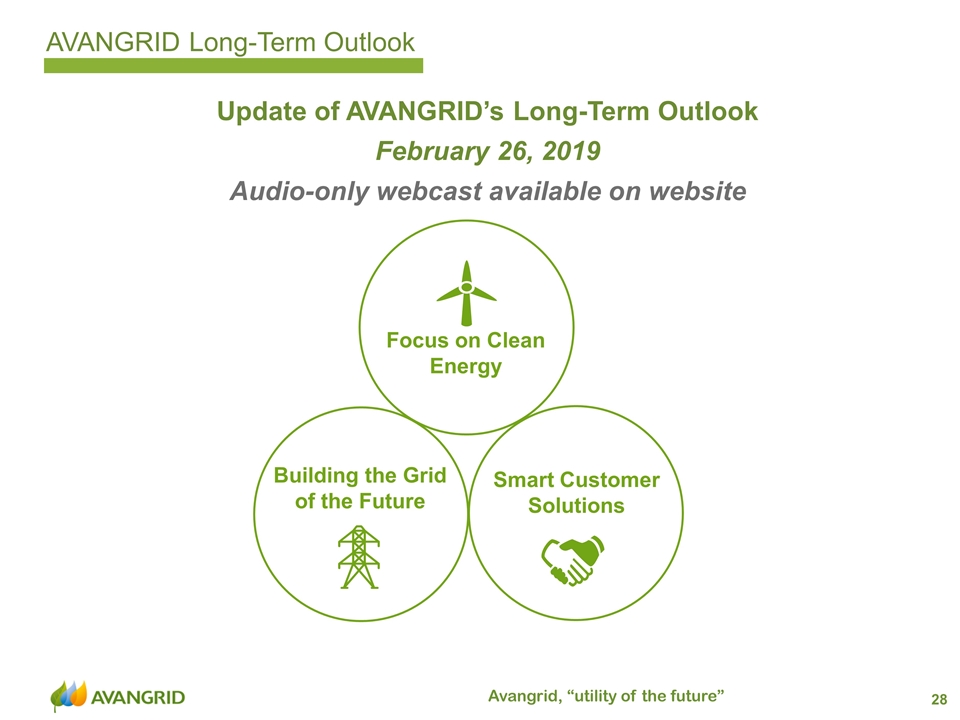
Update of AVANGRID’s Long-Term Outlook February 26, 2019 Audio-only webcast available on website AVANGRID Long-Term Outlook Focus on Clean Energy Smart Customer Solutions Building the Grid of the Future
Appendix
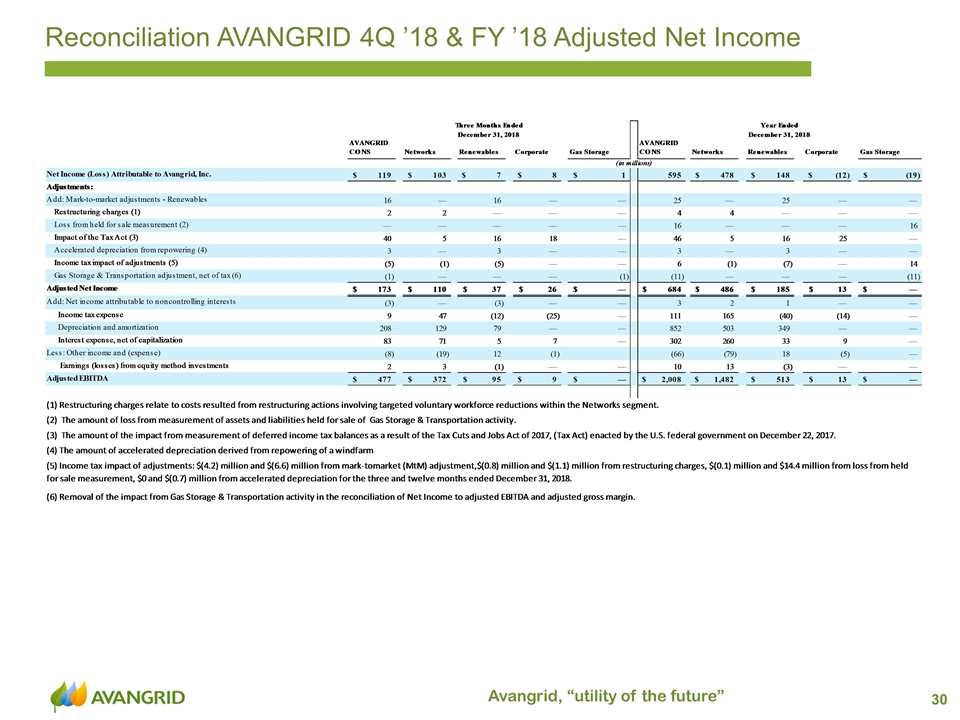
Reconciliation AVANGRID 4Q ’18 & FY ’18 Adjusted Net Income
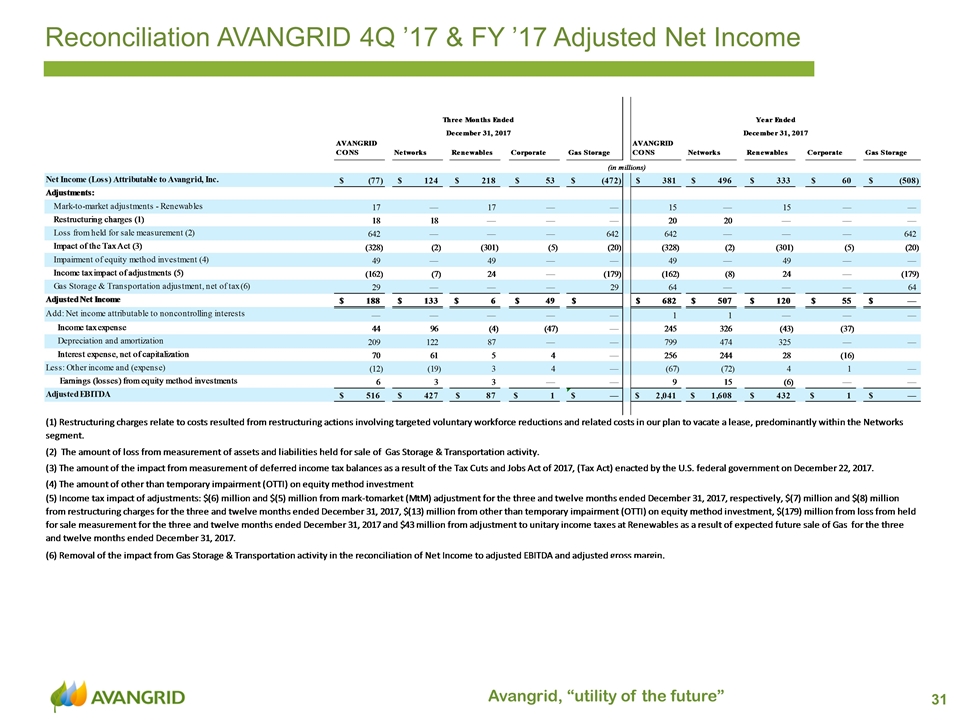
Reconciliation AVANGRID 4Q ’17 & FY ’17 Adjusted Net Income
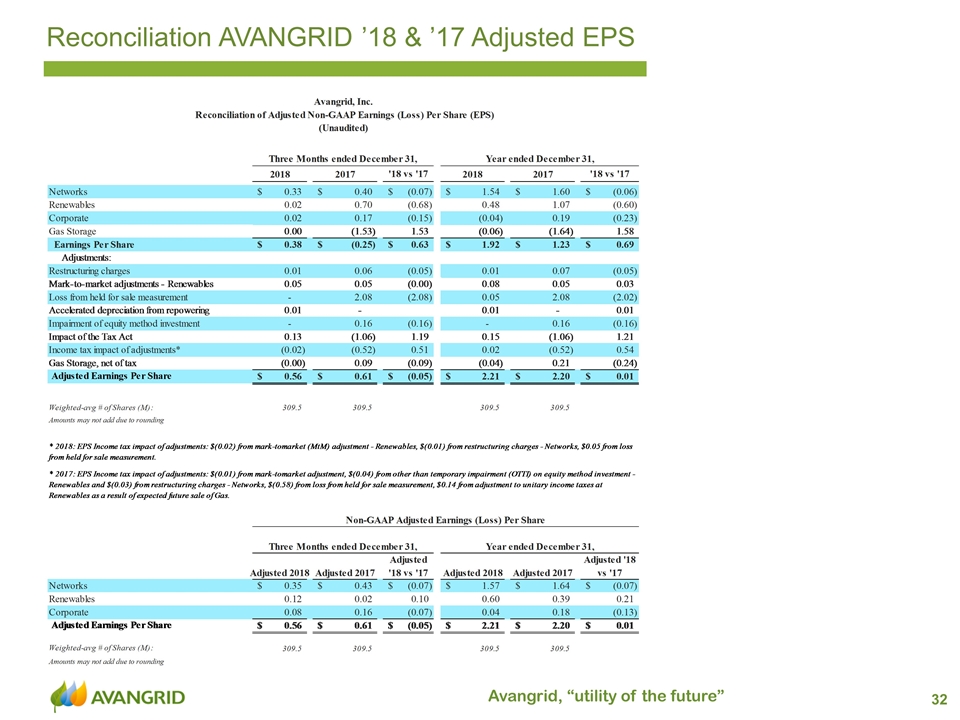
Reconciliation AVANGRID ’18 & ’17 Adjusted EPS
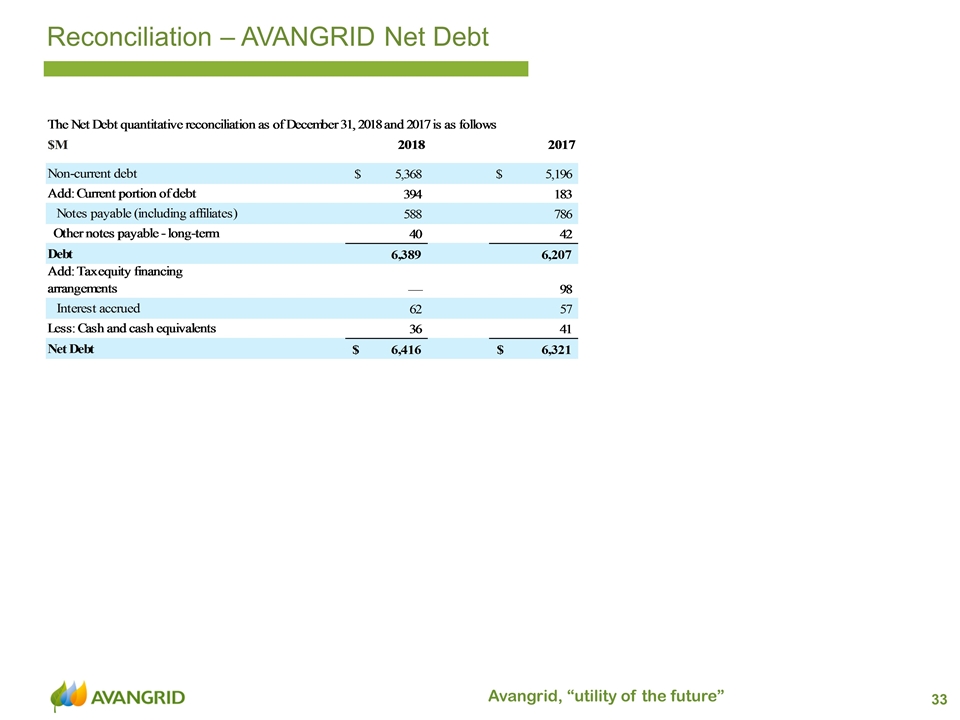
Reconciliation – AVANGRID Net Debt
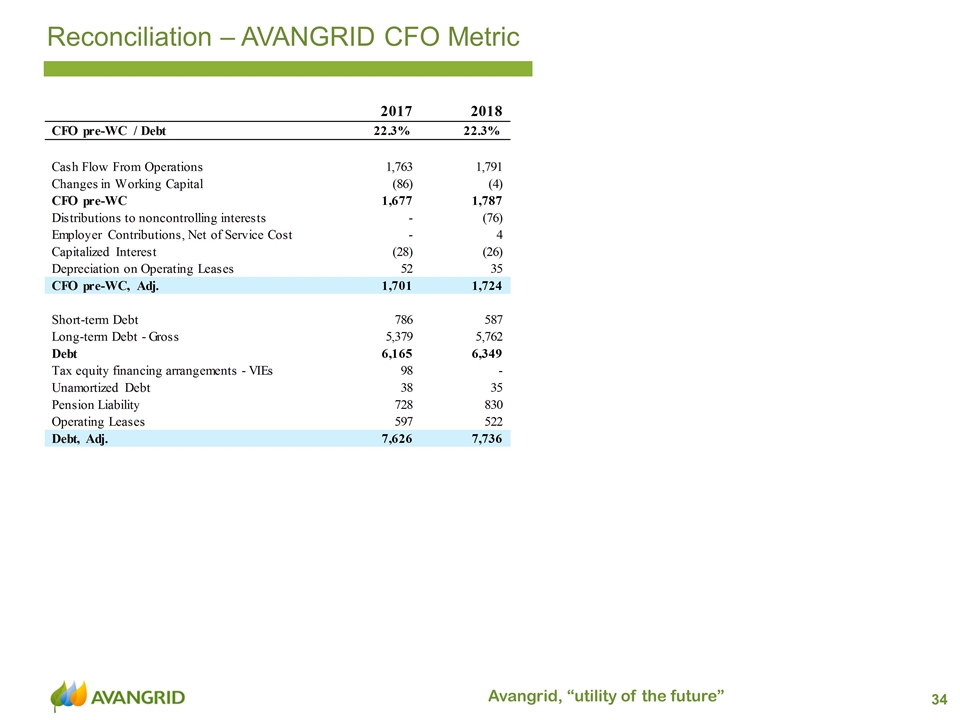
Reconciliation – AVANGRID CFO Metric
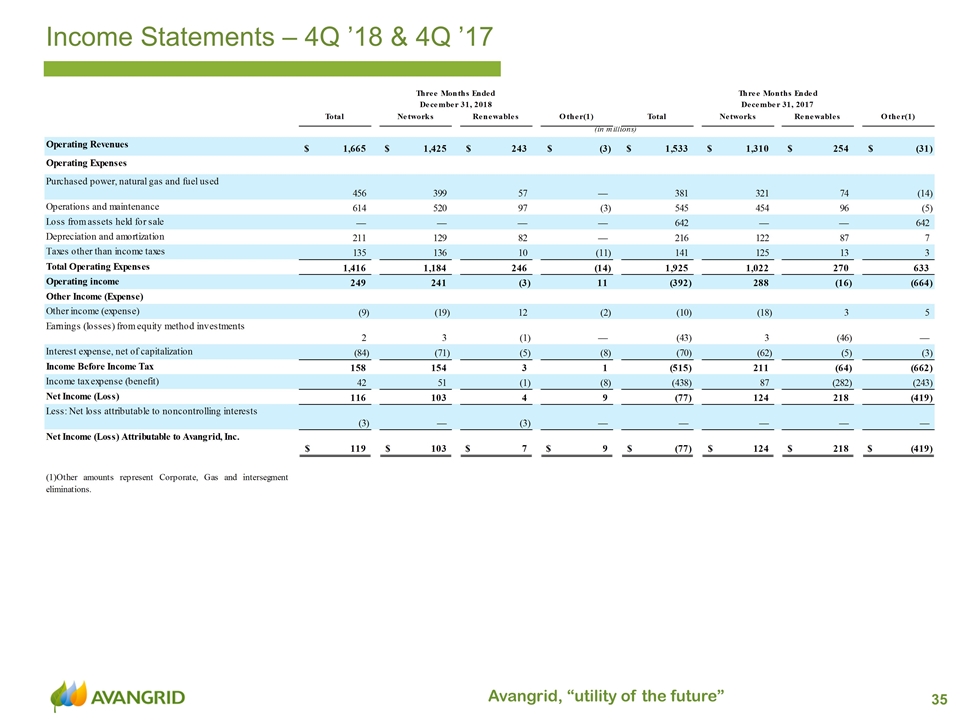
Income Statements – 4Q ’18 & 4Q ’17
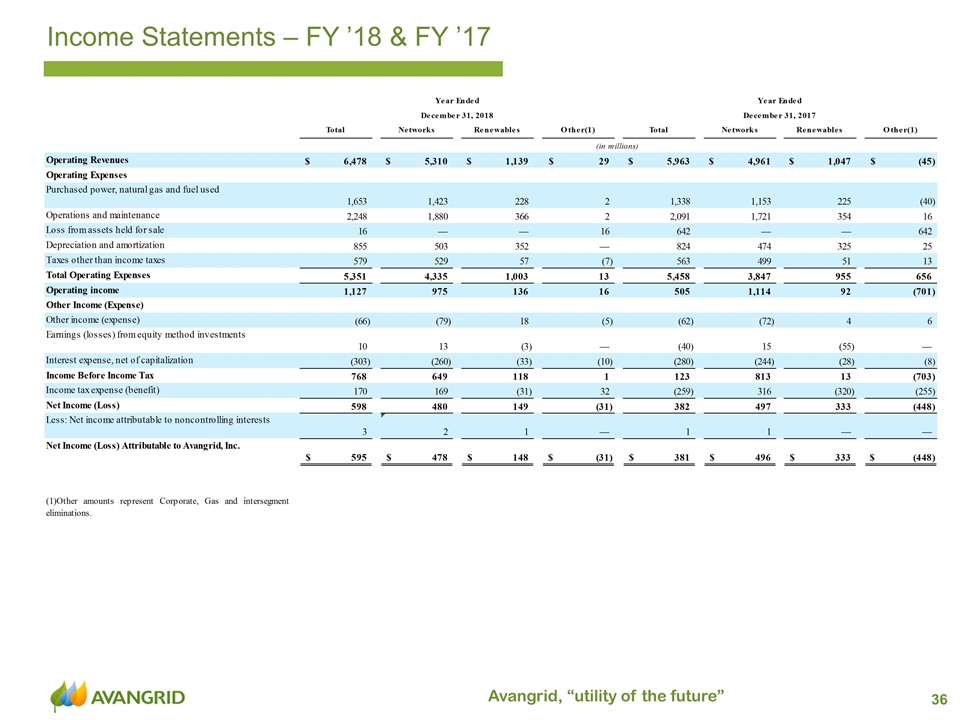
Income Statements – FY ’18 & FY ’17
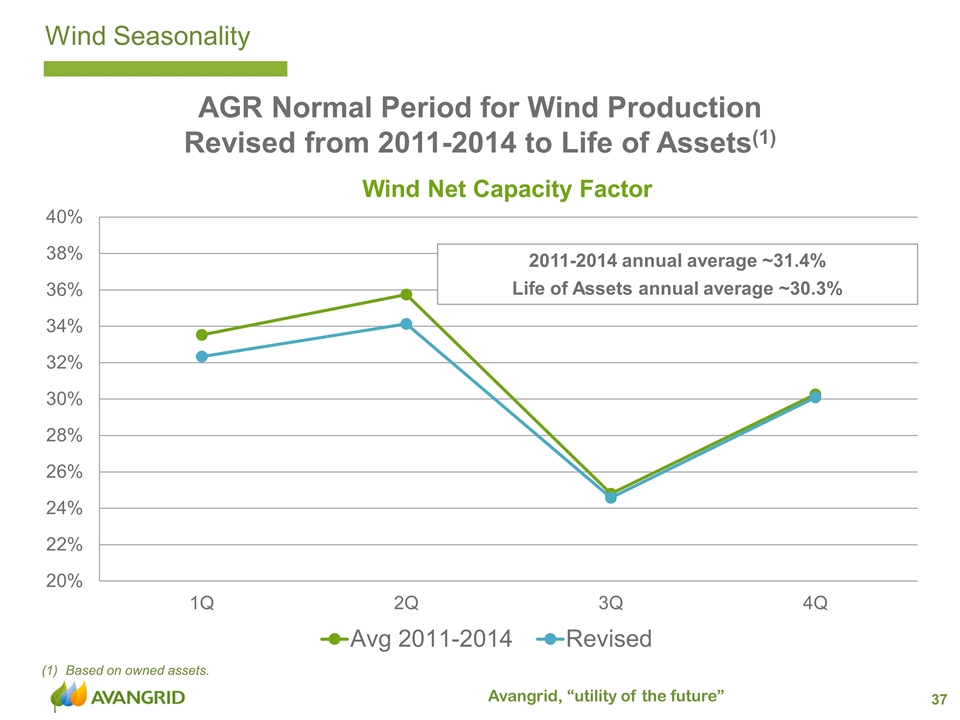
AGR Normal Period for Wind Production Revised from 2011-2014 to Life of Assets(1) Wind Seasonality Based on owned assets. 2011-2014 annual average ~31.4% Life of Assets annual average ~30.3%

Year-over-year impacts largely reflect the addition of new projects in ’17 Capacity Factor(1)(2) +2.8% FY ’17 FY ’18 Wind Production GWh(1) MidCont South & Texas 27% 20% 24% 29% FY ’18 West Northeast +10% -6% +19% +30% -1% AVANGRID Renewables Metrics Wind & Solar Installed Capacity (MW)(3) Montague 201 MW Karankawa 307 MW Patriot 226 MW Coyote 97 MW(4) Otter Creek 158 MW +89 Includes owned capacity only. Average annual capacity factor based on wind production & capacity Includes owned capacity and joint ventures 80% interest in project sold to 3rd party Amounts may not add due to rounding.

Avangrid Renewables Average Price PPA prices decrease Energy prices plus RECs for merchant increase Includes JVs. Includes RECs & hedges. PPA Avg. Price ($/MWh) FY ’17 FY ’18 Merchant Avg. Price(1) ($/MWh) (3) Includes PPA, merchant & RECS. FY ’17 FY ’18 +17% FY ’17 FY ’18 Other (2) Energy Avg. Price(3) ($/MWh) +3% PPA Avg. Price ($/MWh) -2%
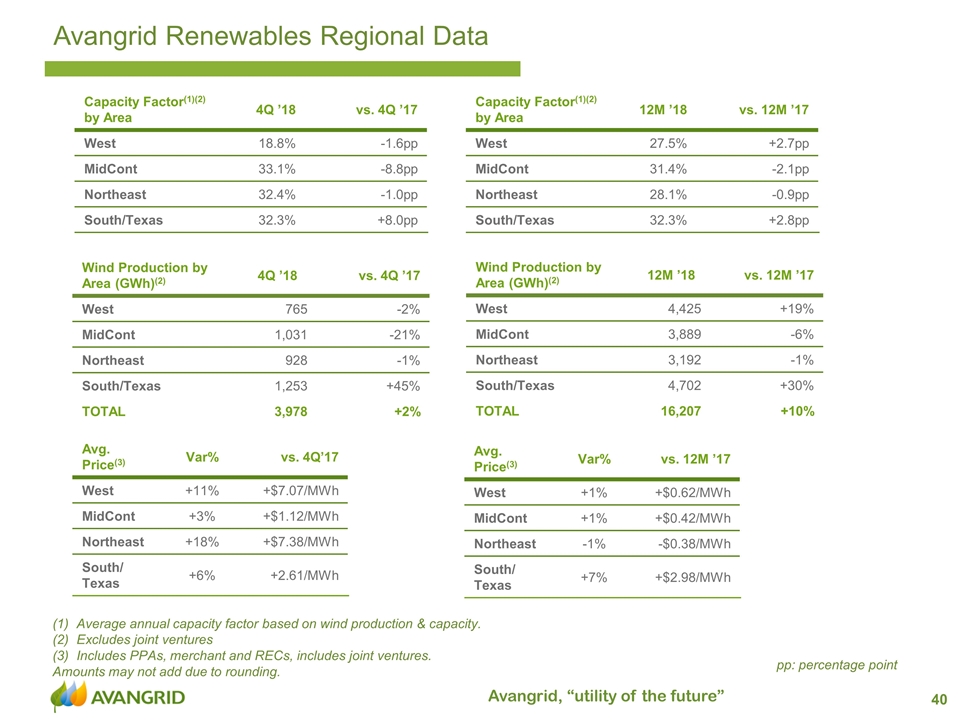
Avangrid Renewables Regional Data pp: percentage point Average annual capacity factor based on wind production & capacity. Excludes joint ventures Includes PPAs, merchant and RECs, includes joint ventures. Amounts may not add due to rounding. Capacity Factor(1)(2) by Area 4Q ’18 vs. 4Q ’17 West 18.8% -1.6pp MidCont 33.1% -8.8pp Northeast 32.4% -1.0pp South/Texas 32.3% +8.0pp Wind Production by Area (GWh)(2) 4Q ’18 vs. 4Q ’17 West 765 -2% MidCont 1,031 -21% Northeast 928 -1% South/Texas 1,253 +45% TOTAL 3,978 +2% Avg. Price(3) Var% vs. 4Q’17 West +11% +$7.07/MWh MidCont +3% +$1.12/MWh Northeast +18% +$7.38/MWh South/ Texas +6% +2.61/MWh Capacity Factor(1)(2) by Area 12M ’18 vs. 12M ’17 West 27.5% +2.7pp MidCont 31.4% -2.1pp Northeast 28.1% -0.9pp South/Texas 32.3% +2.8pp Wind Production by Area (GWh)(2) 12M ’18 vs. 12M ’17 West 4,425 +19% MidCont 3,889 -6% Northeast 3,192 -1% South/Texas 4,702 +30% TOTAL 16,207 +10% Avg. Price(3) Var% vs. 12M ’17 West +1% +$0.62/MWh MidCont +1% +$0.42/MWh Northeast -1% -$0.38/MWh South/ Texas +7% +$2.98/MWh
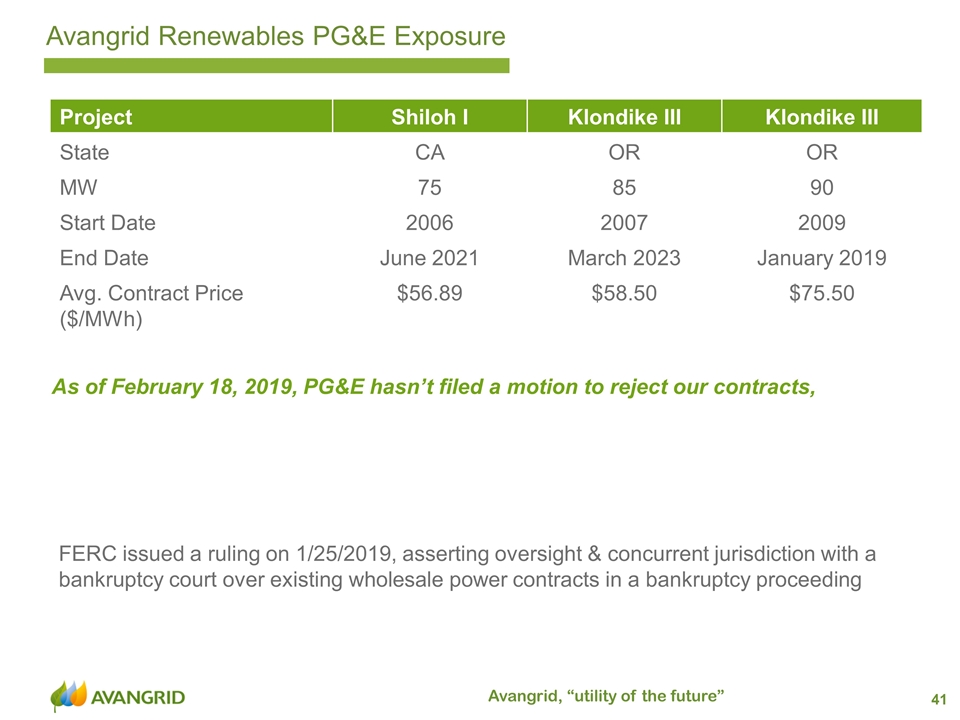
Avangrid Renewables PG&E Exposure FERC issued a ruling on 1/25/2019, asserting oversight & concurrent jurisdiction with a bankruptcy court over existing wholesale power contracts in a bankruptcy proceeding Project Shiloh I Klondike III Klondike III State CA OR OR MW 75 85 90 Start Date 2006 2007 2009 End Date June 2021 March 2023 January 2019 Avg. Contract Price ($/MWh) $56.89 $58.50 $75.50 As of February 18, 2019, PG&E hasn’t filed a motion to reject our contracts,
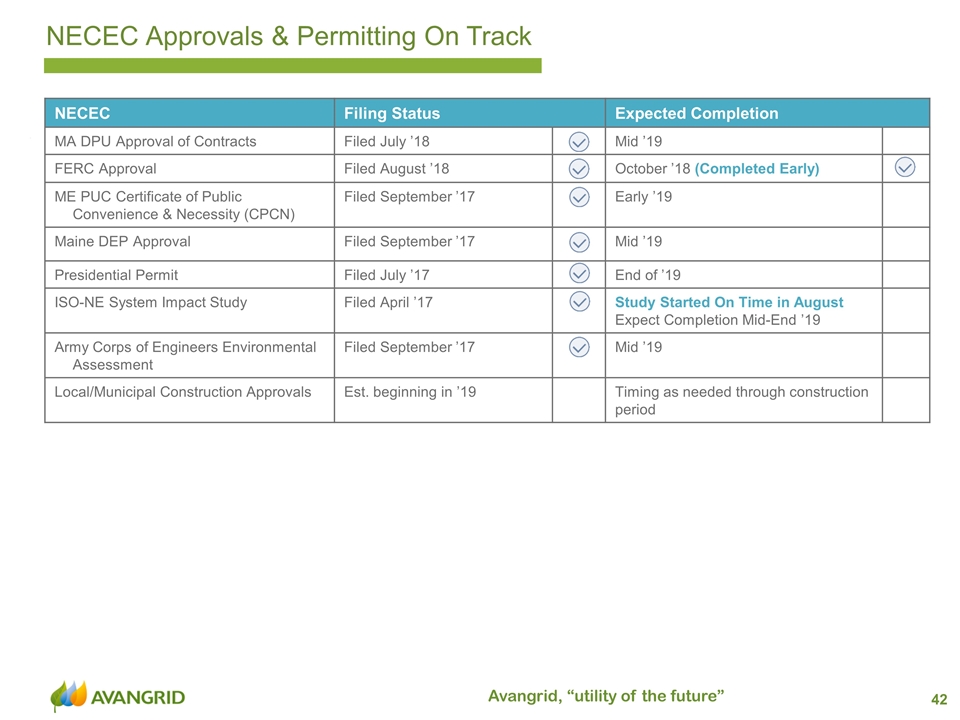
NECEC Approvals & Permitting On Track NECEC Filing Status Expected Completion MA DPU Approval of Contracts Filed July ’18 Mid ’19 FERC Approval Filed August ’18 October ’18 (Completed Early) ME PUC Certificate of Public Convenience & Necessity (CPCN) Filed September ’17 Early ’19 Maine DEP Approval Filed September ’17 Mid ’19 Presidential Permit Filed July ’17 End of ’19 ISO-NE System Impact Study Filed April ’17 Study Started On Time in August Expect Completion Mid-End ’19 Army Corps of Engineers Environmental Assessment Filed September ’17 Mid ’19 Local/Municipal Construction Approvals Est. beginning in ’19 Timing as needed through construction period
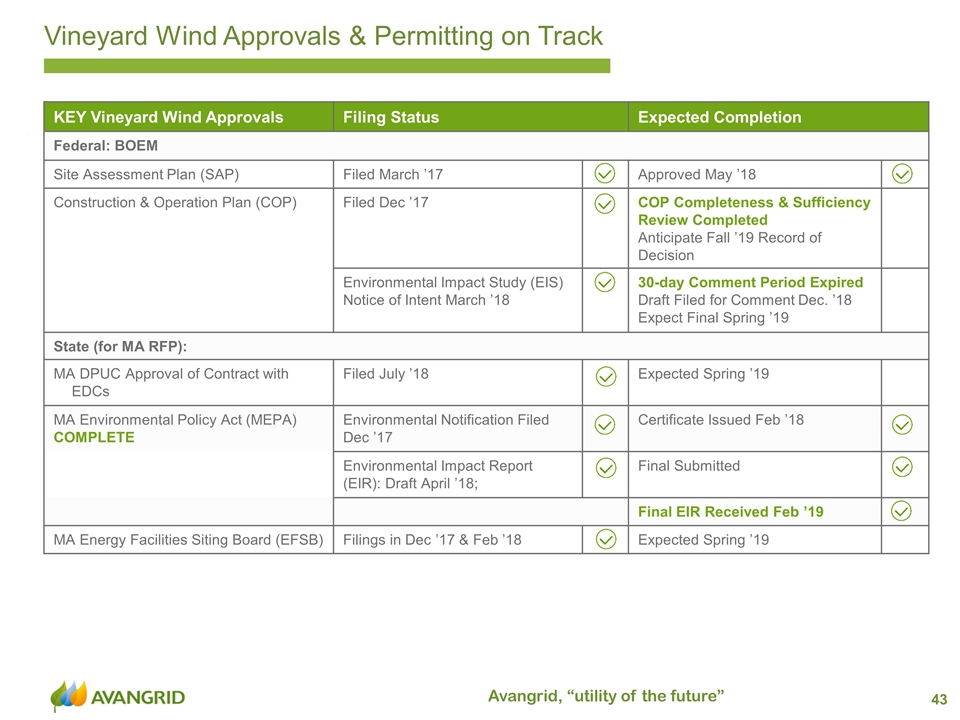
Vineyard Wind Approvals & Permitting on Track KEY Vineyard Wind Approvals Filing Status Expected Completion Federal: BOEM Site Assessment Plan (SAP) Filed March ’17 Approved May ’18 Construction & Operation Plan (COP) Filed Dec ’17 COP Completeness & Sufficiency Review Completed Anticipate Fall ’19 Record of Decision Environmental Impact Study (EIS) Notice of Intent March ’18 30-day Comment Period Expired Draft Filed for Comment Dec. ’18 Expect Final Spring ’19 State (for MA RFP): MA DPUC Approval of Contract with EDCs Filed July ’18 Expected Spring ’19 MA Environmental Policy Act (MEPA) COMPLETE Environmental Notification Filed Dec ’17 Certificate Issued Feb ’18 Environmental Impact Report (EIR): Draft April ’18; Final Submitted Final EIR Received Feb ’19 MA Energy Facilities Siting Board (EFSB) Filings in Dec ’17 & Feb ’18 Expected Spring ’19


