
Exhibit 99.2
Use of Non-U.S. GAAP Financial Measures To supplement our consolidated financial statements presented in accordance with U.S. GAAP, AVANGRID considers certain non-GAAP financial measures that are not prepared in accordance with U.S. GAAP, including adjusted net income, adjusted EPS, adjusted gross margin and adjusted EBITDA. The non-GAAP financial measures we use are specific to AVANGRID and the non-GAAP financial measures of other companies may not be calculated in the same manner. We use these non-GAAP financial measures, in addition to U.S. GAAP measures, to establish operating budgets and operational goals to manage and monitor our business, evaluate our operating and financial performance and to compare such performance to prior periods and to the performance of our competitors. We believe that presenting such non-GAAP financial measures is useful because such measures can be used to analyze and compare profitability between companies and industries because it eliminates the impact of financing and certain non-cash charges as well as allow for an evaluation of AVANGRID with a focus on the performance of its core operations. In addition, we present non-GAAP financial measures because we believe that they and other similar measures are widely used by certain investors, securities analysts and other interested parties as supplemental measures of performance. We provide adjusted net income and adjusted earnings per share, which are adjusted to reflect the effect of mark-to-market changes in the fair value of derivative instruments used by AVANGRID to economically hedge market price fluctuations in related underlying physical transactions for the purchase and sale of electricity, adjustments for the non-core Gas Storage business including certain losses related to its sale, restructuring charges primarily associated with reorganizing to better align our people resources with business demands and priorities as part of the Forward 2020+ program, and the impact of accelerated depreciation on the repowering of certain Renewables assets. We define adjusted EBITDA as net income attributable to AVANGRID, adding back income tax expense, depreciation, amortization, impairment of non-current assets and interest expense, net of capitalization, and then subtracting other income and earnings from equity method investments. We also define adjusted gross margin as adjusted EBITDA adding back operations and maintenance and taxes other than income taxes and then subtracting transmission wheeling. The most directly comparable U.S. GAAP measure to adjusted EBITDA and adjusted gross margin is net income. We believe that presenting these non-GAAP financial measures is useful in understanding and evaluating actual and projected financial performance and contribution of AVANGRID core lines of business and to more fully compare and explain our results. The most directly comparable U.S. GAAP measure to adjusted net income is net income. We also provide adjusted EPS, which is adjusted net income converted to an earnings per share amount. The use of non-GAAP financial measures is not intended to be considered in isolation or as a substitute for, or superior to, AVANGRID’s U.S. GAAP financial information, and investors are cautioned that the non-GAAP financial measures are limited in their usefulness, may be unique to AVANGRID, and should be considered only as a supplement to AVANGRID’s U.S. GAAP financial measures. The non-GAAP financial measures may not be comparable to other similarly titled measures of other companies and have limitations as analytical tools. Non-GAAP financial measures are not primary measurements of our performance under U.S. GAAP and should not be considered as alternatives to operating income, net income or any other performance measures determined in accordance with U.S. GAAP. Legal Notice
Legal Notice Investors@AVANGRID.com FORWARD LOOKING STATEMENTS Certain statements in this presentation may relate to our future business and financial performance and future events or developments involving us and our subsidiaries that are not purely historical and may constitute “forward-looking statements” within the meaning of the Private Securities Litigation Reform Act of 1995. Forward-looking statements may be identified by the use of forward-looking terms such as “may,” “will,” “should,” “would,” “could,” “can,” “expect(s,)” “believe(s),” “anticipate(s),” “intend(s),” “plan(s),” “estimate(s),” “project(s),”“assume(s),” “guide(s),” “target(s),” “forecast(s),” “are (is) confident that” and “seek(s)” or the negative of such terms or other variations on such terms or comparable terminology. Such forward looking statements include, but are not limited to, statements about our plans, objectives and intentions, outlooks or expectations for earnings, revenues, expenses or other future financial or business performance, strategies or expectations, or the impact of legal or regulatory matters on our business, results of operations or financial condition. Such statements are based upon the current reasonable beliefs, expectations and assumptions of our management and are subject to significant risks and uncertainties that could cause actual outcomes and results to differ materially. Important factors that could cause actual results to differ materially from those indicated by such forward-looking statements include, without limitation, the risks and uncertainties set forth under the section entitled “Risk Factors” and “Management’s Discussion and Analysis of Financial Condition and Results of Operations” in our Annual Report on Form 10-K for the year ended December 31, 2018, which is on file with the U.S. Securities and Exchange Commission (SEC) and available on our investor relations website at www.Avangrid.com and on the SEC website at www.sec.gov. Additional information will also be set forth in subsequent filings with the SEC. You should consider these factors carefully in evaluating for-ward looking statements. Should one or more of these risks or uncertainties materialize, or should any of the underlying assumptions prove incorrect, actual results may vary in material respects from those expressed or implied by these forward-looking statements. You should not place undue reliance on these forward-looking statements. We do not undertake any obligation to update or revise any forward-looking statements to reflect events or circumstances after the date of this presentation whether as a result of new information, future events or otherwise, except as may be required under applicable securities laws. About AVANGRID: AVANGRID, Inc. (NYSE: AGR) is a leading, sustainable energy company with approximately $33 billion in assets and operations in 24 U.S. states. AVANGRID has two primary lines of business: Avangrid Networks and Avangrid Renewables. Avangrid Networks owns eight electric and natural gas utilities, serving 3.2 million customers in New York and New England. Avangrid Renewables owns and operates 7.2 gigawatts of electricity capacity, primarily through wind power, with a presence in 22 states across the United States. AVANGRID employs approximately 6,500 people. AVANGRID supports the U.N.’s Sustainable Development Goals and was named among the World’s Most Ethical Companies in 2019 by the Ethisphere Institute. For more information, visit www.avangrid.com.

1Q 2019 Highlights James Torgerson
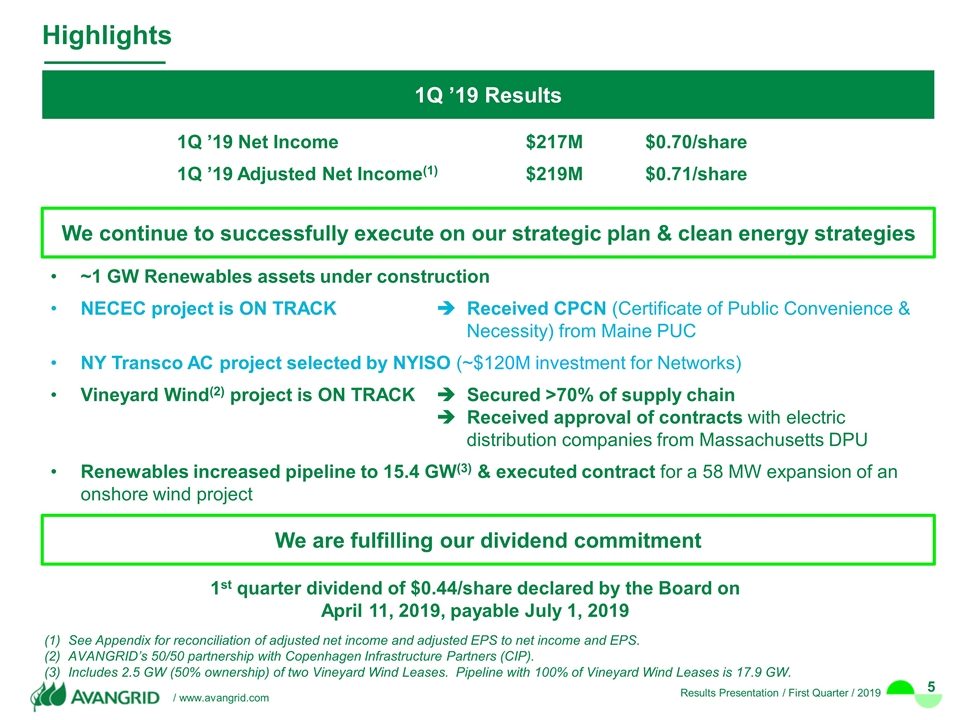
~1 GW Renewables assets under construction NECEC project is ON TRACK è Received CPCN (Certificate of Public Convenience & Necessity) from Maine PUC NY Transco AC project selected by NYISO (~$120M investment for Networks) Vineyard Wind(2) project is ON TRACK è Secured >70% of supply chain è Received approval of contracts with electric distribution companies from Massachusetts DPU Renewables increased pipeline to 15.4 GW(3) & executed contract for a 58 MW expansion of an onshore wind project See Appendix for reconciliation of adjusted net income and adjusted EPS to net income and EPS. AVANGRID’s 50/50 partnership with Copenhagen Infrastructure Partners (CIP). Includes 2.5 GW (50% ownership) of two Vineyard Wind Leases. Pipeline with 100% of Vineyard Wind Leases is 17.9 GW. 1Q ’19 Net Income $217M $0.70/share 1Q ’19 Adjusted Net Income(1) $219M $0.71/share 1st quarter dividend of $0.44/share declared by the Board on April 11, 2019, payable July 1, 2019 Highlights 1Q ’19 Results We continue to successfully execute on our strategic plan & clean energy strategies We are fulfilling our dividend commitment
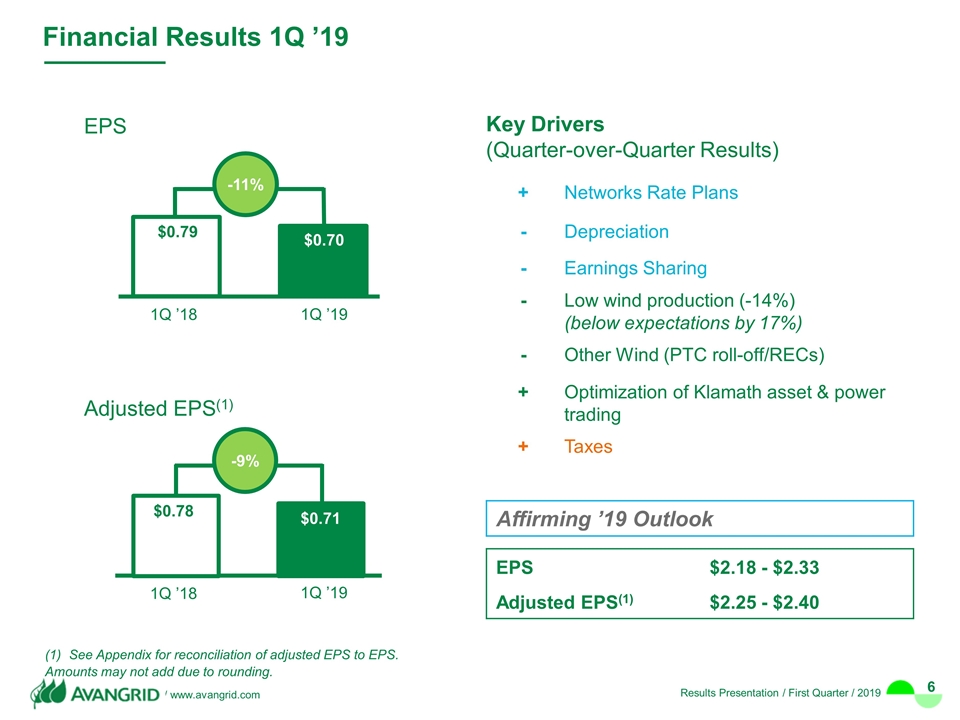
-9% 1Q ’18 1Q ’19 Adjusted EPS(1) Amounts may not add due to rounding. -11% 1Q ’18 1Q ’19 EPS See Appendix for reconciliation of adjusted EPS to EPS. Key Drivers (Quarter-over-Quarter Results) + Networks Rate Plans - Depreciation - Earnings Sharing - Low wind production (-14%) (below expectations by 17%) - Other Wind (PTC roll-off/RECs) + Optimization of Klamath asset & power trading + Taxes Affirming ’19 Outlook EPS $2.18 - $2.33 Adjusted EPS(1) $2.25 - $2.40 Financial Results 1Q ’19
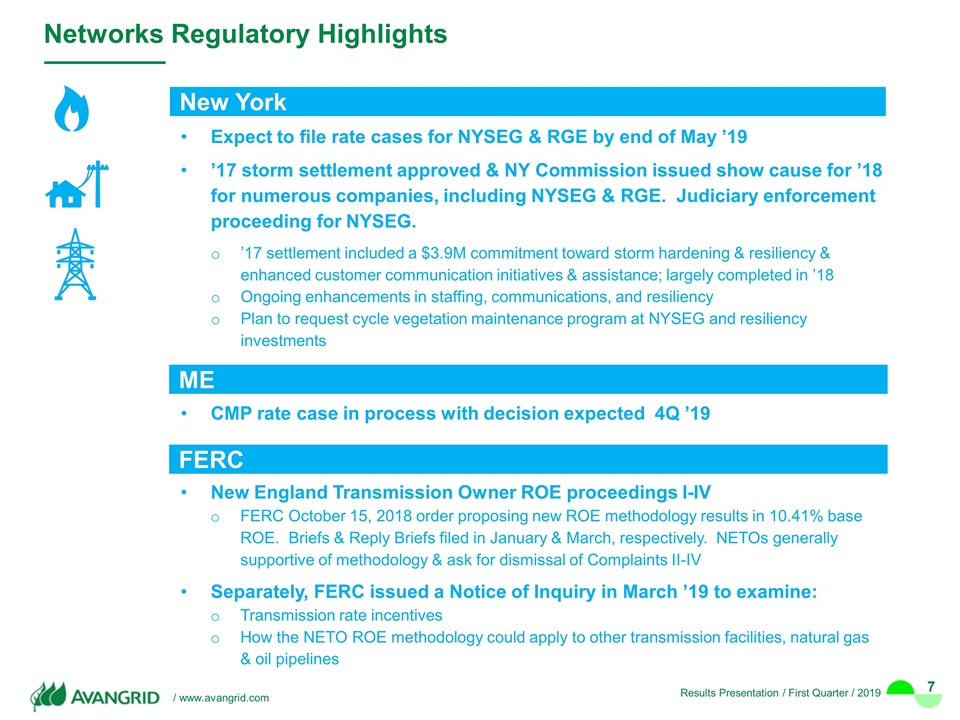
Networks Regulatory Highlights Expect to file rate cases for NYSEG & RGE by end of May ’19 ’17 storm settlement approved & NY Commission issued show cause for ’18 for numerous companies, including NYSEG & RGE. Judiciary enforcement proceeding for NYSEG. ’17 settlement included a $3.9M commitment toward storm hardening & resiliency & enhanced customer communication initiatives & assistance; largely completed in ’18 Ongoing enhancements in staffing, communications, and resiliency Plan to request cycle vegetation maintenance program at NYSEG and resiliency investments New York ME FERC New England Transmission Owner ROE proceedings I-IV FERC October 15, 2018 order proposing new ROE methodology results in 10.41% base ROE. Briefs & Reply Briefs filed in January & March, respectively. NETOs generally supportive of methodology & ask for dismissal of Complaints II-IV Separately, FERC issued a Notice of Inquiry in March ’19 to examine: Transmission rate incentives How the NETO ROE methodology could apply to other transmission facilities, natural gas & oil pipelines CMP rate case in process with decision expected 4Q ’19
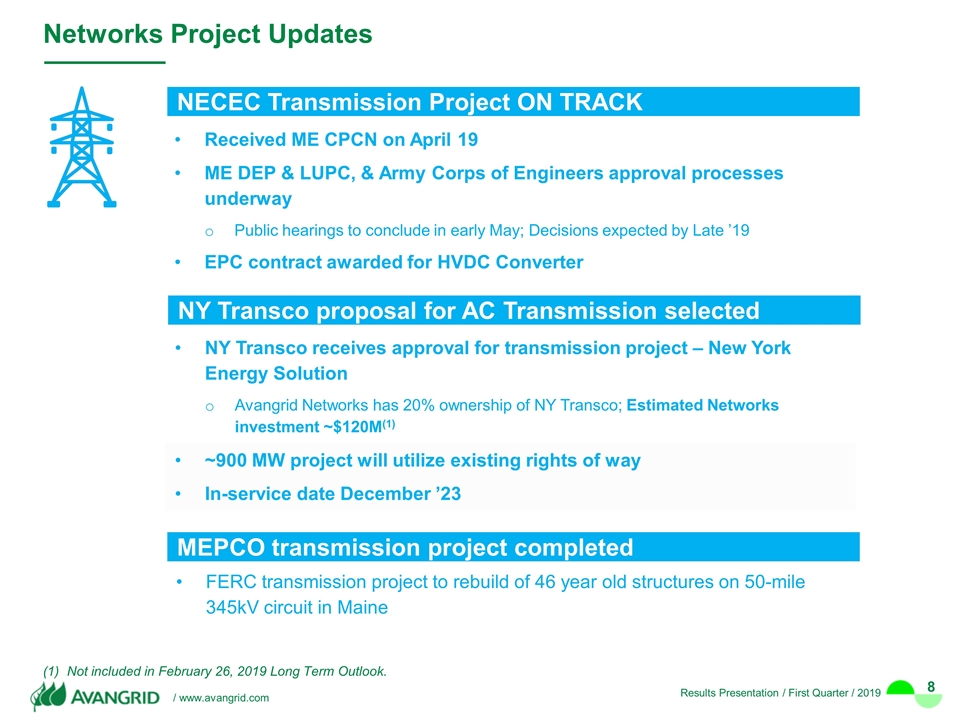
Networks Project Updates Received ME CPCN on April 19 ME DEP & LUPC, & Army Corps of Engineers approval processes underway Public hearings to conclude in early May; Decisions expected by Late ’19 EPC contract awarded for HVDC Converter NECEC Transmission Project ON TRACK NY Transco proposal for AC Transmission selected NY Transco receives approval for transmission project – New York Energy Solution Avangrid Networks has 20% ownership of NY Transco; Estimated Networks investment ~$120M(1) ~900 MW project will utilize existing rights of way In-service date December ’23 MEPCO transmission project completed FERC transmission project to rebuild of 46 year old structures on 50-mile 345kV circuit in Maine Not included in February 26, 2019 Long Term Outlook.
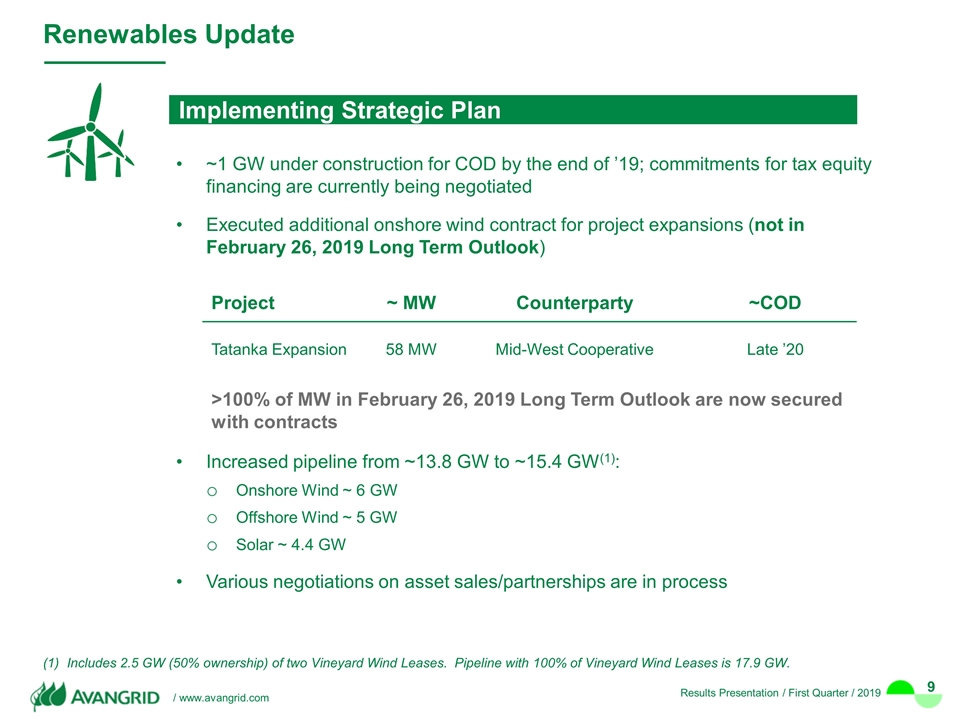
Renewables Update Implementing Strategic Plan ~1 GW under construction for COD by the end of ’19; commitments for tax equity financing are currently being negotiated Executed additional onshore wind contract for project expansions (not in February 26, 2019 Long Term Outlook) Increased pipeline from ~13.8 GW to ~15.4 GW(1): Onshore Wind ~ 6 GW Offshore Wind ~ 5 GW Solar ~ 4.4 GW Various negotiations on asset sales/partnerships are in process Project ~ MW Counterparty ~COD Tatanka Expansion 58 MW Mid-West Cooperative Late ’20 >100% of MW in February 26, 2019 Long Term Outlook are now secured with contracts Includes 2.5 GW (50% ownership) of two Vineyard Wind Leases. Pipeline with 100% of Vineyard Wind Leases is 17.9 GW.
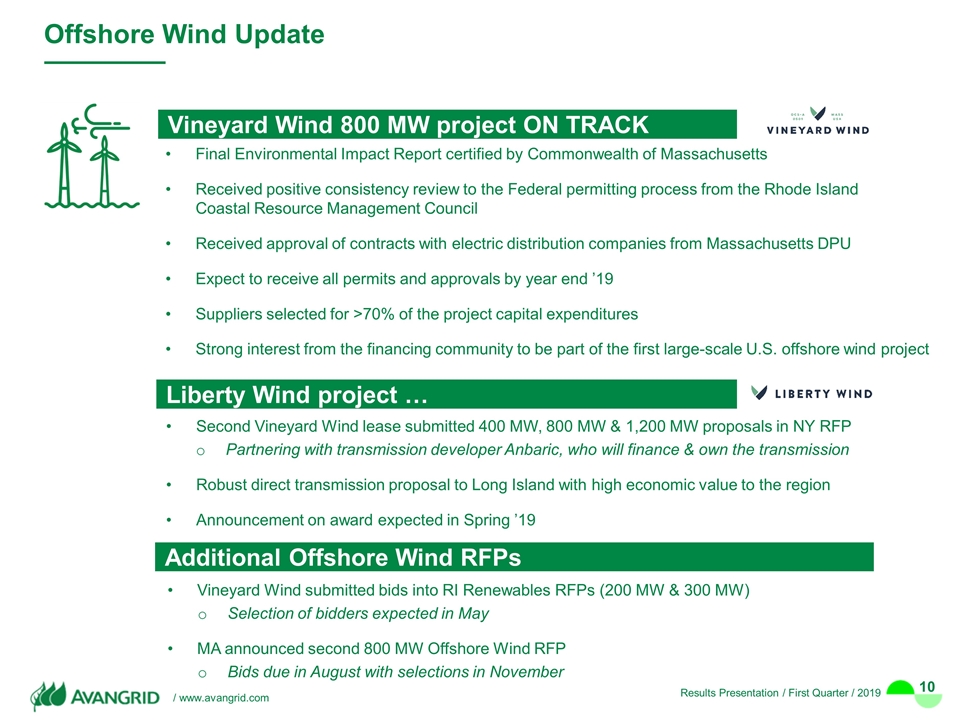
Offshore Wind Update Vineyard Wind 800 MW project ON TRACK Final Environmental Impact Report certified by Commonwealth of Massachusetts Received positive consistency review to the Federal permitting process from the Rhode Island Coastal Resource Management Council Received approval of contracts with electric distribution companies from Massachusetts DPU Expect to receive all permits and approvals by year end ’19 Suppliers selected for >70% of the project capital expenditures Strong interest from the financing community to be part of the first large-scale U.S. offshore wind project Second Vineyard Wind lease submitted 400 MW, 800 MW & 1,200 MW proposals in NY RFP Partnering with transmission developer Anbaric, who will finance & own the transmission Robust direct transmission proposal to Long Island with high economic value to the region Announcement on award expected in Spring ’19 Liberty Wind project … Vineyard Wind submitted bids into RI Renewables RFPs (200 MW & 300 MW) Selection of bidders expected in May MA announced second 800 MW Offshore Wind RFP Bids due in August with selections in November Additional Offshore Wind RFPs
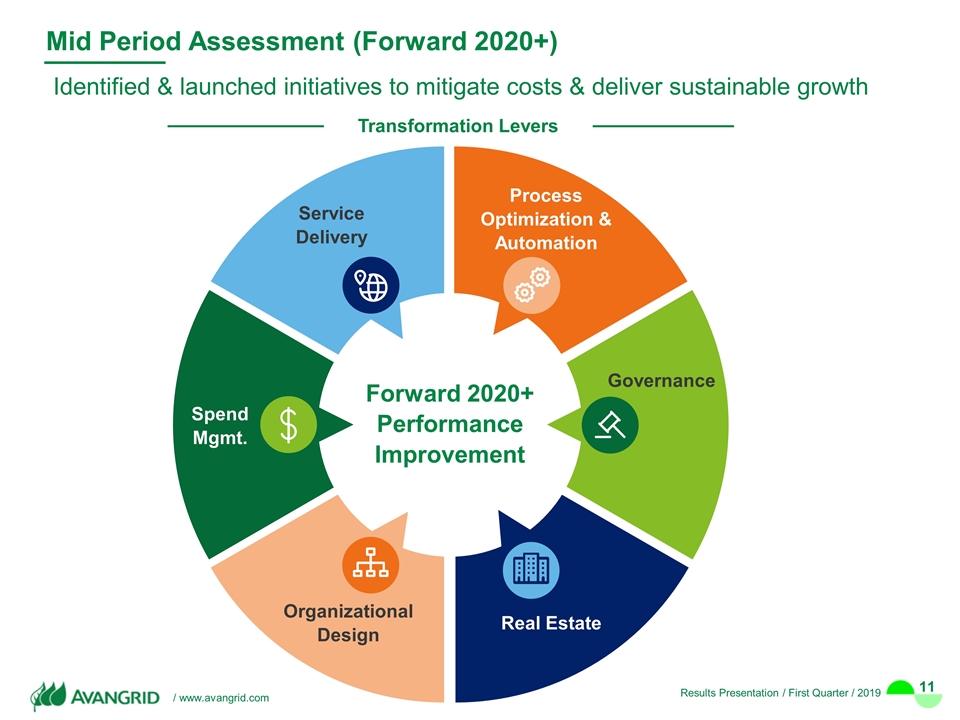
Mid Period Assessment (Forward 2020+) Identified & launched initiatives to mitigate costs & deliver sustainable growth Transformation Levers Service Delivery Process Optimization & Automation Organizational Design Real Estate Spend Mgmt. Governance Forward 2020+ Performance Improvement
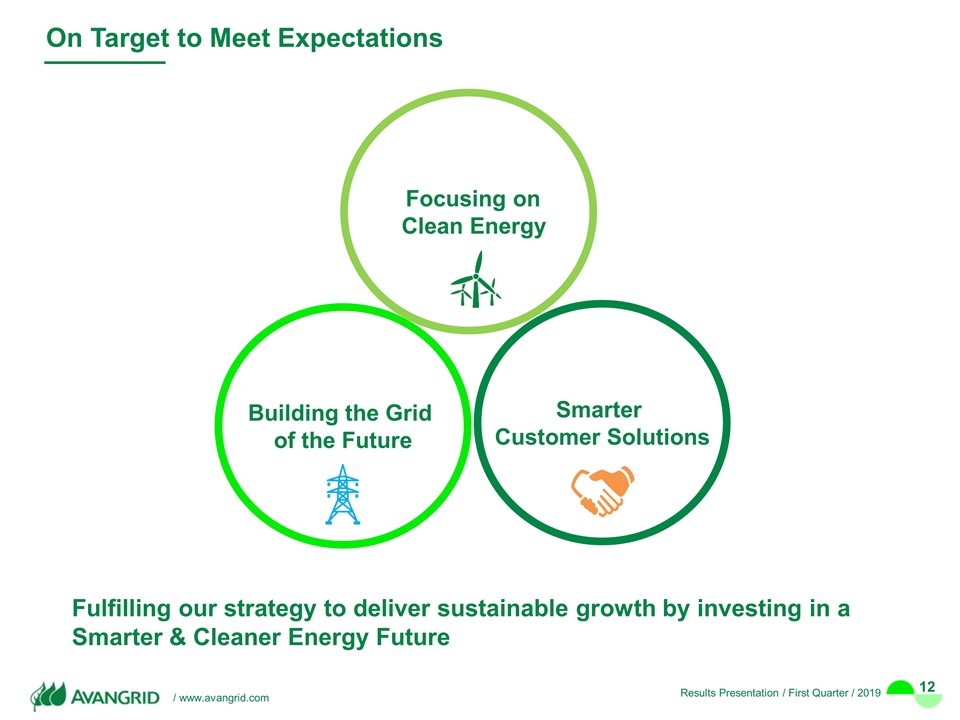
On Target to Meet Expectations Fulfilling our strategy to deliver sustainable growth by investing in a Smarter & Cleaner Energy Future Focusing on Clean Energy Building the Grid of the Future Smarter Customer Solutions

1Q 2019 Financial Results Doug Stuver
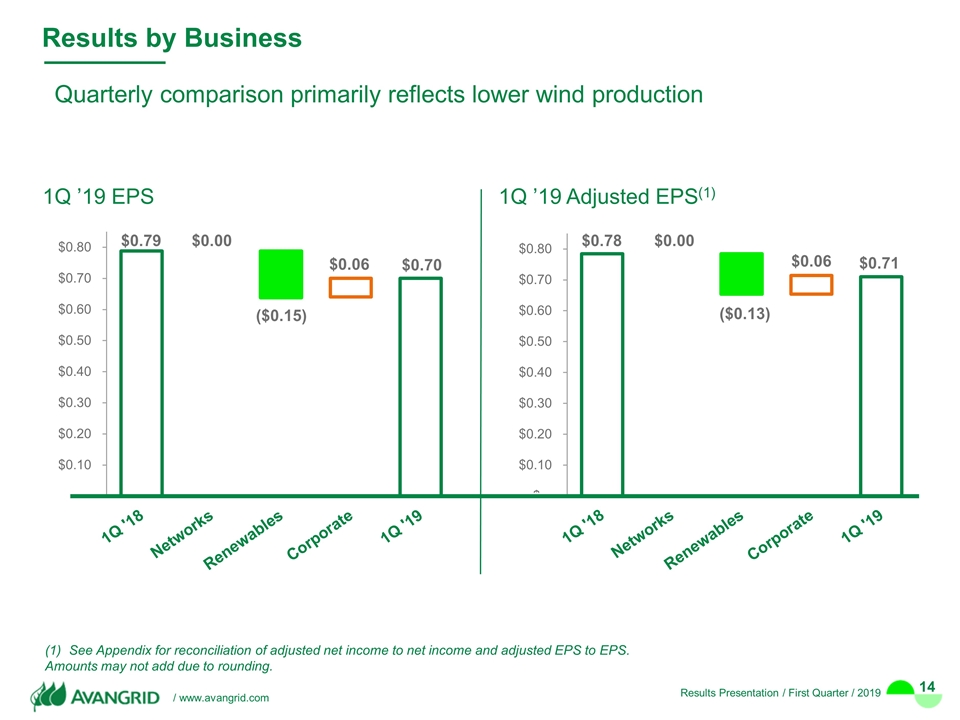
$0.79 $0.70 $0.00 ($0.15) $0.06 Quarterly comparison primarily reflects lower wind production $0.78 $0.71 $0.00 ($0.13) $0.06 1Q ’19 EPS 1Q ’19 Adjusted EPS(1) Results by Business See Appendix for reconciliation of adjusted net income to net income and adjusted EPS to EPS. Amounts may not add due to rounding.
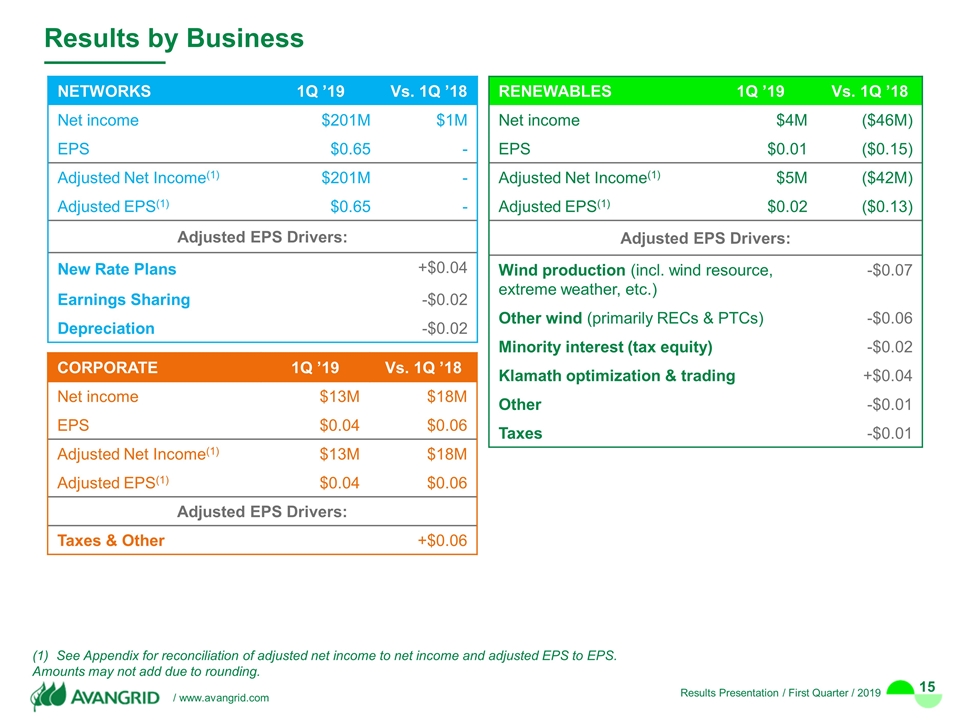
NETWORKS 1Q ’19 Vs. 1Q ’18 Net income $201M $1M EPS $0.65 - Adjusted Net Income(1) $201M - Adjusted EPS(1) $0.65 - Adjusted EPS Drivers: New Rate Plans +$0.04 Earnings Sharing -$0.02 Depreciation -$0.02 Results by Business CORPORATE 1Q ’19 Vs. 1Q ’18 Net income $13M $18M EPS $0.04 $0.06 Adjusted Net Income(1) $13M $18M Adjusted EPS(1) $0.04 $0.06 Adjusted EPS Drivers: Taxes & Other +$0.06 RENEWABLES 1Q ’19 Vs. 1Q ’18 Net income $4M ($46M) EPS $0.01 ($0.15) Adjusted Net Income(1) $5M ($42M) Adjusted EPS(1) $0.02 ($0.13) Adjusted EPS Drivers: Wind production (incl. wind resource, extreme weather, etc.) -$0.07 Other wind (primarily RECs & PTCs) -$0.06 Minority interest (tax equity) -$0.02 Klamath optimization & trading +$0.04 Other -$0.01 Taxes -$0.01 See Appendix for reconciliation of adjusted net income to net income and adjusted EPS to EPS. Amounts may not add due to rounding.
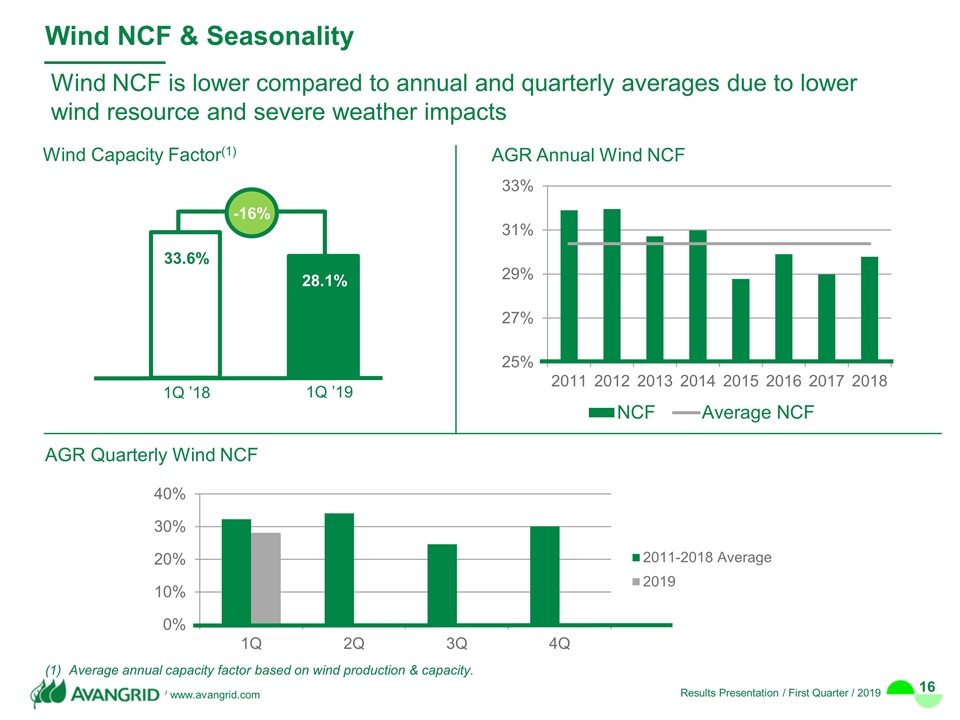
Wind NCF is lower compared to annual and quarterly averages due to lower wind resource and severe weather impacts AGR Annual Wind NCF Wind NCF & Seasonality AGR Quarterly Wind NCF Wind Capacity Factor(1) -16% 1Q ’18 1Q ’19 Average annual capacity factor based on wind production & capacity.
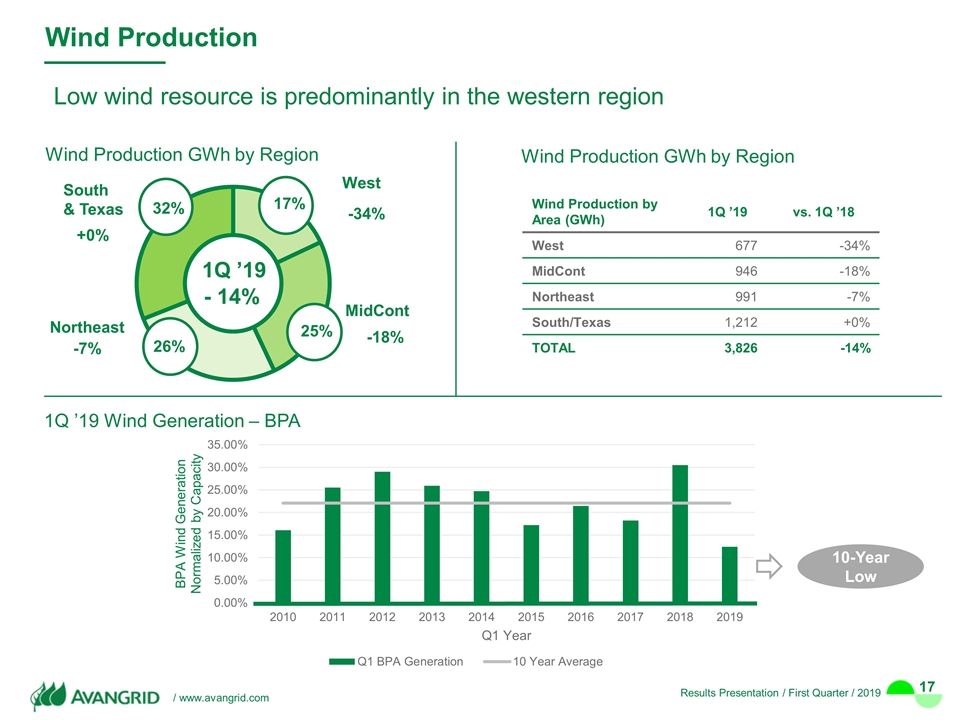
Low wind resource is predominantly in the western region pp: percentage point Wind Production GWh by Region Wind Production GWh by Region MidCont South & Texas 17% 26% 25% 32% 1Q ’19 West Northeast - 14% -18% -34% +0% -7% Wind Production Wind Production by Area (GWh) 1Q ’19 vs. 1Q ’18 West 677 -34% MidCont 946 -18% Northeast 991 -7% South/Texas 1,212 +0% TOTAL 3,826 -14% 1Q ’19 Wind Generation – BPA 10-Year Low
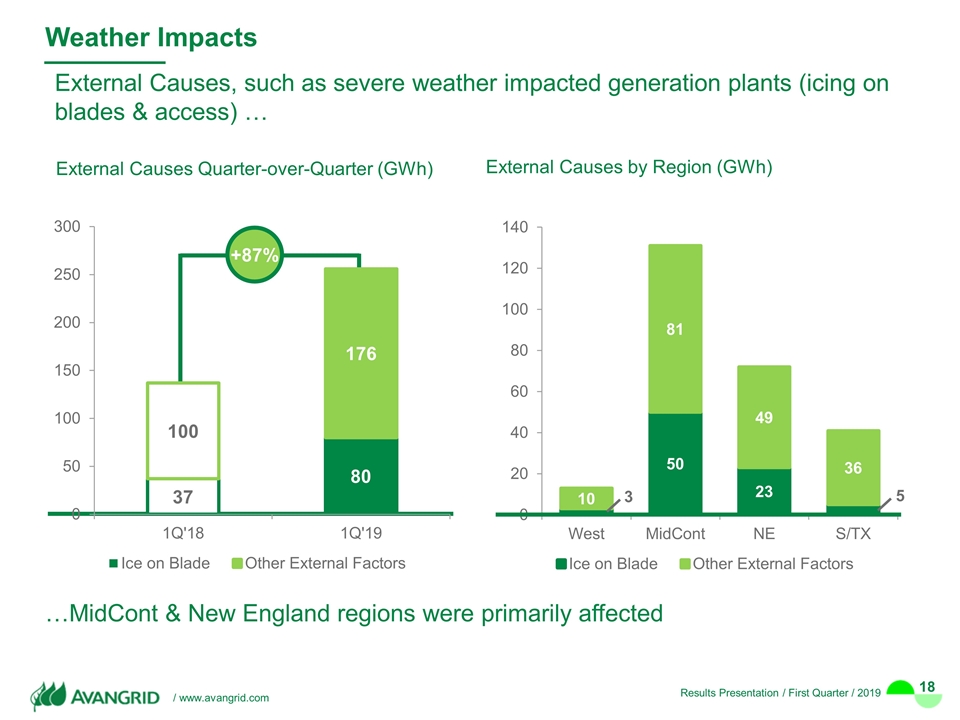
External Causes, such as severe weather impacted generation plants (icing on blades & access) … pp: percentage point Weather Impacts External Causes Quarter-over-Quarter (GWh) …MidCont & New England regions were primarily affected +87% 3 5 External Causes by Region (GWh)
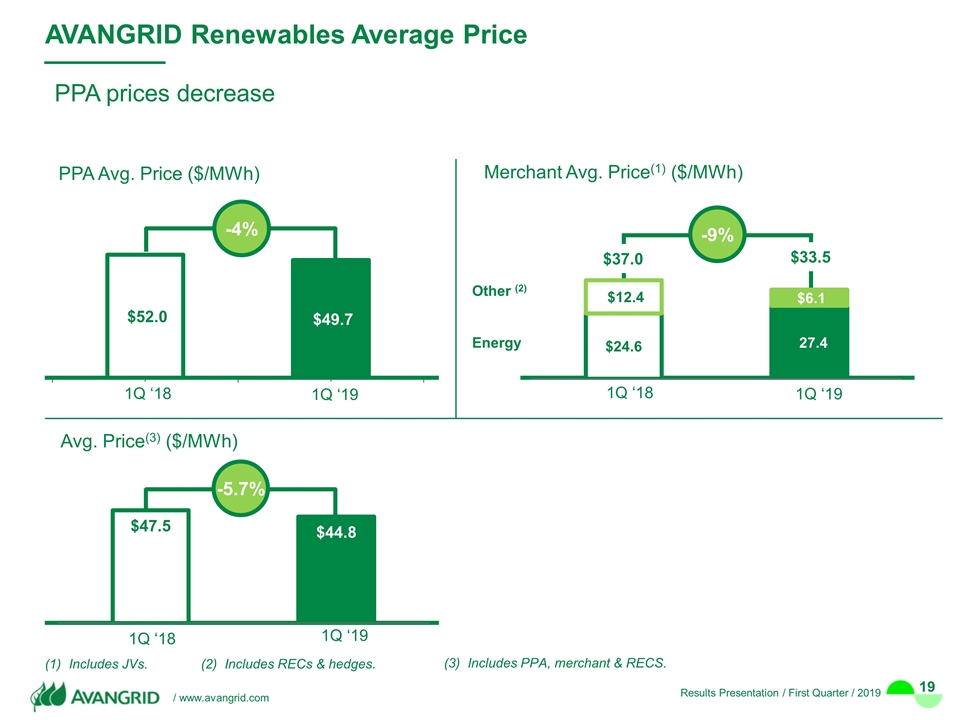
AVANGRID Renewables Average Price PPA prices decrease Includes JVs. 1Q ‘18 1Q ‘19 (3) Includes PPA, merchant & RECS. PPA Avg. Price ($/MWh) -4% 1Q ‘18 1Q ‘19 -5.7% Avg. Price(3) ($/MWh) Merchant Avg. Price(1) ($/MWh) -9% 1Q ‘18 1Q ‘19 Other (2) Energy (2) Includes RECs & hedges.
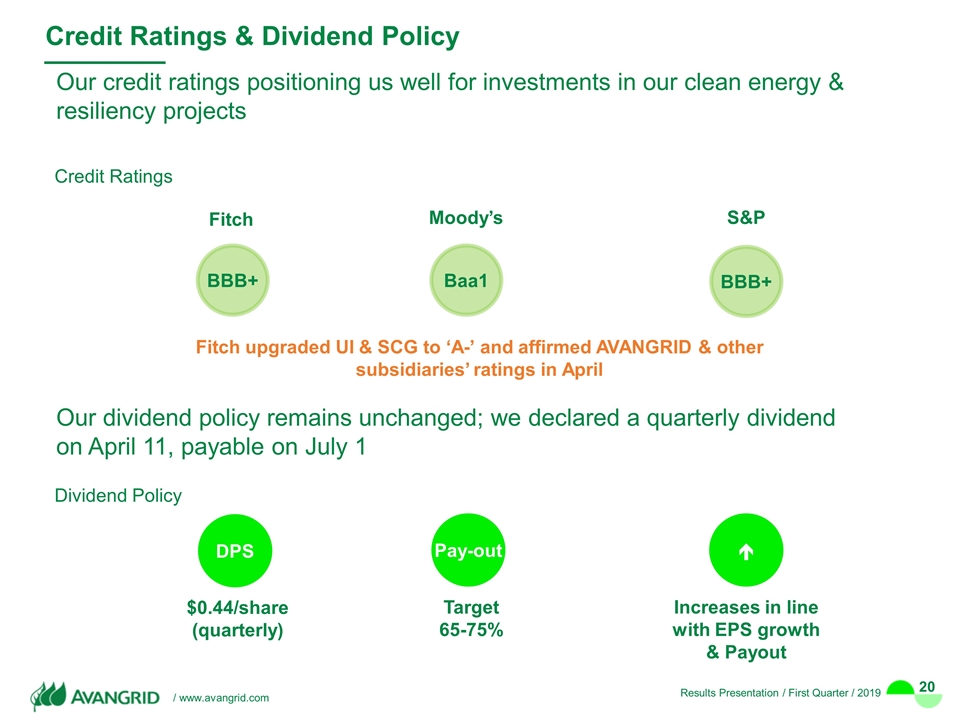
Credit Ratings & Dividend Policy Our credit ratings positioning us well for investments in our clean energy & resiliency projects Credit Ratings BBB+ Baa1 BBB+ Fitch Moody’s S&P Target 65-75% Increases in line with EPS growth & Payout Dividend Policy DPS Pay-out é $0.44/share (quarterly) Fitch upgraded UI & SCG to ‘A-’ and affirmed AVANGRID & other subsidiaries’ ratings in April Our dividend policy remains unchanged; we declared a quarterly dividend on April 11, payable on July 1
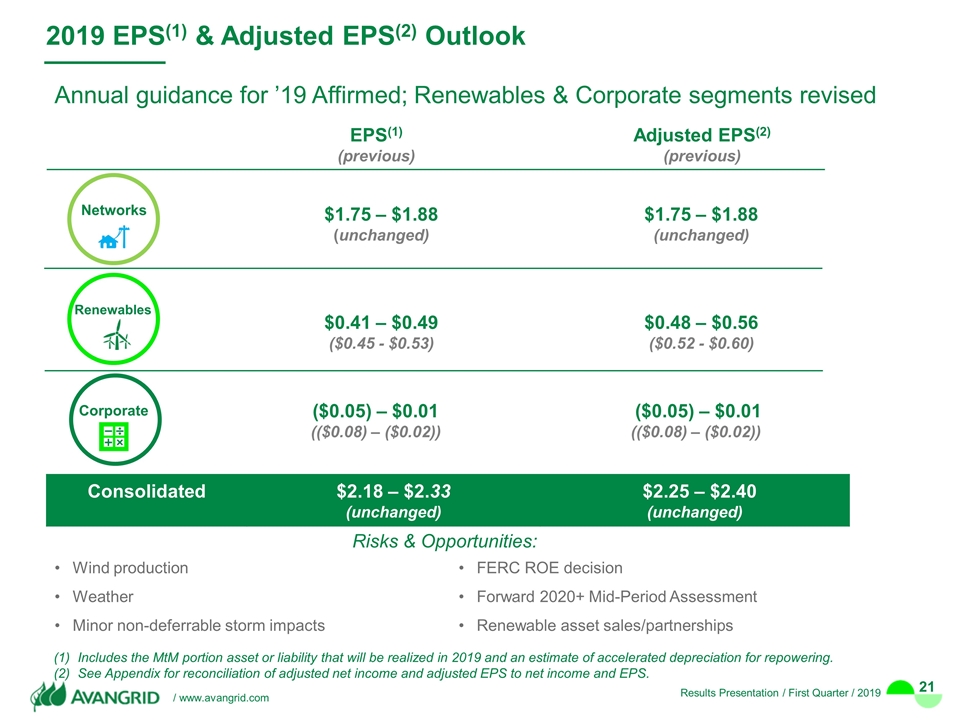
2019 EPS(1) & Adjusted EPS(2) Outlook Includes the MtM portion asset or liability that will be realized in 2019 and an estimate of accelerated depreciation for repowering. See Appendix for reconciliation of adjusted net income and adjusted EPS to net income and EPS. $1.75 – $1.88 (unchanged) $1.75 – $1.88 (unchanged) $0.41 – $0.49 ($0.45 - $0.53) $0.48 – $0.56 ($0.52 - $0.60) ($0.05) – $0.01 (($0.08) – ($0.02)) ($0.05) – $0.01 (($0.08) – ($0.02)) Consolidated $2.18 – $2.33 (unchanged) $2.25 – $2.40 (unchanged) EPS(1) (previous) Adjusted EPS(2) (previous) Networks Renewables Corporate Annual guidance for ’19 Affirmed; Renewables & Corporate segments revised Risks & Opportunities: Wind production FERC ROE decision Weather Forward 2020+ Mid-Period Assessment Minor non-deferrable storm impacts Renewable asset sales/partnerships
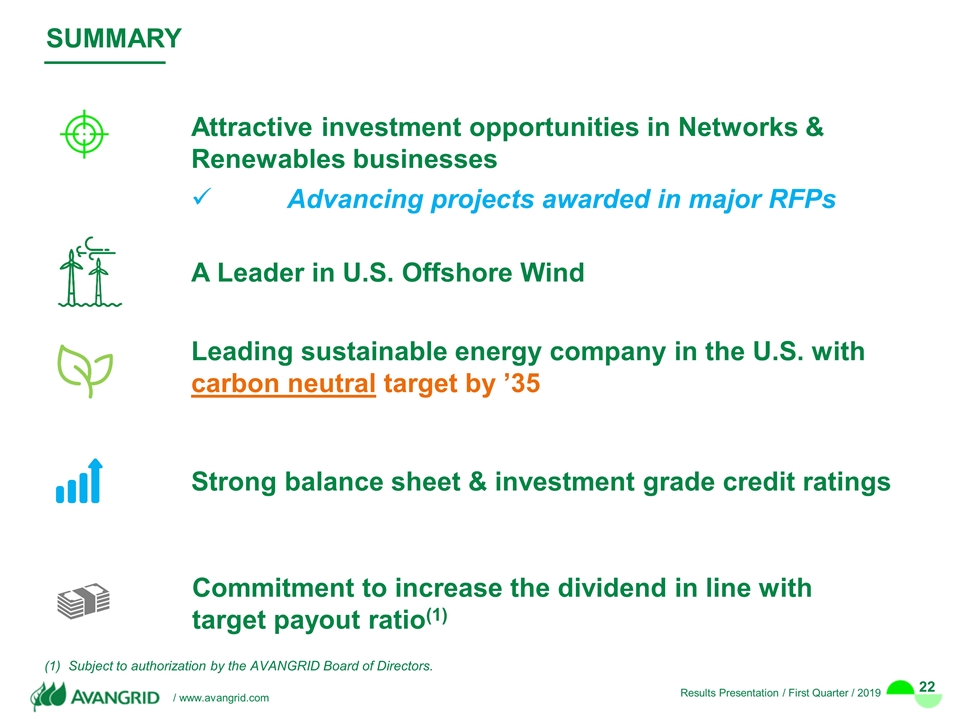
Subject to authorization by the AVANGRID Board of Directors. SUMMARY Leading sustainable energy company in the U.S. with carbon neutral target by ’35 Attractive investment opportunities in Networks & Renewables businesses Advancing projects awarded in major RFPs Strong balance sheet & investment grade credit ratings Commitment to increase the dividend in line with target payout ratio(1) A Leader in U.S. Offshore Wind
Appendix
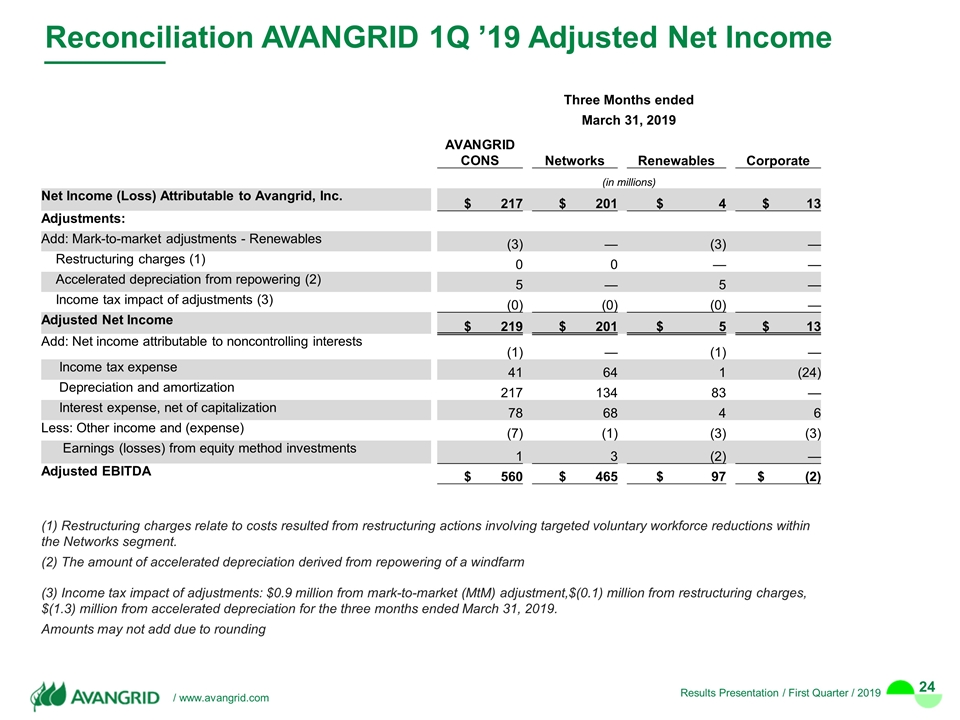
Reconciliation AVANGRID 1Q ’19 Adjusted Net Income Three Months ended March 31, 2019 AVANGRID CONS Networks Renewables Corporate (in millions) Net Income (Loss) Attributable to Avangrid, Inc. $ 217 $ 201 $ 4 $ 13 Adjustments: Add: Mark-to-market adjustments - Renewables (3) — (3) — Restructuring charges (1) 0 0 — — Accelerated depreciation from repowering (2) 5 — 5 — Income tax impact of adjustments (3) (0) (0) (0) — Adjusted Net Income $ 219 $ 201 $ 5 $ 13 Add: Net income attributable to noncontrolling interests (1) — (1) — Income tax expense 41 64 1 (24) Depreciation and amortization 217 134 83 — Interest expense, net of capitalization 78 68 4 6 Less: Other income and (expense) (7) (1) (3) (3) Earnings (losses) from equity method investments 1 3 (2) — Adjusted EBITDA $ 560 $ 465 $ 97 $ (2) (1) Restructuring charges relate to costs resulted from restructuring actions involving targeted voluntary workforce reductions within the Networks segment. (2) The amount of accelerated depreciation derived from repowering of a windfarm (3) Income tax impact of adjustments: $0.9 million from mark-to-market (MtM) adjustment,$(0.1) million from restructuring charges, $(1.3) million from accelerated depreciation for the three months ended March 31, 2019. Amounts may not add due to rounding
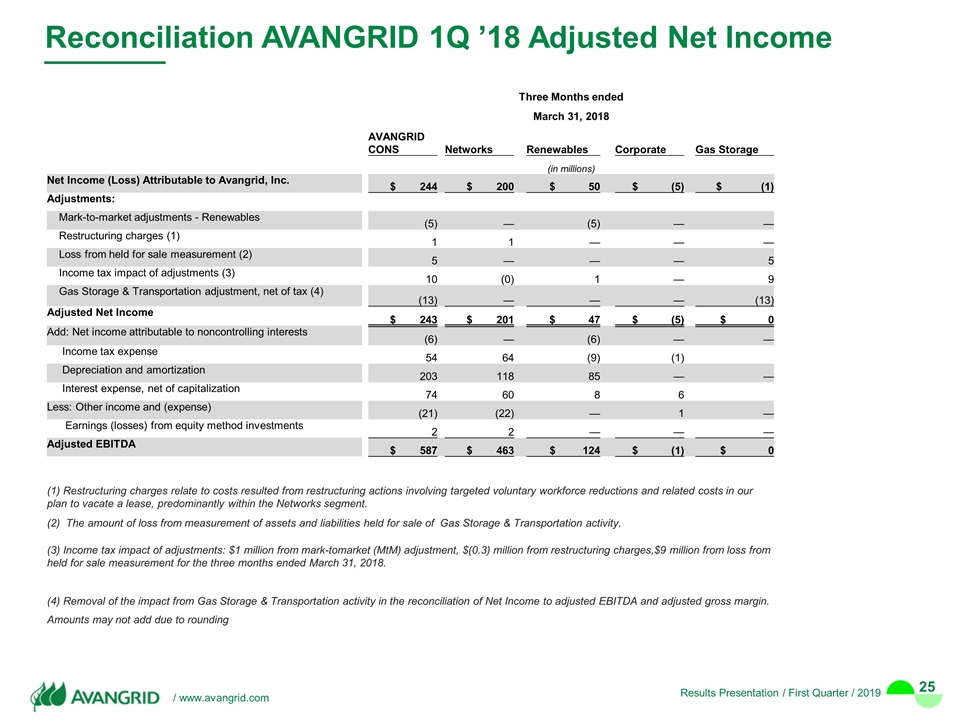
Reconciliation AVANGRID 1Q ’18 Adjusted Net Income Three Months ended March 31, 2018 AVANGRID CONS Networks Renewables Corporate Gas Storage (in millions) Net Income (Loss) Attributable to Avangrid, Inc. $ 244 $ 200 $ 50 $ (5) $ (1) Adjustments: Mark-to-market adjustments - Renewables (5) — (5) — — Restructuring charges (1) 1 1 — — — Loss from held for sale measurement (2) 5 — — — 5 Income tax impact of adjustments (3) 10 (0) 1 — 9 Gas Storage & Transportation adjustment, net of tax (4) (13) — — — (13) Adjusted Net Income $ 243 $ 201 $ 47 $ (5) $ 0 Add: Net income attributable to noncontrolling interests (6) — (6) — — Income tax expense 54 64 (9) (1) Depreciation and amortization 203 118 85 — — Interest expense, net of capitalization 74 60 8 6 Less: Other income and (expense) (21) (22) — 1 — Earnings (losses) from equity method investments 2 2 — — — Adjusted EBITDA $ 587 $ 463 $ 124 $ (1) $ 0 (1) Restructuring charges relate to costs resulted from restructuring actions involving targeted voluntary workforce reductions and related costs in our plan to vacate a lease, predominantly within the Networks segment. (2) The amount of loss from measurement of assets and liabilities held for sale of Gas Storage & Transportation activity. (3) Income tax impact of adjustments: $1 million from mark-tomarket (MtM) adjustment, $(0.3) million from restructuring charges,$9 million from loss from held for sale measurement for the three months ended March 31, 2018. (4) Removal of the impact from Gas Storage & Transportation activity in the reconciliation of Net Income to adjusted EBITDA and adjusted gross margin. Amounts may not add due to rounding
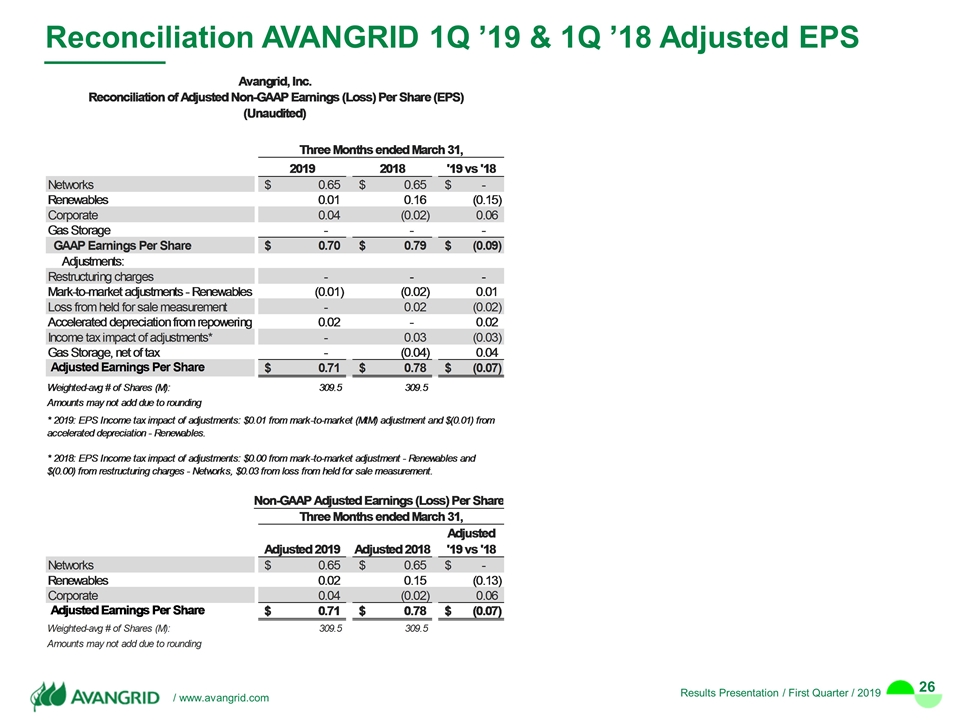
Reconciliation AVANGRID 1Q ’19 & 1Q ’18 Adjusted EPS
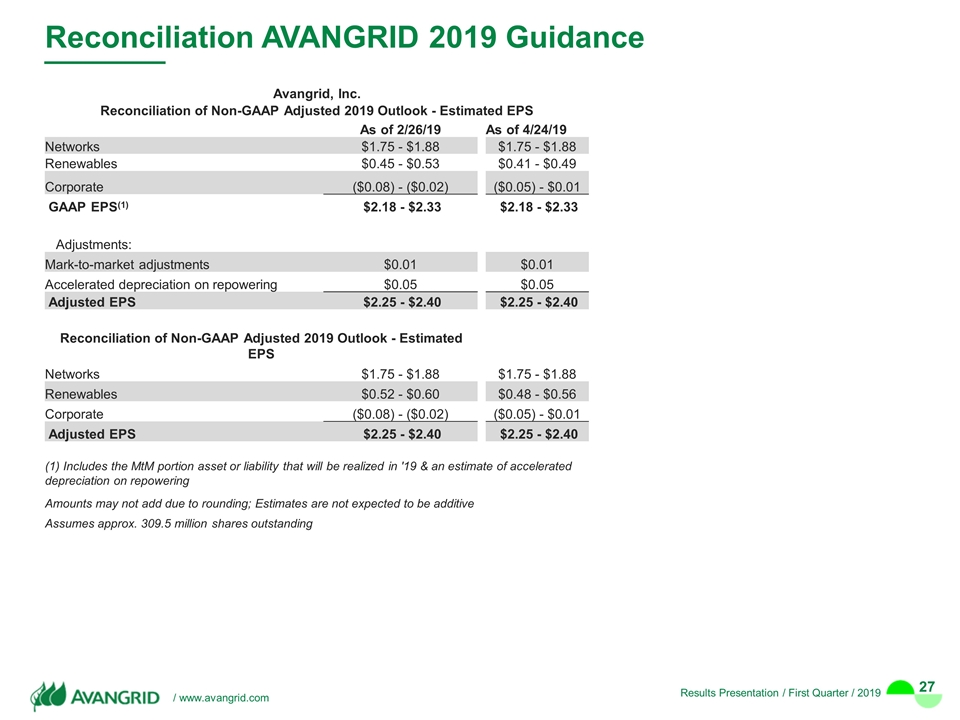
Reconciliation AVANGRID 2019 Guidance Avangrid, Inc. Reconciliation of Non-GAAP Adjusted 2019 Outlook - Estimated EPS As of 2/26/19 As of 4/24/19 Networks $1.75 - $1.88 $1.75 - $1.88 Renewables $0.45 - $0.53 $0.41 - $0.49 Corporate ($0.08) - ($0.02) ($0.05) - $0.01 GAAP EPS(1) $2.18 - $2.33 $2.18 - $2.33 Adjustments: Mark-to-market adjustments $0.01 $0.01 Accelerated depreciation on repowering $0.05 $0.05 Adjusted EPS $2.25 - $2.40 $2.25 - $2.40 Reconciliation of Non-GAAP Adjusted 2019 Outlook - Estimated EPS Networks $1.75 - $1.88 $1.75 - $1.88 Renewables $0.52 - $0.60 $0.48 - $0.56 Corporate ($0.08) - ($0.02) ($0.05) - $0.01 Adjusted EPS $2.25 - $2.40 $2.25 - $2.40 (1) Includes the MtM portion asset or liability that will be realized in '19 & an estimate of accelerated depreciation on repowering Amounts may not add due to rounding; Estimates are not expected to be additive Assumes approx. 309.5 million shares outstanding
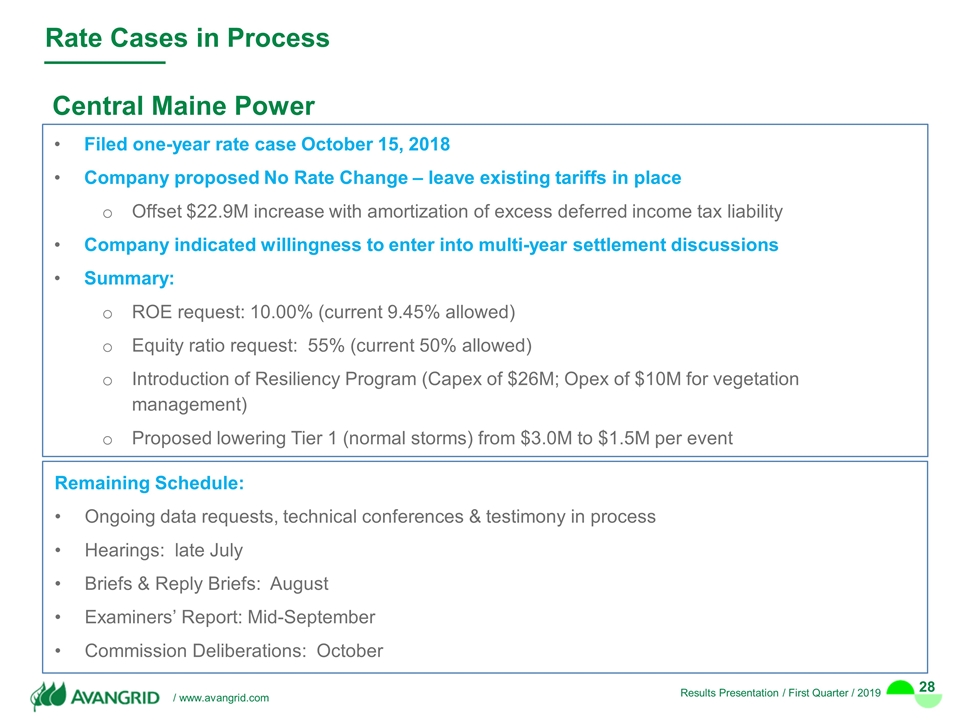
Filed one-year rate case October 15, 2018 Company proposed No Rate Change – leave existing tariffs in place Offset $22.9M increase with amortization of excess deferred income tax liability Company indicated willingness to enter into multi-year settlement discussions Summary: ROE request: 10.00% (current 9.45% allowed) Equity ratio request: 55% (current 50% allowed) Introduction of Resiliency Program (Capex of $26M; Opex of $10M for vegetation management) Proposed lowering Tier 1 (normal storms) from $3.0M to $1.5M per event Rate Cases in Process Central Maine Power Remaining Schedule: Ongoing data requests, technical conferences & testimony in process Hearings: late July Briefs & Reply Briefs: August Examiners’ Report: Mid-September Commission Deliberations: October
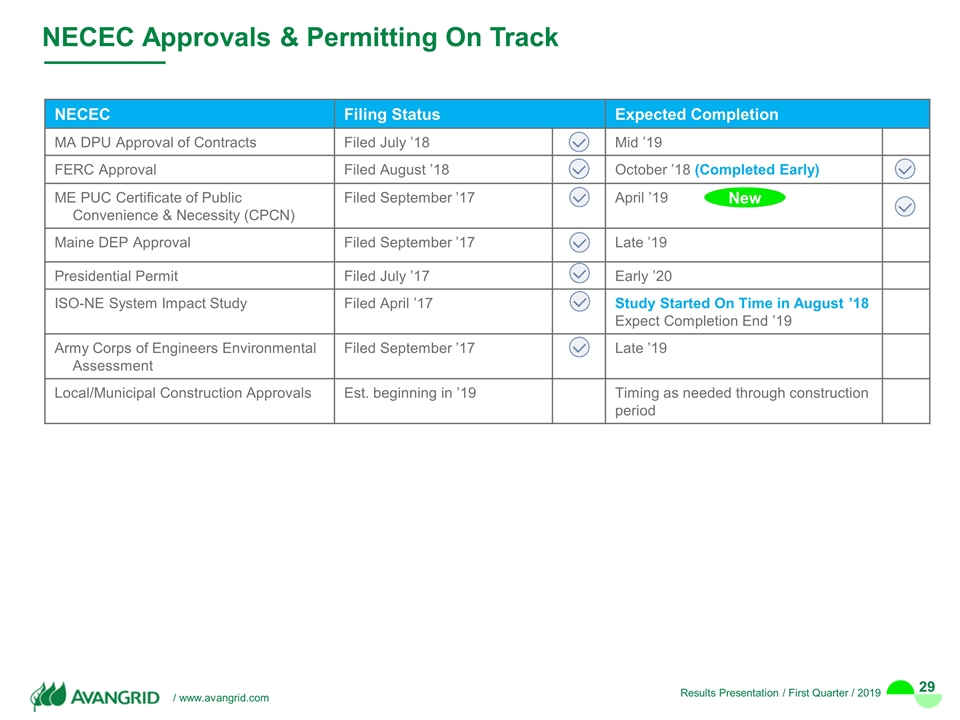
NECEC Approvals & Permitting On Track NECEC Filing Status Expected Completion MA DPU Approval of Contracts Filed July ’18 Mid ’19 FERC Approval Filed August ’18 October ’18 (Completed Early) ME PUC Certificate of Public Convenience & Necessity (CPCN) Filed September ’17 April ’19 Maine DEP Approval Filed September ’17 Late ’19 Presidential Permit Filed July ’17 Early ’20 ISO-NE System Impact Study Filed April ’17 Study Started On Time in August ’18 Expect Completion End ’19 Army Corps of Engineers Environmental Assessment Filed September ’17 Late ’19 Local/Municipal Construction Approvals Est. beginning in ’19 Timing as needed through construction period New
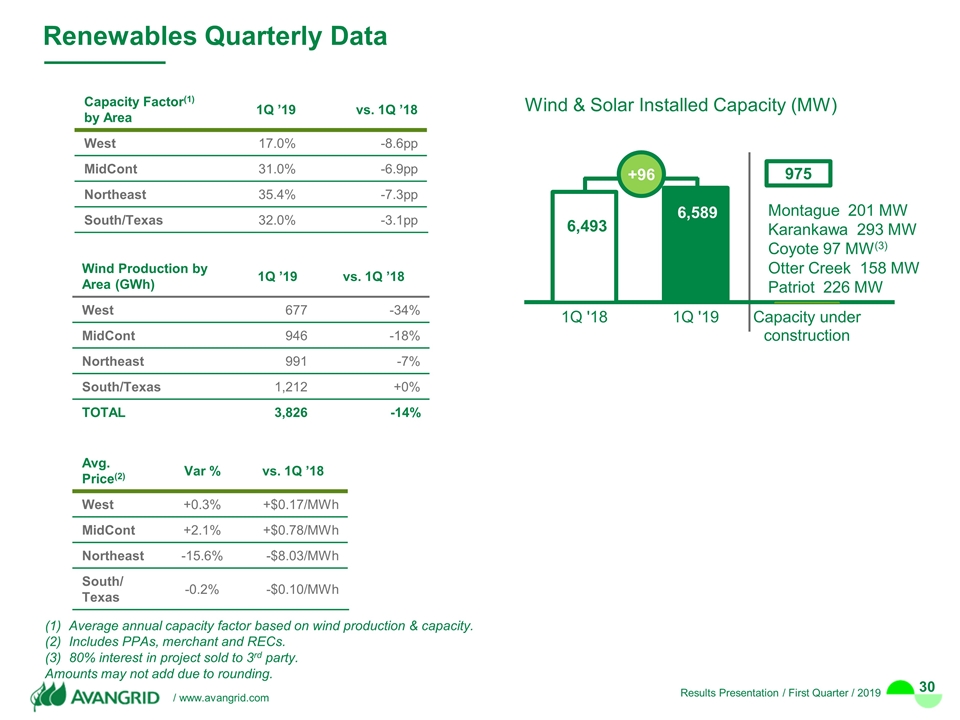
Renewables Quarterly Data pp: percentage point Average annual capacity factor based on wind production & capacity. Includes PPAs, merchant and RECs. 80% interest in project sold to 3rd party. Amounts may not add due to rounding. Capacity Factor(1) by Area 1Q ’19 vs. 1Q ’18 West 17.0% -8.6pp MidCont 31.0% -6.9pp Northeast 35.4% -7.3pp South/Texas 32.0% -3.1pp Wind Production by Area (GWh) 1Q ’19 vs. 1Q ’18 West 677 -34% MidCont 946 -18% Northeast 991 -7% South/Texas 1,212 +0% TOTAL 3,826 -14% Avg. Price(2) Var % vs. 1Q ’18 West +0.3% +$0.17/MWh MidCont +2.1% +$0.78/MWh Northeast -15.6% -$8.03/MWh South/ Texas -0.2% -$0.10/MWh Wind & Solar Installed Capacity (MW) Montague 201 MW Karankawa 293 MW Coyote 97 MW(3) Otter Creek 158 MW Patriot 226 MW +96
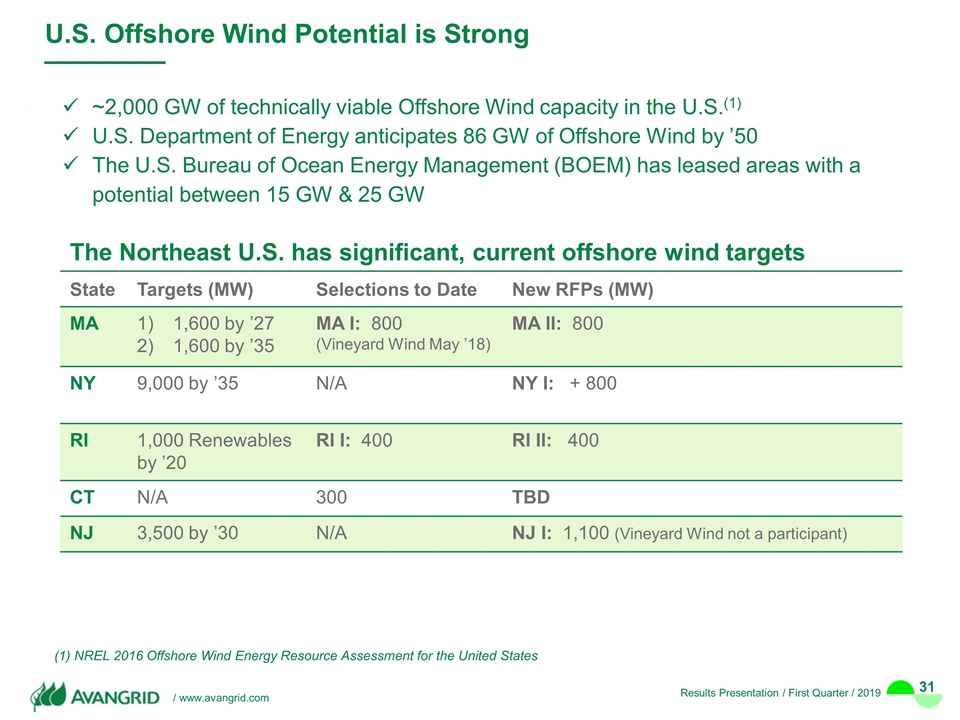
U.S. Offshore Wind Potential is Strong State Targets (MW) Selections to Date New RFPs (MW) MA 1,600 by ’27 1,600 by ’35 MA I: 800 (Vineyard Wind May ’18) MA II: 800 NY 9,000 by ’35 N/A NY I: + 800 RI 1,000 Renewables by ’20 RI I: 400 RI II: 400 CT N/A 300 TBD NJ 3,500 by ’30 N/A NJ I: 1,100 (Vineyard Wind not a participant) ~2,000 GW of technically viable Offshore Wind capacity in the U.S.(1) U.S. Department of Energy anticipates 86 GW of Offshore Wind by ’50 The U.S. Bureau of Ocean Energy Management (BOEM) has leased areas with a potential between 15 GW & 25 GW (1) NREL 2016 Offshore Wind Energy Resource Assessment for the United States The Northeast U.S. has significant, current offshore wind targets
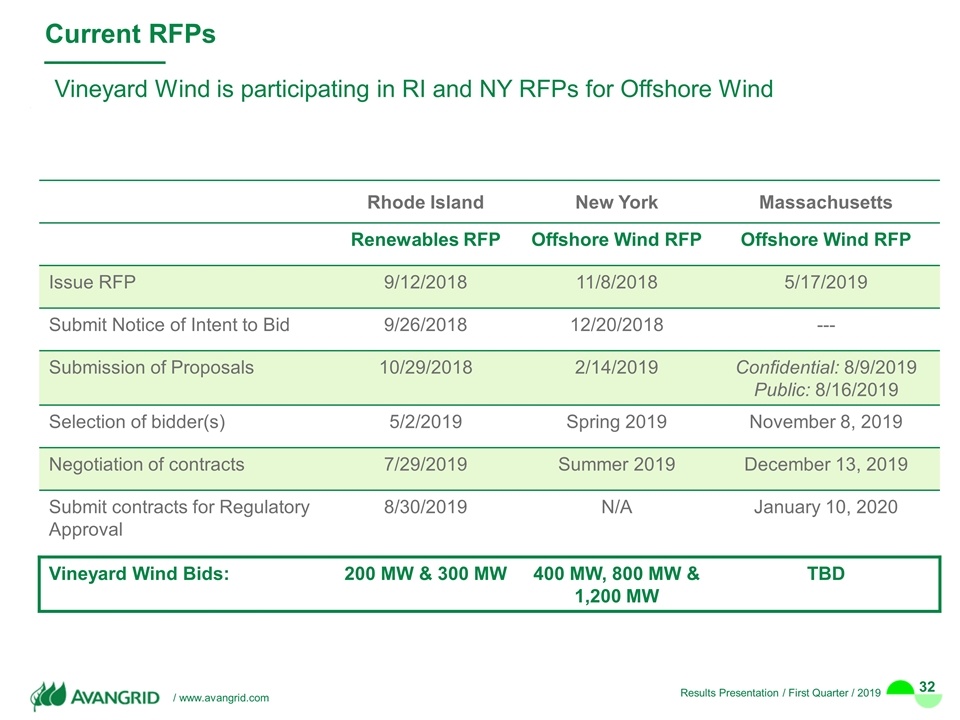
Rhode Island New York Massachusetts Renewables RFP Offshore Wind RFP Offshore Wind RFP Issue RFP 9/12/2018 11/8/2018 5/17/2019 Submit Notice of Intent to Bid 9/26/2018 12/20/2018 --- Submission of Proposals 10/29/2018 2/14/2019 Confidential: 8/9/2019 Public: 8/16/2019 Selection of bidder(s) 5/2/2019 Spring 2019 November 8, 2019 Negotiation of contracts 7/29/2019 Summer 2019 December 13, 2019 Submit contracts for Regulatory Approval 8/30/2019 N/A January 10, 2020 Vineyard Wind Bids: 200 MW & 300 MW 400 MW, 800 MW & 1,200 MW TBD Current RFPs Vineyard Wind is participating in RI and NY RFPs for Offshore Wind
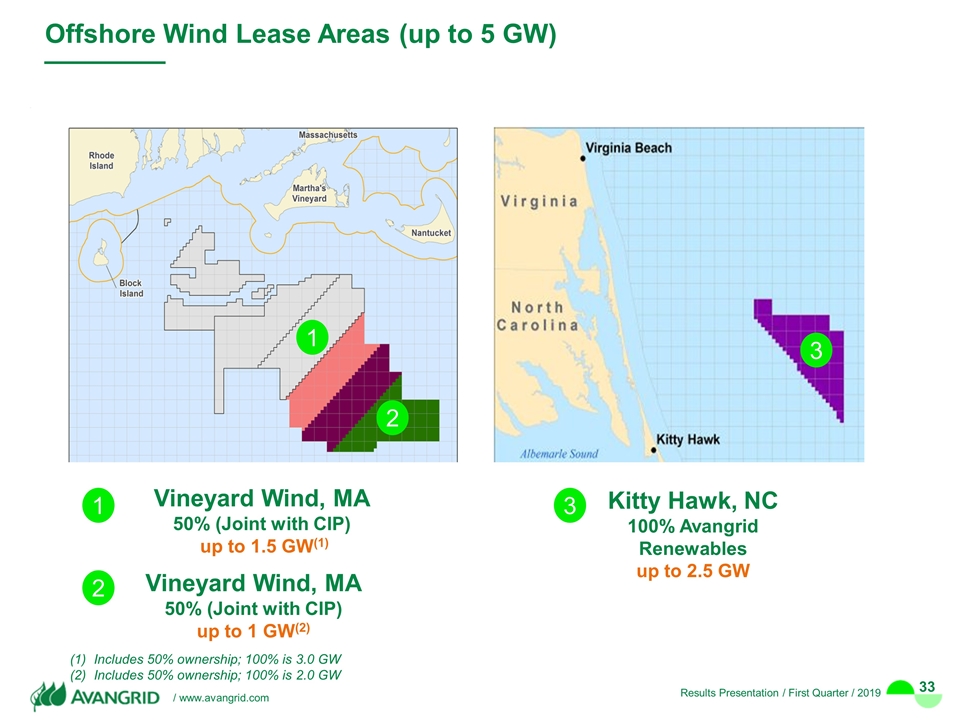
Offshore Wind Lease Areas (up to 5 GW) Vineyard Wind, MA 50% (Joint with CIP) up to 1.5 GW(1) Kitty Hawk, NC 100% Avangrid Renewables up to 2.5 GW Vineyard Wind, MA 50% (Joint with CIP) up to 1 GW(2) 1 1 2 2 3 3 Includes 50% ownership; 100% is 3.0 GW Includes 50% ownership; 100% is 2.0 GW
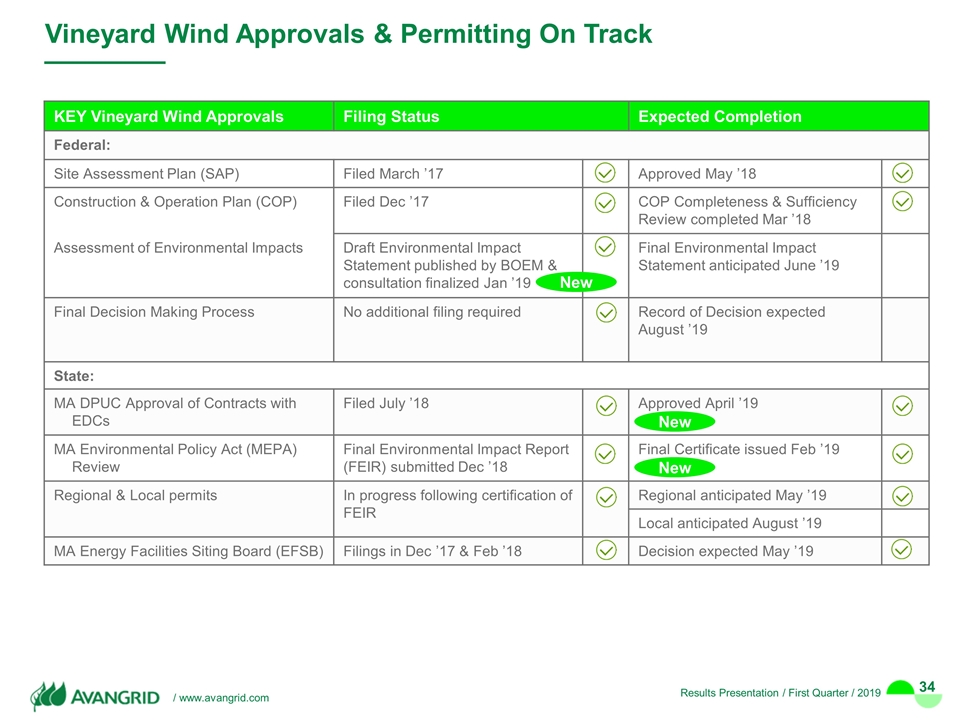
Vineyard Wind Approvals & Permitting On Track KEY Vineyard Wind Approvals Filing Status Expected Completion Federal: Site Assessment Plan (SAP) Filed March ’17 Approved May ’18 Construction & Operation Plan (COP) Filed Dec ’17 COP Completeness & Sufficiency Review completed Mar ’18 Assessment of Environmental Impacts Draft Environmental Impact Statement published by BOEM & consultation finalized Jan ’19 Final Environmental Impact Statement anticipated June ’19 Final Decision Making Process No additional filing required Record of Decision expected August ’19 State: MA DPUC Approval of Contracts with EDCs Filed July ’18 Approved April ’19 MA Environmental Policy Act (MEPA) Review Final Environmental Impact Report (FEIR) submitted Dec ’18 Final Certificate issued Feb ’19 Regional & Local permits In progress following certification of FEIR Regional anticipated May ’19 Local anticipated August ’19 MA Energy Facilities Siting Board (EFSB) Filings in Dec ’17 & Feb ’18 Decision expected May ’19 New New New
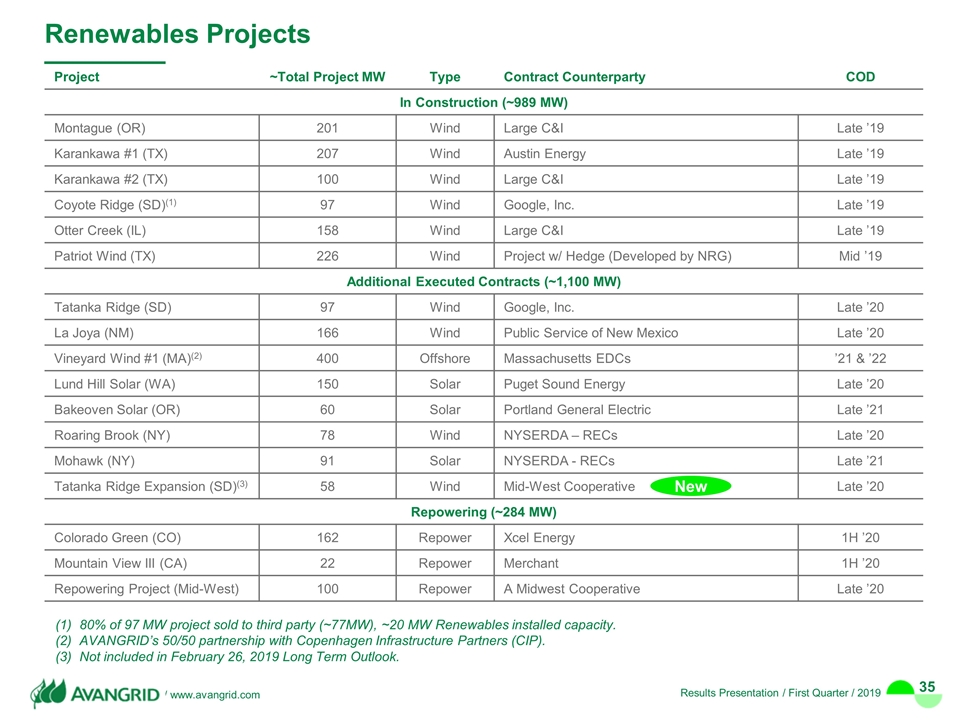
Renewables Projects 80% of 97 MW project sold to third party (~77MW), ~20 MW Renewables installed capacity. AVANGRID’s 50/50 partnership with Copenhagen Infrastructure Partners (CIP). Not included in February 26, 2019 Long Term Outlook. Project ~Total Project MW Type Contract Counterparty COD In Construction (~989 MW) Montague (OR) 201 Wind Large C&I Late ’19 Karankawa #1 (TX) 207 Wind Austin Energy Late ’19 Karankawa #2 (TX) 100 Wind Large C&I Late ’19 Coyote Ridge (SD)(1) 97 Wind Google, Inc. Late ’19 Otter Creek (IL) 158 Wind Large C&I Late ’19 Patriot Wind (TX) 226 Wind Project w/ Hedge (Developed by NRG) Mid ’19 Additional Executed Contracts (~1,100 MW) Tatanka Ridge (SD) 97 Wind Google, Inc. Late ’20 La Joya (NM) 166 Wind Public Service of New Mexico Late ’20 Vineyard Wind #1 (MA)(2) 400 Offshore Massachusetts EDCs ’21 & ’22 Lund Hill Solar (WA) 150 Solar Puget Sound Energy Late ’20 Bakeoven Solar (OR) 60 Solar Portland General Electric Late ’21 Roaring Brook (NY) 78 Wind NYSERDA – RECs Late ’20 Mohawk (NY) 91 Solar NYSERDA - RECs Late ’21 Tatanka Ridge Expansion (SD)(3) 58 Wind Mid-West Cooperative Late ’20 Repowering (~284 MW) Colorado Green (CO) 162 Repower Xcel Energy 1H ’20 Mountain View III (CA) 22 Repower Merchant 1H ’20 Repowering Project (Mid-West) 100 Repower A Midwest Cooperative Late ’20 New


