
Exhibit 99.2
Legal Notice Use of Non-U.S. GAAP Financial Measures To supplement our consolidated financial statements presented in accordance with U.S. GAAP, we consider adjusted net income and adjusted earnings per share as non-GAAP financial measures that are not prepared in accordance with U.S. GAAP. The non-GAAP financial measures we use are specific to AVANGRID and the non-GAAP financial measures of other companies may not be calculated in the same manner. We use these non-GAAP financial measures, in addition to U.S. GAAP measures, to establish operating budgets and operational goals to manage and monitor our business, evaluate our operating and financial performance and to compare such performance to prior periods and to the performance of our competitors. We believe that presenting such non-GAAP financial measures is useful because such measures can be used to analyze and compare profitability between companies and industries by eliminating the impact of certain non-cash charges. In addition, we present non-GAAP financial measures because we believe that they and other similar measures are widely used by certain investors, securities analysts and other interested parties as supplemental measures of performance. We define adjusted net income as net income adjusted to exclude restructuring charges, mark-to-market earnings from changes in the fair value of derivative instruments used by AVANGRID to economically hedge market price fluctuations in related underlying physical transactions for the purchase and sale of electricity, loss from held for sale measurement, accelerated depreciation derived from repowering of wind farms, impact of the Tax Act and adjustments for the non-core Gas storage business. We believe adjusted net income is more useful in understanding and evaluating actual and projected financial performance and contribution of AVANGRID core lines of business and to more fully compare and explain our results. The most directly comparable U.S. GAAP measure to adjusted net income is net income. We also define adjusted earnings per share, or adjusted EPS, as adjusted net income converted to an earnings per share amount. The use of non-GAAP financial measures is not intended to be considered in isolation or as a substitute for, or superior to, AVANGRID’s U.S. GAAP financial information, and investors are cautioned that the non-GAAP financial measures are limited in their usefulness, may be unique to AVANGRID, and should be considered only as a supplement to AVANGRID’s U.S. GAAP financial measures. The non-GAAP financial measures may not be comparable to other similarly titled measures of other companies and have limitations as analytical tools. Non-GAAP financial measures are not primary measurements of our performance under U.S. GAAP and should not be considered as alternatives to operating income, net income or any other performance measures determined in accordance with U.S. GAAP. Investors and others should note that AVANGRID routinely posts important information on its website and considers the Investor Relations section, www.avangrid.com/wps/portal/avangrid/Investors, a channel of distribution.
Legal Notice Investors@AVANGRID.com FORWARD LOOKING STATEMENTS Certain statements in this presentation may relate to our future business and financial performance and future events or developments involving us and our subsidiaries that are not purely historical and may constitute “forward-looking statements” within the meaning of the Private Securities Litigation Reform Act of 1995. Forward-looking statements may be identified by the use of forward-looking terms such as “may,” “will,” “should,” “would,” “could,” “can,” “expect(s),” “believe(s),” “anticipate(s),” “intend(s),” “plan(s),” “estimate(s),” “project(s),” “assume(s),” “guide(s),” “target(s),” “forecast(s),” “are (is) confident that” and “seek(s)” or the negative of such terms or other variations on such terms or comparable terminology. Such forward looking statements include, but are not limited to, statements about our plans, objectives and intentions, outlooks or expectations for earnings, revenues, expenses, Forward 2020+ Mid Period Assessment initiatives, or other future financial or business performance, strategies or expectations, or the impact of legal or regulatory matters on our business, results of operations or financial condition. Such statements are based upon the current reasonable beliefs, expectations and assumptions of our management and are subject to significant risks and uncertainties that could cause actual outcomes and results to differ materially. Important factors that could cause actual results to differ materially from those indicated by such forward-looking statements include, without limitation, the risks and uncertainties set forth under the section entitled “Risk Factors” and “Management’s Discussion and Analysis of Financial Condition and Results of Operations” in our Annual Report on Form 10-K for the year ended December 31, 2018 and our Quarterly Report on Form 10-Q for the nine months ended September 30, 2019, which are on file with the U.S. Securities and Exchange Commission (SEC) and available on our investor relations website at www.Avangrid.com and on the SEC website at www.sec.gov. Additional information will also be set forth in subsequent filings with the SEC. You should consider these factors carefully in evaluating for-ward looking statements. Should one or more of these risks or uncertainties materialize, or should any of the underlying assumptions prove incorrect, actual results may vary in material respects from those expressed or implied by these forward-looking statements. You should not place undue reliance on these forward-looking statements. We do not undertake any obligation to update or revise any forward-looking statements to reflect events or circumstances after the date of this presentation whether as a result of new information, future events or otherwise, except as may be required under applicable securities laws. About AVANGRID: AVANGRID, Inc. (NYSE: AGR) is a leading, sustainable energy company with approximately $34 billion in assets and operations in 24 U.S. states. With headquarters in Orange, Connecticut, AVANGRID has two primary lines of business: Avangrid Networks and Avangrid Renewables. Avangrid Networks owns eight electric and natural gas utilities, serving more than 3.3 million customers in New York and New England. Avangrid Renewables owns and operates a portfolio of renewable energy generation facilities in the United States. AVANGRID employs approximately 6,500 people. AVANGRID supports the U.N.’s Sustainable Development Goals and was named among the World’s Most Ethical Companies in 2019 by the Ethisphere Institute. For more information, visit www.avangrid.com.
2019 Highlights 2020 Outlook & Business Updates James Torgerson
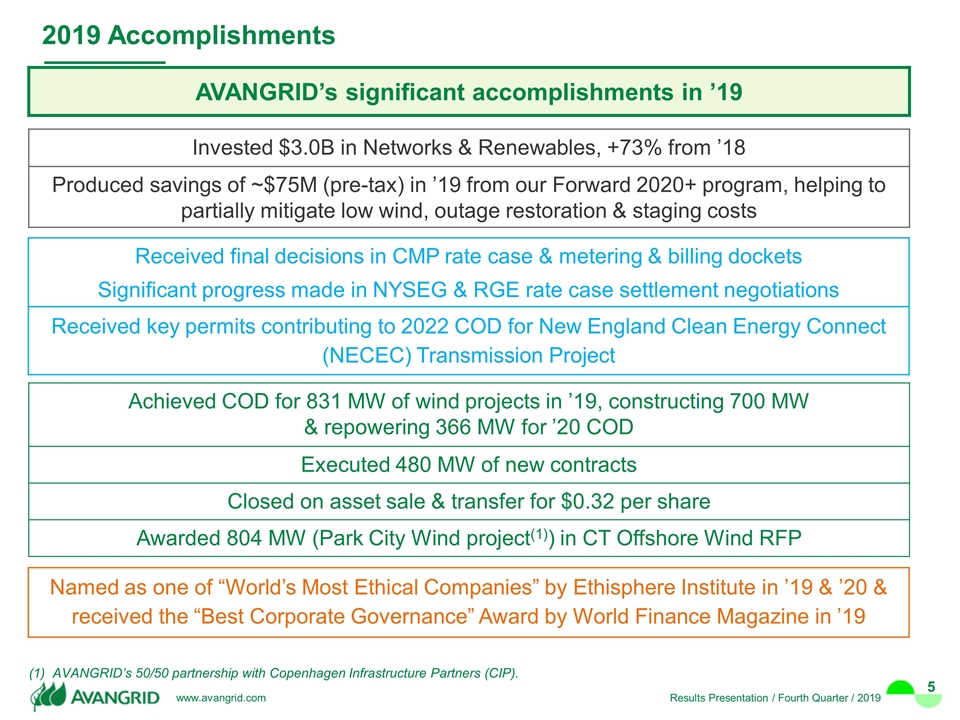
Invested $3.0B in Networks & Renewables, +73% from ’18 Produced savings of ~$75M (pre-tax) in ’19 from our Forward 2020+ program, helping to partially mitigate low wind, outage restoration & staging costs 2019 Accomplishments AVANGRID’s significant accomplishments in ’19 Received final decisions in CMP rate case & metering & billing dockets Significant progress made in NYSEG & RGE rate case settlement negotiations Received key permits contributing to 2022 COD for New England Clean Energy Connect (NECEC) Transmission Project Achieved COD for 831 MW of wind projects in ’19, constructing 700 MW & repowering 366 MW for ’20 COD Executed 480 MW of new contracts Closed on asset sale & transfer for $0.32 per share Awarded 804 MW (Park City Wind project(1)) in CT Offshore Wind RFP (1) AVANGRID’s 50/50 partnership with Copenhagen Infrastructure Partners (CIP). Named as one of “World’s Most Ethical Companies” by Ethisphere Institute in ’19 & ’20 & received the “Best Corporate Governance” Award by World Finance Magazine in ’19
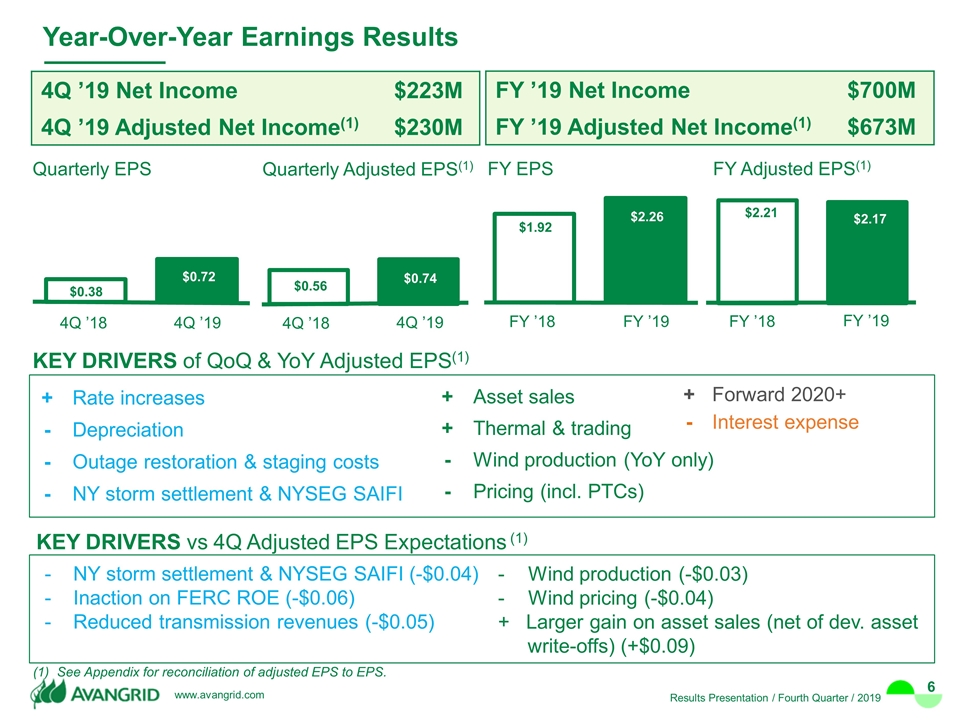
4Q ’19 Net Income $223M 4Q ’19 Adjusted Net Income(1) $230M + Rate increases - Depreciation - Outage restoration & staging costs - NY storm settlement & NYSEG SAIFI FY ’19 Net Income $700M FY ’19 Adjusted Net Income(1) $673M See Appendix for reconciliation of adjusted EPS to EPS. Year-Over-Year Earnings Results 4Q ’18 4Q ’19 Quarterly Adjusted EPS(1) 4Q ’18 4Q ’19 Quarterly EPS FY ’18 FY ’19 FY EPS FY ’18 FY ’19 FY Adjusted EPS(1) - NY storm settlement & NYSEG SAIFI (-$0.04) - Inaction on FERC ROE (-$0.06) - Reduced transmission revenues (-$0.05) + Asset sales + Thermal & trading - Wind production (YoY only) - Pricing (incl. PTCs) KEY DRIVERS of QoQ & YoY Adjusted EPS(1) + Forward 2020+ - Interest expense KEY DRIVERS vs 4Q Adjusted EPS Expectations (1) Wind production (-$0.03) Wind pricing (-$0.04) + Larger gain on asset sales (net of dev. asset write-offs) (+$0.09)
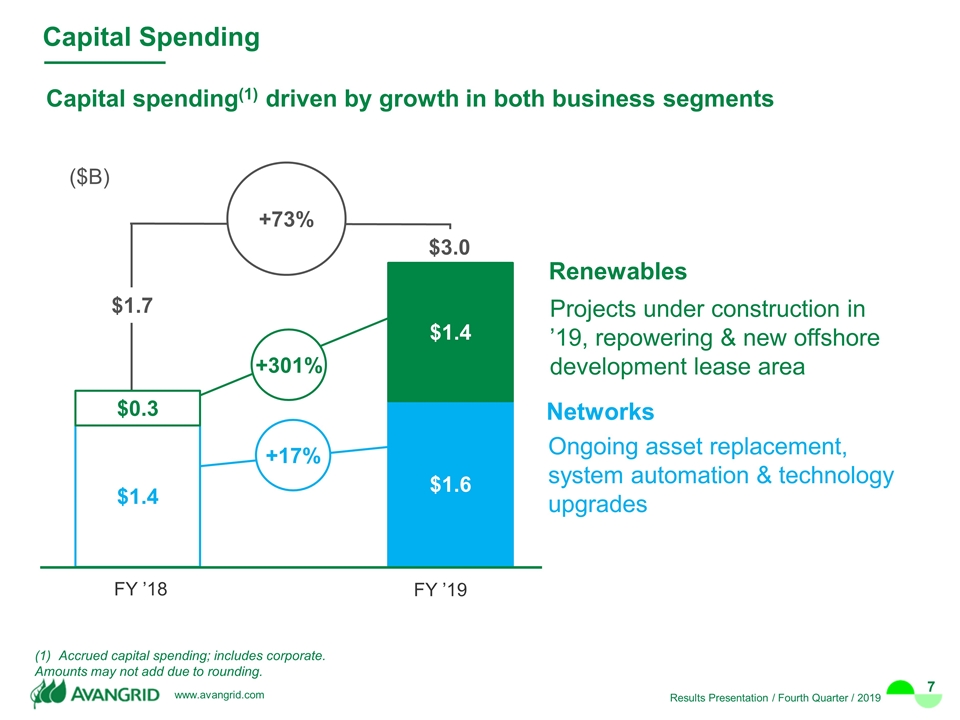
+73% ($B) $3.0 +301% +17% Accrued capital spending; includes corporate. Amounts may not add due to rounding. FY ’19 Capital Spending Capital spending(1) driven by growth in both business segments $1.7 Renewables Projects under construction in ’19, repowering & new offshore development lease area Networks Ongoing asset replacement, system automation & technology upgrades FY ’18
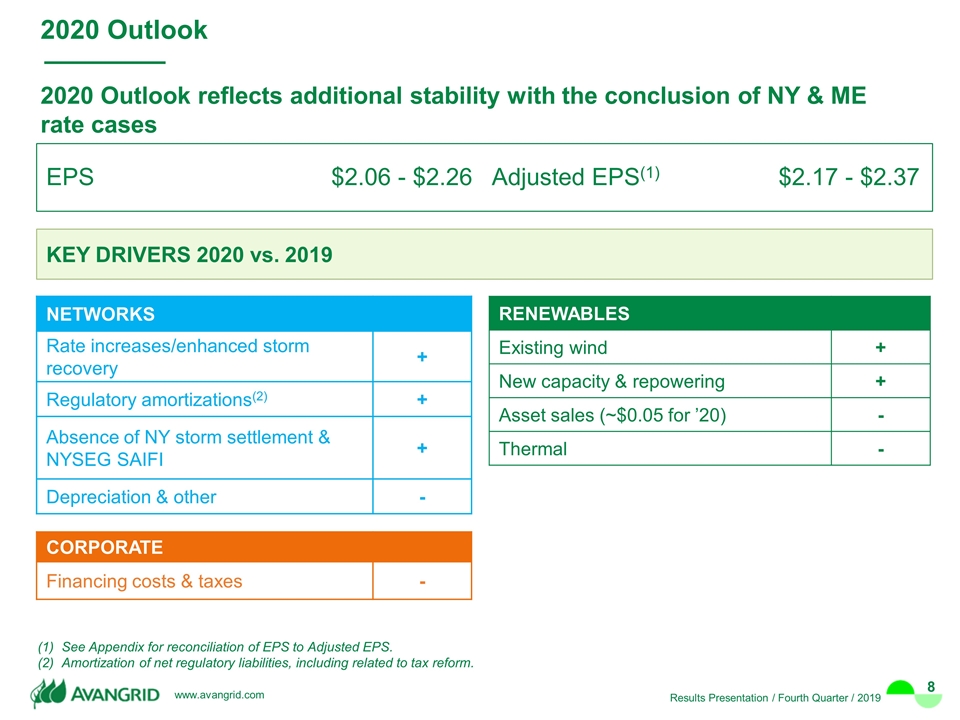
2020 Outlook EPS $2.06 - $2.26 Adjusted EPS(1) $2.17 - $2.37 CORPORATE Financing costs & taxes - RENEWABLES Existing wind + New capacity & repowering + Asset sales (~$0.05 for ’20) - Thermal - KEY DRIVERS 2020 vs. 2019 2020 Outlook reflects additional stability with the conclusion of NY & ME rate cases See Appendix for reconciliation of EPS to Adjusted EPS. Amortization of net regulatory liabilities, including related to tax reform. NETWORKS Rate increases/enhanced storm recovery + Regulatory amortizations(2) + Absence of NY storm settlement & NYSEG SAIFI + Depreciation & other -
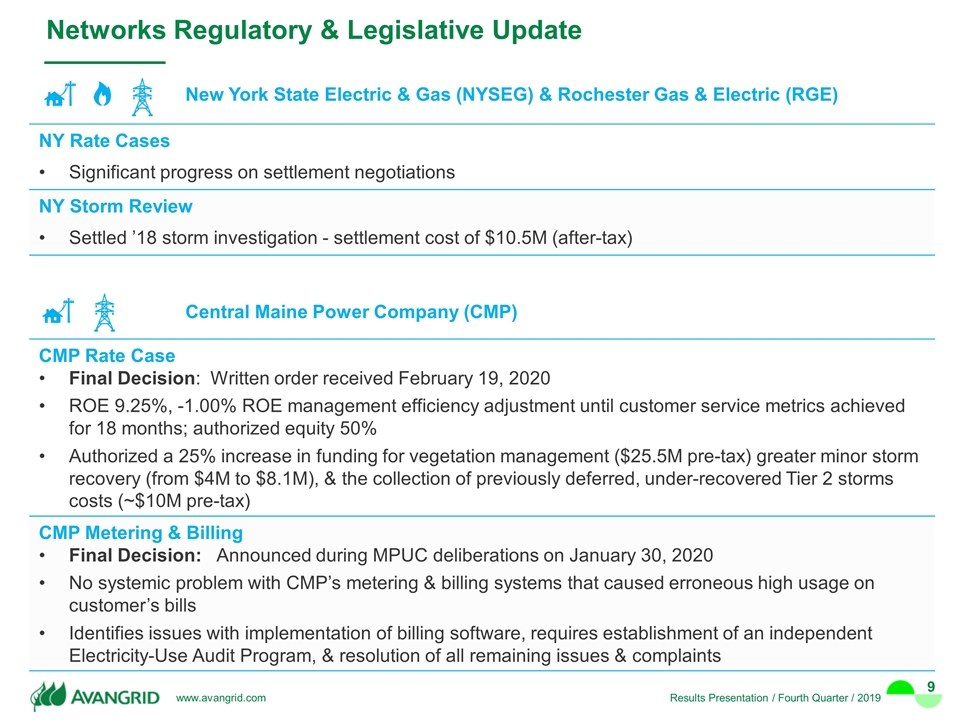
Networks Regulatory & Legislative Update New York State Electric & Gas (NYSEG) & Rochester Gas & Electric (RGE) NY Rate Cases Significant progress on settlement negotiations NY Storm Review Settled ’18 storm investigation - settlement cost of $10.5M (after-tax) CMP Rate Case Final Decision: Written order received February 19, 2020 ROE 9.25%, -1.00% ROE management efficiency adjustment until customer service metrics achieved for 18 months; authorized equity 50% Authorized a 25% increase in funding for vegetation management ($25.5M pre-tax) greater minor storm recovery (from $4M to $8.1M), & the collection of previously deferred, under-recovered Tier 2 storms costs (~$10M pre-tax) CMP Metering & Billing Final Decision: Announced during MPUC deliberations on January 30, 2020 No systemic problem with CMP’s metering & billing systems that caused erroneous high usage on customer’s bills Identifies issues with implementation of billing software, requires establishment of an independent Electricity-Use Audit Program, & resolution of all remaining issues & complaints Central Maine Power Company (CMP)
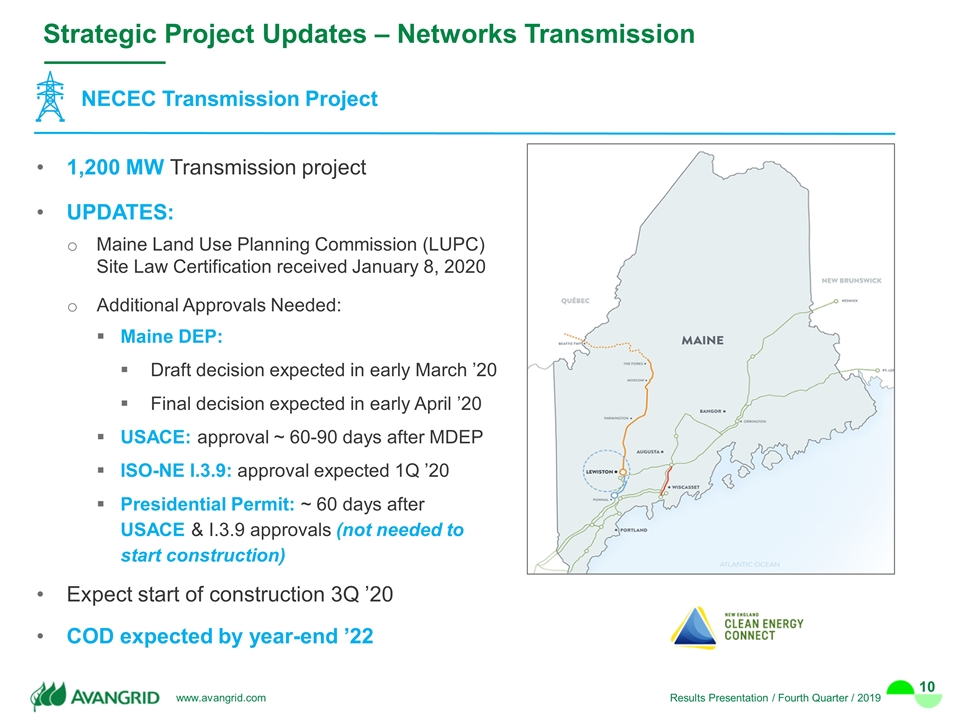
Strategic Project Updates – Networks Transmission NECEC Transmission Project 1,200 MW Transmission project UPDATES: Maine Land Use Planning Commission (LUPC) Site Law Certification received January 8, 2020 Additional Approvals Needed: Maine DEP: Draft decision expected in early March ’20 Final decision expected in early April ’20 USACE: approval ~ 60-90 days after MDEP ISO-NE I.3.9: approval expected 1Q ’20 Presidential Permit: ~ 60 days after USACE & I.3.9 approvals (not needed to start construction) Expect start of construction 3Q ’20 COD expected by year-end ’22

Project ~MWdc(2) ~ COD Montague Solar (OR) 215 2021 Camino Solar + Storage (CA) 57+11 MW 4hr Battery 2022 TOTAL 283 Project ~MW Otter Creek (IL) 158 Tatanka Ridge (SD) 155 La Joya (NM) 306 Roaring Brook (NY) 81 TOTAL 700 Renewables 4Q ’19 Updates Projects COD in ’19 New PPAs in 4Q ’19 Projects with Expected COD ’20 Project MW Patriot Wind (TX) 226 Montague (OR) 201 Karankawa #1 & #2 (TX) 307 Coyote Ridge (SD)(1) 97 TOTAL 831 4 Repowering Projects in ’20 Project MW Colorado Green (CO) 162 Mountain View III (CA) 22 Trimont (MN) 100 Klondike II (OR) 81 TOTAL 366 80% of 97 MW project sold to third party. MWac: Montague Solar = 162.5; Camino Solar = 44. Renewables continues with its onshore wind & solar growth
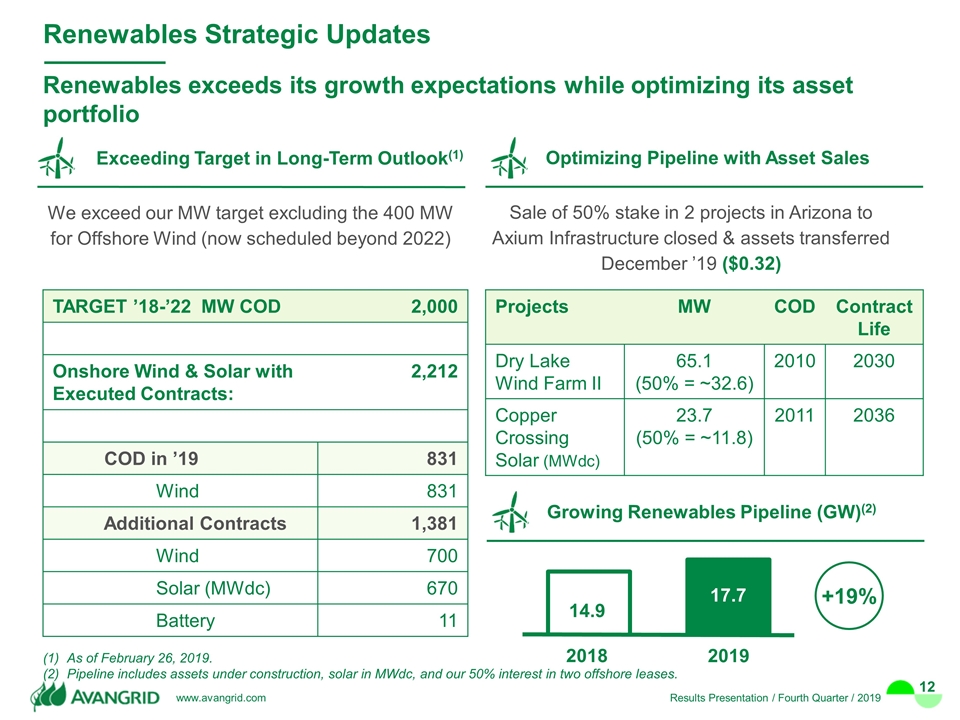
Renewables exceeds its growth expectations while optimizing its asset portfolio Renewables Strategic Updates Exceeding Target in Long-Term Outlook(1) As of February 26, 2019. Pipeline includes assets under construction, solar in MWdc, and our 50% interest in two offshore leases. TARGET ’18-’22 MW COD 2,000 Onshore Wind & Solar with Executed Contracts: 2,212 COD in ’19 831 Wind 831 Additional Contracts 1,381 Wind 700 Solar (MWdc) 670 Battery 11 Sale of 50% stake in 2 projects in Arizona to Axium Infrastructure closed & assets transferred December ’19 ($0.32) Projects MW COD Contract Life Dry Lake Wind Farm II 65.1 (50% = ~32.6) 2010 2030 Copper Crossing Solar (MWdc) 23.7 (50% = ~11.8) 2011 2036 We exceed our MW target excluding the 400 MW for Offshore Wind (now scheduled beyond 2022) Optimizing Pipeline with Asset Sales Growing Renewables Pipeline (GW)(2) +19% 2018 2019
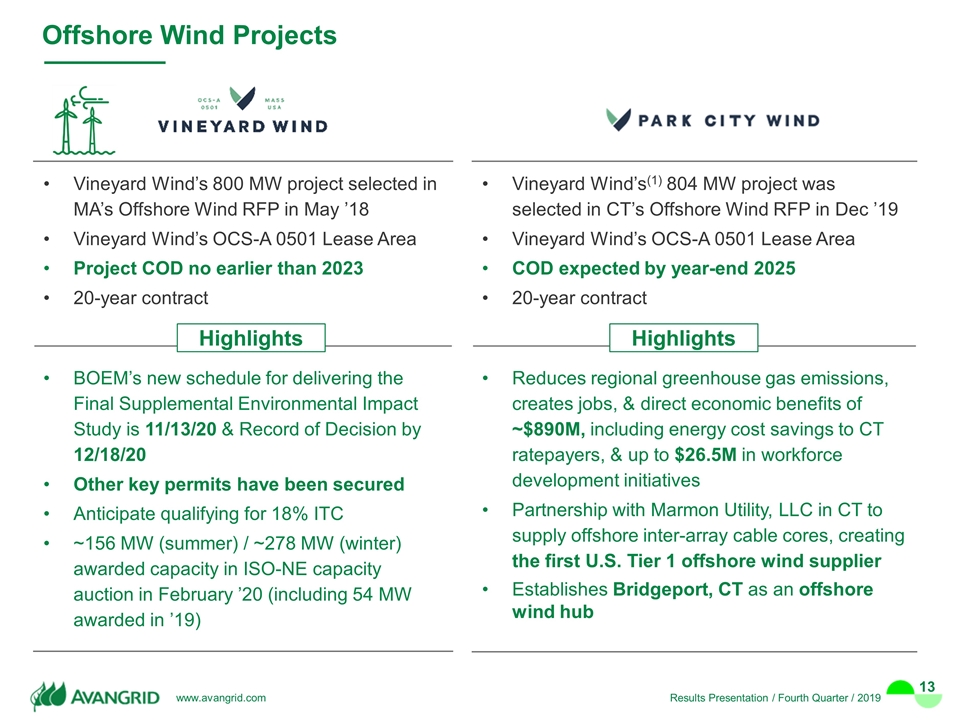
Offshore Wind Projects Vineyard Wind’s 800 MW project selected in MA’s Offshore Wind RFP in May ’18 Vineyard Wind’s OCS-A 0501 Lease Area Project COD no earlier than 2023 20-year contract BOEM’s new schedule for delivering the Final Supplemental Environmental Impact Study is 11/13/20 & Record of Decision by 12/18/20 Other key permits have been secured Anticipate qualifying for 18% ITC ~156 MW (summer) / ~278 MW (winter) awarded capacity in ISO-NE capacity auction in February ’20 (including 54 MW awarded in ’19) Vineyard Wind’s(1) 804 MW project was selected in CT’s Offshore Wind RFP in Dec ’19 Vineyard Wind’s OCS-A 0501 Lease Area COD expected by year-end 2025 20-year contract Reduces regional greenhouse gas emissions, creates jobs, & direct economic benefits of ~$890M, including energy cost savings to CT ratepayers, & up to $26.5M in workforce development initiatives Partnership with Marmon Utility, LLC in CT to supply offshore inter-array cable cores, creating the first U.S. Tier 1 offshore wind supplier Establishes Bridgeport, CT as an offshore wind hub Highlights Highlights
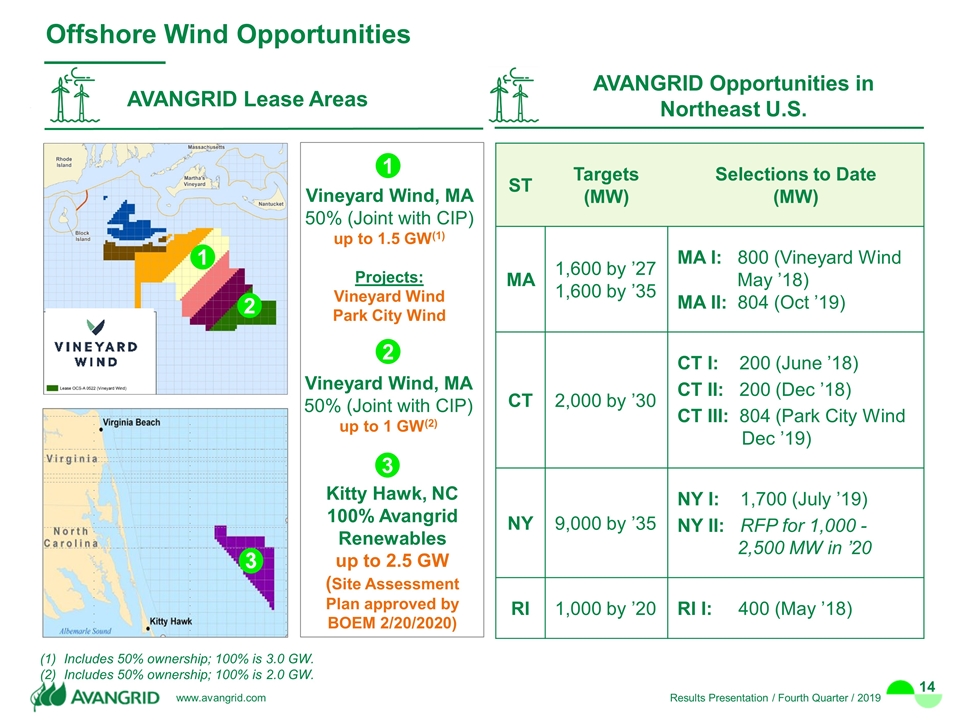
Offshore Wind Opportunities AVANGRID Lease Areas Vineyard Wind, MA 50% (Joint with CIP) up to 1.5 GW(1) Projects: Vineyard Wind Park City Wind Vineyard Wind, MA 50% (Joint with CIP) up to 1 GW(2) 1 2 Includes 50% ownership; 100% is 3.0 GW. Includes 50% ownership; 100% is 2.0 GW. 1 2 ST Targets (MW) Selections to Date (MW) MA 1,600 by ’27 1,600 by ’35 MA I: 800 (Vineyard Wind May ’18) MA II: 804 (Oct ’19) CT 2,000 by ’30 CT I: 200 (June ’18) CT II: 200 (Dec ’18) CT III: 804 (Park City Wind Dec ’19) NY 9,000 by ’35 NY I: 1,700 (July ’19) NY II: RFP for 1,000 - 2,500 MW in ’20 RI 1,000 by ’20 RI I: 400 (May ’18) Kitty Hawk, NC 100% Avangrid Renewables up to 2.5 GW (Site Assessment Plan approved by BOEM 2/20/2020) 3 3 AVANGRID Opportunities in Northeast U.S.
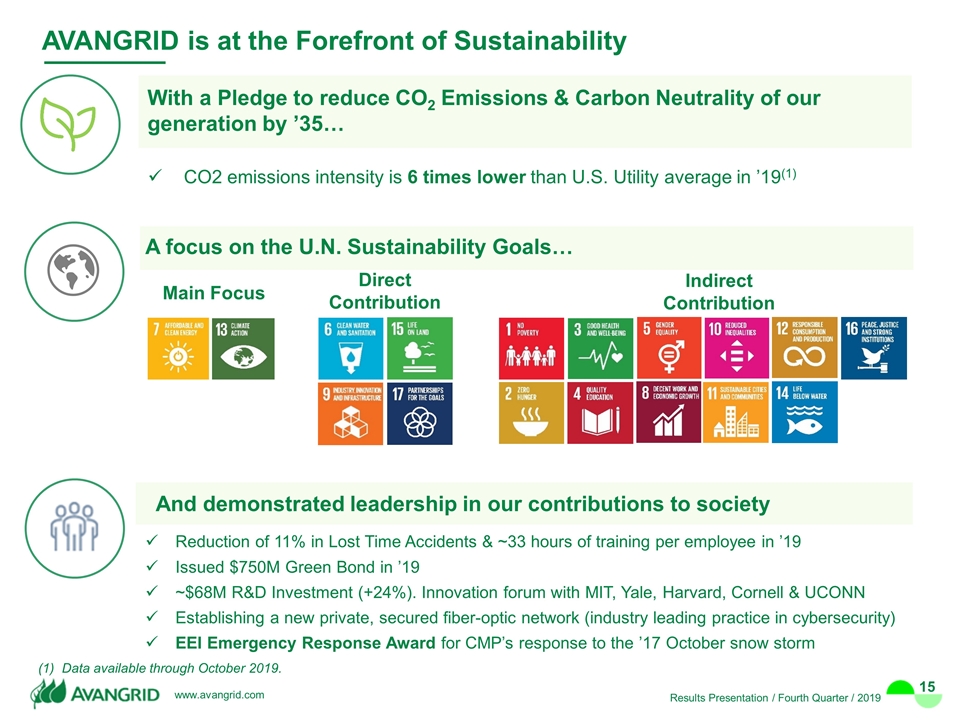
AVANGRID is at the Forefront of Sustainability Main Focus Direct Contribution Indirect Contribution CO2 emissions intensity is 6 times lower than U.S. Utility average in ’19(1) With a Pledge to reduce CO2 Emissions & Carbon Neutrality of our generation by ’35… A focus on the U.N. Sustainability Goals… Reduction of 11% in Lost Time Accidents & ~33 hours of training per employee in ’19 Issued $750M Green Bond in ’19 ~$68M R&D Investment (+24%). Innovation forum with MIT, Yale, Harvard, Cornell & UCONN Establishing a new private, secured fiber-optic network (industry leading practice in cybersecurity) EEI Emergency Response Award for CMP’s response to the ’17 October snow storm And demonstrated leadership in our contributions to society (1) Data available through October 2019.

AVANGRID ESG Recognitions & Awards Constituent of the FTSE4Good Index Series(1) Part of Carbon Disclosure Project, a global environmental disclosure system Named best corporate governance for 2019 by both World Finance Magazine & Ethical Boardroom Received prestigious third party certification of compliance program Includes companies demonstrating strong Environmental, Social and Governance (ESG) practices. (2) 200 global, publicly-traded firms according to the size of “clean revenue” from products & services that provide solutions for the planet. Recognized as one of the World’s Most Ethical Companies in 2019 & 2020 Named North American utility with the best corporate governance in 2017 & 2019 A Recognized Leader in Sustainability A Recognized Leader in Corporate Governance 2020 is the 3rd year AVANGRID earned a place on the Global Clean 200 list(2)
Financial Results by Business Doug Stuver
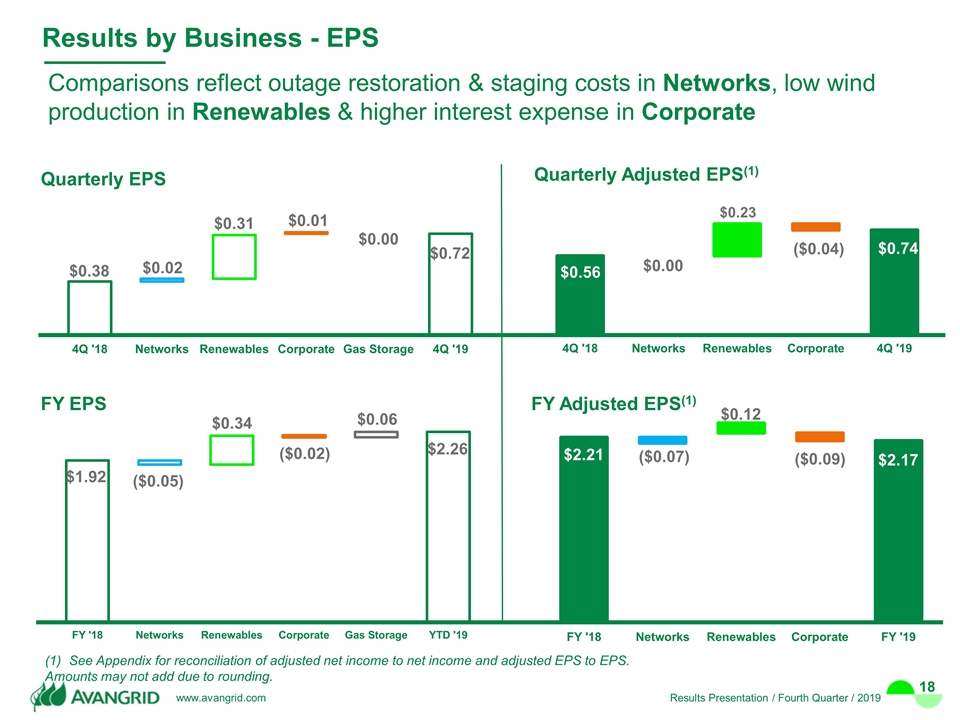
Comparisons reflect outage restoration & staging costs in Networks, low wind production in Renewables & higher interest expense in Corporate $1.92 $2.26 ($0.05) $0.34 ($0.02) FY EPS Quarterly Adjusted EPS(1) $0.41 $0.00 $0.23 ($0.04) $0.74 $0.38 $0.72 $0.02 $0.01 $0.00 Quarterly EPS Results by Business - EPS See Appendix for reconciliation of adjusted net income to net income and adjusted EPS to EPS. Amounts may not add due to rounding. $2.17 ($0.07) $0.12 ($0.09) FY Adjusted EPS(1) $0.06 $0.31 $0.56 $2.21
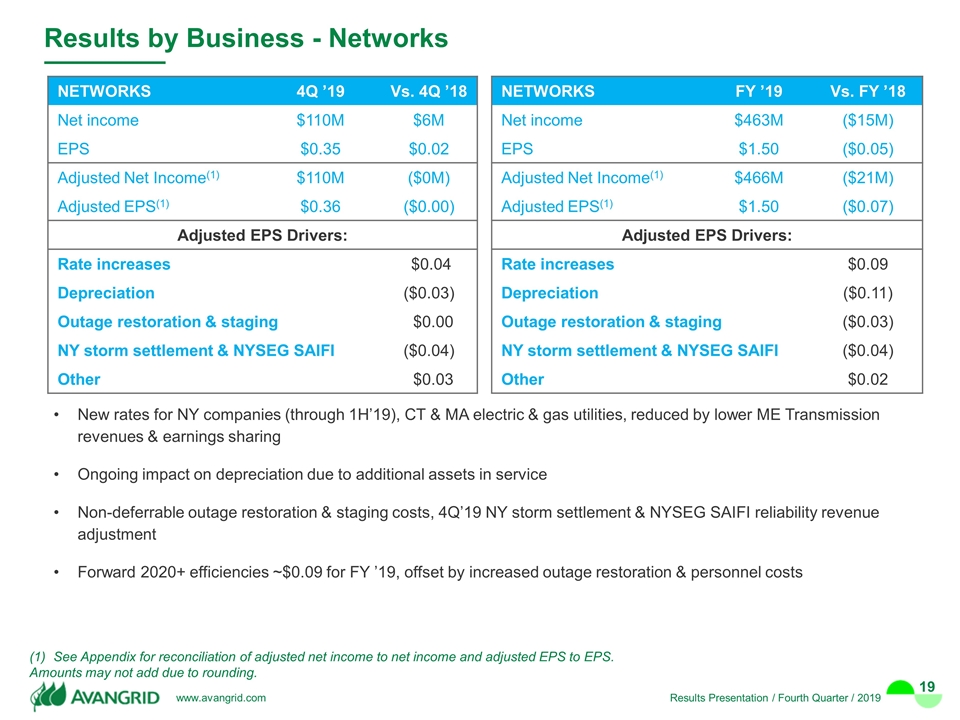
NETWORKS 4Q ’19 Vs. 4Q ’18 Net income $110M $6M EPS $0.35 $0.02 Adjusted Net Income(1) $110M ($0M) Adjusted EPS(1) $0.36 ($0.00) Adjusted EPS Drivers: Rate increases $0.04 Depreciation ($0.03) Outage restoration & staging $0.00 NY storm settlement & NYSEG SAIFI ($0.04) Other $0.03 Results by Business - Networks See Appendix for reconciliation of adjusted net income to net income and adjusted EPS to EPS. Amounts may not add due to rounding. NETWORKS FY ’19 Vs. FY ’18 Net income $463M ($15M) EPS $1.50 ($0.05) Adjusted Net Income(1) $466M ($21M) Adjusted EPS(1) $1.50 ($0.07) Adjusted EPS Drivers: Rate increases $0.09 Depreciation ($0.11) Outage restoration & staging ($0.03) NY storm settlement & NYSEG SAIFI ($0.04) Other $0.02 New rates for NY companies (through 1H’19), CT & MA electric & gas utilities, reduced by lower ME Transmission revenues & earnings sharing Ongoing impact on depreciation due to additional assets in service Non-deferrable outage restoration & staging costs, 4Q’19 NY storm settlement & NYSEG SAIFI reliability revenue adjustment Forward 2020+ efficiencies ~$0.09 for FY ’19, offset by increased outage restoration & personnel costs
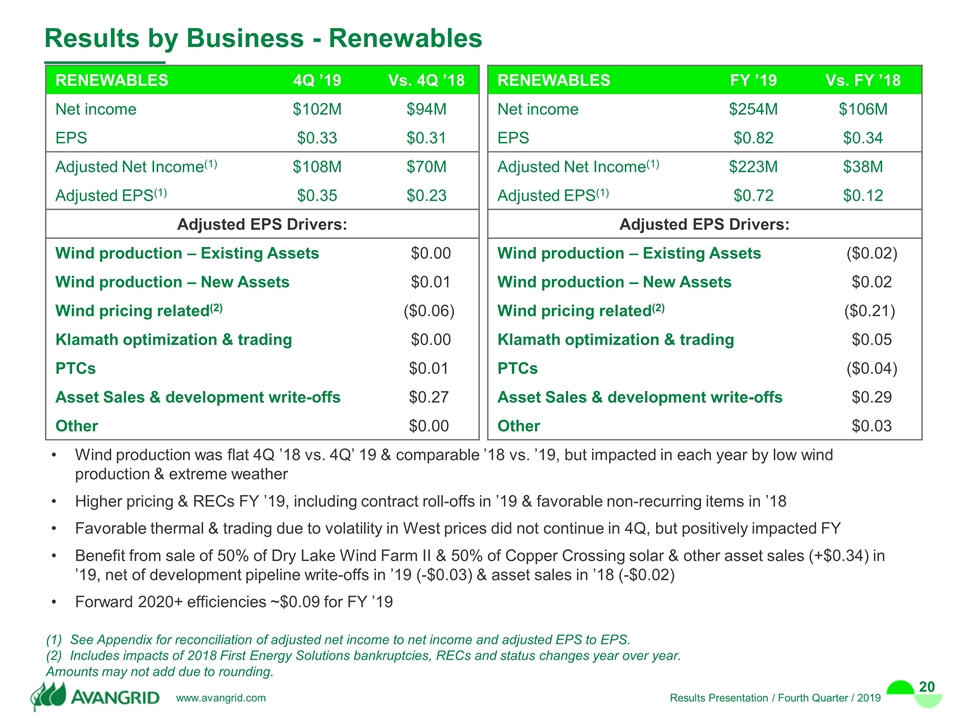
Results by Business - Renewables RENEWABLES 4Q ’19 Vs. 4Q ’18 Net income $102M $94M EPS $0.33 $0.31 Adjusted Net Income(1) $108M $70M Adjusted EPS(1) $0.35 $0.23 Adjusted EPS Drivers: Wind production – Existing Assets $0.00 Wind production – New Assets $0.01 Wind pricing related(2) ($0.06) Klamath optimization & trading $0.00 PTCs $0.01 Asset Sales & development write-offs $0.27 Other $0.00 See Appendix for reconciliation of adjusted net income to net income and adjusted EPS to EPS. Includes impacts of 2018 First Energy Solutions bankruptcies, RECs and status changes year over year. Amounts may not add due to rounding. RENEWABLES FY ’19 Vs. FY ’18 Net income $254M $106M EPS $0.82 $0.34 Adjusted Net Income(1) $223M $38M Adjusted EPS(1) $0.72 $0.12 Adjusted EPS Drivers: Wind production – Existing Assets ($0.02) ($0.02) Wind production – New Assets $0.02 $0.02 Wind pricing related(2) ($0.21) ($0.21) Klamath optimization & trading $0.05 $0.05 PTCs ($0.04) ($0.04) Asset Sales & development write-offs $0.29 $0.29 Other $0.03 $0.03 Wind production was flat 4Q ’18 vs. 4Q’ 19 & comparable ’18 vs. ’19, but impacted in each year by low wind production & extreme weather Higher pricing & RECs FY ’19, including contract roll-offs in ’19 & favorable non-recurring items in ’18 Favorable thermal & trading due to volatility in West prices did not continue in 4Q, but positively impacted FY Benefit from sale of 50% of Dry Lake Wind Farm II & 50% of Copper Crossing solar & other asset sales (+$0.34) in ’19, net of development pipeline write-offs in ’19 (-$0.03) & asset sales in ’18 (-$0.02) Forward 2020+ efficiencies ~$0.09 for FY ’19
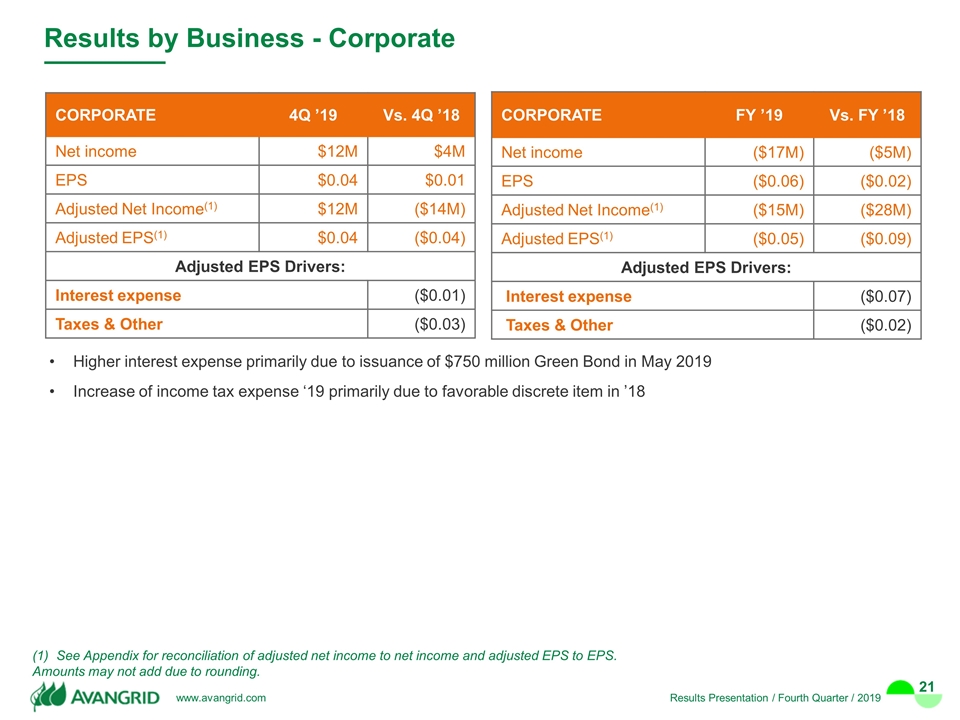
Results by Business - Corporate CORPORATE 4Q ’19 Vs. 4Q ’18 Net income $12M $4M EPS $0.04 $0.01 Adjusted Net Income(1) $12M ($14M) Adjusted EPS(1) $0.04 ($0.04) Adjusted EPS Drivers: Interest expense ($0.01) Taxes & Other ($0.03) See Appendix for reconciliation of adjusted net income to net income and adjusted EPS to EPS. Amounts may not add due to rounding. CORPORATE FY ’19 Vs. FY ’18 Net income ($17M) ($5M) EPS ($0.06) ($0.02) Adjusted Net Income(1) ($15M) ($28M) Adjusted EPS(1) ($0.05) ($0.09) Adjusted EPS Drivers: Interest expense ($0.07) Taxes & Other ($0.02) Higher interest expense primarily due to issuance of $750 million Green Bond in May 2019 Increase of income tax expense ‘19 primarily due to favorable discrete item in ’18
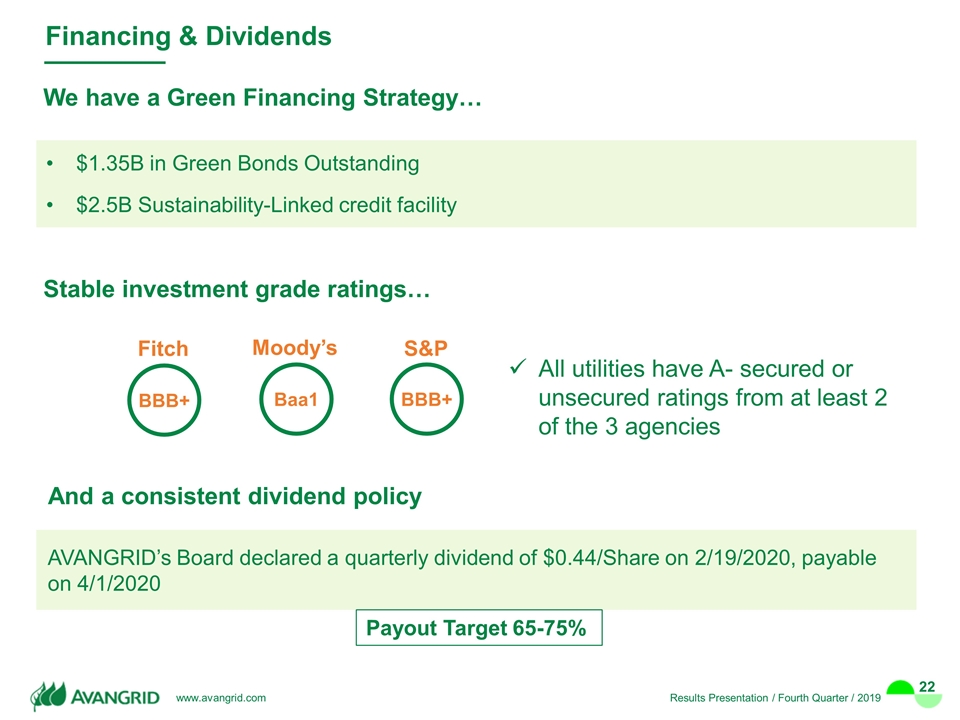
Financing & Dividends BBB+ Baa1 BBB+ Fitch Moody’s S&P AVANGRID’s Board declared a quarterly dividend of $0.44/Share on 2/19/2020, payable on 4/1/2020 Payout Target 65-75% $1.35B in Green Bonds Outstanding $2.5B Sustainability-Linked credit facility We have a Green Financing Strategy… Stable investment grade ratings… And a consistent dividend policy All utilities have A- secured or unsecured ratings from at least 2 of the 3 agencies
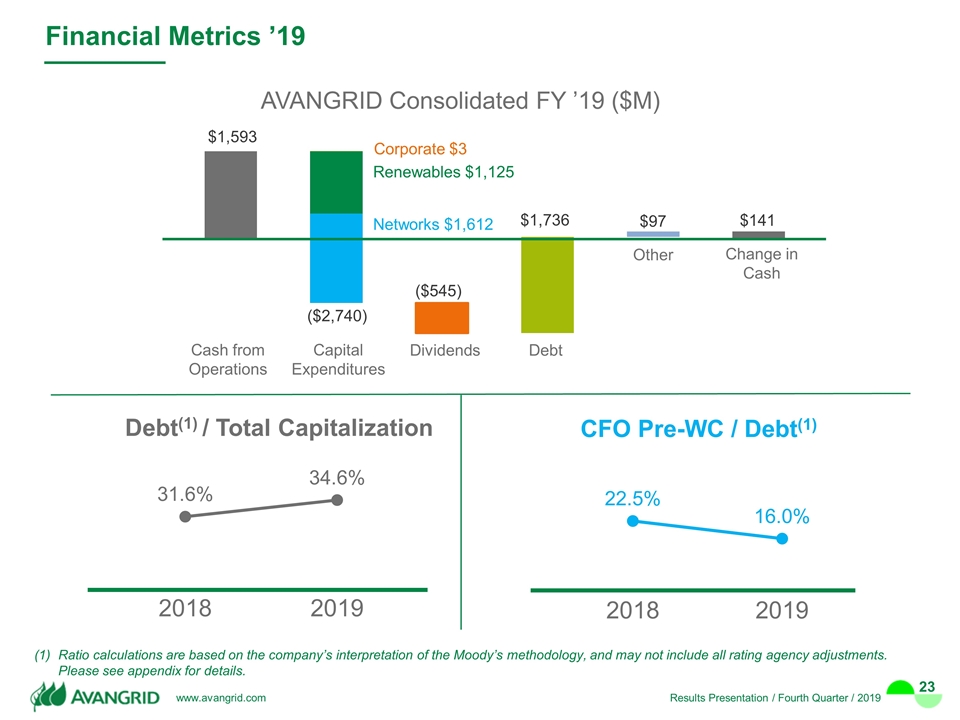
Financial Metrics ’19 Ratio calculations are based on the company’s interpretation of the Moody’s methodology, and may not include all rating agency adjustments. Please see appendix for details. Debt(1) / Total Capitalization CFO Pre-WC / Debt(1) AVANGRID Consolidated FY ’19 ($M) Cash from Operations Capital Expenditures Change in Cash Dividends Debt $1,736 Other Renewables $1,125 Networks $1,612 Corporate $3
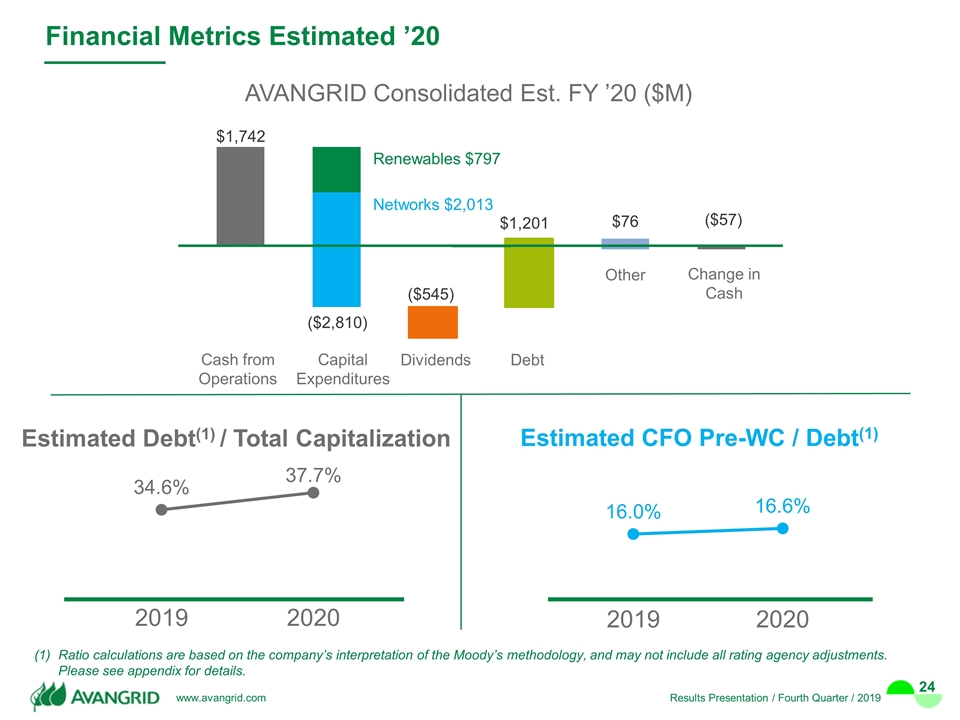
Financial Metrics Estimated ’20 Ratio calculations are based on the company’s interpretation of the Moody’s methodology, and may not include all rating agency adjustments. Please see appendix for details. Estimated Debt(1) / Total Capitalization Estimated CFO Pre-WC / Debt(1) AVANGRID Consolidated Est. FY ’20 ($M) Cash from Operations Capital Expenditures Change in Cash Dividends Debt $1,201 Other Renewables $797 Networks $2,013
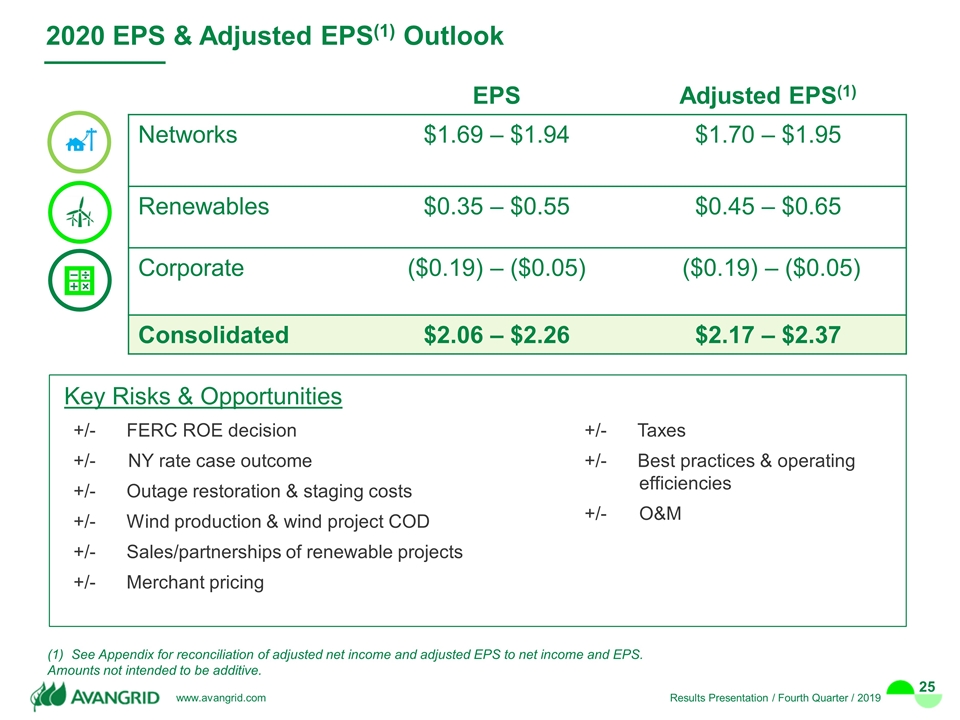
2020 EPS & Adjusted EPS(1) Outlook See Appendix for reconciliation of adjusted net income and adjusted EPS to net income and EPS. Amounts not intended to be additive. Consolidated EPS Adjusted EPS(1) Networks $1.69 – $1.94 $1.70 – $1.95 Renewables $0.35 – $0.55 $0.45 – $0.65 Corporate ($0.19) – ($0.05) ($0.19) – ($0.05) Consolidated $2.06 – $2.26 $2.17 – $2.37 Key Risks & Opportunities +/- FERC ROE decision +/-NY rate case outcome +/- Outage restoration & staging costs +/- Wind production & wind project COD +/- Sales/partnerships of renewable projects +/- Merchant pricing +/- Taxes +/- Best practices & operating efficiencies +/-O&M
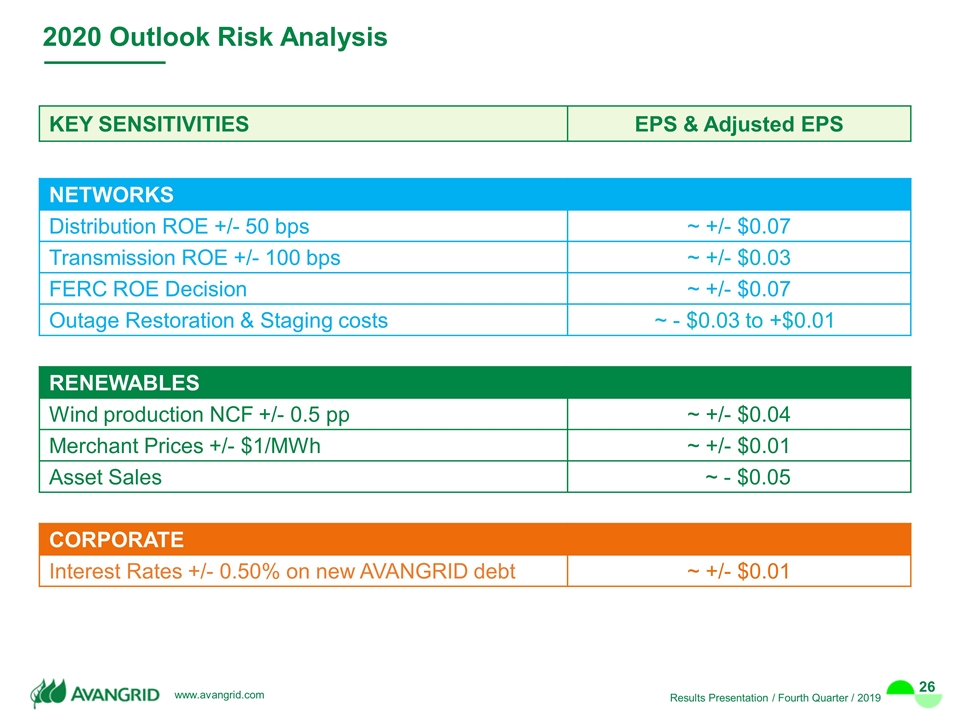
2020 Outlook Risk Analysis KEY SENSITIVITIES EPS & Adjusted EPS NETWORKS Distribution ROE +/- 50 bps ~ +/- $0.07 Transmission ROE +/- 100 bps ~ +/- $0.03 FERC ROE Decision ~ +/- $0.07 Outage Restoration & Staging costs ~ - $0.03 to +$0.01 RENEWABLES Wind production NCF +/- 0.5 pp ~ +/- $0.04 Merchant Prices +/- $1/MWh ~ +/- $0.01 Asset Sales ~ - $0.05 CORPORATE Interest Rates +/- 0.50% on new AVANGRID debt ~ +/- $0.01
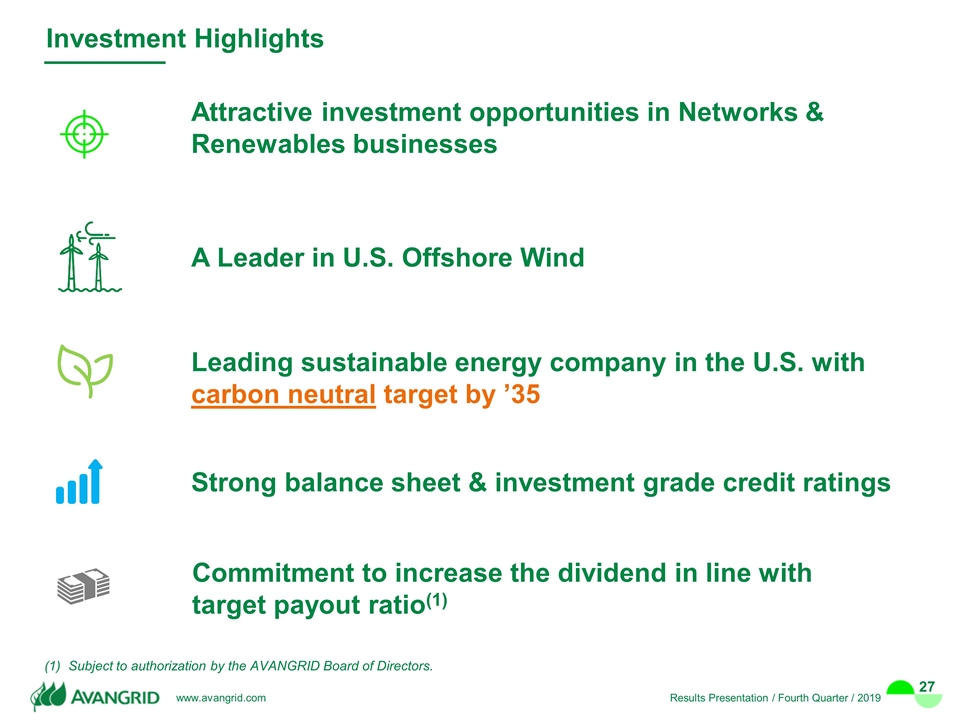
Subject to authorization by the AVANGRID Board of Directors. Investment Highlights Leading sustainable energy company in the U.S. with carbon neutral target by ’35 Attractive investment opportunities in Networks & Renewables businesses Strong balance sheet & investment grade credit ratings Commitment to increase the dividend in line with target payout ratio(1) A Leader in U.S. Offshore Wind
Appendix
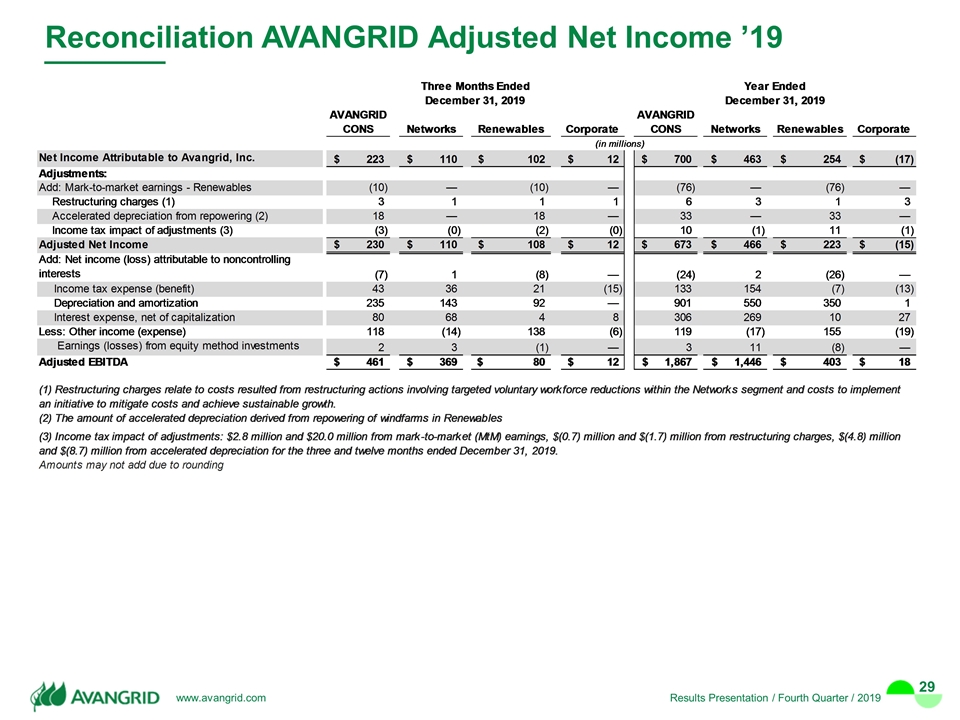
Reconciliation AVANGRID Adjusted Net Income ’19
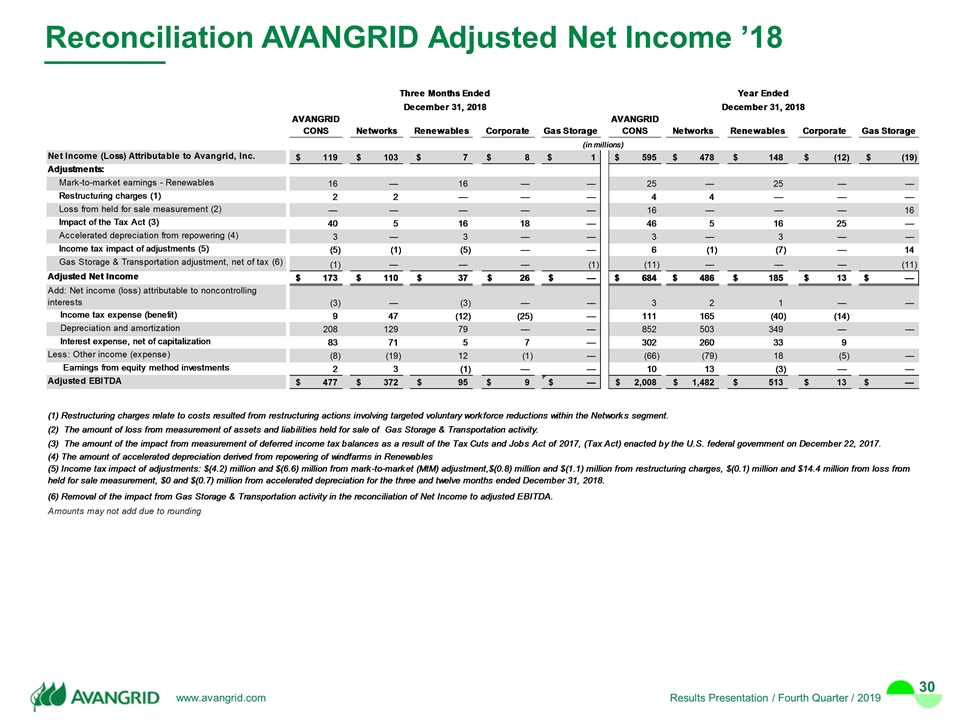
Reconciliation AVANGRID Adjusted Net Income ’18
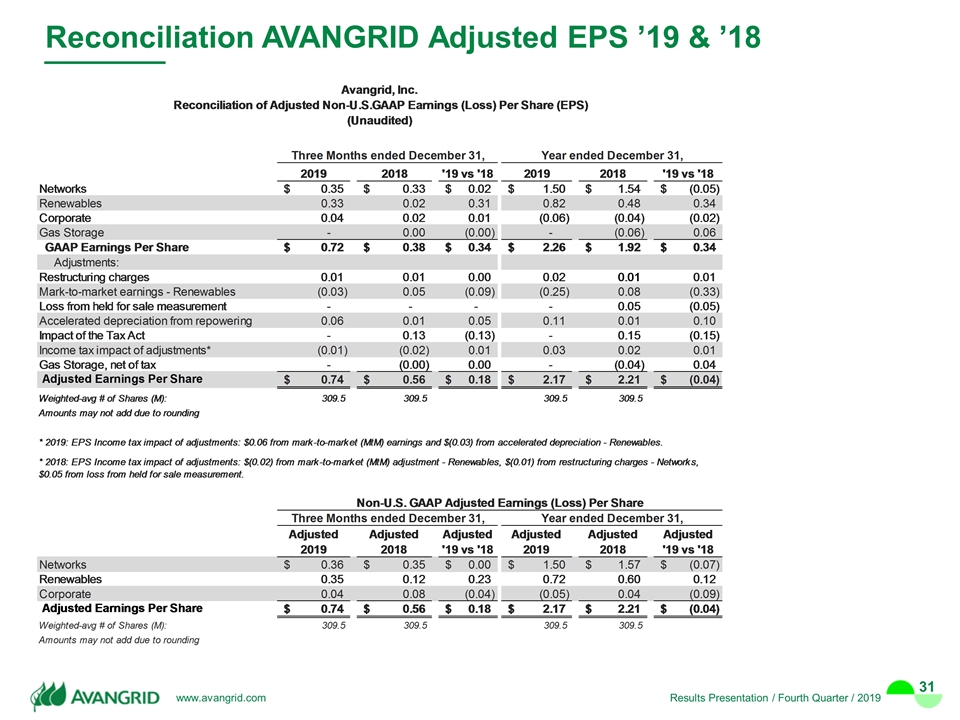
Reconciliation AVANGRID Adjusted EPS ’19 & ’18
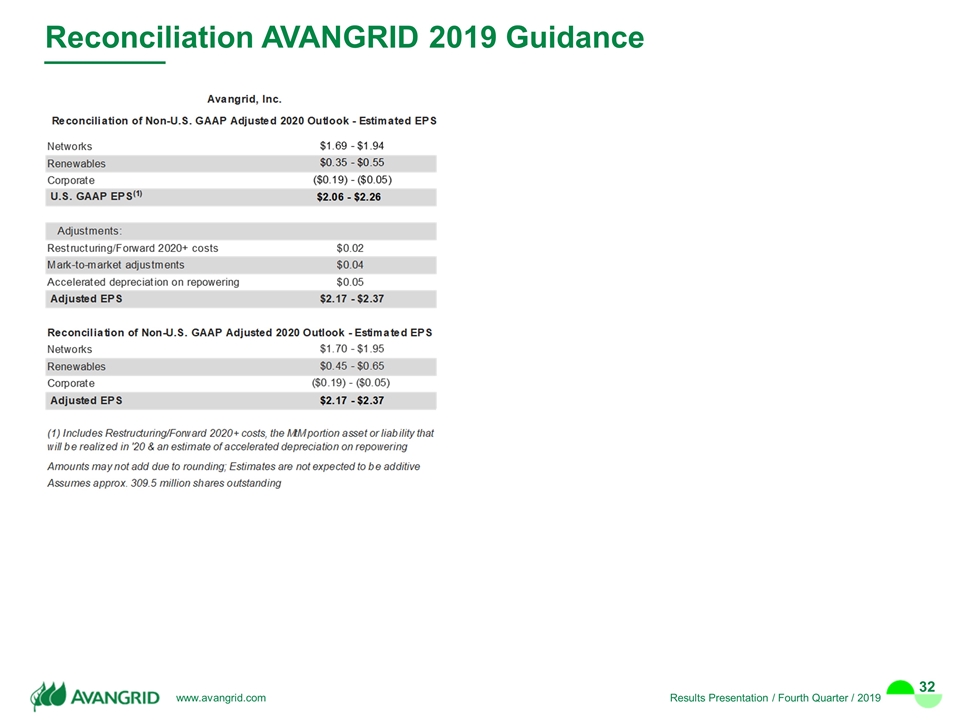
Reconciliation AVANGRID 2019 Guidance
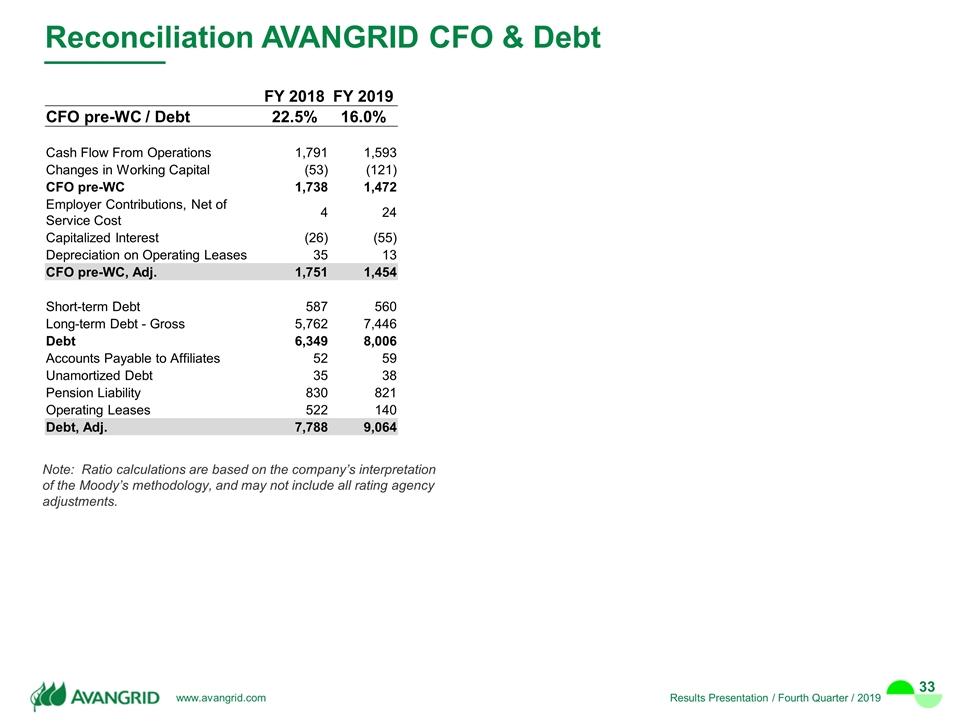
Reconciliation AVANGRID CFO & Debt FY 2018 FY 2019 CFO pre-WC / Debt 22.5% 16.0% Cash Flow From Operations 1,791 1,593 Changes in Working Capital (53) (121) CFO pre-WC 1,738 1,472 Employer Contributions, Net of Service Cost 4 24 Capitalized Interest (26) (55) Depreciation on Operating Leases 35 13 CFO pre-WC, Adj. 1,751 1,454 Short-term Debt 587 560 Long-term Debt - Gross 5,762 7,446 Debt 6,349 8,006 Accounts Payable to Affiliates 52 59 Unamortized Debt 35 38 Pension Liability 830 821 Operating Leases 522 140 Debt, Adj. 7,788 9,064 Note: Ratio calculations are based on the company’s interpretation of the Moody’s methodology, and may not include all rating agency adjustments.
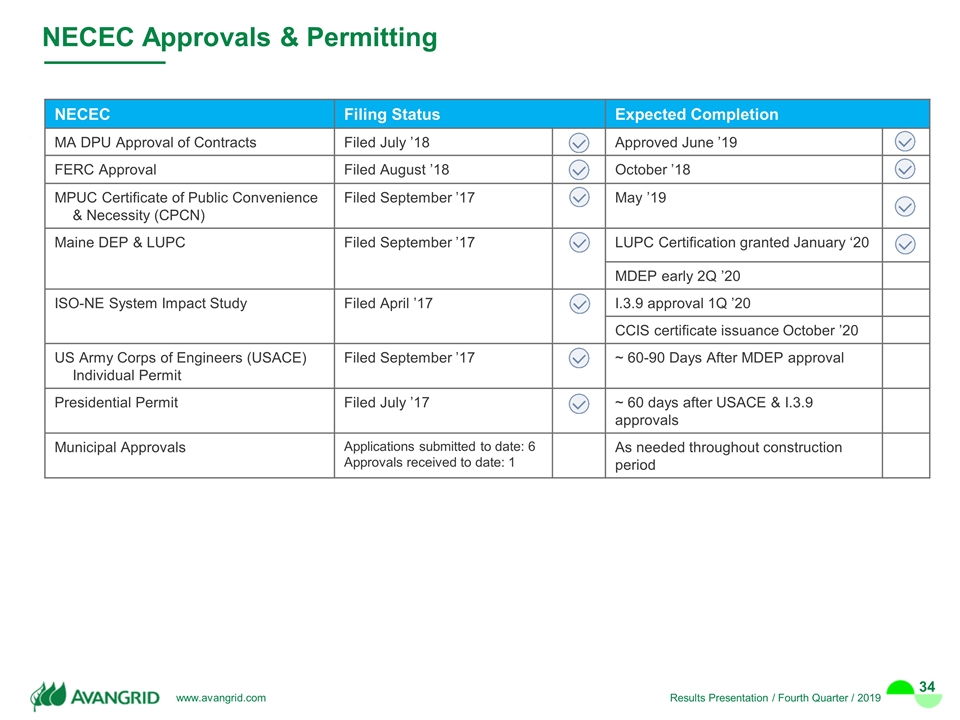
NECEC Approvals & Permitting NECEC Filing Status Expected Completion MA DPU Approval of Contracts Filed July ’18 Approved June ’19 FERC Approval Filed August ’18 October ’18 MPUC Certificate of Public Convenience & Necessity (CPCN) Filed September ’17 May ’19 Maine DEP & LUPC Filed September ’17 LUPC Certification granted January ‘20 MDEP early 2Q ’20 ISO-NE System Impact Study Filed April ’17 I.3.9 approval 1Q ’20 CCIS certificate issuance October ’20 US Army Corps of Engineers (USACE) Individual Permit Filed September ’17 ~ 60-90 Days After MDEP approval Presidential Permit Filed July ’17 ~ 60 days after USACE & I.3.9 approvals Municipal Approvals Applications submitted to date: 6 Approvals received to date: 1 As needed throughout construction period
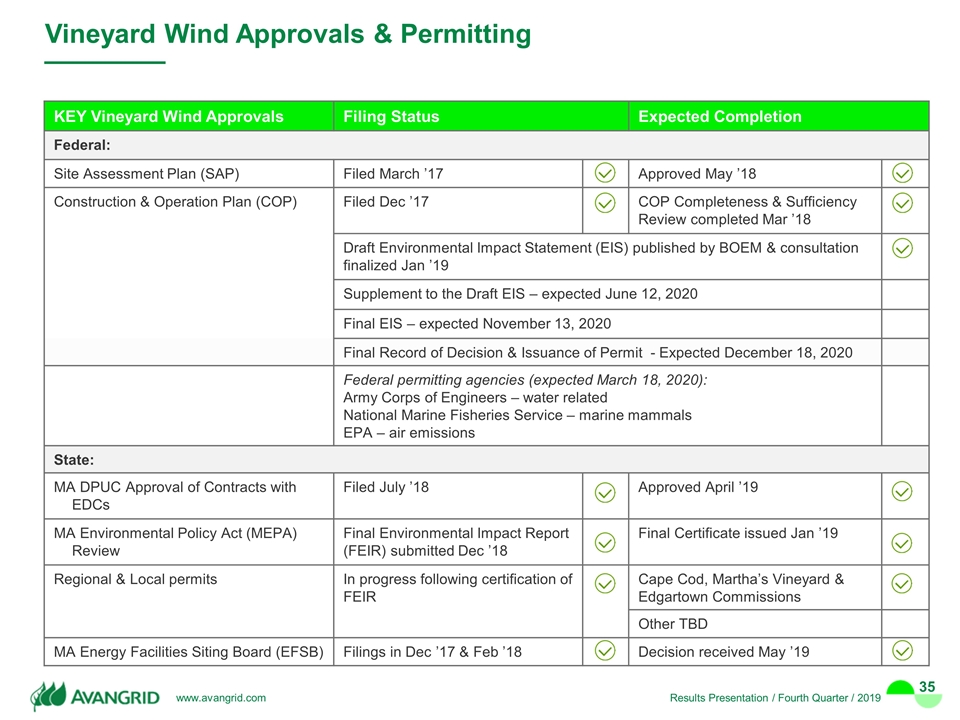
Vineyard Wind Approvals & Permitting KEY Vineyard Wind Approvals Filing Status Expected Completion Federal: Site Assessment Plan (SAP) Filed March ’17 Approved May ’18 Construction & Operation Plan (COP) Filed Dec ’17 COP Completeness & Sufficiency Review completed Mar ’18 Draft Environmental Impact Statement (EIS) published by BOEM & consultation finalized Jan ’19 Supplement to the Draft EIS – expected June 12, 2020 Final EIS – expected November 13, 2020 Final Record of Decision & Issuance of Permit - Expected December 18, 2020 Federal permitting agencies (expected March 18, 2020): Army Corps of Engineers – water related National Marine Fisheries Service – marine mammals EPA – air emissions State: MA DPUC Approval of Contracts with EDCs Filed July ’18 Approved April ’19 MA Environmental Policy Act (MEPA) Review Final Environmental Impact Report (FEIR) submitted Dec ’18 Final Certificate issued Jan ’19 Regional & Local permits In progress following certification of FEIR Cape Cod, Martha’s Vineyard & Edgartown Commissions Other TBD MA Energy Facilities Siting Board (EFSB) Filings in Dec ’17 & Feb ’18 Decision received May ’19
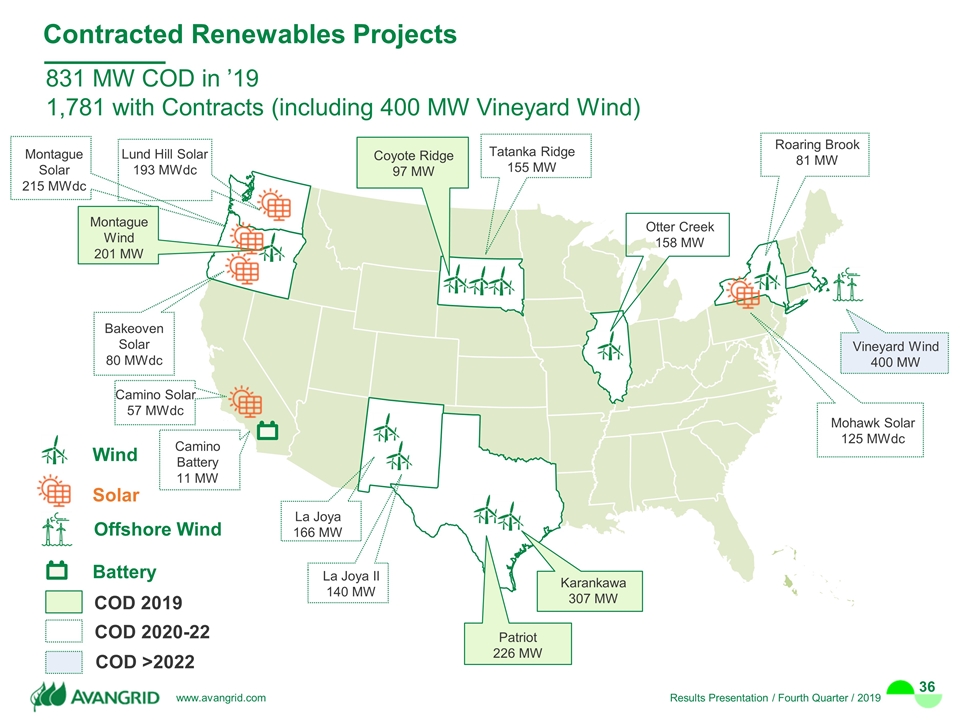
Contracted Renewables Projects 831 MW COD in ’19 1,781 with Contracts (including 400 MW Vineyard Wind) Wind Solar Offshore Wind COD 2019 COD 2020-22 COD >2022 Lund Hill Solar 193 MWdc Montague Wind 201 MW La Joya 166 MW Patriot 226 MW Karankawa 307 MW Coyote Ridge 97 MW Otter Creek 158 MW Roaring Brook 81 MW Vineyard Wind 400 MW Mohawk Solar 125 MWdc Tatanka Ridge 155 MW Bakeoven Solar 80 MWdc La Joya II 140 MW Montague Solar 215 MWdc Camino Solar 57 MWdc Camino Battery 11 MW Battery
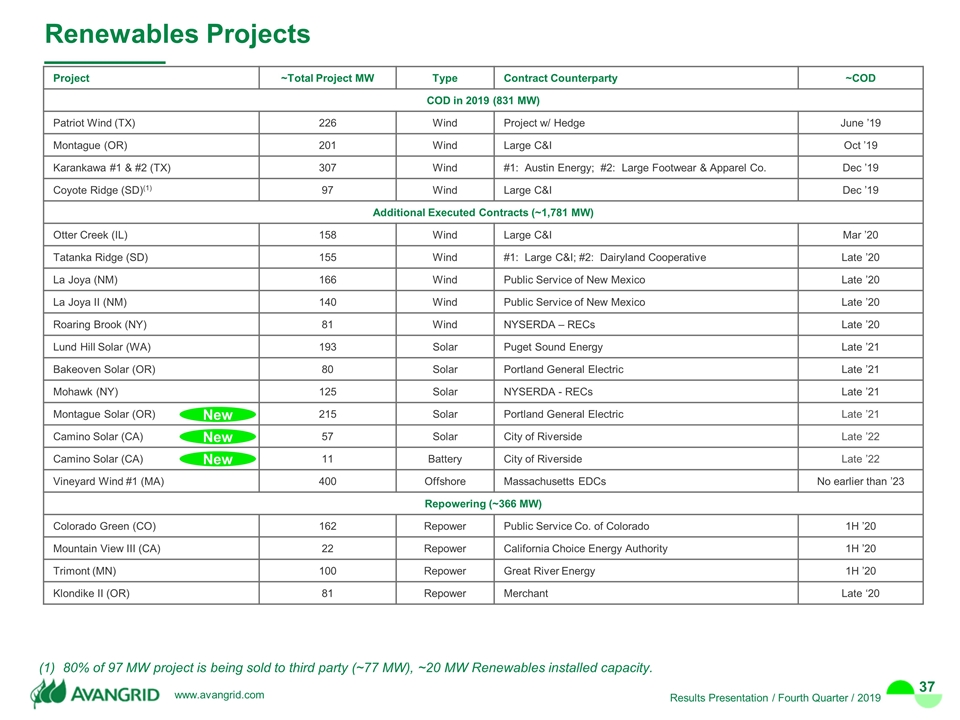
Renewables Projects 80% of 97 MW project is being sold to third party (~77 MW), ~20 MW Renewables installed capacity. Project ~Total Project MW Type Contract Counterparty ~COD COD in 2019 (831 MW) Patriot Wind (TX) 226 Wind Project w/ Hedge June ’19 Montague (OR) 201 Wind Large C&I Oct ’19 Karankawa #1 & #2 (TX) 307 Wind #1: Austin Energy; #2: Large Footwear & Apparel Co. Dec ’19 Coyote Ridge (SD)(1) 97 Wind Large C&I Dec ’19 Additional Executed Contracts (~1,781 MW) Otter Creek (IL) 158 Wind Large C&I Mar ’20 Tatanka Ridge (SD) 155 Wind #1: Large C&I; #2: Dairyland Cooperative Late ’20 La Joya (NM) 166 Wind Public Service of New Mexico Late ’20 La Joya II (NM) 140 Wind Public Service of New Mexico Late ’20 Roaring Brook (NY) 81 Wind NYSERDA – RECs Late ’20 Lund Hill Solar (WA) 193 Solar Puget Sound Energy Late ’21 Bakeoven Solar (OR) 80 Solar Portland General Electric Late ’21 Mohawk (NY) 125 Solar NYSERDA - RECs Late ’21 Montague Solar (OR) 215 Solar Portland General Electric Late ’21 Camino Solar (CA) 57 Solar City of Riverside Late ’22 Camino Solar (CA) 11 Battery City of Riverside Late ’22 Vineyard Wind #1 (MA) 400 Offshore Massachusetts EDCs No earlier than ’23 Repowering (~366 MW) Colorado Green (CO) 162 Repower Public Service Co. of Colorado 1H ’20 Mountain View III (CA) 22 Repower California Choice Energy Authority 1H ’20 Trimont (MN) 100 Repower Great River Energy 1H ’20 Klondike II (OR) 81 Repower Merchant Late ‘20 New New New
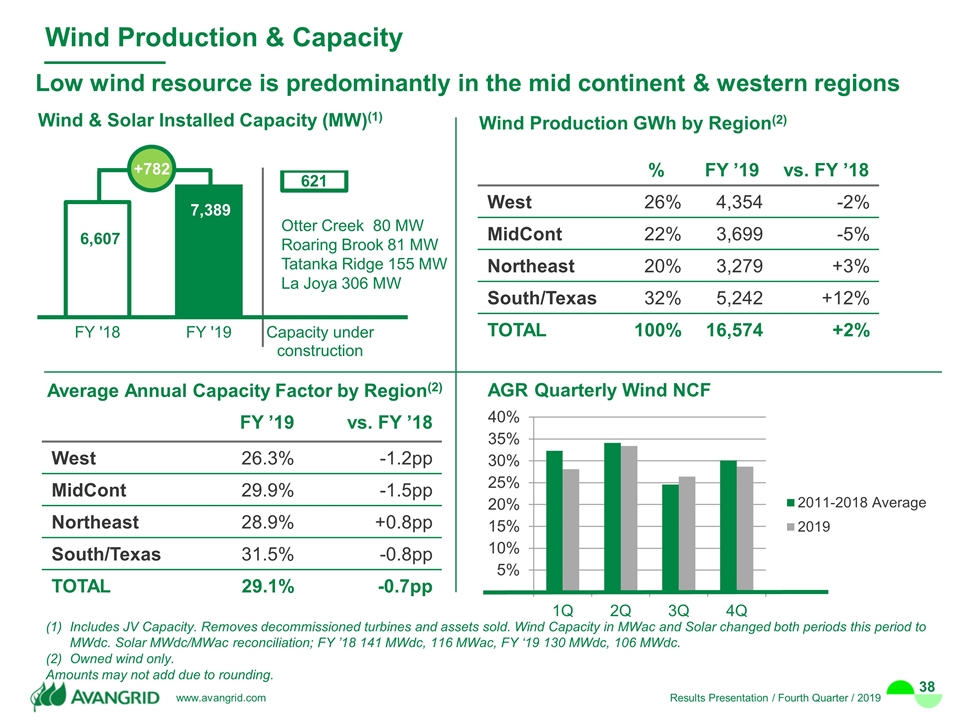
Low wind resource is predominantly in the mid continent & western regions Wind Production & Capacity % FY ’19 vs. FY ’18 West 26% 4,354 -2% MidCont 22% 3,699 -5% Northeast 20% 3,279 +3% South/Texas 32% 5,242 +12% TOTAL 100% 16,574 +2% AGR Quarterly Wind NCF Includes JV Capacity. Removes decommissioned turbines and assets sold. Wind Capacity in MWac and Solar changed both periods this period to MWdc. Solar MWdc/MWac reconciliation; FY ’18 141 MWdc, 116 MWac, FY ‘19 130 MWdc, 106 MWdc. Owned wind only. Amounts may not add due to rounding. Wind Production GWh by Region(2) Average Annual Capacity Factor by Region(2) FY ’19 vs. FY ’18 West 26.3% -1.2pp MidCont 29.9% -1.5pp Northeast 28.9% +0.8pp South/Texas 31.5% -0.8pp TOTAL 29.1% -0.7pp Wind & Solar Installed Capacity (MW)(1) Otter Creek 80 MW Roaring Brook 81 MW Tatanka Ridge 155 MW La Joya 306 MW +782
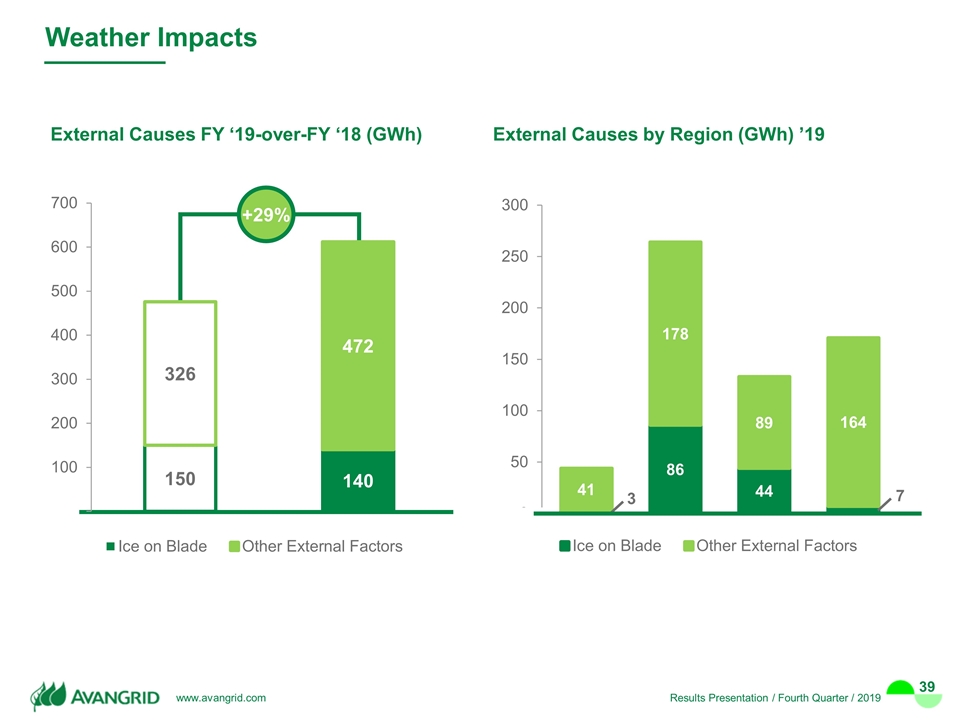
pp: percentage point Weather Impacts External Causes FY ‘19-over-FY ‘18 (GWh) +29% 3 7 External Causes by Region (GWh) ’19
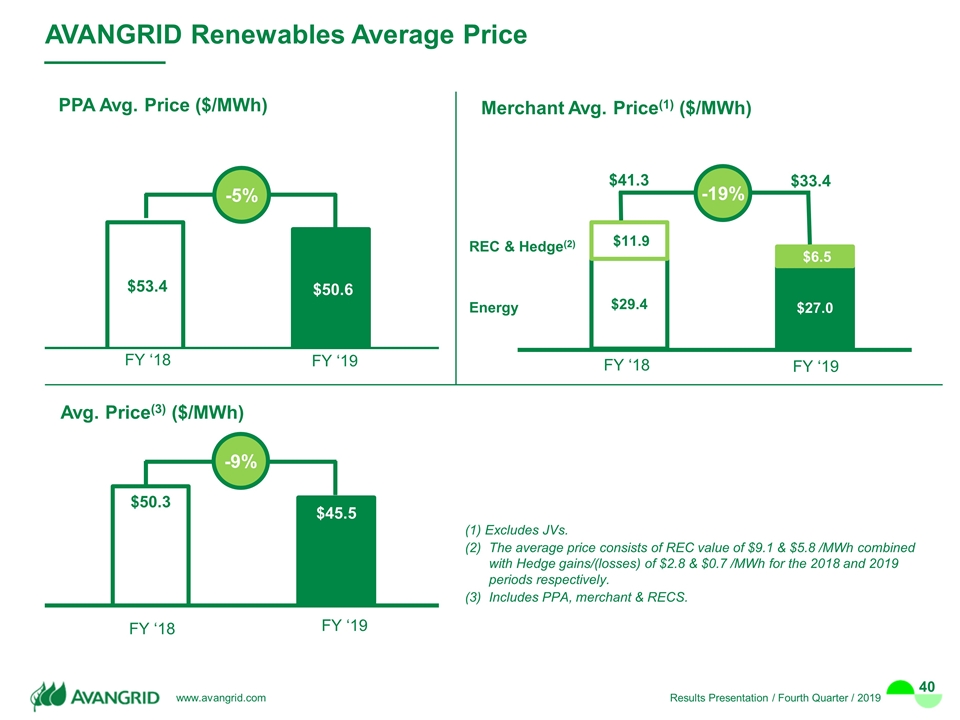
Merchant Avg. Price(1) ($/MWh) FY ‘18 FY ‘19 REC & Hedge(2) Energy AVANGRID Renewables Average Price FY ‘18 FY ‘19 (1) Excludes JVs. The average price consists of REC value of $9.1 & $5.8 /MWh combined with Hedge gains/(losses) of $2.8 & $0.7 /MWh for the 2018 and 2019 periods respectively. Includes PPA, merchant & RECS. PPA Avg. Price ($/MWh) -5% FY ‘18 FY ‘19 -9% Avg. Price(3) ($/MWh) -19%
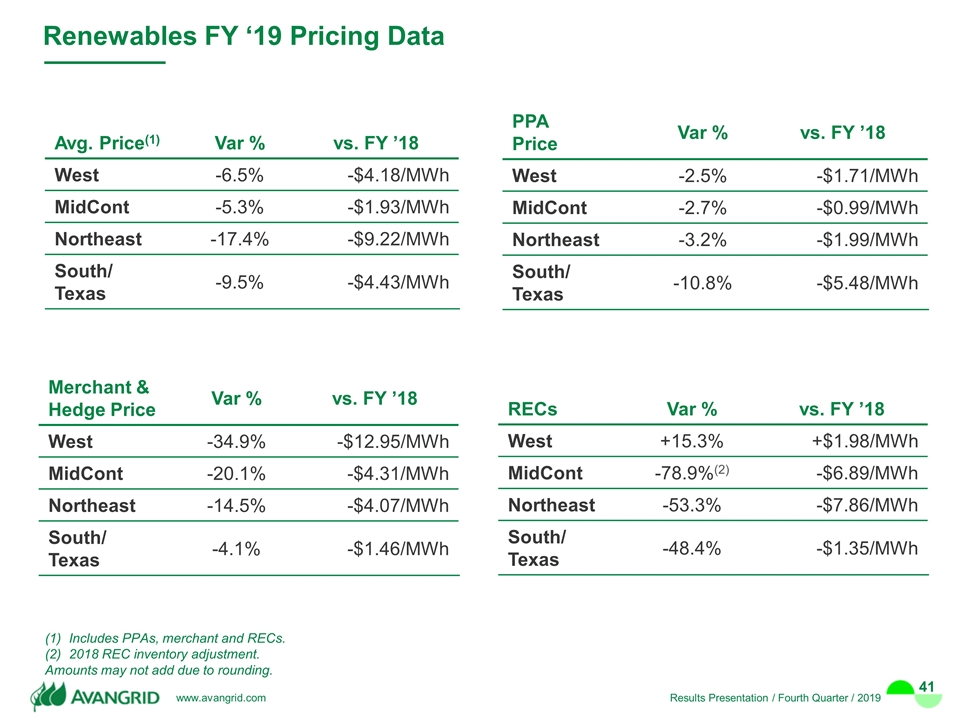
Renewables FY ‘19 Pricing Data Includes PPAs, merchant and RECs. 2018 REC inventory adjustment. Amounts may not add due to rounding. Avg. Price(1) Var % vs. FY ’18 West -6.5% -$4.18/MWh MidCont -5.3% -$1.93/MWh Northeast -17.4% -$9.22/MWh South/ Texas -9.5% -$4.43/MWh PPA Price Var % vs. FY ’18 West -2.5% -$1.71/MWh MidCont -2.7% -$0.99/MWh Northeast -3.2% -$1.99/MWh South/ Texas -10.8% -$5.48/MWh Merchant & Hedge Price Var % vs. FY ’18 West -34.9% -$12.95/MWh MidCont -20.1% -$4.31/MWh Northeast -14.5% -$4.07/MWh South/ Texas -4.1% -$1.46/MWh RECs Var % vs. FY ’18 West +15.3% +$1.98/MWh MidCont -78.9%(2) -$6.89/MWh Northeast -53.3% -$7.86/MWh South/ Texas -48.4% -$1.35/MWh


