Results Presentation Second Quarter July 22, 2020 Exhibit 99.2
Legal Notice FORWARD LOOKING STATEMENTS Certain statements in this presentation may relate to our future business and financial performance and future events or developments involving us and our subsidiaries that are not purely historical and may constitute “forward-looking statements” within the meaning of the Private Securities Litigation Reform Act of 1995. Forward-looking statements may be identified by the use of forward-looking terms such as “may,” “will,” “should,” “would,” “could,” “can,” “expect(s),” “believe(s),” “anticipate(s),” “intend(s),” “plan(s),” “estimate(s),” “project(s),” “assume(s),” “guide(s),” “target(s),” “forecast(s),” “are (is) confident that” and “seek(s)” or the negative of such terms or other variations on such terms or comparable terminology. Such forward-looking statements include, but are not limited to, statements about our plans, objectives and intentions, outlooks or expectations for earnings, revenues, expenses or other future financial or business performance, strategies or expectations, or the impact of legal or regulatory matters on business, results of operations or financial condition of the business and other statements that are not historical facts. Such statements are based upon the current reasonable beliefs, expectations, and assumptions of our management and are subject to significant risks and uncertainties that could cause actual outcomes and results to differ materially. Important factors are discussed and should be reviewed in our Form 10-K and other subsequent filings with the SEC. Specifically, forward-looking statements include, without limitation: the future financial performance, anticipated liquidity and capital expenditures, actions or inactions of local, state or federal regulatory agencies, success in retaining or recruiting our officers, key employees or directors, changes in levels or timing of capital expenditures, adverse developments in general market, business, economic, labor, regulatory and political conditions, fluctuations in weather patterns, technological developments, the impact of any cyber breaches or other incidents, grid disturbances, acts of war or terrorism, civil or social unrest, natural disasters, pandemic health events or other similar occurrences, the impact of any change to applicable laws and regulations affecting operations, including those relating to the environment and climate change, taxes, price controls, regulatory approval and permitting, the implementation of changes in accounting standards; and other presently unknown unforeseen factors. Should one or more of these risks or uncertainties materialize, or should any of the underlying assumptions prove incorrect, actual results may vary in material respects from those expressed or implied by these forward-looking statements. You should not place undue reliance on these forward-looking statements. We do not undertake any obligation to update or revise any forward-looking statements to reflect events or circumstances after the date of this report, whether as a result of new information, future events or otherwise, except as may be required under applicable securities laws. Other risk factors are detailed from time to time in our reports filed with the SEC, and we encourage you to consult such disclosures. About AVANGRID: AVANGRID, Inc. (NYSE: AGR) is a leading, sustainable energy company with approximately $35 billion in assets and operations in 24 U.S. states. With headquarters in Orange, Connecticut, AVANGRID has two primary lines of business: Avangrid Networks and Avangrid Renewables. Avangrid Networks owns eight electric and natural gas utilities, serving more than 3.3 million customers in New York and New England. Avangrid Renewables owns and operates a portfolio of renewable energy generation facilities across the United States. AVANGRID employs approximately 6,600 people. AVANGRID supports the U.N.’s Sustainable Development Goals and was named among the World’s Most Ethical Companies in 2019 and 2020 by the Ethisphere Institute. For more information, visit www.avangrid.com.
Legal Notice Use of Non-U.S. GAAP Financial Measures To supplement our consolidated financial statements presented in accordance with U.S. GAAP, we consider adjusted net income and adjusted earnings per share as non-GAAP financial measures that are not prepared in accordance with U.S. GAAP. The non-GAAP financial measures we use are specific to AVANGRID and the non-GAAP financial measures of other companies may not be calculated in the same manner. We use these non-GAAP financial measures, in addition to U.S. GAAP measures, to establish operating budgets and operational goals to manage and monitor our business, evaluate our operating and financial performance and to compare such performance to prior periods and to the performance of our competitors. We believe that presenting such non-GAAP financial measures is useful because such measures can be used to analyze and compare profitability between companies and industries by eliminating the impact of certain non-cash charges. In addition, we present non-GAAP financial measures because we believe that they and other similar measures are widely used by certain investors, securities analysts and other interested parties as supplemental measures of performance. We define adjusted net income as net income adjusted to exclude restructuring charges, mark-to-market earnings from changes in the fair value of derivative instruments used by AVANGRID to economically hedge market price fluctuations in related underlying physical transactions for the purchase and sale of electricity, accelerated depreciation derived from repowering of wind farms, and the impact of the global coronavirus (COVID-19) pandemic. We believe adjusted net income is more useful in understanding and evaluating actual and projected financial performance and contribution of AVANGRID core lines of business and to more fully compare and explain our results. The most directly comparable U.S. GAAP measure to adjusted net income is net income. We also define adjusted earnings per share, or adjusted EPS, as adjusted net income converted to an earnings per share amount. The use of non-GAAP financial measures is not intended to be considered in isolation or as a substitute for, or superior to, AVANGRID’s U.S. GAAP financial information, and investors are cautioned that the non-GAAP financial measures are limited in their usefulness, may be unique to AVANGRID, and should be considered only as a supplement to AVANGRID’s U.S. GAAP financial measures. The non-GAAP financial measures may not be comparable to other similarly titled measures of other companies and have limitations as analytical tools. Non-GAAP financial measures are not primary measurements of our performance under U.S. GAAP and should not be considered as alternatives to operating income, net income or any other performance measures determined in accordance with U.S. GAAP. Investors and others should note that AVANGRID routinely posts important information on its website and considers the Investor Relations section, www.avangrid.com/wps/portal/avangrid/Investors,a channel of distribution.
Opening Remarks Dennis has over 25 years of experience in the energy sector, most recently serving as Executive Vice President and Group President & Chief Sustainability Officer of Sempra Energy. He has also held a variety of leadership positions including Chairman, President & CEO of Southern California Gas Co. (SoCalGas), Executive Vice President and Chief Financial Officer for SunPower Corp., a Silicon Valley-based solar technology company, & Senior Vice President and Chief Financial Officer of both San Diego Gas & Electric and SoCalGas. Moving AVANGRID forward as a leading sustainable energy company New CEO Welcome “We have enormous potential to lead in this critical moment of transformational change in the energy sector. AVANGRID is uniquely positioned to deliver necessary clean energy solutions to its customers and help develop the infrastructure required to meet our future climate goals.” Dennis V. Arriola Joins AVANGRID as Chief Executive Officer & member of the AVANGRID Board of Directors, effective July 20, 2020
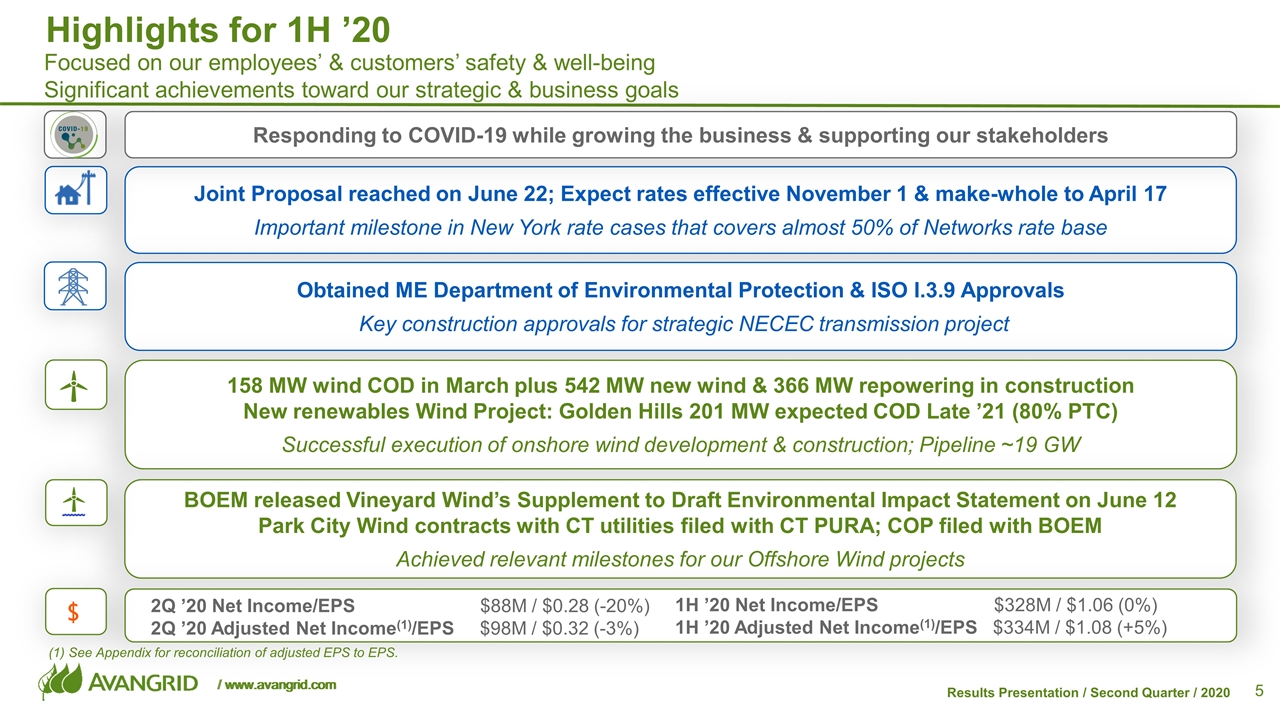
Highlights for 1H ’20 Focused on our employees’ & customers’ safety & well-being Significant achievements toward our strategic & business goals Joint Proposal reached on June 22; Expect rates effective November 1 & make-whole to April 17 Important milestone in New York rate cases that covers almost 50% of Networks rate base Obtained ME Department of Environmental Protection & ISO I.3.9 Approvals Key construction approvals for strategic NECEC transmission project 158 MW wind COD in March plus 542 MW new wind & 366 MW repowering in construction New renewables Wind Project: Golden Hills 201 MW expected COD Late ’21 (80% PTC) Successful execution of onshore wind development & construction; Pipeline ~19 GW BOEM released Vineyard Wind’s Supplement to Draft Environmental Impact Statement on June 12 Park City Wind contracts with CT utilities filed with CT PURA; COP filed with BOEM Achieved relevant milestones for our Offshore Wind projects $ 2Q ’20 Net Income/EPS $88M / $0.28 (-20%) 2Q ’20 Adjusted Net Income(1)/EPS $98M / $0.32 (-3%) 1H ’20 Net Income/EPS $328M / $1.06 (0%) 1H ’20 Adjusted Net Income(1)/EPS $334M / $1.08 (+5%) Responding to COVID-19 while growing the business & supporting our stakeholders (1) See Appendix for reconciliation of adjusted EPS to EPS.
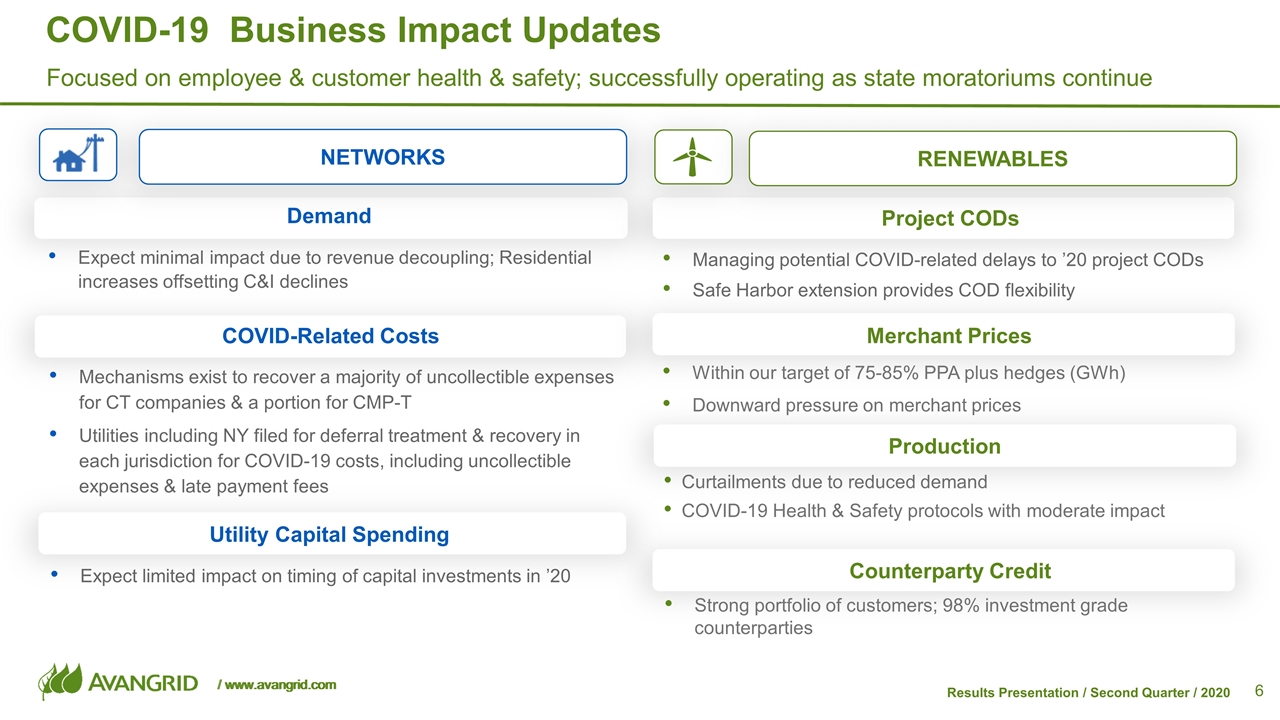
Curtailments due to reduced demand COVID-19 Health & Safety protocols with moderate impact COVID-19 Business Impact Updates Demand Mechanisms exist to recover a majority of uncollectible expenses for CT companies & a portion for CMP-T Utilities including NY filed for deferral treatment & recovery in each jurisdiction for COVID-19 costs, including uncollectible expenses & late payment fees COVID-Related Costs Expect limited impact on timing of capital investments in ’20 Expect minimal impact due to revenue decoupling; Residential increases offsetting C&I declines Utility Capital Spending Project CODs Merchant Prices Counterparty Credit Managing potential COVID-related delays to ’20 project CODs Safe Harbor extension provides COD flexibility Strong portfolio of customers; 98% investment grade counterparties Within our target of 75-85% PPA plus hedges (GWh) Downward pressure on merchant prices Focused on employee & customer health & safety; successfully operating as state moratoriums continue RENEWABLES NETWORKS Production
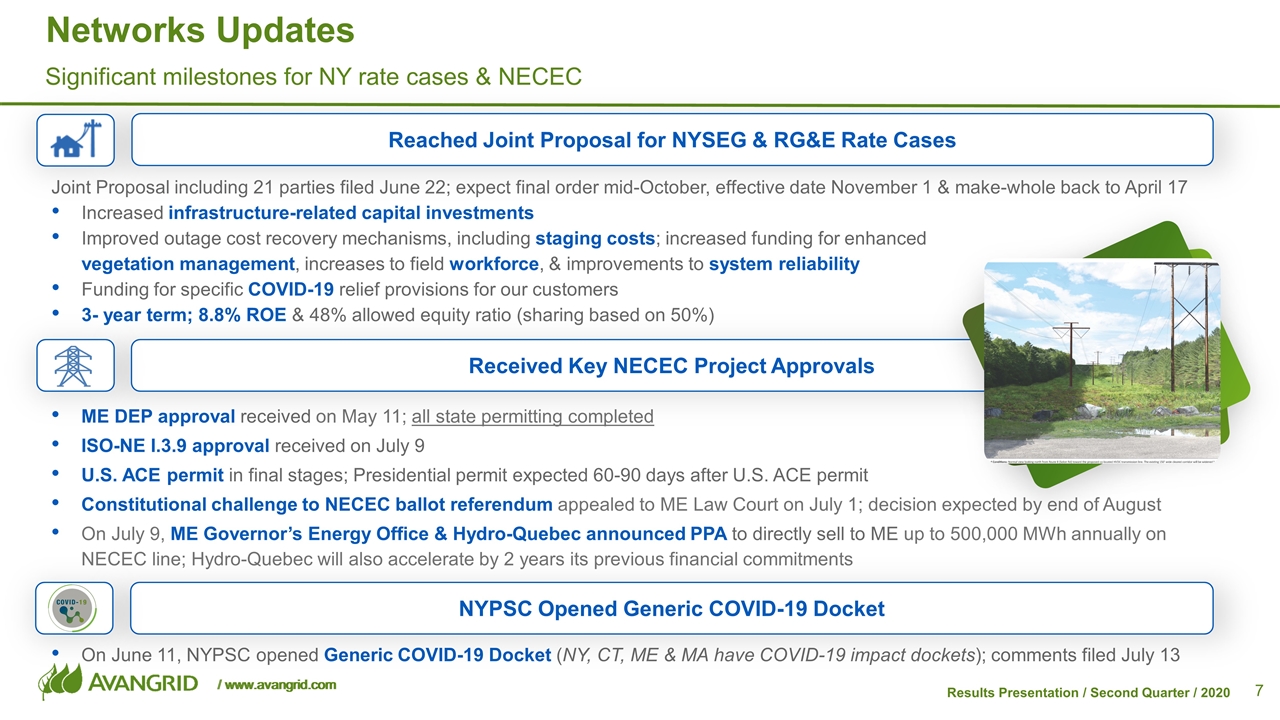
Networks Updates ME DEP approval received on May 11; all state permitting completed ISO-NE I.3.9 approval received on July 9 U.S. ACE permit in final stages; Presidential permit expected 60-90 days after U.S. ACE permit Constitutional challenge to NECEC ballot referendum appealed to ME Law Court on July 1; decision expected by end of August On July 9, ME Governor’s Energy Office & Hydro-Quebec announced PPA to directly sell to ME up to 500,000 MWh annually on NECEC line; Hydro-Quebec will also accelerate by 2 years its previous financial commitments On June 11, NYPSC opened Generic COVID-19 Docket (NY, CT, ME & MA have COVID-19 impact dockets); comments filed July 13 Significant milestones for NY rate cases & NECEC Received Key NECEC Project Approvals NYPSC Opened Generic COVID-19 Docket Reached Joint Proposal for NYSEG & RG&E Rate Cases Joint Proposal including 21 parties filed June 22; expect final order mid-October, effective date November 1 & make-whole back to April 17 Increased infrastructure-related capital investments Improved outage cost recovery mechanisms, including staging costs; increased funding for enhanced vegetation management, increases to field workforce, & improvements to system reliability Funding for specific COVID-19 relief provisions for our customers 3- year term; 8.8% ROE & 48% allowed equity ratio (sharing based on 50%)
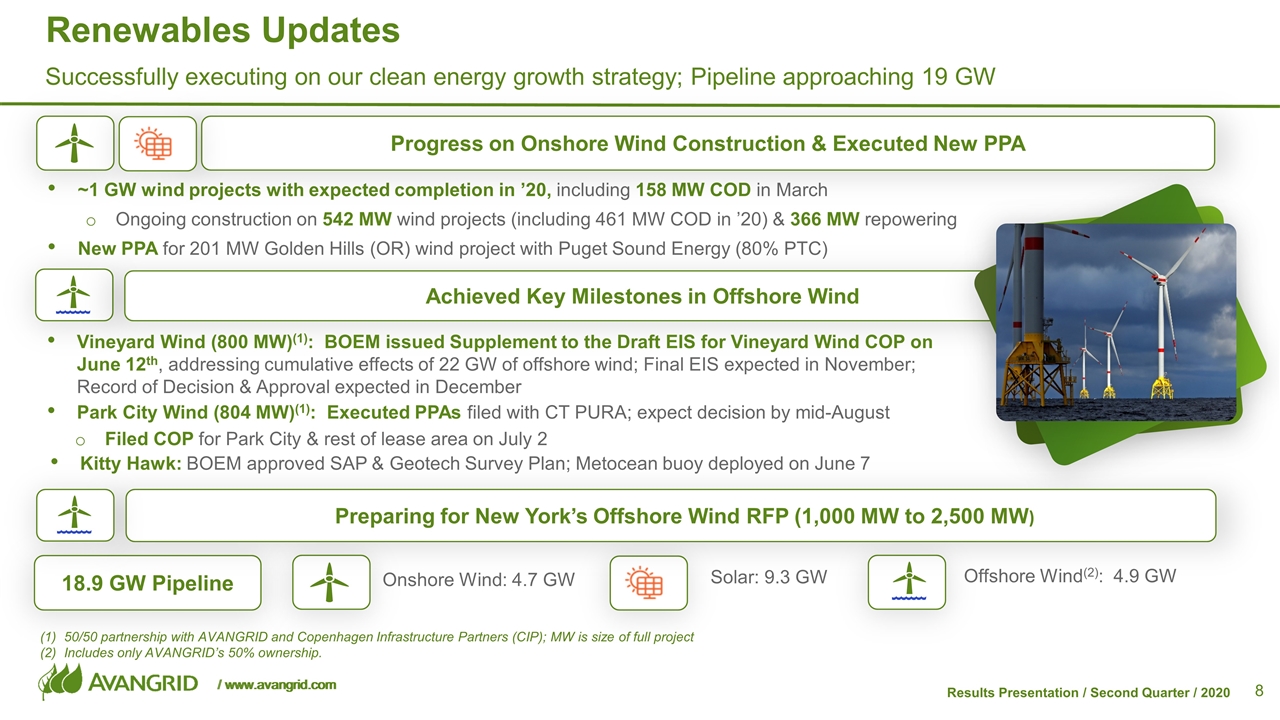
Renewables Updates ~1 GW wind projects with expected completion in ’20, including 158 MW COD in March Ongoing construction on 542 MW wind projects (including 461 MW COD in ’20) & 366 MW repowering New PPA for 201 MW Golden Hills (OR) wind project with Puget Sound Energy (80% PTC) Successfully executing on our clean energy growth strategy; Pipeline approaching 19 GW Progress on Onshore Wind Construction & Executed New PPA Achieved Key Milestones in Offshore Wind Vineyard Wind (800 MW)(1): BOEM issued Supplement to the Draft EIS for Vineyard Wind COP on June 12th, addressing cumulative effects of 22 GW of offshore wind; Final EIS expected in November; Record of Decision & Approval expected in December Park City Wind (804 MW)(1): Executed PPAs filed with CT PURA; expect decision by mid-August Filed COP for Park City & rest of lease area on July 2 Kitty Hawk: BOEM approved SAP & Geotech Survey Plan; Metocean buoy deployed on June 7 Onshore Wind: 4.7 GW 18.9 GW Pipeline Solar: 9.3 GW Offshore Wind(2): 4.9 GW Preparing for New York’s Offshore Wind RFP (1,000 MW to 2,500 MW) 50/50 partnership with AVANGRID and Copenhagen Infrastructure Partners (CIP); MW is size of full project Includes only AVANGRID’s 50% ownership.
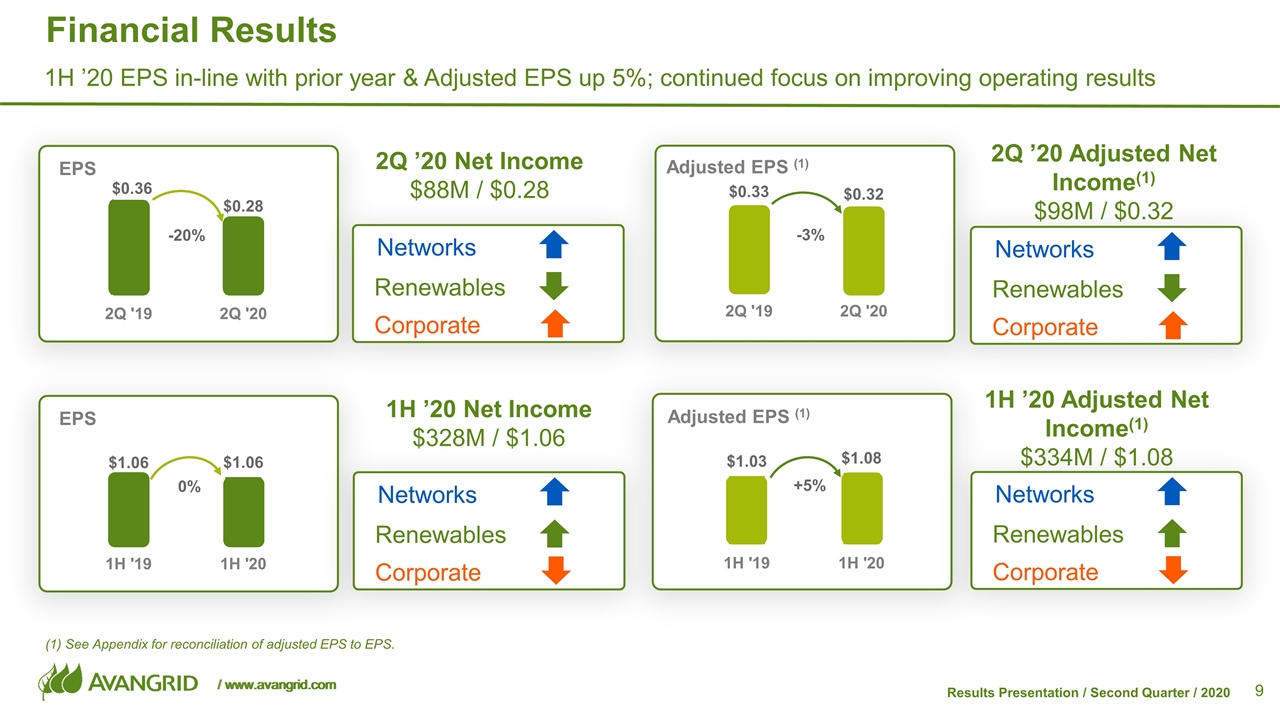
Financial Results 2Q ’20 Adjusted Net Income(1) $98M / $0.32 1H ’20 Adjusted Net Income(1) $334M / $1.08 -20% EPS -3% Adjusted EPS (1) (1) See Appendix for reconciliation of adjusted EPS to EPS. 0% EPS +5% Adjusted EPS (1) 1H ’20 EPS in-line with prior year & Adjusted EPS up 5%; continued focus on improving operating results Networks Corporate Renewables 2Q ’20 Net Income $88M / $0.28 Networks Corporate Renewables 1H ’20 Net Income $328M / $1.06 Networks Corporate Renewables Networks Corporate Renewables $0.36
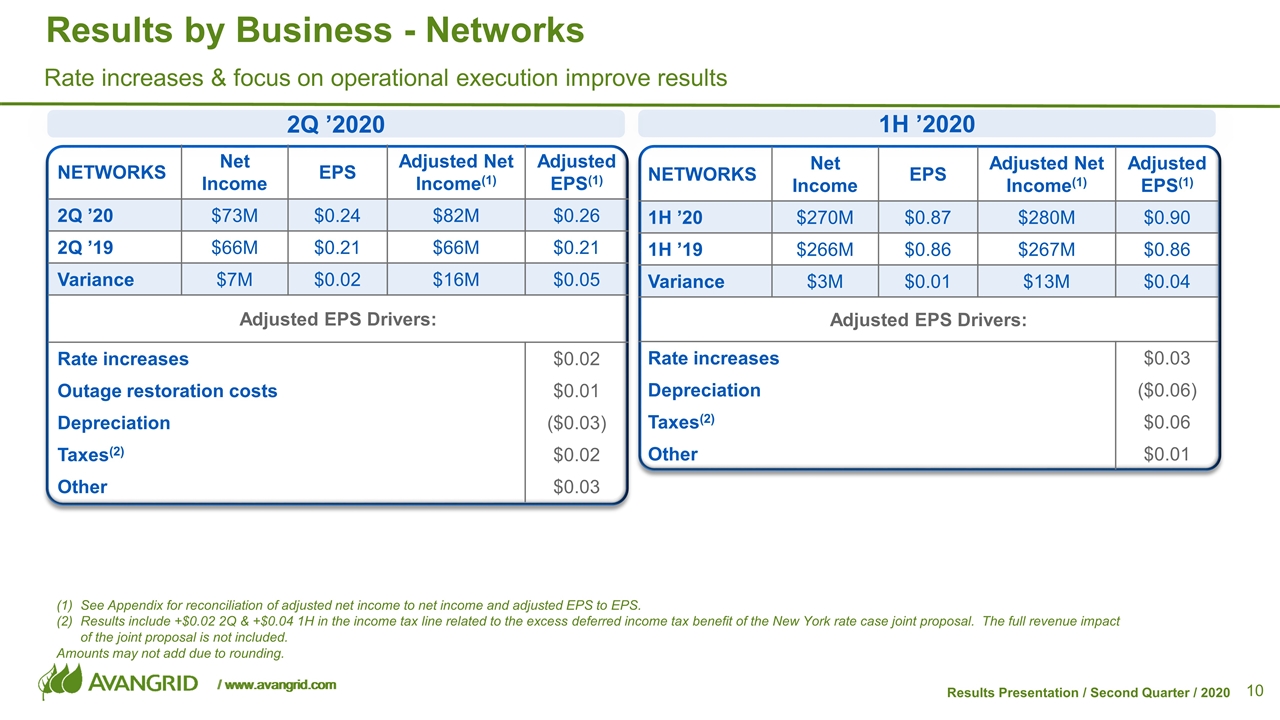
NETWORKS Net Income EPS EPS Adjusted Net Income(1) Adjusted EPS(1) 1H ’20 $270M $0.87 $0.xx $280M $0.90 1H ’19 $266M $0.86 $0.xx $267M $0.86 Variance $3M $0.01 $0.xx $13M $0.04 Adjusted EPS Drivers: Rate increases $0.03 Depreciation ($0.06) Taxes(2) $0.06 Other $0.01 NETWORKS Net Income EPS EPS Adjusted Net Income(1) Adjusted EPS(1) 2Q ’20 $73M $0.24 $0.xx $82M $0.26 2Q ’19 $66M $0.21 $0.xx $66M $0.21 Variance $7M $0.02 $0.xx $16M $0.05 Adjusted EPS Drivers: Rate increases $0.02 Outage restoration costs $0.01 Depreciation ($0.03) Taxes(2) $0.02 Other $0.03 Results by Business - Networks See Appendix for reconciliation of adjusted net income to net income and adjusted EPS to EPS. Results include +$0.02 2Q & +$0.04 1H in the income tax line related to the excess deferred income tax benefit of the New York rate case joint proposal. The full revenue impact of the joint proposal is not included. Amounts may not add due to rounding. 2Q ’2020 1H ’2020 Rate increases & focus on operational execution improve results
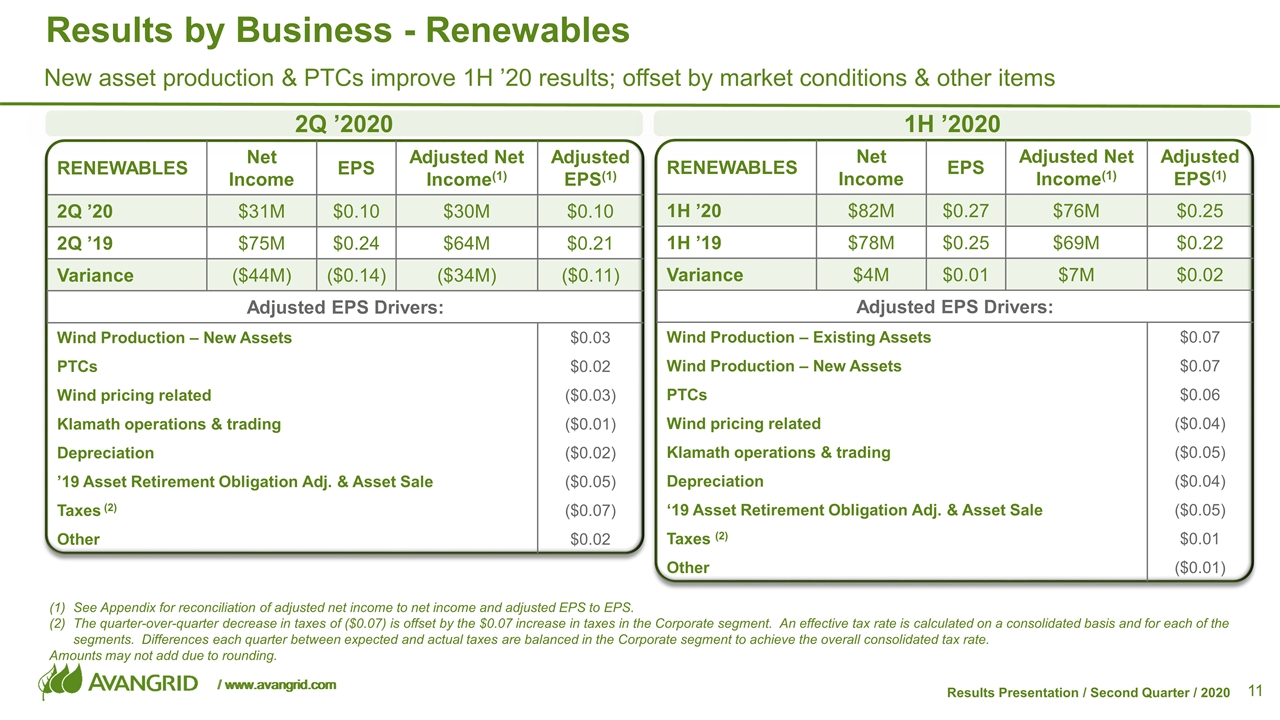
RENEWABLES Net Income EPS Adjusted Net Income(1) Adjusted EPS(1) 2Q ’20 $31M $0.10 $30M $0.10 2Q ’19 $75M $0.24 $64M $0.21 Variance ($44M) ($0.14) ($34M) ($0.11) Adjusted EPS Drivers: Wind Production – New Assets $0.03 PTCs $0.02 Wind pricing related ($0.03) Klamath operations & trading ($0.01) Depreciation ($0.02) ’19 Asset Retirement Obligation Adj. & Asset Sale ($0.05) Taxes (2) ($0.07) Other $0.02 RENEWABLES Net Income EPS Adjusted Net Income(1) Adjusted EPS(1) 1H ’20 $82M $0.27 $76M $0.25 1H ’19 $78M $0.25 $69M $0.22 Variance $4M $0.01 $7M $0.02 Adjusted EPS Drivers: Wind Production – Existing Assets $0.07 Wind Production – New Assets $0.07 PTCs $0.06 Wind pricing related ($0.04) Klamath operations & trading ($0.05) Depreciation ($0.04) ‘19 Asset Retirement Obligation Adj. & Asset Sale ($0.05) Taxes (2) $0.01 Other ($0.01) Results by Business - Renewables See Appendix for reconciliation of adjusted net income to net income and adjusted EPS to EPS. The quarter-over-quarter decrease in taxes of ($0.07) is offset by the $0.07 increase in taxes in the Corporate segment. An effective tax rate is calculated on a consolidated basis and for each of the segments. Differences each quarter between expected and actual taxes are balanced in the Corporate segment to achieve the overall consolidated tax rate. Amounts may not add due to rounding. 2Q ’2020 1H ’2020 New asset production & PTCs improve 1H ’20 results; offset by market conditions & other items
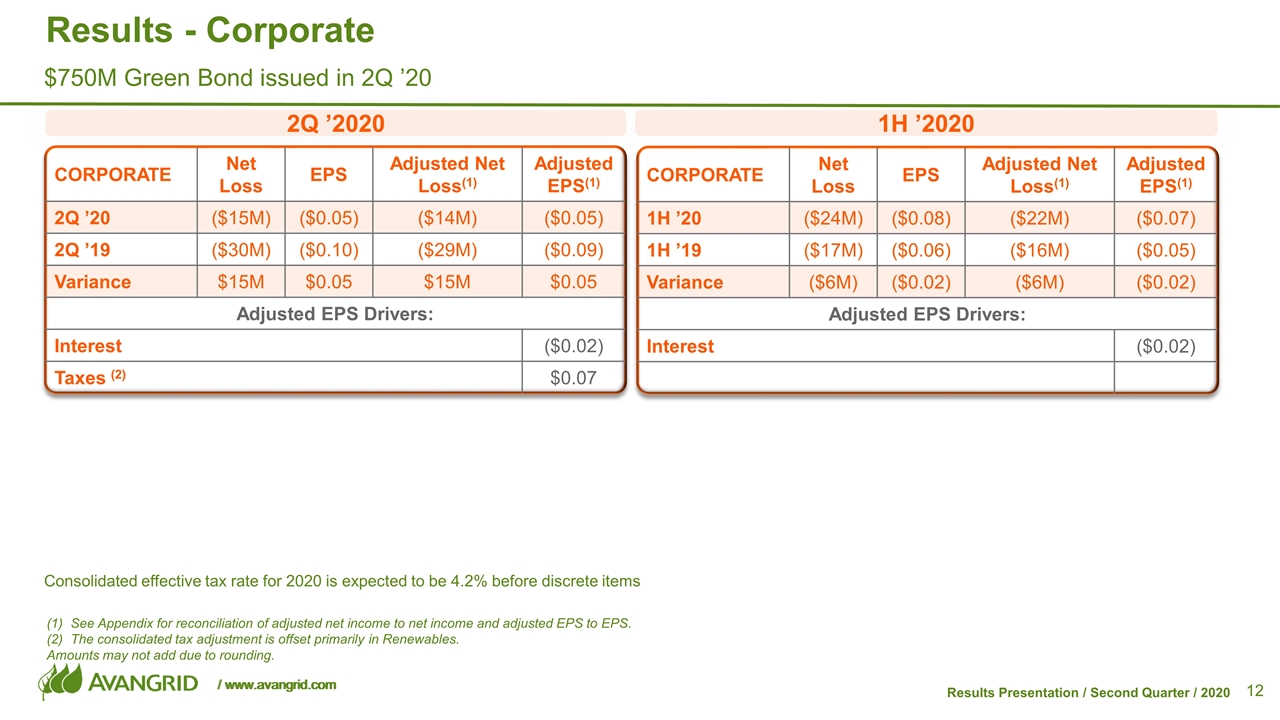
CORPORATE Net Loss EPS Adjusted Net Loss(1) Adjusted EPS(1) 2Q ’20 ($15M) ($0.05) ($14M) ($0.05) 2Q ’19 ($30M) ($0.10) ($29M) ($0.09) Variance $15M $0.05 $15M $0.05 Adjusted EPS Drivers: Interest ($0.02) Taxes (2) $0.07 CORPORATE Net Loss EPS Adjusted Net Loss(1) Adjusted EPS(1) 1H ’20 ($24M) ($0.08) ($22M) ($0.07) 1H ’19 ($17M) ($0.06) ($16M) ($0.05) Variance ($6M) ($0.02) ($6M) ($0.02) Adjusted EPS Drivers: Interest ($0.02) Results - Corporate See Appendix for reconciliation of adjusted net income to net income and adjusted EPS to EPS. The consolidated tax adjustment is offset primarily in Renewables. Amounts may not add due to rounding. 2Q ’2020 1H ’2020 $750M Green Bond issued in 2Q ’20 Consolidated effective tax rate for 2020 is expected to be 4.2% before discrete items
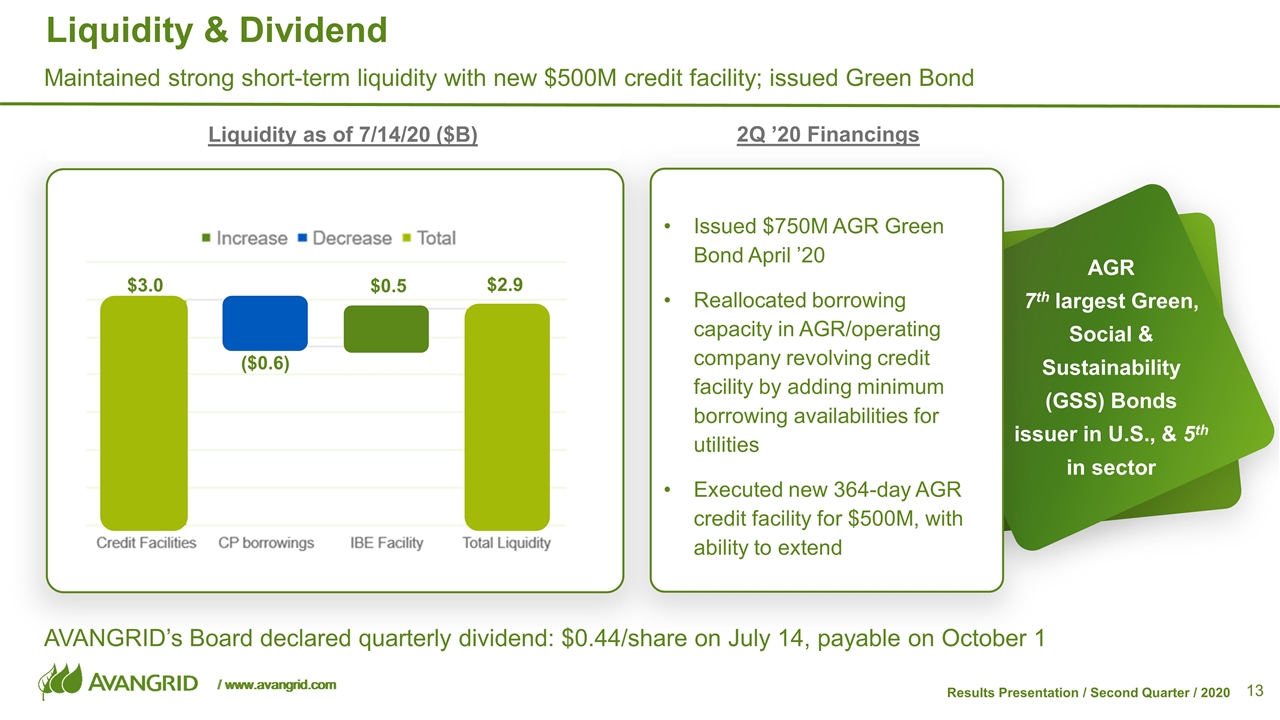
$3.0 $2.9 ($0.6) $0.5 Liquidity & Dividend Maintained strong short-term liquidity with new $500M credit facility; issued Green Bond Liquidity as of 7/14/20 ($B) AGR 7th largest Green, Social & Sustainability (GSS) Bonds issuer in U.S., & 5th in sector Issued $750M AGR Green Bond April ’20 Reallocated borrowing capacity in AGR/operating company revolving credit facility by adding minimum borrowing availabilities for utilities Executed new 364-day AGR credit facility for $500M, with ability to extend 2Q ’20 Financings AVANGRID’s Board declared quarterly dividend: $0.44/share on July 14, payable on October 1
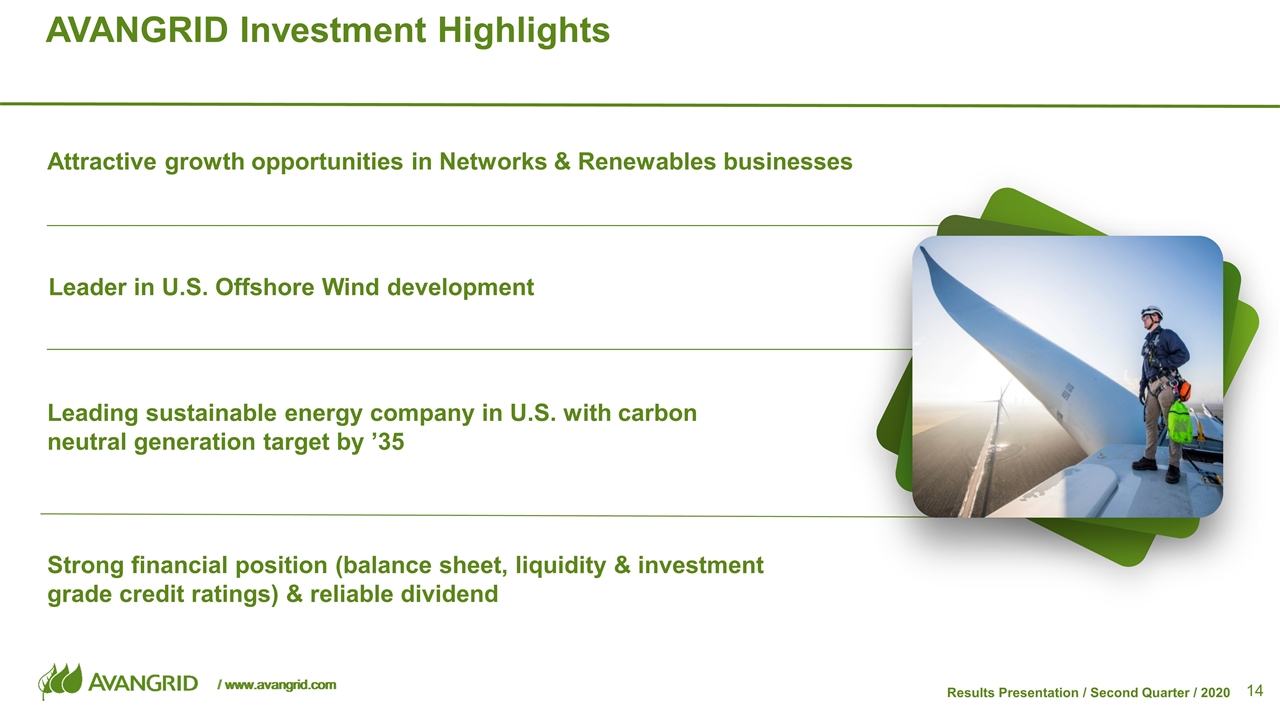
AVANGRID Investment Highlights Attractive growth opportunities in Networks & Renewables businesses Strong financial position (balance sheet, liquidity & investment grade credit ratings) & reliable dividend Leader in U.S. Offshore Wind development Leading sustainable energy company in U.S. with carbon neutral generation target by ’35

Appendix
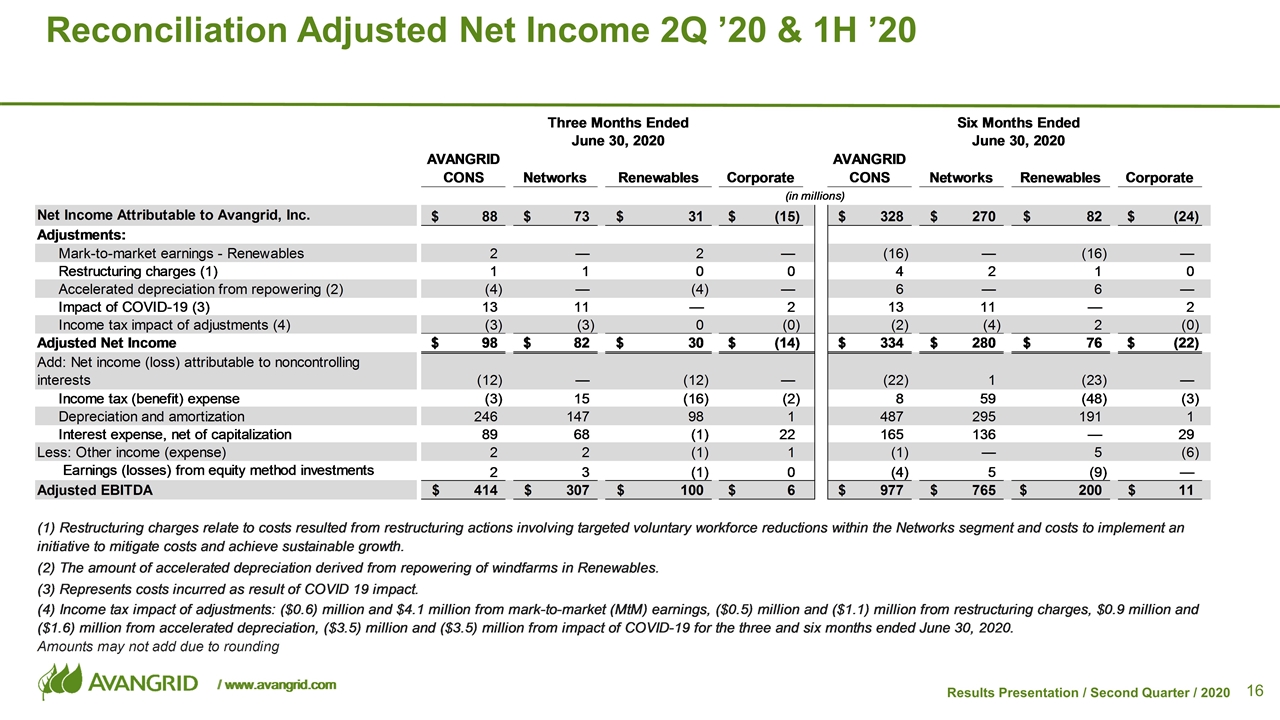
Reconciliation Adjusted Net Income 2Q ’20 & 1H ’20
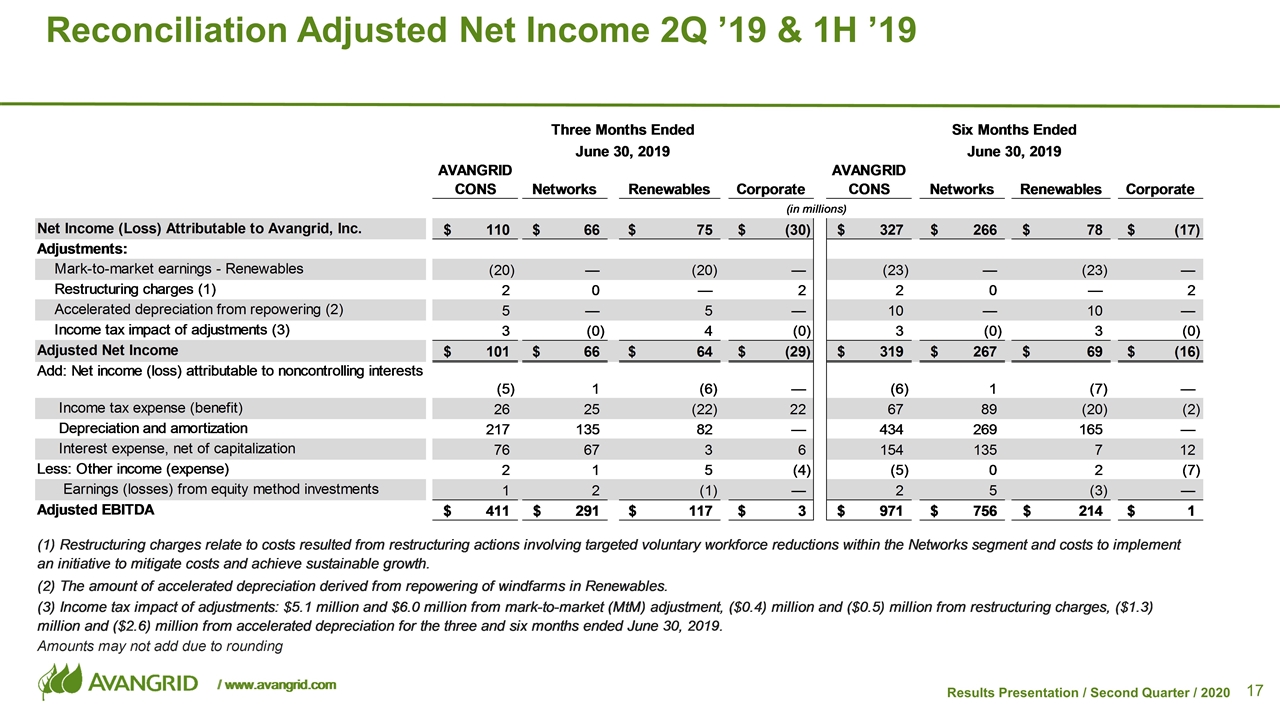
Reconciliation Adjusted Net Income 2Q ’19 & 1H ’19
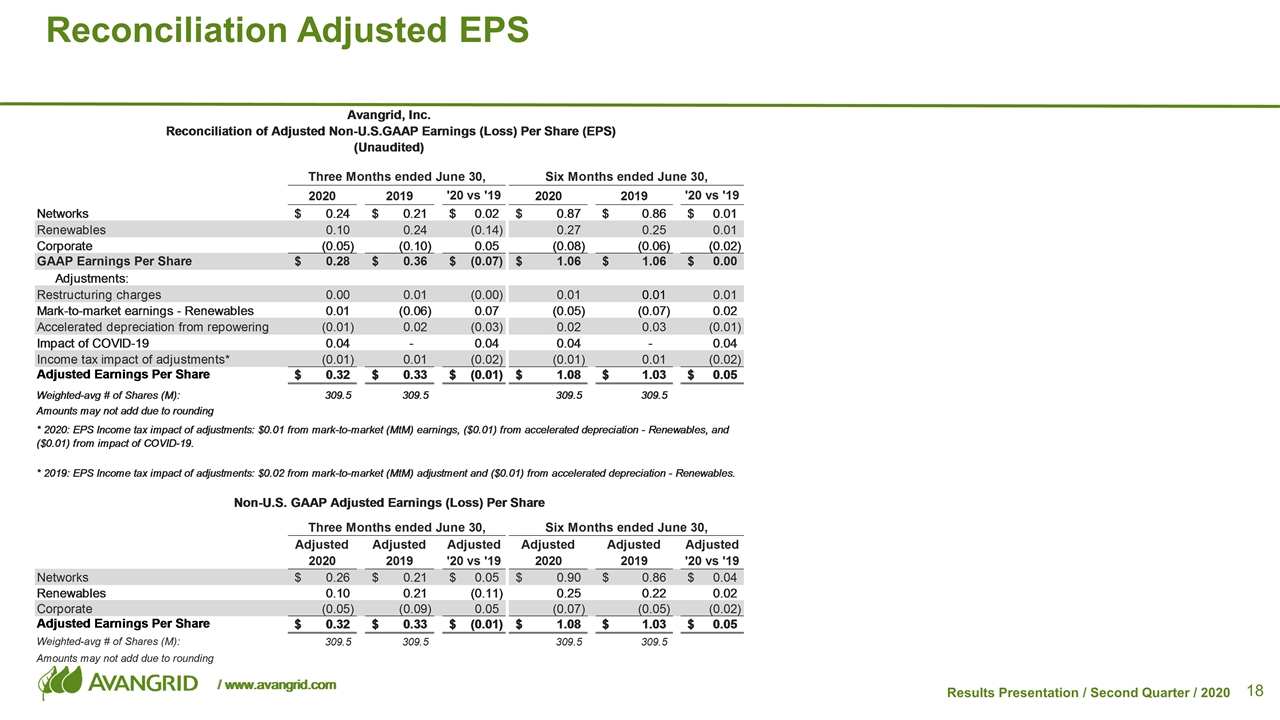
Reconciliation Adjusted EPS
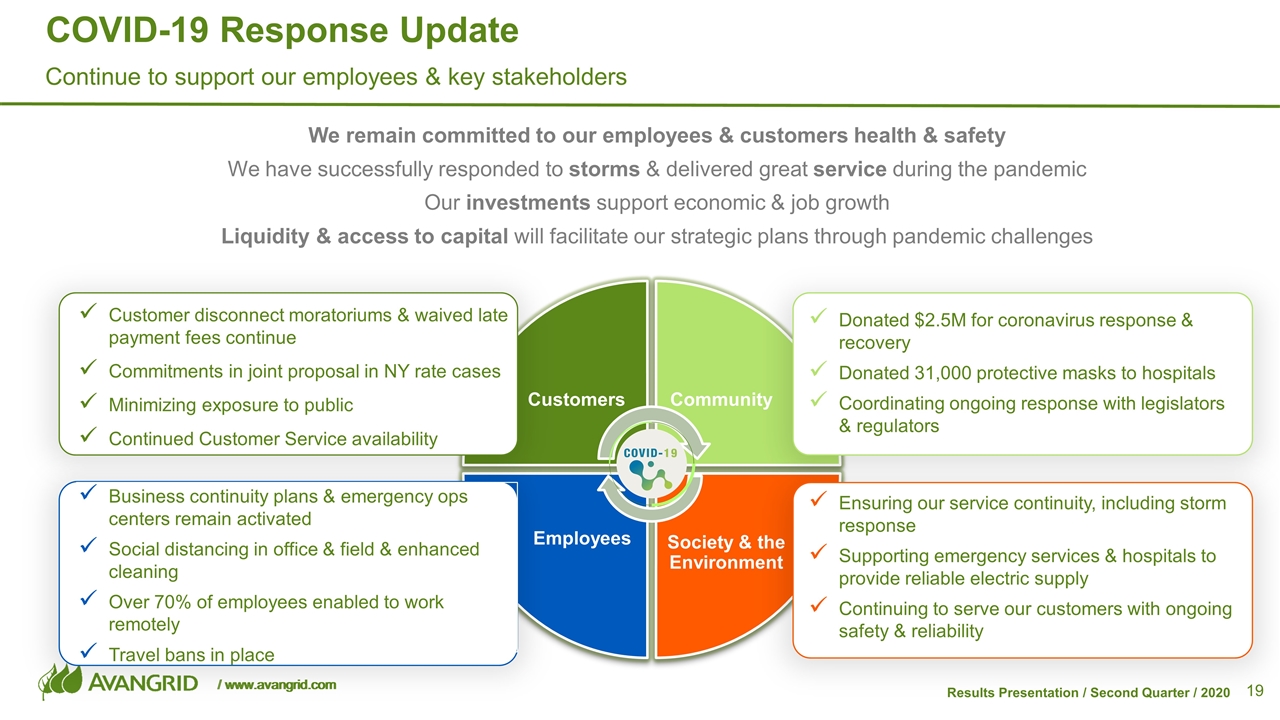
COVID-19 Response Update Customers Community Society & the Environment Employees Donated $2.5M for coronavirus response & recovery Donated 31,000 protective masks to hospitals Coordinating ongoing response with legislators & regulators Customer disconnect moratoriums & waived late payment fees continue Commitments in joint proposal in NY rate cases Minimizing exposure to public Continued Customer Service availability Business continuity plans & emergency ops centers remain activated Social distancing in office & field & enhanced cleaning Over 70% of employees enabled to work remotely Travel bans in place Ensuring our service continuity, including storm response Supporting emergency services & hospitals to provide reliable electric supply Continuing to serve our customers with ongoing safety & reliability Continue to support our employees & key stakeholders We remain committed to our employees & customers health & safety We have successfully responded to storms & delivered great service during the pandemic Our investments support economic & job growth Liquidity & access to capital will facilitate our strategic plans through pandemic challenges
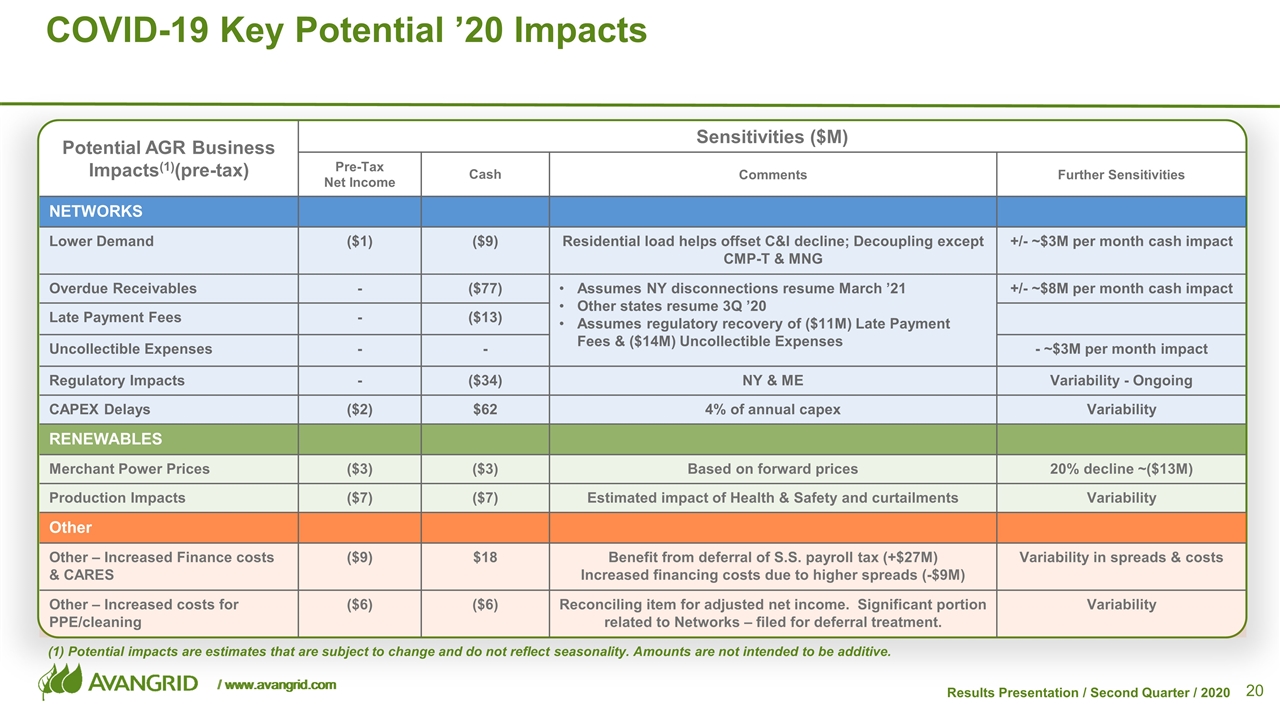
Potential AGR Business Impacts(1)(pre-tax) Sensitivities ($M) Pre-Tax Net Income Cash Comments Further Sensitivities NETWORKS Lower Demand ($1) ($9) Residential load helps offset C&I decline; Decoupling except CMP-T & MNG +/- ~$3M per month cash impact Overdue Receivables - ($77) Assumes NY disconnections resume March ’21 Other states resume 3Q ’20 Assumes regulatory recovery of ($11M) Late Payment Fees & ($14M) Uncollectible Expenses +/- ~$8M per month cash impact Late Payment Fees - ($13) Uncollectible Expenses - - - ~$3M per month impact Regulatory Impacts - ($34) NY & ME Variability - Ongoing CAPEX Delays ($2) $62 4% of annual capex Variability RENEWABLES Merchant Power Prices ($3) ($3) Based on forward prices 20% decline ~($13M) Production Impacts ($7) ($7) Estimated impact of Health & Safety and curtailments Variability Other Other – Increased Finance costs & CARES ($9) $18 Benefit from deferral of S.S. payroll tax (+$27M) Increased financing costs due to higher spreads (-$9M) Variability in spreads & costs Other – Increased costs for PPE/cleaning ($6) ($6) Reconciling item for adjusted net income. Significant portion related to Networks – filed for deferral treatment. Variability COVID-19 Key Potential ’20 Impacts (1) Potential impacts are estimates that are subject to change and do not reflect seasonality. Amounts are not intended to be additive.
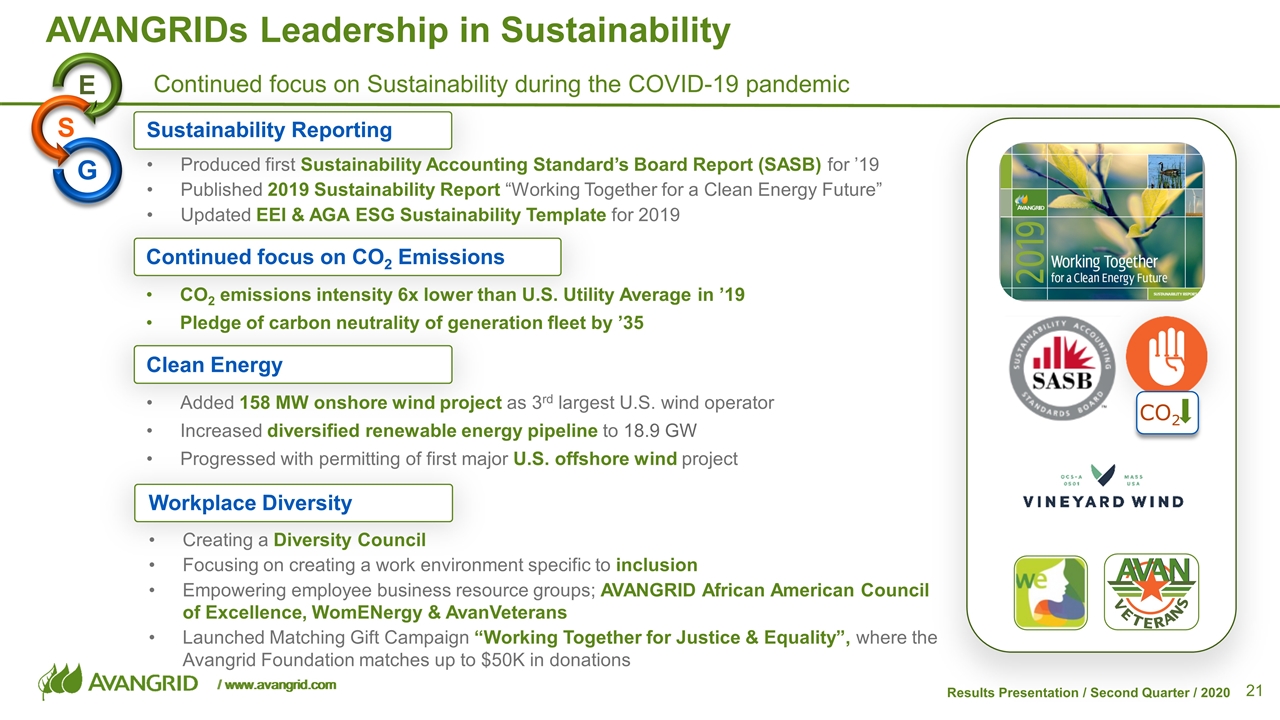
AVANGRIDs Leadership in Sustainability Continued focus on Sustainability during the COVID-19 pandemic S G E CO2 Continued focus on CO2 Emissions CO2 emissions intensity 6x lower than U.S. Utility Average in ’19 Pledge of carbon neutrality of generation fleet by ’35 Workplace Diversity Creating a Diversity Council Focusing on creating a work environment specific to inclusion Empowering employee business resource groups; AVANGRID African American Council of Excellence, WomENergy & AvanVeterans Launched Matching Gift Campaign “Working Together for Justice & Equality”, where the Avangrid Foundation matches up to $50K in donations Clean Energy Added 158 MW onshore wind project as 3rd largest U.S. wind operator Increased diversified renewable energy pipeline to 18.9 GW Progressed with permitting of first major U.S. offshore wind project Sustainability Reporting Produced first Sustainability Accounting Standard’s Board Report (SASB) for ’19 Published 2019 Sustainability Report “Working Together for a Clean Energy Future” Updated EEI & AGA ESG Sustainability Template for 2019


