Results Presentation Third Quarter October 21, 2020 Exhibit 99.1
Legal Notice FORWARD LOOKING STATEMENTS Certain statements in this presentation may relate to our future business and financial performance and future events or developments involving us and our subsidiaries that are not purely historical and may constitute “forward-looking statements” within the meaning of the Private Securities Litigation Reform Act of 1995. Forward-looking statements may be identified by the use of forward-looking terms such as “may,” “will,” “should,” “would,” “could,” “can,” “expect(s),” “believe(s),” “anticipate(s),” “intend(s),” “plan(s),” “estimate(s),” “project(s),” “assume(s),” “guide(s),” “target(s),” “forecast(s),” “are (is) confident that” and “seek(s)” or the negative of such terms or other variations on such terms or comparable terminology. Such forward-looking statements include, but are not limited to, statements about our plans, objectives and intentions, outlooks or expectations for earnings, revenues, expenses or other future financial or business performance, strategies or expectations, or the impact of legal or regulatory matters on business, results of operations or financial condition of the business and other statements that are not historical facts. Such statements are based upon the current reasonable beliefs, expectations, and assumptions of our management and are subject to significant risks and uncertainties that could cause actual outcomes and results to differ materially. Important factors are discussed and should be reviewed in our Form 10-K and other subsequent filings with the SEC. Specifically, forward-looking statements include, without limitation: the future financial performance, anticipated liquidity and capital expenditures, actions or inactions of local, state or federal regulatory agencies, success in retaining or recruiting our officers, key employees or directors, changes in levels or timing of capital expenditures, adverse developments in general market, business, economic, labor, regulatory and political conditions, fluctuations in weather patterns, technological developments, the impact of any cyber breaches or other incidents, grid disturbances, acts of war or terrorism, civil or social unrest, natural disasters, pandemic health events or other similar occurrences, the impact of any change to applicable laws and regulations affecting operations, including those relating to the environment and climate change, taxes, price controls, regulatory approval and permitting, the implementation of changes in accounting standards; and other presently unknown unforeseen factors. Should one or more of these risks or uncertainties materialize, or should any of the underlying assumptions prove incorrect, actual results may vary in material respects from those expressed or implied by these forward-looking statements. You should not place undue reliance on these forward-looking statements. We do not undertake any obligation to update or revise any forward-looking statements to reflect events or circumstances after the date of this report, whether as a result of new information, future events or otherwise, except as may be required under applicable securities laws. Other risk factors are detailed from time to time in our reports filed with the SEC, and we encourage you to consult such disclosures. About AVANGRID: AVANGRID, Inc. (NYSE: AGR) is a leading, sustainable energy company with approximately $36 billion in assets and operations in 24 U.S. states. With headquarters in Orange, Connecticut, AVANGRID has two primary lines of business: Avangrid Networks and Avangrid Renewables. Avangrid Networks owns eight electric and natural gas utilities, serving more than 3.3 million customers in New York and New England. Avangrid Renewables owns and operates a portfolio of renewable energy generation facilities across the United States. AVANGRID employs approximately 6,600 people. AVANGRID supports the U.N.’s Sustainable Development Goals and was named among the World’s Most Ethical Companies in 2019 and 2020 by the Ethisphere Institute. For more information, visit www.avangrid.com.
Legal Notice Use of Non-U.S. GAAP Financial Measures To supplement our consolidated financial statements presented in accordance with generally accepted accounting principles in the United States (“GAAP”), we consider adjusted net income and adjusted earnings per share as non-GAAP financial measures that are not prepared in accordance with GAAP. The non-GAAP financial measures we use are specific to AVANGRID and the non-GAAP financial measures of other companies may not be calculated in the same manner. We use these non-GAAP financial measures, in addition to GAAP measures, to establish operating budgets and operational goals to manage and monitor our business, evaluate our operating and financial performance and to compare such performance to prior periods and to the performance of our competitors. We believe that presenting such non-GAAP financial measures is useful because such measures can be used to analyze and compare profitability between companies and industries by eliminating the impact of certain non-cash charges. In addition, we present non-GAAP financial measures because we believe that they and other similar measures are widely used by certain investors, securities analysts and other interested parties as supplemental measures of performance. We define adjusted net income as net income adjusted to exclude restructuring charges, mark-to-market earnings from changes in the fair value of derivative instruments used by AVANGRID to economically hedge market price fluctuations in related underlying physical transactions for the purchase and sale of electricity, accelerated depreciation derived from repowering of wind farms, and the impact of the global coronavirus (COVID-19) pandemic. We believe adjusted net income is more useful in understanding and evaluating actual and projected financial performance and contribution of AVANGRID core lines of business and to more fully compare and explain our results. The most directly comparable GAAP measure to adjusted net income is net income. We also define adjusted earnings per share, or adjusted EPS, as adjusted net income converted to an earnings per share amount. The use of non-GAAP financial measures is not intended to be considered in isolation or as a substitute for, or superior to, AVANGRID’s GAAP financial information, and investors are cautioned that the non-GAAP financial measures are limited in their usefulness, may be unique to AVANGRID, and should be considered only as a supplement to AVANGRID’s GAAP financial measures. The non-GAAP financial measures may not be comparable to other similarly titled measures of other companies and have limitations as analytical tools. Non-GAAP financial measures are not primary measurements of our performance under GAAP and should not be considered as alternatives to operating income, net income or any other performance measures determined in accordance with GAAP. We use the following non-GAAP metrics in our presentation, which are reconciled to their closest GAAP financial measure in the Appendix: Adjusted net income and adjusted EPS. Investors and others should note that AVANGRID routinely posts important information on its website and considers the Investor Relations section, www.avangrid.com/wps/portal/avangrid/Investors,a channel of distribution.

3Q ’20 Highlights Dennis Arriola AVANGRID CEO
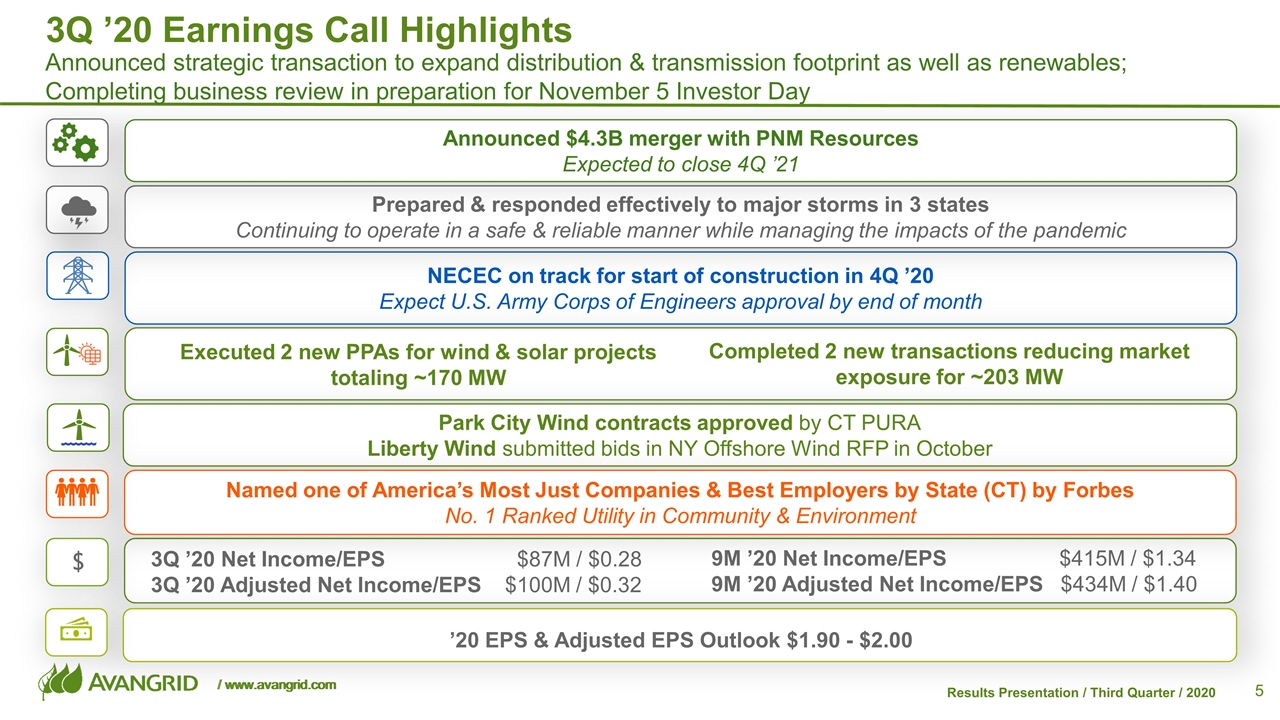
3Q ’20 Earnings Call Highlights Announced strategic transaction to expand distribution & transmission footprint as well as renewables; Completing business review in preparation for November 5 Investor Day NECEC on track for start of construction in 4Q ’20 Expect U.S. Army Corps of Engineers approval by end of month Park City Wind contracts approved by CT PURA Liberty Wind submitted bids in NY Offshore Wind RFP in October 3Q ’20 Net Income/EPS $87M / $0.28 3Q ’20 Adjusted Net Income/EPS $100M / $0.32 9M ’20 Net Income/EPS $415M / $1.34 9M ’20 Adjusted Net Income/EPS $434M / $1.40 Prepared & responded effectively to major storms in 3 states Continuing to operate in a safe & reliable manner while managing the impacts of the pandemic Named one of America’s Most Just Companies & Best Employers by State (CT) by Forbes No. 1 Ranked Utility in Community & Environment ’20 EPS & Adjusted EPS Outlook $1.90 - $2.00 Executed 2 new PPAs for wind & solar projects totaling ~170 MW Completed 2 new transactions reducing market exposure for ~203 MW $ Announced $4.3B merger with PNM Resources Expected to close 4Q ’21
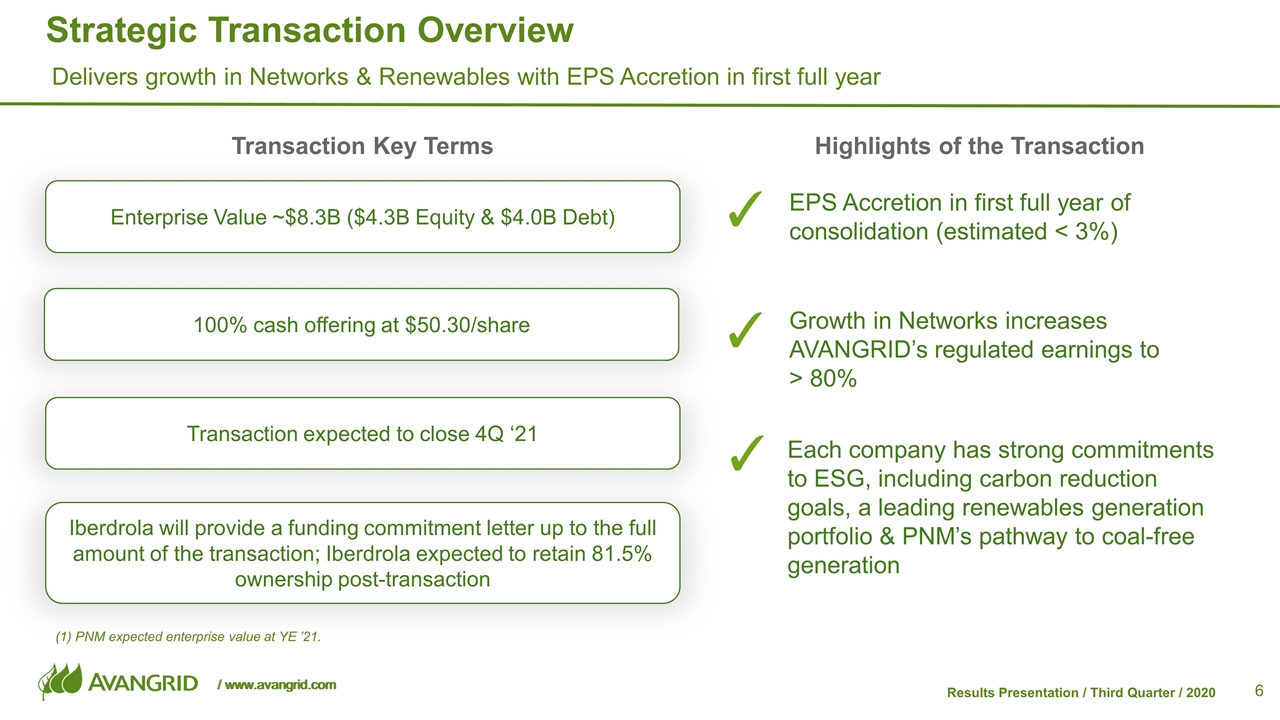
Strategic Transaction Overview Delivers growth in Networks & Renewables with EPS Accretion in first full year ✓ Highlights of the Transaction Growth in Networks increases AVANGRID’s regulated earnings to > 80% EPS Accretion in first full year of consolidation (estimated < 3%) Transaction Key Terms Each company has strong commitments to ESG, including carbon reduction goals, a leading renewables generation portfolio & PNM’s pathway to coal-free generation Enterprise Value ~$8.3B ($4.3B Equity & $4.0B Debt) 100% cash offering at $50.30/share Transaction expected to close 4Q ‘21 ✓ ✓ Iberdrola will provide a funding commitment letter up to the full amount of the transaction; Iberdrola expected to retain 81.5% ownership post-transaction (1) PNM expected enterprise value at YE ’21.
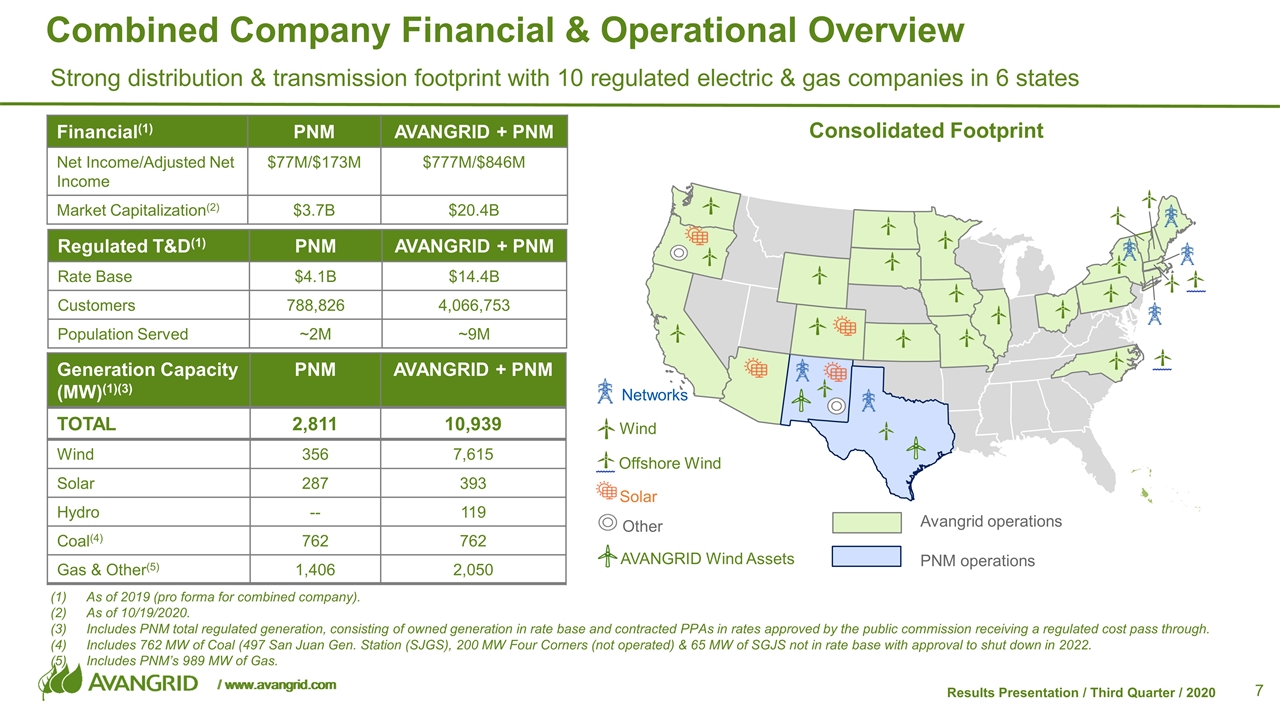
Combined Company Financial & Operational Overview Avangrid operations PNM operations AVANGRID Wind Assets Solar Other Offshore Wind Networks Wind Consolidated Footprint Regulated T&D(1) PNM AVANGRID + PNM Rate Base $4.1B $14.4B Customers 788,826 4,066,753 Population Served ~2M ~9M Generation Capacity (MW)(1)(3) PNM AVANGRID + PNM TOTAL 2,811 10,939 Wind 356 7,615 Solar 287 393 Hydro -- 119 Coal(4) 762 762 Gas & Other(5) 1,406 2,050 As of 2019 (pro forma for combined company). As of 10/19/2020. Includes PNM total regulated generation, consisting of owned generation in rate base and contracted PPAs in rates approved by the public commission receiving a regulated cost pass through. Includes 762 MW of Coal (497 San Juan Gen. Station (SJGS), 200 MW Four Corners (not operated) & 65 MW of SGJS not in rate base with approval to shut down in 2022. Includes PNM’s 989 MW of Gas. Strong distribution & transmission footprint with 10 regulated electric & gas companies in 6 states Financial(1) PNM AVANGRID + PNM Net Income/Adjusted Net Income $77M/$173M $777M/$846M Market Capitalization(2) $3.7B $20.4B
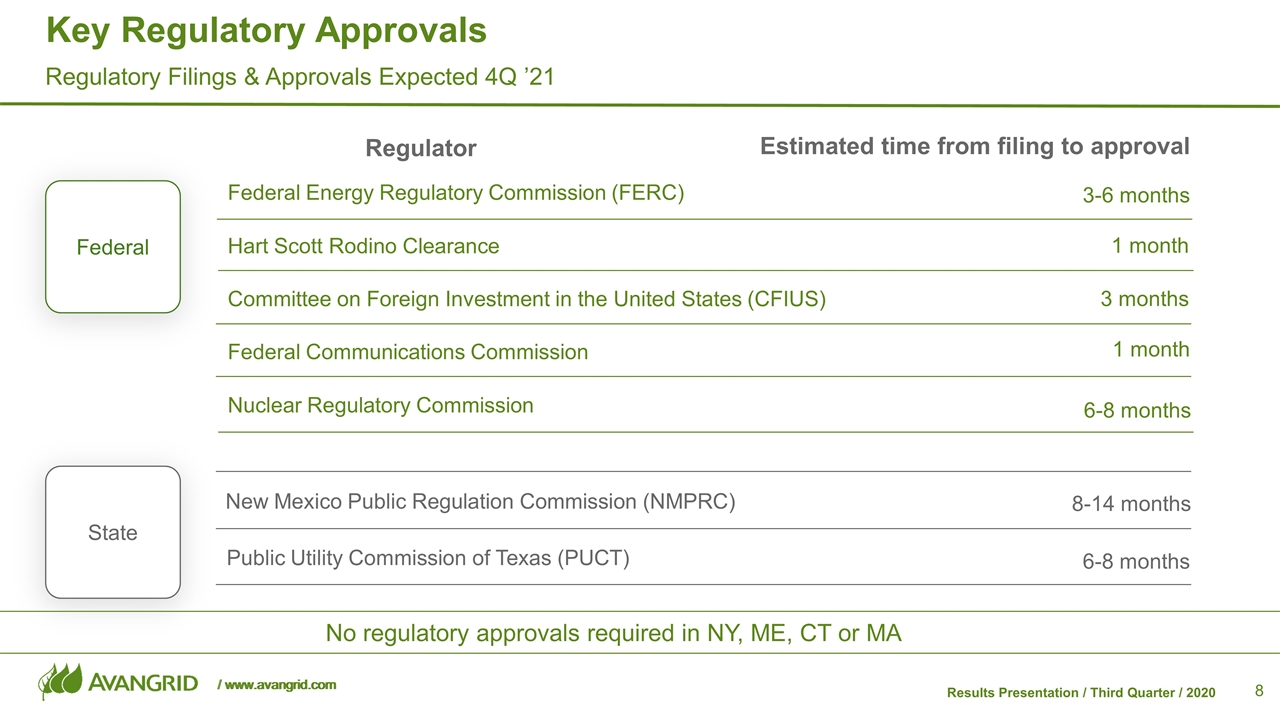
Key Regulatory Approvals Regulatory Filings & Approvals Expected 4Q ’21 Regulator Federal State Federal Energy Regulatory Commission (FERC) Hart Scott Rodino Clearance Committee on Foreign Investment in the United States (CFIUS) Federal Communications Commission Nuclear Regulatory Commission New Mexico Public Regulation Commission (NMPRC) Public Utility Commission of Texas (PUCT) No regulatory approvals required in NY, ME, CT or MA Estimated time from filing to approval 3-6 months 1 month 6-8 months 8-14 months 3 months 1 month 6-8 months

3Q ’20 Financial Results Doug Stuver AVANGRID CFO
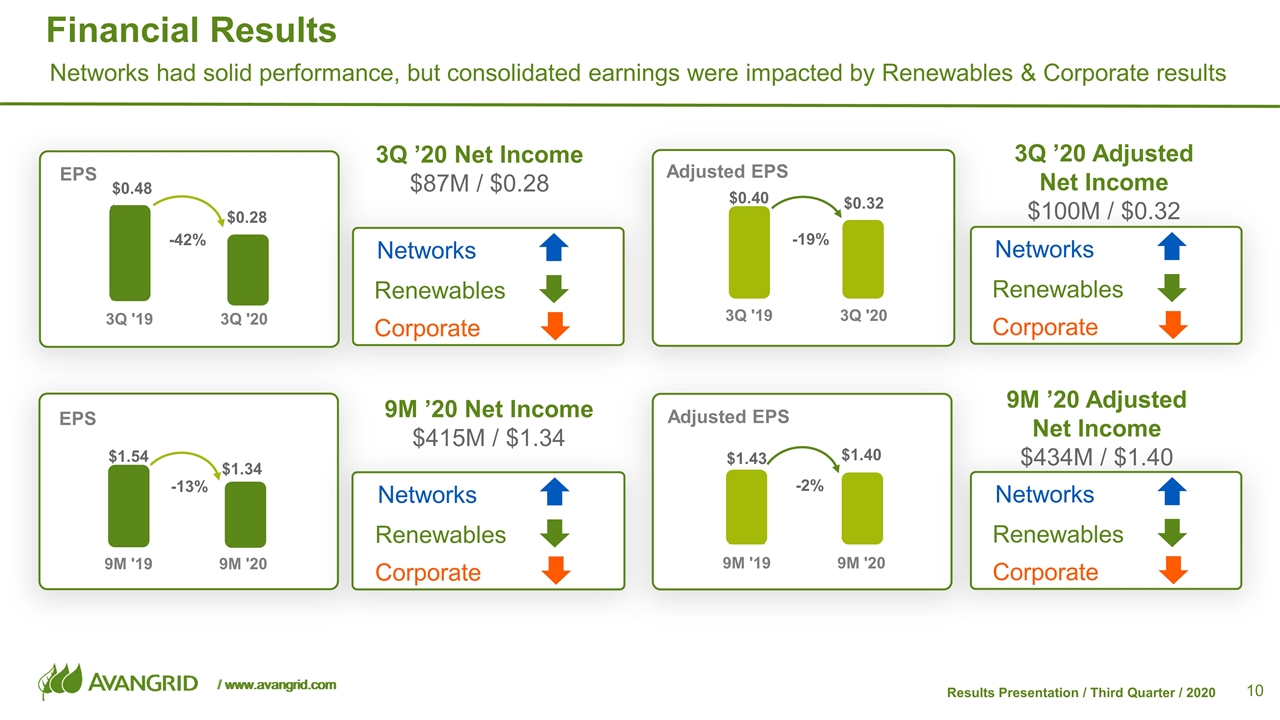
-2% Adjusted EPS Financial Results 3Q ’20 Adjusted Net Income $100M / $0.32 9M ’20 Adjusted Net Income $434M / $1.40 -42% EPS -19% Adjusted EPS -13% EPS Networks had solid performance, but consolidated earnings were impacted by Renewables & Corporate results Networks Corporate Renewables 3Q ’20 Net Income $87M / $0.28 Networks Corporate Renewables 9M ’20 Net Income $415M / $1.34 Networks Corporate Renewables Networks Corporate Renewables $0.48
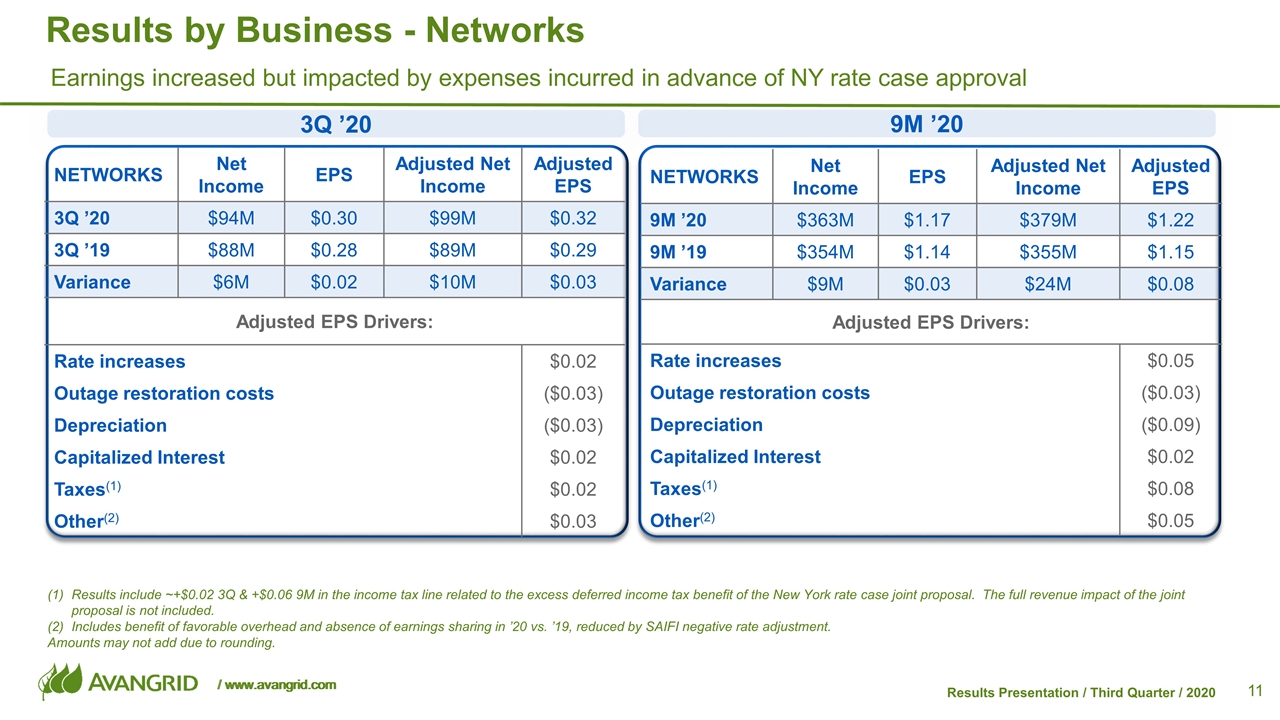
NETWORKS Net Income EPS Adjusted Net Income Adjusted EPS 9M ’20 $363M $1.17 $379M $1.22 9M ’19 $354M $1.14 $355M $1.15 Variance $9M $0.03 $24M $0.08 Adjusted EPS Drivers: Rate increases $0.05 Outage restoration costs ($0.03) Depreciation ($0.09) Capitalized Interest $0.02 Taxes(1) $0.08 Other(2) $0.05 NETWORKS Net Income EPS Adjusted Net Income Adjusted EPS 3Q ’20 $94M $0.30 $99M $0.32 3Q ’19 $88M $0.28 $89M $0.29 Variance $6M $0.02 $10M $0.03 Adjusted EPS Drivers: Rate increases $0.02 Outage restoration costs ($0.03) Depreciation ($0.03) Capitalized Interest $0.02 Taxes(1) $0.02 Other(2) $0.03 Results by Business - Networks Results include ~+$0.02 3Q & +$0.06 9M in the income tax line related to the excess deferred income tax benefit of the New York rate case joint proposal. The full revenue impact of the joint proposal is not included. Includes benefit of favorable overhead and absence of earnings sharing in ’20 vs. ’19, reduced by SAIFI negative rate adjustment. Amounts may not add due to rounding. 3Q ’20 9M ’20 Earnings increased but impacted by expenses incurred in advance of NY rate case approval
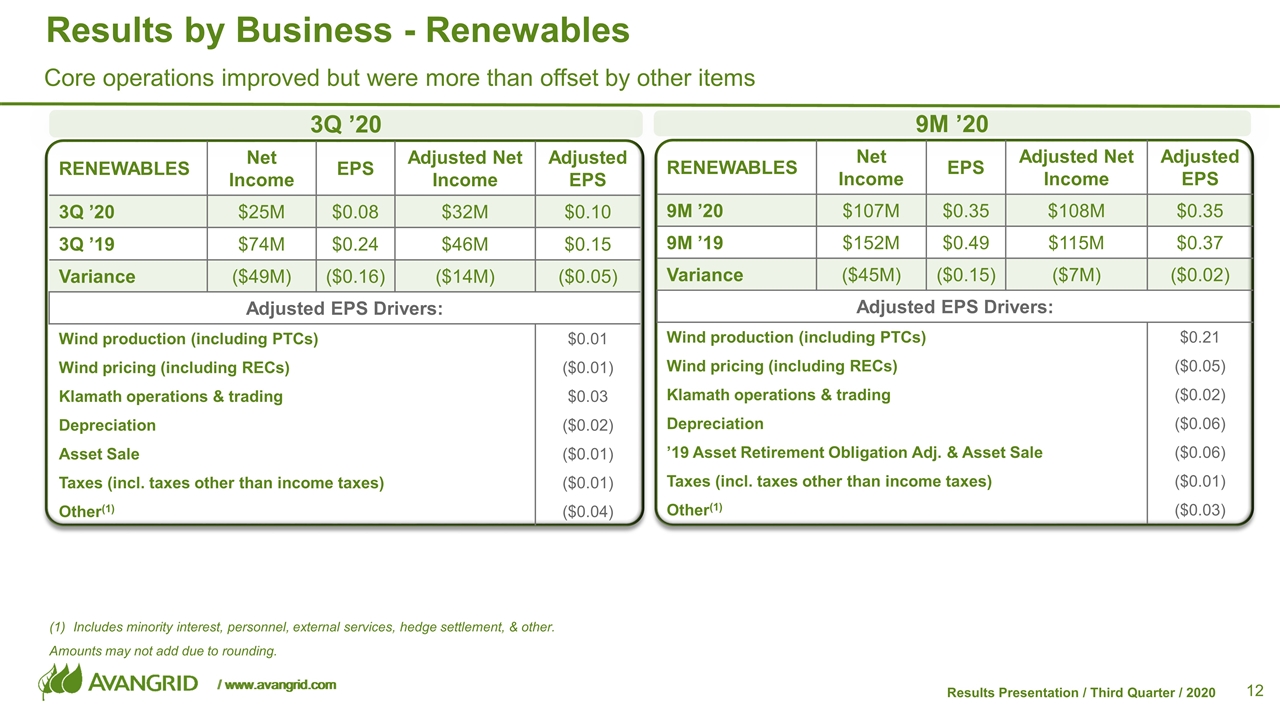
RENEWABLES Net Income EPS Adjusted Net Income Adjusted EPS 3Q ’20 $25M $0.08 $32M $0.10 3Q ’19 $74M $0.24 $46M $0.15 Variance ($49M) ($0.16) ($14M) ($0.05) Adjusted EPS Drivers: Wind production (including PTCs) $0.01 Wind pricing (including RECs) ($0.01) Klamath operations & trading $0.03 Depreciation ($0.02) Asset Sale ($0.01) Taxes (incl. taxes other than income taxes) ($0.01) Other(1) ($0.04) RENEWABLES Net Income EPS Adjusted Net Income Adjusted EPS 9M ’20 $107M $0.35 $108M $0.35 9M ’19 $152M $0.49 $115M $0.37 Variance ($45M) ($0.15) ($7M) ($0.02) Adjusted EPS Drivers: Wind production (including PTCs) $0.21 Wind pricing (including RECs) ($0.05) Klamath operations & trading ($0.02) Depreciation ($0.06) ’19 Asset Retirement Obligation Adj. & Asset Sale ($0.06) Taxes (incl. taxes other than income taxes) ($0.01) Other(1) ($0.03) Results by Business - Renewables Includes minority interest, personnel, external services, hedge settlement, & other. Amounts may not add due to rounding. 9M ’20 Core operations improved but were more than offset by other items 3Q ’20
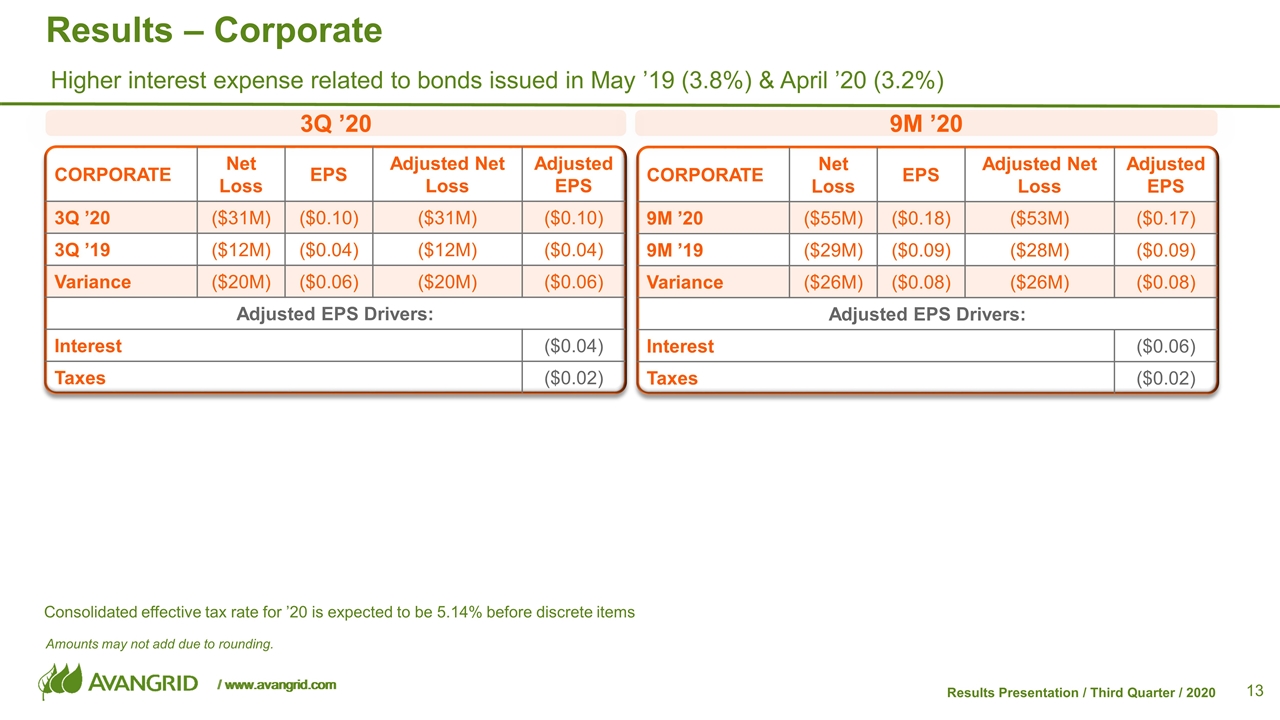
CORPORATE Net Loss EPS Adjusted Net Loss Adjusted EPS 3Q ’20 ($31M) ($0.10) ($31M) ($0.10) 3Q ’19 ($12M) ($0.04) ($12M) ($0.04) Variance ($20M) ($0.06) ($20M) ($0.06) Adjusted EPS Drivers: Interest ($0.04) Taxes ($0.02) CORPORATE Net Loss EPS Adjusted Net Loss Adjusted EPS 9M ’20 ($55M) ($0.18) ($53M) ($0.17) 9M ’19 ($29M) ($0.09) ($28M) ($0.09) Variance ($26M) ($0.08) ($26M) ($0.08) Adjusted EPS Drivers: Interest ($0.06) Taxes ($0.02) Results – Corporate Amounts may not add due to rounding. 3Q ’20 9M ’20 Consolidated effective tax rate for ’20 is expected to be 5.14% before discrete items Higher interest expense related to bonds issued in May ’19 (3.8%) & April ’20 (3.2%)
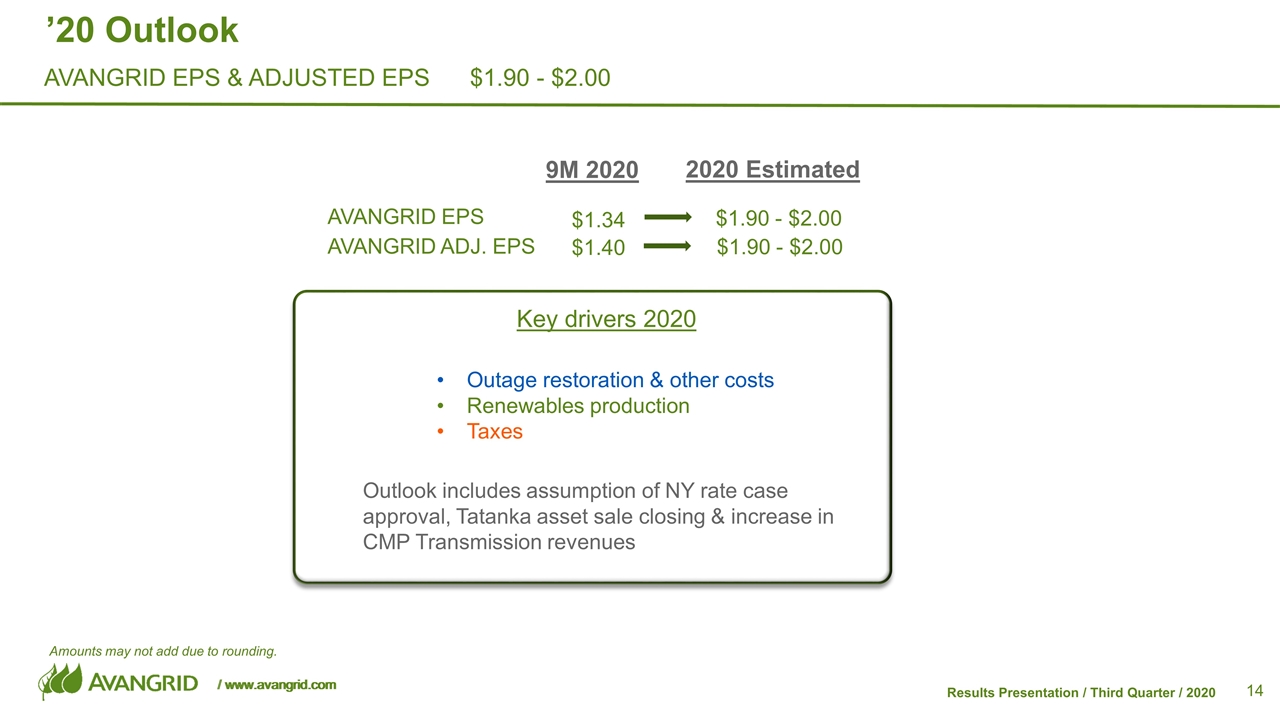
’20 Outlook Amounts may not add due to rounding. AVANGRID EPS & ADJUSTED EPS $1.90 - $2.00 + 9M 2020 AVANGRID EPS AVANGRID ADJ. EPS $1.34 $1.40 $1.90 - $2.00 $1.90 - $2.00 2020 Estimated Outage restoration & other costs Renewables production Taxes Outlook includes assumption of NY rate case approval, Tatanka asset sale closing & increase in CMP Transmission revenues Key drivers 2020
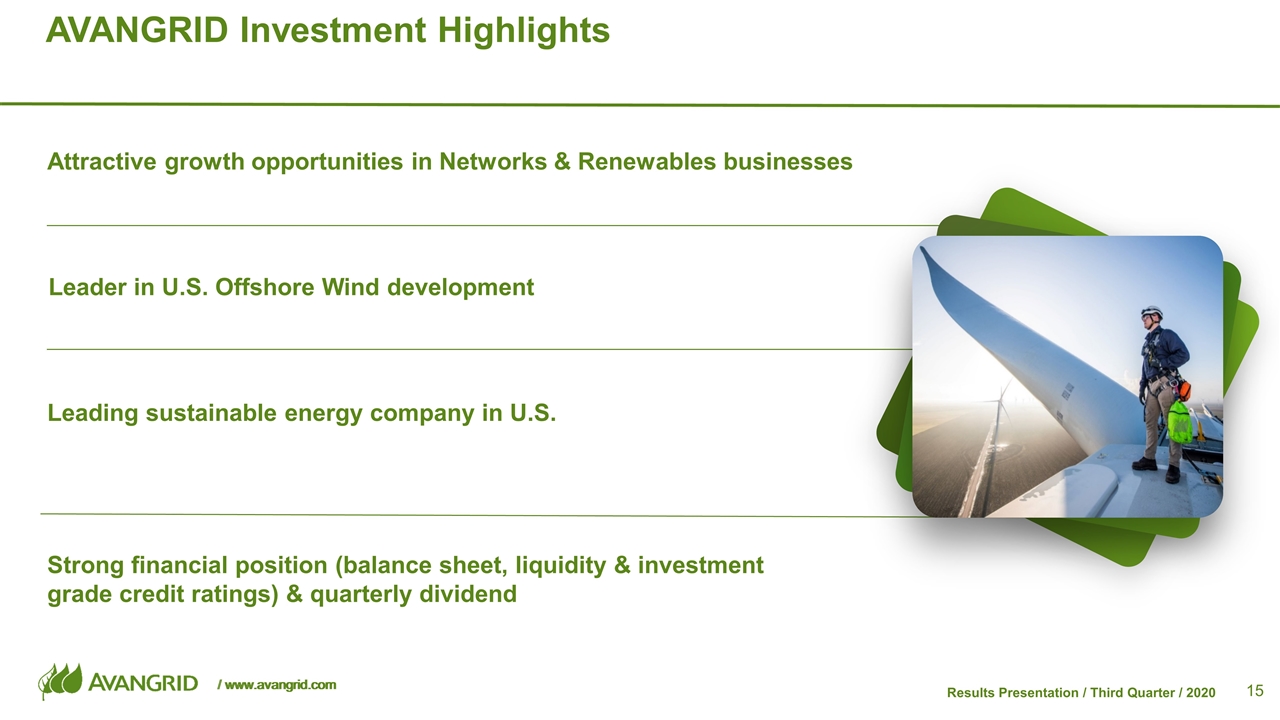
AVANGRID Investment Highlights Attractive growth opportunities in Networks & Renewables businesses Strong financial position (balance sheet, liquidity & investment grade credit ratings) & quarterly dividend Leader in U.S. Offshore Wind development Leading sustainable energy company in U.S.
Appendix 3Q ’20 Earnings Presentation Reconciliations
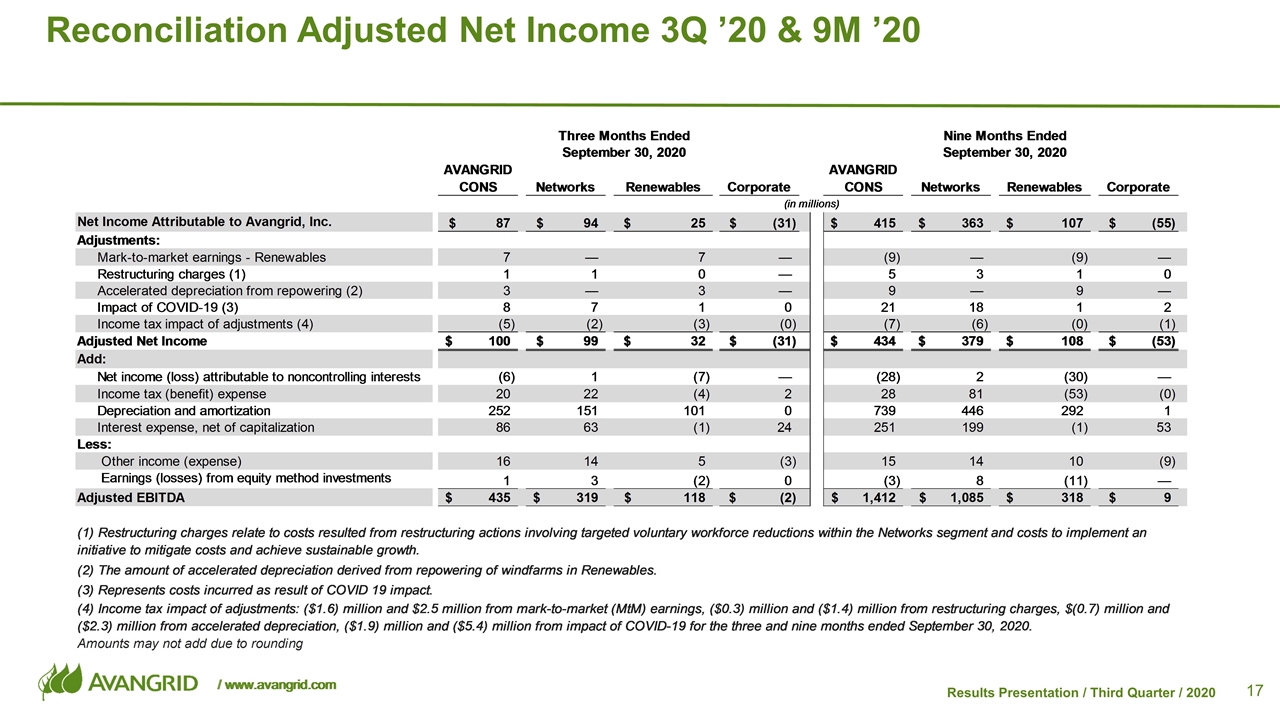
Reconciliation Adjusted Net Income 3Q ’20 & 9M ’20
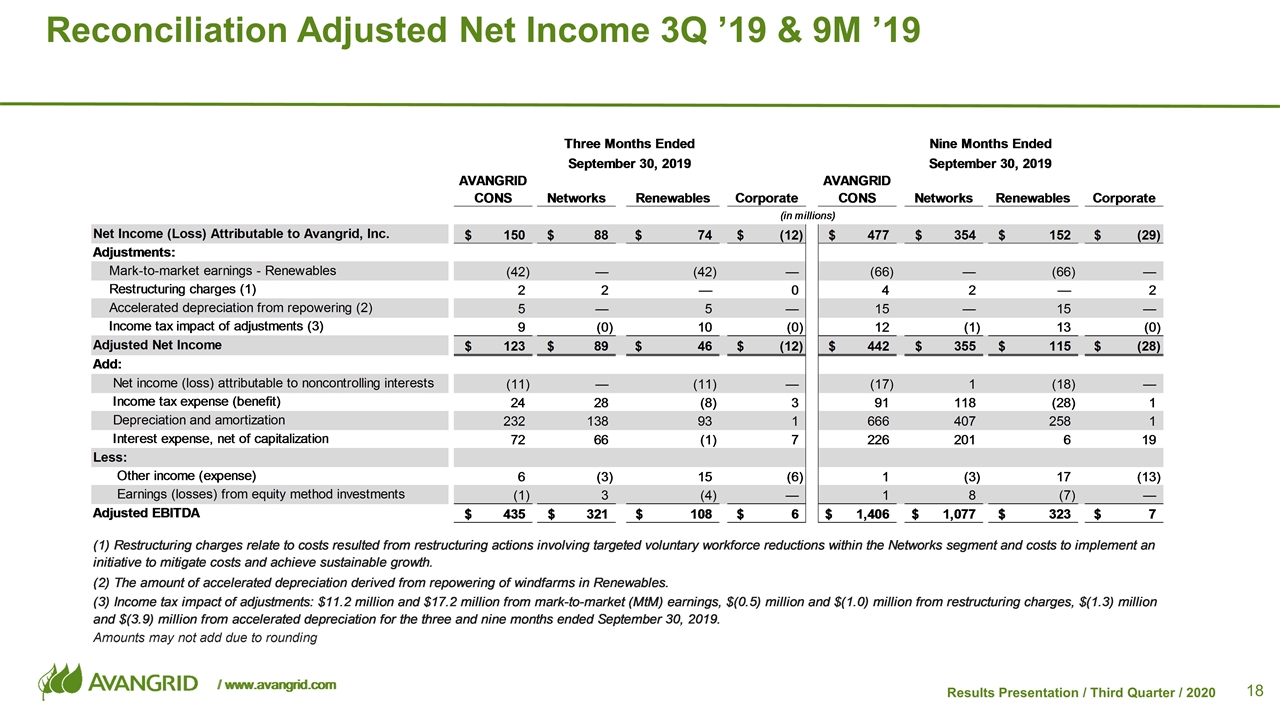
Reconciliation Adjusted Net Income 3Q ’19 & 9M ’19
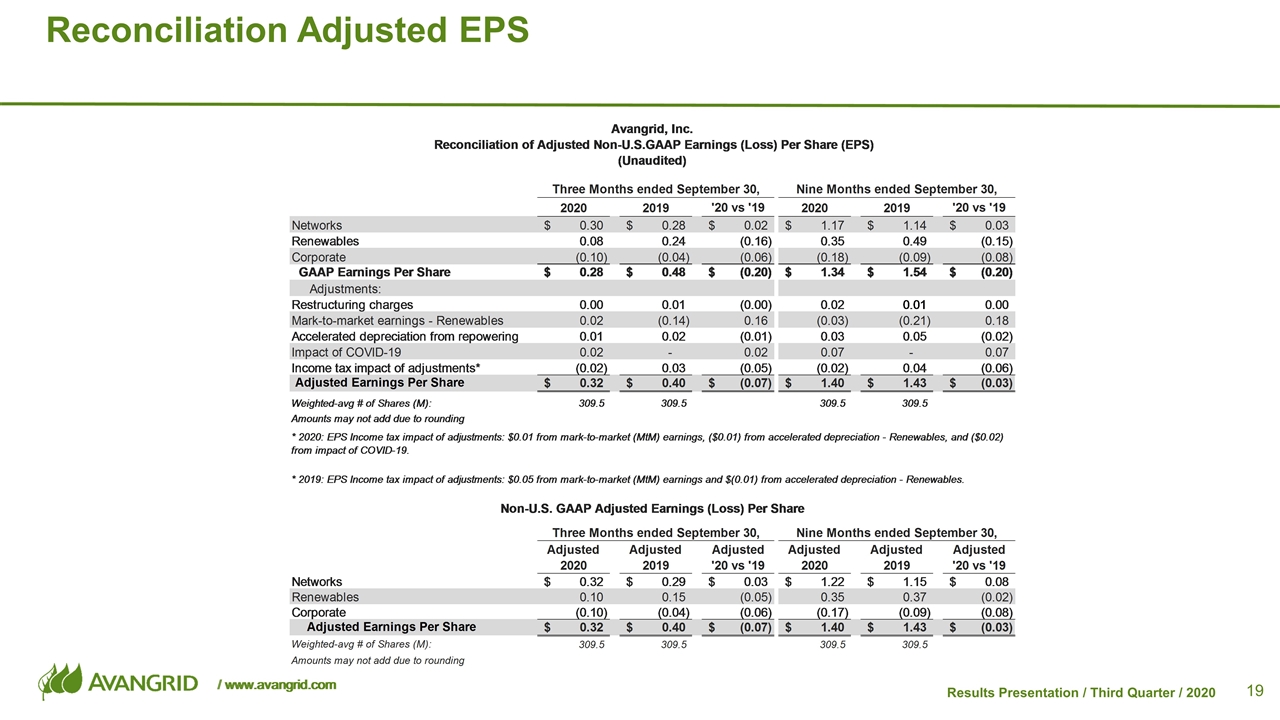
Reconciliation Adjusted EPS
Appendix Additional 3Q’20 Business Updates
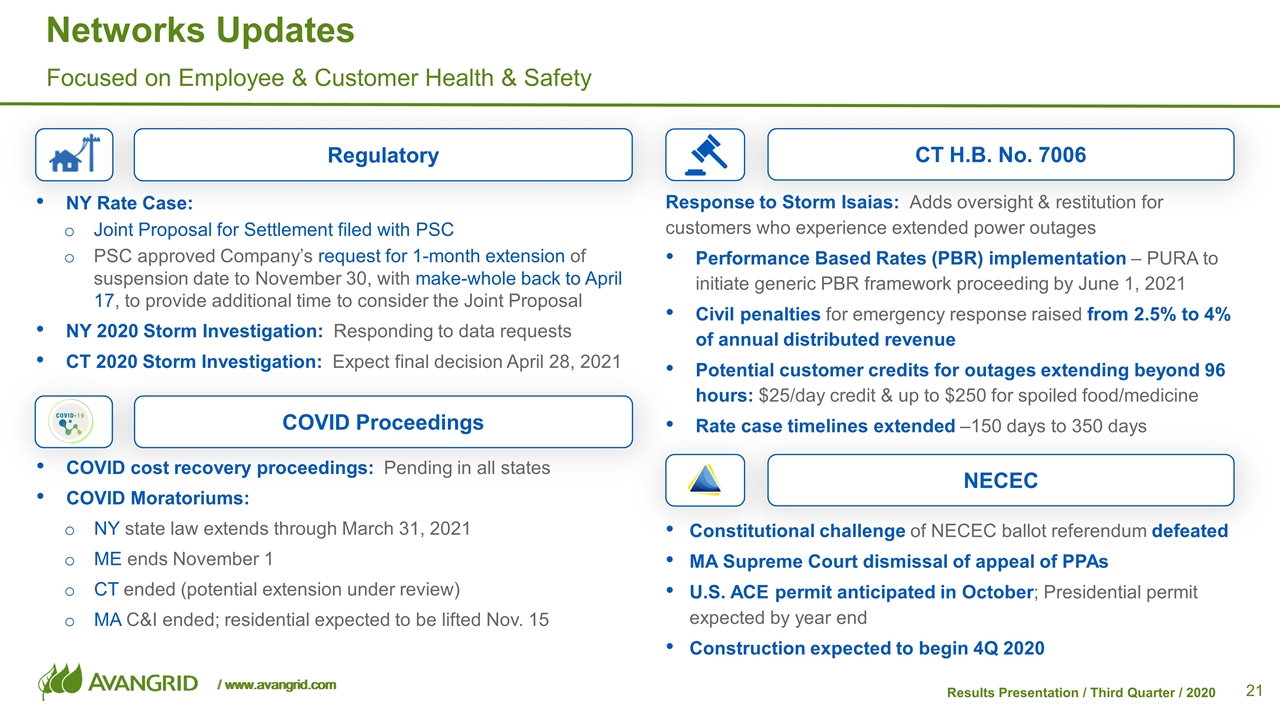
Networks Updates Focused on Employee & Customer Health & Safety COVID Proceedings COVID cost recovery proceedings: Pending in all states COVID Moratoriums: NY state law extends through March 31, 2021 ME ends November 1 CT ended (potential extension under review) MA C&I ended; residential expected to be lifted Nov. 15 Regulatory NY Rate Case: Joint Proposal for Settlement filed with PSC PSC approved Company’s request for 1-month extension of suspension date to November 30, with make-whole back to April 17, to provide additional time to consider the Joint Proposal NY 2020 Storm Investigation: Responding to data requests CT 2020 Storm Investigation: Expect final decision April 28, 2021 CT H.B. No. 7006 Response to Storm Isaias: Adds oversight & restitution for customers who experience extended power outages Performance Based Rates (PBR) implementation – PURA to initiate generic PBR framework proceeding by June 1, 2021 Civil penalties for emergency response raised from 2.5% to 4% of annual distributed revenue Potential customer credits for outages extending beyond 96 hours: $25/day credit & up to $250 for spoiled food/medicine Rate case timelines extended –150 days to 350 days NECEC Constitutional challenge of NECEC ballot referendum defeated MA Supreme Court dismissal of appeal of PPAs U.S. ACE permit anticipated in October; Presidential permit expected by year end Construction expected to begin 4Q 2020
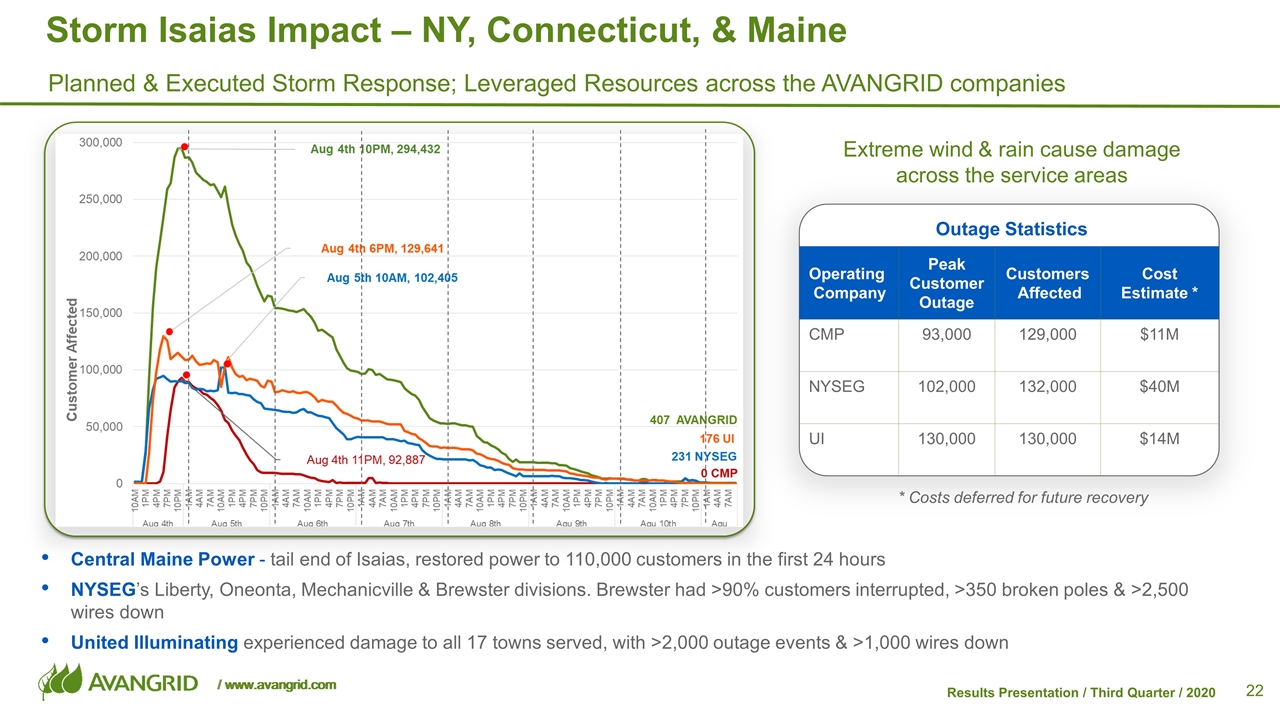
Storm Isaias Impact – NY, Connecticut, & Maine Planned & Executed Storm Response; Leveraged Resources across the AVANGRID companies Central Maine Power - tail end of Isaias, restored power to 110,000 customers in the first 24 hours NYSEG’s Liberty, Oneonta, Mechanicville & Brewster divisions. Brewster had >90% customers interrupted, >350 broken poles & >2,500 wires down United Illuminating experienced damage to all 17 towns served, with >2,000 outage events & >1,000 wires down Outage Statistics Operating Company Peak Customer Outage Customers Affected Cost Estimate * CMP 93,000 129,000 $11M NYSEG 102,000 132,000 $40M UI 130,000 130,000 $14M Extreme wind & rain cause damage across the service areas * Costs deferred for future recovery
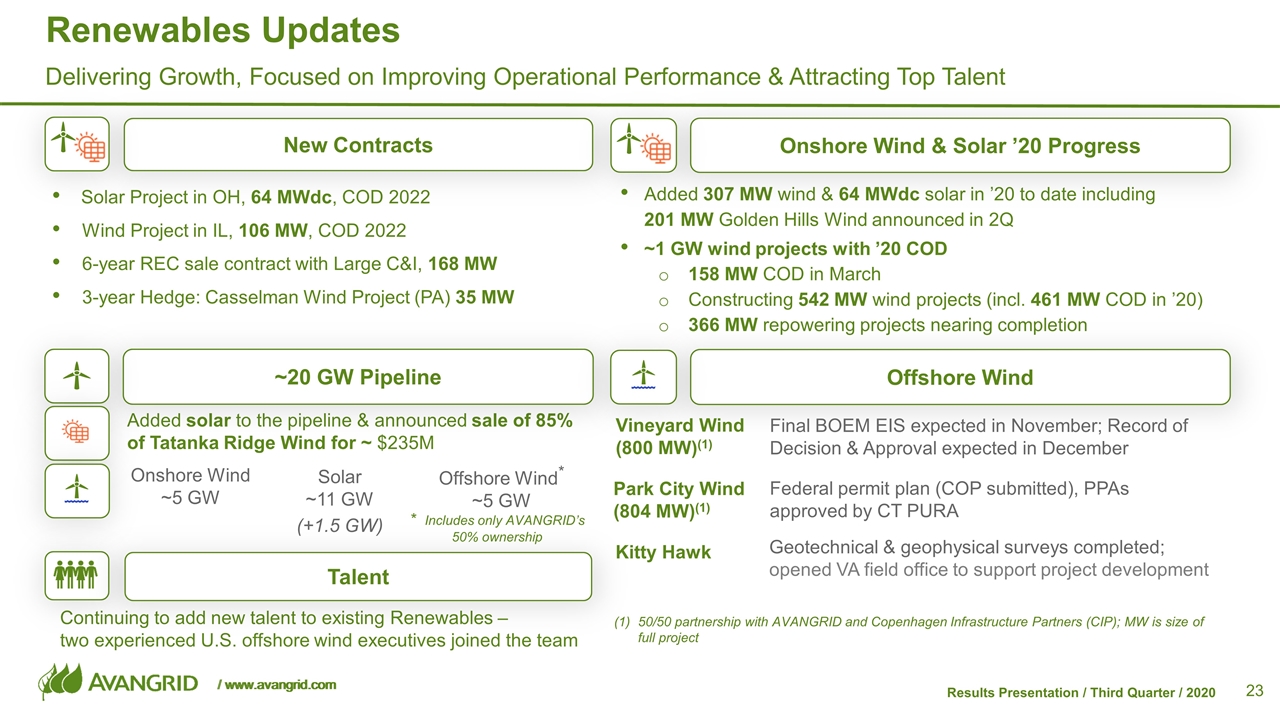
Continuing to add new talent to existing Renewables – two experienced U.S. offshore wind executives joined the team Talent Added solar to the pipeline & announced sale of 85% of Tatanka Ridge Wind for ~ $235M Renewables Updates Delivering Growth, Focused on Improving Operational Performance & Attracting Top Talent Added 307 MW wind & 64 MWdc solar in ’20 to date including 201 MW Golden Hills Wind announced in 2Q ~1 GW wind projects with ’20 COD 158 MW COD in March Constructing 542 MW wind projects (incl. 461 MW COD in ’20) 366 MW repowering projects nearing completion Onshore Wind & Solar ’20 Progress New Contracts Solar Project in OH, 64 MWdc, COD 2022 Wind Project in IL, 106 MW, COD 2022 6-year REC sale contract with Large C&I, 168 MW 3-year Hedge: Casselman Wind Project (PA) 35 MW Onshore Wind ~5 GW ~20 GW Pipeline Solar ~11 GW (+1.5 GW) Offshore Wind* ~5 GW * Includes only AVANGRID’s 50% ownership Offshore Wind Final BOEM EIS expected in November; Record of Decision & Approval expected in December Geotechnical & geophysical surveys completed; opened VA field office to support project development Federal permit plan (COP submitted), PPAs approved by CT PURA Vineyard Wind (800 MW)(1) Park City Wind (804 MW)(1) Kitty Hawk 50/50 partnership with AVANGRID and Copenhagen Infrastructure Partners (CIP); MW is size of full project
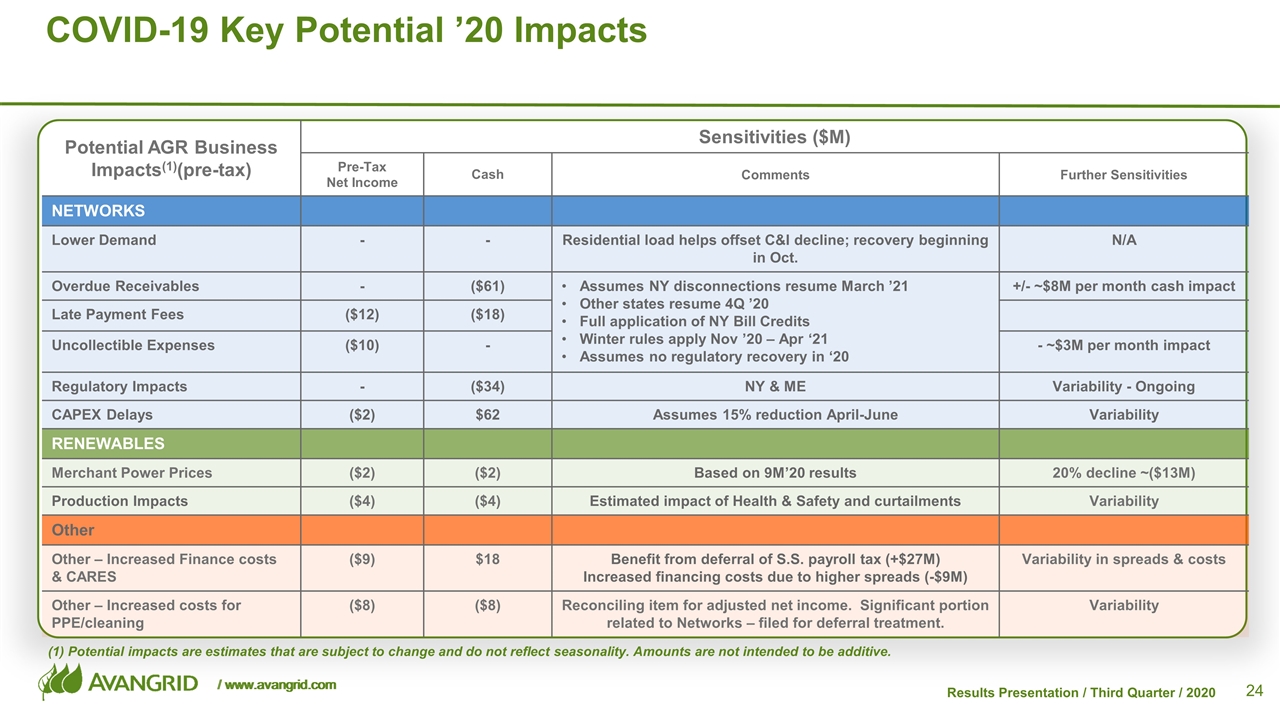
Potential AGR Business Impacts(1)(pre-tax) Sensitivities ($M) Pre-Tax Net Income Cash Comments Further Sensitivities NETWORKS Lower Demand - - Residential load helps offset C&I decline; recovery beginning in Oct. N/A Overdue Receivables - ($61) Assumes NY disconnections resume March ’21 Other states resume 4Q ’20 Full application of NY Bill Credits Winter rules apply Nov ’20 – Apr ‘21 Assumes no regulatory recovery in ‘20 +/- ~$8M per month cash impact Late Payment Fees ($12) ($18) Uncollectible Expenses ($10) - - ~$3M per month impact Regulatory Impacts - ($34) NY & ME Variability - Ongoing CAPEX Delays ($2) $62 Assumes 15% reduction April-June Variability RENEWABLES Merchant Power Prices ($2) ($2) Based on 9M’20 results 20% decline ~($13M) Production Impacts ($4) ($4) Estimated impact of Health & Safety and curtailments Variability Other Other – Increased Finance costs & CARES ($9) $18 Benefit from deferral of S.S. payroll tax (+$27M) Increased financing costs due to higher spreads (-$9M) Variability in spreads & costs Other – Increased costs for PPE/cleaning ($8) ($8) Reconciling item for adjusted net income. Significant portion related to Networks – filed for deferral treatment. Variability COVID-19 Key Potential ’20 Impacts (1) Potential impacts are estimates that are subject to change and do not reflect seasonality. Amounts are not intended to be additive.
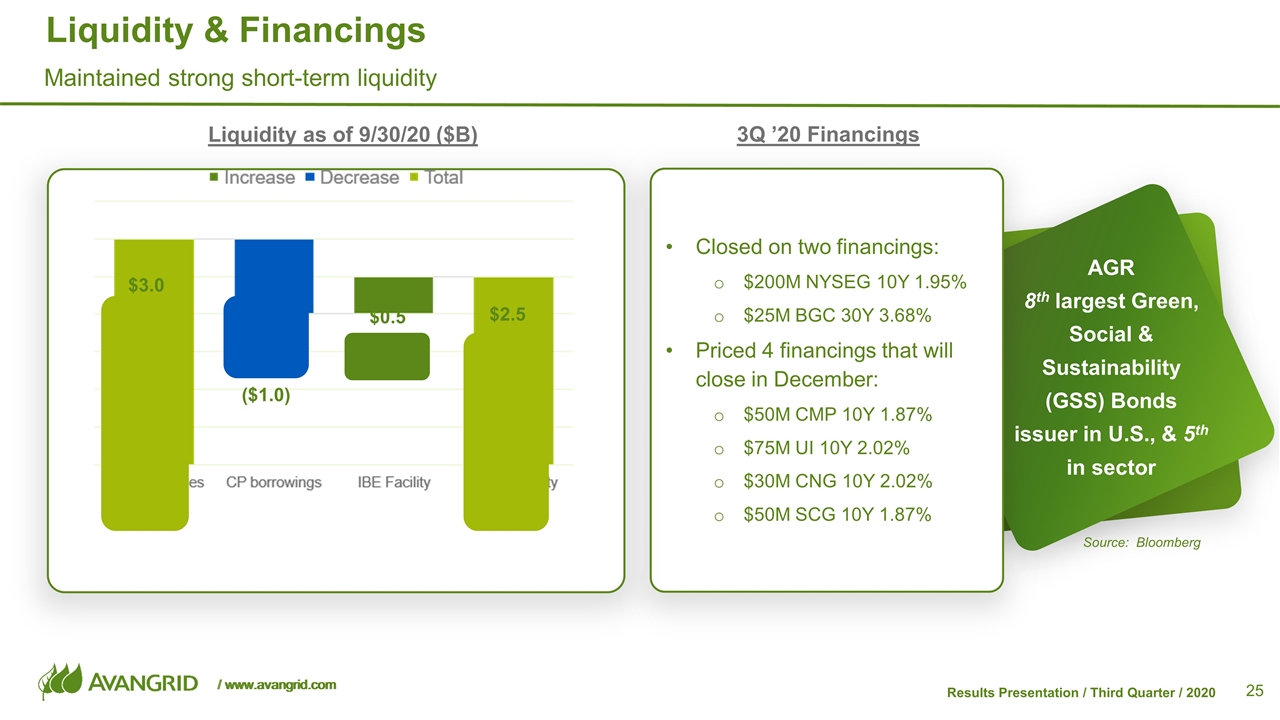
Liquidity & Financings Maintained strong short-term liquidity Liquidity as of 9/30/20 ($B) AGR 8th largest Green, Social & Sustainability (GSS) Bonds issuer in U.S., & 5th in sector Closed on two financings: $200M NYSEG 10Y 1.95% $25M BGC 30Y 3.68% Priced 4 financings that will close in December: $50M CMP 10Y 1.87% $75M UI 10Y 2.02% $30M CNG 10Y 2.02% $50M SCG 10Y 1.87% 3Q ’20 Financings $3.0 $2.5 ($1.0) $0.5 Source: Bloomberg
Appendix AVANGRID – PNM Resources Merger
October 2020 Avangrid-PNM Resources Merger

Legal Disclaimer (I/II) This presentation has been prepared by Avangrid, Inc., exclusively for information purposes, and is being delivered to provide certain information about Avangrid, Inc. and certain affiliates thereof (collectively referred to herein as the “Avangrid Group”) and certain transactions presented herein. This presentation may not be disclosed, reproduced or published, in whole or in part, nor used by any person for any other purpose, without the express prior written consent of Avangrid, Inc. This presentation is not intended for distribution to, or use by, any person in any jurisdiction or country where such distribution or use would be contrary to law or regulation. The term “person” as used in this presentation should be interpreted broadly to include the media and any corporation, company, group, partnership or other entity or individual. This presentation is not, and shall not be deemed to be, an offer to sell or a solicitation of an offer to buy any interest or securities of any person, or an offer to enter into any transaction. Accordingly, neither Avangrid, Inc. nor any other member of the Avangrid Group will be under any legal or other obligation of any kind whatsoever to negotiate or consummate any transaction, and neither the recipient hereof nor any of its affiliates or other persons shall have any claim whatsoever against the Avangrid Group (or any of its directors, officers, owners or affiliates) arising out of or relating to this presentation or the information contained herein. The information contained herein may not be relied on in any manner as legal, tax, accounting or investment advice. Information contained herein does not purport to be complete. No express or implied warranty is made as to the impartiality, accuracy, completeness or correctness of the information or the opinions or statements expressed herein, and no member of the Avangrid Group or any other person assumes liability for this presentation. Without limiting the foregoing, all recipients of this presentation are expressly advised that (i) the securities of Avangrid, Inc. and certain of its affiliates are listed and posted for trading, (ii) this presentation may contain information not available to the public generally (including material non-public information), (iii) applicable securities laws may prohibit a recipient of material non-public information about an issuer or its securities from trading such securities or disclosing or otherwise communicating such information to any other person, and (iv) each recipient is required to comply with all such laws. This presentation relies on and refer to certain information and statistics obtained from third-party sources. Avangrid, Inc. has not independently verified the accuracy or completeness of any such third-party information. This presentation may contain certain financial measures that are not in accordance with generally accepted accounting principles in the United States (“non-GAAP”). Non-GAAP financial measures are numerical measures of a company’s financial performance that exclude or include certain items in a manner different than the most directly comparable measures calculated and presented in accordance with generally accepted accounting principles in the United States in statements of income, balance sheets or statements of cash flow of a company. The presentations of these non-GAAP financial measures may not be comparable to similarly titled measures reported by other companies. This presentation may include certain information, statements, estimates, projections, anticipated future performance and future events and market and regulatory developments, which constitute “forward-looking statements”, and which can be identified by the use of forward-looking terminology such as “may”, “will”, “should”, “expect”, “anticipate”, “target”, “project”, “estimate”, “intend”, “continue” or “believe”, or the negatives thereof or other variations thereon or comparable terminology. Such forward-looking statements include, but are not limited to, statements about the anticipated benefits of the transactions presented in this presentation, including future financial or operating results, synergies, costs, plans, objectives, expectations or intentions, the expected timing of completion of such transactions, obtaining regulatory approvals, value of any company (as of the completion of the transactions or as of any other date in the future) and other statements that are not historical facts. Such statements, estimates and projections reflect various assumptions made by the management of the respective companies concerning anticipated results and such future events and developments, and involve significant element of subjective judgment and analysis by management. Due to various risks and uncertainties, actual events or results or the actual performance may differ materially from that reflected or contemplated in such forward-looking statements, and there can be no assurance that such projected results are attainable or will be realized or that such events or developments should occur. No representations or warranties are made as to the accuracy or completeness of such statements, estimates or projections.
Legal Disclaimer (II/II) This presentation may also contain historical market data; however, historical market data are not reliable indicators of future market behavior or trends. Past performance is not an indication, prediction or guarantee of future results. In addition, the transactions discussed in this presentation are subject to a number of conditions, which, if not fulfilled, it is possible that such transactions (or any of them) will not be consummated in the expected time frames presented herein (or at all). Recipients of this presentation are urged to conduct their own independent investigation to confirm facts, estimates and projections as part of their due diligence process. No member of the Avangrid Group assumes liability of any kind, whether for negligence or under any other legal theory, for any damage or loss arising from any use of this presentation or its content. Prior to entering into any transaction, each prospective investor should independently determine the economic risks and merits of such transaction (and independently determine that such prospective investor is able to assume these risks). Neither this presentation nor any part of it constitutes a contract, nor may it be relied upon or used for incorporation into or construction of any contract or any other type of agreement. Without limiting the foregoing, (A) statements in this presentation are made as of the date hereof unless stated otherwise herein, and the delivery of this presentation at any time shall not under any circumstances create an implication that the information contained herein is correct or updated as of any time subsequent to such date, (B) in furnishing this presentation, no member of the Avangrid Group undertakes any obligation to provide the recipient with any additional information or to update, revise or correct the information contained herein, and (C) this presentation shall not be deemed an indication of the state of affairs of the Avangrid Group or PNM Resources, Inc. or its subsidiaries (“PNM”), nor shall it constitute an indication that there has been no change in their respective businesses or affairs since the date hereof or since the dates as to which information is given in this presentation. No person has been authorized in connection with this presentation to give any information other than as expressly contained in this presentation. PNM will file with the SEC a proxy statement in connection with certain transactions referred to in this presentation ( (the “Proxy Statement”). INVESTORS AND SHAREHOLDERS ARE URGED TO CAREFULLY READ THE PROXY STATEMENT AND OTHER RELEVANT DOCUMENTS TO BE FILED WITH THE SEC, IN THEIR ENTIRETY WHEN THEY BECOME AVAILABLE BECAUSE THEY WILL CONTAIN IMPORTANT INFORMATION ABOUT PNM, CERTAIN OF THE TRANSACTIONS PRESENTED IN THIS PRESENTATION AND RELATED MATTERS. Investors and shareholders will be able to obtain free copies of the Proxy Statement and other documents filed with the SEC through the website maintained by the SEC at www.sec.gov. In addition, investors and shareholders will be able to obtain free copies of the Proxy Statement and other documents filed with the SEC by the parties by contacting PNM. Avangrid, Inc., PNM and certain of their respective directors, executive officers and other members of management and employees may be deemed to be participants in the solicitation of proxies from PNM’s shareholders in connection with the transactions presented in this presentation. Information regarding the persons who may, under the rules of the SEC, be deemed participants in the solicitation of PNM’s shareholders in connection with the transactions presented in this presentation will be set forth in the Proxy Statement when it is filed with the SEC. Additional information about Avangrid Inc.’s executive officers and directors and PNM’s executive officers and directors can be found in the Proxy Statement when it becomes available. IMPORTANT NOTICES IRS Circular 230 Disclosure: No member of the Avangrid Group provides tax or legal advice. Any discussion of tax matters in this presentation (i) is not intended or written to be used, and cannot be used or relied upon, by any person for the purpose of avoiding any tax penalties and (ii) may have been written in connection with the “promotion or marketing” of any transaction discussed herein. Accordingly, the recipient of this presentation should seek advice based on its particular circumstances from an independent tax advisor.
Index Avangrid’s strategy Description of PNM Description of Avangrid + PNM Terms of the Transaction and Financial Impacts Current activities in New Mexico and Texas Calendar
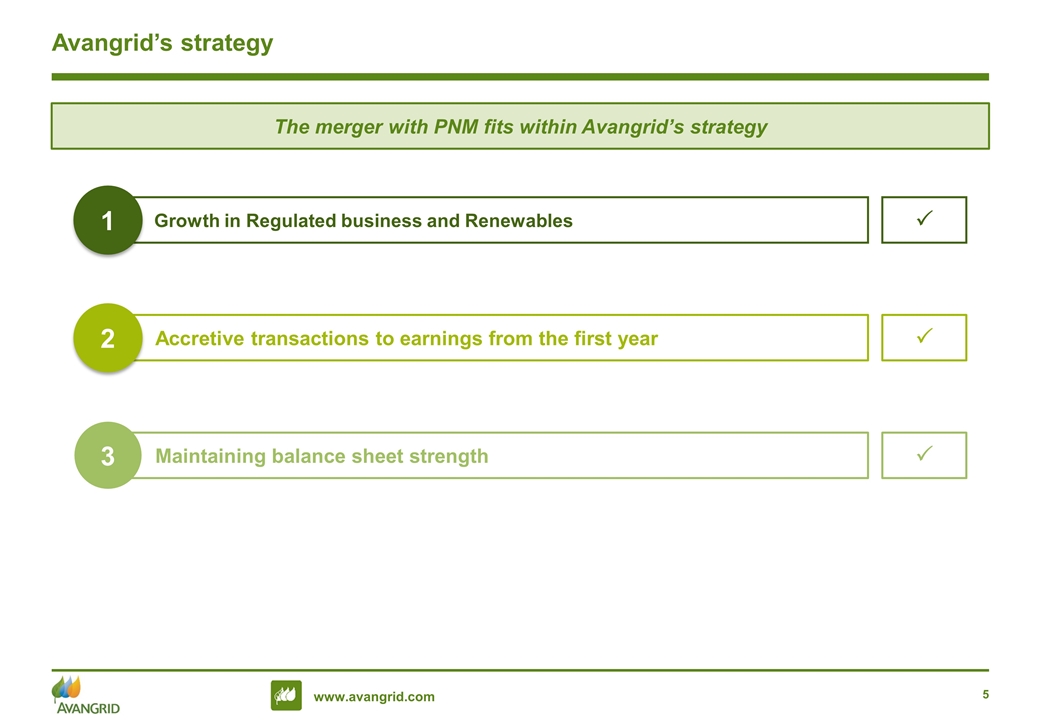
Avangrid’s strategy The merger with PNM fits within Avangrid’s strategy Growth in Regulated business and Renewables Accretive transactions to earnings from the first year Maintaining balance sheet strength 1 2 3 P P P
Index Avangrid’s strategy Description of PNM Description of Avangrid + PNM Terms of the Transaction and Financial Impacts Current activities in New Mexico and Texas Calendar
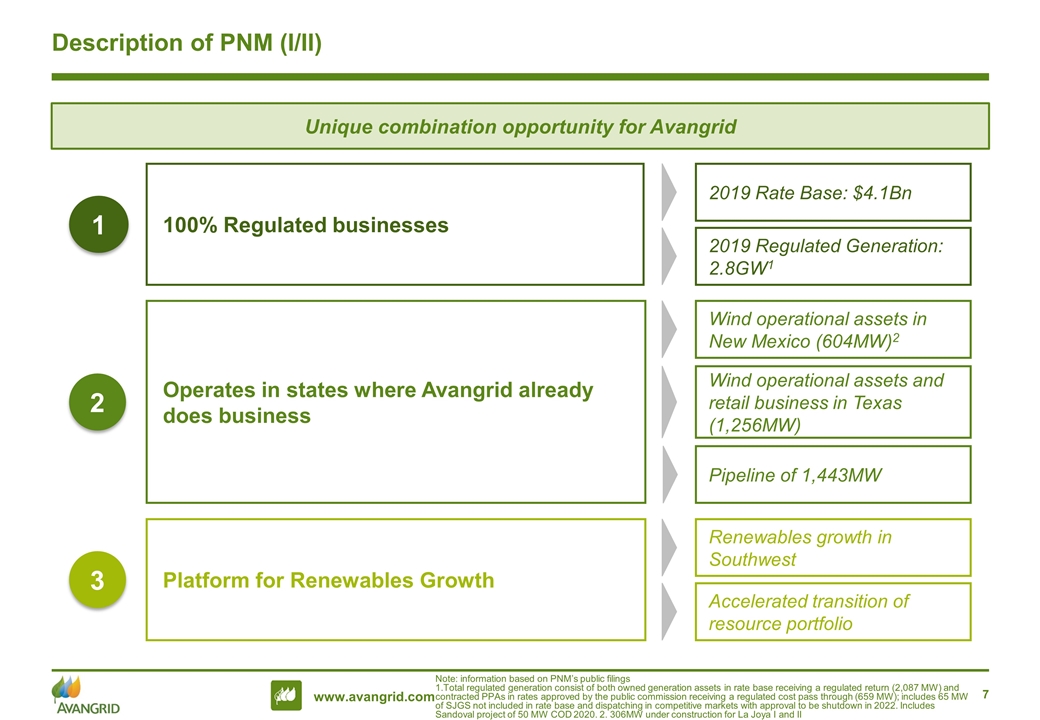
Description of PNM (I/II) 100% Regulated businesses 1 2019 Rate Base: $4.1Bn 2019 Regulated Generation: 2.8GW1 Platform for Renewables Growth 3 Renewables growth in Southwest Accelerated transition of resource portfolio Note: information based on PNM’s public filings 1.Total regulated generation consist of both owned generation assets in rate base receiving a regulated return (2,087 MW) and contracted PPAs in rates approved by the public commission receiving a regulated cost pass through (659 MW); includes 65 MW of SJGS not included in rate base and dispatching in competitive markets with approval to be shutdown in 2022. Includes Sandoval project of 50 MW COD 2020. 2. 306MW under construction for La Joya I and II Operates in states where Avangrid already does business 2 Wind operational assets in New Mexico (604MW)2 Wind operational assets and retail business in Texas (1,256MW) Pipeline of 1,443MW Unique combination opportunity for Avangrid
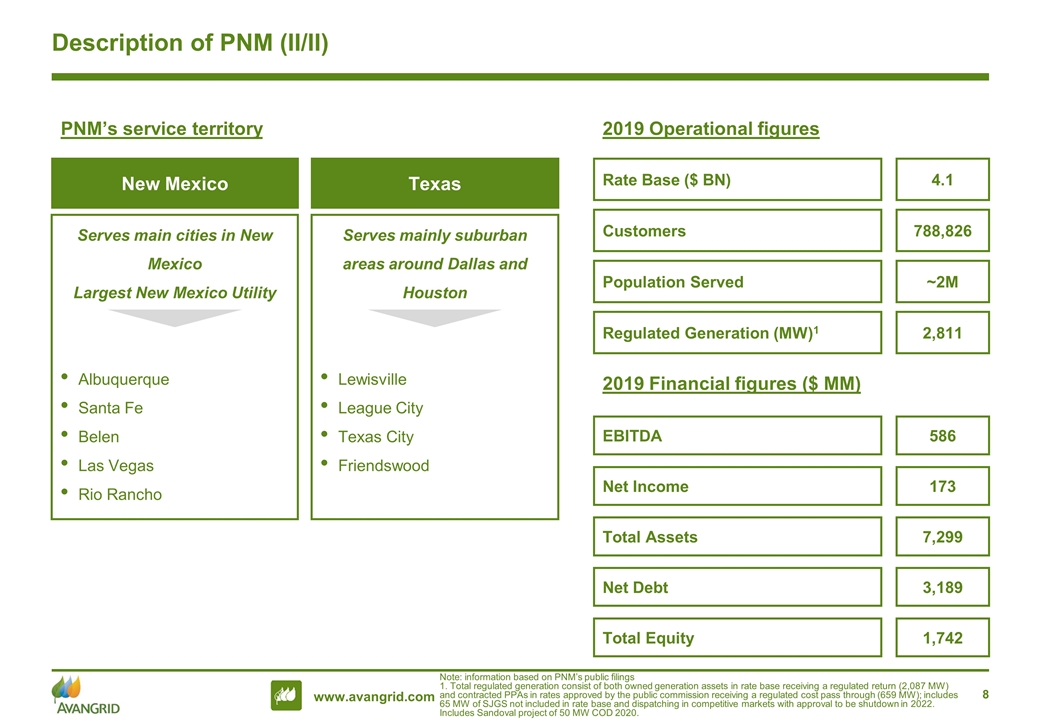
Description of PNM (II/II) PNM’s service territory New Mexico Serves main cities in New Mexico Largest New Mexico Utility Albuquerque Santa Fe Belen Las Vegas Rio Rancho Texas Serves mainly suburban areas around Dallas and Houston Lewisville League City Texas City Friendswood Note: information based on PNM’s public filings 1. Total regulated generation consist of both owned generation assets in rate base receiving a regulated return (2,087 MW) and contracted PPAs in rates approved by the public commission receiving a regulated cost pass through (659 MW); includes 65 MW of SJGS not included in rate base and dispatching in competitive markets with approval to be shutdown in 2022. Includes Sandoval project of 50 MW COD 2020. 2019 Financial figures ($ MM) Regulated Generation (MW)1 2,811 2019 Operational figures Population Served ~2M Customers 788,826 Rate Base ($ BN) 4.1 Net Income 173 EBITDA 586 Total Assets 7,299 Net Debt 3,189 Total Equity 1,742
Index Avangrid’s strategy Description of PNM Description of Avangrid + PNM Terms of the Transaction and Financial Impacts Current activities in New Mexico and Texas Calendar
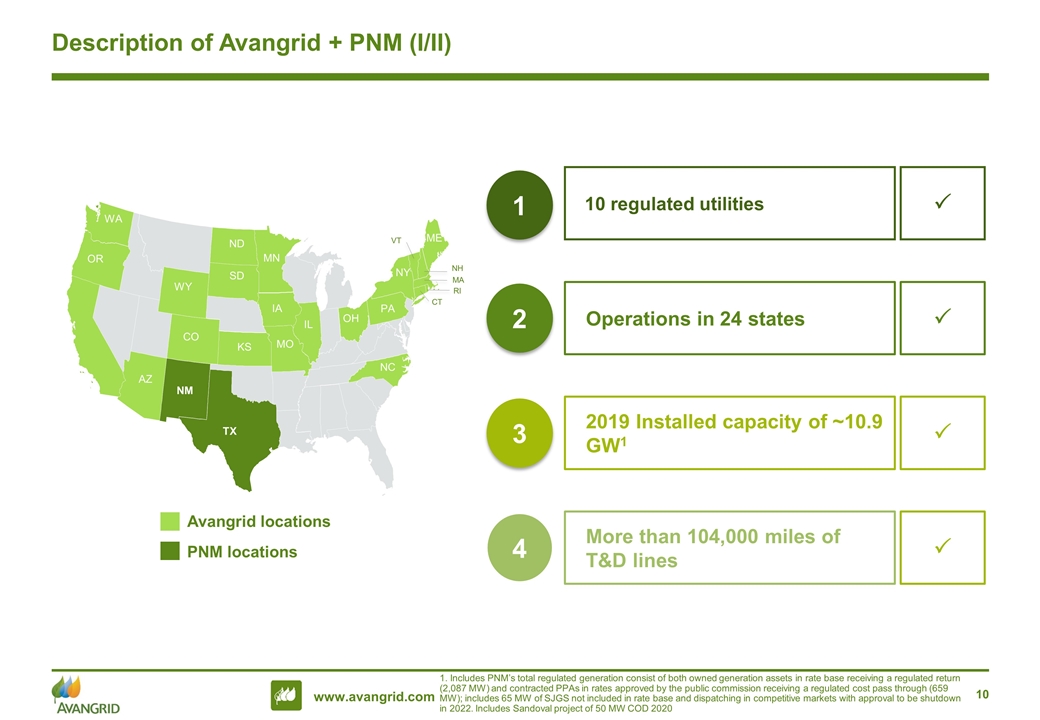
Description of Avangrid + PNM (I/II) 10 regulated utilities 1 P Operations in 24 states 2 P 2019 Installed capacity of ~10.9 GW1 3 P CA Avangrid locations PNM locations MA NH RI CT NM TX WA OR AZ CO KS ND SD WY NC PA OH NY MN IA MO IL ME VT 1. Includes PNM’s total regulated generation consist of both owned generation assets in rate base receiving a regulated return (2,087 MW) and contracted PPAs in rates approved by the public commission receiving a regulated cost pass through (659 MW); includes 65 MW of SJGS not included in rate base and dispatching in competitive markets with approval to be shutdown in 2022. Includes Sandoval project of 50 MW COD 2020 More than 104,000 miles of T&D lines 4 P
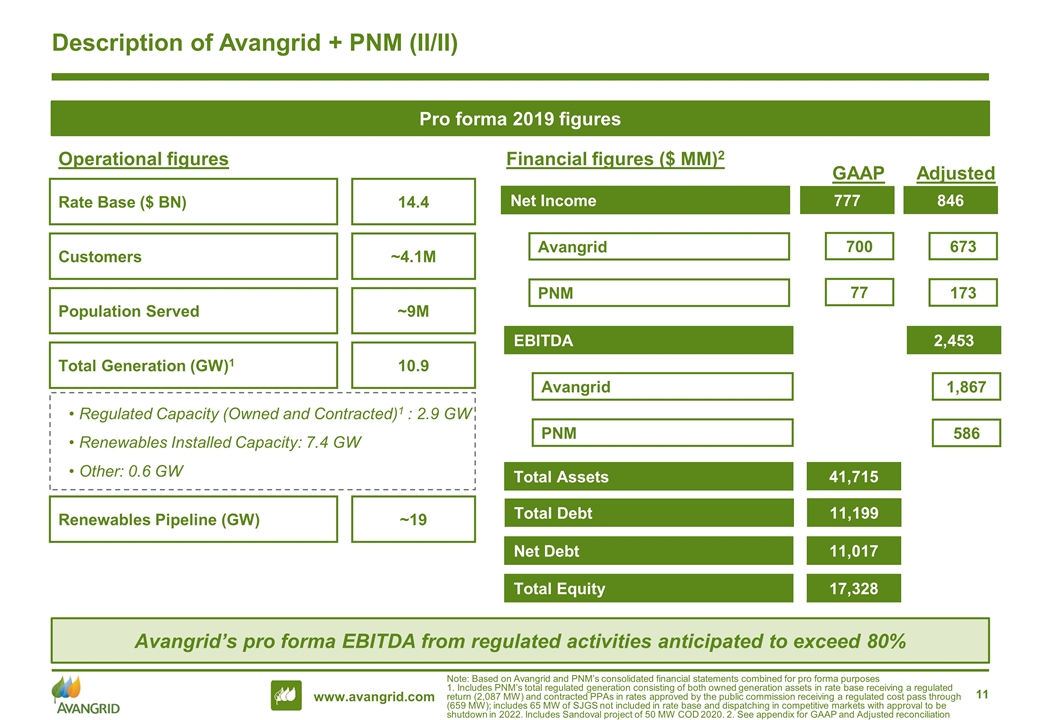
Description of Avangrid + PNM (II/II) Total Generation (GW)1 10.9 Population Served ~9M Operational figures Customers ~4.1M Rate Base ($ BN) 14.4 Financial figures ($ MM)2 Avangrid’s pro forma EBITDA from regulated activities anticipated to exceed 80% Pro forma 2019 figures Note: Based on Avangrid and PNM’s consolidated financial statements combined for pro forma purposes 1. Includes PNM’s total regulated generation consisting of both owned generation assets in rate base receiving a regulated return (2,087 MW) and contracted PPAs in rates approved by the public commission receiving a regulated cost pass through (659 MW); includes 65 MW of SJGS not included in rate base and dispatching in competitive markets with approval to be shutdown in 2022. Includes Sandoval project of 50 MW COD 2020. 2. See appendix for GAAP and Adjusted reconciliation EBITDA 2,453 PNM 586 Avangrid 1,867 Net Income 846 PNM 173 Avangrid 673 Total Assets 41,715 Net Debt 11,017 Total Equity 17,328 Renewables Pipeline (GW) ~19 Regulated Capacity (Owned and Contracted)1 : 2.9 GW Renewables Installed Capacity: 7.4 GW Other: 0.6 GW 700 GAAP Adjusted Total Debt 11,199 77 777
Index Avangrid’s strategy Description of PNM Description of Avangrid + PNM Terms of the Transaction and Financial Impacts Current activities in New Mexico and Texas Calendar
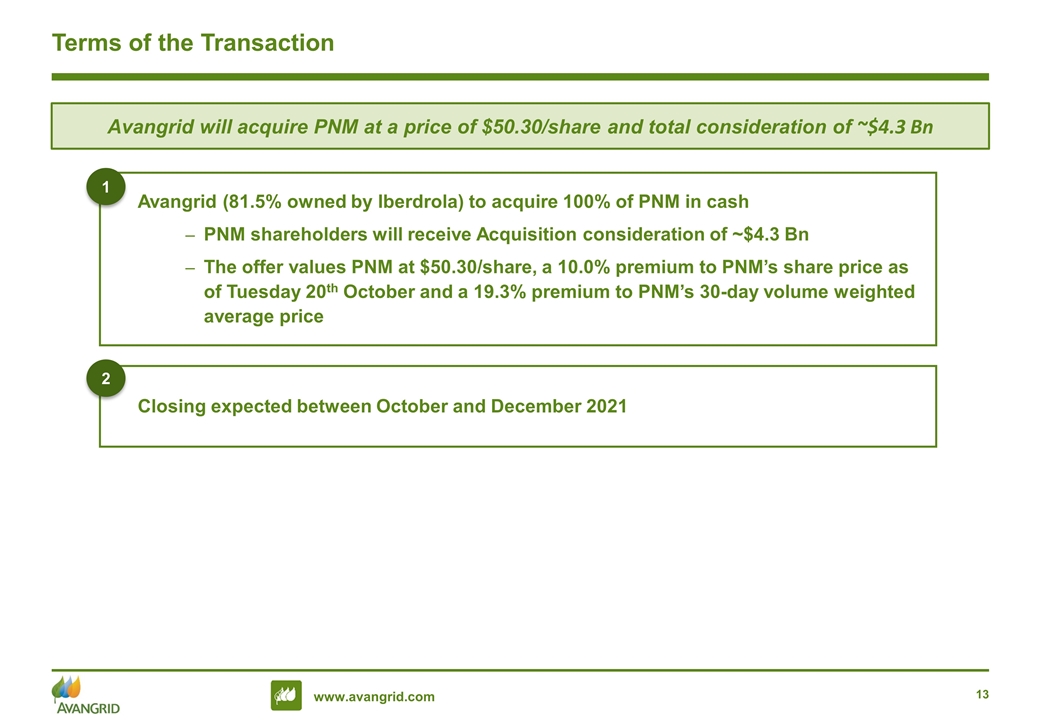
Terms of the Transaction Avangrid (81.5% owned by Iberdrola) to acquire 100% of PNM in cash PNM shareholders will receive Acquisition consideration of ~$4.3 Bn The offer values PNM at $50.30/share, a 10.0% premium to PNM’s share price as of Tuesday 20th October and a 19.3% premium to PNM’s 30-day volume weighted average price Avangrid will acquire PNM at a price of $50.30/share and total consideration of ~$4.3 Bn 1 Closing expected between October and December 2021 2
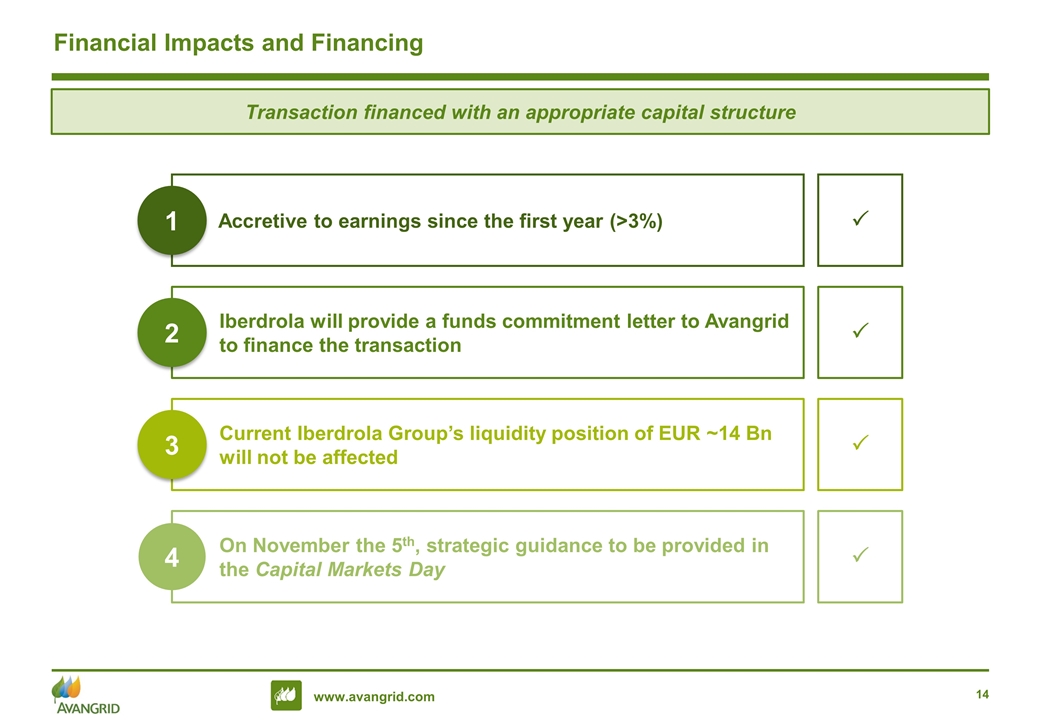
Financial Impacts and Financing Transaction financed with an appropriate capital structure Accretive to earnings since the first year (>3%) 1 Iberdrola will provide a funds commitment letter to Avangrid to finance the transaction 2 Current Iberdrola Group’s liquidity position of EUR ~14 Bn will not be affected 3 On November the 5th, strategic guidance to be provided in the Capital Markets Day 4 P P P P
Index Avangrid’s strategy Description of PNM Description of Avangrid + PNM Terms of the Transaction and Financial Impacts Current activities in New Mexico and Texas Calendar
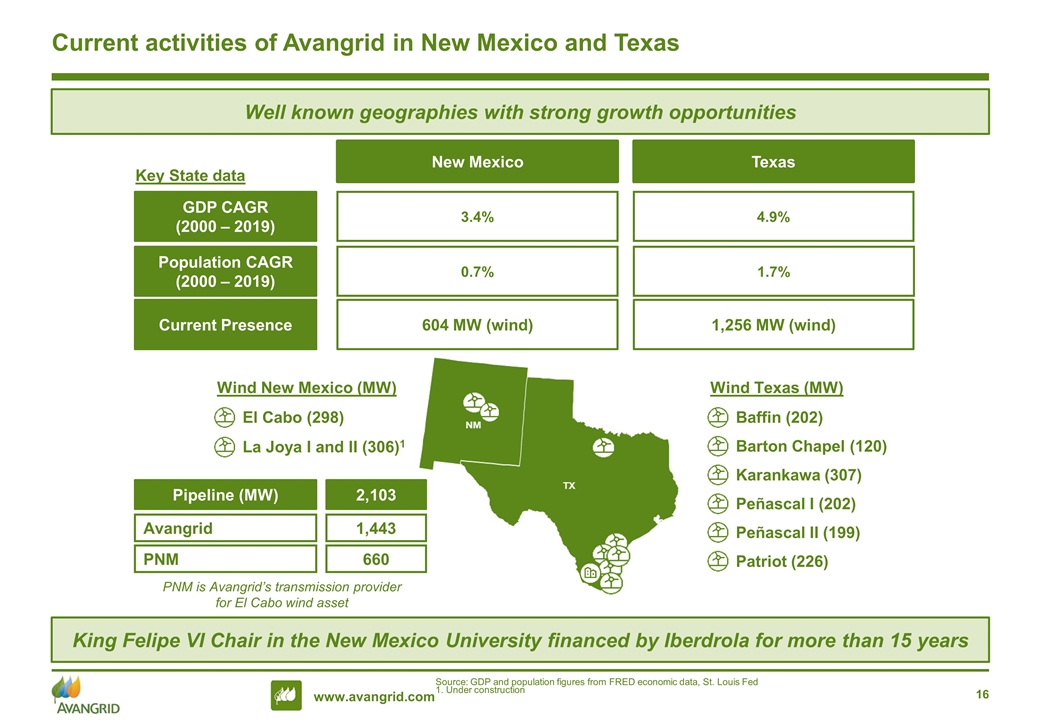
Current activities of Avangrid in New Mexico and Texas Source: GDP and population figures from FRED economic data, St. Louis Fed 1. Under construction Well known geographies with strong growth opportunities Current Presence 604 MW (wind) 1,256 MW (wind) New Mexico Texas Key State data GDP CAGR (2000 – 2019) Population CAGR (2000 – 2019) 3.4% 0.7% 4.9% 1.7% El Cabo (298) Wind New Mexico (MW) Barton Chapel (120) Baffin (202) Wind Texas (MW) Karankawa (307) Peñascal I (202) Peñascal II (199) Patriot (226) La Joya I and II (306)1 Pipeline (MW) PNM 660 Avangrid 1,443 2,103 King Felipe VI Chair in the New Mexico University financed by Iberdrola for more than 15 years PNM is Avangrid’s transmission provider for El Cabo wind asset
Index Avangrid’s strategy Description of PNM Description of Avangrid + PNM Terms of the Transaction and Financial Impacts Current activities in New Mexico and Texas Calendar
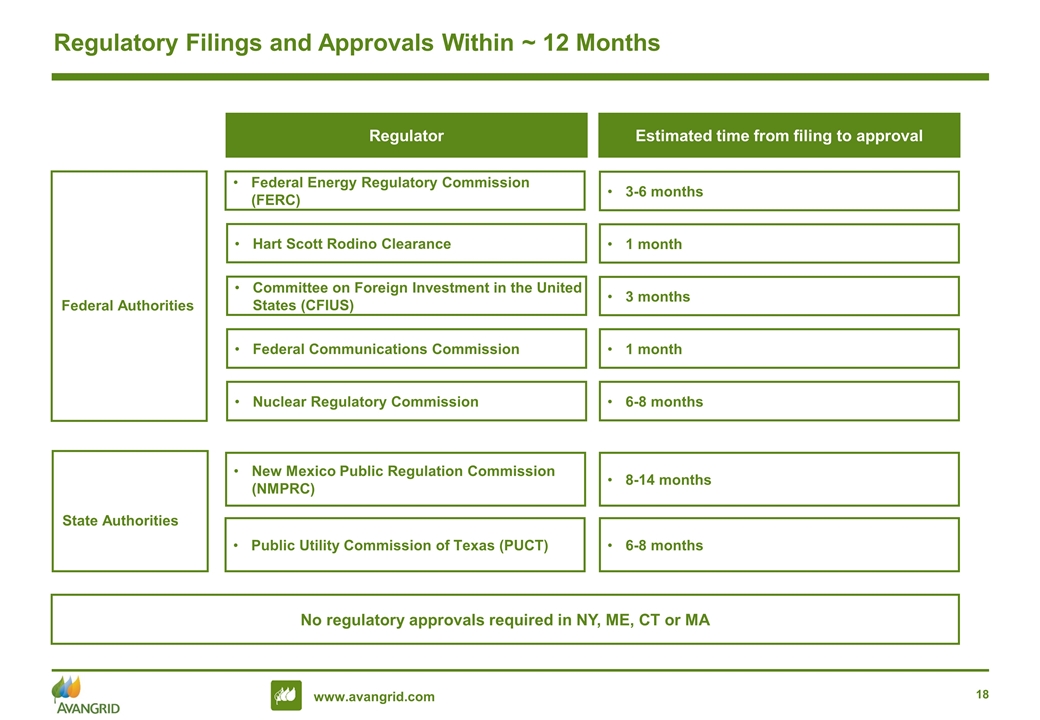
Regulatory Filings and Approvals Within ~ 12 Months Federal Authorities Federal Energy Regulatory Commission (FERC) Hart Scott Rodino Clearance Committee on Foreign Investment in the United States (CFIUS) Federal Communications Commission Regulator Estimated time from filing to approval 3-6 months 1 month 3 months 1 month State Authorities New Mexico Public Regulation Commission (NMPRC) Public Utility Commission of Texas (PUCT) 8-14 months 6-8 months No regulatory approvals required in NY, ME, CT or MA Nuclear Regulatory Commission 6-8 months
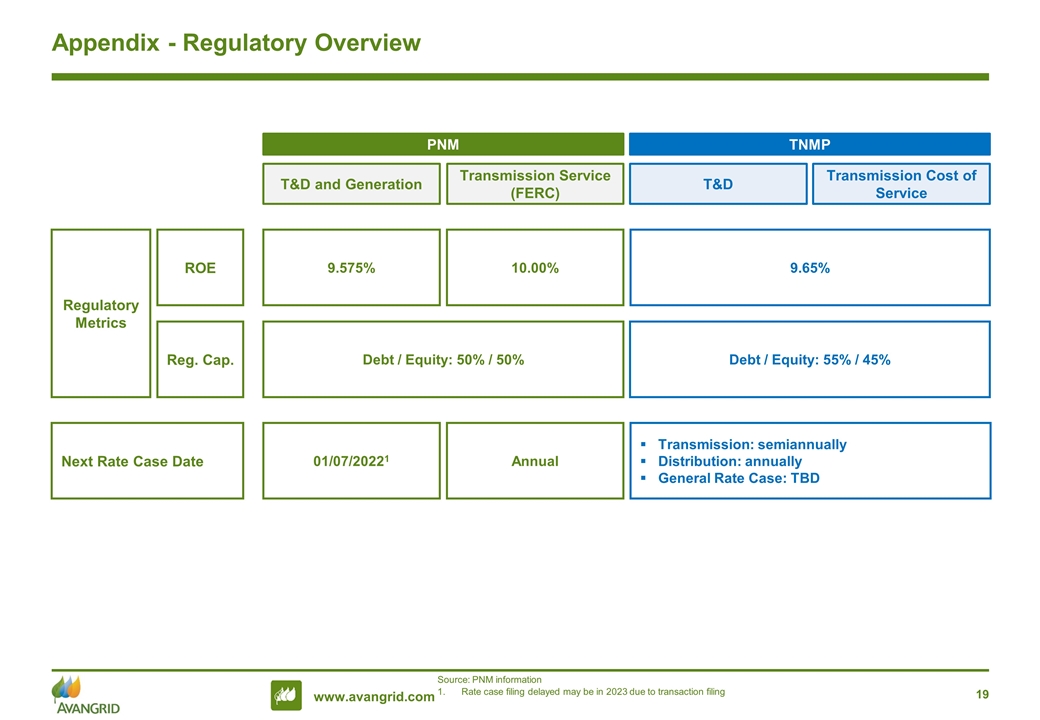
Appendix - Regulatory Overview Regulatory Metrics ROE Reg. Cap. 9.65% Debt / Equity: 55% / 45% 9.575% 10.00% Debt / Equity: 50% / 50% T&D and Generation Transmission Service (FERC) T&D Transmission Cost of Service PNM TNMP Source: PNM information Rate case filing delayed may be in 2023 due to transaction filing Next Rate Case Date Transmission: semiannually Distribution: annually General Rate Case: TBD 01/07/20221 Annual
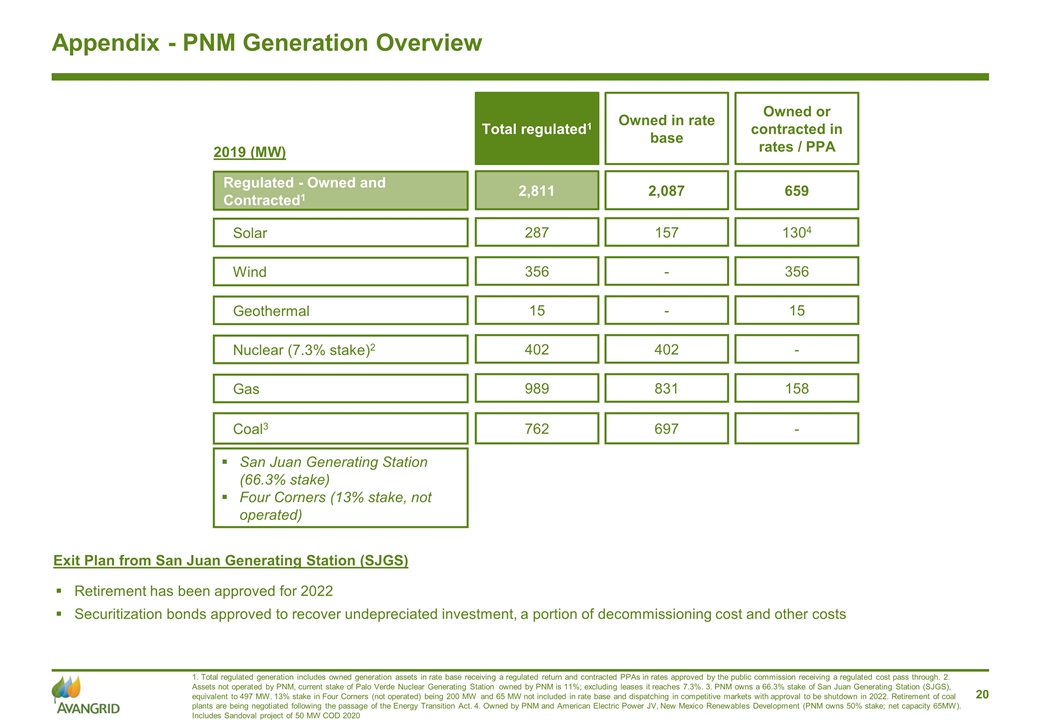
Appendix - PNM Generation Overview 1. Total regulated generation includes owned generation assets in rate base receiving a regulated return and contracted PPAs in rates approved by the public commission receiving a regulated cost pass through. 2. Assets not operated by PNM, current stake of Palo Verde Nuclear Generating Station owned by PNM is 11%; excluding leases it reaches 7.3%. 3. PNM owns a 66.3% stake of San Juan Generating Station (SJGS), equivalent to 497 MW. 13% stake in Four Corners (not operated) being 200 MW and 65 MW not included in rate base and dispatching in competitive markets with approval to be shutdown in 2022. Retirement of coal plants are being negotiated following the passage of the Energy Transition Act. 4. Owned by PNM and American Electric Power JV, New Mexico Renewables Development (PNM owns 50% stake; net capacity 65MW). Includes Sandoval project of 50 MW COD 2020 Retirement has been approved for 2022 Securitization bonds approved to recover undepreciated investment, a portion of decommissioning cost and other costs 2,087 Owned in rate base 659 Owned or contracted in rates / PPA 2,811 Total regulated1 Regulated - Owned and Contracted1 157 1304 287 Solar - 356 356 Wind - 15 15 Geothermal 402 - 402 Nuclear (7.3% stake)2 831 158 989 Gas 697 - 762 Coal3 2019 (MW) Exit Plan from San Juan Generating Station (SJGS) San Juan Generating Station (66.3% stake) Four Corners (13% stake, not operated)
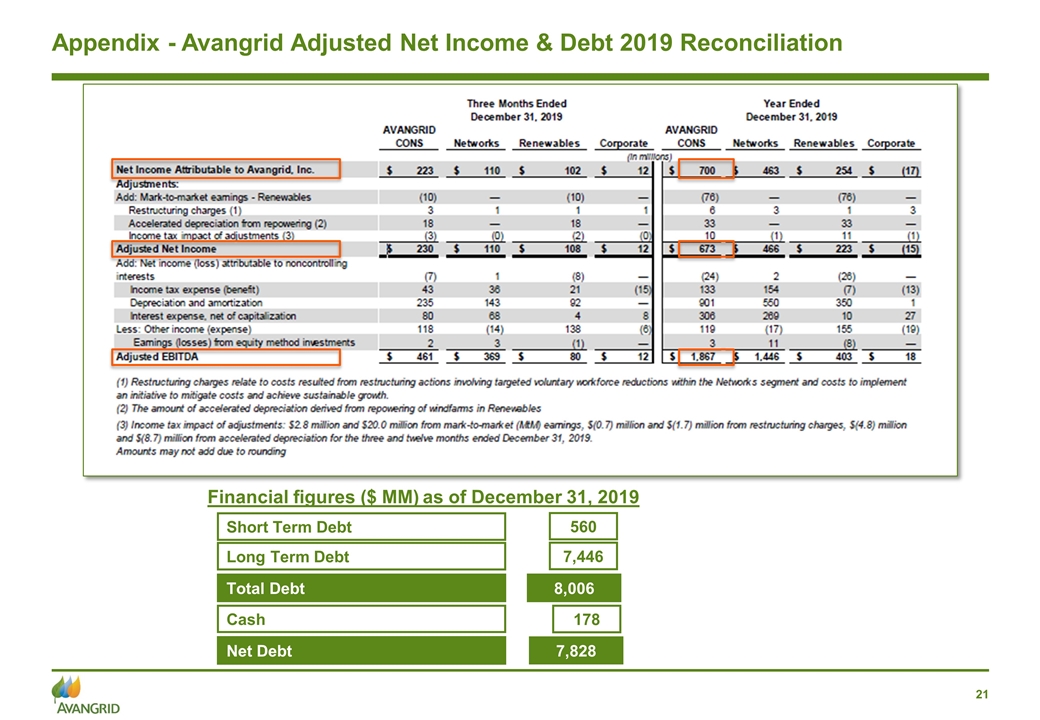
Appendix - Avangrid Adjusted Net Income & Debt 2019 Reconciliation Total Debt 8,006 Cash 178 Net Debt 7,828 Long Term Debt 7,446 Short Term Debt 560 Financial figures ($ MM) as of December 31, 2019


