UNITED STATES
SECURITIES AND EXCHANGE COMMISSION
Washington, D.C. 20549
FORM N-CSR
CERTIFIED SHAREHOLDER REPORT OF REGISTERED MANAGEMENT
INVESTMENT COMPANIES
Investment Company Act file number 811-23161
Nushares ETF Trust
(Exact name of registrant as specified in charter)
Nuveen Investments
333 West Wacker Drive, Chicago, IL 60606
(Address of principal executive offices) (Zip code)
Diana R. Gonzalez
Nuveen Investments
333 West Wacker Drive
Chicago, IL 60606
(Name and address of agent for service)
Registrant’s telephone number, including area code: (312) 917-7700
Date of fiscal year end: July 31
Date of reporting period: July 31, 2021
Form N-CSR is to be used by management investment companies to file reports with the Commission not later than 10 days after the transmission to stockholders of any report that is required to be transmitted to stockholders under Rule 30e-1 under the Investment Company Act of 1940 (17 CFR 270.30e-1). The Commission may use the information provided on Form N-CSR in its regulatory, disclosure review, inspection, and policy making roles.
A registrant is required to disclose the information specified by Form N-CSR, and the Commission will make this information public. A registrant is not required to respond to the collection of information contained in Form N-CSR unless the Form displays a currently valid Office of Management and Budget (“OMB”) control number. Please direct comments concerning the accuracy of the information collection burden estimate and any suggestions for reducing the burden to Secretary, Securities and Exchange Commission, 450 Fifth Street, NW, Washington, DC 20549-0609. The OMB has reviewed this collection of information under the clearance requirements of 44 U.S.C. ss.3507.
| ITEM 1. | REPORTS TO STOCKHOLDERS. |

Funds
| Fund Name | Listing Exchange | Ticker Symbol | |||
| Nuveen Enhanced Yield U.S. Aggregate Bond ETF | NYSE Arca | NUAG | |||
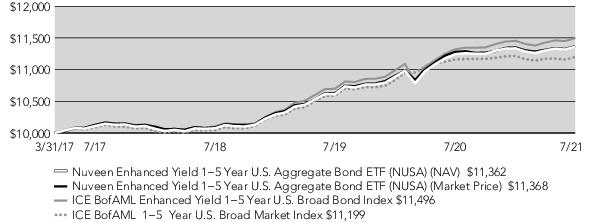
| Nuveen Enhanced Yield 1-5 Year U.S. Aggregate Bond ETF | NYSE Arca | NUSA | |||
| Nuveen ESG High Yield Corporate Bond ETF | NYSE Arca | NUHY | |||
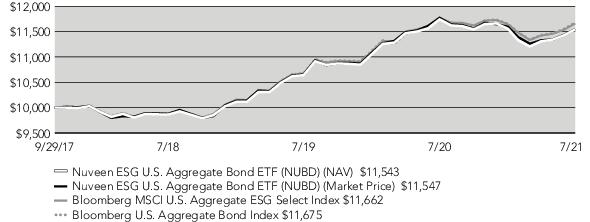
| Nuveen ESG U.S. Aggregate Bond ETF | NYSE Arca | NUBD |


| Total Returns as of July 31, 2021 | ||||
| Average Annual | ||||
| Inception Date | 1-Year | Since Inception | Expense Ratios | |
| NUAG at NAV | 9/14/16 | (0.81)% | 3.40% | 0.20% |
| NUAG at Market Price | 9/14/16 | (0.64)% | 3.40% | - |
| ICE BofA Enhanced Yield U.S. Broad Bond Index | - | (0.01)% | 3.78% | - |
| ICE BofA U.S. Broad Market Index | - | (0.82)% | 3.38% | - |

| Total Returns as of July 31, 2021 | ||||
| Average Annual | ||||
| Inception Date | 1-Year | Since Inception | Expense Ratios | |
| NUSA at NAV | 3/31/17 | 1.03% | 2.99% | 0.20% |
| NUSA at Market Price | 3/31/17 | 0.80% | 3.00% | - |
| ICE BofA Enhanced Yield 1-5 Year U.S. Broad Bond Index | - | 1.53% | 3.27% | - |
| ICE BofA 1-5 Year U.S. Broad Market Index | - | 0.34% | 2.65% | - |
| Total Returns as of July 31, 2021 | ||||
| Average Annual | ||||
| Inception Date | 1-Year | Since Inception | Expense Ratios | |
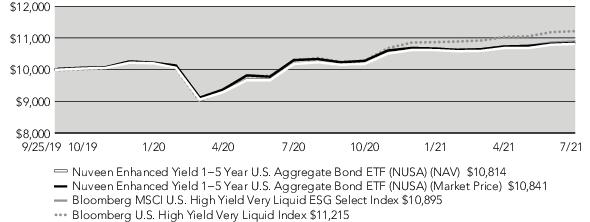
| NUHY at NAV | 9/25/19 | 6.32% | 4.37% | 0.35% |
| NUHY at Market Price | 9/25/19 | 5.25% | 4.48% | - |
| Bloomberg MSCI U.S. High Yield Very Liquid ESG Select Index | - | 6.83% | 4.75% | - |
| Bloomberg U.S. High Yield Very Liquid Index | - | 9.05% | 6.40% | - |
| Total Returns as of July 31, 2021 | ||||
| Average Annual | ||||
| Inception Date | 1-Year | Since Inception | Expense Ratios | |
| NUBD at NAV | 9/29/17 | (1.72)% | 3.81% | 0.20% |
| NUBD at Market Price | 9/29/17 | (1.90)% | 3.81% | - |
| Bloomberg MSCI U.S. Aggregate ESG Select Index | - | (0.95)% | 4.09% | - |
| Bloomberg U.S. Aggregate Bond Index | - | (0.70)% | 4.12% | - |
| Dividend Rate | 2.54% |
| SEC 30-Day Yield | 1.16% |
| Dividend Rate | 2.13% |
| SEC 30-Day Yield | 0.61% |
| Dividend Rate | 4.59% |
| SEC 30-Day Yield | 3.48% |
| Dividend Rate | 1.94% |
| SEC 30-Day Yield | 1.04% |
| Fund Allocation (% of net assets) | |
| Securitized | 38.6% |
| U.S. Treasury | 29.7% |
| Corporate Debt | 24.9% |
| Government Related - Long-Term | 6.1% |
| Investments Purchased with Collateral from Securities Lending | 0.9% |
| U.S. Government and Agency Obligations | 25.3% |
| Other Assets Less Liabilities1 | (25.5)% |
| Net Assets | 100% |
| Corporate Debt: Industries (% of total corporate debt holdings) | |
| Industrial | 60.2% |
| Financials | 14.6% |
| Utility | 25.2% |
| Total | 100% |
| Portfolio Credit Quality (% of total investments) | |
| U.S. Treasury/Agency | 71.4% |
| AAA | 1.1% |
| AA | 1.2% |
| A | 1.8% |
| BBB | 21.4% |
| N/R | 2.4% |
| N/A (not applicable) | 0.7% |
| Total | 100% |
| 1 | Includes payable for investments purchased on a when issued/delayed delivery basis as reported on the Statement of Assets and Liabilities. |
| Fund Allocation (% of net assets) | |
| Corporate Debt | 43.0% |
| Securitized | 30.0% |
| U.S. Treasury | 26.2% |
| Investments Purchased with Collateral from Securities Lending | 0.7% |
| U.S. Government and Agency Obligations | 1.8% |
| Other Assets Less Liabilities | (1.7)% |
| Net Assets | 100% |
| Corporate Debt: Industries (% of total corporate debt holdings) | |
| Industrial | 22.4% |
| Financials | 48.4% |
| Utility | 29.1% |
| Total | 100% |
| Portfolio Credit Quality (% of total investments) | |
| U.S. Treasury/Agency | 43.3% |
| AAA | 11.4% |
| AA | 2.6% |
| A | 15.2% |
| BBB | 27.5% |
| Total | 100% |
| Fund Allocation (% of net assets) | |
| Corporate Debt | 97.7% |
| Investments Purchased with Collateral from Securities Lending | 2.0% |
| U.S. Government and Agency Obligations | 0.2% |
| Other Assets Less Liabilities | 0.1% |
| Net Assets | 100% |
| Corporate Debt: Industries (% of total corporate debt holdings) | |
| Industrial | 90.8% |
| Financials | 7.9% |
| Utility | 1.3% |
| Total | 100% |
| Portfolio Credit Quality (% of total investments) | |
| U.S. Treasury/Agency | 0.2% |
| BBB | 2.8% |
| BB or Lower | 97.0% |
| Total | 100% |
| Fund Allocation (% of net assets) | |
| U.S. Treasury | 36.7% |
| Securitized | 29.8% |
| Corporate Debt | 27.0% |
| Government Related - Long-Term | 5.7% |
| Investments Purchased with Collateral from Securities Lending | 0.5% |
| U.S. Government and Agency Obligations | 0.7% |
| Other Assets Less Liabilities | (0.4)% |
| Net Assets | 100% |
| Corporate Debt: Industries (% of total corporate debt holdings) | |
| Industrial | 60.3% |
| Financials | 31.3% |
| Utility | 8.4% |
| Total | 100% |
| Portfolio Credit Quality (% of total investments) | |
| U.S. Treasury/Agency | 61.8% |
| AAA | 8.5% |
| AA | 2.6% |
| A | 13.9% |
| BBB | 12.4% |
| N/R (not rated) | 0.8% |
| Total | 100% |
| Actual Performance | |
| Beginning Account Value | $1,000.00 |
| Ending Account Value | $ 999.80 |
| Expenses Incurred During Period | $ 0.99 |
| Hypothetical Performance (5% annualized return before expenses) | |
| Beginning Account Value | $1,000.00 |
| Ending Account Value | $1,023.80 |
| Expenses Incurred During the Period | $ 1.00 |
| Actual Performance | |
| Beginning Account Value | $1,000.00 |
| Ending Account Value | $1,002.00 |
| Expenses Incurred During Period | $ 0.99 |
| Hypothetical Performance (5% annualized return before expenses) | |
| Beginning Account Value | $1,000.00 |
| Ending Account Value | $1,023.80 |
| Expenses Incurred During the Period | $ 1.00 |
| Actual Performance | |
| Beginning Account Value | $1,000.00 |
| Ending Account Value | $1,019.00 |
| Expenses Incurred During Period | $ 1.75 |
| Hypothetical Performance (5% annualized return before expenses) | |
| Beginning Account Value | $1,000.00 |
| Ending Account Value | $1,023.06 |
| Expenses Incurred During the Period | $ 1.76 |
| Actual Performance | |
| Beginning Account Value | $1,000.00 |
| Ending Account Value | $ 998.90 |
| Expenses Incurred During Period | $ 0.99 |
| Hypothetical Performance (5% annualized return before expenses) | |
| Beginning Account Value | $1,000.00 |
| Ending Account Value | $1,023.80 |
| Expenses Incurred During the Period | $ 1.00 |
| Principal Amount (000) | Description (1) | Coupon | Maturity | Ratings (2) | Value | |
| LONG-TERM INVESTMENTS – 99.3% | ||||||
| SECURITIZED – 38.6% | ||||||
| $ 400 | BANK 2021-BNK33 | 2.021% | 5/15/64 | Aaa | $409,318 | |
| 150 | Benchmark 2021-B27 Mortgage Trust | 2.703% | 7/15/54 | A- | 152,190 | |
| 250 | COMM 2015-LC19 Mortgage Trust | 3.527% | 2/10/48 | Aa1 | 268,901 | |
| 594 | Fannie Mae Pool AL9125 | 4.000% | 10/01/43 | N/R | 651,150 | |
| 274 | Fannie Mae Pool AS6302 | 3.500% | 12/01/45 | N/R | 294,698 | |
| 394 | Fannie Mae Pool AX4887 | 4.000% | 12/01/44 | N/R | 430,540 | |
| 1,636 | Fannie Mae Pool FN MA4356 | 2.500% | 6/01/51 | N/R | 1,705,013 | |
| 37 | Fannie Mae Pool MA1489 | 3.000% | 7/01/43 | Aaa | 39,156 | |
| 323 | Fannie Mae Pool MA2929 | 3.500% | 3/01/47 | Aaa | 345,546 | |
| 3,157 | Fannie Mae Pool MA3120, (DD1) | 3.500% | 9/01/47 | Aaa | 3,362,876 | |
| 119 | Fannie Mae Pool MA3211 | 4.000% | 12/01/47 | Aaa | 128,285 | |
| 213 | Fannie Mae Pool MA3239 | 4.000% | 1/01/48 | Aaa | 229,275 | |
| 285 | Fannie Mae Pool MA3276 | 3.500% | 2/01/48 | Aaa | 303,174 | |
| 73 | Fannie Mae Pool MA3277 | 4.000% | 2/01/48 | N/R | 77,767 | |
| 145 | Fannie Mae Pool MA3305 | 3.500% | 3/01/48 | N/R | 153,865 | |
| 48 | Fannie Mae Pool MA3306 | 4.000% | 3/01/48 | N/R | 51,325 | |
| 150 | Fannie Mae Pool MA3332 | 3.500% | 4/01/48 | Aaa | 159,155 | |
| 89 | Fannie Mae Pool MA3383 | 3.500% | 6/01/48 | Aaa | 94,159 | |
| 707 | Fannie Mae Pool MA3416 | 4.500% | 7/01/48 | Aaa | 762,011 | |
| 89 | Fannie Mae Pool MA3467 | 4.000% | 9/01/48 | Aaa | 95,520 | |
| 99 | Fannie Mae Pool MA3663 | 3.500% | 5/01/49 | Aaa | 104,618 | |
| 136 | Fannie Mae Pool MA3744 | 3.000% | 8/01/49 | N/R | 142,902 | |
| 154 | Fannie Mae Pool MA3774 | 3.000% | 9/01/49 | Aaa | 161,160 | |
| 204 | Fannie Mae Pool MA3905 | 3.000% | 1/01/50 | N/R | 213,723 | |
| 1,430 | Fannie Mae Pool MA4209, (WI/DD) | 1.500% | 12/01/50 | N/R | 1,415,329 | |
| 1,321 | Fannie Mae Pool MA4256 | 2.500% | 2/01/51 | N/R | 1,376,479 | |
| 689 | Fannie Mae Pool MA4304 | 1.500% | 4/01/51 | N/R | 681,941 | |
| 1,837 | Fannie Mae Pool MA4307 | 3.000% | 4/01/51 | N/R | 1,937,387 | |
| 4,171 | Fannie Mae Pool MA4355 | 2.000% | 6/01/51 | N/R | 4,254,448 | |
| 9,968 | Fannie Mae Pool MA4398, (WI/DD) | 2.000% | 8/01/51 | N/R | 10,166,215 | |
| 6,971 | Fannie Mae Pool MA4399, (WI/DD) | 2.500% | 8/01/51 | N/R | 7,263,606 | |
| 4,971 | Fannie Mae Pool MA4400, (WI/DD) | 3.000% | 8/01/51 | N/R | 5,243,131 | |
| 282 | Freddie Mac Gold Pool G08797 | 4.000% | 1/01/48 | N/R | 303,383 | |
| 125 | Freddie Mac Gold Pool G08800 | 3.500% | 2/01/48 | N/R | 133,036 | |
| 350 | Freddie Mac Multifamily Structured Pass-Through Certificates | 0.861% | 6/25/27 | Aaa | 350,912 | |
| 214 | Freddie Mac Multifamily Structured Pass-Through Certificates | 1.760% | 3/25/28 | Aaa | 222,298 |
| Principal Amount (000) | Description (1) | Coupon | Maturity | Ratings (2) | Value | |
| $ 199 | Freddie Mac Multifamily Structured Pass-Through Certificates | 1.353% | 11/25/30 | Aaa | $202,995 | |
| 349 | Ginnie Mae II Pool G2 MA7418 | 2.500% | 6/20/51 | N/R | 362,684 | |
| 30 | Ginnie Mae II Pool MA2149 | 4.000% | 8/20/44 | N/R | 32,858 | |
| 315 | Ginnie Mae II Pool MA3310 | 3.500% | 12/20/45 | Aaa | 335,767 | |
| 95 | Ginnie Mae II Pool MA3311 | 4.000% | 12/20/45 | Aaa | 102,837 | |
| 108 | Ginnie Mae II Pool MA3874 | 3.500% | 8/20/46 | Aaa | 114,993 | |
| 71 | Ginnie Mae II Pool MA3937 | 3.500% | 9/20/46 | Aaa | 75,463 | |
| 155 | Ginnie Mae II Pool MA4900 | 3.500% | 12/20/47 | Aaa | 164,632 | |
| 120 | Ginnie Mae II Pool MA4962 | 3.500% | 1/20/48 | Aaa | 127,527 | |
| 130 | Ginnie Mae II Pool MA5875 | 3.500% | 4/20/49 | Aaa | 136,411 | |
| 216 | Ginnie Mae II Pool MA6283 | 3.000% | 11/20/49 | N/R | 225,838 | |
| 224 | Ginnie Mae II Pool MA6338 | 3.000% | 12/20/49 | N/R | 234,120 | |
| 222 | Ginnie Mae II Pool MA6474 | 3.000% | 2/20/50 | N/R | 232,546 | |
| 927 | Ginnie Mae II Pool MA6994 | 2.000% | 11/20/50 | N/R | 950,177 | |
| 496 | Ginnie Mae II Pool MA7366 | 2.000% | 5/20/51 | N/R | 508,751 | |
| 1,984 | Ginnie Mae II Pool MA7367 | 2.500% | 5/20/51 | N/R | 2,062,577 | |
| 495 | Ginnie Mae II Pool MA7368 | 3.000% | 5/20/51 | N/R | 519,646 | |
| 349 | Ginnie Mae II Pool MA7417 | 2.000% | 6/20/51 | N/R | 357,707 | |
| 3,988 | Ginnie Mae II Pool MA7471, (WI/DD) | 2.000% | 7/20/51 | N/R | 4,087,216 | |
| 3,987 | Ginnie Mae II Pool MA7472, (WI/DD) | 2.500% | 7/20/51 | N/R | 4,145,580 | |
| 3,487 | Ginnie Mae II Pool MA7473, (WI/DD) | 3.000% | 7/20/51 | N/R | 3,670,256 | |
| 3,488 | Ginnie Mae II Pool MA7474, (WI/DD) | 3.500% | 7/20/51 | N/R | 3,711,246 | |
| 230 | GS Mortgage Securities Trust 2013-GC16 | 5.161% | 11/10/46 | Aa1 | 245,992 | |
| 233 | GS Mortgage Securities Trust 2016-GS4 | 3.178% | 11/10/49 | Aaa | 249,893 | |
| 250 | Morgan Stanley Capital I Trust 2021-L5 | 1.518% | 5/15/54 | AAA | 252,467 | |
| 250 | Wells Fargo Commercial Mortgage Trust 2014-LC16 | 4.020% | 8/15/50 | Aa2 | 261,796 | |
| $ 64,453 | Total Securitized (cost $66,631,913) | 67,056,467 |
| Principal Amount (000) | Description (1) | Coupon | Maturity | Ratings (2) | Value | |
| U.S. TREASURY – 29.7% | ||||||
| $ 13 | United States Treasury Note/Bond | 1.750% | 6/15/22 | AAA | $13,189 | |
| 2,243 | United States Treasury Note/Bond | 0.125% | 12/31/22 | AAA | 2,243,088 | |
| 9,950 | United States Treasury Note/Bond | 0.125% | 4/30/23 | AAA | 9,943,781 | |
| 840 | United States Treasury Note/Bond | 0.125% | 5/31/23 | AAA | 839,442 | |
| 1,200 | United States Treasury Note/Bond, (3) | 0.125% | 6/30/23 | AAA | 1,199,156 | |
| 1,183 | United States Treasury Note/Bond | 1.250% | 2/28/25 | AAA | 1,210,311 | |
| 634 | United States Treasury Note/Bond | 0.375% | 4/30/25 | AAA | 630,954 | |
| 2,208 | United States Treasury Note/Bond | 0.250% | 9/30/25 | AAA | 2,177,899 | |
| 2,695 | United States Treasury Note/Bond | 0.250% | 10/31/25 | AAA | 2,655,628 | |
| 425 | United States Treasury Note/Bond | 0.375% | 1/31/26 | AAA | 420,102 | |
| 425 | United States Treasury Note/Bond | 0.750% | 3/31/26 | AAA | 426,826 |
| Principal Amount (000) | Description (1) | Coupon | Maturity | Ratings (2) | Value | |
| $ 9,200 | United States Treasury Note/Bond | 0.750% | 4/30/26 | AAA | $9,236,656 | |
| 2,565 | United States Treasury Note/Bond | 0.750% | 5/31/26 | AAA | 2,573,416 | |
| 5,500 | United States Treasury Note/Bond | 0.875% | 6/30/26 | AAA | 5,548,555 | |
| 976 | United States Treasury Note/Bond | 3.125% | 11/15/28 | AAA | 1,119,541 | |
| 483 | United States Treasury Note/Bond | 2.375% | 5/15/29 | AAA | 529,470 | |
| 557 | United States Treasury Note/Bond | 1.625% | 8/15/29 | AAA | 579,541 | |
| 2,432 | United States Treasury Note/Bond | 0.625% | 5/15/30 | AAA | 2,319,900 | |
| 1,383 | United States Treasury Note/Bond | 0.875% | 11/15/30 | AAA | 1,342,158 | |
| 3,320 | United States Treasury Note/Bond | 1.625% | 5/15/31 | AAA | 3,437,756 | |
| 2,700 | United States Treasury Note/Bond | 1.875% | 2/15/51 | AA+ | 2,677,641 | |
| 420 | United States Treasury Note/Bond | 2.375% | 5/15/51 | AAA | 465,741 | |
| $ 51,352 | Total U.S. Treasury (cost $51,609,352) | 51,590,751 |
| Principal Amount (000) | Description (1) | Coupon | Maturity | Ratings (2) | Value | |
| CORPORATE DEBT – 24.9% | ||||||
| Financials – 3.6% | ||||||
| $ 22 | AerCap Ireland Capital DAC / AerCap Global Aviation Trust | 3.875% | 1/23/28 | BBB- | $23,776 | |
| 20 | Aetna Inc | 4.750% | 3/15/44 | BBB | 25,348 | |
| 13 | Air Lease Corp | 3.875% | 7/03/23 | BBB | 13,781 | |
| 30 | Air Lease Corp | 3.625% | 4/01/27 | BBB | 32,624 | |
| 10 | Air Lease Corp | 3.000% | 2/01/30 | BBB | 10,325 | |
| 130 | Alexandria Real Estate Equities Inc | 1.875% | 2/01/33 | BBB+ | 125,657 | |
| 131 | American International Group Inc | 4.200% | 4/01/28 | BBB+ | 151,496 | |
| 153 | Anthem Inc, (3) | 2.875% | 9/15/29 | BBB+ | 164,796 | |
| 100 | Anthem Inc | 3.125% | 5/15/50 | BBB+ | 104,633 | |
| 132 | Aon Corp | 3.750% | 5/02/29 | BBB+ | 149,734 | |
| 2 | Arch Capital Group US Inc | 5.144% | 11/01/43 | BBB+ | 2,665 | |
| 10 | Ares Capital Corp | 2.150% | 7/15/26 | BBB- | 10,075 | |
| 10 | Ares Capital Corp | 2.875% | 6/15/28 | BBB- | 10,310 | |
| 10 | Assurant Inc | 2.650% | 1/15/32 | BBB- | 10,108 | |
| 122 | Athene Holding Ltd | 6.150% | 4/03/30 | BBB+ | 156,441 | |
| 27 | AXIS Specialty Finance PLC | 4.000% | 12/06/27 | BBB+ | 30,168 | |
| 11 | BankUnited Inc | 5.125% | 6/11/30 | Baa3 | 12,951 | |
| 250 | Barclays PLC | 5.088% | 6/20/30 | BBB | 293,063 | |
| 10 | Blackstone Secured Lending Fund | 2.750% | 9/16/26 | Baa3 | 10,246 | |
| 100 | Blackstone Secured Lending Fund, 144A | 2.125% | 2/15/27 | Baa3 | 98,740 | |
| 75 | Boston Properties LP | 3.400% | 6/21/29 | BBB+ | 82,501 | |
| 34 | Brighthouse Financial Inc | 5.625% | 5/15/30 | BBB | 41,789 | |
| 100 | Brixmor Operating Partnership LP | 4.125% | 5/15/29 | BBB- | 114,049 | |
| 134 | Capital One Financial Corp | 3.800% | 1/31/28 | BBB+ | 151,237 | |
| 100 | Capital One Financial Corp | 2.359% | 7/29/32 | BBB | 100,801 |
| Principal Amount (000) | Description (1) | Coupon | Maturity | Ratings (2) | Value | |
| Financials (continued) | ||||||
| $ 10 | CI Financial Corp | 4.100% | 6/15/51 | BBB | $10,554 | |
| 65 | Citigroup Inc | 1.122% | 1/28/27 | A- | 64,440 | |
| 140 | Citigroup Inc | 1.462% | 6/09/27 | A- | 140,123 | |
| 9 | Citigroup Inc | 4.450% | 9/29/27 | BBB | 10,379 | |
| 17 | Citizens Financial Group Inc | 2.500% | 2/06/30 | BBB+ | 17,631 | |
| 32 | CNA Financial Corp | 3.900% | 5/01/29 | BBB+ | 36,473 | |
| 20 | Cooperatieve Rabobank UA | 3.750% | 7/21/26 | BBB+ | 22,115 | |
| 150 | Deutsche Bank AG/New York NY | 3.547% | 9/18/31 | BBB- | 161,924 | |
| 17 | Digital Realty Trust LP | 4.450% | 7/15/28 | BBB | 19,948 | |
| 150 | Discover Financial Services | 4.100% | 2/09/27 | BBB | 170,272 | |
| 10 | Duke Realty LP | 1.750% | 7/01/30 | BBB+ | 9,761 | |
| 11 | Duke Realty LP | 3.050% | 3/01/50 | BBB+ | 11,118 | |
| 100 | Equitable Holdings Inc | 4.350% | 4/20/28 | BBB | 115,501 | |
| 280 | Essex Portfolio LP | 2.550% | 6/15/31 | BBB+ | 290,068 | |
| 122 | Fairfax Financial Holdings Ltd | 4.625% | 4/29/30 | BBB- | 141,525 | |
| 100 | Federal Realty Investment Trust | 3.500% | 6/01/30 | BBB+ | 111,040 | |
| 100 | Fidelity National Financial Inc | 3.400% | 6/15/30 | BBB | 109,210 | |
| 14 | Fifth Third Bancorp | 3.950% | 3/14/28 | BBB+ | 16,253 | |
| 100 | First American Financial Corp | 2.400% | 8/15/31 | BBB | 98,892 | |
| 66 | GATX Corp | 4.550% | 11/07/28 | BBB | 77,263 | |
| 40 | GE Capital Funding LLC | 4.550% | 5/15/32 | BBB+ | 48,294 | |
| 285 | GE Capital International Funding Co Unlimited Co | 4.418% | 11/15/35 | BBB+ | 349,249 | |
| 15 | Goldman Sachs Group Inc | 2.615% | 4/22/32 | A- | 15,511 | |
| 100 | Goldman Sachs Group Inc | 2.383% | 7/21/32 | A- | 101,477 | |
| 100 | Golub Capital BDC Inc | 2.050% | 2/15/27 | BBB- | 98,998 | |
| 17 | Hartford Financial Services Group Inc | 6.100% | 10/01/41 | BBB+ | 24,763 | |
| 20 | Healthcare Trust of America Holdings LP | 3.100% | 2/15/30 | BBB | 21,573 | |
| 100 | Healthpeak Properties Inc | 2.875% | 1/15/31 | BBB+ | 106,604 | |
| 5 | Highwoods Realty LP | 3.050% | 2/15/30 | BBB | 5,379 | |
| 20 | HSBC Holdings PLC | 0.976% | 5/24/25 | A | 20,051 | |
| 30 | Humana Inc | 3.850% | 10/01/24 | BBB | 32,595 | |
| 100 | Humana Inc | 2.150% | 2/03/32 | BBB | 100,316 | |
| 15 | Huntington Bancshares Inc/OH | 4.000% | 5/15/25 | BBB+ | 16,698 | |
| 22 | Jefferies Financial Group Inc | 5.500% | 10/18/23 | BBB | 23,539 | |
| 10 | JPMorgan Chase & Co | 2.069% | 6/01/29 | A | 10,182 | |
| 4 | JPMorgan Chase & Co | 3.702% | 5/06/30 | A | 4,496 | |
| 100 | KeyCorp | 2.550% | 10/01/29 | BBB+ | 105,961 | |
| 22 | Kimco Realty Corp | 4.250% | 4/01/45 | BBB+ | 25,909 | |
| 17 | Lazard Group LLC | 4.500% | 9/19/28 | BBB | 19,779 | |
| 150 | Lincoln National Corp | 3.625% | 12/12/26 | BBB+ | 167,277 | |
| 12 | Manulife Financial Corp | 4.061% | 2/24/32 | BBB+ | 13,178 |
| Principal Amount (000) | Description (1) | Coupon | Maturity | Ratings (2) | Value | |
| Financials (continued) | ||||||
| $ 7 | Markel Corp | 5.000% | 5/20/49 | BBB | $9,310 | |
| 11 | Mid-America Apartments LP | 2.750% | 3/15/30 | BBB+ | 11,659 | |
| 19 | Morgan Stanley | 4.350% | 9/08/26 | BBB+ | 21,631 | |
| 100 | Morgan Stanley | 1.512% | 7/20/27 | A | 100,810 | |
| 100 | National Retail Properties Inc | 2.500% | 4/15/30 | BBB+ | 103,485 | |
| 160 | Natwest Group PLC | 5.076% | 1/27/30 | BBB+ | 191,673 | |
| 34 | Nomura Holdings Inc | 2.679% | 7/16/30 | BBB+ | 34,793 | |
| 10 | Old Republic International Corp | 3.850% | 6/11/51 | BBB | 10,859 | |
| 22 | Omega Healthcare Investors Inc | 4.750% | 1/15/28 | BBB- | 25,154 | |
| 10 | Owl Rock Capital Corp | 2.625% | 1/15/27 | BBB- | 10,115 | |
| 30 | Prudential Financial Inc | 5.375% | 5/15/45 | BBB+ | 33,091 | |
| 100 | Prudential Financial Inc | 3.700% | 10/01/50 | BBB+ | 105,591 | |
| 17 | Regency Centers LP | 4.400% | 2/01/47 | BBB+ | 20,387 | |
| 18 | Reinsurance Group of America Inc | 4.700% | 9/15/23 | BBB+ | 19,533 | |
| 28 | Santander Holdings USA Inc | 3.244% | 10/05/26 | BBB | 30,120 | |
| 20 | Spirit Realty LP | 2.100% | 3/15/28 | BBB | 20,218 | |
| 20 | SVB Financial Group | 1.800% | 2/02/31 | BBB+ | 19,432 | |
| 23 | Synchrony Financial | 3.950% | 12/01/27 | BBB- | 25,712 | |
| 25 | UDR Inc | 3.000% | 8/15/31 | BBB+ | 26,811 | |
| 13 | Unum Group | 4.500% | 12/15/49 | BBB- | 14,016 | |
| 122 | Ventas Realty LP | 4.750% | 11/15/30 | BBB+ | 147,463 | |
| 100 | VEREIT Operating Partnership LP | 3.100% | 12/15/29 | BBB | 108,613 | |
| 84 | Wachovia Corp | 5.500% | 8/01/35 | BBB+ | 110,861 | |
| 100 | Welltower Inc | 2.800% | 6/01/31 | BBB+ | 105,587 | |
| 140 | Westpac Banking Corp | 1.150% | 6/03/26 | AA- | 141,358 | |
| 11 | Willis North America Inc | 4.500% | 9/15/28 | BBB | 12,806 | |
| 5,757 | Total Financials | 6,334,721 | ||||
| Industrial – 15.0% | ||||||
| 150 | AbbVie Inc | 3.200% | 11/21/29 | BBB | 164,520 | |
| 230 | AbbVie Inc | 4.050% | 11/21/39 | BBB | 270,796 | |
| 159 | AbbVie Inc | 4.625% | 10/01/42 | BBB | 199,590 | |
| 12 | Altria Group Inc | 3.400% | 5/06/30 | BBB+ | 12,933 | |
| 147 | Altria Group Inc | 5.800% | 2/14/39 | BBB+ | 184,387 | |
| 100 | Altria Group Inc | 3.875% | 9/16/46 | BBB+ | 101,187 | |
| 6 | Altria Group Inc | 5.950% | 2/14/49 | BBB+ | 7,805 | |
| 20 | Amcor Flexibles North America Inc | 2.690% | 5/25/31 | BBB | 20,864 | |
| 213 | American Tower Corp | 2.100% | 6/15/30 | BBB | 212,981 | |
| 30 | AmerisourceBergen Corp | 2.700% | 3/15/31 | BBB+ | 31,332 | |
| 100 | Amgen Inc, (3) | 2.300% | 2/25/31 | BBB+ | 103,099 | |
| 224 | Amgen Inc | 3.150% | 2/21/40 | BBB+ | 239,367 |
| Principal Amount (000) | Description (1) | Coupon | Maturity | Ratings (2) | Value | |
| Industrial (continued) | ||||||
| $ 17 | Amgen Inc | 5.150% | 11/15/41 | BBB+ | $22,794 | |
| 209 | Anheuser-Busch Cos LLC / Anheuser-Busch InBev Worldwide Inc | 4.900% | 2/01/46 | BBB+ | 267,680 | |
| 83 | Anheuser-Busch InBev Worldwide Inc | 4.000% | 4/13/28 | BBB+ | 95,228 | |
| 282 | Anheuser-Busch InBev Worldwide Inc | 4.350% | 6/01/40 | BBB+ | 341,171 | |
| 145 | Anheuser-Busch InBev Worldwide Inc | 4.600% | 6/01/60 | BBB+ | 181,818 | |
| 279 | AT&T Inc | 2.750% | 6/01/31 | BBB | 293,998 | |
| 296 | AT&T Inc | 4.850% | 3/01/39 | BBB | 362,928 | |
| 150 | AT&T Inc | 3.500% | 6/01/41 | BBB | 159,171 | |
| 145 | AT&T Inc | 4.900% | 6/15/42 | BBB | 180,137 | |
| 19 | AutoNation Inc | 4.500% | 10/01/25 | BBB- | 21,185 | |
| 10 | AutoZone Inc | 3.750% | 4/18/29 | BBB | 11,297 | |
| 50 | AutoZone Inc | 4.000% | 4/15/30 | BBB | 57,636 | |
| 117 | Barrick North America Finance LLC | 5.700% | 5/30/41 | BBB | 162,987 | |
| 100 | BAT Capital Corp | 3.557% | 8/15/27 | BBB | 108,203 | |
| 209 | BAT Capital Corp | 4.390% | 8/15/37 | BBB | 229,526 | |
| 27 | Baxter International Inc | 3.500% | 8/15/46 | A- | 30,586 | |
| 100 | Becton Dickinson and Co | 1.957% | 2/11/31 | BBB- | 99,076 | |
| 32 | Becton Dickinson and Co | 4.685% | 12/15/44 | BBB- | 40,721 | |
| 30 | Bell Telephone Co of Canada or Bell Canada | 4.464% | 4/01/48 | BBB+ | 37,469 | |
| 100 | Biogen Inc | 5.200% | 9/15/45 | BBB+ | 133,632 | |
| 10 | Block Financial LLC | 2.500% | 7/15/28 | BBB- | 10,217 | |
| 84 | Boeing Co | 6.125% | 2/15/33 | BBB- | 108,226 | |
| 35 | Boeing Co, (3) | 3.300% | 3/01/35 | BBB- | 35,703 | |
| 150 | Boeing Co | 3.500% | 3/01/39 | BBB- | 153,512 | |
| 24 | Boeing Co | 5.875% | 2/15/40 | BBB- | 31,659 | |
| 209 | Boeing Co | 5.705% | 5/01/40 | BBB- | 271,295 | |
| 18 | BorgWarner Inc | 4.375% | 3/15/45 | BBB+ | 21,192 | |
| 100 | Boston Scientific Corp | 4.550% | 3/01/39 | BBB | 123,926 | |
| 15 | BP Capital Markets America Inc | 3.379% | 2/08/61 | A | 15,577 | |
| 200 | British Telecommunications PLC | 5.125% | 12/04/28 | BBB | 237,908 | |
| 130 | Broadcom Corp / Broadcom Cayman Finance Ltd | 3.500% | 1/15/28 | BBB- | 142,606 | |
| 282 | Broadcom Inc | 4.750% | 4/15/29 | BBB- | 330,865 | |
| 10 | Broadridge Financial Solutions Inc | 2.600% | 5/01/31 | BBB+ | 10,387 | |
| 74 | Canadian Natural Resources Ltd | 5.850% | 2/01/35 | BBB- | 97,006 | |
| 12 | Canadian Natural Resources Ltd | 6.750% | 2/01/39 | BBB- | 17,068 | |
| 30 | Canadian Pacific Railway Co | 2.050% | 3/05/30 | BBB | 30,255 | |
| 100 | Canadian Pacific Railway Co | 4.800% | 8/01/45 | BBB | 130,957 | |
| 30 | Cardinal Health Inc | 4.500% | 11/15/44 | BBB | 35,373 | |
| 154 | Carrier Global Corp | 2.722% | 2/15/30 | BBB- | 162,959 | |
| 100 | Cenovus Energy Inc | 5.250% | 6/15/37 | BBB- | 120,560 |
| Principal Amount (000) | Description (1) | Coupon | Maturity | Ratings (2) | Value | |
| Industrial (continued) | ||||||
| $ 250 | Charter Communications Operating LLC / Charter Communications Operating Capital | 5.375% | 4/01/38 | BBB- | $310,909 | |
| 155 | Charter Communications Operating LLC / Charter Communications Operating Capital | 5.375% | 5/01/47 | BBB- | 191,585 | |
| 11 | Choice Hotels International Inc | 3.700% | 1/15/31 | BBB- | 12,062 | |
| 21 | Cigna Corp | 4.500% | 2/25/26 | BBB+ | 23,981 | |
| 209 | Cigna Corp | 4.900% | 12/15/48 | BBB+ | 277,049 | |
| 10 | Cimarex Energy Co | 4.375% | 6/01/24 | BBB- | 10,865 | |
| 10 | CNH Industrial Capital LLC | 1.450% | 7/15/26 | BBB- | 10,058 | |
| 100 | CommonSpirit Health | 2.782% | 10/01/30 | BBB+ | 105,633 | |
| 100 | Conagra Brands Inc | 4.850% | 11/01/28 | BBB- | 120,058 | |
| 20 | Conagra Brands Inc | 5.300% | 11/01/38 | BBB- | 25,789 | |
| 11 | ConocoPhillips, 144A | 2.400% | 2/15/31 | A- | 11,469 | |
| 100 | Constellation Brands Inc | 5.250% | 11/15/48 | BBB- | 137,434 | |
| 100 | Corning Inc | 3.900% | 11/15/49 | BBB+ | 114,995 | |
| 180 | Crown Castle International Corp | 2.500% | 7/15/31 | BBB | 184,276 | |
| 18 | CSX Corp | 4.250% | 3/15/29 | BBB+ | 21,103 | |
| 156 | CSX Corp | 3.800% | 4/15/50 | BBB+ | 184,363 | |
| 100 | CVS Health Corp | 1.750% | 8/21/30 | BBB | 97,821 | |
| 222 | CVS Health Corp | 4.875% | 7/20/35 | BBB | 276,080 | |
| 227 | CVS Health Corp | 4.780% | 3/25/38 | BBB | 284,386 | |
| 100 | Danaher Corp | 4.375% | 9/15/45 | BBB+ | 128,290 | |
| 77 | Dell International LLC / EMC Corp | 6.200% | 7/15/30 | BBB- | 99,685 | |
| 25 | Dell International LLC / EMC Corp | 8.350% | 7/15/46 | BBB- | 41,398 | |
| 70 | Deutsche Telekom International Finance BV | 8.750% | 6/15/30 | BBB+ | 105,748 | |
| 17 | Devon Energy Corp | 5.600% | 7/15/41 | BBB- | 21,186 | |
| 20 | Diamondback Energy Inc | 3.125% | 3/24/31 | BBB- | 20,973 | |
| 14 | Dignity Health | 5.267% | 11/01/64 | BBB+ | 19,780 | |
| 143 | Discovery Communications LLC | 4.000% | 9/15/55 | BBB- | 153,428 | |
| 17 | Dollar General Corp | 4.125% | 4/03/50 | BBB | 20,443 | |
| 150 | Dow Chemical Co | 4.250% | 10/01/34 | BBB | 177,626 | |
| 100 | DR Horton Inc | 1.300% | 10/15/26 | BBB | 100,098 | |
| 127 | DuPont de Nemours Inc | 5.319% | 11/15/38 | BBB+ | 169,473 | |
| 10 | Eagle Materials Inc | 2.500% | 7/01/31 | BBB | 10,098 | |
| 38 | Eaton Corp | 4.150% | 11/02/42 | BBB+ | 46,242 | |
| 110 | eBay Inc | 2.600% | 5/10/31 | BBB+ | 113,930 | |
| 9 | Electronic Arts Inc | 4.800% | 3/01/26 | BBB+ | 10,412 | |
| 12 | Enable Midstream Partners LP | 4.150% | 9/15/29 | BBB- | 13,323 | |
| 22 | Enable Midstream Partners LP | 5.000% | 5/15/44 | BBB- | 24,252 | |
| 280 | Energy Transfer LP | 5.800% | 6/15/38 | BBB- | 347,461 | |
| 227 | Enterprise Products Operating LLC | 5.750% | 3/01/35 | BBB+ | 298,068 |
| Principal Amount (000) | Description (1) | Coupon | Maturity | Ratings (2) | Value | |
| Industrial (continued) | ||||||
| $ 100 | Enterprise Products Operating LLC | 3.950% | 1/31/60 | BBB+ | $112,556 | |
| 140 | Equinix Inc | 2.500% | 5/15/31 | BBB | 145,074 | |
| 100 | Expedia Group Inc | 3.800% | 2/15/28 | BBB- | 109,529 | |
| 24 | Expedia Group Inc | 3.250% | 2/15/30 | BBB- | 25,166 | |
| 7 | FedEx Corp | 3.100% | 8/05/29 | BBB | 7,657 | |
| 27 | FedEx Corp | 3.900% | 2/01/35 | BBB | 31,556 | |
| 134 | FedEx Corp | 4.050% | 2/15/48 | BBB | 155,926 | |
| 100 | Fidelity National Information Services Inc | 1.650% | 3/01/28 | BBB | 100,832 | |
| 17 | Fidelity National Information Services Inc | 4.500% | 8/15/46 | BBB | 21,692 | |
| 214 | Fiserv Inc | 4.400% | 7/01/49 | BBB | 263,434 | |
| 16 | Fortive Corp | 4.300% | 6/15/46 | BBB | 19,425 | |
| 138 | Fox Corp, (3) | 3.500% | 4/08/30 | BBB | 153,769 | |
| 200 | General Electric Co | 4.250% | 5/01/40 | BBB+ | 238,431 | |
| 100 | General Mills Inc | 4.550% | 4/17/38 | BBB | 123,387 | |
| 208 | General Motors Co | 6.600% | 4/01/36 | BBB- | 287,588 | |
| 20 | General Motors Financial Co Inc | 2.400% | 4/10/28 | BBB- | 20,516 | |
| 160 | Gilead Sciences Inc | 4.750% | 3/01/46 | BBB+ | 207,968 | |
| 28 | Global Payments Inc | 4.450% | 6/01/28 | BBB- | 32,521 | |
| 100 | Global Payments Inc | 2.900% | 5/15/30 | BBB- | 106,141 | |
| 38 | GLP Capital LP / GLP Financing II Inc | 5.300% | 1/15/29 | BBB- | 44,778 | |
| 100 | Halliburton Co | 4.850% | 11/15/35 | BBB+ | 119,351 | |
| 30 | Halliburton Co | 4.750% | 8/01/43 | BBB+ | 34,815 | |
| 20 | Hasbro Inc | 3.900% | 11/19/29 | BBB- | 22,508 | |
| 131 | HCA Inc | 4.125% | 6/15/29 | BBB- | 149,389 | |
| 10 | HCA Inc | 3.500% | 7/15/51 | BBB- | 10,315 | |
| 6 | Helmerich & Payne Inc | 4.650% | 3/15/25 | BBB+ | 6,724 | |
| 35 | Hess Corp | 4.300% | 4/01/27 | BBB- | 39,105 | |
| 28 | Hewlett Packard Enterprise Co | 6.200% | 10/15/35 | BBB | 38,828 | |
| 100 | HP Inc | 3.400% | 6/17/30 | BBB | 107,298 | |
| 10 | HP Inc, 144A | 2.650% | 6/17/31 | BBB | 10,097 | |
| 17 | HP Inc | 6.000% | 9/15/41 | BBB | 22,372 | |
| 10 | Huntsman International LLC | 2.950% | 6/15/31 | BBB- | 10,360 | |
| 10 | IDEX Corp | 2.625% | 6/15/31 | BBB | 10,379 | |
| 31 | International Paper Co | 4.800% | 6/15/44 | BBB | 40,501 | |
| 27 | International Paper Co | 4.400% | 8/15/47 | BBB | 34,257 | |
| 37 | J M Smucker Co | 4.250% | 3/15/35 | BBB | 44,188 | |
| 34 | Johnson Controls International plc | 4.625% | 7/02/44 | BBB | 42,965 | |
| 6 | Kansas City Southern | 4.300% | 5/15/43 | BBB | 7,224 | |
| 100 | Kansas City Southern | 4.700% | 5/01/48 | BBB | 127,289 | |
| 24 | Kellogg Co | 2.100% | 6/01/30 | BBB | 24,358 | |
| 34 | Keurig Dr Pepper Inc | 3.200% | 5/01/30 | BBB | 37,406 |
| Principal Amount (000) | Description (1) | Coupon | Maturity | Ratings (2) | Value | |
| Industrial (continued) | ||||||
| $ 100 | Keurig Dr Pepper Inc | 4.985% | 5/25/38 | BBB | $128,807 | |
| 70 | Kinder Morgan Energy Partners LP | 6.375% | 3/01/41 | BBB | 97,952 | |
| 209 | Kinder Morgan Inc | 5.200% | 3/01/48 | BBB | 267,355 | |
| 6 | Kroger Co | 2.200% | 5/01/30 | BBB | 6,099 | |
| 150 | Kroger Co | 1.700% | 1/15/31 | BBB | 145,927 | |
| 26 | Kroger Co | 5.400% | 1/15/49 | BBB | 36,182 | |
| 30 | L3Harris Technologies Inc | 2.900% | 12/15/29 | BBB | 32,253 | |
| 100 | L3Harris Technologies Inc | 1.800% | 1/15/31 | BBB | 98,463 | |
| 65 | Laboratory Corp of America Holdings | 2.700% | 6/01/31 | BBB | 67,456 | |
| 50 | Las Vegas Sands Corp | 3.500% | 8/18/26 | BBB- | 52,649 | |
| 50 | Lear Corp | 3.500% | 5/30/30 | BBB | 54,889 | |
| 224 | Lowe's Cos Inc | 4.500% | 4/15/30 | BBB+ | 267,191 | |
| 10 | Lowe's Cos Inc | 2.625% | 4/01/31 | BBB+ | 10,505 | |
| 186 | LYB International Finance BV | 5.250% | 7/15/43 | BBB | 246,073 | |
| 22 | Magellan Midstream Partners LP | 4.200% | 3/15/45 | BBB+ | 23,709 | |
| 12 | Magellan Midstream Partners LP | 4.250% | 9/15/46 | BBB+ | 13,782 | |
| 11 | Magellan Midstream Partners LP | 3.950% | 3/01/50 | BBB+ | 12,087 | |
| 17 | Marathon Petroleum Corp | 5.000% | 9/15/54 | BBB | 20,926 | |
| 50 | Marriott International Inc/MD | 4.650% | 12/01/28 | BBB- | 57,808 | |
| 27 | Marriott International Inc/MD | 4.500% | 10/01/34 | BBB- | 30,940 | |
| 16 | Martin Marietta Materials Inc | 2.500% | 3/15/30 | BBB | 16,527 | |
| 10 | Masco Corp | 1.500% | 2/15/28 | BBB | 9,908 | |
| 150 | McDonald's Corp | 4.700% | 12/09/35 | BBB+ | 189,723 | |
| 9 | McDonald's Corp | 6.300% | 10/15/37 | BBB+ | 13,062 | |
| 91 | McDonald's Corp | 4.875% | 7/15/40 | BBB+ | 116,649 | |
| 17 | Micron Technology Inc | 5.327% | 2/06/29 | BBB- | 20,648 | |
| 30 | Molson Coors Beverage Co | 4.200% | 7/15/46 | BBB- | 34,033 | |
| 30 | Mondelez International Inc | 1.875% | 10/15/32 | BBB | 29,597 | |
| 10 | Mosaic Co | 4.050% | 11/15/27 | BBB- | 11,337 | |
| 100 | Motorola Solutions Inc | 2.300% | 11/15/30 | BBB- | 99,870 | |
| 30 | Motorola Solutions Inc | 2.750% | 5/24/31 | BBB- | 31,084 | |
| 29 | MPLX LP | 4.500% | 7/15/23 | BBB | 30,942 | |
| 234 | MPLX LP | 4.500% | 4/15/38 | BBB | 269,930 | |
| 15 | Mylan Inc | 4.550% | 4/15/28 | BBB- | 17,392 | |
| 30 | NetApp Inc | 2.700% | 6/22/30 | BBB | 31,628 | |
| 100 | Newmont Corp | 5.875% | 4/01/35 | BBB | 136,191 | |
| 50 | Nordstrom Inc | 4.375% | 4/01/30 | BBB- | 52,721 | |
| 142 | Norfolk Southern Corp | 4.800% | 8/15/43 | BBB+ | 176,732 | |
| 138 | Northrop Grumman Corp | 4.400% | 5/01/30 | BBB | 164,838 | |
| 18 | Nucor Corp, 144A | 2.979% | 12/15/55 | BBB+ | 18,086 | |
| 100 | Nutrien Ltd | 5.875% | 12/01/36 | BBB | 138,539 |
| Principal Amount (000) | Description (1) | Coupon | Maturity | Ratings (2) | Value | |
| Industrial (continued) | ||||||
| $ 28 | NXP BV / NXP Funding LLC, 144A | 5.550% | 12/01/28 | BBB- | $34,654 | |
| 100 | NXP BV / NXP Funding LLC / NXP USA Inc, 144A | 2.500% | 5/11/31 | BBB- | 103,555 | |
| 17 | Omnicom Group Inc | 4.200% | 6/01/30 | BBB+ | 19,728 | |
| 34 | ONEOK Inc | 4.550% | 7/15/28 | BBB | 39,161 | |
| 4 | ONEOK Partners LP | 6.650% | 10/01/36 | BBB | 5,464 | |
| 200 | ONEOK Partners LP | 6.125% | 2/01/41 | BBB | 261,999 | |
| 700 | Oracle Corp | 3.800% | 11/15/37 | BBB+ | 776,233 | |
| 100 | Oracle Corp | 3.650% | 3/25/41 | BBB+ | 108,136 | |
| 35 | Orange SA | 5.375% | 1/13/42 | BBB+ | 48,330 | |
| 22 | O'Reilly Automotive Inc | 1.750% | 3/15/31 | BBB | 21,479 | |
| 131 | Otis Worldwide Corp | 3.112% | 2/15/40 | BBB | 137,932 | |
| 22 | Owens Corning | 4.300% | 7/15/47 | BBB- | 26,087 | |
| 33 | Parker-Hannifin Corp | 4.450% | 11/21/44 | BBB+ | 41,997 | |
| 34 | PayPal Holdings Inc | 3.250% | 6/01/50 | A- | 37,786 | |
| 100 | Phillips 66 | 4.650% | 11/15/34 | BBB+ | 119,765 | |
| 27 | Phillips 66 | 5.875% | 5/01/42 | BBB+ | 37,722 | |
| 14 | Pioneer Natural Resources Co | 4.450% | 1/15/26 | BBB | 15,824 | |
| 31 | Plains All American Pipeline LP / PAA Finance Corp | 3.800% | 9/15/30 | BBB- | 33,593 | |
| 100 | Raytheon Technologies Corp | 2.650% | 11/01/26 | BBB+ | 107,191 | |
| 17 | Raytheon Technologies Corp | 6.125% | 7/15/38 | BBB+ | 24,463 | |
| 16 | Raytheon Technologies Corp | 3.750% | 11/01/46 | BBB+ | 18,507 | |
| 224 | Raytheon Technologies Corp | 4.625% | 11/16/48 | BBB+ | 294,697 | |
| 14 | RELX Capital Inc | 3.000% | 5/22/30 | BBB+ | 15,096 | |
| 39 | Republic Services Inc | 3.950% | 5/15/28 | BBB | 44,761 | |
| 32 | Reynolds American Inc | 5.700% | 8/15/35 | BBB | 39,490 | |
| 130 | Rogers Communications Inc | 5.000% | 3/15/44 | BBB+ | 165,026 | |
| 34 | Roper Technologies Inc | 2.950% | 9/15/29 | BBB | 36,807 | |
| 100 | Royalty Pharma PLC | 2.150% | 9/02/31 | BBB- | 98,368 | |
| 14 | RPM International Inc | 4.250% | 1/15/48 | BBB- | 15,699 | |
| 137 | Sabine Pass Liquefaction LLC | 4.200% | 3/15/28 | BBB- | 155,272 | |
| 22 | Sands China Ltd | 5.400% | 8/08/28 | BBB- | 25,667 | |
| 100 | Sherwin-Williams Co | 4.000% | 12/15/42 | BBB | 117,938 | |
| 127 | Southern Copper Corp | 5.250% | 11/08/42 | BBB+ | 160,655 | |
| 21 | Southwest Airlines Co | 3.450% | 11/16/27 | BBB+ | 22,933 | |
| 147 | Spectra Energy Partners LP | 4.500% | 3/15/45 | BBB+ | 176,447 | |
| 132 | Starbucks Corp | 3.550% | 8/15/29 | BBB+ | 149,478 | |
| 11 | Starbucks Corp | 3.350% | 3/12/50 | BBB+ | 11,883 | |
| 24 | Stryker Corp | 4.100% | 4/01/43 | BBB+ | 29,040 | |
| 200 | Suncor Energy Inc | 4.000% | 11/15/47 | BBB+ | 227,562 | |
| 11 | Suzano Austria GmbH | 6.000% | 1/15/29 | BBB- | 13,105 | |
| 20 | Suzano Austria GmbH | 3.125% | 1/15/32 | BBB- | 19,820 |
| Principal Amount (000) | Description (1) | Coupon | Maturity | Ratings (2) | Value | |
| Industrial (continued) | ||||||
| $ 100 | Sysco Corp | 5.950% | 4/01/30 | BBB | $129,539 | |
| 200 | Takeda Pharmaceutical Co Ltd | 2.050% | 3/31/30 | BBB | 201,584 | |
| 17 | Teck Resources Ltd | 6.000% | 8/15/40 | BBB- | 22,143 | |
| 150 | Telefonica Emisiones SA | 4.103% | 3/08/27 | BBB- | 169,591 | |
| 16 | Textron Inc | 3.000% | 6/01/30 | BBB | 17,108 | |
| 100 | Thermo Fisher Scientific Inc | 2.600% | 10/01/29 | BBB+ | 106,371 | |
| 22 | Thermo Fisher Scientific Inc | 4.497% | 3/25/30 | BBB+ | 26,577 | |
| 150 | Time Warner Cable LLC | 5.500% | 9/01/41 | BBB- | 189,487 | |
| 500 | T-Mobile USA Inc | 2.250% | 11/15/31 | BBB- | 501,160 | |
| 70 | Toledo Hospital | 6.015% | 11/15/48 | BBB- | 87,298 | |
| 100 | Trane Technologies Global Holding Co Ltd | 5.750% | 6/15/43 | BBB | 146,422 | |
| 89 | TransCanada PipeLines Ltd | 4.100% | 4/15/30 | BBB+ | 102,983 | |
| 75 | TransCanada PipeLines Ltd | 5.100% | 3/15/49 | BBB+ | 100,176 | |
| 279 | Transcontinental Gas Pipe Line Co LLC | 3.250% | 5/15/30 | BBB+ | 304,048 | |
| 17 | Tyson Foods Inc | 5.150% | 8/15/44 | BBB | 22,384 | |
| 15 | Tyson Foods Inc | 5.100% | 9/28/48 | BBB | 20,200 | |
| 217 | Union Pacific Corp | 3.875% | 2/01/55 | BBB+ | 251,048 | |
| 34 | Vale Overseas Ltd | 6.250% | 8/10/26 | BBB- | 40,814 | |
| 18 | Valero Energy Corp | 3.650% | 3/15/25 | BBB | 19,599 | |
| 34 | Valero Energy Corp | 2.150% | 9/15/27 | BBB | 34,625 | |
| 300 | Verizon Communications Inc | 2.625% | 8/15/26 | BBB+ | 319,766 | |
| 283 | Verizon Communications Inc | 4.812% | 3/15/39 | BBB+ | 363,166 | |
| 225 | Verizon Communications Inc | 4.862% | 8/21/46 | BBB+ | 295,816 | |
| 213 | Verizon Communications Inc | 4.000% | 3/22/50 | BBB+ | 248,978 | |
| 50 | VF Corp, (3) | 2.950% | 4/23/30 | BBB+ | 53,560 | |
| 134 | ViacomCBS Inc | 4.900% | 8/15/44 | BBB | 166,750 | |
| 34 | Viatris Inc, 144A | 3.850% | 6/22/40 | BBB- | 37,026 | |
| 30 | VMware Inc, (WI/DD) | 1.400% | 8/15/26 | BBB- | 30,096 | |
| 18 | VMware Inc | 4.700% | 5/15/30 | BBB- | 21,625 | |
| 140 | Vodafone Group PLC | 4.375% | 2/19/43 | BBB | 165,051 | |
| 73 | Vodafone Group PLC | 4.875% | 6/19/49 | BBB | 93,028 | |
| 100 | Vulcan Materials Co | 3.500% | 6/01/30 | BBB | 111,367 | |
| 30 | Walgreens Boots Alliance Inc | 4.500% | 11/18/34 | BBB | 35,672 | |
| 100 | Waste Management Inc | 3.900% | 3/01/35 | BBB+ | 118,731 | |
| 100 | Weyerhaeuser Co | 4.000% | 4/15/30 | BBB | 114,737 | |
| 100 | WRKCo Inc | 4.900% | 3/15/29 | BBB | 120,929 | |
| 6 | Zimmer Biomet Holdings Inc | 5.750% | 11/30/39 | BBB | 8,199 |
| Principal Amount (000) | Description (1) | Coupon | Maturity | Ratings (2) | Value | |
| Industrial (continued) | ||||||
| $ 107 | Zoetis Inc | 4.700% | 2/01/43 | BBB | $ 140,574 | |
| 22,111 | Total Industrial | 26,000,928 | ||||
| Utility – 6.3% | ||||||
| 200 | AEP Texas Inc | 2.100% | 7/01/30 | BBB+ | 198,932 | |
| 223 | AEP Texas Inc | 3.800% | 10/01/47 | BBB+ | 249,858 | |
| 81 | Alabama Power Co | 5.200% | 6/01/41 | A+ | 107,673 | |
| 30 | Alabama Power Co | 3.125% | 7/15/51 | A+ | 31,940 | |
| 9 | Appalachian Power Co | 4.400% | 5/15/44 | A- | 10,973 | |
| 136 | Black Hills Corp | 3.150% | 1/15/27 | BBB+ | 146,483 | |
| 10 | Black Hills Corp | 4.200% | 9/15/46 | BBB+ | 11,594 | |
| 20 | CenterPoint Energy Inc | 2.650% | 6/01/31 | BBB | 20,793 | |
| 77 | CenterPoint Energy Resources Corp | 4.000% | 4/01/28 | A- | 87,814 | |
| 15 | CenterPoint Energy Resources Corp | 4.100% | 9/01/47 | A- | 17,896 | |
| 136 | Cleco Corporate Holdings LLC | 3.743% | 5/01/26 | BBB- | 149,622 | |
| 150 | Cleco Corporate Holdings LLC | 4.973% | 5/01/46 | BBB- | 185,264 | |
| 29 | Consumers Energy Co | 3.750% | 2/15/50 | A+ | 35,270 | |
| 20 | Dayton Power & Light Co | 3.950% | 6/15/49 | BBB+ | 23,067 | |
| 211 | Delmarva Power & Light Co | 4.000% | 6/01/42 | A | 246,376 | |
| 74 | Dominion Energy Inc | 5.250% | 8/01/33 | BBB | 94,501 | |
| 361 | Dominion Energy Inc | 4.900% | 8/01/41 | BBB | 471,222 | |
| 10 | Dominion Energy Inc | 4.050% | 9/15/42 | BBB | 11,770 | |
| 73 | DTE Electric Co | 3.950% | 6/15/42 | A+ | 85,715 | |
| 282 | Duke Energy Carolinas LLC | 4.250% | 12/15/41 | A+ | 348,698 | |
| 60 | Duke Energy Corp | 2.550% | 6/15/31 | BBB | 61,983 | |
| 300 | Duke Energy Corp | 3.300% | 6/15/41 | BBB | 315,203 | |
| 230 | Duke Energy Corp | 3.950% | 8/15/47 | BBB | 260,942 | |
| 12 | Duke Energy Indiana LLC | 2.750% | 4/01/50 | A+ | 11,910 | |
| 84 | El Paso Electric Co | 5.000% | 12/01/44 | Baa2 | 104,733 | |
| 20 | Emera US Finance LP, 144A | 2.639% | 6/15/31 | BBB- | 20,465 | |
| 131 | Emera US Finance LP | 4.750% | 6/15/46 | BBB- | 158,731 | |
| 19 | Entergy Louisiana LLC | 4.200% | 9/01/48 | A | 23,680 | |
| 14 | Entergy Louisiana LLC | 2.900% | 3/15/51 | A | 14,218 | |
| 143 | Essential Utilities Inc | 2.704% | 4/15/30 | BBB+ | 151,266 | |
| 30 | Essential Utilities Inc | 3.351% | 4/15/50 | BBB+ | 32,054 | |
| 431 | Exelon Corp | 4.950% | 6/15/35 | BBB | 542,315 | |
| 296 | Exelon Corp | 5.100% | 6/15/45 | BBB | 395,449 | |
| 18 | Exelon Corp | 4.450% | 4/15/46 | BBB | 22,335 | |
| 68 | Iberdrola International BV | 6.750% | 7/15/36 | BBB+ | 104,658 | |
| 26 | Indiana Michigan Power Co | 3.750% | 7/01/47 | A- | 29,908 | |
| 80 | Interstate Power and Light Co | 4.700% | 10/15/43 | BBB+ | 100,278 |
| Principal Amount (000) | Description (1) | Coupon | Maturity | Ratings (2) | Value | |
| Utility (continued) | ||||||
| $ 18 | ITC Holdings Corp | 5.300% | 7/01/43 | BBB | $24,195 | |
| 66 | National Grid USA | 5.803% | 4/01/35 | BBB | 83,639 | |
| 220 | NextEra Energy Capital Holdings Inc | 1.900% | 6/15/28 | BBB+ | 224,558 | |
| 296 | NiSource Inc | 5.650% | 2/01/45 | BBB | 414,498 | |
| 225 | NiSource Inc | 3.950% | 3/30/48 | BBB | 262,233 | |
| 84 | Oglethorpe Power Corp | 5.950% | 11/01/39 | BBB+ | 115,214 | |
| 147 | Oglethorpe Power Corp | 4.250% | 4/01/46 | BBB+ | 168,253 | |
| 25 | Oglethorpe Power Corp | 5.050% | 10/01/48 | BBB+ | 31,939 | |
| 200 | Oglethorpe Power Corp | 5.250% | 9/01/50 | BBB+ | 259,101 | |
| 150 | ONE Gas Inc | 4.500% | 11/01/48 | BBB+ | 187,772 | |
| 30 | Pacific Gas and Electric Co | 3.000% | 6/15/28 | BBB- | 30,013 | |
| 295 | Pacific Gas and Electric Co | 4.200% | 6/01/41 | BBB- | 288,100 | |
| 298 | Pacific Gas and Electric Co, (3) | 3.750% | 8/15/42 | BBB- | 272,640 | |
| 706 | Pacific Gas and Electric Co | 4.300% | 3/15/45 | BBB- | 667,923 | |
| 214 | Pacific Gas and Electric Co | 4.000% | 12/01/46 | BBB- | 199,935 | |
| 250 | Pacific Gas and Electric Co | 3.950% | 12/01/47 | BBB- | 234,826 | |
| 150 | Pacific Gas and Electric Co | 4.950% | 7/01/50 | BBB- | 154,827 | |
| 158 | Pennsylvania Electric Co | 6.150% | 10/01/38 | BBB | 215,583 | |
| 200 | Piedmont Natural Gas Co Inc | 3.640% | 11/01/46 | BBB+ | 221,714 | |
| 130 | Public Service Co of New Hampshire | 2.200% | 6/15/31 | A+ | 135,343 | |
| 10 | Puget Energy Inc, 144A | 2.379% | 6/15/28 | BBB- | 10,212 | |
| 15 | Sempra Energy | 4.050% | 12/01/23 | BBB | 16,083 | |
| 225 | Sempra Energy | 4.000% | 2/01/48 | BBB | 258,173 | |
| 10 | Southern California Edison Co | 3.650% | 6/01/51 | A- | 10,194 | |
| 66 | Southern California Gas Co | 3.950% | 2/15/50 | AA- | 80,366 | |
| 250 | Southern Co | 4.250% | 7/01/36 | BBB+ | 294,464 | |
| 8 | Southern Co Gas Capital Corp | 4.400% | 6/01/43 | BBB+ | 9,724 | |
| 282 | Southern Co Gas Capital Corp | 4.400% | 5/30/47 | BBB+ | 341,014 | |
| 279 | Southern Power Co | 4.950% | 12/15/46 | BBB+ | 343,676 | |
| 83 | Southwestern Electric Power Co | 3.900% | 4/01/45 | BBB+ | 92,963 | |
| 153 | Southwestern Public Service Co | 6.000% | 10/01/36 | BBB+ | 204,913 | |
| 28 | Spire Inc | 4.700% | 8/15/44 | BBB | 33,010 | |
| 10 | Union Electric Co | 2.150% | 3/15/32 | A | 10,206 | |
| 10 | Wisconsin Electric Power Co | 1.700% | 6/15/28 | A | 10,147 | |
| 68 | Wisconsin Power and Light Co | 4.100% | 10/15/44 | A- | 81,265 | |
| 9,468 | Total Utility | 10,874,305 | ||||
| $ 37,336 | Total Corporate Debt (cost $43,053,391) | 43,209,954 |
| Principal Amount (000) | Description (1) | Coupon | Maturity | Ratings (2) | Value | |
| GOVERNMENT RELATED – 6.1% | ||||||
| Government Agency – 0.6% | ||||||
| $ 350 | Federal Home Loan Mortgage Corp | 1.310% | 8/17/33 | Aaa | $337,200 | |
| 1 | Federal National Mortgage Association | 1.875% | 9/24/26 | Aaa | 1,057 | |
| 72 | Federal National Mortgage Association | 6.625% | 11/15/30 | Aaa | 105,191 | |
| 21 | Health & Educational Facilities Authority of the State of Missouri | 3.086% | 9/15/51 | AA+ | 23,471 | |
| 499 | Tennessee Valley Authority | 3.500% | 12/15/42 | AAA | 605,362 | |
| 943 | Total Government Agency | 1,072,281 | ||||
| Municipal Bonds – 2.4% (4) | ||||||
| 91 | Bay Area Toll Authority, California, Revenue Bonds, San Francisco Bay Area Toll Bridge, Subordinate Lien, Build America Federally Taxable Bond Series 2010S-1 (No Optional Call) | 6.918% | 4/01/40 | AA- | 139,615 | |
| 10 | Board of Regents of the University of Texas System, Revenue Financing System Bonds, Green Series 2016B (No Optional Call) | 3.852% | 8/15/46 | AAA | 12,712 | |
| 50 | California State University, Systemwide Revenue Bonds, Taxable Series 2021B (Optional Call: 11/31 at 100.00) | 2.939% | 11/01/52 | AA- | 50,190 | |
| 50 | California State, General Obligation Bonds, Various Purpose Build America Taxable Bond Series 2010 (No Optional Call) | 7.625% | 3/01/40 | AA | 85,740 | |
| 70 | Chicago Greater Metropolitan Water Reclamation District, Illinois, General Obligation Bonds, Build America Taxable Bonds, Series 2009 (No Optional Call) | 5.720% | 12/01/38 | AA+ | 100,738 | |
| 47 | Chicago O'Hare International Airport (No Optional Call) | 4.572% | 1/01/54 | A | 64,970 | |
| 40 | Commonwealth Financing Authority, Pennslyvania, Revenue Bonds, Taxable Series 2021A (No Optional Call) | 2.991% | 6/01/42 | A+ | 42,037 | |
| 91 | Commonwealth Financing Authority, Pennsylvania, State Appropriation Lease Bonds, Plancon Program, Taxable Series 2018A (No Optional Call) | 3.864% | 6/01/38 | A+ | 105,786 | |
| 50 | Cook County, Illinois, General Obligation Bonds, Build America Taxable Bonds, Series 2010D (No Optional Call) | 6.229% | 11/15/34 | A+ | 69,426 | |
| 91 | Dormitory Authority of the State of New York, Revenue Bonds, Montefiore Obligated Group, Taxable Series 2018B (Optional Call: 8/28 at 100.00) | 4.946% | 8/01/48 | A+ | 104,514 | |
| 100 | Dormitory Authority of the State of New York, State Personal Income Tax Revenue Bonds, General Purpose, Series 2021C (No Optional Call) | 2.202% | 3/15/34 | AA+ | 103,150 | |
| 556 | Illinois State, General Obligation Bonds, Pension Funding Series 2003 (No Optional Call) | 5.100% | 6/01/33 | BBB | 667,334 | |
| 148 | Inter-American Development Bank (No Optional Call) | 4.375% | 1/24/44 | Aaa | 208,738 | |
| 30 | Los Angeles Community College District, California, General Obligation Bonds, Build America Taxable Bonds, Series 2010 (No Optional Call) | 6.750% | 8/01/49 | AA+ | 52,693 | |
| 91 | Los Angeles Unified School District, Los Angeles County, California, General Obligation Bonds, Build America Taxable Bonds, Series 2009KRY (No Optional Call) | 5.750% | 7/01/34 | A+ | 125,064 | |
| 50 | Massachusetts State, General Obligation Bonds, Taxable Refunding Series 2019D (No Optional Call) | 2.663% | 9/01/39 | AA+ | 52,801 | |
| 58 | Metropolitan Transportation Authority, New York, Transportation Revenue Bonds, Build America Taxable Bonds, Series 2009A-1 (No Optional Call) | 5.871% | 11/15/39 | A- | 78,235 | |
| 11 | Michigan Finance Authority, Hospital Revenue Bonds, Trinity Health Credit Group, Taxable Refunding Series 2019-T (No Optional Call) | 3.384% | 12/01/40 | AA- | 12,457 |
| Principal Amount (000) | Description (1) | Coupon | Maturity | Ratings (2) | Value | |
| Municipal Bonds (4) (continued) | ||||||
| $ 95 | Municipal Electric Authority of Georgia, Plant Vogtle Units 3 & 4 Project J Bonds, Taxable Build America Bonds Series 2010A (No Optional Call) | 6.637% | 4/01/57 | A- | $147,653 | |
| 47 | New Jersey Transportation Trust Fund Authority, Transportation System Bonds, Federally Taxable Issuer Subsidy Build America Bonds, Series 2010B (No Optional Call) | 6.561% | 12/15/40 | BBB+ | 71,368 | |
| 50 | New Jersey Turnpike Authority, Revenue Bonds, Build America Taxable Bonds, Series 2010A (No Optional Call) | 7.102% | 1/01/41 | A | 81,832 | |
| 75 | New York City Transitional Finance Authority, New York, Future Tax Secured Bonds, Build America Taxable Bonds, Series 2010B-1 (No Optional Call) | 5.572% | 11/01/38 | AAA | 101,100 | |
| 82 | New York State Thruway Authority, General Revenue Bonds, Taxable Series 2019M (No Optional Call) | 2.900% | 1/01/35 | A | 89,472 | |
| 100 | North Texas Tollway Authority (Optional Call: 1/31 at 100.00) | 3.011% | 1/01/43 | A+ | 103,555 | |
| 120 | Ohio State University, General Receipts Bonds, Build America Taxable Bond Series 2010C (No Optional Call) | 4.910% | 6/01/40 | AA | 163,728 | |
| 30 | Ohio State University, General Receipts Bonds, Multiyear Debt Issuance Program, Taxable Series 2016B (No Optional Call) | 3.798% | 12/01/46 | AA | 37,561 | |
| 21 | Phoenix, Arizona, Various Purpose General Obligation Bonds, Build America Taxable Bonds, Series 2009A (No Optional Call) | 5.269% | 7/01/34 | AA+ | 25,938 | |
| 200 | Port Authority of New York and New Jersey, Consolidated Revenue Bonds, Two Hundred Twenty-Fifth Series 2021 (Optional Call: 7/31 at 100.00) | 3.175% | 7/15/60 | A+ | 203,758 | |
| 325 | Province of British Columbia Canada (No Optional Call) | 1.300% | 1/29/31 | AA+ | 321,286 | |
| 32 | Sales Tax Securitization Corp (No Optional Call) | 3.820% | 1/01/48 | AA- | 36,743 | |
| 50 | State of California (Optional Call: 4/28 at 100.00) | 4.500% | 4/01/33 | AA | 59,624 | |
| 42 | Texas State, General Obligation Bonds, Transportation Commission, Build America Taxable Bonds, Series 2010A (No Optional Call) | 4.631% | 4/01/33 | AAA | 52,712 | |
| 233 | The Rector and Visitors of the University of Virginia, General Revenue Bonds, Taxable Pledge and Refunding Series 2020 (Optional Call: 3/50 at 100.00) | 2.256% | 9/01/50 | AAA | 222,857 | |
| 20 | Tucson, Arizona, Certificates of Participation, Taxable Series 2021A (No Optional Call) | 2.856% | 7/01/47 | AA- | 20,378 | |
| 100 | University of California Regents, Medical Center Pooled Revenue Bonds, Taxable Build America Bond Series 2010H (No Optional Call) | 6.548% | 5/15/48 | AA- | 159,010 | |
| 60 | University of California Regents, Medical Center Pooled Revenue Bonds, Taxable Series 2020N (Optional Call: 11/49 at 100.00) | 3.006% | 5/15/50 | AA- | 63,037 | |
| 57 | University of California, General Revenue Bonds, Taxable Series 2019BD (No Optional Call) | 3.349% | 7/01/29 | AA | 64,935 | |
| 3,373 | Total Municipal Bonds | 4,102,747 | ||||
| Sovereign Debt – 3.1% | ||||||
| 42 | Chile Government International Bond | 2.550% | 1/27/32 | A | 43,033 | |
| 100 | Chile Government International Bond | 3.625% | 10/30/42 | A | 107,582 | |
| 300 | Chile Government International Bond | 3.500% | 1/25/50 | A | 316,164 | |
| 300 | Indonesia Government International Bond, (3) | 2.150% | 7/28/31 | BBB | 297,688 | |
| 100 | Indonesia Government International Bond | 4.350% | 1/11/48 | Baa2 | 114,277 | |
| 44 | Indonesia Government International Bond | 3.500% | 2/14/50 | BBB | 45,507 | |
| 100 | Israel Government International Bond | 4.500% | 1/30/43 | A+ | 127,174 |
| Principal Amount (000) | Description (1) | Coupon | Maturity | Ratings (2) | Value | |
| Sovereign Debt (continued) | ||||||
| $ 1,108 | Mexico Government International Bond | 5.550% | 1/21/45 | BBB | $1,351,095 | |
| 66 | Mexico Government International Bond | 4.350% | 1/15/47 | BBB | 69,500 | |
| 100 | Mexico Government International Bond | 4.600% | 2/10/48 | BBB | 108,155 | |
| 710 | Panama Government International Bond | 4.500% | 5/15/47 | BBB | 808,569 | |
| 225 | Peruvian Government International Bond | 1.862% | 12/01/32 | BBB+ | 205,463 | |
| 148 | Peruvian Government International Bond | 2.780% | 12/01/60 | BBB+ | 127,085 | |
| 225 | Peruvian Government International Bond | 3.230% | 7/28/21 | BBB+ | 189,020 | |
| 44 | Philippine Government International Bond | 3.750% | 1/14/29 | BBB | 49,766 | |
| 150 | Philippine Government International Bond | 3.950% | 1/20/40 | BBB | 167,741 | |
| 500 | Philippine Government International Bond | 3.700% | 3/01/41 | BBB | 544,139 | |
| 90 | Republic of Italy Government International Bond | 5.375% | 6/15/33 | Baa3 | 115,539 | |
| 24 | State of Israel | 3.375% | 1/15/50 | A+ | 26,241 | |
| 296 | Uruguay Government International Bond | 5.100% | 6/18/50 | BBB | 387,612 | |
| 150 | Uruguay Government International Bond | 4.975% | 4/20/55 | BBB | 193,512 | |
| 4,822 | Total Sovereign Debt | 5,394,862 | ||||
| $ 9,138 | Total Government Related (cost $10,541,082) | 10,569,890 | ||||
| Total Long-Term Investments (cost $171,835,738) | 172,427,062 |
| Shares | Description (1) | Coupon | Value | |||
| INVESTMENTS PURCHASED WITH COLLATERAL FROM SECURITIES LENDING – 0.9% | ||||||
| MONEY MARKET FUNDS – 0.9% | ||||||
| 1,604,714 | State Street Navigator Securities Lending Government Money Market Portfolio, (5) | 0.050% (6) | $ 1,604,714 | |||
| Total Investments Purchased with Collateral from Securities Lending (cost $1,604,714) | 1,604,714 | |||||
| Principal Amount (000) | Description (1) | Coupon | Maturity | Ratings (2) | Value | |
| SHORT-TERM INVESTMENTS – 25.3% | ||||||
| U.S. GOVERNMENT AND AGENCY OBLIGATIONS – 25.3% | ||||||
| $ 5,169 | Federal Home Loan Bank Discount Notes | 0.000% | 10/20/21 | N/R | $5,168,524 | |
| 38,682 | United States Treasury Bill | 0.000% | 8/03/21 | AAA | 38,681,973 | |
| $ 43,851 | Total Short-Term Investments (cost $43,850,497) | 43,850,497 | ||||
| Total Investments (cost $217,290,949) – 125.5% | 217,882,273 | |||||
| Other Assets Less Liabilities – (25.5)% | (44,205,799) | |||||
| Net Assets – 100% | $ 173,676,474 |
| For Fund portfolio compliance purposes, the Fund’s industry classifications refer to any one or more of the industry sub-classifications used by one or more widely recognized market indexes or ratings group indexes, and/or as defined by Fund management. This definition may not apply for purposes of this report, which may combine industry sub-classifications into sectors for reporting ease. | ||
| (1) | All percentages shown in the Portfolio of Investments are based on net assets. | |
| (2) | The Fund uses credit quality ratings for its portfolio securities provided by Moody's, S&P and Fitch. If all three of Moody's, S&P, and Fitch provide a rating for a security, an average of the ratings is used; if two of the three agencies rate a security, an average of the two is used; and if only one rating agency rates a security, that rating is used. AAA, AA, A, and BBB are investment grade ratings; BB, B, CCC/CC/C and D are below-investment grade ratings. Credit ratings are subject to change. Holdings designated N/R are not rated by Moody's, S&P or Fitch. Ratings are not covered by the report of independent registered public accounting firm. | |
| (3) | Investment, or a portion of investment, is out on loan for securities lending. The total value of the securities out on loan as of the end of the reporting period was $1,571,525. | |
| (4) | Optional Call Provisions: Dates (month and year) and prices of the earliest optional call or redemption. There may be other call provisions at varying prices at later dates. Certain mortgage-backed securities may be subject to periodic principal paydowns. Optional Call Provisions are not covered by the report of independent registered public accounting firm. | |
| (5) | The Fund may loan securities representing up to one third of the market value of its total assets (which includes collateral for securities on loan) to broker dealers, banks, and other institutions. The collateral maintained by the Fund shall have a market value, at the inception of each loan, equal to not less than 100% of the market value of the loaned securities. The cash collateral received by the Fund is invested in this money market fund. | |
| (6) | The rate shown is the one-day yield as of the end of the reporting period. | |
| 144A | Investment is exempt from registration under Rule 144A of the Securities Act of 1933, as amended. These investments may only be resold in transactions exempt from registration, which are normally those transactions with qualified institutional buyers. | |
| DD1 | Portion of investment purchased on a delayed delivery basis. | |
| WI/DD | Purchased on a when-issued or delayed delivery basis. |
| Principal Amount (000) | Description (1) | Coupon | Maturity | Ratings (2) | Value | |
| LONG-TERM INVESTMENTS – 99.2% | ||||||
| CORPORATE DEBT – 43.0% | ||||||
| Financials – 20.8% | ||||||
| $ 60 | AerCap Ireland Capital DAC / AerCap Global Aviation Trust | 4.125% | 7/03/23 | BBB- | $63,471 | |
| 130 | AerCap Ireland Capital DAC / AerCap Global Aviation Trust | 4.875% | 1/16/24 | BBB- | 141,401 | |
| 100 | Aflac Inc | 1.125% | 3/15/26 | A- | 100,624 | |
| 100 | Air Lease Corp | 2.250% | 1/15/23 | BBB | 102,507 | |
| 50 | Air Lease Corp | 1.875% | 8/15/26 | BBB | 50,455 | |
| 81 | Aircastle Ltd | 4.400% | 9/25/23 | BBB- | 86,637 | |
| 85 | Ally Financial Inc | 3.875% | 5/21/24 | BBB- | 91,905 | |
| 40 | Ally Financial Inc | 5.125% | 9/30/24 | BBB- | 44,976 | |
| 67 | American Express Co | 3.400% | 2/22/24 | A- | 71,659 | |
| 81 | American International Group Inc | 4.125% | 2/15/24 | BBB+ | 88,078 | |
| 40 | American International Group Inc | 3.750% | 7/10/25 | BBB+ | 44,068 | |
| 85 | Anthem Inc | 2.375% | 1/15/25 | BBB+ | 89,294 | |
| 85 | Aon Corp | 2.200% | 11/15/22 | BBB+ | 87,062 | |
| 74 | Ares Capital Corp | 3.250% | 7/15/25 | BBB- | 78,441 | |
| 20 | Assured Guaranty US Holdings Inc, (3) | 5.000% | 7/01/24 | BBB+ | 22,476 | |
| 164 | Bank of America Corp | 3.458% | 3/15/25 | A | 175,057 | |
| 100 | Bank of America Corp | 0.976% | 4/22/25 | A | 100,537 | |
| 80 | Bank of America Corp | 3.366% | 1/23/26 | A | 86,136 | |
| 100 | Bank of America Corp | 1.734% | 7/22/27 | A | 101,739 | |
| 100 | Bank of Montreal | 0.625% | 7/09/24 | A | 100,133 | |
| 100 | Bank of New York Mellon Corp | 0.750% | 1/28/26 | A+ | 99,389 | |
| 20 | Bank of Nova Scotia, (3) | 0.700% | 4/15/24 | A | 20,048 | |
| 100 | Bank of Nova Scotia, (3) | 1.350% | 6/24/26 | A | 100,877 | |
| 270 | Barclays PLC | 3.932% | 5/07/25 | BBB+ | 291,315 | |
| 100 | Blackstone Secured Lending Fund | 2.750% | 9/16/26 | Baa3 | 102,460 | |
| 50 | Boston Properties LP | 3.800% | 2/01/24 | BBB+ | 53,376 | |
| 69 | Canadian Imperial Bank of Commerce, (3) | 3.100% | 4/02/24 | A | 73,510 | |
| 100 | Capital One Financial Corp | 3.750% | 4/24/24 | BBB+ | 107,914 | |
| 208 | Capital One Financial Corp | 3.300% | 10/30/24 | BBB+ | 224,229 | |
| 100 | Charles Schwab Corp | 1.150% | 5/13/26 | A | 100,885 | |
| 30 | Chubb INA Holdings Inc | 3.150% | 3/15/25 | A | 32,531 | |
| 73 | Citigroup Inc | 4.044% | 6/01/24 | A- | 77,569 | |
| 60 | Citigroup Inc | 3.875% | 3/26/25 | BBB | 65,881 | |
| 100 | Citigroup Inc | 0.981% | 5/01/25 | A- | 100,538 | |
| 100 | Citigroup Inc | 1.462% | 6/09/27 | A- | 100,088 |
| Principal Amount (000) | Description (1) | Coupon | Maturity | Ratings (2) | Value | |
| Financials (continued) | ||||||
| $ 120 | Cooperatieve Rabobank UA | 4.375% | 8/04/25 | BBB+ | $134,505 | |
| 250 | Credit Suisse Group Funding Guernsey Ltd | 3.800% | 9/15/22 | BBB+ | 259,594 | |
| 10 | Deutsche Bank AG/London | 3.700% | 5/30/24 | BBB- | 10,715 | |
| 200 | Deutsche Bank AG/New York NY | 3.700% | 5/30/24 | BBB- | 214,164 | |
| 120 | Discover Bank | 3.350% | 2/06/23 | BBB | 125,000 | |
| 86 | Fifth Third Bancorp | 2.600% | 6/15/22 | BBB+ | 87,588 | |
| 50 | FS KKR Capital Corp | 4.125% | 2/01/25 | Baa3 | 53,147 | |
| 50 | FS KKR Capital Corp | 2.625% | 1/15/27 | Baa3 | 49,802 | |
| 160 | Goldman Sachs Group Inc | 3.625% | 2/20/24 | A- | 171,252 | |
| 70 | Goldman Sachs Group Inc | 3.750% | 5/22/25 | A- | 76,669 | |
| 100 | Golub Capital BDC Inc | 2.050% | 2/15/27 | BBB- | 98,998 | |
| 200 | HSBC Holdings PLC | 3.600% | 5/25/23 | A | 211,476 | |
| 100 | HSBC Holdings PLC | 0.976% | 5/24/25 | A | 100,257 | |
| 66 | Humana Inc | 2.900% | 12/15/22 | BBB | 68,121 | |
| 85 | Jefferies Group LLC | 5.125% | 1/20/23 | BBB | 90,617 | |
| 100 | JPMorgan Chase & Co | 3.797% | 7/23/24 | A | 106,379 | |
| 134 | JPMorgan Chase & Co | 2.005% | 3/13/26 | A | 138,843 | |
| 100 | JPMorgan Chase & Co | 1.578% | 4/22/27 | A | 101,153 | |
| 26 | Marsh & McLennan Cos Inc | 3.875% | 3/15/24 | BBB+ | 28,139 | |
| 25 | MetLife Inc | 3.600% | 4/10/24 | A- | 27,038 | |
| 200 | Mitsubishi UFJ Financial Group Inc | 0.953% | 7/19/25 | A | 201,036 | |
| 177 | Morgan Stanley | 3.700% | 10/23/24 | A | 193,275 | |
| 100 | Morgan Stanley | 0.790% | 5/30/25 | A | 99,847 | |
| 100 | Morgan Stanley | 1.593% | 5/04/27 | A | 101,478 | |
| 310 | Natwest Group PLC | 4.269% | 3/22/25 | BBB+ | 336,885 | |
| 200 | Nomura Holdings Inc | 1.653% | 7/14/26 | BBB+ | 201,013 | |
| 50 | Oaktree Specialty Lending Corp | 2.700% | 1/15/27 | Baa3 | 50,567 | |
| 50 | Office Properties Income Trust | 2.650% | 6/15/26 | BBB- | 51,417 | |
| 50 | Owl Rock Capital Corp | 3.750% | 7/22/25 | BBB- | 53,138 | |
| 51 | Prudential Financial Inc | 5.625% | 6/15/43 | BBB+ | 54,639 | |
| 51 | Prudential Financial Inc | 5.200% | 3/15/44 | BBB+ | 55,048 | |
| 100 | Royal Bank of Canada | 1.200% | 4/27/26 | A+ | 100,273 | |
| 100 | Royal Bank of Canada | 1.150% | 7/14/26 | A | 100,337 | |
| 81 | Santander Holdings USA Inc | 3.500% | 6/07/24 | BBB | 86,691 | |
| 120 | Santander UK Group Holdings PLC | 4.796% | 11/15/24 | BBB+ | 130,990 | |
| 85 | State Street Corp | 3.700% | 11/20/23 | A+ | 91,633 | |
| 140 | Sumitomo Mitsui Financial Group Inc | 3.748% | 7/19/23 | A | 149,038 | |
| 10 | Symetra Financial Corp | 4.250% | 7/15/24 | BBB | 10,858 | |
| 70 | Synchrony Financial | 2.850% | 7/25/22 | BBB- | 71,528 | |
| 10 | Synchrony Financial | 4.375% | 3/19/24 | BBB- | 10,888 | |
| 50 | Toronto-Dominion Bank | 1.200% | 6/03/26 | A | 50,455 |
| Principal Amount (000) | Description (1) | Coupon | Maturity | Ratings (2) | Value | |
| Financials (continued) | ||||||
| $ 71 | Trinity Acquisition PLC | 4.625% | 8/15/23 | BBB | $76,607 | |
| 126 | Truist Bank | 3.689% | 8/02/24 | A | 134,310 | |
| 30 | Ventas Realty LP | 3.750% | 5/01/24 | BBB+ | 32,173 | |
| 50 | Vornado Realty LP | 2.150% | 6/01/26 | BBB | 51,189 | |
| 18 | Wells Fargo & Co | 3.500% | 3/08/22 | A | 18,350 | |
| 141 | Wells Fargo & Co | 3.750% | 1/24/24 | A | 151,577 | |
| 100 | Wells Fargo & Co | 0.805% | 5/19/25 | A | 100,179 | |
| 110 | Wells Fargo & Co | 3.550% | 9/29/25 | A | 121,226 | |
| 100 | Westpac Banking Corp | 1.150% | 6/03/26 | AA- | 100,970 | |
| 8,025 | Total Financials | 8,418,338 | ||||
| Industrial – 9.7% | ||||||
| 85 | AbbVie Inc | 2.600% | 11/21/24 | BBB | 89,926 | |
| 85 | Altria Group Inc | 2.350% | 5/06/25 | BBB+ | 88,975 | |
| 80 | American Tower Corp | 2.400% | 3/15/25 | BBB | 83,740 | |
| 35 | Amgen Inc | 1.900% | 2/21/25 | BBB+ | 36,417 | |
| 50 | Astrazeneca Finance LLC | 1.200% | 5/28/26 | A- | 50,421 | |
| 110 | AT&T Inc | 3.400% | 5/15/25 | BBB | 119,983 | |
| 30 | AutoZone Inc | 3.250% | 4/15/25 | BBB | 32,449 | |
| 50 | Becton Dickinson and Co | 3.363% | 6/06/24 | BBB- | 53,556 | |
| 85 | Boeing Co | 4.875% | 5/01/25 | BBB- | 95,300 | |
| 44 | Bunge Ltd Finance Corp | 3.000% | 9/25/22 | BBB- | 45,146 | |
| 20 | Carrier Global Corp | 2.242% | 2/15/25 | BBB- | 20,928 | |
| 19 | Charter Communications Operating LLC / Charter Communications Operating Capital | 4.500% | 2/01/24 | BBB- | 20,673 | |
| 20 | Charter Communications Operating LLC / Charter Communications Operating Capital | 4.908% | 7/23/25 | BBB- | 22,698 | |
| 47 | Cigna Corp | 3.750% | 7/15/23 | BBB+ | 49,914 | |
| 30 | CNH Industrial Capital LLC | 1.450% | 7/15/26 | BBB- | 30,173 | |
| 71 | CVS Health Corp | 2.625% | 8/15/24 | BBB | 74,908 | |
| 99 | Dell International LLC / EMC Corp | 5.450% | 6/15/23 | BBB- | 107,066 | |
| 50 | Diamondback Energy Inc | 4.750% | 5/31/25 | BBB- | 56,127 | |
| 20 | Eastman Chemical Co | 3.600% | 8/15/22 | BBB- | 20,500 | |
| 100 | eBay Inc | 1.400% | 5/10/26 | BBB+ | 101,251 | |
| 50 | Enbridge Inc | 3.500% | 6/10/24 | BBB+ | 53,609 | |
| 74 | Energy Transfer LP | 4.250% | 3/15/23 | BBB- | 77,482 | |
| 50 | Enterprise Products Operating LLC | 3.900% | 2/15/24 | BBB+ | 53,745 | |
| 85 | Equifax Inc | 2.600% | 12/15/25 | BBB | 90,408 | |
| 100 | Equinix Inc | 1.450% | 5/15/26 | BBB | 100,512 | |
| 50 | Fidelity National Information Services Inc | 0.600% | 3/01/24 | BBB | 49,962 | |
| 100 | Fiserv Inc | 3.800% | 10/01/23 | BBB | 106,828 | |
| 50 | Fiserv Inc | 2.750% | 7/01/24 | BBB | 52,933 |
| Principal Amount (000) | Description (1) | Coupon | Maturity | Ratings (2) | Value | |
| Industrial (continued) | ||||||
| $ 20 | Fox Corp | 4.030% | 1/25/24 | BBB | $21,626 | |
| 20 | General Electric Co | 3.375% | 3/11/24 | BBB+ | 21,405 | |
| 61 | General Motors Financial Co Inc | 4.375% | 9/25/21 | BBB- | 61,358 | |
| 100 | General Motors Financial Co Inc | 1.250% | 1/08/26 | BBB- | 99,922 | |
| 90 | Gilead Sciences Inc | 3.500% | 2/01/25 | BBB+ | 97,511 | |
| 59 | Global Payments Inc | 4.000% | 6/01/23 | BBB- | 62,344 | |
| 30 | HCA Inc | 5.250% | 4/15/25 | BBB- | 34,419 | |
| 100 | HP Inc, 144A | 1.450% | 6/17/26 | BBB | 99,918 | |
| 36 | Keurig Dr Pepper Inc | 4.057% | 5/25/23 | BBB | 38,303 | |
| 45 | Kinder Morgan Energy Partners LP | 4.250% | 9/01/24 | BBB | 49,334 | |
| 30 | Laboratory Corp of America Holdings | 1.550% | 6/01/26 | BBB | 30,397 | |
| 50 | Las Vegas Sands Corp | 2.900% | 6/25/25 | BBB- | 51,888 | |
| 85 | LYB International Finance III LLC | 2.875% | 5/01/25 | BBB | 90,674 | |
| 85 | Marriott International Inc/MD | 5.750% | 5/01/25 | BBB- | 98,067 | |
| 100 | Martin Marietta Materials Inc | 0.650% | 7/15/23 | BBB | 100,196 | |
| 10 | McDonald's Corp | 3.250% | 6/10/24 | BBB+ | 10,684 | |
| 10 | Moody's Corp | 2.625% | 1/15/23 | BBB+ | 10,309 | |
| 35 | Moody's Corp | 3.750% | 3/24/25 | BBB+ | 38,440 | |
| 50 | MPLX LP | 4.875% | 12/01/24 | BBB | 55,862 | |
| 40 | Norfolk Southern Corp | 3.250% | 12/01/21 | BBB+ | 40,093 | |
| 50 | Omnicom Group Inc / Omnicom Capital Inc | 3.650% | 11/01/24 | BBB+ | 54,522 | |
| 70 | ONEOK Inc | 2.750% | 9/01/24 | BBB | 73,733 | |
| 100 | Oracle Corp | 2.950% | 11/15/24 | BBB+ | 106,583 | |
| 50 | PayPal Holdings Inc | 2.400% | 10/01/24 | A- | 52,612 | |
| 50 | Pioneer Natural Resources Co | 0.550% | 5/15/23 | BBB | 50,063 | |
| 10 | Reliance Steel & Aluminum Co | 4.500% | 4/15/23 | BBB | 10,568 | |
| 50 | Roper Technologies Inc, (3) | 2.350% | 9/15/24 | BBB | 52,286 | |
| 70 | Ryder System Inc | 2.500% | 9/01/24 | BBB | 73,508 | |
| 35 | Sabine Pass Liquefaction LLC | 5.625% | 3/01/25 | BBB- | 40,073 | |
| 10 | Southern Copper Corp | 3.875% | 4/23/25 | BBB+ | 10,908 | |
| 20 | Steel Dynamics Inc | 2.800% | 12/15/24 | BBB- | 21,116 | |
| 50 | Stryker Corp | 1.150% | 6/15/25 | BBB+ | 50,478 | |
| 20 | Tapestry Inc | 4.250% | 4/01/25 | BBB- | 21,775 | |
| 59 | Union Pacific Corp | 3.150% | 3/01/24 | BBB+ | 62,893 | |
| 20 | Verizon Communications Inc | 3.500% | 11/01/24 | BBB+ | 21,671 | |
| 50 | Verizon Communications Inc | 1.450% | 3/20/26 | BBB+ | 50,672 | |
| 100 | VMware Inc, (WI/DD) | 1.400% | 8/15/26 | BBB- | 100,319 | |
| 85 | Williams Cos Inc | 3.900% | 1/15/25 | BBB | 92,852 |
| Principal Amount (000) | Description (1) | Coupon | Maturity | Ratings (2) | Value | |
| Industrial (continued) | ||||||
| $ 50 | Zimmer Biomet Holdings Inc | 3.550% | 4/01/25 | BBB | $ 54,359 | |
| 3,694 | Total Industrial | 3,899,371 | ||||
| Utility – 12.5% | ||||||
| 100 | AES Corp, 144A | 1.375% | 1/15/26 | BBB- | 99,805 | |
| 81 | Ameren Corp | 2.500% | 9/15/24 | BBB | 85,285 | |
| 100 | American Electric Power Co Inc, (3) | 1.000% | 11/01/25 | BBB+ | 99,798 | |
| 118 | American Water Capital Corp | 3.850% | 3/01/24 | A- | 126,822 | |
| 85 | Avangrid Inc | 3.150% | 12/01/24 | BBB | 91,173 | |
| 80 | CenterPoint Energy Inc | 2.500% | 9/01/24 | BBB | 83,801 | |
| 100 | CenterPoint Energy Inc | 1.450% | 6/01/26 | BBB | 101,134 | |
| 83 | CenterPoint Energy Resources Corp | 3.550% | 4/01/23 | A- | 86,927 | |
| 80 | CMS Energy Corp | 3.875% | 3/01/24 | BBB | 85,818 | |
| 121 | Dominion Energy Inc | 3.071% | 8/15/24 | BBB | 128,755 | |
| 150 | Dominion Energy Inc | 3.300% | 3/15/25 | BBB | 162,801 | |
| 100 | Dominion Energy Inc | 1.450% | 4/15/26 | BBB | 100,949 | |
| 70 | DTE Energy Co | 2.529% | 10/01/24 | BBB | 73,430 | |
| 179 | Duke Energy Carolinas LLC | 3.050% | 3/15/23 | A+ | 186,534 | |
| 85 | Edison International | 4.950% | 4/15/25 | BBB- | 94,419 | |
| 70 | Entergy Gulf States Louisiana LLC | 5.590% | 10/01/24 | A | 80,514 | |
| 169 | Entergy Louisiana LLC | 5.400% | 11/01/24 | A | 194,064 | |
| 109 | Evergy Inc | 2.450% | 9/15/24 | BBB | 114,657 | |
| 70 | Eversource Energy | 2.750% | 3/15/22 | BBB+ | 70,933 | |
| 100 | Eversource Energy | 0.800% | 8/15/25 | BBB+ | 99,785 | |
| 59 | Exelon Corp | 3.497% | 6/01/22 | BBB | 60,385 | |
| 120 | Exelon Corp | 3.950% | 6/15/25 | BBB | 132,406 | |
| 150 | Exelon Corp | 3.400% | 4/15/26 | BBB | 164,616 | |
| 266 | Georgia Power Co | 2.200% | 9/15/24 | A- | 278,086 | |
| 50 | Interstate Power and Light Co | 3.250% | 12/01/24 | BBB+ | 53,800 | |
| 74 | ITC Holdings Corp | 2.700% | 11/15/22 | BBB | 76,018 | |
| 100 | National Rural Utilities Cooperative Finance Corp | 0.350% | 2/08/24 | A | 99,458 | |
| 24 | NextEra Energy Capital Holdings Inc | 2.800% | 1/15/23 | BBB+ | 24,791 | |
| 235 | NextEra Energy Capital Holdings Inc | 2.750% | 5/01/25 | BBB+ | 250,380 | |
| 20 | Oncor Electric Delivery Co LLC | 2.950% | 4/01/25 | A | 21,422 | |
| 100 | Pacific Gas and Electric Co | 3.400% | 8/15/24 | BBB- | 104,375 | |
| 250 | Pacific Gas and Electric Co | 3.450% | 7/01/25 | BBB- | 260,789 | |
| 134 | PacifiCorp | 3.600% | 4/01/24 | A+ | 143,968 | |
| 150 | PacifiCorp | 3.350% | 7/01/25 | A+ | 163,109 | |
| 150 | Pinnacle West Capital Corp | 1.300% | 6/15/25 | A- | 151,845 | |
| 224 | PSEG Power LLC | 3.850% | 6/01/23 | BBB | 237,249 | |
| 100 | Public Service Co of Colorado | 2.900% | 5/15/25 | A+ | 106,751 |
| Principal Amount (000) | Description (1) | Coupon | Maturity | Ratings (2) | Value | |
| Utility (continued) | ||||||
| $ 100 | Public Service Electric and Gas Co | 0.950% | 3/15/26 | A+ | $100,185 | |
| 85 | Sempra Energy | 3.550% | 6/15/24 | BBB | 91,321 | |
| 31 | Southern California Edison Co | 1.845% | 2/01/22 | A- | 31,032 | |
| 61 | Southern California Edison Co | 3.400% | 6/01/23 | A- | 64,069 | |
| 100 | Southern California Edison Co | 1.200% | 2/01/26 | A- | 100,446 | |
| 50 | Tucson Electric Power Co | 3.050% | 3/15/25 | A- | 53,701 | |
| 120 | Wisconsin Electric Power Co | 3.100% | 6/01/25 | A | 129,440 | |
| 4,803 | Total Utility | 5,067,046 | ||||
| $ 16,522 | Total Corporate Debt (cost $16,950,340) | 17,384,755 |
| Principal Amount (000) | Description (1) | Coupon | Maturity | Ratings (2) | Value | |
| SECURITIZED – 30.0% | ||||||
| $ 202 | American Express Credit Account Master Trust | 2.200% | 4/15/25 | AA- | $206,157 | |
| 50 | AmeriCredit Automobile Receivables Trust 2021-2 | 1.010% | 1/19/27 | AA- | 50,045 | |
| 20 | BA Credit Card Trust | 0.440% | 9/15/26 | AAA | 20,000 | |
| 50 | BANK 2021-BNK34 | 1.935% | 6/15/63 | AAA | 51,648 | |
| 100 | BENCHMARK 2018-B1 Mortgage Trust | 3.571% | 1/15/51 | AAA | 103,090 | |
| 150 | Carmax Auto Owner Trust 2018-3 | 3.130% | 6/15/23 | AAA | 151,667 | |
| 95 | Carmax Auto Owner Trust 2020-1 | 1.890% | 12/16/24 | AAA | 96,539 | |
| 100 | CNH Equipment Trust 2019-C | 2.350% | 4/15/27 | Aa1 | 103,693 | |
| 120 | COMM 2012-CCRE1 Mortgage Trust | 3.912% | 5/15/45 | Aaa | 122,179 | |
| 542 | COMM 2014-CCRE16 Mortgage Trust | 3.775% | 4/10/47 | AAA | 575,001 | |
| 190 | COMM 2014-LC17 Mortgage Trust | 3.648% | 10/10/47 | Aaa | 199,915 | |
| 260 | Fannie Mae Pool BM3087 | 4.000% | 12/01/32 | N/R | 278,159 | |
| 85 | Fannie Mae Pool MA3392 | 3.500% | 6/01/33 | N/R | 91,278 | |
| 65 | Fannie Mae Pool MA3490 | 4.000% | 10/01/33 | N/R | 68,964 | |
| 148 | Fannie Mae Pool MA3798 | 3.000% | 10/01/34 | N/R | 156,376 | |
| 40 | Fannie Mae Pool MA3828 | 3.000% | 11/01/34 | N/R | 41,695 | |
| 43 | Fannie Mae Pool MA3897 | 3.000% | 1/01/35 | N/R | 45,198 | |
| 526 | Fannie Mae Pool MA3985 | 3.000% | 4/01/35 | N/R | 553,858 | |
| 563 | Fannie Mae Pool MA4179 | 2.000% | 11/01/35 | N/R | 584,936 | |
| 430 | Fannie Mae Pool MA4206 | 2.000% | 12/01/35 | N/R | 445,975 | |
| 1,797 | Fannie Mae Pool MA4262 | 2.500% | 2/01/36 | N/R | 1,886,566 | |
| 721 | Fannie Mae Pool MA4278 | 1.500% | 3/01/36 | N/R | 734,388 | |
| 955 | Fannie Mae Pool MA4279 | 2.000% | 3/01/36 | N/R | 991,367 | |
| 300 | Fannie Mae Pool MA4418, (WI/DD) | 2.000% | 8/01/36 | N/R | 311,480 | |
| 100 | Ford Credit Auto Owner Trust 2020-B | 1.190% | 1/15/26 | AA | 101,582 | |
| 500 | Ford Credit Floorplan Master Owner Trust A | 2.440% | 9/15/26 | AAA | 527,032 | |
| 153 | Freddie Mac Gold Pool G18642 | 3.500% | 4/01/32 | N/R | 164,259 |
| Principal Amount (000) | Description (1) | Coupon | Maturity | Ratings (2) | Value | |
| $ 700 | Freddie Mac Multifamily Structured Pass-Through Certificates | 3.205% | 3/25/25 | AAA | $760,059 | |
| 100 | GM Financial Automobile Leasing Trust 2021-2 | 0.690% | 5/20/25 | AA | 100,027 | |
| 150 | GM Financial Consumer Automobile Receivables Trust 2020-1 | 2.180% | 5/16/25 | AA+ | 154,154 | |
| 300 | GS Mortgage Securities Trust 2019-GC38 | 3.872% | 2/10/52 | AAA | 318,859 | |
| 100 | Honda Auto Receivables 2020-3 Owner Trust | 0.370% | 10/18/24 | AAA | 100,201 | |
| 50 | John Deere Owner Trust | 0.740% | 5/15/28 | Aaa | 50,194 | |
| 200 | JP Morgan Chase Commercial Mortgage Securities Trust 2013-C16 | 4.166% | 12/15/46 | Aaa | 214,858 | |
| 100 | Mercedes-Benz Auto Lease Trust 2021-B | 0.400% | 11/15/24 | AAA | 100,118 | |
| 50 | MMAF Equipment Finance LLC 2019-A, 144A | 2.930% | 3/10/26 | Aaa | 51,949 | |
| 300 | Morgan Stanley Bank of America Merrill Lynch Trust 2015-C26 | 3.531% | 10/15/48 | Aaa | 327,291 | |
| 100 | Morgan Stanley Capital I Trust 2021-L5 | 1.518% | 5/15/54 | AAA | 100,987 | |
| 100 | Santander Drive Auto Receivables Trust 2021-2 | 0.900% | 6/15/26 | Aa3 | 100,278 | |
| 50 | Santander Retail Auto Lease Trust 2017-A, 144A | 0.540% | 6/20/25 | Aaa | 49,979 | |
| 50 | Santander Retail Auto Lease Trust 2017-A, 144A | 1.410% | 11/20/25 | Baa2 | 49,972 | |
| 119 | SoFi Professional Loan Program 2020-C Trust, 144A | 1.950% | 2/15/46 | AAA | 120,686 | |
| 100 | Toyota Auto Receivables 2019-A Owner Trust | 3.000% | 5/15/24 | AAA | 103,512 | |
| 100 | Toyota Auto Receivables 2021-B Owner Trust | 0.530% | 10/15/26 | AAA | 100,001 | |
| 90 | Verizon Master Trust | 0.500% | 5/20/27 | AAA | 90,155 | |
| 89 | Verizon Owner Trust 2019-A | 2.930% | 9/20/23 | AAA | 90,100 | |
| 135 | Wells Fargo Commercial Mortgage Trust 2016-C32 | 3.324% | 1/15/59 | Aaa | 142,428 | |
| 118 | WFRBS Commercial Mortgage Trust 2012-C7 | 4.090% | 6/15/45 | Baa1 | 119,608 | |
| 140 | WFRBS Commercial Mortgage Trust 2013-C12 | 3.863% | 3/15/48 | AA | 145,332 | |
| 100 | World Omni Auto Receivables Trust 2021-B | 0.420% | 6/15/26 | AAA | 100,178 | |
| $ 11,646 | Total Securitized (cost $12,066,426) | 12,153,973 |
| Principal Amount (000) | Description (1) | Coupon | Maturity | Ratings (2) | Value | |
| U.S. TREASURY – 26.2% | ||||||
| $ 2,884 | United States Treasury Note/Bond | 1.375% | 10/15/22 | AAA | $2,928,161 | |
| 211 | United States Treasury Note/Bond | 2.000% | 10/31/22 | AAA | 215,954 | |
| 128 | United States Treasury Note/Bond | 2.000% | 11/30/22 | AAA | 131,210 | |
| 337 | United States Treasury Note/Bond | 2.375% | 1/31/23 | AAA | 348,255 | |
| 542 | United States Treasury Note/Bond | 2.500% | 3/31/23 | AAA | 563,066 | |
| 300 | United States Treasury Note/Bond | 0.125% | 5/31/23 | AAA | 299,801 | |
| 113 | United States Treasury Note/Bond | 2.875% | 11/30/23 | AAA | 119,908 | |
| 113 | United States Treasury Note/Bond | 2.500% | 1/31/24 | AAA | 119,277 | |
| 332 | United States Treasury Note/Bond | 1.750% | 6/30/24 | AAA | 345,578 | |
| 70 | United States Treasury Note/Bond | 1.250% | 8/31/24 | AAA | 71,878 | |
| 1,681 | United States Treasury Note/Bond | 1.375% | 1/31/25 | AAA | 1,734,516 | |
| 167 | United States Treasury Note/Bond | 0.375% | 4/30/25 | AAA | 166,198 | |
| 350 | United States Treasury Note/Bond | 0.250% | 5/31/25 | AAA | 346,377 | |
| 650 | United States Treasury Note/Bond | 0.250% | 7/31/25 | AAA | 642,230 |
| Principal Amount (000) | Description (1) | Coupon | Maturity | Ratings (2) | Value | |
| $ 200 | United States Treasury Note/Bond | 0.375% | 12/31/25 | AAA | $197,828 | |
| 700 | United States Treasury Note/Bond | 0.750% | 4/30/26 | AAA | 702,789 | |
| 1,300 | United States Treasury Note/Bond | 0.750% | 5/31/26 | AAA | 1,304,266 | |
| 350 | United States Treasury Note/Bond | 0.875% | 6/30/26 | AAA | 353,090 | |
| $ 10,428 | Total U.S. Treasury (cost $10,540,912) | 10,590,382 | ||||
| Total Long-Term Investments (cost $39,557,678) | 40,129,110 |
| Shares | Description (1) | Coupon | Value | |||
| INVESTMENTS PURCHASED WITH COLLATERAL FROM SECURITIES LENDING – 0.7% | ||||||
| MONEY MARKET FUNDS – 0.7% | ||||||
| 277,750 | State Street Navigator Securities Lending Government Money Market Portfolio, (4) | 0.050% (5) | $ 277,750 | |||
| Total Investments Purchased with Collateral from Securities Lending (cost $277,750) | 277,750 | |||||
| Principal Amount (000) | Description (1) | Coupon | Maturity | Ratings (2) | Value | |
| SHORT-TERM INVESTMENTS – 1.8% | ||||||
| U.S. GOVERNMENT AND AGENCY OBLIGATIONS – 1.8% | ||||||
| $ 727 | Federal Agricultural Mortgage Corp Discount Notes | 0.000% | 8/02/21 | N/R | $ 727,000 | |
| $ 727 | Total Short-Term Investments (cost $727,000) | 727,000 | ||||
| Total Investments (cost $40,562,428) – 101.7% | 41,133,860 | |||||
| Other Assets Less Liabilities – (1.7)% | (677,827) | |||||
| Net Assets – 100% | $ 40,456,033 |
| For Fund portfolio compliance purposes, the Fund’s industry classifications refer to any one or more of the industry sub-classifications used by one or more widely recognized market indexes or ratings group indexes, and/or as defined by Fund management. This definition may not apply for purposes of this report, which may combine industry sub-classifications into sectors for reporting ease. | ||
| (1) | All percentages shown in the Portfolio of Investments are based on net assets. | |
| (2) | The Fund uses credit quality ratings for its portfolio securities provided by Moody's, S&P and Fitch. If all three of Moody's, S&P, and Fitch provide a rating for a security, an average of the ratings is used; if two of the three agencies rate a security, an average of the two is used; and if only one rating agency rates a security, that rating is used. AAA, AA, A, and BBB are investment grade ratings; BB, B, CCC/CC/C and D are below-investment grade ratings. Credit ratings are subject to change. Holdings designated N/R are not rated by Moody's, S&P or Fitch. Ratings are not covered by the report of independent registered public accounting firm. | |
| (3) | Investment, or a portion of investment, is out on loan for securities lending. The total value of the securities out on loan as of the end of the reporting period was $271,949. | |
| (4) | The Fund may loan securities representing up to one third of the market value of its total assets (which includes collateral for securities on loan) to broker dealers, banks, and other institutions. The collateral maintained by the Fund shall have a market value, at the inception of each loan, equal to not less than 100% of the market value of the loaned securities. The cash collateral received by the Fund is invested in this money market fund. | |
| (5) | The rate shown is the one-day yield as of the end of the reporting period. | |
| 144A | Investment is exempt from registration under Rule 144A of the Securities Act of 1933, as amended. These investments may only be resold in transactions exempt from registration, which are normally those transactions with qualified institutional buyers. | |
| WI/DD | Purchased on a when-issued or delayed delivery basis. |
| Principal Amount (000) | Description (1) | Coupon | Maturity | Ratings (2) | Value | |
| LONG-TERM INVESTMENTS – 97.7% | ||||||
| CORPORATE DEBT – 97.7% | ||||||
| Financials – 7.7% | ||||||
| $ 110 | Brookfield Property REIT Inc / BPR Cumulus LLC / BPR Nimbus LLC / GGSI Sellco LL, 144A | 5.750% | 5/15/26 | BB+ | $114,125 | |
| 470 | Centene Corp, 144A | 5.375% | 6/01/26 | BB+ | 489,599 | |
| 60 | Centene Corp, 144A | 5.375% | 8/15/26 | BB+ | 62,478 | |
| 260 | Centene Corp | 4.250% | 12/15/27 | BB+ | 274,300 | |
| 165 | Centene Corp | 2.450% | 7/15/28 | BB+ | 167,269 | |
| 1,700 | Centene Corp | 4.625% | 12/15/29 | BB+ | 1,863,115 | |
| 140 | Compass Group Diversified Holdings LLC, 144A | 5.250% | 4/15/29 | B+ | 145,230 | |
| 60 | Curo Group Holdings Corp, 144A | 7.500% | 8/01/28 | B- | 61,050 | |
| 350 | Deutsche Bank AG/New York NY | 5.882% | 7/08/31 | BB+ | 413,179 | |
| 100 | Enact Holdings Inc, 144A | 6.500% | 8/15/25 | Ba3 | 108,432 | |
| 150 | HAT Holdings I LLC / HAT Holdings II LLC, 144A | 3.375% | 6/15/26 | BB+ | 152,007 | |
| 160 | Howard Hughes Corp, 144A | 5.375% | 8/01/28 | BB- | 169,400 | |
| 140 | Howard Hughes Corp, 144A | 4.375% | 2/01/31 | BB- | 139,639 | |
| 50 | Icahn Enterprises LP / Icahn Enterprises Finance Corp | 4.750% | 9/15/24 | BB | 52,111 | |
| 240 | Intesa Sanpaolo SpA, 144A | 5.710% | 1/15/26 | BB+ | 270,908 | |
| 200 | iStar Inc | 4.250% | 8/01/25 | BB | 207,362 | |
| 300 | Kennedy-Wilson Inc | 5.000% | 3/01/31 | BB | 307,500 | |
| 140 | LPL Holdings Inc, 144A | 4.000% | 3/15/29 | BB | 142,100 | |
| 150 | MGIC Investment Corp | 5.250% | 8/15/28 | BB+ | 159,461 | |
| 200 | Molina Healthcare Inc, 144A | 4.375% | 6/15/28 | BB- | 209,250 | |
| 200 | Molina Healthcare Inc, 144A | 3.875% | 11/15/30 | BB- | 211,750 | |
| 110 | MPT Operating Partnership LP / MPT Finance Corp | 4.625% | 8/01/29 | BBB- | 118,415 | |
| 610 | Nationstar Mortgage Holdings Inc, 144A | 5.125% | 12/15/30 | B | 608,475 | |
| 100 | OneMain Finance Corp | 6.875% | 3/15/25 | BB- | 113,432 | |
| 150 | Park Intermediate Holdings LLC / PK Domestic Property LLC / PK Finance Co-Issuer, 144A | 5.875% | 10/01/28 | B+ | 160,125 | |
| 400 | PennyMac Financial Services Inc, 144A | 5.375% | 10/15/25 | BB- | 419,736 | |
| 260 | UniCredit SpA, 144A | 5.459% | 6/30/35 | BB+ | 286,910 | |
| 6,975 | Total Financials | 7,427,358 | ||||
| Industrial – 88.8% | ||||||
| 750 | 1011778 BC ULC / New Red Finance Inc, 144A | 3.875% | 1/15/28 | BB+ | 755,467 | |
| 100 | ACCO Brands Corp, 144A | 4.250% | 3/15/29 | BB- | 99,875 | |
| 110 | Adtalem Global Education Inc, 144A | 5.500% | 3/01/28 | BB- | 112,613 | |
| 210 | AECOM | 5.125% | 3/15/27 | BB- | 233,625 |
| Principal Amount (000) | Description (1) | Coupon | Maturity | Ratings (2) | Value | |
| Industrial (continued) | ||||||
| $ 100 | Altera Infrastructure LP/Teekay Offshore Finance Corp, 144A | 8.500% | 7/15/23 | CCC | $91,625 | |
| 200 | Altice France Holding SA, 144A | 6.000% | 2/15/28 | CCC+ | 197,250 | |
| 100 | American Airlines Group Inc, 144A, (3) | 3.750% | 3/01/25 | CCC | 88,999 | |
| 258 | American Axle & Manufacturing Inc | 6.250% | 4/01/25 | B | 266,708 | |
| 170 | AmeriGas Partners LP / AmeriGas Finance Corp | 5.500% | 5/20/25 | Ba2 | 187,527 | |
| 150 | AmeriGas Partners LP / AmeriGas Finance Corp | 5.875% | 8/20/26 | Ba2 | 168,000 | |
| 100 | AMN Healthcare Inc, 144A | 4.625% | 10/01/27 | BB- | 104,125 | |
| 100 | Antero Midstream Partners LP / Antero Midstream Finance Corp, 144A | 7.875% | 5/15/26 | BB- | 110,747 | |
| 120 | Antero Midstream Partners LP / Antero Midstream Finance Corp, 144A | 5.750% | 3/01/27 | BB- | 123,600 | |
| 180 | Aramark Services Inc, 144A | 5.000% | 4/01/25 | B+ | 184,725 | |
| 100 | Aramark Services Inc, 144A | 5.000% | 2/01/28 | B+ | 103,888 | |
| 210 | Archrock Partners LP / Archrock Partners Finance Corp, 144A | 6.875% | 4/01/27 | B+ | 220,500 | |
| 340 | Archrock Partners LP / Archrock Partners Finance Corp, 144A | 6.250% | 4/01/28 | B+ | 346,375 | |
| 280 | Ardagh Metal Packaging Finance USA LLC / Ardagh Metal Packaging Finance PLC, 144A | 4.000% | 9/01/29 | B+ | 280,350 | |
| 150 | Ardagh Packaging Finance PLC / Ardagh Holdings USA Inc, 144A | 5.250% | 8/15/27 | B- | 153,165 | |
| 120 | ASGN Inc, 144A | 4.625% | 5/15/28 | BB- | 124,500 | |
| 210 | Aston Martin Capital Holdings Ltd, 144A | 10.500% | 11/30/25 | CCC+ | 233,100 | |
| 390 | Avantor Funding Inc, 144A | 4.625% | 7/15/28 | BB- | 410,475 | |
| 910 | Avaya Inc, 144A | 6.125% | 9/15/28 | B+ | 973,700 | |
| 110 | Avient Corp, 144A | 5.750% | 5/15/25 | BB- | 115,500 | |
| 50 | Avis Budget Car Rental LLC / Avis Budget Finance Inc, 144A, (3) | 5.375% | 3/01/29 | B | 52,000 | |
| 160 | Axalta Coating Systems LLC, 144A | 3.375% | 2/15/29 | BB- | 157,400 | |
| 60 | Ball Corp | 4.875% | 3/15/26 | BB+ | 67,050 | |
| 110 | Ball Corp | 2.875% | 8/15/30 | BB+ | 108,858 | |
| 200 | Bausch Health Cos Inc, 144A | 5.750% | 8/15/27 | BB | 210,500 | |
| 1,750 | Bausch Health Cos Inc, 144A | 7.000% | 1/15/28 | B | 1,837,500 | |
| 400 | Bausch Health Cos Inc, 144A | 5.000% | 1/30/28 | B | 381,500 | |
| 350 | Black Knight InfoServ LLC, 144A | 3.625% | 9/01/28 | BB- | 350,719 | |
| 60 | Bombardier Inc, 144A | 7.875% | 4/15/27 | CCC | 62,176 | |
| 110 | Booz Allen Hamilton Inc, 144A | 3.875% | 9/01/28 | BB | 112,200 | |
| 150 | Builders FirstSource Inc, 144A | 6.750% | 6/01/27 | BBB- | 160,500 | |
| 60 | Builders FirstSource Inc, 144A | 5.000% | 3/01/30 | BB- | 63,825 | |
| 150 | Builders FirstSource Inc, 144A | 4.250% | 2/01/32 | BB- | 153,189 | |
| 150 | Cable One Inc, 144A | 4.000% | 11/15/30 | BB- | 150,750 | |
| 110 | Cascades Inc/Cascades USA Inc, 144A | 5.375% | 1/15/28 | BB- | 115,775 | |
| 400 | Catalent Pharma Solutions Inc, 144A | 5.000% | 7/15/27 | BB- | 418,500 | |
| 150 | CDK Global Inc, 144A | 5.250% | 5/15/29 | BB+ | 163,125 | |
| 240 | CDW LLC / CDW Finance Corp | 4.250% | 4/01/28 | BBB- | 249,235 | |
| 440 | Cedar Fair LP / Canada's Wonderland Co / Magnum Management Corp / Millennium Op | 5.375% | 4/15/27 | B- | 448,800 |
| Principal Amount (000) | Description (1) | Coupon | Maturity | Ratings (2) | Value | |
| Industrial (continued) | ||||||
| $ 490 | Century Communities Inc | 6.750% | 6/01/27 | BB- | $520,375 | |
| 510 | Charles River Laboratories International Inc, 144A | 3.750% | 3/15/29 | BB | 523,387 | |
| 300 | Chemours Co, (3) | 5.375% | 5/15/27 | B+ | 325,500 | |
| 200 | Chemours Co, 144A | 5.750% | 11/15/28 | B+ | 212,250 | |
| 280 | Cheniere Energy Inc | 4.625% | 10/15/28 | Ba3 | 295,215 | |
| 120 | Cheniere Energy Partners LP | 5.625% | 10/01/26 | BB | 123,913 | |
| 300 | Cheniere Energy Partners LP | 4.500% | 10/01/29 | BB | 323,625 | |
| 150 | Cheniere Energy Partners LP, 144A | 4.000% | 3/01/31 | BB | 158,670 | |
| 100 | Clarivate Science Holdings Corp, 144A | 4.875% | 6/30/29 | CCC+ | 100,714 | |
| 170 | Clean Harbors Inc, 144A | 4.875% | 7/15/27 | BB+ | 178,288 | |
| 400 | Clear Channel Outdoor Holdings Inc, 144A | 7.500% | 6/01/29 | CCC | 414,640 | |
| 210 | Clear Channel Worldwide Holdings Inc, 144A | 5.125% | 8/15/27 | B+ | 215,607 | |
| 100 | CommScope Inc, 144A | 5.500% | 3/01/24 | BB- | 102,859 | |
| 640 | CommScope Inc, 144A | 6.000% | 3/01/26 | BB- | 667,200 | |
| 240 | CommScope Inc, 144A | 8.250% | 3/01/27 | B- | 254,100 | |
| 312 | CommScope Technologies LLC, 144A | 6.000% | 6/15/25 | B- | 316,680 | |
| 310 | CommScope Technologies LLC, 144A | 5.000% | 3/15/27 | B- | 313,658 | |
| 100 | Consolidated Communications Inc, 144A | 6.500% | 10/01/28 | B+ | 107,598 | |
| 460 | Cornerstone Building Brands Inc, 144A | 6.125% | 1/15/29 | B- | 489,900 | |
| 100 | Crestwood Midstream Partners LP / Crestwood Midstream Finance Corp, 144A | 5.625% | 5/01/27 | BB- | 102,235 | |
| 260 | Crestwood Midstream Partners LP / Crestwood Midstream Finance Corp, 144A | 6.000% | 2/01/29 | BB- | 270,400 | |
| 130 | Darling Ingredients Inc, 144A | 5.250% | 4/15/27 | BB+ | 136,149 | |
| 650 | DaVita Inc, 144A | 4.625% | 6/01/30 | BB- | 671,937 | |
| 830 | DaVita Inc, 144A | 3.750% | 2/15/31 | BB- | 804,909 | |
| 80 | DCP Midstream Operating LP | 5.375% | 7/15/25 | BB+ | 88,400 | |
| 166 | Delta Air Lines Inc | 7.375% | 1/15/26 | BB+ | 195,381 | |
| 150 | Deluxe Corp, 144A | 8.000% | 6/01/29 | B- | 163,875 | |
| 760 | Diamond Sports Group LLC / Diamond Sports Finance Co, 144A, (3) | 5.375% | 8/15/26 | CCC+ | 440,800 | |
| 200 | Diamond Sports Group LLC / Diamond Sports Finance Co, 144A | 6.625% | 8/15/27 | CCC- | 79,250 | |
| 200 | DT Midstream Inc, 144A | 4.125% | 6/15/29 | BB+ | 205,120 | |
| 210 | Edgewell Personal Care Co, 144A | 5.500% | 6/01/28 | BB | 222,363 | |
| 410 | Elanco Animal Health Inc | 5.272% | 8/28/23 | BB | 438,700 | |
| 300 | Elastic NV, 144A | 4.125% | 7/15/29 | B+ | 301,137 | |
| 140 | Encompass Health Corp | 4.500% | 2/01/28 | B+ | 145,250 | |
| 100 | Encompass Health Corp | 4.750% | 2/01/30 | B+ | 106,750 | |
| 30 | Energizer Holdings Inc, 144A | 4.750% | 6/15/28 | B+ | 30,825 | |
| 510 | Energizer Holdings Inc, 144A | 4.375% | 3/31/29 | B+ | 513,493 | |
| 350 | Envision Healthcare Corp, 144A | 8.750% | 10/15/26 | CCC- | 258,083 | |
| 210 | Flex Acquisition Co Inc, 144A | 7.875% | 7/15/26 | CCC+ | 218,770 | |
| 500 | Frontier Communications Holdings LLC, 144A | 6.750% | 5/01/29 | CCC+ | 532,500 | |
| 410 | Gap Inc, 144A | 8.875% | 5/15/27 | BB | 471,324 |
| Principal Amount (000) | Description (1) | Coupon | Maturity | Ratings (2) | Value | |
| Industrial (continued) | ||||||
| $ 260 | Gartner Inc, 144A | 4.500% | 7/01/28 | BB+ | $274,950 | |
| 160 | Gartner Inc, 144A | 3.625% | 6/15/29 | BB+ | 163,800 | |
| 140 | Gates Global LLC / Gates Corp, 144A | 6.250% | 1/15/26 | B | 145,387 | |
| 550 | Global Medical Response Inc, 144A | 6.500% | 10/01/25 | B | 570,625 | |
| 200 | Go Daddy Operating Co LLC / GD Finance Co Inc, 144A | 5.250% | 12/01/27 | BB- | 209,786 | |
| 600 | Gray Television Inc, 144A | 4.750% | 10/15/30 | B+ | 594,816 | |
| 400 | Greif Inc, 144A | 6.500% | 3/01/27 | B+ | 421,000 | |
| 230 | GrubHub Holdings Inc, 144A | 5.500% | 7/01/27 | BB- | 241,684 | |
| 110 | H&E Equipment Services Inc, 144A | 3.875% | 12/15/28 | BB- | 109,038 | |
| 220 | Hanesbrands Inc, 144A | 4.625% | 5/15/24 | BB | 232,650 | |
| 160 | Hanesbrands Inc, 144A | 4.875% | 5/15/26 | BB | 172,496 | |
| 110 | HCA Inc | 5.875% | 2/15/26 | BB+ | 127,875 | |
| 610 | HCA Inc | 3.500% | 9/01/30 | BB+ | 662,429 | |
| 250 | Herbalife Nutrition Ltd / HLF Financing Inc, 144A | 7.875% | 9/01/25 | BB- | 271,563 | |
| 500 | Herc Holdings Inc, 144A | 5.500% | 7/15/27 | BB- | 524,375 | |
| 310 | Hilton Domestic Operating Co Inc | 4.875% | 1/15/30 | BB | 332,503 | |
| 500 | Hilton Grand Vacations Borrower Escrow LLC / Hilton Grand Vacations Borrower Esc, 144A | 5.000% | 6/01/29 | B | 504,510 | |
| 500 | Hilton Grand Vacations Borrower Escrow LLC / Hilton Grand Vacations Borrower Esc, 144A | 4.875% | 7/01/31 | B | 490,441 | |
| 80 | Hilton Worldwide Finance LLC / Hilton Worldwide Finance Corp | 4.875% | 4/01/27 | BB | 83,023 | |
| 200 | HLF Financing Sarl LLC / Herbalife International Inc, 144A | 4.875% | 6/01/29 | BB- | 201,900 | |
| 150 | Hologic Inc, 144A | 3.250% | 2/15/29 | BB | 151,503 | |
| 400 | Horizon Therapeutics USA Inc, 144A | 5.500% | 8/01/27 | BB- | 426,000 | |
| 210 | Howmet Aerospace Inc | 6.875% | 5/01/25 | BB+ | 244,379 | |
| 190 | Hughes Satellite Systems Corp | 5.250% | 8/01/26 | BBB- | 212,325 | |
| 70 | Hughes Satellite Systems Corp, (3) | 6.625% | 8/01/26 | BB | 78,663 | |
| 260 | IAA Inc, 144A | 5.500% | 6/15/27 | B | 272,675 | |
| 600 | iHeartCommunications Inc | 8.375% | 5/01/27 | CCC+ | 638,244 | |
| 670 | IHS Markit Ltd | 4.750% | 8/01/28 | Baa2 | 797,300 | |
| 200 | Indigo Merger Sub Inc, 144A | 2.875% | 7/15/26 | BB+ | 203,980 | |
| 120 | Iron Mountain Inc, 144A | 5.250% | 3/15/28 | BB- | 125,400 | |
| 390 | Iron Mountain Inc, 144A | 4.875% | 9/15/29 | BB- | 408,525 | |
| 850 | ITT Holdings LLC, 144A | 6.500% | 8/01/29 | B | 847,943 | |
| 450 | Jaguar Holding Co II / PPD Development LP, 144A | 5.000% | 6/15/28 | B+ | 484,875 | |
| 200 | Jazz Securities DAC, 144A | 4.375% | 1/15/29 | BB | 208,250 | |
| 190 | KAR Auction Services Inc, 144A | 5.125% | 6/01/25 | B- | 194,513 | |
| 648 | Kraft Heinz Foods Co | 3.000% | 6/01/26 | BB+ | 688,214 | |
| 200 | L Brands Inc, 144A | 6.625% | 10/01/30 | BB- | 230,000 | |
| 10 | Lamb Weston Holdings Inc, 144A | 4.625% | 11/01/24 | BB+ | 10,275 | |
| 350 | Lamb Weston Holdings Inc, 144A | 4.875% | 5/15/28 | BB+ | 387,625 |
| Principal Amount (000) | Description (1) | Coupon | Maturity | Ratings (2) | Value | |
| Industrial (continued) | ||||||
| $ 250 | Level 3 Financing Inc, 144A | 4.250% | 7/01/28 | BB | $254,531 | |
| 200 | Lions Gate Capital Holdings LLC, 144A | 5.500% | 4/15/29 | B- | 204,740 | |
| 350 | Live Nation Entertainment Inc, 144A | 4.750% | 10/15/27 | B- | 357,437 | |
| 430 | LogMeIn Inc, 144A | 5.500% | 9/01/27 | B | 445,759 | |
| 300 | Lumen Technologies Inc, 144A | 4.000% | 2/15/27 | BB+ | 308,250 | |
| 250 | Macy's Inc, 144A | 8.375% | 6/15/25 | BB+ | 272,500 | |
| 80 | Marriott Ownership Resorts Inc / ILG LLC | 6.500% | 9/15/26 | B+ | 82,965 | |
| 70 | Masonite International Corp, 144A | 5.375% | 2/01/28 | BB+ | 74,463 | |
| 100 | MasTec Inc, 144A | 4.500% | 8/15/28 | BB | 105,452 | |
| 400 | MEDNAX Inc, 144A | 6.250% | 1/15/27 | B+ | 421,384 | |
| 120 | Mercer International Inc | 5.125% | 2/01/29 | BB- | 122,250 | |
| 150 | Methanex Corp | 5.250% | 12/15/29 | BB | 165,825 | |
| 490 | MGM Growth Properties Operating Partnership LP / MGP Finance Co-Issuer Inc | 5.625% | 5/01/24 | BB- | 530,342 | |
| 740 | MGM Growth Properties Operating Partnership LP / MGP Finance Co-Issuer Inc | 5.750% | 2/01/27 | BB- | 826,950 | |
| 330 | Michaels Cos Inc, 144A | 5.250% | 5/01/28 | BB- | 341,550 | |
| 100 | ModivCare Inc, 144A | 5.875% | 11/15/25 | B+ | 106,125 | |
| 100 | NCL Corp Ltd, 144A | 3.625% | 12/15/24 | B- | 95,125 | |
| 250 | NCL Corp Ltd, 144A | 10.250% | 2/01/26 | B+ | 285,625 | |
| 150 | NCL Corp Ltd, 144A | 5.875% | 3/15/26 | B- | 151,125 | |
| 150 | NCL Finance Ltd, 144A | 6.125% | 3/15/28 | B- | 151,500 | |
| 380 | NCR Corp, 144A | 5.750% | 9/01/27 | B+ | 400,900 | |
| 560 | NCR Corp, 144A | 5.000% | 10/01/28 | B+ | 576,800 | |
| 240 | NCR Corp, 144A | 6.125% | 9/01/29 | B+ | 260,282 | |
| 110 | Netflix Inc | 4.875% | 4/15/28 | BB+ | 128,700 | |
| 130 | Netflix Inc | 5.875% | 11/15/28 | BB+ | 161,525 | |
| 100 | Newell Brands Inc | 4.875% | 6/01/25 | BB+ | 110,750 | |
| 300 | Nexstar Media Inc, 144A | 4.750% | 11/01/28 | B+ | 309,372 | |
| 700 | Nielsen Co Luxembourg SARL, 144A, (3) | 5.000% | 2/01/25 | BB | 718,830 | |
| 1,700 | Nielsen Finance LLC / Nielsen Finance Co, 144A | 5.625% | 10/01/28 | BB | 1,795,625 | |
| 300 | Nielsen Finance LLC / Nielsen Finance Co, 144A | 4.750% | 7/15/31 | BB | 302,573 | |
| 160 | Nokia Oyj | 4.375% | 6/12/27 | BB+ | 176,400 | |
| 220 | NortonLifeLock Inc, 144A | 5.000% | 4/15/25 | BB- | 222,750 | |
| 160 | ON Semiconductor Corp, 144A | 3.875% | 9/01/28 | BB | 166,672 | |
| 200 | Open Text Corp, 144A | 3.875% | 2/15/28 | BB | 206,500 | |
| 200 | Outfront Media Capital LLC / Outfront Media Capital Corp, 144A | 5.000% | 8/15/27 | B+ | 204,000 | |
| 110 | Owens & Minor Inc, 144A | 4.500% | 3/31/29 | B | 112,750 | |
| 100 | Owens-Brockway Glass Container Inc, 144A | 5.875% | 8/15/23 | B | 107,125 | |
| 120 | Parkland Corp/Canada, 144A | 5.875% | 7/15/27 | BB | 127,950 | |
| 170 | PBF Holding Co LLC / PBF Finance Corp | 7.250% | 6/15/25 | B+ | 102,000 | |
| 700 | Performance Food Group Inc, 144A | 5.500% | 10/15/27 | B | 729,171 | |
| 85 | Performance Food Group Inc, 144A | 4.250% | 8/01/29 | B2 | 86,249 |
| Principal Amount (000) | Description (1) | Coupon | Maturity | Ratings (2) | Value | |
| Industrial (continued) | ||||||
| $ 200 | Plantronics Inc, 144A | 4.750% | 3/01/29 | B | $195,000 | |
| 600 | Post Holdings Inc, 144A | 5.625% | 1/15/28 | B+ | 631,500 | |
| 350 | Post Holdings Inc, 144A | 4.625% | 4/15/30 | B+ | 356,563 | |
| 120 | Prestige Brands Inc, 144A | 3.750% | 4/01/31 | B+ | 118,650 | |
| 200 | Prime Security Services Borrower LLC / Prime Finance Inc, 144A | 5.750% | 4/15/26 | BB- | 219,000 | |
| 1,300 | Prime Security Services Borrower LLC / Prime Finance Inc, 144A | 6.250% | 1/15/28 | B- | 1,356,745 | |
| 50 | Primo Water Holdings Inc, 144A | 4.375% | 4/30/29 | B+ | 50,000 | |
| 100 | PTC Inc, 144A | 3.625% | 2/15/25 | BB | 102,750 | |
| 100 | PTC Inc, 144A | 4.000% | 2/15/28 | BB | 103,375 | |
| 240 | Qorvo Inc | 4.375% | 10/15/29 | BBB- | 261,230 | |
| 270 | Qorvo Inc, 144A | 3.375% | 4/01/31 | BBB- | 280,268 | |
| 210 | QualityTech LP / QTS Finance Corp, 144A | 3.875% | 10/01/28 | BB+ | 224,946 | |
| 300 | Rackspace Technology Global Inc, 144A | 3.500% | 2/15/28 | B+ | 288,750 | |
| 350 | Rakuten Group Inc, 144A | 5.125% | N/A (4) | B+ | 351,313 | |
| 200 | Rakuten Group Inc, 144A | 6.250% | N/A (4) | B+ | 205,580 | |
| 300 | RBS Global Inc / Rexnord LLC, 144A | 4.875% | 12/15/25 | BB- | 306,000 | |
| 800 | Realogy Group LLC / Realogy Co-Issuer Corp, 144A | 5.750% | 1/15/29 | B- | 839,000 | |
| 300 | Renewable Energy Group Inc, 144A | 5.875% | 6/01/28 | BB | 312,750 | |
| 130 | Ritchie Bros Auctioneers Inc, 144A | 5.375% | 1/15/25 | BB+ | 132,925 | |
| 70 | Rite Aid Corp, 144A | 7.500% | 7/01/25 | CCC+ | 70,154 | |
| 280 | Rite Aid Corp, 144A | 8.000% | 11/15/26 | CCC+ | 281,050 | |
| 400 | Royal Caribbean Cruises Ltd, 144A | 9.125% | 6/15/23 | B+ | 435,052 | |
| 300 | Royal Caribbean Cruises Ltd, 144A | 4.250% | 7/01/26 | B | 292,830 | |
| 600 | SBA Communications Corp | 4.875% | 9/01/24 | BB- | 609,000 | |
| 900 | SBA Communications Corp | 3.875% | 2/15/27 | BB- | 928,125 | |
| 320 | Scripps Escrow II Inc, 144A | 5.375% | 1/15/31 | CCC+ | 319,200 | |
| 10 | Scripps Escrow Inc, 144A | 5.875% | 7/15/27 | CCC+ | 10,350 | |
| 400 | Seagate HDD Cayman, 144A | 4.091% | 6/01/29 | BB+ | 419,500 | |
| 1,140 | Select Medical Corp, 144A | 6.250% | 8/15/26 | B- | 1,205,231 | |
| 100 | Sensata Technologies BV, 144A | 4.000% | 4/15/29 | BB+ | 102,625 | |
| 250 | Sensata Technologies Inc, 144A | 3.750% | 2/15/31 | BB+ | 251,875 | |
| 20 | Service Corp International/US | 5.125% | 6/01/29 | BB | 21,600 | |
| 220 | Sirius XM Radio Inc, 144A | 3.875% | 8/01/22 | BB | 220,000 | |
| 310 | Sirius XM Radio Inc, 144A | 5.000% | 8/01/27 | BB | 323,950 | |
| 260 | Sirius XM Radio Inc, 144A | 5.500% | 7/01/29 | BB | 284,739 | |
| 300 | Sirius XM Radio Inc, 144A | 4.125% | 7/01/30 | BB | 309,504 | |
| 356 | Six Flags Entertainment Corp, 144A, (3) | 5.500% | 4/15/27 | B- | 366,858 | |
| 100 | Spectrum Brands Inc, 144A | 3.875% | 3/15/31 | B | 100,210 | |
| 250 | Spirit AeroSystems Inc, 144A | 7.500% | 4/15/25 | B | 265,000 | |
| 200 | Sprint Corp | 7.625% | 3/01/26 | BB | 244,298 | |
| 600 | Summit Materials LLC / Summit Materials Finance Corp, 144A | 5.250% | 1/15/29 | BB | 636,750 |
| Principal Amount (000) | Description (1) | Coupon | Maturity | Ratings (2) | Value | |
| Industrial (continued) | ||||||
| $ 380 | Sunoco LP / Sunoco Finance Corp | 6.000% | 4/15/27 | BB- | $396,625 | |
| 200 | Sunoco LP / Sunoco Finance Corp | 4.500% | 5/15/29 | BB- | 204,500 | |
| 110 | Superior Plus LP / Superior General Partner Inc, 144A | 4.500% | 3/15/29 | BB- | 112,952 | |
| 150 | Surgery Center Holdings Inc, 144A, (3) | 10.000% | 4/15/27 | CCC | 163,500 | |
| 50 | Syneos Health Inc, 144A | 3.625% | 1/15/29 | BB- | 49,625 | |
| 20 | Tallgrass Energy Partners LP / Tallgrass Energy Finance Corp, 144A | 5.500% | 9/15/24 | BB- | 20,253 | |
| 570 | Targa Resources Partners LP / Targa Resources Partners Finance Corp | 5.000% | 1/15/28 | BB | 599,366 | |
| 420 | Targa Resources Partners LP / Targa Resources Partners Finance Corp | 6.875% | 1/15/29 | BB | 471,700 | |
| 550 | Targa Resources Partners LP / Targa Resources Partners Finance Corp | 5.500% | 3/01/30 | BB | 605,632 | |
| 300 | Targa Resources Partners LP / Targa Resources Partners Finance Corp, 144A | 4.875% | 2/01/31 | BB | 324,375 | |
| 220 | TechnipFMC PLC, 144A | 6.500% | 2/01/26 | BB+ | 235,753 | |
| 190 | TEGNA Inc | 5.000% | 9/15/29 | BB | 198,550 | |
| 100 | Teleflex Inc | 4.625% | 11/15/27 | BB | 105,471 | |
| 100 | Teleflex Inc, 144A | 4.250% | 6/01/28 | BB | 104,250 | |
| 250 | Tempur Sealy International Inc, 144A | 4.000% | 4/15/29 | BB | 256,250 | |
| 980 | Tenet Healthcare Corp, 144A | 5.125% | 11/01/27 | B+ | 1,026,550 | |
| 230 | Tenet Healthcare Corp, 144A | 4.625% | 6/15/28 | B+ | 238,050 | |
| 260 | Tenneco Inc, (3) | 5.000% | 7/15/26 | B- | 256,425 | |
| 250 | Terex Corp, 144A | 5.000% | 5/15/29 | BB- | 259,063 | |
| 140 | Tesla Inc, 144A | 5.300% | 8/15/25 | BB | 143,655 | |
| 100 | T-Mobile USA Inc | 3.375% | 4/15/29 | BB | 104,119 | |
| 460 | TransDigm Inc | 6.375% | 6/15/26 | B- | 474,950 | |
| 260 | TransDigm Inc, 144A | 4.875% | 5/01/29 | B- | 260,411 | |
| 110 | TreeHouse Foods Inc | 4.000% | 9/01/28 | BB- | 110,138 | |
| 470 | Trinseo Materials Operating SCA / Trinseo Materials Finance Inc, 144A | 5.375% | 9/01/25 | B | 479,729 | |
| 156 | Triumph Group Inc, 144A | 8.875% | 6/01/24 | B | 172,770 | |
| 200 | Triumph Group Inc, 144A | 6.250% | 9/15/24 | CCC | 201,000 | |
| 1,170 | Trivium Packaging Finance BV, 144A | 5.500% | 8/15/26 | B | 1,222,650 | |
| 100 | Tronox Inc, 144A | 4.625% | 3/15/29 | B | 101,625 | |
| 100 | TTM Technologies Inc, 144A | 4.000% | 3/01/29 | BB- | 100,625 | |
| 130 | Twilio Inc | 3.875% | 3/15/31 | BB | 135,967 | |
| 100 | United Natural Foods Inc, 144A | 6.750% | 10/15/28 | B- | 107,750 | |
| 160 | United Rentals North America Inc | 4.875% | 1/15/28 | BB | 168,960 | |
| 180 | United Rentals North America Inc | 5.250% | 1/15/30 | BB | 196,960 | |
| 300 | United Rentals North America Inc | 4.000% | 7/15/30 | BB | 311,625 | |
| 100 | Uniti Group LP / Uniti Fiber Holdings Inc / CSL Capital LLC, 144A | 7.125% | 12/15/24 | CCC | 102,750 | |
| 320 | Uniti Group LP / Uniti Fiber Holdings Inc / CSL Capital LLC, 144A | 7.875% | 2/15/25 | B | 340,800 | |
| 400 | Uniti Group LP / Uniti Group Finance Inc / CSL Capital LLC, 144A | 4.750% | 4/15/28 | B | 401,200 | |
| 150 | Univar Solutions USA Inc/Washington, 144A | 5.125% | 12/01/27 | BB | 156,981 | |
| 230 | Univision Communications Inc, 144A | 6.625% | 6/01/27 | B | 247,321 | |
| 100 | UPC Holding BV, 144A | 5.500% | 1/15/28 | B | 105,250 |
| Principal Amount (000) | Description (1) | Coupon | Maturity | Ratings (2) | Value | |
| Industrial (continued) | ||||||
| $ 360 | US Foods Inc, 144A | 6.250% | 4/15/25 | BB- | $379,152 | |
| 260 | US Foods Inc, 144A | 4.750% | 2/15/29 | B+ | 265,200 | |
| 210 | Valvoline Inc, 144A | 4.250% | 2/15/30 | BB- | 217,350 | |
| 100 | VEON Holdings BV | 7.250% | 4/26/23 | BB+ | 107,830 | |
| 200 | VEON Holdings BV, 144A | 3.375% | 11/25/27 | BBB- | 201,638 | |
| 100 | ViacomCBS Inc | 6.250% | 2/28/57 | BB+ | 114,497 | |
| 320 | VICI Properties LP / VICI Note Co Inc, 144A | 3.750% | 2/15/27 | BB | 329,200 | |
| 450 | VICI Properties LP / VICI Note Co Inc, 144A | 4.625% | 12/01/29 | BB | 481,500 | |
| 350 | Videotron Ltd, 144A | 3.625% | 6/15/29 | BB+ | 359,187 | |
| 150 | Virgin Media Secured Finance PLC, 144A | 5.500% | 5/15/29 | BB- | 160,238 | |
| 110 | Vista Outdoor Inc, 144A | 4.500% | 3/15/29 | BB- | 112,003 | |
| 400 | Vmed O2 UK Financing I PLC, 144A | 4.750% | 7/15/31 | BB- | 408,548 | |
| 300 | Vodafone Group PLC | 7.000% | 4/04/79 | BB+ | 372,398 | |
| 250 | Vodafone Group PLC | 4.125% | 6/04/81 | BB+ | 252,948 | |
| 110 | Vodafone Group PLC | 3.250% | 6/04/81 | BB+ | 111,813 | |
| 550 | Weatherford International Ltd, 144A | 11.000% | 12/01/24 | B- | 569,250 | |
| 200 | Weir Group PLC, 144A | 2.200% | 5/13/26 | BBB- | 202,147 | |
| 521 | WESCO Distribution Inc, 144A | 7.250% | 6/15/28 | BB- | 580,446 | |
| 350 | Western Digital Corp | 4.750% | 2/15/26 | BB+ | 388,500 | |
| 460 | Western Midstream Operating LP | 5.050% | 2/01/30 | BB | 516,366 | |
| 150 | William Carter Co, 144A | 5.500% | 5/15/25 | BB+ | 157,893 | |
| 850 | Williams Scotsman International Inc, 144A | 4.625% | 8/15/28 | B+ | 875,500 | |
| 100 | WMG Acquisition Corp, 144A | 3.875% | 7/15/30 | BB+ | 102,750 | |
| 350 | WMG Acquisition Corp, 144A | 3.000% | 2/15/31 | BB+ | 339,007 | |
| 100 | WR Grace & Co-Conn, 144A | 4.875% | 6/15/27 | BB- | 105,625 | |
| 240 | Wyndham Hotels & Resorts Inc, 144A | 4.375% | 8/15/28 | BB | 248,086 | |
| 210 | Xerox Corp | 4.375% | 3/15/23 | BB+ | 219,450 | |
| 310 | Xerox Holdings Corp, 144A | 5.500% | 8/15/28 | BB+ | 327,031 | |
| 560 | Yum! Brands Inc, 144A | 4.750% | 1/15/30 | BB- | 613,200 | |
| 300 | Zayo Group Holdings Inc, 144A | 6.125% | 3/01/28 | CCC+ | 305,298 | |
| 590 | Ziggo Bond Co BV, 144A | 6.000% | 1/15/27 | B- | 612,172 | |
| 600 | Ziggo BV, 144A | 5.500% | 1/15/27 | B+ | 622,630 | |
| 1,300 | Ziggo BV, 144A | 4.875% | 1/15/30 | B+ | 1,340,950 | |
| 82,342 | Total Industrial | 85,558,408 | ||||
| Utility – 1.2% | ||||||
| 200 | Clearway Energy Operating LLC, 144A | 4.750% | 3/15/28 | BB | 212,000 | |
| 100 | Clearway Energy Operating LLC, 144A | 3.750% | 2/15/31 | BB | 100,000 | |
| 160 | Drax Finco PLC, 144A | 6.625% | 11/01/25 | BBB- | 164,600 | |
| 500 | Enviva Partners LP / Enviva Partners Finance Corp, 144A | 6.500% | 1/15/26 | B+ | 517,800 | |
| 50 | NextEra Energy Operating Partners LP, 144A | 4.250% | 7/15/24 | BB+ | 52,572 |
| Principal Amount (000) | Description (1) | Coupon | Maturity | Ratings (2) | Value | |
| Utility (continued) | ||||||
| $ 150 | NextEra Energy Operating Partners LP, 144A | 3.875% | 10/15/26 | BB+ | $ 157,875 | |
| 1,160 | Total Utility | 1,204,847 | ||||
| $ 90,477 | Total Corporate Debt (cost $93,005,487) | 94,190,613 | ||||
| Total Long-Term Investments (cost $93,005,487) | 94,190,613 |
| Shares | Description (1) | Coupon | Value | |||
| INVESTMENTS PURCHASED WITH COLLATERAL FROM SECURITIES LENDING – 2.0% | ||||||
| MONEY MARKET FUNDS – 2.0% | ||||||
| 1,871,599 | State Street Navigator Securities Lending Government Money Market Portfolio, (5) | 0.050% (6) | $ 1,871,599 | |||
| Total Investments Purchased with Collateral from Securities Lending (cost $1,871,599) | 1,871,599 | |||||
| Principal Amount (000) | Description (1) | Coupon | Maturity | Ratings (2) | Value | |
| SHORT-TERM INVESTMENTS – 0.2% | ||||||
| U.S. GOVERNMENT AND AGENCY OBLIGATIONS – 0.2% | ||||||
| $ 192 | Federal Agricultural Mortgage Corp Discount Notes | 0.000% | 8/02/21 | N/R | $ 192,000 | |
| $ 192 | Total Short-Term Investments (cost $192,000) | 192,000 | ||||
| Total Investments (cost $95,069,086) – 99.9% | 96,254,212 | |||||
| Other Assets Less Liabilities – 0.1% | 123,835 | |||||
| Net Assets – 100% | $ 96,378,047 |
| For Fund portfolio compliance purposes, the Fund’s industry classifications refer to any one or more of the industry sub-classifications used by one or more widely recognized market indexes or ratings group indexes, and/or as defined by Fund management. This definition may not apply for purposes of this report, which may combine industry sub-classifications into sectors for reporting ease. | ||
| (1) | All percentages shown in the Portfolio of Investments are based on net assets. | |
| (2) | The Fund uses credit quality ratings for its portfolio securities provided by Moody's, S&P and Fitch. If all three of Moody's, S&P, and Fitch provide a rating for a security, the middle is used; if two of the three agencies rate a security, the lower rating is used; and if only one rating agency rates a security, that rating is used. AAA, AA, A, and BBB are investment grade ratings; BB, B, CCC/CC/C and D are below-investment grade ratings. Credit ratings are subject to change. Holdings designated N/R are not rated by Moody's, S&P or Fitch. Ratings are not covered by the report of independent registered public accounting firm. | |
| (3) | Investment, or a portion of investment, is out on loan for securities lending. The total value of the securities out on loan as of the end of the reporting period was $1,796,839. | |
| (4) | Perpetual security. Maturity date is not applicable. | |
| (5) | The Fund may loan securities representing up to one third of the market value of its total assets (which includes collateral for securities on loan) to broker dealers, banks, and other institutions. The collateral maintained by the Fund shall have a market value, at the inception of each loan, equal to not less than 100% of the market value of the loaned securities. The cash collateral received by the Fund is invested in this money market fund. | |
| (6) | The rate shown is the one-day yield as of the end of the reporting period. | |
| 144A | Investment is exempt from registration under Rule 144A of the Securities Act of 1933, as amended. These investments may only be resold in transactions exempt from registration, which are normally those transactions with qualified institutional buyers. | |
| N/A | Not Applicable. | |
| REIT | Real Estate Investment Trust |
| Principal Amount (000) | Description (1) | Coupon | Maturity | Ratings (2) | Value | |
| LONG-TERM INVESTMENTS – 99.2% | ||||||
| U.S. TREASURY – 36.7% | ||||||
| $ 9,205 | United States Treasury Note/Bond | 1.875% | 9/30/22 | AAA | $9,394,493 | |
| 250 | United States Treasury Note/Bond | 0.125% | 9/30/22 | AAA | 250,059 | |
| 3,400 | United States Treasury Note/Bond | 1.500% | 1/15/23 | AAA | 3,467,867 | |
| 1,500 | United States Treasury Note/Bond | 0.125% | 1/31/23 | AAA | 1,499,883 | |
| 500 | United States Treasury Note/Bond | 0.125% | 2/28/23 | AAA | 499,922 | |
| 2,600 | United States Treasury Note/Bond | 0.125% | 3/31/23 | AAA | 2,598,781 | |
| 2,400 | United States Treasury Note/Bond | 0.125% | 4/30/23 | AAA | 2,398,500 | |
| 700 | United States Treasury Note/Bond | 0.125% | 5/31/23 | AAA | 699,535 | |
| 1,900 | United States Treasury Note/Bond | 0.125% | 6/30/23 | AAA | 1,898,664 | |
| 1,248 | United States Treasury Note/Bond | 2.750% | 7/31/23 | AAA | 1,311,716 | |
| 1,346 | United States Treasury Note/Bond | 2.875% | 11/30/23 | AAA | 1,428,285 | |
| 1,411 | United States Treasury Note/Bond | 2.500% | 1/31/24 | AAA | 1,489,377 | |
| 1,814 | United States Treasury Note/Bond | 2.250% | 4/30/24 | AAA | 1,910,085 | |
| 4,872 | United States Treasury Note/Bond | 2.000% | 5/31/24 | AAA | 5,101,897 | |
| 262 | United States Treasury Note/Bond | 1.250% | 8/31/24 | AAA | 269,031 | |
| 3,090 | United States Treasury Note/Bond | 2.125% | 9/30/24 | AAA | 3,258,984 | |
| 1,454 | United States Treasury Note/Bond | 2.125% | 11/30/24 | AAA | 1,535,844 | |
| 2,824 | United States Treasury Note/Bond | 1.375% | 1/31/25 | AAA | 2,913,905 | |
| 1,500 | United States Treasury Note/Bond | 0.250% | 5/31/25 | AAA | 1,484,473 | |
| 950 | United States Treasury Note/Bond | 0.250% | 8/31/25 | AAA | 937,680 | |
| 3,900 | United States Treasury Note/Bond | 0.250% | 9/30/25 | AAA | 3,846,832 | |
| 800 | United States Treasury Note/Bond | 0.250% | 10/31/25 | AAA | 788,312 | |
| 1,820 | United States Treasury Note/Bond | 0.375% | 11/30/25 | AAA | 1,802,227 | |
| 1,300 | United States Treasury Note/Bond | 0.375% | 12/31/25 | AAA | 1,285,883 | |
| 3,500 | United States Treasury Note/Bond | 0.375% | 1/31/26 | AAA | 3,459,668 | |
| 500 | United States Treasury Note/Bond | 0.500% | 2/28/26 | AAA | 496,719 | |
| 1,900 | United States Treasury Note/Bond | 0.750% | 3/31/26 | AAA | 1,908,164 | |
| 3,200 | United States Treasury Note/Bond | 0.750% | 4/30/26 | AAA | 3,212,750 | |
| 700 | United States Treasury Note/Bond | 0.750% | 5/31/26 | AAA | 702,297 | |
| 1,700 | United States Treasury Note/Bond | 0.875% | 6/30/26 | AAA | 1,715,008 | |
| 900 | United States Treasury Note/Bond | 0.500% | 6/30/27 | AAA | 882,035 | |
| 2,186 | United States Treasury Note/Bond | 2.250% | 8/15/27 | AAA | 2,364,808 | |
| 888 | United States Treasury Note/Bond | 2.250% | 11/15/27 | AAA | 961,399 | |
| 2,344 | United States Treasury Note/Bond | 2.750% | 2/15/28 | AAA | 2,613,743 | |
| 1,470 | United States Treasury Note/Bond | 2.375% | 5/15/29 | AAA | 1,611,430 | |
| 514 | United States Treasury Note/Bond | 1.625% | 8/15/29 | AAA | 534,801 |
| Principal Amount (000) | Description (1) | Coupon | Maturity | Ratings (2) | Value | |
| $ 1,200 | United States Treasury Note/Bond | 0.625% | 5/15/30 | AAA | $1,144,687 | |
| 1,700 | United States Treasury Note/Bond | 0.625% | 8/15/30 | AAA | 1,616,859 | |
| 200 | United States Treasury Note/Bond | 1.125% | 8/15/40 | AAA | 178,016 | |
| 3,850 | United States Treasury Note/Bond | 1.375% | 11/15/40 | AAA | 3,575,086 | |
| 1,300 | United States Treasury Note/Bond | 1.875% | 2/15/41 | AAA | 1,314,016 | |
| 500 | United States Treasury Note/Bond | 2.250% | 5/15/41 | AAA | 536,406 | |
| 1,964 | United States Treasury Note/Bond | 2.750% | 8/15/42 | AAA | 2,281,769 | |
| 4,571 | United States Treasury Note/Bond | 2.750% | 8/15/47 | AAA | 5,381,995 | |
| 2,050 | United States Treasury Note/Bond | 1.250% | 5/15/50 | AAA | 1,744,342 | |
| 1,000 | United States Treasury Note/Bond | 1.375% | 8/15/50 | AAA | 878,008 | |
| 200 | United States Treasury Note/Bond | 1.625% | 11/15/50 | AAA | 186,875 | |
| 3,900 | United States Treasury Note/Bond | 1.875% | 2/15/51 | AA+ | 3,867,703 | |
| 1,100 | United States Treasury Note/Bond | 2.375% | 5/15/51 | AAA | 1,219,797 | |
| $ 94,383 | Total U.S. Treasury (cost $94,294,799) | 96,460,616 |
| Principal Amount (000) | Description (1) | Coupon | Maturity | Ratings (2) | Value | |
| SECURITIZED – 29.8% | ||||||
| $ 50 | AmeriCredit Automobile Receivables Trust 2021-2 | 1.010% | 1/19/27 | AA | $50,045 | |
| 20 | BA Credit Card Trust | 0.440% | 9/15/26 | AAA | 20,000 | |
| 200 | BANK 2019-BN19 | 2.926% | 8/15/61 | AAA | 215,435 | |
| 100 | BANK 2021-BNK34 | 1.935% | 6/15/63 | AAA | 103,296 | |
| 100 | BANK 2021-BNK35, (WI/DD) | 2.067% | 7/15/28 | N/R | 102,999 | |
| 500 | BBCMS Mortgage Trust 2020-C6 | 2.690% | 2/15/53 | AAA | 524,453 | |
| 200 | Benchmark 2021-B24 Mortgage Trust | 2.264% | 3/15/54 | AAA | 205,971 | |
| 100 | Benchmark 2021-B27 Mortgage Trust | 2.703% | 7/15/54 | A- | 101,460 | |
| 367 | Capital One Multi-Asset Execution Trust | 1.720% | 8/15/24 | AAA | 372,908 | |
| 95 | Carmax Auto Owner Trust 2020-1 | 1.890% | 12/16/24 | AAA | 96,539 | |
| 100 | Citibank Credit Card Issuance Trust | 3.290% | 5/23/25 | AAA | 105,573 | |
| 180 | Citigroup Commercial Mortgage Trust 2016-C1 | 3.209% | 5/10/49 | Aaa | 195,647 | |
| 500 | COMM 2015-LC19 Mortgage Trust | 3.183% | 2/10/48 | Aaa | 537,406 | |
| 2,886 | Fannie Mae Pool FM5488 | 4.000% | 5/01/49 | N/R | 3,076,932 | |
| 3,981 | Fannie Mae Pool FM5665 | 3.500% | 8/01/48 | N/R | 4,223,127 | |
| 1,587 | Fannie Mae Pool FN MA4356 | 2.500% | 6/01/51 | N/R | 1,653,345 | |
| 438 | Fannie Mae Pool MA2941 | 3.500% | 3/01/32 | N/R | 467,295 | |
| 498 | Fannie Mae Pool MA3120 | 3.500% | 9/01/47 | Aaa | 530,557 | |
| 1,246 | Fannie Mae Pool MA3143 | 3.000% | 9/01/47 | N/R | 1,314,041 | |
| 89 | Fannie Mae Pool MA3182 | 3.500% | 11/01/47 | Aaa | 94,330 | |
| 348 | Fannie Mae Pool MA3358 | 4.500% | 5/01/48 | Aaa | 376,927 | |
| 127 | Fannie Mae Pool MA3392 | 3.500% | 6/01/33 | N/R | 136,214 | |
| 285 | Fannie Mae Pool MA3490 | 4.000% | 10/01/33 | N/R | 303,442 | |
| 191 | Fannie Mae Pool MA3536 | 4.000% | 12/01/48 | Aaa | 204,262 |
| Principal Amount (000) | Description (1) | Coupon | Maturity | Ratings (2) | Value | |
| $ 306 | Fannie Mae Pool MA3574 | 3.500% | 1/01/49 | N/R | $324,413 | |
| 1,738 | Fannie Mae Pool MA3774 | 3.000% | 9/01/49 | Aaa | 1,821,103 | |
| 99 | Fannie Mae Pool MA3828 | 3.000% | 11/01/34 | N/R | 104,239 | |
| 197 | Fannie Mae Pool MA3865 | 3.000% | 12/01/34 | N/R | 206,851 | |
| 210 | Fannie Mae Pool MA3890 | 3.000% | 1/01/40 | N/R | 221,020 | |
| 1,142 | Fannie Mae Pool MA3905 | 3.000% | 1/01/50 | N/R | 1,196,846 | |
| 267 | Fannie Mae Pool MA3957 | 3.500% | 3/01/35 | N/R | 285,307 | |
| 879 | Fannie Mae Pool MA4074 | 2.000% | 7/01/35 | N/R | 912,160 | |
| 777 | Fannie Mae Pool MA4123 | 2.000% | 9/01/35 | N/R | 806,849 | |
| 842 | Fannie Mae Pool MA4180 | 2.500% | 11/01/35 | N/R | 884,275 | |
| 2,589 | Fannie Mae Pool MA4182 | 2.000% | 11/01/50 | N/R | 2,640,777 | |
| 1,508 | Fannie Mae Pool MA4183 | 2.500% | 11/01/50 | N/R | 1,570,941 | |
| 1,661 | Fannie Mae Pool MA4208 | 2.000% | 12/01/50 | N/R | 1,693,552 | |
| 2,183 | Fannie Mae Pool MA4238 | 2.500% | 1/01/51 | AAA | 2,274,880 | |
| 974 | Fannie Mae Pool MA4254 | 1.500% | 2/01/51 | N/R | 963,800 | |
| 1,124 | Fannie Mae Pool MA4255 | 2.000% | 2/01/51 | N/R | 1,146,196 | |
| 4,251 | Fannie Mae Pool MA4256 | 2.500% | 2/01/51 | N/R | 4,429,312 | |
| 940 | Fannie Mae Pool MA4268 | 2.000% | 2/01/41 | N/R | 969,022 | |
| 672 | Fannie Mae Pool MA4278 | 1.500% | 3/01/36 | N/R | 685,429 | |
| 901 | Fannie Mae Pool MA4298 | 2.500% | 3/01/36 | N/R | 949,382 | |
| 194 | Fannie Mae Pool MA4302 | 1.500% | 4/01/36 | N/R | 198,003 | |
| 394 | Fannie Mae Pool MA4304 | 1.500% | 4/01/51 | N/R | 389,681 | |
| 2,776 | Fannie Mae Pool MA4305 | 2.000% | 4/01/51 | N/R | 2,831,073 | |
| 2,206 | Fannie Mae Pool MA4307 | 3.000% | 4/01/51 | N/R | 2,326,396 | |
| 147 | Fannie Mae Pool MA4310 | 1.500% | 4/01/41 | N/R | 147,584 | |
| 96 | Fannie Mae Pool MA4316 | 2.500% | 4/01/36 | N/R | 101,344 | |
| 988 | Fannie Mae Pool MA4325 | 2.000% | 5/01/51 | N/R | 1,008,054 | |
| 988 | Fannie Mae Pool MA4326 | 2.500% | 5/01/51 | N/R | 1,029,240 | |
| 489 | Fannie Mae Pool MA4327 | 3.000% | 5/01/51 | N/R | 513,482 | |
| 245 | Fannie Mae Pool MA4329 | 2.000% | 5/01/36 | N/R | 254,040 | |
| 244 | Fannie Mae Pool MA4330 | 2.500% | 5/01/36 | N/R | 256,015 | |
| 690 | Fannie Mae Pool MA4334 | 2.500% | 5/01/41 | N/R | 721,471 | |
| 274 | Fannie Mae Pool MA4337 | 4.000% | 4/01/51 | N/R | 292,713 | |
| 2,086 | Fannie Mae Pool MA4355 | 2.000% | 6/01/51 | N/R | 2,127,224 | |
| 890 | Fannie Mae Pool MA4357 | 3.000% | 6/01/51 | N/R | 938,077 | |
| 395 | Fannie Mae Pool MA4359 | 1.500% | 6/01/36 | N/R | 402,587 | |
| 394 | Fannie Mae Pool MA4360 | 2.000% | 6/01/36 | N/R | 409,413 | |
| 98 | Fannie Mae Pool MA4361 | 2.500% | 6/01/36 | N/R | 102,818 | |
| 102 | Fannie Mae Pool MA4364 | 2.000% | 6/01/41 | N/R | 104,800 | |
| 99 | Fannie Mae Pool MA4366 | 2.500% | 6/01/41 | N/R | 103,608 | |
| 200 | Fannie Mae Pool MA4377 | 1.500% | 7/01/51 | N/R | 197,472 | |
| 299 | Fannie Mae Pool MA4378 | 2.000% | 7/01/51 | N/R | 305,210 |
| Principal Amount (000) | Description (1) | Coupon | Maturity | Ratings (2) | Value | |
| $ 199 | Fannie Mae Pool MA4380 | 3.000% | 7/01/51 | N/R | $209,218 | |
| 299 | Fannie Mae Pool MA4387 | 2.000% | 7/01/41 | N/R | 307,880 | |
| 500 | Fannie Mae Pool MA4397 | 1.500% | 8/01/51 | N/R | 494,943 | |
| 1,550 | Fannie Mae Pool MA4398, (DD1) | 2.000% | 8/01/51 | N/R | 1,580,833 | |
| 500 | Fannie Mae Pool MA4399 | 2.500% | 8/01/51 | N/R | 520,946 | |
| 348 | Fannie Mae Pool MA4400, (WI/DD) | 3.000% | 8/01/51 | N/R | 367,019 | |
| 200 | Fannie Mae Pool MA4402 | 1.500% | 8/01/36 | N/R | 203,865 | |
| 600 | Fannie Mae Pool MA4403 | 2.000% | 8/01/36 | N/R | 622,959 | |
| 200 | Fannie Mae-Aces | 3.052% | 3/25/28 | N/R | 222,985 | |
| 250 | Fannie Mae-Aces | 3.370% | 7/25/28 | N/R | 284,234 | |
| 100 | Ford Credit Floorplan Master Owner Trust A | 2.480% | 9/15/24 | AAA | 102,484 | |
| 800 | Freddie Mac Multifamily Structured Pass-Through Certificates | 2.862% | 5/25/26 | AAA | 866,161 | |
| 100 | Freddie Mac Multifamily Structured Pass-Through Certificates | 0.861% | 6/25/27 | Aaa | 100,261 | |
| 62 | Freddie Mac Multifamily Structured Pass-Through Certificates | 1.760% | 3/25/28 | Aaa | 64,404 | |
| 100 | Freddie Mac Multifamily Structured Pass-Through Certificates | 1.770% | 5/25/28 | Aaa | 104,043 | |
| 342 | Freddie Mac Multifamily Structured Pass-Through Certificates | 2.701% | 4/25/29 | AAA | 369,827 | |
| 99 | Freddie Mac Multifamily Structured Pass-Through Certificates | 1.101% | 8/25/30 | Aaa | 99,353 | |
| 100 | Freddie Mac Multifamily Structured Pass-Through Certificates | 1.353% | 11/25/30 | Aaa | 101,498 | |
| 100 | Freddie Mac Multifamily Structured Pass-Through Certificates | 1.647% | 5/25/31 | N/R | 101,402 | |
| 100 | Freddie Mac Multifamily Structured Pass-Through Certificates | 2.007% | 7/25/35 | N/R | 105,222 | |
| 811 | Ginnie Mae II Pool MA3663 | 3.500% | 5/20/46 | Aaa | 865,044 | |
| 117 | Ginnie Mae II Pool MA5264 | 4.000% | 6/20/48 | Aaa | 125,032 | |
| 134 | Ginnie Mae II Pool MA5398 | 4.000% | 8/20/48 | Aaa | 142,595 | |
| 803 | Ginnie Mae II Pool MA6038 | 3.000% | 7/20/49 | N/R | 842,234 | |
| 367 | Ginnie Mae II Pool MA6283 | 3.000% | 11/20/49 | N/R | 383,924 | |
| 1,431 | Ginnie Mae II Pool MA6338 | 3.000% | 12/20/49 | N/R | 1,498,368 | |
| 326 | Ginnie Mae II Pool MA6542 | 3.500% | 3/20/50 | N/R | 342,077 | |
| 152 | Ginnie Mae II Pool MA6600 | 3.500% | 4/20/50 | N/R | 159,884 | |
| 919 | Ginnie Mae II Pool MA6819 | 2.500% | 8/20/50 | N/R | 955,992 | |
| 139 | Ginnie Mae II Pool MA6820 | 3.000% | 8/20/50 | N/R | 145,593 | |
| 1,041 | Ginnie Mae II Pool MA6864 | 2.000% | 9/20/50 | N/R | 1,066,692 | |
| 1,064 | Ginnie Mae II Pool MA6865 | 2.500% | 9/20/50 | N/R | 1,106,601 | |
| 129 | Ginnie Mae II Pool MA6931 | 2.500% | 10/20/50 | N/R | 134,343 | |
| 447 | Ginnie Mae II Pool MA6995 | 2.500% | 11/20/50 | N/R | 464,827 | |
| 641 | Ginnie Mae II Pool MA7051 | 2.000% | 12/20/50 | N/R | 656,423 | |
| 1,040 | Ginnie Mae II Pool MA7052 | 2.500% | 12/20/50 | N/R | 1,081,006 | |
| 465 | Ginnie Mae II Pool MA7054 | 3.500% | 12/20/50 | N/R | 488,093 | |
| 374 | Ginnie Mae II Pool MA7135 | 2.000% | 1/20/51 | N/R | 382,693 | |
| 686 | Ginnie Mae II Pool MA7136 | 2.500% | 1/20/51 | N/R | 712,918 | |
| 957 | Ginnie Mae II Pool MA7254 | 2.000% | 3/20/51 | N/R | 981,073 | |
| 296 | Ginnie Mae II Pool MA7311 | 2.000% | 4/20/51 | N/R | 303,619 | |
| 691 | Ginnie Mae II Pool MA7312 | 2.500% | 4/20/51 | N/R | 718,941 |
| Principal Amount (000) | Description (1) | Coupon | Maturity | Ratings (2) | Value | |
| $ 248 | Ginnie Mae II Pool MA7366 | 2.000% | 5/20/51 | N/R | $254,376 | |
| 744 | Ginnie Mae II Pool MA7367 | 2.500% | 5/20/51 | N/R | 773,466 | |
| 299 | Ginnie Mae II Pool MA7417 | 2.000% | 6/20/51 | N/R | 306,606 | |
| 646 | Ginnie Mae II Pool MA7419, (DD1) | 3.000% | 6/20/51 | N/R | 679,022 | |
| 300 | Ginnie Mae II Pool MA7471 | 2.000% | 7/20/51 | N/R | 307,477 | |
| 100 | GM Financial Automobile Leasing Trust 2021-2 | 0.690% | 5/20/25 | AA+ | 100,027 | |
| 200 | GS Mortgage Securities Trust 2019-GC38 | 3.968% | 2/10/52 | AAA | 230,868 | |
| 100 | Honda Auto Receivables 2021-2 Owner Trust | 0.330% | 8/15/25 | AAA | 99,985 | |
| 50 | John Deere Owner Trust | 0.740% | 5/15/28 | Aaa | 50,194 | |
| 100 | Mercedes-Benz Auto Lease Trust 2021-B | 0.400% | 11/15/24 | AAA | 100,118 | |
| 100 | Morgan Stanley Capital I Trust 2021-L5 | 1.518% | 5/15/54 | AAA | 100,987 | |
| 100 | Santander Drive Auto Receivables Trust 2021-2 | 0.900% | 6/15/26 | Aa1 | 100,278 | |
| 100 | Toyota Auto Receivables 2021-B Owner Trust | 0.530% | 10/15/26 | AAA | 100,001 | |
| 90 | Verizon Master Trust | 0.500% | 5/20/27 | AAA | 90,155 | |
| 271 | Wells Fargo Commercial Mortgage Trust 2016-C32 | 3.324% | 1/15/59 | Aaa | 284,856 | |
| 300 | Wells Fargo Commercial Mortgage Trust 2019-C49 | 3.760% | 3/15/52 | Aaa | 340,309 | |
| 100 | World Omni Auto Receivables Trust 2021-B | 0.420% | 6/15/26 | AAA | 100,178 | |
| $ 75,169 | Total Securitized (cost $79,182,305) | 78,265,275 |
| Principal Amount (000) | Description (1) | Coupon | Maturity | Ratings (2) | Value | |
| CORPORATE DEBT – 27.0% | ||||||
| Financials – 8.4% | ||||||
| $ 100 | AerCap Ireland Capital DAC / AerCap Global Aviation Trust | 3.150% | 2/15/24 | BBB- | $104,968 | |
| 100 | Aflac Inc | 3.600% | 4/01/30 | A- | 113,942 | |
| 200 | Air Lease Corp | 2.875% | 1/15/26 | BBB | 211,423 | |
| 100 | Alexandria Real Estate Equities Inc | 3.375% | 8/15/31 | BBB+ | 111,713 | |
| 71 | Allstate Corp | 4.500% | 6/15/43 | A- | 91,469 | |
| 10 | Ally Financial Inc | 5.800% | 5/01/25 | BBB- | 11,627 | |
| 110 | Ally Financial Inc | 8.000% | 11/01/31 | BBB- | 159,812 | |
| 10 | Ally Financial Inc | 8.000% | 11/01/31 | BBB- | 14,280 | |
| 201 | American Express Co | 3.400% | 2/27/23 | A- | 210,194 | |
| 40 | American Express Co | 3.400% | 2/22/24 | A- | 42,781 | |
| 230 | American International Group Inc | 3.400% | 6/30/30 | BBB+ | 254,240 | |
| 52 | Ameriprise Financial Inc | 4.000% | 10/15/23 | A- | 56,053 | |
| 110 | Anthem Inc | 3.650% | 12/01/27 | BBB | 123,979 | |
| 100 | Anthem Inc | 2.250% | 5/15/30 | BBB | 102,656 | |
| 100 | Anthem Inc | 4.650% | 1/15/43 | BBB | 127,222 | |
| 30 | Assurant Inc | 2.650% | 1/15/32 | BBB | 30,323 | |
| 90 | Australia & New Zealand Banking Group Ltd/New York NY | 3.700% | 11/16/25 | AA- | 101,004 | |
| 40 | Banco Bilbao Vizcaya Argentaria SA | 0.875% | 9/18/23 | A- | 40,205 | |
| 250 | Bank of America Corp | 0.523% | 6/14/24 | A | 250,054 |
| Principal Amount (000) | Description (1) | Coupon | Maturity | Ratings (2) | Value | |
| Financials (continued) | ||||||
| $ 200 | Bank of America Corp | 1.734% | 7/22/27 | A | $203,477 | |
| 250 | Bank of America Corp | 2.087% | 6/14/29 | A | 254,492 | |
| 150 | Bank of America Corp | 4.271% | 7/23/29 | A | 173,116 | |
| 600 | Bank of America Corp | 3.974% | 2/07/30 | A | 682,139 | |
| 200 | Bank of America Corp | 2.592% | 4/29/31 | A | 207,073 | |
| 250 | Bank of America Corp | 2.651% | 3/11/32 | A | 259,199 | |
| 100 | Bank of America Corp | 2.299% | 7/21/32 | A | 100,881 | |
| 100 | Bank of America Corp | 3.311% | 4/22/42 | A | 107,617 | |
| 200 | Bank of America Corp | 2.972% | 7/21/52 | A | 201,739 | |
| 148 | Bank of Montreal | 3.803% | 12/15/32 | BBB+ | 164,633 | |
| 76 | Bank of New York Mellon Corp | 3.450% | 8/11/23 | A+ | 80,811 | |
| 100 | Bank of New York Mellon Corp | 2.800% | 5/04/26 | A+ | 108,208 | |
| 185 | Bank of New York Mellon Corp | 3.300% | 8/23/29 | A | 207,128 | |
| 100 | Bank of Nova Scotia | 0.650% | 7/31/24 | A2 | 100,125 | |
| 100 | Bank of Nova Scotia, (3) | 1.350% | 6/24/26 | A | 100,877 | |
| 500 | Barclays PLC | 4.836% | 5/09/28 | BBB | 567,097 | |
| 42 | BlackRock Inc | 3.500% | 3/18/24 | AA- | 45,418 | |
| 40 | BlackRock Inc | 3.250% | 4/30/29 | AA- | 45,165 | |
| 140 | Boston Properties LP | 2.900% | 3/15/30 | BBB+ | 148,269 | |
| 100 | BPCE SA | 4.000% | 4/15/24 | A+ | 109,160 | |
| 50 | Brixmor Operating Partnership LP | 4.125% | 6/15/26 | BBB- | 56,255 | |
| 100 | Brookfield Finance I UK Plc | 2.340% | 1/30/32 | A- | 100,945 | |
| 40 | Brookfield Finance Inc | 4.350% | 4/15/30 | A- | 46,956 | |
| 100 | Brookfield Finance Inc | 2.724% | 4/15/31 | A- | 104,987 | |
| 40 | Camden Property Trust | 2.800% | 5/15/30 | A- | 43,067 | |
| 103 | Canadian Imperial Bank of Commerce | 3.500% | 9/13/23 | AA | 109,867 | |
| 100 | Charles Schwab Corp | 3.200% | 3/02/27 | A | 110,250 | |
| 100 | Charles Schwab Corp | 2.000% | 3/20/28 | A | 103,796 | |
| 99 | Chubb Corp | 6.000% | 5/11/37 | A | 145,886 | |
| 100 | CI Financial Corp | 4.100% | 6/15/51 | BBB | 105,538 | |
| 100 | Citigroup Inc | 0.981% | 5/01/25 | A- | 100,538 | |
| 1,148 | Citigroup Inc | 3.980% | 3/20/30 | A- | 1,306,627 | |
| 100 | Citigroup Inc | 2.561% | 5/01/32 | A- | 103,295 | |
| 100 | Citizens Financial Group Inc | 2.638% | 9/30/32 | BBB | 101,121 | |
| 60 | CME Group Inc | 5.300% | 9/15/43 | AA- | 87,977 | |
| 250 | Credit Suisse AG/New York NY | 2.950% | 4/09/25 | A+ | 267,985 | |
| 30 | CyrusOne LP / CyrusOne Finance Corp | 3.450% | 11/15/29 | BBB- | 32,190 | |
| 200 | Deutsche Bank AG/New York NY | 1.447% | 4/01/25 | BBB- | 201,599 | |
| 150 | Deutsche Bank AG/New York NY | 3.035% | 5/28/32 | BBB- | 154,969 | |
| 50 | Duke Realty LP | 2.875% | 11/15/29 | BBB+ | 53,452 | |
| 50 | Equitable Holdings Inc | 4.350% | 4/20/28 | BBB+ | 57,751 |
| Principal Amount (000) | Description (1) | Coupon | Maturity | Ratings (2) | Value | |
| Financials (continued) | ||||||
| $ 30 | Equitable Holdings Inc | 5.000% | 4/20/48 | BBB+ | $38,915 | |
| 86 | ERP Operating LP | 2.500% | 2/15/30 | A- | 90,180 | |
| 50 | Federal Realty Investment Trust | 3.500% | 6/01/30 | A- | 55,520 | |
| 100 | First American Financial Corp | 2.400% | 8/15/31 | BBB | 98,892 | |
| 42 | Franklin Resources Inc | 2.800% | 9/15/22 | A | 43,165 | |
| 50 | GATX Corp | 4.700% | 4/01/29 | BBB | 58,658 | |
| 100 | Healthpeak Properties Inc | 1.350% | 2/01/27 | BBB+ | 100,423 | |
| 50 | Healthpeak Properties Inc | 3.500% | 7/15/29 | BBB+ | 56,242 | |
| 50 | Host Hotels & Resorts LP | 4.500% | 2/01/26 | BBB- | 55,480 | |
| 125 | HSBC Holdings PLC | 0.976% | 5/24/25 | A- | 125,321 | |
| 200 | HSBC Holdings PLC | 2.013% | 9/22/28 | A- | 202,334 | |
| 400 | HSBC Holdings PLC | 2.804% | 5/24/32 | A- | 414,410 | |
| 60 | Humana Inc | 2.900% | 12/15/22 | BBB | 61,928 | |
| 50 | Humana Inc | 4.875% | 4/01/30 | BBB | 60,996 | |
| 100 | Humana Inc | 2.150% | 2/03/32 | BBB | 100,316 | |
| 9 | Humana Inc | 4.625% | 12/01/42 | BBB | 11,286 | |
| 10 | Humana Inc | 4.950% | 10/01/44 | BBB | 13,149 | |
| 100 | Huntington Bancshares Inc/OH | 2.625% | 8/06/24 | BBB+ | 105,514 | |
| 100 | ING Groep NV | 3.950% | 3/29/27 | A- | 113,247 | |
| 50 | ING Groep NV | 4.050% | 4/09/29 | A- | 57,855 | |
| 114 | Intercontinental Exchange Inc | 3.750% | 9/21/28 | A- | 129,374 | |
| 50 | Intercontinental Exchange Inc | 4.250% | 9/21/48 | A- | 60,585 | |
| 50 | Invesco Finance PLC | 3.750% | 1/15/26 | A- | 55,557 | |
| 100 | JPMorgan Chase & Co | 0.824% | 6/01/25 | A | 100,074 | |
| 150 | JPMorgan Chase & Co | 3.702% | 5/06/30 | A | 168,612 | |
| 200 | JPMorgan Chase & Co | 2.739% | 10/15/30 | A | 210,839 | |
| 1,098 | JPMorgan Chase & Co | 4.493% | 3/24/31 | A | 1,311,950 | |
| 100 | JPMorgan Chase & Co | 3.157% | 4/22/42 | A | 106,331 | |
| 250 | JPMorgan Chase & Co | 3.328% | 4/22/52 | A | 271,430 | |
| 10 | KeyBank NA/Cleveland OH | 3.300% | 2/01/22 | A- | 10,156 | |
| 9 | KeyBank NA/Cleveland OH | 3.300% | 6/01/25 | A- | 9,875 | |
| 20 | KeyBank NA/Cleveland OH | 6.950% | 2/01/28 | BBB+ | 25,796 | |
| 99 | KeyCorp | 2.250% | 4/06/27 | BBB+ | 103,551 | |
| 50 | Kilroy Realty LP | 4.750% | 12/15/28 | BBB | 58,757 | |
| 100 | Kimco Realty Corp | 2.700% | 10/01/30 | BBB+ | 104,349 | |
| 20 | Legg Mason Inc | 4.750% | 3/15/26 | A | 23,289 | |
| 20 | Life Storage LP | 4.000% | 6/15/29 | BBB | 22,881 | |
| 100 | Lincoln National Corp | 3.050% | 1/15/30 | BBB+ | 108,616 | |
| 40 | Lloyds Banking Group PLC | 4.500% | 11/04/24 | BBB+ | 44,375 | |
| 300 | Lloyds Banking Group PLC | 2.438% | 2/05/26 | A | 314,133 | |
| 20 | Lloyds Banking Group PLC | 4.550% | 8/16/28 | A | 23,472 |
| Principal Amount (000) | Description (1) | Coupon | Maturity | Ratings (2) | Value | |
| Financials (continued) | ||||||
| $ 30 | Manulife Financial Corp | 5.375% | 3/04/46 | A | $42,825 | |
| 150 | Marsh & McLennan Cos Inc | 2.250% | 11/15/30 | A- | 154,545 | |
| 100 | MetLife Inc | 3.000% | 3/01/25 | A- | 107,548 | |
| 100 | MetLife Inc | 4.050% | 3/01/45 | A- | 120,495 | |
| 200 | Mitsubishi UFJ Financial Group Inc | 2.757% | 9/13/26 | A- | 213,879 | |
| 200 | Mitsubishi UFJ Financial Group Inc | 1.538% | 7/20/27 | A- | 202,102 | |
| 64 | Mitsubishi UFJ Financial Group Inc | 3.961% | 3/02/28 | A- | 73,163 | |
| 9 | Mizuho Financial Group Inc | 2.839% | 7/16/25 | A+ | 9,518 | |
| 200 | Mizuho Financial Group Inc | 2.226% | 5/25/26 | A+ | 207,635 | |
| 10 | Mizuho Financial Group Inc | 3.663% | 2/28/27 | A+ | 11,166 | |
| 100 | Mizuho Financial Group Inc | 2.869% | 9/13/30 | A+ | 106,030 | |
| 100 | Morgan Stanley | 0.790% | 5/30/25 | A | 99,847 | |
| 847 | Morgan Stanley | 3.772% | 1/24/29 | A | 951,724 | |
| 200 | Morgan Stanley | 4.431% | 1/23/30 | A | 234,818 | |
| 110 | Morgan Stanley | 3.622% | 4/01/31 | A | 123,602 | |
| 100 | Morgan Stanley | 2.239% | 7/21/32 | A | 100,704 | |
| 100 | National Australia Bank Ltd/New York | 3.625% | 6/20/23 | AA- | 106,227 | |
| 50 | National Australia Bank Ltd/New York | 3.375% | 1/14/26 | AA- | 55,400 | |
| 100 | Natwest Group PLC | 4.269% | 3/22/25 | BBB+ | 108,673 | |
| 100 | Natwest Group PLC | 5.076% | 1/27/30 | BBB+ | 119,795 | |
| 200 | Nomura Holdings Inc | 2.172% | 7/14/28 | BBB+ | 201,120 | |
| 42 | Northern Trust Corp | 3.950% | 10/30/25 | A | 47,562 | |
| 20 | Northern Trust Corp | 3.150% | 5/03/29 | A+ | 22,308 | |
| 44 | ORIX Corp | 2.900% | 7/18/22 | A- | 45,097 | |
| 20 | People's United Financial Inc | 3.650% | 12/06/22 | BBB+ | 20,687 | |
| 10 | PNC Bank NA | 3.300% | 10/30/24 | A | 10,832 | |
| 10 | PNC Bank NA | 3.100% | 10/25/27 | A | 11,043 | |
| 90 | PNC Bank NA | 4.050% | 7/26/28 | A- | 104,921 | |
| 10 | PNC Bank NA | 2.700% | 10/22/29 | A- | 10,719 | |
| 182 | PNC Financial Services Group Inc | 3.900% | 4/29/24 | A- | 197,614 | |
| 54 | Principal Financial Group Inc | 3.700% | 5/15/29 | A- | 61,196 | |
| 54 | Progressive Corp | 3.200% | 3/26/30 | A | 60,146 | |
| 30 | Progressive Corp | 4.200% | 3/15/48 | A | 38,346 | |
| 91 | Prologis LP | 3.875% | 9/15/28 | A- | 105,391 | |
| 10 | Prologis LP | 4.375% | 9/15/48 | A- | 12,925 | |
| 100 | Prudential Financial Inc | 1.500% | 3/10/26 | A- | 102,184 | |
| 60 | Prudential Financial Inc | 3.000% | 3/10/40 | A- | 62,977 | |
| 10 | Prudential Financial Inc | 4.500% | 9/15/47 | BBB+ | 10,936 | |
| 113 | Prudential Financial Inc | 3.905% | 12/07/47 | A- | 133,493 | |
| 93 | Regions Financial Corp | 3.800% | 8/14/23 | BBB+ | 99,120 | |
| 20 | Regions Financial Corp | 7.375% | 12/10/37 | BBB | 31,096 |
| Principal Amount (000) | Description (1) | Coupon | Maturity | Ratings (2) | Value | |
| Financials (continued) | ||||||
| $ 10 | Reinsurance Group of America Inc | 3.950% | 9/15/26 | BBB+ | $11,219 | |
| 39 | Reinsurance Group of America Inc | 3.900% | 5/15/29 | BBB+ | 44,276 | |
| 100 | Royal Bank of Canada | 2.250% | 11/01/24 | A | 104,930 | |
| 10 | Royal Bank of Canada | 4.650% | 1/27/26 | A- | 11,484 | |
| 100 | Royal Bank of Canada | 1.200% | 4/27/26 | A | 100,273 | |
| 100 | Royal Bank of Canada | 1.150% | 7/14/26 | A | 100,337 | |
| 120 | Simon Property Group LP | 1.750% | 2/01/28 | A- | 120,966 | |
| 120 | Simon Property Group LP | 2.200% | 2/01/31 | A- | 120,489 | |
| 42 | Sompo International Holdings Ltd | 4.700% | 10/15/22 | A- | 43,999 | |
| 149 | State Street Corp | 3.100% | 5/15/23 | A | 156,357 | |
| 90 | State Street Corp | 2.400% | 1/24/30 | A+ | 95,487 | |
| 158 | Sumitomo Mitsui Financial Group Inc | 3.936% | 10/16/23 | A+ | 170,002 | |
| 50 | Sumitomo Mitsui Financial Group Inc | 2.632% | 7/14/26 | A+ | 53,213 | |
| 330 | Sumitomo Mitsui Financial Group Inc, (3) | 3.364% | 7/12/27 | A+ | 366,111 | |
| 100 | SVB Financial Group | 2.100% | 5/15/28 | A- | 102,609 | |
| 20 | SVB Financial Group | 3.125% | 6/05/30 | A- | 21,813 | |
| 200 | Toronto-Dominion Bank | 1.200% | 6/03/26 | A+ | 201,819 | |
| 30 | Toronto-Dominion Bank | 3.625% | 9/15/31 | A | 33,476 | |
| 100 | Travelers Cos Inc | 4.600% | 8/01/43 | A | 133,642 | |
| 51 | Truist Bank | 3.625% | 9/16/25 | A | 56,443 | |
| 200 | Truist Financial Corp | 3.700% | 6/05/25 | A- | 221,270 | |
| 50 | Truist Financial Corp | 1.887% | 6/07/29 | A- | 51,010 | |
| 21 | Ventas Realty LP | 3.850% | 4/01/27 | BBB+ | 23,672 | |
| 10 | Ventas Realty LP | 3.000% | 1/15/30 | BBB+ | 10,632 | |
| 84 | Ventas Realty LP | 4.750% | 11/15/30 | BBB+ | 101,532 | |
| 9 | Voya Financial Inc | 4.800% | 6/15/46 | BBB | 11,612 | |
| 60 | Voya Financial Inc | 4.700% | 1/23/48 | BBB- | 63,155 | |
| 100 | Welltower Inc | 2.050% | 1/15/29 | BBB+ | 101,435 | |
| 128 | Welltower Inc | 4.125% | 3/15/29 | BBB+ | 147,305 | |
| 100 | Westpac Banking Corp | 2.150% | 6/03/31 | AA- | 102,684 | |
| 166 | Westpac Banking Corp | 4.322% | 11/23/31 | BBB+ | 185,432 | |
| 50 | Willis North America Inc | 2.950% | 9/15/29 | BBB | 52,936 | |
| 10 | Zions Bancorp NA | 3.250% | 10/29/29 | BBB | 10,661 | |
| 20,297 | Total Financials | 22,219,143 | ||||
| Industrial – 16.3% | ||||||
| 20 | 3M Co | 3.375% | 3/01/29 | A+ | 22,570 | |
| 198 | 3M Co | 2.375% | 8/26/29 | A+ | 210,157 | |
| 70 | 3M Co | 3.050% | 4/15/30 | A+ | 77,811 | |
| 50 | ABB Finance USA Inc | 3.800% | 4/03/28 | A- | 57,545 | |
| 70 | Activision Blizzard Inc | 4.500% | 6/15/47 | A- | 89,107 |
| Principal Amount (000) | Description (1) | Coupon | Maturity | Ratings (2) | Value | |
| Industrial (continued) | ||||||
| $ 104 | Adobe Inc | 1.900% | 2/01/25 | A+ | $108,376 | |
| 18 | Adobe Inc | 2.150% | 2/01/27 | A+ | 18,955 | |
| 10 | Agilent Technologies Inc | 2.100% | 6/04/30 | BBB+ | 10,063 | |
| 99 | Air Products and Chemicals Inc, (3) | 1.850% | 5/15/27 | A | 102,654 | |
| 40 | Alphabet Inc | 3.375% | 2/25/24 | AA+ | 43,101 | |
| 170 | Alphabet Inc | 1.900% | 8/15/40 | AA+ | 157,449 | |
| 30 | Alphabet Inc | 2.050% | 8/15/50 | AA+ | 27,145 | |
| 10 | Amcor Finance USA Inc | 4.500% | 5/15/28 | BBB | 11,720 | |
| 40 | Amcor Flexibles North America Inc | 2.630% | 6/19/30 | BBB | 41,627 | |
| 100 | Amcor Flexibles North America Inc | 2.690% | 5/25/31 | BBB | 104,318 | |
| 180 | American Tower Corp | 5.000% | 2/15/24 | BBB- | 199,131 | |
| 100 | American Tower Corp | 1.600% | 4/15/26 | BBB- | 101,520 | |
| 100 | American Tower Corp | 1.500% | 1/31/28 | BBB- | 98,523 | |
| 70 | American Tower Corp | 2.900% | 1/15/30 | BBB- | 74,374 | |
| 138 | Amgen Inc, (3) | 2.300% | 2/25/31 | BBB+ | 142,276 | |
| 355 | Amgen Inc | 4.400% | 5/01/45 | BBB+ | 442,180 | |
| 50 | Amphenol Corp | 4.350% | 6/01/29 | BBB+ | 59,116 | |
| 10 | Applied Materials Inc | 3.900% | 10/01/25 | A | 11,220 | |
| 42 | Applied Materials Inc | 5.100% | 10/01/35 | A | 56,399 | |
| 50 | Applied Materials Inc | 4.350% | 4/01/47 | A | 64,206 | |
| 50 | Aptiv PLC | 4.350% | 3/15/29 | BBB | 58,313 | |
| 90 | Archer-Daniels-Midland Co, (3) | 3.250% | 3/27/30 | A | 100,767 | |
| 100 | Astrazeneca Finance LLC | 1.200% | 5/28/26 | A- | 100,842 | |
| 49 | AstraZeneca PLC | 1.375% | 8/06/30 | A- | 47,332 | |
| 165 | AstraZeneca PLC | 6.450% | 9/15/37 | A- | 250,563 | |
| 10 | AstraZeneca PLC | 4.375% | 11/16/45 | A- | 12,907 | |
| 100 | Automatic Data Processing Inc | 1.700% | 5/15/28 | AA- | 102,136 | |
| 100 | AutoNation Inc | 1.950% | 8/01/28 | BBB- | 100,251 | |
| 20 | Avnet Inc | 4.625% | 4/15/26 | BBB- | 22,597 | |
| 145 | Baker Hughes a GE Co LLC / Baker Hughes Co-Obligor Inc | 3.138% | 11/07/29 | A- | 157,902 | |
| 180 | Baxalta Inc | 4.000% | 6/23/25 | BBB+ | 199,129 | |
| 50 | Baxter International Inc | 1.730% | 4/01/31 | A- | 49,343 | |
| 100 | Bell Telephone Co of Canada or Bell Canada | 3.650% | 3/17/51 | BBB+ | 111,900 | |
| 150 | Biogen Inc | 3.625% | 9/15/22 | A- | 155,438 | |
| 20 | Biogen Inc | 2.250% | 5/01/30 | A- | 20,358 | |
| 100 | Block Financial LLC | 2.500% | 7/15/28 | BBB | 102,167 | |
| 50 | Boardwalk Pipelines LP | 5.950% | 6/01/26 | BBB- | 59,414 | |
| 10 | Boardwalk Pipelines LP | 4.450% | 7/15/27 | BBB- | 11,348 | |
| 70 | Booking Holdings Inc | 2.750% | 3/15/23 | A- | 72,646 | |
| 50 | Booking Holdings Inc | 3.600% | 6/01/26 | A- | 55,625 | |
| 50 | BorgWarner Inc | 2.650% | 7/01/27 | BBB+ | 53,393 |
| Principal Amount (000) | Description (1) | Coupon | Maturity | Ratings (2) | Value | |
| Industrial (continued) | ||||||
| $ 250 | Bristol-Myers Squibb Co | 2.600% | 5/16/22 | A+ | $254,761 | |
| 38 | Bristol-Myers Squibb Co | 2.000% | 8/01/22 | A+ | 38,683 | |
| 90 | Bristol-Myers Squibb Co | 1.450% | 11/13/30 | A+ | 88,241 | |
| 260 | Bristol-Myers Squibb Co | 4.125% | 6/15/39 | A+ | 320,178 | |
| 149 | Bristol-Myers Squibb Co | 5.000% | 8/15/45 | A+ | 207,728 | |
| 100 | British Telecommunications PLC | 9.625% | 12/15/30 | BBB | 154,428 | |
| 100 | Broadridge Financial Solutions Inc | 2.600% | 5/01/31 | BBB+ | 103,867 | |
| 28 | Bunge Ltd Finance Corp | 3.000% | 9/25/22 | BBB- | 28,729 | |
| 30 | Bunge Ltd Finance Corp | 3.250% | 8/15/26 | BBB- | 32,654 | |
| 10 | Bunge Ltd Finance Corp | 3.750% | 9/25/27 | BBB- | 11,135 | |
| 50 | Bunge Ltd Finance Corp | 2.750% | 5/14/31 | BBB- | 51,245 | |
| 10 | Campbell Soup Co | 3.300% | 3/19/25 | BBB | 10,707 | |
| 110 | Campbell Soup Co | 2.375% | 4/24/30 | BBB | 112,420 | |
| 50 | Canadian National Railway Co | 6.375% | 11/15/37 | A | 73,776 | |
| 10 | Canadian National Railway Co | 4.450% | 1/20/49 | A | 12,826 | |
| 47 | Cardinal Health Inc | 2.616% | 6/15/22 | BBB | 47,838 | |
| 38 | Cardinal Health Inc | 3.200% | 3/15/23 | BBB | 39,631 | |
| 40 | Carlisle Cos Inc | 3.500% | 12/01/24 | BBB | 43,175 | |
| 160 | Carrier Global Corp | 3.377% | 4/05/40 | BBB- | 172,408 | |
| 70 | Caterpillar Financial Services Corp | 0.950% | 5/13/22 | A | 70,426 | |
| 80 | Caterpillar Financial Services Corp | 2.550% | 11/29/22 | A | 82,490 | |
| 100 | Caterpillar Financial Services Corp | 0.450% | 5/17/24 | A | 100,190 | |
| 50 | Caterpillar Financial Services Corp | 3.250% | 12/01/24 | A | 54,414 | |
| 10 | Caterpillar Financial Services Corp | 0.800% | 11/13/25 | A | 9,996 | |
| 60 | Caterpillar Inc | 2.600% | 9/19/29 | A | 64,592 | |
| 186 | Caterpillar Inc | 3.803% | 8/15/42 | A | 226,893 | |
| 100 | Celanese US Holdings LLC | 1.400% | 8/05/26 | N/R | 100,276 | |
| 40 | Celulosa Arauco y Constitucion SA | 3.875% | 11/02/27 | BBB- | 43,000 | |
| 10 | Celulosa Arauco y Constitucion SA | 5.500% | 11/02/47 | BBB- | 12,100 | |
| 50 | Cheniere Corpus Christi Holdings LLC | 5.875% | 3/31/25 | BBB- | 57,130 | |
| 50 | Cheniere Corpus Christi Holdings LLC | 5.125% | 6/30/27 | BBB- | 58,555 | |
| 40 | Church & Dwight Co Inc | 3.150% | 8/01/27 | A- | 43,930 | |
| 70 | Cigna Corp | 4.500% | 2/25/26 | BBB+ | 79,936 | |
| 432 | Cigna Corp | 3.050% | 10/15/27 | BBB+ | 469,957 | |
| 50 | Cigna Corp | 4.800% | 8/15/38 | BBB+ | 63,295 | |
| 100 | Cintas Corp No 2 | 3.700% | 4/01/27 | A- | 112,421 | |
| 188 | Cisco Systems Inc/Delaware | 2.500% | 9/20/26 | AA- | 202,365 | |
| 30 | Citrix Systems Inc | 3.300% | 3/01/30 | BBB | 31,908 | |
| 28 | Clorox Co | 3.050% | 9/15/22 | A- | 28,667 | |
| 120 | CNH Industrial NV | 3.850% | 11/15/27 | BBB- | 134,503 | |
| 175 | Coca-Cola Co | 1.450% | 6/01/27 | A+ | 178,669 |
| Principal Amount (000) | Description (1) | Coupon | Maturity | Ratings (2) | Value | |
| Industrial (continued) | ||||||
| $ 50 | Coca-Cola Co | 1.000% | 3/15/28 | A+ | $49,218 | |
| 160 | Coca-Cola Co | 1.650% | 6/01/30 | A+ | 159,909 | |
| 100 | Coca-Cola Co | 3.000% | 3/05/51 | A+ | 108,052 | |
| 40 | Coca-Cola Co | 2.750% | 6/01/60 | A+ | 41,151 | |
| 90 | Coca-Cola Femsa SAB de CV | 1.850% | 9/01/32 | A2 | 87,361 | |
| 60 | Colgate-Palmolive Co | 1.950% | 2/01/23 | AA- | 61,592 | |
| 10 | Conagra Brands Inc | 4.600% | 11/01/25 | BBB- | 11,369 | |
| 130 | Conagra Brands Inc | 8.250% | 9/15/30 | BBB- | 194,113 | |
| 100 | Corning Inc | 5.350% | 11/15/48 | BBB+ | 138,314 | |
| 10 | Corning Inc | 3.900% | 11/15/49 | BBB+ | 11,499 | |
| 10 | Corning Inc | 4.375% | 11/15/57 | BBB+ | 12,167 | |
| 150 | Costco Wholesale Corp | 1.375% | 6/20/27 | AA- | 151,934 | |
| 30 | Crown Castle International Corp | 4.300% | 2/15/29 | BBB- | 34,847 | |
| 204 | Crown Castle International Corp | 3.300% | 7/01/30 | BBB- | 221,938 | |
| 100 | Crown Castle International Corp | 2.500% | 7/15/31 | BBB- | 102,376 | |
| 155 | CSX Corp | 4.250% | 3/15/29 | BBB+ | 181,718 | |
| 10 | CSX Corp | 6.000% | 10/01/36 | BBB+ | 14,106 | |
| 100 | CSX Corp | 4.100% | 3/15/44 | BBB+ | 119,532 | |
| 10 | CSX Corp | 4.750% | 11/15/48 | BBB+ | 13,171 | |
| 42 | CSX Corp | 4.250% | 11/01/66 | BBB+ | 53,185 | |
| 9 | Cummins Inc | 1.500% | 9/01/30 | A+ | 8,777 | |
| 120 | Cummins Inc | 2.600% | 9/01/50 | A+ | 118,181 | |
| 50 | Darden Restaurants Inc | 4.550% | 2/15/48 | BBB- | 59,196 | |
| 274 | Deere & Co | 3.900% | 6/09/42 | A | 340,795 | |
| 140 | Dell International LLC / EMC Corp | 5.450% | 6/15/23 | BBB- | 151,406 | |
| 100 | Dell International LLC / EMC Corp | 5.850% | 7/15/25 | BBB- | 117,649 | |
| 151 | Dell International LLC / EMC Corp | 8.100% | 7/15/36 | BBB- | 234,443 | |
| 100 | Deutsche Telekom International Finance BV | 8.750% | 6/15/30 | BBB+ | 151,068 | |
| 200 | Discovery Communications LLC | 3.625% | 5/15/30 | BBB- | 220,294 | |
| 51 | Discovery Communications LLC | 6.350% | 6/01/40 | BBB- | 71,451 | |
| 46 | Discovery Communications LLC | 4.000% | 9/15/55 | BBB- | 49,355 | |
| 30 | Dover Corp | 5.375% | 10/15/35 | BBB+ | 39,250 | |
| 200 | Dow Chemical Co | 4.250% | 10/01/34 | BBB | 236,835 | |
| 100 | DR Horton Inc | 1.300% | 10/15/26 | BBB | 100,098 | |
| 126 | DuPont de Nemours Inc | 4.725% | 11/15/28 | BBB+ | 151,131 | |
| 120 | DuPont de Nemours Inc | 5.319% | 11/15/38 | BBB+ | 160,132 | |
| 48 | DXC Technology Co | 4.250% | 4/15/24 | BBB | 52,002 | |
| 120 | Eastern Gas Transmission & Storage Inc, 144A | 4.800% | 11/01/43 | A | 147,176 | |
| 48 | Eaton Corp | 3.103% | 9/15/27 | BBB+ | 52,534 | |
| 42 | Eaton Corp | 4.000% | 11/02/32 | BBB+ | 49,842 | |
| 124 | eBay Inc | 2.700% | 3/11/30 | BBB+ | 130,419 |
| Principal Amount (000) | Description (1) | Coupon | Maturity | Ratings (2) | Value | |
| Industrial (continued) | ||||||
| $ 126 | Ecolab Inc | 3.250% | 12/01/27 | A- | $139,874 | |
| 60 | Eli Lilly & Co | 3.375% | 3/15/29 | A+ | 68,038 | |
| 100 | Eli Lilly & Co | 3.700% | 3/01/45 | A+ | 119,460 | |
| 9 | Eli Lilly & Co | 3.950% | 5/15/47 | A+ | 11,101 | |
| 10 | Eli Lilly & Co | 3.950% | 3/15/49 | A+ | 12,421 | |
| 50 | Emerson Electric Co | 1.950% | 10/15/30 | A | 50,939 | |
| 160 | Enbridge Inc | 3.125% | 11/15/29 | BBB+ | 172,451 | |
| 90 | Enbridge Inc | 4.500% | 6/10/44 | BBB+ | 108,994 | |
| 60 | Equifax Inc | 2.600% | 12/15/25 | BBB | 63,817 | |
| 140 | Equinix Inc | 2.625% | 11/18/24 | BBB | 147,554 | |
| 20 | Equinix Inc | 2.150% | 7/15/30 | BBB | 20,098 | |
| 100 | Equinix Inc | 2.500% | 5/15/31 | BBB | 103,624 | |
| 110 | Estee Lauder Cos Inc | 2.600% | 4/15/30 | A+ | 117,714 | |
| 100 | FedEx Corp | 3.250% | 5/15/41 | BBB | 105,679 | |
| 100 | FedEx Corp | 5.100% | 1/15/44 | BBB | 132,758 | |
| 150 | FedEx Corp | 5.250% | 5/15/50 | BBB | 209,526 | |
| 150 | Fidelity National Information Services Inc | 1.650% | 3/01/28 | BBB | 151,249 | |
| 254 | Fiserv Inc | 3.500% | 7/01/29 | BBB | 283,441 | |
| 50 | Flex Ltd | 4.875% | 6/15/29 | BBB- | 57,945 | |
| 10 | Fomento Economico Mexicano SAB de CV | 4.375% | 5/10/43 | A | 12,136 | |
| 79 | Fomento Economico Mexicano SAB de CV | 3.500% | 1/16/50 | A | 84,662 | |
| 30 | Fortive Corp | 3.150% | 6/15/26 | BBB+ | 32,772 | |
| 174 | General Mills Inc | 2.875% | 4/15/30 | BBB | 187,070 | |
| 160 | Gilead Sciences Inc | 4.600% | 9/01/35 | A- | 200,150 | |
| 296 | Gilead Sciences Inc | 4.000% | 9/01/36 | A- | 351,245 | |
| 50 | GlaxoSmithKline Capital Inc | 3.625% | 5/15/25 | A | 55,301 | |
| 30 | GlaxoSmithKline Capital PLC | 3.000% | 6/01/24 | A | 32,066 | |
| 230 | GlaxoSmithKline Capital PLC | 3.375% | 6/01/29 | A | 259,216 | |
| 150 | Halliburton Co | 4.850% | 11/15/35 | BBB+ | 179,027 | |
| 30 | Harley-Davidson Inc | 4.625% | 7/28/45 | BBB- | 33,085 | |
| 10 | Hasbro Inc | 3.500% | 9/15/27 | BBB- | 11,004 | |
| 100 | Hasbro Inc | 3.900% | 11/19/29 | BBB- | 112,539 | |
| 206 | HCA Inc | 4.125% | 6/15/29 | BBB- | 234,916 | |
| 100 | HCA Inc | 5.125% | 6/15/39 | BBB- | 127,352 | |
| 100 | HCA Inc | 3.500% | 7/15/51 | BBB- | 103,145 | |
| 116 | Hewlett Packard Enterprise Co | 3.500% | 10/05/21 | BBB | 116,336 | |
| 50 | Hewlett Packard Enterprise Co | 2.250% | 4/01/23 | BBB | 51,352 | |
| 50 | Hewlett Packard Enterprise Co | 6.200% | 10/15/35 | BBB | 69,337 | |
| 30 | Home Depot Inc | 2.625% | 6/01/22 | A | 30,549 | |
| 9 | Home Depot Inc | 2.800% | 9/14/27 | A | 9,828 | |
| 10 | Home Depot Inc | 2.950% | 6/15/29 | A | 11,034 |
| Principal Amount (000) | Description (1) | Coupon | Maturity | Ratings (2) | Value | |
| Industrial (continued) | ||||||
| $ 299 | Home Depot Inc | 5.400% | 9/15/40 | A | $420,748 | |
| 100 | Home Depot Inc | 5.950% | 4/01/41 | A | 147,594 | |
| 10 | Home Depot Inc | 4.400% | 3/15/45 | A | 12,903 | |
| 90 | Home Depot Inc | 3.125% | 12/15/49 | A | 97,676 | |
| 100 | Hormel Foods Corp | 1.700% | 6/03/28 | A+ | 101,673 | |
| 100 | HP Inc, 144A | 1.450% | 6/17/26 | BBB | 99,918 | |
| 80 | HP Inc | 3.400% | 6/17/30 | BBB | 85,839 | |
| 100 | IDEX Corp | 2.625% | 6/15/31 | BBB | 103,791 | |
| 60 | Illinois Tool Works Inc | 4.875% | 9/15/41 | A+ | 81,747 | |
| 392 | Intel Corp | 2.450% | 11/15/29 | A+ | 413,216 | |
| 10 | Intel Corp | 4.000% | 12/15/32 | A+ | 12,173 | |
| 100 | Intel Corp | 4.600% | 3/25/40 | A+ | 127,422 | |
| 40 | Intel Corp | 4.250% | 12/15/42 | A+ | 49,547 | |
| 60 | Intel Corp | 4.100% | 5/11/47 | A+ | 72,818 | |
| 20 | International Business Machines Corp | 7.000% | 10/30/25 | A | 25,022 | |
| 350 | International Business Machines Corp | 3.300% | 5/15/26 | A | 386,517 | |
| 20 | International Business Machines Corp | 1.700% | 5/15/27 | A | 20,464 | |
| 78 | International Business Machines Corp, (3) | 1.950% | 5/15/30 | A | 78,253 | |
| 72 | International Business Machines Corp, (3) | 5.600% | 11/30/39 | A | 102,085 | |
| 90 | International Business Machines Corp | 4.700% | 2/19/46 | A | 119,036 | |
| 58 | International Flavors & Fragrances Inc | 3.200% | 5/01/23 | BBB | 60,350 | |
| 10 | International Flavors & Fragrances Inc | 4.375% | 6/01/47 | BBB | 12,073 | |
| 10 | International Flavors & Fragrances Inc | 5.000% | 9/26/48 | BBB | 13,340 | |
| 10 | International Paper Co | 3.800% | 1/15/26 | BBB | 11,179 | |
| 100 | International Paper Co | 4.800% | 6/15/44 | BBB | 130,650 | |
| 30 | International Paper Co | 4.350% | 8/15/48 | BBB | 38,081 | |
| 48 | Intuit Inc | 1.350% | 7/15/27 | A- | 48,475 | |
| 10 | Intuit Inc | 1.650% | 7/15/30 | A- | 9,981 | |
| 100 | J M Smucker Co | 2.375% | 3/15/30 | BBB | 104,207 | |
| 100 | Jabil Inc | 1.700% | 4/15/26 | BBB- | 101,398 | |
| 50 | John Deere Capital Corp | 3.650% | 10/12/23 | A | 53,661 | |
| 100 | John Deere Capital Corp | 0.450% | 1/17/24 | A | 100,056 | |
| 100 | John Deere Capital Corp | 0.450% | 6/07/24 | A | 99,833 | |
| 30 | John Deere Capital Corp | 1.750% | 3/09/27 | A | 30,987 | |
| 10 | John Deere Capital Corp | 2.800% | 9/08/27 | A | 10,905 | |
| 10 | John Deere Capital Corp | 2.450% | 1/09/30 | A | 10,683 | |
| 50 | Johnson Controls International plc | 5.125% | 9/14/45 | BBB+ | 67,706 | |
| 10 | Johnson Controls International plc / Tyco Fire & Security Finance SCA | 1.750% | 9/15/30 | BBB+ | 9,851 | |
| 70 | Kansas City Southern | 4.300% | 5/15/43 | BBB | 84,276 | |
| 115 | Kellogg Co | 2.650% | 12/01/23 | BBB | 120,626 | |
| 179 | Keurig Dr Pepper Inc | 3.130% | 12/15/23 | BBB | 189,669 |
| Principal Amount (000) | Description (1) | Coupon | Maturity | Ratings (2) | Value | |
| Industrial (continued) | ||||||
| $ 80 | Keurig Dr Pepper Inc | 2.550% | 9/15/26 | BBB | $85,475 | |
| 50 | Keysight Technologies Inc | 3.000% | 10/30/29 | BBB | 53,751 | |
| 10 | Kimberly-Clark Corp | 3.950% | 11/01/28 | A | 11,659 | |
| 48 | Kimberly-Clark Corp | 6.625% | 8/01/37 | A | 75,094 | |
| 69 | Kimberly-Clark Corp | 5.300% | 3/01/41 | A | 95,816 | |
| 450 | Kinder Morgan Inc | 5.300% | 12/01/34 | BBB | 565,771 | |
| 30 | Koninklijke KPN NV | 8.375% | 10/01/30 | BBB | 43,061 | |
| 10 | Kroger Co | 2.200% | 5/01/30 | BBB+ | 10,166 | |
| 160 | Kroger Co | 6.900% | 4/15/38 | BBB+ | 239,579 | |
| 9 | Kroger Co | 5.400% | 7/15/40 | BBB+ | 11,995 | |
| 100 | Laboratory Corp of America Holdings | 1.550% | 6/01/26 | BBB | 101,323 | |
| 100 | Laboratory Corp of America Holdings | 2.700% | 6/01/31 | BBB | 103,779 | |
| 10 | Lam Research Corp | 1.900% | 6/15/30 | A | 10,211 | |
| 90 | Lam Research Corp | 3.125% | 6/15/60 | A | 97,410 | |
| 30 | Leggett & Platt Inc | 4.400% | 3/15/29 | BBB | 34,858 | |
| 119 | Linde Inc/CT, (3) | 2.700% | 2/21/23 | A | 122,716 | |
| 10 | Linde Inc/CT | 1.100% | 8/10/30 | A | 9,564 | |
| 10 | Lowe's Cos Inc | 4.500% | 4/15/30 | BBB+ | 11,928 | |
| 100 | Lowe's Cos Inc | 2.625% | 4/01/31 | BBB+ | 105,049 | |
| 300 | Lowe's Cos Inc | 5.000% | 4/15/40 | BBB+ | 392,239 | |
| 150 | LYB International Finance III LLC | 3.375% | 5/01/30 | BBB | 165,596 | |
| 60 | Magna International Inc | 2.450% | 6/15/30 | A- | 62,181 | |
| 150 | Marathon Petroleum Corp | 4.750% | 9/15/44 | BBB | 180,165 | |
| 40 | Martin Marietta Materials Inc | 2.500% | 3/15/30 | BBB | 41,319 | |
| 100 | Martin Marietta Materials Inc | 3.200% | 7/15/51 | BBB | 102,228 | |
| 100 | Marvell Technology Inc, 144A | 2.450% | 4/15/28 | BBB- | 103,377 | |
| 50 | Masco Corp | 2.000% | 2/15/31 | BBB | 49,475 | |
| 28 | Mastercard Inc | 2.000% | 11/21/21 | A+ | 28,107 | |
| 20 | Mastercard Inc | 2.950% | 6/01/29 | A+ | 22,153 | |
| 144 | Mastercard Inc | 3.350% | 3/26/30 | A+ | 164,601 | |
| 40 | Mastercard Inc | 3.800% | 11/21/46 | A+ | 47,954 | |
| 139 | McCormick & Co Inc/MD | 2.700% | 8/15/22 | BBB | 142,160 | |
| 250 | McDonald's Corp | 3.300% | 7/01/25 | BBB+ | 272,007 | |
| 250 | McDonald's Corp | 4.200% | 4/01/50 | BBB+ | 308,199 | |
| 20 | Micron Technology Inc | 4.975% | 2/06/26 | BBB- | 23,136 | |
| 80 | Micron Technology Inc | 4.185% | 2/15/27 | BBB- | 90,607 | |
| 50 | Microsoft Corp | 3.300% | 2/06/27 | AAA | 55,855 | |
| 211 | Microsoft Corp | 3.450% | 8/08/36 | AAA | 249,163 | |
| 776 | Microsoft Corp | 2.921% | 3/17/52 | AAA | 835,495 | |
| 84 | Moody's Corp | 4.500% | 9/01/22 | BBB+ | 86,848 | |
| 38 | Moody's Corp | 2.625% | 1/15/23 | BBB+ | 39,174 |
| Principal Amount (000) | Description (1) | Coupon | Maturity | Ratings (2) | Value | |
| Industrial (continued) | ||||||
| $ 10 | Moody's Corp | 5.250% | 7/15/44 | BBB+ | $13,748 | |
| 150 | Mosaic Co | 4.875% | 11/15/41 | BBB- | 180,712 | |
| 100 | Motorola Solutions Inc | 4.600% | 2/23/28 | BBB- | 117,118 | |
| 100 | Motorola Solutions Inc | 2.750% | 5/24/31 | BBB- | 103,612 | |
| 100 | National Fuel Gas Co | 5.500% | 1/15/26 | BBB- | 116,524 | |
| 50 | NetApp Inc | 2.375% | 6/22/27 | BBB+ | 52,786 | |
| 164 | NIKE Inc | 2.850% | 3/27/30 | AA- | 179,931 | |
| 50 | Nordstrom Inc, (3) | 4.375% | 4/01/30 | BBB- | 52,721 | |
| 10 | Nordstrom Inc | 5.000% | 1/15/44 | BBB- | 9,939 | |
| 10 | Norfolk Southern Corp | 3.650% | 8/01/25 | BBB+ | 11,004 | |
| 100 | Norfolk Southern Corp | 2.300% | 5/15/31 | BBB+ | 103,126 | |
| 142 | Norfolk Southern Corp | 4.837% | 10/01/41 | BBB+ | 183,836 | |
| 50 | Norfolk Southern Corp | 4.450% | 6/15/45 | BBB+ | 62,529 | |
| 50 | NOV Inc | 3.950% | 12/01/42 | BBB+ | 49,793 | |
| 150 | Novartis Capital Corp | 2.200% | 8/14/30 | AA- | 157,485 | |
| 100 | Novartis Capital Corp | 4.400% | 5/06/44 | AA- | 130,545 | |
| 210 | Nutrien Ltd | 4.200% | 4/01/29 | BBB | 243,873 | |
| 54 | NVIDIA Corp | 2.200% | 9/16/21 | A | 54,037 | |
| 100 | NVIDIA Corp | 2.000% | 6/15/31 | A | 101,700 | |
| 50 | NVIDIA Corp | 3.500% | 4/01/40 | A | 57,237 | |
| 30 | NVR Inc | 3.000% | 5/15/30 | BBB+ | 32,074 | |
| 100 | NXP BV / NXP Funding LLC / NXP USA Inc, 144A | 3.150% | 5/01/27 | BBB- | 108,027 | |
| 100 | NXP BV / NXP Funding LLC / NXP USA Inc, 144A | 2.500% | 5/11/31 | BBB- | 103,555 | |
| 104 | Omnicom Group Inc | 4.200% | 6/01/30 | BBB+ | 120,687 | |
| 10 | Omnicom Group Inc / Omnicom Capital Inc | 3.600% | 4/15/26 | BBB+ | 11,106 | |
| 273 | ONEOK Inc | 4.550% | 7/15/28 | BBB | 314,438 | |
| 19 | ONEOK Inc | 4.350% | 3/15/29 | BBB | 21,660 | |
| 60 | Otis Worldwide Corp | 3.112% | 2/15/40 | BBB | 63,175 | |
| 10 | Owens Corning | 3.400% | 8/15/26 | BBB- | 10,902 | |
| 50 | Owens Corning | 3.875% | 6/01/30 | BBB- | 56,352 | |
| 96 | PACCAR Financial Corp | 2.300% | 8/10/22 | A+ | 98,005 | |
| 100 | PACCAR Financial Corp | 1.100% | 5/11/26 | A+ | 100,596 | |
| 10 | Parker-Hannifin Corp, (3) | 3.250% | 3/01/27 | BBB+ | 10,990 | |
| 104 | Parker-Hannifin Corp | 4.200% | 11/21/34 | BBB+ | 124,310 | |
| 10 | Parker-Hannifin Corp | 4.450% | 11/21/44 | BBB+ | 12,726 | |
| 150 | PayPal Holdings Inc | 2.850% | 10/01/29 | A- | 163,147 | |
| 60 | PepsiCo Inc | 3.500% | 7/17/25 | A+ | 66,128 | |
| 20 | PepsiCo Inc | 2.375% | 10/06/26 | A+ | 21,481 | |
| 100 | PepsiCo Inc | 1.625% | 5/01/30 | A+ | 100,161 | |
| 20 | PepsiCo Inc | 4.875% | 11/01/40 | A+ | 27,010 | |
| 60 | PepsiCo Inc | 4.250% | 10/22/44 | A+ | 76,477 |
| Principal Amount (000) | Description (1) | Coupon | Maturity | Ratings (2) | Value | |
| Industrial (continued) | ||||||
| $ 364 | PepsiCo Inc | 2.875% | 10/15/49 | A+ | $382,020 | |
| 100 | PPG Industries Inc, (3) | 3.750% | 3/15/28 | A- | 114,459 | |
| 100 | Procter & Gamble Co | 1.000% | 4/23/26 | AA- | 101,037 | |
| 200 | Procter & Gamble Co | 3.000% | 3/25/30 | AA- | 222,884 | |
| 25 | PulteGroup Inc | 5.000% | 1/15/27 | BBB- | 29,313 | |
| 28 | Quest Diagnostics Inc | 4.250% | 4/01/24 | BBB | 30,375 | |
| 50 | Quest Diagnostics Inc | 3.450% | 6/01/26 | BBB | 55,168 | |
| 40 | Regeneron Pharmaceuticals Inc | 1.750% | 9/15/30 | BBB+ | 38,635 | |
| 48 | RELX Capital Inc | 3.500% | 3/16/23 | BBB+ | 50,295 | |
| 10 | Republic Services Inc | 3.375% | 11/15/27 | BBB | 11,070 | |
| 100 | Republic Services Inc | 3.950% | 5/15/28 | BBB | 114,772 | |
| 18 | Republic Services Inc | 2.300% | 3/01/30 | BBB | 18,582 | |
| 40 | Republic Services Inc | 1.450% | 2/15/31 | BBB | 38,510 | |
| 40 | Rockwell Automation Inc, (3) | 4.200% | 3/01/49 | A | 50,829 | |
| 150 | Rogers Communications Inc | 5.450% | 10/01/43 | BBB+ | 202,193 | |
| 36 | Roper Technologies Inc | 3.125% | 11/15/22 | BBB+ | 37,034 | |
| 100 | Roper Technologies Inc | 3.800% | 12/15/26 | BBB+ | 112,425 | |
| 114 | Ryder System Inc | 2.500% | 9/01/24 | BBB | 119,713 | |
| 100 | Sabine Pass Liquefaction LLC | 5.875% | 6/30/26 | BBB- | 118,941 | |
| 150 | Sabine Pass Liquefaction LLC | 4.500% | 5/15/30 | BBB- | 175,260 | |
| 60 | salesforcecom Inc | 3.700% | 4/11/28 | A+ | 68,613 | |
| 100 | salesforcecom Inc | 2.700% | 7/15/41 | A+ | 102,208 | |
| 100 | salesforcecom Inc | 2.900% | 7/15/51 | A+ | 102,469 | |
| 10 | Schlumberger Finance Canada Ltd | 1.400% | 9/17/25 | A | 10,177 | |
| 100 | Schlumberger Investment SA | 2.650% | 6/26/30 | A | 106,369 | |
| 131 | Sherwin-Williams Co | 2.950% | 8/15/29 | BBB | 142,555 | |
| 30 | Sherwin-Williams Co | 4.500% | 6/01/47 | BBB | 38,015 | |
| 100 | Shire Acquisitions Investments Ireland DAC | 2.875% | 9/23/23 | BBB+ | 104,549 | |
| 100 | Stanley Black & Decker Inc | 4.250% | 11/15/28 | A- | 118,181 | |
| 10 | Stanley Black & Decker Inc | 4.000% | 3/15/60 | BBB | 10,700 | |
| 10 | Starbucks Corp | 3.500% | 3/01/28 | BBB+ | 11,230 | |
| 222 | Starbucks Corp | 3.550% | 8/15/29 | BBB+ | 251,395 | |
| 10 | Starbucks Corp | 4.300% | 6/15/45 | BBB+ | 12,030 | |
| 50 | Starbucks Corp | 3.750% | 12/01/47 | BBB+ | 56,882 | |
| 50 | Takeda Pharmaceutical Co Ltd | 3.375% | 7/09/60 | BBB+ | 53,943 | |
| 21 | Target Corp | 3.375% | 4/15/29 | A | 23,736 | |
| 190 | Target Corp | 2.350% | 2/15/30 | A | 200,587 | |
| 9 | Target Corp, (3) | 3.900% | 11/15/47 | A | 11,380 | |
| 50 | TC PipeLines LP | 3.900% | 5/25/27 | BBB+ | 55,830 | |
| 60 | Teledyne Technologies Inc | 2.250% | 4/01/28 | BBB- | 62,033 | |
| 20 | Telefonica Emisiones SA | 4.103% | 3/08/27 | BBB- | 22,612 |
| Principal Amount (000) | Description (1) | Coupon | Maturity | Ratings (2) | Value | |
| Industrial (continued) | ||||||
| $ 21 | Telefonica Emisiones SA | 7.045% | 6/20/36 | BBB- | $30,561 | |
| 150 | Telefonica Emisiones SA | 5.520% | 3/01/49 | BBB- | 197,584 | |
| 50 | Telefonica Europe BV | 8.250% | 9/15/30 | BBB- | 73,955 | |
| 60 | TELUS Corp | 3.700% | 9/15/27 | BBB+ | 67,957 | |
| 120 | Texas Instruments Inc | 1.750% | 5/04/30 | A+ | 121,464 | |
| 150 | Thermo Fisher Scientific Inc | 4.133% | 3/25/25 | BBB+ | 166,343 | |
| 40 | Thomson Reuters Corp | 3.350% | 5/15/26 | BBB | 43,781 | |
| 282 | Toyota Motor Corp | 2.760% | 7/02/29 | A+ | 307,888 | |
| 100 | Toyota Motor Credit Corp | 0.400% | 4/06/23 | A+ | 100,160 | |
| 100 | Toyota Motor Credit Corp | 0.450% | 1/11/24 | A+ | 99,965 | |
| 60 | Toyota Motor Credit Corp | 2.000% | 10/07/24 | A+ | 62,612 | |
| 100 | Toyota Motor Credit Corp | 1.125% | 6/18/26 | A+ | 100,405 | |
| 10 | Toyota Motor Credit Corp | 3.650% | 1/08/29 | A+ | 11,506 | |
| 78 | Trane Technologies Global Holding Co Ltd | 4.250% | 6/15/23 | BBB | 83,391 | |
| 10 | Trane Technologies Luxembourg Finance SA | 3.800% | 3/21/29 | BBB | 11,413 | |
| 50 | Transcontinental Gas Pipe Line Co LLC | 7.850% | 2/01/26 | BBB+ | 63,485 | |
| 150 | Transcontinental Gas Pipe Line Co LLC | 3.250% | 5/15/30 | BBB+ | 163,467 | |
| 50 | Transcontinental Gas Pipe Line Co LLC | 3.950% | 5/15/50 | BBB+ | 57,189 | |
| 90 | Trimble Inc | 4.150% | 6/15/23 | BBB- | 95,464 | |
| 351 | TWDC Enterprises 18 Corp | 2.350% | 12/01/22 | A- | 360,469 | |
| 39 | TWDC Enterprises 18 Corp | 3.150% | 9/17/25 | A- | 42,439 | |
| 20 | TWDC Enterprises 18 Corp | 4.375% | 8/16/41 | A- | 25,149 | |
| 10 | TWDC Enterprises 18 Corp | 4.125% | 12/01/41 | A- | 12,154 | |
| 200 | Tyson Foods Inc | 4.875% | 8/15/34 | BBB | 252,087 | |
| 80 | Unilever Capital Corp | 3.125% | 3/22/23 | A+ | 83,517 | |
| 100 | Unilever Capital Corp | 2.600% | 5/05/24 | A+ | 105,538 | |
| 18 | Unilever Capital Corp | 3.100% | 7/30/25 | A+ | 19,642 | |
| 21 | Unilever Capital Corp | 2.000% | 7/28/26 | A+ | 22,027 | |
| 350 | Union Pacific Corp | 2.400% | 2/05/30 | A- | 365,650 | |
| 90 | Union Pacific Corp | 3.550% | 8/15/39 | A- | 102,305 | |
| 100 | Union Pacific Corp | 3.200% | 5/20/41 | A- | 107,927 | |
| 80 | United Parcel Service Inc | 4.450% | 4/01/30 | A | 97,513 | |
| 28 | United Parcel Service Inc | 6.200% | 1/15/38 | A | 41,913 | |
| 154 | United Parcel Service Inc | 3.750% | 11/15/47 | A | 186,266 | |
| 160 | Valero Energy Corp | 4.000% | 4/01/29 | BBB | 179,182 | |
| 100 | Valero Energy Partners LP | 4.375% | 12/15/26 | BBB | 113,883 | |
| 70 | Valmont Industries Inc | 5.250% | 10/01/54 | BBB- | 89,233 | |
| 100 | Verisk Analytics Inc, (3) | 4.125% | 3/15/29 | BBB | 115,531 | |
| 250 | Verizon Communications Inc | 0.750% | 3/22/24 | BBB+ | 251,115 | |
| 250 | Verizon Communications Inc | 3.376% | 2/15/25 | BBB+ | 271,889 | |
| 78 | Verizon Communications Inc | 2.625% | 8/15/26 | BBB+ | 83,139 |
| Principal Amount (000) | Description (1) | Coupon | Maturity | Ratings (2) | Value | |
| Industrial (continued) | ||||||
| $ 39 | Verizon Communications Inc | 4.016% | 12/03/29 | BBB+ | $45,102 | |
| 100 | Verizon Communications Inc | 1.500% | 9/18/30 | BBB+ | 96,956 | |
| 190 | Verizon Communications Inc | 5.250% | 3/16/37 | BBB+ | 253,559 | |
| 200 | Verizon Communications Inc | 4.812% | 3/15/39 | BBB+ | 256,654 | |
| 670 | Verizon Communications Inc | 4.672% | 3/15/55 | BBB+ | 874,902 | |
| 50 | VF Corp | 2.800% | 4/23/27 | A- | 53,793 | |
| 300 | ViacomCBS Inc | 4.200% | 5/19/32 | BBB | 350,570 | |
| 240 | Visa Inc | 2.050% | 4/15/30 | AA- | 249,594 | |
| 189 | Visa Inc | 4.150% | 12/14/35 | AA- | 235,965 | |
| 135 | VMware Inc | 2.950% | 8/21/22 | BBB- | 138,254 | |
| 100 | VMware Inc, (WI/DD) | 1.400% | 8/15/26 | BBB- | 100,319 | |
| 20 | Vodafone Group PLC | 2.500% | 9/26/22 | BBB | 20,497 | |
| 30 | Vodafone Group PLC | 2.950% | 2/19/23 | BBB | 31,190 | |
| 10 | Vodafone Group PLC | 4.125% | 5/30/25 | BBB | 11,180 | |
| 233 | Vodafone Group PLC | 6.150% | 2/27/37 | BBB | 325,713 | |
| 80 | Vodafone Group PLC | 5.250% | 5/30/48 | BBB | 106,426 | |
| 200 | Walgreens Boots Alliance Inc, (3) | 3.200% | 4/15/30 | BBB | 217,197 | |
| 40 | Walt Disney Co | 2.650% | 1/13/31 | A- | 42,570 | |
| 130 | Walt Disney Co | 6.400% | 12/15/35 | A- | 192,893 | |
| 60 | Walt Disney Co | 4.950% | 10/15/45 | A- | 82,184 | |
| 270 | Walt Disney Co | 2.750% | 9/01/49 | A- | 268,370 | |
| 50 | Waste Connections Inc | 3.500% | 5/01/29 | BBB+ | 55,779 | |
| 60 | Waste Management Inc | 3.150% | 11/15/27 | BBB+ | 66,182 | |
| 30 | Waste Management Inc | 1.150% | 3/15/28 | BBB+ | 29,449 | |
| 100 | Waste Management Inc | 2.000% | 6/01/29 | BBB+ | 102,660 | |
| 10 | Waste Management Inc | 1.500% | 3/15/31 | BBB+ | 9,665 | |
| 40 | Western Union Co | 2.850% | 1/10/25 | BBB | 42,425 | |
| 10 | Western Union Co | 6.200% | 11/17/36 | BBB | 12,671 | |
| 120 | WRKCo Inc | 4.000% | 3/15/28 | BBB | 136,223 | |
| 50 | WW Grainger Inc | 1.850% | 2/15/25 | A+ | 51,890 | |
| 10 | Xylem Inc/NY | 2.250% | 1/30/31 | BBB | 10,238 | |
| 10 | Zoetis Inc | 3.250% | 2/01/23 | BBB+ | 10,355 | |
| 10 | Zoetis Inc | 4.500% | 11/13/25 | BBB+ | 11,394 | |
| 126 | Zoetis Inc | 3.900% | 8/20/28 | BBB+ | 144,971 | |
| 9 | Zoetis Inc | 2.000% | 5/15/30 | BBB+ | 9,110 | |
| 37,670 | Total Industrial | 42,762,451 | ||||
| Utility – 2.3% | ||||||
| 10 | AEP Texas Inc | 2.400% | 10/01/22 | BBB+ | 10,234 | |
| 30 | Alabama Power Co | 1.450% | 9/15/30 | A+ | 29,184 | |
| 111 | Alabama Power Co | 6.000% | 3/01/39 | A+ | 161,285 |
| Principal Amount (000) | Description (1) | Coupon | Maturity | Ratings (2) | Value | |
| Utility (continued) | ||||||
| $ 100 | American Water Capital Corp | 2.800% | 5/01/30 | A | $108,328 | |
| 100 | American Water Capital Corp | 2.300% | 6/01/31 | A | 103,496 | |
| 200 | Appalachian Power Co | 4.400% | 5/15/44 | A- | 243,836 | |
| 100 | Arizona Public Service Co | 3.350% | 5/15/50 | A | 109,943 | |
| 300 | Berkshire Hathaway Energy Co | 5.150% | 11/15/43 | A- | 403,325 | |
| 100 | CenterPoint Energy Inc | 1.450% | 6/01/26 | BBB | 101,134 | |
| 90 | CenterPoint Energy Resources Corp | 4.100% | 9/01/47 | A- | 107,378 | |
| 121 | Commonwealth Edison Co | 6.450% | 1/15/38 | A | 180,667 | |
| 100 | Connecticut Light and Power Co | 2.050% | 7/01/31 | A+ | 102,627 | |
| 100 | Consolidated Edison Co of New York Inc | 2.400% | 6/15/31 | A- | 103,582 | |
| 124 | Consolidated Edison Co of New York Inc | 5.500% | 12/01/39 | A- | 168,309 | |
| 10 | Consolidated Edison Co of New York Inc | 4.300% | 12/01/56 | A- | 12,210 | |
| 10 | Consolidated Edison Co of New York Inc | 4.500% | 5/15/58 | A- | 12,588 | |
| 10 | Consumers Energy Co | 0.350% | 6/01/23 | A+ | 10,003 | |
| 90 | Consumers Energy Co | 3.500% | 8/01/51 | A+ | 104,632 | |
| 30 | Dominion Energy Inc | 1.450% | 4/15/26 | BBB | 30,285 | |
| 10 | DTE Electric Co | 2.625% | 3/01/31 | A+ | 10,722 | |
| 126 | DTE Energy Co | 2.950% | 3/01/30 | BBB | 135,402 | |
| 100 | Duke Energy Carolinas LLC | 2.450% | 2/01/30 | AA- | 105,036 | |
| 100 | Duke Energy Carolinas LLC | 2.550% | 4/15/31 | AA- | 105,592 | |
| 60 | Duke Energy Carolinas LLC | 4.250% | 12/15/41 | AA- | 74,191 | |
| 100 | Duke Energy Corp | 2.550% | 6/15/31 | BBB | 103,306 | |
| 100 | Duke Energy Corp | 4.800% | 12/15/45 | BBB | 126,469 | |
| 100 | Emera US Finance LP, 144A | 2.639% | 6/15/31 | BBB- | 102,324 | |
| 30 | Emera US Finance LP | 4.750% | 6/15/46 | BBB- | 36,351 | |
| 10 | Enel Generacion Chile SA | 4.250% | 4/15/24 | A- | 10,703 | |
| 157 | Entergy Louisiana LLC | 4.000% | 3/15/33 | A | 186,409 | |
| 100 | Essential Utilities Inc | 2.400% | 5/01/31 | A- | 103,114 | |
| 10 | Exelon Corp | 4.950% | 6/15/35 | BBB | 12,583 | |
| 191 | Florida Power & Light Co | 5.950% | 2/01/38 | AA- | 279,319 | |
| 48 | Interstate Power and Light Co | 3.600% | 4/01/29 | A- | 53,835 | |
| 100 | NextEra Energy Capital Holdings Inc | 1.900% | 6/15/28 | BBB+ | 102,072 | |
| 100 | NiSource Inc | 3.600% | 5/01/30 | BBB | 111,816 | |
| 117 | Northern States Power Co/MN | 6.200% | 7/01/37 | A+ | 172,469 | |
| 100 | OGE Energy Corp | 0.703% | 5/26/23 | BBB+ | 100,044 | |
| 100 | Piedmont Natural Gas Co Inc | 2.500% | 3/15/31 | A- | 103,044 | |
| 36 | Potomac Electric Power Co | 6.500% | 11/15/37 | A | 53,743 | |
| 50 | PPL Capital Funding Inc | 3.100% | 5/15/26 | BBB+ | 54,088 | |
| 18 | Public Service Co of Colorado | 6.500% | 8/01/38 | A+ | 27,406 | |
| 100 | Public Service Co of New Hampshire | 2.200% | 6/15/31 | A+ | 104,110 | |
| 10 | Public Service Electric and Gas Co | 2.450% | 1/15/30 | AA- | 10,569 |
| Principal Amount (000) | Description (1) | Coupon | Maturity | Ratings (2) | Value | |
| Utility (continued) | ||||||
| $ 100 | Public Service Electric and Gas Co | 5.800% | 5/01/37 | AA- | $142,380 | |
| 90 | Puget Sound Energy Inc | 5.638% | 4/15/41 | A | 128,392 | |
| 43 | San Diego Gas & Electric Co | 4.150% | 5/15/48 | A | 53,848 | |
| 104 | Sempra Energy | 6.000% | 10/15/39 | BBB | 148,041 | |
| 10 | Southern California Edison Co | 5.625% | 2/01/36 | A- | 12,818 | |
| 178 | Southern California Edison Co | 4.500% | 9/01/40 | A- | 207,530 | |
| 10 | Southern California Edison Co | 4.875% | 3/01/49 | A- | 11,998 | |
| 100 | Southern California Edison Co | 3.650% | 6/01/51 | A- | 101,938 | |
| 100 | Southern Co | 3.750% | 9/15/51 | BBB- | 102,040 | |
| 30 | Tucson Electric Power Co | 3.250% | 5/01/51 | A- | 32,106 | |
| 50 | Union Electric Co | 2.150% | 3/15/32 | A | 51,032 | |
| 60 | Union Electric Co | 5.300% | 8/01/37 | A | 78,585 | |
| 222 | Virginia Electric and Power Co | 6.000% | 5/15/37 | A | 312,748 | |
| 100 | Wisconsin Electric Power Co | 1.700% | 6/15/28 | A | 101,468 | |
| 48 | Wisconsin Public Service Corp | 3.671% | 12/01/42 | A | 55,655 | |
| 4,954 | Total Utility | 5,928,342 | ||||
| $ 62,921 | Total Corporate Debt (cost $68,751,367) | 70,909,936 |
| Principal Amount (000) | Description (1) | Coupon | Maturity | Ratings (2) | Value | |
| GOVERNMENT RELATED – 5.7% | ||||||
| Government Agency – 2.4% | ||||||
| $ 10 | Equinor ASA | 3.250% | 11/10/24 | AA | $10,811 | |
| 10 | Equinor ASA | 3.000% | 4/06/27 | AA | 10,925 | |
| 10 | Equinor ASA | 3.625% | 9/10/28 | AA | 11,360 | |
| 214 | Equinor ASA | 3.125% | 4/06/30 | AA | 236,617 | |
| 10 | Equinor ASA | 3.950% | 5/15/43 | AA | 11,852 | |
| 10 | Equinor ASA | 3.700% | 4/06/50 | AA | 11,760 | |
| 120 | Export Development Canada | 2.500% | 1/24/23 | AAA | 124,108 | |
| 390 | Federal Home Loan Banks | 2.375% | 9/08/23 | AAA | 407,661 | |
| 440 | Federal Home Loan Banks | 2.500% | 2/13/24 | AAA | 465,736 | |
| 240 | Federal Home Loan Banks | 2.875% | 6/14/24 | AAA | 257,152 | |
| 100 | Federal National Mortgage Association | 0.300% | 8/03/23 | Aaa | 100,263 | |
| 81 | Federal National Mortgage Association | 2.625% | 9/06/24 | Aaa | 86,751 | |
| 70 | Federal National Mortgage Association | 1.625% | 1/07/25 | Aaa | 72,876 | |
| 200 | Federal National Mortgage Association | 0.625% | 4/22/25 | Aaa | 200,890 | |
| 200 | Federal National Mortgage Association | 0.500% | 6/17/25 | Aaa | 199,680 | |
| 200 | Federal National Mortgage Association | 1.875% | 9/24/26 | Aaa | 211,453 | |
| 529 | Federal National Mortgage Association | 5.625% | 7/15/37 | Aaa | 817,930 | |
| 100 | Israel Government AID Bond | 5.500% | 12/04/23 | AAA | 111,401 |
| Principal Amount (000) | Description (1) | Coupon | Maturity | Ratings (2) | Value | |
| Government Agency (continued) | ||||||
| $ 10 | Israel Government AID Bond | 5.500% | 9/18/33 | AAA | $14,382 | |
| 200 | Japan Bank for International Cooperation | 1.750% | 10/17/24 | A+ | 207,362 | |
| 99 | Japan Bank for International Cooperation | 2.500% | 5/28/25 | A+ | 105,622 | |
| 200 | Japan Bank for International Cooperation | 0.625% | 7/15/25 | A+ | 198,640 | |
| 180 | Japan Bank for International Cooperation | 2.875% | 6/01/27 | A+ | 198,112 | |
| 10 | Korea Development Bank | 2.750% | 3/19/23 | AA | 10,366 | |
| 100 | Korea Development Bank | 2.125% | 10/01/24 | AA | 104,919 | |
| 310 | Kreditanstalt fuer Wiederaufbau | 2.375% | 12/29/22 | AAA | 319,737 | |
| 774 | Kreditanstalt fuer Wiederaufbau | 2.500% | 11/20/24 | AAA | 825,458 | |
| 9 | Kreditanstalt fuer Wiederaufbau | 0.375% | 7/18/25 | AAA | 8,920 | |
| 10 | Landwirtschaftliche Rentenbank | 3.125% | 11/14/23 | AAA | 10,637 | |
| 50 | Landwirtschaftliche Rentenbank | 2.000% | 1/13/25 | AAA | 52,522 | |
| 150 | Landwirtschaftliche Rentenbank | 0.500% | 5/27/25 | AAA | 149,538 | |
| 109 | Oesterreichische Kontrollbank AG | 3.125% | 11/07/23 | AA+ | 115,936 | |
| 200 | Svensk Exportkredit AB | 1.750% | 12/12/23 | AA+ | 206,564 | |
| 61 | Tennessee Valley Authority | 4.700% | 7/15/33 | AAA | 81,660 | |
| 170 | Tennessee Valley Authority | 5.500% | 6/15/38 | AAA | 251,281 | |
| 16 | Tennessee Valley Authority | 5.250% | 9/15/39 | AAA | 23,424 | |
| 5,592 | Total Government Agency | 6,234,306 | ||||
| Municipal Bonds – 2.4% (4) | ||||||
| 150 | African Development Bank (No Optional Call) | 3.000% | 9/20/23 | AAA | 158,654 | |
| 100 | African Development Bank (No Optional Call) | 0.875% | 7/22/26 | AAA | 100,435 | |
| 229 | Asian Development Bank (No Optional Call) | 2.750% | 3/17/23 | AAA | 238,541 | |
| 9 | Asian Development Bank (No Optional Call) | 0.250% | 7/14/23 | AAA | 8,999 | |
| 400 | Asian Development Bank (No Optional Call) | 1.500% | 10/18/24 | AAA | 413,160 | |
| 20 | Council Of Europe Development Bank (No Optional Call) | 1.375% | 2/27/25 | AA+ | 20,585 | |
| 100 | European Bank for Reconstruction & Development (No Optional Call) | 2.750% | 3/07/23 | AAA | 104,071 | |
| 170 | European Investment Bank (No Optional Call) | 1.375% | 5/15/23 | AAA | 173,545 | |
| 250 | European Investment Bank (No Optional Call) | 2.875% | 8/15/23 | Aaa | 263,439 | |
| 289 | European Investment Bank (No Optional Call) | 3.125% | 12/14/23 | Aaa | 308,123 | |
| 90 | European Investment Bank (No Optional Call) | 2.250% | 6/24/24 | AAA | 94,851 | |
| 150 | Inter-American Development Bank (No Optional Call) | 2.000% | 7/23/26 | AAA | 158,855 | |
| 100 | Inter-American Development Bank (No Optional Call) | 1.125% | 7/20/28 | AAA | 100,268 | |
| 340 | Inter-American Development Bank (No Optional Call) | 3.875% | 10/28/41 | Aaa | 446,651 | |
| 99 | International Bank for Reconstruction & Development (No Optional Call) | 7.625% | 1/19/23 | AAA | 109,767 | |
| 100 | International Bank for Reconstruction & Development (No Optional Call) | 2.500% | 3/19/24 | AAA | 105,620 | |
| 535 | International Bank for Reconstruction & Development (No Optional Call) | 1.500% | 8/28/24 | AAA | 552,436 | |
| 100 | International Bank for Reconstruction & Development (No Optional Call) | 2.125% | 3/03/25 | Aaa | 105,578 | |
| 60 | International Bank for Reconstruction & Development (No Optional Call) | 3.125% | 11/20/25 | AAA | 66,317 | |
| 110 | International Finance Corp (No Optional Call) | 0.375% | 7/16/25 | AAA | 108,974 |
| Principal Amount (000) | Description (1) | Coupon | Maturity | Ratings (2) | Value | |
| Municipal Bonds (4) (continued) | ||||||
| $ 20 | International Finance Corp (No Optional Call) | 2.125% | 4/07/26 | AAA | $21,320 | |
| 200 | Nordic Investment Bank (No Optional Call) | 2.250% | 5/21/24 | AAA | 210,401 | |
| 9 | Province of Alberta Canada (No Optional Call) | 2.200% | 7/26/22 | Aa3 | 9,180 | |
| 250 | Province of Alberta Canada (No Optional Call), (3) | 1.000% | 5/20/25 | AA- | 252,982 | |
| 150 | Province of Alberta Canada (No Optional Call) | 3.300% | 3/15/28 | Aa3 | 169,876 | |
| 40 | Province of Alberta Canada (No Optional Call) | 1.300% | 7/22/30 | AA- | 39,106 | |
| 59 | Province of British Columbia Canada (No Optional Call) | 2.000% | 10/23/22 | AAA | 60,301 | |
| 100 | Province of British Columbia Canada (No Optional Call) | 1.750% | 9/27/24 | AA+ | 103,963 | |
| 50 | Province of British Columbia Canada (No Optional Call) | 2.250% | 6/02/26 | AAA | 53,449 | |
| 100 | Province of British Columbia Canada (No Optional Call) | 0.900% | 7/20/26 | AAA | 100,589 | |
| 9 | Province of Manitoba Canada (No Optional Call) | 2.125% | 5/04/22 | AA | 9,135 | |
| 10 | Province of Manitoba Canada (No Optional Call) | 2.100% | 9/06/22 | AA | 10,203 | |
| 100 | Province of Manitoba Canada (No Optional Call) | 2.600% | 4/16/24 | AA | 105,772 | |
| 70 | Province of New Brunswick Canada (No Optional Call) | 3.625% | 2/24/28 | AA | 81,042 | |
| 30 | Province of Ontario Canada (No Optional Call) | 2.550% | 4/25/22 | AA- | 30,516 | |
| 50 | Province of Ontario Canada (No Optional Call) | 2.250% | 5/18/22 | AA- | 50,840 | |
| 50 | Province of Ontario Canada (No Optional Call) | 2.200% | 10/03/22 | AA- | 51,190 | |
| 516 | Province of Ontario Canada (No Optional Call) | 1.750% | 1/24/23 | AA- | 527,672 | |
| 10 | Province of Ontario Canada (No Optional Call) | 3.400% | 10/17/23 | AA- | 10,671 | |
| 60 | Province of Ontario Canada (No Optional Call) | 3.200% | 5/16/24 | AA- | 64,601 | |
| 200 | Province of Ontario Canada (No Optional Call) | 2.500% | 4/27/26 | AA- | 215,440 | |
| 20 | Province of Quebec Canada (No Optional Call) | 2.625% | 2/13/23 | AA- | 20,743 | |
| 9 | Province of Quebec Canada (No Optional Call) | 2.875% | 10/16/24 | AA- | 9,666 | |
| 180 | Province of Quebec Canada (No Optional Call) | 1.500% | 2/11/25 | AA- | 185,900 | |
| 50 | Province of Quebec Canada (No Optional Call) | 0.600% | 7/23/25 | AA- | 49,799 | |
| 295 | Province of Quebec Canada (No Optional Call) | 2.500% | 4/20/26 | AA- | 318,736 | |
| 70 | Province of Quebec Canada (No Optional Call) | 2.750% | 4/12/27 | AA- | 76,897 | |
| 6,108 | Total Municipal Bonds | 6,478,859 | ||||
| Sovereign Debt – 0.9% | ||||||
| 10 | Canada Government International Bond | 2.000% | 11/15/22 | AAA | 10,244 | |
| 100 | Canada Government International Bond | 1.625% | 1/22/25 | AAA | 103,943 | |
| 210 | Chile Government International Bond | 2.450% | 1/31/31 | A | 214,064 | |
| 200 | Chile Government International Bond | 2.550% | 1/27/32 | A | 204,920 | |
| 130 | Hungary Government International Bond | 5.750% | 11/22/23 | BBB | 145,532 | |
| 14 | Hungary Government International Bond | 7.625% | 3/29/41 | BBB | 23,553 | |
| 240 | Israel Government International Bond | 2.750% | 7/03/30 | A+ | 258,276 | |
| 80 | Korea International Bond | 2.750% | 1/19/27 | AA | 87,010 | |
| 10 | Korea International Bond | 2.500% | 6/19/29 | Aa2 | 10,796 | |
| 20 | Korea International Bond | 1.000% | 9/16/30 | AA | 19,269 | |
| 10 | Panama Government International Bond | 3.750% | 3/16/25 | BBB | 10,868 |
| Principal Amount (000) | Description (1) | Coupon | Maturity | Ratings (2) | Value | |
| Sovereign Debt (continued) | ||||||
| $ 20 | Panama Government International Bond | 3.160% | 1/23/30 | BBB | $21,000 | |
| 250 | Panama Government International Bond | 4.500% | 5/15/47 | BBB | 284,707 | |
| 70 | Panama Government International Bond | 4.500% | 4/16/50 | BBB | 79,653 | |
| 30 | Peruvian Government International Bond | 4.125% | 8/25/27 | BBB+ | 33,283 | |
| 180 | Peruvian Government International Bond | 2.844% | 6/20/30 | BBB+ | 183,692 | |
| 96 | Peruvian Government International Bond | 5.625% | 11/18/50 | BBB+ | 129,860 | |
| 100 | Republic of Italy Government International Bond | 1.250% | 2/17/26 | N/R | 99,603 | |
| 150 | Republic of Italy Government International Bond | 2.875% | 10/17/29 | N/R | 159,174 | |
| 112 | Uruguay Government International Bond | 4.375% | 1/23/31 | BBB | 130,891 | |
| 200 | Uruguay Government International Bond | 4.125% | 11/20/45 | BBB | 234,840 | |
| 2,232 | Total Sovereign Debt | 2,445,178 | ||||
| $ 13,932 | Total Government Related (cost $14,939,924) | 15,158,343 | ||||
| Total Long-Term Investments (cost $257,168,395) | 260,794,170 |
| Shares | Description (1) | Coupon | Value | |||
| INVESTMENTS PURCHASED WITH COLLATERAL FROM SECURITIES LENDING – 0.5% | ||||||
| MONEY MARKET FUNDS – 0.5% | ||||||
| 1,349,362 | State Street Navigator Securities Lending Government Money Market Portfolio, (5) | 0.050% (6) | $ 1,349,362 | |||
| Total Investments Purchased with Collateral from Securities Lending (cost $1,349,362) | 1,349,362 | |||||
| Principal Amount (000) | Description (1) | Coupon | Maturity | Ratings (2) | Value | |
| SHORT-TERM INVESTMENTS – 0.7% | ||||||
| U.S. GOVERNMENT AND AGENCY OBLIGATIONS – 0.7% | ||||||
| $ 1,829 | Federal Agricultural Mortgage Corp Discount Notes | 0.000% | 8/02/21 | N/R | $ 1,829,000 | |
| $ 1,829 | Total Short-Term Investments (cost $1,829,000) | 1,829,000 | ||||
| Total Investments (cost $260,346,757) – 100.4% | 263,972,532 | |||||
| Other Assets Less Liabilities – (0.4)% | (1,088,536) | |||||
| Net Assets – 100% | $ 262,883,996 |
| For Fund portfolio compliance purposes, the Fund’s industry classifications refer to any one or more of the industry sub-classifications used by one or more widely recognized market indexes or ratings group indexes, and/or as defined by Fund management. This definition may not apply for purposes of this report, which may combine industry sub-classifications into sectors for reporting ease. | ||
| (1) | All percentages shown in the Portfolio of Investments are based on net assets. | |
| (2) | The Fund uses credit quality ratings for its portfolio securities provided by Moody's, S&P and Fitch. If all three of Moody's, S&P, and Fitch provide a rating for a security, the middle is used; if two of the three agencies rate a security, the lower rating is used; and if only one rating agency rates a security, that rating is used. AAA, AA, A, and BBB are investment grade ratings; BB, B, CCC/CC/C and D are below-investment grade ratings. Credit ratings are subject to change. Holdings designated N/R are not rated by Moody's, S&P or Fitch. Ratings are not covered by the report of independent registered public accounting firm. | |
| (3) | Investment, or a portion of investment, is out on loan for securities lending. The total value of the securities out on loan as of the end of the reporting period was $1,323,236. | |
| (4) | Optional Call Provisions: Dates (month and year) and prices of the earliest optional call or redemption. There may be other call provisions at varying prices at later dates. Certain mortgage-backed securities may be subject to periodic principal paydowns. Optional Call Provisions are not covered by the report of independent registered public accounting firm. | |
| (5) | The Fund may loan securities representing up to one third of the market value of its total assets (which includes collateral for securities on loan) to broker dealers, banks, and other institutions. The collateral maintained by the Fund shall have a market value, at the inception of each loan, equal to not less than 100% of the market value of the loaned securities. The cash collateral received by the Fund is invested in this money market fund. | |
| (6) | The rate shown is the one-day yield as of the end of the reporting period. | |
| 144A | Investment is exempt from registration under Rule 144A of the Securities Act of 1933, as amended. These investments may only be resold in transactions exempt from registration, which are normally those transactions with qualified institutional buyers. | |
| DD1 | Portion of investment purchased on a delayed delivery basis. | |
| WI/DD | Purchased on a when-issued or delayed delivery basis. |
| NUAG | NUSA | NUHY | NUBD | |
| Assets | ||||
| Long-term investments, at value (cost $171,835,738, $39,557,678, $93,005,487 and $257,168,395, respectively)(1) | $172,427,062 | $40,129,110 | $94,190,613 | $260,794,170 |
| Investment purchased with collateral from securities lending, at value (cost approximates value) | 1,604,714 | 277,750 | 1,871,599 | 1,349,362 |
| Short-term investments, at value (cost approximates value) | 43,850,497 | 727,000 | 192,000 | 1,829,000 |
| Cash | — | — | 159,557 | 4,531 |
| Receivable for: | ||||
| Interest | 672,120 | 188,207 | 1,320,304 | 1,275,330 |
| Investments sold | 2,103,633 | 601,515 | 1,466,514 | 3,660,781 |
| Securities lending income | 101 | 31 | 1,134 | 532 |
| Total assets | 220,658,127 | 41,923,613 | 99,201,721 | 268,913,706 |
| Liabilities | ||||
| Cash overdraft | 192,778 | 179 | — | — |
| Payable for: | ||||
| Collateral from securities lending program | 1,604,714 | 277,750 | 1,871,599 | 1,349,362 |
| Investments purchased - regular settlement | 2,400,070 | 770,793 | 918,668 | 3,441,130 |
| Investments purchased - when-issued/delayed-delivery settlement | 42,764,650 | 411,206 | — | 1,189,948 |
| Accrued expenses: | ||||
| Management fees | 17,538 | 7,080 | 28,113 | 45,661 |
| Professional fees | 1,012 | 236 | 548 | 1,532 |
| Trustees fees | 891 | 336 | 726 | 2,077 |
| Other | — | — | 4,020 | — |
| Total liabilities | 46,981,653 | 1,467,580 | 2,823,674 | 6,029,710 |
| Net assets | $173,676,474 | $40,456,033 | $96,378,047 | $262,883,996 |
| Shares outstanding | 6,900,000 | 1,600,000 | 3,900,000 | 10,000,000 |
| Net asset value ("NAV") per share | $ 25.17 | $ 25.29 | $ 24.71 | $ 26.29 |
| Net assets consist of: | ||||
| Capital paid-in | $179,619,875 | $40,279,677 | $96,678,730 | $260,157,731 |
| Total distributable earnings | (5,943,401) | 176,356 | (300,683) | 2,726,265 |
| Net assets | $173,676,474 | $40,456,033 | $96,378,047 | $262,883,996 |
| Authorized shares | Unlimited | Unlimited | Unlimited | Unlimited |
| Par value per share | $ 0.01 | $ 0.01 | $ 0.01 | $ 0.01 |
| (1) | Includes securities loaned of $1,571,525, $271,949, $1,796,839 and $1,323,236 for NUAG, NUSA, NUHY and NUBD, respectively. |
| NUAG | NUSA | NUHY | NUBD | |
| Investment Income | ||||
| Interest | $ 2,296,205 | $ 618,603 | $3,333,402 | $ 3,853,537 |
| Securities lending income, net | 270 | 116 | 3,083 | 1,219 |
| Total investment income | 2,296,475 | 618,719 | 3,336,485 | 3,854,756 |
| Expenses | ||||
| Management fees | 301,373 | 80,211 | 259,579 | 405,854 |
| Professional fees | 3,290 | 845 | 1,564 | 4,237 |
| Trustees fees | 3,664 | 1,127 | 2,068 | 5,629 |
| Total expenses | 308,327 | 82,183 | 263,211 | 415,720 |
| Net investment income (loss) | 1,988,148 | 536,536 | 3,073,274 | 3,439,036 |
| Realized and Unrealized Gain (Loss) | ||||
| Net realized gain (loss) from: | ||||
| Investments | (4,541,233) | 249,401 | 939,045 | 66,689 |
| In-kind redemptions | (1,887,230) | 86,177 | — | — |
| Change in net unrealized appreciation (depreciation) of investments | (2,099,133) | (449,139) | 445,273 | (5,397,079) |
| Net realized and unrealized gain (loss) | (8,527,596) | (113,561) | 1,384,318 | (5,330,390) |
| Net increase (decrease) in net assets from operations | $(6,539,448) | $ 422,975 | $4,457,592 | $(1,891,354) |
| NUAG | NUSA | NUHY | NUBD | ||||||||
| Year Ended 7/31/21 | Year Ended 7/31/20 | Year Ended 7/31/21 | Year Ended 7/31/20 | Year Ended 7/31/21 | For the Period 9/25/19 (commencement of operations) through 7/31/20 | Year Ended 7/31/21 | Year Ended 7/31/20 | ||||
| Operations | |||||||||||
| Net investment income (loss) | $ 1,988,148 | $ 2,851,689 | $ 536,536 | $ 716,658 | $ 3,073,274 | $ 1,730,589 | $ 3,439,036 | $ 1,930,718 | |||
| Net realized gain (loss) from: | |||||||||||
| Investments | (4,541,233) | 1,175,963 | 249,401 | 217,770 | 939,045 | (1,796,697) | 66,689 | 92,664 | |||
| In-kind redemptions | (1,887,230) | (940,002) | 86,177 | 261,126 | — | — | — | 171,532 | |||
| Change in net unrealized appreciation (depreciation) of investments | (2,099,133) | 578,463 | (449,139) | 629,947 | 445,273 | 739,853 | (5,397,079) | 7,704,023 | |||
| Net increase (decrease) in net assets from operations | (6,539,448) | 3,666,113 | 422,975 | 1,825,501 | 4,457,592 | 673,745 | (1,891,354) | 9,898,937 | |||
| Distributions to Shareholders | |||||||||||
| Dividends | (3,233,360) | (3,772,060) | (923,780) | (894,030) | (3,626,280) | (1,805,740) | (4,115,730) | (2,152,900) | |||
| Decrease in net assets from distributions to shareholders | (3,233,360) | (3,772,060) | (923,780) | (894,030) | (3,626,280) | (1,805,740) | (4,115,730) | (2,152,900) | |||
| Fund Share Transactions | |||||||||||
| Proceeds from shares sold | 576,413,221 | 439,401,562 | 7,650,840 | 22,618,439 | 39,351,360 | 57,327,420 | 121,402,100 | 89,150,650 | |||
| Cost of shares redeemed | (473,809,350) | (429,469,590) | (2,547,690) | (15,045,450) | — | (50) | — | (5,194,200) | |||
| Net increase (decrease) in net assets from Fund share transactions | 102,603,871 | 9,931,972 | 5,103,150 | 7,572,989 | 39,351,360 | 57,327,370 | 121,402,100 | 83,956,450 | |||
| Net increase (decrease) in net assets | 92,831,063 | 9,826,025 | 4,602,345 | 8,504,460 | 40,182,672 | 56,195,375 | 115,395,016 | 91,702,487 | |||
| Net assets at the beginning of period | 80,845,411 | 71,019,386 | 35,853,688 | 27,349,228 | 56,195,375 | — | 147,488,980 | 55,786,493 | |||
| Net assets at the end of period | $ 173,676,474 | $ 80,845,411 | $40,456,033 | $ 35,853,688 | $96,378,047 | $56,195,375 | $262,883,996 | $147,488,980 | |||
| Investment Operations | Less Distributions | |||||||||
| Year Ended July 31, | Beginning NAV | Net Investment Income (Loss)(a) | Net Realized/ Unrealized Gain (Loss) | Total | From Net Investment Income | From Accumulated Net Realized Gains | Total | Ending NAV | Ending Market Price | |
| NUAG | ||||||||||
| 2021 | $26.08 | $0.33 | $(0.55) | $(0.22) | $(0.69) | $ — | $(0.69) | $25.17 | $25.18 | |
| 2020 | 24.49 | 0.55 | 1.88 | 2.43 | (0.84) | — | (0.84) | 26.08 | 26.05 | |
| 2019 | 23.49 | 0.75 | 1.09 | 1.84 | (0.84) | — | (0.84) | 24.49 | 24.44 | |
| 2018 | 24.61 | 0.67 | (0.91) | (0.24) | (0.88) | — | (0.88) | 23.49 | 23.50 | |
| 2017(d) | 25.00 | 0.57 | (0.40) | 0.17 | (0.56) | —** | (0.56) | 24.61 | 24.67 | |
| NUSA | ||||||||||
| 2021 | 25.61 | 0.34 | (0.08) | 0.26 | (0.58) | — | (0.58) | 25.29 | 25.31 | |
| 2020 | 24.86 | 0.55 | 0.90 | 1.45 | (0.70) | — | (0.70) | 25.61 | 25.69 | |
| 2019 | 24.30 | 0.62 | 0.65 | 1.27 | (0.71) | — | (0.71) | 24.86 | 24.89 | |
| 2018 | 25.11 | 0.55 | (0.64) | (0.09) | (0.72) | — | (0.72) | 24.30 | 24.33 | |
| 2017(e) | 25.00 | 0.23 | 0.04 | 0.27 | (0.16) | — | (0.16) | 25.11 | 25.15 | |
| NUHY | ||||||||||
| 2021 | 24.43 | 1.04 | 0.47 | 1.51 | (1.23) | — | (1.23) | 24.71 | 24.78 | |
| 2020(f) | 25.00 | 0.93 | (0.53) | 0.40 | (0.97) | — | (0.97) | 24.43 | 24.74 | |
| NUBD | ||||||||||
| 2021 | 27.31 | 0.45 | (0.92) | (0.47) | (0.55) | — | (0.55) | 26.29 | 26.30 | |
| 2020 | 25.36 | 0.55 | 2.04 | 2.59 | (0.64) | — | (0.64) | 27.31 | 27.37 | |
| 2019 | 24.17 | 0.63 | 1.24 | 1.87 | (0.68) | — | (0.68) | 25.36 | 25.38 | |
| 2018(g) | 25.00 | 0.48 | (0.82) | (0.34) | (0.49) | — | (0.49) | 24.17 | 24.20 | |
| Ratios/Supplemental Data | |||||
| Total Return | Ratios to Average Net Assets | ||||
| Based on NAV(b) | Based on Market Price(b) | Ending Net Assets (000) | Expenses | Net Investment Income (Loss) | Portfolio Turnover Rate(c) |
| (0.81) % | (0.64) % | $173,676 | 0.20% | 1.32% | 235% |
| 10.11 | 10.19 | 80,845 | 0.20 | 2.21 | 208 |
| 8.03 | 7.77 | 71,019 | 0.20 | 3.17 | 167 |
| (1.00) | (1.21) | 147,959 | 0.20 | 2.79 | 123 |
| 0.74 | 1.00 | 54,135 | 0.20* | 2.67* | 84 |
| 1.03 | 0.80 | 40,456 | 0.20 | 1.33 | 46 |
| 5.93 | 6.15 | 35,854 | 0.20 | 2.20 | 51 |
| 5.37 | 5.31 | 27,349 | 0.20 | 2.54 | 36 |
| (0.37) | (0.39) | 26,727 | 0.20 | 2.22 | 37 |
| 1.10 | 1.26 | 30,132 | 0.20* | 2.74* | 4 |
| 6.32 | 5.25 | 96,378 | 0.35 | 4.14 | 65 |
| 1.79 | 3.02 | 56,195 | 0.35* | 4.55* | 47 |
| (1.72) | (1.90) | 262,884 | 0.20 | 1.69 | 33 |
| 10.38 | 10.51 | 147,489 | 0.20 | 2.07 | 18 |
| 7.89 | 7.84 | 55,786 | 0.20 | 2.59 | 27 |
| (1.37) | (1.25) | 41,088 | 0.20* | 2.31* | 17 |
| (a) | Per share Net Investment Income (Loss) is calculated using the average daily shares method. |
| (b) | Total Return Based on NAV reflects the change in NAV over the period, including the assumed reinvestment of distributions, if any, at NAV on each ex-dividend payment date during the period. Total Return Based on Market Price reflects the change in the market price per share over the period, including the assumed reinvestment of distributions, if any, at the ending market price per share on each ex-dividend payment date during the period. Total returns are not annualized. |
| (c) | Portfolio Turnover Rate is calculated based on the lesser of long-term purchases or sales (as disclosed in Note 4 - Investment Transactions) divided by the average long-term market value during the period. Portfolio Turnover Rate excludes securities received or delivered as a result of processing in-kind creations or redemptions of Fund shares (as disclosed in Note 5 - Fund Shares). |
| (d) | For the period September 14, 2016 (commencement of operations) through July 31, 2017. |
| (e) | For the period March 31, 2017 (commencement of operations) through July 31, 2017. |
| (f) | For the period September 25, 2019 (commencement of operations) through January 31, 2020. |
| (g) | For the period September 29, 2017 (commencement of operations) through July 31, 2018. |
| * | Annualized. |
| ** | Rounds to less than $.01 per share. |
| NUAG | Level 1 | Level 2 | Level 3 | Total |
| Long-Term Investments: | ||||
| Securitized | $ — | $ 67,056,467 | $ — | $ 67,056,467 |
| U.S. Treasury | — | 51,590,751 | — | 51,590,751 |
| Corporate Debt | — | 43,209,954 | — | 43,209,954 |
| Government Related | — | 10,569,890 | — | 10,569,890 |
| Investments Purchased with Collateral from Securities Lending | 1,604,714 | — | — | 1,604,714 |
| Short-Term Investments: | ||||
| U.S. Government and Agency Obligations | — | 43,850,497 | — | 43,850,497 |
| Total | $1,604,714 | $216,277,559 | $ — | $217,882,273 |
| NUSA | Level 1 | Level 2 | Level 3 | Total |
| Long-Term Investments: | ||||
| Corporate Debt | $ — | $17,384,755 | $ — | $17,384,755 |
| Securitized | — | 12,153,973 | — | 12,153,973 |
| U.S. Treasury | — | 10,590,382 | — | 10,590,382 |
| Investments Purchased with Collateral from Securities Lending | 277,750 | — | — | 277,750 |
| Short-Term Investments: | ||||
| U.S. Government and Agency Obligations | — | 727,000 | — | 727,000 |
| Total | $277,750 | $40,856,110 | $ — | $41,133,860 |
| NUHY | Level 1 | Level 2 | Level 3 | Total |
| Long-Term Investments: | ||||
| Corporate Debt | $ — | $94,190,613 | $ — | $94,190,613 |
| Investments Purchased with Collateral from Securities Lending | 1,871,599 | — | — | 1,871,599 |
| Short-Term Investments: | ||||
| U.S. Government and Agency Obligations | — | 192,000 | — | 192,000 |
| Total | $1,871,599 | $94,382,613 | $ — | $96,254,212 |
| NUBD | Level 1 | Level 2 | Level 3 | Total |
| Long-Term Investments: | ||||
| U.S. Treasury | $ — | $ 96,460,616 | $ — | $ 96,460,616 |
| Securitized | — | 78,265,275 | — | 78,265,275 |
| Corporate Debt | — | 70,909,936 | — | 70,909,936 |
| Government Related | — | 15,158,343 | — | 15,158,343 |
| Investments Purchased with Collateral from Securities Lending | 1,349,362 | — | — | 1,349,362 |
| Short-Term Investments: | ||||
| U.S. Government and Agency Obligations | — | 1,829,000 | — | 1,829,000 |
| Total | $1,349,362 | $262,623,170 | $ — | $263,972,532 |
| Fund | Asset Class out on Loan | Long-Term Investments, at Value | Total Collateral Received |
| NUAG | Corporate Debt | $ 448,892 | $ 458,901 |
| Government Related | 223,266 | 227,813 | |
| U.S. Treasury | 899,367 | 918,000 | |
| Total | $1,571,525 | $1,604,714 | |
| NUSA | Corporate Debt | $ 271,949 | $ 277,750 |
| NUHY | Corporate Debt | $1,796,839 | $1,871,599 |
| NUBD | Corporate Debt | $1,133,642 | $1,155,817 |
| Municipal Bonds | 189,594 | 193,545 | |
| Total | $1,323,236 | $1,349,362 |
| NUAG | NUSA | NUHY | NUBD | |
| Purchases: | ||||
| Investment securities | $336,115,125 | $17,880,458 | $47,634,058 | $101,132,408 |
| U.S. Government and agency obligations | 84,446,726 | 2,993,947 | — | 14,729,813 |
| Sales and maturities: | ||||
| Investment securities | 281,442,459 | 15,647,655 | 50,411,127 | 57,052,264 |
| U.S. Government and agency obligations | 53,669,109 | 2,659,441 | — | 9,688,504 |
| NUAG | NUSA | NUHY | NUBD | |
| In-kind purchases | $262,695,556 | $5,328,583 | $41,195,732 | $72,676,828 |
| In-kind sales | 243,036,013 | 2,645,939 | — | — |
| NUAG | NUSA | ||||||||||
| Year Ended 7/31/21 | Year Ended 7/31/20 | Year Ended 7/31/21 | Year Ended 7/31/20 | ||||||||
| Shares | Amount | Shares | Amount | Shares | Amount | Shares | Amount | ||||
| Shares sold | 22,600,000 | $ 576,413,221 | 17,500,000 | $ 439,401,562 | 300,000 | $ 7,650,840 | 900,000 | $ 22,618,439 | |||
| Shares redeemed | (18,800,000) | (473,809,350) | (17,300,000) | (429,469,590) | (100,000) | (2,547,690) | (600,000) | (15,045,450) | |||
| Net increase (decrease) | 3,800,000 | $ 102,603,871 | 200,000 | $ 9,931,972 | 200,000 | $ 5,103,150 | 300,000 | $ 7,572,989 | |||
| NUHY | NUBD | ||||||||||
| Year Ended 7/31/21 | For the Period 9/25/19 (commencement of operations) through 7/31/20 | Year Ended 7/31/21 | Year Ended 7/31/20 | ||||||||
| Shares | Amount | Shares | Amount | Shares | Amount | Shares | Amount | ||||
| Shares sold | 1,600,000 | $39,351,360 | 2,300,002 | $57,327,420 | 4,600,000 | $121,402,100 | 3,400,000 | $89,150,650 | |||
| Shares redeemed | — | — | (2) | (50) | — | — | (200,000) | (5,194,200) | |||
| Net increase (decrease) | 1,600,000 | $39,351,360 | 2,300,000 | $57,327,370 | 4,600,000 | $121,402,100 | 3,200,000 | $83,956,450 | |||
| NUAG | NUSA | NUHY | NUBD | |
| Tax cost of investments | $217,515,533 | $40,871,015 | $95,568,489 | $260,609,294 |
| Gross unrealized: | ||||
| Appreciation | $ 911,367 | $ 458,686 | $ 1,478,855 | $ 5,153,451 |
| Depreciation | (544,627) | (195,841) | (793,132) | (1,790,213) |
| Net unrealized appreciation (depreciation) of investments | $ 366,740 | $ 262,845 | $ 685,723 | $ 3,363,238 |
| NUAG | NUSA | NUHY | NUBD | |
| Undistributed net ordinary income1 | $185,073 | $83,714 | $437,801 | $500,902 |
| Undistributed net long-term capital gains | — | — | — | — |
| 1 | Net ordinary income consists of net taxable income derived from dividends, interest, and net short-term capital gains, if any. |
| 2021 | NUAG | NUSA | NUHY | NUBD |
| Distributions from net ordinary income1 | $3,233,360 | $923,780 | $3,626,280 | $4,115,730 |
| Distributions from net long-term capital gains | — | — | — | — |
| 2020 | NUAG | NUSA | NUHY | NUBD |
| Distributions from net ordinary income1 | $3,772,060 | $894,030 | $1,805,740 | $2,152,900 |
| Distributions from net long-term capital gains | — | — | — | — |
| 1 | Net ordinary income consists of net taxable income derived from dividends, interest, and net short-term capital gains, if any. |
| NUAG | NUSA | NUHY | NUBD | |
| Not subject to expiration: | ||||
| Short-term | $5,498,697 | $ 80,573 | $1,424,207 | $1,137,875 |
| Long-term | 996,517 | 89,630 | — | — |
| Total | $6,495,214 | $170,203 | $1,424,207 | $1,137,875 |
| NUSA | NUHY | |
| Utilized capital loss carryforwards | $62,691 | $464,253 |
| Fund | Management Fee |
| NUAG | 0.20% |
| NUSA | 0.20 |
| NUHY | 0.35 |
| NUBD | 0.20 |
| NUAG | |
| Nuveen owned shares | 0%* |
| * | Rounds to less than 1%. |
| NUHY | |
| TIAA owned shares | 46% |
| Fund | Management Fee |
| NUHY | 0.30% |
| NUBD | 0.15% |
| NUAG | NUSA | ||||
| Year Ended July 31, 2021 | Number of Days | % of Total Days | Number of Days | % of Total Days | |
| Premium/Discount Range: | |||||
| 0.26% to 0.50% | 5 | 2.0% | 18 | 7.2% | |
| 0.00 to 0.25% | 117 | 46.6% | 229 | 91.2% | |
| (0.01)% to (0.25)% | 126 | 50.2% | 4 | 1.6% | |
| (0.26)% to (0.50)% | 3 | 1.2% | - | - | |
| 251 | 100% | 251 | 100% | ||
| NUHY | NUBD | ||||
| Year Ended July 31, 2021 | Number of Days | % of Total Days | Number of Days | % of Total Days | |
| Premium/Discount Range: | |||||
| 1.01% to 3.00% | 33 | 13.1% | - | - | |
| 0.51% to 1.00% | 156 | 62.2% | 1 | 0.4% | |
| 0.26% to 0.50% | 56 | 22.3% | 62 | 24.7% | |
| 0.00 to 0.25% | 6 | 2.4% | 180 | 71.7% | |
| (0.01)% to (0.25)% | - | - | 8 | 3.2% | |
| 251 | 100% | 251 | 100% | ||
| NUAG | NUSA | NUHY | NUBD | |
| August 1, 2020 through December 31, 2020 | 91.2% | 89.1% | 82.3% | 87.6% |
| January 1, 2021 through July 31, 2021 | 87.5% | 88.3% | 78.4% | 88.1% |
| NUAG | NUSA | NUHY | NUBD | |
| % of Section 163(j) Interest Dividends | 99.5% | 99.5% | 99.5% | 99.3% |
| • | Centralization of Functions – ongoing initiatives to centralize investment leadership, market approach and shared support functions within Nuveen and its affiliates in seeking to operate more effectively the business and enhance the services to the Nuveen funds; |
| • | Fund Improvements and Product Management Initiatives – continuing to proactively manage the Nuveen fund complex as a whole and at the individual fund level with an aim to continually improve product platforms and investment strategies to better serve shareholders through, among other things, rationalizing the product line and gaining efficiencies through mergers, repositionings and liquidations; launching new funds; reviewing and updating investment policies and benchmarks; and modifying portfolio management teams for various funds; |
| • | Investment Team Integrations – continuing to integrate and adjust the members of certain investment teams, in part, to allow greater access to tools and resources within the Nuveen organization and its affiliates; |
| • | Capital Initiatives – continuing to invest capital to support new Nuveen funds with initial capital as well as to support existing funds and facilitate regulatory or logistical changes; |
| • | Liquidity Management – continuing to operate the liquidity management program of the applicable Nuveen funds including monitoring daily their liquidity profile and assessing annually the overall liquidity risk of such funds; |
| • | Compliance Program Initiatives – continuing efforts to mitigate compliance risk, increase operating efficiencies, implement enhancements to strengthen key compliance program elements and support international business growth and other corporate objectives; |
| • | Investment Oversight – preparing reports to the Board addressing, among other things, fund performance; market conditions; investment teams; new products; changes to mandates, policies and benchmarks; and other management proposals; |
| • | Risk Management and Valuation Services - continuing to oversee and manage risk including, among other things, conducting daily calculations and monitoring of risk measures across the Nuveen funds, instituting appropriate investment risk controls, providing risk reporting throughout the firm, participating in internal oversight committees, and continuing to implement an operational risk framework that seeks to provide greater transparency of operational risk matters across the complex as well as provide multiple other risk programs that seek to provide a more disciplined and consistent approach to identifying and mitigating Nuveen’s operational risks. Further, the securities valuation team continues, among other things, to oversee the daily valuation process of the portfolio securities of the funds, maintains the valuation policies and procedures, facilitates valuation committee meetings, manages relationships with pricing vendors, and prepares relevant valuation reports and designs methods to simplify and enhance valuation workflow within the organization; |
| • | Regulatory Matters – continuing efforts to monitor regulatory trends and advocate on behalf of Nuveen and/or the Nuveen funds, to implement and comply with new or revised rules and mandates and to respond to regulatory inquiries and exams; |
| • | Government Relations – continuing efforts of various Nuveen teams and Nuveen’s affiliates to develop policy positions on a broad range of issues that may impact the Nuveen funds, advocate and communicate these positions to lawmakers and other regulatory authorities and work with trade associations to ensure these positions are represented; |
| • | Business Continuity, Disaster Recovery and Information Security – continuing efforts of Nuveen to periodically test and update business continuity and disaster recovery plans and, together with its affiliates, to maintain an information security program designed to identify and manage information security risks, and provide reports to the Board, at least annually, addressing, among other things, management’s security risk assessment, cyber risk profile, potential impact of new or revised laws and regulations, incident tracking and other relevant information technology risk-related reports; and |
| • | Dividend Management Services – continuing to manage the dividends among the varying types of Nuveen funds within the Nuveen complex to be consistent with the respective fund’s product design and positioning in striving to deliver those earnings to shareholders in a relatively consistent manner over time as well as assisting in the development of new products or the restructuring of existing funds. |
| Name, Year of Birth & Address | Position(s) Held with the Funds | Year First Elected or Appointed (1) | Principal Occupation(s) Including other Directorships During Past 5 Years | Number of Portfolios in Fund Complex Overseen by Trustee |
| Independent Trustees: | ||||
| Terence J. Toth 1959 333 W. Wacker Drive Chicago, IL 60606 | Chair and Trustee | 2008 | Formerly, a Co-Founding Partner, Promus Capital (investment advisory firm) (2008-2017); Director, Quality Control Corporation (manufacturing) (since 2012); member: Catalyst Schools of Chicago Board (since 2008) and Mather Foundation Board (philanthropy) (since 2012), and chair of its investment committee; formerly, Director, Fulcrum IT Services LLC (information technology services firm to government entities) (2010-2019); formerly, Director, LogicMark LLC (health services) (2012-2016); formerly, Director, Legal & General Investment Management America, Inc. (asset management) (2008-2013); formerly, CEO and President, Northern Trust Global Investments (financial services) (2004-2007); Executive Vice President, Quantitative Management & Securities Lending (2000-2004); prior thereto, various positions with Northern Trust Company (financial services) (since 1994); formerly, Member, Northern Trust Mutual Funds Board (2005-2007), Northern Trust Global Investments Board (2004-2007), Northern Trust Japan Board (2004-2007), Northern Trust Securities Inc. Board (2003- 2007) and Northern Trust Hong Kong Board (1997-2004). | 146 |
| Jack B. Evans 1948 333 W. Wacker Drive Chicago, IL 60606 | Trustee | 1999 | Chairman (since 2019), formerly, President (1996-2019), The Hall-Perrine Foundation, (private philanthropic corporation); Life Trustee of Coe College and the Iowa College Foundation; formerly, Member and President Pro-Tem of the Board of Regents for the State of Iowa University System (2007- 2013); Director and Chairman (2009-2021), United Fire Group, a publicly held company; Director, Public Member, American Board of Orthopaedic Surgery (2015-2020); Director (2000-2004), Alliant Energy; Director (1996-2015), The Gazette Company (media and publishing); Director (1997- 2003), Federal Reserve Bank of Chicago; President and Chief Operating Officer (1972-1995), SCI Financial Group, Inc., (regional financial services firm). | 146 |
| Name, Year of Birth & Address | Position(s) Held with the Funds | Year First Elected or Appointed (1) | Principal Occupation(s) Including other Directorships During Past 5 Years | Number of Portfolios in Fund Complex Overseen by Trustee |
| William C. Hunter 1948 333 W. Wacker Drive Chicago, IL 60606 | Trustee | 2003 | Dean Emeritus, formerly, Dean, Tippie College of Business, University of Iowa (2006-2012); Director of Wellmark, Inc. (since 2009); past Director (2005-2015), and past President (2010- 2014) Beta Gamma Sigma, Inc., The International Business Honor Society; formerly, Director (2004-2018) of Xerox Corporation; formerly, Dean and Distinguished Professor of Finance, School of Business at the University of Connecticut (2003-2006); previously, Senior Vice President and Director of Research at the Federal Reserve Bank of Chicago (1995-2003); formerly, Director (1997-2007), Credit Research Center at Georgetown University. | 146 |
| Amy B. R. Lancellotta 1959 333 W. Wacker Drive Chicago, IL 60606 | Trustee | 2021 | Formerly, Managing Director, Independent Directors Council (IDC) (supports the fund independent director community and is part of the Investment Company Institute (ICI), which represents regulated investment companies) (2006-2019); formerly, various positions with ICI (1989-2006); Member of the Board of Directors, Jewish Coalition Against Domestic Abuse (JCADA) (since 2020). | 146 |
| Joanne T. Medero 1954 333 W. Wacker Drive Chicago, IL 60606 | Trustee | 2021 | Formerly, Managing Director, Government Relations and Public Policy (2009-2020) and Senior Advisor to the Vice Chairman (2018-2020), BlackRock, Inc. (global investment management firm); formerly, Managing Director, Global Head of Government Relations and Public Policy, Barclays Group (IBIM) (investment banking, investment management and wealth management businesses)(2006-2009); formerly, Managing Director, Global General Counsel and Corporate Secretary, Barclays Global Investors (global investment management firm) (1996-2006); formerly, Partner, Orrick, Herrington & Sutcliffe LLP (law firm) (1993-1995); formerly, General Counsel, Commodity Futures Trading Commission (government agency overseeing U.S. derivatives markets) (1989-1993); formerly, Deputy Associate Director/Associate Director for Legal and Financial Affairs, Office of Presidential Personnel, The White House (1986-1989); Member of the Board of Directors, Baltic-American Freedom Foundation (seeks to provide opportunities for citizens of the Baltic states to gain education and professional development through exchanges in the U.S.) (since 2019). | 146 |
| Albin F. Moschner 1952 333 W. Wacker Drive Chicago, IL 60606 | Trustee | 2016 | Founder and Chief Executive Officer, Northcroft Partners, LLC, (management consulting) (since 2012); formerly, Chairman (2019), and Director (2012-2019), USA Technologies, Inc., (provider of solutions and services to facilitate electronic payment transactions); formerly, Director, Wintrust Financial Corporation (1996-2016); previously, held positions at Leap Wireless International, Inc. (consumer wireless services), including Consultant (2011-2012), Chief Operating Officer (2008-2011), and Chief Marketing Officer (2004-2008); formerly, President, Verizon Card Services division of Verizon Communications, Inc. (2000-2003); formerly, President, One Point Services at One Point Communications (telecommunication services) (1999-2000); formerly, Vice Chairman of the Board, Diba, Incorporated (internet technology provider) (1996-1997); formerly, various executive positions (1991-1996) including Chief Executive Officer (1995-1996) of Zenith Electronics Corporation (consumer electronics). | 146 |
| Name, Year of Birth & Address | Position(s) Held with the Funds | Year First Elected or Appointed (1) | Principal Occupation(s) Including other Directorships During Past 5 Years | Number of Portfolios in Fund Complex Overseen by Trustee |
| John K. Nelson 1962 333 W. Wacker Drive Chicago, IL 60606 | Trustee | 2013 | Member of Board of Directors of Core12 LLC. (private firm which develops branding, marketing and communications strategies for clients) (since 2008); served The President's Council of Fordham University (2010-2019) and previously a Director of the Curran Center for Catholic American Studies (2009-2018); formerly, senior external advisor to the Financial Services practice of Deloitte Consulting LLP. (2012-2014); former Chair of the Board of Trustees of Marian University (2010-2014 as trustee, 2011-2014 as Chair); formerly Chief Executive Officer of ABN AMRO Bank N.V., North America, and Global Head of the Financial Markets Division (2007-2008), with various executive leadership roles in ABN AMRO Bank N.V. between 1996 and 2007. | 146 |
| Judith M. Stockdale 1947 333 W. Wacker Drive Chicago, IL 60606 | Trustee | 1997 | Board Member, Land Trust Alliance (national public charity addressing natural land and water conservation in the U.S.) (since 2013); formerly, Board Member, U.S. Endowment for Forestry and Communities (national endowment addressing forest health, sustainable forest production and markets, and economic health of forest-reliant communities in the U.S.) (2013-2019); formerly, Executive Director (1994-2012), Gaylord and Dorothy Donnelley Foundation (private foundation endowed to support both natural land conservation and artistic vitality); prior thereto, Executive Director, Great Lakes Protection Fund (endowment created jointly by seven of the eight Great Lakes states' Governors to take a regional approach to improving the health of the Great Lakes) (1990-1994). | 146 |
| Carole E. Stone 1947 333 W. Wacker Drive Chicago, IL 60606 | Trustee | 2007 | Former Director, Chicago Board Options Exchange (2006-2017), and C2 Options Exchange, Incorporated (2009-2017); formerly, Director, Cboe Global Markets, Inc., (2010-2020) (formerly named CBOE Holdings, Inc.); formerly, Commissioner, New York State Commission on Public Authority Reform (2005-2010). | 146 |
| Matthew Thornton III 1958 333 W. Wacker Drive Chicago, IL 60606 | Trustee | 2020 | Formerly, Executive Vice President and Chief Operating Officer (2018-2019), FedEx Freight Corporation, a subsidiary of FedEx Corporation ("FedEx") (provider of transportation, e-commerce and business services through its portfolio of companies); formerly, Senior Vice President, U.S. Operations (2006-2018), Federal Express Corporation, a subsidiary of FedEx; formerly Member of the Board of Directors (2012-2018), Safe Kids Worldwide® (a non-profit organization dedicated to preventing childhood injuries). Member of the Board of Directors (since 2014), The Sherwin-Williams Company (develops, manufactures, distributes and sells paints, coatings and related products); Director (since 2020), Crown Castle International (provider of communications infrastructure). | 146 |
| Name, Year of Birth & Address | Position(s) Held with the Funds | Year First Elected or Appointed (1) | Principal Occupation(s) Including other Directorships During Past 5 Years | Number of Portfolios in Fund Complex Overseen by Trustee |
| Margaret L. Wolff 1955 333 W. Wacker Drive Chicago, IL 60606 | Trustee | 2016 | Formerly, member of the Board of Directors (2013-2017) of Travelers Insurance Company of Canada and The Dominion of Canada General Insurance Company (each, a part of Travelers Canada, the Canadian operation of The Travelers Companies, Inc.); formerly, Of Counsel, Skadden, Arps, Slate, Meagher & Flom LLP (legal services, Mergers & Acquisitions Group) (2005-2014); Member of the Board of Trustees of New York-Presbyterian Hospital (since 2005); Member (since 2004) and Chair (since 2015) of the Board of Trustees of The John A. Hartford Foundation (a philanthropy dedicated to improving the care of older adults); formerly, Member (2005-2015) and Vice Chair (2011-2015) of the Board of Trustees of Mt. Holyoke College. | 146 |
| Robert L. Young 1963 333 W. Wacker Drive Chicago, IL 60606 | Trustee | 2017 | Formerly, Chief Operating Officer and Director, J.P. Morgan Investment Management Inc. (financial services) (2010-2016); formerly, President and Principal Executive Officer (2013-2016), and Senior Vice President and Chief Operating Officer (2005-2010), of J.P. Morgan Funds; formerly, Director and various officer positions for J.P. Morgan Investment Management Inc. (formerly, JPMorgan Funds Management, Inc. and formerly, One Group Administrative Services) and JPMorgan Distribution Services, Inc. (financial services) (formerly, One Group Dealer Services, Inc.) (1999-2017). | 146 |
| Name, Year of Birth & Address | Position(s) Held with the Funds | Year First Elected or Appointed(2) | Principal Occupation(s) During Past 5 Years | |
| Officers of the Funds: | ||||
| Jordan M. Farris 1980 333 W. Wacker Drive Chicago, IL 60606 | Chief Administrative Officer | 2019 | Managing Director (since 2017), formerly Vice President (2016-2017), Head of Product Management and Development, ETFs, Nuveen Securities, LLC; Director, Guggenheim Funds Distributors (2013-2016). | |
| Mark J. Czarniecki 1979 901 Marquette Avenue Minneapolis, MN 55402 | Vice President and Assistant Secretary | 2013 | Vice President and Assistant Secretary of Nuveen Securities, LLC (since 2016) and Nuveen Fund Advisors, LLC (since 2017); Vice President and Associate General Counsel of Nuveen (since 2013) and Vice President, Assistant Secretary and Associate General Counsel of Nuveen Asset Management, LLC (since 2018). | |
| Diana R. Gonzalez 1978 333 W. Wacker Drive Chicago, IL 60606 | Vice President and Secretary | 2017 | Vice President and Assistant Secretary of Nuveen Fund Advisors, LLC (since 2017); Vice President and Associate General Counsel of Nuveen (since 2017); Associate General Counsel of Jackson National Asset Management, LLC (2012-2017). | |
| Nathaniel T. Jones 1979 333 W. Wacker Drive Chicago, IL 60606 | Vice President and Treasurer | 2016 | Senior Managing Director (since 2021), formerly, Managing Director (2017-2021), Senior Vice President (2016-2017), formerly, Vice President (2011- 2016) of Nuveen; Managing Director (since 2015) of Nuveen Fund Advisors, LLC; Chartered Financial Analyst. | |
| Tina M. Lazar 1961 333 W. Wacker Drive Chicago, IL 60606 | Vice President | 2002 | Managing Director (since 2017), formerly, Senior Vice President (2014-2017) of Nuveen Securities, LLC. | |
| Brian J. Lockhart 1974 333 W. Wacker Drive Chicago, IL 60606 | Vice President | 2019 | Managing Director (since 2019) of Nuveen Fund Advisors, LLC; Senior Managing Director (since 2021), formerly, Managing Director (2017-2021), Vice President (2010-2017) of Nuveen; Head of Investment Oversight (since 2017), formerly, Team Leader of Manager Oversight (2015-2017); Chartered Financial Analyst and Certified Financial Risk Manager. |
| Name, Year of Birth & Address | Position(s) Held with the Funds | Year First Elected or Appointed(2) | Principal Occupation(s) During Past 5 Years | |
| Jacques M. Longerstaey 1963 8500 Andrew Carnegie Blvd. Charlotte, NC 28262 | Vice President | 2019 | Senior Managing Director, Chief Risk Officer, Nuveen (since May 2019); Senior Managing Director (since May 2019) of Nuveen Fund Advisors, LLC; formerly, Chief Investment and Model Risk Officer, Wealth & Investment Management Division, Wells Fargo Bank (NA) (2013-2019). | |
| Kevin J. McCarthy 1966 333 W. Wacker Drive Chicago, IL 60606 | Vice President and Assistant Secretary | 2007 | Senior Managing Director (since 2017) and Secretary and General Counsel (since 2016) of Nuveen Investments, Inc., formerly, Executive Vice President (2016-2017) and Managing Director and Assistant Secretary (2008-2016); Senior Managing Director (since 2017) and Assistant Secretary (since 2008) of Nuveen Securities, LLC, formerly Executive Vice President (2016-2017) and Managing Director (2008-2016); Senior Managing Director (since 2017) and Secretary (since 2016) of Nuveen Fund Advisors, LLC, formerly, Co-General Counsel (2011-2020), Executive Vice President (2016-2017), Managing Director (2008-2016) and Assistant Secretary (2007-2016); Senior Managing Director (since 2017), Secretary (since 2016) of Nuveen Asset Management, LLC, formerly, Associate General Counsel (2011-2020), Executive Vice President (2016-2017) and Managing Director and Assistant Secretary (2011-2016); Vice President (since 2007) and Secretary (since 2016), formerly, Assistant Secretary, of NWQ Investment Management Company, LLC, Santa Barbara Asset Management, LLC and Winslow Capital Management, LLC (since 2010). Senior Managing Director (since 2017) and Secretary (since 2016) of Nuveen Alternative Investments, LLC. | |
| Jon Scott Meissner 1973 8500 Andrew Carnegie Blvd. Charlotte, NC 28262 | Vice President and Assistant Secretary | 2019 | Managing Director of Mutual Fund Tax and Financial Reporting groups at Nuveen (since 2017); Managing Director of Nuveen Fund Advisors, LLC (since 2019); Senior Director of Teachers Advisors, LLC and TIAA-CREF Investment Management, LLC (since 2016); Senior Director (since 2015) Mutual Fund Taxation to the TIAA-CREF Funds, the TIAA-CREF Life Funds, the TIAA Separate Account VA-1 and the CREF Accounts; has held various positions with TIAA since 2004. | |
| Deann D. Morgan 1969 730 Third Avenue New York, NY 10017 | Vice President | 2020 | President, Nuveen Fund Advisors, LLC (since 2020); Executive Vice President, Global Head of Product at Nuveen (since 2019); Co-Chief Executive Officer of Nuveen Securities, LLC (since 2020); Managing Member of MDR Collaboratory LLC (since 2018); Managing Director, Head of Wealth Management Product Structuring & COO Multi Asset Investing. The Blackstone Group (2013-2017). | |
| Christopher M. Rohrbacher 1971 333 W. Wacker Drive Chicago, IL 60606 | Vice President and Assistant Secretary | 2008 | Managing Director and Assistant Secretary (since 2017) of Nuveen Securities, LLC; Managing Director (since 2017), General Counsel (since 2020), and Assistant Secretary (since 2016), formerly, Senior Vice President (2016-2017), of Nuveen Fund Advisors, LLC; Managing Director, Associate General Counsel and Assistant Secretary of Nuveen Asset Management, LLC (since 2020); Managing Director (since 2017) and Associate General Counsel (since 2016), formerly, Senior Vice President (2012-2017) and Assistant General Counsel (2008-2016) of Nuveen. | |
| William A. Siffermann 1975 333 W. Wacker Drive Chicago, IL 60606 | Vice President | 2017 | Managing Director (since 2017), formerly Senior Vice President (2016-2017) and Vice President (2011-2016) of Nuveen. | |
| E. Scott Wickerham 1973 8500 Andrew Carnegie Blvd. Charlotte, NC 28262 | Vice President and Controller | 2019 | Senior Managing Director, Head of Public Investment Finance at Nuveen (since 2019), formerly, Managing Director; Senior Managing Director (since 2019) of Nuveen Fund Advisors, LLC; Principal Financial Officer, Principal Accounting Officer and Treasurer (since 2017) of the TIAA-CREF Funds, the TIAA-CREF Life Funds, the TIAA Separate Account VA-1 and Principal Financial Officer, Principal Accounting Officer (since 2020) and Treasurer (since 2017) of the CREF Accounts; formerly, Senior Director, TIAA-CREF Fund Administration (2014-2015); has held various positions with TIAA since 2006. |
| Name, Year of Birth & Address | Position(s) Held with the Funds | Year First Elected or Appointed(2) | Principal Occupation(s) During Past 5 Years | |
| Mark L. Winget 1968 333 W. Wacker Drive Chicago, IL 60606 | Vice President and Assistant Secretary | 2008 | Vice President and Assistant Secretary of Nuveen Securities, LLC (since 2008), and Nuveen Fund Advisors, LLC (since 2019); Vice President, Associate General Counsel and Assistant Secretary of Nuveen Asset Management, LLC (since 2020); Vice President (since 2010) and Associate General Counsel (since 2019), formerly, Assistant General Counsel (2008-2016) of Nuveen. | |
| Gifford R. Zimmerman 1956 333 W. Wacker Drive Chicago, IL 60606 | Vice President and Chief Compliance Officer | 1988 | Formerly: Managing Director (2002-2020) and Assistant Secretary (2002-2020) of Nuveen Securities, LLC; formerly, Managing Director (2002-2020), Assistant Secretary (1997-2020) and Co-General Counsel (2011-2020) of Nuveen Fund Advisors, LLC; formerly, Managing Director (2004-2020) and Assistant Secretary (1994-2020) of Nuveen Investments, Inc.; formerly, Managing Director, Assistant Secretary and Associate General Counsel of Nuveen Asset Management, LLC (2011-2020); formerly, Vice President and Assistant Secretary of NWQ Investment Management Company, LLC (2002-2020), Santa Barbara Asset Management, LLC (2006-2020) and Winslow Capital Management, LLC (2010-2020); Chartered Financial Analyst. |
Serving Investors for Generations
| ITEM 2. | CODE OF ETHICS. |
As of the end of the period covered by this report, the registrant has adopted a code of ethics that applies to the registrant’s principal executive officer, principal financial officer, principal accounting officer or controller, or persons performing similar functions. There were no amendments to or waivers from the code during the period covered by this report. The registrant has posted the code of ethics on its website at www.nuveen.com/fund-governance. (To view the code, click on Code of Conduct.)
| ITEM 3. | AUDIT COMMITTEE FINANCIAL EXPERT. |
As of the end of the period covered by this report, the registrant’s Board of Directors or Trustees (“Board”) determined that the registrant has at least one “audit committee financial expert” (as defined in Item 3 of Form N-CSR) serving on its Audit Committee. The registrant’s audit committee financial experts are Carole E. Stone, Jack B. Evans, William C. Hunter and Albin F. Moschner, who are “independent” for purposes of Item 3 of Form N-CSR.
Ms. Stone served for five years as Director of the New York State Division of the Budget. As part of her role as Director, Ms. Stone was actively involved in overseeing the development of the State’s operating, local assistance and capital budgets, its financial plan and related documents; overseeing the development of the State’s bond-related disclosure documents and certifying that they fairly presented the State’s financial position; reviewing audits of various State and local agencies and programs; and coordinating the State’s system of internal audit and control. Prior to serving as Director, Ms. Stone worked as a budget analyst/examiner with increasing levels of responsibility over a 30 year period, including approximately five years as Deputy Budget Director. Ms. Stone has also served as Chair of the New York State Racing Association Oversight Board, as Chair of the Public Authorities Control Board, as a Commissioner on the New York State Commission on Public Authority Reform and as a member of the Boards of Directors of several New York State public authorities. These positions have involved overseeing operations and finances of certain entities and assessing the adequacy of project/entity financing and financial reporting. Currently, Ms. Stone is on the Board of Directors of CBOE Holdings, Inc., of the Chicago Board Options Exchange, and of C2 Options Exchange. Ms. Stone’s position on the boards of these entities and as a member of both CBOE Holdings’ Audit Committee and its Finance Committee has involved, among other things, the oversight of audits, audit plans and preparation of financial statements.
Mr. Evans was formerly President and Chief Operating Officer of SCI Financial Group, Inc., a full service registered broker-dealer and registered investment adviser (“SCI”). As part of his role as President and Chief Operating Officer, Mr. Evans actively supervised the Chief Financial Officer (the “CFO”) and actively supervised the CFO’s preparation of financial statements and other filings with various regulatory authorities. In such capacity, Mr. Evans was actively involved in the preparation of SCI’s financial statements and the resolution of issues raised in connection therewith. Mr. Evans has also served on the audit committee of various reporting companies. At such companies, Mr. Evans was involved in the oversight of audits, audit plans, and the preparation of financial statements. Mr. Evans also formerly chaired the audit committee of the Federal Reserve Bank of Chicago.
Mr. Hunter was formerly a Senior Vice President at the Federal Reserve Bank of Chicago. As part of his role as Senior Vice President, Mr. Hunter was the senior officer responsible for all operations of each of the Economic Research, Statistics, and Community and Consumer Affairs units at the Federal Reserve Bank of Chicago. In such capacity, Mr. Hunter oversaw the subunits of the Statistics and Community and Consumer Affairs divisions responsible for the analysis and evaluation of bank and bank holding company financial statements and financial filings. Prior to serving as Senior Vice President at the Federal Reserve Bank of Chicago, Mr. Hunter was the Vice President of the Financial Markets unit at the Federal Reserve Bank of Atlanta where he supervised financial staff and bank holding company analysts who analyzed and evaluated bank and bank holding company financial statements. Mr. Hunter also currently serves on the Boards of Directors of Xerox Corporation and Wellmark, Inc. as well as on the Audit Committees of such Boards. As an Audit Committee member, Mr. Hunter’s responsibilities include, among other things, reviewing financial statements, internal audits and internal controls over financial reporting. Mr. Hunter also formerly was a Professor of Finance at the University of Connecticut School of Business and has authored numerous scholarly articles on the topics of finance, accounting and economics.
Mr. Moschner, Founder and Chief Executive Officer, Northcroft Partners, LLC, (management consulting) (since 2012); formerly, Chairman (2019), and Director (2012-2019), USA Technologies, Inc., (provider of solutions and services to facilitate electronic payment transactions); formerly, Director, Wintrust Financial Corporation (1996-2016); previously, held positions at Leap Wireless International, Inc., (consumer wireless services) including Consultant (2011-2012), Chief Operating Officer (2008-2011), and Chief Marketing Officer (2004-2008); formerly, President, Verizon Card Services division of Verizon Communications, Inc. (2000-2003); formerly, President, One Point Services at One Point Communications (telecommunication services) (1999-2000); formerly, Vice Chairman of the Board, Diba, Incorporated (internet technology provider) (1996-1997); formerly, various executive positions (1991-1996), including Chief Executive Officer (1995-1996) of Zenith Electronics Corporation (consumer electronics).
| ITEM 4. | PRINCIPAL ACCOUNTANT FEES AND SERVICES. |
The following tables show the amount of fees that KPMG LLP, the Funds’ auditor, billed to the Funds’ during the Funds’ last two full fiscal years. The Audit Committee approved in advance all audit services and non-audit services that KPMG LLP provided to the Funds, except for those non-audit services that were subject to the pre-approval exception under Rule 2-01 of Regulation S-X (the “pre-approval exception”). The preapproval exception for services provided directly to the Funds waives the pre-approval requirement for services other than audit, review or attest services if: (A) the aggregate amount of all such services provided constitutes no more than 5% of the total amount of revenues paid by the Funds during the fiscal year in which the services are provided; (B) the Funds did not recognize the services as non-audit services at the time of the engagement; and (C) the services are promptly brought to the Audit Committee’s attention, and the Committee (or its delegate) approves the services before the audit is completed.
The Audit Committee has delegated certain pre-approval responsibilities to its Chair (or, in her absence, any other member of the Audit Committee).
Fiscal Year Ended July 31, 2021 | Audit Fees Billed to Funds 1 | Audit-Related Fees Billed to Funds 2 | Tax Fees Billed to Funds 3 | All Other Fees Billed to Funds 4 | ||||||||||||
Fund Name | ||||||||||||||||
Nuveen Enhanced Yield U.S. Aggregate Bond ETF | 18,690 | 0 | 0 | 0 | ||||||||||||
Nuveen ESG U.S. Aggregate Bond ETF | 18,640 | 0 | 0 | 0 | ||||||||||||
Nuveen ESG High Yield Corporate Bond ETF | 18,690 | 0 | 0 | 0 | ||||||||||||
Nuveen Enhanced Yield 1-5 Year U.S. Aggregate Bond ETF | 18,690 | 0 | 0 | 0 | ||||||||||||
|
|
|
|
|
|
|
| |||||||||
Total | $ | 74,710 | $ | 0 | $ | 0 | $ | 0 | ||||||||
| 1 | “Audit Fees” are the aggregate fees billed for professional services for the audit of the Fund’s annual financial statements and services provided in connection with statutory and regulatory filings or engagements. |
| 2 | “Audit-Related Fees” are the aggregate fees billed for assurance and related services reasonably related to the performance of the audit or review of financial statements that are not reported under “Audit Fees”. These fees include offerings related to the Fund’s common shares and leverage. |
| 3 | “Tax Fees” are the aggregate fees billed for professional services for tax advice, tax compliance, and tax planning. These fees include: all global withholding tax services; excise and state tax reviews; capital gain, tax equalization and taxable basis calculations performed by the principal accountant. |
| 4 | “All Other Fees” are the aggregate fees billed for products and services other than “Audit Fees”, “Audit-Related Fees” and “Tax Fees”. These fees represent all “Agreed-Upon Procedures” engagements pertaining to the Fund’s use of leverage. |
| Percentage Approved Pursuant to Pre-approval Exception | ||||||||||||||||
| Audit Fees Billed to Funds | Audit-Related Fees Billed to Funds | Tax Fees Billed to Funds | All Other Fees Billed to Funds | |||||||||||||
Fund Name | ||||||||||||||||
Nuveen Enhanced Yield U.S. Aggregate Bond ETF | 0 | % | 0 | % | 0 | % | 0 | % | ||||||||
Nuveen ESG U.S. Aggregate Bond ETF | 0 | % | 0 | % | 0 | % | 0 | % | ||||||||
Nuveen ESG High Yield Corporate Bond ETF | 0 | % | 0 | % | 0 | % | 0 | % | ||||||||
Nuveen Enhanced Yield 1-5 Year U.S. Aggregate Bond ETF | 0 | % | 0 | % | 0 | % | 0 | % | ||||||||
Fiscal Year Ended July 31, 2020 | Audit Fees Billed to Funds 1 | Audit-Related Fees Billed to Funds 2 | Tax Fees Billed to Funds 3 | All Other Fees Billed to Funds 4 | ||||||||||||
Fund Name | ||||||||||||||||
Nuveen Enhanced Yield U.S. Aggregate Bond ETF | 18,330 | 0 | 0 | 0 | ||||||||||||
Nuveen ESG U.S. Aggregate Bond ETF | 18,280 | 0 | 0 | 0 | ||||||||||||
Nuveen ESG High Yield Corporate Bond ETF | 18,330 | 0 | 0 | 0 | ||||||||||||
Nuveen Enhanced Yield 1-5 Year U.S. Aggregate Bond ETF | 18,330 | 0 | 0 | 0 | ||||||||||||
|
|
|
|
|
|
|
| |||||||||
Total | $ | 73,270 | $ | 0 | $ | 0 | $ | 0 | ||||||||
| 1 | “Audit Fees” are the aggregate fees billed for professional services for the audit of the Fund’s annual financial statements and services provided in connection with statutory and regulatory filings or engagements. |
| 2 | “Audit-Related Fees” are the aggregate fees billed for assurance and related services reasonably related to the performance of the audit or review of financial statements that are not reported under “Audit Fees”. These fees include offerings related to the Fund’s common shares and leverage. |
| 3 | “Tax Fees” are the aggregate fees billed for professional services for tax advice, tax compliance, and tax planning. These fees include: all global withholding tax services; excise and state tax reviews; capital gain, tax equalization and taxable basis calculations performed by the principal accountant. |
| 4 | “All Other Fees” are the aggregate fees billed for products and services other than “Audit Fees”, “Audit-Related Fees” and “Tax Fees”. These fees represent all “Agreed-Upon Procedures” engagements pertaining to the Fund’s use of leverage. |
| 5 | Fund commenced operations on 9/26/2019 |
| Percentage Approved Pursuant to Pre-approval Exception | ||||||||||||||||
| Audit Fees Billed to Funds | Audit-Related Fees Billed to Funds | Tax Fees Billed to Funds | All Other Fees Billed to Funds | |||||||||||||
Fund Name | ||||||||||||||||
Nuveen Enhanced Yield U.S. Aggregate Bond ETF | 0 | % | 0 | % | 0 | % | 0 | % | ||||||||
Nuveen ESG U.S. Aggregate Bond ETF | 0 | % | 0 | % | 0 | % | 0 | % | ||||||||
Nuveen ESG High Yield Corporate Bond ETF | 0 | % | 0 | % | 0 | % | 0 | % | ||||||||
Nuveen Enhanced Yield 1-5 Year U.S. Aggregate Bond ETF | 0 | % | 0 | % | 0 | % | 0 | % | ||||||||
Fiscal Year Ended July 31, 2021 | Audit-Related Fees Billed to Adviser and Affiliated Fund Service Providers | Tax Fees Billed to Adviser and Affiliated Fund Service Providers | All Other Fees Billed to Adviser and Affiliated Fund Service Providers | |||||||||
Nuveen ETF Trust | $ | 0 | $ | 0 | $ | 0 | ||||||
| Percentage Approved Pursuant to Pre-approval Exception | ||||||||||||
| Audit-Related Fees Billed to Adviser and Affiliated Fund Service Providers | Tax Fees Billed to Adviser and Affiliated Fund Service Providers | All Other Fees Billed to Adviser and Affiliated Fund Service Providers | ||||||||||
| 0 | % | 0 | % | 0 | % | |||||||
Fiscal Year Ended July 31, 2020 | Audit-Related Fees Billed to Adviser and Affiliated Fund Service Providers | Tax Fees Billed to Adviser and Affiliated Fund Service Providers | All Other Fees Billed to Adviser and Affiliated Fund Service Providers | |||||||||
NuShares ETF Trust | $ | 0 | $ | 0 | $ | 0 | ||||||
| Percentage Approved Pursuant to Pre-approval Exception | ||||||||||||
| Audit-Related Fees Billed to Adviser and Affiliated Fund Service Providers | Tax Fees Billed to Adviser and Affiliated Fund Service Providers | All Other Fees Billed to Adviser and Affiliated Fund Service Providers | ||||||||||
| 0 | % | 0 | % | 0 | % | |||||||
Fiscal Year Ended July 31, 2021 | Total Non-Audit Fees Billed to Trust | Total Non-Audit Fees billed to Adviser and Affiliated Fund Service Providers (engagements related directly to the operations and financial reporting of the Trust) | Total Non-Audit Fees billed to Adviser and Affiliated Fund Service Providers (all other engagements) | Total | ||||||||||||
Fund Name | ||||||||||||||||
Nuveen Enhanced Yield U.S. Aggregate Bond ETF | 0 | 0 | 0 | 0 | ||||||||||||
Nuveen ESG U.S. Aggregate Bond ETF | 0 | 0 | 0 | 0 | ||||||||||||
Nuveen ESG High Yield Corporate Bond ETF | 0 | 0 | 0 | 0 | ||||||||||||
Nuveen Enhanced Yield 1-5 Year U.S. Aggregate Bond ETF | 0 | 0 | 0 | 0 | ||||||||||||
|
|
|
|
|
|
|
| |||||||||
Total | $ | 0 | $ | 0 | $ | 0 | $ | 0 | ||||||||
“Non-Audit Fees billed to Fund” for both fiscal year ends represent “Tax Fees” and “All Other Fees” billed to Fund in their respective amounts from the previous table.
Less than 50 percent of the hours expended on the principal accountant’s engagement to audit the registrant’s financial statements for the most recent fiscal year were attributed to work performed by persons other than the principal accountant’s full-time, permanent employees.
Fiscal Year Ended July 31, 2020 | Total Non-Audit Fees Billed to Trust | Total Non-Audit Fees billed to Adviser and Affiliated Fund Service Providers (engagements related directly to the operations and financial reporting of the Trust) | Total Non-Audit Fees billed to Adviser and Affiliated Fund Service Providers (all other engagements) | Total | ||||||||||||
Fund Name | ||||||||||||||||
Nuveen Enhanced Yield U.S. Aggregate Bond ETF | 0 | 0 | 0 | 0 | ||||||||||||
Nuveen ESG U.S. Aggregate Bond ETF | 0 | 0 | 0 | 0 | ||||||||||||
Nuveen ESG High Yield Corporate Bond ETF | 0 | 0 | 0 | 0 | ||||||||||||
Nuveen Enhanced Yield 1-5 Year U.S. Aggregate Bond ETF | 0 | 0 | 0 | 0 | ||||||||||||
|
|
|
|
|
|
|
| |||||||||
Total | $ | 0 | $ | 0 | $ | 0 | $ | 0 | ||||||||
“Non-Audit Fees billed to Fund” for both fiscal year ends represent “Tax Fees” and “All Other Fees” billed to Fund in their respective amounts from the previous table.
| ITEM 5. | AUDIT COMMITTEE OF LISTED REGISTRANTS. |
The registrant is an issuer as defined in Rule 10A-3 under the Securities Exchange Act of 1934 (the “Exchange Act”). The registrant’s Board has a separately designated Audit Committee established in accordance with Section 3(a)(58)(A) of the Securities Exchange Act of 1934, as amended (15 U.S.C. 78c(a)(58)(A)). As of the end of the period covered by this report, the members of the audit committee are Jack B. Evans, William C. Hunter, John K. Nelson, Judith M. Stockdale and Carole E. Stone, Chair.
| ITEM 6. | SCHEDULE OF INVESTMENTS. |
| a) | See Portfolio of Investments in Item 1. |
| b) | Not applicable. |
| ITEM 7. | DISCLOSURE OF PROXY VOTING POLICIES AND PROCEDURES FOR CLOSED-END MANAGEMENT INVESTMENT COMPANIES. |
Not applicable to this registrant.
| ITEM 8. | PORTFOLIO MANAGERS OF CLOSED-END MANAGEMENT INVESTMENT COMPANIES. |
Not applicable to this registrant.
| ITEM 9. | PURCHASES OF EQUITY SECURITIES BY CLOSED-END MANAGEMENT INVESTMENT COMPANY AND AFFILIATED PURCHASERS. |
Not applicable to this registrant.
| ITEM 10. | SUBMISSION OF MATTERS TO A VOTE OF SECURITY HOLDERS. |
There have been no material changes to the procedures by which shareholders may recommend nominees to the registrant’s Board of Trustees implemented after the registrant last provided disclosure in response to this Item.
| ITEM 11. | CONTROLS AND PROCEDURES. |
| (a) | The registrant’s principal executive and principal financial officers, or persons performing similar functions, have concluded that the registrant’s disclosure controls and procedures (as defined in Rule 30a-3(c) under the Investment Company Act of 1940, as amended (the “1940 Act”) (17 CFR 270.30a-3(c))) are effective, as of a date within 90 days of the filing date of this report that includes the disclosure required by this paragraph, based on their evaluation of the controls and procedures required by Rule 30a-3(b) under the 1940 Act (17 CFR 270.30a-3(b)) and Rules 13a-15(b) or 15d-15(b) under the Securities Exchange Act of 1934, as amended (the “Exchange Act”) (17 CFR 240.13a-15(b) or 240.15d-15(b)). |
| (b) | There were no changes in the registrant’s internal control over financial reporting (as defined in Rule 30a-3(d) under the 1940 Act (17 CFR 270.30a-3(d)) that occurred during the period covered by this report that has materially affected, or is reasonably likely to materially affect, the registrant’s internal control over financial reporting. |
| ITEM 12. | DISCLOSURE OF SECURITIES LENDING ACTIVITIES FOR CLOSED-END MANAGEMENT INVESTMENT COMPANIES. |
Not applicable.
| ITEM 13. | EXHIBITS. |
File the exhibits listed below as part of this Form.
SIGNATURES
Pursuant to the requirements of the Securities Exchange Act of 1934 and the Investment Company Act of 1940, the registrant has duly caused this report to be signed on its behalf by the undersigned, thereunto duly authorized.
(Registrant) Nushares ETF Trust
| By (Signature and Title) | /s/ Diana R. Gonzalez | |
| Diana R. Gonzalez | ||
| Vice President and Secretary |
Date: October 6, 2021
Pursuant to the requirements of the Securities Exchange Act of 1934 and the Investment Company Act of 1940, this report has been signed below by the following persons on behalf of the registrant and in the capacities and on the dates indicated.
| By (Signature and Title) | /s/ Jordan M. Farris | |
| Jordan M. Farris | ||
| Chief Administrative Officer | ||
| (principal executive officer) |
Date: October 6, 2021
| By (Signature and Title) | /s/ E. Scott Wickerham | |
| E. Scott Wickerham | ||
| Vice President and Controller | ||
| (principal financial officer) |
Date: October 6, 2021