Exhibit 99.1
PRO FORMA VALUATION REPORT
SECOND-STEP CONVERSION
MSB Financial Corp. | Millington, New Jersey
PROPOSED HOLDING COMPANY FOR:
Millington Savings Bank | Millington, New Jersey
Dated as of February 6, 2015

1100 North Glebe Road Suite 600
Arlington, Virginia 22201
703.528.1700
rpfinancial.com

February 6, 2015
Boards of Directors
MSB Financial, MHC
MSB Financial Corp.
Millington Savings Bank
1902 Long Hill Road
Millington, New Jersey 07946
Members of the Boards of Directors:
At your request, we have completed and hereby provide an independent appraisal (“Appraisal”) of the estimated pro forma market value of the common stock which is to be issued in connection with the mutual-to-stock conversion transaction described below.
This Appraisal is furnished pursuant to the requirements stipulated in the Code of Federal Regulations and has been prepared in accordance with the “Guidelines for Appraisal Reports for the Valuation of Savings and Loan Associations Converting from Mutual to Stock Form of Organization” (the “Valuation Guidelines”) of the Office of Thrift Supervision (“OTS”) and accepted by the Federal Reserve Board (“FRB”), the Federal Deposit Insurance Corporation (“FDIC”), the Office of the Comptroller of the Currency (“OCC”) and the New Jersey Department of Banking and Insurance (the “Department”), and applicable regulatory interpretations thereof.
Description of Plan of Conversion
On November 17, 2014, the Boards of Directors of MSB Financial, MHC (the “MHC”), MSB Financial Corp. (“MSBF”) and Millington Savings Bank (the “Bank”) adopted a plan of conversion whereby the MHC will convert to stock form. As a result of the conversion, MSBF, which currently owns all of the issued and outstanding common stock of the Bank, will be succeeded by a new Maryland corporation with the name of MSB Financial Corp. (“MSB Financial” or the “Company”). Following the conversion, the MHC will no longer exist. For purposes of this document, the existing consolidated entity will hereinafter also be referred to as MSB Financial or the Company, unless otherwise identified as MSBF. As of December 31, 2014, the MHC had a majority ownership interest in, and its principal asset consisted of, approximately 61.70% of the common stock (the “MHC Shares”) of MSBF. The remaining 38.30% of MSBF’s common stock is owned by public stockholders.
It is our understanding that MSB Financial will offer its stock, representing the majority ownership interest held by the MHC, in a subscription offering to Eligible Account Holders, Tax-Qualified Employee Benefit Plans including the Bank’s employee stock ownership plan (the “ESOP”), Supplemental Eligible Account Holders and Other Depositors. To the extent that shares remain available for purchase after satisfaction of all subscriptions received in the subscription offering, the shares may be offered for sale to the public at large in a community
Washington Headquarters Three Ballston Plaza 1100 North Glebe Road, Suite 600 Arlington, VA 22201 www.rpfinancial.com | Telephone: (703) 528-1700 Fax No.: (703) 528-1788 Toll-Free No.: (866) 723-0594 E-Mail: mail@rpfinancial.com |
Boards of Directors
February 6, 2015
Page 2
offering and a syndicated offering. Upon completing the mutual-to-stock conversion and stock offering (the “second-step conversion”), the Company will be 100% owned by public shareholders, the publicly-held shares of MSBF will be exchanged for shares in the Company at a ratio that retains their ownership interest at the time the conversion is completed and the MHC assets will be consolidated with the Company.
RP® Financial, LC. |
RP® Financial, LC. (“RP Financial”) is a financial consulting firm serving the financial services industry nationwide that, among other things, specializes in financial valuations and analyses of business enterprises and securities, including the pro forma valuation for savings institutions converting from mutual-to-stock form. The background and experience of RP Financial is detailed inExhibit V-1. We believe that, except for the fee we will receive for the Appraisal, we are independent of the Company, the Bank, the MHC and the other parties engaged by the Bank or the Company to assist in the stock conversion process.
Valuation Methodology
In preparing our Appraisal, we have reviewed the regulatory applications of the Company, the Bank and the MHC, including the prospectus as filed with the FRB and the Securities and Exchange Commission (“SEC”). We have conducted a financial analysis of the Company, the Bank and the MHC that has included a review of audited financial information for the fiscal years ended June 30, 2010 through December 31, 2014, a review of various unaudited information and internal financial reports through December 31, 2014, and due diligence related discussions with the Company’s management; BDO USA, LLP, the Company’s independent auditor; Jones Walker LLP, the Company’s conversion counsel and Keefe, Bruyette & Woods, Inc., the Company’s marketing advisor in connection with the stock offering. All assumptions and conclusions set forth in the Appraisal were reached independently from such discussions. In addition, where appropriate, we have considered information based on other available published sources that we believe are reliable. While we believe the information and data gathered from all these sources are reliable, we cannot guarantee the accuracy and completeness of such information.
We have investigated the competitive environment within which MSB Financial operates and have assessed MSB Financial’s relative strengths and weaknesses. We have kept abreast of the changing regulatory and legislative environment for financial institutions and analyzed the potential impact on MSB Financial and the industry as a whole. We have analyzed the potential effects of the stock conversion on MSB Financial’s operating characteristics and financial performance as they relate to the pro forma market value of MSB Financial. We have analyzed the assets held by the MHC, which will be consolidated with MSB Financial’s assets and equity pursuant to the completion of the second-step conversion. We have reviewed the economic and demographic characteristics of the Company’s primary market area. We have compared MSB Financial’s financial performance and condition with selected publicly-traded thrifts in accordance with the Valuation Guidelines, as well as all publicly-traded thrifts and thrift holding companies. We have reviewed the current conditions in the securities markets in general and the market for thrift stocks in particular, including the market for existing thrift issues, initial public offerings by thrifts and thrift holding companies, and second-step conversion offerings. We have excluded from such analyses thrifts subject to announced or rumored acquisition, and/or institutions that exhibit other unusual characteristics.
Boards of Directors
February 6, 2015
Page 3
The Appraisal is based on MSB Financial’s representation that the information contained in the regulatory applications and additional information furnished to us by MSB Financial and its independent auditor, legal counsel and other authorized agents are truthful, accurate and complete. We did not independently verify the financial statements and other information provided by MSB Financial, or its independent auditor, legal counsel and other authorized agents nor did we independently value the assets or liabilities of MSB Financial. The valuation considers MSB Financial only as a going concern and should not be considered as an indication of MSB Financial’s liquidation value.
Our appraised value is predicated on a continuation of the current operating environment for MSB Financial and for all thrifts and their holding companies. Changes in the local, state and national economy, the legislative and regulatory environment for financial institutions and mutual holding companies, the stock market, interest rates, and other external forces (such as natural disasters or significant world events) may occur from time to time, often with great unpredictability and may materially impact the value of thrift stocks as a whole or the value of MSB Financial’s stock alone. It is our understanding that there are no current plans for selling control of MSB Financial following completion of the second-step conversion. To the extent that such factors can be foreseen, they have been factored into our analysis.
The estimated pro forma market value is defined as the price at which MSB Financial’s common stock, immediately upon completion of the second-step stock offering, would change hands between a willing buyer and a willing seller, neither being under any compulsion to buy or sell and both having reasonable knowledge of relevant facts.
In preparing the pro forma pricing analysis we have taken into account the pro forma impact of the MHC’s net assets (i.e., unconsolidated equity) that will be consolidated with the Company and thus will slightly increase equity. After accounting for the impact of the MHC’s net assets and the $1.6 million of aggregate dividends that were waived by the MHC, the public shareholders’ ownership interest was reduced by approximately 1.69%. Accordingly, for purposes of the Company’s pro forma valuation, the public shareholders’ pro forma ownership interest was reduced from 38.30% to 36.69% and the MHC’s ownership interest was increased from 61.70% to 63.31%.
Valuation Conclusion
It is our opinion that, as of February 6, 2015, the estimated aggregate pro forma valuation of the shares of the Company to be issued and outstanding at the end of the conversion offering – including (1) newly-issued shares representing the MHC’s current ownership interest in the Company and (2) exchange shares issued to existing public shareholders of MSBF – was $45,019,550 at the midpoint, equal to 4,501,955 shares at $10.00 per share. The resulting range of value and pro forma shares, all based on $10.00 per share, are as follows: $38,266,620 or 3,826,662 shares at the minimum, $51,772,480 or 5,177,248 shares at the maximum and $59,538,350 or 5,953,835 shares at the super maximum.
Boards of Directors
February 6, 2015
Page 4
Based on this valuation and taking into account the ownership interest represented by the shares owned by the MHC, the midpoint of the offering range is $28,500,000 equal to 2,850,000 shares at $10.00 per share. The resulting offering range and offering shares, all based on $10.00 per share, are as follows: $24,225,000 or 2,422,500 shares at the minimum, $32,775,000 or 3,277,500 shares at the maximum and $37,691,250 or 3,769,125 shares at the super maximum,
Establishment of the Exchange Ratio
The conversion regulations provide that in a conversion of a mutual holding company, the minority stockholders are entitled to exchange the public shares for newly issued shares in the fully converted company. The Boards of Directors of the MHC, MSBF and the Bank have independently determined the exchange ratio, which has been designed to preserve the current aggregate percentage ownership in the Company (adjusted for the dilution resulting from the dividends waived by the MHC and consolidation of the MHC’s unconsolidated equity into the Company). The exchange ratio to be received by the existing minority shareholders of the Company will be determined at the end of the offering, based on the total number of shares sold in the offering and the final appraisal. Based on the valuation conclusion herein, the resulting offering value and the $10.00 per share offering price, the indicated exchange ratio at the midpoint is 0.8608 shares of the Company’s stock for every one share held by public shareholders. Furthermore, based on the offering range of value, the indicated exchange ratio is 0.7317 at the minimum, 0.9899 at the maximum and 1.1384 at the super maximum. RP Financial expresses no opinion on the proposed exchange of newly issued Company shares for the shares held by the public stockholders or on the proposed exchange ratio.
Limiting Factors and Considerations
The valuation is not intended, and must not be construed, as a recommendation of any kind as to the advisability of purchasing shares of the common stock. Moreover, because such valuation is determined in accordance with applicable regulatory guidelines and is necessarily based upon estimates and projections of a number of matters, all of which are subject to change from time to time, no assurance can be given that persons who purchase shares of common stock in the conversion offering, or prior to that time, will thereafter be able to buy or sell such shares at prices related to the foregoing valuation of the estimated pro forma market value thereof. The appraisal reflects only a valuation range as of this date for the pro forma market value of MSB Financial immediately upon issuance of the stock and does not take into account any trading activity with respect to the purchase and sale of common stock in the secondary market on the date of issuance of such securities or at anytime thereafter following the completion of the second-step conversion.
RP Financial’s valuation was based on the financial condition, operations and shares outstanding of MSB Financial as of December 31, 2014, the date of the financial data included in the prospectus. The proposed exchange ratio to be received by the current public stockholders of MSBF and the exchange of the public shares for newly issued shares of MSB Financial’s common stock as a full public company was determined independently by the Boards of Directors of the MHC, MSBF and the Bank. RP Financial expresses no opinion on the proposed exchange ratio to public stockholders or the exchange of public shares for newly issued shares.
Boards of Directors
February 6, 2015
Page 5
RP Financial is not a seller of securities within the meaning of any federal and state securities laws and any report prepared by RP Financial shall not be used as an offer or solicitation with respect to the purchase or sale of any securities. RP Financial maintains a policy which prohibits RP Financial, its principals or employees from purchasing stock of its client institutions.
This valuation will be updated as provided for in the conversion regulations and guidelines. These updates will consider, among other things, any developments or changes in the financial performance and condition of MSB Financial, management policies, and current conditions in the equity markets for thrift shares, both existing issues and new issues. These updates may also consider changes in other external factors which impact value including, but not limited to: various changes in the legislative and regulatory environment for financial institutions, the stock market and the market for thrift stocks, and interest rates. Should any such new developments or changes be material, in our opinion, to the valuation of the shares, appropriate adjustments to the estimated pro forma market value will be made. The reasons for any such adjustments will be explained in the update at the date of the release of the update. The valuation will also be updated at the completion of MSB Financial’s stock offering.
| Respectfully submitted, |
| RP® FINANCIAL, LC. |
 |
| William E. Pommerening |
| Chief Executive Officer and Managing Director |
 |
| Gregory E. Dunn |
| Director |
| RP® Financial, LC. | TABLE OF CONTENTS | |
| i |
TABLE OF CONTENTS
MSB FINANCIAL CORP.
MILLINGTON SAVINGS BANK
Millington, New Jersey
DESCRIPTION | PAGE | |||
| CHAPTER ONE | OVERVIEW AND FINANCIAL ANALYSIS | |||
Introduction | I.1 | |||
Plan of Conversion | I.1 | |||
Strategic Overview | I.2 | |||
Balance Sheet Trends | I.4 | |||
Income and Expense Trends | I.8 | |||
Interest Rate Risk Management | I.11 | |||
Lending Activities and Strategy | I.12 | |||
Asset Quality | I.15 | |||
Funding Composition and Strategy | I.15 | |||
Subsidiaries | I.16 | |||
Legal Proceedings | I.16 | |||
| CHAPTER TWO | MARKET AREA ANALYSIS | |||
Introduction | II.1 | |||
National Economic Factors | II.1 | |||
Market Area Demographics | II.4 | |||
Regional Economy | II.7 | |||
Unemployment Trends | II.8 | |||
Market Area Deposit Characteristics and Competition | II.8 | |||
| CHAPTER THREE | PEER GROUP ANALYSIS | |||
Peer Group Selection | III.1 | |||
Financial Condition | III.4 | |||
Income and Expense Components | III.8 | |||
Loan Composition | III.11 | |||
Interest Rate Risk | III.11 | |||
Credit Risk | III.14 | |||
Summary | III.14 | |||
| RP® Financial, LC. | TABLE OF CONTENTS | |
| ii |
TABLE OF CONTENTS
MSB FINANCIAL CORP.
MILLINGTON SAVINGS BANK
Millington, New Jersey
(continued)
DESCRIPTION | PAGE | |||
| CHAPTER FOUR | VALUATION ANALYSIS | |||
Introduction | IV.1 | |||
Appraisal Guidelines | IV.1 | |||
RP Financial Approach to the Valuation | IV.1 | |||
Valuation Analysis | IV.2 | |||
1. Financial Condition | IV.3 | |||
2. Profitability, Growth and Viability of Earnings | IV.4 | |||
3. Asset Growth | IV.6 | |||
4. Primary Market Area | IV.6 | |||
5. Dividends | IV.8 | |||
6. Liquidity of the Shares | IV.8 | |||
7. Marketing of the Issue | IV.9 | |||
A. The Public Market | IV.9 | |||
B. The New Issue Market | IV.13 | |||
C. The Acquisition Market | IV.16 | |||
D. Trading in MSB Financial’s Stock | IV.16 | |||
8. Management | IV.17 | |||
9. Effect of Government Regulation and Regulatory Reform | IV.17 | |||
Summary of Adjustments | IV.18 | |||
Valuation Approaches | IV.18 | |||
1. Price-to-Earnings (“P/E”) | IV.20 | |||
2. Price-to-Book (“P/B”) | IV.20 | |||
3. Price-to-Assets (“P/A”) | IV.22 | |||
Comparison to Recent Offerings | IV.22 | |||
Valuation Conclusion | IV.23 | |||
Establishment of the Exchange Ratio | IV.24 | |||
| RP® Financial, LC. | LIST OF TABLES | |
| iii |
LIST OF TABLES
MSB FINANCIAL CORP.
MILLINGTON SAVINGS BANK
Millington, New Jersey
TABLE | DESCRIPTION | PAGE | ||||
| 1.1 | Historical Balance Sheet Data | I.5 | ||||
| 1.2 | Historical Income Statements | I.9 | ||||
| 2.1 | Summary Demographic Data | II.5 | ||||
| 2.2 | Primary Market Area Employment Sectors | II.7 | ||||
| 2.3 | Unemployment Trends | II.8 | ||||
| 2.4 | Deposit Summary | II.9 | ||||
| 2.5 | Market Area Deposit Competitors | II.10 | ||||
| 3.1 | Peer Group of Publicly-Traded Thrifts | III.3 | ||||
| 3.2 | Balance Sheet Composition and Growth Rates | III.6 | ||||
| 3.3 | Income as a % of Average Assets and Yields, Costs, Spreads | III.9 | ||||
| 3.4 | Loan Portfolio Composition and Related Information | III.12 | ||||
| 3.5 | Interest Rate Risk Measures and Net Interest Income Volatility | III.13 | ||||
| 3.6 | Credit Risk Measures and Related Information | III.15 | ||||
| 4.1 | Market Area Unemployment Rates | IV.7 | ||||
| 4.2 | Pricing Characteristics and After-Market Trends | IV.14 | ||||
| 4.3 | Market Pricing Comparatives | IV.15 | ||||
| 4.4 | Public Market Pricing Versus Peer Group | IV.21 | ||||
Exhibit 99.1
| RP® Financial, LC. | OVERVIEW AND FINANCIAL ANALYSIS I.1 |
I. OVERVIEW AND FINANCIAL ANALYSIS
Introduction
Millington Savings Bank (“Millington Savings” or the “Bank”), founded in 1911, is a New Jersey-chartered stock savings bank headquartered in Millington, New Jersey. The Bank currently serves northern New Jersey through the main office and four branch locations. The main office is located in Morris County, approximately 20 miles west of Newark, and all four branch offices are located in Somerset County. The Bank is subject to regulation and oversight by the Federal Deposit Insurance Corporation (the “FDIC”) and the New Jersey Department of Banking and Insurance (the “Department”). The Bank is a member of the Federal Home Loan Bank (“FHLB”) system, and its deposits are insured up to the regulatory maximums by the FDIC. A map of the Bank’s office locations is included as Exhibit I-1.
The Bank completed its initial public during the fiscal year ended June 30, 2007, pursuant to which it sold 2,529,281 shares or 45.00% of its outstanding common stock to the public and issued 3,091,344 shares or 55.00% of its common stock outstanding to MSB Financial, MHC. (the “MHC”). MSB Financial Corp. (“MSBF”), is a federally chartered mid-tier stock holding company of the Bank. MSBF owns 100% of the outstanding common stock of the Bank. Since being formed in 2004, MSBF has been engaged primarily in the business of holding the common stock of the Bank. The MHC and MSBF are subject to supervision and regulation by the Board of Governors of the Federal Reserve System (the “Federal Reserve Board” or the “FRB”). At December 31, 2014, MSBF had total consolidated assets of $340.3 million, deposits of $266.1 million and equity of $41.0 million or 12.06% of total assets. MSBF’s audited financial statements for the most recent period are included by reference as Exhibit I-2.
Plan of Conversion
On November 17, 2014, the respective Board of Directors of the MHC and MSBF adopted a Plan of Conversion, whereby the MHC will convert to stock form. As a result of the conversion, MSBF, which currently owns all of the issued and outstanding common stock of the Bank, will be succeeded by a new Maryland corporation with the name of MSB Financial Corp. (“MSB Financial” or the “Company”). Following the conversion, the MHC will no longer exist. For purposes of this document, the existing consolidated entity will also hereinafter be referred to as MSB Financial or the Company, unless otherwise identified as MSBF. As of December 31,
| RP® Financial, LC. | OVERVIEW AND FINANCIAL ANALYSIS | |
| I.2 |
2014, the MHC had a majority ownership interest of approximately 61.70% in, and its principal asset consisted of, 3,091,344 common stock shares of MSB Financial (the “MHC Shares”). The remaining 1,919,093 shares or approximately 38.30% of MSB Financial’s common stock was owned by public shareholders.
It is our understanding that MSB Financial will offer its stock, representing the majority ownership interest held by the MHC, in a subscription offering to Eligible Account Holders, Tax-Qualified Employee Benefit Plans including the Bank’s employee stock ownership plan (the “ESOP”), Supplemental Eligible Account Holders and Other Depositors. To the extent that shares remain available for purchase after satisfaction of all subscriptions received in the subscription offering, the shares may be offered for sale to the public at large in a community offering and a syndicated offering. Upon completing the mutual-to-stock conversion and stock offering (the “second-step conversion”), the Company will be 100% owned by public shareholders, the publicly-held shares of MSBF will be exchanged for shares in the Company at a ratio that retains their ownership interest at the time the conversion is completed and the MHC assets will be consolidated with the Company.
Strategic Overview
MSB Financial maintains a local community banking emphasis, with a primary strategic objective of meeting the borrowing and savings needs of consumers and businesses in northeast New Jersey. Lending activities by the Company have emphasized the origination of mortgage loans, including 1-4 family permanent mortgage loans, commercial real estate loans, home equity loans and construction loans. Lending diversification by the Company also includes the origination of commercial business loans and consumer loans. Following several years of downsizing the loan portfolio, the Company returned to a loan growth strategy during fiscal 2014 and the first six months of fiscal 2015. The Company’s lending activities are supplemented with investments in securities, which comprise a much smaller portion of the Company’s interest-earning asset composition. U.S. Government agency obligations comprise the largest segment of the Company’s investment portfolio. Assets are primarily funded by retail deposits generated through the branch network, with supplemental funding provided by borrowings as an alternative funding source for purposes of managing funding costs and interest rate risk.
| RP® Financial, LC. | OVERVIEW AND FINANCIAL ANALYSIS | |
| I.3 |
The Company’s lending markets were adversely impacted by the 2008 national recession and the resulting fallout from the financial crisis that occurred with the implosion of the housing market, pursuant to which the Company experienced credit quality deterioration. Over the past five and one-half fiscal years, the Company’s balance of non-performing assets peaked at $17.2 million or 4.69% of assets at fiscal yearend 2011. Since fiscal yearend 2011, the balance of non-performing assets has trended lower with most significant decrease occurring during fiscal 2014. Non-performing assets totaled $7.4 million or 1.79% of assets at December 31, 2014.
MSB Financial’s earnings base is largely dependent upon net interest income and operating expense levels. Overall, the Company has experienced net interest margin compression since fiscal 2011, as loan portfolio shrinkage and maintenance of relatively high balances of non-performing loans negatively interest-earning asset yields. However, since fiscal 2013 net interest margins have improved slightly, as a resumption of loan growth and a decrease in non-performing loans have helped to preserve interest-earning asset yields. Operating expenses have been maintained at relatively stable levels as a percent of average assets, as the Company was effective in reducing operating expenses during periods of asset shrinkage. Revenues derived from non-interest operating income sources have been a relatively limited contributor to the Company’s core earnings base, with such income consisting mostly of customer fees and service charges and income from bank owned life insurance.
A key component of the Company’s business plan is to complete a second-step conversion offering. The post-offering business plan of the Company is expected to continue to focus on implementing strategic initiatives to develop and grow a full service community banking franchise. Accordingly, MSB Financial will continue to be an independent full service community bank, with a commitment to meeting the retail and commercial banking needs of individuals and businesses in northeast New Jersey.
The capital realized from the stock offering will increase the Company’s operating flexibility and allow for continued growth of the balance sheet. The additional capital realized from stock proceeds will increase liquidity to support funding of future loan growth and other interest-earning assets. The Company’s strengthened capital position will also provide more of a cushion against potential credit quality related losses, as the Company continues to implement workout strategies to reduce the balance of non-performing assets. MSB Financial’s higher capital position resulting from the infusion of stock proceeds will also serve to reduce
| RP® Financial, LC. | OVERVIEW AND FINANCIAL ANALYSIS | |
| I.4 |
interest rate risk, particularly through enhancing the Company’s interest-earning assets/interest-bearing liabilities (“IEA/IBL”) ratio. The additional funds realized from the stock offering will serve to raise the level of interest-earning assets funded with equity and, thereby, reduce the ratio of interest-earning assets funded with interest-bearing liabilities as the balance of interest-bearing liabilities will initially remain relatively unchanged following the conversion, which may facilitate a reduction in MSB Financial’s funding costs. Additionally, MSB Financial’s higher equity-to-assets ratio will enable the Company to pursue expansion opportunities. Such expansion would most likely occur through the establishment or acquisition of additional banking offices or customer facilities that would increase market penetration in the markets currently served by the Company or to gain a market presence into nearby complementary markets. The Company will also be better positioned to pursue growth through acquisition of other financial service providers following the stock offering, given its strengthened capital position and ability to offer stock as consideration. At this time, the Company has no specific plans for expansion. The projected uses of proceeds are highlighted below.
| • | MSB Financial. The Company is expected to retain up to 50% of the net offering proceeds. At present, funds at the Company level, net of the loan to the ESOP, are expected to be primarily invested initially into liquid funds held as a deposit at the Bank. Over time, the funds may be utilized for various corporate purposes, possibly including acquisitions, infusing additional equity into the Bank, repurchases of common stock, and the payment of cash dividends. |
| • | Millington Savings Bank. Approximately 50% of the net stock proceeds will be infused into the Bank in exchange for all of the Bank’s stock. Cash proceeds (i.e., net proceeds less deposits withdrawn to fund stock purchases) infused into the Bank are anticipated to become part of general operating funds, and are expected to be primarily utilized to fund loan growth over time. |
Overall, it is the Company’s objective to pursue growth that will serve to increase returns, while, at the same time, growth will not be pursued that could potentially compromise the overall risk associated with MSB Financial’s operations.
Balance Sheet Trends
Table 1.1 shows the Company’s historical balance sheet data for the past five and one-half fiscal years. In November 2014, the Company switched from a June 30 to a December 31 fiscal year, effective immediately. Since fiscal yearend 2010, the Company recorded a decrease in assets in every year except fiscal year 2013. Overall, assets decreased at an annual rate of 1.17% from June 30, 2010 through December 31, 2014. Asset shrinkage was
| RP® Financial, LC. | OVERVIEW AND FINANCIAL ANALYSIS | |
| I.5 |
Table 1.1
MSB Financial Corp.
Historical Balance Sheet Data
| 06/30/10- | ||||||||||||||||||||||||||||||||||||||||||||||||||||
| At Fiscal Year Ended | 12/31/14 | |||||||||||||||||||||||||||||||||||||||||||||||||||
| At Fiscal Year Ended June 30, | December 31, | Annual. | ||||||||||||||||||||||||||||||||||||||||||||||||||
| 2010 | 2011 | 2012 | 2013 | 2014 | 2014 | Growth Rate | ||||||||||||||||||||||||||||||||||||||||||||||
| Amount | Pct(1) | Amount | Pct(1) | Amount | Pct(1) | Amount | Pct(1) | Amount | Pct(1) | Amount | Pct(1) | Pct | ||||||||||||||||||||||||||||||||||||||||
| ($000) | (%) | ($000) | (%) | ($000) | (%) | ($000) | (%) | ($000) | (%) | ($000) | (%) | (%) | ||||||||||||||||||||||||||||||||||||||||
Total Amount of: | ||||||||||||||||||||||||||||||||||||||||||||||||||||
Assets | $ | 358,743 | 100.00 | % | $ | 349,459 | 100.00 | % | $ | 347,347 | 100.00 | % | $ | 352,470 | 100.00 | % | $ | 345,124 | 100.00 | % | $ | 340,252 | 100.00 | % | -1.17 | % | ||||||||||||||||||||||||||
Cash and cash equivalents | 21,144 | 5.89 | % | 30,976 | 8.86 | % | 33,757 | 9.72 | % | 24,755 | 7.02 | % | 7,308 | 2.12 | % | 7,519 | 2.21 | % | -20.53 | % | ||||||||||||||||||||||||||||||||
Investment securities | 47,523 | 13.25 | % | 41,753 | 11.95 | % | 50,758 | 14.61 | % | 80,912 | 22.96 | % | 84,932 | 24.61 | % | 78,518 | 23.08 | % | 11.80 | % | ||||||||||||||||||||||||||||||||
Loans receivable, net | 265,814 | 74.10 | % | 253,251 | 72.47 | % | 240,520 | 69.24 | % | 223,256 | 63.34 | % | 230,275 | 66.72 | % | 231,449 | 68.02 | % | -3.03 | % | ||||||||||||||||||||||||||||||||
FHLB stock | 1,404 | 0.39 | % | 1,384 | 0.40 | % | 1,365 | 0.39 | % | 1,827 | 0.52 | % | 2,190 | 0.63 | % | 1,710 | 0.50 | % | 4.48 | % | ||||||||||||||||||||||||||||||||
Bank owned life insurance | 5,717 | 1.59 | % | 5,913 | 1.69 | % | 6,115 | 1.76 | % | 6,919 | 1.96 | % | 7,136 | 2.07 | % | 7,246 | 2.13 | % | 5.41 | % | ||||||||||||||||||||||||||||||||
Deposits | 296,401 | 82.62 | % | 286,175 | 81.89 | % | 283,798 | 81.70 | % | 280,467 | 79.57 | % | 263,389 | 76.32 | % | 266,068 | 78.20 | % | -2.37 | % | ||||||||||||||||||||||||||||||||
Borrowings | 20,000 | 5.58 | % | 20,000 | 5.72 | % | 20,000 | 5.76 | % | 30,000 | 8.51 | % | 38,000 | 11.01 | % | 30,000 | 8.82 | % | 9.43 | % | ||||||||||||||||||||||||||||||||
Equity | 39,968 | 11.14 | % | 40,680 | 11.64 | % | 40,878 | 11.77 | % | 39,391 | 11.18 | % | 40,688 | 11.79 | % | 41,025 | 12.06 | % | 0.58 | % | ||||||||||||||||||||||||||||||||
Loans/Deposits | 87.52 | % | 86.26 | % | 82.15 | % | 84.03 | % | 82.07 | % | 78.28 | % | ||||||||||||||||||||||||||||||||||||||||
Full Service Banking Offices Open | 5 | 5 | 5 | 5 | 5 | 5 | ||||||||||||||||||||||||||||||||||||||||||||||
| (1) | Ratios are as a percent of ending assets. |
| Sources: | MSB Financial’s prospectus, audited and unaudited financial statements and RP Financial calculations. |
| RP® Financial, LC. | OVERVIEW AND FINANCIAL ANALYSIS | |
| I.6 |
mostly due to a decrease in loans receivable, which was largely offset by an increase in investment securities. A summary of MSB Financial’s key operating ratios for the past five and one-half fiscal years is presented in Exhibit I-3.
MSB Financial’s loans receivable portfolio decreased at a 3.03% annual rate from fiscal yearend 2010 through December 31, 2104, in which loans declined from fiscal yearend 2010 through fiscal yearend 2013 followed by loan growth during the past one and one-half fiscal years. The Company’s comparatively higher rate of loan shrinkage relative to asset shrinkage provided for a decrease in the loans-to-assets ratio from 74.10% at June 30, 2010 to 68.02% at December 31, 2014. Net loans receivable at December 31, 2014 totaled $231.4 million, versus $265.8 million at June 30, 2010.
The decline in the loans receivable balance since fiscal yearend 2010 was mostly attributable to decreases in 1-4 family permanent mortgage loans, home equity loans and construction loans. While the balance of 1-4 family permanent mortgage loans has declined since fiscal yearend 2010, the concentration of 1-family permanent mortgage loans comprising total loans increased from 56.94% at June 30, 2010 to 61.19% at December 31, 2014. Home equity loans comprise the second largest segment of the loan portfolio equal to 15.55% of total loans at December 31, 2014, versus 20.86% of total loans at June 30, 2010. Similarly, construction loans decreased from 6.10% of total loans at June 30, 2010 to 5.34% of total loans at December 31, 2014. Comparatively, maintenance of relatively stable balances of commercial real estate loans, commercial business loans and consumer loans served to increase the concentration of those loans as a percent of total loans. From June 30, 2010 to December 31, 2014, commercial real estate loans increased from 12.39% to 13.35% of total loans, commercial business loans increased from 3.37% to 4.08% of total loans and consumer loans increased from 0.34% to 0.49% of total loans.
The intent of the Company’s investment policy is to provide adequate liquidity and to generate a favorable return within the context of supporting overall credit and interest rate risk objectives. It is anticipated that proceeds retained at the holding company level will primarily be invested into liquid funds held as a deposit at the Bank. Since fiscal yearend 2010, the Company’s level of cash and investment securities (inclusive of FHLB stock) ranged from a low of 19.53% of assets at fiscal yearend 2010 to a high of 30.49% of assets at fiscal yearend 2013. As of December 31, 2014, the Company’s cash and investments totaled $87.7 million or 25.79% of total assets. U.S. Government agency obligations totaling $44.2 million comprised the most
| RP® Financial, LC. | OVERVIEW AND FINANCIAL ANALYSIS | |
| I.7 |
significant component of the Company’s investment portfolio at December 31, 2014. Other investments held by the Company at December 31, 2014 consisted of mortgage-backed securities ($25.4 million), corporate bonds ($4.6 million) and certificates of deposit (“CDs”) maintained in other financial institutions ($4.3 million). The mortgage-backed securities portfolio consists of securities that are guarantee by Government Sponsored Enterprises (“GSEs”). As of December 31, 2014, the entire investment portfolio was maintained as held-to-maturity. Exhibit I-4 provides historical detail of the Company’s investment portfolio. As of December 31, 2014, the Company also held $7.5 million of cash and cash equivalents and $1.7 million of FHLB stock.
The Company also maintains an investment in bank-owned life insurance (“BOLI”) policies, which covers the lives of some of MSB Financial’s Board members and senior officers. The purpose of the investment is to provide funding for the benefit plans of the covered individuals. The life insurance policies earn tax-exempt income through cash value accumulation and death proceeds. As of December 31, 2014, the cash surrender value of the Company’s BOLI equaled $7.2 million or 2.13% of assets.
Over the past five and one-half fiscal years, MSB Financial’s funding needs have been addressed through a combination of deposits, borrowings and internal cash flows. From fiscal yearend 2010 through December 31, 2014, the Company’s deposits decreased at a 2.37% annual rate. Deposits trended lower from June 30, 2010 through June 30, 2014 and then increased during the six months ended December 31, 2014. Overall, deposits decreased from $296.4 million or 82.62% of assets at fiscal yearend 2010 to $266.1 million or 78.20% of assets at December 31, 2014. Transaction and savings account deposits constitute the largest concentration of the Company’s deposits and have increased as a percent of total deposits in recent years.
Borrowings serve as an alternative funding source for the Company to address funding needs for growth and to support management of deposit costs and interest rate risk. From fiscal yearend 2010 through fiscal yearend 2012, the Company’s borrowings remained stable at $20.0 million and then trended higher to a peak balance of $38.0 million at June 30, 2014. As of December 31, 2014, borrowing held by the Company totaled $30.0 million or 8.82% of assets. Overall, borrowings increased at a 9.43% annual rate from fiscal yearend 2010 through December 31, 2014. FHLB advances constitute the only source of borrowings utilized by the Company.
| RP® Financial, LC. | OVERVIEW AND FINANCIAL ANALYSIS | |
| I.8 |
The Company’s equity increased at a 0.58% annual rate from fiscal yearend 2010 through December 31, 2014. Capital growth was largely realized through retention of earnings, partially offset by a net loss reported during fiscal 2013, dividend payments and stock buy backs. Overall, capital growth combined with asset shrinkage provided for an increase in the Company’s equity-to-assets ratio from 11.14% at fiscal yearend 2010 to 12.06% at December 31, 2014. All of the Company’s capital is tangible capital and Millington Savings maintained capital surpluses relative to all of its regulatory capital requirements at December 31, 2014. The addition of stock proceeds will serve to strengthen the Company’s capital position, as well as support growth opportunities. At the same time, the significant increase in MSB Financial’s pro forma capital position will initially depress its ROE.
Income and Expense Trends
Table 1.2 shows the Company’s historical income statements for the past five fiscal years and for the twelve months ended December 31, 2014. The Company’s reported earnings over the past five and one-half fiscal years ranged a net loss of $1.4 million or 0.40% of average assets in fiscal 2013 to net income of $988,000 or 0.29% of average assets in fiscal 2014. For the twelve months ended December 31, 2014, the Company reported net income of $707,000 or 0.21% of average assets. Net interest income and operating expenses represent the primary components of the Company’s earnings. Non-interest operating income has been a relatively limited contributor to the Company’s earnings, while loan loss provisions have had a varied impact on the Company’s earnings over the past five and one-half fiscal years. Non-operating income typically has not been a factor in the Company’s earnings over the past five and one-half fiscal years.
Over the past five and one-half years, the Company’s net interest income to average assets ratio ranged from a low of 2.69% during fiscal 2013 to a high of 3.09% during fiscal 2011. The decline in the Company’s net interest income ratio since fiscal 2011 has been largely attributable to interest rate spread compression that has resulted from a more significant decrease in the yield earned on interest-earnings assets relative to the cost of interest-bearing liabilities. As the result of the prolonged low interest rate environment, the decline in yield earned on less rate sensitive interest-earning assets has become more significant relative to the decline in rate paid on more rate sensitive liabilities which had more significant downward repricing earlier in the prevailing interest rate environment. Furthermore, a shift in the Company’s interest-earning asset composition towards a higher concentration of investments,
| RP® Financial, LC. | OVERVIEW AND FINANCIAL ANALYSIS | |
| I.9 |
Table 1.2
MSB Financial Corp.
Historical Income Statements
| For the Fiscal Year | ||||||||||||||||||||||||||||||||||||||||||||||||
| For the Fiscal Year Ended June 30, | Ended December 31, | |||||||||||||||||||||||||||||||||||||||||||||||
| 2010 | 2011 | 2012 | 2013 | 2014 | 2014 | |||||||||||||||||||||||||||||||||||||||||||
| Amount | Pct(1) | Amount | Pct(1) | Amount | Pct(1) | Amount | Pct(1) | Amount | Pct(1) | Amount | Pct(1) | |||||||||||||||||||||||||||||||||||||
| ($000) | (%) | ($000) | (%) | ($000) | (%) | ($000) | (%) | ($000) | (%) | ($000) | (%) | |||||||||||||||||||||||||||||||||||||
Interest income | $ | 16,850 | 4.67 | % | $ | 15,127 | 4.29 | % | $ | 13,801 | 3.99 | % | $ | 12,032 | 3.47 | % | $ | 11,992 | 3.46 | % | $ | 11,990 | 3.49 | % | ||||||||||||||||||||||||
Interest expense | (6,155 | ) | -1.71 | % | (4,226 | ) | -1.20 | % | (3,336 | ) | -0.96 | % | (2,721 | ) | -0.79 | % | (2,422 | ) | -0.70 | % | (2,346 | ) | -0.68 | % | ||||||||||||||||||||||||
|
|
|
|
|
|
|
|
|
|
|
|
|
|
|
|
|
|
|
|
|
|
|
| |||||||||||||||||||||||||
Net interest income | $ | 10,695 | 2.96 | % | $ | 10,901 | 3.09 | % | $ | 10,465 | 3.02 | % | $ | 9,311 | 2.69 | % | $ | 9,570 | 2.76 | % | $ | 9,644 | 2.80 | % | ||||||||||||||||||||||||
Provision for loan losses | (1,600 | ) | -0.44 | % | (1,686 | ) | -0.48 | % | (2,217 | ) | -0.64 | % | (4,044 | ) | -1.17 | % | (600 | ) | -0.17 | % | (400 | ) | -0.11 | % | ||||||||||||||||||||||||
|
|
|
|
|
|
|
|
|
|
|
|
|
|
|
|
|
|
|
|
|
|
|
| |||||||||||||||||||||||||
Net interest income after provisions | $ | 9,095 | 2.52 | % | $ | 9,215 | 2.62 | % | $ | 8,248 | 2.38 | % | $ | 5,267 | 1.52 | % | $ | 8,970 | 2.59 | % | $ | 9,244 | 2.69 | % | ||||||||||||||||||||||||
Non-interest operating income | $ | 636 | 0.18 | % | $ | 760 | 0.22 | % | $ | 670 | 0.19 | % | $ | 649 | 0.19 | % | $ | 724 | 0.21 | % | $ | 685 | 0.20 | % | ||||||||||||||||||||||||
Non-interest operating expense | (8,449 | ) | -2.34 | % | (8,767 | ) | -2.49 | % | (8,130 | ) | -2.35 | % | (8,289 | ) | -2.39 | % | (8,158 | ) | -2.36 | % | (8,878 | ) | -2.58 | % | ||||||||||||||||||||||||
|
|
|
|
|
|
|
|
|
|
|
|
|
|
|
|
|
|
|
|
|
|
|
| |||||||||||||||||||||||||
Net operating income | $ | 1,282 | 0.36 | % | $ | 1,208 | 0.34 | % | $ | 788 | 0.23 | % | ($ | 2,373 | ) | -0.69 | % | $ | 1,536 | 0.44 | % | $ | 1,051 | 0.31 | % | |||||||||||||||||||||||
Non-Operating Income | ||||||||||||||||||||||||||||||||||||||||||||||||
Unrealized gain (loss) on trading securities | $ | 9 | 0.00 | % | $ | 13 | 0.00 | % | ($ | 8 | ) | 0.00 | % | $ | 1 | 0.00 | % | $ | 0 | 0.00 | % | $ | 0 | 0.00 | % | |||||||||||||||||||||||
|
|
|
|
|
|
|
|
|
|
|
|
|
|
|
|
|
|
|
|
|
|
|
| |||||||||||||||||||||||||
Net non-operating income | $ | 9 | 0.00 | % | $ | 13 | 0.00 | % | ($ | 8 | ) | 0.00 | % | $ | 1 | 0.00 | % | $ | 0 | 0.00 | % | $ | 0 | 0.00 | % | |||||||||||||||||||||||
Net income before tax | $ | 1,291 | 0.36 | % | $ | 1,221 | 0.35 | % | $ | 780 | 0.23 | % | ($ | 2,372 | ) | -0.68 | % | $ | 1,536 | 0.44 | % | $ | 1,051 | 0.31 | % | |||||||||||||||||||||||
Income tax provision | (485 | ) | -0.13 | % | (515 | ) | -0.15 | % | (283 | ) | -0.08 | % | 987 | 0.29 | % | (548 | ) | -0.16 | % | (344 | ) | -0.10 | % | |||||||||||||||||||||||||
|
|
|
|
|
|
|
|
|
|
|
|
|
|
|
|
|
|
|
|
|
|
|
| |||||||||||||||||||||||||
Net income (loss) | $ | 806 | 0.22 | % | $ | 706 | 0.20 | % | $ | 497 | 0.14 | % | ($ | 1,385 | ) | -0.40 | % | $ | 988 | 0.29 | % | $ | 707 | 0.21 | % | |||||||||||||||||||||||
Adjusted Earnings | ||||||||||||||||||||||||||||||||||||||||||||||||
Net income | $ | 806 | 0.22 | % | $ | 706 | 0.20 | % | $ | 497 | 0.14 | % | ($ | 1,385 | ) | -0.40 | % | $ | 988 | 0.29 | % | $ | 707 | 0.21 | % | |||||||||||||||||||||||
Add (Deduct): Net gain/(loss) on sale | (9 | ) | 0.00 | % | (13 | ) | 0.00 | % | 8 | 0.00 | % | (1 | ) | 0.00 | % | 0 | 0.00 | % | 0 | 0.00 | % | |||||||||||||||||||||||||||
Tax effect (2) | 3 | 0.00 | % | 5 | 0.00 | % | (3 | ) | 0.00 | % | — | 0.00 | % | — | 0.00 | % | — | 0.00 | % | |||||||||||||||||||||||||||||
|
|
|
|
|
|
|
|
|
|
|
|
|
|
|
|
|
|
|
|
|
|
|
| |||||||||||||||||||||||||
Adjusted earnings | $ | 800 | 0.22 | % | $ | 698 | 0.20 | % | $ | 502 | 0.14 | % | ($ | 1,386 | ) | -0.40 | % | $ | 988 | 0.29 | % | $ | 707 | 0.21 | % | |||||||||||||||||||||||
Expense Coverage Ratio (3) | 1.26x | 1.24x | 1.29x | 1.12x | 1.17x | 1.09x | ||||||||||||||||||||||||||||||||||||||||||
Efficiency Ratio (4) | 74.52 | % | 75.23 | % | 73.21 | % | 82.99 | % | 79.46 | % | 86.00 | % | ||||||||||||||||||||||||||||||||||||
Effective tax rate | 37.57 | % | 42.18 | % | 36.28 | % | 41.61 | % | 35.68 | % | 32.73 | % | ||||||||||||||||||||||||||||||||||||
| (1) | Ratios are as a percent of average assets. |
| (2) | Assumes a 37.5% effective tax rate. |
| (3) | Expense coverage ratio calculated as net interest income before provisions for loan losses divided by operating expenses. |
| (4) | Efficiency ratio calculated as operating expenses divided by the sum of net interest income before provisions for loan losses plus other income (excluding non-operating gains). |
| Sources: | MSB Financial’s prospectus, audited & unaudited financial statements and RP Financial calculations. |
| RP® Financial, LC. | OVERVIEW AND FINANCIAL ANALYSIS | |
| I.10 |
which earn lower yields relative to loans, also placed downward pressure on the average yield earned on interest-earning assets. Overall, during the past five and one-half fiscal years, the Company’s interest rate spread decreased from a peak of 3.33% during fiscal 2011 to a low of 2.84% during the six months ended December 31, 2013. The Company’s interest rate spread for the six months ended December 31, 2014 of 2.87% was up slightly compared to the year ago six month period interest rate spread which was realized through a 0.01% increase in yield on interest-earning assets and a 0.02% decrease in the average cost of interest-bearing liabilities. The increase in yield and reduction in cost of funds was facilitated by funding loan growth, the pay down of borrowings and run-off of CDs with lower yielding cash and investments. Since fiscal 2013, the Company’s net interest income to average assets ratio has edged up slightly to equal 2.80% for the twelve months ended December 31, 2014. The Company’s net interest rate spreads and yields and costs for the past five and one-quarter years are set forth in Exhibit I-3 and Exhibit I-5.
Non-interest operating income has been a fairly stable contributor to the Company’s earnings, averaging a modest 0.20% of average assets over the five and one-half year period covered in Table 1.2. For the twelve months ended December 31, 2014, non-interest operating income amounted to $685,000 or 0.20% of average assets. Fees and service charges and income from BOLI constitute the major components of the Company’s non-interest operating revenues.
Operating expenses represent the other major component of the Company’s earnings, which have been effectively contained by the Company such that the operating expense ratio as a percent of average assets did not increase during periods of asset shrinkage. For the twelve months ended December 31, 2014, operating expenses amounted to $8.8 million or 2.58% of average assets. Comparatively, during the past five fiscal years, operating expense ranged from $8.1 million or 2.35% of average assets during fiscal 2012 to $8.8 million or 2.49% of average assets during fiscal 2011. Operating expenses were approximately $700,000 higher for the twelve months ended December 31, 2014 compared to the fiscal year ended June 30, 2014, which was primarily related to a $439,000 wire fraud loss recorded in December 2014. Containment of operating expenses has been facilitated by the Company’s limited diversification into other fee-based products and services that would increase staffing requirements.
Overall, the general trends in the Company’s net interest income ratio and operating expense ratio over the past five and one-half fiscal years showed a slight decline in core
| RP® Financial, LC. | OVERVIEW AND FINANCIAL ANALYSIS | |
| I.11 |
earnings, as indicated by the Company’s expense coverage ratios (net interest income divided by operating expenses). MSB Financial’s expense coverage ratio equaled 1.26 times during fiscal 2010, versus a ratio of 1.09 times during the twelve months ended December 31, 2014. Likewise, MSB Financial’s efficiency ratio (operating expenses as a percent of the sum of net interest income and other operating income) of 74.52% during fiscal 2010 was more favorable compared to an efficiency ratio of 86.00% during the twelve months ended December 31, 2014.
Over the past five and one-half fiscal years, loan loss provisions established by the Company ranged from a high of $4.0 million or 1.17% of average assets during fiscal 2013 to a low of $400,000 or 0.11% of average assets during the twelve months ended December 31, 2014. The significant reduction in the amount of loan loss provisions established since fiscal 2013 has been supported by improving credit quality trends, including a decline in non-performing assets and lower net charge-offs, and an improving economy along with a recovery in real estate values in the Company’s lending markets. As of December 31, 2014, the Company maintained valuation allowances of $3.6 million, equal to 1.53% of total loans outstanding and 59.75% of non-performing loans. Exhibit I-6 sets forth the Company’s loan loss allowance activity during the past five and one-half fiscal years.
Non-operating income and losses have not been a material factor in the Company’s earnings over the past five and one-half fiscal years, consisting of nominal unrealized gains or losses recorded on trading securities. For the twelve months ended December 31, 2014, the Company did not record any non-operating income.
The Company’s effective tax rate ranged from 32.73% during the twelve months ended December 31, 2014 to 42.18% during fiscal 2011. As set forth in the prospectus, the Company’s effective marginal tax rate is 37.5%.
Interest Rate Risk Management
The Company’s balance sheet is liability-sensitive in the short-term (less than one year) and, thus, the net interest margin will typically be adversely affected during periods of rising and higher interest rates. Comparatively, the Company’s net interest margin benefits from a declining interest rate environment. As interest rates have remained at or near historically low levels for an extended period of time, the Company has experienced interest spread compression as the average yield earned on interest-earning assets has started to decline more relative to the average rate paid on interest-bearing liabilities. The Company’s interest rate risk
| RP® Financial, LC. | OVERVIEW AND FINANCIAL ANALYSIS | |
| I.12 |
analysis indicated that as of December 31, 2014, in the event of a 200 basis point instantaneous and sustained increase in interest rates, Economic Value of Equity would decrease by 7.72% which was within policy limits (see Exhibit I-7).
The Company pursues a number of strategies to manage interest rate risk, particularly with respect to seeking to limit the repricing mismatch between interest rate sensitive assets and liabilities. The Company manages interest rate risk from the asset side of the balance sheet through maintaining an investment portfolio with laddered terms, emphasizing investing in securities with maturities of three years or less, and diversifying into other types of lending beyond 1-4 family permanent mortgage loans which consists primarily of adjustable rate loans or shorter-term fixed rate loans. As of December 31, 2014, ARM loans comprised 29.52% of the dollar amount of all fixed rate and adjustable rate loans due after December 31, 2015 (see Exhibit I-8). On the liability side of the balance sheet, management of interest rate risk has been pursued through utilizing fixed rate FHLB advances with terms out to ten years and emphasizing growth of lower costing and less interest rate sensitive transaction and savings account deposits. Transaction and savings account deposits comprised 63.67% of the Company’s average total deposits for the six months ended December 31, 2014.
The infusion of stock proceeds will serve to further limit the Company’s interest rate risk exposure, as most of the net proceeds will be redeployed into interest-earning assets and the increase in the Company’s capital position will lessen the proportion of interest rate sensitive liabilities funding assets.
Lending Activities and Strategy
MSB Financial’s lending activities have traditionally emphasized 1-4 family permanent mortgage loans and such loans continue to comprise the largest component of the Company’s loan portfolio. Pursuant to the Company’s strategic plan, the Company is pursuing a diversified lending strategy emphasizing commercial real estate and commercial business loans as the primary areas of targeted loan growth. Other areas of lending diversification for the Company include home equity loans, construction loans and consumer loans. Exhibit I-9 provides historical detail of MSB Financial’s loan portfolio composition for the past five and one-half fiscal years and Exhibit I-10 provides the contractual maturity of the Company’s loan portfolio by loan type as of December 31, 2014.
| RP® Financial, LC. | OVERVIEW AND FINANCIAL ANALYSIS | |
| I.13 |
1-4 Family Residential Loans. MSB Financial offers both fixed rate and adjustable rate 1-4 family permanent mortgage loans, which are substantially secured by local properties. Loans are generally underwritten to secondary market guidelines. The Company’s current philosophy is to retain all 1-4 family loan originations for its own portfolio. Fixed rate loans are offered with terms from ranging from five to thirty years. ARM loans offered by the Company have initial repricing terms of five, seven or ten years and then adjust annually for the balance of the loan term. ARM loans are indexed to the U.S. Treasury One Year Constant Maturity. The Company also offers a 30 year two-step loan product, which has an initial fixed rate term of seven or ten years and then resets to a higher fixed rate for the remaining term of the loan. As of December 31, 2014, the Company’s outstanding balance of 1-4 family residential loans totaled $145.0 million or 61.19% of total loans outstanding.
Home Equity Loans and Lines of Credit. The Company’s 1-4 family lending activities include home equity loans and lines of credit. Home equity loans are originated as fixed rate loans with amortization terms up to 30 years. Home equity lines of credit are tied to the prime rate as published inThe Wall Street Journal and are offered for terms of up to 15 years. The Company also offers an interest only home equity line of credit with a ten year draw period followed by a repayment term of 15 years. The Company will originate home equity loans and lines of credit up to a maximum loan-to value (“LTV”) ratio of 80.0%, inclusive of other liens on the property, on owner occupied properties and up to 75.0% on investment properties. LTV limits on interest only home equity lines of credit are 70.0% on owner occupied properties and 60.0% on investment properties. As of December 31, 2014, the Company’s outstanding balance of home equity loans and lines of credit totaled $36.8 million or 15.55% of total loans outstanding.
Commercial Real Estate Loans Commercial real estate loans consist primarily of loans originated by the Company, which are collateralized by properties in the Company’s regional lending area. On a limited basis, the Company also purchases commercial real estate loan participations, which are secured by local properties and meet the Company’s underwriting criteria. MSB Financial originates commercial real estate loans up to a LTV ratio of 75.0% and requires a minimum debt-coverage ratio of 1.25 times. Commercial real estate loans are originated as three to ten year balloon loans with amortization terms of up 25 years or 15 year fixed rate loans. Properties securing the commercial real estate loan portfolio include apartments, service/retail and mixed-use properties, churches and non-profit properties, medical and dental facilities and other commercial real estate. As of December 31, 2014, the Company’s outstanding balance of commercial real estate loans totaled $31.6 million equal to 13.35% of total loans outstanding.
| RP® Financial, LC. | OVERVIEW AND FINANCIAL ANALYSIS | |
| I.14 |
Construction Loans. Construction loans originated by the Company consist of loans to finance the construction for an owner occupied residence or to a builder with a valid contract for sale. The Company also provides financing for speculative residential or commercial construction and development, which requires prior approval by the Board of Directors. Residential and commercial construction loans are interest only variable rate loans indexed to the prime rate as published inThe Wall Street Journal. Construction loans are generally offered for terms of up to 18 months up to a maximum LTV ratio of 80.0% of the appraised value of the completed property. As of December 31, 2014, MSB Financial’s outstanding balance of construction loans equaled $12.7 million or 5.34% of total loans outstanding
Commercial Business Loans The commercial business loan portfolio is generated through extending loans to businesses operating in the local market area. Expansion of commercial business lending activities is a desired area of loan growth for the Company, pursuant to which the Company is seeking to become a full service community bank to its commercial loan customers through offering a full range of commercial loan products that can be packaged with lower cost commercial deposit products. Commercial business loans offered by the Company consist of floating lines of credit indexed toThe Wall Street Journal prime rate and fixed rate term loans with terms of up to 15 years. Depending on the collateral securing the loan, commercial business loans are originated up to a LTV ratio of 80.0% for loans secured by real estate, 75.0% of the purchase price for new equipment, the lesser of 75.0% of the purchase price or current market value for used equipment and 90% of the savings account deposit. The commercial business loan portfolio consists substantially of loans secured by real estate. As of December 31, 2014, MSB Financial’s outstanding balance of commercial business loans equaled $9.7 million or 4.08% of total loans outstanding.
Consumer Loans The Company’s diversification into consumer lending has been limited, with such loans generally consisting of automobile loans, secured and unsecured personal loans, loans secured by deposits and overdraft lines of credit. As of December 31, 2014, MSB Financial’s outstanding balance of consumer loans equaled $1.2 million or 0.49% of total loans outstanding.
| RP® Financial, LC. | OVERVIEW AND FINANCIAL ANALYSIS | |
| I.15 |
Asset Quality
Historically, the Company’s lending emphasis on lending in local and familiar markets generally supported maintenance of relatively favorable credit quality measures. However, with the onset of the national recession and bursting of the housing bubble in 2008, the Company experienced elevated levels of problems assets. Over the past five and one-half fiscal years, MSB Financial’s balance of non-performing assets ranged from a high of $17.2 million or 4.93% of assets at fiscal yearend 2011 to a low of $7.4 million or 2.16% of assets at December 31, 2014. As shown in Exhibit I-11, non-performing assets at December 31, 2014 consisted of $5.7 million of non-accruing loans, $360,000 of accruing loans 90 days or more past due and $1.3 million of other real estate owned. Most of the reduction in the balance of non-performing loans since fiscal yearend 2011 was due to a decrease in the balance of non-accruing loans, which consisted primarily of 1-4 family permanent mortgage loans, commercial real estate loans and construction loans.
To track the Company’s asset quality and the adequacy of valuation allowances, the Company has established detailed asset classification policies and procedures which are consistent with regulatory guidelines. Classified assets are reviewed monthly by senior management and the Board. Pursuant to these procedures, when needed, the Company establishes additional valuation allowances to cover anticipated losses in classified or non-classified assets. As of December 31, 2014, the Company maintained loan loss allowances of $3.6 million, equal to 1.53% of total loans outstanding and 59.75% of non-performing loans.
Funding Composition and Strategy
Deposits have consistently served as the Company’s primary funding source and at December 31, 2014 deposits accounted for 89.87% of the Company’s combined balance of deposits and borrowings. Exhibit I-12 sets forth the Company’s deposit composition for the past three and one-half fiscal years. Transaction and savings account deposits constituted 63.67% of average total deposits during the six months ended December 31, 2014, as compared to 57.22% of average total deposits during the fiscal year ended June 30, 2012. The increase in the concentration of core deposits comprising total deposits since fiscal 2012 was primarily realized through a decline in CDs and, to a lesser extent, growth of core deposits. Growth of core deposits since fiscal 2012 was due to growth of demand deposits, partially offset by a decline in savings account deposits. Demand deposits comprised 25.81% of average total deposits and 40.53% of average core deposits during the six months ended December 31, 2014.
| RP® Financial, LC. | OVERVIEW AND FINANCIAL ANALYSIS | |
| I.16 |
The balance of the Company’s deposits consists of CDs, which comprised 36.33% of average total deposits during the six months ended December 31, 2014 compared to 42.78% of average total deposits during fiscal year ended June 30, 2012. MSB Financial’s current CD composition reflects a higher concentration of short-term CDs (maturities of one year or less). The CD portfolio totaled $93.9 million at December 31, 2014 and $57.0 million or 60.35% of the CDs were scheduled to mature in one year or less. Exhibit I-13 sets forth the maturity schedule of the Company’s CDs as of December 31, 2014. As of December 31, 2014, jumbo CDs (CD accounts with balances of $100,000 or more) amounted to $41.5 million or 44.13% of total CDs. The Company did not maintain any brokered CDs at December 31, 2014.
Borrowings serve as an alternative funding source for the Company to facilitate management of funding costs and interest rate risk Borrowings totaled $30.0 million at December 31, 2014 and consisted of fixed rate FHLB advances with initial terms of three and ten years. At December 31, 2014, the weighted average interest rate on the term FHLB advances was 2.50%. Exhibit I-14 provided further detail of the Company’s borrowings.
Subsidiaries
MSB Financial has no direct subsidiaries other than the Bank. The Bank has one wholly-owned subsidiary, Millington Savings Service Corp. formed in 1984. The service corporation is currently inactive.
Legal Proceedings
Periodically, the Company has been involved in routine legal proceedings in the ordinary course of business. Such routine legal proceedings, in the aggregate, are believed by management to be immaterial to the Company’s financial condition, results of operations and cash flows.
| RP® Financial, LC. | MARKET AREA | |
| II.1 |
II. MARKET AREA
Introduction
MSB Financial is headquartered in Millington, New Jersey and currently serves northern New Jersey through the main office and four branch locations. The main office is located in Morris County, approximately 20 miles west of Newark, and all four branch offices are located in Somerset County. Details regarding the Company’s office properties are set forth in Exhibit II-1.
The Company’s markets are generally suburban in character and possess a relatively large employment base, supported by a diverse array of industries and employers. They also serve as bedroom communities for nearby New York City as well as other nearby suburban areas in central and northern New Jersey and downstate New York. The Company’s competitive environment includes a significant number of thrifts, commercial banks and other financial services companies, some of which have a regional or national presence and many of which are larger than MSB Financial in terms of deposits, loans, scope of operations, and number of branches. Future growth opportunities for MSB Financial depend on the future growth and stability of the national and regional economy, demographic growth trends and the nature and intensity of the competitive environment. These factors have been briefly examined to help determine the growth potential that exists for the Company, the relative economic health of the Company’s market area, and the resultant impact on value.
National Economic Factors
The future success of the Company’s operations is partially dependent upon various national economic trends. In assessing national economic trends over the past few quarters, the employment report for July 2014 showed job growth slowing more than expected, as 209,000 jobs were added in July and the unemployment rate for July edged up to 6.2%. Both manufacturing and non-manufacturing activity expanded at slightly higher rates in July compared to June’s readings. Signs of the recovery in housing gaining traction were indicated by month-over-month increases for July housing starts and sales of existing homes, although new home sales declined from to June to July. Aided by strong sales of aircraft, durable-goods orders jumped by more than 22% in July compared to June. Manufacturing activity expanded at a faster rate in August, while service sector activity growth eased in August. The employment
| RP® Financial, LC. | MARKET AREA | |
| II.2 |
report for August showed only 142,000 jobs were added, which was the smallest increase in eight months. However, the unemployment rate for August edged down to 6.1%, as more people dropped out of the labor force. In contrast to July, housing starts and existing home sales showed month-over-month declines in August, while new home sales were up solidly in August compared to July. After posting a significant increase in July, orders for durable-goods were down by more than 18% in August. The growth rates for manufacturing and service sector activity slowed slightly in September. A stronger-than-expected 248,000 jobs were added to the U.S. economy in September and the September unemployment rate declined to a six-year low of 5.9%. September retail sales were down 0.3% compared to the prior month, while September housing starts showed a 6.3% increase compared to August and sales of existing homes climbed 2.4% in September. New home sales edged up 0.2% in September compared to August. Durable-goods orders fell 1.3% from August to September. Third quarter GDP came in at a 3.5% annual growth rate, which was driven by an increase in military spending.
U.S employers added 214,000 jobs in October 2014, which provided for a decline in the national unemployment rate to 5.8%. Manufacturing activity expanded at a faster rate in October compared to September, while the rate of expansion for the service sector declined slightly from September to October. Retail sales rose 0.3% in October after declining 0.3% in September. October existing home sales jumped to their highest level in more than a year, rising 1.5% from September. Comparatively, new home sales increased 0.7% from September to October. The pace of manufacturing and service sector activity both eased slightly in November compared to October. U.S. employers added 321,000 jobs in November, which was the most in one month since January 2012. The November unemployment rate was unchanged at 5.8% and wage growth showed a slight pick-up in November. Retail sales rose 0.7% in November from October, as retailers got a boost from a sharp drop in gasoline prices. November existing and new home sales declined 6.1% and 1.5%, respectively, from October. Manufacturing and service activity slowed further in December, with service sector activity slipping to a six month low. Employers added 252,000 jobs in December and the December unemployment rate dipped to 5.6%. December retail sales fell 0.9% compared to November, which was largely related to a decline in gasoline spending due to falling oil prices. New and existing home sales rebounded in December, with respective increases of 11.6% and 2.4% compared to the previous month. Comparatively, durable goods orders for December fell 3.4% from November and fourth quarter GDP increased at an annual rate of 2.6% compared to a third quarter annual growth rate of 5.0%.
| RP® Financial, LC. | MARKET AREA | |
| II.3 |
Manufacturing activity for January 2015 declined to its lowest level in a year with an index reading of 53.5 compared to 55.1 for December 2014, as slow global growth started to weigh on demand for goods made in the U.S. Comparatively, service sector activity edged up slightly in January 2015 with an index reading of 56.7 compared to 56.5 for December 2014. U.S. job growth showed a solid increase of 257,000 jobs in January 2015, although the unemployment rate for January edged up to 5.7%.
In terms of interest rates trends over the past few quarters, better-than-expected job growth reflected in the June employment report contributed to long-term Treasury yields increasing slightly at the start of the third quarter of 2014. Treasury yields eased lower in mid-July, as investors moved to safer assets on news that a jet was shot down over eastern Ukraine. The 10-year Treasury yield hovered around 2.50% through the end of July. The policy statement from the Federal Reserve’s end of July meeting indicated that the Federal Reserve would remain patient about raising interest rates and monthly bond purchases by the Federal Reserve would be scaled back by another $10 billion to $25 billion per month. Weaker than expected job growth reflected in the July employment report and turmoil in the Mideast and Ukraine contributed to long-term Treasury yields edging lower in early-August. Low inflation readings and mixed economic data provided for a stable interest rate environment through early-September. Long-term Treasury yields edged higher ahead of the mid-September meeting of the Federal Reserve, with the yield on the on the 10-year Treasury approximating 2.60%. The Federal Reserve concluded its mid-September by maintaining “considerable time” phrasing with respect to its stance on keeping short-term interest rates near zero and concluded its bond buying program with $15 billion of purchases in October.
Treasury yields dipped lower at the start of the fourth quarter of 2014, as investors moved into safe haven investments amid heightened concerns that slowing economic growth in Europe would negatively impact corporate earnings for the third quarter. Heightened volatility in the stock market sustained the bond rally into mid-October. Treasury yields remained fairly stable through the balance of October and the first half of November, as the Federal Reserve concluded its late-October session with a policy statement that confirmed the end of quantitative easing and reaffirmed its commitment to keep interest rates low for the foreseeable future. The Federal Reserve’s policy statement also included a brighter economic outlook. A sharp decline in oil prices and more signs of economic weakness in Europe and Japan served to push long-term Treasury yields lower during the first half of December, which was followed by relatively stable interest rates during the balance of 2014.
| RP® Financial, LC. | MARKET AREA | |
| II.4 |
The 10-year Treasury yield dipped below 2.0% in early-January 2015 and continued to trend lower into mid-January, as investors moved into safe haven investments amid heightened concerns over global economic growth and an increase in financial market turmoil. Long-term Treasury yields continued to edge lower through the end of January, as investors took into consideration economic data suggesting that the economic recovery was losing momentum and indications from the Federal Reserve that it would keep its target rate near zero until at least mid-year. A jump in oil prices and the strong job growth reflected in the January employment report pushed long-term Treasury yields higher in the first week of February, as expectations increased that the Federal Reserve would raise rates in mid-2015. As of February 6, 2015, the bond equivalent yields for U.S. Treasury bonds with terms of one and ten years equaled 0.26% and 1.95%, respectively, versus comparable year ago yields of 0.13% and 2.73%. Exhibit II-2 provides historical interest rate trends.
Based on the consensus outlook of economists surveyed by The Wall Street Journal in January 2015, GDP growth was projected to come in at 2.6% in 2014 and increase to 3.0% in 2015. The unemployment rate was forecasted to decline to 5.2% in December 2015. An average of 240,000 jobs were projected to be added per month during 2015. On average, the economists did not expect the Federal Reserve to begin raising its target rate until mid-2015 at the earliest and the 10-year Treasury yield would increase to 2.87% at the end of 2015. The surveyed economists also forecasted home prices would rise 4.1% in 2015 and housing starts were forecasted to continue to trend slightly higher in 2015.
Market Area Demographics
Key demographic and economic indicators in the Company’s market area include population, number of households and household/per capita income levels. Demographic data for the primary market counties, which consists of Morris County for the Millington main office, and Somerset County for the two Basking Ridge branches and the single branch locations in Bernardsville and Martinsville, as well as comparative data for New Jersey and the U.S., are provided in Table 2.1. Growth trends for Morris County and Somerset County reflect that growth has been occurring throughout the markets served by the Company’s branches. Overall, both counties appear to provide growth potential for the Company based on: (1) the market’s population and household growth trends; and (2) the overall affluence of the market served in terms of various wealth measures, including median household income, per capita income, and household income distribution.
| RP® Financial, LC. | MARKET AREA | |
| II.5 |
Table 2.1
MSB Financial Corp.
Summary Demographic Data
| Year | Growth Rate | |||||||||||||||||||
| 2010 | 2014 | 2019 | 2010-2014 | 2014-2019 | ||||||||||||||||
| (%) | (%) | |||||||||||||||||||
Population (000) | ||||||||||||||||||||
USA | 308,746 | 317,199 | 328,309 | 0.7 | % | 0.7 | % | |||||||||||||
New Jersey | 8,792 | 8,906 | 9,052 | 0.3 | % | 0.3 | % | |||||||||||||
Morris, NJ | 492 | 501 | 512 | 0.4 | % | 0.4 | % | |||||||||||||
Somerset, NJ | 323 | 330 | 338 | 0.5 | % | 0.5 | % | |||||||||||||
Households (000) | ||||||||||||||||||||
USA | 116,716 | 120,163 | 124,623 | 0.7 | % | 0.7 | % | |||||||||||||
New Jersey | 3,214 | 3,258 | 3,316 | �� | 0.3 | % | 0.3 | % | ||||||||||||
Morris, NJ | 181 | 184 | 189 | 0.5 | % | 0.5 | % | |||||||||||||
Somerset, NJ | 118 | 120 | 123 | 0.5 | % | 0.5 | % | |||||||||||||
Median Household Income ($) | ||||||||||||||||||||
USA | NA | 51,579 | 53,943 | NA | 0.9 | % | ||||||||||||||
New Jersey | NA | 69,176 | 71,683 | NA | 0.7 | % | ||||||||||||||
Morris, NJ | NA | 91,208 | 91,080 | NA | 0.0 | % | ||||||||||||||
Somerset, NJ | NA | 95,114 | 96,949 | NA | 0.4 | % | ||||||||||||||
Per Capita Income ($) | ||||||||||||||||||||
USA | NA | 27,721 | 29,220 | NA | 1.1 | % | ||||||||||||||
New Jersey | NA | 35,137 | 36,654 | NA | 0.8 | % | ||||||||||||||
Morris, NJ | NA | 46,181 | 46,286 | NA | 0.0 | % | ||||||||||||||
Somerset, NJ | NA | 46,943 | 47,964 | NA | 0.4 | % | ||||||||||||||
| 0-14 Yrs. | 15-34 Yrs. | 35-54 Yrs. | 55-69 Yrs. | 70+ Yrs. | ||||||||||||||||
2014 Age Distribution (%) | ||||||||||||||||||||
USA | 19.3 | 27.3 | 26.6 | 17.3 | 9.5 | |||||||||||||||
New Jersey | 18.5 | 25.6 | 28.2 | 17.7 | 9.9 | |||||||||||||||
Morris, NJ | 18.0 | 23.1 | 29.7 | 19.0 | 10.3 | |||||||||||||||
Somerset, NJ | 19.0 | 23.0 | 30.6 | 18.3 | 9.1 | |||||||||||||||
| Less Than 25,000 | $25,000 to 50,000 | $50,000 to 100,000 | $100,000+ | |||||||||||||
2014 HH Income Dist. (%) | ||||||||||||||||
USA | 24.4 | 24.4 | 29.8 | 21.3 | ||||||||||||
New Jersey | 18.1 | 19.3 | 29.4 | 33.2 | ||||||||||||
Morris, NJ | 11.1 | 14.0 | 29.8 | 45.1 | ||||||||||||
Somerset, NJ | 9.9 | 14.1 | 28.7 | 47.3 | ||||||||||||
| Source: | SNL Financial, LC. |
| RP® Financial, LC. | MARKET AREA | |
| II.6 |
The size and scope of the Company’s market is evidenced by the demographic data in Table 2.1, which shows that as of 2014 Morris County and Somerset County had total populations of 501,000 and 330,000, respectively. Annual population growth rates from 2010 through 2014 for Morris and Somerset Counties equaled 0.4% and 0.5%, respectively, versus a slightly lower New Jersey growth rate of 0.3% and a higher national growth rate of 0.7%. These population trends are projected to continue over the next five years. Growth in households paralleled population growth trends, with Morris and Somerset Counties posting stronger household growth than New Jersey, but lower household growth compared to the national growth rate for the 2010 through 2014 period. These trends are also projected to continue through 2019.
Median household and per capita income levels in Morris and Somerset Counties exceeded the state and national aggregates. Specifically, 2014 median household income in Morris County and Somerset County equaled $91,208 and $95,114, respectively, as compared to $69,176 for the state of New Jersey and $51,579 for the United States. Per capita income levels as of 2014 equaled $46,181 and $46,943 for Morris County and Somerset County, respectively, compared to $35,137 for New Jersey and $27,721 for the United States. Household income distribution patterns provide further evidence of the relatively affluent nature of the Company’s market, as 74.9% and 76.0% of all households in Morris and Somerset Counties, respectively, had income levels in excess of $50,000 annually in 2014 as compared to 62.6% and 51.1% of all households in New Jersey and the United States, respectively.
Both Morris and Somerset Counties are among the top ten wealthiest counties in the United States. The demographics of Morris County reflect the influence of nearly 50 of the nation’s Fortune 500 companies that are headquartered or have a major facility in Morris County. Industries with a large presence in Morris County include finance, insurance, real estate, pharmaceuticals, health services, research and development, and technology. Comparatively, Somerset County is comprised of a balance between urban and suburban neighborhoods and rural country sides as well, where pharmaceutical and technology companies represent major sources of employment. Both counties also serve as desired suburban locations for commuting into New York City.
| RP® Financial, LC. | MARKET AREA | |
| II.7 |
Regional Economy
The Company’s primary market area has a fairly diversified local economy, with employment in services, wholesale/retail trade, manufacturing, finance, insurance, and real estate, and healthcare serving as the basis of the regional economy. Service jobs represented the largest employment sector in both of the primary market area counties, followed by wholesale/retail trade, which paralleled the state of New Jersey. In comparison to the state of New Jersey, the primary market area counties maintained higher concentrations of employment in the manufacturing and finance, insurance, and real estate employment sectors and a lower concentration of government jobs. Similar to national and statewide trends, service jobs have accounted for most of the recent job growth in the regional economy. Major private employers in Morris County include Novartis (life sciences), Picatinny Arsenal (industrial), Atlantic Health (healthcare) and ADP (services), while in Somerset County major private employers include Citigroup (finance), Johnson & Johnson (pharmaceutical), Met Life (insurance) and Verizon Business (telecommunications). Table 2.2 provides an overview of employment by sector for the primary market area counties and the state of New Jersey.
Table 2.2
MSB Financial Corp.
Primary Market Area Employment Sectors
(Percent of Labor Force)
Employment Sector | New Jersey | Morris County | Somerset County | |||||||||
| (% of Total Employment) | ||||||||||||
Services | 32.0 | % | 34.0 | % | 29.5 | % | ||||||
Wholesale/Retail Trade | 25.2 | % | 23.1 | % | 22.5 | % | ||||||
Healthcare | 9.5 | % | 9.3 | % | 7.1 | % | ||||||
Manufacturing | 7.8 | % | 10.6 | % | 12.9 | % | ||||||
Finance/Insurance/Real Estate | 7.5 | % | 9.8 | % | 11.4 | % | ||||||
Government | 6.7 | % | 3.3 | % | 3.4 | % | ||||||
Construction | 4.5 | % | 4.2 | % | 4.7 | % | ||||||
Transportation/Utility | 4.0 | % | 2.6 | % | 2.4 | % | ||||||
Information | 1.1 | % | 1.4 | % | 3.9 | % | ||||||
Agriculture | 0.9 | % | 1.1 | % | 1.2 | % | ||||||
Other | 0.9 | % | 0.7 | % | 0.9 | % | ||||||
|
|
|
|
|
| |||||||
| 100.0 | % | 100.0 | % | 100.0 | % | |||||||
| Source: | SNL Financial, LC. |
| RP® Financial, LC. | MARKET AREA | |
| II.8 |
Unemployment Trends
Comparative unemployment rates for Morris and Somerset Counties, as well as for the U.S. and New Jersey, are shown in Table 2.3. The December 2014 unemployment rates for Morris and Somerset Counties were the same at 4.2%, below the comparable U.S. and New Jersey unemployment rates of 5.6% and 5.7%, respectively. The comparatively lower unemployment rates indicated for the primary market area counties reflect the strength of the regional economy, which includes a high concentration of white collar professionals. Consistent with the U.S. and New Jersey, Morris and Somerset Counties reported lower unemployment rates in December 2014 compared to a year ago.
Table 2.3
MSB Financial Corp.
Unemployment Trends
Region | December 2013 Unemployment | December 2014 Unemployment | ||||||
USA | 6.7 | % | 5.6 | % | ||||
New Jersey | 6.7 | % | 5.7 | % | ||||
Morris, NJ | 5.0 | % | 4.2 | % | ||||
Somerset, NJ | 5.1 | % | 4.2 | % | ||||
| Source: | SNL Financial, LC. |
Market Area Deposit Characteristics and Competition
The Company’s deposit base is closely tied to the economic fortunes of Morris and Somerset Counties and, in particular, the areas surrounding MSB Financial’s branch locations. Table 2.4 displays deposit market trends from June 30, 2010 through June 30, 2014 for MSB Financial, as well as for all commercial bank and savings institution branches located in the market area counties and the state of New Jersey. Consistent with the state of New Jersey, commercial banks maintained a larger market share of deposits than savings institutions in Morris and Somerset Counties. For the four year period covered in Table 2.4, savings institutions’ deposit market share increased in Somerset County, but decreased in Morris County. Overall, for the past four years, bank and thrift deposits decreased at an annual rate of 4.2% in Somerset County and increased at an annual rate of 4.6% in Morris County, which was above the comparable state annual deposit growth rate of 3.8%.
| RP® Financial, LC. | MARKET AREA | |
| II.9 |
Table 2.4
MSB Financial Corp.
Deposit Summary
| As of June 30, | ||||||||||||||||||||||||||||
| 2010 | 2014 | Deposit | ||||||||||||||||||||||||||
| Deposits | Market Share | No. of Branches | Deposits | Market Share | No. of Branches | Growth Rate 2010-2014 | ||||||||||||||||||||||
| (Dollars in Thousands) | (%) | |||||||||||||||||||||||||||
New Jersey | $ | 246,492,205 | 100.0 | % | 3,338 | $ | 286,327,288 | 100.0 | % | 3,171 | 3.8 | % | ||||||||||||||||
Commercial Banks | 175,349,101 | 71.1 | % | 2,440 | 216,771,725 | 75.7 | % | 2,420 | 5.4 | % | ||||||||||||||||||
Savings Institutions | 71,143,104 | 28.9 | % | 898 | 69,555,563 | 24.3 | % | 751 | -0.6 | % | ||||||||||||||||||
Morris County | $ | 18,655,681 | 100.0 | % | 235 | $ | 22,305,366 | 100.0 | % | 225 | 4.6 | % | ||||||||||||||||
Commercial Banks | 13,556,517 | 72.7 | % | 183 | 17,836,057 | 80.0 | % | 183 | 7.1 | % | ||||||||||||||||||
Savings Institutions | 5,099,164 | 27.3 | % | 52 | 4,469,309 | 20.0 | % | 42 | -3.2 | % | ||||||||||||||||||
MSB Financial Corp. | 157,814 | 0.8 | % | 1 | 139,615 | 0.6 | % | 1 | -3.0 | % | ||||||||||||||||||
Somerset County | $ | 13,242,574 | 100.0 | % | 133 | $ | 11,144,331 | 100.0 | % | 131 | -4.2 | % | ||||||||||||||||
Commercial Banks | 12,028,668 | 90.8 | % | 112 | 9,405,108 | 84.4 | % | 110 | -6.0 | % | ||||||||||||||||||
Savings Institutions | 1,213,906 | 9.2 | % | 21 | 1,739,223 | 15.6 | % | 21 | 9.4 | % | ||||||||||||||||||
MSB Financial Corp. | 144,062 | 1.1 | % | 4 | 127,649 | 1.1 | % | 4 | -3.0 | % | ||||||||||||||||||
| Source: | FDIC |
MSB Financial maintains its largest balance and deposit market share in Morris County, where the Company maintains its main office. The Company’s $139.6 million of deposits at the Morris County main office represented a 0.6% market share of total county bank and thrift deposits at June 30, 2014. Comparatively, the four branches in Somerset County had total deposits of $127.6 million at June 30, 2014, which represented a 1.1% market share of total county bank and thrift deposits. The Company’s deposits declined at a 3.0% annual rate in both primary market area counties from June 30, 2010 to June 30, 2014, which resulted in a slight decline in deposit market share in Morris County and no change in deposit market share in Somerset County.
| RP® Financial, LC. | MARKET AREA | |
| II.10 |
As implied by the Company’s low market share of deposits, competition among financial institutions in the Company’s market area is significant. The Company faces notable competition in both deposit gathering and lending activities. Among the Company’s competitors are much larger and more diversified institutions, which have greater resources than maintained by MSB Financial. Financial institution competitors in the Company’s primary market area include other locally based thrifts, banks, and credit unions, as well as regional, super-regional, and money center banks. From a competitive standpoint, MSB Financial has sought to emphasize its community orientation in the markets served by its branches. Table 2.5 lists the Company’s largest competitors in the market area counties, based on deposit market share. The Company’s market share and market rank are also provided in Table 2.5 below.
Table 2.5
MSB Financial Corp.
Market Area Deposit Competitors
Location | Name | Market Share | Rank | |||||
Morris County | Wells Fargo & Co. | 17.86 | % | |||||
JP Morgan Chase & Co. | 11.53 | % | ||||||
Bank of America Corp. | 9.97 | % | ||||||
MSB Financial Corp. | 0.62 | % | 20 out of 31 | |||||
Somerset County | Bank of America Corp. | 16.96 | % | |||||
Toronto-Dominion Bank | 15.17 | % | ||||||
PNC Financial Services Group | 13.60 | % | ||||||
MSB Financial Corp. | 1.14 | % | 15 out of 29 | |||||
| Source: | SNL Financial, LC. |
| RP® Financial, LC. | PEER GROUP ANALYSIS | |
| III.1 |
III. PEER GROUP ANALYSIS
This chapter presents an analysis of MSB Financial’s operations versus a group of comparable savings institutions (the “Peer Group”) selected from the universe of all publicly-traded savings institutions in a manner consistent with the regulatory valuation guidelines. The basis of the pro forma market valuation of MSB Financial is derived from the pricing ratios of the Peer Group institutions, incorporating valuation adjustments for key differences in relation to the Peer Group. Since no Peer Group can be exactly comparable to MSB Financial, key areas examined for differences are: financial condition; profitability, growth and viability of earnings; asset growth; primary market area; dividends; liquidity of the shares; marketing of the issue; management; and effect of government regulations and regulatory reform.
Peer Group Selection
The Peer Group selection process is governed by the general parameters set forth in the regulatory valuation guidelines. Accordingly, the Peer Group is comprised of only those publicly-traded savings institutions whose common stock is either listed on the NYSE or NASDAQ, since their stock trading activity is regularly reported and generally more frequent than non-publicly traded and closely-held institutions. Institutions that are not listed on the NYSE or NASDAQ are inappropriate, since the trading activity for thinly-traded or closely-held stocks are typically highly irregular in terms of frequency and price and thus may not be a reliable indicator of market value. We have also excluded from the Peer Group those companies under acquisition or subject to rumored acquisition, mutual holding companies and recent conversions, since their pricing ratios are subject to unusual distortion and/or have limited trading history. A recent listing of the universe of all publicly-traded savings institutions is included as Exhibit III-1.
Ideally, the Peer Group, which must have at least 10 members to comply with the regulatory valuation guidelines, should be comprised of locally- or regionally-based institutions with comparable resources, strategies and financial characteristics. There are approximately 98 fully-converted, publicly-traded institutions nationally and, thus, it is typically the case that the Peer Group will be comprised of institutions with relatively comparable characteristics. To the extent that differences exist between the converting institution and the Peer Group, valuation adjustments will be applied to account for the differences. Since MSB Financial Bancorp will be
| RP® Financial, LC. | PEER GROUP ANALYSIS | |
| III.2 |
a full public company upon completion of the offering, we considered only full public companies to be viable candidates for inclusion in the Peer Group. From the universe of publicly-traded thrifts, we selected ten institutions with characteristics similar to those of MSB Financial. In the selection process, we applied two “screens” to the universe of all public companies that were eligible for consideration:
| • | Screen #1 Mid-Atlantic institutions with assets between $250 million and $1.250 billion, tangible equity-to-assets ratios of greater than 8.0% and positive core earnings. Thirteen companies met the criteria for Screen #1 and nine were included in the Peer Group: Alliance Bancorp, Inc. of Pennsylvania, Cape Bancorp, Inc. of New Jersey, Fox Chase Bancorp, Inc. of Pennsylvania, Malvern Bancorp, Inc. of Pennsylvania, Ocean Shore Holding Co. of New Jersey, Oneida Financial Corp. of New York, Prudential Bancorp, Inc. of Pennsylvania, Severn Bancorp, Inc. of Maryland and WVS Financial Corp. of Pennsylvania. The four companies which met the selection criteria, but were excluded from the Peer Group were Clifton Bancorp, Inc. of New Jersey, CMS Bancorp, Inc. of New York, Colonial Financial Services, Inc. of New Jersey and Pathfinder Bancorp, Inc. of New York. CMS Bancorp and Colonial Financial Services were excluded as the result of being the targets of announced acquisitions and Clifton Bancorp and Pathfinder Bancorp were excluded due to their recent conversion status (Clifton Bancorp’s second-step conversion was completed in April 2014 and Pathfinder Bancorp’s second-step conversion was completed in October 2014). Exhibit III-2 provides financial and public market pricing characteristics of all publicly-traded Mid-Atlantic thrifts. |
| • | Screen #2 Northeast institutions with assets between $250 million and $1.250 billion, tangible equity-to-assets ratios of greater than 8.0% and positive core earnings. Four companies met the criteria for Screen #2 and two were included in the Peer Group: Georgetown Bancorp, Inc. of Massachusetts and Wellesley Bancorp, Inc. of Massachusetts. Hampden Bancorp, Inc. of Massachusetts and Peoples Federal Bancshares, Inc. of Massachusetts were excluded as the result of being targets of announced acquisitions. Exhibit III-3 provides financial and public market pricing characteristics of all publicly-traded New England thrifts. |
Table 3.1 shows the general characteristics of each of the ten Peer Group companies and Exhibit III-4 provides summary demographic and deposit market share data for the primary market areas served by each of the Peer Group companies. While there are expectedly some differences between the Peer Group companies and MSB Financial, we believe that the Peer Group companies, on average, provide a good basis for valuation subject to valuation adjustments. The following sections present a comparison of MSB Financial’s financial condition, income and expense trends, loan composition, interest rate risk and credit risk versus the Peer Group as of the most recent publicly available date. Comparative data for all publicly-traded thrifts, publicly-traded New Jersey thrifts and institutions comparable to MSB Financial that have recently completed a second-step conversion offering have been included in the Chapter III tables as well.
| RP® Financial, LC. | PEER GROUP ANALYSIS | |
| III.3 |
Table 3.1
Peer Group of Publicly-Traded Thrifts
As of December 31, 2014 or the Most Recent Date Available
| As of February 6, 2015 | ||||||||||||||||||||||||||||||
Ticker | Financial Institution | Exchange | City | State | Total Assets | Offices | Fiscal | Conv. Date | Stock Price | Market Value | ||||||||||||||||||||
| ($Mil) | ($) | ($Mil) | ||||||||||||||||||||||||||||
ALLB | Alliance Bancorp, Inc. of Pennsylvania | NASDAQ | Broomall | PA | 423 | (1) | 8 | Dec | 1/18/2011 | 17.00 | 68.46 | |||||||||||||||||||
CBNJ | Cape Bancorp, Inc. | NASDAQ | Cape May Court House | NJ | 1,080 | 15 | Dec | 2/1/2008 | 8.73 | 100.18 | ||||||||||||||||||||
FXCB | Fox Chase Bancorp, Inc. | NASDAQ | Hatboro | PA | 1,095 | 10 | Dec | 6/29/2010 | 16.44 | 194.04 | ||||||||||||||||||||
GTWN | Georgetown Bancorp, Inc. | NASDAQ | Georgetown | MA | 271 | 3 | Dec | 7/12/2012 | 17.95 | 32.80 | ||||||||||||||||||||
MLVF | Malvern Bancorp, Inc. | NASDAQ | Paoli | PA | 603 | 8 | Sep | 10/12/2012 | 12.04 | 78.96 | ||||||||||||||||||||
OSHC | Ocean Shore Holding Co. | NASDAQ | Ocean City | NJ | 1,025 | 11 | Dec | 12/21/2009 | 14.10 | 90.15 | ||||||||||||||||||||
ONFC | Oneida Financial Corp. | NASDAQ | Oneida | NY | 798 | 14 | Dec | 7/7/2010 | 13.20 | 92.70 | ||||||||||||||||||||
PBIP | Prudential Bancorp, Inc. | NASDAQ | Philadelphia | PA | 527 | 8 | Sep | 10/10/2013 | 12.23 | 114.72 | ||||||||||||||||||||
SVBI | Severn Bancorp, Inc. | NASDAQ | Annapolis | MD | 777 | 4 | Dec | 1/0/1900 | 4.55 | 45.79 | ||||||||||||||||||||
WEBK | Wellesley Bancorp, Inc. | NASDAQ | Wellesley | MA | 535 | 4 | Dec | 1/26/2012 | 19.17 | 47.13 | ||||||||||||||||||||
WVFC | WVS Financial Corp. | NASDAQ | Pittsburgh | PA | 295 | 6 | Jun | 11/29/1993 | 11.18 | 22.93 | ||||||||||||||||||||
| (1) | As of September 30, 2014. |
| Source: | SNL Financial, LC. |
| RP® Financial, LC. | PEER GROUP ANALYSIS | |
| III.4 |
In addition to the selection criteria used to identify the Peer Group companies, a summary description of the key comparable characteristics of each of the Peer Group companies relative to MSB Financial’s characteristics is detailed below.
| • | Alliance Bancorp, Inc. of Pennsylvania. Comparable due to completed second-step conversion in 2011, similar asset size, similar interest-earning asset composition, relative high equity-to-assets ratio, similar earnings contribution from sources of non-interest operating income and similar ratio of operating expenses as a percent of average assets. |
| • | Cape Bancorp, Inc. of New Jersey. Comparable due to similar interest-earning asset composition, similar interest-bearing funding composition and similar ratio of operating expenses as a percent of average assets. |
| • | Fox Chase Bancorp, Inc. of Pennsylvania. Comparable due to completed second-step conversion in 2010, similar interest-earning asset composition, relatively high equity-to-assets ratio and similar earnings contribution from sources of non-interest operating income. |
| • | Georgetown Bancorp, Inc. of Massachusetts. Comparable due to completed second-step conversion in 2012 and similar asset size. |
| • | Malvern Bancorp, Inc. of Pennsylvania. Comparable due to completed second-step conversion in 2012, similar interest-earning asset composition and similar interest-bearing funding composition. |
| • | Ocean Shore Holding Co. of New Jersey. Comparable due to completed second-step conversion in 2009, similar interest-bearing funding composition and similar net interest income to average assets ratio. |
| • | Oneida Financial Corp. of New York. Comparable due to completed second-step conversion in 2010. |
| • | Prudential Bancorp, Inc. of Pennsylvania. Comparable due to completed second-step conversion in 2013, similar interest-earning asset composition, relatively high equity-to-assets ratio and similar earnings contribution from sources of non-interest operating income. |
| • | Severn Bancorp, Inc. of Maryland. Comparable due to similar size of branch network, similar net interest income to average assets ratio, similar impact of loan loss provisions on earnings and similar concentration of 1-4 family permanent mortgage loans as a percent of assets. |
| • | Wellesley Bancorp, Inc. of Massachusetts. Comparable due to similar size of branch network, similar interest-bearing funding composition, similar impact of loan loss provisions on earnings and similar earnings contribution from sources of non-interest operating income. |
| • | WVS Financial Corp. of Pennsylvania. Comparable due to similar asset size, similar size of branch network and similar earnings contribution from sources of non-interest operating income. |
| RP® Financial, LC. | PEER GROUP ANALYSIS | |
| III.5 |
In aggregate, the Peer Group companies maintained a similar level of tangible equity compared to the industry average (12.76% of assets versus 12.99% for all public companies), generated lower earnings as a percent of average assets (0.46% core ROAA versus 0.72% for all public companies) and earned a lower ROE (3.65% core ROE versus 5.82% for all public companies). Overall, the Peer Group’s average P/TB ratio and average core P/E multiple were below and above the respective averages for all publicly-traded thrifts.
| All Publicly-Traded | Peer Group | |||||||
Financial Characteristics (Averages) | ||||||||
Assets ($Mil) | $ | 3,165 | $ | 675 | ||||
Market capitalization ($Mil) | $ | 448 | $ | 81 | ||||
Tangible equity/assets (%) | 12.99 | % | 12.76 | % | ||||
Core return on average assets (%) | 0.72 | 0.46 | ||||||
Core return on average equity (%) | 5.82 | 3.65 | ||||||
Pricing Ratios (Averages)(1) | ||||||||
Core price/earnings (x) | 16.50x | 20.09x | ||||||
Price/tangible book (%) | 113.89 | % | 97.44 | % | ||||
Price/assets (%) | 13.63 | 12.11 | ||||||
| (1) | Based on market prices as of February 6, 2015. |
Ideally, the Peer Group companies would be comparable to MSB Financial in terms of all of the selection criteria, but the universe of publicly-traded thrifts does not provide for an appropriate number of such companies. However, in general, the companies selected for the Peer Group were fairly comparable to MSB Financial, as will be highlighted in the following comparative analysis. Comparative data for all publicly-traded thrifts, publicly-traded New Jersey thrifts and institutions comparable to MSB Financial that have recently completed a second-step conversion offering have been included in the Chapter III tables as well.
Financial Condition
Table 3.2 shows comparative balance sheet measures for MSB Financial and the Peer Group, reflecting the expected similarities and some differences given the selection procedures outlined above. The Company’s and the Peer Group’s ratios reflect balances as of December 31, 2014, unless indicated otherwise for the Peer Group companies. MSB Financial’s equity-to-assets ratio of 12.06% was slightly below the Peer Group’s average net worth ratio of 13.30%. However, the Company’s pro forma capital position will increase with the addition of stock
| RP® Financial, LC. | PEER GROUP ANALYSIS | |
| III.6 |
Table 3.2
Balance Sheet Composition and Growth Rates
Comparable Institution Analysis
As of December 31, 2014 or Most Recent Date Available
| Balance Sheet as a Percent of Assets | Balance Sheet Annual Growth Rates | Regulatory Capital | ||||||||||||||||||||||||||||||||||||||||||||||||||||||||||||||||||||||||||||||||||
| Cash & Equivalents | MBS & Invest | BOLI | Net Loans (1) | Deposits | Borrowed Funds | Sub. Debt | Total Equity | Goodwill & Intang | Tangible Equity | Assets | MBS, Cash & Investments | Loans (1) | Deposits | Borrows. & Subdebt | Total Equity | Tangible Equity | Tier 1 Leverage | Tier 1 Risk-Based | Risk-Based Capital | |||||||||||||||||||||||||||||||||||||||||||||||||||||||||||||||||
MSB Financial Corp. | NJ | |||||||||||||||||||||||||||||||||||||||||||||||||||||||||||||||||||||||||||||||||||
December 31, 2014 | 2.21 | % | 23.58 | % | 2.13 | % | 68.00 | % | 78.20 | % | 8.82 | % | 0.00 | % | 12.06 | % | 0.00 | % | 12.06 | % | -1.97 | % | -6.27 | % | 0.27 | % | -1.61 | % | -10.45 | % | 2.15 | % | 2.15 | % | 10.64 | % | 17.68 | % | 18.94 | % | ||||||||||||||||||||||||||||||||||||||||||||
All Public Companies | ||||||||||||||||||||||||||||||||||||||||||||||||||||||||||||||||||||||||||||||||||||
Averages | 4.81 | % | 19.23 | % | 1.95 | % | 70.23 | % | 73.72 | % | 11.27 | % | 0.39 | % | 13.62 | % | 0.66 | % | 12.99 | % | 8.73 | % | 3.38 | % | 13.41 | % | 8.10 | % | 10.90 | % | 17.95 | % | 18.90 | % | 12.69 | % | 20.16 | % | 21.42 | % | ||||||||||||||||||||||||||||||||||||||||||||
Medians | 3.32 | % | 16.40 | % | 1.96 | % | 71.49 | % | 74.27 | % | 10.49 | % | 0.00 | % | 12.80 | % | 0.00 | % | 11.88 | % | 4.33 | % | -0.92 | % | 8.92 | % | 2.74 | % | 0.00 | % | 3.49 | % | 4.04 | % | 11.76 | % | 18.70 | % | 19.73 | % | ||||||||||||||||||||||||||||||||||||||||||||
State of NJ | ||||||||||||||||||||||||||||||||||||||||||||||||||||||||||||||||||||||||||||||||||||
Averages | 2.64 | % | 22.43 | % | 2.68 | % | 69.18 | % | 68.82 | % | 14.95 | % | 0.17 | % | 15.03 | % | 0.61 | % | 14.42 | % | 6.87 | % | 2.68 | % | 10.55 | % | 4.56 | % | 10.20 | % | 24.07 | % | 30.96 | % | 13.77 | % | 21.61 | % | 22.60 | % | ||||||||||||||||||||||||||||||||||||||||||||
Medians | 2.57 | % | 20.25 | % | 2.46 | % | 71.33 | % | 69.47 | % | 14.71 | % | 0.00 | % | 13.42 | % | 0.00 | % | 11.90 | % | 8.86 | % | -0.75 | % | 9.78 | % | 1.18 | % | -2.06 | % | 1.82 | % | 1.82 | % | 10.51 | % | 18.73 | % | 19.73 | % | ||||||||||||||||||||||||||||||||||||||||||||
Comparable Recent | ||||||||||||||||||||||||||||||||||||||||||||||||||||||||||||||||||||||||||||||||||||
PBHC | Pathfinder Bancorp, Inc. | NY | 3.60 | % | 24.57 | % | 1.92 | % | 65.26 | % | 83.36 | % | 6.43 | % | 0.98 | % | 8.33 | % | 0.87 | % | 7.46 | % | 4.14 | % | 3.81 | % | 2.66 | % | 2.33 | % | 25.38 | % | 6.71 | % | 5.49 | % | 8.73 | % | 12.53 | % | 13.83 | % | ||||||||||||||||||||||||||||||||||||||||||
Comparable Group | ||||||||||||||||||||||||||||||||||||||||||||||||||||||||||||||||||||||||||||||||||||
Averages | 4.68 | % | 24.49 | % | 1.91 | % | 65.48 | % | 72.35 | % | 12.95 | % | 0.35 | % | 13.30 | % | 0.54 | % | 12.76 | % | 1.32 | % | -2.70 | % | 4.80 | % | 2.33 | % | -6.87 | % | 0.61 | % | 0.87 | % | 12.39 | % | 21.41 | % | 22.40 | % | ||||||||||||||||||||||||||||||||||||||||||||
Medians | 3.89 | % | 15.98 | % | 2.21 | % | 71.31 | % | 73.81 | % | 12.63 | % | 0.00 | % | 12.01 | % | 0.00 | % | 10.94 | % | 0.36 | % | -4.36 | % | 3.92 | % | 0.64 | % | -2.57 | % | 1.26 | % | 1.26 | % | 10.38 | % | 18.73 | % | 19.78 | % | ||||||||||||||||||||||||||||||||||||||||||||
Comparable Group | ||||||||||||||||||||||||||||||||||||||||||||||||||||||||||||||||||||||||||||||||||||
ALLB | Alliance Bancorp, Inc. of Pennsylvania (3) | PA | 10.65 | % | 12.10 | % | 2.99 | % | 71.31 | % | 82.34 | % | 0.60 | % | 0.00 | % | 15.50 | % | 0.00 | % | 15.50 | % | -2.88 | % | -21.15 | % | 5.26 | % | -0.12 | % | -28.56 | % | -14.33 | % | -14.33 | % | 14.39 | % | 21.94 | % | 23.19 | % | ||||||||||||||||||||||||||||||||||||||||||
CBNJ | Cape Bancorp, Inc. | NJ | 2.60 | % | 15.98 | % | 2.88 | % | 71.33 | % | 73.81 | % | 12.63 | % | 0.00 | % | 13.05 | % | 2.11 | % | 10.94 | % | -1.19 | % | -3.56 | % | -1.49 | % | -0.17 | % | -5.28 | % | 0.32 | % | 0.40 | % | 9.94 | % | 13.34 | % | 14.55 | % | ||||||||||||||||||||||||||||||||||||||||||
FXCB | Fox Chase Bancorp, Inc. | PA | 1.57 | % | 28.34 | % | 1.37 | % | 66.17 | % | 65.04 | % | 18.27 | % | 0.00 | % | 16.07 | % | 0.00 | % | 16.07 | % | -1.97 | % | -5.56 | % | 0.53 | % | 5.67 | % | -23.22 | % | 1.41 | % | 1.41 | % | 13.99 | % | 18.97 | % | 20.02 | % | ||||||||||||||||||||||||||||||||||||||||||
GTWN | Georgetown Bancorp, Inc. | MA | 1.81 | % | 8.58 | % | 1.10 | % | 85.71 | % | 67.28 | % | 20.15 | % | 0.00 | % | 11.33 | % | 0.00 | % | 11.33 | % | 3.04 | % | -1.23 | % | 3.28 | % | 3.63 | % | -0.59 | % | 6.12 | % | 6.12 | % | 10.08 | % | 13.21 | % | 14.29 | % | ||||||||||||||||||||||||||||||||||||||||||
MLVF | Malvern Bancorp, Inc. | PA | 7.97 | % | 23.14 | % | 3.05 | % | 63.56 | % | 73.05 | % | 12.93 | % | 0.00 | % | 12.91 | % | 0.00 | % | 12.91 | % | 1.54 | % | 25.32 | % | -5.87 | % | -6.45 | % | 81.40 | % | 4.39 | % | 4.39 | % | 10.97 | % | 18.53 | % | 19.78 | % | ||||||||||||||||||||||||||||||||||||||||||
OSHC | Ocean Shore Holding Co. | NJ | 7.84 | % | 10.86 | % | 2.31 | % | 75.53 | % | 76.81 | % | 10.73 | % | 0.70 | % | 10.33 | % | 0.51 | % | 9.82 | % | 0.46 | % | -13.93 | % | 3.92 | % | 0.82 | % | -2.57 | % | -0.39 | % | -0.35 | % | 9.78 | % | 18.73 | % | 19.24 | % | ||||||||||||||||||||||||||||||||||||||||||
ONFC | Oneida Financial Corp. | NY | 3.89 | % | 38.97 | % | 2.21 | % | 46.09 | % | 86.34 | % | 0.00 | % | 0.00 | % | 12.01 | % | 3.29 | % | 8.71 | % | 7.50 | % | 7.98 | % | 9.58 | % | 8.15 | % | -100.00 | % | 5.66 | % | 8.46 | % | 9.36 | % | 15.77 | % | 16.54 | % | ||||||||||||||||||||||||||||||||||||||||||
PBIP | Prudential Bancorp, Inc. | PA | 6.30 | % | 26.95 | % | 2.37 | % | 63.03 | % | 74.27 | % | 0.06 | % | 0.00 | % | 24.31 | % | 0.00 | % | 24.31 | % | 0.36 | % | -4.36 | % | 3.30 | % | 0.64 | % | 0.00 | % | -1.80 | % | -1.80 | % | 24.98 | % | 54.19 | % | 55.23 | % | ||||||||||||||||||||||||||||||||||||||||||
SVBI | Severn Bancorp, Inc. | MD | 4.29 | % | 8.44 | % | 0.00 | % | 82.54 | % | 70.02 | % | 14.81 | % | 3.11 | % | 10.79 | % | 0.04 | % | 10.75 | % | -2.87 | % | -33.74 | % | 5.69 | % | -4.80 | % | 0.00 | % | 1.26 | % | 1.26 | % | 13.84 | % | 19.39 | % | 20.65 | % | ||||||||||||||||||||||||||||||||||||||||||
WEBK | Wellesley Bancorp, Inc. | MA | 3.62 | % | 10.53 | % | 1.28 | % | 82.95 | % | 78.91 | % | 11.49 | % | 0.00 | % | 9.22 | % | 0.00 | % | 9.22 | % | 16.70 | % | 28.29 | % | 15.43 | % | 18.10 | % | 17.14 | % | 5.46 | % | 5.46 | % | 8.58 | % | 11.67 | % | 12.88 | % | ||||||||||||||||||||||||||||||||||||||||||
WVFC | WVS Financial Corp. | PA | 0.89 | % | 85.52 | % | 1.42 | % | 12.09 | % | 48.03 | % | 40.79 | % | 0.00 | % | 10.80 | % | 0.00 | % | 10.80 | % | -6.16 | % | -7.81 | % | 13.18 | % | 0.18 | % | -13.86 | % | -1.43 | % | -1.43 | % | 10.38 | % | 29.76 | % | 30.04 | % | ||||||||||||||||||||||||||||||||||||||||||
| (1) | Includes loans held for sale. |
| (2) | Ratios are based on the date of the most recent financial statements disclosed in the offering prospectus. |
| (3) | As of or for the twelve months ended September 30, 2014. |
| Source: | SNL Financial, LC. and RP® Financial, LC. calculations. The information provided in this table has been obtained from sources we believe are reliable, but we cannot guarantee the accuracy or completeness of such information. |
Copyright (c) 2015 by RP® Financial, LC.
| RP® Financial, LC. | PEER GROUP ANALYSIS | |
| III.7 |
proceeds, providing the Company with an equity-to-assets ratio that will exceed the Peer Group’s ratio. Tangible equity-to-assets ratios for the Company and the Peer Group equaled 12.06% and 12.76%, respectively. The increase in MSB Financial’s pro forma capital position will be favorable from a risk perspective and in terms of future earnings potential that could be realized through leverage and lower funding costs. At the same time, the Company’s higher pro forma capitalization will initially depress return on equity. Both MSB Financial’s and the Peer Group’s capital ratios reflected capital surpluses with respect to the regulatory capital requirements.
The interest-earning asset compositions for the Company and the Peer Group were somewhat similar, with loans constituting the bulk of interest-earning assets for both MSB Financial and the Peer Group. The Company’s loans-to-assets ratio of 68.00% was slightly higher than the comparable Peer Group ratio of 65.48%. Comparatively, the Company’s cash and investments-to-assets ratio of 25.79% was lower than the comparable Peer Group ratio of 29.17%. Overall, MSB Financial’s interest-earning assets amounted to 93.79% of assets, which was slightly below the comparable Peer Group ratio of 94.65%. The Peer Group’s non-interest earning assets included bank-owned life insurance (“BOLI”) equal to 1.91% of assets and goodwill/intangibles equal to 0.54% of assets, while the Company maintained BOLI equal to 2.13% of assets and a zero balance of goodwill/intangible assets.
MSB Financial’s funding liabilities reflected a funding strategy that was somewhat similar to that of the Peer Group’s funding composition. The Company’s deposits equaled 78.20% of assets, which was above the Peer Group’s ratio of 72.35%. Comparatively, the Company maintained a lower level of borrowings than the Peer Group, as indicated by borrowings-to-assets ratios of 8.82% and 13.30% for MSB Financial and the Peer Group, respectively. Total interest-bearing liabilities maintained by the Company and the Peer Group, as a percent of assets, equaled 87.02% and 85.65%, respectively.
A key measure of balance sheet strength for a thrift institution is its interest-earning assets/interest-bearing liabilities (“IEA/IBL”) ratio. Presently, the Company’s IEA/IBL ratio is lower than the Peer Group’s ratio, based on IEA/IBL ratios of 107.78% and 110.51%, respectively. The additional capital realized from stock proceeds should serve to provide MSB Financial with an IEA/IBL ratio that exceeds the Peer Group’s ratio, as the increase in capital provided by the infusion of stock proceeds will serve to lower the level of interest-bearing liabilities funding assets and will be primarily deployed into interest-earning assets.
| RP® Financial, LC. | PEER GROUP ANALYSIS | |
| III.8 |
The growth rate section of Table 3.2 shows annual growth rates for key balance sheet items. MSB Financial’s and the Peer Group’s growth rates are based on annual growth for the twelve months ended December 31, 2014 or the most recent twelve month period available for the Peer Group companies. MSB Financial recorded a 1.97% decrease in assets, versus asset growth of 1.32% recorded by the Peer Group. A 6.27% decline in cash and investments accounted for the Company’s asset shrinkage, which funded deposit run-off, the pay down of borrowings and a 0.27% increase in loans. Asset growth for the Peer Group included a 4.80% increase in loans, which was partially offset by a 2.70% decrease in cash and investments.
The decline in MSB Financial’s cash and investments funded a 1.61% decrease in deposits and a 10.45% decrease in borrowings. Comparatively, asset growth for the Peer Group was funded through deposit growth of 2.33%, which also funded a 6.87% reduction in the Peer Group’s borrowings. The Company’s tangible capital increased by 2.15%, which was largely attributable to retention of earnings. Comparatively, the Peer Group’s tangible capital increased 0.87%, as retention of earnings was largely offset by stock repurchases and dividend payments. The Company’s post-conversion capital growth rate will initially be constrained by maintenance of a higher pro forma capital position. Additional implementation of any stock repurchases and dividend payments, pursuant to regulatory limitations and guidelines, could also slow the Company’s capital growth rate in the longer term following the stock offering.
Income and Expense Components
Table 3.3 displays statements of operations for the Company and the Peer Group. The Company’s and the Peer Group’s ratios are based on earnings for the twelve months ended December 31, 2014 or the most recent data available for the Peer Group companies. MSB Financial and the Peer Group reported net income to average assets ratios of 0.21% and 0.47%, respectively. Higher ratios for net interest income, non-interest operating income and non-operating gains and a lower effective tax rate represented earnings advantages for the Peer Group, which were partially offset by the Company’s lower operating expense ratio.
The Peer Group’s higher net interest income to average assets ratio was primarily realized through a lower interest expense ratio, which was primarily supported by a slightly lower cost of funds (0.80% versus 0.85% for the Company), as well as maintaining a lower concentration of interest-bearing liabilities as a percent of assets. Overall, MSB Financial and the Peer Group reported net interest income to average assets ratios of 2.80% and 2.87%, respectively.
| RP® Financial, LC. | Peer Group Analysis | |
| Page III.9 |
Table 3.3
Income as Percent of Average Assets and Yields, Costs, Spreads
Comparable Institution Analysis
For the 12 Months Ended December 31, 2014 or Most Recent Date Available
| Net Interest Income | Non-Interest Income | Non-Op. Items | Yields, Costs, and Spreads | |||||||||||||||||||||||||||||||||||||||||||||||||||||||||||||||||||||
| Net Income | Income | Expense | NII | Loss Provis. on IEA | NII After Provis. | Recurring Gain on Sale of Loans | Other Non- Int Income | Total Non-Int Expense | Net Gains/ Losses (2) | Extrao. Items | Provision for Taxes | Yield On IEA | Cost Of IBL | Yld-Cost Spread | MEMO: Assets/ FTE Emp. | MEMO: Effective Tax Rate | ||||||||||||||||||||||||||||||||||||||||||||||||||||||||
| (%) | (%) | (%) | (%) | (%) | (%) | (%) | (%) | (%) | (%) | (%) | (%) | (%) | (%) | (%) | (%) | |||||||||||||||||||||||||||||||||||||||||||||||||||||||||
MSB Financial Corp. | NJ | |||||||||||||||||||||||||||||||||||||||||||||||||||||||||||||||||||||||
December 31, 2014 | 0.21 | % | 3.49 | % | 0.68 | % | 2.80 | % | 0.11 | % | 2.69 | % | 0.00 | % | 0.20 | % | 2.58 | % | 0.00 | % | 0.00 | % | 0.10 | % | 3.73 | % | 0.85 | % | 2.88 | % | $ | 6,543 | 32.73 | % | ||||||||||||||||||||||||||||||||||||||
All Public Companies | ||||||||||||||||||||||||||||||||||||||||||||||||||||||||||||||||||||||||
Averages | 0.65 | % | 3.61 | % | 0.61 | % | 3.00 | % | 0.08 | % | 2.92 | % | 0.31 | % | 0.62 | % | 2.93 | % | -0.02 | % | 0.00 | % | 0.16 | % | 3.87 | % | 0.76 | % | 3.06 | % | $ | 6,232 | 25.92 | % | ||||||||||||||||||||||||||||||||||||||
Medians | 0.63 | % | 3.56 | % | 0.59 | % | 3.01 | % | 0.07 | % | 2.94 | % | 0.06 | % | 0.45 | % | 2.79 | % | 0.00 | % | 0.00 | % | 0.24 | % | 3.83 | % | 0.75 | % | 3.10 | % | $ | 5,324 | 32.08 | % | ||||||||||||||||||||||||||||||||||||||
State of NJ | ||||||||||||||||||||||||||||||||||||||||||||||||||||||||||||||||||||||||
Averages | 0.64 | % | 3.48 | % | 0.65 | % | 2.84 | % | 0.12 | % | 2.71 | % | 0.02 | % | 0.30 | % | 2.06 | % | -0.01 | % | 0.00 | % | 0.34 | % | 3.78 | % | 0.80 | % | 3.13 | % | $ | 9,575 | 33.38 | % | ||||||||||||||||||||||||||||||||||||||
Medians | 0.62 | % | 3.47 | % | 0.69 | % | 2.97 | % | 0.11 | % | 2.74 | % | 0.00 | % | 0.20 | % | 2.01 | % | 0.00 | % | 0.00 | % | 0.39 | % | 3.83 | % | 0.83 | % | 3.11 | % | $ | 9,172 | 34.75 | % | ||||||||||||||||||||||||||||||||||||||
Comparable Recent Conversions(2) | ||||||||||||||||||||||||||||||||||||||||||||||||||||||||||||||||||||||||
PBHC | Pathfinder Bancorp, Inc. | NY | 0.46 | % | 3.66 | % | 0.59 | % | 3.06 | % | 0.17 | % | 2.88 | % | 0.00 | % | 0.54 | % | 2.94 | % | 0.15 | % | 0.00 | % | 0.16 | % | 4.10 | % | 0.76 | % | 3.34 | % | $ | 4,654 | 25.69 | % | ||||||||||||||||||||||||||||||||||||
Comparable Group | ||||||||||||||||||||||||||||||||||||||||||||||||||||||||||||||||||||||||
Averages | 0.47 | % | 3.50 | % | 0.63 | % | 2.87 | % | 0.10 | % | 2.76 | % | 0.05 | % | 0.60 | % | 2.75 | % | 0.03 | % | 0.00 | % | 0.21 | % | 3.75 | % | 0.80 | % | 2.96 | % | $ | 6,124 | 27.52 | % | ||||||||||||||||||||||||||||||||||||||
Medians | 0.46 | % | 3.71 | % | 0.61 | % | 2.95 | % | 0.06 | % | 2.85 | % | 0.03 | % | 0.29 | % | 2.69 | % | 0.00 | % | 0.00 | % | 0.22 | % | 4.01 | % | 0.87 | % | 3.08 | % | $ | 6,047 | 33.03 | % | ||||||||||||||||||||||||||||||||||||||
Comparable Group | ||||||||||||||||||||||||||||||||||||||||||||||||||||||||||||||||||||||||
ALLB | Alliance Bancorp, Inc. of Pennsylvania (3) | PA | 0.46 | % | 3.94 | % | 0.53 | % | 3.41 | % | 0.19 | % | 3.23 | % | 0.00 | % | 0.19 | % | 2.69 | % | 0.00 | % | 0.00 | % | 0.27 | % | 4.15 | % | 0.69 | % | 3.46 | % | $ | 5,324 | 37.44 | % | ||||||||||||||||||||||||||||||||||||
CBNJ | Cape Bancorp, Inc. | NJ | 0.62 | % | 3.74 | % | 0.48 | % | 3.26 | % | 0.28 | % | 2.99 | % | 0.04 | % | 0.39 | % | 2.53 | % | 0.14 | % | 0.00 | % | 0.39 | % | 4.10 | % | 0.60 | % | 3.50 | % | $ | 6,217 | 38.53 | % | ||||||||||||||||||||||||||||||||||||
FXCB | Fox Chase Bancorp, Inc. | PA | 0.76 | % | 3.71 | % | 0.61 | % | 3.09 | % | 0.18 | % | 2.91 | % | 0.00 | % | 0.22 | % | 2.06 | % | 0.00 | % | 0.00 | % | 0.32 | % | 3.82 | % | 0.87 | % | 2.95 | % | $ | 7,639 | 29.43 | % | ||||||||||||||||||||||||||||||||||||
GTWN | Georgetown Bancorp, Inc. | MA | 0.55 | % | 4.19 | % | 0.54 | % | 3.65 | % | 0.04 | % | 3.61 | % | 0.08 | % | 0.32 | % | 3.14 | % | 0.00 | % | 0.00 | % | 0.32 | % | 4.35 | % | 0.68 | % | 3.67 | % | $ | 6,023 | 36.50 | % | ||||||||||||||||||||||||||||||||||||
MLVF | Malvern Bancorp, Inc. | PA | 0.10 | % | 3.41 | % | 0.86 | % | 2.55 | % | 0.05 | % | 2.51 | % | 0.06 | % | 0.29 | % | 2.76 | % | 0.01 | % | 0.00 | % | 0.00 | % | 3.61 | % | 1.06 | % | 2.55 | % | $ | 5,831 | 3.01 | % | ||||||||||||||||||||||||||||||||||||
OSHC | Ocean Shore Holding Co. | NJ | 0.61 | % | 3.42 | % | 0.73 | % | 2.69 | % | 0.04 | % | 2.65 | % | 0.00 | % | 0.41 | % | 2.11 | % | 0.01 | % | 0.00 | % | 0.34 | % | 4.01 | % | 0.93 | % | 3.08 | % | $ | 6,047 | 35.87 | % | ||||||||||||||||||||||||||||||||||||
ONFC | Oneida Financial Corp. | NY | 0.66 | % | 2.90 | % | 0.34 | % | 2.56 | % | 0.06 | % | 2.50 | % | 0.03 | % | 3.94 | % | 5.72 | % | 0.10 | % | 0.00 | % | 0.19 | % | 3.34 | % | 0.42 | % | 2.92 | % | $ | 2,168 | 22.16 | % | ||||||||||||||||||||||||||||||||||||
PBIP | Prudential Bancorp, Inc. | PA | 0.37 | % | 3.22 | % | 0.66 | % | 2.56 | % | 0.06 | % | 2.50 | % | 0.03 | % | 0.15 | % | 2.24 | % | 0.08 | % | 0.00 | % | 0.14 | % | 3.32 | % | 0.89 | % | 2.43 | % | $ | 7,298 | 27.43 | % | ||||||||||||||||||||||||||||||||||||
SVBI | Severn Bancorp, Inc. | MD | 0.37 | % | 4.05 | % | 1.10 | % | 2.95 | % | 0.11 | % | 2.85 | % | 0.28 | % | 0.31 | % | 3.07 | % | 0.00 | % | 0.00 | % | 0.00 | % | 4.53 | % | 1.27 | % | 3.26 | % | $ | 4,899 | 1.05 | % | ||||||||||||||||||||||||||||||||||||
WEBK | Wellesley Bancorp, Inc. | MA | 0.36 | % | 3.97 | % | 0.70 | % | 3.28 | % | 0.13 | % | 3.15 | % | 0.02 | % | 0.17 | % | 2.76 | % | 0.00 | % | 0.00 | % | 0.22 | % | 4.09 | % | 0.87 | % | 3.22 | % | $ | 8,361 | 38.32 | % | ||||||||||||||||||||||||||||||||||||
WVFC | WVS Financial Corp. | PA | 0.33 | % | 1.94 | % | 0.39 | % | 1.54 | % | 0.01 | % | 1.53 | % | 0.00 | % | 0.17 | % | 1.20 | % | -0.01 | % | 0.00 | % | 0.16 | % | 1.94 | % | 0.47 | % | 1.47 | % | $ | 7,554 | 33.03 | % | ||||||||||||||||||||||||||||||||||||
| (1) | Net gains/losses includes gain/loss on sale of securities and nonrecurring income and expense. |
| (2) | Ratios are based on the date of the most recent financial statements disclosed in the offering prospectus. |
| (3) | As of or for the twelve months ended September 30, 2014. |
| Source: | SNL Financial, LC. and RP® Financial, LC. calculations. The information provided in this table has been obtained from sources we believe are reliable, but we cannot guarantee the accuracy or completeness of such information. |
Copyright (c) 2015 by RP® Financial, LC.
| RP® Financial, LC. | PEER GROUP ANALYSIS | |
| III.10 |
In another key area of core earnings strength, the Company maintained a lower level of operating expenses than the Peer Group. For the period covered in Table 3.3, the Company and the Peer Group reported operating expense to average assets ratios of 2.58% and 2.75%, respectively. The Company’s lower operating expense ratio was consistent with the comparatively lower number of employees maintained relative to its asset size. Assets per full time equivalent employee equaled $6.543 million for the Company, versus $6.124 million for the Peer Group.
When viewed together, net interest income and operating expenses provide considerable insight into a thrift’s earnings strength, since those sources of income and expenses are typically the most prominent components of earnings and are generally more predictable than losses and gains realized from the sale of assets or other non-recurring activities. In this regard, as measured by their expense coverage ratios (net interest income divided by operating expenses), the Company’s earnings were slightly more favorable than the Peer Group’s. Expense coverage ratios for MSB Financial and the Peer Group equaled 1.09x and 1.04x, respectively.
Sources of non-interest operating income provided a larger contribution to the Peer Group’s earnings, with such income amounting to 0.20% and 0.65% of MSB Financial’s and the Peer Group’s average assets, respectively. Taking non-interest operating income into account in comparing the Company’s and the Peer Group’s earnings, MSB Financial’s efficiency ratio (operating expenses, as a percent of the sum of non-interest operating income and net interest income) of 86.00% was less favorable than the Peer Group’s efficiency ratio of 78.13%.
Loan loss provisions had a similar impact on the Company’s and the Peer Group’s earnings, as loan loss provisions established by the Company and the Peer Group equaled 0.11% and 0.10% of average assets, respectively
Net non-operating gains and losses were not a factor in the Company’s earnings, while the Peer Group recorded net non-operating gains equal to 0.03% of average assets for the Peer Group. Typically, gains and losses generated from the sale of assets and other non-operating activities are viewed as earnings with a relatively high degree of volatility, particularly to the extent that such gains and losses result from the sale of investments or other assets that are not considered to be part of an institution’s core operations. Extraordinary items were not a factor in either the Company’s or the Peer Group’s earnings.
| RP® Financial, LC. | PEER GROUP ANALYSIS | |
| III.11 |
Taxes had a more significant impact on the Company’s earnings, as the Company and the Peer Group posted effective tax rates of 32.73% and 27.52%, respectively. As indicated in the prospectus, the Company’s effective marginal tax rate is equal to 37.5%.
Loan Composition
Table 3.4 presents data related to the Company’s and the Peer Group’s loan portfolio compositions (including the investment in mortgage-backed securities). In comparison to the Peer Group, the Company’s loan portfolio composition reflected a similar concentration of 1-4 family permanent mortgage loans and mortgage-backed securities (50.08% of assets versus 51.06% for the Peer Group), as the Company’s higher concentration of 1-4 family permanent mortgage loans was offset by the Peer Group’s higher concentration of mortgage-backed securities. The Company maintained a zero balance of loans services for others, while loans serviced for others equaled 4.19% of the Peer Group’s assets. Loan servicing intangibles constituted a relatively small balance sheet item for the Peer Group.
Overall, diversification into higher risk and higher yielding types of lending was comparable for the Company and the Peer Group. Consumer loans and commercial real estate loans constituted the most significant types of lending diversification for the Company and the Peer Group, respectively, with such loans equaling 11.17% of the Company’s assets and 17.12% of the Peer Group’s assets. Consumer loans was the only other area of lending diversification that was more significant for the Company. In total, construction/land, commercial real estate, multi-family, commercial business and consumer loans comprised 27.03% and 28.44% of the Company’s and the Peer Group’s assets, respectively. Overall, the Company’s and the Peer Group’s asset compositions provided for similar risk weighted assets-to-assets ratios of 60.19% and 61.39%, respectively.
Interest Rate Risk
Table 3.5 reflects various key ratios highlighting the relative interest rate risk exposure of the Company versus the Peer Group. In terms of balance sheet composition, MSB Financial’s interest rate risk characteristics were overall considered to be slightly less favorable than the Peer Group’s measures. Most notably, the Company’s tangible equity-to-assets ratio and IEA/IBL ratio were below the comparable Peer Group ratios. Comparatively, the Company maintained a slight advantage with respect to its lower ratio of non-interest earning assets as a
| RP® Financial, LC. | Peer Group Analysis | |
| Page III.12 |
Table 3.4
Loan Portfolio Composition and Related Information
Comparable Institution Analysis
As of December 31, 2014 or Most Recent Date Available
| Portfolio Composition as a Percent of Assets | ||||||||||||||||||||||||||||||||||||||||||||
| MBS | 1-4 Family | Constr. & Land | Multi- Family | Comm RE | Commerc. Business | Consumer | RWA/ Assets | Serviced For Others | Servicing Assets | |||||||||||||||||||||||||||||||||||
| (%) | (%) | (%) | (%) | (%) | (%) | (%) | (%) | ($000) | ($000) | |||||||||||||||||||||||||||||||||||
MSB Financial Corp. | NJ | |||||||||||||||||||||||||||||||||||||||||||
December 31, 2014 | 7.47 | % | 42.61 | % | 3.72 | % | 0.57 | % | 8.73 | % | 2.84 | % | 11.17 | % | 60.19 | % | $ | 0 | $ | 0 | ||||||||||||||||||||||||
All Public Companies | ||||||||||||||||||||||||||||||||||||||||||||
Averages | 12.32 | % | 32.69 | % | 3.36 | % | 8.40 | % | 17.78 | % | 4.09 | % | 1.22 | % | 64.92 | % | $ | 2,331,079 | $ | 17,030 | ||||||||||||||||||||||||
Medians | 10.69 | % | 31.64 | % | 2.59 | % | 3.82 | % | 17.22 | % | 1.37 | % | 0.30 | % | 64.76 | % | $ | 89,112 | $ | 453 | ||||||||||||||||||||||||
State of | NJ | |||||||||||||||||||||||||||||||||||||||||||
Averages | 14.64 | % | 31.59 | % | 1.61 | % | 13.34 | % | 20.28 | % | 1.96 | % | 0.15 | % | 59.22 | % | $ | 358,692 | $ | 2,386 | ||||||||||||||||||||||||
Medians | 13.09 | % | 31.21 | % | 1.72 | % | 7.66 | % | 18.03 | % | 0.85 | % | 0.06 | % | 53.38 | % | $ | 2,968 | $ | 3 | ||||||||||||||||||||||||
Comparable Recent Conversions(1) | ||||||||||||||||||||||||||||||||||||||||||||
PBHC | Pathfinder Bancorp, Inc. | NY | 10.51 | % | 31.79 | % | 0.23 | % | 3.19 | % | 16.32 | % | 9.82 | % | 4.82 | % | 66.76 | % | $ | 27,856 | $ | 77 | ||||||||||||||||||||||
Comparable Group | ||||||||||||||||||||||||||||||||||||||||||||
Averages | 14.34 | % | 36.72 | % | 4.88 | % | 2.21 | % | 17.12 | % | 4.23 | % | 0.63 | % | 61.39 | % | $ | 28,266 | $ | 225 | ||||||||||||||||||||||||
Medians | 8.19 | % | 40.83 | % | 2.65 | % | 1.37 | % | 17.22 | % | 3.40 | % | 0.08 | % | 64.76 | % | $ | 37 | $ | 3 | ||||||||||||||||||||||||
Comparable Group | ||||||||||||||||||||||||||||||||||||||||||||
ALLB | Alliance Bancorp, Inc. of Pennsylvania (2) | PA | 0.75 | % | 28.65 | % | 6.12 | % | 5.79 | % | 28.59 | % | 3.40 | % | 0.88 | % | 64.76 | % | $ | 0 | $ | 0 | ||||||||||||||||||||||
CBNJ | Cape Bancorp, Inc. | NJ | 7.17 | % | 28.91 | % | 2.60 | % | 4.25 | % | 30.60 | % | 6.02 | % | 0.06 | % | 72.55 | % | $ | 1,515 | $ | 2 | ||||||||||||||||||||||
FXCB | Fox Chase Bancorp, Inc. | PA | 27.02 | % | 16.24 | % | 2.87 | % | 2.09 | % | 29.35 | % | 15.32 | % | 0.04 | % | 71.65 | % | $ | 24,219 | $ | 126 | ||||||||||||||||||||||
GTWN | Georgetown Bancorp, Inc. | MA | 6.59 | % | 40.83 | % | 10.58 | % | 5.53 | % | 22.91 | % | 6.58 | % | 0.11 | % | 76.24 | % | $ | 113,446 | $ | 834 | ||||||||||||||||||||||
MLVF | Malvern Bancorp, Inc. | PA | 12.73 | % | 50.20 | % | 1.16 | % | 0.17 | % | 11.85 | % | 0.91 | % | 0.47 | % | 58.54 | % | $ | 0 | $ | 453 | ||||||||||||||||||||||
OSHC | Ocean Shore Holding Co. | NJ | 8.19 | % | 63.46 | % | 2.65 | % | 0.35 | % | 8.48 | % | 0.85 | % | 0.05 | % | 51.74 | % | $ | 0 | $ | 3 | ||||||||||||||||||||||
ONFC | Oneida Financial Corp. | NY | 13.84 | % | 21.78 | % | 0.31 | % | 1.65 | % | 9.50 | % | 6.74 | % | 5.04 | % | 57.09 | % | $ | 101,260 | $ | 352 | ||||||||||||||||||||||
PBIP | Prudential Bancorp, Inc. | PA | 10.21 | % | 54.09 | % | 2.42 | % | 1.36 | % | 3.05 | % | 0.38 | % | 0.08 | % | 45.72 | % | $ | 0 | $ | 0 | ||||||||||||||||||||||
SVBI | Severn Bancorp, Inc. | MD | 2.07 | % | 43.05 | % | 10.22 | % | 1.31 | % | 25.38 | % | 2.23 | % | 0.09 | % | 70.99 | % | $ | 70,447 | $ | 708 | ||||||||||||||||||||||
WEBK | Wellesley Bancorp, Inc. | MA | 3.17 | % | 48.95 | % | 13.58 | % | 0.48 | % | 17.22 | % | 3.59 | % | 0.05 | % | 70.88 | % | $ | 37 | $ | 0 | ||||||||||||||||||||||
WVFC | WVS Financial Corp. | PA | 66.04 | % | 7.72 | % | 1.20 | % | 1.37 | % | 1.35 | % | 0.48 | % | 0.05 | % | 35.11 | % | $ | 0 | $ | 0 | ||||||||||||||||||||||
| (1) | Ratios are based on the date of the most recent financial statements disclosed in the offering prospectus. |
| (2) | As of or for the twelve months ended September 30, 2014. |
| Source: | SNL Financial LC. and RP® Financial, LC. calculations. The information provided in this table has been obtained from sources we believe are reliable, but we cannot guarantee the accuracy or completeness of such information. |
Copyright (c) 2015 by RP® Financial, LC.
| RP® Financial, LC. | Peer Group Analysis | |
| Page III.13 |
Table 3.5
Interest Rate Risk Measures and Net Interest Income Volatility
Comparable Institution Analysis
As of December 31, 2014 or Most Recent Date Available
Balance Sheet Measures | ||||||||||||||||||||||||||||||||||||||||
| Tangible Equity/ Assets | IEA/ IBL | Non-IEA Assets/ Assets | Quarterly Change in Net Interest Income | |||||||||||||||||||||||||||||||||||||
| 12/31/2014 | 9/30/2014 | 6/30/2014 | 3/31/2014 | 12/31/2013 | 9/30/2013 | |||||||||||||||||||||||||||||||||||
| (%) | (%) | (%) | (change in net interest income is annualized in basis points) | |||||||||||||||||||||||||||||||||||||
MSB Financial Corp. | NJ | |||||||||||||||||||||||||||||||||||||||
December 31, 2014 | 12.1 | % | 107.8 | % | 6.2 | % | 0 | -1 | -4 | 8 | 7 | 14 | ||||||||||||||||||||||||||||
All Public Companies | 13.0 | % | 102.6 | % | 6.9 | % | 0 | 0 | 1 | -1 | 5 | 3 | ||||||||||||||||||||||||||||
State of NJ | 14.1 | % | 110.3 | % | 7.9 | % | -1 | 1 | -5 | -3 | 3 | 4 | ||||||||||||||||||||||||||||
Comparable Recent Conversions(1) | ||||||||||||||||||||||||||||||||||||||||
PBHC | Pathfinder Bancorp, inc. | NY | 7.5 | % | 102.9 | % | 6.6 | % | 2 | 6 | 0 | -9 | 6 | -2 | ||||||||||||||||||||||||||
Comparable Group | ||||||||||||||||||||||||||||||||||||||||
Average | 12.8 | % | 110.8 | % | 7.2 | % | -2 | 2 | 2 | -3 | 4 | 1 | ||||||||||||||||||||||||||||
Median | 11.2 | % | 109.9 | % | 5.9 | % | -3 | 1 | 2 | -1 | 6 | 5 | ||||||||||||||||||||||||||||
Comparable Group | ||||||||||||||||||||||||||||||||||||||||
ALLB | Alliance Bancorp, Inc. of Pennsylvania (2) | PA | 15.5 | % | 113.4 | % | 4.3 | % | NA | 1 | -1 | 8 | 11 | 15 | ||||||||||||||||||||||||||
CBNJ | Cape Bancorp, Inc. | NJ | 11.2 | % | 104.0 | % | 8.5 | % | -7 | -1 | -7 | -13 | 2 | 5 | ||||||||||||||||||||||||||
FXCB | Fox Chase Bancorp, Inc. | PA | 16.1 | % | 115.3 | % | 5.9 | % | -3 | 3 | 5 | -4 | 12 | 7 | ||||||||||||||||||||||||||
GTWN | Georgetown Bancorp, Inc. | MA | 11.3 | % | 109.9 | % | 4.1 | % | 0 | 1 | -6 | -5 | 6 | -1 | ||||||||||||||||||||||||||
MLVF | Malvern Bancorp, Inc. | PA | 12.9 | % | 110.1 | % | 9.1 | % | -8 | -5 | 2 | 0 | 19 | 8 | ||||||||||||||||||||||||||
OSHC | Ocean Shore Holding Co. | NJ | 9.8 | % | 106.8 | % | 13.6 | % | 3 | 0 | -3 | 4 | 15 | 2 | ||||||||||||||||||||||||||
ONFC | Oneida Financial Corp. | NY | 9.0 | % | 103.0 | % | 13.5 | % | -4 | 6 | 3 | -21 | -11 | 6 | ||||||||||||||||||||||||||
PBIP | Prudential Bancorp, Inc. | PA | 24.3 | % | 129.5 | % | 3.3 | % | -6 | 4 | 7 | 14 | 9 | -32 | ||||||||||||||||||||||||||
SVBI | Severn Bancorp, Inc. | MD | 10.8 | % | 108.3 | % | 9.3 | % | 2 | 13 | -4 | 5 | -5 | -3 | ||||||||||||||||||||||||||
WEBK | Wellesley Bancorp, Inc. | MA | 9.2 | % | 107.4 | % | 5.0 | % | -7 | -2 | 11 | -17 | -13 | 12 | ||||||||||||||||||||||||||
WVFC | WVS Financial Corp. | PA | 10.8 | % | 110.9 | % | 3.3 | % | 7 | -1 | 19 | -1 | -5 | -10 | ||||||||||||||||||||||||||
NA=Change is greater than 100 basis points during the quarter.
| (1) | Ratios are based on the date of the most recent financial statements disclosed in the offering prospectus. |
| (2) | As of September 30, 2014. |
| Source: | SNL Financial LC. and RP® Financial, LC. calculations. The information provided in this table has been obtained from sources we believe are reliable, but we cannot guarantee the accuracy or completeness of such information. |
Copyright (c) 2015 by RP® Financial, LC.
| RP® Financial, LC. | PEER GROUP ANALYSIS | |
| III.14 |
percent of assets. On a pro forma basis, the infusion of stock proceeds should serve to more than offset the current comparative advantages reflected in the Peer Group’s balance sheet interest rate risk characteristics.
To analyze interest rate risk associated with the net interest margin, we reviewed quarterly changes in net interest income as a percent of average assets for MSB Financial and the Peer Group. In general, the comparative fluctuations in the Company’s and the Peer Group’s net interest income ratios implied that the interest rate risk associated with their respective net interest margins was fairly similar, based on the interest rate environment that prevailed during the period covered in Table 3.5. The stability of the Company’s net interest margin should be enhanced by the infusion of stock proceeds, as interest rate sensitive liabilities will be funding a lower portion of MSB Financial’s assets and the proceeds will be substantially deployed into interest-earning assets.
Credit Risk
Overall, based on a comparison of credit risk measures, the Company’s implied credit risk exposure was viewed to be greater relative to the Peer Group’s credit risk exposure. As shown in Table 3.6, the Company’s ratios for non-performing/assets and non-performing loans/loans equaled 5.55% and 7.43%, respectively, versus comparable measures of 1.39% and 1.67% for the Peer Group. It should be noted that the measures for non-performing assets and non-performing loans include accruing loans that are classified as troubled debt restructurings, which accounted for 61.0% of the Company’s non-performing assets and 65.5% of the Company’s non-performing loans. The Company’s and Peer Group’s loss reserves as a percent of non-performing loans equaled 20.64% and 104.93%, respectively. Loss reserves maintained as percent of loans receivable equaled 1.53% for the Company, versus 1.06% for the Peer Group. Net loan charge-offs were a similar factor for the Company and the Peer Group, as net loan charge-offs for the Company and the Peer Group equaled 0.15% and 0.18% of loans, respectively.
Summary
Based on the above analysis, RP Financial concluded that the Peer Group forms a reasonable basis for determining the pro forma market value of the Company. Such general characteristics as asset size, capital position, interest-earning asset composition, funding
| RP® Financial, LC. | Peer Group Analysis | |
| Page III.15 |
Table 3.6
Credit Risk Measures and Related Information
Comparable Institution Analysis
As of December 31, 2014 or Most Recent Date Available
| REO/ Assets | NPAs & 90+Del/ Assets (1) | NPLs/ Loans (1) | Rsrves/ Loans HFI | Rsrves/ NPLs (1) | Rsrves/ NPAs & 90+Del (1) | Net Loan Chargeoffs (2) | NLCs/ Loans | |||||||||||||||||||||||||||||
| (%) | (%) | (%) | (%) | (%) | (%) | ($000) | (%) | |||||||||||||||||||||||||||||
MSB Financial Corp. | NJ | |||||||||||||||||||||||||||||||||||
December 31, 2014 | 0.38 | % | 5.55 | % | 7.43 | % | 1.53 | % | 20.64 | % | 19.24 | % | $ | 345 | 0.15 | % | ||||||||||||||||||||
All Public Companies | ||||||||||||||||||||||||||||||||||||
Averages | 0.33 | % | 2.06 | % | 2.19 | % | 1.23 | % | 88.43 | % | 71.61 | % | $ | 2,995 | 0.17 | % | ||||||||||||||||||||
Medians | 0.17 | % | 1.42 | % | 1.66 | % | 1.07 | % | 68.37 | % | 51.00 | % | $ | 689 | 0.11 | % | ||||||||||||||||||||
State of NJ | ||||||||||||||||||||||||||||||||||||
Averages | 0.39 | % | 2.06 | % | 2.64 | % | 1.00 | % | 64.13 | % | 57.17 | % | $ | 3,294 | 0.21 | % | ||||||||||||||||||||
Medians | 0.06 | % | 1.50 | % | 1.78 | % | 1.01 | % | 55.12 | % | 45.07 | % | $ | 1,709 | 0.13 | % | ||||||||||||||||||||
Comparable Recent Conversions(3) | ||||||||||||||||||||||||||||||||||||
PBHC | Pathfinder Bancorp, Inc. | NY | 0.13 | % | 1.83 | % | 2.57 | % | 1.44 | % | 55.85 | % | 51.81 | % | $ | 640 | 0.18 | % | ||||||||||||||||||
Comparable Group | ||||||||||||||||||||||||||||||||||||
Averages | 0.18 | % | 1.39 | % | 1.67 | % | 1.06 | % | 104.93 | % | 86.59 | % | $ | 1,074 | 0.18 | % | ||||||||||||||||||||
Medians | 0.07 | % | 0.94 | % | 1.17 | % | 1.06 | % | 75.28 | % | 55.08 | % | $ | 518 | 0.12 | % | ||||||||||||||||||||
Comparable Group | ||||||||||||||||||||||||||||||||||||
ALLB | Alliance Bancorp, Inc. of Pennsylvania (4) | PA | 0.55 | % | 2.12 | % | 1.91 | % | 1.44 | % | 75.10 | % | 49.06 | % | $ | 903 | 0.30 | % | ||||||||||||||||||
CBNJ | Cape Bancorp, Inc. | NJ | 0.49 | % | 1.68 | % | 1.60 | % | 1.20 | % | 75.28 | % | 51.66 | % | $ | 2,957 | 0.38 | % | ||||||||||||||||||
FXCB | Fox Chase Bancorp, Inc. | PA | 0.26 | % | 0.90 | % | 0.96 | % | 1.46 | % | 151.60 | % | 108.47 | % | $ | 2,743 | 0.38 | % | ||||||||||||||||||
GTWN | Georgetown Bancorp, Inc. | MA | 0.00 | % | 0.59 | % | 0.68 | % | 0.95 | % | 140.01 | % | 140.01 | % | $ | 265 | 0.11 | % | ||||||||||||||||||
MLVF | Malvern Bancorp, Inc. | PA | 0.25 | % | 0.80 | % | 0.86 | % | 1.19 | % | 137.68 | % | 95.14 | % | $ | 518 | 0.13 | % | ||||||||||||||||||
OSHC | Ocean Shore Holding Co. | NJ | 0.06 | % | 0.95 | % | 1.17 | % | 0.48 | % | 41.22 | % | 38.48 | % | $ | 901 | 0.12 | % | ||||||||||||||||||
ONFC | Oneida Financial Corp. | NY | 0.03 | % | 0.17 | % | 0.29 | % | 0.95 | % | 327.08 | % | 265.98 | % | $ | 107 | 0.03 | % | ||||||||||||||||||
PBIP | Prudential Bancorp, Inc. | PA | 0.07 | % | 1.46 | % | 2.20 | % | 0.75 | % | 34.02 | % | 32.50 | % | $ | 168 | 0.05 | % | ||||||||||||||||||
SVBI | Severn Bancorp, Inc. | MD | 0.25 | % | 5.47 | % | 6.24 | % | 1.47 | % | 23.26 | % | 22.19 | % | $ | 3,135 | 0.48 | % | ||||||||||||||||||
WEBK | Wellesley Bancorp, Inc. | MA | 0.00 | % | 0.94 | % | 1.12 | % | 1.06 | % | 93.91 | % | 93.91 | % | $ | 115 | 0.03 | % | ||||||||||||||||||
WVFC | WVS Financial Corp. | PA | 0.00 | % | 0.16 | % | 1.29 | % | 0.71 | % | 55.08 | % | 55.08 | % | $ | 0 | 0.00 | % | ||||||||||||||||||
| (1) | Includes TDRs for the Company and the Peer Group. |
| (2) | Net loan chargeoffs are shown on a last twelve month basis. |
| (3) | Ratios are based on the date of the most recent financial statements disclosed in the offering prospectus. |
| (4) | As of or for the twelve months ended December 31, 2014. |
| Source: | SNL Financial, LC and RP® Financial, LC. calculations. The information provided in this table has been obrained from sources we believe are reliable, but we cannot guarantee the accuracy or completeness of such information. |
Copyright (c) 2015 by RP® Financial, LC.
| RP® Financial, LC. | PEER GROUP ANALYSIS | |
| III.16 |
composition, core earnings measures, loan composition, credit quality and exposure to interest rate risk all tend to support the reasonability of the Peer Group from a financial standpoint. Those areas where differences exist will be addressed in the form of valuation adjustments to the extent necessary.
| RP® Financial, LC. | VALUATION ANALYSIS | |
| IV.1 |
IV. VALUATION ANALYSIS
Introduction
This chapter presents the valuation analysis and methodology, prepared pursuant to the regulatory valuation guidelines, and valuation adjustments and assumptions used to determine the estimated pro forma market value of the common stock to be issued in conjunction with the Company’s conversion transaction.
Appraisal Guidelines
The federal regulatory appraisal guidelines required by the FRB, the OCC, the FDIC and state banking agencies specify the pro forma market value methodology for estimating the pro forma market value of a converting thrift. Pursuant to this methodology: (1) a peer group of comparable publicly-traded institutions is selected; (2) a financial and operational comparison of the subject company to the peer group is conducted to discern key differences; and (3) a valuation analysis in which the pro forma market value of the subject company is determined based on the market pricing of the peer group as of the date of valuation, incorporating valuation adjustments for key differences. In addition, the pricing characteristics of recent conversions, both at conversion and in the aftermarket, must be considered.
RP Financial Approach to the Valuation
The valuation analysis herein complies with such regulatory approval guidelines. Accordingly, the valuation incorporates a detailed analysis based on the Peer Group, discussed in Chapter III, which constitutes “fundamental analysis” techniques. Additionally, the valuation incorporates a “technical analysis” of recently completed stock conversions, particularly second-step conversions, including closing pricing and aftermarket trading of such offerings. It should be noted that these valuation analyses cannot possibly fully account for all the market forces which impact trading activity and pricing characteristics of a particular stock on a given day.
The pro forma market value determined herein is a preliminary value for the Company’s to-be-issued stock. Throughout the conversion process, RP Financial will: (1) review changes in MSB Financial’s operations and financial condition; (2) monitor MSB Financial’s operations and financial condition relative to the Peer Group to identify any fundamental changes; (3)
| RP® Financial, LC. | VALUATION ANALYSIS | |
| IV.2 |
monitor the external factors affecting value including, but not limited to, local and national economic conditions, interest rates, and the stock market environment, including the market for thrift stocks and MSB Financial’s stock specifically; and (4) monitor pending conversion offerings, particularly second-step conversions, (including those in the offering phase), both regionally and nationally. If, during the conversion process, material changes occur, RP Financial will determine if updated valuation reports should be prepared to reflect such changes and their related impact on value, if any. RP Financial will also prepare a final valuation update at the closing of the offering to determine if the prepared valuation analysis and resulting range of value continues to be appropriate.
The appraised value determined herein is based on the current market and operating environment for the Company and for all thrifts. Subsequent changes in the local and national economy, the legislative and regulatory environment, the stock market, interest rates, and other external forces (such as natural disasters or major world events), which may occur from time to time (often with great unpredictability) may materially impact the market value of all thrift stocks, including MSB Financial’s value, or MSB Financial’s value alone. To the extent a change in factors impacting the Company’s value can be reasonably anticipated and/or quantified, RP Financial has incorporated the estimated impact into the analysis.
Valuation Analysis
A fundamental analysis discussing similarities and differences relative to the Peer Group was presented in Chapter III. The following sections summarize the key differences between the Company and the Peer Group and how those differences affect the pro forma valuation. Emphasis is placed on the specific strengths and weaknesses of the Company relative to the Peer Group in such key areas as financial condition, profitability, growth and viability of earnings, asset growth, primary market area, dividends, liquidity of the shares, marketing of the issue, management, and the effect of government regulations and/or regulatory reform. We have also considered the market for thrift stocks, in particular new issues, to assess the impact on value of the Company coming to market at this time.
| RP® Financial, LC. | VALUATION ANALYSIS | |
| IV.3 |
| 1. | Financial Condition |
The financial condition of an institution is an important determinant in pro forma market value because investors typically look to such factors as liquidity, capital, asset composition and quality, and funding sources in assessing investment attractiveness. The similarities and differences in the Company’s and the Peer Group’s financial strengths are noted as follows:
| • | Overall A/L Composition. In comparison to the Peer Group, the Company’s interest-earning asset composition showed a higher concentration of loans and a lower concentration of cash and investments. Diversification into higher risk and higher yielding types of loans was similar for the Company and the Peer Group, while the Company maintained a higher concentration of 1-4 family loans. Overall, in comparison to the Peer Group, the Company’s interest-earning asset composition provided for an equal yield earned on interest-earning assets and a similar risk weighted assets-to-assets ratio. MSB Financial’s funding composition reflected a higher level of deposits and a lower level of borrowings relative to the comparable Peer Group measures, which translated into a slightly higher cost of funds for the Company. Overall, as a percent of assets, the Company maintained a slightly lower level of interest-earning assets and a higher level of interest-bearing liabilities compared to the Peer Group’s ratios, which resulted in a lower IEA/IBL ratio for the Company. After factoring in the impact of the net stock proceeds, the Company’s IEA/IBL ratio should be comparable to or exceed the Peer Group’s IEA/IBL ratio. On balance, RP Financial concluded that asset/liability composition was a neutral factor in our adjustment for financial condition. |
| • | Credit Quality. The Company’s ratios for non-performing assets as a percent of assets and non-performing loans as a percent of loans were higher than the comparable ratios for the Peer Group, in which accruing troubled debt restructurings comprised more than half of the Company’s non-performing assets and non-performing loans. In comparison to the Peer Group, the Company maintained lower loss reserves as a percent of non-performing loans and higher loss reserves as a percent of loans. Net loan charge-offs as a percent of loans were similar for the Company and the Peer Group. The Company’s risk weighted assets-to-assets ratio was similar to the Peer Group’s ratio. Overall, RP Financial concluded that credit quality was a slightly negative factor in our adjustment for financial condition. |
| • | Balance Sheet Liquidity. The Company operated with a lower level of cash and investment securities relative to the Peer Group (25.79% of assets versus 29.17% for the Peer Group). Following the infusion of stock proceeds, the Company’s cash and investments ratio is expected to increase as the net proceeds realized from the second-step offering will be initially deployed into cash and investments. The Company was viewed as having slightly greater future borrowing capacity relative to the Peer Group, based on the slightly higher level of borrowings currently funding the Peer Group’s assets. Overall, RP Financial concluded that balance sheet liquidity was a neutral factor in our adjustment for financial condition. |
| • | Funding Liabilities. The Company’s interest-bearing funding composition reflected a slightly higher concentration of deposits and a slightly lower concentration of borrowings relative to the comparable Peer Group ratios, which translated into a slightly lower cost of funds for the Peer Group. Total interest-bearing liabilities as a percent of assets were higher for the Company. Following the stock offering, the increase in the Company’s capital position will reduce the level of interest-bearing liabilities funding the Company’s assets to a ratio that is lower than the comparable Peer Group ratio. Overall, RP Financial concluded that funding liabilities was a neutral factor in our adjustment for financial condition. |
| RP® Financial, LC. | VALUATION ANALYSIS | |
| IV.4 |
| • | Capital. The Company currently operates with a slightly lower tangible equity-to-assets ratio than the Peer Group. Following the stock offering, MSB Financial’s pro forma tangible capital position is expected to exceed the Peer Group’s tangible equity-to-assets ratio. The increase in the Company’s pro forma capital position will result in greater leverage potential and reduce the level of interest-bearing liabilities utilized to fund assets. At the same time, the Company’s more significant capital surplus will likely result in a lower ROE. On balance, RP Financial concluded that capital strength was a slightly positive factor in our adjustment for financial condition. |
On balance, MSB Financial’s balance sheet strength was considered to be similar to the Peer Group’s balance sheet strength and, thus, no adjustment was applied for the Company’s financial condition.
| 2. | Profitability, Growth and Viability of Earnings |
Earnings are a key factor in determining pro forma market value, as the level and risk characteristics of an institution’s earnings stream and the prospects and ability to generate future earnings heavily influence the multiple that the investment community will pay for earnings. The major factors considered in the valuation are described below.
| • | Reported Earnings. The Company’s reported earnings were lower than the Peer Group’s on a ROAA basis (0.21% of average assets versus 0.47% for the Peer Group), as the Company’s earnings advantage with respect to its lower operating expense ratio was more than offset by the Peer Group’s earnings advantages with respect to higher ratios for net interest income non-interest operating income, net non-operating gains and lower effective tax rate. Reinvestment of stock proceeds into interest-earning assets will serve to increase the Company’s earnings, with the benefit of reinvesting proceeds expected to be somewhat offset by implementation of additional stock benefit plans in connection with the second-step offering. Overall, the Company’s pro forma reported earnings were considered to be less favorable than the Peer Group’s earnings and, thus, RP Financial concluded that this was a moderately negative factor in our adjustment for profitability, growth and viability of earnings. |
| • | Core Earnings. Net interest income, operating expenses, non-interest operating income and loan loss provisions were reviewed in assessing the relative strengths and weaknesses of the Company’s and the Peer Group’s core earnings. The Company maintained a lower net interest income ratio, a lower operating expense ratio and a lower level of non-interest operating income. The Company’s less favorable net interest income ratio and more favorable operating expense ratio translated into a slightly higher expense coverage ratio in comparison to the Peer Group’s ratio (equal to 1.09x versus 1.04x for the Peer Group). Comparatively, the Company’s efficiency ratio of 86.00% was less favorable than the Peer Group’s efficiency ratio of 78.13%. Loan loss provisions had a similar impact on the Company’s and the Peer Group’s earnings. After adjusting for non-operating gains, the Company’s ROAA ratio remained well below the comparable Peer Group ratio. Overall, these measures, as well as the expected earnings benefits the Company |
| RP® Financial, LC. | VALUATION ANALYSIS | |
| IV.5 |
should realize from the redeployment of stock proceeds into interest-earning assets and leveraging of post-conversion capital, which will be somewhat negated by expenses associated with the stock benefit plans, indicate that the Company’s pro forma core earnings will remain less favorable than the Peer Group’s core earnings. Therefore, RP Financial concluded that this was a moderately negative factor in our adjustment for profitability, growth and viability of earnings. |
| • | Interest Rate Risk. Quarterly changes in the Company’s and the Peer Group’s net interest income to average assets ratios indicated a similar degree of volatility was associated with the Company’s and the Peer Group’s net interest margins. Other measures of interest rate risk, such as capital and IEA/IBL ratios were slightly more favorable for the Peer Group. On a pro forma basis, the infusion of stock proceeds can be expected to provide the Company with equity-to-assets and IEA/ILB ratios that will exceed the Peer Group ratios, as well as enhance the stability of the Company’s net interest margin through the reinvestment of stock proceeds into interest-earning assets. On balance, RP Financial concluded that interest rate risk was a neutral factor in our adjustment for profitability, growth and viability of earnings |
| • | Credit Risk. Loan loss provisions were a similar factor in the Company’s and the Peer Group’s earnings (0.11% of average assets versus 0.10% of average assets for the Peer Group). In terms of future exposure to credit quality related losses, lending diversification into higher risk types of loans was similar for the Company and the Peer Group. The Company’s credit quality measures generally implied a higher degree of credit risk exposure relative to the comparable credit quality measures indicated for the Peer Group. Overall, RP Financial concluded that credit risk was a slightly negative factor in our adjustment for profitability, growth and viability of earnings. |
| • | Earnings Growth Potential. Several factors were considered in assessing earnings growth potential. First, the Peer Group maintained a slightly higher interest rate spread than the Peer Group, which would tend to facilitate continuation of a higher net interest margin for the Peer Group going forward based on the current prevailing interest rate environment. Second, the infusion of stock proceeds will provide the Company with greater growth potential through leverage than currently maintained by the Peer Group. Third, the Peer Group’s higher ratio of non-interest operating income and the Company’s lower operating expense ratio were viewed as respective advantages to sustain earnings growth during periods when net interest margins come under pressure as the result of adverse changes in interest rates. Overall, earnings growth potential was considered to be a neutral factor in our adjustment for profitability, growth and viability of earnings. |
| • | Return on Equity. Currently, the Company’s core ROE is lower than the Peer Group’s core ROE. As the result of the increase in capital that will be realized from the infusion of net stock proceeds into the Company’s equity, the Company’s pro forma return equity on a core earnings basis will remain lower than the Peer Group’s core ROE. Accordingly, this was a moderately negative factor in the adjustment for profitability, growth and viability of earnings. |
On balance, MSB Financial’s pro forma earnings strength was considered to be less favorable than the Peer Group’s and, thus, a moderate downward adjustment was applied for profitability, growth and viability of earnings.
| RP® Financial, LC. | VALUATION ANALYSIS | |
| IV.6 |
| 3. | Asset Growth |
Comparative asset growth rates for the Company and the Peer Group showed a 1.97% decrease in the Company’s assets, versus a 1.32% increase in the Peer Group’s assets. The Company’s asset shrinkage was due to a 6.27% decline in cash and investments, which funded a 0.27% increase in loans. Asset growth for the Peer Group consisted of a 4.80% increase in loans, which was partially offset by a 2.70% decrease in cash and investments. Overall, the Company’s recent asset growth trends would tend to be viewed less favorably than the Peer Group’s asset growth trends, in terms of supporting future earnings growth. On a pro forma basis, the Company’s tangible equity-to-assets ratio will exceed the Peer Group’s tangible equity-to-assets ratio, indicating greater leverage capacity for the Company. On balance, no adjustment was applied for asset growth.
| 4. | Primary Market Area |
The general condition of an institution’s market area has an impact on value, as future success is in part dependent upon opportunities for profitable activities in the local market served. MSB Financial serves northeastern New Jersey through the main office and four branch locations. Operating in a densely populated market area with slow to moderate growth provides the Company with growth opportunities, but such growth must be achieved in a highly competitive market environment. The Company competes against significantly larger institutions that provide a larger array of services and have significantly larger branch networks than maintained by MSB Financial. The Company maintains relatively low market shares of deposits in the two counties where its branches are maintained.
The Peer Group companies generally operate in markets with similarly sized populations as Morris County. Population growth for the primary market area counties served by the Peer Group companies reflected a range of growth rates, but overall population growth rates in the markets served by the Peer Group companies approximated Morris County’s recent historical growth and projected population growth rates. Morris County has a higher per capita income compared to the primary market area counties served by Peer Group companies and, on average, the Peer Group’s primary market area counties were less affluent markets within their respective states compared to Morris County’s per capita income as a percent of New Jersey’s
| RP® Financial, LC. | VALUATION ANALYSIS | |
| IV.7 |
per capita income (107.7% for the Peer Group versus 131.4% for Morris County). The average and median deposit market shares maintained by the Peer Group companies were above the Company’s market share of deposits in Morris County. Overall, the degree of competition faced by the Peer Group companies was viewed as less than faced by the Company in Morris County, while the growth potential in the markets served by the Peer Group companies was for the most part viewed to be similar to the Company’s primary market area. Summary demographic and deposit market share data for the Company and the Peer Group companies is provided in Exhibit III-4. As shown in Table 4.1, the average unemployment rate for the primary market area counties served by the Peer Group companies was above the unemployment rate reflected for Morris County. On balance, we concluded that a slight upward adjustment was appropriate for the Company’s market area.
Table 4.1
Market Area Unemployment Rates
MSB Financial Corp. and the Peer Group Companies(1)
| County | December 2014 Unemployment | |||||
MSB Financial Corp. - NJ | Morris | 4.2 | % | |||
Peer Group Average | 6.1 | % | ||||
Alliance Bancorp, Inc. – PA | Delaware | 4.5 | ||||
Cape Bancorp, Inc. - NJ | Cape May | 12.7 | ||||
Fox Chase Bancorp, Inc. – PA | Montgomery | 3.8 | ||||
Georgetown Bancorp, Inc. - MA | Essex | 5.1 | ||||
Malvern Bancorp, Inc. – PA | Chester | 3.4 | ||||
Ocean Shore Holding Co. - NJ | Cape May | 12.7 | ||||
Oneida Financial Corp. - NY | Madison | 6.5 | ||||
Prudential Bancorp, Inc. - PA | Philadelphia | 6.2 | ||||
Severn Bancorp, Inc. - MD | Anne Arundel | 4.6 | ||||
Wellesley Bancorp, Inc. - MA | Norfolk | 3.9 | ||||
WVS Financial Corp. – PA | Allegheny | 4.1 | ||||
| (1) | Unemployment rates are not seasonally adjusted. |
| Source: | SNL Financial. |
| RP® Financial, LC. | VALUATION ANALYSIS | |
| IV.8 |
| 5. | Dividends |
At this time the Company has not established a dividend policy. Future declarations of dividends by the Board of Directors will depend upon a number of factors, including investment opportunities, growth objectives, financial condition, profitability, tax considerations, minimum capital requirements, regulatory limitations, stock market characteristics and general economic conditions.
Nine out of the eleven Peer Group companies pay regular cash dividends, with implied dividend yields ranging from 0.52% to 3.41%. The average dividend yield on the stocks of the Peer Group institutions was 1.53% as of February 6, 2015. Comparatively, as of February 6, 2015, the average dividend yield on the stocks of all fully-converted publicly-traded thrifts equaled 1.81%. The dividend paying thrifts generally maintain higher than average profitability ratios, facilitating their ability to pay cash dividends.
While the Company has not established a definitive dividend policy prior to converting, the Company’s capacity to pay a dividend comparable to the Peer Group’s average dividend yield is viewed to be less based on its lower pro forma earnings and resulting higher payout ratio. On balance, we concluded that a slight downward adjustment was warranted for this factor.
| 6. | Liquidity of the Shares |
The Peer Group is by definition composed of companies that are traded in the public markets. All of the Peer Group companies trade on NASDAQ. Typically, the number of shares outstanding and market capitalization provides an indication of how much liquidity there will be in a particular stock. The market capitalization of the Peer Group companies ranged from $23 million to $194 million as of February 6, 2015, with average and median market values of $81 million and $79 million, respectively. The shares issued and outstanding of the Peer Group companies ranged from 1.8 million to 11.8 million, with average and median shares outstanding both equal to 6.6 million. The Company’s second-step stock offering is expected to provide for a pro forma market value that will in the lower end of the Peer Group’s range of market values and between the bottom and middle of the Peer Group’s range of shares outstanding. Following the second-step conversion, the Company’s stock will continue to be traded on the NASDAQ Global Market. Overall, we anticipate that the Company’s stock will have a comparable trading market as the Peer Group companies on average and, therefore, concluded no adjustment was necessary for this factor.
| RP® Financial, LC. | VALUATION ANALYSIS | |
| IV.9 |
| 7. | Marketing of the Issue |
We believe that four separate markets exist for thrift stocks, including those coming to market such as MSB Financial (A) the after-market for public companies, in which trading activity is regular and investment decisions are made based upon financial condition, earnings, capital, ROE, dividends and future prospects; (B) the new issue market in which converting thrifts are evaluated on the basis of the same factors, but on a pro forma basis without the benefit of prior operations as a fully-converted company; (C) the acquisition market for thrift and bank franchises based in New Jersey; and (D) the market for the public stock of MSB Financial. All of these markets were considered in the valuation of the Company’s to-be-issued stock.
| A. | The Public Market |
The value of publicly-traded thrift stocks is easily measurable, and is tracked by most investment houses and related organizations. Exhibit IV-1 provides pricing and financial data on all publicly-traded thrifts. In general, thrift stock values react to market stimuli such as interest rates, inflation, perceived industry health, projected rates of economic growth, regulatory issues and stock market conditions in general. Exhibit IV-2 displays historical stock market trends for various indices and includes historical stock price index values for thrifts and commercial banks. Exhibit IV-3 displays various stock price indices for thrifts.
In terms of assessing general stock market conditions, the performance of the overall stock market has been mixed in recent quarters. At the start of the third quarter of 2014, the Dow Jones Industrial Average (“DJIA”) closed above 17000 for the first time as better-than-expected job growth reflected in June employment report contributed to stock market gains. The DJIA retreated back under 17000 following the record close, as caution prevailed ahead of the second quarter earnings season. Some better-than-expected earnings reports coming out of the banking and technology sectors helped to propel the DJIA to record highs in mid-July. Global tensions in Ukraine and the Middle East pressured stocks lower heading into late-July. Stocks tumbled lower at the end of July, as worries about the global economy, including Europe’s prolonged economic slump and Argentina defaulting on its debt, translated into a broad-based sell-off. In the first full trading week of August, weaker–than-expected job growth reflected in the July employment report and ongoing geopolitical concerns pushed the DJIA to
| RP® Financial, LC. | VALUATION ANALYSIS | |
| IV.10 |
its lowest close since late-April which was followed by the DJIA rebounding on the last trading day of the week. Following the first week of August, the broader stock market generally drifted higher through the balance of August as investors were encouraged by the absence of more negative geopolitical news coming out of the Middle East and Ukraine along with a favorable report on housing starts for July. The S&P 500 closed above 2000 for the first time in late-August. Stocks traded higher to close out the first week of September, as weaker-than-expected job growth reflected in the August employment report lessened expectations of a near term rate hike by the Federal Reserve. Escalating tensions in Ukraine and the upcoming meeting of the Federal Reserve weighed on the stock market heading into mid-September. Reassuring comments from the Federal Reserve that short-term rates will remain near zero for a “considerable time” contributed to the DJIA closing at a record high following the Federal Reserve’s mid-September policy meeting. Concerns about the pace of China’s economic growth and some favorable economic reports on the U.S. economy provided for an up and down stock market at the close of third quarter.
Volatility continued to prevail in the broader stock market at the start of the fourth quarter of 2014, with concerns about a softening global economy contributing to a sell-off at the beginning of the fourth quarter that was followed by a rebound supported by a favorable employment report for September. Heightened concerns over slowing economic growth in Europe, a disappointing retail sales report for September and the uncertain outlook for third quarter earnings fueled a sharp decline in the broader stock market in mid-October, with the DJIA declining 5% over five trading sessions. Stocks rallied following the sell-off with such factors as some favorable third quarter earnings reports, increased expectations that the European Central Bank would increase stimulus, a rise in U.S. consumer sentiment in October and an increase in September housing starts contributing to the gains. The upward trend in the broader stock market continued into the first half of November, with the DJIA closing at record highs for five consecutive trading sessions following the mid-term election. The positive trend in the broader stock market continued during the second half of November and into early-December, as investors cheered China’s rate cut. Led by a rebound in big energy stocks and a favorable employment report for November, the DJIA and S&P 500 closed at record highs in early-December. Pressured by steepening decline in oil prices and fresh signs of economic weakness in Europe and Japan, stocks retreated heading into mid-December. The Federal Reserve’s pledge to be patient when it comes to raising interest rates and stronger-than-expected third quarter GDP growth helped stocks to rally in the second half of December. The
| RP® Financial, LC. | VALUATION ANALYSIS | |
| IV.11 |
DJIA closed above 18000 for the first time on December 23, 2014 and posted gains for seven consecutive trading sessions through December 26, 2014. Stocks retreated at the close of 2014, which was largely attributable to profit taking.
Stocks tumbled at the start of 2015, as oil fell below $50 per barrel and fresh worries about Europe’s economy stoked fears of deflation. A rebound in oil prices supported a two day rebound in the broader stock market, which was followed by a downward trend through mid-January. Factors contributing to the downturn included a further drop in oil prices, a weak reading for December wage growth, disappointing retail sales for December and lackluster fourth quarter earnings results posted by some of the nation’s largest banks. After five consecutive sessions of losses, some upbeat reports on the U.S. economy, a rebound in energy shares and a new round of stimulus efforts proposed by the European Central Bank contributed to a stock market rally heading into the second half of January. Volatility prevailed in the broader stock at the end of January and into early-February, as investors reacted to mixed earnings reports, fluctuating oil prices and weaker-than-expected fourth quarter GDP growth. Higher oil prices contributed to stocks closing out the first week of trading in February with a net gain. On February 6, 2015, the DJIA closed at 17824.29, an increase of 14.0% from one year ago and no change year-to-date, and the NASDAQ closed at 4744.40, an increase of 16.9% from one year ago and an increase of 0.2% year-to-date. The Standard & Poor’s 500 Index closed at 2055.47 on February 6, 2015, an increase of 15.9% from one year ago and a decrease of 0.2% year-to-date.
The market for thrift stocks has also experienced varied trends in recent quarters. The favorable employment report for June boosted thrift stocks, along with the broader stock market, at the start of the third quarter of 2014. Financial shares eased lower ahead of the second quarter earnings season. Mixed second earnings reports coming out of the banking sector provided for a narrow trading range for thrift shares through mid-July. Thrift stocks faltered along with stocks in general heading into the second half of July, as investors moved to safe haven investments on reports of a Malaysian airliner being shot down and Israel’s invasion of Gaza. Merger activity in the banking sector helped to lift thrift stocks heading into late-July. Thrift shares traded lower to close out July and at the start of August, as concerns that an improving U.S. economy could prompt the Federal Reserve to raise rates sooner than expected weighed on interest rate sensitive issues. In the first full week trading in August, thrift shares stabilized and then rebounded along with the broader stock market to close out the week. Thrift stocks edged higher along with the broader stock market during the last three weeks of August,
| RP® Financial, LC. | VALUATION ANALYSIS | |
| IV.12 |
with the favorable report for July housing starts contributing to stock market gains in the thrift sector. Investors shrugged off the disappointing employment report for August, as the thrift sector showed little movement during the first two weeks of September. Financial shares edged higher following the Federal Reserve’s mid-September policy meeting, based on comments that the Federal Reserve was staying the course regarding interest rate monetary policies. Concerns about a global economic slowdown dragged bank and thrift stocks lower at the close of the third quarter.
Financial shares traded in line with the broader stock market in early-October 2014, initially trading lower on the global economic outlook and then rebounding in response to September employment data showing stronger-than-expected job growth. The rebound was short-lived, as the financial sector participated in the broader stock market sell-off in mid-October. Third quarter earnings releases posted by some of the big banks showed net interest margins continued to be squeezed by low interest rates. Some favorable reports on September housing starts and existing home sales helped thrift stocks to rebound modestly following the sell-off. Thrift stocks participated in the broader stock market rally that extended into mid-November, as the Federal Reserve’s late-October policy statement repeated its pledge to keep interest rates low for the foreseeable future and indicated a brighter economic outlook. Signs of financial sector merger activity picking up also contributed to the gains in thrift stocks heading into mid-November. Thrift shares traded in a narrow range during the second half of November and then retreated at the start of December, as disappointing economic reports coming out of China and Europe impacted the broader stock market. November’s favorable employment report boosted the thrift sector at the close of the first week of December, which was followed by a downturn in financial shares going into mid-December as the prolonged slump in oil prices raised doubts about the health of the global economy and sparked a sell-off in the broader stock market. Financial shares rebounded along with the broader stock market during the second half of December, as the Federal Reserve’s comments on remaining patient with its approach to future rate increases were well received by bank investors.
Thrift stocks followed the broader stock market lower during the first half of January 2015, as a weak report for December retail sales and fourth quarter bank earnings showing net interest margins continued to be squeezed depressed financial stocks in general. The broader stock market rally at the start of the second half of January boosted thrift shares as well. Financial shares rallied heading into late-January in response to Royal Bank of Canada’s $5.4 billion acquisition of City National. Thrift stocks retreated at the close of January and then
| RP® Financial, LC. | VALUATION ANALYSIS | |
| IV.13 |
rebounded during the first week of February, as investors reacted to some encouraging news on home prices, the January employment report showing strong-than-expected job growth and signs of acquisition activity heating up in the banking sector. On February 6, 2015, the SNL Index for all publicly-traded thrifts closed at 727.1, an increase of 8.0% from one year ago and a decrease of 1.6% year-to-date.
| B. | The New Issue Market |
In addition to thrift stock market conditions in general, the new issue market for converting thrifts is also an important consideration in determining the Company’s pro forma market value. The new issue market is separate and distinct from the market for seasoned thrift stocks in that the pricing ratios for converting issues are computed on a pro forma basis, specifically: (1) the numerator and denominator are both impacted by the conversion offering amount, unlike existing stock issues in which price change affects only the numerator; and (2) the pro forma pricing ratio incorporates assumptions regarding source and use of proceeds, effective tax rates, stock plan purchases, etc. which impact pro forma financials, whereas pricing for existing issues are based on reported financials. The distinction between pricing of converting and existing issues is perhaps no clearer than in the case of the price/book (“P/B”) ratio in that the P/B ratio of a converting thrift will typically result in a discount to book value whereas in the current market for existing thrifts the P/B ratio may reflect a premium to book value. Therefore, it is appropriate to also consider the market for new issues, both at the time of the conversion and in the aftermarket.
As shown in Table 4.2, three standard conversions and two second-step conversion have been completed during the past three months. For purposes of comparable data in connection with the valuation of the Company, recent second-step conversion offerings are viewed to be the most relevant. The average closing pro forma price/tangible book ratio of the two recent second-step conversion offerings equaled 75.50%. On average, the two second-step conversion offerings had price appreciation of 6.00% after their first week of trading. As of February 6, 2015, the two recent second-step conversion offerings showed an average price increase of 8.60% from their respective IPO prices.
Shown in Table 4.3 are the current pricing ratios for the three fully-converted offerings completed during the past three months and trade on NASDAQ, which includes Beneficial Bancorp’s second-step offering. The current average P/TB ratio of the NASDAQ traded, fully-converted recent conversions equaled 93.95%, based on closing stock prices as of February 6, 2015.
| RP® Financial, LC. | RP® Financial, LC. | |
| IV.14 |
Table 4.2
Pricing Characteristics and After-Market Trends
Conversions Completed in the Last Three Months
Institutional Information | Pre-Conversion Data | Contribution to | Insider Purchases | |||||||||||||||||||||||||||||||||||||||||||||||||||||||||||||
| Financial Info. | Asset Quality | Offering Information | Char. Found. | % Off Incl. Fdn.+Merger Shares | ||||||||||||||||||||||||||||||||||||||||||||||||||||||||||||
| Excluding Foundation | % of | Benefit Plans | Initial | |||||||||||||||||||||||||||||||||||||||||||||||||||||||||||||
| Equity/ | NPAs/ | Res. | Gross | % | % of | Exp./ | Public Off. | Recog. | Stk | Mgmt.& | Div. | |||||||||||||||||||||||||||||||||||||||||||||||||||||
| Conversion | Assets | Assets | Assets | Cov. | Proc. | Offer | Mid. | Proc. | Form | Inc. Fdn. | ESOP | Plans | Option | Dirs. | Yield | |||||||||||||||||||||||||||||||||||||||||||||||||
Institution | Date | Ticker | ($Mil) | (%) | (%) | (%) | ($Mil.) | (%) | (%) | (%) | (%) | (%) | (%) | (%) | (%)(1) | (%) | ||||||||||||||||||||||||||||||||||||||||||||||||
Standard Conversions | ||||||||||||||||||||||||||||||||||||||||||||||||||||||||||||||||
First Northwest Bancorp - WA* | 1/30/15 | FNWB-NASDAQ | $ | 788 | 10.39 | % | 0.80 | % | 137 | % | $ | 121.7 | 100 | % | 132 | % | 2.7 | % | C/S | $ | 400K/7.12 | % | 8.0 | % | 4.0 | % | 10.0 | % | 1.1 | % | 0.00 | % | ||||||||||||||||||||||||||||||||
MW Bancorp, Inc. - OH | 1/30/15 | MWBC-OTC Pink | $ | 90 | 9.75 | % | 1.70 | % | 115 | % | $ | 8.8 | 100 | % | 103 | % | 12.7 | % | N.A. | N.A. | 8.0 | % | 4.0 | % | 10.0 | % | 14.3 | % | 0.00 | % | ||||||||||||||||||||||||||||||||||
MB Bancorp, Inc. - MD | 12/30/14 | MBCQ-OTC Pink | $ | 136 | 12.75 | % | 3.02 | % | 43 | % | $ | 21.2 | 100 | % | 132 | % | 5.0 | % | N.A. | N.A. | 8.0 | % | 4.0 | % | 10.0 | % | 2.7 | % | 0.00 | % | ||||||||||||||||||||||||||||||||||
| Averages - Standard Conversions: | $ | 338 | 10.96 | % | 1.84 | % | 98 | % | $ | 50.5 | 100 | % | 123 | % | 6.8 | % | N.A. | N.A. | 8.0 | % | 4.0 | % | 10.0 | % | 6.0 | % | 0.00 | % | ||||||||||||||||||||||||||||||||||||
| Medians - Standard Conversions: | $ | 136 | 10.39 | % | 1.70 | % | 115 | % | $ | 21.2 | 100 | % | 132 | % | 5.0 | % | N.A. | N.A. | 8.0 | % | 4.0 | % | 10.0 | % | 2.7 | % | 0.00 | % | ||||||||||||||||||||||||||||||||||||
Second Step Conversions | ||||||||||||||||||||||||||||||||||||||||||||||||||||||||||||||||
Ben Franklin Financial, Inc. - IL | 1/22/15 | BFFI-OTCQB | $ | 87 | 9.96 | % | 2.38 | % | 95 | % | $ | 3.9 | 56 | % | 92 | % | 28.4 | % | N.A. | N.A. | 7.0 | % | 3.0 | % | 10.0 | % | 7.2 | % | 0.00 | % | ||||||||||||||||||||||||||||||||||
Beneficial Bancorp, Inc. - PA* | 1/13/15 | BNCL-NASDAQ | $ | 4,360 | 14.03 | % | 0.86 | % | 146 | % | $ | 503.8 | 61 | % | 92 | % | 1.7 | % | N.A. | N.A. | 4.0 | % | 4.0 | % | 10.0 | % | 0.2 | % | 0.00 | % | ||||||||||||||||||||||||||||||||||
| Averages - Second Step Conversions: | $ | 2,224 | 12.00 | % | 1.62 | % | 121 | % | $ | 253.9 | 59 | % | 92 | % | 15.1 | % | N.A. | N.A. | 5.5 | % | 3.5 | % | 10.0 | % | 3.7 | % | 0.00 | % | ||||||||||||||||||||||||||||||||||||
| Medians - Second Step Conversions: | $ | 2,224 | 12.00 | % | 1.62 | % | 121 | % | $ | 253.9 | 59 | % | 92 | % | 15.1 | % | N.A. | N.A. | 5.5 | % | 3.5 | % | 10.0 | % | 3.7 | % | 0.00 | % | ||||||||||||||||||||||||||||||||||||
| Averages - All Conversions: | $ | 1,092 | 11.38 | % | 1.75 | % | 107 | % | $ | 131.9 | 83 | % | 110 | % | 10.1 | % | N.A. | N.A. | 7.0 | % | 3.8 | % | 10.0 | % | 5.1 | % | 0.00 | % | ||||||||||||||||||||||||||||||||||||
| Medians - All Conversions: | $ | 136 | 10.39 | % | 1.70 | % | 115 | % | $ | 21.2 | 100 | % | 103 | % | 5.0 | % | N.A. | N.A. | 8.0 | % | 4.0 | % | 10.0 | % | 2.7 | % | 0.00 | % | ||||||||||||||||||||||||||||||||||||
Institutional Information | Pro Forma Data | Post-IPO Pricing Trends | ||||||||||||||||||||||||||||||||||||||||||||||||||||||||||||||
| Pricing Ratios(2)(5) | Financial Charac. | Closing Price: | ||||||||||||||||||||||||||||||||||||||||||||||||||||||||||||||
| First | After | After | ||||||||||||||||||||||||||||||||||||||||||||||||||||||||||||||
| Core | Core | Core | IPO | Trading | % | First | % | First | % | Thru | % | |||||||||||||||||||||||||||||||||||||||||||||||||||||
| Conversion | P/TB | P/E | P/A | ROA | TE/A | ROE | Price | Day | Chge | Week(3) | Chge | Month(4) | Chge | 2/6/15 | Chge | |||||||||||||||||||||||||||||||||||||||||||||||||
Institution | Date | Ticker | (%) | (x) | (%) | (%) | (%) | (%) | ($) | ($) | (%) | ($) | (%) | ($) | (%) | ($) | (%) | |||||||||||||||||||||||||||||||||||||||||||||||
Standard Conversions | ||||||||||||||||||||||||||||||||||||||||||||||||||||||||||||||||
First Northwest Bancorp - WA* | 1/30/15 | FNWB-NASDAQ | 69.9 | % | 64.6x | 14.7 | % | 0.2 | % | 21.0 | % | 1.1 | % | $ | 10.00 | $ | 12.18 | 21.8 | % | $ | 12.49 | 24.9 | % | $ | 12.49 | 24.9 | % | $ | 12.49 | 24.9 | % | |||||||||||||||||||||||||||||||||
MW Bancorp, Inc. - OH | 1/30/15 | MWBC-OTC Pink | 56.9 | % | NM | 9.0 | % | -0.5 | % | 15.9 | % | -3.4 | % | $ | 10.00 | $ | 11.50 | 15.0 | % | $ | 12.00 | 20.0 | % | $ | 12.00 | 20.0 | % | $ | 12.00 | 20.0 | % | |||||||||||||||||||||||||||||||||
MB Bancorp, Inc. - MD | 12/30/14 | MBCQ-OTC Pink | 60.6 | % | NM | 13.8 | % | -1.3 | % | 22.7 | % | -5.9 | % | $ | 10.00 | $ | 10.45 | 4.5 | % | $ | 10.59 | 5.9 | % | $ | 10.55 | 5.5 | % | $ | 10.60 | 6.0 | % | |||||||||||||||||||||||||||||||||
| Averages - Standard Conversions: | 62.4 | % | 64.6x | 12.5 | % | -0.5 | % | 19.9 | % | -2.7 | % | $ | 10.00 | $ | 11.38 | 13.8 | % | $ | 11.69 | 16.9 | % | $ | 11.68 | 16.8 | % | $ | 11.70 | 17.0 | % | |||||||||||||||||||||||||||||||||||
| Medians - Standard Conversions: | 60.6 | % | 64.6x | 13.8 | % | -0.5 | % | 21.0 | % | -3.4 | % | $ | 10.00 | $ | 11.50 | 15.0 | % | $ | 12.00 | 20.0 | % | $ | 12.00 | 20.0 | % | $ | 12.00 | 20.0 | % | |||||||||||||||||||||||||||||||||||
Second Step Conversions | ||||||||||||||||||||||||||||||||||||||||||||||||||||||||||||||||
Ben Franklin Financial, Inc. - IL | 1/22/15 | BFFI-OTCQB | 62.8 | % | NM | 7.8 | % | -1.8 | % | 12.4 | % | -14.2 | % | $ | 10.00 | $ | 10.11 | 1.1 | % | $ | 10.45 | 4.5 | % | $ | 10.30 | 3.0 | % | $ | 10.30 | 3.0 | % | |||||||||||||||||||||||||||||||||
Beneficial Bancorp, Inc. - PA* | 1/13/15 | BNCL-NASDAQ | 88.2 | % | 57.9x | 17.2 | % | 0.3 | % | 20.0 | % | 1.3 | % | $ | 10.00 | $ | 10.82 | 8.2 | % | $ | 10.75 | 7.5 | % | $ | 11.41 | 14.1 | % | $ | 11.41 | 14.1 | % | |||||||||||||||||||||||||||||||||
| Averages - Second Step Conversions: | 75.5 | % | 57.9x | 12.5 | % | -0.7 | % | 16.2 | % | -6.4 | % | $ | 10.00 | $ | 10.47 | 4.7 | % | $ | 10.60 | 6.0 | % | $ | 10.86 | 8.6 | % | $ | 10.86 | 8.6 | % | |||||||||||||||||||||||||||||||||||
| Medians -Second Step Conversions: | 75.5 | % | 57.9x | 12.5 | % | -0.7 | % | 16.2 | % | -6.4 | % | $ | 10.00 | $ | 10.47 | 4.7 | % | $ | 10.60 | 6.0 | % | $ | 10.86 | 8.6 | % | $ | 10.86 | 8.6 | % | |||||||||||||||||||||||||||||||||||
| Averages - All Conversions: | 67.7 | % | 61.2x | 12.5 | % | -0.6 | % | 18.4 | % | -4.2 | % | $ | 10.00 | $ | 11.01 | 10.1 | % | $ | 11.26 | 12.6 | % | $ | 11.35 | 13.5 | % | $ | 11.36 | 13.6 | % | |||||||||||||||||||||||||||||||||||
| Medians - All Conversions: | 62.8 | % | 61.2x | 13.8 | % | -0.5 | % | 20.0 | % | -3.4 | % | $ | 10.00 | $ | 10.82 | 8.2 | % | $ | 10.75 | 7.5 | % | $ | 11.41 | 14.1 | % | $ | 11.41 | 14.1 | % | |||||||||||||||||||||||||||||||||||
Note: * - Appraisal performed by RP Financial; BOLD = RP Fin. Did the business plan, “NT” - Not Traded; “NA” - Not Applicable, Not Available; C/S-Cash/Stock.
| (1) | As a percent of MHC offering for MHC transactions. | (5) | Mutual holding company pro forma data on full conversion basis. | |||||||
| (2) | Does not take into account the adoption of SOP 93-6. | (6) | Simultaneously completed acquisition of another financial institution. | |||||||
| (3) | Latest price if offering is less than one week old. | (7) | Simultaneously converted to a commercial bank charter. | |||||||
| (4) | Latest price if offering is more than one week but less than one month old. | (8) | Former credit union. | February 6, 2015 |
| RP® Financial, LC. | Valuation Analysis | |
| IV.15 |
Table 4.3
Market Pricing Comparatives
Prices As of February 6, 2015
Market | Per Share Data | |||||||||||||||||||||||||||||||||||||||||||||||||||||||||||||||||||||||||||||||||||
| Capitalization | Core | Book | Dividends(3) | Financial Characteristics(5) | ||||||||||||||||||||||||||||||||||||||||||||||||||||||||||||||||||||||||||||||||
| Price/ | Market | 12 Month | Value/ | Pricing Ratios(2) | Amount/ | Payout | Total | Equity/ | Tang Eq/ | NPAs/ | Reported | Core | ||||||||||||||||||||||||||||||||||||||||||||||||||||||||||||||||||||||||
Financial Institution | Share | Value | EPS(1) | Share | P/E | P/B | P/A | P/TB | P/Core | Share | Yield | Ratio(4) | Assets | Assets | Assets | Assets | ROA | ROE | ROA | ROE | ||||||||||||||||||||||||||||||||||||||||||||||||||||||||||||||||
| ($) | ($Mil) | ($) | ($) | (x) | (%) | (%) | (%) | (x) | ($) | (%) | (%) | ($Mil) | (%) | (%) | (%) | (%) | (%) | (%) | (%) | |||||||||||||||||||||||||||||||||||||||||||||||||||||||||||||||||
All Non-MHC Public Companies | $ | 16.79 | $ | 448.26 | $ | 0.96 | $ | 15.78 | 17.31x | 105.72 | % | 13.63 | % | 113.89 | % | 16.50x | $ | 0.30 | 1.81 | % | 49.60 | % | $ | 3,165 | 13.47 | % | 12.90 | % | 2.02 | % | 0.67 | % | 5.60 | % | 0.72 | % | 5.82 | % | ||||||||||||||||||||||||||||||||||||||||||||||
Converted Last 3 Months (no MHC) | $ | 11.95 | $ | 553.70 | $ | 0.16 | $ | 13.60 | NM | 87.90 | % | 18.95 | % | 93.95 | % | NM | $ | 0.00 | 0.00 | % | NM | $ | 2,854 | 21.56 | % | 20.49 | % | 0.83 | % | 0.28 | % | 1.29 | % | 0.26 | % | 1.21 | % | |||||||||||||||||||||||||||||||||||||||||||||||
Converted Last 3 Months (no MHC) | ||||||||||||||||||||||||||||||||||||||||||||||||||||||||||||||||||||||||||||||||||||
BNCL | Beneficial Bancorp, Inc. | PA | $ | 11.41 | $ | 943.78 | $ | 0.17 | $ | 12.89 | NM | 88.52 | % | 19.60 | % | 100.62 | % | NM | $ | 0.00 | 0.00 | % | NM | $ | 4,814 | 22.14 | % | 20.01 | % | 0.86 | % | 0.32 | % | 1.44 | % | 0.30 | % | 1.34 | % | |||||||||||||||||||||||||||||||||||||||||||||
FNWB | First Northwest Bancorp | WA | $ | 12.49 | $ | 163.62 | $ | 0.15 | $ | 14.31 | NM | 87.28 | % | 18.31 | % | 87.28 | % | NM | $ | 0.00 | 0.00 | % | NM | $ | 894 | 20.98 | % | 20.97 | % | 0.80 | % | 0.24 | % | 1.15 | % | 0.23 | % | 1.08 | % | |||||||||||||||||||||||||||||||||||||||||||||
| (1) | Core income, on a diluted per-share basis. Core income is net income after taxes and before extraordinary items, less net income attributable to noncontrolling interest, gain on the sale of securities, amortization of intangibles, goodwill and nonrecurring items. Assumed tax rate is 35%. |
| (2) | P/E = Price to earnings; P/B = Price to book; P/A = Price to assets; P/TB = Price to tangible book value; and P/Core = Price to core earnings. P/E and P/Core =NM if the ratio is negative or above 35x. |
| (3) | Indicated 12 month dividend, based on last quarterly dividend declared. |
| (4) | Indicated 12 month dividend as a percent of trailing 12 month earnings. |
| (5) | ROAA (return on average assets) and ROAE (return on average equity) are indicated ratios based on trailing 12 month earnings and average equity and assets balances. |
| (6) | Excludes from averages and medians those companies the subject of actual or rumored acquisition activities or unusual operating characteristics. |
| Source: | SNL Financial, LC. and RP® Financial, LC. calculations. The information provided in this report has been obtained from sources we believe are reliable, but we cannot guarantee the accuracy or completeness of such information. |
Copyright (c) 2015 by RP® Financial, LC.
| RP® Financial, LC. | VALUATION ANALYSIS | |
| IV.16 |
| C. | The Acquisition Market |
Also considered in the valuation was the potential impact on MSB Financial’s stock price of recently completed and pending acquisitions of other thrift institutions operating in New Jersey. As shown in Exhibit IV-4, there were six acquisitions of New Jersey based thrifts completed from the beginning of 2011 through February 6, 2015 and there are currently two acquisitions pending for New Jersey thrift institutions. The recent acquisition activity involving New Jersey thrift institutions may imply a certain degree of acquisition speculation for the Company’s stock. To the extent that acquisition speculation may impact the Company’s offering, we have largely taken this into account in selecting companies for the Peer Group that could be subject to the same type of acquisition speculation that may influence MSB Financial’s stock. However, since converting thrifts are subject to a three-year regulatory moratorium from being acquired, acquisition speculation in MSB Financial’s stock would tend to be less compared to the stocks of the Peer Group companies.
| D. | Trading in MSB Financial’s Stock |
Since MSB Financial’s minority stock currently trades under the symbol “MSBF” on the NASDAQ, RP Financial also considered the recent trading activity in the valuation analysis. MSB Financial had a total of 5,010,437 shares issued and outstanding at December 31, 2014, of which 1,919,093 shares were held by public shareholders and traded as public securities. The Company’s stock has had a 52 week trading range of $7.83 to $10.75 per share and its closing price on February 6, 2015 was $10.50 per share. There are significant differences between the Company’s minority stock (currently being traded) and the conversion stock that will be issued by the Company. Such differences include different liquidity characteristics, a different return on equity for the conversion stock and the stock is currently traded based on speculation of a range of exchange ratios. Since the pro forma impact has not been publicly disseminated to date, it is appropriate to discount the current trading level. As the pro forma impact is made known publicly, the trading level will become more informative.
* * * * * * * * * * *
| RP® Financial, LC. | VALUATION ANALYSIS | |
| IV.17 |
In determining our valuation adjustment for marketing of the issue, we considered trends in both the overall thrift market, the new issue market including the new issue market for second-step conversions, the acquisition market, and recent trading activity in the Company’s minority stock. Taking these factors and trends into account, RP Financial concluded that no adjustment was appropriate in the valuation analysis for purposes of marketing of the issue.
| 8. | Management |
The Company’s management team appears to have experience and expertise in all of the key areas of the Company’s operations. Exhibit IV-5 provides summary resumes of the Company’s Board of Directors and senior management. The financial characteristics of the Company suggest that the Board and senior management have been effective in implementing an operating strategy that can be well managed by the Company’s present organizational structure. The Company currently does not have any senior management positions that are vacant.
Similarly, the returns, equity positions and other operating measures of the Peer Group companies are indicative of well-managed financial institutions, which have Boards and management teams that have been effective in implementing competitive operating strategies. Therefore, on balance, we concluded no valuation adjustment relative to the Peer Group was appropriate for this factor.
| 9. | Effect of Government Regulation and Regulatory Reform |
As a fully-converted regulated institution, MSB Financial will operate in substantially the same regulatory environment as the Peer Group members — all of whom are adequately capitalized institutions and are operating with no apparent restrictions. Exhibit IV-6 reflects the Bank’s pro forma regulatory capital ratios. On balance, no adjustment has been applied for the effect of government regulation and regulatory reform.
| RP® Financial, LC. | VALUATION ANALYSIS | |
| IV.18 |
Summary of Adjustments
Overall, based on the factors discussed above, we concluded that the Company’s pro forma market value should reflect the following valuation adjustments relative to the Peer Group:
| Key Valuation Parameters: | Valuation Adjustment | |
| Financial Condition | No Adjustment | |
| Profitability, Growth and Viability of Earnings | Moderate Downward | |
| Asset Growth | No Adjustment | |
| Primary Market Area | Slight Upward | |
| Dividends | Slight Downward | |
| Liquidity of the Shares | No Adjustment | |
| Marketing of the Issue | No Adjustment | |
| Management | No Adjustment | |
| Effect of Govt. Regulations and Regulatory Reform | No Adjustment | |
Valuation Approaches
In applying the accepted valuation methodology promulgated by the FRB, i.e., the pro forma market value approach, we considered the three key pricing ratios in valuing the Company’s to-be-issued stock — price/earnings (“P/E”), price/book (“P/B”), and price/assets (“P/A”) approaches — all performed on a pro forma basis including the effects of the stock proceeds. In computing the pro forma impact of the conversion and the related pricing ratios, we have incorporated the valuation parameters disclosed in the Company’s prospectus for reinvestment rate, effective tax rate, stock benefit plan assumptions and expenses (summarized in Exhibits IV-7 and IV-8). In our estimate of value, we assessed the relationship of the pro forma pricing ratios relative to the Peer Group and recent conversion offerings.
RP Financial’s valuation placed an emphasis on the following:
| • | P/E Approach. The P/E approach is generally the best indicator of long-term value for a stock and we have given it significant weight among the valuation approaches. Given certain similarities between the Company’s and the Peer Group’s earnings composition and overall financial condition, the P/E approach was carefully considered in this valuation. At the same time, recognizing that (1) the earnings multiples will be evaluated on a pro forma basis for the Company; and (2) the Peer Group on average has had the opportunity to realize the benefit of reinvesting and leveraging their offering proceeds, we also gave weight to the other valuation approaches. |
| • | P/B Approach. P/B ratios have generally served as a useful benchmark in the valuation of thrift stocks, particularly in the context of an initial public offering, as the earnings approach involves assumptions regarding the use of proceeds. RP Financial considered the P/B approach to be a valuable indicator of pro forma value, taking into account the pricing ratios under the P/E and P/A approaches. We have also modified the P/B approach to exclude the impact of intangible assets (i.e., price/tangible book value or “P/TB”), in that the investment community frequently makes this adjustment in its evaluation of this pricing approach. |
| RP® Financial, LC. | VALUATION ANALYSIS | |
| IV.19 |
| • | P/A Approach. P/A ratios are generally a less reliable indicator of market value, as investors typically assign less weight to assets and attribute greater weight to book value and earnings. Furthermore, this approach as set forth in the regulatory valuation guidelines does not take into account the amount of stock purchases funded by deposit withdrawals, thus understating the pro forma P/A ratio. At the same time, the P/A ratio is an indicator of franchise value, and, in the case of highly capitalized institutions, high P/A ratios may limit the investment community’s willingness to pay market multiples for earnings or book value when ROE is expected to be low. |
| • | Trading of MSBF stock. Converting institutions generally do not have stock outstanding. MSB Financial, however, has public shares outstanding due to the mutual holding company form of ownership and first-step minority stock offering. Since MSB Financial’s stock is currently quoted on NASDAQ, it is an indicator of investor interest in the Company’s conversion stock and therefore received some weight in our valuation. Based on the February 6, 2015 closing stock price of $10.50 per share and the 5,010,437 shares of MSB Financial stock outstanding, the Company’s implied market value of $52.6 million was considered in the valuation process. However, since the Company’s stock is not actively traded, the conversion stock will have different characteristics than the minority shares, and the pro forma information has not been publicly disseminated to date, the current trading price of MSB Financial’s stock was somewhat discounted herein but will become more important towards the closing of the offering. |
The Company has adopted “Employers’ Accounting for Employee Stock Ownership Plans” (“ASC 718-40”), which causes earnings per share computations to be based on shares issued and outstanding excluding unreleased ESOP shares. For purposes of preparing the pro forma pricing analyses, we have reflected all shares issued in the offering, including all ESOP shares, to capture the full dilutive impact, particularly since the ESOP shares are economically dilutive, receive dividends and can be voted. However, we did consider the impact of ASC 718-40 in the valuation.
In preparing the pro forma pricing analysis we have taken into account the pro forma impact of the MHC’s net assets (i.e., unconsolidated equity) that will be consolidated with the Company and, thus, will slightly increase equity. At December 31, 2014, the MHC had pro forma net assets of $166,000, which has been added to the Company’s December 31, 2014 pro forma equity to reflect the consolidation of the MHC into the Company’s operations. Exhibit IV-9 shows that after accounting for the impact of the MHC’s net assets and $1.6 million of aggregate dividends that were waived by the MHC, the public shareholders’ ownership interest was reduced by approximately 1.61%. Accordingly, for purposes of the Company’s pro forma valuation, the public shareholders’ ownership interest was reduced from 38.30% to 36.69% and the MHC’s ownership interest was increased from 61.70% to 63.31%.
| RP® Financial, LC. | VALUATION ANALYSIS | |
| IV.20 |
Based on the application of the three valuation approaches, taking into consideration the valuation adjustments discussed above, RP Financial concluded that as of February 6, 2015, the aggregate pro forma market value of MSB Financial’s conversion stock equaled $45,019,550 at the midpoint, equal to 4,501,955 shares at $10.00 per share. The $10.00 per share price was determined by the MSB Financial Board. The midpoint and resulting valuation range is based on the sale of a 63.31% ownership interest to the public, which provides for a $28,500,000 public offering at the midpoint value.
1.Price-to-Earnings (“P/E”). The application of the P/E valuation method requires calculating the Company’s pro forma market value by applying a valuation P/E multiple to the pro forma earnings base. In applying this technique, we considered both reported earnings and a recurring earnings base, that is, earnings adjusted to exclude any one-time non-operating items, plus the estimated after-tax earnings benefit of the reinvestment of the net proceeds. The Company’s reported earnings equaled $707,000 for the twelve months ended December 31, 2014 and were viewed to be representative of the Company’s core earnings as well.
Based on the Company’s reported and estimated core earnings, and incorporating the impact of the pro forma assumptions discussed previously, the Company’s pro forma reported and core P/E multiples at the $45.0 million midpoint value both equaled 69.94x, indicating premiums of 256.11% and 248.13% relative to the Peer Group’s average reported and core earnings multiples of 19.64x and 20.09x, respectively (see Table 4.4). In comparison to the Peer Group’s median reported and core earnings multiple of 21.12x, the Company’s pro forma reported and core P/E multiples at the midpoint value indicated a premium of 231.16%. The Company’s pro forma P/E ratios at the minimum and the super maximum equaled 58.70x and 95.10x, respectively.
2.Price-to-Book (“P/B”). The application of the P/B valuation method requires calculating the Company’s pro forma market value by applying a valuation P/B ratio, as derived from the Peer Group’s P/B ratio, to the Company’s pro forma book value. Based on the $45.0 million midpoint valuation, the Company’s pro forma P/B and P/TB ratios both equaled 68.07%. In comparison to the average P/B and P/TB ratios for the Peer Group of 92.18% and 97.44%, the Company’s ratios reflected discounts of 26.16% on a P/B basis and 30.14% on a P/TB basis. In comparison to the Peer Group’s median P/B and P/TB ratios both equal to 95.52%, the Company’s pro forma P/B and P/TB ratios at the midpoint value reflected a discount of 28.74%. At the super maximum of the range, the Company’s P/B and P/TB ratios both equaled
| RP® Financial, LC. | VALUATION ANALYSIS | |
| IV.21 |
Table 4.4
Public Market Pricing Versus Peer Group
MSB Financial Corp. and the Comparables
As of February 6, 2015
| Market Capitalization | Per Share Data | |||||||||||||||||||||||||||||||||||||||||||||||||||
Core | Book | Dividends(3) | ||||||||||||||||||||||||||||||||||||||||||||||||||
| Price/ Share | Market Value | 12 Month | Value/ | Pricing Ratios(2) | Amount/ | Payout | ||||||||||||||||||||||||||||||||||||||||||||||
| EPS(1) | Share | P/E | P/B | P/A | P/TB | P/Core | Share | Yield | Ratio(4) | |||||||||||||||||||||||||||||||||||||||||||
| ($) | ($Mil) | ($) | ($) | (x) | (%) | (%) | (%) | (x) | ($) | (%) | (%) | |||||||||||||||||||||||||||||||||||||||||
MSB Financial Corp. | NJ | |||||||||||||||||||||||||||||||||||||||||||||||||||
Super Maximum | $ | 10.00 | $ | 59.54 | $ | 0.11 | $ | 12.51 | 95.10x | 79.94 | % | 15.93 | % | 79.94 | % | 95.10x | $ | 0.00 | 0.00 | % | 0.00 | % | ||||||||||||||||||||||||||||||
Maximum | $ | 10.00 | $ | 51.77 | $ | 0.12 | 13.53 | 81.47x | 73.91 | % | 14.02 | % | 73.91 | % | 81.47x | $ | 0.00 | 0.00 | % | 0.00 | % | |||||||||||||||||||||||||||||||
Midpoint | $ | 10.00 | $ | 45.02 | $ | 0.14 | 14.69 | 69.94x | 68.07 | % | 12.32 | % | 68.07 | % | 69.94x | $ | 0.00 | 0.00 | % | 0.00 | % | |||||||||||||||||||||||||||||||
Minimum | $ | 10.00 | $ | 38.27 | $ | 0.17 | 16.27 | 58.70x | 61.46 | % | 10.59 | % | 61.46 | % | 58.70x | $ | 0.00 | 0.00 | % | 0.00 | % | |||||||||||||||||||||||||||||||
All Non-MHC Public Companies(6) | ||||||||||||||||||||||||||||||||||||||||||||||||||||
Averages | $ | 16.79 | $ | 448.26 | $ | 0.96 | $ | 15.78 | 17.31x | 105.72 | % | 13.63 | % | 113.89 | % | 16.50x | $ | 0.30 | 1.81 | % | 49.60 | % | ||||||||||||||||||||||||||||||
Median | $ | 13.88 | $ | 114.72 | $ | 0.81 | $ | 14.54 | 15.41x | 98.46 | % | 12.76 | % | 102.24 | % | 15.10x | $ | 0.24 | 1.48 | % | 40.91 | % | ||||||||||||||||||||||||||||||
All Non-MHC State of NJ(6) | ||||||||||||||||||||||||||||||||||||||||||||||||||||
Averages | $ | 14.08 | $ | 943.28 | $ | 0.76 | $ | 13.31 | 17.27x | 107.07 | % | 17.57 | % | 118.05 | % | 19.60x | $ | 0.38 | 2.65 | % | 58.19 | % | ||||||||||||||||||||||||||||||
Medians | $ | 14.30 | $ | 506.52 | $ | 0.74 | $ | 12.59 | 14.75x | 110.33 | % | 16.95 | % | 121.77 | % | 15.10x | $ | 0.26 | 2.32 | % | 51.26 | % | ||||||||||||||||||||||||||||||
State of NJ (7) | ||||||||||||||||||||||||||||||||||||||||||||||||||||
| CBNJ | Cape Bancorp, Inc. | NJ | $ | 8.73 | $ | 100.18 | $ | 0.53 | $ | 12.28 | 14.31x | 71.11 | % | 9.28 | % | 84.81 | % | 16.61x | $ | 0.24 | 2.75 | % | 39.34 | % | ||||||||||||||||||||||||||||
| CSBK | Clifton Bancorp Inc. | NJ | $ | 13.57 | $ | 368.46 | $ | 0.26 | $ | 13.40 | NM | 101.26 | % | 30.74 | % | 101.26 | % | NM | $ | 0.24 | 1.77 | % | 92.31 | % | ||||||||||||||||||||||||||||
| ISBC | Investors Bancorp, Inc. | NJ | $ | 11.57 | $ | 4,142.21 | $ | 0.41 | $ | 9.99 | 30.45x | 115.77 | % | 22.06 | % | 119.81 | % | 27.89x | $ | 0.20 | 1.73 | % | 52.53 | % | ||||||||||||||||||||||||||||
| NFBK | Northfield Bancorp, Inc. | NJ | $ | 14.76 | $ | 714.41 | $ | 0.42 | $ | 12.27 | NM | 120.29 | % | 23.65 | % | 123.73 | % | 34.91x | $ | 0.28 | 1.90 | % | 65.85 | % | ||||||||||||||||||||||||||||
| OSHC | Ocean Shore Holding Co. | NJ | $ | 14.10 | $ | 90.15 | $ | 1.02 | $ | 16.55 | 14.39x | 85.20 | % | 8.80 | % | 91.27 | % | 13.84x | $ | 0.24 | 1.70 | % | 24.49 | % | ||||||||||||||||||||||||||||
| OCFC | OceanFirst Financial Corp. | NJ | $ | 16.93 | $ | 286.14 | $ | 1.16 | $ | 12.91 | 14.23x | 131.10 | % | 12.14 | % | 131.10 | % | 14.63x | $ | 0.52 | 3.07 | % | 42.02 | % | ||||||||||||||||||||||||||||
| ORIT | Oritani Financial Corp. | NJ | $ | 14.50 | $ | 644.59 | $ | 0.96 | $ | 11.42 | 15.10x | 126.96 | % | 19.83 | % | 126.96 | % | 15.10x | $ | 0.70 | 4.83 | % | 98.96 | % | ||||||||||||||||||||||||||||
| PFS | Provident Financial Services, Inc. | NJ | $ | 18.49 | $ | 1,200.11 | $ | 1.30 | $ | 17.63 | 15.16x | 104.90 | % | 14.08 | % | 165.44 | % | 14.24x | $ | 0.64 | 3.46 | % | 50.00 | % | ||||||||||||||||||||||||||||
Comparable Group | ||||||||||||||||||||||||||||||||||||||||||||||||||||
Averages | $ | 13.33 | $ | 80.71 | $ | 0.53 | $ | 14.30 | 19.64x | 92.18 | % | 12.11 | % | 97.44 | % | 20.09x | $ | 0.22 | 1.53 | % | 40.84 | % | ||||||||||||||||||||||||||||||
Medians | $ | 13.20 | $ | 78.96 | $ | 0.53 | $ | 14.90 | 21.12x | 95.52 | % | 11.61 | % | 95.52 | % | 21.12x | $ | 0.17 | 1.41 | % | 39.34 | % | ||||||||||||||||||||||||||||||
Comparable Group | ||||||||||||||||||||||||||||||||||||||||||||||||||||
| ALLB | Alliance Bancorp, Inc. of Pennsylvania | PA | $ | 17.00 | $ | 68.46 | $ | 0.48 | $ | 16.30 | NM | 104.28 | % | 16.17 | % | 104.28 | % | NM | $ | 0.24 | 1.41 | % | 47.92 | % | ||||||||||||||||||||||||||||
| CBNJ | Cape Bancorp, Inc. | NJ | $ | 8.73 | $ | 100.18 | $ | 0.53 | $ | 12.28 | 14.31x | 71.11 | % | 9.28 | % | 84.81 | % | 16.61x | $ | 0.24 | 2.75 | % | 39.34 | % | ||||||||||||||||||||||||||||
| FXCB | Fox Chase Bancorp, Inc. | PA | $ | 16.44 | $ | 194.04 | $ | 0.71 | $ | 14.90 | 23.15x | 110.30 | % | 17.73 | % | 110.30 | % | 23.15x | $ | 0.56 | 3.41 | % | 84.51 | % | ||||||||||||||||||||||||||||
| GTWN | Georgetown Bancorp, Inc. | MA | $ | 17.95 | $ | 32.80 | $ | 0.85 | $ | 16.81 | 21.12x | 106.79 | % | 12.10 | % | 106.79 | % | 21.12x | $ | 0.17 | 0.95 | % | 20.00 | % | ||||||||||||||||||||||||||||
| MLVF | Malvern Bancorp, Inc. | PA | $ | 12.04 | $ | 78.96 | $ | 0.08 | $ | 11.88 | NM | 101.39 | % | 13.09 | % | 101.39 | % | NM | $ | 0.11 | 0.00 | % | NM | |||||||||||||||||||||||||||||
| OSHC | Ocean Shore Holding Co. | NJ | $ | 14.10 | $ | 90.15 | $ | 1.02 | $ | 16.55 | 14.39x | 85.20 | % | 8.80 | % | 91.27 | % | 13.84x | $ | 0.24 | 1.70 | % | 24.49 | % | ||||||||||||||||||||||||||||
| ONFC | Oneida Financial Corp. | NY | $ | 13.20 | $ | 92.70 | $ | 0.69 | $ | 13.65 | 18.08x | 97.72 | % | 11.61 | % | 135.33 | % | 19.19x | $ | 0.48 | 3.64 | % | 65.75 | % | ||||||||||||||||||||||||||||
| PBIP | Prudential Bancorp, Inc. | PA | $ | 12.23 | $ | 114.72 | $ | 0.17 | $ | 13.66 | NM | 89.53 | % | 21.76 | % | 89.53 | % | NM | $ | 0.12 | 0.98 | % | 45.00 | % | ||||||||||||||||||||||||||||
| SVBI | Severn Bancorp, Inc. | MD | $ | 4.55 | $ | 45.79 | $ | 0.06 | $ | 5.68 | NM | 80.10 | % | 6.11 | % | 80.57 | % | NM | $ | 0.00 | 0.00 | % | NM | |||||||||||||||||||||||||||||
| WEBK | Wellesley Bancorp, Inc. | MA | $ | 19.17 | $ | 47.13 | $ | 0.77 | $ | 20.07 | 24.90x | 95.52 | % | 8.81 | % | 95.52 | % | 24.95x | $ | 0.10 | 0.52 | % | 9.74 | % | ||||||||||||||||||||||||||||
| WVFC | WVS Financial Corp. | PA | $ | 11.18 | $ | 22.93 | $ | 0.51 | $ | 15.52 | 21.50x | 72.04 | % | 7.78 | % | 72.04 | % | 21.78x | $ | 0.16 | 1.43 | % | 30.77 | % | ||||||||||||||||||||||||||||
| Financial Characteristics(5) | ||||||||||||||||||||||||||||||||||||||||||||
| Total | Equity/ | Tang. Eq./ | NPAs/ | Reported | Core | Exchange | Offering | |||||||||||||||||||||||||||||||||||||
| Assets | Assets | T. Assets | Assets | ROAA | ROAE | ROAA | ROAE | Ratio | Range | |||||||||||||||||||||||||||||||||||
| ($Mil) | (%) | (%) | (%) | (%) | (%) | (%) | (%) | (x) | ($Mil) | |||||||||||||||||||||||||||||||||||
MSB Financial Corp. | NJ | |||||||||||||||||||||||||||||||||||||||||||
Super Maximum | $ | 374 | 19.93 | % | 19.93 | % | 5.05 | % | 0.17 | % | 0.84 | % | 0.17 | % | 0.84 | % | 1.1384x | $ | 37.69 | |||||||||||||||||||||||||
Maximum | $ | 369 | 18.96 | % | 18.96 | % | 5.12 | % | 0.17 | % | 0.91 | % | 0.17 | % | 0.91 | % | 0.9899x | $ | 32.78 | |||||||||||||||||||||||||
Midpoint | $ | 365 | 18.10 | % | 18.10 | % | 5.17 | % | 0.18 | % | 0.97 | % | 0.18 | % | 0.97 | % | 0.8608x | $ | 28.50 | |||||||||||||||||||||||||
Minimum | $ | 361 | 17.22 | % | 17.22 | % | 5.23 | % | 0.18 | % | 1.05 | % | 0.18 | % | 1.05 | % | 0.7317x | $ | 24.23 | |||||||||||||||||||||||||
All Non-MHC Public Companies(6) | ||||||||||||||||||||||||||||||||||||||||||||
Averages | $ | 3,165 | 13.47 | % | 12.90 | % | 2.02 | % | 0.67 | % | 5.60 | % | 0.72 | % | 5.82 | % | ||||||||||||||||||||||||||||
Median | $ | 980 | 12.70 | % | 11.63 | % | 1.38 | % | 0.65 | % | 5.29 | % | 0.72 | % | 5.27 | % | ||||||||||||||||||||||||||||
All Non-MHC State of NJ(6) | ||||||||||||||||||||||||||||||||||||||||||||
Averages | $ | 4,904 | 16.34 | % | 15.94 | % | 1.13 | % | 0.80 | % | 5.54 | % | 0.80 | % | 5.54 | % | ||||||||||||||||||||||||||||
Medians | $ | 2,689 | 14.52 | % | 14.52 | % | 1.12 | % | 0.75 | % | 5.35 | % | 0.79 | % | 5.52 | % | ||||||||||||||||||||||||||||
State of NJ (7) | ||||||||||||||||||||||||||||||||||||||||||||
| CBNJ | Cape Bancorp, Inc. | NJ | $ | 1,080 | 13.05 | % | 11.17 | % | 1.65 | % | 0.62 | % | 4.80 | % | 0.54 | % | 4.14 | % | ||||||||||||||||||||||||||
| CSBK | Clifton Bancorp Inc. | NJ | $ | 1,198 | 30.36 | % | 30.36 | % | 0.41 | % | 0.54 | % | 2.09 | % | 0.54 | % | 2.07 | % | ||||||||||||||||||||||||||
| ISBC | Investors Bancorp, Inc. | NJ | $ | 18,774 | 19.06 | % | 18.65 | % | 0.81 | % | 0.76 | % | 4.71 | % | 0.83 | % | 5.14 | % | ||||||||||||||||||||||||||
| NFBK | Northfield Bancorp, Inc. | NJ | $ | 3,021 | 19.66 | % | 19.22 | % | 1.29 | % | 0.73 | % | 3.07 | % | 0.75 | % | 3.17 | % | ||||||||||||||||||||||||||
| OSHC | Ocean Shore Holding Co. | NJ | $ | 1,025 | 10.33 | % | 9.82 | % | 0.95 | % | 0.61 | % | 5.90 | % | 0.61 | % | 5.90 | % | ||||||||||||||||||||||||||
| OCFC | OceanFirst Financial Corp. | NJ | $ | 2,357 | 9.26 | % | 9.26 | % | 1.89 | % | 0.86 | % | 9.18 | % | 0.84 | % | 8.93 | % | ||||||||||||||||||||||||||
| ORIT | Oritani Financial Corp. | NJ | $ | 3,251 | 15.62 | % | 15.62 | % | 0.67 | % | 1.31 | % | 7.81 | % | 1.31 | % | 7.81 | % | ||||||||||||||||||||||||||
| PFS | Provident Financial Services, Inc. | NJ | $ | 8,523 | 13.42 | % | 13.42 | % | 1.38 | % | 0.92 | % | 6.75 | % | 0.97 | % | 7.18 | % | ||||||||||||||||||||||||||
Comparable Group | ||||||||||||||||||||||||||||||||||||||||||||
Averages | $ | 675 | 13.30 | % | 12.81 | % | 1.37 | % | 0.47 | % | 3.76 | % | 0.46 | % | 3.65 | % | ||||||||||||||||||||||||||||
Medians | $ | 603 | 12.01 | % | 11.17 | % | 0.94 | % | 0.46 | % | 3.69 | % | 0.46 | % | 3.67 | % | ||||||||||||||||||||||||||||
Comparable Group | ||||||||||||||||||||||||||||||||||||||||||||
| ALLB | Alliance Bancorp, Inc. of Pennsylvania | PA | $ | 423 | 15.50 | % | 15.50 | % | 1.93 | % | 0.46 | % | 2.84 | % | 0.46 | % | 2.84 | % | ||||||||||||||||||||||||||
| CBNJ | Cape Bancorp, Inc. | NJ | $ | 1,080 | 13.05 | % | 11.17 | % | 1.65 | % | 0.62 | % | 4.80 | % | 0.54 | % | 4.14 | % | ||||||||||||||||||||||||||
| FXCB | Fox Chase Bancorp, Inc. | PA | $ | 1,095 | 16.07 | % | 16.07 | % | 0.90 | % | 0.76 | % | 4.63 | % | 0.76 | % | 4.63 | % | ||||||||||||||||||||||||||
| GTWN | Georgetown Bancorp, Inc. | MA | $ | 271 | 11.33 | % | 11.33 | % | 0.59 | % | 0.55 | % | 5.04 | % | 0.55 | % | 5.04 | % | ||||||||||||||||||||||||||
| MLVF | Malvern Bancorp, Inc. | PA | $ | 603 | 12.91 | % | 12.91 | % | 0.80 | % | 0.10 | % | 0.76 | % | 0.09 | % | 0.71 | % | ||||||||||||||||||||||||||
| OSHC | Ocean Shore Holding Co. | NJ | $ | 1,025 | 10.33 | % | 9.82 | % | 0.95 | % | 0.61 | % | 5.90 | % | 0.61 | % | 5.90 | % | ||||||||||||||||||||||||||
| ONFC | Oneida Financial Corp. | NY | $ | 798 | 12.01 | % | 9.01 | % | 0.17 | % | 0.66 | % | 5.44 | % | 0.62 | % | 5.14 | % | ||||||||||||||||||||||||||
| PBIP | Prudential Bancorp, Inc. | PA | $ | 527 | 24.31 | % | 24.31 | % | 1.46 | % | 0.37 | % | 1.51 | % | 0.32 | % | 1.30 | % | ||||||||||||||||||||||||||
| SVBI | Severn Bancorp, Inc. | MD | $ | 777 | 10.79 | % | 10.75 | % | 5.47 | % | 0.37 | % | 3.54 | % | 0.37 | % | 3.54 | % | ||||||||||||||||||||||||||
| WEBK | Wellesley Bancorp, Inc. | MA | $ | 535 | 9.22 | % | 9.22 | % | 0.94 | % | 0.36 | % | 3.69 | % | 0.36 | % | 3.67 | % | ||||||||||||||||||||||||||
| WVFC | WVS Financial Corp. | PA | $ | 295 | 10.80 | % | 10.80 | % | 0.16 | % | 0.33 | % | 3.25 | % | 0.34 | % | 3.29 | % | ||||||||||||||||||||||||||
| (1) | Core income, on a diluted per-share basis. Core income is net income after taxes and before extraordinary items, less net income attributable to noncontrolling interest, gain on the sale of securities, amortization of intangibles, goodwill and nonrecurring items. |
| Assumed tax rate is 35.0% |
| (2) | P/E = Price to earnings; P/B = Price to book; P/A = Price to assets; P/TB = Price to tangible book value; and P/Core = Price to core earnings. P/E and P/Core =NM if the ratio is negative or above 35x. |
| (3) | Indicated 12 month dividend, based on last quarterly dividend declared. |
| (4) | Indicated 12 month dividend as a percent of trailing 12 month earnings. |
| (5) | ROAA (return on average assets) and ROAE (return on average equity) are indicated ratios based on trailing 12 month earnings and average equity and assets balances. |
| (6) | Excludes from averages and medians those companies the subject of actual or rumored acquisition activities or unusual operating characteristics. |
| Source: | SNL Financial, LC. and RP Financial, LC. calculations. The information provided in this report has been obtained from sources we believe are reliable, but we cannot guarantee the accuracy or completeness of such information. |
| RP® Financial, LC. | VALUATION ANALYSIS | |
| IV.22 |
79.94%. In comparison to the Peer Group’s average P/B and P/TB ratios, the Company’s P/B and P/TB ratios at the super maximum of the range reflected discounts of 13.28% and 17.96%, respectively. In comparison to the Peer Group’s median P/B and P/TB ratio, the Company’s P/B and P/TB ratio at the super maximum of the range reflected a discount of 16.31%. RP Financial considered the discounts under the P/B approach to be reasonable, given the nature of the calculation of the P/B ratio which tends to mathematically result in a ratio discounted to book value.
3.Price-to-Assets (“P/A”). The P/A valuation methodology determines market value by applying a valuation P/A ratio to the Company’s pro forma asset base, conservatively assuming no deposit withdrawals are made to fund stock purchases. In all likelihood there will be deposit withdrawals, which results in understating the pro forma P/A ratio which is computed herein. At the $45.0 million midpoint of the valuation range, the Company’s value equaled 12.32% of pro forma assets. Comparatively, the Peer Group companies exhibited an average P/A ratio of 12.11%, which implies a premium of 1.73% has been applied to the Company’s pro forma P/A ratio. In comparison to the Peer Group’s median P/A ratio of 11.61%, the Company’s pro forma P/A ratio at the midpoint value reflects a premium of 6.12%.
Comparison to Recent Offerings
As indicated at the beginning of this chapter, RP Financial’s analysis of recent conversion offering pricing characteristics at closing and in the aftermarket has been limited to a “technical” analysis and, thus, the pricing characteristics of recent conversion offerings cannot be a primary determinate of value. Particular focus was placed on the P/TB approach in this analysis, since the P/E multiples do not reflect the actual impact of reinvestment and the source of the stock proceeds (i.e., external funds vs. deposit withdrawals). As discussed previously, the two recently completed second-step offerings had an average forma price/tangible book ratio at closing of 75.50% (see Table 4.2). In comparison, the Company’s pro forma price/tangible book ratio at the midpoint value reflects an implied discount of 9.84%.
The most recent second-step offering that is comparable to MSB Financial’s second-step offering was completed by Pathfinder Bancorp of New York, which closed in October 2014. Pathfinder Bancorp’s offering closed at the top of its super range, with a second-step offering of $26.4 million and an aggregate pro forma market value of $43.5 million. Pathfinder Bancorp’s pro forma price/tangible book ratio at closing equaled 86.73%. In comparison, the Company’s
| RP® Financial, LC. | VALUATION ANALYSIS | |
| IV.23 |
pro forma price/tangible book ratio at the midpoint value reflects an implied discount of 21.52%. Pathfinder Bancorp’s closing stock price on February 6, 2015 was 1.1% below its IPO price. Comparative pre-conversion financial data for Pathfinder Bancorp has been included in the Chapter III tables and show that, in comparison to MSB Financial, Pathfinder Bancorp maintained a lower tangible equity-to-assets ratio (7.46% versus 12.06% for MSB Financial Financial), a higher return on average assets (0.46% versus 0.21% for MSB Financial and a lower ratio of non-performing assets (inclusive of accruing troubles debt restructurings) as a percent of assets (1.83% versus 5.55% for MSB Financial).
Valuation Conclusion
Based on the foregoing, it is our opinion that, as of February 6, 2015, the estimated aggregate pro forma valuation of the shares of the Company to be issued and outstanding at the end of the conversion offering – including (1) newly-issued shares representing the MHC’s current ownership interest in the Company and (2) exchange shares issued to existing public shareholders of the Company - was $45,019,550 at the midpoint, equal to 4,501,955 shares at a per share value of $10.00. The resulting range of value and pro forma shares, all based on $10.00 per share, are shown below.
The pro forma valuation calculations relative to the Peer Group are shown in Table 4.4 and are detailed in Exhibit IV-7 and Exhibit IV-8.
| Total Shares | Offering Shares | Exchange Shares Issued to Public Shareholders | Exchange Ratio | |||||||||||||
Shares | ||||||||||||||||
Maximum, as Adjusted | 5,953,835 | 3,769,125 | 2,184,710 | 1.1384 | ||||||||||||
Maximum | 5,177,248 | 3,277,500 | 1,899,748 | 0.9899 | ||||||||||||
Midpoint | 4,501,955 | 2,850,000 | 1,651,955 | 0.8608 | ||||||||||||
Minimum | 3,826,662 | 2,422,500 | 1,404,162 | 0.7317 | ||||||||||||
Distribution of Shares | ||||||||||||||||
Maximum, as Adjusted | 100.00 | % | 63.31 | % | 36.69 | % | ||||||||||
Maximum | 100.00 | % | 63.31 | % | 36.69 | % | ||||||||||
Midpoint | 100.00 | % | 63.31 | % | 36.69 | % | ||||||||||
Minimum | 100.00 | % | 63.31 | % | 36.69 | % | ||||||||||
Aggregate Market Value at $10 per share | ||||||||||||||||
Maximum, as Adjusted | $ | 59,538,350 | $ | 37,691,250 | $ | 21,847,100 | ||||||||||
Maximum | $ | 51,772,480 | $ | 32,775,000 | $ | 18,997,480 | ||||||||||
Midpoint | $ | 45,019,550 | $ | 28,500,000 | $ | 16,519,550 | ||||||||||
Minimum | $ | 38,266,620 | $ | 24,225,000 | $ | 14,041,620 | ||||||||||
| RP® Financial, LC. | VALUATION ANALYSIS | |
| IV.24 |
Establishment of the Exchange Ratio
Conversion regulations provide that in a conversion of a mutual holding company, the minority shareholders are entitled to exchange the public shares for newly issued shares in the fully converted company. The Boards of Directors of the MHC and MSBF have independently determined the exchange ratio, which has been designed to preserve the current aggregate percentage ownership in the Company (adjusted for the dilution resulting from the consolidation of the MHC’s unconsolidated equity into the Company). The exchange ratio to be received by the existing minority shareholders of the Company will be determined at the end of the offering, based on the total number of shares sold in the second-step conversion offering and the final appraisal. Based on the valuation conclusion herein, the resulting offering value and the $10.00 per share offering price, the indicated exchange ratio at the midpoint is 0.8608 shares of the Company for every one public share held by public shareholders. Furthermore, based on the offering range of value, the indicated exchange ratio is 0.7317 at the minimum, 0.9899 at the maximum and 1.1384 at the super maximum. RP Financial expresses no opinion on the proposed exchange of newly issued Company shares for the shares held by the public shareholders or on the proposed exchange ratio.
EXHIBITS
LIST OF EXHIBITS
Exhibit | Description | |
| I-1 | Map of Office Locations | |
| I-2 | Audited Financial Statements | |
| I-3 | Key Operating Ratios | |
| I-4 | Investment Portfolio Composition | |
| I-5 | Yields and Costs | |
| I-6 | Loan Loss Allowance Activity | |
| I-7 | Interest Rate Risk Analysis | |
| I-8 | Fixed and Adjustable Rate Loans | |
| I-9 | Loan Portfolio Composition | |
| I-10 | Contractual Maturity by Loan Type | |
| I-11 | Non-Performing Assets | |
| I-12 | Deposit Composition | |
| I-13 | Maturity of Time Deposits | |
| I-14 | Borrowing Activity | |
| II-1 | Description of Office Properties | |
| II-2 | Historical Interest Rates | |
LIST OF EXHIBITS (continued)
Exhibit | Description | |
| III-1 | Characteristics of Publicly-Traded Thrifts | |
| III-2 | Public Market Pricing of Mid-Atlantic Thrifts | |
| III-3 | Public Market Pricing of Northeast Thrifts | |
| III-4 | Peer Group Market Area Comparative Analysis | |
| IV-1 | Stock Prices: As of February 6, 2015 | |
| IV-2 | Historical Stock Price Indices | |
| IV-3 | Historical Thrift Stock Indices | |
| IV-4 | New Jersey Thrift Acquisitions 2011 - Present | |
| IV-5 | Director and Senior Management Summary Resumes | |
| IV-6 | Pro Forma Regulatory Capital Ratios | |
| IV-7 | Pro Forma Analysis Sheet | |
| IV-8 | Pro Forma Effect of Conversion Proceeds | |
| IV-9 | Calculation of Minority Ownership Dilution in a Second-Step Offering | |
| V-1 | Firm Qualifications Statement | |
EXHIBIT I-1
MSB Financial Corp.
Map of Office Locations
Exhibit I-1
MSB Financial Corp.
Map of Office Locations
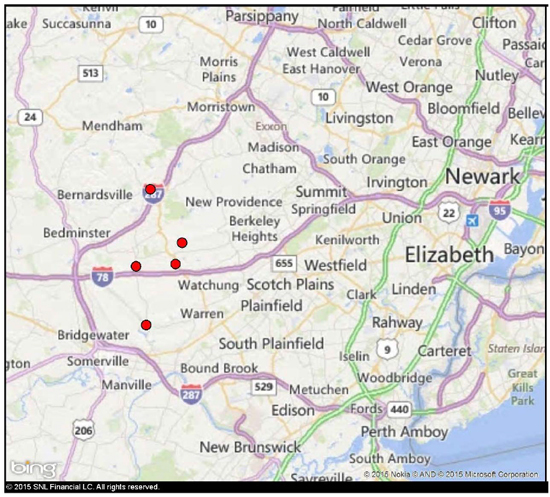
EXHIBIT I-2
MSB Financial Corp.
Audited Financial Statements
[Incorporated by Reference]
EXHIBIT I-3
MSB Financial Corp.
Key Operating Ratios
Exhibit I-3
MSB Financial Corp.
Key Operating Ratios
| Six Months Ended | ||||||||||||||||||||||||||||
| December 31, | Year Ended June 30, | |||||||||||||||||||||||||||
| 2014 | 2013 | 2014 | 2013 | 2012 | 2011 | 2010 | ||||||||||||||||||||||
Performance Ratios: | ||||||||||||||||||||||||||||
Return (loss) on average assets | 0.13 | % | 0.29 | % | 0.29 | % | (0.40 | )% | 0.14 | % | 0.20 | % | 0.22 | % | ||||||||||||||
Return (loss) on average equity | 1.06 | 2.50 | 2.46 | (3.45 | ) | 1.21 | 1.74 | 1.99 | ||||||||||||||||||||
Interest rate spread (1) | 2.87 | 2.84 | 2.86 | 2.90 | 3.22 | 3.33 | 3.03 | |||||||||||||||||||||
Net interest margin (2) | 3.00 | 2.94 | 2.97 | 2.98 | 3.32 | 3.42 | 3.20 | |||||||||||||||||||||
Noninterest expense to average assets | 2.76 | 2.31 | 2.36 | 2.39 | 2.34 | 2.49 | 2.34 | |||||||||||||||||||||
Efficiency ratio (3) | 92.67 | 79.15 | 79.25 | 83.21 | 73.07 | 75.10 | 74.51 | |||||||||||||||||||||
Average interest-earning assets to average interest-bearing liabilities | 117.28 | 112.67 | 114.09 | 109.33 | 109.22 | 107.25 | 109.04 | |||||||||||||||||||||
Average equity to average assets | 11.98 | 11.46 | 11.62 | 11.58 | 11.79 | 11.50 | 11.24 | |||||||||||||||||||||
Equity to assets at period end | 12.06 | 11.54 | 11.79 | 11.18 | 11.74 | 11.61 | 11.11 | |||||||||||||||||||||
Capital Ratios at Period End: (4) | ||||||||||||||||||||||||||||
Tangible capital (to adjusted assets) | 10.64 | % | 10.16 | % | 10.39 | % | 9.93 | % | 9.97 | % | 9.68 | % | 9.07 | % | ||||||||||||||
Core capital (to adjusted assets) | 10.64 | 10.16 | 10.39 | 9.93 | 9.97 | 9.68 | 9.07 | |||||||||||||||||||||
Tier 1 risk-based | 17.68 | 16.93 | 17.45 | 16.87 | 15.64 | 15.16 | 13.95 | |||||||||||||||||||||
Total risk-based capital (to risk-weighted assets) | 18.93 | 18.19 | 18.71 | 18.13 | 16.89 | 16.15 | 15.06 | |||||||||||||||||||||
Asset Quality Ratios: | ||||||||||||||||||||||||||||
Allowance for loan losses as a percent of total loans | 1.53 | % | 1.51 | % | 1.56 | % | 1.87 | % | 1.24 | % | 0.84 | % | 0.95 | % | ||||||||||||||
Allowance for loan losses as a percent of nonperforming loans | 59.75 | 43.81 | 44.34 | 30.30 | 18.29 | 13.25 | 16.53 | |||||||||||||||||||||
Net charge-offs to average outstanding loans during the period | 0.13 | 0.86 | 0.51 | 1.19 | 0.53 | 0.80 | 0.30 | |||||||||||||||||||||
Non-performing loans as a percent of total loans | 2.59 | 3.45 | 3.51 | 6.16 | 6.81 | 6.32 | 5.74 | |||||||||||||||||||||
Non-performing assets to total assets | 2.16 | 2.69 | 2.53 | 4.15 | 4.82 | 4.93 | 4.66 | |||||||||||||||||||||
Other Data: | ||||||||||||||||||||||||||||
Number of: | ||||||||||||||||||||||||||||
Full time equivalent employees | 57 | 59 | 53 | 65 | 53 | 52 | 51 | |||||||||||||||||||||
Offices | 5 | 5 | 5 | 5 | 5 | 5 | 5 | |||||||||||||||||||||
| (1) | Represents the difference between the weighted average yield on average interest-earning assets and the weighted average cost of interest-bearing liabilities. |
| (2) | Represents net interest income as a percent of average interest-earning assets. |
| (3) | Represents noninterest expense divided by the sum of net interest income and noninterest income. |
| (4) | Capital ratios are for Millington Savings Bank |
Source: MSB Financial’s prospectus.
EXHIBIT I-4
MSB Financial Corp.
Investment Portfolio Composition
Exhibit I-4
MSB Financial Corp.
Investment Portfolio Composition
| At December 31, | At June 30, | |||||||||||||||
| 2014 | 2014 | 2013 | 2012 | |||||||||||||
| (In thousands) | ||||||||||||||||
U.S. Government Agency Obligations | $ | 44,180 | $ | 49,177 | $ | 46,194 | $ | 37,018 | ||||||||
Government National Mortgage Association | 13 | 14 | 17 | 20 | ||||||||||||
Federal Home Loan Mortgage Corporation | 2,735 | 2,926 | 3,397 | 325 | ||||||||||||
Federal National Mortgage Association | 22,678 | 23,149 | 21,354 | 9,775 | ||||||||||||
Corporate bonds | 4,611 | 4,630 | 4,669 | 2,143 | ||||||||||||
Certificates of deposits | 4,301 | 5,036 | 5,281 | 1,425 | ||||||||||||
|
|
|
|
|
|
|
| |||||||||
Total securities held to maturity | $ | 78,518 | $ | 84,932 | $ | 80,912 | $ | 50,706 | ||||||||
|
|
|
|
|
|
|
| |||||||||
Source: MSB Financial’s prospectus.
EXHIBIT I-5
MSB Financial Corp.
Yields and Costs
Exhibit I-5
MSB Financial Corp.
Yields and Costs
| At | Six Months Ended December 31, | |||||||||||||||||||||||||||||||
| December 31, 2014 | 2014 | 2013 | ||||||||||||||||||||||||||||||
| Actual Balance | Average Rate | Average Balance | Interest Earned/Paid | Average Yield/ Cost | Average Balance | Interest Earned/Paid | Average Yield/ Cost | |||||||||||||||||||||||||
| (Dollars in thousands) | ||||||||||||||||||||||||||||||||
Interest-earning assets: | ||||||||||||||||||||||||||||||||
Loans receivable(1) | $ | 231,449 | 4.36 | % | $ | 235,327 | $ | 5,049 | 4.29 | % | $ | 230,425 | $ | 4,987 | 4.33 | % | ||||||||||||||||
Securities | 78,518 | 2.04 | % | 81,301 | 875 | 2.15 | % | 85,711 | 938 | 2.19 | % | |||||||||||||||||||||
Other interest-earning assets(2) | 3,084 | 3.75 | % | 3,291 | 44 | 0.88 | % | 4,973 | 45 | 1.81 | % | |||||||||||||||||||||
|
|
|
|
|
|
|
|
|
| |||||||||||||||||||||||
Total interest-earning assets | 313,051 | 1.91 | % | 319,919 | 5,968 | 3.65 | % | 321,109 | 5,970 | 3.72 | % | |||||||||||||||||||||
|
|
|
| |||||||||||||||||||||||||||||
Non-interest-earning assets | 27,201 | 23,717 | 27,048 | |||||||||||||||||||||||||||||
|
|
|
|
|
| |||||||||||||||||||||||||||
Total assets | $ | 340,252 | $ | 343,636 | $ | 348,157 | ||||||||||||||||||||||||||
|
|
|
|
|
| |||||||||||||||||||||||||||
Interest-bearing liabilities: | ||||||||||||||||||||||||||||||||
NOW, super NOW & money market demand | $ | 46,099 | 0.14 | % | $ | 42,067 | 33 | 0.16 | % | $ | 38,374 | 25 | 0.13 | % | ||||||||||||||||||
Savings and club deposits | 101,210 | 0.22 | % | 101,011 | 109 | 0.22 | % | 110,166 | 120 | 0.22 | % | |||||||||||||||||||||
Certificates of deposit | 93,938 | 1.30 | % | 96,904 | 642 | 1.33 | % | 105,157 | 723 | 1.38 | % | |||||||||||||||||||||
|
|
|
|
|
|
|
|
|
| |||||||||||||||||||||||
Total interest-bearing deposits | 241,247 | 0.63 | % | 239,982 | 784 | 0.65 | % | 253,697 | 868 | 0.68 | % | |||||||||||||||||||||
Federal Home Loan Bank of New York advances | 30,000 | 2.59 | % | 32,799 | 389 | 2.37 | % | 31,297 | 381 | 2.43 | % | |||||||||||||||||||||
|
|
|
|
|
|
|
|
|
|
|
| |||||||||||||||||||||
Total interest-bearing liabilities | 271,247 | 0.84 | % | 272,781 | 1,173 | 0.86 | % | 284,994 | 1,249 | 0.88 | % | |||||||||||||||||||||
|
|
|
|
|
| |||||||||||||||||||||||||||
Non-interest-bearing deposits | 24,821 | 26,770 | 20,438 | |||||||||||||||||||||||||||||
Other non-interest-bearing liabilities | 3,159 | 2,920 | 2,821 | |||||||||||||||||||||||||||||
|
|
|
| |||||||||||||||||||||||||||||
Total liabilities | 299,227 | 302,471 | 308,253 | |||||||||||||||||||||||||||||
Stockholders’ equity | 41,025 | 41,165 | 39,904 | |||||||||||||||||||||||||||||
|
|
|
|
|
| |||||||||||||||||||||||||||
Total liabilities and stockholders’ equity | $ | 340,252 | $ | 343,636 | $ | 348,157 | ||||||||||||||||||||||||||
|
|
|
|
|
| |||||||||||||||||||||||||||
Net interest income/net interest rate spread(3) | $ | 4,795 | $ | 4,795 | 2.87 | % | $ | 4,721 | 2.84 | % | ||||||||||||||||||||||
|
|
|
|
|
|
|
|
|
| |||||||||||||||||||||||
Net interest margin(4) | 3.00 | % | 2.94 | % | ||||||||||||||||||||||||||||
|
|
|
| |||||||||||||||||||||||||||||
Ratio of interest-earning assets to interest-bearing liabilities | 115.41 | % | 117.28 | % | 112.67 | % | ||||||||||||||||||||||||||
|
|
|
|
|
| |||||||||||||||||||||||||||
| (1) | Non-accruing loans have been included, and the effect of such inclusion was not material. The allowance for loan losses is excluded, while construction loans in process and deferred fees are included. |
| (2) | Includes Federal Home Loan Bank of New York stock at cost and term deposits with other financial institutions. |
| (3) | Net interest rate spread represents the difference between the average yield on interest-earning assets and the average cost of interest-bearing liabilities. |
| (4) | Net interest margin represents net interest income as a percentage of average interest-earning assets. |
Exhibit I-5 (Continued)
MSB Financial Corp.
Yields and Costs
| Year Ended June 30, | ||||||||||||||||||||||||||||||||||||
| 2014 | 2013 | 2012 | ||||||||||||||||||||||||||||||||||
| Actual Balance | Interest Earned/ Paid | Average Yield/ Cost | Average Balance | Interest Earned/ Paid | Average Yield/ Cost | Average Balance | Interest Earned/ Paid | Average Yield/ Cost | ||||||||||||||||||||||||||||
| (Dollars in thousands) | ||||||||||||||||||||||||||||||||||||
Interest-earning assets: | ||||||||||||||||||||||||||||||||||||
Loans receivable(1) | $ | 232,148 | $ | 10,033 | 4.32 | % | $ | 237,776 | $ | 10,435 | 4.39 | % | $ | 248,124 | $ | 11,783 | 4.75 | % | ||||||||||||||||||
Securities | 85,561 | 1,870 | 2.19 | % | 68,978 | 1,504 | 2.18 | % | 60,710 | 1,929 | 3.18 | % | ||||||||||||||||||||||||
Other interest-earning assets(2) | 4,276 | 89 | 2.08 | % | 5,963 | 93 | 1.56 | % | 6,572 | 89 | 1.35 | % | ||||||||||||||||||||||||
|
|
|
|
|
|
|
|
|
|
|
| |||||||||||||||||||||||||
Total interest-earning assets | 321,985 | 11,992 | 3.72 | % | 312,717 | 12,032 | 3.85 | % | 315,406 | 13,801 | 4.38 | % | ||||||||||||||||||||||||
|
|
|
|
|
| |||||||||||||||||||||||||||||||
Non-interest-earning assets | 24,258 | 33,567 | 32,443 | |||||||||||||||||||||||||||||||||
|
|
|
|
|
| |||||||||||||||||||||||||||||||
Total assets | $ | 346,243 | $ | 346,284 | $ | 347,849 | ||||||||||||||||||||||||||||||
|
|
|
|
|
| |||||||||||||||||||||||||||||||
Interest-bearing liabilities: | ||||||||||||||||||||||||||||||||||||
NOW, super NOW & money market demand | $ | 39,356 | 50 | 0.13 | % | $ | 36,918 | 51 | 0.14 | % | $ | 34,012 | 60 | 0.18 | % | |||||||||||||||||||||
Savings and club deposits | 107,960 | 234 | 0.22 | % | 110,916 | 251 | 0.23 | % | 112,901 | 417 | 0.37 | % | ||||||||||||||||||||||||
Certificates of deposit | 101,801 | 1,371 | 1.35 | % | 114,876 | 1,705 | 1.48 | % | 121,858 | 2,175 | 1.78 | % | ||||||||||||||||||||||||
|
|
|
|
|
|
|
|
|
|
|
| |||||||||||||||||||||||||
Total interest-bearing deposits | 249,117 | 1,655 | 0.66 | % | 262,710 | 2,007 | 0.76 | % | 268,771 | 2,652 | 0.99 | % | ||||||||||||||||||||||||
Federal Home Loan Bank of New York advances | 33,108 | 767 | 2.32 | % | 23,329 | 714 | 3.06 | % | 20,000 | 684 | 3.42 | % | ||||||||||||||||||||||||
|
|
|
|
|
|
|
|
|
|
|
| |||||||||||||||||||||||||
Total interest-bearing liabilities | 282,225 | 2,422 | 0.86 | % | 286,039 | 2,721 | 0.95 | % | 288,771 | 3,336 | 1.16 | % | ||||||||||||||||||||||||
|
|
|
|
|
| |||||||||||||||||||||||||||||||
Non-interest-bearing deposits | 21,598 | 18,691 | 16,094 | |||||||||||||||||||||||||||||||||
Other non-interest-bearing liabilities | 2,198 | 1,438 | 1,964 | |||||||||||||||||||||||||||||||||
|
|
|
|
|
| |||||||||||||||||||||||||||||||
Total liabilities | 306,021 | 306,168 | 306,829 | |||||||||||||||||||||||||||||||||
Stockholders’ equity | 40,222 | 40,116 | 41,020 | |||||||||||||||||||||||||||||||||
|
|
|
|
|
| |||||||||||||||||||||||||||||||
Total liabilities and stockholders’ equity | $ | 346,243 | $ | 346,284 | $ | 347,849 | ||||||||||||||||||||||||||||||
|
|
|
|
|
| |||||||||||||||||||||||||||||||
Net interest income/net interest rate spread(3) | $ | 9,570 | 2.86 | % | $ | 9.311 | 2.90 | % | $ | 10,465 | 3.22 | % | ||||||||||||||||||||||||
|
|
|
|
|
|
|
|
|
|
|
| |||||||||||||||||||||||||
Net interest margin(4) | 2.97 | % | 2.98 | % | 3.32 | % | ||||||||||||||||||||||||||||||
|
|
|
|
|
| |||||||||||||||||||||||||||||||
Ratio of interest-earning assets to interest-bearing liabilities | 114.09 | % | 109.33 | % | 109.22 | % | ||||||||||||||||||||||||||||||
|
|
|
|
|
| |||||||||||||||||||||||||||||||
| (1) | Non-accruing loans have been included, and the effect of such inclusion was not material. The allowance for loan losses is excluded, while construction loans in process and deferred fees are included. |
| (2) | Includes Federal Home Loan Bank of New York stock at cost and term deposits with other financial institutions. |
| (3) | Net interest rate spread represents the difference between the average yield on interest-earning assets and the average cost of interest-bearing liabilities. |
| (4) | Net interest margin represents net interest income as a percentage of average interest-earning assets. |
Source: MSB Financial’s prospectus.
EXHIBIT I-6
MSB Financial Corp.
Loan Loss Allowance Activity
Exhibit I-6
MSB Financial Corp.
Loan Loss Allowance Activity
| Six Months Ended December 31, | Year Ended June 30, | |||||||||||||||||||||||||||
| 2014 | 2013 | 2014 | 2013 | 2012 | 2011 | 2010 | ||||||||||||||||||||||
| (Dollars in thousands) | ||||||||||||||||||||||||||||
Allowance balance at beginning of period | $ | 3,686 | $ | 4,270 | $ | 4,270 | $ | 3,065 | $ | 2,170 | $ | 2,588 | $ | 1,808 | ||||||||||||||
Provision for loan losses | 100 | 300 | 600 | 4,044 | 2,217 | 1,686 | 1,600 | |||||||||||||||||||||
Charge-offs: | ||||||||||||||||||||||||||||
One-to four-family real estate | 57 | 498 | 522 | 1,574 | 857 | 1,134 | 6 | |||||||||||||||||||||
Commercial real estate | — | 340 | 340 | 348 | 5 | 155 | 166 | |||||||||||||||||||||
Construction | 73 | 118 | 119 | 333 | — | 34 | 487 | |||||||||||||||||||||
Consumer | 2 | — | 9 | 5 | 17 | 8 | 14 | |||||||||||||||||||||
Home equity | 285 | — | 15 | 293 | 443 | 759 | 148 | |||||||||||||||||||||
Commercial and industrial | �� | 1 | 54 | 236 | 342 | 2 | 14 | — | ||||||||||||||||||||
|
|
|
|
|
|
|
|
|
|
|
|
|
| |||||||||||||||
Total charge-offs | 418 | 1,010 | 1,241 | 2,895 | 1,324 | 2,104 | 821 | |||||||||||||||||||||
|
|
|
|
|
|
|
|
|
|
|
|
|
| |||||||||||||||
Recoveries: | ||||||||||||||||||||||||||||
Consumer | — | — | — | — | 2 | — | 1 | |||||||||||||||||||||
One- to four-family real estate | 6 | 11 | 35 | 42 | — | — | — | |||||||||||||||||||||
Construction | 229 | — | 14 | 14 | — | — | — | |||||||||||||||||||||
Home equity | 31 | — | — | — | — | — | — | |||||||||||||||||||||
Commercial and industrial | — | 8 | 8 | — | — | — | — | |||||||||||||||||||||
|
|
|
|
|
|
|
|
|
|
|
|
|
| |||||||||||||||
Total recoveries | 266 | 19 | 57 | 56 | 2 | — | 1 | |||||||||||||||||||||
|
|
|
|
|
|
|
|
|
|
|
|
|
| |||||||||||||||
Net charge-offs | 152 | 991 | 1,184 | 2,839 | 1,322 | 2,104 | 820 | |||||||||||||||||||||
|
|
|
|
|
|
|
|
|
|
|
|
|
| |||||||||||||||
Allowance balance at end of period | $ | 3,634 | $ | 3,579 | $ | 3,686 | $ | 4,270 | $ | 3,065 | $ | 2,170 | $ | 2,588 | ||||||||||||||
|
|
|
|
|
|
|
|
|
|
|
|
|
| |||||||||||||||
Total loans outstanding at end of period | $ | 236,916 | $ | 236,962 | $ | 236,818 | $ | 228,648 | $ | 246,200 | $ | 259,097 | $ | 272,626 | ||||||||||||||
|
|
|
|
|
|
|
|
|
|
|
|
|
| |||||||||||||||
Average loans outstanding during period | $ | 236,867 | $ | 231,527 | $ | 232,148 | $ | 237,776 | $ | 248,124 | $ | 264,476 | $ | 277,379 | ||||||||||||||
|
|
|
|
|
|
|
|
|
|
|
|
|
| |||||||||||||||
Allowance for loan losses as a percentage ofnon-performing loans | 59.75 | % | 43.81 | % | 44.34 | % | 30.30 | % | 18.29 | % | 13.25 | % | 16.53 | % | ||||||||||||||
Allowance for loan losses as a percentage of total loans | 1.53 | % | 1.51 | % | 1.56 | % | 1.87 | % | 1.24 | % | 0.84 | % | 0.95 | % | ||||||||||||||
Net loans charged-off as a percentage of average loans(six-month periods annualized) | 0.13 | % | 0.86 | % | 0.51 | % | 1.19 | % | 0.53 | % | 0.80 | % | 0.30 | % | ||||||||||||||
Source: MSB Financial’s prospectus.
EXHIBIT I-7
MSB Financial Corp.
Interest Rate Risk Analysis
Exhibit I-7
MSB Financial Corp.
Interest Rate Risk Analysis
Change in Interest Rates (base points) | % Change in Pretax Net Interest Income | % Change in Economic Value of Equity | ||||||
| (Dollars in thousands) | ||||||||
+400 | -10.76 | % | 12.18 | % | ||||
+300 | -7.77 | % | 13.60 | % | ||||
+200 | -4.92 | % | 14.94 | % | ||||
+100 | -1.38 | % | 15.99 | % | ||||
0 | 16.19 | % | ||||||
-100 | -7.97 | % | 16.74 | % | ||||
Source: MSB Financial’s prospectus.
EXHIBIT I-8
MSB Financial Corp.
Fixed and Adjustable Rate Loans
Exhibit I-8
MSB Financial Corp.
Fixed and Adjustable Rate Loans
| Fixed Rates | Floating or Adjustable Rates | Total | ||||||||||
| (In thousands) | ||||||||||||
One- to four-family real estate | $ | 104,075 | $ | 32,812 | $ | 136,887 | ||||||
Commercial and multi-family real estate | 26,343 | 3,359 | 29,702 | |||||||||
Construction | 2,155 | 38 | 2,193 | |||||||||
Consumer | 935 | — | 935 | |||||||||
Home equity | 13,591 | 21,271 | 34,862 | |||||||||
Commercial and industrial | 1,996 | 4,955 | 6,951 | |||||||||
|
|
|
|
|
| |||||||
Total | $ | 149,095 | $ | 62,435 | $ | 211,530 | ||||||
|
|
|
|
|
| |||||||
Source: MSB Financial’s prospectus.
EXHIBIT I-9
MSB Financial Corp.
Loan Portfolio Composition
Exhibit I-9
MSB Financial Corp.
Loan Portfolio Composition
At December 31, | At June 30, | |||||||||||||||||||||||||||||||||||||||||||||||
| 2014 | 2014 | 2013 | 2012 | 2011 | 2010 | |||||||||||||||||||||||||||||||||||||||||||
| Amount | Percent | Amount | Percent | Amount | Percent | Amount | Percent | Amount | Percent | Amount | Percent | |||||||||||||||||||||||||||||||||||||
| (Dollars in thousands) | ||||||||||||||||||||||||||||||||||||||||||||||||
Type of Loans: | ||||||||||||||||||||||||||||||||||||||||||||||||
One- to four-family real estate | $ | 144,966 | 61.19 | % | $ | 143,283 | 60.50 | % | $ | 136,704 | 59.79 | % | $ | 141,927 | 57.65 | % | $ | 149,399 | 57.66 | % | $ | 155,241 | 56.94 | % | ||||||||||||||||||||||||
Commercial and multi-family real estate | 31,637 | 13.35 | 32,036 | 13.53 | 32,171 | 14.07 | 32,181 | 13.07 | 32,559 | 12.57 | 33,776 | 12.39 | ||||||||||||||||||||||||||||||||||||
Construction | 12,651 | 5.34 | 12,517 | 5.29 | 8,895 | 3.89 | 11,669 | 4.74 | 16,633 | 6.42 | 16,639 | 6.10 | ||||||||||||||||||||||||||||||||||||
Home equity | 36,847 | 15.55 | 38,484 | 16.25 | 40,682 | 17.79 | 49,224 | 19.99 | 50,240 | 19.39 | 56,862 | 20.86 | ||||||||||||||||||||||||||||||||||||
Commercial and industrial | 9,663 | 4.08 | 9,666 | 4.08 | 9,267 | 4.05 | 10,092 | 4.10 | 9,325 | 3.60 | 9,190 | 3.37 | ||||||||||||||||||||||||||||||||||||
Consumer | 1,152 | 0.49 | 832 | 0.35 | 929 | 0.41 | 1,107 | 0.45 | 941 | 0.36 | 918 | 0.34 | ||||||||||||||||||||||||||||||||||||
|
|
|
|
|
|
|
|
|
|
|
|
|
|
|
|
|
|
|
|
|
|
|
| |||||||||||||||||||||||||
Total loans receivable | 236,916 | 100.00 | % | 236,818 | 100.00 | % | 228,648 | 100.00 | % | 246,200 | 100.00 | % | 259,097 | 100.00 | % | 272,626 | 100.00 | % | ||||||||||||||||||||||||||||||
|
|
|
|
|
|
|
|
|
|
|
| |||||||||||||||||||||||||||||||||||||
Less: | ||||||||||||||||||||||||||||||||||||||||||||||||
Construction loans in process | (1,499 | ) | (2,491 | ) | (745 | ) | (2,261 | ) | (3,452 | ) | (4,027 | ) | ||||||||||||||||||||||||||||||||||||
Allowance for loan losses | (3,634 | ) | (3,686 | ) | (4,270 | ) | (3,065 | ) | (2,170 | ) | (2,588 | ) | ||||||||||||||||||||||||||||||||||||
Deferred loan fees | (334 | ) | (366 | ) | (377 | ) | (354 | ) | (224 | ) | (197 | ) | ||||||||||||||||||||||||||||||||||||
|
|
|
|
|
|
|
|
|
|
|
| |||||||||||||||||||||||||||||||||||||
Total loans receivable, net | $ | 231,449 | $ | 230,275 | $ | 223,256 | $ | 240,520 | $ | 253,251 | $ | 265,814 | ||||||||||||||||||||||||||||||||||||
|
|
|
|
|
|
|
|
|
|
|
| |||||||||||||||||||||||||||||||||||||
Source: MSB Financial’s prospectus.
EXHIBIT I-10
MSB Financial Corp.
Contractual Maturity by Loan Type
Exhibit I-10
MSB Financial Corp.
Contractual Maturity by Loan Type
| At December 31, 2014 | ||||||||||||||||||||||||||||
| One- to Four- Family Real Estate | Commercial and Multi- Family Real Estate | Construction | Consumer | Home Equity | Commercial and Industrial | Total | ||||||||||||||||||||||
| (In thousands) | ||||||||||||||||||||||||||||
Amounts Due: | ||||||||||||||||||||||||||||
Within 1 Year | $ | 8,079 | $ | 1,935 | $ | 8,959 | $ | 217 | $ | 1,985 | $ | 2,712 | $ | 23,887 | ||||||||||||||
|
|
|
|
|
|
|
|
|
|
|
|
|
| |||||||||||||||
After 1 year: | ||||||||||||||||||||||||||||
1 to 5 years | 10,567 | 14,096 | 2,193 | 58 | 10,898 | 6,020 | 43,832 | |||||||||||||||||||||
5 to 10 years | 8,047 | 4,164 | — | — | 11,361 | 649 | 24,221 | |||||||||||||||||||||
After 10 years | 118,273 | 11,442 | — | 877 | 12,603 | 282 | 143,477 | |||||||||||||||||||||
|
|
|
|
|
|
|
|
|
|
|
|
|
| |||||||||||||||
Total due after one year | 136,887 | 29,702 | 2,193 | 935 | 34,862 | 6,951 | 211,530 | |||||||||||||||||||||
|
|
|
|
|
|
|
|
|
|
|
|
|
| |||||||||||||||
Total | $ | 144,966 | $ | 31,637 | $ | 11,152 | $ | 1,152 | $ | 36,847 | $ | 9,663 | $ | 235,417 | ||||||||||||||
|
|
|
|
|
|
|
|
|
|
|
|
|
| |||||||||||||||
Source: MSB Financial’s prospectus.
EXHIBIT I-11
MSB Financial Corp.
Non-Performing Assets
Exhibit I-11
MSB Financial Corp.
Non-Performing Assets
| At December 31, 2014 | At June 30, | |||||||||||||||||||||||
| 2014 | 2013 | 2012 | 2011 | 2010 | ||||||||||||||||||||
| (Dollars in thousands) | ||||||||||||||||||||||||
Loans accounted for on a non-accrual basis: | ||||||||||||||||||||||||
One-to four-family real estate | $ | 3,360 | $ | 4,346 | $ | 7,955 | $ | 9,003 | $ | 8,317 | $ | 6,764 | ||||||||||||
Commercial and multi-family real estate | 1,240 | 1,248 | 2,587 | 2,337 | 3,132 | 3,465 | ||||||||||||||||||
Construction | 64 | 137 | 601 | 1,258 | 1,027 | 864 | ||||||||||||||||||
Consumer | — | — | 802 | — | 2 | 9 | ||||||||||||||||||
Home equity | 430 | 1,586 | 1,502 | 923 | 950 | 2,281 | ||||||||||||||||||
Commercial and industrial | 628 | 635 | — | 1,064 | 642 | 514 | ||||||||||||||||||
|
|
|
|
|
|
|
|
|
|
|
| |||||||||||||
Total(1) | 5,722 | 7,952 | 13,447 | 14,585 | 14,070 | 13,897 | ||||||||||||||||||
|
|
|
|
|
|
|
|
|
|
|
| |||||||||||||
Accruing loans contractually past due 90 days or more: | ||||||||||||||||||||||||
One-to four-family real estate | 360 | 310 | 501 | 1,263 | 1,369 | 1,439 | ||||||||||||||||||
Commercial and multi-family real estate | — | — | — | — | — | — | ||||||||||||||||||
Construction | — | — | — | — | — | — | ||||||||||||||||||
Consumer | — | — | — | 1 | — | 2 | ||||||||||||||||||
Home equity | — | 51 | 146 | 906 | 934 | 321 | ||||||||||||||||||
Commercial and industrial | — | — | — | — | — | — | ||||||||||||||||||
|
|
|
|
|
|
|
|
|
|
|
| |||||||||||||
Total | 360 | 361 | 647 | 2,170 | 2,303 | 1,762 | ||||||||||||||||||
|
|
|
|
|
|
|
|
|
|
|
| |||||||||||||
Total non-performing loans | $ | 6,082 | $ | 8,313 | $ | 14,094 | $ | 16,755 | $ | 16,373 | $ | 15,659 | ||||||||||||
|
|
|
|
|
|
|
|
|
|
|
| |||||||||||||
Total non-performing assets(2) | $ | 7,365 | $ | 8,722 | $ | 14,624 | $ | 16,755 | $ | 17,234 | $ | 16,726 | ||||||||||||
|
|
|
|
|
|
|
|
|
|
|
| |||||||||||||
Accruing loans modified in troubled debt restructuring | $ | 11,525 | $ | 13,439 | $ | 11,848 | $ | 7,061 | $ | 543 | $ | 6,555 | ||||||||||||
|
|
|
|
|
|
|
|
|
|
|
| |||||||||||||
Total non-performing loans to total loans | 2.59 | % | 3.51 | % | 6.16 | % | 6.81 | % | 6.32 | 5.74 | % | |||||||||||||
Total non-performing loans to total assets | 1.79 | % | 2.41 | % | 4.00 | % | 4.82 | % | 4.69 | 4.36 | % | |||||||||||||
Total non-performing assets to total assets | 2.16 | % | 2.53 | % | 4.15 | % | 4.82 | % | 4.93 | 4.66 | % | |||||||||||||
| (1) | Includes $4.6 million, $3.2 million, $6.2 million, $5.1 million, $2.4 million and $2.9 million in troubled debt restructurings at December 31, 2014 and June 30, 2014, 2013, 2012, 2011 and 2010, respectively. |
| (2) | Total non-performing assets consist of total non-performing loans and other real estate owned of $1.3 million, $409,000, $530,000, $-, $861,000 and $1.1 million at December 31, 2014 and June 30, 2014, 2013, 2012, 2011 and 2010, respectively. |
Source: MSB Financial’s prospectus.
EXHIBIT I-12
MSB Financial Corp.
Deposit Composition
Exhibit I-12
MSB Financial Corp.
Deposit Composition
| Six Months Ended December 31, | ||||||||||||||||||||||||
| 2014 | 2013 | |||||||||||||||||||||||
| Average Balance | Percent of Total Deposits | Weighted Average Nominal Rate | Average Balance | Percent of Total Deposits | Weighted Average Nominal Rate | |||||||||||||||||||
| (Dollars in thousands) | ||||||||||||||||||||||||
Non-interest-bearing demand | $ | 26,770 | 10.04 | % | — | % | $ | 20,438 | 7.46 | % | — | % | ||||||||||||
Interest-bearing demand | 42,067 | 15.77 | 0.16 | 38,374 | 14.00 | 0.13 | ||||||||||||||||||
Savings and club | 101,011 | 37.86 | 0.22 | 110,166 | 40.18 | 0.22 | ||||||||||||||||||
Certificates of deposit | 96,904 | 36.33 | 1.33 | 105,157 | 38.36 | 1.38 | ||||||||||||||||||
|
|
|
|
|
|
|
| |||||||||||||||||
Total deposits | $ | 266,752 | 100.00 | % | 0.65 | % | $ | 274,135 | 100.00 | % | 0.68 | % | ||||||||||||
|
|
|
|
|
|
|
| |||||||||||||||||
| For the Year Ended June 30, | ||||||||||||||||||||||||||||||||||||
| 2014 | 2013 | 2012 | ||||||||||||||||||||||||||||||||||
| Average Balance | Percent of Total Deposits | Weighted Average Nominal Rate | Average Balance | Percent of Total Deposits | Weighted Average Nominal Rate | Average Balance | Percent of Total Deposits | Weighted Average Nominal Rate | ||||||||||||||||||||||||||||
| (Dollars in thousands) | ||||||||||||||||||||||||||||||||||||
Non-interest-bearing demand | $ | 21,598 | 7.98 | % | — | % | $ | 18,691 | 6.64 | % | — | % | $ | 16,094 | 5.65 | % | — | % | ||||||||||||||||||
Interest-bearing demand | 39,356 | 14.54 | 0.13 | 36,918 | 13.12 | 0.14 | 34,012 | 11.94 | 0.18 | |||||||||||||||||||||||||||
Savings and club | 107,960 | 39.88 | 0.22 | 110,916 | 39.42 | 0.23 | 112,901 | 39.63 | 0.37 | |||||||||||||||||||||||||||
Certificates of deposit | 101,801 | 37.60 | 1.35 | 114,876 | 40.82 | 1.48 | 121,858 | 42.78 | 1.78 | |||||||||||||||||||||||||||
|
|
|
|
|
|
|
|
|
|
|
| |||||||||||||||||||||||||
Total deposits | $ | 270,715 | 100.00 | % | 0.66 | % | $ | 281,401 | 100.00 | % | 0.76 | % | $ | 284,865 | 100.00 | % | 0.93 | |||||||||||||||||||
|
|
|
|
|
|
|
|
|
|
|
| |||||||||||||||||||||||||
Source: MSB Financial’s prospectus.
EXHIBIT I-13
MSB Financial Corp.
Maturity of Time Deposits
Exhibit I-13
MSB Financial Corp.
Maturity of Time Deposits
| Amount Due Year Ended December 31, | ||||||||||||||||||||||||||||
| 2015 | 2016 | 2017 | 2018 | 2019 | After 2019 | Total | ||||||||||||||||||||||
| (Dollars in thousands) | ||||||||||||||||||||||||||||
Interest Rate: | ||||||||||||||||||||||||||||
Under - 1.00% | $ | 43,083 | $ | 10,543 | $ | 169 | $ | — | $ | — | $ | 733 | $ | 54,528 | ||||||||||||||
1.00% - 1.99% | 3,907 | 4,561 | 8,663 | 1,791 | 953 | 1,064 | 20,939 | |||||||||||||||||||||
2.00% - 2.99% | 2,784 | 3,202 | — | — | 103 | 284 | 6,373 | |||||||||||||||||||||
3.00% - 3.99% | 5,426 | — | — | 85 | 325 | — | 5,836 | |||||||||||||||||||||
4.00% - 4.99% | 134 | — | — | 846 | 37 | — | 1,017 | |||||||||||||||||||||
5.00% - 5.99% | 1,358 | 1,199 | 1,815 | 873 | — | — | 5,245 | |||||||||||||||||||||
6.00% + | — | — | — | — | — | — | — | |||||||||||||||||||||
|
|
|
|
|
|
|
|
|
|
|
|
|
| |||||||||||||||
Total | $ | 56,692 | $ | 19,505 | $ | 10,647 | $ | 3,595 | $ | 1,418 | $ | 2,081 | $ | 93,938 | ||||||||||||||
|
|
|
|
|
|
|
|
|
|
|
|
|
| |||||||||||||||
Source: MSB Financial’s prospectus.
EXHIBIT I-14
MSB Financial Corp.
Borrowing Activity
Exhibit I-14
MSB Financial Corp.
Borrowing Activity
| At December 31, 2014 | ||||||||||||
| Balance | Rate | Maturity | ||||||||||
| (Dollars in thousands) | ||||||||||||
Total Borrowings: | ||||||||||||
Three year fixed rate advance | $ | 5,000 | 0.780 | % | February 2016 | |||||||
Three year fixed rate advance | $ | 5,000 | 0.780 | % | March 2016 | |||||||
Ten year fixed rate convertible advance | $ | 10,000 | 3.272 | % | November 2017 | |||||||
Ten year fixed rate convertible advance | $ | 10,000 | 3.460 | % | March 2018 | |||||||
Source: MSB Financial’s prospectus.
EXHIBIT II-1
Description of Office Properties
Exhibit II-1
MSB Financial Corp.
Description of Office Properties
Office Location | Year Facility Opened | Leased or Owned | ||||
Millington Main Office | 1994 | (1) | Owned | |||
1902 Long Hill Road | ||||||
Millington, NJ | ||||||
Dewy Meadow Branch Office | 2002 | Leased | ||||
415 King George Road | ||||||
Basking Ridge, NJ | ||||||
RiverWalk Branch Office | 2005 | (2) | Leased | |||
675 Martinsville Road | ||||||
Basking Ridge, NJ | ||||||
Martinsville Branch Office | 2006 | Leased | ||||
1924 Washington Valley Road | ||||||
Martinsville, NJ | ||||||
Bernardsville Branch Office | 2008 | Owned | ||||
122 Morristown Road | ||||||
Bernardsville, NJ | ||||||
| (1) | Millington Savings Bank’s main office opened in 1911 in Millington, New Jersey. Millington Savings Bank moved into its current main office in 1994. |
| (2) | Millington Savings Bank’s first branch office opened in 1998 in Liberty Corner, New Jersey. This office was relocated in 2005. |
Source: MSB Financial’s prospectus.
EXHIBIT II-2
Historical Interest Rates
Exhibit II-2
Historical Interest Rates(1)
Year/Qtr. Ended | Prime Rate | 90 Day T-Note | One Year T-Note | 10 Year T-Note | ||||||||||||||
2004: | Quarter 1 | 4.00 | % | 0.95 | % | 1.20 | % | 3.86 | % | |||||||||
Quarter 2 | 4.00 | % | 1.33 | % | 2.09 | % | 4.62 | % | ||||||||||
Quarter 3 | 4.75 | % | 1.70 | % | 2.16 | % | 4.12 | % | ||||||||||
Quarter 4 | 5.25 | % | 2.22 | % | 2.75 | % | 4.24 | % | ||||||||||
2005: | Quarter 1 | 5.75 | % | 2.80 | % | 3.43 | % | 4.51 | % | |||||||||
Quarter 2 | 6.00 | % | 3.12 | % | 3.51 | % | 3.98 | % | ||||||||||
Quarter 3 | 6.75 | % | 3.55 | % | 4.01 | % | 4.34 | % | ||||||||||
Quarter 4 | 7.25 | % | 4.08 | % | 4.38 | % | 4.39 | % | ||||||||||
2006: | Quarter 1 | 7.75 | % | 4.63 | % | 4.82 | % | 4.86 | % | |||||||||
Quarter 2 | 8.25 | % | 5.01 | % | 5.21 | % | 5.15 | % | ||||||||||
Quarter 3 | 8.25 | % | 4.88 | % | 4.91 | % | 4.64 | % | ||||||||||
Quarter 4 | 8.25 | % | 5.02 | % | 5.00 | % | 4.71 | % | ||||||||||
2007: | Quarter 1 | 8.25 | % | 5.04 | % | 4.90 | % | 4.65 | % | |||||||||
Quarter 2 | 8.25 | % | 4.82 | % | 4.91 | % | 5.03 | % | ||||||||||
Quarter 3 | 7.75 | % | 3.82 | % | 4.05 | % | 4.59 | % | ||||||||||
Quarter 4 | 7.25 | % | 3.36 | % | 3.34 | % | 3.91 | % | ||||||||||
2008: | Quarter 1 | 5.25 | % | 1.38 | % | 1.55 | % | 3.45 | % | |||||||||
Quarter 2 | 5.00 | % | 1.90 | % | 2.36 | % | 3.99 | % | ||||||||||
Quarter 3 | 5.00 | % | 0.92 | % | 1.78 | % | 3.85 | % | ||||||||||
Quarter 4 | 3.25 | % | 0.11 | % | 0.37 | % | 2.25 | % | ||||||||||
2009: | Quarter 1 | 3.25 | % | 0.21 | % | 0.57 | % | 2.71 | % | |||||||||
Quarter 2 | 3.25 | % | 0.19 | % | 0.56 | % | 3.53 | % | ||||||||||
Quarter 3 | 3.25 | % | 0.14 | % | 0.40 | % | 3.31 | % | ||||||||||
Quarter 4 | 3.25 | % | 0.06 | % | 0.47 | % | 3.85 | % | ||||||||||
2010: | Quarter 1 | 3.25 | % | 0.16 | % | 0.41 | % | 3.84 | % | |||||||||
Quarter 2 | 3.25 | % | 0.18 | % | 0.32 | % | 2.97 | % | ||||||||||
Quarter 3 | 3.25 | % | 0.18 | % | 0.32 | % | 2.97 | % | ||||||||||
Quarter 4 | 3.25 | % | 0.12 | % | 0.29 | % | 3.30 | % | ||||||||||
2011: | Quarter 1 | 3.25 | % | 0.09 | % | 0.30 | % | 3.47 | % | |||||||||
Quarter 2 | 3.25 | % | 0.03 | % | 0.19 | % | 3.18 | % | ||||||||||
Quarter 3 | 3.25 | % | 0.02 | % | 0.13 | % | 1.92 | % | ||||||||||
Quarter 4 | 3.25 | % | 0.02 | % | 0.12 | % | 1.89 | % | ||||||||||
2012: | Quarter 1 | 3.25 | % | 0.07 | % | 0.19 | % | 2.23 | % | |||||||||
Quarter 2 | 3.25 | % | 0.09 | % | 0.21 | % | 1.67 | % | ||||||||||
Quarter 3 | 3.25 | % | 0.10 | % | 0.17 | % | 1.65 | % | ||||||||||
Quarter 4 | 3.25 | % | 0.05 | % | 0.16 | % | 1.78 | % | ||||||||||
2013: | Quarter 1 | 3.25 | % | 0.07 | % | 0.14 | % | 1.87 | % | |||||||||
Quarter 2 | 3.25 | % | 0.04 | % | 0.15 | % | 2.52 | % | ||||||||||
Quarter 3 | 3.25 | % | 0.02 | % | 0.10 | % | 2.64 | % | ||||||||||
Quarter 4 | 3.25 | % | 0.07 | % | 0.13 | % | 3.04 | % | ||||||||||
2014: | Quarter 1 | 3.25 | % | 0.05 | % | 0.13 | % | 2.73 | % | |||||||||
Quarter 2 | 3.25 | % | 0.04 | % | 0.11 | % | 2.53 | % | ||||||||||
Quarter 3 | 3.25 | % | 0.02 | % | 0.13 | % | 2.52 | % | ||||||||||
Quarter 4 | 3.25 | % | 0.04 | % | 0.25 | % | 2.17 | % | ||||||||||
As of Feb. 6, 2015 | 3.25 | % | 0.02 | % | 0.26 | % | 1.95 | % | ||||||||||
| (1) | End of period data. |
Sources: Federal Reserve and The Wall Street Journal.
EXHIBIT III-1
Characteristics of Publicly-Traded Thrifts
Exhibit III-1
Characteristics of Publicly-Traded Thrifts
February 6, 2015
| As of February 6, 2015 | ||||||||||||||||||||||||||||||
Ticker | Financial Institution | Exchange | Region | City | State | Total Assets | Offices | Fiscal Mth End | Conv. Date | Stock Price | Market Value | |||||||||||||||||||
| ($Mil) | ($) | ($Mil) | ||||||||||||||||||||||||||||
| ALLB | Alliance Bancorp, Inc. of Pennsylvania | NASDAQ | MA | Broomall | PA | $ | 423 | (1) | 8 | Dec | 1/18/11 | $ | 17.00 | $ | 68 | |||||||||||||||
| ANCB | Anchor Bancorp | NASDAQ | WE | Lacey | WA | 377 | 11 | Jun | 1/26/11 | 21.90 | 56 | |||||||||||||||||||
| ABCW | Anchor BanCorp Wisconsin Inc. | NASDAQ | MW | Madison | WI | 2,082 | 53 | Dec | 7/16/92 | 32.98 | 315 | |||||||||||||||||||
| ASBB | ASB Bancorp, Inc. | NASDAQ | SE | Asheville | NC | 760 | 13 | Dec | 10/12/11 | 19.55 | 86 | |||||||||||||||||||
| AF | Astoria Financial Corporation | NYSE | MA | Lake Success | NY | 15,640 | 87 | Dec | 11/18/93 | 12.99 | 1,298 | |||||||||||||||||||
| AFCB | Athens Bancshares Corporation | NASDAQ | SE | Athens | TN | 302 | 7 | Dec | 1/7/10 | 24.77 | 45 | |||||||||||||||||||
| ACFC | Atlantic Coast Financial Corporation | NASDAQ | SE | Jacksonville | FL | 706 | 12 | Dec | 2/4/11 | 3.92 | 61 | |||||||||||||||||||
| BKMU | Bank Mutual Corporation | NASDAQ | MW | Brown Deer | WI | 2,328 | 77 | Dec | 10/30/03 | 7.00 | 326 | |||||||||||||||||||
| BFIN | BankFinancial Corporation | NASDAQ | MW | Burr Ridge | IL | 1,465 | 20 | Dec | 6/24/05 | 11.73 | 248 | |||||||||||||||||||
| BNCL | Beneficial Bancorp, Inc. | NASDAQ | MA | Philadelphia | PA | 4,752 | 60 | Dec | 1/13/15 | 11.41 | 944 | |||||||||||||||||||
| BHBK | Blue Hills Bancorp, Inc. | NASDAQ | NE | Norwood | MA | 1,728 | 10 | Dec | 7/22/14 | 13.24 | 377 | |||||||||||||||||||
| BOFI | BofI Holding, Inc. | NASDAQ | WE | San Diego | CA | 5,195 | 1 | Jun | 3/14/05 | 88.99 | 1,342 | |||||||||||||||||||
| BYFC | Broadway Financial Corporation | NASDAQ | WE | Los Angeles | CA | 338 | (1) | 3 | Dec | 1/9/96 | 1.15 | 25 | ||||||||||||||||||
| BLMT | BSB Bancorp, Inc. | NASDAQ | NE | Belmont | MA | 1,336 | (1) | 6 | Dec | 10/5/11 | 18.79 | 170 | ||||||||||||||||||
| CBNJ | Cape Bancorp, Inc. | NASDAQ | MA | Cape May Court House | NJ | 1,080 | 15 | Dec | 2/1/08 | 8.73 | 100 | |||||||||||||||||||
| CFFN | Capitol Federal Financial, Inc. | NASDAQ | MW | Topeka | KS | 9,056 | 47 | Sep | 12/22/10 | 12.72 | 1,789 | |||||||||||||||||||
| CARV | Carver Bancorp, Inc. | NASDAQ | MA | New York | NY | 644 | (1) | 10 | Mar | 10/25/94 | 5.90 | 22 | ||||||||||||||||||
| CFBK | Central Federal Corporation | NASDAQ | MW | Worthington | OH | 308 | (1) | 4 | Dec | 12/30/98 | 1.28 | 20 | ||||||||||||||||||
| CHFN | Charter Financial Corporation | NASDAQ | SE | West Point | GA | 980 | 17 | Sep | 4/9/13 | 11.50 | 195 | |||||||||||||||||||
| CHEV | Cheviot Financial Corp. | NASDAQ | MW | Cheviot | OH | 571 | 12 | Dec | 1/18/12 | 14.35 | 96 | |||||||||||||||||||
| CBNK | Chicopee Bancorp, Inc. | NASDAQ | NE | Chicopee | MA | 639 | 9 | Dec | 7/20/06 | 16.49 | 87 | |||||||||||||||||||
| CSBK | Clifton Bancorp Inc. | NASDAQ | MA | Clifton | NJ | 1,198 | 12 | Mar | 4/2/14 | 13.57 | 368 | |||||||||||||||||||
| CWAY | Coastway Bancorp, Inc. | NASDAQ | NE | Warwick | RI | 451 | (1) | 11 | Dec | 1/15/14 | 11.11 | 55 | ||||||||||||||||||
| DCOM | Dime Community Bancshares, Inc. | NASDAQ | MA | Brooklyn | NY | 4,497 | 25 | Dec | 6/26/96 | 15.70 | 579 | |||||||||||||||||||
| ENFC | Entegra Financial Corp. | NASDAQ | SE | Franklin | NC | 904 | 12 | Dec | 10/1/14 | 15.47 | 101 | |||||||||||||||||||
| ESSA | ESSA Bancorp, Inc. | NASDAQ | MA | Stroudsburg | PA | 1,568 | 28 | Sep | 4/4/07 | 12.22 | 140 | |||||||||||||||||||
| EVER | EverBank Financial Corp | NYSE | SE | Jacksonville | FL | 21,618 | 12 | Dec | 5/2/12 | 18.15 | 2,245 | |||||||||||||||||||
| FCAP | First Capital, Inc. | NASDAQ | MW | Corydon | IN | 473 | 12 | Dec | 1/4/99 | 23.58 | 65 | |||||||||||||||||||
| FBNK | First Connecticut Bancorp, Inc. | NASDAQ | NE | Farmington | CT | 2,484 | 25 | Dec | 6/30/11 | 15.41 | 247 | |||||||||||||||||||
| FDEF | First Defiance Financial Corp. | NASDAQ | MW | Defiance | OH | 2,179 | 33 | Dec | 10/2/95 | 32.22 | 297 | |||||||||||||||||||
| FFNM | First Federal of Northern Michigan Bancorp, Inc. | NASDAQ | MW | Alpena | MI | 312 | (1) | 9 | Dec | 4/4/05 | 5.55 | 21 | ||||||||||||||||||
| FFNW | First Financial Northwest, Inc. | NASDAQ | WE | Renton | WA | 937 | 1 | Dec | 10/10/07 | 12.57 | 191 | |||||||||||||||||||
| FNWB | First Northwest Bancorp | NASDAQ | WE | Port Angeles | WA | 924 | 9 | Jun | 1/30/15 | 12.49 | 164 | |||||||||||||||||||
| FBC | Flagstar Bancorp, Inc. | NYSE | MW | Troy | MI | 9,840 | 107 | Dec | 4/30/97 | 14.85 | 837 | |||||||||||||||||||
| FXCB | Fox Chase Bancorp, Inc. | NASDAQ | MA | Hatboro | PA | 1,095 | 10 | Dec | 6/29/10 | 16.44 | 194 | |||||||||||||||||||
| FSBW | FS Bancorp, Inc. | NASDAQ | WE | Mountlake Terrace | WA | 510 | 8 | Dec | 7/10/12 | 18.90 | 61 | |||||||||||||||||||
| GTWN | Georgetown Bancorp, Inc. | NASDAQ | NE | Georgetown | MA | 271 | 3 | Dec | 7/12/12 | 17.95 | 33 | |||||||||||||||||||
| HBK | Hamilton Bancorp, Inc. | NASDAQ | MA | Towson | MD | 289 | 5 | Mar | 10/10/12 | 12.61 | 43 | |||||||||||||||||||
| HFFC | HF Financial Corp. | NASDAQ | MW | Sioux Falls | SD | 1,263 | 27 | Jun | 4/8/92 | 14.60 | 103 | |||||||||||||||||||
| HIFS | Hingham Institution for Savings | NASDAQ | NE | Hingham | MA | 1,552 | 13 | Dec | 12/20/88 | 88.00 | 187 | |||||||||||||||||||
| HMNF | HMN Financial, Inc. | NASDAQ | MW | Rochester | MN | 577 | 11 | Dec | 6/30/94 | 12.12 | 54 | |||||||||||||||||||
| HBCP | Home Bancorp, Inc. | NASDAQ | SW | Lafayette | LA | 1,221 | 27 | Dec | 10/3/08 | 21.67 | 154 | |||||||||||||||||||
| HFBL | Home Federal Bancorp, Inc. of Louisiana | NASDAQ | SW | Shreveport | LA | 346 | 5 | Jun | 12/22/10 | 19.41 | 43 | |||||||||||||||||||
| HMST | HomeStreet, Inc. | NASDAQ | WE | Seattle | WA | 3,535 | 34 | Dec | 2/10/12 | 17.65 | 262 | |||||||||||||||||||
| IROQ | IF Bancorp, Inc. | NASDAQ | MW | Watseka | IL | 550 | 6 | Jun | 7/8/11 | 16.70 | 72 | |||||||||||||||||||
| ISBC | Investors Bancorp, Inc. | NASDAQ | MA | Short Hills | NJ | 18,774 | 136 | Dec | 5/8/14 | 11.57 | 4,142 | |||||||||||||||||||
| JXSB | Jacksonville Bancorp, Inc. | NASDAQ | MW | Jacksonville | IL | 312 | 6 | Dec | 7/15/10 | 22.50 | 40 | |||||||||||||||||||
| LPSB | La Porte Bancorp, Inc. | NASDAQ | MW | La Porte | IN | 519 | 7 | Dec | 10/5/12 | 12.60 | 71 | |||||||||||||||||||
| LABC | Louisiana Bancorp, Inc. | NASDAQ | SW | Metairie | LA | 333 | 4 | Dec | 7/10/07 | 20.66 | 60 | |||||||||||||||||||
| MCBK | Madison County Financial, Inc. | NASDAQ | MW | Madison | NE | 302 | (1) | 5 | Dec | 10/4/12 | 19.75 | 60 | ||||||||||||||||||
| MLVF | Malvern Bancorp, Inc. | NASDAQ | MA | Paoli | PA | 603 | 8 | Sep | 10/12/12 | 12.04 | 79 | |||||||||||||||||||
Exhibit III-1
Characteristics of Publicly-Traded Thrifts
February 6, 2015
| As of February 6, 2015 | ||||||||||||||||||||||||||||||
Ticker | Financial Institution | Exchange | Region | City | State | Total Assets | Offices | Fiscal Mth End | Conv. Date | Stock Price | Market Value | |||||||||||||||||||
| ($Mil) | ($) | ($Mil) | ||||||||||||||||||||||||||||
| MELR | Melrose Bancorp, Inc. | NASDAQ | NE | Melrose | MA | 213 | (1) | 1 | Dec | 10/22/14 | 13.29 | 38 | ||||||||||||||||||
| EBSB | Meridian Bancorp, Inc. | NASDAQ | NE | Peabody | MA | 3,279 | 27 | Dec | 7/29/14 | 12.37 | 677 | |||||||||||||||||||
| CASH | Meta Financial Group, Inc. | NASDAQ | MW | Sioux Falls | SD | 2,108 | 12 | Sep | 9/20/93 | 34.37 | 221 | |||||||||||||||||||
| NVSL | Naugatuck Valley Financial Corporation | NASDAQ | NE | Naugatuck | CT | 489 | (1) | 10 | Dec | 6/30/11 | 8.80 | 62 | ||||||||||||||||||
| NHTB | New Hampshire Thrift Bancshares, Inc. | NASDAQ | NE | Newport | NH | 1,504 | 36 | Dec | 5/27/86 | 15.42 | 127 | |||||||||||||||||||
| NYCB | New York Community Bancorp, Inc. | NYSE | MA | Westbury | NY | 48,559 | 278 | Dec | 11/23/93 | 15.98 | 7,073 | |||||||||||||||||||
| NFBK | Northfield Bancorp, Inc. | NASDAQ | MA | Woodbridge | NJ | 3,021 | 30 | Dec | 1/25/13 | 14.76 | 714 | |||||||||||||||||||
| NWBI | Northwest Bancshares, Inc. | NASDAQ | MA | Warren | PA | 7,775 | 165 | Dec | 12/18/09 | 11.85 | 1,122 | |||||||||||||||||||
| OSHC | Ocean Shore Holding Co. | NASDAQ | MA | Ocean City | NJ | 1,025 | 11 | Dec | 12/21/09 | 14.10 | 90 | |||||||||||||||||||
| OCFC | OceanFirst Financial Corp. | NASDAQ | MA | Toms River | NJ | 2,357 | 24 | Dec | 7/3/96 | 16.93 | 286 | |||||||||||||||||||
| ONFC | Oneida Financial Corp. | NASDAQ | MA | Oneida | NY | 798 | 14 | Dec | 7/7/10 | 13.20 | 93 | |||||||||||||||||||
| ORIT | Oritani Financial Corp. | NASDAQ | MA | Township of Washington | NJ | 3,251 | 26 | Jun | 6/24/10 | 14.50 | 645 | |||||||||||||||||||
| PBHC | Pathfinder Bancorp, Inc. | NASDAQ | MA | Oswego | NY | 561 | 17 | Dec | 10/17/14 | 9.89 | 43 | |||||||||||||||||||
| PBCT | People’s United Financial, Inc. | NASDAQ | NE | Bridgeport | CT | 35,997 | 407 | Dec | 4/16/07 | 14.71 | 4,528 | |||||||||||||||||||
| PBSK | Poage Bankshares, Inc. | NASDAQ | MW | Ashland | KY | 412 | (1) | 8 | Dec | 9/13/11 | 14.99 | 58 | ||||||||||||||||||
| PBCP | Polonia Bancorp, Inc. | NASDAQ | MA | Huntingdon Valley | PA | 298 | (1) | 5 | Dec | 11/13/12 | 10.50 | 35 | ||||||||||||||||||
| PROV | Provident Financial Holdings, Inc. | NASDAQ | WE | Riverside | CA | 1,112 | 15 | Jun | 6/28/96 | 15.80 | 142 | |||||||||||||||||||
| PFS | Provident Financial Services, Inc. | NYSE | MA | Jersey City | NJ | 8,523 | 90 | Dec | 1/16/03 | 18.49 | 1,200 | |||||||||||||||||||
| PBIP | Prudential Bancorp, Inc. | NASDAQ | MA | Philadelphia | PA | 527 | 8 | Sep | 10/10/13 | 12.23 | 115 | |||||||||||||||||||
| PULB | Pulaski Financial Corp. | NASDAQ | MW | Saint Louis | MO | 1,426 | 13 | Sep | 12/3/98 | 11.76 | 142 | |||||||||||||||||||
| RVSB | Riverview Bancorp, Inc. | NASDAQ | WE | Vancouver | WA | 828 | 17 | Mar | 10/1/97 | 4.45 | 100 | |||||||||||||||||||
| SVBI | Severn Bancorp, Inc. | NASDAQ | MA | Annapolis | MD | 777 | 4 | Dec | 1/0/00 | 4.55 | 46 | |||||||||||||||||||
| SIFI | SI Financial Group, Inc. | NASDAQ | NE | Willimantic | CT | 1,351 | 26 | Dec | 1/13/11 | 11.13 | 142 | |||||||||||||||||||
| SBCP | Sunshine Bancorp, Inc. | NASDAQ | SE | Plant City | FL | 230 | 5 | Dec | 7/15/14 | 11.91 | 50 | |||||||||||||||||||
| TBNK | Territorial Bancorp Inc. | NASDAQ | WE | Honolulu | HI | 1,692 | 29 | Dec | 7/13/09 | 21.68 | 215 | |||||||||||||||||||
| TSBK | Timberland Bancorp, Inc. | NASDAQ | WE | Hoquiam | WA | 750 | 22 | Sep | 1/13/98 | 10.77 | 76 | |||||||||||||||||||
| TRST | TrustCo Bank Corp NY | NASDAQ | MA | Glenville | NY | 4,644 | 144 | Dec | 1/0/00 | 6.96 | 660 | |||||||||||||||||||
| UCBA | United Community Bancorp | NASDAQ | MW | Lawrenceburg | IN | 509 | 8 | Jun | 1/10/13 | 12.01 | 56 | |||||||||||||||||||
| UCFC | United Community Financial Corp. | NASDAQ | MW | Youngstown | OH | 1,834 | 32 | Dec | 7/9/98 | 5.42 | 267 | |||||||||||||||||||
| UBNK | United Financial Bancorp, Inc. | NASDAQ | NE | Glastonbury | CT | 5,477 | 58 | Dec | 3/4/11 | 12.98 | 663 | |||||||||||||||||||
| WSBF | Waterstone Financial, Inc. | NASDAQ | MW | Wauwatosa | WI | 1,799 | (1) | 11 | Dec | 1/23/14 | 12.95 | 446 | ||||||||||||||||||
| WAYN | Wayne Savings Bancshares, Inc. | NASDAQ | MW | Wooster | OH | 418 | 12 | Dec | 1/9/03 | 13.88 | 39 | |||||||||||||||||||
| WEBK | Wellesley Bancorp, Inc. | NASDAQ | NE | Wellesley | MA | 535 | 4 | Dec | 1/26/12 | 19.17 | 47 | |||||||||||||||||||
| WBB | Westbury Bancorp, Inc. | NASDAQ | MW | West Bend | WI | 595 | 9 | Sep | 4/10/13 | 16.35 | 82 | |||||||||||||||||||
| WFD | Westfield Financial, Inc. | NASDAQ | NE | Westfield | MA | 1,320 | 14 | Dec | 1/4/07 | 7.39 | 138 | |||||||||||||||||||
| WBKC | Wolverine Bancorp, Inc. | NASDAQ | MW | Midland | MI | 339 | (1) | 4 | Dec | 1/20/11 | 23.84 | 54 | ||||||||||||||||||
| WSFS | WSFS Financial Corporation | NASDAQ | MA | Wilmington | DE | 4,853 | 46 | Dec | 11/26/86 | 79.26 | 745 | |||||||||||||||||||
| WVFC | WVS Financial Corp. | NASDAQ | MA | Pittsburgh | PA | 295 | 6 | Jun | 11/29/93 | 11.18 | 23 | |||||||||||||||||||
| GCBC | Greene County Bancorp, Inc. (MHC) | NASDAQ | MA | Catskill | NY | 712 | 14 | Jun | 12/30/98 | 29.50 | 124 | |||||||||||||||||||
| KRNY | Kearny Financial Corp. (MHC) | NASDAQ | MA | Fairfield | NJ | 3,548 | 42 | Jun | 2/24/05 | 13.48 | 908 | |||||||||||||||||||
| KFFB | Kentucky First Federal Bancorp (MHC) | NASDAQ | MW | Frankfort | KY | 303 | 7 | Jun | 3/3/05 | 8.13 | 69 | |||||||||||||||||||
| LSBK | Lake Shore Bancorp, Inc. (MHC) | NASDAQ | MA | Dunkirk | NY | 487 | 11 | Dec | 4/4/06 | 13.50 | 80 | |||||||||||||||||||
| MGYR | Magyar Bancorp, Inc. (MHC) | NASDAQ | MA | New Brunswick | NJ | 525 | 6 | Sep | 1/24/06 | 8.35 | 49 | |||||||||||||||||||
| MSBF | MSB Financial Corp. (MHC) | NASDAQ | MA | Millington | NJ | 345 | (1) | 5 | Dec | 1/5/07 | 10.50 | 53 | ||||||||||||||||||
| NECB | NorthEast Community Bancorp, Inc. (MHC) | NASDAQ | MA | White Plains | NY | 502 | (1) | 9 | Dec | 7/6/06 | 6.91 | 86 | ||||||||||||||||||
| OFED | Oconee Federal Financial Corp. (MHC) | NASDAQ | SE | Seneca | SC | 357 | (1) | 7 | Jun | 1/14/11 | 20.18 | 118 | ||||||||||||||||||
| PSBH | PSB Holdings, Inc. (MHC) | NASDAQ | NE | Putnam | CT | 472 | (1) | 8 | Jun | 10/5/04 | 7.48 | 49 | ||||||||||||||||||
| TFSL | TFS Financial Corporation (MHC) | NASDAQ | MW | Cleveland | OH | 12,068 | 38 | Sep | 4/23/07 | 14.29 | 4,263 | |||||||||||||||||||
| (1) | As of September 30, 2014. |
Source: SNL Financial, LC.
EXHIBIT III-2
Public Market Pricing of Mid-Atlantic Thrifts
Exhibit III-2
Public Market Pricing of Mid-Atlantic Thrifts
As of February 6, 2015
| Market | Per Share Data | |||||||||||||||||||||||||||||||||||||||||||||||||||||||||||||||||||||||||||||||||||
| Capitalization | Core | Book | Dividends(3) | Financial Characteristics(5) | ||||||||||||||||||||||||||||||||||||||||||||||||||||||||||||||||||||||||||||||||
| Price/ | Market | 12 Month | Value/ | Pricing Ratios(2) | Amount/ | Payout | Total | Equity/ | Tang. Eq./ | NPAs/ | Reported | Core | ||||||||||||||||||||||||||||||||||||||||||||||||||||||||||||||||||||||||
| Share | Value | EPS(1) | Share | P/E | P/B | P/A | P/TB | P/Core | Share | Yield | Ratio(4) | Assets | Assets | T. Assets | Assets | ROAA | ROAE | ROAA | ROAE | |||||||||||||||||||||||||||||||||||||||||||||||||||||||||||||||||
| ($) | ($Mil) | ($) | ($) | (x) | (%) | (%) | (%) | (x) | ($) | (%) | (%) | ($Mil) | (%) | (%) | (%) | (%) | (%) | (%) | (%) | |||||||||||||||||||||||||||||||||||||||||||||||||||||||||||||||||
All Non-MHC Public Companies(6) | ||||||||||||||||||||||||||||||||||||||||||||||||||||||||||||||||||||||||||||||||||||
Averages | $ | 16.79 | $ | 448.26 | $ | 0.96 | $ | 15.78 | 17.31x | 105.72 | % | 13.63 | % | 113.89 | % | 16.50x | $ | 0.30 | 1.81 | % | 49.60 | % | $ | 3,165 | 13.47 | % | 12.90 | % | 2.02 | % | 0.67 | % | 5.60 | % | 0.72 | % | 5.82 | % | ||||||||||||||||||||||||||||||||||||||||||||||
Median | $ | 13.88 | $ | 114.72 | $ | 0.81 | $ | 14.54 | 15.41x | 98.46 | % | 12.76 | % | 102.24 | % | 15.10x | $ | 0.24 | 1.48 | % | 40.91 | % | $ | 980 | 12.70 | % | 11.63 | % | 1.38 | % | 0.65 | % | 5.29 | % | 0.72 | % | 5.27 | % | ||||||||||||||||||||||||||||||||||||||||||||||
Comparable Group | ||||||||||||||||||||||||||||||||||||||||||||||||||||||||||||||||||||||||||||||||||||
Averages | $ | 14.98 | $ | 772.88 | $ | 0.83 | $ | 14.04 | 16.76x | 111.37 | % | 14.00 | % | 124.17 | % | 18.21x | $ | 0.34 | 2.33 | % | 58.82 | % | $ | 5,105 | 13.92 | % | 13.04 | % | 1.65 | % | 0.59 | % | 4.81 | % | 0.64 | % | 5.08 | % | ||||||||||||||||||||||||||||||||||||||||||||||
Medians | $ | 12.61 | $ | 194.04 | $ | 0.53 | $ | 12.91 | 14.94x | 104.28 | % | 14.08 | % | 110.30 | % | 15.28x | $ | 0.25 | 1.83 | % | 47.92 | % | $ | 1,198 | 12.86 | % | 10.99 | % | 1.18 | % | 0.61 | % | 4.80 | % | 0.75 | % | 5.14 | % | ||||||||||||||||||||||||||||||||||||||||||||||
Comparable Group | ||||||||||||||||||||||||||||||||||||||||||||||||||||||||||||||||||||||||||||||||||||
ALLB | Alliance Bancorp, Inc. of Pennsylvania | PA | $ | 17.00 | $ | 68.46 | $ | 0.48 | $ | 16.30 | NM | 104.28 | % | 16.17 | % | 104.28 | % | NM | $ | 0.24 | 1.41 | % | 47.92 | % | $ | 423 | 15.50 | % | 15.50 | % | 1.93 | % | 0.46 | % | 2.84 | % | 0.46 | % | 2.84 | % | ||||||||||||||||||||||||||||||||||||||||||||
AF | Astoria Financial Corporation | NY | $ | 12.99 | $ | 1,298.23 | $ | 0.88 | $ | 14.51 | 14.76x | 89.52 | % | 8.37 | % | 102.62 | % | 14.78x | $ | 0.16 | 1.23 | % | 18.18 | % | $ | 15,640 | 10.10 | % | 9.03 | % | NA | 0.61 | % | 6.12 | % | 0.61 | % | 6.11 | % | |||||||||||||||||||||||||||||||||||||||||||||
BNCL | Beneficial Bancorp, Inc. | PA | $ | 11.41 | $ | 943.78 | $ | 0.25 | NA | NM | 154.20 | % | NA | 195.25 | % | NM | NA | NA | NM | $ | 4,752 | 12.86 | % | 10.44 | % | 0.40 | % | 0.40 | % | 2.95 | % | 0.46 | % | 3.37 | % | |||||||||||||||||||||||||||||||||||||||||||||||||
CBNJ | Cape Bancorp, Inc. | NJ | $ | 8.73 | $ | 100.18 | $ | 0.53 | $ | 12.28 | 14.31x | 71.11 | % | 9.28 | % | 84.81 | % | 16.61x | $ | 0.24 | 2.75 | % | 39.34 | % | $ | 1,080 | 13.05 | % | 11.17 | % | NA | 0.62 | % | 4.80 | % | 0.54 | % | 4.14 | % | |||||||||||||||||||||||||||||||||||||||||||||
CARV | Carver Bancorp, Inc. | NY | $ | 5.90 | $ | 21.81 | ($ | 0.01 | ) | $ | 2.30 | NM | 256.19 | % | 3.64 | % | 256.19 | % | NM | $ | 0.00 | 0.00 | % | NM | $ | 644 | 8.25 | % | 8.25 | % | 3.03 | % | -0.27 | % | -3.11 | % | -0.08 | % | -0.96 | % | ||||||||||||||||||||||||||||||||||||||||||||
CSBK | Clifton Bancorp Inc. | NJ | $ | 13.57 | $ | 368.46 | $ | 0.26 | $ | 13.40 | NM | 101.26 | % | 30.74 | % | 101.26 | % | NM | $ | 0.24 | 1.77 | % | 92.31 | % | $ | 1,198 | 30.36 | % | 30.36 | % | NA | 0.54 | % | 2.09 | % | 0.54 | % | 2.07 | % | |||||||||||||||||||||||||||||||||||||||||||||
DCOM | Dime Community Bancshares, Inc. | NY | $ | 15.70 | $ | 578.62 | $ | 1.20 | $ | 12.47 | 12.76x | 125.86 | % | 12.87 | % | 143.19 | % | 13.08x | $ | 0.56 | 3.57 | % | 45.53 | % | $ | 4,497 | 10.22 | % | 9.10 | % | 0.49 | % | 1.03 | % | 9.83 | % | 1.01 | % | 9.60 | % | ||||||||||||||||||||||||||||||||||||||||||||
ESSA | ESSA Bancorp, Inc. | PA | $ | 12.22 | $ | 139.85 | NA | $ | 14.81 | 14.38x | 82.51 | % | 8.92 | % | 89.08 | % | NM | $ | 0.28 | 2.29 | % | 32.94 | % | $ | 1,568 | 10.81 | % | 10.09 | % | NA | 0.60 | % | 5.35 | % | NA | NA | ||||||||||||||||||||||||||||||||||||||||||||||||
FXCB | Fox Chase Bancorp, Inc. | PA | $ | 16.44 | $ | 194.04 | $ | 0.71 | $ | 14.90 | 23.15x | 110.30 | % | 17.73 | % | 110.30 | % | 23.15x | $ | 0.56 | 3.41 | % | 84.51 | % | $ | 1,095 | 16.07 | % | 16.07 | % | 0.90 | % | 0.76 | % | 4.63 | % | 0.76 | % | 4.63 | % | ||||||||||||||||||||||||||||||||||||||||||||
HBK | Hamilton Bancorp, Inc. | MD | $ | 12.61 | $ | 43.04 | ($ | 0.28 | ) | $ | 17.70 | NM | 71.26 | % | 14.91 | % | 74.73 | % | NM | NA | NA | NM | $ | 289 | 20.93 | % | 20.15 | % | NA | -0.25 | % | -1.24 | % | -0.31 | % | -1.55 | % | |||||||||||||||||||||||||||||||||||||||||||||||
ISBC | Investors Bancorp, Inc. | NJ | $ | 11.57 | $ | 4,142.21 | $ | 0.41 | $ | 9.99 | 30.45x | 115.77 | % | 22.06 | % | 119.81 | % | 27.89x | $ | 0.20 | 1.73 | % | 52.53 | % | $ | 18,774 | 19.06 | % | NA | 0.81 | % | 0.76 | % | 4.71 | % | 0.83 | % | 5.14 | % | |||||||||||||||||||||||||||||||||||||||||||||
MLVF | Malvern Bancorp, Inc. | PA | $ | 12.04 | $ | 78.96 | $ | 0.08 | $ | 11.88 | NM | 101.39 | % | 13.09 | % | 101.39 | % | NM | $ | 0.11 | 0.00 | % | NM | $ | 603 | 12.91 | % | 12.91 | % | 0.80 | % | 0.10 | % | 0.76 | % | 0.09 | % | 0.71 | % | |||||||||||||||||||||||||||||||||||||||||||||
NYCB | New York Community Bancorp, Inc. | NY | $ | 15.98 | $ | 7,072.54 | $ | 1.08 | $ | 13.06 | 14.66x | 122.32 | % | 14.56 | % | 211.90 | % | 14.85x | $ | 1.00 | 6.26 | % | 91.74 | % | $ | 48,559 | 11.91 | % | 7.24 | % | NA | 1.01 | % | 8.41 | % | 1.00 | % | 8.31 | % | |||||||||||||||||||||||||||||||||||||||||||||
NFBK | Northfield Bancorp, Inc. | NJ | $ | 14.76 | $ | 714.41 | $ | 0.42 | $ | 12.27 | NM | 120.29 | % | 23.65 | % | 123.73 | % | 34.91x | $ | 0.28 | 1.90 | % | 65.85 | % | $ | 3,021 | 19.66 | % | 19.22 | % | 1.29 | % | 0.73 | % | 3.07 | % | 0.75 | % | 3.17 | % | ||||||||||||||||||||||||||||||||||||||||||||
NWBI | Northwest Bancshares, Inc. | PA | $ | 11.85 | $ | 1,122.45 | $ | 0.64 | $ | 11.22 | 17.69x | 105.63 | % | 14.44 | % | 126.93 | % | 18.38x | $ | 0.56 | 4.73 | % | 228.36 | % | $ | 7,775 | 13.67 | % | 11.64 | % | 1.72 | % | 0.79 | % | 5.69 | % | 0.76 | % | 5.47 | % | ||||||||||||||||||||||||||||||||||||||||||||
OSHC | Ocean Shore Holding Co. | NJ | $ | 14.10 | $ | 90.15 | NA | $ | 16.55 | 14.39x | 85.20 | % | 8.80 | % | 91.27 | % | NM | $ | 0.24 | 1.70 | % | 24.49 | % | $ | 1,025 | 10.33 | % | NA | NA | 0.61 | % | 5.90 | % | NA | NA | |||||||||||||||||||||||||||||||||||||||||||||||||
OCFC | OceanFirst Financial Corp. | NJ | $ | 16.93 | $ | 286.14 | $ | 1.16 | $ | 12.91 | 14.23x | 131.10 | % | 12.14 | % | 131.10 | % | 14.63x | $ | 0.52 | 3.07 | % | 42.02 | % | $ | 2,357 | 9.26 | % | 9.26 | % | 1.89 | % | 0.86 | % | 9.18 | % | 0.84 | % | 8.93 | % | ||||||||||||||||||||||||||||||||||||||||||||
ONFC | Oneida Financial Corp. | NY | $ | 13.20 | $ | 92.70 | $ | 0.69 | NA | 18.08x | 97.72 | % | NA | 135.33 | % | 19.19x | $ | 0.48 | 3.64 | % | 65.75 | % | $ | 798 | 12.01 | % | 9.01 | % | NA | 0.66 | % | 5.44 | % | 0.62 | % | 5.14 | % | |||||||||||||||||||||||||||||||||||||||||||||||
ORIT | Oritani Financial Corp. | NJ | $ | 14.50 | $ | 644.59 | $ | 0.96 | $ | 11.42 | 15.10x | 126.96 | % | 19.83 | % | 126.96 | % | 15.10x | $ | 0.70 | 4.83 | % | 98.96 | % | $ | 3,251 | 15.62 | % | 15.62 | % | NA | 1.31 | % | 7.81 | % | 1.31 | % | 7.81 | % | |||||||||||||||||||||||||||||||||||||||||||||
PBHC | Pathfinder Bancorp, Inc. | NY | $ | 9.89 | $ | 43.04 | NA | $ | 12.82 | 15.70x | 77.14 | % | 7.86 | % | 83.98 | % | NM | $ | 0.12 | 1.21 | % | 13.43 | % | $ | 561 | 12.34 | % | 11.62 | % | NA | 0.52 | % | 5.89 | % | NA | NA | ||||||||||||||||||||||||||||||||||||||||||||||||
PBCP | Polonia Bancorp, Inc. | PA | $ | 10.50 | $ | 35.02 | ($ | 0.00 | ) | $ | 11.64 | NM | 90.24 | % | 11.76 | % | 90.24 | % | NM | NA | NA | NM | $ | 298 | 13.03 | % | 13.03 | % | NA | 0.00 | % | 0.02 | % | 0.00 | % | 0.02 | % | |||||||||||||||||||||||||||||||||||||||||||||||
PFS | Provident Financial Services, Inc. | NJ | $ | 18.49 | $ | 1,200.11 | $ | 1.30 | $ | 17.63 | 15.16x | 104.90 | % | 14.08 | % | 165.44 | % | 14.24x | $ | 0.64 | 3.46 | % | 50.00 | % | $ | 8,523 | 13.42 | % | NA | NA | 0.92 | % | 6.75 | % | 0.97 | % | 7.18 | % | ||||||||||||||||||||||||||||||||||||||||||||||
PBIP | Prudential Bancorp, Inc. | PA | $ | 12.23 | $ | 114.72 | NA | $ | 13.66 | NM | 89.53 | % | 21.76 | % | 89.53 | % | NM | $ | 0.12 | 0.98 | % | 45.00 | % | $ | 527 | 24.31 | % | 24.31 | % | NA | 0.37 | % | 1.51 | % | NA | NA | ||||||||||||||||||||||||||||||||||||||||||||||||
SVBI | Severn Bancorp, Inc. | MD | $ | 4.55 | $ | 45.79 | NA | $ | 5.68 | NM | 80.10 | % | 6.11 | % | 80.57 | % | NM | $ | 0.00 | 0.00 | % | NM | $ | 777 | 10.79 | % | 10.75 | % | 5.47 | % | 0.37 | % | 3.54 | % | NA | NA | ||||||||||||||||||||||||||||||||||||||||||||||||
TRST | TrustCo Bank Corp NY | NY | $ | 6.96 | $ | 660.21 | $ | 0.45 | $ | 4.15 | 14.94x | 167.80 | % | 14.21 | % | 168.04 | % | 15.45x | $ | 0.26 | 3.77 | % | 56.33 | % | $ | 4,644 | 8.47 | % | 8.46 | % | NA | 0.97 | % | 11.54 | % | 0.93 | % | 11.16 | % | |||||||||||||||||||||||||||||||||||||||||||||
WSFS | WSFS Financial Corporation | DE | $ | 79.26 | $ | 745.28 | $ | 6.29 | $ | 52.01 | 13.71x | 152.39 | % | 15.36 | % | 172.74 | % | 12.59x | $ | 0.60 | 0.76 | % | 9.34 | % | $ | 4,853 | 10.08 | % | 9.00 | % | 1.08 | % | 1.17 | % | 12.22 | % | 1.27 | % | 13.30 | % | ||||||||||||||||||||||||||||||||||||||||||||
WVFC | WVS Financial Corp. | PA | $ | 11.18 | $ | 22.93 | NA | $ | 15.52 | 21.50x | 72.04 | % | 7.78 | % | 72.04 | % | NM | $ | 0.16 | 1.43 | % | 30.77 | % | $ | 295 | 10.80 | % | 10.80 | % | NA | 0.33 | % | 3.25 | % | NA | NA | ||||||||||||||||||||||||||||||||||||||||||||||||
MHCs | ||||||||||||||||||||||||||||||||||||||||||||||||||||||||||||||||||||||||||||||||||||
GCBC | Greene County Bancorp, Inc. (MHC) | NY | $ | 29.50 | $ | 124.46 | $ | 1.59 | $ | 15.28 | 18.79x | 193.06 | % | 17.47 | % | 193.06 | % | 18.51x | $ | 0.72 | 2.44 | % | 45.54 | % | $ | 712 | 9.05 | % | 9.05 | % | NA | 0.97 | % | 10.83 | % | 0.99 | % | 10.99 | % | |||||||||||||||||||||||||||||||||||||||||||||
KRNY | Kearny Financial Corp. (MHC) | NJ | $ | 13.48 | $ | 908.22 | $ | 0.16 | $ | 7.32 | NM | 184.14 | % | 25.60 | % | 236.56 | % | NM | $ | 0.00 | 0.00 | % | NM | $ | 3,548 | 13.90 | % | 11.17 | % | NA | 0.28 | % | 2.01 | % | 0.32 | % | 2.30 | % | ||||||||||||||||||||||||||||||||||||||||||||||
LSBK | Lake Shore Bancorp, Inc. (MHC) | NY | $ | 13.50 | $ | 80.18 | NA | NA | 24.55x | 114.99 | % | NA | 114.99 | % | NM | $ | 0.28 | 2.07 | % | 50.91 | % | $ | 487 | 14.69 | % | 14.69 | % | NA | 0.65 | % | 4.58 | % | NA | NA | ||||||||||||||||||||||||||||||||||||||||||||||||||
MGYR | Magyar Bancorp, Inc. (MHC) | NJ | $ | 8.35 | $ | 48.56 | $ | 0.10 | $ | 7.94 | NM | 105.14 | % | 9.26 | % | 105.14 | % | NM | NA | NA | NM | $ | 525 | 8.80 | % | 8.80 | % | NA | 0.12 | % | 1.37 | % | 0.11 | % | 1.32 | % | ||||||||||||||||||||||||||||||||||||||||||||||||
MSBF | MSB Financial Corp. (MHC) | NJ | $ | 10.50 | $ | 52.61 | $ | 0.20 | $ | 8.21 | NM | 127.95 | % | 15.23 | % | 127.95 | % | NM | $ | 0.00 | 0.00 | % | NM | $ | 345 | 11.90 | % | 11.90 | % | 5.65 | % | 0.28 | % | 2.39 | % | 0.28 | % | 2.39 | % | |||||||||||||||||||||||||||||||||||||||||||||
NECB | NorthEast Community Bancorp, Inc. (MHC) | NY | $ | 6.91 | $ | 85.52 | $ | 0.10 | $ | 8.37 | NM | 82.57 | % | 17.03 | % | 83.42 | % | NM | $ | 0.12 | 1.74 | % | 120.00 | % | $ | 502 | 20.63 | % | 20.46 | % | 4.97 | % | 0.26 | % | 1.17 | % | 0.27 | % | 1.21 | % | ||||||||||||||||||||||||||||||||||||||||||||
Under Acquisition | ||||||||||||||||||||||||||||||||||||||||||||||||||||||||||||||||||||||||||||||||||||
CMSB | CMS Bancorp, Inc. | NY | $ | 13.17 | $ | 24.53 | $ | 0.44 | $ | 12.01 | NM | 109.64 | % | 9.02 | % | 109.64 | % | 29.70x | NA | NA | NM | $ | 273 | 8.73 | % | 8.73 | % | NA | 0.25 | % | 2.82 | % | 0.32 | % | 3.66 | % | ||||||||||||||||||||||||||||||||||||||||||||||||
COBK | Colonial Financial Services, Inc. | NJ | $ | 13.28 | $ | 51.35 | $ | 0.27 | $ | 16.27 | NM | 81.62 | % | 9.28 | % | 81.62 | % | NM | NA | NA | NM | $ | 553 | 11.36 | % | 11.36 | % | 3.74 | % | 0.18 | % | 1.64 | % | 0.18 | % | 1.61 | % | |||||||||||||||||||||||||||||||||||||||||||||||
ESBF | ESB Financial Corporation | PA | $ | 18.04 | $ | 325.24 | NA | NA | 17.69x | 155.63 | % | NA | 194.95 | % | NM | $ | 0.40 | 2.22 | % | 39.22 | % | $ | 1,939 | 11.02 | % | NA | NA | 0.94 | % | 9.10 | % | NA | NA | |||||||||||||||||||||||||||||||||||||||||||||||||||
HCBK | Hudson City Bancorp, Inc. | NJ | $ | 9.61 | $ | 5,082.81 | $ | 0.19 | $ | 9.04 | 30.03x | 106.30 | % | 13.90 | % | 109.81 | % | NM | $ | 0.16 | 1.66 | % | 50.00 | % | $ | 36,569 | 13.08 | % | 12.71 | % | NA | 0.42 | % | 3.28 | % | 0.25 | % | 1.94 | % | |||||||||||||||||||||||||||||||||||||||||||||
| (1) | Core income, on a diluted per-share basis. Core income is net income after taxes and before extraordinary items, less net income attributable to noncontrolling interest, gain on the sale of securities, amortization of intangibles, goodwill and nonrecurring items. Assumed tax rate is 35%. |
| (2) | P/E = Price to earnings; P/B = Price to book; P/A = Price to assets; P/TB = Price to tangible book value; and P/Core = Price to core earnings. P/E and P/Core =NM if the ratio is negative or above 35x. |
| (3) | Indicated 12 month dividend, based on last quarterly dividend declared. |
| (4) | Indicated 12 month dividend as a percent of trailing 12 month earnings. |
| (5) | ROAA (return on average assets) and ROAE (return on average equity) are indicated ratios based on trailing 12 month earnings and average equity and assets balances. |
| (6) | Excludes from averages and medians those companies the subject of actual or rumored acquisition activities or unusual operating characteristics. |
Source: SNL Financial, LC. and RP Financial, LC. calculations. The information provided in this report has been obtained from sources we believe are reliable, but we cannot guarantee the accuracy or completeness of such information.
Copyright (c) 2015 by RP® Financial, LC.
EXHIBIT III-3
Public Market Pricing of Northeast Thrifts
Exhibit III-3
Public Market Pricing of Northeast Thrifts
As of February 6, 2015
| Market | Per Share Data | |||||||||||||||||||||||||||||||||||||||||||||||||||||||||||||||||||||||||||||||||||
| Capitalization | Core | Book | Dividends(3) | Financial Characteristics(5) | ||||||||||||||||||||||||||||||||||||||||||||||||||||||||||||||||||||||||||||||||
| Price/ | Market | 12 Month | Value/ | Pricing Ratios(2) | Amount/ | Payout | Total | Equity/ | Tang. Eq./ | NPAs/ | Reported | Core | ||||||||||||||||||||||||||||||||||||||||||||||||||||||||||||||||||||||||
| Share | Value | EPS(1) | Share | P/E | P/B | P/A | P/TB | P/Core | Share | Yield | Ratio(4) | Assets | Assets | T. Assets | Assets | ROAA | ROAE | ROAA | ROAE | |||||||||||||||||||||||||||||||||||||||||||||||||||||||||||||||||
| ($) | ($Mil) | ($) | ($) | (x) | (%) | (%) | (%) | (x) | ($) | (%) | (%) | ($Mil) | (%) | (%) | (%) | (%) | (%) | (%) | (%) | |||||||||||||||||||||||||||||||||||||||||||||||||||||||||||||||||
All Non-MHC Public Companies(6) | ||||||||||||||||||||||||||||||||||||||||||||||||||||||||||||||||||||||||||||||||||||
Averages | $ | 16.79 | $ | 448.26 | $ | 0.96 | $ | 15.78 | 17.31x | 105.72 | % | 13.63 | % | 113.89 | % | 16.50x | $ | 0.30 | 1.81 | % | 49.60 | % | $ | 3,165 | 13.47 | % | 12.90 | % | 2.02 | % | 0.67 | % | 5.60 | % | 0.72 | % | 5.82 | % | ||||||||||||||||||||||||||||||||||||||||||||||
Median | $ | 13.88 | $ | 114.72 | $ | 0.81 | $ | 14.54 | 15.41x | 98.46 | % | 12.76 | % | 102.24 | % | 15.10x | $ | 0.24 | 1.48 | % | 40.91 | % | $ | 980 | 12.70 | % | 11.63 | % | 1.38 | % | 0.65 | % | 5.29 | % | 0.72 | % | 5.27 | % | ||||||||||||||||||||||||||||||||||||||||||||||
Comparable Group | ||||||||||||||||||||||||||||||||||||||||||||||||||||||||||||||||||||||||||||||||||||
Averages | $ | 18.52 | $ | 473.62 | $ | 0.51 | $ | 17.06 | 21.32x | 104.25 | % | 12.76 | % | 116.96 | % | 18.98x | $ | 0.34 | 1.79 | % | 59.84 | % | $ | 3,664 | 12.29 | % | 11.48 | % | 1.62 | % | 0.37 | % | 3.64 | % | 0.37 | % | 3.10 | % | ||||||||||||||||||||||||||||||||||||||||||||||
Medians | $ | 14.00 | $ | 140.29 | $ | 0.52 | $ | 14.74 | 21.74x | 98.62 | % | 12.14 | % | 105.74 | % | 19.29x | $ | 0.20 | 1.44 | % | 36.11 | % | $ | 1,343 | 11.17 | % | 10.30 | % | 1.65 | % | 0.36 | % | 3.69 | % | 0.44 | % | 4.01 | % | ||||||||||||||||||||||||||||||||||||||||||||||
Comparable Group | ||||||||||||||||||||||||||||||||||||||||||||||||||||||||||||||||||||||||||||||||||||
BHBK | Blue Hills Bancorp, Inc. | MA | $ | 13.24 | $ | 376.90 | NA | $ | 14.46 | NM | 91.57 | % | 21.81 | % | 94.65 | % | NM | NA | NA | NM | $ | 1,728 | 23.82 | % | 23.22 | % | 0.27 | % | -0.01 | % | -0.07 | % | 0.26 | % | 1.47 | % | ||||||||||||||||||||||||||||||||||||||||||||||||
BLMT | BSB Bancorp, Inc. | MA | $ | 18.79 | $ | 170.30 | $ | 0.41 | $ | 14.91 | NM | 126.02 | % | 12.75 | % | 126.02 | % | NM | NA | NA | NM | $ | 1,336 | 10.12 | % | 10.12 | % | 0.66 | % | 0.31 | % | 2.73 | % | 0.31 | % | 2.73 | % | |||||||||||||||||||||||||||||||||||||||||||||||
CBNK | Chicopee Bancorp, Inc. | MA | $ | 16.49 | $ | 86.91 | ($ | 0.11 | ) | $ | 16.72 | NM | 98.62 | % | 13.60 | % | 98.62 | % | NM | $ | 0.28 | 1.70 | % | NM | $ | 639 | 13.79 | % | 13.79 | % | 1.92 | % | -0.10 | % | -0.64 | % | -0.10 | % | -0.66 | % | ||||||||||||||||||||||||||||||||||||||||||||
CWAY | Coastway Bancorp, Inc. | RI | $ | 11.11 | $ | 54.99 | NA | $ | 14.22 | NM | 78.11 | % | 12.18 | % | 78.11 | % | NM | NA | NA | NM | $ | 451 | 15.59 | % | 15.59 | % | 3.61 | % | -0.29 | % | -2.09 | % | -0.05 | % | -0.38 | % | ||||||||||||||||||||||||||||||||||||||||||||||||
FBNK | First Connecticut Bancorp, Inc. | CT | $ | 15.41 | $ | 246.97 | $ | 0.62 | $ | 14.57 | 24.85x | 105.74 | % | 9.94 | % | 105.74 | % | 24.85x | $ | 0.20 | 1.30 | % | 27.42 | % | $ | 2,484 | 9.40 | % | 9.40 | % | NA | 0.41 | % | 3.98 | % | 0.41 | % | 3.98 | % | |||||||||||||||||||||||||||||||||||||||||||||
GTWN | Georgetown Bancorp, Inc. | MA | $ | 17.95 | $ | 32.80 | $ | 0.85 | $ | 16.81 | 21.12x | 106.79 | % | 12.10 | % | 106.79 | % | 21.12x | $ | 0.17 | 0.95 | % | 20.00 | % | $ | 271 | 11.33 | % | 11.33 | % | NA | 0.55 | % | 5.04 | % | 0.55 | % | 5.04 | % | |||||||||||||||||||||||||||||||||||||||||||||
HIFS | Hingham Institution for Savings | MA | $ | 88.00 | $ | 187.33 | NA | $ | 57.08 | 8.43x | 154.16 | % | 12.07 | % | 154.16 | % | NM | $ | 1.12 | 1.27 | % | 20.11 | % | $ | 1,552 | 7.83 | % | 7.83 | % | NA | 1.52 | % | 19.30 | % | NA | NA | ||||||||||||||||||||||||||||||||||||||||||||||||
MELR | Melrose Bancorp, Inc. | MA | $ | 13.29 | $ | 37.61 | NA | NA | NM | NA | NA | NA | NM | NA | NA | NM | $ | 213 | 10.17 | % | 10.17 | % | NA | NA | NA | NA | NA | |||||||||||||||||||||||||||||||||||||||||||||||||||||||||
EBSB | Meridian Bancorp, Inc. | MA | $ | 12.37 | $ | 676.74 | $ | 0.34 | $ | 10.56 | 29.45x | 117.14 | % | 20.64 | % | 119.98 | % | NM | NA | NA | NM | $ | 3,279 | 17.62 | % | 17.28 | % | NA | 0.75 | % | 5.69 | % | 0.61 | % | 4.65 | % | ||||||||||||||||||||||||||||||||||||||||||||||||
NVSL | Naugatuck Valley Financial Corporation | CT | $ | 8.80 | $ | 61.62 | ($ | 0.25 | ) | $ | 8.49 | NM | 103.68 | % | 12.60 | % | 103.68 | % | NM | $ | 0.00 | 0.00 | % | NM | $ | 489 | 12.15 | % | 12.15 | % | 1.65 | % | -0.42 | % | -3.54 | % | -0.34 | % | -2.90 | % | ||||||||||||||||||||||||||||||||||||||||||||
NHTB | New Hampshire Thrift Bancshares, Inc. | NH | $ | 15.42 | $ | 127.34 | $ | 1.25 | $ | 15.96 | 12.96x | 96.59 | % | 8.51 | % | 163.41 | % | 12.31x | $ | 0.52 | 3.37 | % | 43.70 | % | $ | 1,504 | 9.30 | % | 5.93 | % | NA | 0.68 | % | 6.81 | % | 0.72 | % | 7.16 | % | |||||||||||||||||||||||||||||||||||||||||||||
PBCT | People’s United Financial, Inc. | CT | $ | 14.71 | $ | 4,527.74 | $ | 0.84 | $ | 15.05 | 17.51x | 97.73 | % | 12.58 | % | 178.92 | % | 17.46x | $ | 0.66 | 4.49 | % | 78.57 | % | $ | 35,997 | 12.87 | % | 7.47 | % | NA | 0.75 | % | 5.44 | % | 0.75 | % | 5.46 | % | |||||||||||||||||||||||||||||||||||||||||||||
SIFI | SI Financial Group, Inc. | CT | $ | 11.13 | $ | 142.16 | NA | $ | 12.35 | 30.92x | 90.12 | % | 10.53 | % | 102.24 | % | NM | $ | 0.16 | 1.44 | % | 36.11 | % | $ | 1,351 | 11.68 | % | 10.44 | % | NA | 0.33 | % | 2.82 | % | NA | NA | ||||||||||||||||||||||||||||||||||||||||||||||||
UBNK | United Financial Bancorp, Inc. | CT | $ | 12.98 | $ | 662.93 | $ | 0.83 | NA | NM | 104.88 | % | NA | 129.53 | % | 15.62x | $ | 0.40 | 3.08 | % | 250.00 | % | $ | 5,477 | 11.00 | % | 8.93 | % | NA | 0.16 | % | 1.28 | % | 0.82 | % | 6.64 | % | |||||||||||||||||||||||||||||||||||||||||||||||
WEBK | Wellesley Bancorp, Inc. | MA | $ | 19.17 | $ | 47.13 | NA | $ | 20.07 | 24.90x | 95.52 | % | 8.81 | % | 95.52 | % | NM | $ | 0.10 | 0.52 | % | 9.74 | % | $ | 535 | 9.22 | % | 9.22 | % | NA | 0.36 | % | 3.69 | % | NA | NA | ||||||||||||||||||||||||||||||||||||||||||||||||
WFD | Westfield Financial, Inc. | MA | $ | 7.39 | $ | 138.42 | $ | 0.33 | $ | 7.61 | 21.74x | 97.11 | % | 10.49 | % | 97.11 | % | 22.49x | $ | 0.12 | 1.62 | % | 52.94 | % | $ | 1,320 | 10.80 | % | 10.80 | % | NA | 0.48 | % | 4.18 | % | 0.46 | % | 4.04 | % | |||||||||||||||||||||||||||||||||||||||||||||
MHCs | ||||||||||||||||||||||||||||||||||||||||||||||||||||||||||||||||||||||||||||||||||||
PSBH | PSB Holdings, Inc. (MHC) | CT | $ | 7.48 | $ | 48.94 | $ | 0.20 | $ | 7.93 | NM | 94.35 | % | 10.37 | % | 108.85 | % | NM | $ | 0.12 | 1.60 | % | 16.67 | % | $ | 472 | 10.99 | % | 9.67 | % | NA | 0.23 | % | 2.08 | % | 0.26 | % | 2.33 | % | |||||||||||||||||||||||||||||||||||||||||||||
Under Acquisition | ||||||||||||||||||||||||||||||||||||||||||||||||||||||||||||||||||||||||||||||||||||
HBNK | Hampden Bancorp, Inc. | MA | $ | 20.81 | $ | 115.59 | $ | 0.79 | $ | 15.47 | 31.06x | 134.52 | % | 16.22 | % | 134.52 | % | 26.26x | $ | 0.32 | 1.54 | % | 44.78 | % | $ | 711 | 12.05 | % | 12.05 | % | NA | 0.51 | % | 4.20 | % | 0.61 | % | 5.01 | % | |||||||||||||||||||||||||||||||||||||||||||||
PEOP | Peoples Federal Bancshares, Inc. | MA | $ | 21.91 | $ | 136.71 | $ | 0.30 | $ | 16.74 | NM | 130.86 | % | 22.90 | % | 130.86 | % | NM | $ | 0.20 | 0.91 | % | 117.65 | % | $ | 597 | 17.50 | % | 17.50 | % | NA | 0.17 | % | 1.01 | % | 0.28 | % | 1.62 | % | |||||||||||||||||||||||||||||||||||||||||||||
| (1) | Core income, on a diluted per-share basis. Core income is net income after taxes and before extraordinary items, less net income attributable to noncontrolling interest, gain on the sale of securities, amortization of intangibles, goodwill and nonrecurring items. Assumed tax rate is 35%. |
| (2) | P/E = Price to earnings; P/B = Price to book; P/A = Price to assets; P/TB = Price to tangible book value; and P/Core = Price to core earnings. P/E and P/Core =NM if the ratio is negative or above 35x. |
| (3) | Indicated 12 month dividend, based on last quarterly dividend declared. |
| (4) | Indicated 12 month dividend as a percent of trailing 12 month earnings. |
| (5) | ROAA (return on average assets) and ROAE (return on average equity) are indicated ratios based on trailing 12 month earnings and average equity and assets balances. |
| (6) | Excludes from averages and medians those companies the subject of actual or rumored acquisition activities or unusual operating characteristics. |
Source: SNL Financial, LC. and RP Financial, LC. calculations. The information provided in this report has been obtained from sources we believe are reliable, but we cannot guarantee the accuracy or completeness of such information.
Copyright (c) 2015 by RP® Financial, LC.
EXHIBIT III-4
Peer Group Market Area Comparative Analysis
Exhibit III-4
Peer Group Market Area Comparative Analysis
| Proj. | Per Capita Income | Deposit | ||||||||||||||||||||||||||||||||
| Population | Pop. | 2010-2014 | 2014-2019 | 2014 | % State | Market | ||||||||||||||||||||||||||||
Institution | County | 2010 | 2014 | 2019 | % Change | % Change | Amount | Average | Share(1) | |||||||||||||||||||||||||
Alliance Bancorp, Inc. - PA | Delaware | 558,979 | 562,633 | 567,680 | 0.2 | % | 0.2 | % | 33,481 | 116.7 | % | 2.88 | % | |||||||||||||||||||||
Cape Bancorp, Inc. - NJ | Cape May | 97,265 | 95,738 | 94,705 | -0.4 | % | -0.2 | % | 30,695 | 87.4 | % | 13.29 | % | |||||||||||||||||||||
Fox Chase Bancorp, Inc. - PA | Montgomery | 799,874 | 813,379 | 828,002 | 0.4 | % | 0.4 | % | 41,062 | 143.1 | % | 1.25 | % | |||||||||||||||||||||
Georgetown Bancorp, Inc. - MA | Essex | 743,159 | 762,929 | 787,929 | 0.7 | % | 0.6 | % | 34,967 | 97.0 | % | 0.98 | % | |||||||||||||||||||||
Malvern Bancorp, Inc. - PA | Chester | 498,886 | 511,036 | 523,609 | 0.6 | % | 0.5 | % | 40,831 | 142.3 | % | 3.59 | % | |||||||||||||||||||||
Ocean Shore Holding Co. - NJ | Cape May | 97,265 | 95,738 | 94,705 | -0.4 | % | -0.2 | % | 30,695 | 87.4 | % | 9.38 | % | |||||||||||||||||||||
Oneida Financial Corp. - NY | Madison | 73,442 | 71,624 | 70,186 | -0.6 | % | -0.4 | % | 27,178 | 84.9 | % | 63.92 | % | |||||||||||||||||||||
Prudential Bancorp, Inc. - PA | Philadelphia | 1,526,006 | 1,560,706 | 1,597,398 | 0.6 | % | 0.5 | % | 21,411 | 74.6 | % | 0.91 | % | |||||||||||||||||||||
Severn Bancorp, Inc. - MD | Anne Arundel | 537,656 | 558,700 | 584,969 | 1.0 | % | 0.9 | % | 42,752 | 114.6 | % | 4.92 | % | |||||||||||||||||||||
Wellesley Bancorp, Inc. - MA | Norfolk | 670,850 | 688,231 | 710,338 | 0.6 | % | 0.6 | % | 44,883 | 124.6 | % | 1.77 | % | |||||||||||||||||||||
WVS Financial Corp. - PA | Allegheny | 1,223,348 | 1,232,037 | 1,242,628 | 0.2 | % | 0.2 | % | 32,273 | 112.5 | % | 0.15 | % | |||||||||||||||||||||
Averages: | 620,612 | 632,068 | 645,650 | 0.3 | % | 0.3 | % | 34,566 | 107.7 | % | 9.37 | % | ||||||||||||||||||||||
Medians: | 558,979 | 562,633 | 584,969 | 0.4 | % | 0.4 | % | 33,481 | 112.5 | % | 2.88 | % | ||||||||||||||||||||||
MSB Financial Corp. - NJ | Morris | 492,276 | 501,149 | 511,664 | 0.4 | % | 0.4 | % | 46,181 | 131.4 | % | 0.62 | % | |||||||||||||||||||||
| (1) | Total institution deposits in headquarters county as percent of total county deposits as of June 30, 2014. |
Sources: SNL Financial LC, FDIC.
EXHIBIT IV-1
Stock Prices:
As of February 6, 2015
RP® Financial, LC.
Exhibit IV-1A
Weekly Thrift Market Line - Part One
Prices As of February 6, 2015
| Market Capitalization | Price Change Data | Current Per Share Financials | ||||||||||||||||||||||||||||||||||||||||||||||||||||||||||
| Price/ | Shares | Market | 52 Week (1) | % Change From | LTM | LTM Core | BV/ | TBV/ | Assets/ | |||||||||||||||||||||||||||||||||||||||||||||||||||
| Share(1) | Outstanding | Capitalization | High | Low | Last Wk | Last Wk | 52 Wks (2) | MRY (2) | EPS (3) | EPS (3) | Share | Share (4) | Share | |||||||||||||||||||||||||||||||||||||||||||||||
| ($) | (000) | ($Mil) | ($) | ($) | ($) | (%) | (%) | (%) | ($) | ($) | ($) | ($) | ($) | |||||||||||||||||||||||||||||||||||||||||||||||
Companies | ||||||||||||||||||||||||||||||||||||||||||||||||||||||||||||
ALLB | Alliance Bancorp, Inc. of Pennsylvania | PA | 17.00 | 4,027 | 68.5 | 18.41 | 15.10 | 17.50 | -2.86 | 10.75 | -7.66 | 0.48 | 0.48 | 16.30 | 16.30 | 105.15 | ||||||||||||||||||||||||||||||||||||||||||||
ANCB | Anchor Bancorp | WA | 21.90 | 2,550 | 55.8 | 23.00 | 16.98 | 21.49 | 1.91 | 28.82 | 7.35 | 3.88 | 3.87 | 24.59 | 24.59 | 148.02 | ||||||||||||||||||||||||||||||||||||||||||||
ABCW | Anchor BanCorp Wisconsin Inc. | WI | 32.98 | 9,546 | 314.8 | 37.96 | 28.00 | 33.50 | -1.55 | NA | -4.24 | 1.60 | NA | 23.85 | 23.85 | 218.15 | ||||||||||||||||||||||||||||||||||||||||||||
ASBB | ASB Bancorp, Inc. | NC | 19.55 | 4,378 | 85.6 | 21.96 | 17.25 | 19.79 | -1.21 | 11.78 | -9.07 | 0.59 | 0.56 | 21.56 | 21.56 | 173.59 | ||||||||||||||||||||||||||||||||||||||||||||
AF | Astoria Financial Corporation | NY | 12.99 | 99,940 | 1,298.2 | 14.67 | 11.96 | 12.23 | 6.21 | 2.77 | -2.77 | 0.88 | 0.88 | 14.51 | 12.66 | 156.49 | ||||||||||||||||||||||||||||||||||||||||||||
AFCB | Athens Bancshares Corporation | TN | 24.77 | 1,802 | 44.6 | 30.50 | 19.00 | 24.50 | 1.10 | 25.10 | -2.48 | 1.52 | NA | NA | NA | 167.84 | ||||||||||||||||||||||||||||||||||||||||||||
ACFC | Atlantic Coast Financial Corporation | FL | 3.92 | 15,509 | 60.8 | 4.49 | 3.60 | 3.88 | 1.03 | 0.26 | -1.26 | 0.09 | 0.08 | NA | NA | 45.55 | ||||||||||||||||||||||||||||||||||||||||||||
BKMU | Bank Mutual Corporation | WI | 7.00 | 46,568 | 326.0 | 7.02 | 5.74 | 6.37 | 9.89 | 9.38 | 2.04 | 0.31 | NA | 6.03 | 6.03 | 50.00 | ||||||||||||||||||||||||||||||||||||||||||||
BFIN | BankFinancial Corporation | IL | 11.73 | 21,102 | 247.5 | 12.17 | 9.20 | 11.31 | 3.71 | 26.40 | -1.10 | 2.01 | 2.03 | 10.24 | 10.15 | 69.44 | ||||||||||||||||||||||||||||||||||||||||||||
BNCL | Beneficial Bancorp, Inc. | PA | 11.41 | 82,715 | 943.8 | 13.05 | 10.38 | 10.79 | 5.75 | 8.75 | 2.28 | 0.22 | 0.25 | NA | NA | 57.44 | ||||||||||||||||||||||||||||||||||||||||||||
BHBK | Blue Hills Bancorp, Inc. | MA | 13.24 | 28,467 | 376.9 | 13.74 | 11.25 | 13.29 | -0.38 | NA | -2.50 | NA | NA | 14.46 | 13.99 | 60.71 | ||||||||||||||||||||||||||||||||||||||||||||
BOFI | BofI Holding, Inc. | CA | 88.99 | 15,077 | 1,341.7 | 106.55 | 64.62 | 84.36 | 5.49 | 13.61 | 14.37 | 4.55 | 4.65 | 29.65 | 29.65 | 344.56 | ||||||||||||||||||||||||||||||||||||||||||||
BYFC | Broadway Financial Corporation | CA | 1.15 | 29,077 | 33.4 | 2.95 | 1.00 | 1.12 | 2.36 | 6.48 | -12.21 | 0.09 | 0.09 | 1.36 | 1.36 | 11.62 | ||||||||||||||||||||||||||||||||||||||||||||
BLMT | BSB Bancorp, Inc. | MA | 18.79 | 9,063 | 170.3 | 19.35 | 15.20 | 18.72 | 0.37 | 21.70 | 0.86 | 0.41 | 0.41 | 14.91 | 14.91 | 147.38 | ||||||||||||||||||||||||||||||||||||||||||||
CBNJ | Cape Bancorp, Inc. | NJ | 8.73 | 11,475 | 100.2 | 11.26 | 8.62 | 8.63 | 1.16 | -14.58 | -7.23 | 0.61 | 0.53 | 12.28 | 10.29 | 94.11 | ||||||||||||||||||||||||||||||||||||||||||||
CFFN | Capitol Federal Financial, Inc. | KS | 12.72 | 140,653 | 1,789.1 | 13.12 | 11.61 | 12.46 | 2.09 | 7.52 | -0.47 | 0.58 | 0.58 | 10.42 | 10.42 | 64.39 | ||||||||||||||||||||||||||||||||||||||||||||
CARV | Carver Bancorp, Inc. | NY | 5.90 | 3,696 | 21.8 | 16.68 | 5.12 | 6.18 | -4.53 | -52.99 | -5.60 | -0.32 | -0.01 | 2.30 | 2.30 | 174.27 | ||||||||||||||||||||||||||||||||||||||||||||
CFBK | Central Federal Corporation | OH | 1.28 | 15,824 | 20.3 | 1.78 | 1.18 | 1.25 | 2.40 | -11.10 | 4.92 | 0.05 | 0.01 | 1.45 | 1.45 | 19.44 | ||||||||||||||||||||||||||||||||||||||||||||
CHFN | Charter Financial Corporation | GA | 11.50 | 16,963 | 195.1 | 11.64 | 10.02 | 11.20 | 2.68 | 9.32 | 0.44 | 0.32 | 0.33 | 12.57 | 12.29 | 57.76 | ||||||||||||||||||||||||||||||||||||||||||||
CHEV | Cheviot Financial Corp. | OH | 14.35 | 6,719 | 96.4 | 14.40 | 10.12 | 13.40 | 7.09 | 41.10 | 0.99 | 0.47 | 0.36 | 14.32 | NA | 85.02 | ||||||||||||||||||||||||||||||||||||||||||||
CBNK | Chicopee Bancorp, Inc. | MA | 16.49 | 5,271 | 86.9 | 17.96 | 13.56 | 16.73 | -1.43 | -4.68 | -1.55 | -0.11 | -0.11 | 16.72 | 16.72 | 121.28 | ||||||||||||||||||||||||||||||||||||||||||||
CSBK | Clifton Bancorp Inc. | NJ | 13.57 | 27,152 | 368.5 | 13.78 | 11.29 | 13.26 | 2.34 | 3.24 | -0.15 | 0.26 | 0.26 | 13.40 | 13.40 | 44.13 | ||||||||||||||||||||||||||||||||||||||||||||
CWAY | Coastway Bancorp, Inc. | RI | 11.11 | 4,949 | 55.0 | 11.89 | 10.12 | 11.05 | 0.54 | 8.39 | -4.39 | NA | NA | 14.22 | 14.22 | 91.22 | ||||||||||||||||||||||||||||||||||||||||||||
DCOM | Dime Community Bancshares, Inc. | NY | 15.70 | 36,855 | 578.6 | 18.23 | 14.02 | 14.76 | 6.37 | 1.23 | -3.56 | 1.23 | 1.20 | 12.47 | 10.96 | 122.02 | ||||||||||||||||||||||||||||||||||||||||||||
ENFC | Entegra Financial Corp. | NC | 15.47 | 6,546 | 101.3 | 15.50 | 12.60 | 15.46 | 0.06 | NA | 7.51 | 0.91 | NA | 16.39 | 16.39 | 138.04 | ||||||||||||||||||||||||||||||||||||||||||||
ESSA | ESSA Bancorp, Inc. | PA | 12.22 | 11,444 | 139.9 | 12.55 | 10.20 | 12.15 | 0.58 | 10.99 | 1.83 | 0.85 | NA | 14.81 | 13.72 | 136.99 | ||||||||||||||||||||||||||||||||||||||||||||
EVER | EverBank Financial Corp | FL | 18.15 | 123,679 | 2,244.8 | 20.61 | 16.40 | 17.45 | 4.01 | 9.40 | -4.77 | 1.10 | NA | 12.92 | 12.51 | 174.79 | ||||||||||||||||||||||||||||||||||||||||||||
FCAP | First Capital, Inc. | IN | 23.58 | 2,741 | 64.6 | 24.95 | 20.00 | 23.57 | 0.04 | 16.16 | -3.12 | 2.03 | NA | NA | NA | 172.51 | ||||||||||||||||||||||||||||||||||||||||||||
FBNK | First Connecticut Bancorp, Inc. | CT | 15.41 | 16,026 | 247.0 | 16.75 | 14.23 | 14.75 | 4.47 | -0.64 | -5.58 | 0.62 | 0.62 | 14.57 | 14.57 | 155.02 | ||||||||||||||||||||||||||||||||||||||||||||
FDEF | First Defiance Financial Corp. | OH | 32.22 | 9,209 | 296.7 | 35.70 | 25.18 | 30.46 | 5.78 | 27.81 | -5.40 | 2.38 | 2.38 | 30.21 | 23.29 | 236.61 | ||||||||||||||||||||||||||||||||||||||||||||
FFNM | First Federal of Northern Michigan Bancorp, Inc. | MI | 5.55 | 3,727 | 20.7 | 6.30 | 4.69 | 5.90 | -5.93 | 6.73 | 1.09 | 0.52 | NA | 8.04 | 7.68 | 83.69 | ||||||||||||||||||||||||||||||||||||||||||||
FFNW | First Financial Northwest, Inc. | WA | 12.57 | 15,167 | 190.7 | 12.60 | 9.93 | 11.99 | 4.84 | 22.63 | 4.40 | 0.71 | 0.71 | 11.96 | 11.96 | 61.78 | ||||||||||||||||||||||||||||||||||||||||||||
FNWB | First Northwest Bancorp | WA | 12.49 | 13,100 | 163.6 | 12.50 | 11.75 | 12.18 | 2.55 | NA | NA | NA | NA | NA | NA | 70.54 | ||||||||||||||||||||||||||||||||||||||||||||
FBC | Flagstar Bancorp, Inc. | MI | 14.85 | 56,332 | 836.5 | 22.88 | 14.12 | 14.21 | 4.50 | -28.09 | -5.59 | -1.72 | NA | 19.64 | 19.64 | 174.68 | ||||||||||||||||||||||||||||||||||||||||||||
FXCB | Fox Chase Bancorp, Inc. | PA | 16.44 | 11,803 | 194.0 | 17.46 | 15.68 | 16.24 | 1.23 | -3.35 | -1.38 | 0.71 | 0.71 | 14.90 | 14.90 | 92.74 | ||||||||||||||||||||||||||||||||||||||||||||
FSBW | FS Bancorp, Inc. | WA | 18.90 | 3,236 | 61.1 | 18.99 | 15.50 | 18.50 | 2.15 | 12.02 | 3.55 | 1.52 | 1.53 | 20.35 | 20.35 | 157.54 | ||||||||||||||||||||||||||||||||||||||||||||
GTWN | Georgetown Bancorp, Inc. | MA | 17.95 | 1,827 | 32.8 | 18.56 | 14.08 | 17.38 | 3.31 | 20.88 | 9.12 | 0.85 | 0.85 | 16.81 | 16.81 | 148.33 | ||||||||||||||||||||||||||||||||||||||||||||
HBK | Hamilton Bancorp, Inc. | MD | 12.61 | 3,413 | 43.0 | 14.48 | 10.04 | 12.75 | -1.09 | -6.52 | -2.99 | -0.22 | -0.28 | 17.70 | 16.88 | 84.57 | ||||||||||||||||||||||||||||||||||||||||||||
HFFC | HF Financial Corp. | SD | 14.60 | 7,054 | 103.0 | 15.00 | 12.92 | 14.50 | 0.69 | 9.06 | 4.66 | 0.63 | 1.00 | 14.44 | 13.76 | 179.05 | ||||||||||||||||||||||||||||||||||||||||||||
HIFS | Hingham Institution for Savings | MA | 88.00 | 2,129 | 187.3 | 90.77 | 66.12 | 87.00 | 1.15 | 13.56 | 1.14 | 10.44 | NA | 57.08 | 57.08 | 729.16 | ||||||||||||||||||||||||||||||||||||||||||||
HMNF | HMN Financial, Inc. | MN | 12.12 | 4,470 | 54.2 | 13.95 | 8.94 | 12.25 | -1.06 | 14.34 | -2.26 | 1.23 | 1.23 | 14.77 | 14.77 | 129.17 | ||||||||||||||||||||||||||||||||||||||||||||
HBCP | Home Bancorp, Inc. | LA | 21.67 | 7,123 | 154.4 | 23.23 | 19.12 | 21.78 | -0.51 | 11.64 | -5.54 | 1.42 | 1.63 | 21.64 | NA | 171.46 | ||||||||||||||||||||||||||||||||||||||||||||
HFBL | Home Federal Bancorp, Inc. of Louisiana | LA | 19.41 | 2,191 | 42.5 | 20.30 | 17.52 | 19.20 | 1.09 | 9.35 | -0.61 | 1.48 | 1.44 | 19.76 | 19.76 | 158.07 | ||||||||||||||||||||||||||||||||||||||||||||
HMST | HomeStreet, Inc. | WA | 17.65 | 14,857 | 262.2 | 19.89 | 15.95 | 17.66 | -0.06 | 0.06 | 1.38 | 1.49 | 1.52 | 20.34 | 19.39 | 237.95 | ||||||||||||||||||||||||||||||||||||||||||||
IROQ | IF Bancorp, Inc. | IL | 16.70 | 4,339 | 72.5 | 17.49 | 15.90 | 16.65 | 0.30 | 1.21 | -1.24 | 0.85 | NA | 19.29 | 19.29 | 126.72 | ||||||||||||||||||||||||||||||||||||||||||||
ISBC | Investors Bancorp, Inc. | NJ | 11.57 | 358,013 | 4,142.2 | 11.74 | 9.79 | 11.01 | 5.09 | 17.40 | 3.07 | 0.38 | 0.41 | 9.99 | NA | 52.44 | ||||||||||||||||||||||||||||||||||||||||||||
JXSB | Jacksonville Bancorp, Inc. | IL | 22.50 | 1,799 | 40.5 | 24.00 | 19.70 | 22.14 | 1.63 | 13.87 | -2.17 | 1.65 | 1.50 | 25.02 | 23.50 | 173.42 | ||||||||||||||||||||||||||||||||||||||||||||
LPSB | La Porte Bancorp, Inc. | IN | 12.60 | 5,674 | 71.5 | 13.15 | 10.63 | 12.16 | 3.62 | 16.13 | 0.88 | 0.81 | 0.81 | 14.52 | 13.00 | 91.40 | ||||||||||||||||||||||||||||||||||||||||||||
LABC | Louisiana Bancorp, Inc. | LA | 20.66 | 2,901 | 59.9 | 24.10 | 18.20 | 21.36 | -3.28 | 11.74 | -7.97 | 1.06 | 1.06 | 20.13 | 20.13 | 114.91 | ||||||||||||||||||||||||||||||||||||||||||||
MCBK | Madison County Financial, Inc. | NE | 19.75 | 3,032 | 59.9 | 23.00 | 16.74 | 19.75 | 0.00 | 14.83 | 2.12 | 1.02 | 1.05 | 20.35 | 20.01 | 99.56 | ||||||||||||||||||||||||||||||||||||||||||||
MLVF | Malvern Bancorp, Inc. | PA | 12.04 | 6,558 | 79.0 | 13.00 | 10.13 | 11.95 | 0.75 | 15.22 | -0.41 | 0.09 | 0.08 | 11.88 | 11.88 | 91.97 | ||||||||||||||||||||||||||||||||||||||||||||
MELR | Melrose Bancorp, Inc. | MA | 13.29 | 2,830 | 37.6 | 14.12 | 12.75 | 13.10 | 1.45 | NA | 0.38 | NA | NA | NA | NA | 75.17 | ||||||||||||||||||||||||||||||||||||||||||||
EBSB | Meridian Bancorp, Inc. | MA | 12.37 | 54,708 | 676.7 | 12.73 | 9.39 | 11.61 | 6.55 | 28.77 | 10.25 | 0.42 | 0.34 | 10.56 | 10.31 | 59.93 | ||||||||||||||||||||||||||||||||||||||||||||
CASH | Meta Financial Group, Inc. | SD | 34.37 | 6,421 | 220.7 | 46.38 | 32.02 | 33.47 | 2.69 | -11.42 | -1.91 | 2.46 | 2.75 | 29.57 | 25.98 | 328.30 | ||||||||||||||||||||||||||||||||||||||||||||
NVSL | Naugatuck Valley Financial Corporation | CT | 8.80 | 7,002 | 61.6 | 9.24 | 7.10 | 8.60 | 2.33 | 23.94 | 2.80 | -0.31 | -0.25 | 8.49 | 8.49 | 69.85 | ||||||||||||||||||||||||||||||||||||||||||||
NHTB | New Hampshire Thrift Bancshares, Inc. | NH | 15.42 | 8,258 | 127.3 | 16.12 | 14.05 | 15.17 | 1.65 | 3.41 | -1.28 | 1.19 | 1.25 | 15.96 | 9.44 | 182.10 | ||||||||||||||||||||||||||||||||||||||||||||
NYCB | New York Community Bancorp, Inc. | NY | 15.98 | 442,587 | 7,072.5 | 16.58 | 13.75 | 15.45 | 3.43 | 4.10 | -0.13 | 1.09 | 1.08 | 13.06 | 7.54 | 109.72 | ||||||||||||||||||||||||||||||||||||||||||||
NFBK | Northfield Bancorp, Inc. | NJ | 14.76 | 48,402 | 714.4 | 15.15 | 12.29 | 14.40 | 2.50 | 18.36 | -0.27 | 0.41 | 0.42 | 12.27 | 11.93 | 62.41 | ||||||||||||||||||||||||||||||||||||||||||||
NWBI | Northwest Bancshares, Inc. | PA | 11.85 | 94,721 | 1,122.4 | 15.11 | 11.73 | 11.80 | 0.42 | -14.87 | -5.43 | 0.67 | 0.64 | 11.22 | 9.34 | 82.08 | ||||||||||||||||||||||||||||||||||||||||||||
OSHC | Ocean Shore Holding Co. | NJ | 14.10 | 6,393 | 90.1 | 15.00 | 13.63 | 14.15 | -0.35 | 1.81 | -1.54 | 0.98 | NA | 16.55 | NA | 160.28 | ||||||||||||||||||||||||||||||||||||||||||||
OCFC | OceanFirst Financial Corp. | NJ | 16.93 | 16,902 | 286.1 | 19.00 | 13.94 | 16.20 | 4.51 | -1.91 | -1.23 | 1.19 | 1.16 | 12.91 | 12.91 | 139.44 | ||||||||||||||||||||||||||||||||||||||||||||
ONFC | Oneida Financial Corp. | NY | 13.20 | 7,022 | 92.7 | 13.85 | 12.12 | 13.17 | 0.24 | 7.14 | 1.54 | 0.73 | 0.69 | NA | NA | 113.66 | ||||||||||||||||||||||||||||||||||||||||||||
ORIT | Oritani Financial Corp. | NJ | 14.50 | 44,454 | 644.6 | 16.84 | 13.69 | 14.11 | 2.76 | -4.29 | -5.84 | 0.96 | 0.96 | 11.42 | 11.42 | 73.13 | ||||||||||||||||||||||||||||||||||||||||||||
PBHC | Pathfinder Bancorp, Inc. | NY | 9.89 | 4,352 | 43.0 | 10.20 | 8.50 | 9.88 | 0.10 | 13.05 | 0.92 | 0.63 | NA | 12.82 | 11.78 | 128.92 | ||||||||||||||||||||||||||||||||||||||||||||
PBCT | People’s United Financial, Inc. | CT | 14.71 | 307,800 | 4,527.7 | 15.50 | 13.61 | 14.07 | 4.55 | 5.83 | -3.10 | 0.84 | 0.84 | 15.05 | 8.22 | 116.95 | ||||||||||||||||||||||||||||||||||||||||||||
PBSK | Poage Bankshares, Inc. | KY | 14.99 | 3,882 | 58.2 | 16.60 | 12.46 | 14.85 | 0.94 | 7.22 | 0.81 | 0.20 | 0.48 | 17.21 | 16.63 | 106.07 | ||||||||||||||||||||||||||||||||||||||||||||
PBCP | Polonia Bancorp, Inc. | PA | 10.50 | 3,336 | 35.0 | 10.91 | 8.80 | 10.50 | 0.00 | 6.60 | 0.48 | 0.00 | 0.00 | 11.64 | 11.64 | 89.30 | ||||||||||||||||||||||||||||||||||||||||||||
PROV | Provident Financial Holdings, Inc. | CA | 15.80 | 8,995 | 142.1 | 16.18 | 13.75 | 15.52 | 1.80 | 7.85 | 4.43 | 0.86 | 0.86 | 16.05 | 16.05 | 123.67 | ||||||||||||||||||||||||||||||||||||||||||||
PFS | Provident Financial Services, Inc. | NJ | 18.49 | 64,906 | 1,200.1 | 19.28 | 16.06 | 17.36 | 6.51 | 11.79 | 2.38 | 1.22 | 1.30 | 17.63 | NA | 131.32 | ||||||||||||||||||||||||||||||||||||||||||||
PBIP | Prudential Bancorp, Inc. | PA | 12.23 | 9,380 | 114.7 | 12.50 | 10.45 | 12.17 | 0.53 | 15.92 | -2.16 | 0.20 | NA | 13.66 | 13.66 | 56.19 | ||||||||||||||||||||||||||||||||||||||||||||
PULB | Pulaski Financial Corp. | MO | 11.76 | 12,064 | 141.9 | 12.90 | 9.14 | 11.90 | -1.18 | 14.17 | -4.62 | 0.95 | 0.95 | 9.78 | 9.45 | 118.24 | ||||||||||||||||||||||||||||||||||||||||||||
RP® Financial, LC.
Exhibit IV-1A
Weekly Thrift Market Line - Part One
Prices As of February 6, 2015
| Market Capitalization | Price Change Data | Current Per Share Financials | ||||||||||||||||||||||||||||||||||||||||||||||||||||||||||
| Price/ | Shares | Market | 52 Week (1) | % Change From | LTM | LTM Core | BV/ | TBV/ | Assets/ | |||||||||||||||||||||||||||||||||||||||||||||||||||
| Share(1) | Outstanding | Capitalization | High | Low | Last Wk | Last Wk | 52 Wks (2) | MRY (2) | EPS (3) | EPS (3) | Share | Share (4) | Share | |||||||||||||||||||||||||||||||||||||||||||||||
| ($) | (000) | ($Mil) | ($) | ($) | ($) | (%) | (%) | (%) | ($) | ($) | ($) | ($) | ($) | |||||||||||||||||||||||||||||||||||||||||||||||
Companies | ||||||||||||||||||||||||||||||||||||||||||||||||||||||||||||
RVSB | Riverview Bancorp, Inc. | WA | 4.45 | 22,472 | 100.0 | 4.55 | 3.17 | 4.40 | 1.14 | 38.63 | -0.67 | 0.87 | 0.87 | 4.54 | 3.40 | 36.87 | ||||||||||||||||||||||||||||||||||||||||||||
SVBI | Severn Bancorp, Inc. | MD | 4.55 | 10,064 | 45.8 | 4.93 | 4.26 | 4.45 | 2.24 | -5.99 | 0.24 | 0.06 | NA | 5.68 | 5.65 | 77.17 | ||||||||||||||||||||||||||||||||||||||||||||
SIFI | SI Financial Group, Inc. | CT | 11.13 | 12,772 | 142.2 | 12.00 | 10.66 | 11.01 | 1.09 | -3.72 | -1.77 | 0.36 | NA | 12.35 | 10.89 | 105.74 | ||||||||||||||||||||||||||||||||||||||||||||
SBCP | Sunshine Bancorp, Inc. | FL | 11.91 | 4,232 | 50.4 | 12.73 | 11.21 | 12.25 | -2.78 | NA | -2.62 | NA | NA | 14.56 | 14.56 | 54.31 | ||||||||||||||||||||||||||||||||||||||||||||
TBNK | Territorial Bancorp Inc. | HI | 21.68 | 9,919 | 215.0 | 22.56 | 19.56 | 21.74 | -0.28 | -3.04 | 0.60 | 1.51 | 1.42 | 21.81 | NA | 170.57 | ||||||||||||||||||||||||||||||||||||||||||||
TSBK | Timberland Bancorp, Inc. | WA | 10.77 | 7,053 | 76.0 | 11.83 | 9.02 | 10.50 | 2.57 | -1.37 | 1.60 | 0.83 | 0.83 | 11.95 | 11.15 | 106.33 | ||||||||||||||||||||||||||||||||||||||||||||
TRST | TrustCo Bank Corp NY | NY | 6.96 | 94,857 | 660.2 | 7.50 | 6.25 | 6.43 | 8.24 | 10.13 | -4.13 | 0.47 | 0.45 | 4.15 | 4.14 | 48.96 | ||||||||||||||||||||||||||||||||||||||||||||
UCBA | United Community Bancorp | IN | 12.01 | 4,635 | 55.7 | 12.58 | 10.45 | 11.70 | 2.65 | 9.18 | 3.27 | 0.44 | NA | 15.27 | NA | 109.81 | ||||||||||||||||||||||||||||||||||||||||||||
UCFC | United Community Financial Corp. | OH | 5.42 | 49,239 | 266.9 | 5.62 | 3.17 | 5.40 | 0.37 | 59.41 | 0.93 | 1.00 | 1.01 | 4.88 | 4.88 | 37.24 | ||||||||||||||||||||||||||||||||||||||||||||
UBNK | United Financial Bancorp, Inc. | CT | 12.98 | 51,073 | 662.9 | 14.67 | 12.00 | 12.44 | 4.34 | -0.46 | -9.61 | 0.16 | 0.83 | NA | NA | 107.23 | ||||||||||||||||||||||||||||||||||||||||||||
WSBF | Waterstone Financial, Inc. | WI | 12.95 | 34,420 | 445.7 | 13.33 | 10.08 | 12.68 | 2.13 | 23.92 | -1.52 | 0.36 | 0.36 | 13.03 | 13.01 | 52.28 | ||||||||||||||||||||||||||||||||||||||||||||
WAYN | Wayne Savings Bancshares, Inc. | OH | 13.88 | 2,807 | 39.0 | 14.59 | 10.90 | 13.13 | 5.71 | 26.18 | 3.58 | 0.95 | NA | 14.25 | 13.64 | 148.75 | ||||||||||||||||||||||||||||||||||||||||||||
WEBK | Wellesley Bancorp, Inc. | MA | 19.17 | 2,459 | 47.1 | 20.00 | 17.52 | 18.85 | 1.70 | -0.36 | -0.11 | 0.77 | NA | 20.07 | 20.07 | 217.64 | ||||||||||||||||||||||||||||||||||||||||||||
WBB | Westbury Bancorp, Inc. | WI | 16.35 | 5,022 | 82.1 | 16.86 | 13.90 | 16.20 | 0.93 | 16.87 | -0.30 | -0.22 | -0.15 | 17.24 | 17.24 | 118.41 | ||||||||||||||||||||||||||||||||||||||||||||
WFD | Westfield Financial, Inc. | MA | 7.39 | 18,731 | 138.4 | 8.00 | 6.85 | 7.20 | 2.64 | 1.65 | 0.68 | 0.34 | 0.33 | 7.61 | 7.61 | 70.48 | ||||||||||||||||||||||||||||||||||||||||||||
WBKC | Wolverine Bancorp, Inc. | MI | 23.84 | 2,268 | 54.1 | 24.10 | 21.45 | 23.44 | 1.71 | 10.37 | -0.46 | 0.81 | 0.81 | 27.05 | 27.05 | 149.31 | ||||||||||||||||||||||||||||||||||||||||||||
WSFS | WSFS Financial Corporation | DE | 79.26 | 9,403 | 745.3 | 80.00 | 63.74 | 73.86 | 7.31 | 17.30 | 3.08 | 5.78 | 6.29 | 52.01 | 45.89 | 516.15 | ||||||||||||||||||||||||||||||||||||||||||||
WVFC | WVS Financial Corp. | PA | 11.18 | 2,051 | 22.9 | 12.50 | 10.75 | 11.45 | -2.35 | -7.60 | 3.71 | 0.52 | NA | 15.52 | 15.52 | 143.69 | ||||||||||||||||||||||||||||||||||||||||||||
MHCs | ||||||||||||||||||||||||||||||||||||||||||||||||||||||||||||
GCBC | Greene County Bancorp, Inc. (MHC) | NY | 29.50 | 4,219 | 124.5 | 30.87 | 24.97 | 28.43 | 3.76 | 18.00 | -1.99 | 1.57 | 1.59 | 15.28 | 15.28 | 168.87 | ||||||||||||||||||||||||||||||||||||||||||||
KRNY | Kearny Financial Corp. (MHC) | NJ | 13.48 | 67,375 | 908.2 | 16.23 | 10.91 | 13.00 | 3.69 | 20.90 | -1.96 | 0.14 | 0.16 | 7.32 | 5.70 | 52.66 | ||||||||||||||||||||||||||||||||||||||||||||
KFFB | Kentucky First Federal Bancorp (MHC) | KY | 8.13 | 8,458 | 68.8 | 8.97 | 7.47 | 8.13 | 0.00 | -4.80 | -0.49 | 0.23 | NA | 7.94 | 6.23 | 35.84 | ||||||||||||||||||||||||||||||||||||||||||||
LSBK | Lake Shore Bancorp, Inc. (MHC) | NY | 13.50 | 5,939 | 80.2 | 14.00 | 11.95 | 13.95 | -3.23 | 10.20 | -0.44 | 0.55 | NA | NA | NA | 82.08 | ||||||||||||||||||||||||||||||||||||||||||||
MGYR | Magyar Bancorp, Inc. (MHC) | NJ | 8.35 | 5,815 | 48.6 | 9.20 | 7.55 | 8.40 | -0.60 | 6.91 | -1.07 | 0.10 | 0.10 | 7.94 | 7.94 | 90.20 | ||||||||||||||||||||||||||||||||||||||||||||
MSBF | MSB Financial Corp. (MHC) | NJ | 10.50 | 5,010 | 52.6 | 10.75 | 7.83 | 10.40 | 0.96 | 31.25 | 2.44 | 0.20 | 0.20 | 8.21 | 8.21 | 68.95 | ||||||||||||||||||||||||||||||||||||||||||||
NECB | NorthEast Community Bancorp, Inc. (MHC) | NY | 6.91 | 12,376 | 85.5 | 7.44 | 6.55 | 6.94 | -0.43 | -4.56 | -4.29 | 0.10 | 0.10 | 8.37 | 8.28 | 40.57 | ||||||||||||||||||||||||||||||||||||||||||||
OFED | Oconee Federal Financial Corp. (MHC) | SC | 20.18 | 5,871 | 118.5 | 21.50 | 16.90 | 20.59 | -1.99 | 18.71 | 0.90 | 0.66 | NA | 13.27 | 13.27 | 60.82 | ||||||||||||||||||||||||||||||||||||||||||||
PSBH | PSB Holdings, Inc. (MHC) | CT | 7.48 | 6,542 | 48.9 | 9.20 | 6.04 | 7.58 | -1.31 | 16.89 | -3.84 | 0.18 | 0.20 | 7.93 | 6.87 | 72.14 | ||||||||||||||||||||||||||||||||||||||||||||
TFSL | TFS Financial Corporation (MHC) | OH | 14.29 | 298,315 | 4,262.9 | 15.38 | 11.37 | 14.02 | 1.93 | 22.98 | -4.00 | 0.22 | NA | 6.06 | 6.03 | 40.45 | ||||||||||||||||||||||||||||||||||||||||||||
Under Acquisition | ||||||||||||||||||||||||||||||||||||||||||||||||||||||||||||
CMSB | CMS Bancorp, Inc. | NY | 13.17 | 1,863 | 24.5 | 13.65 | 8.95 | 13.20 | -0.23 | 41.61 | 2.25 | 0.33 | 0.44 | 12.01 | 12.01 | 146.74 | ||||||||||||||||||||||||||||||||||||||||||||
COBK | Colonial Financial Services, Inc. | NJ | 13.28 | 3,867 | 51.4 | 13.97 | 10.11 | 13.45 | -1.25 | 10.22 | -0.89 | 0.27 | 0.27 | 16.27 | 16.27 | 142.94 | ||||||||||||||||||||||||||||||||||||||||||||
ESBF | ESB Financial Corporation | PA | 18.04 | 18,029 | 325.2 | 19.49 | 11.46 | 16.71 | 7.96 | 43.97 | -4.75 | 1.02 | NA | NA | NA | 107.54 | ||||||||||||||||||||||||||||||||||||||||||||
HBNK | Hampden Bancorp, Inc. | MA | 20.81 | 5,554 | 115.6 | 21.49 | 15.05 | 20.09 | 3.58 | 29.94 | -1.89 | 0.67 | 0.79 | 15.47 | 15.47 | 128.02 | ||||||||||||||||||||||||||||||||||||||||||||
HBOS | Heritage Financial Group, Inc. | GA | 24.74 | 9,239 | 228.6 | 26.11 | 17.28 | 23.97 | 3.21 | 30.83 | -4.48 | 0.95 | 1.21 | 17.32 | NA | 184.61 | ||||||||||||||||||||||||||||||||||||||||||||
HCBK | Hudson City Bancorp, Inc. | NJ | 9.61 | 528,909 | 5,082.8 | 10.35 | 8.53 | 8.97 | 7.13 | 5.14 | -5.04 | 0.32 | 0.19 | 9.04 | 8.75 | 69.14 | ||||||||||||||||||||||||||||||||||||||||||||
PEOP | Peoples Federal Bancshares, Inc. | MA | 21.91 | 6,239 | 136.7 | 22.97 | 17.73 | 20.95 | 4.58 | 23.30 | -2.80 | 0.17 | 0.30 | 16.74 | 16.74 | 95.68 | ||||||||||||||||||||||||||||||||||||||||||||
SMPL | Simplicity Bancorp, Inc. | CA | 17.55 | 7,393 | 129.7 | 18.43 | 15.61 | 17.59 | -0.23 | 7.87 | 2.33 | 0.67 | 0.73 | 18.70 | 18.16 | 116.76 | ||||||||||||||||||||||||||||||||||||||||||||
SIBC | State Investors Bancorp, Inc. | LA | 20.86 | 2,308 | 48.1 | 21.04 | 14.97 | 20.92 | -0.29 | 34.58 | 0.68 | 0.41 | 0.41 | 17.99 | 17.99 | 0.00 | ||||||||||||||||||||||||||||||||||||||||||||
| (1) | Average of High/Low or Bid/Ask price per share. |
| (2) | Or since offering price if converted of first listed in the past 52 weeks. Percent change figures are actual year-to-date and are not annualized. |
| (3) | EPS (earnings per share) is based on actual trailing 12 month data and is not shown on a pro forma basis. |
| (4) | Excludes intangibles (such as goodwill, value of core deposits, etc.). |
| (5) | ROA (return on assets) and ROE (return on equity) are indicated ratios based on trailing 12 month common earnings and average common equity and total assets balances. |
| (6) | Annualized based on last regular quarterly cash dividend announcement. |
| (7) | Indicated dividend as a percent of trailing 12 month earnings. |
| (8) | Excluded from averages due to actual or rumored acquisition activities or unusual operating characteristics. |
| (9) | For MHC institutions, market value reflects share price multiplied by public (non-MHC) shares. |
Source: SNL Financial, LC. and RP® Financial, LC. calculations. The information provided in this table has been obtained from sources we believe are reliable, but we cannot guarantee the accuracy or completeness of such information.
Copyright (c) 2015 by RP® Financial, LC.
RP® Financial, LC.
Exhibit IV-1B
Weekly Thrift Market Line - Part Two
Prices As of February 6, 2015
| Key Financial Ratios | Asset Quality Ratios | Pricing Ratios | Dividend Data (6) | |||||||||||||||||||||||||||||||||||||||||||||||||||||||||||||||||
| Equity/ | Tang Equity/ | Reported Earnings | Core Earnings | NPAs/ | Rsvs/ | Price/ | Price/ | Price/ | Price/ | Price/ | Div/ | Dividend | Payout | |||||||||||||||||||||||||||||||||||||||||||||||||||||||
| Assets(1) | Assets(1) | ROA(5) | ROE(5) | ROA(5) | ROE(5) | Assets | NPLs | Earnings | Book | Assets | Tang Book | Core Earnings | Share | Yield | Ratio (7) | |||||||||||||||||||||||||||||||||||||||||||||||||||||
| (%) | (%) | (%) | (%) | (%) | (%) | (%) | (%) | (x) | (%) | (%) | (%) | (x) | ($) | (%) | (%) | |||||||||||||||||||||||||||||||||||||||||||||||||||||
Companies | ||||||||||||||||||||||||||||||||||||||||||||||||||||||||||||||||||||
ALLB | Alliance Bancorp, Inc. of Pennsylvania | PA | 15.50 | 15.50 | 0.46 | 2.84 | 0.46 | 2.84 | 1.93 | 75.10 | 35.42 | 104.28 | 16.17 | 104.28 | 35.42 | 0.24 | 1.41 | 47.92 | ||||||||||||||||||||||||||||||||||||||||||||||||||
ANCB | Anchor Bancorp | WA | 16.61 | 16.61 | 2.47 | 17.61 | 2.46 | 17.56 | 3.41 | 32.64 | 5.64 | 89.06 | 14.80 | 89.06 | 5.66 | NA | NA | NM | ||||||||||||||||||||||||||||||||||||||||||||||||||
ABCW | Anchor BanCorp Wisconsin Inc. | WI | 10.93 | 10.93 | 0.69 | 6.89 | NA | NA | NA | NA | 20.61 | 138.28 | 15.12 | 138.28 | NA | NA | NA | NM | ||||||||||||||||||||||||||||||||||||||||||||||||||
ASBB | ASB Bancorp, Inc. | NC | 12.42 | 12.42 | 0.33 | 2.51 | 0.31 | 2.38 | 2.15 | 79.40 | 33.14 | 90.68 | 11.26 | 90.68 | 35.07 | NA | NA | NM | ||||||||||||||||||||||||||||||||||||||||||||||||||
AF | Astoria Financial Corporation | NY | 10.10 | 9.03 | 0.61 | 6.12 | 0.61 | 6.11 | NA | NA | 14.76 | 89.52 | 8.37 | 102.62 | 14.78 | 0.16 | 1.23 | 18.18 | ||||||||||||||||||||||||||||||||||||||||||||||||||
AFCB | Athens Bancshares Corporation | TN | 14.11 | 14.08 | 0.90 | 6.52 | NA | NA | 2.50 | 70.11 | 16.30 | 107.22 | NA | 107.57 | NA | 0.20 | 0.81 | 13.16 | ||||||||||||||||||||||||||||||||||||||||||||||||||
ACFC | Atlantic Coast Financial Corporation | FL | 10.24 | 10.24 | 0.19 | 1.89 | 0.17 | 1.70 | NA | NA | 43.56 | 86.25 | NA | 86.25 | 48.29 | 0.00 | 0.00 | NM | ||||||||||||||||||||||||||||||||||||||||||||||||||
BKMU | Bank Mutual Corporation | WI | 12.22 | 12.21 | 0.63 | 5.13 | NA | NA | NA | NA | 22.58 | 116.12 | 14.02 | 116.17 | NA | 0.16 | 2.29 | 51.61 | ||||||||||||||||||||||||||||||||||||||||||||||||||
BFIN | BankFinancial Corporation | IL | 14.75 | 14.64 | 2.83 | 22.58 | 2.86 | 22.80 | NA | NA | 5.84 | 114.53 | 16.89 | 115.52 | 5.78 | 0.16 | 1.36 | 5.97 | ||||||||||||||||||||||||||||||||||||||||||||||||||
BNCL | Beneficial Bancorp, Inc. | PA | 12.86 | 10.44 | 0.40 | 2.95 | 0.46 | 3.37 | 0.40 | 292.54 | 52.29 | 154.20 | NA | 195.25 | 45.71 | NA | NA | NM | ||||||||||||||||||||||||||||||||||||||||||||||||||
BHBK | Blue Hills Bancorp, Inc. | MA | 23.82 | 23.22 | -0.01 | -0.07 | 0.26 | 1.47 | 0.27 | NA | NA | 91.57 | 21.81 | 94.65 | NA | NA | NA | NA | ||||||||||||||||||||||||||||||||||||||||||||||||||
BOFI | BofI Holding, Inc. | CA | 8.67 | 8.67 | 1.56 | 18.31 | 1.59 | 18.71 | 0.70 | 65.45 | 19.56 | 300.16 | 25.76 | 300.16 | 19.13 | NA | NA | NM | ||||||||||||||||||||||||||||||||||||||||||||||||||
BYFC | Broadway Financial Corporation | CA | 8.12 | 8.12 | 0.53 | 6.76 | 0.54 | 6.80 | 8.13 | 36.32 | 12.78 | 84.85 | 6.89 | 84.85 | 12.78 | 0.04 | 0.00 | NM | ||||||||||||||||||||||||||||||||||||||||||||||||||
BLMT | BSB Bancorp, Inc. | MA | 10.12 | 10.12 | 0.31 | 2.73 | 0.31 | 2.73 | �� | 0.66 | 94.22 | 45.83 | 126.02 | 12.75 | 126.02 | 45.83 | NA | NA | NM | |||||||||||||||||||||||||||||||||||||||||||||||||
CBNJ | Cape Bancorp, Inc. | NJ | 13.05 | 11.17 | 0.62 | 4.80 | 0.54 | 4.14 | NA | NA | 14.31 | 71.11 | 9.28 | 84.81 | 16.61 | 0.24 | 2.75 | 39.34 | ||||||||||||||||||||||||||||||||||||||||||||||||||
CFFN | Capitol Federal Financial, Inc. | KS | 16.19 | 16.19 | 0.81 | 5.29 | 0.81 | 5.27 | 0.62 | 17.93 | 21.93 | 122.05 | 19.76 | 122.05 | 22.01 | 0.34 | 2.67 | 141.38 | ||||||||||||||||||||||||||||||||||||||||||||||||||
CARV | Carver Bancorp, Inc. | NY | 8.25 | 8.25 | -0.27 | -3.11 | -0.08 | -0.96 | 3.03 | 42.86 | NM | 256.19 | 3.64 | 256.19 | NM | 0.00 | 0.00 | NM | ||||||||||||||||||||||||||||||||||||||||||||||||||
CFBK | Central Federal Corporation | OH | 11.17 | 11.17 | 0.37 | 3.89 | 0.11 | 1.12 | 2.77 | 90.96 | 25.60 | 88.11 | 6.84 | 88.11 | 178.77 | 0.00 | 0.00 | NM | ||||||||||||||||||||||||||||||||||||||||||||||||||
CHFN | Charter Financial Corporation | GA | 21.76 | 21.38 | 0.58 | 2.43 | 0.59 | 2.46 | 1.05 | 101.48 | 35.94 | 91.50 | 19.91 | 93.60 | 35.35 | 0.20 | 1.74 | 62.50 | ||||||||||||||||||||||||||||||||||||||||||||||||||
CHEV | Cheviot Financial Corp. | OH | 16.84 | NA | 0.53 | 3.28 | 0.41 | 2.53 | NA | NA | 30.53 | 100.24 | 16.88 | 114.57 | 39.62 | 0.36 | 2.51 | 76.60 | ||||||||||||||||||||||||||||||||||||||||||||||||||
CBNK | Chicopee Bancorp, Inc. | MA | 13.79 | 13.79 | -0.10 | -0.64 | -0.10 | -0.66 | 1.92 | 43.86 | NM | 98.62 | 13.60 | 98.62 | NM | 0.28 | 1.70 | NM | ||||||||||||||||||||||||||||||||||||||||||||||||||
CSBK | Clifton Bancorp Inc. | NJ | 30.36 | 30.36 | 0.54 | 2.09 | 0.54 | 2.07 | NA | NA | 52.19 | 101.26 | 30.74 | 101.26 | 52.74 | 0.24 | 1.77 | 115.38 | ||||||||||||||||||||||||||||||||||||||||||||||||||
CWAY | Coastway Bancorp, Inc. | RI | 15.59 | 15.59 | -0.29 | -2.09 | -0.05 | -0.38 | 3.61 | 19.61 | NA | 78.11 | 12.18 | 78.11 | NA | NA | NA | NA | ||||||||||||||||||||||||||||||||||||||||||||||||||
DCOM | Dime Community Bancshares, Inc. | NY | 10.22 | 9.10 | 1.03 | 9.83 | 1.01 | 9.60 | 0.49 | 86.83 | 12.76 | 125.86 | 12.87 | 143.19 | 13.08 | 0.56 | 3.57 | 45.53 | ||||||||||||||||||||||||||||||||||||||||||||||||||
ENFC | Entegra Financial Corp. | NC | 11.88 | 11.88 | 0.71 | 10.59 | NA | NA | NA | NA | 17.00 | 94.37 | 11.21 | 94.37 | NA | NA | NA | NM | ||||||||||||||||||||||||||||||||||||||||||||||||||
ESSA | ESSA Bancorp, Inc. | PA | 10.81 | 10.09 | 0.60 | 5.35 | NA | NA | NA | NA | 14.38 | 82.51 | 8.92 | 89.08 | NA | 0.28 | 2.29 | 32.94 | ||||||||||||||||||||||||||||||||||||||||||||||||||
EVER | EverBank Financial Corp | FL | 8.08 | 7.87 | 0.77 | 8.82 | NA | NA | 0.52 | 67.15 | 16.50 | 140.51 | 10.46 | 145.10 | NA | 0.16 | 0.88 | 13.64 | ||||||||||||||||||||||||||||||||||||||||||||||||||
FCAP | First Capital, Inc. | IN | NA | NA | 1.23 | NA | NA | NA | 1.08 | 96.15 | 11.62 | 115.02 | NA | 127.22 | NA | 0.84 | 3.56 | 41.38 | ||||||||||||||||||||||||||||||||||||||||||||||||||
FBNK | First Connecticut Bancorp, Inc. | CT | 9.40 | 9.40 | 0.41 | 3.98 | 0.41 | 3.98 | NA | NA | 24.85 | 105.74 | 9.94 | 105.74 | 24.85 | 0.20 | 1.30 | 27.42 | ||||||||||||||||||||||||||||||||||||||||||||||||||
FDEF | First Defiance Financial Corp. | OH | 12.80 | 10.17 | 1.10 | 8.59 | 1.10 | 8.60 | 2.52 | 50.73 | 13.54 | 106.66 | 13.66 | 138.37 | 13.52 | 0.70 | 2.17 | 27.31 | ||||||||||||||||||||||||||||||||||||||||||||||||||
FFNM | First Federal of Northern Michigan Bancorp, Inc. | MI | 9.61 | 9.22 | 0.77 | 7.05 | NA | NA | 1.23 | 153.14 | 10.67 | 69.01 | 6.63 | 72.27 | NA | 0.08 | 1.44 | 15.38 | ||||||||||||||||||||||||||||||||||||||||||||||||||
FFNW | First Financial Northwest, Inc. | WA | 19.36 | 19.36 | 1.17 | 5.82 | 1.18 | 5.82 | 6.92 | 18.88 | 17.70 | 105.09 | 20.35 | 105.09 | 17.68 | 0.20 | 1.59 | 28.17 | ||||||||||||||||||||||||||||||||||||||||||||||||||
FNWB | First Northwest Bancorp | WA | 8.98 | NA | 0.35 | 3.53 | 0.34 | 3.39 | NA | NA | NA | NA | NA | NA | NA | NA | NA | NA | ||||||||||||||||||||||||||||||||||||||||||||||||||
FBC | Flagstar Bancorp, Inc. | MI | 13.95 | 13.95 | -0.70 | -4.94 | NA | NA | NA | NA | NM | 75.62 | 8.74 | 75.62 | NA | 0.00 | 0.00 | NM | ||||||||||||||||||||||||||||||||||||||||||||||||||
FXCB | Fox Chase Bancorp, Inc. | PA | 16.07 | 16.07 | 0.76 | 4.63 | 0.76 | 4.63 | 0.90 | 151.60 | 23.15 | 110.30 | 17.73 | 110.30 | 23.15 | 0.56 | 3.41 | 84.51 | ||||||||||||||||||||||||||||||||||||||||||||||||||
FSBW | FS Bancorp, Inc. | WA | 12.92 | 12.92 | 1.01 | 7.17 | 1.01 | 7.22 | 0.24 | 500.82 | 12.43 | 92.88 | 12.00 | 92.88 | 12.34 | 0.24 | 1.27 | 15.79 | ||||||||||||||||||||||||||||||||||||||||||||||||||
GTWN | Georgetown Bancorp, Inc. | MA | 11.33 | 11.33 | 0.55 | 5.04 | 0.55 | 5.04 | NA | NA | 21.12 | 106.79 | 12.10 | 106.79 | 21.12 | 0.17 | 0.95 | 20.00 | ||||||||||||||||||||||||||||||||||||||||||||||||||
HBK | Hamilton Bancorp, Inc. | MD | 20.93 | 20.15 | -0.25 | -1.24 | -0.31 | -1.55 | NA | NA | NM | 71.26 | 14.91 | 74.73 | NM | NA | NA | NM | ||||||||||||||||||||||||||||||||||||||||||||||||||
HFFC | HF Financial Corp. | SD | 8.07 | 7.72 | 0.35 | 4.35 | 0.56 | 7.02 | 1.14 | 75.69 | 23.17 | 101.11 | 8.15 | 106.08 | 14.57 | 0.45 | 3.08 | 71.43 | ||||||||||||||||||||||||||||||||||||||||||||||||||
HIFS | Hingham Institution for Savings | MA | 7.83 | 7.83 | 1.52 | 19.30 | NA | NA | NA | NA | 8.43 | 154.16 | 12.07 | 154.16 | NA | 1.12 | 1.27 | 20.11 | ||||||||||||||||||||||||||||||||||||||||||||||||||
HMNF | HMN Financial, Inc. | MN | 13.16 | 13.16 | 1.21 | 9.12 | 1.21 | 9.12 | NA | NA | 9.85 | 82.08 | 9.55 | 82.08 | 9.85 | 0.00 | 0.00 | NM | ||||||||||||||||||||||||||||||||||||||||||||||||||
HBCP | Home Bancorp, Inc. | LA | 12.62 | NA | 0.81 | 6.67 | 0.94 | 7.68 | 1.99 | 37.44 | 15.26 | 100.14 | 12.64 | 105.28 | 13.27 | 0.28 | 1.29 | 9.86 | ||||||||||||||||||||||||||||||||||||||||||||||||||
HFBL | Home Federal Bancorp, Inc. of Louisiana | LA | 12.50 | 12.50 | 0.95 | 6.96 | 0.92 | 6.75 | NA | NA | 13.11 | 98.23 | 12.28 | 98.23 | 13.51 | 0.28 | 1.44 | 18.24 | ||||||||||||||||||||||||||||||||||||||||||||||||||
HMST | HomeStreet, Inc. | WA | 8.55 | 8.18 | 0.69 | 7.69 | 0.71 | 7.85 | 2.89 | 23.77 | 11.85 | 86.76 | 7.42 | 91.04 | 11.61 | 0.44 | 0.00 | NM | ||||||||||||||||||||||||||||||||||||||||||||||||||
IROQ | IF Bancorp, Inc. | IL | 15.23 | 15.23 | 0.62 | 4.19 | NA | NA | NA | NA | 19.65 | 86.55 | 13.18 | 86.55 | NA | 0.10 | 0.60 | 11.76 | ||||||||||||||||||||||||||||||||||||||||||||||||||
ISBC | Investors Bancorp, Inc. | NJ | 19.06 | NA | 0.76 | 4.71 | 0.83 | 5.14 | 0.81 | 139.10 | 30.45 | 115.77 | 22.06 | 119.81 | 27.89 | 0.20 | 1.73 | 52.53 | ||||||||||||||||||||||||||||||||||||||||||||||||||
JXSB | Jacksonville Bancorp, Inc. | IL | 14.43 | 13.67 | 0.95 | 6.81 | 0.87 | 6.20 | NA | NA | 13.64 | 89.93 | 12.97 | 95.73 | 14.98 | 0.32 | 1.42 | 19.39 | ||||||||||||||||||||||||||||||||||||||||||||||||||
LPSB | La Porte Bancorp, Inc. | IN | 15.89 | 14.46 | 0.86 | 5.38 | 0.86 | 5.35 | NA | NA | 15.56 | 86.78 | 13.79 | 96.94 | 15.64 | 0.16 | 1.27 | 19.75 | ||||||||||||||||||||||||||||||||||||||||||||||||||
LABC | Louisiana Bancorp, Inc. | LA | 17.52 | 17.52 | 0.88 | 4.87 | 0.88 | 4.86 | NA | NA | 19.49 | 102.63 | 17.98 | 102.63 | 19.53 | 0.28 | 1.36 | 91.51 | ||||||||||||||||||||||||||||||||||||||||||||||||||
MCBK | Madison County Financial, Inc. | NE | 20.47 | 20.20 | 1.01 | 4.69 | 1.04 | 4.84 | NA | NM | 19.36 | 97.06 | 19.87 | 98.71 | 18.76 | 0.24 | 1.22 | 23.53 | ||||||||||||||||||||||||||||||||||||||||||||||||||
MLVF | Malvern Bancorp, Inc. | PA | 12.91 | 12.91 | 0.10 | 0.76 | 0.09 | 0.71 | 0.80 | 137.68 | NM | 101.39 | 13.09 | 101.39 | 142.33 | 0.11 | 0.00 | NM | ||||||||||||||||||||||||||||||||||||||||||||||||||
MELR | Melrose Bancorp, Inc. | MA | 10.17 | 10.17 | NA | NA | NA | NA | NA | 61.68 | NA | NA | NA | NA | NA | NA | NA | NA | ||||||||||||||||||||||||||||||||||||||||||||||||||
EBSB | Meridian Bancorp, Inc. | MA | 17.62 | 17.28 | 0.75 | 5.69 | 0.61 | 4.65 | NA | NA | 29.45 | 117.14 | 20.64 | 119.98 | 36.01 | NA | NA | NM | ||||||||||||||||||||||||||||||||||||||||||||||||||
CASH | Meta Financial Group, Inc. | SD | 8.71 | 7.74 | 0.76 | 9.28 | 0.85 | 10.36 | 0.10 | 247.28 | 13.97 | 116.22 | 10.13 | 132.27 | 12.52 | 0.52 | 1.51 | 21.14 | ||||||||||||||||||||||||||||||||||||||||||||||||||
NVSL | Naugatuck Valley Financial Corporation | CT | 12.15 | 12.15 | -0.42 | -3.54 | -0.34 | -2.90 | 1.65 | 91.56 | NM | 103.68 | 12.60 | 103.68 | NM | 0.00 | 0.00 | NM | ||||||||||||||||||||||||||||||||||||||||||||||||||
NHTB | New Hampshire Thrift Bancshares, Inc. | NH | 9.30 | 5.93 | 0.68 | 6.81 | 0.72 | 7.16 | NA | NA | 12.96 | 96.59 | 8.51 | 163.41 | 12.31 | 0.52 | 3.37 | 43.70 | ||||||||||||||||||||||||||||||||||||||||||||||||||
NYCB | New York Community Bancorp, Inc. | NY | 11.91 | 7.24 | 1.01 | 8.41 | 1.00 | 8.31 | NA | NA | 14.66 | 122.32 | 14.56 | 211.90 | 14.85 | 1.00 | 6.26 | 91.74 | ||||||||||||||||||||||||||||||||||||||||||||||||||
NFBK | Northfield Bancorp, Inc. | NJ | 19.66 | 19.22 | 0.73 | 3.07 | 0.75 | 3.17 | 1.29 | 69.03 | 36.00 | 120.29 | 23.65 | 123.73 | 34.91 | 0.28 | 1.90 | 65.85 | ||||||||||||||||||||||||||||||||||||||||||||||||||
NWBI | Northwest Bancshares, Inc. | PA | 13.67 | 11.64 | 0.79 | 5.69 | 0.76 | 5.47 | 1.72 | 57.64 | 17.69 | 105.63 | 14.44 | 126.93 | 18.38 | 0.56 | 4.73 | 228.36 | ||||||||||||||||||||||||||||||||||||||||||||||||||
OSHC | Ocean Shore Holding Co. | NJ | 10.33 | NA | 0.61 | 5.90 | NA | NA | NA | NA | 14.39 | 85.20 | 8.80 | 91.27 | NA | 0.24 | 1.70 | 24.49 | ||||||||||||||||||||||||||||||||||||||||||||||||||
OCFC | OceanFirst Financial Corp. | NJ | 9.26 | 9.26 | 0.86 | 9.18 | 0.84 | 8.93 | 1.89 | 41.03 | 14.23 | 131.10 | 12.14 | 131.10 | 14.63 | 0.52 | 3.07 | 42.02 | ||||||||||||||||||||||||||||||||||||||||||||||||||
ONFC | Oneida Financial Corp. | NY | 12.01 | 9.01 | 0.66 | 5.44 | 0.62 | 5.14 | NA | NA | 18.08 | 97.72 | NA | 135.33 | 19.19 | 0.48 | 3.64 | 65.75 | ||||||||||||||||||||||||||||||||||||||||||||||||||
ORIT | Oritani Financial Corp. | NJ | 15.62 | 15.62 | 1.31 | 7.81 | 1.31 | 7.81 | NA | NA | 15.10 | 126.96 | 19.83 | 126.96 | 15.10 | 0.70 | 4.83 | 98.96 | ||||||||||||||||||||||||||||||||||||||||||||||||||
PBHC | Pathfinder Bancorp, Inc. | NY | 12.34 | 11.62 | 0.52 | 5.89 | NA | NA | NA | NA | 15.70 | 77.14 | 7.86 | 83.98 | NA | 0.12 | 1.21 | 13.43 | ||||||||||||||||||||||||||||||||||||||||||||||||||
PBCT | People’s United Financial, Inc. | CT | 12.87 | 7.47 | 0.75 | 5.44 | 0.75 | 5.46 | NA | NA | 17.51 | 97.73 | 12.58 | 178.92 | 17.46 | 0.66 | 4.49 | 78.57 | ||||||||||||||||||||||||||||||||||||||||||||||||||
PBSK | Poage Bankshares, Inc. | KY | 16.22 | 15.76 | 0.22 | 1.30 | 0.47 | 2.76 | 0.97 | 68.37 | NM | 87.10 | 14.13 | 90.16 | 30.96 | 0.20 | 1.33 | 100.00 | ||||||||||||||||||||||||||||||||||||||||||||||||||
PBCP | Polonia Bancorp, Inc. | PA | 13.03 | 13.03 | 0.00 | 0.02 | 0.00 | 0.02 | NA | NA | NM | 90.24 | 11.76 | 90.24 | NM | NA | NA | NM | ||||||||||||||||||||||||||||||||||||||||||||||||||
PROV | Provident Financial Holdings, Inc. | CA | 12.98 | 12.98 | 0.74 | 5.57 | 0.74 | 5.57 | 1.38 | 73.43 | 18.37 | 98.46 | 12.78 | 98.46 | 18.37 | 0.44 | 2.78 | 50.00 | ||||||||||||||||||||||||||||||||||||||||||||||||||
PFS | Provident Financial Services, Inc. | NJ | 13.42 | NA | 0.92 | 6.75 | 0.97 | 7.18 | NA | NA | 15.16 | 104.90 | 14.08 | 165.44 | 14.24 | 0.64 | 3.46 | 50.00 | ||||||||||||||||||||||||||||||||||||||||||||||||||
PBIP | Prudential Bancorp, Inc. | PA | 24.31 | 24.31 | 0.37 | 1.51 | NA | NA | NA | NA | 61.15 | 89.53 | 21.76 | 89.53 | NA | 0.12 | 0.98 | 45.00 | ||||||||||||||||||||||||||||||||||||||||||||||||||
PULB | Pulaski Financial Corp. | MO | 8.03 | 7.77 | 0.89 | 10.34 | 0.90 | 10.35 | 3.35 | 39.70 | 12.38 | 120.19 | 9.65 | 124.47 | 12.34 | 0.38 | 3.23 | 40.00 | ||||||||||||||||||||||||||||||||||||||||||||||||||
RP® Financial, LC.
Exhibit IV-1B
Weekly Thrift Market Line - Part Two
Prices As of February 6, 2015
| Key Financial Ratios | Asset Quality Ratios | Pricing Ratios | Dividend Data (6) | |||||||||||||||||||||||||||||||||||||||||||||||||||||||||||||||||
| Equity/ | Tang Equity/ | Reported Earnings | Core Earnings | NPAs/ | Rsvs/ | Price/ | Price/ | Price/ | Price/ | Price/ | Div/ | Dividend | Payout | |||||||||||||||||||||||||||||||||||||||||||||||||||||||
| Assets(1) | Assets(1) | ROA(5) | ROE(5) | ROA(5) | ROE(5) | Assets | NPLs | Earnings | Book | Assets | Tang Book | Core Earnings | Share | Yield | Ratio (7) | |||||||||||||||||||||||||||||||||||||||||||||||||||||
| (%) | (%) | (%) | (%) | (%) | (%) | (%) | (%) | (x) | (%) | (%) | (%) | (x) | ($) | (%) | (%) | |||||||||||||||||||||||||||||||||||||||||||||||||||||
Companies | ||||||||||||||||||||||||||||||||||||||||||||||||||||||||||||||||||||
RVSB | Riverview Bancorp, Inc. | WA | 12.36 | 9.57 | 2.39 | 20.33 | 2.39 | 20.14 | NA | NA | 5.11 | 98.12 | 12.08 | 131.01 | 5.13 | 0.00 | 0.00 | NM | ||||||||||||||||||||||||||||||||||||||||||||||||||
SVBI | Severn Bancorp, Inc. | MD | 10.79 | 10.75 | 0.37 | 3.54 | NA | NA | 5.47 | 23.26 | NM | 80.10 | 6.11 | 80.57 | NA | 0.00 | 0.00 | NM | ||||||||||||||||||||||||||||||||||||||||||||||||||
SIFI | SI Financial Group, Inc. | CT | 11.68 | 10.44 | 0.33 | 2.82 | NA | NA | NA | NA | 30.92 | 90.12 | 10.53 | 102.24 | NA | 0.16 | 1.44 | 36.11 | ||||||||||||||||||||||||||||||||||||||||||||||||||
SBCP | Sunshine Bancorp, Inc. | FL | 26.81 | 26.81 | -1.11 | -5.90 | -1.11 | -5.90 | NA | NA | NA | 81.79 | 21.93 | 81.79 | NA | NA | NA | NA | ||||||||||||||||||||||||||||||||||||||||||||||||||
TBNK | Territorial Bancorp Inc. | HI | 12.79 | NA | 0.85 | 6.56 | 0.80 | 6.19 | NA | NA | 14.36 | 99.38 | 12.71 | 99.56 | 15.22 | 0.64 | 2.95 | 47.68 | ||||||||||||||||||||||||||||||||||||||||||||||||||
TSBK | Timberland Bancorp, Inc. | WA | 11.24 | 10.56 | 0.81 | 7.34 | 0.81 | 7.34 | 4.32 | 44.59 | 12.98 | 90.14 | 10.13 | 96.62 | 12.96 | 0.24 | 2.23 | 24.10 | ||||||||||||||||||||||||||||||||||||||||||||||||||
TRST | TrustCo Bank Corp NY | NY | 8.47 | 8.46 | 0.97 | 11.54 | 0.93 | 11.16 | NA | NA | 14.94 | 167.80 | 14.21 | 168.04 | 15.45 | 0.26 | 3.77 | 56.33 | ||||||||||||||||||||||||||||||||||||||||||||||||||
UCBA | United Community Bancorp | IN | 13.91 | NA | 0.40 | 2.88 | NA | NA | NA | NA | 27.30 | 78.63 | 10.94 | 83.97 | NA | 0.24 | 2.00 | 40.91 | ||||||||||||||||||||||||||||||||||||||||||||||||||
UCFC | United Community Financial Corp. | OH | 13.10 | 13.09 | 2.82 | 23.38 | 2.84 | 23.55 | NA | NA | 5.42 | 111.14 | 14.56 | 111.17 | 5.38 | 0.04 | 0.74 | 3.00 | ||||||||||||||||||||||||||||||||||||||||||||||||||
UBNK | United Financial Bancorp, Inc. | CT | 11.00 | 8.93 | 0.16 | 1.28 | 0.82 | 6.64 | NA | NA | NM | 104.88 | NA | 129.53 | 15.62 | 0.40 | 3.08 | 250.00 | ||||||||||||||||||||||||||||||||||||||||||||||||||
WSBF | Waterstone Financial, Inc. | WI | 24.93 | 24.90 | 0.70 | 3.23 | 0.70 | 3.23 | 4.39 | 38.45 | 35.97 | 99.38 | 24.77 | 99.52 | 35.97 | 0.20 | 1.54 | 55.56 | ||||||||||||||||||||||||||||||||||||||||||||||||||
WAYN | Wayne Savings Bancshares, Inc. | OH | 9.58 | 9.21 | 0.64 | 6.62 | NA | NA | NA | NA | 14.61 | 97.39 | 9.33 | 101.77 | NA | 0.36 | 2.59 | 36.84 | ||||||||||||||||||||||||||||||||||||||||||||||||||
WEBK | Wellesley Bancorp, Inc. | MA | 9.22 | 9.22 | 0.36 | 3.69 | NA | NA | NA | NA | 24.90 | 95.52 | 8.81 | 95.52 | NA | 0.10 | 0.52 | 9.74 | ||||||||||||||||||||||||||||||||||||||||||||||||||
WBB | Westbury Bancorp, Inc. | WI | 14.55 | 14.55 | -0.19 | -1.19 | -0.13 | -0.80 | 1.18 | 90.12 | NM | 94.86 | 13.80 | 94.86 | NM | NA | NA | NM | ||||||||||||||||||||||||||||||||||||||||||||||||||
WFD | Westfield Financial, Inc. | MA | 10.80 | 10.80 | 0.48 | 4.18 | 0.46 | 4.04 | NA | NA | 21.74 | 97.11 | 10.49 | 97.11 | 22.49 | 0.12 | 1.62 | 52.94 | ||||||||||||||||||||||||||||||||||||||||||||||||||
WBKC | Wolverine Bancorp, Inc. | MI | 18.15 | 18.15 | 0.55 | 2.84 | 0.55 | 2.84 | 1.68 | 162.46 | 29.43 | 88.14 | 16.00 | 88.14 | 29.43 | NA | NA | 74.07 | ||||||||||||||||||||||||||||||||||||||||||||||||||
WSFS | WSFS Financial Corporation | DE | 10.08 | 9.00 | 1.17 | 12.22 | 1.27 | 13.30 | 1.08 | 84.51 | 13.71 | 152.39 | 15.36 | 172.74 | 12.59 | 0.60 | 0.76 | 9.34 | ||||||||||||||||||||||||||||||||||||||||||||||||||
WVFC | WVS Financial Corp. | PA | 10.80 | 10.80 | 0.33 | 3.25 | NA | NA | NA | NA | 21.50 | 72.04 | 7.78 | 72.04 | NA | 0.16 | 1.43 | 30.77 | ||||||||||||||||||||||||||||||||||||||||||||||||||
MHCs | ||||||||||||||||||||||||||||||||||||||||||||||||||||||||||||||||||||
GCBC | Greene County Bancorp, Inc. (MHC) | NY | 9.05 | 9.05 | 0.97 | 10.83 | 0.99 | 10.99 | NA | NA | 18.79 | 193.06 | 17.47 | 193.06 | 18.51 | 0.72 | 2.44 | 45.54 | ||||||||||||||||||||||||||||||||||||||||||||||||||
KRNY | Kearny Financial Corp. (MHC) | NJ | 13.90 | 11.17 | 0.28 | 2.01 | 0.32 | 2.30 | NA | NA | NM | 184.14 | 25.60 | 236.56 | 83.74 | 0.00 | 0.00 | NM | ||||||||||||||||||||||||||||||||||||||||||||||||||
KFFB | Kentucky First Federal Bancorp (MHC) | KY | 22.17 | 18.26 | 0.63 | 2.84 | NA | NA | NA | NA | 35.35 | 102.33 | 22.68 | 130.51 | NA | 0.40 | 4.92 | 173.91 | ||||||||||||||||||||||||||||||||||||||||||||||||||
LSBK | Lake Shore Bancorp, Inc. (MHC) | NY | 14.69 | 14.69 | 0.65 | 4.58 | NA | NA | NA | NA | 24.55 | 114.99 | NA | 114.99 | NA | 0.28 | 2.07 | 50.91 | ||||||||||||||||||||||||||||||||||||||||||||||||||
MGYR | Magyar Bancorp, Inc. (MHC) | NJ | 8.80 | 8.80 | 0.12 | 1.37 | 0.11 | 1.32 | NA | NA | NM | 105.14 | 9.26 | 105.14 | 86.20 | NA | NA | NM | ||||||||||||||||||||||||||||||||||||||||||||||||||
MSBF | MSB Financial Corp. (MHC) | NJ | 11.90 | 11.90 | 0.28 | 2.39 | 0.28 | 2.39 | 5.65 | 19.12 | 52.50 | 127.95 | 15.23 | 127.95 | 52.50 | 0.00 | 0.00 | NM | ||||||||||||||||||||||||||||||||||||||||||||||||||
NECB | NorthEast Community Bancorp, Inc. (MHC) | NY | 20.63 | 20.46 | 0.26 | 1.17 | 0.27 | 1.21 | 4.97 | 18.40 | 69.10 | 82.57 | 17.03 | 83.42 | 66.96 | 0.12 | 1.74 | 120.00 | ||||||||||||||||||||||||||||||||||||||||||||||||||
OFED | Oconee Federal Financial Corp. (MHC) | SC | 21.68 | 21.68 | 1.05 | 4.95 | NA | NA | 0.61 | 54.15 | 30.58 | 152.06 | 32.97 | 152.06 | NA | 0.40 | 1.98 | 60.61 | ||||||||||||||||||||||||||||||||||||||||||||||||||
PSBH | PSB Holdings, Inc. (MHC) | CT | 10.99 | 9.67 | 0.23 | 2.08 | 0.26 | 2.33 | NA | NA | 41.56 | 94.35 | 10.37 | 108.85 | 37.18 | 0.12 | 1.60 | 16.67 | ||||||||||||||||||||||||||||||||||||||||||||||||||
TFSL | TFS Financial Corporation (MHC) | OH | 15.02 | 14.95 | 0.56 | 3.57 | NA | NA | 2.13 | 33.96 | 64.95 | 235.83 | 35.42 | 237.10 | NA | 0.28 | 1.96 | 63.64 | ||||||||||||||||||||||||||||||||||||||||||||||||||
Under Acquisition | ||||||||||||||||||||||||||||||||||||||||||||||||||||||||||||||||||||
CMSB | CMS Bancorp, Inc. | NY | 8.73 | 8.73 | 0.25 | 2.82 | 0.32 | 3.66 | NA | NA | 39.91 | 109.64 | 9.02 | 109.64 | 29.70 | NA | NA | NM | ||||||||||||||||||||||||||||||||||||||||||||||||||
COBK | Colonial Financial Services, Inc. | NJ | 11.36 | 11.36 | 0.18 | 1.64 | 0.18 | 1.61 | 3.74 | 25.32 | 49.19 | 81.62 | 9.28 | 81.62 | 49.03 | NA | NA | NM | ||||||||||||||||||||||||||||||||||||||||||||||||||
ESBF | ESB Financial Corporation | PA | 11.02 | NA | 0.94 | 9.10 | NA | NA | NA | NA | 17.69 | 155.63 | NA | 194.95 | NA | 0.40 | 2.22 | 39.22 | ||||||||||||||||||||||||||||||||||||||||||||||||||
HBNK | Hampden Bancorp, Inc. | MA | 12.05 | 12.05 | 0.51 | 4.20 | 0.61 | 5.00 | 1.36 | 63.26 | 31.06 | 134.51 | 16.22 | 134.51 | 26.27 | 0.32 | 1.54 | 44.78 | ||||||||||||||||||||||||||||||||||||||||||||||||||
HBOS | Heritage Financial Group, Inc. | GA | 9.38 | NA | 0.50 | 5.46 | 0.64 | 6.96 | 0.88 | 85.93 | 26.04 | 142.84 | 13.40 | 154.40 | 20.40 | 0.28 | 1.13 | 29.47 | ||||||||||||||||||||||||||||||||||||||||||||||||||
HCBK | Hudson City Bancorp, Inc. | NJ | 13.08 | 12.71 | 0.42 | 3.28 | 0.25 | 1.94 | NA | NA | 30.03 | 106.30 | 13.90 | 109.81 | 50.78 | 0.16 | 1.66 | 50.00 | ||||||||||||||||||||||||||||||||||||||||||||||||||
PEOP | Peoples Federal Bancshares, Inc. | MA | 17.50 | 17.50 | 0.17 | 1.01 | 0.28 | 1.62 | NA | 138.49 | NM | 130.86 | 22.90 | 130.86 | 73.82 | 0.20 | 0.91 | 117.65 | ||||||||||||||||||||||||||||||||||||||||||||||||||
SMPL | Simplicity Bancorp, Inc. | CA | 16.01 | 15.63 | 0.56 | 3.52 | 0.61 | 3.83 | 1.79 | 25.39 | 26.19 | 93.86 | 15.03 | 96.62 | 24.02 | 0.36 | 2.05 | 53.73 | ||||||||||||||||||||||||||||||||||||||||||||||||||
SIBC | State Investors Bancorp, Inc. | LA | 15.44 | 15.44 | 0.39 | 2.45 | 0.39 | 2.45 | 1.14 | 46.18 | 50.88 | 115.94 | 17.91 | 115.94 | 50.88 | NA | NA | NM | ||||||||||||||||||||||||||||||||||||||||||||||||||
| (1) | Average of High/Low or Bid/Ask price per share. |
| (2) | Or since offering price if converted of first listed in the past 52 weeks. Percent change figures are actual year-to-date and are not annualized. |
| (3) | EPS (earnings per share) is based on actual trailing 12 month data and is not shown on a pro forma basis. |
| (4) | Exludes intangibles (such as goodwill, value of core deposits, etc.). |
| (5) | ROA (return on assets) and ROE (return on equity) are indicated ratios based on trailing 12 month common earnings and average common equity and total assets balances. |
| (6) | Annualized based on last regular quarterly cash dividend announcement. |
| (7) | Indicated dividend as a percent of trailing 12 month earnings. |
| (8) | Excluded from averages due to actual or rumored acquisition activities or unusual operating characteristics. |
| (9) | For MHC institutions, market value reflects share price multiplied by public (non-MHC) shares. |
Source: SNL Financial, LC. and RP® Financial, LC. calculations. The information provided in this table has been obtained from sources we believe are reliable, but we cannot guarantee the accuracy or completeness of such information.
Copyright (c) 2015 by RP® Financial, LC.
EXHIBIT IV-2
Historical Stock Price Indices
Exhibit IV-2
Historical Stock Price Indices(1)
Year/Qtr. Ended | DJIA | S&P 500 | NASDAQ Composite | SNL Thrift Index | SNL Bank Index | |||||||||||||||||
2004: | Quarter 1 | 10357.7 | 1126.2 | 1994.2 | 1585.3 | 562.20 | ||||||||||||||||
Quarter 2 | 10435.5 | 1140.8 | 2047.8 | 1437.8 | 546.62 | |||||||||||||||||
Quarter 3 | 10080.3 | 1114.6 | 1896.8 | 1495.1 | 556.00 | |||||||||||||||||
Quarter 4 | 10783.0 | 1211.9 | 2175.4 | 1605.6 | 595.10 | |||||||||||||||||
2005: | Quarter 1 | 10503.8 | 1180.6 | 1999.2 | 1516.6 | 551.00 | ||||||||||||||||
Quarter 2 | 10275.0 | 1191.3 | 2057.0 | 1577.1 | 563.27 | |||||||||||||||||
Quarter 3 | 10568.7 | 1228.8 | 2151.7 | 1527.2 | 546.30 | |||||||||||||||||
Quarter 4 | 10717.5 | 1248.3 | 2205.3 | 1616.4 | 582.80 | |||||||||||||||||
2006: | Quarter 1 | 11109.3 | 1294.8 | 2339.8 | 1661.1 | 595.50 | ||||||||||||||||
Quarter 2 | 11150.2 | 1270.2 | 2172.1 | 1717.9 | 601.14 | |||||||||||||||||
Quarter 3 | 11679.1 | 1335.9 | 2258.4 | 1727.1 | 634.00 | |||||||||||||||||
Quarter 4 | 12463.2 | 1418.3 | 2415.3 | 1829.3 | 658.60 | |||||||||||||||||
2007: | Quarter 1 | 12354.4 | 1420.9 | 2421.6 | 1703.6 | 634.40 | ||||||||||||||||
Quarter 2 | 13408.6 | 1503.4 | 2603.2 | 1645.9 | 622.63 | |||||||||||||||||
Quarter 3 | 13895.6 | 1526.8 | 2701.5 | 1523.3 | 595.80 | |||||||||||||||||
Quarter 4 | 13264.8 | 1468.4 | 2652.3 | 1058.0 | 492.85 | |||||||||||||||||
2008: | Quarter 1 | 12262.9 | 1322.7 | 2279.1 | 1001.5 | 442.5 | ||||||||||||||||
Quarter 2 | 11350.0 | 1280.0 | 2293.0 | 822.6 | 332.2 | |||||||||||||||||
Quarter 3 | 10850.7 | 1166.4 | 2082.3 | 760.1 | 414.8 | |||||||||||||||||
Quarter 4 | 8776.4 | 903.3 | 1577.0 | 653.9 | 268.3 | |||||||||||||||||
2009: | Quarter 1 | 7608.9 | 797.9 | 1528.6 | 542.8 | 170.1 | ||||||||||||||||
Quarter 2 | 8447.0 | 919.3 | 1835.0 | 538.8 | 227.6 | |||||||||||||||||
Quarter 3 | 9712.3 | 1057.1 | 2122.4 | 561.4 | 282.9 | |||||||||||||||||
Quarter 4 | 10428.1 | 1115.1 | 2269.2 | 587.0 | 260.8 | |||||||||||||||||
2010: | Quarter 1 | 10856.6 | 1169.4 | 2398.0 | 626.3 | 301.1 | ||||||||||||||||
Quarter 2 | 9744.0 | 1030.7 | 2109.2 | 564.5 | 257.2 | |||||||||||||||||
Quarter 3 | 9744.0 | 1030.7 | 2109.2 | 564.5 | 257.2 | |||||||||||||||||
Quarter 4 | 11577.5 | 1257.6 | 2652.9 | 592.2 | 290.1 | |||||||||||||||||
2011: | Quarter 1 | 12319.7 | 1325.8 | 2781.1 | 578.1 | 293.1 | ||||||||||||||||
Quarter 2 | 12414.3 | 1320.6 | 2773.5 | 540.8 | 266.8 | |||||||||||||||||
Quarter 3 | 10913.4 | 1131.4 | 2415.4 | 443.2 | 198.9 | |||||||||||||||||
Quarter 4 | 12217.6 | 1257.6 | 2605.2 | 481.4 | 221.3 | |||||||||||||||||
2012: | Quarter 1 | 13212.0 | 1408.5 | 3091.6 | 529.3 | 284.9 | ||||||||||||||||
Quarter 2 | 12880.1 | 1362.2 | 2935.1 | 511.6 | 257.3 | |||||||||||||||||
Quarter 3 | 13437.1 | 1440.7 | 3116.2 | 557.6 | 276.8 | |||||||||||||||||
Quarter 4 | 13104.1 | 1426.2 | 3019.5 | 565.8 | 292.7 | |||||||||||||||||
2013: | Quarter 1 | 14578.5 | 1569.2 | 3267.5 | 602.3 | 318.9 | ||||||||||||||||
Quarter 2 | 14909.6 | 1606.3 | 3404.3 | 625.3 | 346.7 | |||||||||||||||||
Quarter 3 | 15129.7 | 1681.6 | 3771.5 | 650.8 | 354.4 | |||||||||||||||||
Quarter 4 | 16576.7 | 1848.4 | 4176.6 | 706.5 | 394.4 | |||||||||||||||||
2014: | Quarter 1 | 16457.7 | 1872.3 | 4199.0 | 718.9 | 410.8 | ||||||||||||||||
Quarter 2 | 16826.6 | 1960.2 | 4408.2 | 723.9 | 405.2 | |||||||||||||||||
Quarter 3 | 17042.9 | 1972.3 | 4493.4 | 697.7 | 411.0 | |||||||||||||||||
Quarter 4 | 17823.1 | 2058.9 | 4736.1 | 738.7 | 432.8 | |||||||||||||||||
As of Feb. 6, 2015 | 17824.3 | 2055.5 | 4744.4 | 727.1 | 414.3 | |||||||||||||||||
| (1) | End of period data. |
Sources: SNL Financial and The Wall Street Journal.
EXHIBIT IV-3
Historical Thrift Stock Indices
Index Values
| Industry: | Savings Bank/Thrift/Mutual | |
| Geography: | United States and Canada |
| Change (%) | Price / Earnings (x) | |||||||||||||||||||||||||||||||||||||||
| Close | Last Update | 1 Day | 1 Week | MTD | QTD | YTD | 1 Year | 3 Years | ||||||||||||||||||||||||||||||||
SNL Custom** Indexes | ||||||||||||||||||||||||||||||||||||||||
SNL Banking Indexes | ||||||||||||||||||||||||||||||||||||||||
SNL U.S. Bank and Thrift | 394.67 | 2/9/2015 | (0.56 | ) | 3.70 | 5.77 | (4.72 | ) | (4.72 | ) | 6.51 | 60.57 | 18.8 | |||||||||||||||||||||||||||
SNL U.S. Thrift | 721.90 | 2/9/2015 | (0.72 | ) | 1.63 | 3.14 | (2.27 | ) | (2.27 | ) | 7.22 | 42.29 | 25.6 | |||||||||||||||||||||||||||
SNL TARP Participants | 81.65 | 2/9/2015 | (0.48 | ) | 6.96 | 10.80 | 4.97 | 4.97 | 14.39 | 68.11 | 14.9 | |||||||||||||||||||||||||||||
S&P 500 Bank | 225.17 | 2/6/2015 | 1.89 | 6.37 | 6.37 | (4.97 | ) | (4.97 | ) | 8.73 | 57.33 | NA | ||||||||||||||||||||||||||||
NASDAQ Bank | 2,576.59 | 2/9/2015 | (1.18 | ) | 3.10 | 5.64 | (3.71 | ) | (3.71 | ) | 4.64 | 47.34 | NA | |||||||||||||||||||||||||||
S&P 500 Thrifts & Mortgage Finance | 4.22 | 2/6/2015 | 0.97 | 5.84 | 5.84 | (4.09 | ) | (4.09 | ) | 5.47 | 25.89 | NA | ||||||||||||||||||||||||||||
SNL Asset Size Indexes | ||||||||||||||||||||||||||||||||||||||||
SNL U.S. Thrift < $250M | 916.31 | 2/9/2015 | (0.01 | ) | (1.99 | ) | (1.03 | ) | (1.37 | ) | (1.37 | ) | 0.04 | 16.74 | NA | |||||||||||||||||||||||||
SNL U.S. Thrift $250M-$500M | 4,544.50 | 2/9/2015 | 0.14 | 0.65 | 0.01 | (0.42 | ) | (0.42 | ) | 14.72 | 63.99 | 25.9 | ||||||||||||||||||||||||||||
SNL U.S. Thrift < $500M | 1,546.15 | 2/9/2015 | 0.13 | 0.48 | (0.06 | ) | (0.48 | ) | (0.48 | ) | 14.25 | 60.43 | 25.9 | |||||||||||||||||||||||||||
SNL U.S. Thrift $500M-$1B | 1,907.05 | 2/9/2015 | (0.37 | ) | 1.19 | 1.36 | (0.57 | ) | (0.57 | ) | 13.58 | 60.93 | 27.5 | |||||||||||||||||||||||||||
SNL U.S. Thrift $1B-$5B | 2,334.66 | 2/9/2015 | (1.28 | ) | 1.32 | 2.41 | (1.51 | ) | (1.51 | ) | 9.10 | 50.90 | 23.4 | |||||||||||||||||||||||||||
SNL U.S. Thrift $5B-$10B | 738.61 | 2/9/2015 | (0.54 | ) | 1.53 | 3.14 | (2.99 | ) | (2.99 | ) | (5.33 | ) | 3.25 | 18.9 | ||||||||||||||||||||||||||
SNL U.S. Thrift > $10B | 147.52 | 2/9/2015 | (0.60 | ) | 1.89 | 3.80 | (2.73 | ) | (2.73 | ) | 8.24 | 43.83 | 27.6 | |||||||||||||||||||||||||||
SNL Market Cap Indexes | ||||||||||||||||||||||||||||||||||||||||
SNL Micro Cap U.S. Thrift | 761.50 | 2/9/2015 | (0.27 | ) | 1.09 | 1.18 | (0.23 | ) | (0.23 | ) | 12.80 | 64.59 | 21.7 | |||||||||||||||||||||||||||
SNL Micro Cap U.S. Bank & Thrift | 510.32 | 2/9/2015 | (0.17 | ) | 0.87 | 1.14 | (0.61 | ) | (0.61 | ) | 10.33 | 60.23 | 15.8 | |||||||||||||||||||||||||||
SNL Small Cap U.S. Thrift | 508.81 | 2/9/2015 | (1.27 | ) | 1.71 | 3.12 | (3.60 | ) | (3.60 | ) | 6.24 | 42.90 | 25.2 | |||||||||||||||||||||||||||
SNL Small Cap U.S. Bank & Thrift | 441.09 | 2/9/2015 | (1.58 | ) | 1.82 | 3.94 | (4.11 | ) | (4.11 | ) | 6.84 | 41.85 | 18.8 | |||||||||||||||||||||||||||
SNL Mid Cap U.S. Thrift | 278.99 | 2/9/2015 | (0.83 | ) | 1.89 | 3.56 | (2.27 | ) | (2.27 | ) | 5.86 | 38.67 | 29.1 | |||||||||||||||||||||||||||
SNL Mid Cap U.S. Bank & Thrift | 298.21 | 2/9/2015 | (1.16 | ) | 3.73 | 6.49 | (2.78 | ) | (2.78 | ) | 4.79 | 42.47 | 16.8 | |||||||||||||||||||||||||||
SNL Large Cap U.S. Thrift | 147.52 | 2/9/2015 | (0.23 | ) | 0.74 | 3.21 | (1.96 | ) | (1.96 | ) | 6.57 | 23.17 | 21.1 | |||||||||||||||||||||||||||
SNL Large Cap U.S. Bank & Thrift | 261.75 | 2/9/2015 | (0.44 | ) | 3.82 | 5.81 | (5.03 | ) | (5.03 | ) | 6.73 | 64.08 | 18.7 | |||||||||||||||||||||||||||
SNL Geographic Indexes | ||||||||||||||||||||||||||||||||||||||||
SNL Mid-Atlantic U.S. Thrift | 2,867.02 | 2/9/2015 | (0.70 | ) | 1.91 | 3.92 | (2.20 | ) | (2.20 | ) | 5.72 | 36.38 | 23.2 | |||||||||||||||||||||||||||
SNL Midwest U.S. Thrift | 2,325.95 | 2/9/2015 | (0.70 | ) | 1.09 | 1.64 | (3.30 | ) | (3.30 | ) | 10.74 | 55.07 | 40.9 | |||||||||||||||||||||||||||
SNL New England U.S. Thrift | 1,963.82 | 2/9/2015 | (0.70 | ) | 1.63 | 3.20 | (2.94 | ) | (2.94 | ) | 6.00 | 22.24 | 20.2 | |||||||||||||||||||||||||||
SNL Southeast U.S. Thrift | 344.08 | 2/9/2015 | (1.56 | ) | 0.81 | 1.52 | (5.14 | ) | (5.14 | ) | 7.38 | 82.92 | 19.8 | |||||||||||||||||||||||||||
SNL Southwest U.S. Thrift | 615.35 | 2/9/2015 | 0.48 | 0.23 | (0.34 | ) | (3.95 | ) | (3.95 | ) | 19.38 | 53.57 | 21.5 | |||||||||||||||||||||||||||
SNL Western U.S. Thrift | 102.11 | 2/9/2015 | (0.19 | ) | 1.95 | 3.17 | 7.73 | 7.73 | 9.83 | 89.77 | 17.2 | |||||||||||||||||||||||||||||
SNL Stock Exchange Indexes | ||||||||||||||||||||||||||||||||||||||||
SNL U.S. Thrift NYSE | 129.29 | 2/9/2015 | (0.65 | ) | 1.20 | 3.50 | (2.04 | ) | (2.04 | ) | 1.10 | 39.51 | 14.9 | |||||||||||||||||||||||||||
SNL U.S. Thrift NASDAQ | 2,015.85 | 2/9/2015 | (0.74 | ) | 1.77 | 3.03 | (2.35 | ) | (2.35 | ) | 9.33 | 43.43 | 29.1 | |||||||||||||||||||||||||||
SNL U.S. Thrift Pink | 229.84 | 2/9/2015 | 0.16 | 2.30 | 2.19 | 3.04 | 3.04 | 16.71 | 63.06 | 16.3 | ||||||||||||||||||||||||||||||
SNL Other Indexes | ||||||||||||||||||||||||||||||||||||||||
SNL U.S. Thrift MHCs | 4,657.64 | 2/9/2015 | (0.64 | ) | 1.02 | 1.31 | (3.72 | ) | (3.72 | ) | 14.06 | 63.72 | 61.2 | |||||||||||||||||||||||||||
Broad Market Indexes | ||||||||||||||||||||||||||||||||||||||||
DJIA | 17,729.21 | 2/9/2015 | (0.53 | ) | 2.12 | 3.29 | (0.53 | ) | (0.53 | ) | 12.25 | 37.54 | NA | |||||||||||||||||||||||||||
Source: SNL Financial | Page 1 of 2
Index Values
S&P 500 | 2,046.74 | 2/9/2015 | (0.42 | ) | 1.28 | 2.59 | (0.59 | ) | (0.59 | ) | 13.90 | 51.39 | NA | |||||||||||||||||||||||||||
S&P Mid-Cap | 1,469.44 | 2/9/2015 | (0.50 | ) | 1.54 | 2.39 | 1.17 | 1.17 | 12.31 | 50.68 | NA | |||||||||||||||||||||||||||||
S&P Small-Cap | 696.85 | 2/6/2015 | (0.17 | ) | 3.95 | 3.95 | 0.26 | 0.26 | 11.17 | 50.99 | NA | |||||||||||||||||||||||||||||
S&P 500 Financials | 324.93 | 2/6/2015 | 0.73 | 4.81 | 4.81 | (2.52 | ) | (2.52 | ) | 14.77 | 64.60 | NA | ||||||||||||||||||||||||||||
SNL U.S. Financial Institutions | 703.78 | 2/9/2015 | (0.48 | ) | 3.18 | 5.03 | (2.97 | ) | (2.97 | ) | 11.46 | 65.97 | 17.3 | |||||||||||||||||||||||||||
MSCI US IMI Financials | 1,199.02 | 2/6/2015 | 0.35 | 4.26 | 4.26 | (1.59 | ) | (1.59 | ) | 13.89 | 57.08 | NA | ||||||||||||||||||||||||||||
NASDAQ | 4,726.01 | 2/9/2015 | (0.39 | ) | 1.05 | 1.96 | (0.21 | ) | (0.21 | ) | 14.55 | 61.45 | NA | |||||||||||||||||||||||||||
NASDAQ Finl | 3,106.25 | 2/9/2015 | (0.80 | ) | 3.58 | 5.74 | (1.14 | ) | (1.14 | ) | 6.36 | 47.10 | NA | |||||||||||||||||||||||||||
NYSE | 10,826.58 | 2/9/2015 | (0.19 | ) | 1.48 | 2.75 | (0.12 | ) | (0.12 | ) | 7.67 | 33.97 | NA | |||||||||||||||||||||||||||
Russell 1000 | 1,145.66 | 2/6/2015 | (0.34 | ) | 3.04 | 3.04 | 0.11 | 0.11 | 15.60 | 53.76 | NA | |||||||||||||||||||||||||||||
Russell 2000 | 1,205.46 | 2/6/2015 | (0.27 | ) | 3.44 | 3.44 | 0.06 | 0.06 | 9.20 | 45.52 | NA | |||||||||||||||||||||||||||||
Russell 3000 | 1,225.44 | 2/6/2015 | (0.33 | ) | 3.07 | 3.07 | 0.11 | 0.11 | 15.09 | 53.07 | NA | |||||||||||||||||||||||||||||
S&P TSX Composite | 15,100.70 | 2/9/2015 | 0.11 | 1.34 | 2.91 | 3.20 | 3.20 | 9.53 | 20.83 | NA | ||||||||||||||||||||||||||||||
MSCI AC World (USD) | 420.50 | 2/6/2015 | (0.40 | ) | 2.48 | 2.48 | 0.81 | 0.81 | 7.72 | 29.38 | NA | |||||||||||||||||||||||||||||
MSCI World (USD) | 1,720.55 | 2/6/2015 | (0.40 | ) | 2.56 | 2.56 | 0.64 | 0.64 | 8.03 | 35.11 | NA | |||||||||||||||||||||||||||||
Bermuda Royal Gazette/BSX | 1,374.90 | 2/6/2015 | 0.00 | 0.79 | 0.79 | 1.31 | 1.31 | 6.25 | 25.36 | NA |
Intraday data is available for certain exchanges. In all cases, the data is at least 15 minutes delayed.
** - Non-publicly traded institutions and institutions outside of your current subscription are not included in custom indexes. Custom indexes including foreign institutions do not take into account currency translations. Data is as of the previous close.
All SNL indexes are market-value weighted; i.e., an institution’s effect on an index is proportional to that institution’s market capitalization.
Source: MSCI. MSCI makes no express or implied warranties or representations and shall have no liability whatsoever with respect to any MSCI data contained herein. The MSCI data may not be further redistributed or used as a basis for other indices or any securities or financial products.
| Mid-Atlantic: DE, DC, MD, NJ, NY, PA, PR | Midwest: IA, IN, IL, KS, KY, MI, MN, MO, ND, NE, OH, SD, WI | |
| New England: CT, ME, MA, NH, RI, VT | Southeast: AL, AR, FL, GA, MS, NC, SC, TN, VA, WV | |
| Southwest: CO, LA, NM, OK, TX, UT | West: AZ, AK, CA, HI, ID, MT, NV, OR, WA, WY | |
Source: SNL Financial | Page 2 of 2
EXHIBIT IV-4
New Jersey Thrift Acquisitions 2011 - Present
Exhibit IV-4
New Jersey Thrift Acquisitions 2011-Present
| Target Financials at Announcement | Deal Terms and Pricing at Announcement | |||||||||||||||||||||||||||||||||||||||||||||||||||||||||||||||||||
Announce Date | Complete Date | Buyer Name | ST | Target Name | ST | Total Assets ($000) | E/A (%) | TE/A (%) | ROAA (%) | ROAE (%) | NPAs/ Assets (%) | Rsrvs/ NPLs (%) | Deal Value ($M) | Value/ Share ($) | P/B (%) | P/TB (%) | P/E (x) | P/A (%) | Prem/ Cdeps (%) | |||||||||||||||||||||||||||||||||||||||||||||||||
11/11/2014 | Pending | Inland Bancorp Inc. | IL | College Savings Bank | NJ | 476,797 | 9.05 | 9.05 | 0.00 | -0.04 | 0.00 | NA | NA | NA | NA | NA | NA | NA | NA | |||||||||||||||||||||||||||||||||||||||||||||||||
09/10/2014 | Pending | Cape Bancorp Inc. | NJ | Colonial Financial Services | NJ | 550,650 | 11.45 | 11.45 | -0.13 | -1.22 | 4.29 | 24.80 | 55.82 | 14.35 | 87.84 | 87.84 | NM | 10.14 | NA | |||||||||||||||||||||||||||||||||||||||||||||||||
04/05/2013 | 01/10/2014 | Investors Bancorp Inc. (MHC) | NJ | Gateway Community Finl | NJ | 309,777 | 7.94 | 7.94 | -1.33 | -15.50 | 2.34 | 52.46 | NA | NA | NA | NA | NA | NA | NA | |||||||||||||||||||||||||||||||||||||||||||||||||
12/28/2012 | 07/02/2013 | TF Financial Corp. | PA | Roebling Financial Corp. | NJ | 161,793 | 10.44 | 10.44 | 0.08 | 0.75 | 2.09 | 45.25 | 14.58 | 8.64 | 86.24 | 86.24 | NM | 9.01 | -1.99 | |||||||||||||||||||||||||||||||||||||||||||||||||
12/19/2012 | 12/06/2013 | Investors Bancorp Inc. (MHC) | NJ | Roma Financial Corp. (MHC) | NJ | 1,835,093 | 11.92 | 11.83 | 0.23 | 2.01 | NA | NA | 459.32 | 15.44 | 215.10 | 216.91 | NM | 25.03 | NA | |||||||||||||||||||||||||||||||||||||||||||||||||
08/27/2012 | Pending | M&T Bank Corp. | NY | Hudson City Bancorp Inc. | NJ | 43,590,185 | 10.70 | 10.38 | -0.28 | -2.74 | 2.50 | 27.38 | 3,813.21 | 7.22 | 81.72 | 84.49 | NM | 8.75 | -3.59 | |||||||||||||||||||||||||||||||||||||||||||||||||
01/12/2012 | 01/12/2012 | Investor group | College Savings Bank | NJ | 530,910 | 7.96 | 7.96 | 0.34 | 4.42 | 0.00 | NA | NA | NA | NA | NA | NA | NA | NA | ||||||||||||||||||||||||||||||||||||||||||||||||||
02/15/2011 | 08/01/2011 | Ocean Shore Holding Co. | NJ | CBHC Financialcorp Inc. | NJ | 136,038 | 7.69 | 7.69 | 0.91 | 12.28 | 0.61 | 122.71 | 11.92 | 15.50 | 130.00 | 130.00 | 10.30 | 8.76 | 1.57 | |||||||||||||||||||||||||||||||||||||||||||||||||
| Average: | 5,948,905 | 9.64 | 9.59 | -0.02 | -0.01 | 1.69 | 54.52 | 870.97 | 12.23 | 120.18 | 121.10 | 10.30 | 12.34 | -1.34 | ||||||||||||||||||||||||||||||||||||||||||||||||||||||
| Median: | 503,854 | 9.75 | 9.72 | 0.04 | 0.35 | 2.09 | 45.25 | 55.82 | 14.35 | 87.84 | 87.84 | 10.30 | 9.01 | -1.99 | ||||||||||||||||||||||||||||||||||||||||||||||||||||||
Source: SNL Financial, LC.
EXHIBIT IV-5
MSB Financial Corp.
Director and Senior Management Summary Resumes
Exhibit IV-5
MSB Financial Corp.
Director and Senior Management Summary Resumes
The following directors have terms ending in 2015:
Gary T. Jolliffe,age 71; director since 1992, served as President and Chief Executive Officer of MSB Financial – Federal and Millington Savings Bank until his retirement on December 31, 2011. Mr. Jolliffe joined Millington Savings Bank in 1986 as its executive vice president and was appointed as its president in 1990. In 1992, he was also appointed to the position of chief executive officer and became a director. Mr. Jolliffe was a member of the Board of Governors of the New Jersey League of Community Bankers from 1999 through 2007 serving in numerous positions, including chairman of the New Jersey League of Community Bankers from 2004 to 2005. Mr. Jolliffe is a past member of the Board of Trustees of Freedom House Foundation, Glen Gardner, New Jersey. After 30 years as a member of the Bernardsville Rotary Club where he held the positions of director, president, vice president and treasurer, Mr. Jolliffe is now an honorary member. Mr. Jolliffe’s 49 years of banking experience including nearly 27 years with Millington Savings Bank and MSB Financial – Federal combined with his knowledge of the communities make him an integral member of our Board of Directors.
Donald J. Musso,age 55; director since 2013, is President of FinPro, Inc., a consulting and financial advisory firm that he founded in 1987. FinPro, Inc., which is located in New Jersey, specializes in providing financial advisory services to the financial institutions industry. In 2012, Mr. Musso also formed FinPro Capital Advisors, Inc. as a wholly owned subsidiary of FinPro to conduct investment banking activities. Mr. Musso has a broad background in strategic planning, asset/liability management, market feasibility assessments, de novo bank formations and investment banking. He has significant experience as a founder, significant stockholder and board member of de novo financial institutions. Mr. Musso is on the faculty of Stonier Graduate School of Banking, the Graduate School of Bank Investments and Financial Management at the University of South Carolina, the Graduate School of Banking at Colorado and the Pacific Coast Banking School. Mr. Musso’s extensive experience in all aspects of banking as well as his knowledge of the market in which MSB Financial – Federal operates makes him an extremely valuable member of the Board.
The following directors have terms ending in 2016:
E. Haas Gallaway, Jr.,age 74; director since 1987, served as president of Gallaway and Crane Funeral Home with principal offices located in Basking Ridge and a branch location located in Bernardsville, New Jersey until his retirement in September 2012. Mr. Gallaway remains with the company as a Vice President. This firm was founded by his father, E. Haas Gallaway, Sr., in Millington in 1935 and moved to its present location in Basking Ridge in 1936. Mr. Gallaway has been associated with the firm since 1960, purchased a minority position in the firm in 1963 and the remainder of the corporation in 1976. He is a licensed funeral director in the states of New Jersey and Florida. Mr. Gallaway is a member and past president of the Morris County Funeral Directors’ Association, member of The New Jersey State Funeral Directors’ Association, member of National Funeral Directors’ Association, and past president of the Bernardsville Rotary Club, former director and past president of the Somerset Hills YMCA, and a past president of the Board of Directors of Honesty House formerly of Stirling. He is the brother of Mr. W. Scott Gallaway. With his extensive business background and knowledge of and stature in the communities in which we do business, Mr. Gallaway has been a significant contributor to the Board of Directors of MSB Financial – Federal for the past 28 years.
Exhibit IV-5 (continued)
MSB Financial Corp.
Director and Senior Management Summary Resumes
W. Scott Gallaway,age 69; director since 2000, founded Gallaway Associates, a real estate brokerage and appraisal firm in 1975 and sold the brokerage portion to Remax Properties Unlimited in 2000. He is an equity partner with ReMax Alliance Realtors of Basking Ridge and spent many years as a broker, salesperson and licensed appraiser in the State of New Jersey. Mr. Gallaway is Past President of the Somerset County Board of Realtors, the Northern New Jersey Chapter of Homes for Living, the New Jersey Chapter of Certified Residential Brokers (CRB), and the Bernardsville Rotary Club. He has also served as Third District Vice President of the New Jersey Association of Realtors and Charter Scoutmaster of Troop 150, BSA, Bernardsville, N.J. He has also served on the Board of Directors of the Patriots Path Council, BSA and the Somerset Hills YMCA. Mr. Gallaway is Past Master of Congdon Overlook Lodge F&AM and Past President of the Masters, Wardens and Past Masters Association of the Eleventh District of New Jersey. Mr. Gallaway was honored as “Outstanding Citizen Volunteer of the Year” by the Borough of Bernardsville in 1993. He is the brother of E. Haas Gallaway, Jr. Mr. Gallaway’s real estate and appraisal experience and his stature in the community have made him a valuable member of the Board of Directors.
Michael A. Shriner,age 50; director since 1999, has been employed by Millington Bank since 1987 and became a vice president in 1990, a senior vice president in 1997, the executive vice president in 2002 and the chief operating officer in 2006. In January 2012 he became President and Chief Executive Officer. He was appointed to the Board of Directors in 1999. Mr. Shriner currently serves and a member of the Enterprise Risk Management Committee with the New Jersey Bankers Association. He has previously served as chairman of the Mortgage Steering Committee of the New Jersey League of Community Bankers and was a member of the Residential Lending and Affordable Housing Committee, Consumer Lending and CRA Committee and Operations and Technology Committee. Mr. Shriner is a graduate of The National School of Banking (Fairfield University). He also serves as a trustee for HomeSharing, Inc. a non-profit organization located in central New Jersey. Mr. Shriner’s 27 years of banking experience, knowledge of Millington Bank and MSB Financial – Federal and leadership skills make him an integral part of the Board of Directors.
The following directors have terms ending in 2017:
Dr. Thomas G. McCain,age 77; director since 1992, became principal of the Fairmount Avenue School in Chatham, New Jersey in 1964 after having taught in Berlin, Connecticut. He left Chatham nine years later to become assistant superintendent of schools in Freeport, New York and in 1978 was appointed superintendent of schools in Bernardsville, New Jersey, the district from which he retired from public education in 1988. In 1991, Dr. McCain founded Learning Builders, a firm that provides planning and training services to schools and businesses in several states. After twenty-two years as president and sole owner of the firm, Dr. McCain retired and closed the firm in 2013. Dr. McCain’s many years of management experience at the highest levels of public education together with his entrepreneurial experience make him a valued member of the Board of Directors.
Exhibit IV-5 (continued)
MSB Financial Corp.
Director and Senior Management Summary Resumes
Ferdinand (Fred) J. Rossi,age 73; director since 1975, has recently retired as the township administrator for the Township of Morris in Morris County, New Jersey and had held that office since 1995. Previously, Mr. Rossi served as the county administrator for Morris County, New Jersey for 15 years, and the township clerk and then administrator for the Township of Long Hill (formerly Passaic Township) for 13 years. Mr. Rossi is a lifelong resident of Long Hill Township and has served as a member of the Board for nearly 40 years. He has also served as president of the New Jersey Association of County Administrators and Managers, is a former member and president of the Bernardsville Rotary Club and is a current member of the Long Hill Township Historic Preservation Advisory Committee. Mr. Rossi has gained critical knowledge about the communities in which we operate through the positions he has held, both elected and appointed and is an important contributor to the Board of Directors.
Executive Officers
Our executive officers are elected annually by the board of directors and serve at the board’s discretion. The following individuals currently serve as executive officers and will serve in the same positions following the conversion and the offering:
Name | Position | |
| Michael A. Shriner | President, Chief Executive Officer | |
| Robert G. Russell, Jr. | Senior Vice President; Chief Operating Officer and Acting Chief Financial Officer | |
| John J. Bailey | Senior Vice President and Chief Lending Officer | |
| Jeffrey E. Smith | Senior Vice President and Chief Financial Officer | |
| Nancy E. Schmitz | Senior Vice President, Chief Credit Officer and Corporate Secretary | |
Below is information regarding our executive officers who are not also directors. Each executive officer has held his or her current position for the period indicated below. Ages presented are as of December 31, 2014.
Robert G. Russell, Jr., age 48, serves as Senior Vice President and Chief Operating Officer of Millington Savings Bank. He is also serving as Acting Chief Financial Officer while Mr. Smith is on medical leave. Prior to being hired by Millington Savings Bank in January 2015, Mr. Russell served as President and Chief Executive Officer of NJM Bank from 2013 up to its merger with Spencer Savings Bank. Prior to serving as President, Mr. Russell had served as Chief Financial Officer of NJM Bank from 2003 to 2013.
John J. Bailey, age 60, was hired by Millington Savings Bank in February 2015 as Senior Vice President and Chief Lending Officer. Prior to being hired by Millington Savings Bank, Mr. Bailey served as Senior Vice President – Credit Administration at Union Center National Bank from 2013-2014 up to its merger with ConnectOne Bank. Prior to joining Union Center National Bank, Mr. Bailey served as Managing Member and owner of Bailey Financial Consulting, LLC, a provider of consulting services to commercial banks, including loan review, credit marks and development of complex credit-based work-out scenarios. Prior to forming his own company, Mr. Bailey had served in various lending capacities at other New Jersey-based financial institutions. Currently, he also serves on the board of Colonial Financial Services, Inc., headquartered in Vineland, New Jersey.
Exhibit IV-5 (continued)
MSB Financial Corp.
Director and Senior Management Summary Resumes
Jeffrey E. Smith,age 65, has been employed by Millington Savings Bank since 1996. He was appointed as controller for Millington Savings Bank in 1998, became a Vice President in 2002, and in 2006 became Chief Financial Officer. He was named a Senior Vice President in 2015. Mr. Smith previously served as a vice president and the comptroller for United National Bank in Plainfield, New Jersey where he was employed for 12 years.
Nancy E. Schmitz, age 59, joined Millington Savings Bank in 1997 as a Commercial Lending Officer and Corporate Secretary. She was promoted to Vice President - Lending in 2006 and to Senior Vice President and Chief Credit Officer in 2015. Ms. Schmitz currently serves as a member of Lending Steering Committee with the New Jersey Bankers. She previously served on the Consumer Lending Committee of the New Jersey League of Community Bankers. Ms. Schmitz was previously employed by Lloyds Bank California for six years, where she completed a formal bank training program in Lending. She also worked at HomeFed Bank, headquartered in San Diego, California in the National Accounts group and with Imperial Corporation of America in their San Diego Corporate Banking Group. She also was a volunteer with the US Agency for International Development in the Republic of Kyrgyzstan.
Source: MSB Financial’s prospectus.
EXHIBIT IV-6
MSB Financial Corp.
Pro Forma Regulatory Capital Ratios
Exhibit IV-6
MSB Financial Corp.
Pro Forma Regulatory Capital Ratios
| Pro Forma at December 31, 2014 | ||||||||||||||||||||||||||||||||||||||||
| Historical at December 31, 2014 | Minimum of Offering Range 2,422,500 Shares at $10.00 Per Share | Midpoint of Offering Range 2,850,000 Shares at $10.00 Per Share | Maximum of Offering Range 3,277,500 Shares at $10.00 Per Share | Maximum, as Adjusted of Offering Range 3,769,125 Shares at $10.00 Per Share | ||||||||||||||||||||||||||||||||||||
| Amount | Percent of Assets (1) | Amount | Percent of Assets (1) | Amount | Percent of Assets (1) | Amount | Percent of Assets (1) | Amount | Percent of Assets (1) | |||||||||||||||||||||||||||||||
| (Dollars in thousands) | ||||||||||||||||||||||||||||||||||||||||
Total equity under generally accepted accounting principles (GAAP) | $ | 36,774 | 10.81 | % | $ | 46,331 | 13.17 | % | $ | 48,106 | 13.59 | % | $ | 49,881 | 14.01 | % | $ | 51,921 | 14.48 | % | ||||||||||||||||||||
Tier 1 (leverage) capital: | ||||||||||||||||||||||||||||||||||||||||
Actual | $ | 36,209 | 10.64 | % | $ | 45,766 | 13.01 | % | $ | 47,541 | 13.43 | % | $ | 49,316 | 13.85 | % | $ | 51,356 | 14.33 | % | ||||||||||||||||||||
Requirement | 17,016 | 5.00 | 17,591 | 5.00 | 17,697 | 5.00 | 17,803 | 5.00 | 17,925 | 5.00 | ||||||||||||||||||||||||||||||
|
|
|
|
|
|
|
|
|
|
|
|
|
|
|
|
|
|
|
| |||||||||||||||||||||
Excess | $ | 19,193 | 5.64 | % | $ | 28,175 | 8.01 | % | $ | 29,844 | 8.43 | % | $ | 31,513 | 8.85 | % | $ | 33,431 | 9.33 | % | ||||||||||||||||||||
|
|
|
|
|
|
|
|
|
|
|
|
|
|
|
|
|
|
|
| |||||||||||||||||||||
Tier 1 risk-based capital: | ||||||||||||||||||||||||||||||||||||||||
Actual (2) | $ | 36,209 | 17.68 | % | $ | 45,766 | 22.09 | % | $ | 47,541 | 22.90 | % | $ | 49,316 | 23.71 | % | $ | 51,356 | 24.63 | % | ||||||||||||||||||||
Requirement | 16,387 | 8.00 | 16,571 | 8.00 | 16,605 | 8.00 | 16,639 | 8.00 | 16,677 | 8.00 | ||||||||||||||||||||||||||||||
|
|
|
|
|
|
|
|
|
|
|
|
|
|
|
|
|
|
|
| |||||||||||||||||||||
Excess | $ | 19,822 | 9.68 | % | $ | 29,195 | 14.09 | % | $ | 30,936 | 14.90 | % | $ | 32,677 | 15.71 | % | $ | 34,679 | 16.63 | % | ||||||||||||||||||||
|
|
|
|
|
|
|
|
|
|
|
|
|
|
|
|
|
|
|
| |||||||||||||||||||||
Total risk-based capital: | ||||||||||||||||||||||||||||||||||||||||
Actual (2) | $ | 38,786 | 18.94 | % | $ | 48,343 | 23.34 | % | $ | 50,118 | 24.15 | % | $ | 51,893 | 24.95 | % | $ | 53,933 | 25.87 | % | ||||||||||||||||||||
Requirement | 20,484 | 10.00 | 20,713 | 10.00 | 20,756 | 10.00 | 20,798 | 10.00 | 20,847 | 10.00 | ||||||||||||||||||||||||||||||
|
|
|
|
|
|
|
|
|
|
|
|
|
|
|
|
|
|
|
| |||||||||||||||||||||
Excess | $ | 18,302 | 8.94 | % | $ | 27,630 | 13.34 | % | $ | 29,362 | 14.15 | % | $ | 31,095 | 14.95 | % | $ | 33,086 | 15.87 | % | ||||||||||||||||||||
|
|
|
|
|
|
|
|
|
|
|
|
|
|
|
|
|
|
|
| |||||||||||||||||||||
Common Equity Tier 1 capital: | ||||||||||||||||||||||||||||||||||||||||
Actual | $ | 36,209 | 17.68 | % | 45,766 | 13.01 | % | 47,541 | 13.43 | % | 49,316 | 13.85 | % | $ | 51,356 | 14.33 | % | |||||||||||||||||||||||
Common Equity Tier 1 Capital Requirement | 22,121 | 6.50 | 22,868 | 6.50 | 23,006 | 6.50 | 23,144 | 6.50 | 23,302 | 6.50 | ||||||||||||||||||||||||||||||
|
|
|
|
|
|
|
|
|
|
|
|
|
|
|
|
|
|
|
| |||||||||||||||||||||
Excess | $ | 14,088 | 11.18 | % | 22,898 | 6.51 | % | 24,535 | 6.93 | % | 26,172 | 7.35 | % | $ | 28,054 | 7.83 | % | |||||||||||||||||||||||
|
|
|
|
|
|
|
|
|
|
|
|
|
|
|
|
|
|
|
| |||||||||||||||||||||
Reconciliation of capital contributed to Millington Savings Bank: | ||||||||||||||||||||||||||||||||||||||||
Net proceeds contributed to Millington Savings Bank | $ | 11,495 | $ | 13,612 | $ | 15,729 | $ | 18,613 | ||||||||||||||||||||||||||||||||
Less common stock to be acquired by employee stock ownership plan | (969 | ) | (1,140 | ) | (1,311 | ) | (1,508 | ) | ||||||||||||||||||||||||||||||||
Less common stock to be acquired by new equity incentive plan | (969 | ) | (1,140 | ) | (1,311 | ) | (1,508 | ) | ||||||||||||||||||||||||||||||||
|
|
|
|
|
|
|
| |||||||||||||||||||||||||||||||||
Pro forma increase in GAAP and regulatory capital | $ | 9,557 | $ | 11,332 | $ | 13,107 | $ | 15,147 | ||||||||||||||||||||||||||||||||
|
|
|
|
|
|
|
| |||||||||||||||||||||||||||||||||
| (1) | Core capital levels are shown as a percentage of adjusted total assets of $340.3 million. Risk-based capital levels are shown as a percentage of risk-weighted assets of $204.8 million. |
| (2) | Pro forma amounts and percentages include capital contributed to Millington Bank from the offering and assume net proceeds are invested in assets that carry a 20% risk-weighting. |
Source: MSB Financial’s prospectus.
EXHIBIT IV-7
MSB Financial Corp.
Pro Forma Analysis Sheet
EXHIBIT IV-7
PRO FORMA ANALYSIS SHEET
MSB Financial Corp.
Prices as of February 6, 2015
| Subject | Peer Group | New Jersey | All Public | |||||||||||||||||||||||||||||
Valuation Midpoint Pricing Multiples | Symbol | at Midpoint | Mean | Median | Mean | Median | Mean | Median | ||||||||||||||||||||||||
Price-earnings multiple | = | P/E | 69.94 | x | 19.64x | 21.12x | 17.27x | 14.75x | 17.31x | 15.41x | ||||||||||||||||||||||
Price-core earnings multiple | = | P/CE | 69.94 | x | 20.09x | 21.12x | 19.60x | 15.10x | 16.50x | 15.10x | ||||||||||||||||||||||
Price-book ratio | = | P/B | 68.07 | % | 92.18 | % | 95.52 | % | 107.07 | % | 110.33 | % | 105.72 | % | 98.46 | % | ||||||||||||||||
Price-tangible book ratio | = | P/TB | 68.07 | % | 97.44 | % | 95.52 | % | 118.05 | % | 121.77 | % | 113.89 | % | 102.24 | % | ||||||||||||||||
Price-assets ratio | = | P/A | 12.32 | % | 12.11 | % | 11.61 | % | 17.57 | % | 16.95 | % | 13.63 | % | 12.76 | % | ||||||||||||||||
Valuation Parameters | ||||||
Pre-Conversion Earnings (Y) | $ | 708,712 | (12 Mths 12/14)(2) | |||
Pre-Conversion Core Earnings (YC) | $ | 708,712 | (12 Mths 12/14)(2) | |||
Pre-Conversion Book Value (B) | $ | 41,191,000 | (2) | |||
Pre-Conv. Tang. Book Value (B) | $ | 41,191,000 | (2) | |||
Pre-Conversion Assets (A) | $ | 340,418,000 | (2) | |||
Reinvestment Rate (R) | 1.65 | % | ||||
Tax rate (TAX) | 37.50 | % | ||||
After Tax Reinvest. Rate (R) | 1.03 | % | ||||
Est. Conversion Expenses (1)(X) | 4.48 | % | ||||
Insider Purchases | $ | 1,230,000 | ||||
Price/Share | $ | 10.00 | ||||
Foundation Cash Contribution (FC) | $ | — | ||||
Foundation Stock Contribution (FS) | $ | — | ||||
Foundation Tax Benefit (FT) | $ | — | ||||
| Adjusted | ||||||
ESOP Stock (% of Offering + Foundation) (E) | 4.00 | % | ||||
Cost of ESOP Borrowings (S) | 0.00 | % | ||||
ESOP Amortization (T) | 20.00 | Years | ||||
Stock Program (% of Offering + Foundation (M) | 4.00 | % | ||||
Stock Programs Vesting (N) | 5.00 | Years | ||||
Fixed Expenses | $ | 1,015,000 | ||||
Variable Expenses (Blended Commission %) | 0.92 | % | ||||
Percentage Sold (PCT) | 63.3058 | % | ||||
MHC Assets | $ | 166,000 | ||||
Options as (% of Offering + Foundation) (O1) | 10.00 | % | ||||
Estimated Option Value (O2) | 27.90 | % | ||||
Option Vesting Period (O3) | 5.00 | Years | ||||
% of Options taxable (O4) | 25.00 | % | ||||
Calculation of Pro Forma Value After Conversion
| 1. | V= | P/E * (Y - FC * R) | V= | $45,019,550 | ||||||||
| 1 - P/E * PCT * ((1-X-E-M-FS)*R - (1-TAX)*(E/T) - (1-TAX)*(M/N)-(1-TAX*O4)*(O1*O2/O3))) | ||||||||||||
| 2. | V= | P/Core E * (YC) | V= | $45,019,550 | ||||||||
| 1 - P/Core E * PCT * ((1-X-E-M-FS)*R - (1-TAX)*(E/T) - (1-TAX)*(M/N)-(1-TAX*O4)*(O1*O2/O3))) | ||||||||||||
| 3. | V= | P/B * (B-FC+FT) | V= | $45,019,550 | ||||||||
| 1 - P/B * PCT * (1-X-E-M) | ||||||||||||
| 4. | V= | P/TB * (B-FC+FT) | V= | $45,019,550 | ||||||||
| 1 - P/TB * PCT * (1-X-E-M) | ||||||||||||
| 5. | V= | P/A * (A-FC+FT) | V= | $45,019,550 | ||||||||
| 1 - P/A * PCT * (1-X-E-M) | ||||||||||||
Shares
Conclusion | 2nd Step Offering Shares | 2nd Step Exchange Shares | Full Conversion Shares | Plus: Foundation Shares | Total Market Capitalization Shares | Exchange Ratio | ||||||||||||||||||
Super Maximum | 3,769,125 | 2,184,710 | 5,953,835 | 0 | 5,953,835 | 1.1384 | ||||||||||||||||||
Maximum | 3,277,500 | 1,899,748 | 5,177,248 | 0 | 5,177,248 | 0.9899 | ||||||||||||||||||
Midpoint | 2,850,000 | 1,651,955 | 4,501,955 | 0 | 4,501,955 | 0.8608 | ||||||||||||||||||
Minimum | 2,422,500 | 1,404,162 | 3,826,662 | 0 | 3,826,662 | 0.7317 | ||||||||||||||||||
Market Value
Conclusion | 2nd Step Offering Value | 2nd Step Exchange Shares Value | Full Conversion $ Value | Foundation $ Value | Total Market Capitalization $ Value | |||||||||||||||
Super Maximum | $ | 37,691,250 | $ | 21,847,100 | $ | 59,538,350 | $ | 0 | $ | 59,538,350 | ||||||||||
Maximum | $ | 32,775,000 | $ | 18,997,480 | $ | 51,772,480 | 0 | $ | 51,772,480 | |||||||||||
Midpoint | $ | 28,500,000 | $ | 16,519,550 | $ | 45,019,550 | 0 | $ | 45,019,550 | |||||||||||
Minimum | $ | 24,225,000 | $ | 14,041,620 | $ | 38,266,620 | 0 | $ | 38,266,620 | |||||||||||
| (1) | Estimated offering expenses at midpoint of the offering. |
| (2) | Adjusted to reflect consolidation and reinvesment of $166,000 of net MHC net assets |
EXHIBIT IV-8
MSB Financial Corp.
Pro Forma Effect of Conversion Proceeds
Exhibit IV-8
PRO FORMA EFFECT OF CONVERSION PROCEEDS
MSB Financial Corp.
At the Minimum of the Range
| 1. | Fully Converted Value and Exchange Ratio |
Fully Converted Value | $ | 38,266,620 | ||
Exchange Ratio | 0.73168 | |||
2nd Step Offering Proceeds | $ | 24,225,000 | ||
Less: Estimated Offering Expenses | 1,235,260 | |||
|
| |||
2nd Step Net Conversion Proceeds (Including Foundation) | $ | 22,989,740 | ||
| 2. | Estimated Additional Income from Conversion Proceeds |
Net Conversion Proceeds | $ | 22,989,740 | ||
Less: Cash Contribution to Foundation | 0 | |||
Less: ESOP Stock Purchases (1) | (969,000 | ) | ||
Less: RRP Stock Purchases (2) | (969,000 | ) | ||
|
| |||
Net Cash Proceeds | $ | 21,051,740 | ||
Estimated after-tax net incremental rate of return | 1.03 | % | ||
|
| |||
Earnings Increase | $ | 217,096 | ||
Less: Consolidated interest cost of ESOP borrowings | 0 | |||
Less: Amortization of ESOP borrowings(3) | (30,281 | ) | ||
Less: RRP Vesting (3) | (121,125 | ) | ||
Less: Option Plan Vesting (4) | (122,503 | ) | ||
|
| |||
Net Earnings Increase | ($ | 56,813 | ) |
| 3. | Pro Forma Earnings |
| Before Conversion(5) | Net Earnings Increase | After Conversion | ||||||||||
12 Months ended March 31, 2014 (reported) | $ | 708,712 | ($ | 56,813 | ) | $ | 651,899 | |||||
12 Months ended March 31, 2014 (core) | $ | 708,712 | ($ | 56,813 | ) | $ | 651,899 | |||||
| 4. | Pro Forma Net Worth |
| Before Conversion(5) | Net Cash Proceeds | Tax Benefit and Other | After Conversion | |||||||||||||
March 31, 2014 | $ | 41,191,000 | $ | 21,051,740 | $ | — | $ | 62,242,740 | ||||||||
March 31, 2014 (Tangible) | $ | 41,191,000 | $ | 21,051,740 | $ | 0 | $ | 62,242,740 | ||||||||
| 5. | Pro Forma Assets |
| Before Conversion(5) | Net Cash Proceeds | Tax Benefit and Other | After Conversion | |||||||||||||
March 31, 2014 | $ | 340,418,000 | $ | 21,051,740 | $ | 0 | $ | 361,469,740 | ||||||||
| (1) | Includes ESOP purchases of 4% of the second step offering. |
| (2) | Includes RRP purchases of 4% of the second step offering. |
| (3) | ESOP amortized over 10 years, RRP amortized over 5 years, tax effected at: 37.50% |
| (4) | Option valuation based on Black-Scholes model, 5 year vesting, and assuming 25% taxable. |
| (5) | Adjusted to reflect consolidation and reinvestment of net MHC assets. |
Exhibit IV-8
PRO FORMA EFFECT OF CONVERSION PROCEEDS
MSB Financial Corp.
At the Midpoint of the Range
| 1. | Fully Converted Value and Exchange Ratio |
Fully Converted Value | $ | 45,019,550 | ||
Exchange Ratio | 0.86080 | |||
2nd Step Offering Proceeds | $ | 28,500,000 | ||
Less: Estimated Offering Expenses | 1,276,300 | |||
|
| |||
2nd Step Net Conversion Proceeds (Including Foundation) | $ | 27,223,700 | ||
| 2. | Estimated Additional Income from Conversion Proceeds |
Net Conversion Proceeds | $ | 27,223,700 | ||
Less: Cash Contribution to Foundation | 0 | |||
Less: ESOP Stock Purchases (1) | (1,140,000 | ) | ||
Less: RRP Stock Purchases (2) | (1,140,000 | ) | ||
|
| |||
Net Cash Proceeds | $ | 24,943,700 | ||
Estimated after-tax net incremental rate of return | 1.03 | % | ||
|
| |||
Earnings Increase | $ | 257,232 | ||
Less: Consolidated interest cost of ESOP borrowings | 0 | |||
Less: Amortization of ESOP borrowings(3) | (35,625 | ) | ||
Less: RRP Vesting (3) | (142,500 | ) | ||
Less: Option Plan Vesting (4) | (144,121 | ) | ||
|
| |||
Net Earnings Increase | ($ | 65,014 | ) |
| 3. | Pro Forma Earnings |
| Before Conversion(5) | Net Earnings Increase | After Conversion | ||||||||||
12 Months ended March 31, 2014 (reported) | $ | 708,712 | ($ | 65,014 | ) | $ | 643,698 | |||||
12 Months ended March 31, 2014 (core) | $ | 708,712 | ($ | 65,014 | ) | $ | 643,698 | |||||
| 4. | Pro Forma Net Worth |
| Before Conversion (5) | Net Cash Proceeds | Tax Benefit of Foundation | After Conversion | |||||||||||||
March 31, 2014 | $ | 41,191,000 | $ | 24,943,700 | $ | — | $ | 66,134,700 | ||||||||
March 31, 2014 (Tangible) | $ | 41,191,000 | $ | 24,943,700 | $ | 0 | $ | 66,134,700 | ||||||||
| 5. | Pro Forma Assets |
| Before Conversion (5) | Net Cash Proceeds | Tax Benefit of Foundation | After Conversion | |||||||||||||
March 31, 2014 | $ | 340,418,000 | $ | 24,943,700 | $ | 0 | $ | 365,361,700 | ||||||||
| (1) | Includes ESOP purchases of 4% of the second step offering. |
| (2) | Includes RRP purchases of 4% of the second step offering. |
| (3) | ESOP amortized over 10 years, RRP amortized over 5 years, tax effected at: 37.50% |
| (4) | Option valuation based on Black-Scholes model, 5 year vesting, and assuming 25% taxable. |
| (5) | Adjusted to reflect consolidation and reinvestment of net MHC assets. |
Exhibit IV-8
PRO FORMA EFFECT OF CONVERSION PROCEEDS
MSB Financial Corp.
At the Maximum of the Range
| 1. | Fully Converted Value and Exchange Ratio |
Fully Converted Value | $ | 51,772,480 | ||
Exchange Ratio | 0.98992 | |||
2nd Step Offering Proceeds | $ | 32,775,000 | ||
Less: Estimated Offering Expenses | 1,317,340 | |||
|
| |||
2nd Step Net Conversion Proceeds (Including Foundation) | $ | 31,457,660 | ||
| 2. | Estimated Additional Income from Conversion Proceeds |
Net Conversion Proceeds | $ | 31,457,660 | ||
Less: Cash Contribution to Foundation | 0 | |||
Less: ESOP Stock Purchases (1) | (1,311,000 | ) | ||
Less: RRP Stock Purchases (2) | (1,311,000 | ) | ||
|
| |||
Net Cash Proceeds | $ | 28,835,660 | ||
Estimated after-tax net incremental rate of return | 1.03 | % | ||
|
| |||
Earnings Increase | $ | 297,368 | ||
Less: Consolidated interest cost of ESOP borrowings | 0 | |||
Less: Amortization of ESOP borrowings(3) | (40,969 | ) | ||
Less: RRP Vesting (3) | (163,875 | ) | ||
Less: Option Plan Vesting (4) | (165,739 | ) | ||
|
| |||
Net Earnings Increase | ($ | 73,215 | ) |
| 3. | Pro Forma Earnings |
| Net | ||||||||||||
| Before | Earnings | After | ||||||||||
| Conversion(5) | Increase | Conversion | ||||||||||
12 Months ended March 31, 2014 (reported) | $ | 708,712 | ($ | 73,215 | ) | $ | 635,497 | |||||
12 Months ended March 31, 2014 (core) | $ | 708,712 | ($ | 73,215 | ) | $ | 635,497 | |||||
| 4. | Pro Forma Net Worth |
| Before | Net Cash | �� | Tax Benefit | After | ||||||||||||
| Conversion (5) | Proceeds | of Foundation | Conversion | |||||||||||||
March 31, 2014 | $ | 41,191,000 | $ | 28,835,660 | $ | — | $ | 70,026,660 | ||||||||
March 31, 2014 (Tangible) | $ | 41,191,000 | $ | 28,835,660 | $ | 0 | $ | 70,026,660 | ||||||||
| 5. | Pro Forma Assets |
| Before | Net Cash | Tax Benefit | After | |||||||||||||
| Conversion (5) | Proceeds | of Foundation | Conversion | |||||||||||||
March 31, 2014 | $ | 340,418,000 | $ | 28,835,660 | $ | 0 | $ | 369,253,660 | ||||||||
| (1) | Includes ESOP purchases of 4% of the second step offering. |
| (2) | Includes RRP purchases of 4% of the second step offering. |
| (3) | ESOP amortized over 10 years, RRP amortized over 5 years, tax effected at: 37.50% |
| (4) | Option valuation based on Black-Scholes model, 5 year vesting, and assuming 25% taxable. |
| (5) | Adjusted to reflect consolidation and reinvestment of net MHC assets. |
Exhibit IV-8
PRO FORMA EFFECT OF CONVERSION PROCEEDS
MSB Financial Corp.
At the Super Maximum Value
| 1. | Fully Converted Value and Exchange Ratio |
Fully Converted Value | $ | 59,538,350 | ||
Exchange Ratio | 1.13841 | |||
2nd Step Offering Proceeds | $ | 37,691,250 | ||
Less: Estimated Offering Expenses | 1,364,536 | |||
|
| |||
2nd Step Net Conversion Proceeds (Including Foundation) | $ | 36,326,714 | ||
| 2. | Estimated Additional Income from Conversion Proceeds |
Net Conversion Proceeds | $ | 36,326,714 | ||
Less: Cash Contribution to Foundation | 0 | |||
Less: ESOP Stock Purchases (1) | (1,507,650 | ) | ||
Less: RRP Stock Purchases (2) | (1,507,650 | ) | ||
|
| |||
Net Cash Proceeds | $ | 33,311,414 | ||
Estimated after-tax net incremental rate of return | 1.03 | % | ||
|
| |||
Earnings Increase | $ | 343,524 | ||
Less: Consolidated interest cost of ESOP borrowings | 0 | |||
Less: Amortization of ESOP borrowings(3) | (47,114 | ) | ||
Less: RRP Vesting (3) | (188,456 | ) | ||
Less: Option Plan Vesting (4) | (190,600 | ) | ||
|
| |||
Net Earnings Increase | ($ | 82,646 | ) |
| 3. | Pro Forma Earnings |
| Net | ||||||||||||
| Before | Earnings | After | ||||||||||
| Conversion(5) | Increase | Conversion | ||||||||||
12 Months ended March 31, 2014 (reported) | $ | 708,712 | ($ | 82,646 | ) | $ | 626,066 | |||||
12 Months ended March 31, 2014 (core) | $ | 708,712 | ($ | 82,646 | ) | $ | 626,066 | |||||
| 4. | Pro Forma Net Worth |
| Before | Net Cash | Tax Benefit | After | |||||||||||||
| Conversion (5) | Proceeds | of Foundation | Conversion | |||||||||||||
March 31, 2014 | $ | 41,191,000 | $ | 33,311,414 | $ | — | $ | 74,502,414 | ||||||||
March 31, 2014 (Tangible) | $ | 41,191,000 | $ | 33,311,414 | $ | 0 | $ | 74,502,414 | ||||||||
| 5. | Pro Forma Assets |
| Before | Net Cash | Tax Benefit | After | |||||||||||||
| Conversion (5) | Proceeds | of Foundation | Conversion | |||||||||||||
March 31, 2014 | $ | 340,418,000 | $ | 33,311,414 | $ | 0 | $ | 373,729,414 | ||||||||
| (1) | Includes ESOP purchases of 4% of the second step offering. |
| (2) | Includes RRP purchases of 4% of the second step offering. |
| (3) | ESOP amortized over 10 years, RRP amortized over 5 years, tax effected at: 37.50% |
| (4) | Option valuation based on Black-Scholes model, 5 year vesting, and assuming 25% taxable. |
| (5) | Adjusted to reflect consolidation and reinvestment of net MHC assets. |
EXHIBIT IV-9
Calculation of Minority Ownership Dilution in a Second-Step Offering
Exhibit IV-9
MSB Financial Corp.
Impact of MHC Assets & Waived Dividends on Minority Ownership In 2nd Step
Financial and Stock Ownership Data as of December 31, 2014
Reflects Appraised Pro Forma Market Value as of February 6, 2015
Key Input Assumptions
Mid-Tier Common Stockholders’ Equity | $ | 41,025,000 | (BOOK) | |||
Aggregate Dividends Waived by MHC | $ | 1,576,586 | (WAIVED DIVIDENDS) | |||
Minority Ownership Interest | 38.3019 | % | (PCT) | |||
Pro Forma Market Value | $ | 45,019,550 | (VALUE) | |||
Market Value of MHC Assets (Other than Stock in Mid-Tier) | $ | 166,000 | (MHC ASSETS) |
Adjustment for MHC Assets & Waived Dividends - 2 Step Calculation (as required by FDIC & FRB)
| (BOOK - WAIVED DIVIDENDS) x PCT | ||||
| Step 1: To Account for Waiver of Dividends | = | BOOK | ||
| = | 36.8300% | |||
| (VALUE - MHC ASSETS) x Step 1 | ||||
| Step 2: To Account for MHC Assets | = | VALUE | ||
| = | 36.6942% (rounded) | |||
Current Ownership
MHC Shares | 3,091,344 | 61.70 | % | |||||
Public Shares | 1,919,093 | 38.30 | % | |||||
|
|
|
| |||||
Total Shares | 5,010,437 | 100.00 | % |
EXHIBIT V-1
RP® Financial, LC.
Firm Qualifications Statement
RP FINANCIAL, LC.
Advisory | Planning | Valuation
FIRM QUALIFICATION STATEMENT
RP® Financial, LC. (“RP Financial”) provides financial and management consulting, merger advisory and valuation services to the financial services companies, including banks, thrifts, credit unions, insurance companies, mortgage companies and others. We offer a broad array of services, high quality and prompt service, hands-on involvement by our senior staff, careful structuring of strategic initiatives and sophisticated valuation and other analyses consistent with industry practices and regulatory requirements. Our staff has extensive consulting, valuation, financial advisory and industry backgrounds.
STRATEGIC PLANNING SERVICES
RP Financial’s strategic planning services, for established or de novo banking companies, provide effective feasible plans with quantifiable results to enhance shareholder value, achieve regulatory approval or realize other objectives. We conduct situation analyses; establish mission/vision statements, develope strategic goals and objectives; and identify strategies to enhance value, address capital, increase earnings, manage risk and tackle operational or organizational matters. Our proprietary financial simulation models facilitate the evaluation of the feasibility, impact and merit of alternative financial strategies.
MERGER ADVISORY SERVICES
RP Financial’s merger advisory services include targeting buyers and sellers, assessing acquisition merit, conducting due diligence, negotiating and structuring deal terms, preparing merger business plans and financial simulations, rendering fairness opinions, preparing fair valuation analyses and supporting post-merger strategies. RP Financial is also expert in de novo charters, shelf charters and failed bank deals with loss sharing or other assistance. Through financial simulations, valuation proficiency and regulatory familiarity, RP Financial’s merger advisory services center on enhancing shareholder returns.
VALUATION SERVICES
RP Financial’s extensive valuation practice includes mergers, thrift stock conversions, insurance company demutualizations, merger valuation and goodwill impairment, ESOPs, going private, secondary offerings and other purposes. We are highly experienced in performing appraisals conforming with regulatory guidelines and appraisal standards. RP Financial is the nation’s leading valuation firm for thrift stock conversions, with offerings ranging up to $4 billion.
MANAGEMENT STUDIES
RP Financial provides effective organizational planning, and we are often engaged to prepare independent management studies required for regulatory enforcement actions. We evaluate Board, management and staffing needs, assess existing talent and capabilities and make strategic recommendations for new positions, replacement, succession and other organizational matters.
ENTERPRISE RISK ASSESSMENT SERVICES
RP Financial provides effective enterprise risk assessment consulting services to assist our clients in evaluating the degree to which they have properly identified, understood, measured, monitored and controlled enterprise risk as part of a deliberate risk/reward strategy and to help them implement strategies to mitigate risk, enhance performance, ensure effective reporting and compliance with laws and regulations and avoid potential future damage to their reputation and associated consequences and to mitigate residual risk and unanticipated losses.
OTHER CONSULTING SERVICES
RP Financial provides other consulting services including evaluating regulatory changes, development diversification and branching strategies, conducting feasibility studies and other research, and preparing management studies in response to regulatory enforcement actions. We assist clients with CRA plans and revising policies and procedures. Our other consulting services are aided by proprietary valuation and financial simulation models.
KEY PERSONNEL (Years of Relevant Experience & Contact Information)
Ronald S. Riggins, Managing Director (34) | (703) 647-6543 | rriggins@rpfinancial.com | ||
William E. Pommerening, Managing Director (31) | (703) 647-6546 | wpommerening@rpfinancial.com | ||
Marcus Faust, Director (27) | (703) 647-6553 | mfaust@rpfinancial.com | ||
Gregory E. Dunn, Director (32) | (703) 647-6548 | gdunn@rpfinancial.com | ||
James P. Hennessey, Director (29) | (703) 647-6544 | jhennessey@rpfinancial.com | ||
James J. Oren, Director (28) | (703) 647-6549 | joren@rpfinancial.com | ||
Timothy M. Biddle, Senior Vice President (25) | (703) 647-6552 | tbiddle@rpfinancial.com | ||
Carla H. Pollard, Senior Vice President (26) | (703) 647-6556 | cpollard@rpfinancial.com |
RP Financial, LC. 1100 North Glebe Road, Suite 600 Arlington, VA 22201 | 1 | Phone: (703) 528-1700 Fax: (703) 528-1788 www.rpfinancial.com |