Exhibit 99.3

MANAGEMENT’S DISCUSSION AND ANALYSIS
FOR THE YEAR ENDED
DECEMBER 31, 2017
March 14, 2018
TABLE OF CONTENTS
MANAGEMENT’S DISCUSSION AND ANALYSIS
This Management’s Discussion and Analysis (this “MD&A”) provides a review of the results of operations, financial condition and cash flows for The Stars Group Inc. (“The Stars Group” or the “Corporation”) on a consolidated basis, for the three months and year ended December 31, 2017. This document should be read in conjunction with the information contained in the Corporation’s audited consolidated financial statements and related notes for the year ended December 31, 2017 (the “2017 Annual Financial Statements”) and the Corporation’s annual information form for the year ended December 31, 2017 (the “2017 Annual Information Form” and together with this MD&A and the 2017 Annual Financial Statements, the “2017 Annual Reports”). These documents and additional information regarding the business of the Corporation are available on the System for Electronic Document Analysis and Retrieval (“SEDAR”) at www.sedar.com, the Electronic Data Gathering, Analysis, and Retrieval system (“EDGAR”) at www.sec.gov, and the Corporation’s website at www.starsgroup.com.
For reporting purposes, the Corporation prepared the 2017 Annual Financial Statements in U.S. dollars and, unless otherwise indicated, in conformity with International Financial Reporting Standards (“IFRS”) as issued by the International Accounting Standards Board (“IASB”). The financial information contained in this MD&A was derived from the 2017 Annual Financial Statements. Unless otherwise indicated, all dollar (“$”) and “USD” amounts and references in this MD&A are in and to U.S. dollars, references to ‘‘EUR’’ or “€” are to European Euros, references to “GBP” are to Great Britain pounds sterling and references to ‘‘CDN’’ or “CDN $” are to Canadian dollars. Unless otherwise indicated, all references to a specific “note” refer to the notes to the 2017 Annual Financial Statements.
As at December 31, 2017, the Corporation had two major lines of operations within its online gaming business, real-money online poker (“Poker”) and real-money online casino and sportsbook (“Casino & Sportsbook”). As it relates to these two product lines, online revenues include revenues generated through the Corporation’s online, mobile and desktop client platforms.
This MD&A references non-IFRS and non-U.S. generally accepted accounting principles (“GAAP”) financial measures, including those under the headings “Selected Financial Information” and “Key Metrics” below. The Corporation believes these non-IFRS and non-U.S. GAAP financial measures will provide investors with useful supplemental information about the financial performance of its business, enable comparison of financial results between periods where certain items may vary independent of business performance, and allow for greater transparency with respect to key metrics used by management in operating its business and making decisions. Although management believes these financial measures are important in evaluating the Corporation, they are not intended to be considered in isolation or as a substitute for, or superior to, financial information prepared and presented in accordance with IFRS or U.S. GAAP. They are not recognized measures under IFRS or U.S. GAAP and do not have standardized meanings prescribed by IFRS or U.S. GAAP. These measures may be different from non-IFRS and non-U.S. GAAP financial measures used by other companies, limiting its usefulness for comparison purposes. Moreover, presentation of certain of these measures is provided for period-over-period comparison purposes, and investors should be cautioned that the effect of the adjustments thereto provided herein have an actual effect on the Corporation’s operating results.
Unless otherwise stated, in preparing this MD&A the Corporation has considered information available to it up to March 14, 2018, the date the Corporation’s board of directors (the “Board”) approved this MD&A and the 2017 Annual Reports.
1
CAUTION REGARDING FORWARD-LOOKING STATEMENTS
The 2017 Annual Reports, including this MD&A, contain certain information that may constitute forward-looking information and statements (collectively, “forward-looking statements”) within the meaning of the Private Securities Litigation Reform Act of 1995 and applicable securities laws, including financial and operational expectations and projections. These statements, other than statements of historical fact, are based on management’s current expectations and are subject to a number of risks, uncertainties, and assumptions, including market and economic conditions, business prospects or opportunities, future plans and strategies, projections, technological developments, anticipated events and trends and regulatory changes that affect the Corporation, its subsidiaries and their respective customers and industries. Although the Corporation and management believe the expectations reflected in such forward-looking statements are reasonable and are based on reasonable assumptions and estimates as of the date hereof, there can be no assurance that these assumptions or estimates are accurate or that any of these expectations will prove accurate. Forward-looking statements are inherently subject to significant business, regulatory, economic and competitive risks, uncertainties and contingencies that could cause actual events to differ materially from those expressed or implied in such statements. Forward-looking statements are often, but not always, identified by the use of words such as “seek”, “anticipate”, “plan”, “continue”, “estimate”, “expect”, “may”, “will”, “project”, “predict”, “potential”, “targeting”, “intend”, “could”, “might”, “would”, “should”, “believe”, “objective”, “ongoing”, “imply” or the negative of these words or other variations or synonyms of these words or comparable terminology and similar expressions.
Specific factors and assumptions include, without limitation, the following factors, which are discussed in greater detail in the “Risk Factors and Uncertainties” section of the 2017 Annual Information Form: the heavily regulated industry in which the Corporation carries on its business; interactive entertainment and online and mobile gaming generally; current and future laws or regulations and new interpretations of existing laws or regulations, or potential prohibitions, with respect to interactive entertainment or online gaming or activities related to or necessary for the operation and offering of online gaming; potential changes to the gaming regulatory framework; legal and regulatory requirements; ability to obtain, maintain and comply with all applicable and required licenses, permits and certifications to offer, operate, and market its products and services, including difficulties or delays in the same; significant barriers to entry; competition and the competitive environment within the Corporation’s addressable markets and industries; impact of inability to complete future acquisitions or to integrate businesses successfully; risks associated with advancements in technology, including artificial intelligence; ability to develop and enhance existing products and services and new commercially viable products and services; ability to mitigate foreign exchange and currency risks; ability to mitigate tax risks and adverse tax consequences, including, without limitation, the imposition of new or additional taxes, such as value-added (“VAT”) and point of consumption taxes, and gaming duties; risks of foreign operations generally; protection of proprietary technology and intellectual property rights; ability to recruit and retain management and other qualified personnel, including key technical, sales and marketing personnel; defects in the Corporation’s products or services; losses due to fraudulent activities; management of growth; contract awards; potential financial opportunities in addressable markets and with respect to individual contracts; ability of technology infrastructure to meet applicable demand; systems, networks, telecommunications or service disruptions or failures or cyber-attacks; regulations and laws that may be adopted with respect to the Internet and electronic commerce or that may otherwise impact the Corporation in the jurisdictions where it is currently doing business or intends to do business, particularly those related to online gaming or that could impact the ability to provide online gaming products and services, including, without limitation, as it relates to payment processing; ability to obtain additional financing on reasonable terms or at all; refinancing risks; customer and operator preferences and changes in the economy; dependency on customers’ acceptance of its products and services; consolidation within the gaming industry; litigation costs and outcomes; expansion within existing and into new markets; relationships with vendors and distributors; and natural events. These factors are not intended to represent a complete list of the factors that could affect the Corporation; however, these factors, as well as those risk factors presented under the heading “Risk Factors and Uncertainties” in the 2017 Annual Information Form, elsewhere in this MD&A and the 2017 Annual Reports and in other filings that The Stars Group has made and may make in the future with applicable securities authorities, should be considered carefully.
Shareholders and investors should not place undue reliance on forward-looking statements as the plans, assumptions, intentions or expectations upon which they are based might not occur. The forward-looking statements contained in this MD&A are expressly qualified by this cautionary statement. Unless otherwise indicated by the Corporation, forward-looking statements in this MD&A describe the Corporation’s expectations as of March 14, 2018 and, accordingly, are subject to change after such date. The Corporation does not undertake to update or revise any forward-looking statements, except in accordance with applicable securities laws.
2
LIMITATIONS OF KEY METRICS AND OTHER DATA
The numbers for the Corporation’s key metrics, which include quarterly real-money active uniques (“QAUs”), quarterly net yield (“QNY”), and net deposits (“Net Deposits”), as well as certain other metrics, are calculated using internal company data based on the activity of customer accounts. While these numbers are based on what the Corporation believes to be reasonable judgments and estimates of its customer base for the applicable period of measurement, there are certain challenges and limitations in measuring the usage of its products and services across its customer base. Such challenges and limitations may also affect the Corporation’s understanding of certain details of its business. In addition, the Corporation’s key metrics and related estimates may differ from estimates published by third parties or from similarly-titled metrics of its competitors due to differences in methodology and access to information. Moreover, QNY is a non-IFRS measure. For important information on the Corporation’s non-IFRS measures, see the information presented in italics under the heading “Management’s Discussion and Analysis” above and the information under “Key Metrics” and “Selected Financial Information—Other Financial Information” below. The Corporation continually seeks to improve its estimates of its active customer base, and such estimates may change due to improvements or changes in the Corporation’s methodology.
For example, the methodologies used to measure the Corporation’s customer metrics are based on significant internal judgments and estimates, and may be susceptible to algorithm, calculation or other technical errors, including, without limitation, how certain metrics may be defined (and the assumptions and considerations made and included in, or excluded from, such definitions). Moreover, the Corporation’s business intelligence tools may fail on a particular data backup or upload, which could lead to certain customer activity not being properly recorded or accurately included, in the calculation of a particular key metric, such as QAUs. In addition, as it relates to certain of the Corporation’s product and service offerings, customers are required to provide certain information when registering and establishing real-money accounts, which could lead to the creation of multiple accounts for the same customer (in nearly all instances such account creation would violate the Corporation’s applicable terms and conditions of use) and customers could take advantage of certain customer acquisition incentives to register and interact with the Corporation’s products and services, but not actually deposit or transfer funds into their real-money accounts with the Corporation. Although the Corporation typically addresses and corrects any such failures, duplications and inaccuracies relatively quickly, its metrics are still susceptible to the same and its estimations of such metrics may be lower or higher than the actual numbers.
The Corporation regularly reviews its processes for calculating and defining these metrics, and from time to time it may discover inaccuracies in its metrics or make adjustments to improve their accuracy that may result in the recalculation or replacement of historical metrics or introduction of new metrics. These changes may also include adjustments to underlying data, such as changes to historical revenue amounts as a result of certain accounting reallocations made in later periods and adjustments to definitions in an effort to provide what management believes may be the most helpful and relevant data. The Corporation also continuously seeks to improve its ability to identify irregularities and inaccuracies (and suspend any customer accounts that violate its terms and conditions of use and limit or eliminate promotional incentives that are susceptible to abuse), and its key metrics or estimates of key metrics may change due to improvements or changes in its methodology. Additionally, all the Corporation’s metrics are subject to software bugs, inconsistencies in the Corporation’s systems and human error. Notwithstanding, the Corporation believes that any such irregularities, inaccuracies or adjustments are immaterial unless otherwise stated.
If the public or investors do not perceive the Corporation’s customer metrics to accurately represent its customer base, or if it discovers material inaccuracies in its customer metrics, the Corporation may be subject to certain liability and its reputation may be harmed, which could negatively affect its business, results of operations and financial condition.
3
OVERVIEW AND OUTLOOK
Business Overview and Background
The Stars Group is a leading provider of technology-based products and services in the global gaming and interactive entertainment industries. The Stars Group’s gaming business is its primary business and source of revenue and currently consists of the operations of Stars Interactive Holdings (IOM) Limited and its subsidiaries and affiliates (collectively, “Stars Interactive Group”), which it acquired in August 2014 (the “Stars Interactive Group Acquisition”), and CrownBet Holdings Pty Limited and its subsidiaries and affiliates (“CrownBet”), in which it acquired a majority equity interest in February 2018.
Through its Stars Interactive Group division, which is based in the Isle of Man and operates globally, and CrownBet, which operates and is based in Australia, The Stars Group owns and operates gaming and related interactive entertainment businesses, such as online (including desktop and mobile) real-money poker, casino and sports betting (also known as sportsbook) and play-money poker and casino. The Corporation offers these products and services under several ultimately owned brands, including, among others, PokerStars, PokerStars Casino, BetStars, Full Tilt, and the PokerStars Players No Limit Hold’em Championship, European Poker Tour, PokerStars Caribbean Adventure, Latin American Poker Tour, Asia Pacific Poker Tour, PokerStars Festival, and PokerStars MEGASTACK live poker tour and event brands. These brands together have millions of registered customers globally and collectively form the largest poker business in the world, comprising online poker games and tournaments, sponsored live poker competitions, marketing arrangements for branded poker rooms in popular casinos in major cities around the world, and poker programming and content created for television and online audiences. The Stars Group currently estimates that PokerStars holds a significant majority of the market share of real-money poker player liquidity, or the volume of real-money online poker players, in regions where it offers real-money online poker and is among the leaders in play-money online poker player liquidity. The Stars Group also estimates that its combined online casino, including PokerStars Casino, is currently among the world’s largest and fastest growing and currently has one of the largest active player bases among its competitors. The Stars Group also has an emerging sportsbook, BetStars, that is currently primarily focused on regulated jurisdictions within the European Union and a majority equity interest in CrownBet, which currently operates in the regulated Australian online sports betting market.
In addition to pursuing growth opportunities in poker in existing and new markets, including through the innovation of new product features and enhancements, geographic expansion, improvements to the poker ecosystem (as discussed below), and increased marketing campaigns, The Stars Group believes there are potentially significant opportunities for growth in the online casino and sportsbook verticals. The Stars Group believes that such potential opportunities include the ability to leverage its brand and product recognition (particularly poker) to acquire new customers, including recreational customers, and capitalize on network effects and cross-selling these new verticals to its existing and new customer base. The Stars Group continues to improve its online casino and sportsbook product offerings, including through mobile applications and other enhancements, expanding its game and sports portfolios and geographic reach, and launching external marketing campaigns. In addition to online casino and sportsbook, The Stars Group currently intends to expand upon and explore other growth opportunities, including, without limitation, expanding upon its current social gaming offering, and pursuing other interactive entertainment opportunities.
The Stars Group believes it has a premier, scalable platform that diversifies its products and services both geographically and across verticals and as such, continuously works to enhance this proprietary platform. The Corporation has invested significantly in its technology infrastructure since inception to provide a positive, best-in-class experience for its customers, not only from a gameplay perspective, but most importantly, with respect to security and integrity across its product and service offerings. The Stars Group dedicates nearly all of its research and development investments to its online gaming business, which seeks to provide broad market applications for products and services derived from its technology base, and expects to continue investing significantly in research and development in an effort to constantly improve customer experience and engagement. To support its strong reputation for security and integrity, The Stars Group employs what it believes to be industry‑leading practices and systems with respect to various aspects of its technology infrastructure, including, but not limited to, information and payment security, game integrity, customer fund protection, marketing and promotion, customer support, responsible gaming, and loyalty programs, rebates and rewards (i.e., incentives).
The Stars Group also monitors and assesses its products and services, including through advanced business intelligence analytics regarding customer engagement and behavior, to continuously improve the experience for all
4
of its customers and to ensure a safe, competitive and enjoyable environment. This includes implementing policies and controls over the use of abusive technological tools and software, assessing pricing and incentives, and introducing improvements to product ecosystems. In particular, The Stars Group has implemented, and continues to implement, policies and controls to significantly reduce or eliminate the use of certain sophisticated technology that may provide an artificial competitive advantage for certain customers over others. It has also made, and may continue to make, changes to its pricing and incentives to ensure that they align with its objectives to reward customers for loyalty and behavior that is positive to the overall customer experience and the particular product’s ecosystem. For example, since the beginning of 2016, The Stars Group has introduced certain improvements in the poker ecosystem to benefit and attract high-value, net-depositing customers (primarily recreational players) and reduce incentives for high-volume, net-withdrawing customers, and adjust the pricing on poker games and tournaments (also known as rake and tournament fees) on certain offerings (which resulted in an effective increase in pricing). Most recently, the Corporation launched the Stars Rewards program in July 2017, which is an integrated cross vertical loyalty program focused on improving customer engagement, retention and the player experience. The Stars Rewards program seeks to offer an exciting, personalized gaming experience that rewards players for their overall gameplay across poker, casino and sportsbook, in each case where available. Stars Rewards gives players randomized prizes based on a number of factors, including the time passed since the player made his or her first real-money deposit, volume of play, player impact on the overall ecosystem, such as whether the player is a net-withdrawing versus net-depositing player, and product and game selection.
The Stars Group anticipates that these and future planned improvements, despite an expected overall decrease in volume of gameplay and total deposit balances held by high-volume, net-withdrawing players, will create a more attractive environment and experience for recreational players, allowing them to play longer on its platforms and engage in its various product offerings. The Stars Group believes these initiatives have led and may continue to lead to an increase in Net Deposits. The Stars Group has been, among other things, reinvesting resulting savings and funds from the poker ecosystem improvements into marketing, increased incentives for certain customers, bonuses and promotions, new poker products and services, research and development, and to help offset costs in the business, including certain taxes, gaming duties and other costs related to promoting the regulation of online gaming in various jurisdictions.
The Stars Group, through certain of its subsidiaries, is licensed or approved to offer, or offers under third-party licenses or approvals, its products and services in various jurisdictions throughout the world, including in Europe, both within and outside of the European Union, North America and elsewhere. In particular, PokerStars is the world’s most licensed online gaming brand, holding licenses or related operating approvals in 17 jurisdictions. The Stars Group intends to seek licensure with respect to more European Union member states if and when such member states introduce their own independent regulatory and licensing regimes compliant with European Union law. Outside of the European Union, The Stars Group anticipates there may be a potential for the regulation of online gaming, including online poker, casino and/or sports betting, including with respect to shared liquidity, and that this may result in potential licensing or partnerships with private operators in various jurisdictions. The Stars Group supports the regulation of online gaming, including licensing and taxation regimes and pooled poker liquidity, which it believes will promote sustainable online gaming markets that are beneficial for consumers, governments and the citizens of the regulating jurisdiction, operators and the gaming industry as a whole. The Stars Group expects to continue to invest substantial resources into these efforts, particularly in markets that management believes may in the future have the greatest impact on its business. The Stars Group strives to work with applicable governmental authorities to develop regulations that it expects would protect consumers, encourage responsible gaming, ensure efficient taxation and promote regulated gameplay. The Stars Group also strives to be among the first licensed operators to obtain gaming licenses and provide online gaming to customers in newly-regulated jurisdictions, in each case to the extent it would be in furtherance of The Stars Group’s business goals and strategy and in compliance with its policies and procedures. See also “Regulatory Environment” in the 2017 Annual Information Form.
Notwithstanding, the online gaming industry is heavily regulated and failure by The Stars Group to obtain or maintain applicable licensure or approvals, or otherwise comply with applicable requirements, restrictions and prohibitions, could, among other things, be disruptive to its business and adversely affect its operations. The Stars Group may also be unable to capitalize on the expansion of online gaming or other trends and changes in the online gaming industry, in part due to laws and regulations governing this industry. For example, new gaming or gaming-related laws or regulations, changes in existing gaming or gaming-related laws or regulations, new interpretations of such laws or regulations or changes in the manner in which such laws and regulations are enforced, may materially hinder or prevent The Stars Group from continuing to operate in those jurisdictions where it currently conducts business or where its customers are located, which would harm its operating results and financial condition. For
5
additional risks and uncertainties related to regulation, see “Risk Factors and Uncertainties—Risks Related to Regulation” in the 2017 Annual Information Form.
For additional information about The Stars Group, see the disclosure and discussion elsewhere in this MD&A and the 2017 Annual Reports. For additional risks and uncertainties relating to, among other things, The Stars Group, its business, its customers, its regulatory and tax environment and the industries and geographies in which it operates or where its customers are located, see “Risk Factors and Uncertainties” below and in the 2017 Annual Information Form, as well as the risks and uncertainties contained elsewhere herein, the 2017 Annual Reports and in other filings that The Stars Group has made and may make in the future with applicable securities authorities.
Recent Corporate Developments
Below is a general summary of certain recent corporate developments through the date hereof. For additional corporate developments and highlights, see the 2017 Annual Reports, the Corporation’s management’s discussion and analysis for the three and nine months ended September 30, 2017, and “Further Information” below.
Nominee Agreement and Appointment of Board Observer
As previously disclosed, in January 2018 The Stars Group entered into an agreement with Mr. Tang Hao and his affiliated entity Discovery Key Investments Limited, which based on publicly available information collectively hold approximately 17.9% of the outstanding common shares of The Stars Group (“Common Shares”). In connection with that agreement, Mr. Melvin Zhang was appointed as an observer to the Board as a nominee of Mr. Tang. Mr. Zhang will serve as an observer until such time as he and Mr. Tang have received certain licenses and approvals from certain of The Stars Group’s gaming regulatory authorities, at which point Mr. Zhang will serve on the Board as a director. Also pursuant to the agreement, Mr. Tang is subject to certain restrictions on director nominations and share ownership, including certain standstill restrictions with respect to acquiring greater than 20% of the outstanding Common Shares. For additional information, see the 2017 Annual Information Form under the heading “Directors and Officers—Appointment of Observer to the Board”.
CrownBet and William Hill Australia Holdings Pty Ltd.
As previously disclosed on February 27, 2018, the Corporation acquired a 62% equity interest in CrownBet from Crown Resorts Limited for an aggregate amount of $117.7 million using cash on the Corporation’s balance sheet.
On March 6, 2018, the Corporation also entered into agreements to increase its equity interest in CrownBet from 62% to 80% and for CrownBet to acquire William Hill Australia Holdings Pty Ltd. (“William Hill Australia”), an Australian-based online sportsbook. The aggregate purchase price for both transactions will be approximately $315 million, of which $234 million will be payable in cash for William Hill Australia and the remainder will be payable in approximately 3.1 million newly-issued Common Shares. The management team of CrownBet will be entitled to an additional payment of up to $182 million in 2020 subject to certain performance conditions and payable in cash, additional Common Shares or a combination thereof, at the Corporation’s discretion. To finance the cash portion of the purchase price for the transactions, the Corporation obtained committed financing for a $325 million incremental USD First Lien Term Loan (as defined below). The Corporation currently expects the transactions to close in April 2018.
Mr. Matthew Tripp, CrownBet’s Chief Executive Officer, will remain in his position and continue to operate the combined business in Australia. Under the transaction agreements, The Stars Group is also entitled to appoint a majority of the directors on the board of directors of CrownBet.
KEY METRICS
The Corporation reviews a number of metrics, including those key metrics set forth below, to evaluate its business, measure performance, identify trends, formulate business plans and make strategic decisions. Although management may have provided other key metrics in the past, it continues to review and assess the importance, completeness and accuracy of such metrics as it relates to its evaluation of the Corporation’s business, performance and trends affecting the same. This includes, without limitation, customer engagement, gameplay, depositing activity and various other customer trends, particularly following the introduction of certain previously announced improvements in the poker ecosystem to benefit and attract recreational customers and reduce incentives for high-volume, net-
6
withdrawing customers, the introduction of certain customer acquisition initiatives, and the Corporation’s expansion in real-money online casino and sportsbook. As such, management may determine that particular metrics that may have been presented in the past may no longer be helpful or relevant to understanding the Corporation’s current and future business, performance or trends affecting the same. As a result, such historic metrics may be replaced, redefined or clarified, or new or alternative metrics may be introduced. For each applicable period, management intends to provide key metrics that it believes may be the most helpful and relevant to a complete and accurate understanding of the Corporation’s business, performance and trends affecting the same, in each case taking into account, among other things, the development of its product and service offerings, loyalty programs, customer acquisition efforts, and expansion in new markets and verticals. For additional information on how the Corporation calculates its key metrics and factors that can affect such metrics, see “Limitations of Key Metrics and Other Data” above.
With respect to QAUs and QNY, the Corporation provides applicable trend information for each of the quarterly periods since the first quarter of 2015, and with respect to Net Deposits, it provides applicable trend information for each of the quarterly periods since the first quarter of 2016. As a result of management’s continued review and assessment of such metrics as noted above, beginning with the second quarter of 2017 and as previously disclosed, it determined that the prior definition of QAUs required further adjustment to remove those customers who were active during the applicable quarterly period by taking advantage of certain customer acquisition promotional incentives, but had not yet made a deposit or transferred funds into their real-money accounts with the Corporation for further gameplay, and to clarify the inclusions in and exclusions from the definition, particularly relating to free play, bonuses and promotions. Management believes that these adjustments to its key metrics will provide a more accurate understanding of the Corporation’s customers, including their engagement and activity. As such, QAUs and QNY (as QAUs serve as the denominator for QNY) for each quarterly period since the first quarter of 2015 were re-calculated accordingly and first provided in the Q2 2017 MD&A. The Corporation believes that readers should consider QAUs, QNY and Net Deposits together as customer growth and monetization trends reflected in such metrics are key factors that affect the Corporation’s revenues.
Quarterly Real-Money Active Uniques (QAUs)
The Corporation defines QAUs as active unique customers (online, mobile and desktop client) who (i) made a deposit or transferred funds into their real-money account with the Corporation at any time, and (ii) generated real-money rake or placed a real-money bet or wager on or through one of the Corporation’s real-money online poker, casino or sportsbook offerings during the applicable quarterly period. The Corporation defines unique as a customer who played at least once on one of its real-money offerings during the period, and excludes duplicate counting, even if that customer is active across multiple verticals (poker, casino and/or sportsbook). The definition of QAUs excludes customer activity from certain low-stakes, non-raked real-money poker games, but includes real-money activity by customers using funds (cash and cash equivalents) deposited by the Corporation into such customers’ previously funded accounts as promotions to increase their lifetime value. QAUs are a measure of the player liquidity on the Corporation’s real-money poker product offerings and level of gameplay on all its real-money product offerings, collectively. Trends in QAUs affect revenue and financial results by influencing the volume of gameplay, the Corporation’s product offerings, and its expenses and capital expenditures. QAUs are disclosed below on a combined basis for the Corporation’s real-money online gaming brands.
7
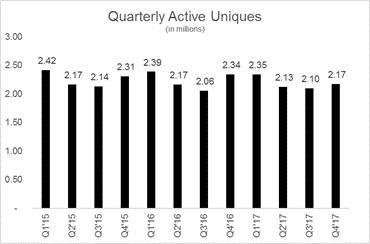
During the three months ended December 31, 2017, the Corporation had 2.17 million combined QAUs, which represents a decrease of 7.3% over the prior year period. The Corporation believes that the decrease when compared to the fourth quarter of 2016 was primarily the result of (i) the Corporation’s strategy of focusing on positive return customer relationship management (“CRM”) initiatives to attract high-value, net-depositing customers (primarily recreational players) which has resulted, and may continue to result, in a decrease in certain lower value customers, (ii) the cessation of operations in Australia and Colombia, (iii) the recently imposed local licensing regime in the Czech Republic with more onerous customer registration requirements for online gaming accounts requiring face-to-face verification, (iv) previously disclosed negative operating conditions in Poland primarily related to constraints on processing payments in that jurisdiction, and (v) a normalization in Portugal as compared to the prior year period when the Corporation relaunched real money online poker and casino in that jurisdiction. Notwithstanding, the Corporation’s QAUs were positively impacted by the growth and expansion of the Corporation’s real-money online casino and sportsbook product offerings. Historically, QAUs have generally been higher in the first and fourth fiscal quarters. For a description of seasonal trends and other factors, see “Summary of Quarterly Results” below.
The Corporation has faced and may continue to face challenges in increasing the size of its active customer base due to, among other things, competition from alternative products and services, high-volume, net-withdrawing customers who detract from the overall poker ecosystem and discourage recreational customers, the use of certain sophisticated technology that may provide an artificial competitive advantage for certain customers over others, and past and potential future weakness in global currencies against the U.S. dollar, which decreases the purchasing power of the Corporation’s global customer base as the U.S. dollar is the primary currency of gameplay on the Corporation’s product offerings. Notwithstanding, the Corporation intends to grow its customer base, reactivate dormant users and retain existing customers by, among other things, continuing to introduce improvements in the poker ecosystem to benefit recreational players, expanding the product depth of its casino offering, improving the user interface and user experience of its sportsbook, investing in CRM initiatives, demonstrating the superiority of its products and services, improving the effectiveness of its marketing and promotional efforts, expanding the availability of its offerings geographically, and continuing to introduce new and innovative products, features and enhancements. See also the 2017 Annual Information Form, including under the headings “Business of the Corporation—Online Poker”, “—Online Casino and Sportsbook” and “—Business Strategy of the Corporation”. To the extent the growth of or growth rate in the Corporation’s customer base declines, the Corporation’s revenue growth will become increasingly dependent on its ability to increase levels of customer monetization.
Quarterly Net Yield (QNY)
The Corporation defines QNY as combined real-money online gaming and related revenue (excluding certain other revenues, such as revenues that are included in Other Gaming revenues) for its two product lines (i.e., Poker and Casino & Sportsbook) as reported during the applicable quarterly period (or as adjusted to the extent any accounting reallocations are made in later periods) divided by the total QAUs during the same period. QNY is a non-IFRS measure. For a reconciliation of the numerator of QNY to the nearest IFRS measure, see below. For other important information on the Corporation’s non-IFRS measures, see the information presented in italics under the heading “Management’s Discussion and Analysis” above and the information under “Selected Financial Information—Other Financial Information” below. The Corporation also provides QNY on a constant currency basis. For information on the Corporation’s constant currency revenues, see “Discussion of Operations—Foreign Exchange Impact on
8
Revenue” for each of the three months and year ended December 31, 2017. Trends in QNY are a measure of growth as the Corporation continues to expand its core real-money online poker offerings and real-money online casino and sportsbook offerings. In addition, the trends in the Corporation’s ability to generate revenue on a per customer basis across its real-money online gaming offerings are reflected in QNY and are key factors that affect the Corporation’s revenue.
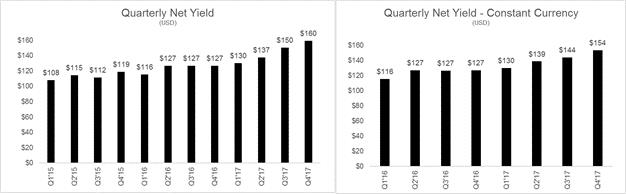
During the three months ended December 31, 2017, the Corporation’s QNY was $160, which represents an increase of 25.6% from the prior year period. The growth in QNY was primarily the result of (i) the implementation of the Stars Rewards loyalty program and continued focus on high-value, net-depositing customers (primarily recreational players), (ii) the Corporation’s strategy of focusing on positive return CRM initiatives to attract such customers which has resulted, and may continue to result, in a decrease in certain lower value customers, and (iii) continued development of the casino and sportsbook product offerings, including through additional third-party slots under the PokerStars Casino brand and improvement of the user experience and user interface under the BetStars brand. During the three months ended December 31, 2017, the Corporation’s constant currency QNY was $154, which represents an increase of 21.3% from the prior year period. The growth in constant currency QNY was driven primarily by the same factors mentioned above.
There are many variables that impact the monetization of the Corporation’s product offerings through QNY, including the rake and fees charged in real-money online poker, the amounts wagered and gross win margins (i.e., the percentage of wagers retained by the Corporation) in real-money online casino and sportsbook, the amount of time customers play on its products, offsets to gross gaming revenue for loyalty program rebates, rewards, bonuses, and promotions and VAT in certain jurisdictions, and the amount the Corporation spends on advertising and other expenses. The Corporation currently intends to increase QNY in future periods by, among other things, (i) continuing to introduce new and innovative products and other initiatives to enhance and optimize the customer experience and increase customer engagement, including through CRM initiatives to attract and retain high-value customers (primarily recreational players), (ii) capitalizing on its existing online poker platforms and offerings, which provides customers with the highest level of player liquidity globally, (iii) cross-selling its online poker, casino and sportsbook offerings to both existing and new customers, and (iv) continuing to expand and improve its online casino and sportsbook offerings, including through the addition of new product offerings and new geographies. See also the 2017 Annual Information Form, including under the headings “Business of the Corporation—Online Poker”, “—Online Casino and Sportsbook” and “—Business Strategy of the Corporation”.
The tables below present reconciliations of the numerator of QNY (i.e., Poker and Casino & Sportsbook revenues) to the nearest IFRS measure (i.e., revenue) as reported for the applicable period. Unless otherwise noted, any deviation in the reconciliations below to measures presented herein may be the result of immaterial adjustments made in later periods due to certain accounting reallocations.
9
| | Mar 31, | | | Jun 30, | | | Sep 30, | | | Dec 31, | | Mar 31, | | | Jun 30, | |
$000's | | 2015 | | | 2015 | | | 2015 | | | 2015 | | 2016 | | | 2016 | |
Revenue | | | 272,292 | | | | 259,500 | | | | 247,327 | | | | 293,201 | | | 288,518 | | | | 285,762 | |
Corporate | | | (426 | ) | | | (392 | ) | | | (225 | ) | | | (471 | ) | | (59 | ) | | | (46 | ) |
Other Gaming Revenue | | | (12,638 | ) | | | (11,562 | ) | | | (9,729 | ) | | | (13,419 | ) | | (11,971 | ) | | | (10,479 | ) |
Poker and Casino & Sportsbook | | | 259,228 | | | | 247,546 | | | | 237,373 | | | | 279,311 | | | 276,488 | | | | 275,237 | |
| | | | | | | | | | | | | | | | | | | | | | | |
| | | | | | | | | | | | | | | | | | | | | | | |
| | Sep 30, | | | Dec 31, | | | Mar 31, | | | Jun 30, | | Sep 30, | | | Dec 31, | |
$000's | | 2016 | | | 2016 | | | 2017 | | | 2017 | | 2017 | | | 2017 | |
Revenue | | | 270,681 | | | | 310,286 | | | | 317,320 | | | | 305,305 | | | 329,443 | | | | 360,247 | |
Corporate | | | — | | | | (3 | ) | | | (22 | ) | | | (92 | ) | | (213 | ) | | | (358 | ) |
Other Gaming Revenue | | | (9,632 | ) | | | (12,884 | ) | | | (11,854 | ) | | | (12,762 | ) | | (12,675 | ) | | | (13,031 | ) |
Poker and Casino & Sportsbook | | | 261,049 | | | | 297,399 | | | | 305,444 | | | | 292,451 | | | 316,555 | | | | 346,858 | |
Net Deposits
The Corporation defines Net Deposits as the aggregate of gross deposits or transfer of funds made by customers into their real-money online accounts less withdrawals or transfer of funds by such customers from such accounts, in each case during the applicable quarterly period. Gross deposits exclude (i) any deposits, transfers or other payments made by such customers into the Corporation’s play-money and social gaming offerings, and (ii) any real-money funds (cash and cash equivalents) deposited by the Corporation into such customers’ previously funded accounts as promotions to increase their lifetime value. Net Deposits are closely correlated to the Corporation’s reported net gaming revenue. Some or all of such deposits eventually become revenue if and when the deposits enter the online poker, casino or sportsbook ecosystems through applicable rake, tournament fees or wagering. Trends in Net Deposits are used by management to gauge expected revenue performance across the Corporation’s current online real-money gaming offerings (i.e., poker, casino, sportsbook) and are considered by management when making decisions with respect to changes to any such offering, including but not limited to, the recent and continuing changes to the Corporation’s online poker ecosystem to benefit and attract high-value, net-depositing customers (primarily recreational players). Net Deposits are not, and should not be considered, representative of revenue bookings or deferred revenues.
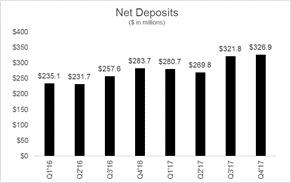
During the three months ended December 31, 2017, Net Deposits were $326.9 million, which represents an increase of 15% over the prior year period. The increase in Net Deposits was due to growth, in absolute terms, of gross deposits, or transfers of funds made by customers into their real-money online accounts, surpassing growth in withdrawals, or transfers of funds by such customers from such accounts. The Corporation believes that the increase was primarily driven by the implementation of the Stars Rewards loyalty program and continued focus on high-value customers (primarily recreational players), continued development of the casino and sportsbook product offerings, including through additional third-party slots under the PokerStars Casino brand and improvement of the user experience and user interface under the BetStars brand.
As with QAUs and QNY, there are many variables that impact Net Deposits, most of which are substantially similar to those noted above impacting the monetization of the Corporation’s product offerings as evidenced through QNY. In addition, there are certain factors that have impacted, and may in the future impact, Net Deposits that are not
10
indicative of the performance or underlying health of the Corporation’s business. For example, as it relates to online poker and following the implementation of certain previously disclosed changes to the poker ecosystem, the movement in customer real-money account balances (i.e., customer deposits on the consolidated statements of financial position) by high-volume, net-withdrawing customers (primarily professional or highly experienced players) has reduced, and may continue to reduce, Net Deposits as a result of increased withdrawals by such customers, but the Corporation believes that such movements will ultimately create a more attractive environment and experience for recreational players, allowing them to play longer on its platforms and engage in its various product offerings, which in turn may lead to increased Net Deposits. The Corporation believes that the funds in the accounts of the high-volume, net-withdrawing customers are generally not additive to the overall poker ecosystem or to the Corporation’s revenues as such customers generally use only a small portion of them to bet or wager. In the first and second quarters of 2016, following the initial implementation of such changes to the poker ecosystem, including changes to its then-effective VIP program, the Corporation experienced significant movements in customer real-money account balances resulting from increased withdrawals by high-volume, net-withdrawing customers. As the Corporation continues to make adjustments and improvements to its product offerings, it expects that such customers may continue to withdraw at greater rates and amounts immediately following such adjustments and improvements, which would impact Net Deposits accordingly.
For other factors that may cause Net Deposits to fluctuate, see “Overview and Outlook” above, “Summary of Quarterly Results”, “Liquidity and Capital Resources—Market Risk” and “Risk Factors and Uncertainties” below, and the 2017 Annual Information Form, including, without limitation, under the headings “Risk Factors and Uncertainties” and “Business of the Corporation—Seasonality and Other Factors Impacting the Business” therein.
SELECTED FINANCIAL INFORMATION
Selected Financial Information
Selected financial information of the Corporation for the three months ended December 31, 2017 and 2016, and for the years ended December 31, 2017, 2016 and 2015 is set forth below.
| | Three Months Ended December 31, | | | Year Ended December 31, | |
$000's, except per share amounts | | 2017 | | | 2016 | | | 2017 | | | 2016 | | | 2015 | |
Revenue | | | 360,247 | | | | 310,286 | | | | 1,312,315 | | | | 1,155,247 | | | | 1,072,320 | |
Net Earnings | | | 47,175 | | | | 45,039 | | | | 259,285 | | | | 135,550 | | | | 210,262 | |
Basic Net Earnings Per Common Share | | $ | 0.32 | | | $ | 0.31 | | | $ | 1.77 | | | $ | 0.96 | | | $ | 1.58 | |
Diluted Net Earnings Per Common Share | | $ | 0.23 | | | $ | 0.23 | | | $ | 1.27 | | | $ | 0.70 | | | $ | 1.06 | |
Total Assets (as at) | | | 5,415,126 | | | | 5,462,475 | | | | 5,415,126 | | | | 5,462,475 | | | | 5,643,547 | |
Total Long-Term Liabilities (as at) | | | 2,509,221 | | | | 2,412,579 | | | | 2,509,221 | | | | 2,412,579 | | | | 2,851,994 | |
Revenue increased in both the three months and year ended December 31, 2017 as compared to the respective prior year periods and as compared to the year ended December 31, 2015 primarily as a result of the growth of the Corporation’s online poker, casino and sportsbook product offerings. For additional variance analysis on Poker revenues and Casino & Sportsbook revenues, see “Discussions of Operations” below. For revenue calculated on a constant currency basis, see “Foreign Exchange Impact on Revenue” below for each of the three months and year ended December 31, 2017.
The decrease in the Corporation’s asset base from December 31, 2016 was primarily the result of a decrease in current investments, amortization in respect of its intangible assets and a decrease in the fair value of the Swap Agreements (as defined and described below), partially offset by an increase in cash and cash equivalents. For additional variance analysis on cash and cash equivalents, see “Cash Flows by Activity” below. The increase in outstanding long-term liabilities from December 31, 2016 was primarily to the result of a decrease in the fair value of the Swap Agreements causing such fair value to move from assets to liabilities. The decrease in the Corporation’s asset base from December 31, 2015 through December 31, 2016 was primarily the result of the amortization of its intangible assets, while the decrease in outstanding long-term liabilities during the same period was primarily the result of reclassifying the deferred purchase price for the Stars Interactive Group Acquisition in the initial aggregate
11
amount of $400 million to current liabilities (of which the Corporation paid $200 million in November 2016 and the remaining balance in 2017).
Other Financial Information
To supplement its 2017 Annual Financial Statements presented in accordance with IFRS, the Corporation considers certain financial measures that are not prepared in accordance with IFRS, including those set forth below and QNY set forth above under “Key Metrics”. The Corporation uses such non-IFRS financial measures in evaluating its operating results and for financial and operational decision-making purposes. The Corporation believes that such measures help identify underlying trends in its business that could otherwise be masked by the effect of the expenses that it excludes in such measures or, in the case of Adjusted Cash Flow from Operations, by cash that is not available for financial or operational use. The Corporation also believes that such measures provide useful information about its operating results, enhance the overall understanding of its past performance and future prospects and allow for greater transparency with respect to key metrics used by management in its financial and operational decision-making. However, these measures should not be considered in isolation from, or as a substitute for, financial information prepared in accordance with IFRS. There are a number of limitations related to the use of such non-IFRS measures as opposed to their nearest IFRS equivalents. See also the information presented in italics under the heading “Management’s Discussion and Analysis” above and the information under “Limitations of Key Metrics and Other Data” and “Key Metrics” above.
| | Three Months Ended December 31, | | | Year Ended December 31, | |
$000's, except per share amounts | | 2017 | | | 2016 | | | 2017 | | | 2016 | |
Revenue | | | 360,247 | | | | 310,286 | | | | 1,312,315 | | | | 1,155,247 | |
Adjusted EBITDA | | | 147,002 | | | | 147,604 | | | | 600,306 | | | | 524,093 | |
Adjusted Cash Flow from Operations | | | 132,283 | | | | 142,806 | | | | 525,524 | | | | 420,928 | |
Adjusted Net Earnings | | | 111,951 | | | | 107,013 | | | | 458,940 | | | | 366,699 | |
Adjusted Net Earnings per Diluted Share | | $ | 0.54 | | | $ | 0.53 | | | $ | 2.25 | | | $ | 1.88 | |
Adjusted EBITDA, Adjusted Cash Flow from Operations, Adjusted Net Earnings and Adjusted Net Earnings per Diluted Share
The Corporation currently considers the following non-IFRS measures:
Adjusted EBITDA, which the Corporation defines as net earnings before financial expenses, income taxes expense (recovery), depreciation and amortization, stock-based compensation, restructuring and certain other items as set out in the table below.
Adjusted Cash Flow from Operations, which the Corporation defines as net cash inflows from operating activities after adding back customer deposit liability movements, and which the Corporation first introduced for the quarter ended June 30, 2017.
Adjusted Net Earnings, which the Corporation defines as net earnings before interest accretion, amortization of intangible assets resulting from purchase price allocation following acquisitions, deferred income taxes, stock-based compensation, restructuring, foreign exchange, and certain other items as set out in the table below.
Adjusted Net Earnings per Diluted Share, as defined by the Corporation means Adjusted Net Earnings divided by Diluted Shares. Diluted Shares means the weighted average number of Common Shares on a fully diluted basis, including options, other equity-based awards, warrants and the Corporation’s convertible preferred shares (“Preferred Shares”). The effects of anti-dilutive potential Common Shares are ignored in calculating Diluted Shares. See note 9 in the 2017 Annual Financial Statements. For the three months and year ended December 31, 2017, Diluted Shares equaled 206,807,485 and 203,707,589, respectively.
12
The table below presents a reconciliation of Adjusted EBITDA, Adjusted Net Earnings and Adjusted Net Earnings per Diluted Share, each to the nearest IFRS measure:
| | Three Months Ended December 31, | | | Year Ended December 31, | |
$000's, except per share amounts | | 2017 | | | 2016 | | | 2017 | | | 2016 | |
Net earnings | | | 47,175 | | | | 45,039 | | | | 259,285 | | | | 135,550 | |
Financial expenses | | | 39,713 | | | | 36,565 | | | | 163,039 | | | | 138,299 | |
Income taxes expense (recovery) | | | 26,352 | | | | (78 | ) | | | 27,208 | | | | 4,000 | |
Depreciation of property and equipment | | | 2,370 | | | | 2,072 | | | | 8,925 | | | | 8,181 | |
Amortization of intangible and deferred development costs | | | 35,851 | | | | 34,783 | | | | 138,261 | | | | 131,702 | |
EBITDA | | | 151,461 | | | | 118,381 | | | | 596,718 | | | | 417,732 | |
Stock-based compensation | | | 2,708 | | | | 1,893 | | | | 10,622 | | | | 10,289 | |
Termination of employment agreements | | | 1,677 | | | | 3,643 | | | | 5,842 | | | | 15,008 | |
Termination of affiliate agreements | | | — | | | | 1,099 | | | | 407 | | | | 4,485 | |
Loss on disposal of assets | | | — | | | | 361 | | | | 599 | | | | 923 | |
(Gain) loss from investments | | | (20,288 | ) | | | 4,749 | | | | (34,524 | ) | | | 19,278 | |
Acquisition-related costs | | | — | | | | — | | | | — | | | | 199 | |
Gain on settlement of deferred consideration | | | — | | | | (2,466 | ) | | | — | | | | (2,466 | ) |
Net loss (earnings) from associates and (reversal of) impairment of assets held for sale, associates and intangible assets | | | 1,631 | | | | 9,646 | | | | (4,230 | ) | | | 16,308 | |
Other costs (see table below) | | | 9,813 | | | | 10,298 | | | | 24,872 | | | | 42,337 | |
Adjusted EBITDA | | | 147,002 | | | | 147,604 | | | | 600,306 | | | | 524,093 | |
Current income tax expense | | | (1,224 | ) | | | (2,570 | ) | | | (7,914 | ) | | | (8,384 | ) |
Depreciation and amortization (excluding amortization of purchase price allocation intangibles) | | | (7,145 | ) | | | (5,779 | ) | | | (22,885 | ) | | | (18,138 | ) |
Interest † | | | (26,682 | ) | | | (32,242 | ) | | | (110,567 | ) | | | (130,872 | ) |
Adjusted Net Earnings | | | 111,951 | | | | 107,013 | | | | 458,940 | | | | 366,699 | |
Diluted Shares | | | 206,807,485 | | | | 200,132,710 | | | | 203,707,589 | | | | 195,432,920 | |
Adjusted Net Earnings per Diluted Share | | $ | 0.54 | | | $ | 0.53 | | | $ | 2.25 | | | $ | 1.88 | |
† Excluding interest accretion and non-refundable late payment fees related to the unpaid balance of the deferred purchase price for the Stars Interactive Group Acquisition in 2016.
There are a number of limitations related to the use of these measures rather than net earnings, which is the nearest IFRS equivalent of these financial measures. Some of these limitations are:
| • | these non-IFRS financial measures exclude the applicable items listed in the reconciliation table above and other costs as set forth in the table below; and |
| • | the expenses that the Corporation excludes in its calculation of these non-IFRS financial measures may differ from the expenses, if any, that its peer companies may exclude from similarly-titled non-IFRS measures when they report their results of operations. In addition, although certain excluded expenses may have been incurred in the past or may be expected to recur in the future, management believes it is appropriate to exclude such expenses at this time as it does not consider them as on-going core operating expenses as it relates specifically to the Corporation as compared to its peer companies. For example, the Corporation currently excludes certain lobbying and legal expenses in jurisdictions where it is actively seeking licensure or similar approval, not for such expenses in jurisdictions where it (or any of its subsidiaries) currently operates, has customers, or holds a license or similar approval. Management believes that the Corporation’s incremental cost of these lobbying and legal expenses in such jurisdictions is generally higher than its peers given liabilities and related issues primarily stemming from periods prior to the Stars Interactive Group Acquisition or from matters not directly involving the Corporation or its current business. Moreover, certain exclusions, such as retention bonuses and office restructuring and legacy business unit shutdown costs, primarily relate to the |
13
| | Corporation’s transformation following the Stars Interactive Group Acquisition and management believes such expenses are more similar to acquisition-related costs than to on-going core operating expenses. Over time, as management continues assessing its operations and calculating applicable non-IFRS measures, it believes that, subject to, among other things, unanticipated events or impacts of anticipated events, it should have fewer adjustments or the amounts of such adjustments should decrease over time. |
The table below presents certain items comprising “Other costs” in the reconciliation table above:
| | Three Months Ended December 31, | | | Year Ended December 31, | |
| | 2017 | | | 2016 | | | 2017 | | | 2016 | |
| | $000's | | | $000's | | | $000's | | | $000's | |
Non-U.S. lobbying and legal expenses | | | 787 | | | | 765 | | | | 3,409 | | | | 3,065 | |
U.S. lobbying and legal expenses | | | 4,074 | | | | 3,630 | | | | 13,686 | | | | 12,793 | |
Strategic review professional fees | | | — | | | | 2,965 | | | | 125 | | | | 10,338 | |
Retention bonuses | | | 117 | | | | 615 | | | | 1,388 | | | | 3,272 | |
Non-recurring professional fees | | | 2,263 | | | | 1,188 | | | | 4,431 | | | | 6,020 | |
AMF and other investigation professional fees (net of insurance proceeds) | | | 2,544 | | | | 1,018 | | | | 6,432 | | | | 5,509 | |
Austria gaming duty | | | — | | | | — | | | | (5,000 | ) | | | — | |
Office restructuring and legacy business unit shutdown costs | | | 28 | | | | 117 | | | | 401 | | | | 1,340 | |
Other costs | | | 9,813 | | | | 10,298 | | | | 24,872 | | | | 42,337 | |
The table below presents a reconciliation of Adjusted Cash Flow from Operations to net cash inflows from operating activities, which is the nearest IFRS measure:
| Three Months Ended December 31, | | | Year Ended December 31, | |
| 2017 | | | 2016 | | | 2017 | | | 2016 | |
| $000's | | | $000's | | | $000's | | | $000's | |
Net cash inflows from operating activities | | 123,757 | | | | 148,295 | | | | 494,600 | | | | 349,936 | |
Customer deposit liability movement | | 8,526 | | | | (5,489 | ) | | | 30,924 | | | | 70,992 | |
Adjusted Cash Flow from Operations | | 132,283 | | | | 142,806 | | | | 525,524 | | | | 420,928 | |
The Corporation believes that removing movements in customer deposit liabilities provides a more meaningful understanding of its cash flow from operations as customer deposits are not available funds for the Corporation to use for financial or operational purposes.
DISCUSSION OF OPERATIONS
Comparison of the Three Months Ended December 31, 2017 and 2016
| | | | | | | | | | | | | | | | |
| | Three Months Ended December 31, | |
$000's except percentage amounts | | 2017 | | | 2016 | | | Variance | | | % Change | |
Revenue | | | 360,247 | | | | 310,286 | | | | 49,961 | | | | 16.1 | % |
Selling | | | 67,251 | | | | 45,505 | | | | 21,746 | | | | 47.8 | % |
General and administrative | | | 162,857 | | | | 151,552 | | | | 11,305 | | | | 7.5 | % |
Financial | | | 39,713 | | | | 36,565 | | | | 3,148 | | | | 8.6 | % |
Gaming duty | | | 37,188 | | | | 29,420 | | | | 7,768 | | | | 26.4 | % |
Gain (loss) from investments | | | 20,288 | | | | (4,728 | ) | | | 25,016 | | | | 529.1 | % |
Net loss from associates | | | — | | | | (21 | ) | | | 21 | | | | 100.0 | % |
Gain on settlement of deferred consideration | | | — | | | | 2,466 | | | | (2,466 | ) | | | (100.0 | %) |
Income taxes expense (recovery) | | | 26,352 | | | | (78 | ) | | | 26,430 | | | | 33884.6 | % |
14
Revenue
The revenue increase for the three months ended December 31, 2017 as compared to the prior year period was primarily attributable to (i) the implementation of the Stars Rewards loyalty program, (ii) the continued development of the Corporation’s casino product offerings, including through additional third-party slots under the PokerStars Casino brand, (iii) user experience and user interface improvements to the Corporation’s sportsbook product and a higher than average gross win margin during the quarter, (iv) the expansion of the geographical reach of the Corporation’s casino and sportsbook products into eligible markets, and (v) the re-launch of real-money online poker and real-money online casino in Portugal. As it relates to currency fluctuations during the quarter, the general weakening of the U.S. dollar relative to certain foreign currencies had a positive impact on the Corporation’s revenue as compared to the prior year period. See also “Foreign Exchange Impact on Revenue” below.
Revenue by Product Line and Geographic Region
| | Three months ended December 31, 2017 | |
| | Poker | | | Casino & Sportsbook | | | Other Gaming | | | Total Gaming | | | Corporate | | | Total | |
| | $000’s | | | $000’s | | | $000’s | | | $000’s | | | $000’s | | | $000’s | |
Geographic Area | | | | | | | | | | | | | | | | | | | | | | | | |
Isle of Man | | | 93,415 | | | | 6,761 | | | | 1 | | | | 100,177 | | | | — | | | | 100,177 | |
Malta | | | 54,847 | | | | 64,762 | | | | 1 | | | | 119,610 | | | | — | | | | 119,610 | |
Italy | | | 22,009 | | | | 16,467 | | | | 133 | | | | 38,609 | | | | — | | | | 38,609 | |
United Kingdom | | | 15,193 | | | | 4,599 | | | | 58 | | | | 19,850 | | | | — | | | | 19,850 | |
Spain | | | 13,796 | | | | 10,679 | | | | 167 | | | | 24,642 | | | | — | | | | 24,642 | |
France | | | 13,855 | | | | 4,383 | | | | 123 | | | | 18,361 | | | | — | | | | 18,361 | |
Other licensed or approved jurisdictions | | | 21,235 | | | | 4,857 | | | | 12,548 | | | | 38,640 | | | | 358 | | | | 38,998 | |
| | | 234,350 | | | | 112,508 | | | | 13,031 | | | | 359,889 | | | | 358 | | | | 360,247 | |
| | Three months ended December 31, 2016 (As reclassified) | |
| | Poker | | | Casino & Sportsbook | | | Other Gaming | | | Total Gaming | | | Corporate | | | Total | |
| | $000’s | | | $000’s | | | $000’s | | | $000’s | | | $000’s | | | $000’s | |
Geographic Area | | | | | | | | | | | | | | | | | | | | | | | | |
Isle of Man | | | 88,323 | | | | 8,521 | | | | 1 | | | | 96,845 | | | | — | | | | 96,845 | |
Malta | | | 52,727 | | | | 46,267 | | | | 1 | | | | 98,995 | | | | — | | | | 98,995 | |
Italy | | | 19,947 | | | | 10,347 | | | | 177 | | | | 30,471 | | | | — | | | | 30,471 | |
United Kingdom | | | 13,518 | | | | 3,507 | | | | 104 | | | | 17,129 | | | | — | | | | 17,129 | |
Spain | | | 11,870 | | | | 6,917 | | | | 185 | | | | 18,972 | | | | — | | | | 18,972 | |
France | | | 13,807 | | | | 1,144 | | | | 160 | | | | 15,111 | | | | — | | | | 15,111 | |
Other licensed or approved jurisdictions | | | 17,022 | | | | 3,482 | | | | 12,256 | | | | 32,760 | | | | 3 | | | | 32,763 | |
| | | 217,214 | | | | 80,185 | | | | 12,884 | | | | 310,283 | | | | 3 | | | | 310,286 | |
The majority of the Corporation’s revenues are generated through Poker, followed by Casino & Sportsbook. Other offerings, including social and play-money gaming, live poker events, branded poker rooms and other sources of revenue primarily related to gaming are aggregated into Other Gaming revenues. Corporate revenues include certain other nominal sources of revenue. These revenues together comprise one segment as individually they do not meet any of the quantitative thresholds or disclosure requirements described in IFRS 8, Operating segments.
Poker Revenue
Poker revenue for the three months ended December 31, 2017 was $234.4 million as compared to $217.2 million for the prior year period, which represents an increase of 7.9% year-over-year. The increase in Poker revenue was primarily the result of (i) positive impacts of foreign exchange fluctuations, (ii) the implementation of the Stars Rewards loyalty program, and (iii) the re-launch of online poker in Portugal. Notwithstanding, Poker revenues were negatively impacted by, among other things (i) certain customers playing, either entirely or partially in place of poker, the Corporation’s real-money online casino offerings, (ii) the cessation of operations in Australia and
15
Colombia, (iii) the new local licensing regime in the Czech Republic with more onerous customer registration requirements for online gaming accounts requiring face-to-face verification, and (iv) previously disclosed negative operating conditions in Poland primarily related to constraints on processing payments in that jurisdiction. For information on the impact of fluctuations in foreign exchange rates, see “Foreign Exchange Impact on Revenue” below.
Casino & Sportsbook Revenue
Casino & Sportsbook revenue for the three months ended December 31, 2017 was $112.5 million as compared to $80.2 million for the prior year period, which represents an increase of 40.3% year-over-year. The increase in Casino & Sportsbook revenue was primarily the result of (i) the continued development of the Corporation’s casino product offerings, including through additional third-party slots under the PokerStars Casino brand, (ii) user experience and user interface improvements to the Corporation’s sportsbook product and a higher than average gross win margin during the quarter, (iii) the expansion of the geographical reach of the Corporation’s casino and sportsbook products into eligible markets, and (iv) positive impacts of foreign exchange fluctuations. Notwithstanding, Casino & Sportsbook revenues were negatively impacted by, among other things, the new local licensing regime in the Czech Republic with more onerous customer registration requirements for online gaming accounts requiring face-to-face verification. For information on the impact of fluctuations in foreign exchange rates, see “Foreign Exchange Impact on Revenue” below.
Revenue by Geographic Region
The Corporation also evaluates revenue performance by geographic region based on the primary jurisdiction where the Corporation is licensed or approved to offer, or offers through third-party licenses or approvals, its online gaming products and services. The revenue tables above set out the proportion of revenue attributable to each gaming license or approval (as opposed to the jurisdiction where the customer was located) that either generated a minimum of 5% of total consolidated revenue for the three months ended December 31, 2017 or 2016 or that the Corporation otherwise deems relevant based on its historical reporting of the same or otherwise.
With respect to Canada, the jurisdiction where its registered office is located, and based solely on calculations derived from internal records, the Corporation estimates that revenue derived from customers in Canada, which currently relates only to Poker, would represent less than 5% of its total consolidated revenue for the three months ended December 31, 2016 and 2017. These estimations are neither itemized nor otherwise separated from the revenues the Corporation reports under IFRS or otherwise, and as such, they are neither reviewed nor audited, as applicable, by its independent external auditor nor can they be reconciled to a reported IFRS measure.
Poker
Poker revenue increased in all geographic regions for the three months ended December 31, 2017 as compared to the prior year period. The increases were generally the result of the same factors noted above under “Poker Revenue” for the same period. The growth in other licensed and approved jurisdictions was also the result of obtaining local licenses to operate certain online gaming in Portugal and the Czech Republic (the Czech Republic had previously operated under the Malta license and the Corporation had previously ceased operations in Portugal). The growth in Malta was partially offset by the movement of Czech Republic to a local licensing regime.
Casino & Sportsbook
Casino & Sportsbook revenue increased in each geographic region, except the Isle of Man, for the three months ended December 31, 2017 as compared to the prior year period. The increases were generally the result of the same factors noted above under “Casino & Sportsbook Revenue” for the same period. The increase in Malta was also the result of the Corporation offering certain online casino and live dealer games under its Malta license to players in jurisdictions otherwise served through the Isle of Man and the United Kingdom licenses. Malta was also positively impacted by the expansion of the Corporation’s online casino and sportsbook product offerings into eligible markets. The decrease in the Isle of Man was the result of the use of the Corporation’s Malta license for certain offerings as noted above. In addition, the increase in other licensed or approved jurisdictions was primarily the result of previously obtaining local licenses to operate online gaming in Portugal and the Czech Republic (the Czech Republic had previously operated under the Malta license and the Corporation had previously ceased operations in Portugal).
16
Other Gaming
Other Gaming revenue was relatively flat as a proportion of revenue during the three months ended December 31, 2017 as compared to the prior year period.
Foreign Exchange Impact on Revenue
The general weakening of the U.S. dollar, which is the primary currency of gameplay on the Corporation’s product offerings, relative to certain foreign currencies (particularly the Euro, which is the primary depositing currency of the Corporation’s customers) during the three months ended December 31, 2017 as compared to the prior year period had a positive impact on the Corporation’s Poker, Casino & Sportsbook revenue. During the three months ended December 31, 2017, the Corporation estimates the increase in the purchasing power of its consumer base, based on a weighted average of customer deposits, was a result of an average 7.3% increase in the value of its customers’ local currencies relative to the U.S. dollar.
To calculate revenue on a constant currency basis, the Corporation translated revenue for the current period using the prior year’s monthly average exchange rates for its local currencies other than the U.S. dollar, which the Corporation believes is a useful metric that facilitates comparison to its historical performance, mainly because the U.S. dollar is the primary currency of gameplay on the Corporation’s product offerings and the majority of the Corporation’s customers are from European Union jurisdictions.
If the Corporation had translated its total IFRS revenue for the three months ended December 31, 2017 using the constant currency exchange rates for its source currencies other than the U.S. dollar, such revenues would have been $334.5 million, which is $25.8 million lower than actual IFRS revenues during such period. As a result, excluding the impact of year-over-year changes in foreign exchange rates, such revenues for the quarter would have increased by 7.8%, as opposed to 16.1%, over the prior year period.
Expenses
Selling
The increase in selling expenses for the three months ended December 31, 2017 as compared to the prior year period was primarily the result of (i) an increase in acquisition marketing costs in connection with online poker and sportsbook operations and (ii) an increase in royalty costs in connection with online casino operations driven by the growth and expansion of third-party slot and live dealer game offerings.
General and Administrative
The increase in general and administrative expenses for the three months ended December 31, 2017 as compared to the prior year period was primarily the result of (i) an increase in salary expenses due to investment in headcount, staff restructuring in connection with the Corporation’s previously announced operational excellence program and the provision for expected annual staff incentives in the 2017 period, and (ii) an increase in professional fees driven by the AMF investigations and additional public company compliance costs primarily related to the Corporation’s remediation efforts associated with and improvements to internal control over financial reporting.
Financial
The increase in financial expenses for the three months ended December 31, 2017 as compared to the prior year period was primarily the result of foreign exchange gains recorded in the prior year period. The increase was partially offset by reduced accretion recorded in respect of the deferred purchase price for the Stars Interactive Group Acquisition.
Gaming Duty
The increase in gaming duty expenses for the three months ended December 31, 2017 as compared to the prior year period was primarily the result of (i) gaming duty on Poker, Casino & Sportsbook revenues reflecting growth in such revenues in markets where gaming duty is applicable, such as Italy, Spain, France and the United Kingdom, and (ii) gaming duty in markets recently licensed such as Portugal and the Czech Republic.
17
Foreign Exchange Impact on Expenses
The Corporation’s expenses are also impacted by currency fluctuations. Almost all its expenses are incurred in either the Euro, Great Britain Pound Sterling, U.S. dollar or Canadian dollar. There are some natural hedges as a result of customer deposits made in such currencies, however the Corporation also enters into certain economic hedges to mitigate the impact of foreign currency fluctuations as it deems necessary. Further information on foreign currency risk can be found below in “Liquidity and Capital Resources—Market Risk—Foreign Currency Exchange Risk”.
Gain (Loss) from Investments
The gain recognized from investments during the three months ended December 31, 2017 as compared to a loss in the prior year period was primarily the result of the completion of the Corporation’s previously announced disposition of its retained ownership in NYX Gaming Group Limited (“NYX Gaming Group”) securities and NYX Sub Preferred Shares (as defined below) to Scientific Games Corporation and its ordinary shares of Jackpotjoy plc (LSE: JPJ) (“Jackpotjoy”). For the prior year period, the loss from investments was primarily the result of a decrease in the value of the Corporation’s retained ownership of certain preferred shares (the “NYX Sub Preferred Shares”) of NYX Digital Gaming (Canada) ULC, a subsidiary of NYX Gaming Group (“NYX Sub”), issued to the Corporation as partial consideration for the disposition of two of the Corporation’s former businesses, CryptoLogic Ltd. and Amaya (Alberta) Inc. (formerly Chartwell Technology Inc.), to NYX Gaming Group and NYX Sub.
Income Taxes Expense (Recovery)
The increase in income taxes expense for the three months ended December 31, 2017 as compared to the prior year period was primarily due to a tax provision of $26.5 million relating to an ongoing transfer pricing dispute in Canada for one of the Corporation’s subsidiaries. The issue in dispute relates to the subsidiary’s operations for its 2003 to 2007 fiscal years, prior to its acquisition by The Stars Group. For additional information, see note 8 in the 2017 Annual Financial Statements.
Comparison of the Years Ended December 31, 2017 and 2016
| | | | | | | | | | | | | | | | |
| | Year Ended December 31, | |
$000's except percentage amounts | | 2017 | | | 2016 | | | Variance | | | % Change | |
Revenue | | | 1,312,315 | | | | 1,155,247 | | | | 157,068 | | | | 13.6 | % |
Selling | | | 192,709 | | | | 162,785 | | | | 29,924 | | | | 18.4 | % |
General and administrative | | | 571,258 | | | | 585,123 | | | | (13,865 | ) | | | (2.4 | %) |
Financial | | | 163,039 | | | | 138,299 | | | | 24,740 | | | | 17.9 | % |
Gaming duty | | | 130,771 | | | | 113,102 | | | | 17,669 | | | | 15.6 | % |
Acquisition-related costs | | | — | | | | 199 | | | | (199 | ) | | | (100.0 | %) |
Gain (loss) from investments | | | 34,524 | | | | (19,278 | ) | | | 53,802 | | | | 279.1 | % |
Net (loss) earnings from associates | | | (2,569 | ) | | | 623 | | | | (3,192 | ) | | | (512.4 | %) |
Gain on settlement of deferred consideration | | | — | | | | 2,466 | | | | (2,466 | ) | | | (100.0 | %) |
Income taxes | | | 27,208 | | | | 4,000 | | | | 23,208 | | | | 580.2 | % |
Revenue
The revenue increase for the year ended December 31, 2017 as compared to the prior year period was primarily attributable to (i) the continued development of the Corporation’s casino product offerings, including through additional third-party slots under the PokerStars Casino brand, (ii) the expansion of the geographical reach of the Corporation’s casino and sportsbook products into eligible markets, (iii) positive impacts of foreign exchange fluctuations, (iv) the Corporation’s continued focus on recreational players including through the implementation of the Stars Rewards loyalty program, (v) user experience and user interface improvements to the Corporation’s sportsbook product, and (vi) the re-launch of real-money online poker and real-money online casino in Portugal and the launch of PokerStars NJ. As it relates to currency fluctuations during the full year period, the general weakening of the U.S. dollar relative to certain foreign currencies had a positive impact on the Corporation’s revenue as compared to the prior year period. See also “Foreign Exchange Impact on Revenue” below.
18
Revenue by Product Line and Geographic Region
| | Year Ended December 31, 2017 | |
| | Poker | | | Casino & Sportsbook | | | Other Gaming | | | Total Gaming | | | Corporate | | | Total | |
| | $000’s | | | $000’s | | | $000’s | | | $000’s | | | $000’s | | | $000’s | |
Geographic Area | | | | | | | | | | | | | | | | | | | | | | | | |
Isle of Man | | | 349,375 | | | | 29,338 | | | | 1 | | | | 378,714 | | | | — | | | | 378,714 | |
Malta | | | 210,742 | | | | 224,101 | | | | 2 | | | | 434,845 | | | | — | | | | 434,845 | |
Italy | | | 82,106 | | | | 52,284 | | | | 575 | | | | 134,965 | | | | — | | | | 134,965 | |
United Kingdom | | | 56,155 | | | | 15,140 | | | | 258 | | | | 71,553 | | | | — | | | | 71,553 | |
Spain | | | 47,912 | | | | 34,842 | | | | 669 | | | | 83,423 | | | | — | | | | 83,423 | |
France | | | 50,214 | | | | 10,410 | | | | 508 | | | | 61,132 | | | | — | | | | 61,132 | |
Other licensed or approved jurisdictions | | | 80,792 | | | | 17,897 | | | | 48,309 | | | | 146,998 | | | | 685 | | | | 147,683 | |
| | | 877,296 | | | | 384,012 | | | | 50,322 | | | | 1,311,630 | | | | 685 | | | | 1,312,315 | |
| | Year ended December 31, 2016 (As reclassified) | |
| | Poker | | | Casino & Sportsbook | | | Other Gaming | | | Total Gaming | | | Corporate | | | Total | |
| | $000’s | | | $000’s | | | $000’s | | | $000’s | | | $000’s | | | $000’s | |
Geographic Area | | | | | | | | | | | | | | | | | | | | | | | | |
Isle of Man | | | 339,513 | | | | 19,187 | | | | 3 | | | | 358,703 | | | | — | | | | 358,703 | |
Malta | | | 225,974 | | | | 166,198 | | | | 4 | | | | 392,176 | | | | — | | | | 392,176 | |
Italy | | | 77,646 | | | | 31,693 | | | | 624 | | | | 109,963 | | | | — | | | | 109,963 | |
United Kingdom | | | 56,837 | | | | 13,439 | | | | 387 | | | | 70,663 | | | | — | | | | 70,663 | |
Spain | | | 42,326 | | | | 24,370 | | | | 653 | | | | 67,349 | | | | — | | | | 67,349 | |
France | | | 51,989 | | | | 2,356 | | | | 573 | | | | 54,918 | | | | — | | | | 54,918 | |
Other licensed or approved jurisdictions | | | 51,774 | | | | 6,871 | | | | 42,722 | | | | 101,367 | | | | 108 | | | | 101,475 | |
| | | 846,059 | | | | 264,114 | | | | 44,966 | | | | 1,155,139 | | | | 108 | | | | 1,155,247 | |
The majority of the Corporation’s revenues are generated through Poker, followed by Casino & Sportsbook. Other offerings, including social and play-money gaming, live poker events, branded poker rooms and other sources of revenue primarily related to gaming are aggregated into Other Gaming revenues. Corporate revenues include certain other nominal sources of revenue. These revenues together comprise one segment as individually they do not meet any of the quantitative thresholds or disclosure requirements described in IFRS 8, Operating segments.
Poker Revenue
Poker revenue for the year ended December 31, 2017 was $877.3 million as compared to Poker revenue of $846.1 million for the prior year period, which represents an increase of 3.7% year-over-year. The increase in Poker revenue was primarily the result of (i) positive impacts of foreign exchange fluctuations (ii) the implementation of the Stars Rewards loyalty program, (iii) the Corporation’s previously announced strategy of focusing on recreational players, including through initiatives such as changes to its previous online poker loyalty program, rake structure and the introduction of new poker promotions, (iv) re-launch of online poker in Portugal and launch of PokerStars NJ, and (v) increased marketing spend in the fourth quarter of 2016 versus the prior year period with some resulting revenue impact in the first quarter of 2017. Notwithstanding, Poker revenues were negatively impacted by, among other things, (i) certain customers playing, either entirely or partially in place of poker, the Corporation’s real-money online casino offerings, (ii) a decline in customer activity on the Full Tilt real-money online poker offerings, (iii) the temporary cessation of operations during a portion of the period in the Czech Republic and the subsequent re-launch in the country under a local license with more onerous customer registration requirements for online gaming accounts requiring face-to-face verification, (iv) the cessation of operations in Australia, Colombia, Israel and Slovenia, and (v) previously disclosed negative operating conditions in Poland primarily related to constraints on processing payments in that jurisdiction. For information on the impact of fluctuations in foreign exchange rates, see “Foreign Exchange Impact on Revenue” below.
19
Casino & Sportsbook Revenue
Casino & Sportsbook revenue for the year ended December 31, 2017 was $384.0 million as compared to $264.1 million for the prior year period, which represents an increase of 45.4%. The increase in Casino & Sportsbook revenue was primarily the result of (i) the continued development of the Corporation’s casino product offerings, including through additional third-party slots under the PokerStars Casino brand, (ii) the expansion of the geographical reach of the Corporation’s casino and sportsbook products into eligible markets, (iii) the addition of new sports and user experience and user interface improvements to the Corporation’s sportsbook product, and (iv) positive impacts from foreign exchange fluctuations. For information on the impact of fluctuations in foreign exchange rates, see “Foreign Exchange Impact on Revenue” below.
Revenue by Geographic Region
The Corporation also evaluates revenue performance by geographic region based on the primary jurisdiction where the Corporation is licensed or approved to offer, or offers through third-party licenses or approvals, its online gaming products and services. The revenue tables above set out the proportion of revenue attributable to each gaming license or approval (as opposed to the jurisdiction where the customer was located) that either generated a minimum of 5% of total consolidated revenue for the year ended December 31, 2017 or 2016 or that the Corporation otherwise deems relevant based on its historical reporting of the same or otherwise.
With respect to Canada, the jurisdiction where its registered office is located, and based solely on calculations derived from internal records, the Corporation estimates that revenue derived from customers in Canada, which currently relates only to Poker, would represent less than 5% of its total consolidated revenue for the years ended December 31, 2016 and 2017. These estimations are neither itemized nor otherwise separated from the revenues the Corporation reports under IFRS or otherwise, and as such, they are neither reviewed nor audited, as applicable, by nor can they be reconciled to a reported IFRS measure.
Poker
Poker revenue increased in each geographic region, except in Malta, France and the United Kingdom, for the year ended December 31, 2017 as compared to the prior year period. The increases were generally the result of the same factors noted above under “Poker Revenue” for the same period. The increase in Spain was also due to higher than anticipated jackpot payouts in the Corporation’s Spin & Go product during the first quarter of 2016. The growth in other licensed and approved jurisdictions was also the result of obtaining local licenses to operate certain online gaming in Portugal and the Czech Republic (Czech Republic had previously operated under the Malta license and the Corporation had previously ceased operations in Portugal) and the introduction of PokerStars NJ to the New Jersey market. The decline in Malta was primarily the result of the movement of Czech Republic to local licensing regimes, and the cessation of operations in Slovenia. The decline in France was primarily due to an increase in CRM initiatives, in anticipation of France potentially transitioning to shared liquidity, leading to a reduction in net gaming revenue.
Casino & Sportsbook
Casino & Sportsbook revenue increased in each geographic region for the year ended December 31, 2017 as compared to the prior year period. The increases were generally the result of the same factors noted above under “Casino & Sportsbook Revenue” for the same period. The increase in Malta was also the result of the Corporation offering certain online casino and live dealer games under its Malta license to players in jurisdictions otherwise served through the Isle of Man and the United Kingdom licenses. The increase in the Isle of Man was also a result of the expansion of the Corporation’s online casino into certain additional eligible non-European Union markets. In addition, the significant increase in other licensed or approved jurisdictions was primarily the result of obtaining local licenses to operate online gaming in Portugal and the Czech Republic (Czech Republic had previously operated under the Malta license and the Corporation had previously ceased operations in Portugal), the introduction of online casino and sportsbook in Denmark and the introduction of online casino in New Jersey. The significant increase in Italy was also due to the growth of online casino and the launch of online sportsbook in the middle of the second quarter of 2016. The significant increase in France was due to the launch of online sportsbook in the latter half of the second quarter of 2016; the Corporation does not currently offer online casino in France.
20
Other Gaming
Other Gaming revenue was relatively flat as a proportion of revenue during the year ended December 31, 2017 as compared to the prior year period.
Foreign Exchange Impact on Revenue
The general weakening of the U.S. dollar, which is the primary currency of gameplay on the Corporation’s product offerings, relative to certain foreign currencies (particularly the Euro, which is the primary depositing currency of the Corporation’s customers) during the year ended December 31, 2017 as compared to the prior year period had a positive impact on the Corporation’s Poker, Casino & Sportsbook revenue. During the year ended December 31, 2017, the Corporation estimates the increase in the purchasing power of its consumer base, based on a weighted average of customer deposits, was a result of an average 2.3% increase in the value of its customers’ local currencies relative to the U.S. dollar.
If the Corporation had translated its total IFRS revenue for the year ended December 31, 2017 using the constant currency exchange rates for its source currencies other than the U.S. dollar, such revenues would have been $1,276.3 million, which is $36.1 million lower than actual IFRS revenues during such period. As a result, excluding the impact of year-over-year changes in foreign exchange rates, such revenues for the year would have increased by 10.5%, as opposed to 13.6%, over the prior year period.
Expenses
Selling
The increase in selling expenses for the year ended December 31, 2017 as compared to the prior year period was primarily the result of (i) an increase in acquisition marketing costs in connection with online poker and sportsbook operations, and (ii) an increase in royalty costs in connection with online casino operations driven by the growth and expansion of third-party slot and live dealer game offerings.
General and Administrative
The decrease in general and administrative expenses for the year ended December 31, 2017 as compared to the prior year period was primarily the result of (i) a reversal of the impairment of the Corporation’s investment in Innova Gaming Group Inc. (“Innova”) taken in prior years and (ii) a decrease in salary expense as a result of staff restructuring in connection with the operational excellence program and a reduction in employee termination costs. The decrease was partially offset by (i) increased payment processor costs due to higher net deposits, increased affiliate activities and fewer discounts received from processors in the 2017 period and (ii) amortization of intangible assets and deferred development costs associated with the Stars Interactive Group Acquisition and the development and launch of new products and offerings across online poker, casino, sportsbook and other gaming offerings.
Financial
The increase in financial expenses for the year ended December 31, 2017 as compared to the prior year period was primarily the result of (i) unrealized foreign exchange gains related to the translation of the USD Second Lien Term Loan (as defined below) and the deferred purchase price for the Stars Interactive Group Acquisition and (ii) unrealized foreign exchange gains generated on the Corporation’s outstanding U.S. dollar to Euro foreign exchange contracts, both generated during the prior year period.
Gaming Duty
The increase in gaming duty expenses for the year ended December 31, 2017 as compared to the prior year period was primarily the result of (i) increases in gaming duty on Poker, Casino & Sportsbook revenues reflecting growth in such revenues in markets where gaming duty is applicable, such as Italy, Spain, France and the United Kingdom and (ii) gaming duty in newly licensed markets such as Portugal and the Czech Republic. The increase was partially offset by the Corporation’s receipt of $5 million in indemnification proceeds from the sellers of the Stars Interactive Group in respect of gaming duty owed in Austria for periods prior to the Stars Interactive Group Acquisition.
21
Foreign Exchange Impact on Expenses
The Corporation’s expenses are also impacted by currency fluctuations. Almost all of its expenses are incurred in either the Euro, Great Britain Pound Sterling, U.S. dollar or Canadian dollar. There are some natural hedges as a result of customer deposits made in such currencies, however the Corporation also enters into certain economic hedges to mitigate the impact of foreign currency fluctuations as it deems necessary. Further information on foreign currency risk can be found below in “Liquidity and Capital Resources—Market Risk—Foreign Currency Exchange Risk”.
Gain (Loss) from Investments
The gain recognized from investments during the year ended December 31, 2017 as compared to the prior year period was primarily the result of (i) the completed dispositions of the Corporation’s retained ownership interests in NYX Gaming Group, the NYX Sub Preferred Shares and Jackpotjoy securities and (ii) the realized gain on the note received in connection with the sale of a former subsidiary, Cadillac Jack Inc., in 2015. For the prior year period, the loss from investments comprised (i) a provision recorded relating to a certain EBITDA support agreement between the Corporation and Innova and (ii) a decrease in the value of the Corporation’s retained ownership of the NYX Sub Preferred Shares.
Income Taxes Expense (Recovery)
The increase in income taxes for the year ended December 31, 2017 as compared to the prior year period was primarily due to a tax provision of $26.5 million relating to an ongoing transfer pricing dispute in Canada for one of the Corporation’s subsidiaries. The issue in dispute relates to the subsidiary’s operations for its 2003 to 2007 fiscal years, prior to its acquisition by The Stars Group. For additional information, see note 8 in the 2017 Annual Financial Statements. This tax provision was partially offset by a refund of approximately $2.85 million received from the Belgian tax authorities relating to the closure of a prior tax audit.
SUMMARY OF QUARTERLY RESULTS
The following financial data for each of the eight most recently completed quarters has been prepared in accordance with IFRS, and all such periods have been adjusted to reflect the impact of discontinued operations, as applicable. The presentation currency for each period presented below was and remains the U.S. dollar.
| For the three months ended | |
| Mar 31, | | Jun 30, | | Sept 30, | | Dec 31, | | Mar 31, | | Jun 30, | | Sept 30, | | Dec 31, | |
$000’s, except per share amounts | 2016 | | 2016 | | 2016 | | 2016 | | 2017 | | 2017 | | 2017 | | 2017 | |
Revenue | | 288,518 | | | 285,762 | | | 270,681 | | | 310,286 | | | 317,320 | | | 305,305 | | | 329,443 | | | 360,247 | |
Net Earnings | | 55,491 | | | 22,497 | | | 12,523 | | | 45,039 | | | 65,753 | | | 70,483 | | | 75,874 | | | 47,175 | |
Basic Net Earnings per Common Share | $ 0.42 | | $ 0.16 | | $ 0.09 | | $ 0.31 | | $ 0.45 | | $ 0.48 | | $ 0.52 | | $ | 0.32 | |
Diluted Net Earnings per Common Share | $ 0.28 | | $ 0.12 | | $ 0.06 | | $ 0.23 | | $ 0.33 | | $ 0.35 | | $ 0.37 | | $ | 0.23 | |
The year-over-year revenue increases since the first quarter of 2017 as compared to the prior year periods were primarily attributable to Casino & Sportsbook revenues resulting from the continued rollout of casino and sportsbook products and the expansion of the geographical reach of such products into eligible markets, in addition to the positive impact on poker revenues from the introduction of the Stars Rewards program. Prior to the third quarter of 2017, the revenue increases were also a result of the previously announced changes to the Corporation’s customer loyalty program and rake structure, as well as adjustments to the Corporation’s multi-table tournament payout structure, including through the reinvestment of a portion of the loyalty program cost reductions and additional rake into CRM and lifecycle initiatives for recreational players.
22
For a discussion of trends and variances over the three months and years ended December 31, 2017 and 2016, see “Selected Financial Information”, “Discussion of Operations”, “Liquidity and Capital Resources” and “Cash Flows by Activity” contained in this MD&A.
Given the nature of the Corporation’s business, including, without limitation, the extent of certain non-recurring and other costs, instead of evaluating IFRS net earnings alone, the Corporation also analyzes Adjusted EBITDA, Adjusted Cash Flow from Operations, Adjusted Net Earnings and Adjusted Net Earnings per Diluted Share to evaluate operating results and for financial and operational decision-making purposes. The Corporation believes that these measures provide useful information about its operating results and enhances the overall understanding of its past performance and future prospects, as well as its performance against peers and competitors. See “Selected Financial Information—Other Financial Information” above.
The Corporation’s results of operations can fluctuate due to seasonal trends and other factors. Historically, given the geographies where the majority of the Corporation’s customers are located, and the related climate and weather in such geographies, among other things, revenues, key metrics and customer activity have been generally higher in the first and fourth fiscal quarters than in the second and third fiscal quarters. In online sportsbook, fluctuations can also occur around applicable sports seasons with increased customer activity around notable or popular sporting events. Additionally, with respect to online sports betting, revenues from that vertical generally fluctuate in line with gross win margin (or the total customer wagers less customer winnings as a proportion of the total amount wagered). However, the impact on revenues may be mitigated by the positive or negative impact of gross win margins on customer wagering, which can fluctuate inversely with such margins. As a result, prolonged periods of high gross win margin can negatively impact customer experience, enjoyment and engagement levels thereby resulting in lower customer wagering volumes on sports betting or other gaming verticals. Conversely, while periods of low gross win margin tend to negatively impact revenues, this may be mitigated to an extent by increased customer wagering volume (generally referred to as recycling of winnings) due to the positive impact of customer-friendly results on customer experience, enjoyment and engagement. Further, changes to the Corporation’s Stars Rewards loyalty program impact net gaming revenue, which could also cause fluctuations. As such, results for any quarter are not necessarily indicative of the results that may be achieved in another quarter or for the full fiscal year. There can be no assurance that the seasonal trends and other factors that have impacted the Corporation’s historical results will repeat in future periods as the Corporation cannot influence or forecast many of these factors. For other factors that may cause its results to fluctuate, including, without limitation, market risks, such as foreign exchange risks, see “Overview and Outlook” above, “Liquidity and Capital Resources—Market Risk” and “Risk Factors and Uncertainties” below, and the 2017 Annual Information Form, including, without limitation, under the headings “Risk Factors and Uncertainties” and “Business of the Corporation—Seasonality and Other Factors Impacting the Business” therein.
LIQUIDITY AND CAPITAL RESOURCES
The Corporation’s principal sources of liquidity are its cash generated from operations and certain other currently available funds. Currently available funds consist primarily of cash on deposit with banks and investments, which are comprised primarily of certain highly liquid, short-term investments, including money market funds. The Corporation’s working capital needs are generally minimal over the year as its current gaming business requires customers to deposit funds prior to playing or participating in its real-money product offerings. The Corporation believes that such deposits are typically converted to revenue efficiently and on a timely basis such that operating expenditures are sufficiently covered. Management also believes that investing is a key element necessary for the continued growth of the Corporation’s customer base and the future development of new and innovative products and services. Based on the Corporation’s currently available funds, funds available from the Credit Facility (as defined and detailed below) and its ability to access the debt and equity capital markets, if necessary, management believes that the Corporation will have the cash resources necessary to satisfy current obligations and working capital needs, and fund currently planned development activities and other capital expenditures for at least the next 12 months. Notwithstanding, as a result of, among other things, the state of capital markets and the Corporation’s ability to access them on favorable terms, if at all, micro and macro-economic downturns, and contractions of the Corporation’s operations may influence its ability to secure the capital resources required to satisfy current or future obligations (including, without limitation, those set forth under “Contractual Obligations” below) and fund future projects, strategic initiatives and support growth. For a description of the factors and risks that could affect the Corporation’s ability to generate sufficient amounts of cash and access the capital markets, in the short- and long-terms, in order to maintain the Corporation’s capacity to meet its obligations and expected growth or fund development activities, see “Risk Factors and Uncertainties” below and in the 2017 Annual Information Form.
23
The Corporation believes that it has improved its financial condition since December 31, 2016 by, among other things, paying all remaining amounts of the deferred purchase price for the Stars Interactive Group Acquisition, completing the Repricing, making the Prepayments (each as defined below), decreasing its leverage ratios and producing strong net cash inflows from operating activities. The Corporation expects to continue improving its financial condition through its strong cash flow generation and liquidity, including as a result of continuing to introduce new and innovative products and pursuing expansion into new jurisdictions. For additional information regarding the Corporation’s repayment of debt, including the Repricing, see below under “Long-Term Debt”.
For additional information regarding the Corporation’s liquidity and capital resources, see the descriptions of the Corporation’s debt as set forth below under “Credit Facility” and “Long-Term Debt” and the notes to the 2017 Annual Financial Statements, as well as the 2017 Annual Information Form. See also “Risk Factors and Uncertainties” below and in the 2017 Annual Information Form, particularly under the heading “Risk Factors and Uncertainties—Risks Related to the Corporation’s Substantial Indebtedness”.
Market Risk
The Corporation is exposed to market risks, including changes to foreign currency exchange rates and interest rates.
Foreign Currency Exchange Risk
The Corporation is exposed to foreign currency risk, which includes risks related to its revenue and operating expenses denominated in currencies other than the U.S. dollar. In general, the Corporation is a net receiver of currencies other than the U.S. dollar, primarily the Euro, which is the primary depositing currency of the Corporation’s customers. Accordingly, changes in exchange rates, and in particular a strengthening of the U.S. dollar, which is the primary currency of game play on the Corporation’s product offerings, have in the past reduced, and may in the future reduce, the purchasing power of the Corporation’s customers, thereby potentially negatively affecting the Corporation’s revenue and other operating results.
The Corporation has experienced and will continue to experience fluctuations in its net earnings as a result of translation gains or losses related to revaluing certain current asset and current liability balances that are denominated in currencies other than the functional currency of the entities in which they are recorded. The Corporation uses derivative financial instruments for risk management purposes, not for generating trading profits, and anticipates that such instruments will mitigate some of its foreign currency risk. As such, any change in cash flows associated with derivative instruments is expected to be offset by changes in cash flows related to the hedged position. However, it is difficult to predict the effect hedging activities could have on the Corporation’s results of operations and there can be no assurance that any foreign currency exchange risks will be so mitigated or that such instruments will not result in a loss. The Corporation recognized foreign currency losses of $0.5 million and $5.1 million in the three months ended December 31, 2017 and 2016, respectively, and foreign currency losses of $2.8 million and foreign currency gains of $29.6 million in the years ended December 31, 2017 and 2016, respectively.
For additional information on derivatives, see also notes 2 and 21 in the 2017 Annual Financial Statements. Management monitors movements in foreign exchange rates by frequently reviewing certain currency pairs. The Corporation may in the future enter into additional derivatives or other financial instruments in an attempt to hedge its foreign currency exchange risk.
Interest Rate Sensitivity
The Corporation’s exposure to changes in interest rates (particularly fluctuations in LIBOR) relates primarily to interest paid on the Corporation’s long-term indebtedness, as well as the interest earned on and market value of its cash and available-for-sale investments. The Corporation is also exposed to fair value interest rate risk with respect to its USD First Lien Term Loan, which it attempts to mitigate by hedging through the Swap Agreements that fix the interest rate on the same. The Corporation is also exposed to cash flow interest rate risk on the unhedged elements of the USD First Lien Term Loan, the EUR First Lien Term Loan (as defined below) and the USD Second Lien Term Loan (as defined below), which each bear interest at variable rates.
As of the date hereof, the USD First Lien Term Loan and the USD Second Lien Term Loan each have a LIBOR floor of 1.00% and as such, the interest rate cannot decrease below 4.50% and 8.00%, respectively. The EUR First Lien Term Loan has a EURIBOR floor of 0% and as such, the interest rate cannot decrease below 3.75%. Management monitors movements in the interest rates by frequently reviewing the EURIBOR and LIBOR.
24
The Corporation’s cash consists primarily of cash on deposit with banks and its investments consist primarily of certain highly liquid, short-term instruments, including debt securities and funds. The Corporation’s investment policy and strategy is focused on preservation of capital and supporting its liquidity requirements, not on generating trading profits. Changes in interest rates affect the interest earned on the Corporation’s cash and investments and the market value of those securities. However, any realized gains or losses resulting from such interest rate changes would occur only if the Corporation sold the investments prior to maturity.
Liquidity Risk
The Corporation is also exposed to liquidity risk with respect to its contractual obligations and financial liabilities. The Corporation manages liquidity risk by continuously monitoring its forecasted and actual cash flows and matching maturity profiles of financial assets and liabilities. The Corporation’s objective is to maintain a balance between continuity of funding and flexibility through borrowing facilities available through the Corporation’s banks and other lenders. The Corporation’s policy is to seek to ensure adequate funding is available from operations, established lending facilities and other sources, including the debt and equity capital markets, as required.
Contractual Obligations
The following is a summary of the Corporation’s contractual obligations as at December 31, 2017:
| | Payments due by period | |
| | Total | | | Less than | | | 1-3 years | | | 4-5 years | | | More than | |
$000's | | | | | | 1 year | | | | | | | | | | | 5 years | |
Provisions | | | 16,418 | | | | 13,325 | | | | 3,093 | | | | — | | | | — | |
Long-Term Debt * | | | 2,902,493 | | | | 150,026 | | | | 295,409 | | | | 2,457,058 | | | | — | |
Derivatives | | | 111,762 | | | | — | | | | 111,762 | | | | — | | | | — | |
Purchase Obligations | | | 61,569 | | | | 9,418 | | | | 16,877 | | | | 11,446 | | | | 23,828 | |
Total | | | 3,092,242 | | | | 172,769 | | | | 427,141 | | | | 2,468,504 | | | | 23,828 | |
* Includes principal and interest
In August and September 2017, the Corporation prepaid without penalty $40 million and $75 million, respectively (collectively, the “Prepayments”), under the USD Second Lien Term Loan using cash on its balance sheet, cash flow from operations or a combination thereof. Following the Prepayments, the outstanding principal balance of the USD Second Lien Term loan as of the date hereof is $95 million.
Credit Facility
The Corporation obtained a first lien revolving credit facility of $100 million on August 1, 2014 in connection with the Stars Interactive Group Acquisition (the “Credit Facility”). Maturing on August 1, 2019, the Credit Facility can be used to fund working capital needs and for general corporate purposes. The interest rate under the Credit Facility is, at the Corporation’s option, either LIBOR plus 4.00% or ABR plus 3.00%. The applicable commitment fee on the Credit Facility is based on a first lien leverage ratio of 3.75 to 1.00 and could range from 0.375% to 0.50%. Borrowings under the Credit Facility are subject to the satisfaction of customary conditions, including the absence of a default and compliance with certain representations and warranties.
As at each of December 31, 2017 and 2016, the available balance under the Credit Facility was $70 million. In connection with the previously reported December 23, 2015 Commonwealth of Kentucky trial court order for damages against certain of its subsidiaries, the Corporation filed a notice of appeal to the Kentucky Court of Appeals and posted a $100 million supersedeas bond to stay enforcement of the order for damages during the pendency of the appeals process. In connection with the posting of the bond, the Corporation delivered cash collateral in the amount of $40 million and letters of credit in the aggregate amount of $30 million (collectively, the “Kentucky Bond Collateral”), thereby reducing the availability under the Credit Facility from $100 million to $70 million.
For additional information on the proceedings in Kentucky, see below under “Legal Proceedings and Regulatory Actions” and the 2017 Annual Reports, including under the heading “Legal Proceedings and Regulatory Actions” in the 2017 Annual Information Form and note 30 of the 2017 Annual Financial Statements.
25
Long-Term Debt
The following is a summary of long-term debt outstanding as at December 31, 2017, 2016 and 2015 (all capitalized terms used in the table below relating to such long-term debt are defined below):
| | Interest rate | | | December 31, 2017, Principal outstanding balance in local denominated currency | | | December 31, 2017 Carrying amount | | | December 31, 2016, Principal outstanding balance in local denominated currency | | | December 31, 2016 Carrying amount | | | December 31, 2015, Principal outstanding balance in local denominated currency | | | December 31, 2015 Carrying amount | |
| | | | | | 000’s | | | $000’s | | | 000’s | | | $000’s | | | 000’s | | | $000’s | |
USD First Lien Term Loan | | 4.83% | | | | 1,895,654 | | | | 1,848,397 | | | | 2,021,097 | | | | 1,965,928 | | | | 2,041,616 | | | | 1,978,763 | |
EUR First Lien Term Loan | | 3.75% | | | | 382,222 | | | | 453,540 | | | | 286,143 | | | | 296,198 | | | | 289,048 | | | | 307,584 | |
USD Second Lien Term Loan | | 8.33% | | | | 95,000 | | | | 56,632 | | | | 210,000 | | | | 166,453 | | | | 210,000 | | | | 161,524 | |
CDN 2013 Debentures | | 7.50% | | | | — | | | | — | | | | — | | | | — | | | | 30,000 | | | | 21,556 | |
Total long-term debt | | | | | | | | | | | 2,358,569 | | | | | | | | 2,428,579 | | | | | | | | 2,469,427 | |
Current portion | | | | | | | | | | | 4,990 | | | | | | | | 47,750 | | | | | | | | 32,889 | |
Non-current portion | | | | | | | | | | | 2,353,579 | | | | | | | | 2,380,829 | | | | | | | | 2,436,538 | |
The decrease in outstanding long-term debt from December 31, 2016 to December 31, 2017 was primarily the result of the Prepayments and quarterly scheduled debt principal repayments, partially offset by foreign exchange fluctuations, the Repricing, and interest accretion. The decrease in outstanding long-term debt from December 31, 2015 to December 31, 2016 was primarily the result of the repayment of the CDN 2013 Debentures (as defined below). For additional information regarding the interest on the Corporation’s outstanding long-term debt, including the effective interest rates, see the 2017 Annual Financial Statements. To manage its interest rate exposure on certain of its debt, the Corporation previously entered into the Swap Agreements.
The principal repayments of the Corporation’s currently outstanding long-term debt over the next five years, as adjusted for revised estimates of excess cash flow allocations to the principal repayment of the First Lien Term Loans (as defined below), amount to the following:
| | 1 Year $000's | | | 2 Years $000's | | | 3 Years $000's | | | 4 Years $000's | | | 5 Years $000's | |
USD First Lien Term Loan | | | 19,443 | | | | 19,443 | | | | 19,443 | | | | 1,837,326 | | | | — | |
EUR First Lien Term Loan | | | 4,709 | | | | 4,709 | | | | 4,709 | | | | 444,960 | | | | — | |
USD Second Lien Term Loan | | | — | | | | — | | | | — | | | | — | | | | 95,000 | |
Total | | | 24,152 | | | | 24,152 | | | | 24,152 | | | | 2,282,286 | | | | 95,000 | |
CDN 2013 Debentures
On February 7, 2013, the Corporation closed a private placement of units consisting of debentures and warrants, issuing and selling 30,000 units at a price of CDN $1,000 per unit for aggregate gross proceeds of CDN $30 million (the “CDN 2013 Debentures”). The CDN 2013 Debentures matured on January 31, 2016 and were repaid in full on February 1, 2016 and the then-remaining outstanding warrants expired on January 31, 2016. As of such date, the Corporation had no further obligations under or with respect to the same.
First and Second Lien Term Loans
On August 1, 2014, the Corporation completed the Stars Interactive Group Acquisition, which was partly financed through the issuance of long-term debt, allocated into first and second lien term loans. Giving effect to a previously disclosed refinancing in August 2015 (the “Refinancing”) and the Repricing, as at December 31, 2017, the first lien term loans consisted of a $1.85 billion first lien term loan priced at LIBOR plus 3.50% (the “USD First Lien Term Loan”) and a €378 million seven-year first lien term loan priced at EURIBOR plus 3.75% (the “EUR First Lien Term Loan” and, together with the USD First Lien Term Loan, the “First Lien Term Loans”), with 1.00% LIBOR and 0% EURIBOR floors, respectively, and each repayable on August 22, 2021. Giving effect to the Refinancing,
26
Repricing and Prepayments, as at December 31, 2017, the second lien term loan consisted of a $95 million loan priced at LIBOR plus 7.00%, with a 1.00% LIBOR floor and repayable on August 1, 2022 (the “USD Second Lien Term Loan”).
As previously disclosed, on March 3, 2017, the Corporation completed the repricing and retranching of the First Lien Term Loans and amended the applicable credit agreement (collectively, the “Repricing”). The Repricing included reducing the applicable interest rate margin on the First Lien Term Loans by 0.5% to LIBOR plus 3.5% with a LIBOR floor of 1% to EURIBOR plus 3.75% with a 0% EURIBOR floor, respectively, and retranching such loans by raising €100 million of incremental debt on the EUR First Lien Term Loan and using the proceeds to reduce the USD First Lien Term Loan by $106 million. The Corporation and the lenders also amended the credit agreement for the First Lien Term Loans to, among other things, reflect the Repricing and waive the required 2016 and 2017 excess cash flow repayments (as defined and described in the credit agreement) previously due on March 31, 2017 and March 31, 2018, respectively.
In addition to the Refinancing and Repricing, the Corporation also made the Prepayments during the year ended December 31, 2017. As a result of the Refinancing, Repricing and Prepayments, the Corporation realized aggregate savings of approximately $6.5 million and $16.3 million in interest expense for the three months and year ended December 31, 2017, respectively.
To finance the cash portion of the purchase price for CrownBet, a subsidiary of the Corporation, to acquire William Hill Australia, the Corporation obtained committed financing for a $325 million incremental USD First Lien Term Loan. See “Overview and Outlook – Recent Corporate Developments” for additional information.
First Lien Term Loans
Except as set forth above, the Corporation is required to allocate up to 50% of its excess cash flow to the principal repayment of the First Lien Term Loans. With respect to the First Lien Term loans, excess cash flow means EBITDA of Stars Group Holdings B.V. (a direct or indirect parent of Stars Interactive Group and CrownBet) on a consolidated basis for such excess cash flow period (i.e., each fiscal year commencing with the fiscal year ended on December 31, 2015), minus, without duplication, debt service, capital expenditures, permitted business acquisitions and investments, taxes paid in cash, increases in working capital, cash expenditures in respect of swap agreements, any extraordinary, unusual or nonrecurring loss, income or gain on asset dispositions, and plus, without any duplication, decreases in working capital, capital expenditures funded with the proceeds of the issuance of debt or the issuance of equity, cash payments received in respect of swap agreements, any extraordinary, unusual or nonrecurring gain realized in cash and cash interest income to the extent deducted in the computation of EBITDA.
The percentage allocated to the principal repayment can fluctuate based on the following:
| • | If the total secured leverage ratio (as defined in the credit agreement governing the First Lien Term Loans) at the end of the applicable excess cash flow period is less than or equal to 4.75 to 1.00 but is greater than 4.00 to 1.00, the repayments will be 25% of the excess cash flow. |
| • | If the total secured leverage ratio at the end of the applicable excess cash flow period is less than or equal to 4.00 to 1.00, the repayment will be 0% of the excess cash flow. |
As a result of the Refinancing and Repricing and respective amendments to the credit agreement for the First Lien Term Loans, the Corporation was not required to allocate any excess cash flow to the principal repayment of the First Lien Term Loans during the fiscal years ended December 31, 2016 or 2017 and will not be required to do so during the fiscal year ending December 31, 2018. However, to the extent that the Corporation has such excess cash flow in applicable periods beginning in 2019 and depending upon the total secured leverage ratio, the Corporation may be required to allocate the applicable portion of such excess cash flow for such principal repayment.
The agreement for the First Lien Term Loans limits Stars Group Holdings B.V. and its subsidiaries’ ability to, among other things, incur additional debt or grant additional liens on its assets and equity, distribute equity interests and distribute any assets to third parties.
As described above under “—Market Risk—Interest Rate Sensitivity”, the Corporation is exposed to fluctuations in the LIBOR rate as certain of its indebtedness has variable interest rates, which could lead to increased interest charges. During the year ended December 31, 2015, a subsidiary of the Corporation entered into cross currency
27
interest rate swap agreements (collectively, the “Swap Agreements”), designated and qualifying as cash flow hedges, to manage the interest rate exposure on the USD First Lien Term Loan. Under the Swap Agreements, the subsidiary agreed to exchange a notional principal amount of approximately $2.07 billion of the USD First Lien Term Loan into Euro denominated fixed rate debt in order to fix future interest and principal payments in terms of the Euro, which is the subsidiary’s functional currency. In doing so, the Corporation currently expects to mitigate the impact of changes in interest rates and the impact of foreign currency gains and losses resulting from changes in the U.S. dollar to Euro exchange rate, thereby potentially reducing the uncertainty of future cash flows. As at December 31, 2017, the fair value of the Swap Agreements represented a liability of $111.76 million. As a result of the Swap Agreements, the Corporation had interest savings of $16.58 million during the year. During the year ended December 31, 2017, the Corporation unwound and settled a notional principal amount of $616.54 million of the Swap Agreements for a gain of $13.90 million. As a result of this unwinding and settlement, approximately $1.16 billion of the USD First Lien Term Loan is covered under the Swap Agreements. The remaining $690.29 million USD First Lien Term Loan is exposed to fluctuations in interest rates.
See also “Risk Factors and Uncertainties” below and in the 2017 Annual Information Form, particularly under the heading “Risk Factors and Uncertainties—Risks Related to the Corporation’s Substantial Indebtedness”.
USD Second Lien Term Loan
During the year ended December 31, 2017 and during a portion of the year ended December 31, 2016, the Corporation designated a portion of the USD First Lien Term Loan, the entire principal amount of the USD Second Lien Term Loan and its then-outstanding deferred consideration for the Stars Interactive Group Acquisition as a foreign exchange hedge of its net investment in its foreign operations. Accordingly, the portion of the gains arising from the translation of the USD-denominated liabilities that was determined to be an effective hedge during the period was recognized in other comprehensive income and accumulated under the heading cumulative foreign currency translation reserve, counterbalancing a portion of the losses arising from translation of the Corporation’s net investment in its foreign operations.
During each of the three months and year ended December 31, 2017, there was no ineffectiveness with respect to the net investment hedge. As at December 31, 2017, the Corporation had outstanding forward contracts to sell USD and purchase a notional amount of £67.5 million to hedge the Corporation’s exposure to GBP expenses in 2018. These contracts have been designated as cashflow hedges. There were no equivalent contracts outstanding as at December 31, 2016.
For the three months and year ended December 31, 2017, the Corporation recorded an unrealized exchange loss on translation of $11.82 million and $134.72 million, respectively, as compared to a loss of $42.00 million and a loss of $48.29 million for each of the prior year periods, in the cumulative translation adjustment in reserves related to the translation of a portion of the USD First Lien Term Loan, USD Second Lien Term Loan and the deferred purchase price for the Stars Interactive Group Acquisition.
See note 31 in the 2017 Annual Financial Statements for further information in respect of financial instruments.
CASH FLOWS BY ACTIVITY
Comparison of the Three Months Ended December 31, 2017 and 2016
The table below outlines a summary of cash inflows and outflows by activity for the three months ended December 31, 2017 and 2016.
| | Three Months Ended December 31, | |
| | 2017 | | | 2016 | |
| | $000's | | | $000's | |
Net cash inflows from operating activities | | | 123,756 | | | | 148,295 | |
Net cash outflows from financing activities | | | (28,275 | ) | | | (237,032 | ) |
Net cash inflows from investing activities | | | 184,958 | | | | 147,441 | |
28
Cash Inflows from Operating Activities
The Corporation generated cash inflows from operating activities for the three months ended December 31, 2017 and 2016. The Corporation’s cash inflows from operating activities decreased for the three months ended December 31, 2017 as compared to the prior year period despite increased EBITDA primarily due to realized gains on its completed dispositions of its retained ownership in NYX Gaming Group, the NYX Sub Preferred Shares and Jackpotjoy securities.
Cash Outflows from Financing Activities
During the three months ended December 31, 2017, the primary expenditure affecting cash outflows from financing activities was the repayment of long-term debt interest and principal related to the First Lien Term Loans and the repayment of interest on the USD Second Lien Term Loan. During the three months ended December 31, 2016, the primary expenditures affecting cash outflows from financing activities were (i) the payment of $200 million on the deferred purchase price for the Stars Interactive Group Acquisition in November 2016 and (ii) the repayment of long-term debt interest and principal related to the First Lien Term Loans and the USD Second Lien Term Loan.
Cash Inflows from Investing Activities
During the three months ended December 31, 2017, the Corporation’s cash inflows from investing activities were primarily driven by (i) a change in the securities underlying the customer deposits from those classified as investments to those classified as cash and cash equivalents and (ii) proceeds from the completed dispositions of the Corporation’s retained ownership in NYX Gaming Group, the NYX Sub Preferred Shares and Jackpotjoy securities, all of which were partially offset by capital expenditures. During the three months ended December 31, 2016, the Corporation’s cash inflows from investing activities were primarily driven by the derestriction of certain required monthly excess cash flow deposits to partially fund the $200 million payment on the deferred purchase price for the Stars Interactive Group Acquisition in November 2016, partially offset by capital expenditures, primarily consisting of investments in online poker, casino and sportsbook development.
Comparison of the Years Ended December 31, 2017 and 2016
The table below outlines a summary of cash inflows and outflows by activity for the years ended December 31, 2017 and 2016.
| | Year Ended December 31, | |
| | 2017 | | | 2016 | |
| | $000's | | | $000's | |
Net cash inflows from operating activities | | | 494,600 | | | | 349,936 | |
Net cash outflows from financing activities | | | (443,802 | ) | | | (375,586 | ) |
Net cash inflows from investing activities | | | 174,850 | | | | 28,871 | |
Cash Inflows from Operating Activities
The Corporation generated cash inflows from operating activities for the years ended December 31, 2017 and 2016. The Corporation’s cash inflows from operating activities increased for the year ended December 31, 2017 as compared to the prior year period primarily as a result of increased EBITDA generated from the Corporation’s underlying operations.
Cash Outflows from Financing Activities
During the year ended December 31, 2017, the primary expenditures affecting cash outflows from financing activities were (i) the payment of $197.5 million on the deferred purchase price for the Stars Interactive Group Acquisition during the period and (ii) the repayment of long-term debt interest and principal related to the First Lien Term Loans and the repayment of interest on the USD Second Lien Term Loan, including the Prepayments, both partially offset by proceeds from exercised employee stock options. During the year ended December 31, 2016, the primary expenditures affecting the cash outflows from financing activities were (i) the payment of $200 million on
29
the deferred purchase price for the Stars Interactive Group Acquisition in November 2016 and (ii) the repayment of long-term debt interest and principal related to the First Lien Term Loans and the USD Second Lien Term Loan.
Cash Inflows from Investing Activities
During the year ended December 31, 2017, the Corporation’s cash inflows from investing activities were primarily driven by (i) a change in the securities underlying the customer deposits from those classified as investments to those classified as cash and cash equivalents and (ii) proceeds from the completed dispositions of the Corporation’s retained ownership in NYX Gaming Group, the NYX Sub Preferred Shares and Jackpotjoy securities, all of which were partially offset by capital expenditures, primarily consisting of investments in online poker, casino and sportsbook development. During the year ended December 31, 2016, cash inflows from investing activities primarily consisted of the derestriction of certain required monthly excess cash flow deposits to partially fund the $200 million payment on the deferred purchase price, partially offset by (i) the required monthly excess cash flow deposits for the deferred purchase price for the Stars Interactive Group Acquisition, (ii) the cash collateral delivered as part of the Kentucky Bond Collateral, (iii) capital expenditures, primarily consisting of investments in online poker, casino and sportsbook development, and (iv) the payment of certain minimum revenue guarantees in connection with the Corporation’s divestiture of certain former businesses.
SUMMARY OF SIGNIFICANT ACCOUNTING POLICIES
For a description of the Corporation’s significant accounting policies, critical accounting estimates and judgments, and related information, see note 2 to the 2017 Annual Financial Statements. Other than as set forth below, there have been no changes to the Corporation’s significant accounting policies or critical accounting estimates or judgments during the year ended December 31, 2017.
Change in Critical Accounting Estimates
During the year ended December 31, 2017, the Corporation made the following changes to its critical accounting estimates or judgments:
Tax provision in respect of prior years
Determining the Corporation’s income tax and its provisions for income taxes involves a significant degree of estimation and judgement, particularly in respect of open tax returns relating to prior years where the liabilities remain to be agreed with the local tax authorities. Provisions for income taxes are recognized based on management’s best estimate of the outcome after taking into consideration all available evidence, and where appropriate, after taking external advice into consideration. The tax provision recorded in the Corporation’s 2017 consolidated financial statements in respect of prior years relate to intercompany trading arrangements entered into in the normal course of business. Due to the uncertainty associated with such tax items it is possible that at a future date, on resolution of the open tax matters, the final outcome may vary significantly and there is the potential for a material adjustment to the carrying amounts of the liability recorded as a result of this estimation and uncertainty.
30
RECENT ACCOUNTING PRONOUNCEMENTS
Changes in Accounting Policies Adopted
During the year ended December 31, 2017, there were no changes to the Corporation’s accounting policies adopted.
New Accounting Pronouncements – Not Yet Effective
For a list of the new and revised accounting standards under IFRS that the Corporation has not yet applied, see the 2017 Annual Financial Statements. Subject to full analysis the Corporation does not currently expect that the adoption of such new and revised standards will have a material impact on the financial statements of The Stars Group in future periods, except as noted below:
IFRS 9, Financial Instruments
The IASB issued IFRS 9 relating to the classification and measurement of financial instruments. IFRS 9 uses a single approach to determine whether a financial asset is measured at amortized cost or fair value, and this approach replaces the previous requirements of IAS 39, Financial Instruments: Recognition and Measurement. The approach in IFRS 9 is based on how an entity manages its financial assets (i.e., its business model) and the contractual cash flow characteristics of those financial assets. IFRS 9 also amends the impairment criteria by introducing a new expected credit losses model for calculating impairment on financial assets and commitments to extend credit. The standard also introduces minor changes applicable to financial liabilities. Further, IFRS 9 includes new hedge accounting requirements that align hedge accounting more closely with risk management. These new requirements do not fundamentally change the types of hedging relationships or the requirement to measure and recognize ineffectiveness, but do allow more hedging strategies that are used for risk management to qualify for hedge accounting and for more judgment by management in assessing the effectiveness of those hedging relationships, replacing the rules-based approach to assessing hedge effectiveness under IAS 39. Extended disclosures in respect of risk management activity will also be required under the new standard.
Based on the analysis undertaken to date, the Corporation expects the following impact on its consolidated financial statements and disclosures as a result of the adoption of the new standard on January 1, 2018:
Certain equity investments that are currently classified as available-for-sale ($7.0 million as at December 31, 2017) will be reclassified to financial assets at fair value through profit or loss on January 1, 2018. Related fair value gains of $nil will be transferred from the available-for-sale financial assets reserve to retained earnings on January 1, 2018 and fair value gains related to these investments amounting to $nil were recognized in profit or loss in the 2017 financial year as these investments are currently held at cost.
Investment in debt instruments held by the Corporation (i.e., bonds) that are currently classified as available-for-sale will satisfy the conditions for classification as at fair value through other comprehensive income and hence there will be no change to the accounting for these assets. Related fair value gains of $nil will be transferred from the available-for-sale financial assets reserve to the financial assets at fair value through other comprehensive income reserve on January 1, 2018.
The other financial assets held by the Corporation include debt instruments currently measured at amortized cost which continue to meet the conditions for classification at amortized cost under IFRS 9. Accordingly, the Corporation does not expect the new guidance to affect the classification and measurement of these financial assets.
The new impairment model requires the recognition of impairment provisions based on expected credit losses rather than only incurred credit losses as is the case under IAS 39. It applies to financial assets classified at amortized cost, debt instruments measured at fair value through other comprehensive income, contract assets under IFRS 15, Revenue from Contracts with Customers, lease receivables, loan commitments and certain financial guarantee contracts. Based on the assessments undertaken to date, the Corporation does not expect a material increase in the loss allowance against these assets.
The impact of historic modifications arising on the Corporation’s existing long-term debt are required to be recognized on transition to the new standard. This will result in an adjustment to the carrying amount of long-term debt and a corresponding adjustment in the opening balance of retained earnings on January 1, 2018. The de-recognition rules remain unchanged from IAS 39 Financial Instruments: Recognition and Measurement.
31
As permitted by IFRS 9, the Corporation intends to elect to continue to apply the hedge accounting requirements of IAS 39 to all of its hedging relationships, rather than apply the new requirements of IFRS 9 upon adoption of the new standard on January 1, 2018.
The new standard also introduces requirements for expanded disclosure and changes in presentation. These requirements are expected to change the nature and extent of the Corporation’s disclosures about its financial instruments, particularly in the year of adoption.
The Corporation will apply the new rules retrospectively from January 1, 2018, with the practical expedients permitted under the standard. Comparative information for 2017 will not be restated.
IFRS 15, Revenues from Contracts with Customers
The Financial Accounting Standards Board and IASB issued converged standards in respect of revenue recognition. IFRS 15 affects any entity entering into contracts with customers, unless those contracts fall within the scope of other standards such as insurance contracts, financial instruments or lease contracts. IFRS 15 supersedes the revenue recognition requirements in IAS 18, Revenue, IFRIC 13, Customer Loyalty Programs, and the majority of other industry-specific guidance.
The standard contains a single model that applies to contracts with customers and two approaches to recognizing revenue, i.e., at a point in time or over time. The model features a contract-based five-step analysis of transactions to determine whether, how much and when revenue is recognized. New estimates and judgmental thresholds have been introduced, which may affect the amount or timing of revenue recognized.
The Corporation has completed its analysis and expects the following impact on its consolidated financial statements and disclosures as a result of the adoption of the new standard on January 1, 2018:
The timing and amount of revenue recognized is not expected to be materially affected as a result of adoption, but the Corporation does expect an impact on presentation and disclosure due to the requirement to present revenue from contracts with customers separately from other sources of income.
The Corporation does not believe contract assets and liabilities as of January 1, 2018 will be material such that they require separate disclosure in the consolidated statement of financial position or in the notes to the consolidated financial statements.
The new standard will be applied using the modified retrospective approach, whereby the cumulative impact of adoption will be recognized in retained earnings as of January 1, 2018 and comparative information for 2017 will not be restated. The Corporation does not believe this approach will result in an adjustment to the opening balance of retained earnings on adoption.
IFRS 16, Leases
The IASB recently issued IFRS 16 to replace IAS 17, Leases. This standard introduces a single lessee accounting model and requires a lessee to recognize assets and liabilities for all leases with a term of more than 12 months, unless the underlying asset is of low value. A lessee is required to recognize a right-of-use asset representing its right to use the underlying asset and a lease liability representing its obligation to make lease payments.
This standard substantially carries forward the lessor accounting requirements of IAS 17, while requiring enhanced disclosures to be provided by lessors.
The Corporation intends to adopt IFRS 16 from its effective date of January 1, 2019. The Corporation is currently evaluating the impact of this standard, and does not anticipate applying it prior to its effective date.
32
OFF BALANCE SHEET ARRANGEMENTS
As at December 31, 2017, the Corporation had no off-balance sheet arrangements that have or are reasonably likely to have a current or future effect on the Corporation’s financial condition, changes in financial condition, revenues or expenses, results of operations, liquidity, capital expenditures or capital resources that is material to investors.
OUTSTANDING SHARE DATA
| | As at March 12, 2018 | |
Common Shares issued and outstanding | | | 148,270,626 | |
Common Shares issuable upon conversion of 1,138,978 Preferred Shares | | | 58,763,272 | |
Common Shares issuable upon exercise of options | | | 6,496,451 | |
Common Shares issuable upon exercise of warrants | | | 4,000,000 | |
Common Shares issuable upon settlement of other equity-based awards | | | 739,543 | |
Total Common Shares on a fully-diluted basis | | | 218,269,892 | |
33
LEGAL PROCEEDINGS AND REGULATORY ACTIONS
Other than as set forth in the 2017 Annual Information Form, there were no material changes or updates to the Corporation’s material legal proceedings or regulatory actions during the three months ended December 31, 2017. For additional information regarding the Corporation’s material legal proceedings and regulatory actions, see the 2017 Annual Reports, particularly under the heading “Legal Proceedings and Regulatory Actions” in the 2017 Annual Information Form and note 30 to the 2017 Annual Financial Statements.
Kentucky Proceeding
For information regarding the previously reported proceeding in Kentucky, see above under “Liquidity and Capital Resources—Credit Facility”, the 2017 Annual Information Form, including under the heading “Legal Proceedings and Regulatory Actions” therein, and note 30 to the 2017 Annual Financial Statements.
The AMF Investigation and Foreign Payments Matter
For information regarding the previously reported AMF investigation and related matters and foreign payments matter, see the 2017 Annual Information Form.
Class Actions
For information regarding the previously reported class action lawsuits, see the 2017 Annual Information Form.
DISCLOSURE CONTROLS AND PROCEDURES AND
INTERNAL CONTROL OVER FINANCIAL REPORTING
The applicable rules of the U.S. Securities and Exchange Commission and the Canadian Securities Administrators require The Stars Group’s certifying officers, the Chief Executive Officer (“CEO”) and the Chief Financial Officer (“CFO”), to establish and maintain disclosure controls and procedures (“DC&P”) and internal control over financial reporting (“ICFR”), as those terms are defined in such rules. In compliance with these rules, the Corporation has filed applicable certifications signed by the CEO and the CFO that, among other things, report on the design of each of DC&P and ICFR.
Disclosure Controls and Procedures
The CEO and CFO have designed DC&P, or have caused them to be designed under their supervision, to provide reasonable assurance that:
| • | material information relating to the Corporation is made known to them by others, particularly during the period in which the annual and interim filings are being prepared; and |
| • | information required to be disclosed in the annual filings, interim filings or other reports filed or submitted under securities legislation is recorded, processed, summarized and reported within the time periods specified in applicable securities legislation. |
The CEO and CFO have evaluated, or caused to be evaluated under their supervision, the effectiveness of the Corporation’s DC&P at the financial year end December 31, 2017. Based on that evaluation, the CEO and CFO concluded that the Corporation’s DC&P are effective.
Management’s Annual Report on Internal Control Over Financial Reporting
The CEO and CFO have designed ICFR, or have caused it to be designed under their supervision, to provide reasonable assurance regarding the reliability of financial reporting and the preparation of financial statements for external purposes in accordance with the Corporation’s accounting and reporting standards.
The CEO and CFO have evaluated, or caused to be evaluated under their supervision, the effectiveness of the Corporation’s ICFR at the financial year end December 31, 2017, based on the criteria set forth in Internal Control – Integrated Framework issued by the Committee of Sponsoring Organizations of the Treadway Commission (2013
34
framework). Based on that evaluation, the CEO and CFO concluded that the Corporation’s ICFR are effective as of December 31, 2017.
Changes to Internal Control Over Financial Reporting
Except as noted below, there has been no change in the Corporation’s ICFR that occurred during the three months ended December 31, 2017 that has materially affected, or is reasonably likely to materially affect, the Corporation’s ICFR.
In the Corporation’s management’s discussion and analysis for the three months and year ended December 31, 2016 and for each of the first three quarters of 2017, the Corporation’s management disclosed two material weaknesses in the Corporation’s ICFR that it had identified in its evaluation of the effectiveness of the Corporation’s ICFR at the financial year end December 31, 2016.
The first material weakness in the Corporation’s ICFR related to derivative valuations and hedge accounting. In particular, management identified deficiencies related to the operating effectiveness of controls over derivative valuations and hedge accounting, including specifically as it related to management’s review of internal calculations of fair value of derivatives and its review of the designation of such derivatives in hedge relationships. To remediate this material weakness, the Corporation engaged an external service provider that specializes in derivative valuations and provides a Type 1 report in accordance with Statement on Standards for Attestation Engagements (SSAE) No. 16, Reporting on Controls at a Service Organization (a “SOC1 Report”) to provide applicable valuations for comparison to management’s internal valuations and to assist with hedge documentation and technical assessments related to any significant changes to existing hedge relationships or new hedge relationships. During the fourth quarter of fiscal year ended December 31, 2017, the Corporation successfully completed the testing necessary for management to conclude that this material weakness had been remediated.
The second material weakness in the Corporation’s ICFR related to foreign exchange rate information. Specifically, management identified deficiencies related to the design of controls over the foreign exchange rates used by the Corporation to determine the impact of foreign exchange fluctuations and for financial reporting purposes. Such information was being obtained from a single source that did not provide management with a SOC1 Report and management did not validate such data. To remediate this material weakness, the Corporation now obtains foreign exchange rate information from an additional reputable source in order to compare such information against that provided by its previous sole information source. During the fourth quarter of fiscal year ended December 31, 2017, the Corporation successfully completed the testing necessary for management to conclude that this material weakness had been remediated.
Limitations on Effectiveness of DC&P and ICFR
In designing and evaluating DC&P and ICFR, management recognizes that any controls and procedures, no matter how well designed and operated, can provide only reasonable assurance of achieving the desired control objectives. In addition, the design of DC&P and ICFR must reflect the fact that there are resource constraints and that management is required to apply judgment in evaluating the benefits of possible controls and procedures relative to their costs. See also “Risk Factors and Uncertainties—Risks Related to the Corporation’s Business—If the Corporation’s internal controls are ineffective, its operating results and market confidence in its reported financial information could be adversely affected” in the 2017 Annual Information Form.
35
RISK FACTORS AND UNCERTAINTIES
Certain factors may have a material adverse effect on the Corporation’s business, financial condition and results of operations. Current and prospective investors should carefully consider the risks and uncertainties and other information contained in this MD&A, the 2017 Annual Reports, particularly under the heading “Risk Factors and Uncertainties” in the 2017 Annual Information Form, and in other filings that the Corporation has made and may make in the future with applicable securities authorities, including those available on SEDAR at www.sedar.com, EDGAR at www.sec.gov or The Stars Group’s website at www.starsgroup.com. The risks and uncertainties described herein and therein are not the only ones the Corporation may face. Additional risks and uncertainties that the Corporation is unaware of, or that the Corporation currently believes are not material, may also become important factors that could adversely affect the Corporation’s business. If any of such risks actually occur, the Corporation’s business, financial condition, results of operations, and future prospects could be materially and adversely affected. In that event, the trading price of the Common Shares (or the value of any other securities of the Corporation) could decline, and the Corporation’s securityholders could lose part or all of their investment.
36
FURTHER INFORMATION
Additional information relating to The Stars Group and its business, including, without limitation, the 2017 Annual Reports and other filings that The Stars Group has made and may make in the future with applicable securities authorities, may be found on or through SEDAR at www.sedar.com, EDGAR at www.sec.gov or The Stars Group’s website at www.starsgroup.com. Additional information, including directors’ and officers’ remuneration and indebtedness, principal holders of The Stars Group securities and securities authorized for issuance under equity compensation plans, is also contained in the Corporation’s most recent management information circular for the most recent annual meeting of shareholders of the Corporation.
In addition to press releases, securities filings and public conference calls and webcasts, The Stars Group intends to use its investor relations page on its website as a means of disclosing material information to its investors and others and for complying with its disclosure obligations under applicable securities laws. Accordingly, investors and others should monitor the website in addition to following The Stars Group’s press releases, securities filings, and public conference calls and webcasts. This list may be updated from time to time.
Toronto, Ontario
March 14, 2018
(Signed) “Brian Kyle”
_____________________
Brian Kyle
Chief Financial Officer
37