Exhibit 99.2
Q1 FY18 Results and Acquisition of KapStone Paper & Packaging CorporationJanuary 29, 2018

Forward Looking Statements This presentation contains forward-looking statements within the meaning of the Private Securities Litigation Reform Act of 1995, including but not limited to the statements on the slides entitled “Q1 FY18 Key Highlights”, “Q1 FY18 Consumer Packaging Results”, “Synergy and Performance Improvements”, “Q2 FY18 Guidance”, “Full-Year 2018 Guidance”, “WestRock to Acquire KapStone Paper & Packaging”, “Enhanced Scale and Expanded Product Offering”, “Strategic Rationale for KapStone Acquisition”, “Approximately $200 Million of Run-Rate Synergies & Performance Improvements” and “Capital Allocation Priorities” that give guidance or estimates for future periods as well as statements regarding, among other things, that we expect an increase of $150 million to our FY 18 adjusted operating cash flow guidance as a result of the Tax Cuts and Jobs Act; the MPS integration is on track; we are on track to achieve our $1 billion synergy and performance improvement target by the end of the third quarter of fiscal 2018; we expect (i) a $50 to $60 million benefit from price/mix/pulp and volumes, (ii) a $40 to $45 million negative impact from commodity inflation, (iii) a $15 to $20 million negative impact from weather disruptions, (iv) a $0.02 to $0.03 per share negative impact on the tax rate on our adjusted earnings per share and (v) a $0.02 to $0.03 per share negative impact from depreciation and amortization, in each case in the second quarter of fiscal 2018 compared to the first quarter in fiscal 2018; we expect adjusted earnings per share to be sequentially lower in the second quarter of fiscal 2018; we expect 10% revenue growth (to >$16.3 billion), 25% to 30% adjusted operating cash flow growth (to > $2.45 billion) and 20% adjusted segment EBITDA growth (to >$2.8 billion) in fiscal 2018 compared to fiscal 2017; the acquisition of KapStone (a) creates opportunity for $200 million in cost synergies and performance improvements, (b) strengthens WestRock’s presence on the West Coast, (c) broadens WestRock’s portfolio of differentiated paper and packaging solutions with the addition of attractive paper grades and distribution capabilities, (d) increases mix of virgin fiber based paper in WestRock’s paper portfolio and (e) is expected to be immediately accretive to WestRock’s adjusted earnings and cash flow, inclusive of purchase accounting adjustments; the combined company will be positioned to generate strong cash flow for rapid debt paydown that should allow the leverage ratio to return to 2.25x to 2.50x target by the end of fiscal 2019; the transaction is expected to close in the quarter ending September 30, 2018; we anticipate combined leverage of greater than 3x, excluding cost synergies, at closing (assuming 100% cash consideration); we expect fiscal 2018 combined net sales of approximately $20 billion, with 63% from corrugated packaging and 37% from consumer packaging; we expect the acquisition to complement WestRock’s footprint and provide network optimization opportunities; we expect the full run rate of synergies and performance improvements by the end of fiscal 2021 and the allocation of synergies and performance improvements as presented on slide 18; we expect to re-deploy more than $5 billion of capital through fiscal 2022; and we expect our near-term capital allocation to focus on reducing leverage and that our leverage ratio will return to 2.25x to 2.50x by the end of fiscal 2019.Forward-looking statements are based on our current expectations, beliefs, plans or forecasts and are typically identified by words or phrases such as "may," "will," "could," "should," "would," "anticipate," "estimate," "expect," "project," "intend," "plan," "believe," "target," "prospects," "potential" and "forecast," and other words, terms and phrases of similar meaning. Forward-looking statements involve estimates, expectations, projections, goals, forecasts, assumptions, risks and uncertainties. WestRock cautions readers that a forward-looking statement is not a guarantee of future performance and that actual results could differ materially from those contained in the forward-looking statement. With respect to forward-looking statements, WestRock has made assumptions regarding, among other things, the results and impacts of the acquisition of KapStone; whether and when the waiting period under the Hart-Scott-Rodino Antitrust Improvements Act expires or terminates; whether and when antitrust approvals in Austria, Canada, Germany and Mexico are obtained; whether and when the other conditions to the completion of the KapStone acquisition, including the receipt of KapStone stockholder approval, will be satisfied; economic, competitive and market conditions generally; volumes and price levels of purchases by customers; competitive conditions in WestRock’s businesses and possible adverse actions of their customers, competitors and suppliers. Further, WestRock’s businesses are subject to a number of general risks that would affect any such forward-looking statements. Such risks and other factors that may impact management's assumptions are more particularly described in our filings with the Securities and Exchange Commission, including in Item 1A under the caption "Risk Factors" in our Annual Report on Form 10-K for the year ended September 30, 2017. The information contained herein speaks as of the date hereof and WestRock does not have or undertake any obligation to update or revise its forward-looking statements, whether as a result of new information, future events or otherwise.
Additional Information and Where to Find It This communication may be deemed to be solicitation material in respect of the proposed transaction among Whiskey Holdco, Inc., a Delaware corporation (“Holdco”), WestRock, a Delaware corporation (“WestRock”), and KapStone Paper and Packaging Corporation, a Delaware corporation (“KapStone”). In connection with the proposed transaction, Holdco intends to file with the SEC the registration statement on Form S-4 (the “Registration Statement”) which will include a prospectus with respect to shares of Holdco’s common stock to be issued in the proposed transaction and a proxy statement for KapStone’s stockholders (the “Proxy Statement”) and KapStone will mail the Proxy Statement to its stockholders and file other documents regarding the proposed acquisition with the SEC. Stockholders of WestRock and KapStone are urged to read all relevant documents filed with the SEC, including the Registration Statement and the Proxy Statement, because they will contain important information about the proposed transaction. Investors and security holders are able to obtain the documents (once available) free of charge at the SEC’s web site, http://www.sec.gov. Such documents are not currently available. Participants in Solicitation WestRock, Holdco and KapStone and their respective directors and executive officers, may be deemed to be participants in the solicitation of proxies from the holders of shares of KapStone common stock in respect of the proposed transaction. Information about the directors and executive officers of WestRock is set forth in the proxy statement for WestRock’s 2018 Annual Meeting of stockholders, which was filed with the SEC on December 19, 2017. Information about the directors and executive officers of KapStone is set forth in the proxy statement for KapStone’s 2017 Annual Meeting of stockholders, which was filed with the SEC on April 5, 2017. Investors may obtain additional information regarding the interest of such participants by reading the Registration Statement and the Proxy Statement (once available). No Offer or Solicitation This communication is neither an offer to sell, nor a solicitation of an offer to buy any securities, the solicitation of any vote or approval in any jurisdiction pursuant to or in connection with the proposed transaction or otherwise, nor shall there be any sale, issuance or transfer of securities in any jurisdiction in contravention of applicable law. No offer of securities shall be made except by means of a prospectus meeting the requirements of Section 10 of the Securities Act of 1933, as amended (the “Securities Act”), and otherwise in accordance with applicable law.
Disclaimer; Non-GAAP Financial Measures We may from time to time be in possession of certain information regarding WestRock that applicable law would not require us to disclose to the public in the ordinary course of business, but would require us to disclose if we were engaged in the purchase or sale of our securities. This presentation shall not be considered to be part of any solicitation of an offer to buy or sell WestRock securities. This presentation also may not include all of the information regarding WestRock that you may need to make an investment decision regarding WestRock securities. Any investment decision should be made on the basis of the total mix of information regarding WestRock that is publicly available as of the date of the investment decision.We report our financial results in accordance with accounting principles generally accepted in the United States ("GAAP"). However, management believes certain non-GAAP financial measures provide users with additional meaningful financial information that should be considered when assessing our ongoing performance. Management also uses these non-GAAP financial measures in making financial, operating and planning decisions and in evaluating our performance. Non-GAAP financial measures should be viewed in addition to, and not as an alternative for, our GAAP results. The non-GAAP financial measures we present may differ from similarly captioned measures presented by other companies. See the Appendix for details about these non-GAAP financial measures, as well as the required reconciliations.

Q1 FY18 Key Highlights Strong Corrugated Packaging supply and demand fundamentalsFully implemented previously published PPW price increases and raised export pricing to align our supply with demandStable consumer marketsMPS performing well; integration on trackAdvanced our strategy to provide differentiated solutions to our customers Invested $214 million to maintain and improve our mill and converting networkAnnounced transformative capital investment in Florence, SC mill Paid $110 million in cash dividends to stockholdersIncreased our ownership in the Grupo Gondi joint venture to 32%Announced acquisition of Plymouth Packaging for $198 millionLeverage ratio of 2.45x(2) at the end of the quarter Earned $0.87(1) of adjusted earnings per share, up 85% from $0.47 in prior yearAchieved $60 million of productivity December run rate of $910 million of synergies and performance improvementsAdjusted EBITDA margin of 16.8%(2), an increase of 260 bps y-o-ySignificant benefit from Tax Cuts and Jobs ActIncrease of $150 million to FY18 adjusted operating cash flow guidance(2) Financial Performance Markets & Operations Capital Allocation On a GAAP basis, adjusted earnings per diluted share were $4.38 in Q1 FY18 and $0.32 in Q1 FY17. See Non-GAAP Financial Measures and Reconciliations in the Appendix.Non-GAAP Financial Measure. See Non-GAAP Financial Measures and Reconciliations in the Appendix.
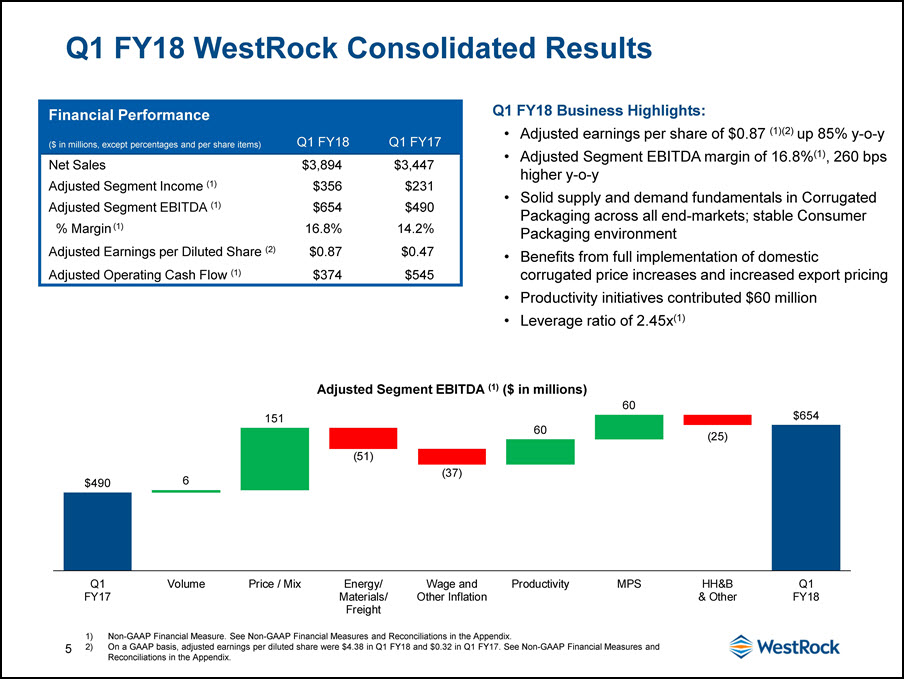
Q1 FY18 WestRock Consolidated Results Non-GAAP Financial Measure. See Non-GAAP Financial Measures and Reconciliations in the Appendix.On a GAAP basis, adjusted earnings per diluted share were $4.38 in Q1 FY18 and $0.32 in Q1 FY17. See Non-GAAP Financial Measures and Reconciliations in the Appendix. Q1 FY18 Business Highlights:Adjusted earnings per share of $0.87 (1)(2) up 85% y-o-yAdjusted Segment EBITDA margin of 16.8%(1), 260 bps higher y-o-ySolid supply and demand fundamentals in Corrugated Packaging across all end-markets; stable Consumer Packaging environmentBenefits from full implementation of domestic corrugated price increases and increased export pricingProductivity initiatives contributed $60 millionLeverage ratio of 2.45x(1) Financial Performance ($ in millions, except percentages and per share items) Q1 FY18 Q1 FY17 Net Sales $3,894 $3,447 Adjusted Segment Income (1) $356 $231 Adjusted Segment EBITDA (1) $654 $490 % Margin (1) 16.8% 14.2% Adjusted Earnings per Diluted Share (2) $0.87 $0.47 Adjusted Operating Cash Flow (1) $374 $545 Adjusted Segment EBITDA (1) ($ in millions)
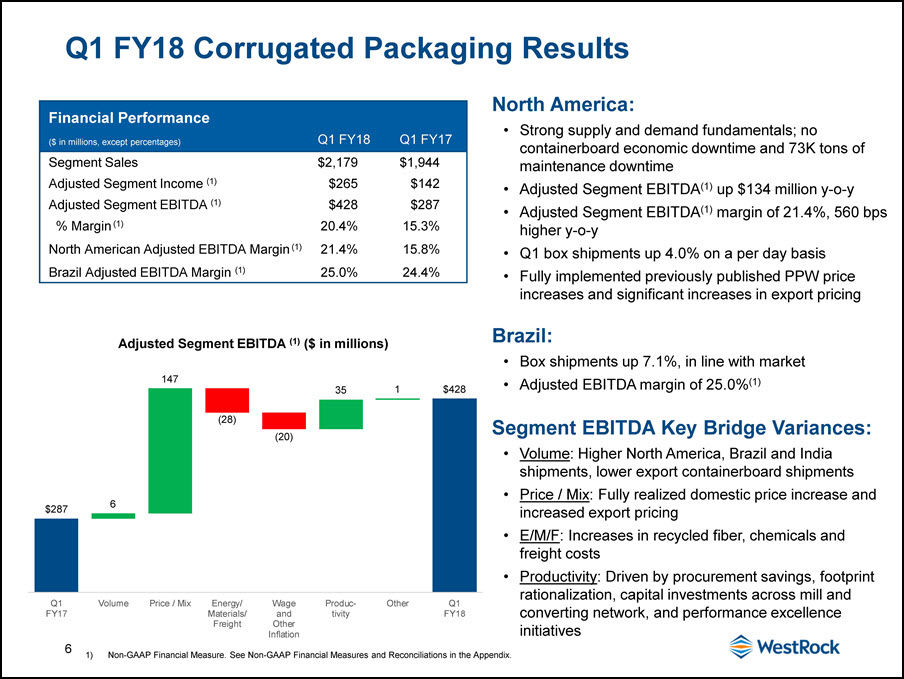
Q1 FY18 Corrugated Packaging Results Non-GAAP Financial Measure. See Non-GAAP Financial Measures and Reconciliations in the Appendix. North America:Strong supply and demand fundamentals; no containerboard economic downtime and 73K tons of maintenance downtimeAdjusted Segment EBITDA(1) up $134 million y-o-yAdjusted Segment EBITDA(1) margin of 21.4%, 560 bps higher y-o-y Q1 box shipments up 4.0% on a per day basis Fully implemented previously published PPW price increases and significant increases in export pricingBrazil:Box shipments up 7.1%, in line with marketAdjusted EBITDA margin of 25.0%(1) Segment EBITDA Key Bridge Variances:Volume: Higher North America, Brazil and India shipments, lower export containerboard shipmentsPrice / Mix: Fully realized domestic price increase and increased export pricingE/M/F: Increases in recycled fiber, chemicals and freight costsProductivity: Driven by procurement savings, footprint rationalization, capital investments across mill and converting network, and performance excellence initiatives Financial Performance ($ in millions, except percentages) Q1 FY18 Q1 FY17 Segment Sales $2,179 $1,944 Adjusted Segment Income (1) $265 $142 Adjusted Segment EBITDA (1) $428 $287 % Margin (1) 20.4% 15.3% North American Adjusted EBITDA Margin (1) 21.4% 15.8% Brazil Adjusted EBITDA Margin (1) 25.0% 24.4% Adjusted Segment EBITDA (1) ($ in millions)
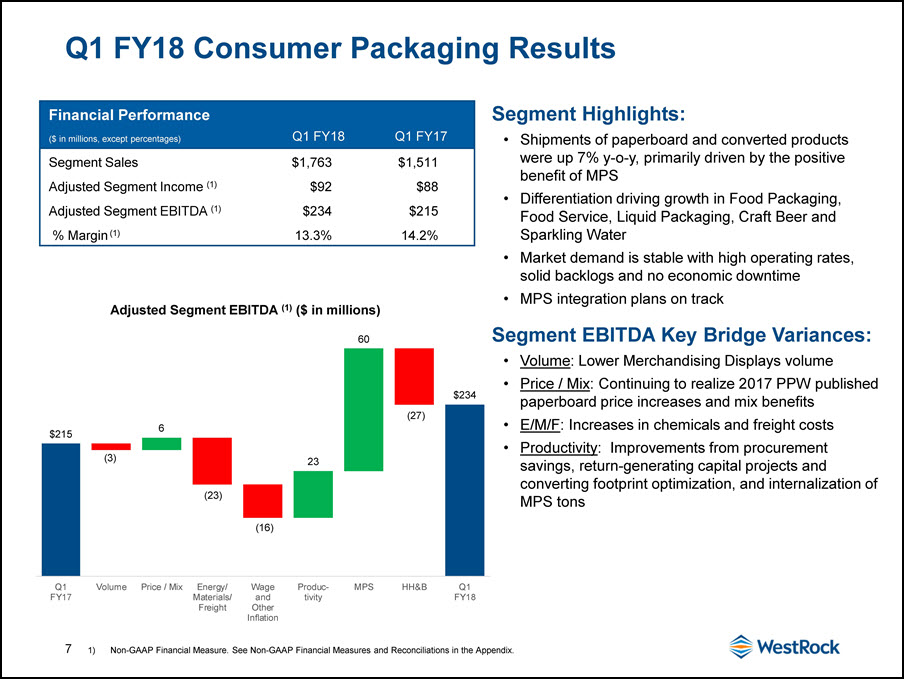
Q1 FY18 Consumer Packaging Results Non-GAAP Financial Measure. See Non-GAAP Financial Measures and Reconciliations in the Appendix. Segment Highlights:Shipments of paperboard and converted products were up 7% y-o-y, primarily driven by the positive benefit of MPSDifferentiation driving growth in Food Packaging, Food Service, Liquid Packaging, Craft Beer and Sparkling WaterMarket demand is stable with high operating rates, solid backlogs and no economic downtimeMPS integration plans on trackSegment EBITDA Key Bridge Variances:Volume: Lower Merchandising Displays volumePrice / Mix: Continuing to realize 2017 PPW published paperboard price increases and mix benefitsE/M/F: Increases in chemicals and freight costsProductivity: Improvements from procurement savings, return-generating capital projects and converting footprint optimization, and internalization of MPS tons Financial Performance ($ in millions, except percentages) Q1 FY18 Q1 FY17 Segment Sales $1,763 $1,511 Adjusted Segment Income (1) $92 $88 Adjusted Segment EBITDA (1) $234 $215 % Margin (1) 13.3% 14.2% Adjusted Segment EBITDA (1) ($ in millions)
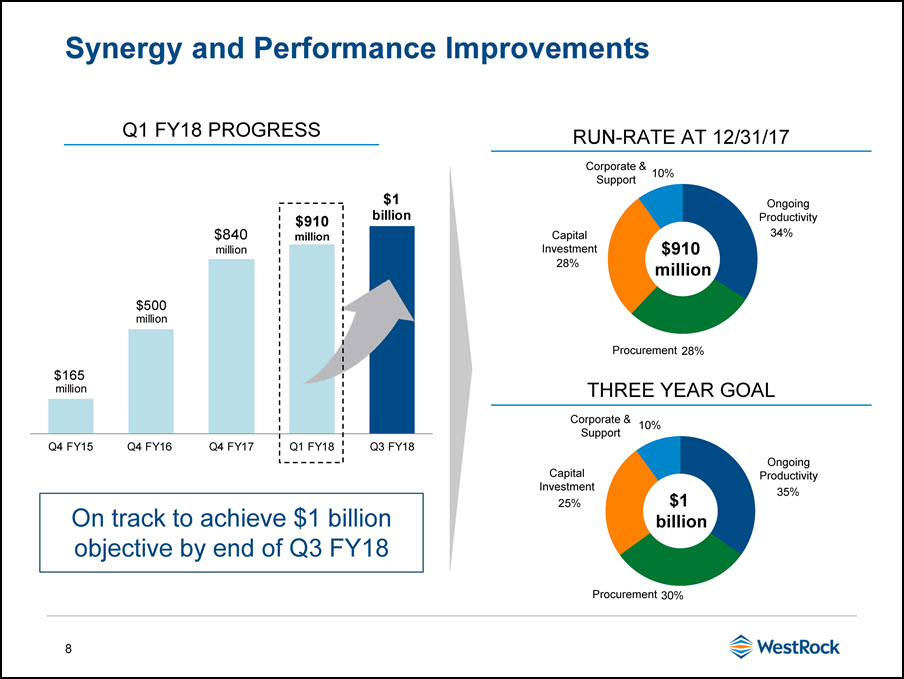
Synergy and Performance Improvements On track to achieve $1 billion objective by end of Q3 FY18 Q1 FY18 PROGRESS (1) (1) $1 billion RUN-RATE AT 12/31/17 THREE YEAR GOAL $910 million 10% 25% 30% 35% Corporate &Support CapitalInvestment OngoingProductivity Procurement
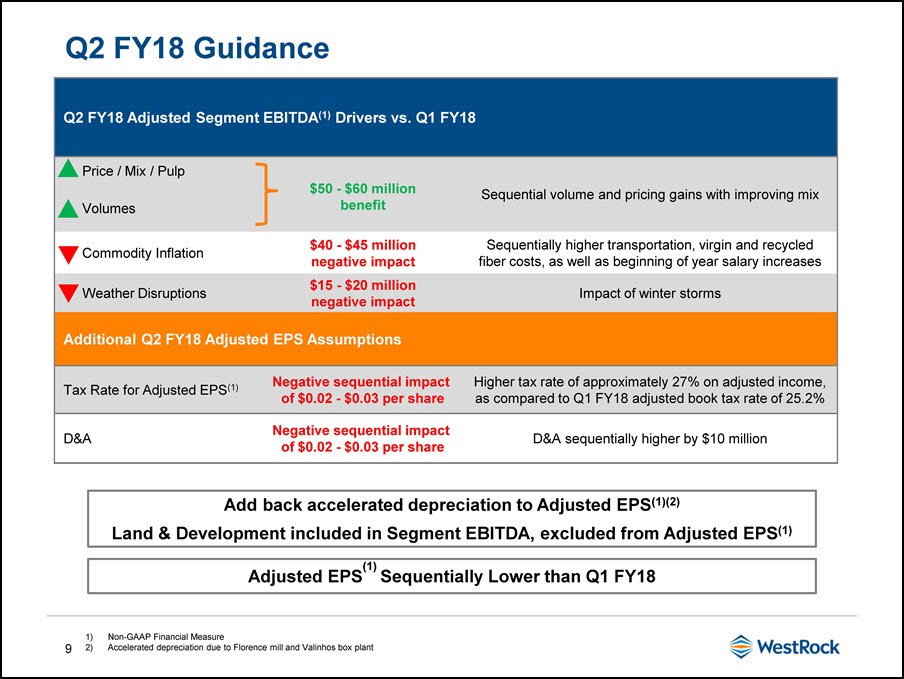
Q2 FY18 Guidance Non-GAAP Financial MeasureAccelerated depreciation due to Florence mill and Valinhos box plant Q2 FY18 Adjusted Segment EBITDA(1) Drivers vs. Q1 FY18 Price / Mix / Pulp Sequential volume and pricing gains with improving mix Volumes Commodity Inflation Sequentially higher transportation, virgin and recycled fiber costs, as well as beginning of year salary increases Weather Disruptions Impact of winter storms Additional Q2 FY18 Adjusted EPS Assumptions Tax Rate for Adjusted EPS(1) Negative sequential impact of $0.02 - $0.03 per share Higher tax rate of approximately 27% on adjusted income, as compared to Q1 FY18 adjusted book tax rate of 25.2% D&A Negative sequential impact of $0.02 - $0.03 per share D&A sequentially higher by $10 million $50 - $60 million benefit $40 - $45 million negative impact $15 - $20 million negative impact Adjusted EPS(1) Sequentially Lower than Q1 FY18 Add back accelerated depreciation to Adjusted EPS(1)(2)Land & Development included in Segment EBITDA, excluded from Adjusted EPS(1)
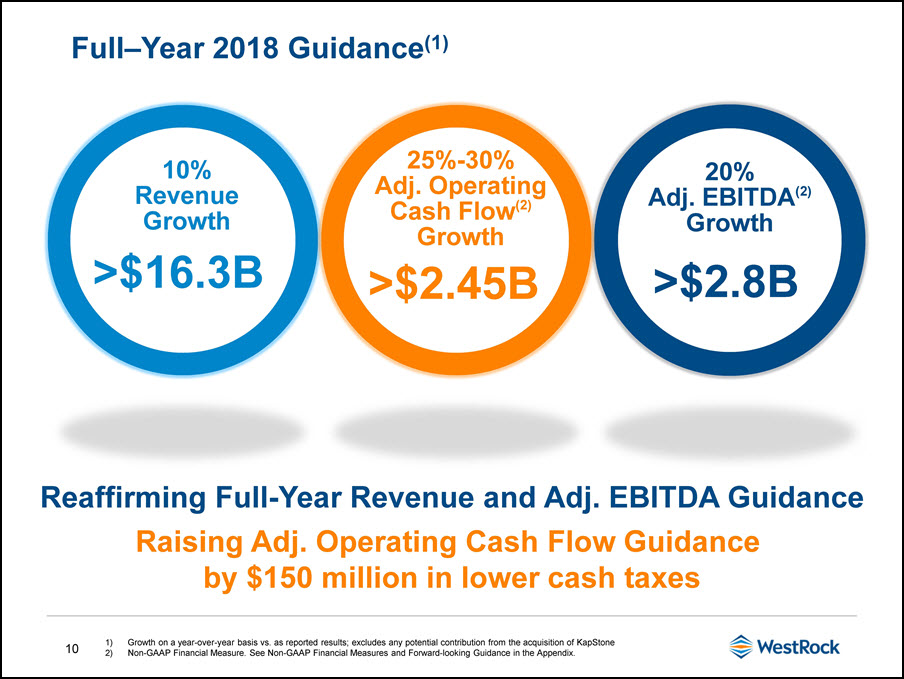
Full–Year 2018 Guidance(1) 10%Revenue Growth >$16.3B 20%Adj. EBITDA(2) Growth >$2.8B 25%-30% Adj. Operating Cash Flow(2) Growth >$2.45B Growth on a year-over-year basis vs. as reported results; excludes any potential contribution from the acquisition of KapStoneNon-GAAP Financial Measure. See Non-GAAP Financial Measures and Forward-looking Guidance in the Appendix. Raising Adj. Operating Cash Flow Guidance by $150 million in lower cash taxes Reaffirming Full-Year Revenue and Adj. EBITDA Guidance

WestRock to Acquire KapStone
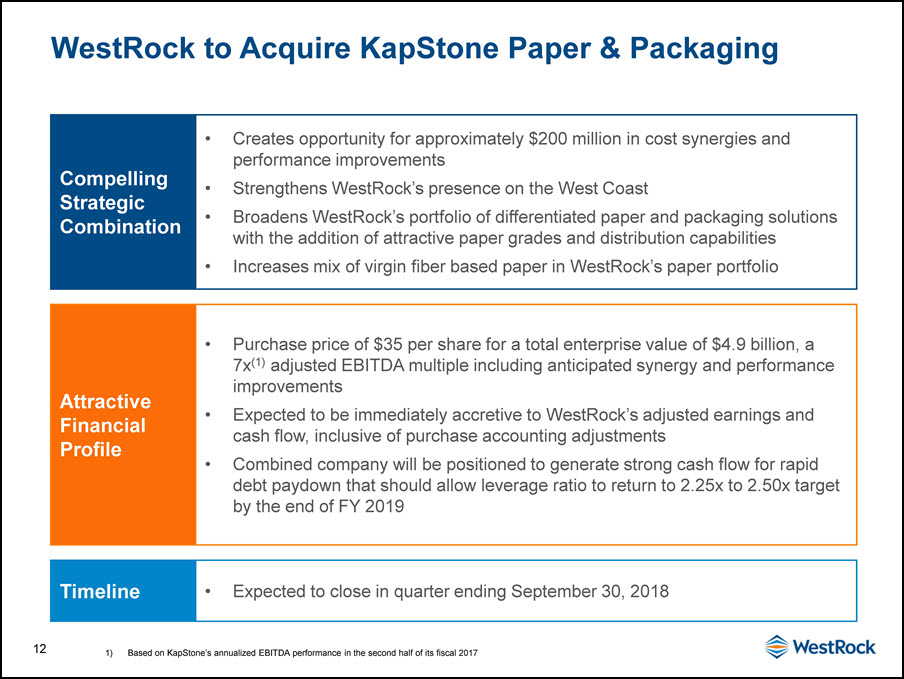
Compelling Strategic Combination Creates opportunity for approximately $200 million in cost synergies and performance improvementsStrengthens WestRock’s presence on the West CoastBroadens WestRock’s portfolio of differentiated paper and packaging solutions with the addition of attractive paper grades and distribution capabilitiesIncreases mix of virgin fiber based paper in WestRock’s paper portfolio Attractive Financial Profile Purchase price of $35 per share for a total enterprise value of $4.9 billion, a 7x(1) adjusted EBITDA multiple including anticipated synergy and performance improvementsExpected to be immediately accretive to WestRock’s adjusted earnings and cash flow, inclusive of purchase accounting adjustmentsCombined company will be positioned to generate strong cash flow for rapid debt paydown that should allow leverage ratio to return to 2.25x to 2.50x target by the end of FY 2019 Timeline Expected to close in quarter ending September 30, 2018 WestRock to Acquire KapStone Paper & Packaging Based on KapStone’s annualized EBITDA performance in the second half of its fiscal 2017
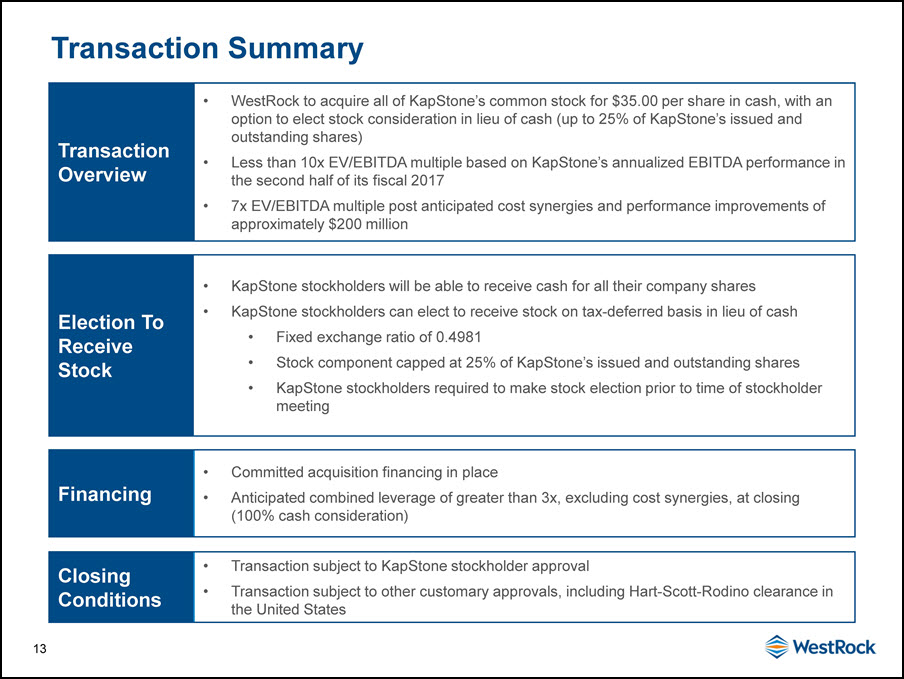
Transaction Overview WestRock to acquire all of KapStone’s common stock for $35.00 per share in cash, with an option to elect stock consideration in lieu of cash (up to 25% of KapStone’s issued and outstanding shares)Less than 10x EV/EBITDA multiple based on KapStone’s annualized EBITDA performance in the second half of its fiscal 20177x EV/EBITDA multiple post anticipated cost synergies and performance improvements of approximately $200 million Election To Receive Stock KapStone stockholders will be able to receive cash for all their company sharesKapStone stockholders can elect to receive stock on tax-deferred basis in lieu of cashFixed exchange ratio of 0.4981Stock component capped at 25% of KapStone’s issued and outstanding sharesKapStone stockholders required to make stock election prior to time of stockholder meeting Financing Committed acquisition financing in placeAnticipated combined leverage of greater than 3x, excluding cost synergies, at closing (100% cash consideration) Closing Conditions Transaction subject to KapStone stockholder approvalTransaction subject to other customary approvals, including Hart-Scott-Rodino clearance in the United States Transaction Summary

COMBINED $16.3B(1) SALES $3.2B(1) SALES 13.4M TON MILL SYSTEM ACROSS 27 MILLS 3.0M TON MILL SYSTEM ACROSS 4 MILLS 300 OPERATING AND BUSINESS LOCATIONS 86+ OPERATING AND DISTRIBUTION FACILITIES A LEADER IN GROWING CONSUMER AND CORRUGATED PACKAGING SEGMENTS #5 LARGEST NORTH AMERICAN CONTAINERBOARD PRODUCER Enhanced Scale and Expanded Product Offering ~$20B 37% 63% NET SALES(1) CORRUGATED PACKAGING CONSUMER PACKAGING WestRock forecasted FY18 sales; KapStone sales trailing twelve months as of 9/30/2017
Strategic Rationale for KapStone Acquisition + Creates opportunity for approximately $200 million in cost synergies and performance improvements Strengthens WestRock’s presence on the West Coast Broadens WestRock’s portfolio of differentiated paper and packaging solutions with the addition of attractive paper grades and distribution capabilities Increases mix of virgin fiber based paper in WestRock’s paper portfolio Ability to serve customers more efficiently Immediately cash flow and adjusted EPS accretive

Complements WestRock’s Current Footprint & Provides Network Optimization Opportunities WestRock Containerboard Mills KapStone Containerboard Mills Roanoke Rapids, VA Longview, WA Cowpens, SC Charleston, SC
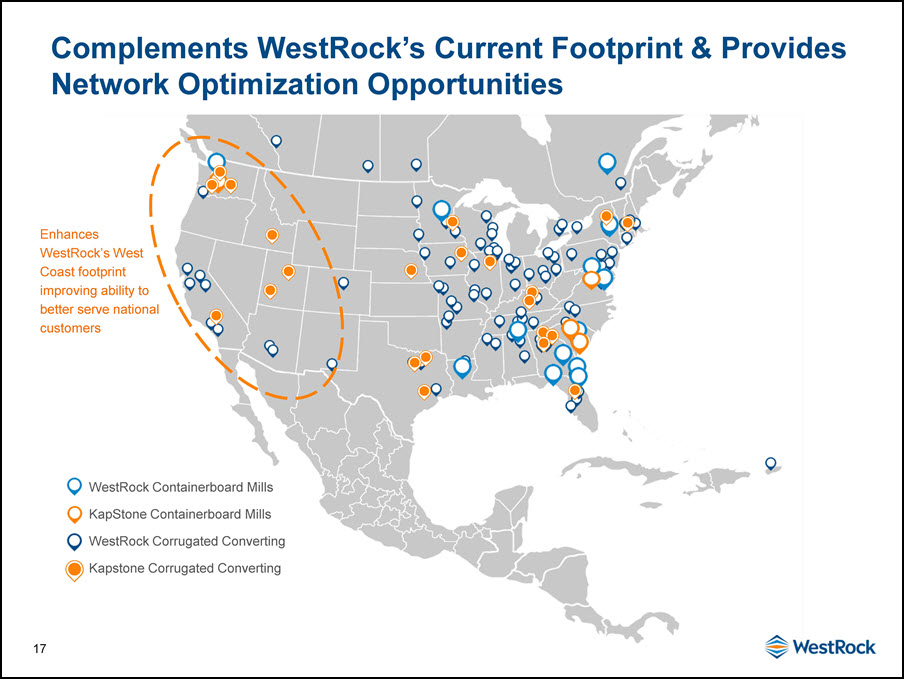
Complements WestRock’s Current Footprint & Provides Network Optimization Opportunities Enhances WestRock’s West Coast footprint improving ability to better serve national customers WestRock Containerboard Mills KapStone Containerboard Mills WestRock Corrugated Converting Kapstone Corrugated Converting
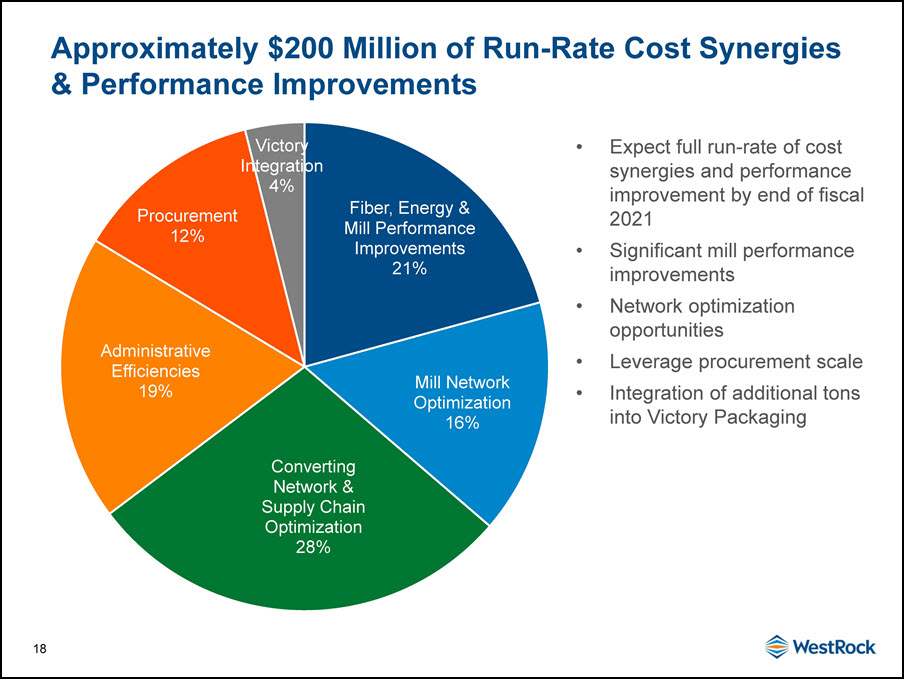
Approximately $200 Million of Run-Rate Cost Synergies & Performance Improvements Expect full run-rate of cost synergies and performance improvement by end of fiscal 2021Significant mill performance improvementsNetwork optimization opportunitiesLeverage procurement scaleIntegration of additional tons into Victory Packaging
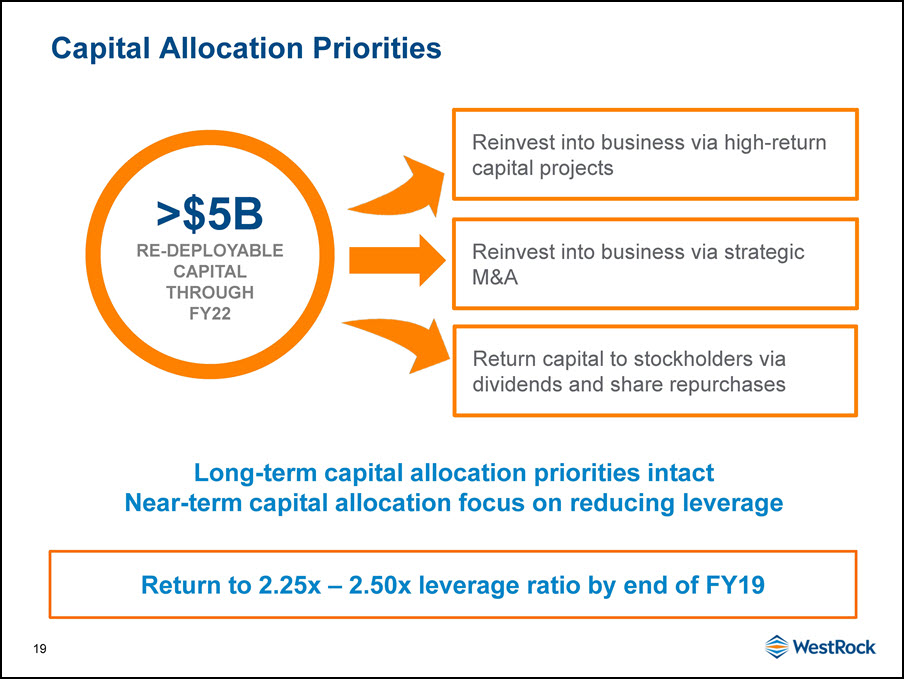
Capital Allocation Priorities >$5B Re-deployablecapital throughFY22 Reinvest into business via high-return capital projects Return capital to stockholders via dividends and share repurchases Reinvest into business via strategic M&A Long-term capital allocation priorities intactNear-term capital allocation focus on reducing leverage Return to 2.25x – 2.50x leverage ratio by end of FY19
WestRock: Creating Shareholder Value We are the leading paper and packaging company with the strategy and capabilities to generate attractive returnsDelivering our broad portfolio of differentiated solutions to customersExecuting on productivity opportunities and generating strong cash flowReinvesting our cash flow back into the business and returning capital to stockholders Outstanding Execution & Delivery Disciplined Capital Allocation Broad Portfolio of Differentiated Solutions

Appendix
Non-GAAP Financial Measures Adjusted Earnings Per Diluted ShareWe use the non-GAAP financial measure “adjusted earnings per diluted share,” also referred to as “adjusted earnings per share” or “Adjusted EPS” because we believe this measure provides our board of directors, investors, potential investors, securities analysts and others with useful information to evaluate our performance since it excludes restructuring and other costs, net, and other specific items that we believe are not indicative of our ongoing operating results. Our management and board of directors use this information to evaluate our performance relative to other periods.Adjusted Operating Cash FlowWe use the non-GAAP financial measure “adjusted operating cash flow” because we believe this measure provides our board of directors, investors, potential investors, securities analysts and others with useful information to evaluate our performance since it excludes restructuring and other costs, net, and other specific items that we believe are not indicative of our ongoing operating results. While this measure is similar to adjusted free cash flow, we believe it provides greater comparability across periods when capital expenditures are changing since it excludes an adjustment for capital expenditures. We believe the most directly comparable GAAP measure is net cash provided by operating activities. Adjusted Segment EBITDA and Adjusted Segment EBITDA MarginsWe use the non-GAAP financial measures “adjusted segment EBITDA” and “adjusted segment EBITDA margins”, along with other factors, to evaluate our segment performance against the performance of our peers. We believe that investors also use these measures to evaluate our performance relative to our peers. We calculate adjusted segment EBITDA for each segment by adding that segment’s adjusted segment income to its depreciation, depletion and amortization. We calculate adjusted segment EBITDA margin for each segment by dividing that segment’s adjusted segment EBITDA by its adjusted segment sales.
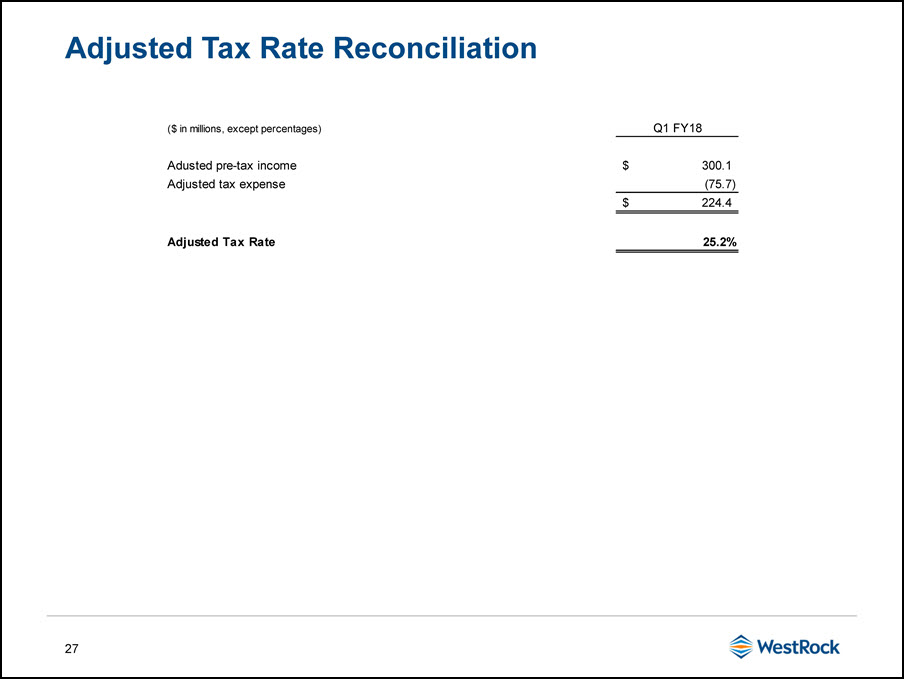
Non-GAAP Financial Measures (cont.) Leverage RatioWe use the non-GAAP financial measure “leverage ratio” as a measurement of our operating performance and to compare to our publicly disclosed target leverage ratio, and because we believe investors use this measure to evaluate our available borrowing capacity. We define leverage ratio as our Total Funded Debt divided by our Credit Agreement EBITDA, each of which term is defined in our credit agreement, dated July 1, 2015. Borrowing capacity under our credit agreement depends on, in addition to other measures, the Credit Agreement Debt/EBITDA ratio or the leverage ratio. As of the December 31, 2017 calculation, our leverage ratio was 2.45 times. While the leverage ratio under our credit agreement determines the credit spread on our debt, we are not subject to a leverage ratio cap. Our credit agreement is subject to a Debt to Capitalization and Consolidated Interest Coverage Ratio, as defined therein.Forward-looking GuidanceWe are not providing forward-looking guidance for U.S. GAAP reported financial measures or a reconciliation of forward-looking non-GAAP financial measures to the most directly comparable U.S. GAAP measure because we are unable to predict with reasonable certainty the ultimate outcome of certain significant items without unreasonable effort. These items include, but are not limited to, merger and acquisition-related expenses, restructuring expenses, asset impairments, litigation settlements, changes to contingent consideration and certain other gains or losses. These items are uncertain, depend on various factors, and could have a material impact on U.S. GAAP reported results for the guidance period.Adjusted Tax RateWestRock uses the non-GAAP financial measure “Adjusted Tax Rate”. Management believes this non-GAAP financial measure is useful because it adjusts our effective tax rate to exclude the impact of restructuring and other costs, net, and other specific items that management believes are not indicative of the ongoing operating results of the business. “Adjusted Tax Rate” is calculated as “Adjusted Tax Expense” divided by “Adjusted Pre-Tax Income”. WestRock believes that the most directly comparable GAAP measure is “Income tax expense”. Set forth in the table above is a reconciliation of “Adjusted Tax Expense” to “Income tax expense” for the three months ended December 31, 2017. The results of which, are included in the table below to compute the “Adjusted Tax Rate” (in millions).
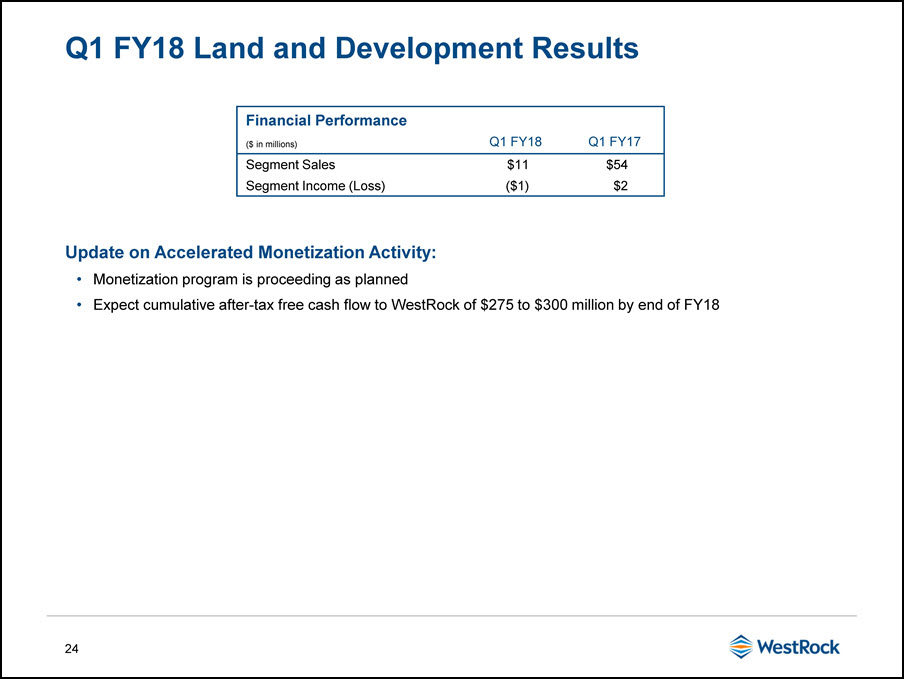
Update on Accelerated Monetization Activity:Monetization program is proceeding as plannedExpect cumulative after-tax free cash flow to WestRock of $275 to $300 million by end of FY18 Q1 FY18 Land and Development Results Financial Performance ($ in millions) Q1 FY18 Q1 FY17 Segment Sales $11 $54 Segment Income (Loss) ($1) $2
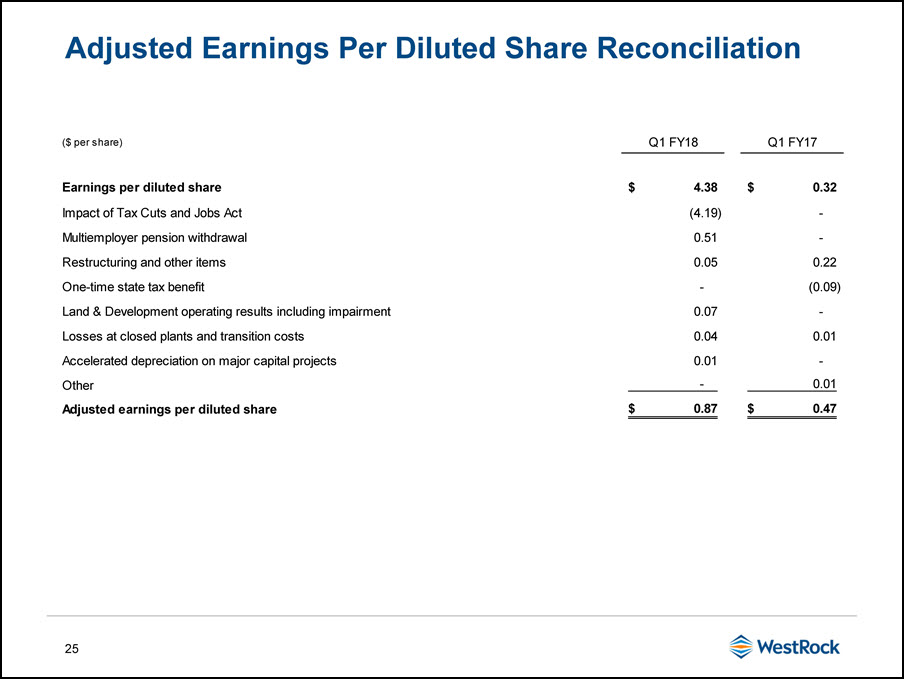
Adjusted Earnings Per Diluted Share Reconciliation

Adjusted Net Income Reconciliation The GAAP results for Pre-Tax, Tax and Net of Tax are equivalent to the line items "Income before income taxes", "Income tax expense" and "Consolidated net income", respectively, as reported on the statements of operations.
Adjusted Tax Rate Reconciliation
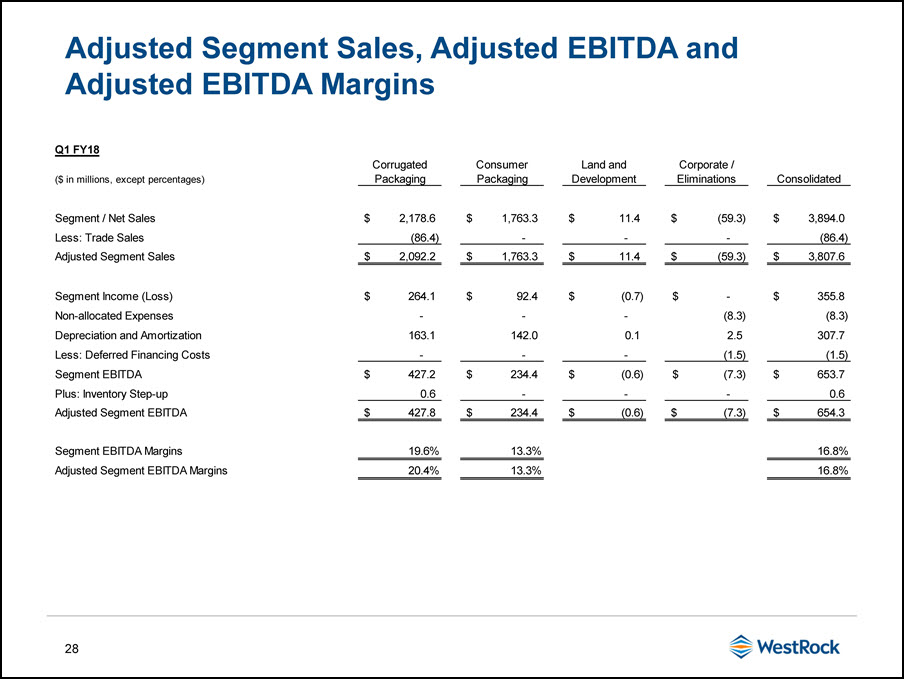
Adjusted Segment Sales, Adjusted EBITDA and Adjusted EBITDA Margins
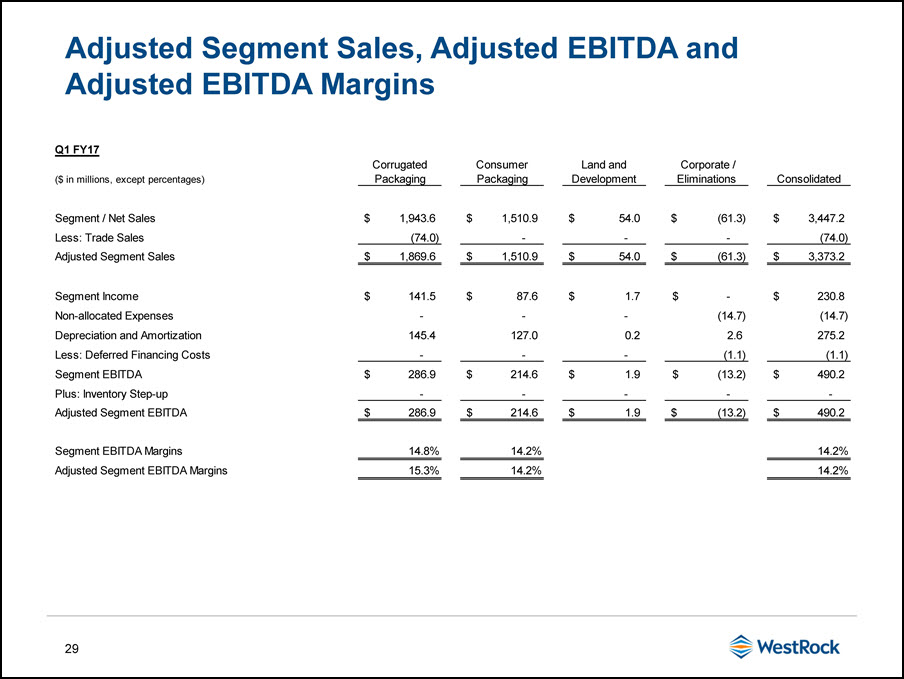
Adjusted Segment Sales, Adjusted EBITDA and Adjusted EBITDA Margins
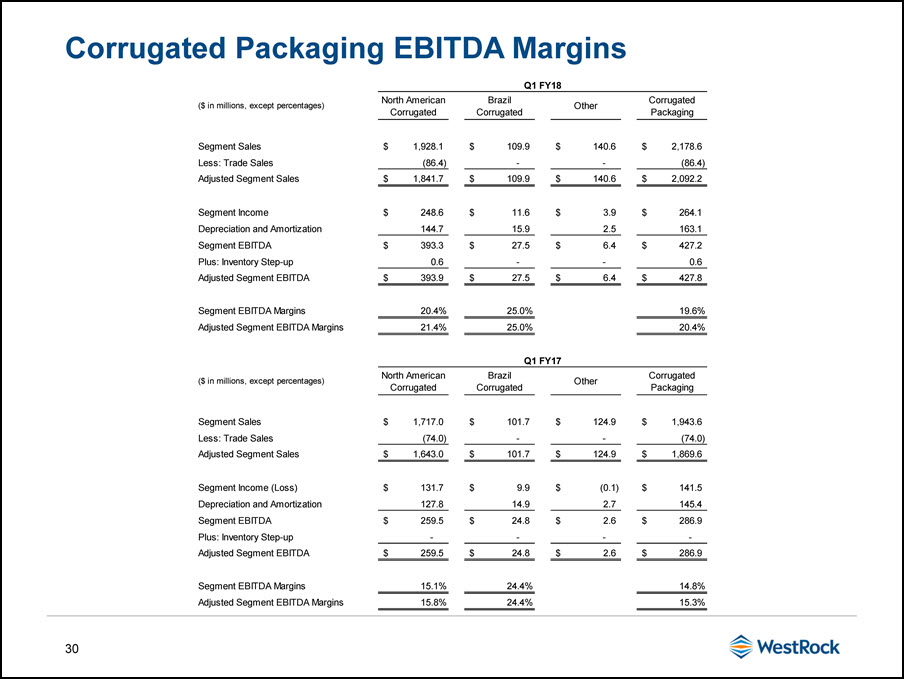
Corrugated Packaging EBITDA Margins
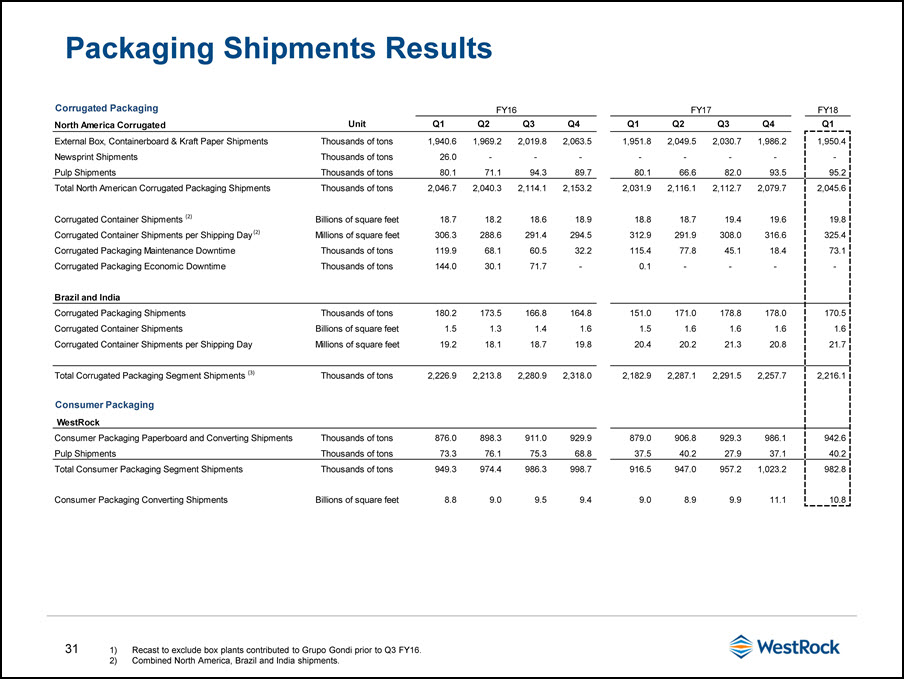
Packaging Shipments Results Recast to exclude box plants contributed to Grupo Gondi prior to Q3 FY16.Combined North America, Brazil and India shipments.
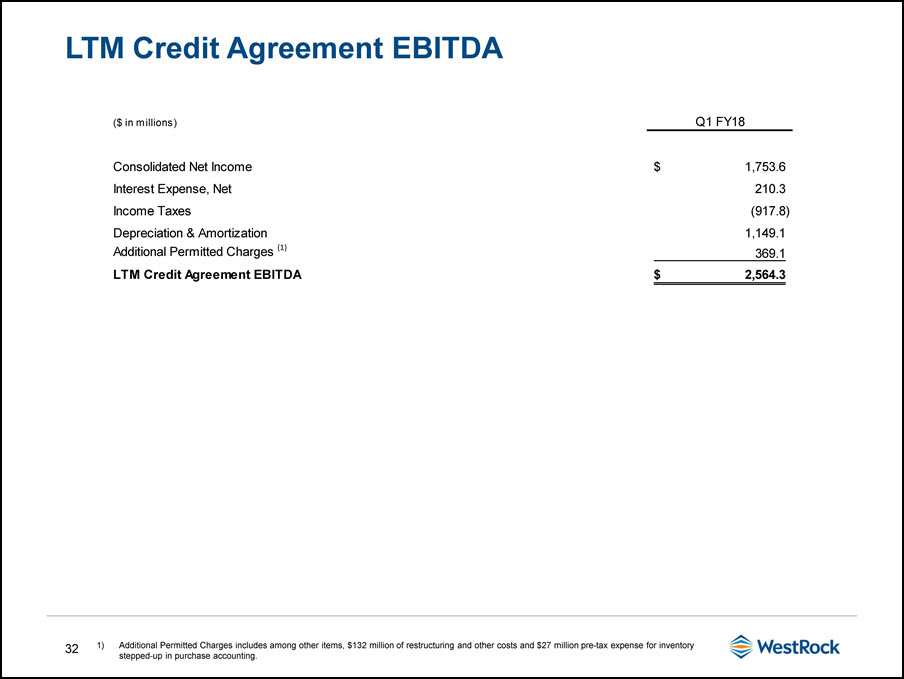
LTM Credit Agreement EBITDA Additional Permitted Charges includes among other items, $132 million of restructuring and other costs and $27 million pre-tax expense for inventory stepped-up in purchase accounting.
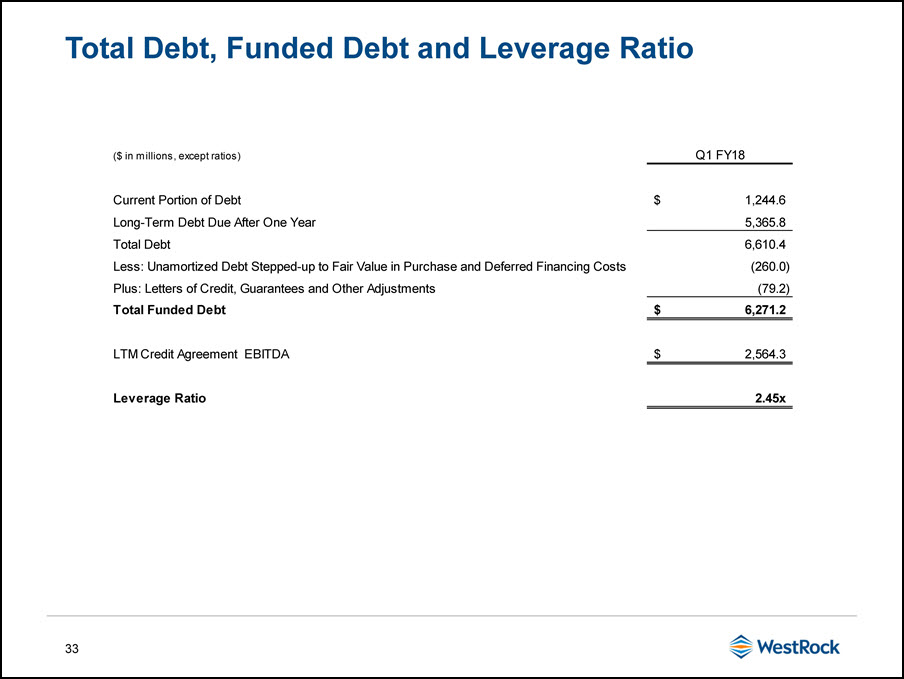
Total Debt, Funded Debt and Leverage Ratio
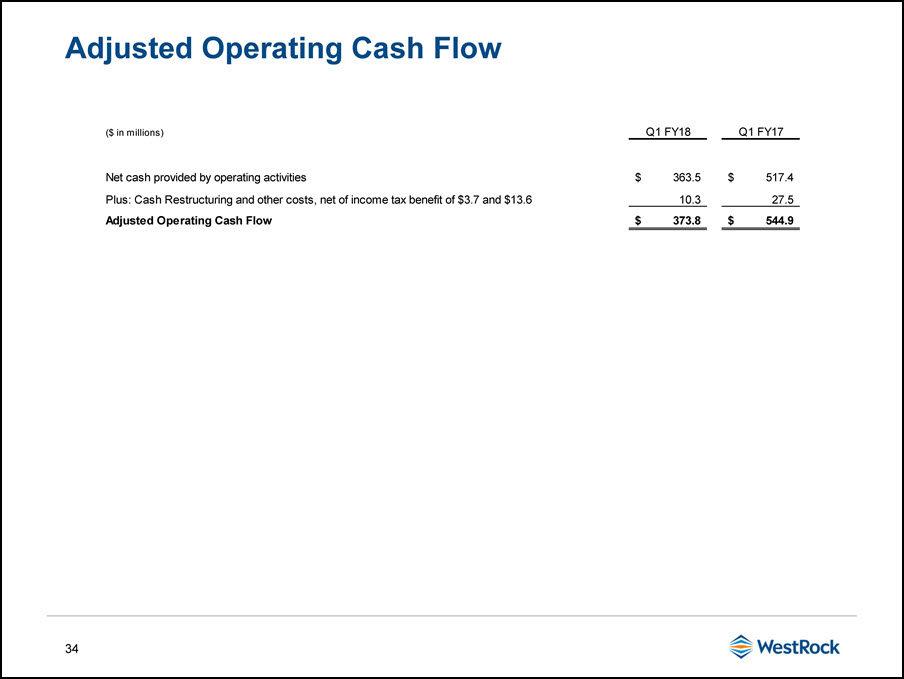
Adjusted Operating Cash Flow
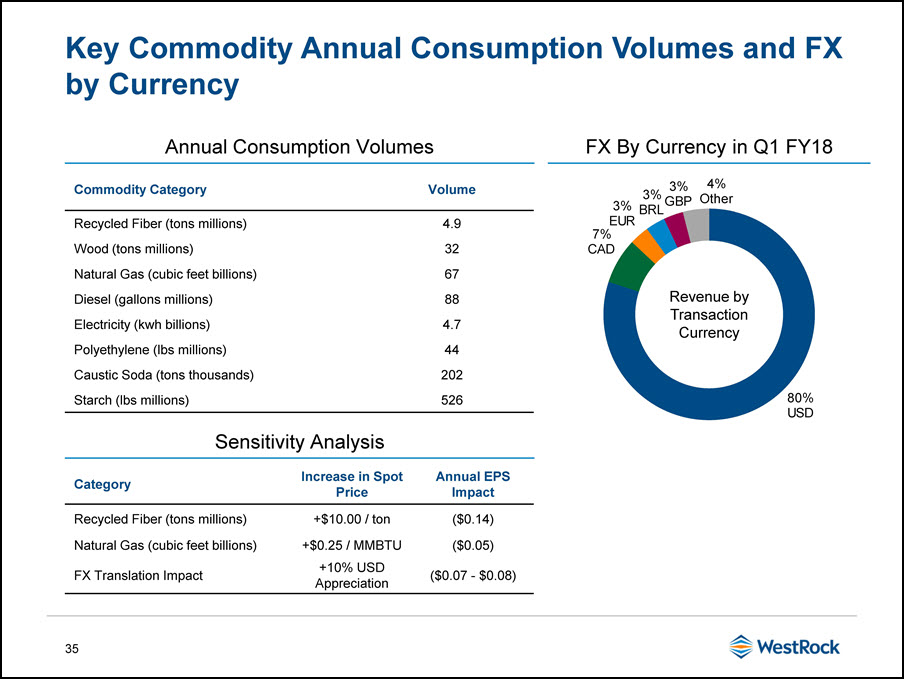
Key Commodity Annual Consumption Volumes and FX by Currency Commodity Category Volume Recycled Fiber (tons millions) 4.9 Wood (tons millions) 32 Natural Gas (cubic feet billions) 67 Diesel (gallons millions) 88 Electricity (kwh billions) 4.7 Polyethylene (lbs millions) 44 Caustic Soda (tons thousands) 202 Starch (lbs millions) 526 Annual Consumption Volumes FX By Currency in Q1 FY18 Sensitivity Analysis Category Increase in Spot Price Annual EPS Impact Recycled Fiber (tons millions) +$10.00 / ton ($0.14) Natural Gas (cubic feet billions) +$0.25 / MMBTU ($0.05) FX Translation Impact +10% USD Appreciation ($0.07 - $0.08) Revenue by TransactionCurrency