Exhibit 99.4

Analyst Meeting New York City April 26, 2016
Disclaimer This presentation contains “forward - looking statements,” including, but not limited to, statements that give guidance or estimates for future periods. “Forward - looking statements” include information related to future, not past, events. Such statements generally include the words “may,” “could,” “should,” “believes,” “plans,” “intends,” “targets,” “will,” “expects, ” “suggests,” “anticipates,” “outlook,” “continues,” “forecast,” “project,” or similar expressions. Forward - looking statements include, without limitation, expected financial positions; results of operations; cash flows; financing plans; business strat egy ; operating plans; capital and other expenditures; competitive positions; growth opportunities for existing products; benefits from new technology and cost reduction initiatives, plans and objectives; and markets for securities. Like other businesses, Ingevity is subject to risks and uncertainties that could cause its actual results to differ materially from its projections or that could cause other forward - looking statements to prove incorrect. Factors that could cause actual results to materially differ from those contained in the forward - looking statements, or that could cause other forward - looking statements to prove incorrect, include, without limitation, general economic and financial conditions; international sales and operations; curren cy exchange rates and currency devaluation; compliance with U.S. and foreign regulations by operations outside the United States ; attracting and retaining key personnel; conditions in the automotive market; worldwide air quality standards; declining volum es in the printing inks market; government infrastructure spending; the limited supply of crude tall oil (“CTO”); lack of access to sufficient CTO; access to and pricing of raw materials; competition from producers of substitute products; a prolonged period of low energy prices; the provision of services by third parties at several facilities; natural disasters, such as hurricanes , w inter or tropical storms, earthquakes, floods, fires or other unanticipated problems such as labor difficulties, equipment failure or unscheduled maintenance and repair; protection of intellectual property and proprietary information; government policies and regulations, including, but not limited to, those affecting the environment, climate change, tax policies and the chemicals industry; and lawsuits arising out of environmental damage or personal injuries associated with chemical manufacturing. These and other important factors that could cause actual results or events to differ materially from those expressed in forward - looking statements that may have been made in this document are described or will be described in our filings with the U.S. Securities and Exchange Commission, including our Form 10 Registration Statement. Readers are cautioned not to place undue reliance on Ingevity’s projections and forward - looking statements, which speak only as the date thereof. Ingevity undertakes no obligation to publicly release any revision to the projections and forward - looking statements contained in this presentation, or to update them to reflect events or circumstances occurring after the date of this presentation. Non - GAAP Financial Measures This presentation includes certain non-GAAP financial measures intended to supplement, not substitute for, comparable measures. Reconciliations of non-GAAP financial measures to GAAP financial measures are provided at the end of the presentation. Investors are urged to consider carefully the comparable GAAP measures and the reconciliations to those measures provided. 2
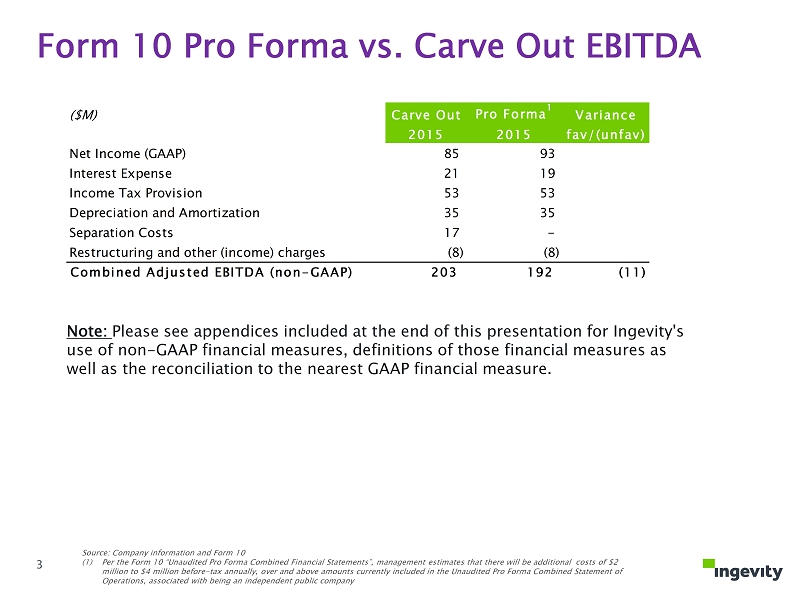
Form 10 Pro Forma vs. Carve Out EBITDA Source: Company information and Form 10 (1) Per the Form 10 “Unaudited Pro Forma Combined Financial Statements”, management estimates that there will be additional cos ts of $2 million to $4 million before - tax annually, over and above amounts currently included in the Unaudited Pro Forma Combined Stateme nt of Operations, associated with being an independent public company ($M) Carve Out Pro Forma 1 Variance 2015 2015 fav/(unfav) Net Income (GAAP) 85 93 Interest Expense 21 19 Income Tax Provision 53 53 Depreciation and Amortization 35 35 Separation Costs 17 - Restructuring and other (income) charges (8) (8) Combined Adjusted EBITDA (non-GAAP) 203 192 (11) Note: Please see appendices included at the end of this presentation for Ingevity's use of non - GAAP financial measures, definitions of those financial measures as well as the reconciliation to the nearest GAAP financial measure. 3
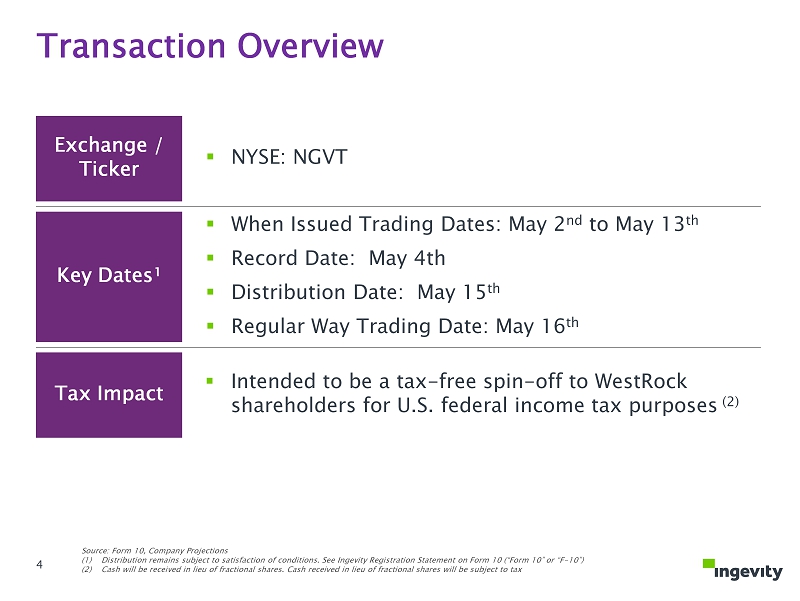
4 Exchange / Ticker ▪ NYSE: NGVT Key Dates¹ ▪ When Issued Trading Dates: May 2 nd to May 13 th ▪ Record Date: May 4th ▪ Distribution Date: May 15 th ▪ Regular Way Trading Date: May 16 th Tax Impact ▪ Intended to be a tax - free spin - off to WestRock shareholders for U.S. federal income tax purposes (2) Source: Form 10, Company Projections (1) Distribution remains subject to satisfaction of conditions. See Ingevity Registration Statement on Form 10 (“Form 10” or “F - 10”) (2) Cash will be received in lieu of fractional shares. Cash received in lieu of fractional shares will be subject to tax Transaction Overview 4
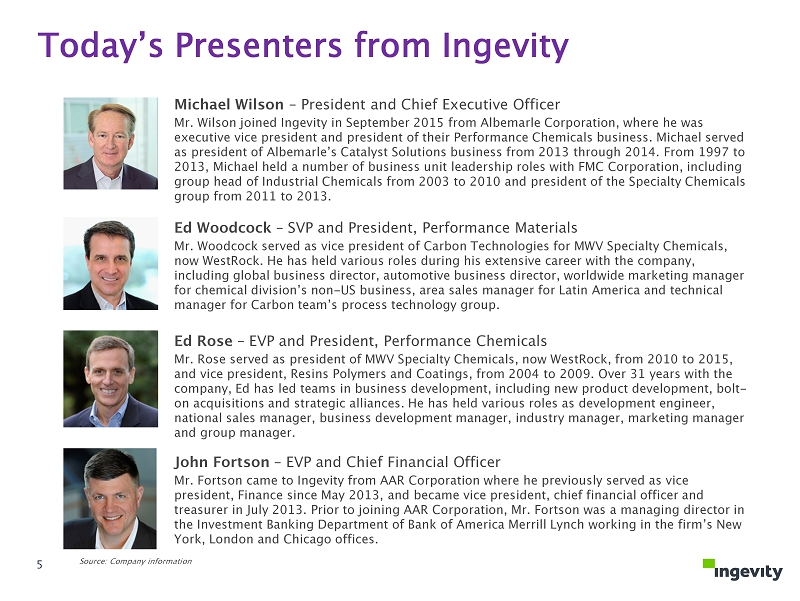
Source : Company information Today’s Presenters from Ingevity Michael Wilson – President and Chief Executive Officer Mr. Wilson joined Ingevity in September 2015 from Albemarle Corporation, where he was executive vice president and president of their Performance Chemicals business. Michael served as president of Albemarle’s Catalyst Solutions business from 2013 through 2014. From 1997 to 2013, Michael held a number of business unit leadership roles with FMC Corporation, including group head of Industrial Chemicals from 2003 to 2010 and president of the Specialty Chemicals group from 2011 to 2013. John Fortson – EVP and Chief Financial Officer Mr. Fortson came to Ingevity from AAR Corporation where he previously served as vice president, Finance since May 2013, and became vice president, chief financial officer and treasurer in July 2013. Prior to joining AAR Corporation, Mr. Fortson was a managing director in the Investment Banking Department of Bank of America Merrill Lynch working in the firm’s New York, London and Chicago offices. Ed Rose – EVP and President, Performance Chemicals Mr. Rose served as president of MWV Specialty Chemicals, now WestRock , from 2010 to 2015, and vice president, Resins Polymers and Coatings, from 2004 to 2009. Over 31 years with the company, Ed has led teams in business development, including new product development, bolt - on acquisitions and strategic alliances. He has held various roles as development engineer, national sales manager, business development manager, industry manager, marketing manager and group manager. Ed Woodcock – SVP and President, Performance Materials Mr. Woodcock served as vice president of Carbon Technologies for MWV Specialty Chemicals, now WestRock. He has held various roles during his extensive career with the company, including global business director, automotive business director, worldwide marketing manager for chemical d ivision’s non - US business, area sales manager for Latin America and technical manager for Carbon team’s process technology group. 5

Section Speaker Time Welcome & Lunch All 11:30 am Introducing Ingevity Michael Wilson 12:00 pm Performance Materials Ed Woodcock 12:30 pm Performance Chemicals Ed Rose 1:00 pm Business Wrap - Up Michael Wilson 1:30 pm Financial Overview John Fortson 1:35 pm Q&A Session All 2:00 pm Agenda 6
Introducing Ingevity Michael Wilson President and CEO 7
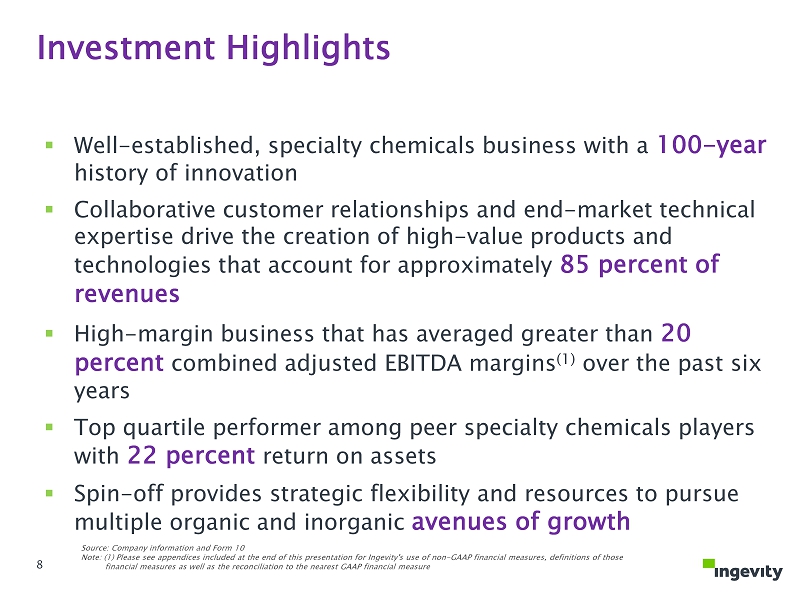
8 Investment Highlights 8 Source: Company information and Form 10 Note: (1) Please see appendices included at the end of this presentation for Ingevity's use of non - GAAP financial measures, definitions of those financial measures as well as the reconciliation to the nearest GAAP financial measure ▪ Well - established, specialty chemicals business with a 100 - year history of innovation ▪ Collaborative customer relationships and end - market technical expertise drive the creation of high - value products and technologies that account for approximately 85 percent of revenues ▪ High - margin business that has averaged greater than 20 percent combined adjusted EBITDA margins (1) over the past six years ▪ Top quartile performer among peer specialty chemicals players with 22 percent return on assets ▪ Spin - off provides strategic flexibility and resources to pursue multiple organic and inorganic avenues of growth

Purify, Protect and Enhance 9
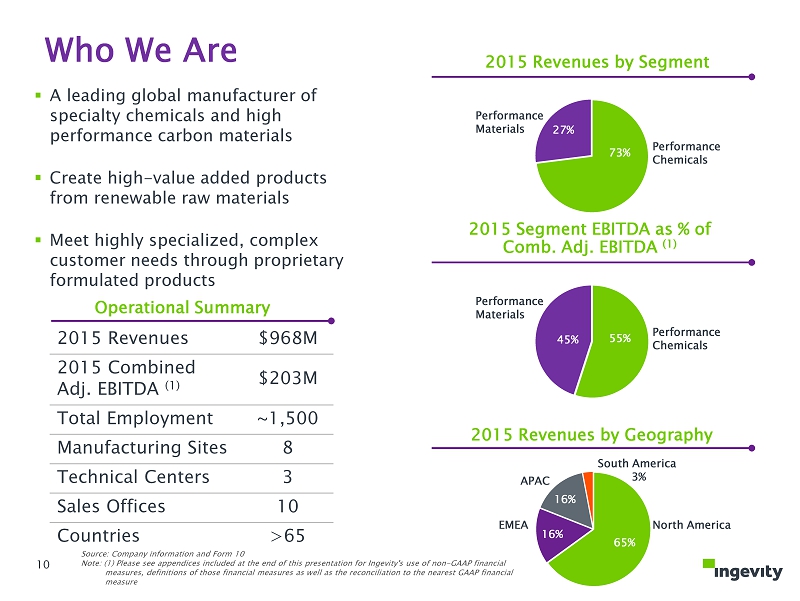
10 73% 27% ▪ A leading global manufacturer of specialty chemicals and high performance carbon materials ▪ Create high - value added products from renewable raw materials ▪ Meet highly specialized, complex customer needs through proprietary formulated products 2015 Revenues by Segment 2015 Revenues by Geography 65% South America 3% 16% 16% Source: Company information and Form 10 Note: (1) Please see appendices included at the end of this presentation for Ingevity's use of non - GAAP financial measures, definitions of those financial measures as well as the reconciliation to the nearest GAAP financial measure 2015 Revenues $968M 2015 Combined Adj. EBITDA (1) $203M Total Employment ~1,500 Manufacturing Sites 8 Technical Centers 3 Sales Offices 10 Countries >65 Who We Are Performance Materials Performance Chemicals North America APAC EMEA Operational Summary 55% 45% 2015 Segment EBITDA as % of Comb. Adj. EBITDA (1) Performance Materials Performance Chemicals 10
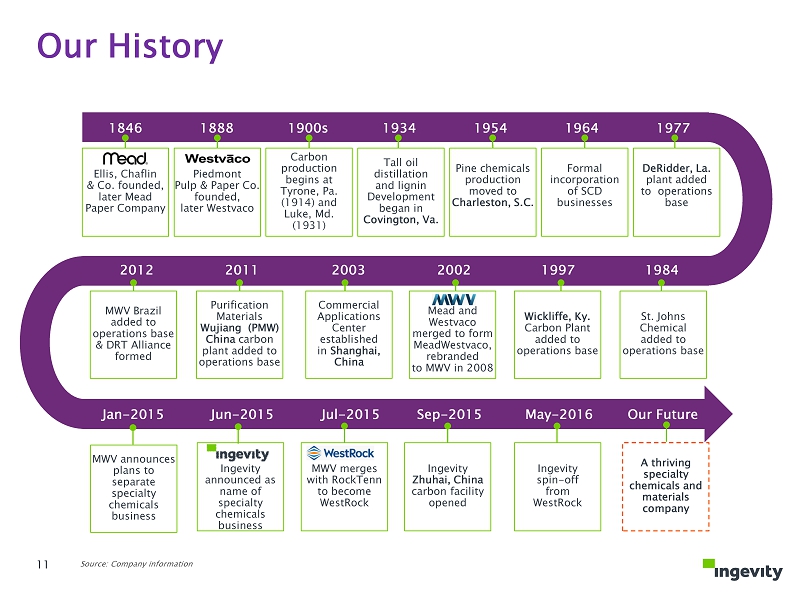
11 Our History 1846 1888 1900s 1934 1954 1964 1977 1984 2003 1997 2002 2011 2012 Jan - 2015 Jun - 2015 Jul - 2015 Sep - 2015 May - 2016 Our Future Ingevity announced as name of specialty chemicals business MWV merges with RockTenn to become WestRock Ingevity Zhuhai, China carbon facility opened Ingevity spin - off from WestRock A thriving specialty chemicals and materials company Ellis , Chaflin & Co. founded , later Mead Paper Company Piedmont Pulp & Paper Co. founded , later Westvaco Carbon production begins at Tyrone, Pa. (1914) and Luke, Md. (1931) Tall oil distillation a nd lignin Development began in Covington , Va . Pine chemicals production moved to Charleston, S.C. Formal incorporation of SCD businesses DeRidder , La. plant added to operations base Commercial Applications Center established in Shanghai, China Wickliffe , Ky. Carbon Plant added to operations base Mead and Westvaco merged to form MeadWestvaco, rebranded to MWV in 2008 Purification Materials Wujiang ( PMW) China carbon plant added to operations base MWV Brazil added to operations base & DRT Alliance formed MWV announces plans to separate specialty chemicals business St . Johns Chemical added to operations base Source: Company information 11
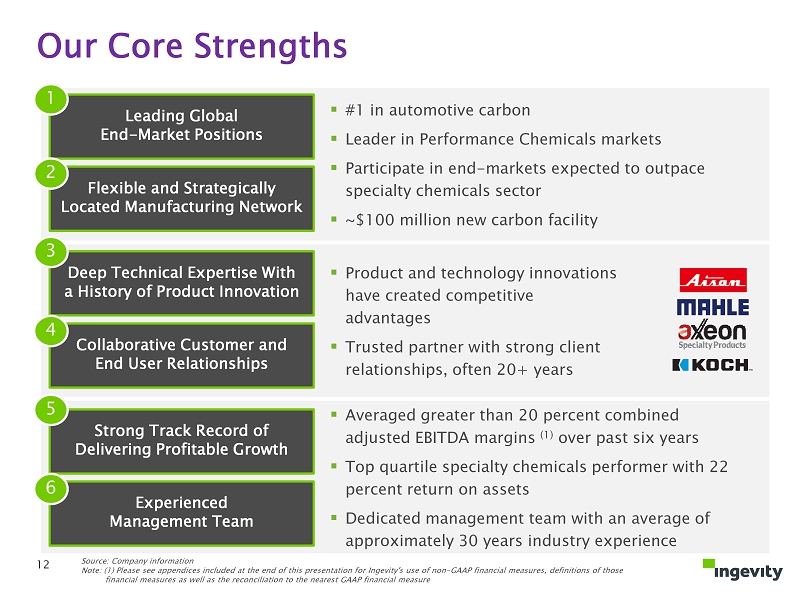
12 Our Core Strengths Leading Global End - Market Positions Flexible and Strategically Located Manufacturing Network Deep Technical Expertise With a History of Product Innovation Collaborative Customer and End User Relationships 1 2 3 4 Strong Track Record of Delivering Profitable Growth Experienced Management Team 5 6 ▪ Product and technology innovations have created competitive advantages ▪ Trusted partner with strong client relationships, often 20+ years ▪ #1 in automotive carbon ▪ Leader in Performance Chemicals markets ▪ Participate in end - markets expected to outpace specialty chemicals sector ▪ ~$100 million new carbon facility ▪ Averaged greater than 20 percent combined adjusted EBITDA margins (1) over past six years ▪ Top quartile specialty chemicals performer with 22 percent return on assets ▪ Dedicated management team with an average of approximately 30 years industry experience Source: Company information Note: (1) Please see appendices included at the end of this presentation for Ingevity's use of non - GAAP financial measures, definitions of those financial measures as well as the reconciliation to the nearest GAAP financial measure 12
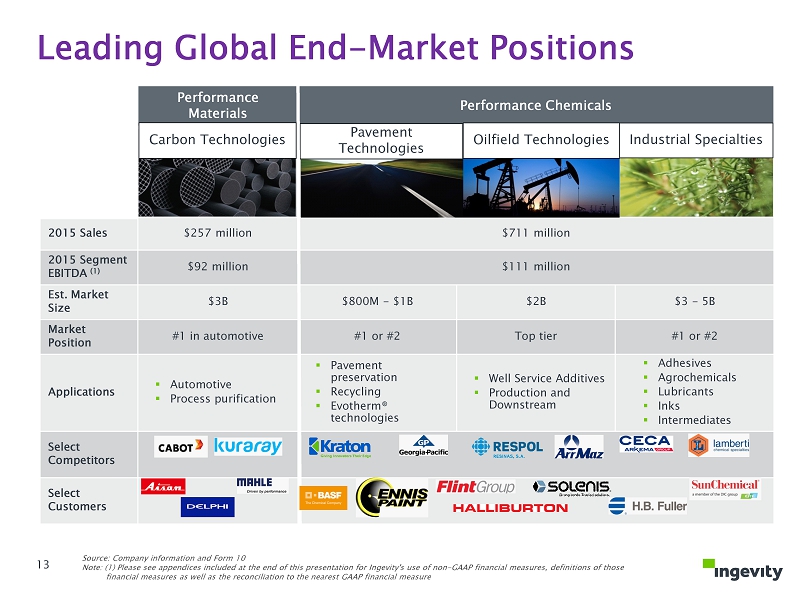
Performance Materials Performance Chemicals 2015 Sales $257 million $711 million 2015 Segment EBITDA (1) $92 million $111 million Est. Market Size $3B $800M - $1B $2B $3 - 5B Market Position #1 in automotive #1 or #2 Top tier #1 or #2 Applications ▪ Automotive ▪ Process purification ▪ Pavement preservation ▪ Recycling ▪ Evotherm ® technologies ▪ Well Service Additives ▪ Production and Downstream ▪ Adhesives ▪ Agrochemicals ▪ Lubricants ▪ Inks ▪ Intermediates Select Competitors Select Customers Carbon Technologies Pavement Technologies Oilfield Technologies Leading Global End - Market Positions Source: Company information and Form 10 Note: (1) Please see appendices included at the end of this presentation for Ingevity's use of non - GAAP financial measures, definitions of those financial measures as well as the reconciliation to the nearest GAAP financial measure Industrial Specialties 13
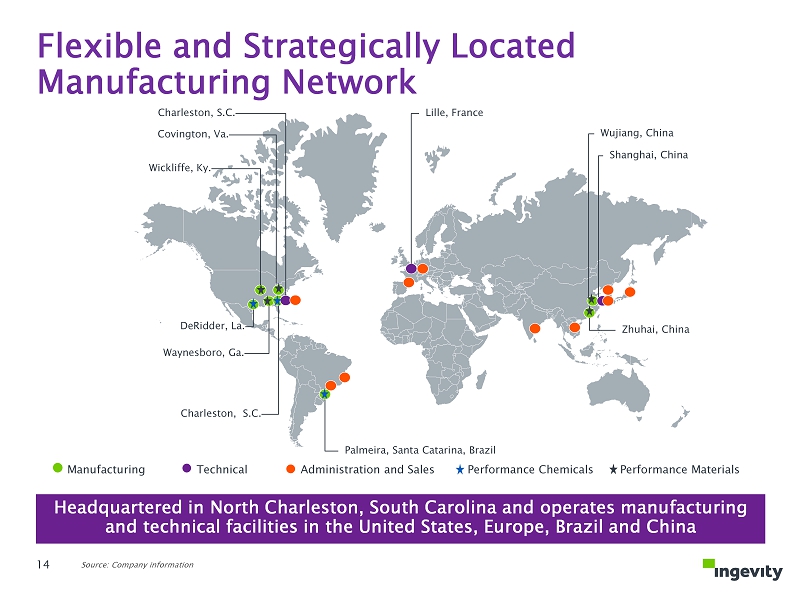
14 Palmeira , Santa Catarina, Brazil DeRidder, La. Waynesboro, Ga. Covington, Va . Wickliffe, Ky. Zhuhai , China Wujiang , China Shanghai , China Charleston, S.C. Lille , France Charleston , S.C. Manufacturing Technical Administration and Sales Headquartered in North Charleston, South Carolina and operates manufacturing and technical facilities in the United States, Europe, Brazil and China Performance Chemicals Source: Company information Performance Materials Flexible and Strategically Located Manufacturing Network 14
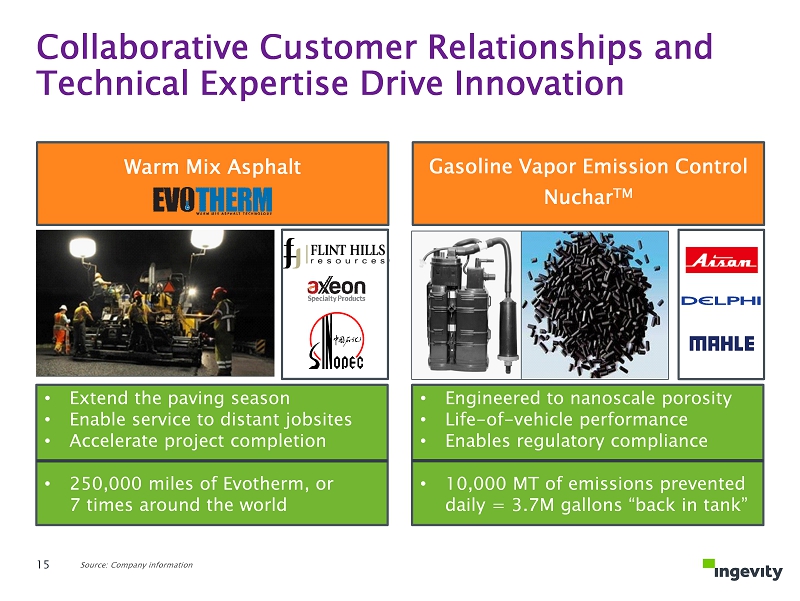
Collaborative Customer Relationships and Technical Expertise Drive Innovation 15 • Extend the paving season • Enable service to distant jobsites • Accelerate project completion • 250,000 miles of Evotherm , or 7 times around the world • Engineered to nanoscale porosity • Life - of - vehicle performance • Enables regulatory compliance • 10,000 MT of emissions prevented daily = 3.7M gallons “back in tank” Warm Mix Asphalt Gasoline Vapor Emission Control Nuchar TM Source: Company information
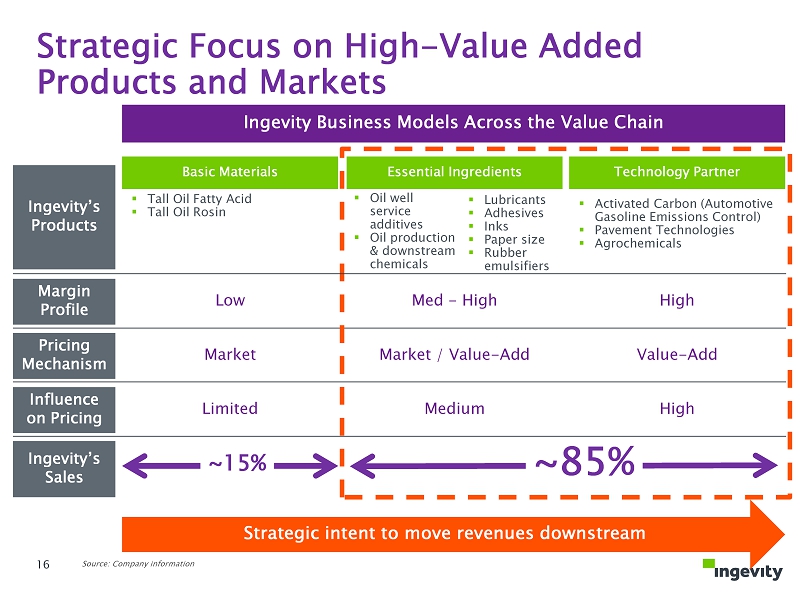
Strategic Focus on High - Value Added Products and Markets Basic Materials Essential Ingredients Technology Partner Ingevity Business Models Across the Value Chain ~85% ~15% Pricing Mechanism Margin Profile Low Med - High High Market Market / Value - Add Value - Add Influence on Pricing Ingevity’s Sales Limited Medium High Strategic intent to move revenues downstream Ingevity’s Products ▪ Tall Oil Fatty Acid ▪ Tall Oil Rosin ▪ Oil well service additives ▪ Oil production & downstream chemicals ▪ Activated Carbon (Automotive Gasoline Emissions Control) ▪ Pavement Technologies ▪ Agrochemicals ▪ Lubricants ▪ Adhesives ▪ Inks ▪ Paper size ▪ Rubber emulsifiers 16 Source: Company information
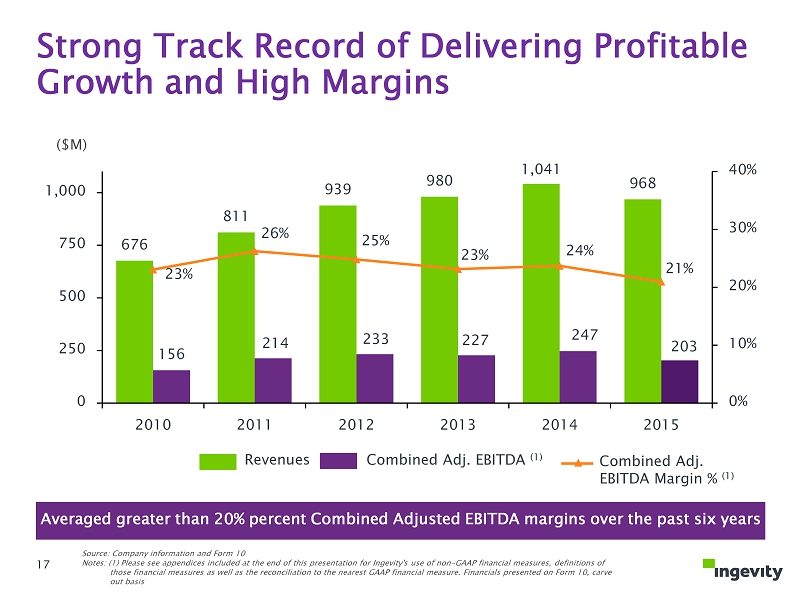
676 811 939 980 1,041 968 156 214 233 227 247 203 23% 26% 25% 23% 24% 21% 0% 10% 20% 30% 40% 0 250 500 750 1,000 2010 2011 2012 2013 2014 2015 ($M) Strong Track Record of Delivering Profitable Growth and High Margins Averaged greater than 20% percent Combined Adjusted EBITDA margins over the past six years Revenues Combined Adj. EBITDA (1) Combined Adj. EBITDA Margin % (1) Source: Company information and Form 10 Notes: (1) Please see appendices included at the end of this presentation for Ingevity's use of non - GAAP financial measures, definitions of those financial measures as well as the reconciliation to the nearest GAAP financial measure. Financials presented on Form 10 , c arve out basis 17
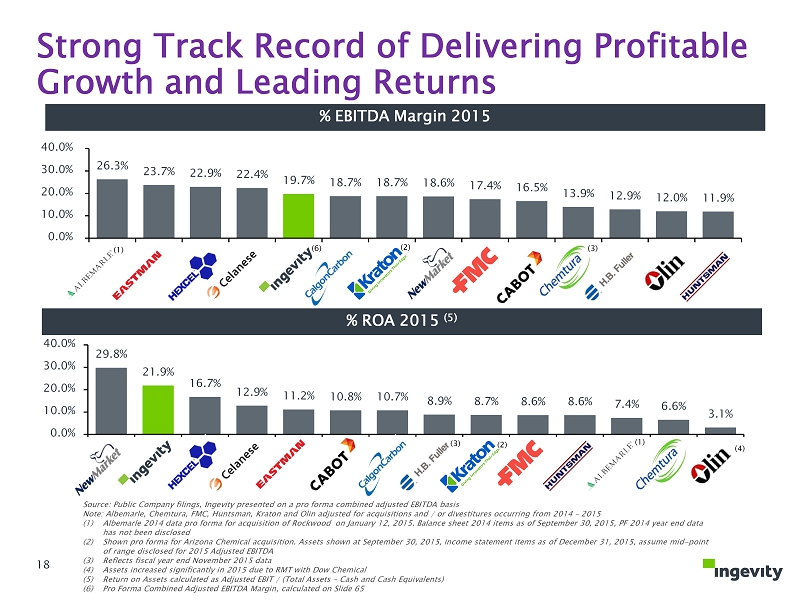
Source: Public Company filings, Ingevity presented on a pro forma combined adjusted EBITDA basis Note: Albemarle, Chemtura , FMC, Huntsman, Kraton and Olin adjusted for acquisitions and / or divestitures occurring from 2014 – 2015 (1) Albemarle 2014 data pro forma for acquisition of Rockwood on January 12, 2015. Balance sheet 2014 items as of September 30, 201 5, PF 2014 year end data has not been disclosed (2) Shown pro forma for Arizona Chemical acquisition. Assets shown at September 30, 2015, income statement items as of December 3 1, 2015, assume mid - point of range disclosed for 2015 Adjusted EBITDA (3) Reflects fiscal year end November 2015 data (4) Assets increased significantly in 2015 due to RMT with Dow Chemical (5) Return on Assets calculated as Adjusted EBIT / (Total Assets – Cash and Cash Equivalents) (6) Pro Forma Combined Adjusted EBITDA Margin, calculated on Slide 65 Strong Track Record of Delivering Profitable Growth and Leading Returns 18 26.3% 23.7% 22.9% 22.4% 19.7% 18.7% 18.7% 18.6% 17.4% 16.5% 13.9% 12.9% 12.0% 11.9% 0.0% 10.0% 20.0% 30.0% 40.0% 29.8% 21.9% 16.7% 12.9% 11.2% 10.8% 10.7% 8.9% 8.7% 8.6% 8.6% 7.4% 6.6% 3.1% 0.0% 10.0% 20.0% 30.0% 40.0% % EBITDA Margin 2015 % ROA 2015 (5) (3) (2) (4) (1) (2) (3) (1) (6)
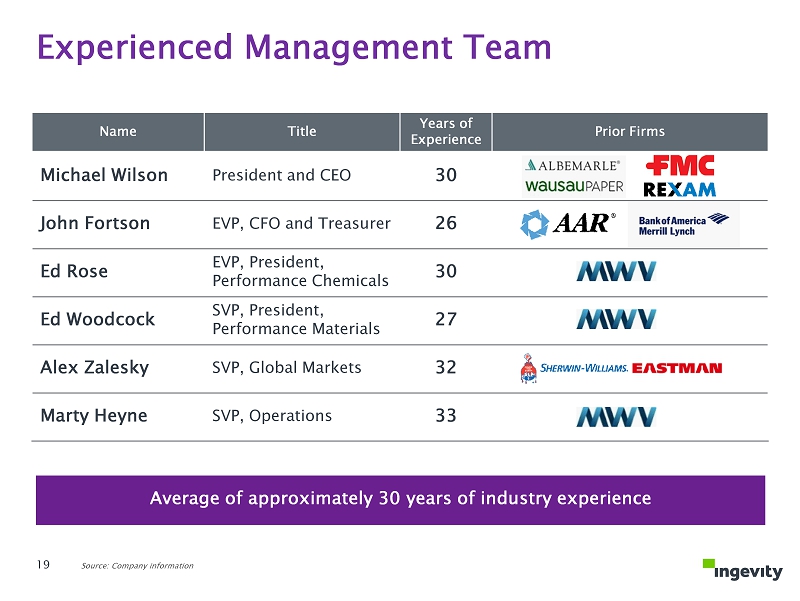
Name Title Years of Experience Prior Firms Michael Wilson President and CEO 30 John Fortson EVP, CFO and Treasurer 26 Ed Rose EVP, President, Performance Chemicals 30 Ed Woodcock SVP, President, Performance Materials 27 Alex Zalesky SVP, Global Markets 32 Marty Heyne SVP, Operations 33 Source: Company information Average of approximately 30 years of industry experience Experienced Management Team 19
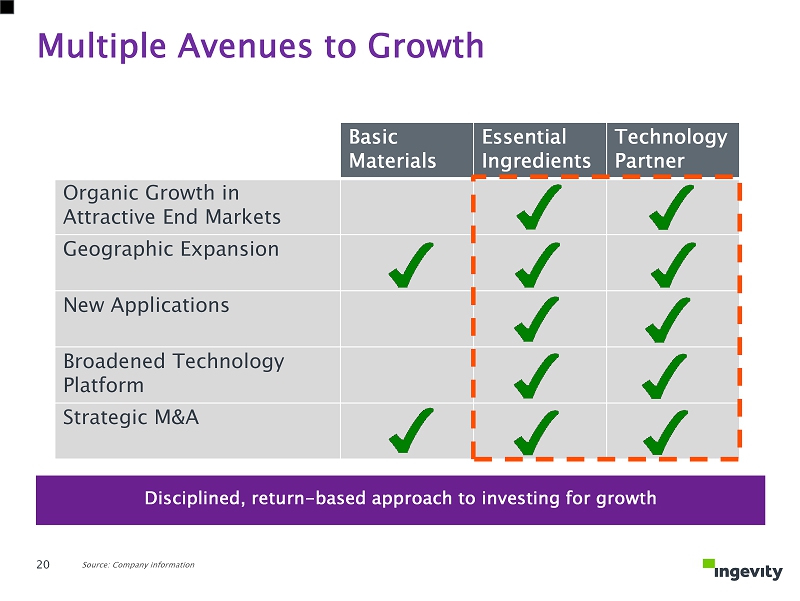
Multiple Avenues to Growth Basic Materials Essential Ingredients Technology Partner Organic Growth in Attractive End Markets Geographic Expansion New Applications Broadened Technology Platform Strategic M&A 20 Source: Company information Disciplined, return - based approach to investing for growth
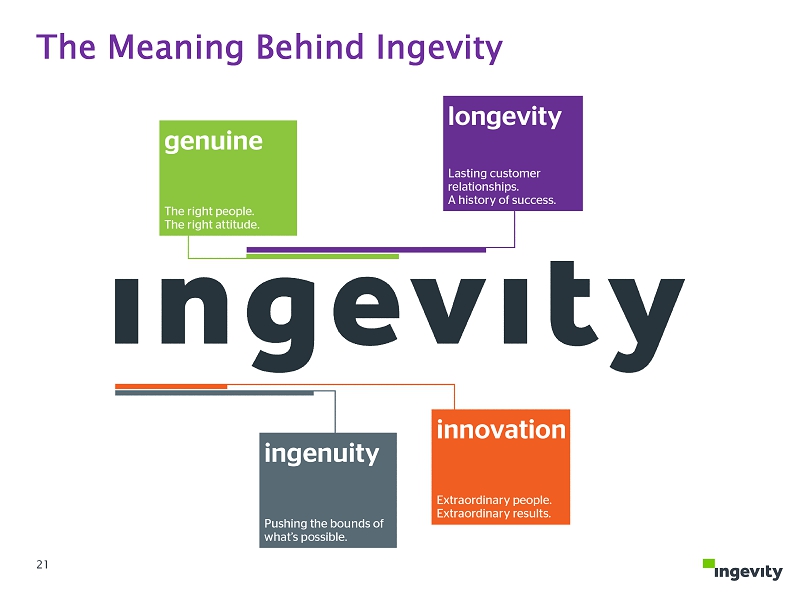
The Meaning Behind Ingevity 21

Performance Materials Ed Woodcock SVP and President, Performance Materials 22
23 ▪ Market and technology leadership position provides significant competitive advantage ▪ Increasingly stringent gasoline vapor emission regulations could double the market over the next five to seven years ▪ Growth will also be accelerated by gasoline vehicle demand forecast at 2.4 percent CAGR for next 10 years ▪ Manufacturing capacity (including new ~$100 million plant ) in place and strategically located to meet current and future demand Investment Highlights – Performance Materials Source: IHS, Company information 23
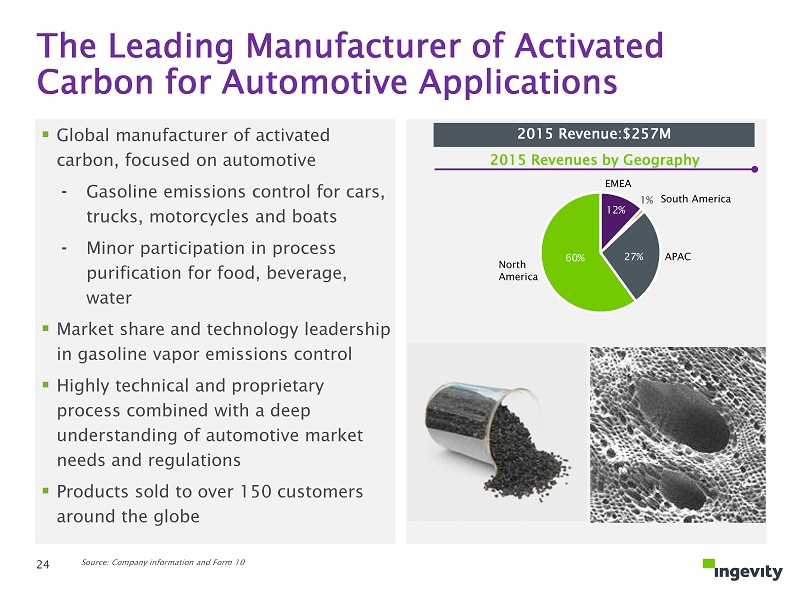
▪ Global manufacturer of activated carbon, focused on automotive ⁃ Gasoline emissions control for cars, trucks, motorcycles and boats ⁃ Minor participation in process purification for food, beverage, water ▪ Market share and technology leadership in gasoline vapor emissions control ▪ Highly technical and proprietary process combined with a deep understanding of automotive market needs and regulations ▪ Products sold to over 150 customers around the globe The Leading Manufacturer of Activated Carbon for Automotive Applications 12% 1% 27% 60% 2015 Revenue:$257M 2015 Revenues by Geography North America EMEA South America APAC Source: Company information and Form 10 24
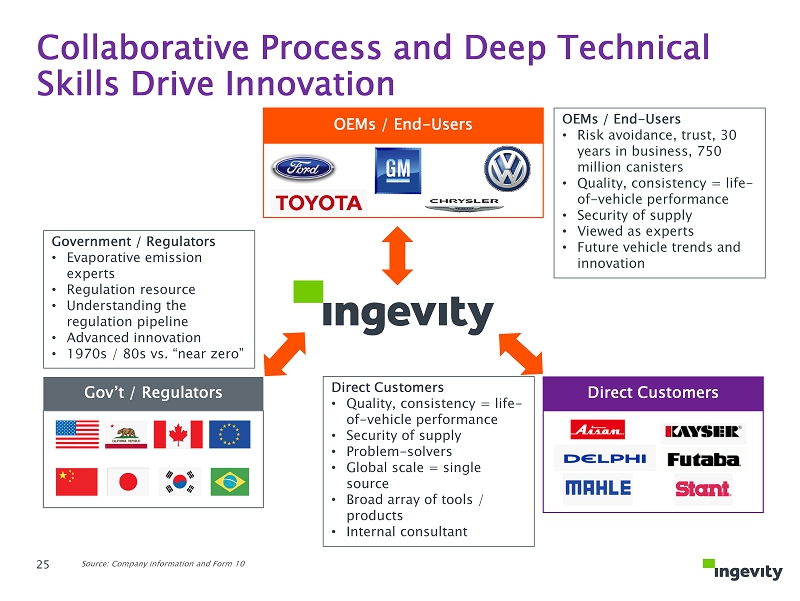
Gov’t / Regulators OEMs / End - Users Direct Customers Collaborative Process and Deep Technical Skills Drive Innovation OEMs / End - Users • Risk avoidance, trust, 30 years in business, 750 million canisters • Quality, consistency = life - of - vehicle performance • Security of supply • Viewed as experts • Future vehicle trends and innovation Direct Customers • Quality, consistency = life - of - vehicle performance • Security of supply • Problem - solvers • Global scale = single source • Broad array of tools / products • Internal consultant Government / Regulators • Evaporative emission experts • Regulation resource • Understanding the regulation pipeline • Advanced innovation • 1970s / 80s vs. “near zero” Source: Company information and Form 10 25

25 - 35 grams /day 1970 – 80s technology / 0.5 - 1.0L One Day Parking 1990s technology / 2.0 - 3.0L • multi - day parking & running loss • plus refueling Modern technology “Near Zero” 2.0 - 3.0L + scrubber India - China - Europe Japan - Brazil - S. Korea US / Canada California (PZEV) Control Technology Emission Sources and Impact Products That Enable Regulatory Compliance Approximately 75 to 80 percent of the world’s gasoline vehicles are using early 1970 - 1980s level of emissions control Parking 13 grams/ hr driving Running loss 75 ml / refueling Refueling Source: Company information and Form 10; IHS 13 gallons / year / vehicle + + = 26
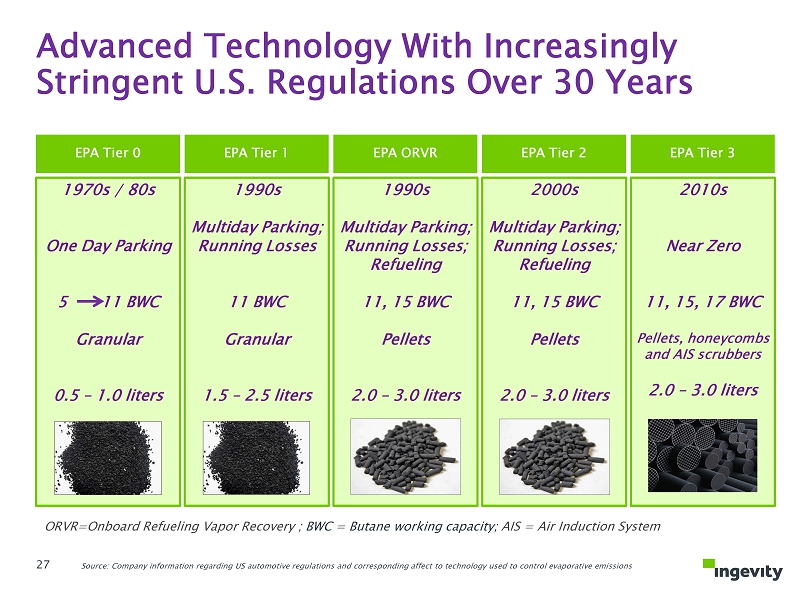
Advanced Technology With Increasingly Stringent U.S. Regulations Over 30 Years Source: Company information regarding US automotive regulations and corresponding affect to technology used to control evaporative emissions EPA Tier 0 EPA Tier 1 EPA ORVR EPA Tier 2 EPA Tier 3 1970s / 80s One Day Parking 5 11 BWC Granular 0.5 – 1.0 liters 1990s Multiday Parking; Running Losses 11 BWC Granular 1.5 – 2.5 liters 1990s Multiday Parking; Running Losses; Refueling 11, 15 BWC Pellets 2.0 – 3.0 liters 2000s Multiday Parking; Running Losses; Refueling 11, 15 BWC Pellets 2.0 – 3.0 liters 2010s Near Zero 11, 15, 17 BWC Pellets, honeycombs and AIS scrubbers 2.0 – 3.0 liters ORVR=Onboard Refueling Vapor Recovery ; BWC = Butane working capacity; AIS = Air Induction System 27
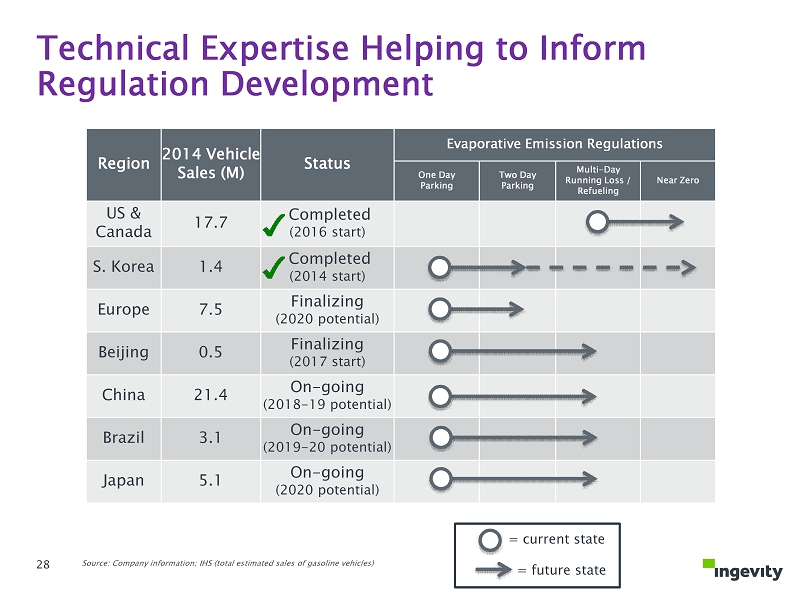
Technical Expertise Helping to Inform Regulation Development Region 2014 Vehicle Sales (M) Status Evaporative Emission Regulations One Day Parking Two Day Parking Multi - Day Running Loss / Refueling Near Zero US & Canada 17.7 Completed (2016 start) S. Korea 1.4 Completed (2014 start) Europe 7.5 Finalizing (2020 potential) Beijing 0.5 Finalizing (2017 start) China 21.4 On - going (2018 - 19 potential) Brazil 3.1 On - going (2019 - 20 potential) Japan 5.1 On - going (2020 potential) = current state = future state Source: Company information; IHS (total estimated sales of gasoline vehicles) 28
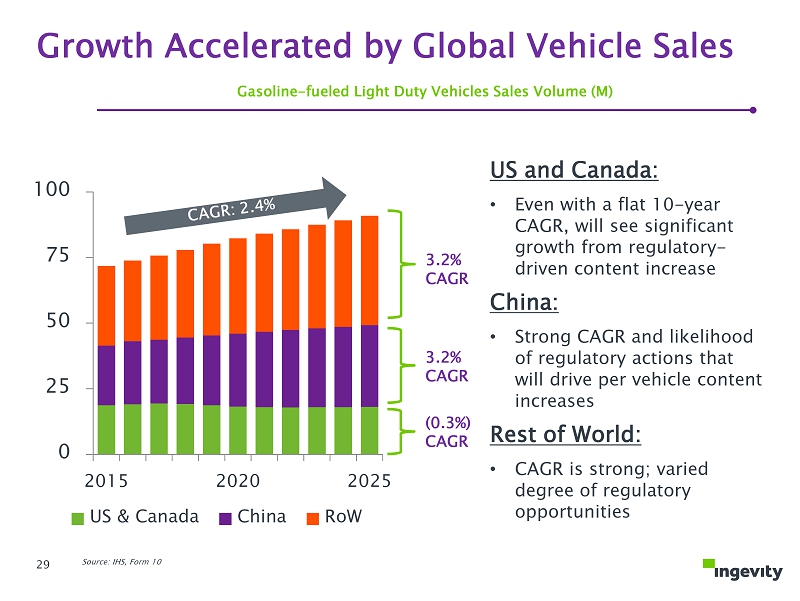
0 25 50 75 100 2015 2020 2025 US & Canada China RoW Source: IHS, Form 10 Gasoline - fueled Light Duty Vehicles Sales Volume (M) Growth Accelerated by Global Vehicle Sales US and Canada: • Even with a flat 10 - year CAGR, will see significant growth from regulatory - driven content increase China: • Strong CAGR and likelihood of regulatory actions that will drive per vehicle content increases Rest of World: • CAGR is strong; varied degree of regulatory opportunities 3.2% CAGR 3.2% CAGR (0.3%) CAGR 29
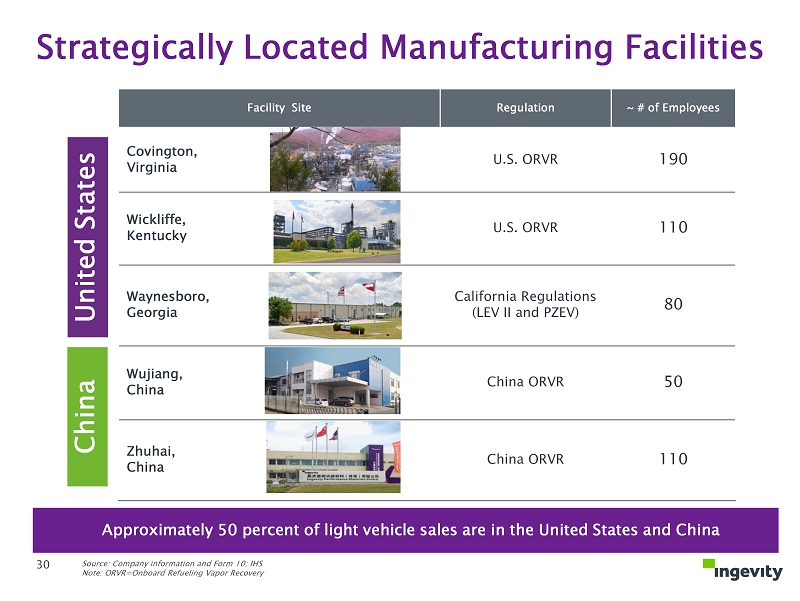
Facility Site Regulation ~ # of Employees Covington, Virginia U.S. ORVR 190 Wickliffe, Kentucky U.S. ORVR 110 Waynesboro, Georgia California Regulations (LEV II and PZEV) 80 Wujiang, China China ORVR 50 Zhuhai, China China ORVR 110 Source: Company information and Form 10; IHS Note: ORVR=Onboard Refueling Vapor Recovery Approximately 50 percent of light vehicle sales are in the United States and China United States China Strategically Located Manufacturing Facilities 30
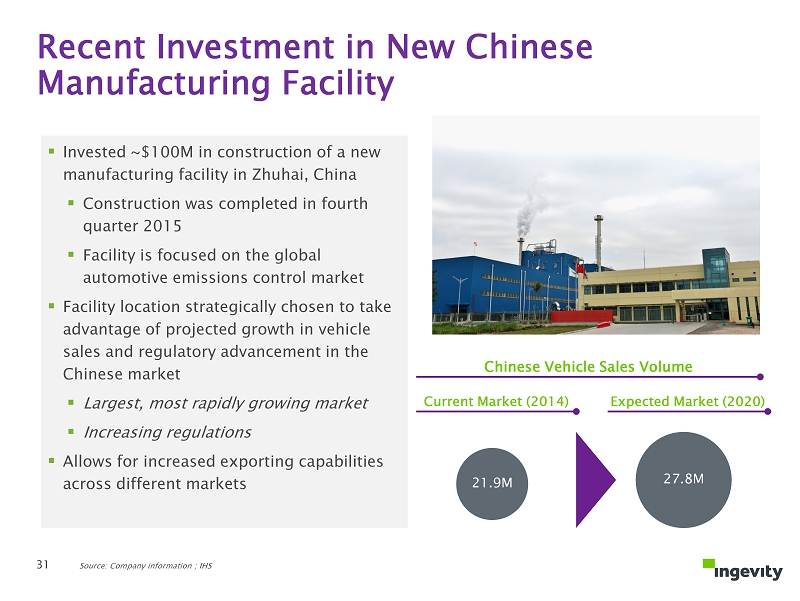
31 Recent Investment in New Chinese Manufacturing Facility ▪ Invested ~$100M in construction of a new manufacturing facility in Zhuhai, China ▪ Construction was completed in fourth quarter 2015 ▪ Facility is focused on the global automotive emissions control market ▪ Facility location strategically chosen to take advantage of projected growth in vehicle sales and regulatory advancement in the Chinese market ▪ Largest, most rapidly growing market ▪ Increasing regulations ▪ Allows for increased exporting capabilities across different markets Current Market (2014) Expected Market (2020) 21.9M 27.8M Chinese Vehicle Sales Volume Source: Company information ; IHS 31
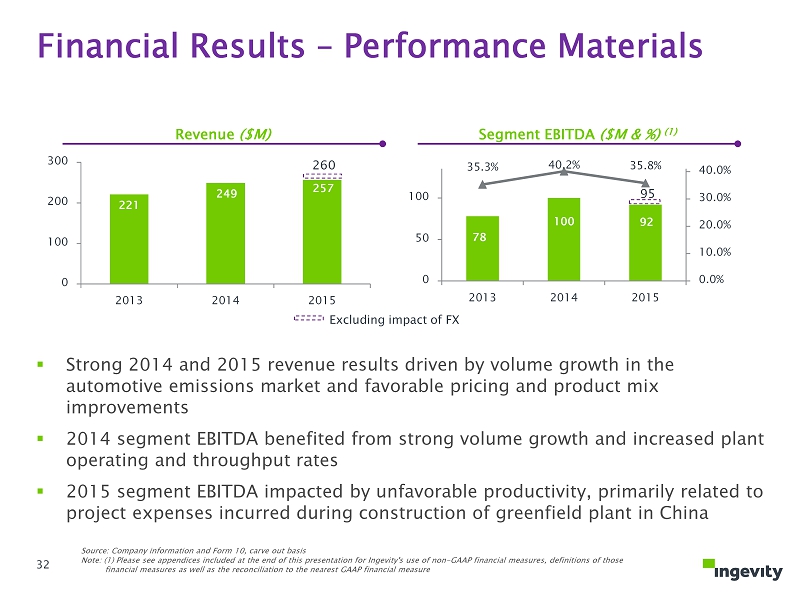
95 78 100 92 35.3% 40.2% 35.8% 0.0% 10.0% 20.0% 30.0% 40.0% 0 50 100 2013 2014 2015 ▪ Strong 2014 and 2015 revenue results driven by volume growth in the automotive emissions market and favorable pricing and product mix improvements ▪ 2014 segment EBITDA benefited from strong volume growth and increased plant operating and throughput rates ▪ 2015 segment EBITDA impacted by unfavorable productivity, primarily related to project expenses incurred during construction of greenfield plant in China Revenue ($M) Segment EBITDA ($M & %) (1) Financial Results – Performance Materials 221 249 257 0 100 200 300 2013 2014 2015 260 Excluding impact of FX Source: Company information and Form 10, carve out basis Note: (1) Please see appendices included at the end of this presentation for Ingevity's use of non - GAAP financial measures, definitions of those financial measures as well as the reconciliation to the nearest GAAP financial measure 32

33 ▪ Market and technology leadership position provides significant competitive advantage ▪ Increasingly stringent gasoline vapor emission regulations could double the market over the next five to seven years ▪ Growth will also be accelerated by gasoline vehicle demand forecast at 2.4 percent CAGR for next 10 years ▪ Manufacturing capacity (including new ~$100 million plant ) in place and strategically located to meet current and future demand Investment Highlights – Performance Materials Source: Company information; IHS 33
Performance Chemicals Ed Rose EVP and President, Performance Chemicals 34

35 ▪ Market - driven strategy focused on segments poised for strong growth ▪ Deep customer collaboration supported by technical expertise ▪ Long - term customer relationships; often more than 20 years ▪ High degree of customer diversity; top 10 make up approximately 43 percent of sales… next 100 make up next approximately 37 percent ▪ Small cost relative to end - product value Investment Highlights – Performance Chemicals Source: Company information and Form 10 35
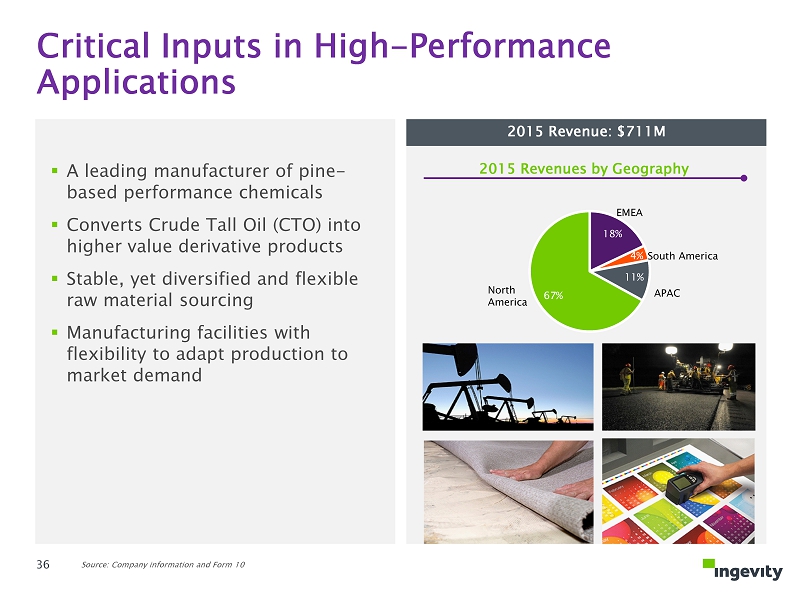
18% 4% 11% 67% 2015 Revenue: $711M 2015 Revenues by Geography Critical Inputs in High - Performance Applications North America EMEA South America APAC ▪ A leading manufacturer of pine - based performance chemicals ▪ Converts Crude Tall Oil (CTO) into higher value derivative products ▪ Stable, yet diversified and flexible raw material sourcing ▪ Manufacturing facilities with flexibility to adapt production to market demand Source: Company information and Form 10 36
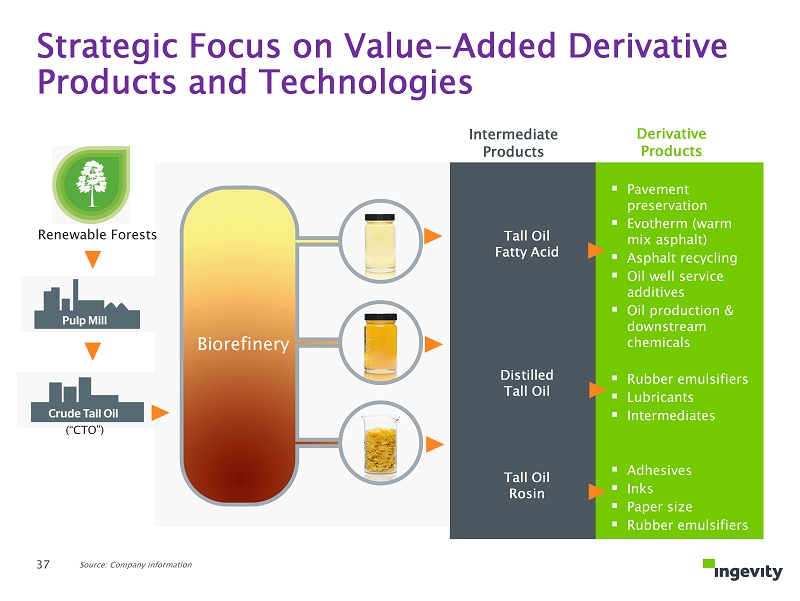
Biorefinery Derivative Products ▪ Pavement preservation ▪ Evotherm (warm mix asphalt) ▪ Asphalt recycling ▪ Oil well service additives ▪ Oil production & downstream chemicals ▪ Rubber emulsifiers ▪ Lubricants ▪ Intermediates ▪ Adhesives ▪ Inks ▪ Paper size ▪ Rubber emulsifiers Renewable Forests Tall Oil Fatty Acid Intermediate Products Distilled Tall Oil Tall Oil Rosin (“CTO”) Strategic Focus on Value - Added Derivative Products and Technologies Source: Company information 37
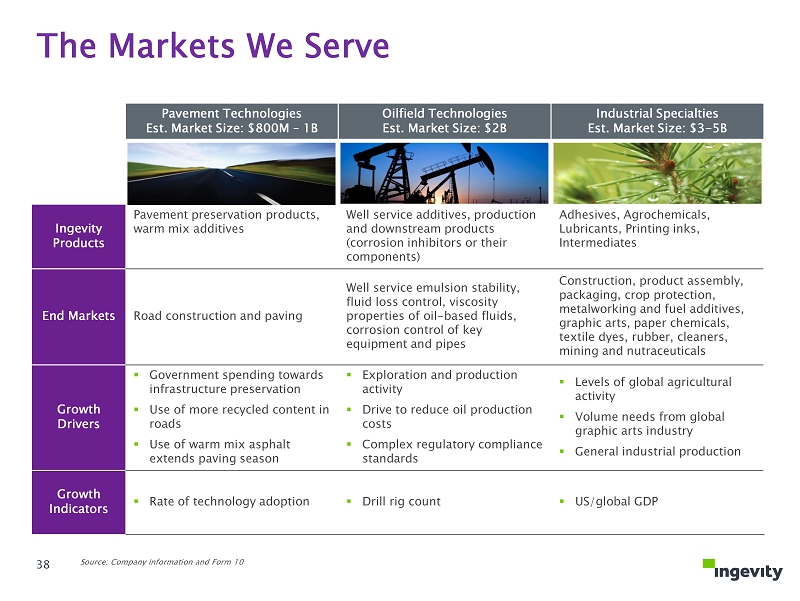
The Markets We Serve Pavement Technologies Est. Market Size: $800M – 1B Oilfield Technologies Est. Market Size: $2B Industrial Specialties Est. Market Size: $3 - 5B Ingevity Products Pavement preservation products, w arm mix additives Well service additives, production and downstream products (corrosion inhibitors or their components) Adhesives, Agrochemicals, Lubricants, Printing inks, Intermediates End Markets Road construction and paving Well service emulsion stability, fluid loss control, viscosity properties of oil - based fluids, corrosion control of key equipment and pipes Construction, product assembly, packaging, crop protection, metalworking and fuel additives, graphic arts, paper chemicals, textile dyes, rubber, cleaners, mining and nutraceuticals Growth Drivers ▪ Government spending towards infrastructure preservation ▪ Use of more recycled content in roads ▪ Use of warm mix asphalt extends paving season ▪ Exploration and production activity ▪ Drive to reduce oil production costs ▪ Complex regulatory compliance standards ▪ Levels of global agricultural activity ▪ Volume needs from global graphic arts industry ▪ General industrial production Growth Indicators ▪ Rate of technology adoption ▪ Drill rig count ▪ US/global GDP Source: Company information and Form 10 38
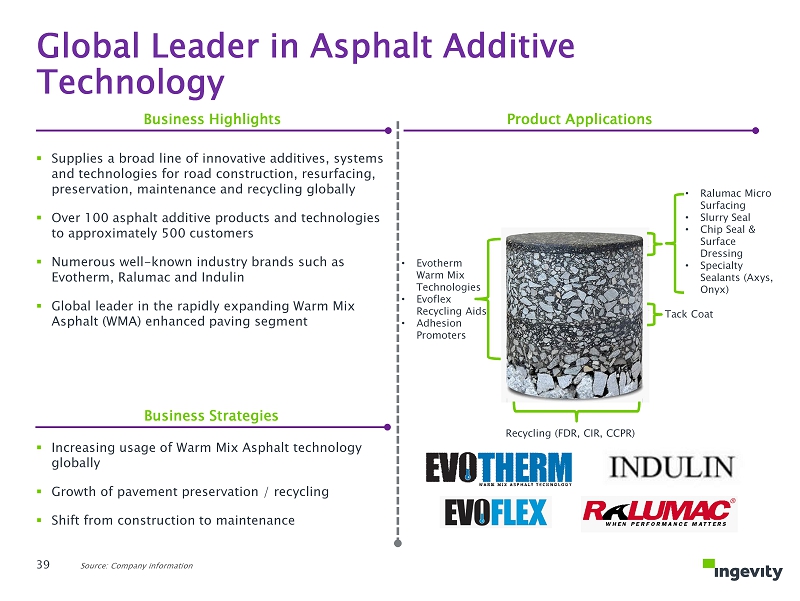
Business Highlights Product Applications Business Strategies ▪ Supplies a broad line of innovative additives, systems and technologies for road construction, resurfacing, preservation, maintenance and recycling globally ▪ Over 100 asphalt additive products and technologies to approximately 500 customers ▪ Numerous well - known industry brands such as Evotherm, Ralumac and Indulin ▪ Global leader in the rapidly expanding Warm Mix Asphalt (WMA) enhanced paving segment Recycling (FDR, CIR, CCPR) Tack Coat • Evotherm Warm Mix Technologies • Evoflex Recycling Aids • Adhesion Promoters • Ralumac Micro Surfacing • Slurry Seal • Chip Seal & Surface Dressing • Specialty Sealants (Axys, Onyx) ▪ Increasing usage of Warm Mix Asphalt technology globally ▪ Growth of pavement preservation / recycling ▪ Shift from construction to maintenance Global Leader in Asphalt Additive Technology Source: Company information 39
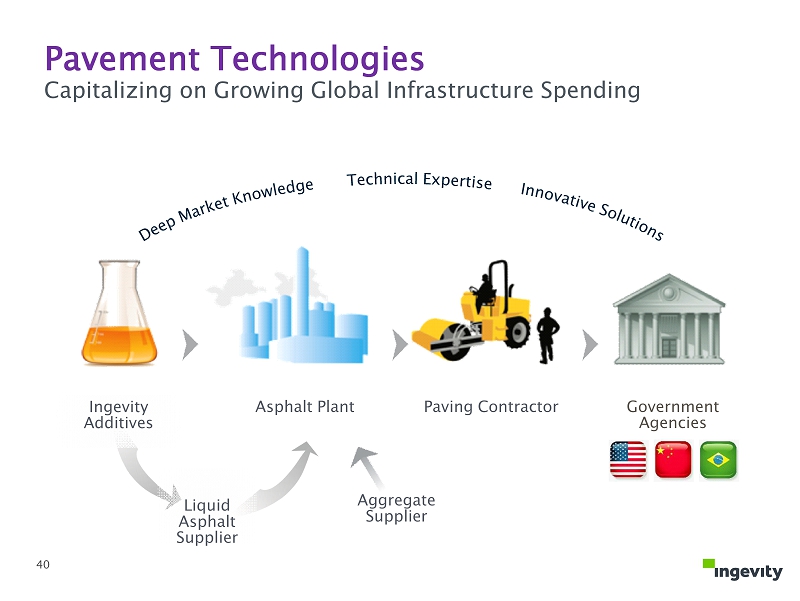
Aggregate Supplier Liquid Asphalt Supplier Asphalt Plant Paving Contractor Government Agencies Ingevity Additives Pavement Technologies Capitalizing on G rowing Global Infrastructure Spending 40
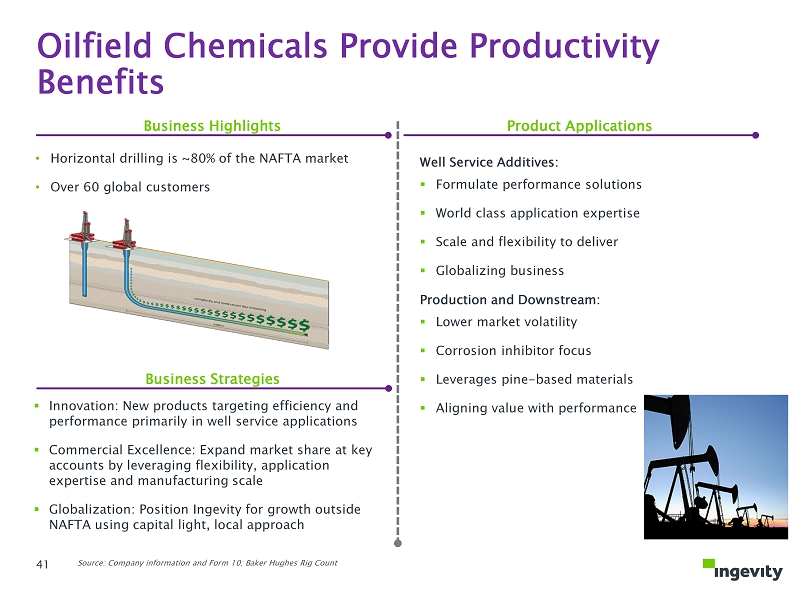
• Horizontal drilling is ~80 % of the NAFTA market • Over 60 global customers ▪ Innovation: New products targeting efficiency and performance primarily in well service applications ▪ Commercial Excellence: Expand market share at key accounts by leveraging flexibility, application expertise and manufacturing scale ▪ Globalization: Position Ingevity for growth outside NAFTA using capital light, local approach Business Highlights Product Applications Business Strategies Well Service Additives: ▪ Formulate performance solutions ▪ World class application expertise ▪ Scale and flexibility to deliver ▪ Globalizing business Production and Downstream: ▪ Lower market volatility ▪ Corrosion inhibitor focus ▪ Leverages pine - based materials ▪ Aligning value with performance Oilfield Chemicals Provide Productivity Benefits Source: Company information and Form 10; Baker Hughes Rig Count 41
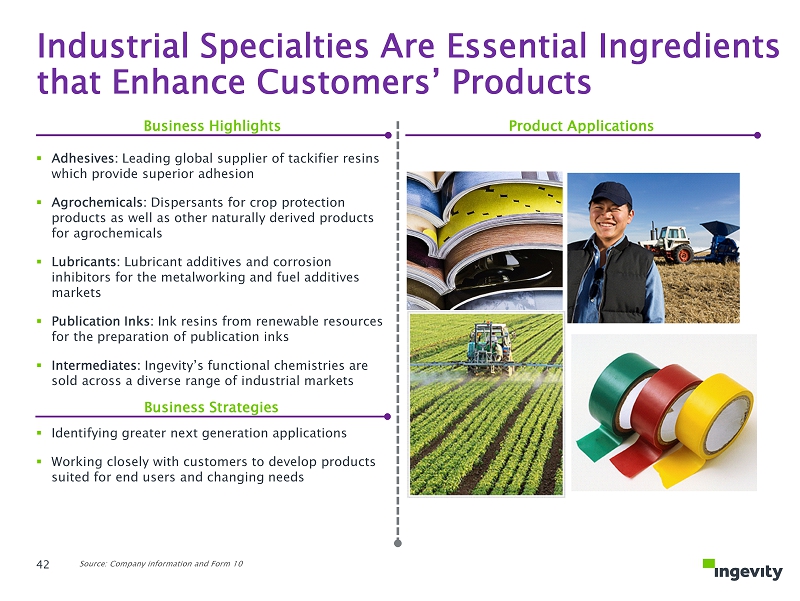
▪ Adhesives: Leading global supplier of tackifier resins which provide superior adhesion ▪ Agrochemicals: Dispersants for crop protection products as well as other naturally derived products for agrochemicals ▪ Lubricants: Lubricant additives and corrosion inhibitors for the metalworking and fuel additives markets ▪ Publication Inks: Ink resins from renewable resources for the preparation of publication inks ▪ Intermediates: Ingevity’s functional chemistries are sold across a diverse range of industrial markets ▪ Identifying greater next generation applications ▪ Working closely with customers to develop products suited for end users and changing needs Business Highlights Product Applications Business Strategies Industrial Specialties Are Essential Ingredients that Enhance Customers’ Products Source: Company information and Form 10 42
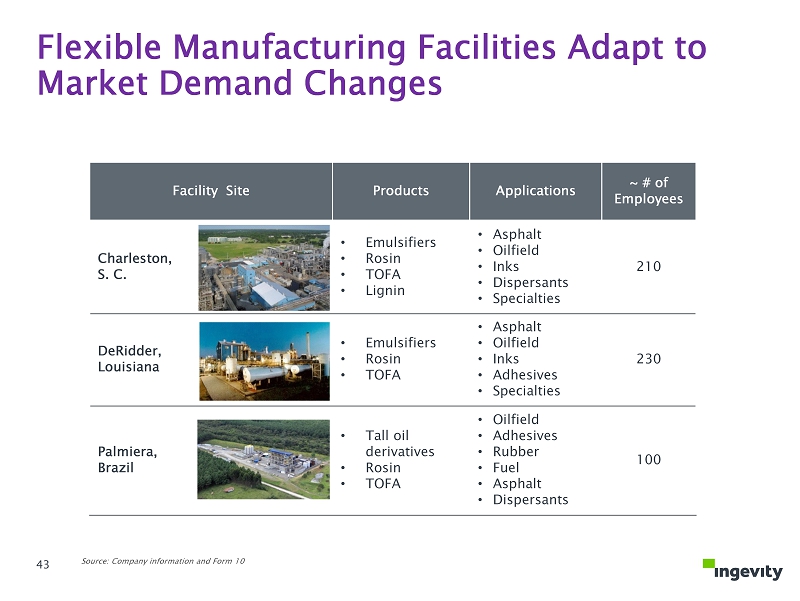
Facility Site Products Applications ~ # of Employees Charleston, S. C. • Emulsifiers • Rosin • TOFA • Lignin • Asphalt • Oilfield • Inks • Dispersants • Specialties 210 DeRidder, Louisiana • Emulsifiers • Rosin • TOFA • Asphalt • Oilfield • Inks • Adhesives • Specialties 230 Palmiera, Brazil • Tall oil derivatives • Rosin • TOFA • Oilfield • Adhesives • Rubber • Fuel • Asphalt • Dispersants 100 Flexible Manufacturing Facilities Adapt to Market Demand Changes Source: Company information and Form 10 43
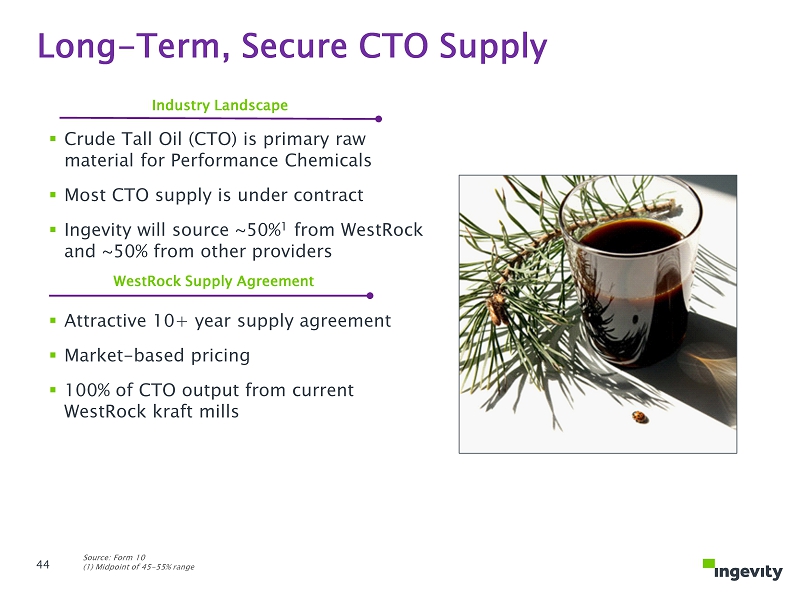
Source: Form 10 (1) Midpoint of 45 - 55% range ▪ Crude Tall Oil (CTO) is primary raw material for P erformance Chemicals ▪ Most CTO supply is under contract ▪ Ingevity will source ~50% 1 from WestRock and ~50% from other providers ▪ Attractive 10+ year supply agreement ▪ Market - based pricing ▪ 100% of CTO output from current WestRock kraft mills Industry Landscape WestRock Supply Agreement Long - Term, Secure CTO Supply 44
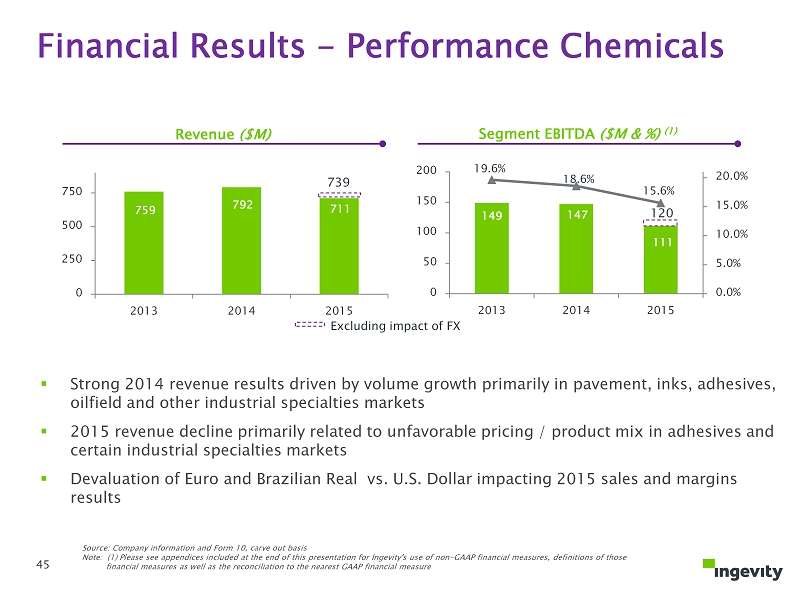
739 759 792 711 0 250 500 750 2013 2014 2015 120 149 147 111 19.6% 18.6% 15.6% 0.0% 5.0% 10.0% 15.0% 20.0% 0 50 100 150 200 2013 2014 2015 ▪ Strong 2014 revenue results driven by volume growth primarily in pavement, inks, adhesives, oilfield and other industrial specialties markets ▪ 2015 revenue decline primarily related to unfavorable pricing / product mix in adhesives and certain industrial specialties markets ▪ Devaluation of Euro and Brazilian Real vs. U.S. Dollar impacting 2015 sales and margins results Revenue ($ M ) Financial Results - Performance Chemicals Excluding impact of FX Source: Company information and Form 10, carve out basis Note: (1) Please see appendices included at the end of this presentation for Ingevity's use of non - GAAP financial measures, definitions of those financial measures as well as the reconciliation to the nearest GAAP financial measure 45 Segment EBITDA ($M & %) (1)
46 ▪ Market - driven strategy focused on segments poised for strong growth ▪ Deep customer collaboration supported by technical expertise ▪ Long - term customer relationships; often more than 20 years ▪ High degree of customer diversity; top 10 make up approximately 43 percent of sales… next 100 make up next approximately 37 percent ▪ Small cost relative to end - product value Investment Highlights – Performance Chemicals Source: Company information and Form 10 46

Business Wrap - Up 47
48 ▪ Well - established, specialty chemicals business with a 100 - year history of innovation ▪ Collaborative customer relationships and end - market technical expertise drive the creation of high - value products and technologies that account for approximately 85 percent of revenues ▪ High - margin business that has averaged greater than 20 percent combined adjusted EBITDA margins (1) over the past six years ▪ Top quartile performer among peer specialty chemicals players with 22 percent return on assets ▪ Spin - off provides strategic flexibility and resources to pursue multiple organic and inorganic avenues of growth Investment Highlights Source: Company information and Form 10 Note: (1) Please see appendices included at the end of this presentation for Ingevity's use of non - GAAP financial measures, definitions of those financial measures as well as the reconciliation to the nearest GAAP financial measure 48
Financial Overview John Fortson EVP, Chief Financial Officer 49
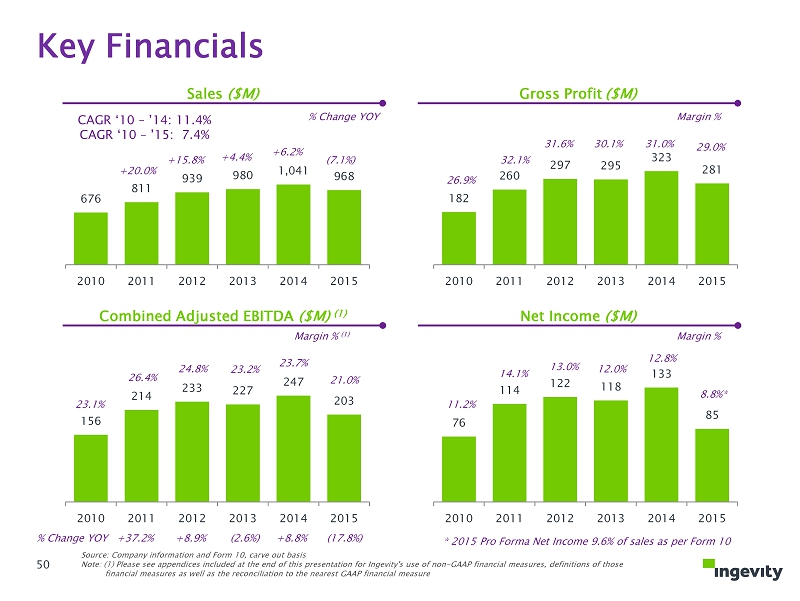
676 811 939 980 1,041 968 2010 2011 2012 2013 2014 2015 156 214 233 227 247 203 2010 2011 2012 2013 2014 2015 182 260 297 295 323 281 2010 2011 2012 2013 2014 2015 76 114 122 118 133 85 2010 2011 2012 2013 2014 2015 Source: Company information and Form 10, carve out basis Note: (1) Please see appendices included at the end of this presentation for Ingevity's use of non - GAAP financial measures, definitions of those financial measures as well as the reconciliation to the nearest GAAP financial measure Sales ($M) Gross Profit ($M) Combined Adjusted EBITDA ($M) (1) Net Income ($M) Key Financials CAGR ‘10 – ’14: 11.4% CAGR ‘10 – ’15: 7.4% +20.0% +4.4% +6.2% +15.8% (7.1%) % Change YOY Margin % 26.9% 30.1% 31.0% 31.6% 29.0% 32.1% Margin % 11.2% 12.0% 12.8% 13.0% 8.8%* 14.1% * 2015 Pro Forma Net Income 9.6% of sales as per Form 10 % Change YOY +37.2% (2.6%) +8.8% +8.9% (17.8%) Margin % (1) 23.1% 23.2% 23.7% 24.8% 21.0% 26.4% 50
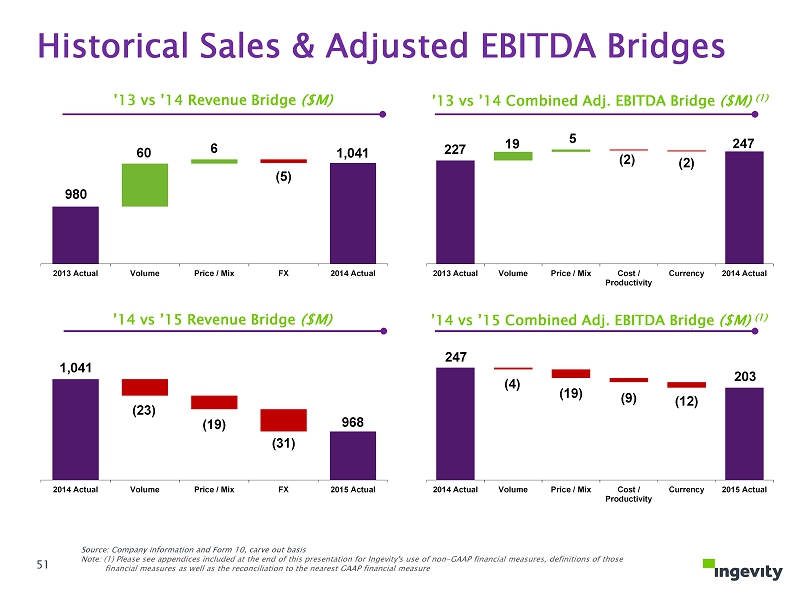
1,041 968 (23) (19) (31) 2014 Actual Volume Price / Mix FX 2015 Actual '14 vs '15 Revenue Bridge ($M) 980 1,041 60 6 (5) 2013 Actual Volume Price / Mix FX 2014 Actual '13 vs '14 Revenue Bridge ($M) 227 247 19 5 (2) (2) 2013 Actual Volume Price / Mix Cost / Productivity Currency 2014 Actual '13 vs '14 Combined Adj. EBITDA Bridge ($M) 247 203 (4) (19) (9) (12) 2014 Actual Volume Price / Mix Cost / Productivity Currency 2015 Actual '14 vs '15 Combined Adj. EBITDA Bridge ($M) Historical Sales & Adjusted EBITDA Bridges Source: Company information and Form 10, carve out basis Note: (1) Please see appendices included at the end of this presentation for Ingevity's use of non - GAAP financial measures, definitions of those financial measures as well as the reconciliation to the nearest GAAP financial measure 51 ’13 vs ’14 Revenue Bridge ($M) ’13 vs ’14 Combined Adj. EBITDA Bridge ($M) (1) ’14 vs ’15 Revenue Bridge ($M) ’14 vs ’15 Combined Adj. EBITDA Bridge ($M) (1)
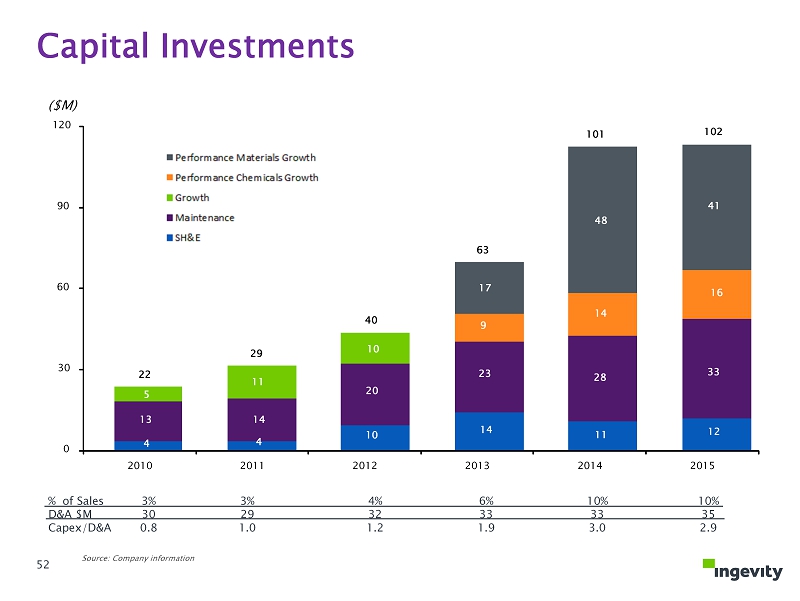
% of Sales D&A $M Capex /D&A 3% 30 0.8 3% 29 1.0 4% 32 1.2 6% 33 1.9 10% 33 3.0 10% 35 2.9 Capital Investments Source: Company information 22 29 40 63 101 102 0 30 60 90 120 2010 2011 2012 2013 2014 2015 10 20 10 28 23 14 48 17 11 41 33 12 ($M) 4 14 11 4 13 5 9 14 16 52
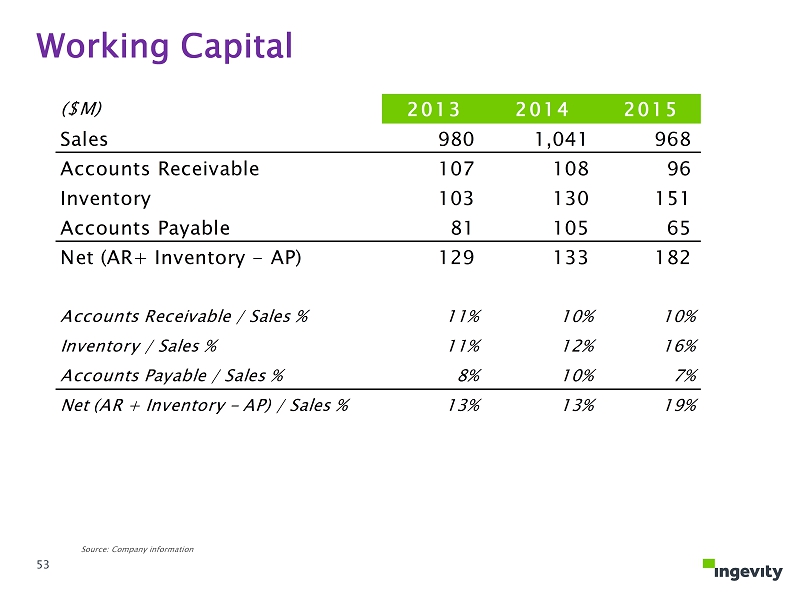
Working Capital ($M) 2013 2014 2015 Sales 980 1,041 968 Accounts Receivable 107 108 96 Inventory 103 130 151 Accounts Payable 81 105 65 Net (AR+ Inventory - AP) 129 133 182 Accounts Receivable / Sales % 11% 10% 10% Inventory / Sales % 11% 12% 16% Accounts Payable / Sales % 8% 10% 7% Net (AR + Inventory - AP) / Sales % 13% 13% 19% Source: Company information 53
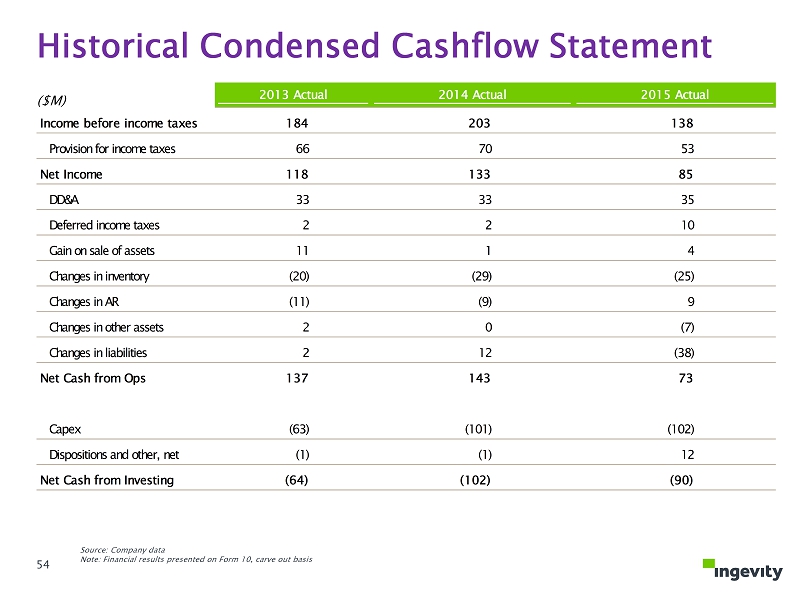
Historical Condensed Cashflow Statement 2013 Actual 2014 Actual 2015 Actual Income before income taxes 184 203 138 Provision for income taxes 66 70 53 Net Income 118 133 85 DD&A 33 33 35 Deferred income taxes 2 2 10 Gain on sale of assets 11 1 4 Changes in inventory (20) (29) (25) Changes in AR (11) (9) 9 Changes in other assets 2 0 (7) Changes in liabilities 2 12 (38) Net Cash from Ops 137 143 73 Capex (63) (101) (102) Dispositions and other, net (1) (1) 12 Net Cash from Investing (64) (102) (90) Source: Company data Note: Financial results presented on Form 10, carve out basis ($M) 54
▪ Conservative capital structure to maintain financial and strategic flexibility ▪ Initial leverage ratio of 2.5x (1) ▪ Termed debt to broaden maturity profile ▪ Working capital efficiency Capital Structure Allows Flexibility for Focused, Returns Driven Growth Financial Objectives Leverage ratio per the Form 10 Pro Forma: (Long Term Debt – Cash & Cash Equivalents – Restricted Cash) / (Pro Forma Combined Adjusted EBITDA) or ($581M - $15M - $80M) / ( $192M) Note: Please see appendices included at the end of this presentation for Ingevity's use of non - GAAP financial measures, definitions of those financial measures as well as the reconciliation to the nearest GAAP financial measure (1) See Slide 56 for Leverage Ratio calculation and definition 55
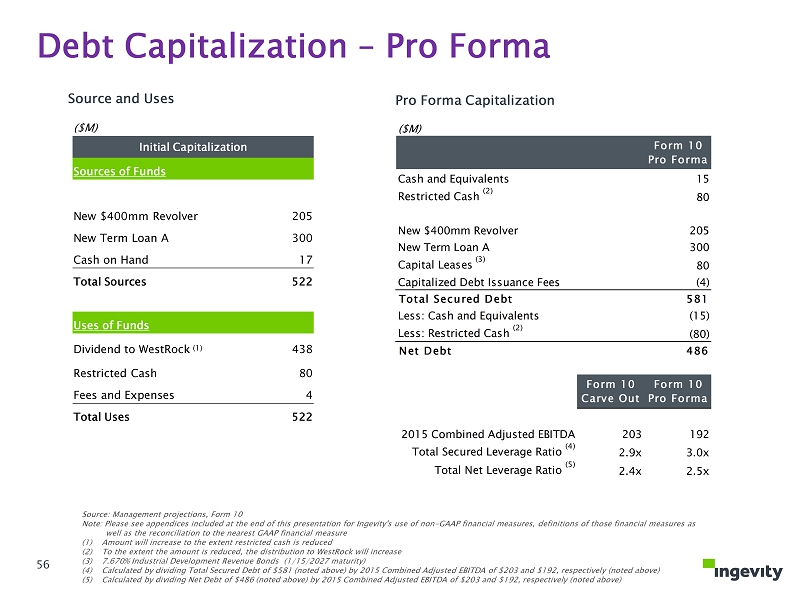
Source and Uses Pro Forma Capitalization Source: Management projections, Form 10 Note: Please see appendices included at the end of this presentation for Ingevity's use of non - GAAP financial measures, definitions of those financial measures as well as the reconciliation to the nearest GAAP financial measure (1) Amount will increase to the extent restricted cash is reduced (2) To the extent the amount is reduced, the distribution to WestRock will increase (3) 7.670% Industrial Development Revenue Bonds (1/15/2027 maturity ) (4) Calculated by dividing Total Secured Debt of $581 (noted above) by 2015 Combined Adjusted EBITDA of $203 and $192, respective ly (noted above) (5) Calculated by dividing Net Debt of $486 (noted above) by 2015 Combined Adjusted EBITDA of $203 and $192, respectively (noted abo ve) Debt Capitalization – Pro Forma 56 ($M) Cash and Equivalents 15 Restricted Cash (2) 80 New $400mm Revolver 205 New Term Loan A 300 Capital Leases (3) 80 Capitalized Debt Issuance Fees (4) Total Secured Debt 581 Less: Cash and Equivalents (15) Less: Restricted Cash (2) (80) Net Debt 486 2015 Combined Adjusted EBITDA 203 192 Total Secured Leverage Ratio (4) 2.9x 3.0x Total Net Leverage Ratio (5) 2.4x 2.5x Form 10 Pro Forma Form 10 Pro Forma Form 10 Carve Out ($M) Initial Capitalization Sources of Funds New $400mm Revolver 205 New Term Loan A 300 Cash on Hand 17 Total Sources 522 Uses of Funds Dividend to WestRock (1) 438 Restricted Cash 80 Fees and Expenses 4 Total Uses 522
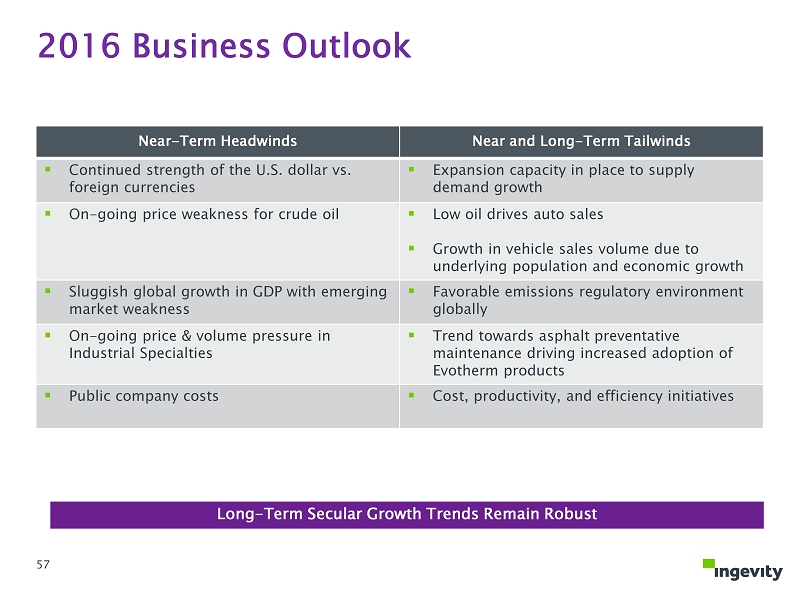
Near - Term Headwinds Near and Long - Term Tailwinds ▪ Continued strength of the U.S. dollar vs. foreign currencies ▪ Expansion capacity in place to supply demand growth ▪ On - going price weakness for crude oil ▪ Low oil drives auto sales ▪ Growth in vehicle sales volume due to underlying population and economic growth ▪ Sluggish global growth in GDP with emerging market weakness ▪ Favorable emissions regulatory environment globally ▪ On - going price & volume pressure in Industrial Specialties ▪ Trend towards asphalt preventative maintenance driving increased adoption of Evotherm products ▪ Public company costs ▪ Cost, productivity, and efficiency initiatives Long - Term Secular Growth Trends Remain Robust 2016 Business Outlook 57
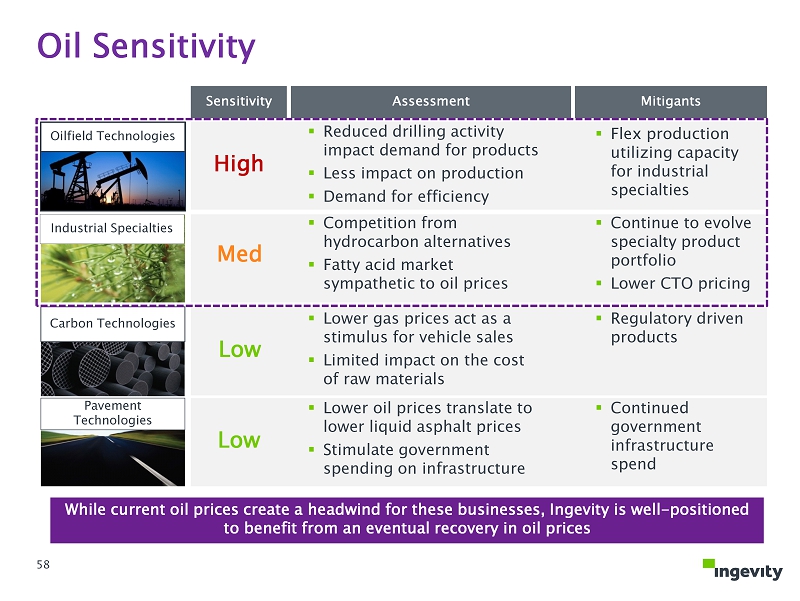
Oil Sensitivity Carbon Technologies Pavement Technologies ▪ Lower gas prices act as a stimulus for vehicle sales ▪ Limited impact on the cost of raw materials ▪ Lower oil prices translate to lower liquid asphalt prices ▪ Stimulate government spending on infrastructure Sensitivity Assessment Mitigants ▪ Continued government infrastructure spend ▪ Regulatory driven products While current oil prices create a headwind for these businesses, Ingevity is well - positioned to benefit from an eventual recovery in oil prices Oilfield Technologies High ▪ Competition from hydrocarbon alternatives ▪ Fatty acid market sympathetic to oil prices ▪ Continue to evolve specialty product portfolio ▪ Lower CTO pricing Low Low 58 ▪ Reduced drilling activity impact demand for products ▪ Less impact on production ▪ Demand for efficiency ▪ Flex production utilizing capacity for industrial specialties Med Industrial Specialties
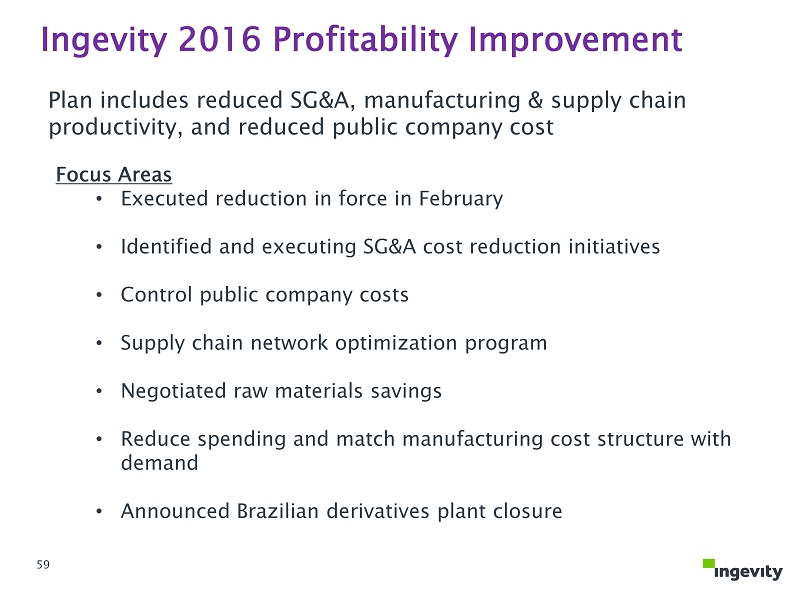
59 Ingevity 2016 Profitability Improvement Focus Areas • Executed reduction in force in February • Identified and executing SG&A cost reduction initiatives • Control public company costs • Supply chain n etwork optimization program • Negotiated raw materials savings • Reduce spending and match manufacturing cost structure with demand • Announced Brazilian derivatives plant closure Plan includes reduced SG&A, manufacturing & supply chain productivity, and reduced public company cost
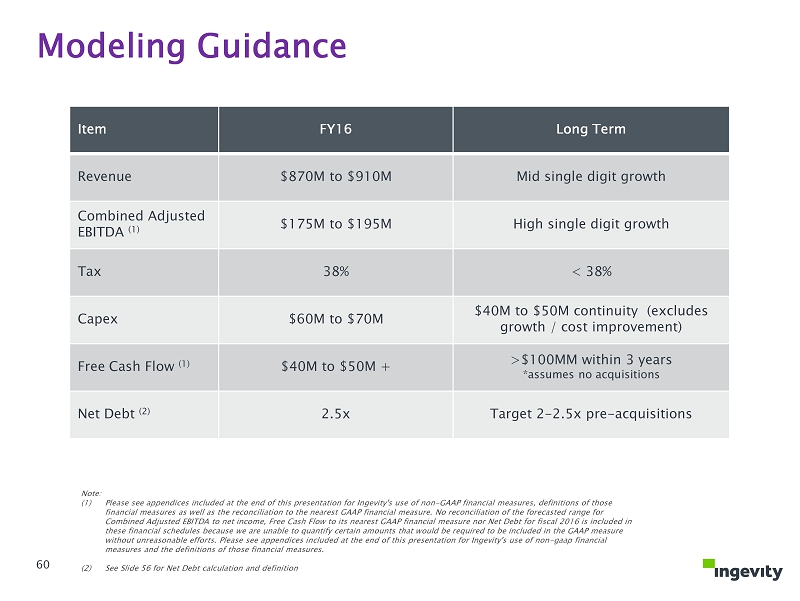
Item FY16 Long Term Revenue $870 M to $910M Mid single digit growth Combined Adjusted EBITDA (1) $175M to $195M High single digit growth Tax 38% < 38% Capex $60M to $70M $40M to $50 M continuity (excludes growth / cost improvement) Free Cash Flow (1) $40M to $50M + >$100MM within 3 years *assumes no acquisitions Net Debt (2) 2.5x Target 2 - 2.5x pre - acquisitions Modeling Guidance 60 Note: (1) Please see appendices included at the end of this presentation for Ingevity's use of non - GAAP financial measures, definitions of those financial measures as well as the reconciliation to the nearest GAAP financial measure. No reconciliation of the forecasted range for Combined Adjusted EBITDA to net income, Free Cash Flow to its nearest GAAP financial measure nor Net Debt for fiscal 2016 is inc luded in these financial schedules because we are unable to quantify certain amounts that would be required to be included in the GAAP me asure without unreasonable efforts. Please see appendices included at the end of this presentation for Ingevity's use of non - gaap financial measures and the definitions of those financial measures. (2) See Slide 56 for Net Debt calculation and definition

Q&A 61
Michael Wilson – President and Chief Executive Officer Mr. Wilson joined Ingevity in September 2015 from Albemarle Corporation, where he was executive vice president and president of their Performance Chemicals business. Michael served as president of Albemarle’s Catalyst Solutions business from 2013 through 2014. From 1997 to 2013, Michael held a number of business unit leadership roles with FMC Corporation, including group head of Industrial Chemicals from 2003 to 2010 and president of the Specialty Chemicals group from 2011 to 2013. John Fortson – EVP and Chief Financial Officer Mr. Fortson came to Ingevity from AAR Corporation where he previously served as vice president, Finance since May 2013, and became vice president, chief financial officer and treasurer in July 2013. Prior to joining AAR Corporation, Mr. Fortson was a managing director in the Investment Banking Department of Bank of America Merrill Lynch working in the firm’s New York, London and Chicago offices. Ed Rose – EVP and President, Performance Chemicals Mr. Rose served as president of MWV Specialty Chemicals, now WestRock , from 2010 to 2015, and vice president, Resins Polymers and Coatings, from 2004 to 2009. Over 31 years with the company, Ed has led teams in business development, including new product development, bolt - on acquisitions and strategic alliances. He has held various roles as development engineer, national sales manager, business development manager, industry manager, marketing manager and group manager. Q&A Ed Woodcock – SVP and President, Performance Materials Mr. Woodcock served as vice president of Carbon Technologies for MWV Specialty Chemicals, now WestRock. He has held various roles during his extensive career with the company, including global business director, automotive business director, worldwide marketing manager for chemical d ivision’s non - US business, area sales manager for Latin America and technical manager for Carbon team’s process technology group. Source: Company information 62

Appendix 63

Non - GAAP Financial Measures 64 Ingevity has presented certain financial measures, defined below, which have not been prepared in accordance with U.S. generally accepted accounting principles (“GAAP”) and has provided a reconciliation to the most directly comparable financial measure calculated in accordance with GAAP. These financial measures are not meant to be considered in isolation or as a substitute for the most directly comparable financial measure calculated in accordance with GAAP. The company believes these non - GAAP measures provide investors, potential investors, securities analysts and others with useful information to evaluate the performance of the business, because such measures, when viewed together with our financial results computed in accordance with GAAP, provide a more complete understanding of the factors and trends affecting our historical financial performance and projected future results. Ingevity uses the following non - GAAP measures: Combined Adjusted EBITDA, inclusive of pro forma adjustments, Segment EBITDA, inclusive of pro forma adjustments and Free Cash Flow. Combined Adjusted EBITDA is defined as net income plus provision for income taxes, interest expense, depreciation and amortization, separation costs and restructuring and other (income) charges. Segment EBITDA is defined as segment operating profit plus depreciation and amortization. Free Cash Flow is defined cash flow from operations less capital expenditures. These non - GAAP measures are not intended to replace the presentation of financial results in accordance with GAAP and investors should consider the limitations associated with these non - GAAP measures, including the potential lack of comparability of these measures from one company to another.
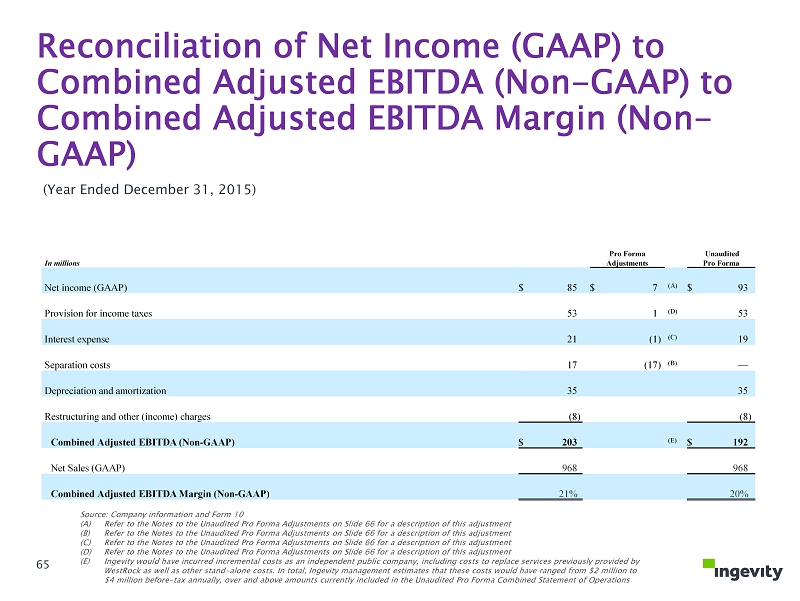
Reconciliation of Net Income (GAAP) to Combined Adjusted EBITDA (Non - GAAP) to Combined Adjusted EBITDA Margin (Non - GAAP) 65 (Year Ended December 31, 2015) In millions Pro Forma Adjustments Unaudited Pro Forma Net income (GAAP) $ 85 $ 7 (A) $ 93 Provision for income taxes 53 1 (D) 53 Interest expense 21 (1 ) (C) 19 Separation costs 17 (17 ) (B) — Depreciation and amortization 35 35 Restructuring and other (income) charges (8 ) (8 ) Combined Adjusted EBITDA (Non - GAAP) $ 203 (E) $ 192 Net Sales (GAAP) 968 968 Combined Adjusted EBITDA Margin (Non - GAAP) 21% 20% Source: Company information and Form 10 (A) Refer to the Notes to the Unaudited Pro Forma Adjustments on Slide 66 for a description of this adjustment (B) Refer to the Notes to the Unaudited Pro Forma Adjustments on Slide 66 for a description of this adjustment (C) Refer to the Notes to the Unaudited Pro Forma Adjustments on Slide 66 for a description of this adjustment (D) Refer to the Notes to the Unaudited Pro Forma Adjustments on Slide 66 for a description of this adjustment (E) Ingevity would have incurred incremental costs as an independent public company, including costs to replace services previously provid ed by WestRock as well as other stand - alone costs. In total, Ingevity management estimates that these costs would have ranged from $2 million to $4 million before - tax annually, over and above amounts currently included in the Unaudited Pro Forma Combined Statement of Opera tions
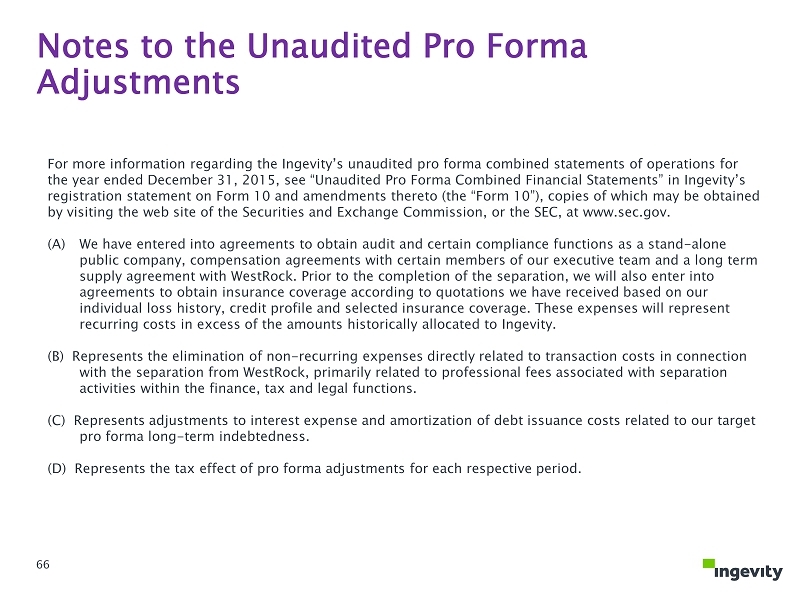
Notes to the Unaudited Pro Forma Adjustments 66 For more information regarding the Ingevity’s unaudited pro forma combined statements of operations for the year ended December 31, 2015, see “Unaudited Pro Forma Combined Financial Statements” in Ingevity’s registration statement on Form 10 and amendments thereto (the “Form 10”), copies of which may be obtained by visiting the web site of the Securities and Exchange Commission, or the SEC, at www.sec.gov. (A) We have entered into agreements to obtain audit and certain compliance functions as a stand - alone public company, compensation agreements with certain members of our executive team and a long term supply agreement with WestRock . Prior to the completion of the separation, we will also enter into agreements to obtain insurance coverage according to quotations we have received based on our individual loss history, credit profile and selected insurance coverage. These expenses will represent recurring costs in excess of the amounts historically allocated to Ingevity . (B) Represents the elimination of non - recurring expenses directly related to transaction costs in connection with the separation from WestRock , primarily related to professional fees associated with separation activities within the finance, tax and legal functions. (C) Represents adjustments to interest expense and amortization of debt issuance costs related to our target pro forma long - term indebtedness. (D) Represents the tax effect of pro forma adjustments for each respective period.

Reconciliation of Net Income (GAAP) to Combined Adjusted EBITDA (Non - GAAP) to Combined Adjusted EBITDA Margin (Non - GAAP) 67 In millions 2015 2014 2013 2012 2011 2010 Net income (GAAP) $ 85 $ 133 $ 118 $ 122 $ 114 $ 76 Provision for income taxes 53 70 66 67 59 38 Interest expense 21 16 13 12 12 12 Separation costs 17 — — — — — Depreciation and amortization 35 33 33 32 29 30 Restructuring and other (income) charges (8 ) (5 ) (3 ) — — — Combined Adjusted EBITDA (Non - GAAP) $ 203 $ 247 $ 227 $ 233 $ 214 $ 156 Net Sales (GAAP) $ 968 $ 1,041 $ 980 $ 939 $ 811 $ 676 Combined Adjusted EBITDA Margin (Non - GAAP) 21 % 24 % 23 % 25 % 26 % 23 % Source: Company information and Form 10
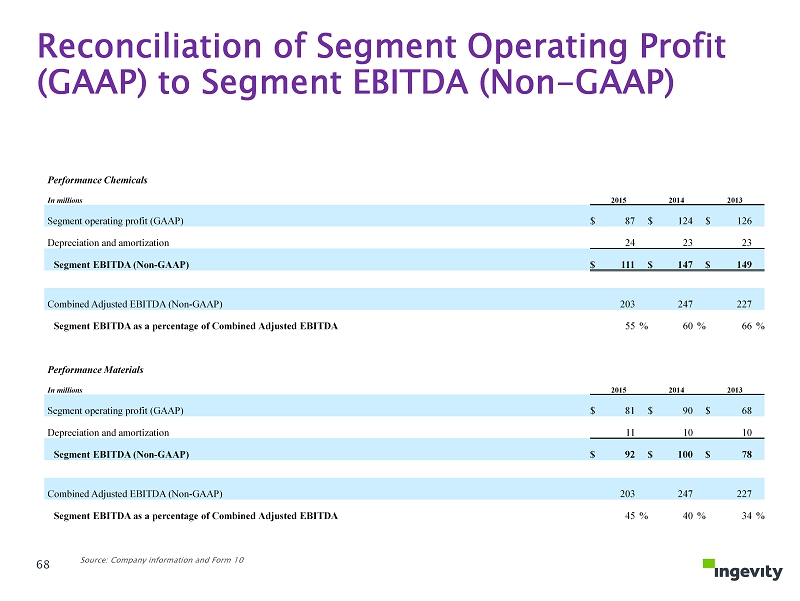
Reconciliation of Segment Operating Profit (GAAP) to Segment EBITDA (Non - GAAP) 68 Source: Company information and Form 10 Performance Chemicals In millions 2015 2014 2013 Segment operating profit (GAAP) $ 87 $ 124 $ 126 Depreciation and amortization 24 23 23 Segment EBITDA (Non - GAAP) $ 111 $ 147 $ 149 Combined Adjusted EBITDA (Non - GAAP) 203 247 227 Segment EBITDA as a percentage of Combined Adjusted EBITDA 55 % 60 % 66 % Performance Materials In millions 2015 2014 2013 Segment operating profit (GAAP) $ 81 $ 90 $ 68 Depreciation and amortization 11 10 10 Segment EBITDA (Non - GAAP) $ 92 $ 100 $ 78 Combined Adjusted EBITDA (Non - GAAP) 203 247 227 Segment EBITDA as a percentage of Combined Adjusted EBITDA 45 % 40 % 34 %
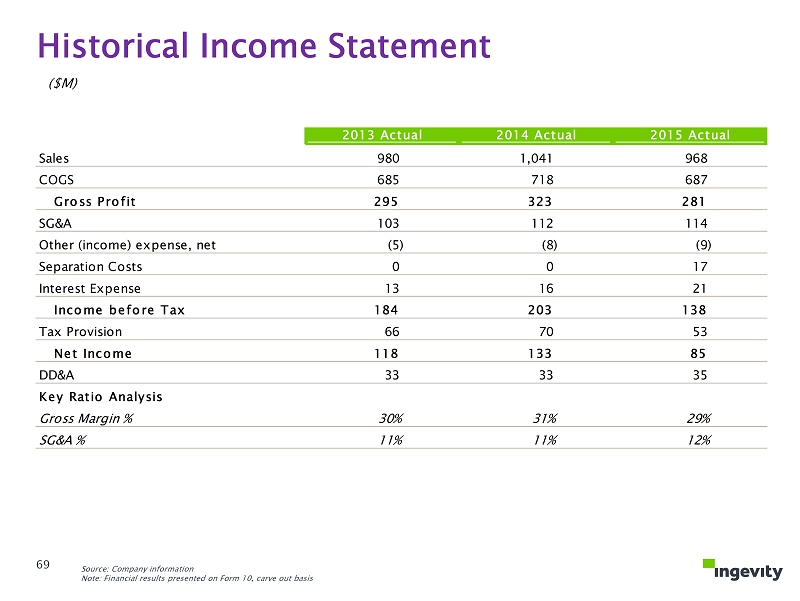
2013 Actual 2014 Actual 2015 Actual Sales 980 1,041 968 COGS 685 718 687 Gross Profit 295 323 281 SG&A 103 112 114 Other (income) expense, net (5) (8) (9) Separation Costs 0 0 17 Interest Expense 13 16 21 Income before Tax 184 203 138 Tax Provision 66 70 53 Net Income 118 133 85 DD&A 33 33 35 Key Ratio Analysis Gross Margin % 30% 31% 29% SG&A % 11% 11% 12% Historical Income Statement Source: Company information Note: Financial results presented on Form 10, carve out basis ($M) 69
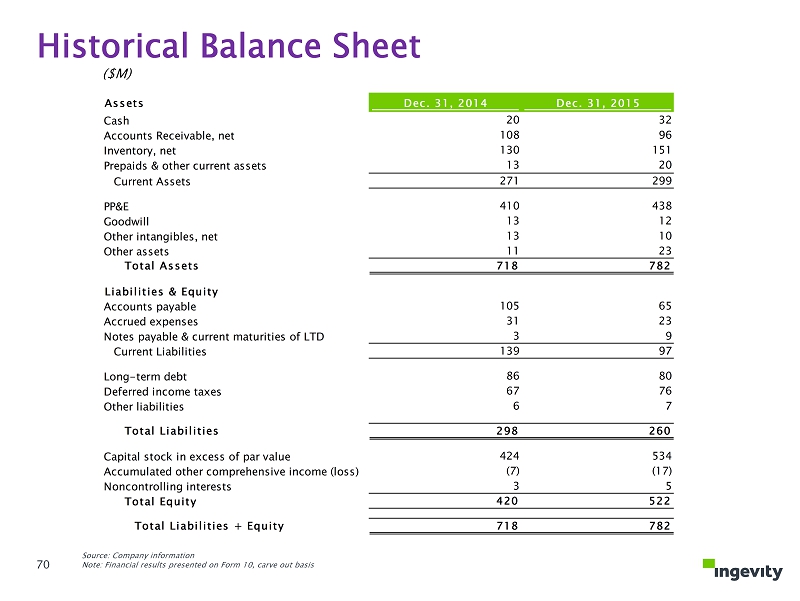
Historical Balance Sheet Source: Company information Note: Financial results presented on Form 10, carve out basis Assets Dec. 31, 2014 Dec. 31, 2015 Cash 20 32 Accounts Receivable, net 108 96 Inventory, net 130 151 Prepaids & other current assets 13 20 0 0 Current Assets 271 299 PP&E 410 438 Goodwill 13 12 Other intangibles, net 13 10 Other assets 11 23 Total Assets 718 782 Liabilities & Equity Accounts payable 105 65 Accrued expenses 31 23 Notes payable & current maturities of LTD 3 9 Current Liabilities 139 97 Long-term debt 86 80 Deferred income taxes 67 76 Other liabilities 6 7 Total Liabilities 298 260 Capital stock in excess of par value 424 534 Accumulated other comprehensive income (loss) (7) (17) Noncontrolling interests 3 5 Total Equity 420 522 Total Liabilities + Equity 718 782 ($M) 70