
SPY001 Phase 1 Results & Corporate Updates November 2024
2 Disclosures The information contained in this presentation has been prepared by Spyre Therapeutics, Inc. and its affiliates (“Spyre” or the “Company”) and contains information pertaining to the business and operations of the Company. The information contained in this presentation: (a) is provided as at the date hereof, is subject to change without notice, and is based on publicly available information, internally developed data as well as third party information from other sources; (b) does not purport to contain all the information that may be necessary or desirable to fully and accurately evaluate an investment in the Company; (c) is not to be considered as a recommendation by the Company that any person make an investment in the Company; (d) is for information purposes only and shall not constitute an offer to buy, sell, issue or subscribe for, or the solicitation of an offer to buy, sell or issue, or subscribe for any securities of the Company in any jurisdiction in which such offer, solicitation or sale would be unlawful. Where any opinion or belief is expressed in this presentation, it is based on certain assumptions and limitations and is an expression of present opinion or belief only. This presentation should not be construed as legal, financial or tax advice to any individual, as each individual’s circumstances are different. This document is for informational purposes only and should not be considered a solicitation or recommendation to purchase, sell or hold a security. Forward-Looking Information Certain information set forth in this presentation contains “forward-looking statements” within the meaning of applicable United States securities legislation. Except for statements of historical fact, certain information contained herein constitutes forward-looking statements which include but are not limited to statements regarding: our business strategy, including our ability to develop best-in-class therapeutics for IBD that meaningfully improve both efficacy and convenience compared to today’s standard of care, the SPY001 phase 1 trial final data readouts not being consistent with or being different than the interim Phase 1 results, the efficacy, safety and tolerability of SPY001 and our other product candidates, the planned induction and maintenance dosing regimen for SPY001 and our other product candidates, the potential for increased or accelerated efficacy, the therapeutic benefits of our product candidates as monotherapies or in combinations and their extended half-life, the expected design and timing of the platform Phase 2 trial, potential cost savings from the Phase 2 trial design, expected timing for regulatory feedback, estimated market size, the potential for a derisked dosing profile, expectations regarding our potential therapeutic combinations and the potential benefits thereof, and management’s assessment of future plans and operations which are based on current internal expectations, estimates, projections, assumptions and beliefs, which may prove to be incorrect. Forward-looking statements can often be identified by the use of words such as “may”, “will”, “could”, “would”, “anticipate”, ‘believe”, expect”, “intend”, “potential”, “estimate”, “scheduled”, “plans”, “planned”, “forecasts”, “goals” and similar expressions or the negatives thereof. Forward-looking statements are neither historical facts nor assurances of future performance. Forward-looking statements are based on a number of factors and assumptions made by management and considered reasonable at the time such information is provided, and forward-looking statements involve known and unknown risks, uncertainties and other factors that may cause the actual results, performance or achievements to be materially different from those expressed or implied by the forward-looking statements, including those uncertainties and factors described under the heading “Risk Factors,” “Risk Factor Summary” and “Note about Forward-Looking Statements” in the Company’s most recent Annual Report on Form 10-K, as supplemented and updated by subsequent Quarterly Reports on Form 10-Q and Current Reports on Form 8-K that the Company has filed or will file with the SEC, as well as discussions of potential risks, uncertainties, and other filings by the Company from time to time, as well as risk factors associated with companies that operate in the biopharma industry, including those associated with the uncertainties of drug development. All of the forward-looking statements made in this presentation are qualified by these cautionary statements and other cautionary statements or other factors contained herein. Although management believes that the expectations conveyed by forward-looking statements herein are reasonable based on information available on the date such forward-looking statements are made, there can be no assurance that forward looking statements will prove to be accurate, as actual results and future events could differ materially from those anticipated in such statements. The Company undertakes no obligation to update forward-looking statements if circumstances or management’s estimates or opinions should change except as required by applicable securities laws. The forward-looking statements contained herein are presented for the purposes of assisting readers in understanding the Company’s plan, objectives and goals and may not be appropriate for other purposes. The reader is cautioned not to place undue reliance on forward-looking statements. Industry Information This presentation also contains or references certain industry data that is based upon information from independent industry publications, market research, and surveys and other publicly available sources. Although the Company believes these sources to be generally reliable, such information is subject to interpretation and cannot be verified with complete certainty due to limits on the availability and reliability of data, the voluntary nature of the data gathering process and other inherent limitations and uncertainties. The Company has not independently verified any of the data from third party sources referred to in this presentation and accordingly, the Company makes no representation or warranty as to the origin, validity, accuracy, completeness, currency or reliability of the information in this presentation.
3 Agenda Introduction and Executive Summary Cameron Turtle, DPhil Chief Executive Officer SPY001 Phase 1 Interim Results Deanna Nguyen, MD SVP, Clinical Development Phase 2 Platform Trial in UC Sheldon Sloan, MD, MBE Chief Medical Officer Building the Leading IBD Portfolio Cameron Turtle, DPhil Chief Executive Officer Analyst Q&A Cameron Turtle, CEO Deanna Nguyen, SVP Sheldon Sloan, CMO Scott Burrows, CFO

4 Engineering for new heights in the treatment of IBD 1Spyre holds exclusive worldwide licensed rights for SPY001, SPY002, and SPY003 from Paragon Therapeutics, Inc. SPY003 license is restricted to IBD, all other program licenses are unrestricted as to indication. TARGET PROGRAM1 PRECLINICAL PHASE 1 PHASE 2 PHASE 3 α4β7 SPY001 TL1A SPY002 IL-23 SPY003 α4β7 + TL1A SPY120 α4β7 + IL-23 SPY130 TL1A + IL-23 SPY230 Phase 1 interim data delivered YE24 Phase 1 interim data expected 1H25 Phase 1 interim data expected 2H25 Next-generation monotherapies Paradigm-changing combinations Our approach Our pipeline
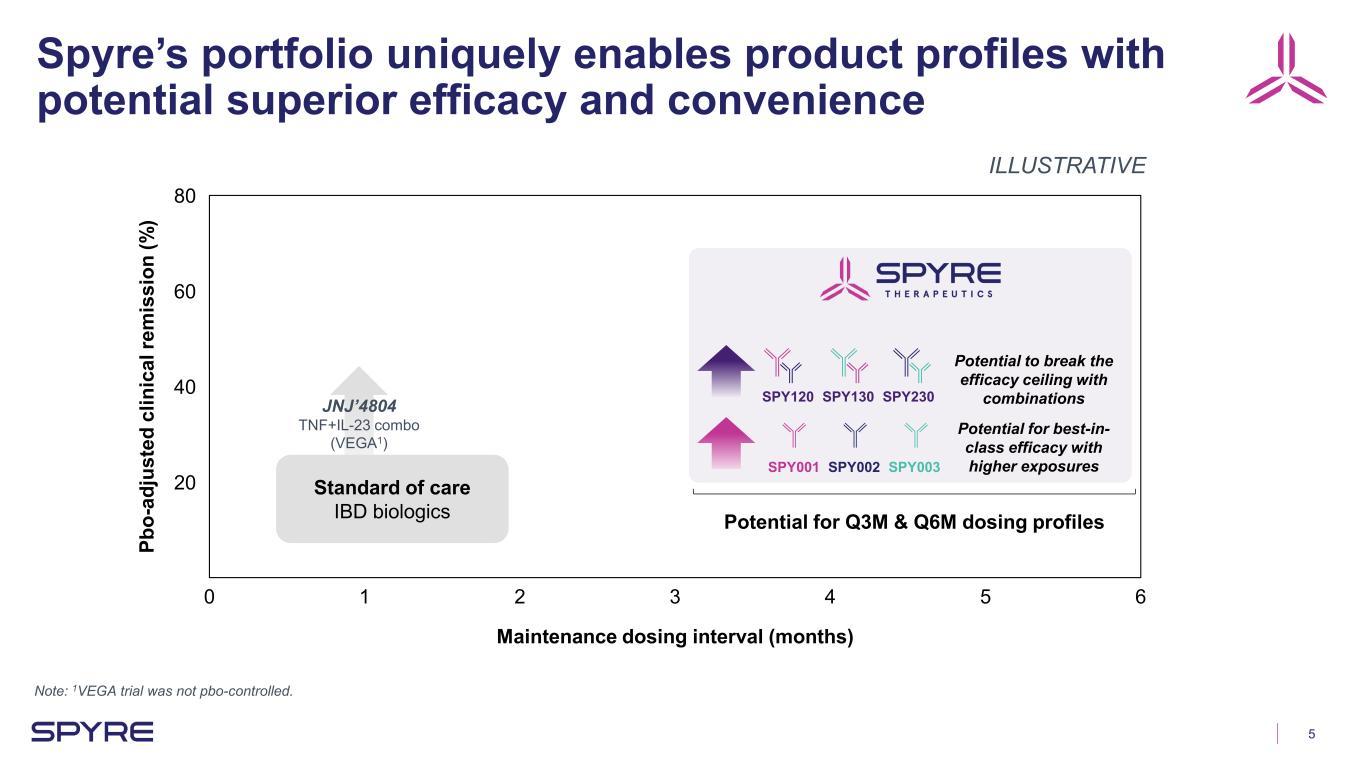
5 Spyre’s portfolio uniquely enables product profiles with potential superior efficacy and convenience Note: 1VEGA trial was not pbo-controlled. 0 1 2 3 4 5 6 20 40 60 80 Maintenance dosing interval (months) Pb o- ad ju st ed c lin ic al re m is si on (% ) Potential for Q3M & Q6M dosing profiles ILLUSTRATIVE SPY001 SPY002 SPY003 Potential to break the efficacy ceiling with combinationsSPY120 SPY130 SPY230 Potential for best-in- class efficacy with higher exposures Standard of care IBD biologics JNJ’4804 TNF+IL-23 combo (VEGA1)
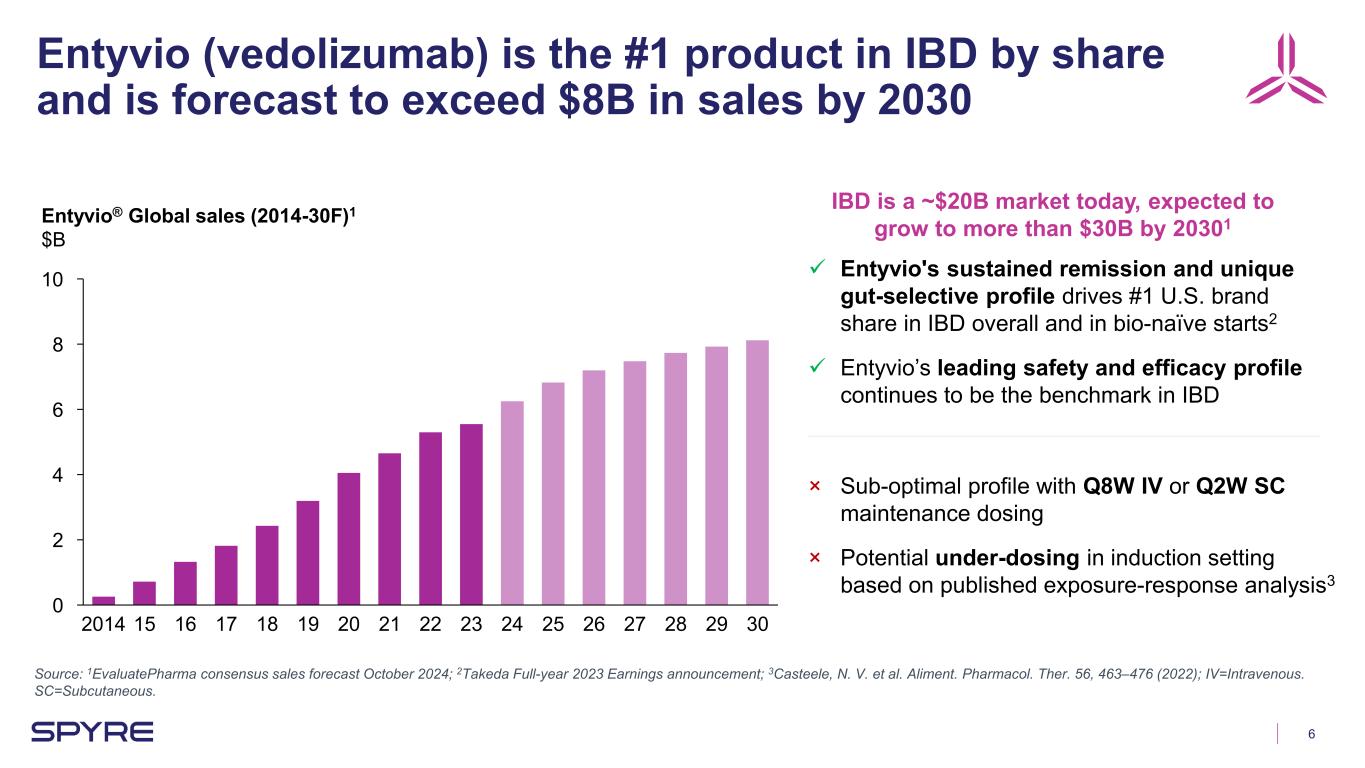
6 Entyvio (vedolizumab) is the #1 product in IBD by share and is forecast to exceed $8B in sales by 2030 Source: 1EvaluatePharma consensus sales forecast October 2024; 2Takeda Full-year 2023 Earnings announcement; 3Casteele, N. V. et al. Aliment. Pharmacol. Ther. 56, 463–476 (2022); IV=Intravenous. SC=Subcutaneous. 0 2 4 6 8 10 Entyvio® Global sales (2014-30F)1 $B 2014 15 16 17 18 19 20 21 22 23 24 25 26 27 28 29 30 Entyvio's sustained remission and unique gut-selective profile drives #1 U.S. brand share in IBD overall and in bio-naïve starts2 Entyvio’s leading safety and efficacy profile continues to be the benchmark in IBD × Sub-optimal profile with Q8W IV or Q2W SC maintenance dosing × Potential under-dosing in induction setting based on published exposure-response analysis3 IBD is a ~$20B market today, expected to grow to more than $30B by 20301

7 SPY001 is designed to be a next-generation α4β7 inhibitor Source: Data on file. Vedolizumab comparator refers to a mAb identical in sequence to vedolizumab synthesized by Spyre for research purposes. In NHP PK study, initial group size n=6 in NHP. Animals with suspected ADAs were excluded from half-life analysis; this did not impact the mouse study but resulted in n=5/cohort for SPY001 and n=3/cohort for vedolizumab at Day 49 of the NHP study. SPY001 and vedolizumab bind the same epitope of the α4β7 integrin SPY001 and vedolizumab potently inhibit MAdCAM-1 (gut) cellular adhesion SPY001 exhibits >3x the half-life of vedolizumab in NHPs SPY001 Vedolizumab 0.01 0.1 1 10 0 10 20 30 40 50 60 mAb Concentration (nM) % In hi bi tio n SPY001 t1/2 = ~22 days Vedolizumab t1/2 = ~6 days 0 7 14 21 28 35 42 49 1 10 100 1000 Days Se ru m C on c. ( μ g/ m L)α4 Subunit β7 Subunit SPY001 Epitope SPY001 is designed to match the validated biology of vedolizumab while optimizing its product profile
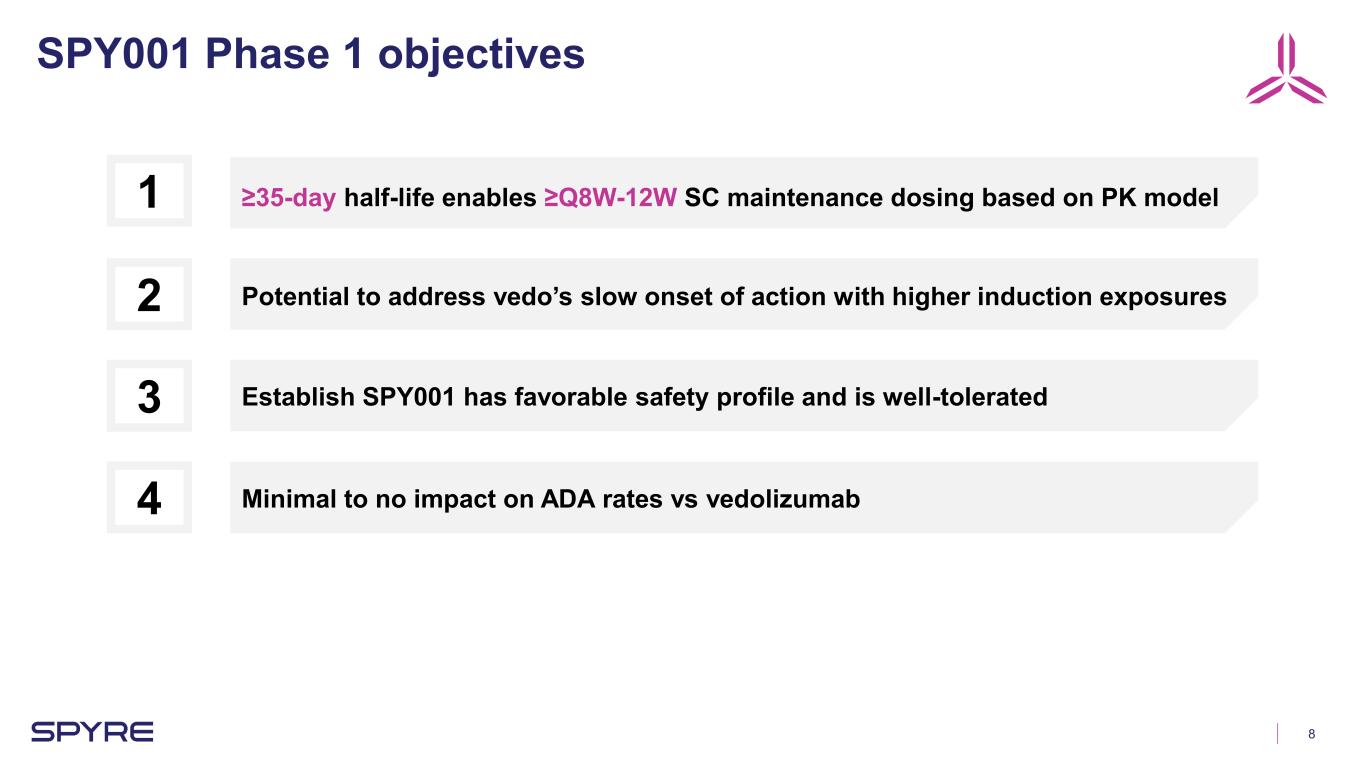
8 SPY001 Phase 1 objectives ≥35-day half-life enables ≥Q8W-12W SC maintenance dosing based on PK model1 Potential to address vedo’s slow onset of action with higher induction exposures2 Establish SPY001 has favorable safety profile and is well-tolerated3 Minimal to no impact on ADA rates vs vedolizumab4

9 SPY001 met or exceeded all Phase 1 objectives Note: 1ADA analysis pending, but no individual PK or PD profiles have been removed from the analysis due to apparent ADAs PK supports a planned Ph2 induction regimen with higher exposures vs vedo (targets all patients in quartile 4), potentially increasing induction efficacy SPY001 demonstrated a favorable safety profile and was well-tolerated No apparent impact of ADAs on PK or PD observed1 >90-day half-life far exceeds expectations and supports potential for both Q3M and Q6M SC maintenance dosing with a single injection SPY001 saturated α4β7 receptors after a single dose through ~12 weeks of available follow up, confirming expected target engagement+ SPY001 drug product improvements achieved with 180 mg/mL citrate free formulation, supporting infrequent dosing in a low volume injector+

Interim SPY001 Phase 1 results Deanna Nguyen, SVP of Clinical Development
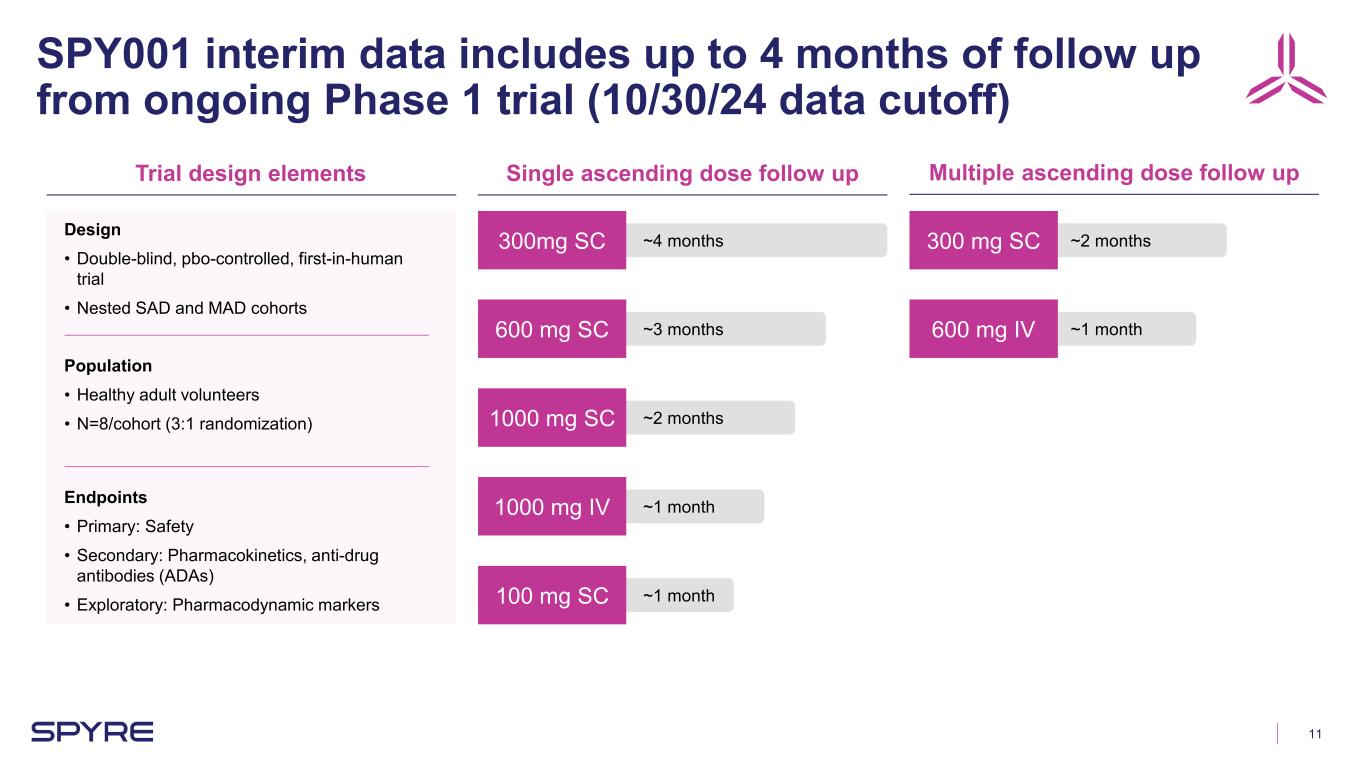
11 SPY001 interim data includes up to 4 months of follow up from ongoing Phase 1 trial (10/30/24 data cutoff) Trial design elements Single ascending dose follow up Multiple ascending dose follow up Design • Double-blind, pbo-controlled, first-in-human trial • Nested SAD and MAD cohorts Population • Healthy adult volunteers • N=8/cohort (3:1 randomization) Endpoints • Primary: Safety • Secondary: Pharmacokinetics, anti-drug antibodies (ADAs) • Exploratory: Pharmacodynamic markers 300mg SC 600 mg SC 1000 mg SC 1000 mg IV 100 mg SC 300 mg SC 600 mg IV ~1 month ~1 month ~2 months ~3 months ~4 months ~1 month ~2 months

12 Baseline demographics were well balanced across cohorts SD=standard deviation. 100 mg 300 mg 600 mg 1000 mg 1000 mg SAD Pooled 300 mg 600 mg MAD Pooled N= 8 8 8 8 8 40 8 8 16 Age, years Mean (SD) 52 (9) 46 (14) 54 (7) 40 (6) 36 (9) 46 (11) 45 (10) 38 (8) 41 (10) Female Percent 0% 13% 38% 25% 50% 25% 25% 13% 19% Weight, kg Mean (SD) 77 (8) 87 (17) 72 (17) 75 (9) 81 (9) 79 (13) 71 (12) 84 (10) 78 (13) BMI, kg/m2 Mean (SD) 26 (3) 27 (5) 25 (4) 26 (3) 28 (3) 26 (4) 24 (3) 28 (4) 26 (4)
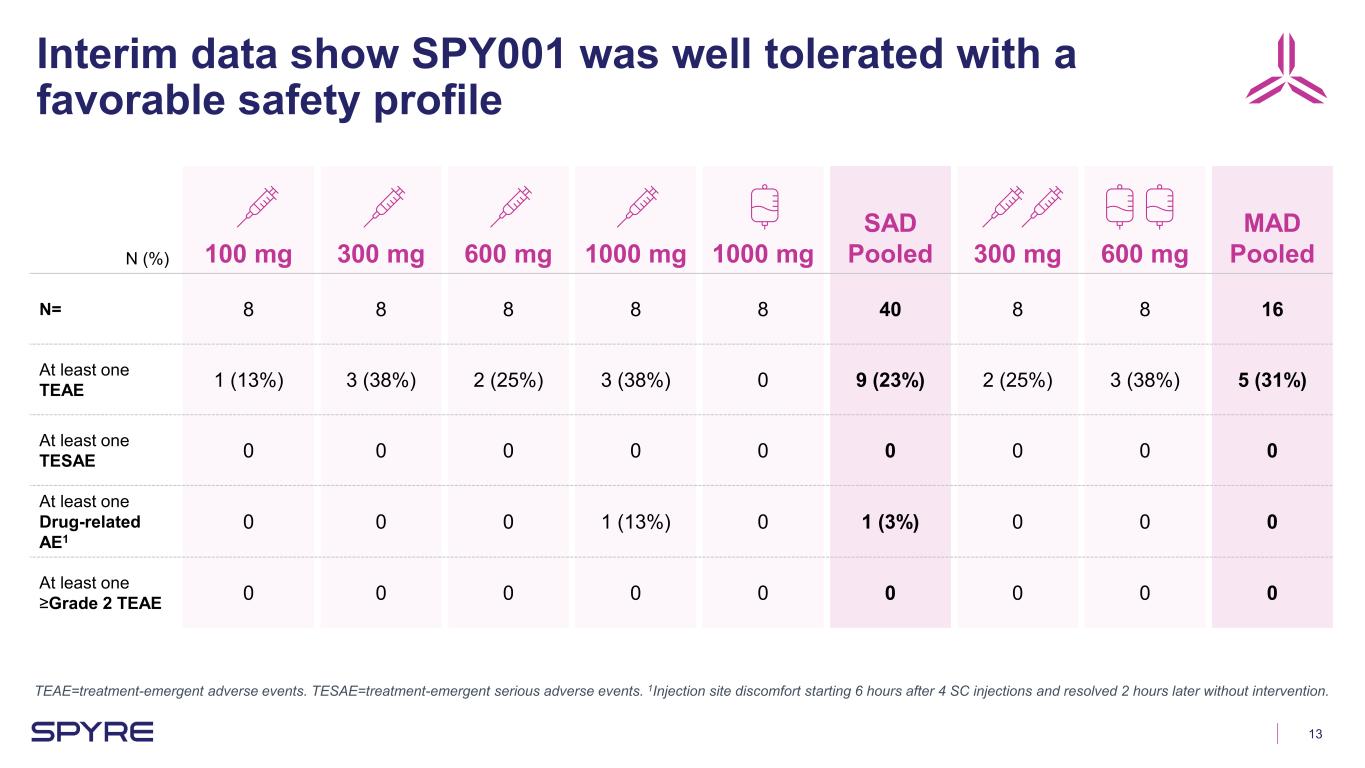
13 Interim data show SPY001 was well tolerated with a favorable safety profile TEAE=treatment-emergent adverse events. TESAE=treatment-emergent serious adverse events. 1Injection site discomfort starting 6 hours after 4 SC injections and resolved 2 hours later without intervention. N (%) 100 mg 300 mg 600 mg 1000 mg 1000 mg SAD Pooled 300 mg 600 mg MAD Pooled N= 8 8 8 8 8 40 8 8 16 At least one TEAE 1 (13%) 3 (38%) 2 (25%) 3 (38%) 0 9 (23%) 2 (25%) 3 (38%) 5 (31%) At least one TESAE 0 0 0 0 0 0 0 0 0 At least one Drug-related AE1 0 0 0 1 (13%) 0 1 (3%) 0 0 0 At least one ≥Grade 2 TEAE 0 0 0 0 0 0 0 0 0
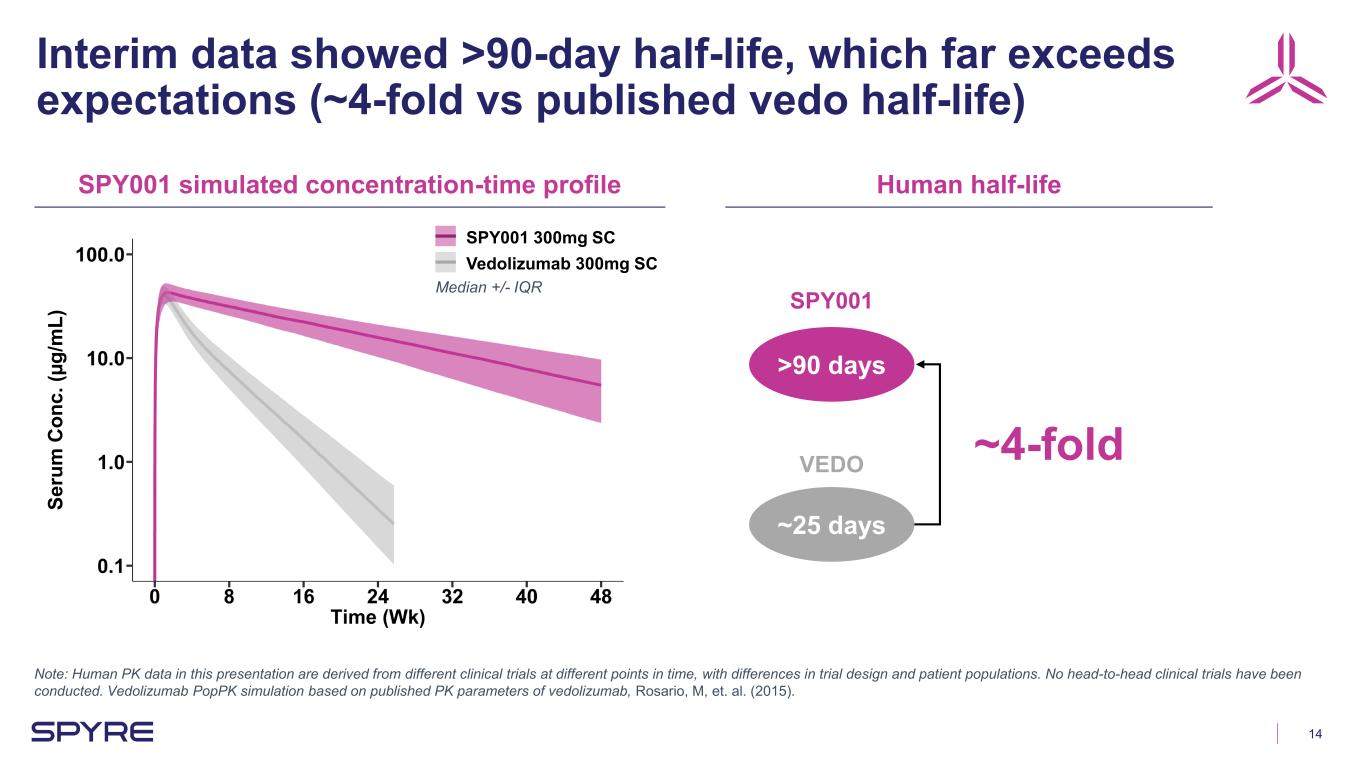
14 Interim data showed >90-day half-life, which far exceeds expectations (~4-fold vs published vedo half-life) Note: Human PK data in this presentation are derived from different clinical trials at different points in time, with differences in trial design and patient populations. No head-to-head clinical trials have been conducted. Vedolizumab PopPK simulation based on published PK parameters of vedolizumab, Rosario, M, et. al. (2015). >90 days ~25 days SPY001 simulated concentration-time profile Human half-life ~4-fold Se ru m C on c. (µ g/ m L) SPY001 300mg SC Vedolizumab 300mg SC SPY001 VEDO Median +/- IQR

15 SPY001 exhibits dose-proportional pharmacokinetics Note: 1Cohorts with sufficient follow up for dose proportionality assessment. SAD mean PK profiles MAD mean PK profiles Dose proportionality observed between 300 - 1000 mg1 Initial MAD PK consistent with SAD PK M ea n Se ru m C on c. (µ g/ m L) t1/2 = 91 days t1/2 > 100 days M ea n Se ru m C on c. (µ g/ m L)
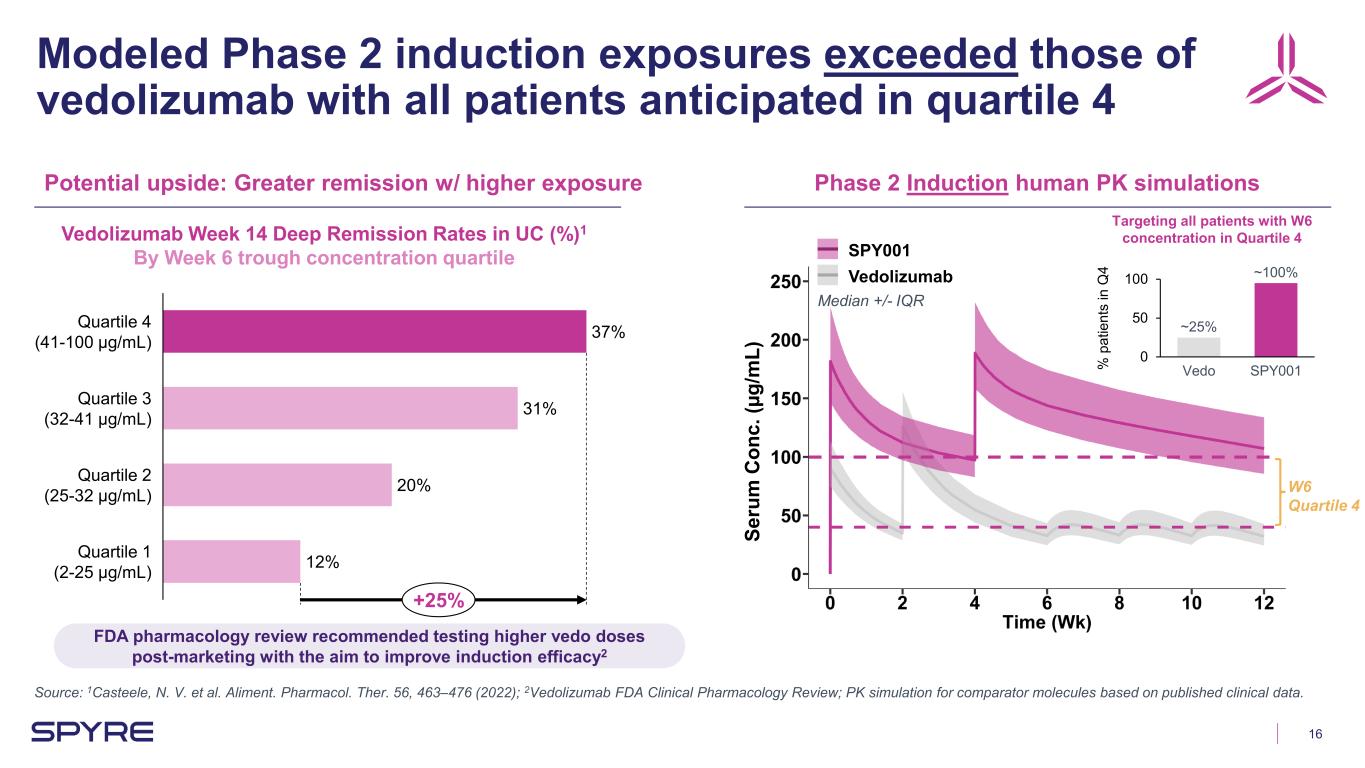
16 Modeled Phase 2 induction exposures exceeded those of vedolizumab with all patients anticipated in quartile 4 Source: 1Casteele, N. V. et al. Aliment. Pharmacol. Ther. 56, 463–476 (2022); 2Vedolizumab FDA Clinical Pharmacology Review; PK simulation for comparator molecules based on published clinical data. Potential upside: Greater remission w/ higher exposure Phase 2 Induction human PK simulations 37% 31% 20% 12% Quartile 4 (41-100 µg/mL) Quartile 3 (32-41 µg/mL) Quartile 2 (25-32 µg/mL) Quartile 1 (2-25 µg/mL) +25% Vedolizumab Week 14 Deep Remission Rates in UC (%)1 By Week 6 trough concentration quartile Se ru m C on c. (µ g/ m L) Targeting all patients with W6 concentration in Quartile 4 SPY001 Vedolizumab 0 50 100 % p at ie nt s in Q 4 Vedo SPY001 ~25% ~100% FDA pharmacology review recommended testing higher vedo doses post-marketing with the aim to improve induction efficacy2 W6 Quartile 4 Median +/- IQR
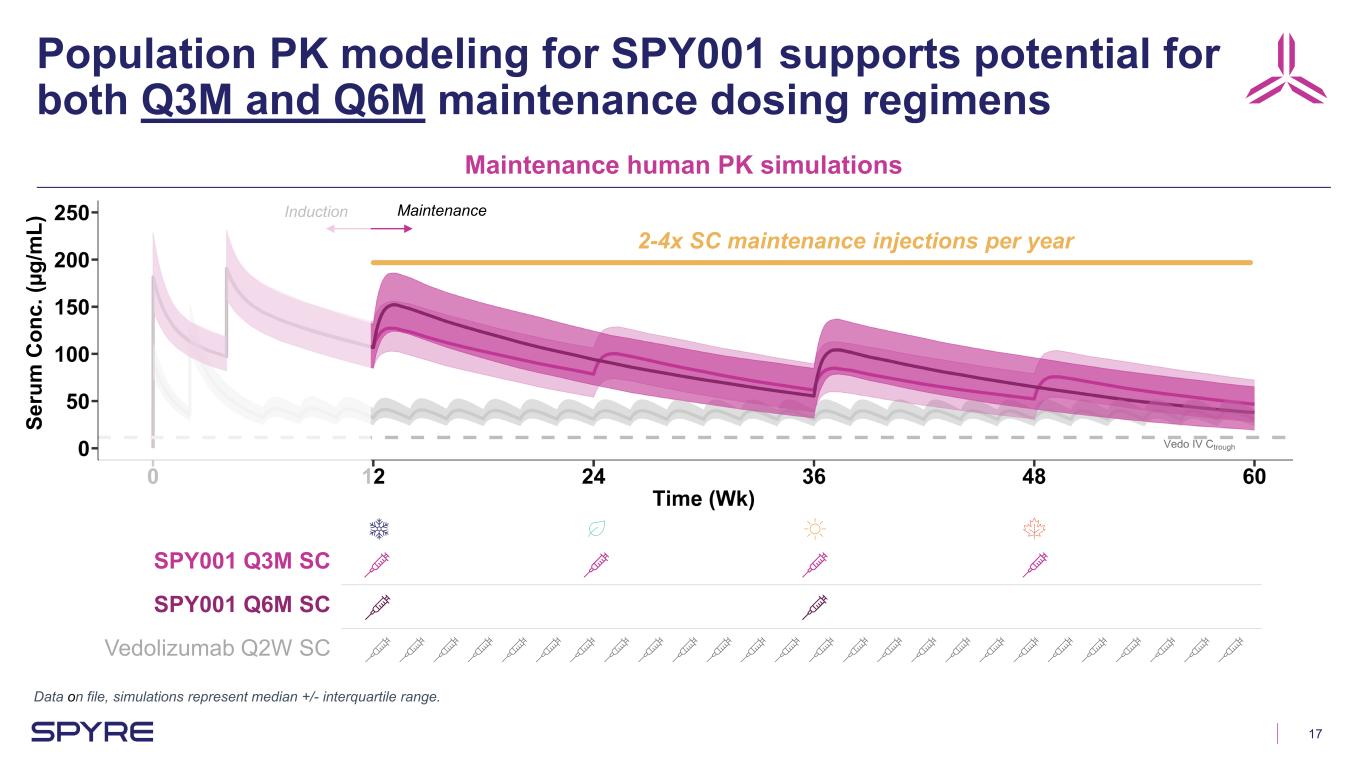
17 Se ru m C on c. (µ g/ m L) SPY001 Q3M SC SPY001 Q6M SC Vedolizumab Q2W SC Population PK modeling for SPY001 supports potential for both Q3M and Q6M maintenance dosing regimens Data on file, simulations represent median +/- interquartile range. Maintenance human PK simulations MaintenanceInduction 2-4x SC maintenance injections per year

18 SPY001 saturated α4β7 receptors through ~12-weeks of follow up after a single dose Notes: Data shown are Mean +/- SD for each cohort at each visit; pooled placebo. (n): Placebo (2-6), SPY001 300 mg SC (5-6), SPY001 600 mg SC (6), SPY001 1000 mg SC (6). Data have been slightly offset for visualization. % MAdCAM-1 Bound on CD4+ Memory T cells

19 SPY001 Phase 1 interim results summary (10/30/24 cutoff) Potential for increased or accelerated induction efficacy by targeting all patients in the 4th quartile of vedo’s reported E-R relationship Ph2 induction dosing to test higher exposures Potential for as little as twice-yearly maintenance dosing in a single SC injection compared to 26 yearly SC injections for vedo Half-life of >90 days, far exceeding expectations Favorable safety profile across all dose levelsSPY001 was well tolerated Single dose of SPY001 saturated α4β7 receptors through available 12 weeks of follow up (inhibition still ongoing) PD markers demonstrated target engagement
Platform Phase 2 trial in ulcerative colitis Sheldon Sloan, CMO
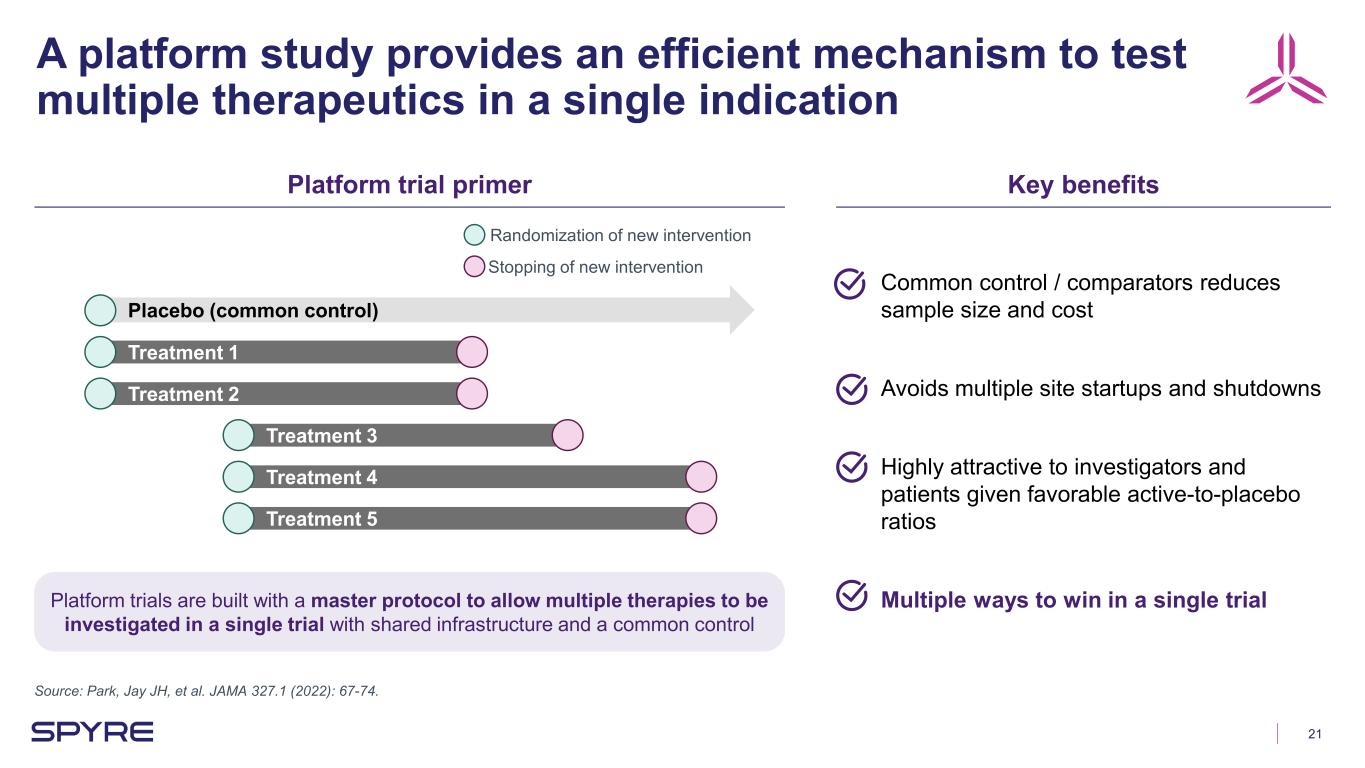
21 A platform study provides an efficient mechanism to test multiple therapeutics in a single indication Source: Park, Jay JH, et al. JAMA 327.1 (2022): 67-74. Platform trial primer Key benefits Placebo (common control) Treatment 1 Treatment 2 Treatment 3 Treatment 4 Treatment 5 Randomization of new intervention Stopping of new intervention Common control / comparators reduces sample size and cost Avoids multiple site startups and shutdowns Highly attractive to investigators and patients given favorable active-to-placebo ratios Multiple ways to win in a single trialPlatform trials are built with a master protocol to allow multiple therapies to be investigated in a single trial with shared infrastructure and a common control
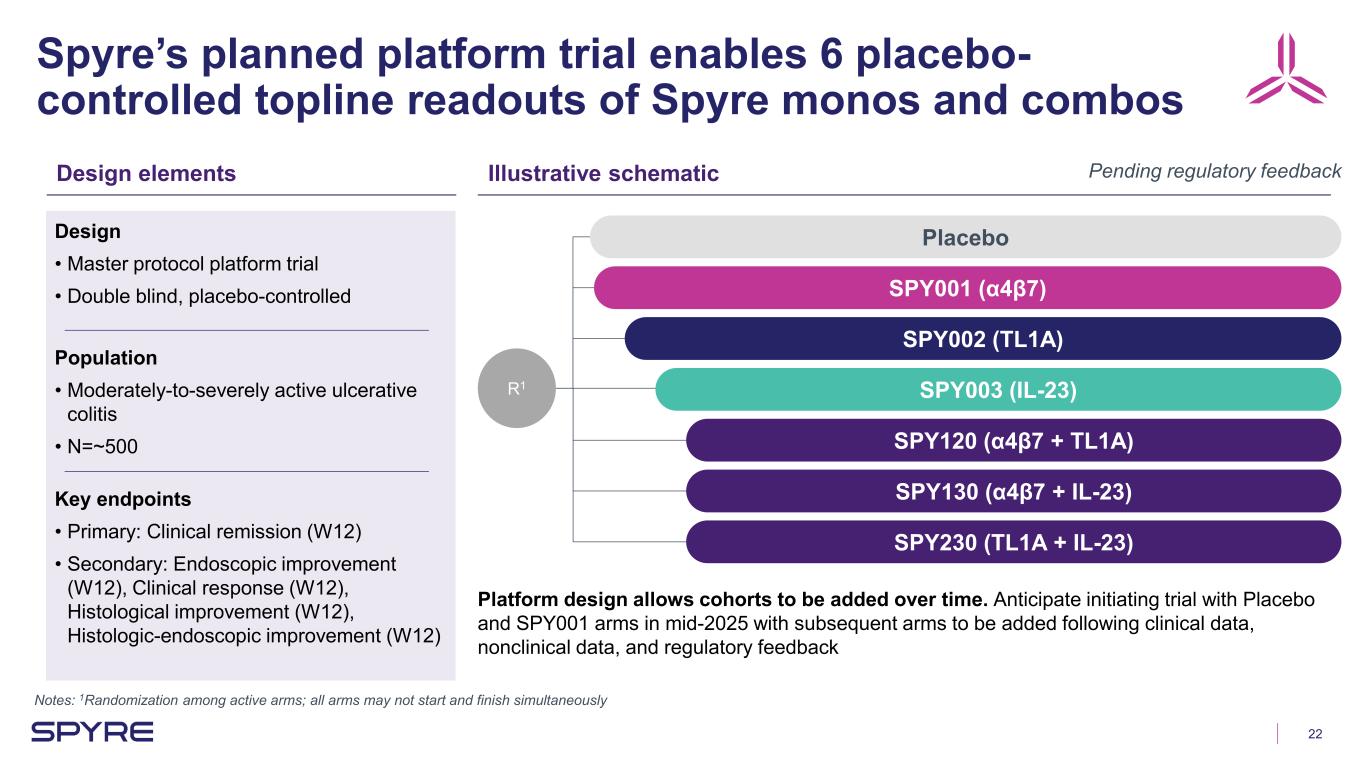
22 Spyre’s planned platform trial enables 6 placebo- controlled topline readouts of Spyre monos and combos Notes: 1Randomization among active arms; all arms may not start and finish simultaneously Design elements Illustrative schematic Design • Master protocol platform trial • Double blind, placebo-controlled Population • Moderately-to-severely active ulcerative colitis • N=~500 Key endpoints • Primary: Clinical remission (W12) • Secondary: Endoscopic improvement (W12), Clinical response (W12), Histological improvement (W12), Histologic-endoscopic improvement (W12) R1 Placebo SPY001 (α4β7) SPY002 (TL1A) SPY003 (IL-23) SPY120 (α4β7 + TL1A) SPY130 (α4β7 + IL-23) SPY230 (TL1A + IL-23) Pending regulatory feedback Platform design allows cohorts to be added over time. Anticipate initiating trial with Placebo and SPY001 arms in mid-2025 with subsequent arms to be added following clinical data, nonclinical data, and regulatory feedback
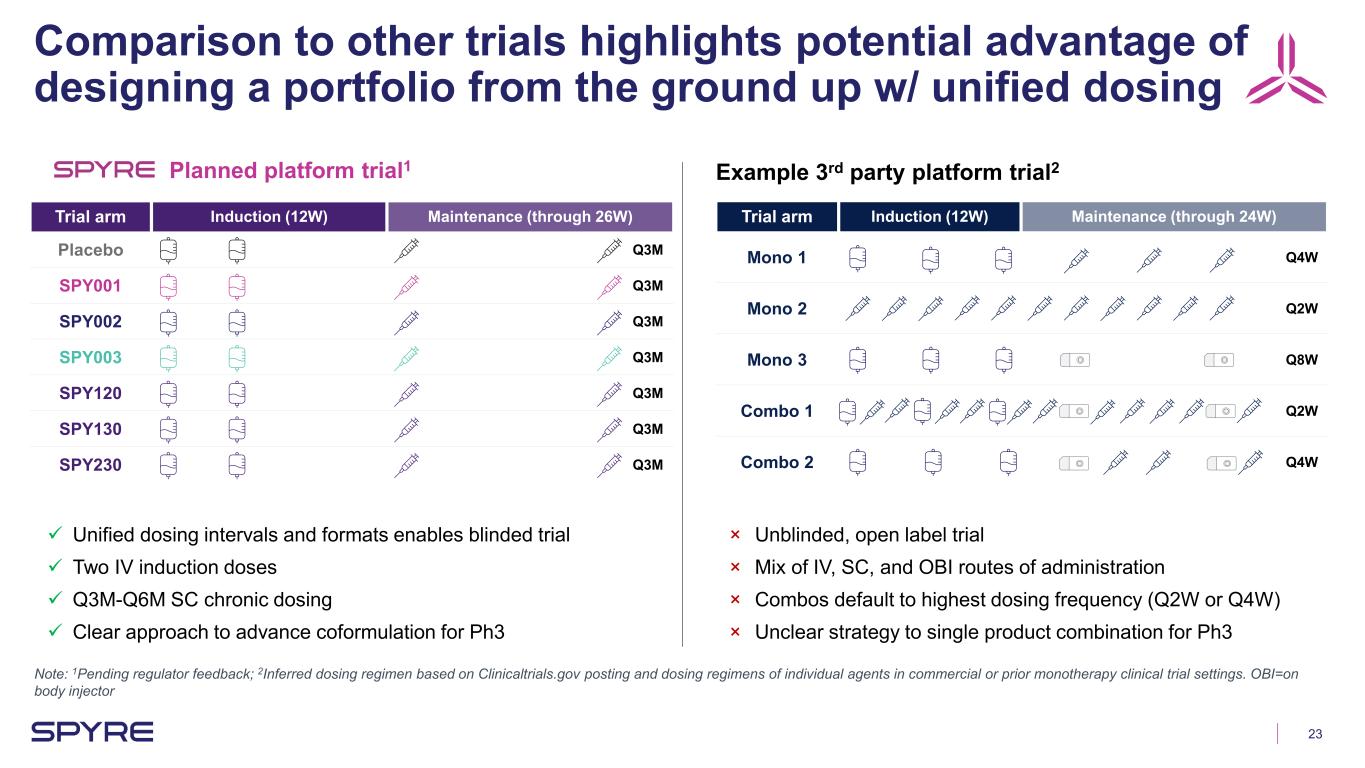
23 Comparison to other trials highlights potential advantage of designing a portfolio from the ground up w/ unified dosing Trial arm Induction (12W) Maintenance (through 26W) Placebo Q3M SPY001 Q3M SPY002 Q3M SPY003 Q3M SPY120 Q3M SPY130 Q3M SPY230 Q3M Unified dosing intervals and formats enables blinded trial Two IV induction doses Q3M-Q6M SC chronic dosing Clear approach to advance coformulation for Ph3 Trial arm Induction (12W) Maintenance (through 24W) Mono 1 Q4W Mono 2 Q2W Mono 3 Q8W Combo 1 Q2W Combo 2 Q4W × Unblinded, open label trial × Mix of IV, SC, and OBI routes of administration × Combos default to highest dosing frequency (Q2W or Q4W) × Unclear strategy to single product combination for Ph3 Example 3rd party platform trial2Planned platform trial1 Note: 1Pending regulator feedback; 2Inferred dosing regimen based on Clinicaltrials.gov posting and dosing regimens of individual agents in commercial or prior monotherapy clinical trial settings. OBI=on body injector

24 Platform design is attractive to patients and investigators with 6 ways to win at up to 40% lower cost 6 ways to win Including 3 optimized monotherapies & 3 paradigm-changing combinations Operational efficiency Up to 40% lower cost vs. individual Ph2 trials High enthusiasm With 3 combination arms and low placebo randomization rate 6 Startup activities underway with FPI anticipated in mid-2025, pending regulatory feedback

Building the Leading IBD Portfolio Cameron Turtle, CEO
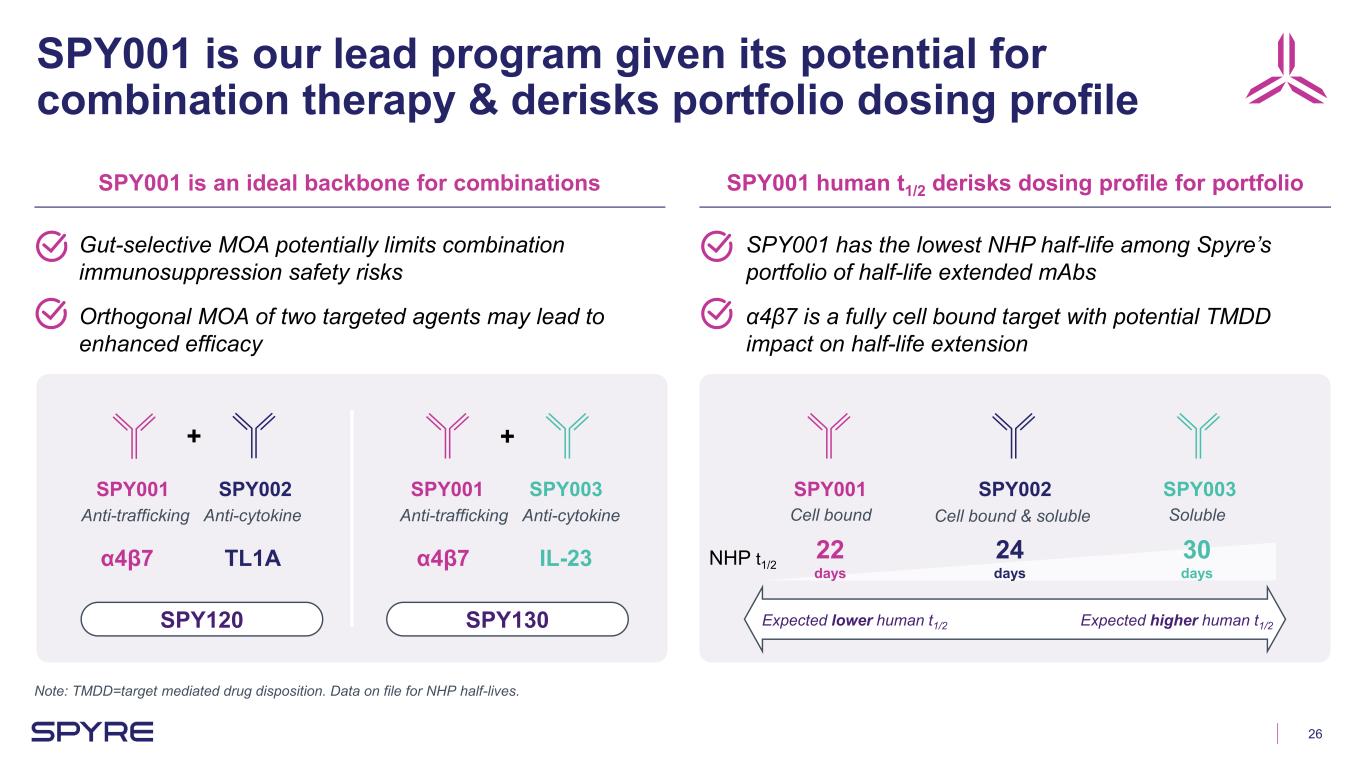
26 SPY001 is our lead program given its potential for combination therapy & derisks portfolio dosing profile Note: TMDD=target mediated drug disposition. Data on file for NHP half-lives. SPY001 is an ideal backbone for combinations SPY001 human t1/2 derisks dosing profile for portfolio Gut-selective MOA potentially limits combination immunosuppression safety risks Orthogonal MOA of two targeted agents may lead to enhanced efficacy SPY001 has the lowest NHP half-life among Spyre’s portfolio of half-life extended mAbs α4β7 is a fully cell bound target with potential TMDD impact on half-life extension SPY001 SPY002 SPY003 + SPY001 SPY002 SPY001 SPY003 + Anti-cytokineAnti-trafficking Anti-cytokineAnti-trafficking NHP t1/2 Cell bound Cell bound & soluble Soluble SPY120 SPY130 α4β7 α4β7TL1A IL-23 Expected lower human t1/2 Expected higher human t1/2 22 days 24 days 30 days
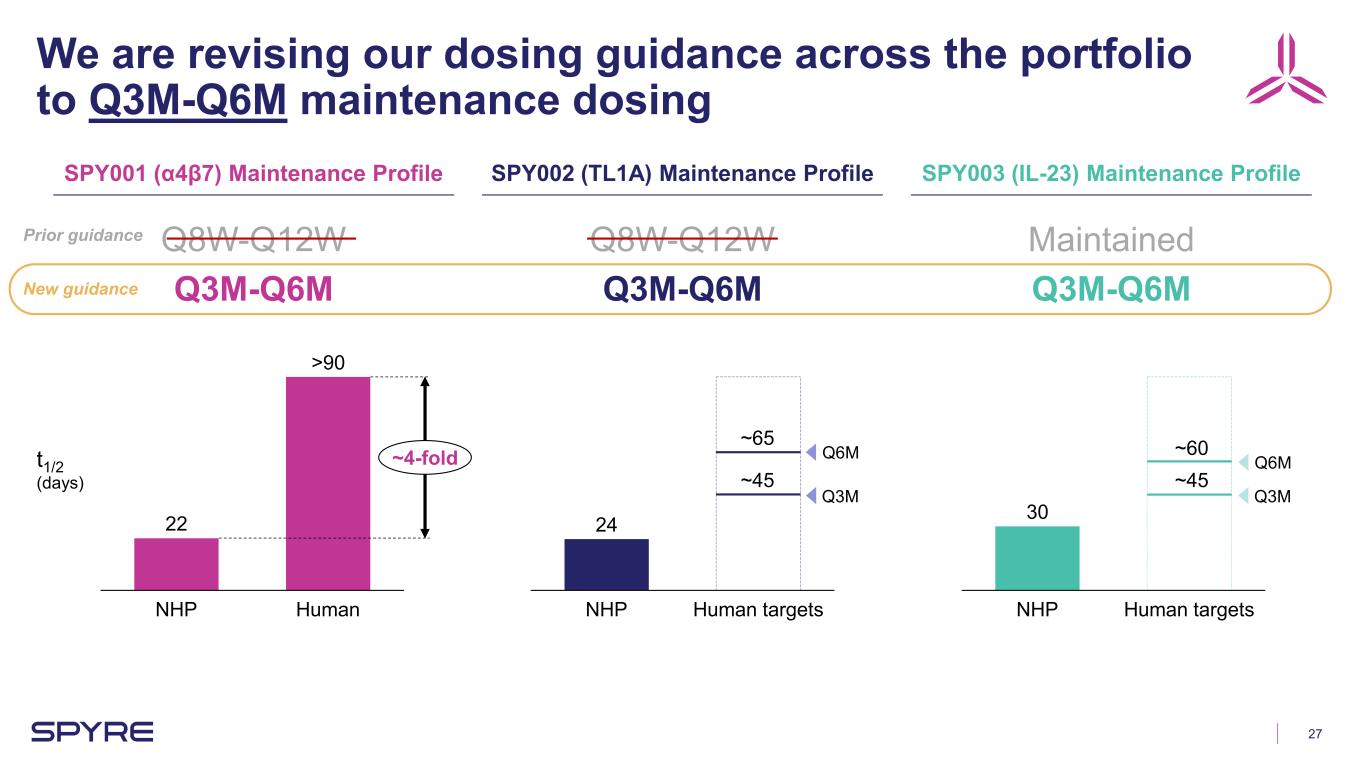
27 We are revising our dosing guidance across the portfolio to Q3M-Q6M maintenance dosing SPY001 (α4β7) Maintenance Profile SPY002 (TL1A) Maintenance Profile SPY003 (IL-23) Maintenance Profile 22 NHP Human >90 ~4-fold 24 NHP Human targets 30 NHP Human targets Q8W-Q12W Q3M-Q6M Q8W-Q12W Q3M-Q6M Maintained Q3M-Q6M Q3M Q6M Q3M Q6M ~45 ~65 ~45 ~60t1/2 (days) New guidance Prior guidance
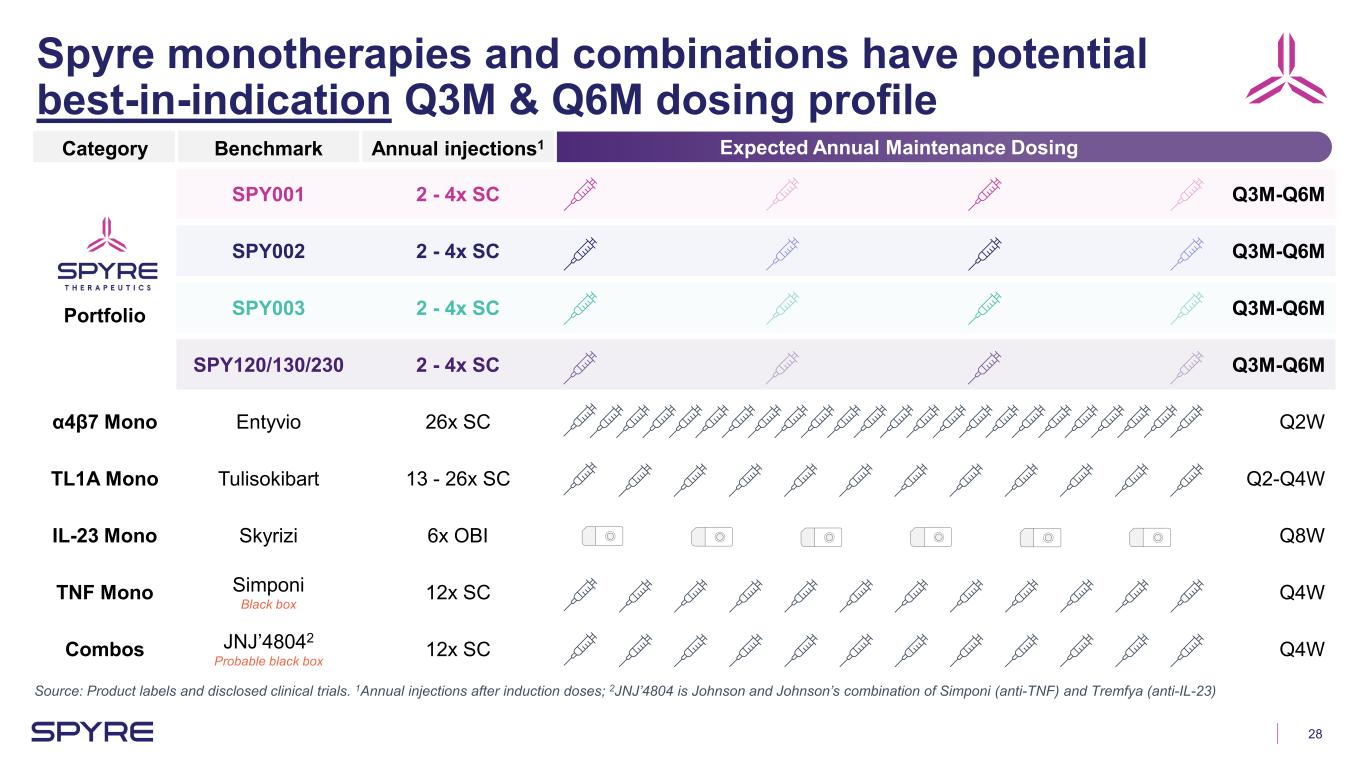
28 Spyre monotherapies and combinations have potential best-in-indication Q3M & Q6M dosing profile Source: Product labels and disclosed clinical trials. 1Annual injections after induction doses; 2JNJ’4804 is Johnson and Johnson’s combination of Simponi (anti-TNF) and Tremfya (anti-IL-23) Expected Annual Maintenance DosingCategory Benchmark Annual injections1 Portfolio SPY001 2 - 4x SC Q3M-Q6M SPY002 2 - 4x SC Q3M-Q6M SPY003 2 - 4x SC Q3M-Q6M SPY120/130/230 2 - 4x SC Q3M-Q6M α4β7 Mono Entyvio 26x SC Q2W TL1A Mono Tulisokibart 13 - 26x SC Q2-Q4W IL-23 Mono Skyrizi 6x OBI Q8W TNF Mono Simponi Black box 12x SC Q4W Combos JNJ’48042 Probable black box 12x SC Q4W

29 Spyre’s portfolio uniquely enables product profiles with potential superior efficacy and convenience Note: 1VEGA trial was not pbo-controlled. 0 1 2 3 4 5 6 20 40 60 80 Maintenance dosing interval (months) Pb o- ad ju st ed c lin ic al re m is si on (% ) Potential for Q3M & Q6M dosing profiles ILLUSTRATIVE SPY001 SPY002 SPY003 Potential to break the efficacy ceiling with combinationsSPY120 SPY130 SPY230 Potential for best-in- class efficacy with higher exposures Standard of care IBD biologics JNJ’4804 TNF+IL-23 combo (VEGA1)
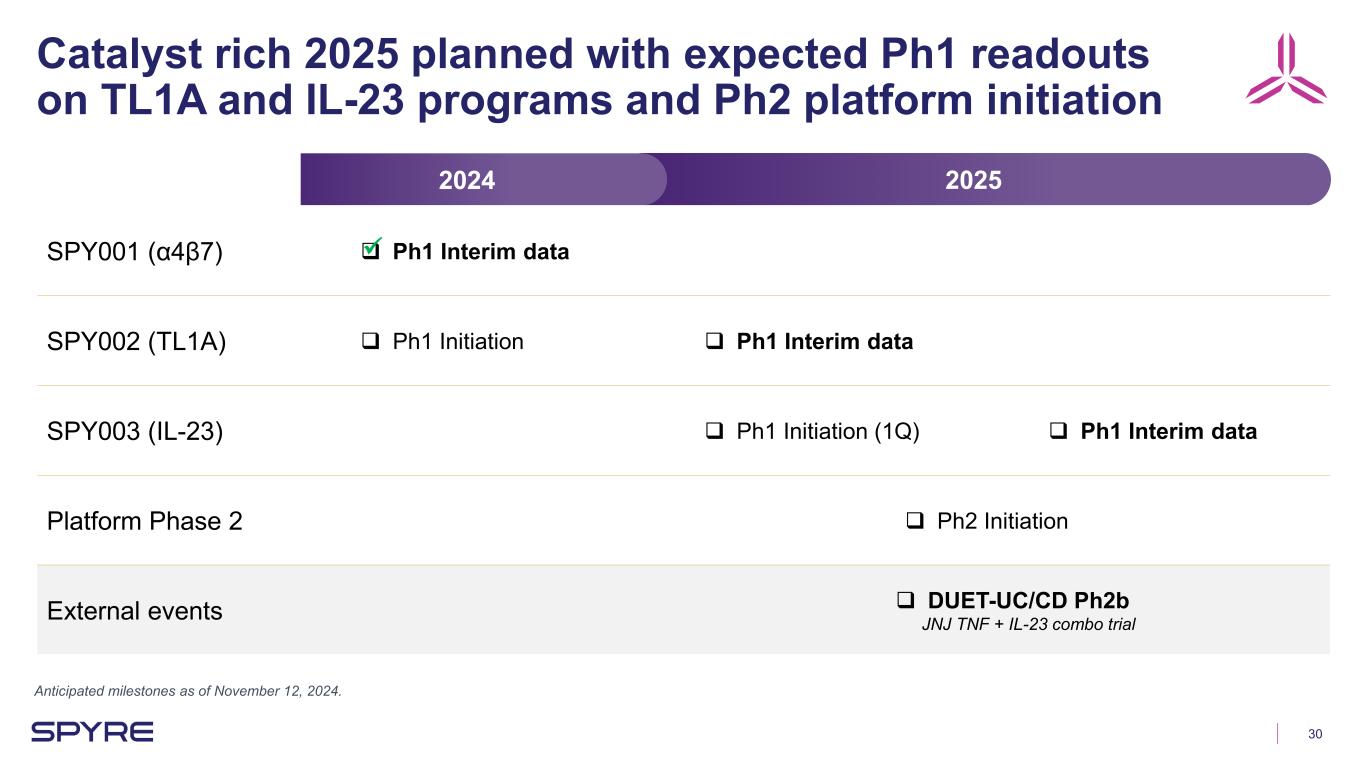
30 Catalyst rich 2025 planned with expected Ph1 readouts on TL1A and IL-23 programs and Ph2 platform initiation 20252024 SPY001 (α4β7) Ph1 Interim data SPY002 (TL1A) Ph1 Initiation Ph1 Interim data SPY003 (IL-23) Ph1 Initiation (1Q) Ph1 Interim data Platform Phase 2 Ph2 Initiation External events DUET-UC/CD Ph2b JNJ TNF + IL-23 combo trial Anticipated milestones as of November 12, 2024.

Q&A