| FREE WRITING PROSPECTUS | ||
| FILED PURSUANT TO RULE 433 | ||
| REGISTRATION FILE NO.: 333-180779-15 | ||
 |  |
MSBAM 2015-C22
Free Writing Prospectus
Structural and Collateral Term Sheet
$1,107,324,016
(Approximate Total Mortgage Pool Balance)
$950,914,000
(Approximate Offered Certificates)
Morgan Stanley Capital I Inc.
as Depositor
Morgan Stanley Mortgage Capital Holdings LLC
Bank of America, National Association
CIBC Inc.
Starwood Mortgage Funding III LLC
as Sponsors and Mortgage Loan Sellers
Commercial Mortgage Pass-Through Certificates
Series 2015-C22
March 30, 2015
| MORGAN STANLEY | BofA MERRILL LYNCH |
Co-Lead Bookrunning Manager CIBC World Markets | Co-Lead Bookrunning Manager Drexel Hamilton |
| Co-Managers | |
STATEMENT REGARDING THIS FREE WRITING PROSPECTUS
The depositor has filed a registration statement (including a prospectus) with the SEC (File Number 333-180779) for the offering to which this communication relates. Before you invest, you should read the prospectus in that registration statement and other documents the depositor has filed with the SEC for more complete information about the depositor, the issuing entity and this offering. You may get these documents for free by visiting EDGAR on the SEC web site at www.sec.gov. Alternatively, the depositor or any underwriter or any dealer participating in the offering will arrange to send you the prospectus if you request it by calling toll free 1-866-718-1649 or by email to prospectus@ms.com.
| This is not a research report and was not prepared by any Underwriter’s research department. It was prepared by the Underwriters’ sales, trading, banking or other non-research personnel. Please see additional important information and qualifications at the end of this Term Sheet. |
Neither this Term Sheet nor anything contained herein shall form the basis for any contract or commitment whatsoever. The information contained herein is preliminary as of the date hereof. This Term Sheet is subject to change, completion or amendment from time to time. The information contained herein will be superseded by similar information delivered to you as part of the Free Writing Prospectus. The information contained herein supersedes any such information previously delivered. The information contained herein should be reviewed only in conjunction with the entire Free Writing Prospectus. All of the information contained herein is subject to the same limitations and qualifications contained in the Free Writing Prospectus. The information contained herein does not contain all relevant information relating to the underlying mortgage loans or mortgaged properties. Such information is described in the Free Writing Prospectus and the Prospectus attached thereto as Exhibit A. The information contained herein will be more fully described in the Free Writing Prospectus. The information contained herein should not be viewed as projections, forecasts, predictions or opinions with respect to value. Prior to making any investment decision, prospective investors are strongly urged to read the Free Writing Prospectus in its entirety. Neither the Securities and Exchange Commission nor any state securities commission has approved or disapproved of these securities or determined if this Term Sheet is truthful or complete. Any representation to the contrary is a criminal offense.
IMPORTANT NOTICE RELATING TO AUTOMATICALLY GENERATED EMAIL DISCLAIMERS
Any legends, disclaimers or other notices that may appear at the bottom of, or attached to, the email communication to which this Term Sheet may have been attached are not applicable to this Term Sheet and should be disregarded. Such legends, disclaimers or other notices have been automatically generated as a result of this Term Sheet having been sent via Bloomberg or another email system.
IMPORTANT NOTICE REGARDING THE CONDITIONS FOR THIS OFFERING OF ASSET-BACKED SECURITIES
THE ASSET-BACKED SECURITIES REFERRED TO IN THIS TERM SHEET ARE BEING OFFERED WHEN, AS AND IF ISSUED. IN PARTICULAR, YOU ARE ADVISED THAT THE ASSET-BACKED SECURITIES, AND THE ASSET POOL BACKING THEM, ARE SUBJECT TO MODIFICATION OR REVISION (INCLUDING, AMONG OTHER THINGS, THE POSSIBILITY THAT ONE OR MORE CLASSES OF SECURITIES MAY BE SPLIT, COMBINED OR ELIMINATED), AT ANY TIME PRIOR TO ISSUANCE OR AVAILABILITY OF A FINAL PROSPECTUS. AS A RESULT, YOU MAY COMMIT TO PURCHASE SECURITIES THAT HAVE CHARACTERISTICS THAT MAY CHANGE, AND YOU ARE ADVISED THAT ALL OR A PORTION OF THE SECURITIES MAY NOT BE ISSUED THAT HAVE THE CHARACTERISTICS DESCRIBED IN THIS TERM SHEET. OUR OBLIGATION TO SELL SECURITIES TO YOU IS CONDITIONED ON THE SECURITIES AND THE UNDERLYING TRANSACTION HAVING THE CHARACTERISTICS DESCRIBED IN THIS TERM SHEET. IF WE DETERMINE THAT THE FOREGOING CONDITION IS NOT SATISFIED IN ANY MATERIAL RESPECT, WE WILL NOTIFY YOU, AND NEITHER THE ISSUING ENTITY NOR ANY UNDERWRITER WILL HAVE ANY OBLIGATION TO YOU TO DELIVER ALL OR ANY PORTION OF THE SECURITIES WHICH YOU HAVE COMMITTED TO PURCHASE, AND THERE WILL BE NO LIABILITY BETWEEN US AS A CONSEQUENCE OF THE NON-DELIVERY.
This is not a research report and was not prepared by the Underwriters’ research departments. Please see additional important information and qualifications at the end of this Term Sheet. |
T-1
MSBAM 2015-C22 | Structural Overview |
Offered Certificates
| Class | Expected Ratings (Moody’s/Fitch/KBRA)(1) | Approximate Initial Certificate Principal Balance or Notional Amount(2) | Approximate Initial Credit Support(3) | Pass-Through Rate Description | Expected Weighted Average Life (Years)(5) | Principal Window (Months)(5) | Certificate Principal UW NOI Debt Yield(6)(8) | Certificate Principal to Value Ratio(7)(8) | ||||||||
| Class A-1 | Aaa(sf)/AAAsf/AAA(sf) | $55,100,000 | 30.000% | (4) | 2.78 | 1-59 | 14.3% | 47.2% | ||||||||
| Class A-2 | Aaa(sf)/AAAsf/AAA(sf) | $66,500,000 | 30.000% | (4) | 4.92 | 59-60 | 14.3% | 47.2% | ||||||||
| Class A-SB | Aaa(sf)/AAAsf/AAA(sf) | $84,700,000 | 30.000% | (4) | 7.33 | 60-115 | 14.3% | 47.2% | ||||||||
| Class A-3 | Aaa(sf)/AAAsf/AAA(sf) | $250,000,000 | 30.000% | (4) | 9.78 | 115-119 | 14.3% | 47.2% | ||||||||
| Class A-4 | Aaa(sf)/AAAsf/AAA(sf) | $318,826,000 | 30.000% | (4) | 9.90 | 119-120 | 14.3% | 47.2% | ||||||||
| Class X-A | Aa2(sf)/AAAsf/AAA(sf) | $836,029,000(9) | N/A | Variable IO(10) | N/A | N/A | N/A | N/A | ||||||||
Class A-S(11) | Aa2(sf)/AAAsf/AAA(sf) | $60,903,000 | 24.500% | (4) | 9.98 | 120-120 | 13.2% | 51.0% | ||||||||
Class B(11) | NR/AA-sf/AA(sf) | $63,671,000 | 18.750% | (4) | 9.98 | 120-120 | 12.3% | 54.8% | ||||||||
Class PST(11) | NR/A-sf/A-(sf) | $175,788,000 | 14.125% | (4) | 9.98 | 120-120 | 11.6% | 58.0% | ||||||||
Class C(11) | NR/A-sf/A-(sf) | $51,214,000 | 14.125% | (4) | 9.98 | 120-120 | 11.6% | 58.0% |
Privately Offered Certificates(12)
| Class | Expected Ratings (Moody’s/Fitch/KBRA)(1) | Approximate Initial Certificate Principal Balance or Notional Amount(2) | Approximate Initial Credit Support(3) | Pass-Through Rate Description | Expected Weighted Average Life (Years)(5) | Principal Window (Months)(5) | Certificate Principal UW NOI Debt Yield(6) | Certificate Principal to Value Ratio(7) | ||||||||
| Class X-B | NR/AA-sf/AAA(sf) | $63,671,000(9) | N/A | Variable IO(10) | N/A | N/A | N/A | N/A | ||||||||
| Class D | NR/BBB-sf/BBB-(sf) | $62,287,000 | 8.500% | (4) | 9.98 | 120-120 | 10.9% | 61.8% | ||||||||
| Class E | NR/BB-sf/BB(sf) | $26,299,000 | 6.125% | (4) | 9.98 | 120-120 | 10.7% | 63.4% | ||||||||
| Class F | NR/B-sf/B+(sf) | $13,841,000 | 4.875% | (4) | 9.98 | 120-120 | 10.5% | 64.2% | ||||||||
| Class G | NR/NR/B-(sf) | $17,994,000 | 3.250% | (4) | 9.98 | 120-120 | 10.3% | 65.3% | ||||||||
| Class H | NR/NR/NR | $35,989,016 | 0.000% | (4) | 9.98 | 120-120 | 10.0% | 67.5% |
| (1) | Ratings shown are those of Moody’s Investors Service, Inc., Fitch Ratings, Inc. and Kroll Bond Rating Agency, Inc. Certain nationally recognized statistical rating organizations that were not hired by the depositor may use information they receive pursuant to Rule 17g-5 under the Securities Exchange Act of 1934, as amended, or otherwise to rate the certificates. There can be no assurance as to what ratings a non-hired nationally recognized statistical rating organization would assign. See “Risk Factors—Risks Related to the Offered Certificates—Ratings of the Offered Certificates Do Not Represent Any Assessment of the Yield to Maturity That a Certificateholder May Experience and Such Ratings May Be Reviewed, Revised, Suspended, Downgraded, Qualified or Withdrawn By the Applicable Rating Agency” and “Ratings” in the other free writing prospectus, which is expected to be dated March 30, 2015 (the “Free Writing Prospectus”), to which the prospectus dated October 1, 2013 (the “Prospectus”) is attached as Exhibit A. Capitalized terms used but not defined herein have the meanings assigned to such terms in the Free Writing Prospectus. |
| (2) | The certificate principal balances and notional amounts are approximate and on the closing date may vary by up to 5%. Mortgage loans may be removed from or added to the mortgage pool prior to the closing date within the same maximum permitted variance. Any reduction or increase in the aggregate principal balance of mortgage loans within these parameters will result in changes to the initial certificate principal balance or notional amount of each class of certificates shown in the table above and to the other statistical data contained herein and in the Free Writing Prospectus. In addition, the notional amounts of the Class X-A and Class X-B Certificates may vary depending upon the final pricing of the classes of certificates and/or trust components whose certificate principal balances comprise such notional amounts, and, if as a result of such pricing the pass-through rate of the Class X-A or Class X-B Certificates, as applicable, would be equal to zero, such class of certificates will not be issued on the closing date of this securitization. |
| (3) | The percentages indicated under the column “Approximate Initial Credit Support” with respect to the Class A-1, Class A-2, Class A-SB, Class A-3 and Class A-4 Certificates represent the approximate credit support for the Class A-1, Class A-2, Class A-SB, Class A-3 and Class A-4 Certificates in the aggregate. The percentage indicated under the column “Approximate Initial Credit Support” with respect to the Class C Certificates and the Class PST Certificates represents the approximate credit support for the underlying Class C trust component. |
| (4) | The Class A-1, Class A-2, Class A-SB, Class A-3, Class A-4, Class A-S, Class B, Class C, Class D, Class E, Class F, Class G and Class H Certificates will, at all times, accrue interest at a per annum rate equal to (i) a fixed rate, (ii) a fixed rate subject to a cap equal to the weighted average of the net interest rates on the mortgage loans (in each case adjusted, if necessary, to accrue on the basis of a 360-day year consisting of 12 30-day months) or (iii) a rate equal to the weighted average of the net interest rates on the mortgage loans (in each case adjusted, if necessary, to accrue on the basis of a 360-day year consisting of 12 30-day months) less a specified percentage, which percentage may be zero. The Class PST Certificates will not have a pass-through rate, but will be entitled to receive the sum of the interest distributable on the Class PST components. The pass-through rates for the Class A-S Certificates, the Class A-S trust component and the Class PST Component A-S will, at all times, be the same. The pass-through rates for the Class B Certificates, the Class B trust component and the Class PST Component B will, at all times, be the same. The pass-through rates for the Class C Certificates, the Class C trust component and the Class PST Component C will, at all times, be the same. |
| (5) | The principal window is expressed in months following the closing date and reflects the period during which distributions of principal would be received under the assumptions set forth in the following sentence. The expected weighted average life and principal window figures set forth above are based on the following assumptions, among others: (i) no defaults or subsequent losses on the mortgage loans; (ii) no extensions of maturity dates of the mortgage loans; (iii) payment in full on the stated maturity date or, in the case of any mortgage loan having an anticipated repayment date, on the anticipated repayment date; and (iv) no prepayments of the mortgage loans prior to maturity or, in the case of a mortgage loan having an anticipated repayment date, prior to such anticipated repayment date. See the structuring assumptions set forth under “Yield, Prepayment and Maturity Considerations—Weighted Average Life” in the Free Writing Prospectus. |
| (6) | Certificate Principal UW NOI Debt Yield for any class of principal balance certificates (other than the Exchangeable Certificates) is calculated as the product of (a) the weighted average UW NOI Debt Yield for the mortgage pool, multiplied by (b) a fraction, the numerator of which is the total initial principal balance of all the principal balance certificates (other than the Exchangeable Certificates) and trust components, and the denominator of which is the total initial principal balance of the subject class of principal balance certificates and all other classes of principal balance certificates (other than the Exchangeable Certificates) and trust components, if any, that are senior to such class. The Certificate Principal UW NOI Debt Yields of the Class A-1, Class A-2, Class A-SB, Class A-3 and Class A-4 Certificates are calculated in the aggregate for those classes as if they were a single class. |
| (Footnotes continued on next page) |
This is not a research report and was not prepared by the Underwriters’ research departments. Please see additional important information and qualifications at the end of this Term Sheet. |
T-2
MSBAM 2015-C22 | Structural Overview |
| (7) | Certificate Principal to Value Ratio for any class of principal balance certificates (other than the Exchangeable Certificates) is calculated as the product of (a) the weighted average Cut-off Date LTV Ratio of the mortgage pool, multiplied by (b) a fraction, the numerator of which is the total initial principal balance of the subject class of principal balance certificates and all other classes of principal balance certificates (other than the Exchangeable Certificates) and trust components, if any, that are senior to such class, and the denominator of which is the total initial principal balance of all the principal balance certificates (other than the Exchangeable Certificates) and trust components. The Certificate Principal to Value Ratios of the Class A-1, Class A-2, Class A-SB, Class A-3 and Class A-4 Certificates are calculated in the aggregate for those classes as if they were a single class. |
| (8) | Certificate Principal UW NOI Debt Yield for the Class A-S, Class B and Class C Certificates is calculated as the product of (a) the weighted average UW NOI Debt Yield for the mortgage pool, multiplied by (b) a fraction, the numerator of which is the total initial principal balance of all the principal balance certificates (other than the Exchangeable Certificates) and trust components, and the denominator of which is the total initial principal balance of the Class A-S trust component, the Class B trust component or the Class C trust component, as applicable, and all other classes of principal balance certificates (other than the Exchangeable Certificates) and trust components that are senior to such trust component. Certificate Principal to Value Ratio for the Class A-S, Class B and Class C Certificates is calculated as the product of (a) the weighted average Cut-off Date LTV Ratio of the mortgage pool, multiplied by (b) a fraction, the numerator of which is the total initial principal balance of the Class A-S trust component, the Class B trust component or the Class C trust component, as applicable, and all other classes of principal balance certificates (other than the Exchangeable Certificates) and trust components that are senior to such trust component, and the denominator of which is the total initial principal balance of all the principal balance certificates (other than the Exchangeable Certificates) and trust components. The Certificate Principal UW NOI Debt Yield and Certificate Principal to Value Ratio of the Class PST Certificates are equal to the respective amounts for the Class C Certificates. |
| (9) | The Class X-A and Class X-B Certificates (collectively, “the Class X Certificates”) will not have certificate principal balances and will not be entitled to receive distributions of principal. Interest will accrue on the Class X-A and Class X-B Certificates at their respective pass-through rates based upon their respective notional amounts. The notional amount of the Class X-A Certificates will equal the aggregate certificate principal balance of the Class A-1, Class A-2, Class A-SB, Class A-3 and Class A-4 Certificates and the Class A-S trust component outstanding from time to time. The notional amount of the Class X-B Certificates will equal the certificate principal balance of the Class B trust component outstanding from time to time. |
| (10) | The pass-through rate on the Class X-A Certificates will generally be equal to the excess, if any, of (a) the weighted average of the net interest rates on the mortgage loans (in each case adjusted, if necessary, to accrue on the basis of a 360-day year consisting of 12 30-day months), over (b) the weighted average of the pass-through rates of the Class A-1, Class A-2, Class A-SB, Class A-3 and Class A-4 Certificates and the Class A-S trust component as described in the Free Writing Prospectus. The pass-through rate on the Class X-B Certificates will generally be equal to the excess, if any, of (a) the weighted average of the net interest rates on the mortgage loans (in each case adjusted, if necessary, to accrue on the basis of a 360-day year consisting of 12 30-day months), over (b) the pass-through rate of the Class B trust component as described in the Free Writing Prospectus. |
| (11) | The Class A-S, Class B, Class PST and Class C Certificates are “Exchangeable Certificates.” On the closing date, the upper-tier REMIC of the issuing entity will issue the Class A-S, Class B and Class C trust components (each a “trust component”), which will have outstanding principal balances on the closing date of $60,903,000, $63,671,000 and $51,214,000, respectively. The trust components will be held in the grantor trust for the benefit of the holders of the Class A-S, Class B, Class PST and Class C Certificates. The Class A-S, Class B, Class PST and Class C Certificates will, at all times, represent undivided beneficial ownership interests, held through the grantor trust, in one or more of such trust components. Each class of the Class A-S, Class B and Class C Certificates will, at all times, represent an undivided beneficial ownership interest in a percentage of the outstanding certificate principal balance of the trust component with the same alphabetical class designation. The Class PST Certificates will, at all times, represent an undivided beneficial ownership interest in the remaining percentages of the outstanding certificate principal balances of the Class A-S, Class B and Class C trust components, and such portions of those trust components are respectively referred to in this Term Sheet as the Class PST Component A-S, Class PST Component B and Class PST Component C (collectively, the “Class PST Components”). Following any exchange of Class A-S, Class B and Class C Certificates for Class PST Certificates or any exchange of Class PST Certificates for Class A-S, Class B and Class C Certificates as described in the Free Writing Prospectus, the percentage interests of the outstanding certificate principal balances of the Class A-S, Class B and Class C trust components that are represented by the Class A-S, Class B, Class PST and Class C Certificates will be increased or decreased accordingly. The initial certificate principal balance of each class of the Class A-S, Class B and Class C Certificates shown in the table represents the maximum certificate principal balance of such class without giving effect to any exchange. The initial certificate principal balance of the Class PST Certificates shown in the table is equal to the aggregate of the initial certificate principal balances of the Class A-S, Class B and Class C Certificates shown in the table and represents the maximum certificate principal balance of the Class PST Certificates that could be issued in an exchange; such initial certificate principal balance is not included in the aggregate certificate principal balance of the offered certificates set forth on the cover page of this Term Sheet. The certificate principal balances of the Class A-S, Class B and Class C Certificates to be issued on the closing date will be reduced, in required proportions, by an amount equal to the certificate principal balance of the Class PST Certificates issued on the closing date. Distributions and allocations of payments and losses with respect to the Exchangeable Certificates are described in this Term Sheet under “Allocations and Distributions on the Exchangeable Certificates” and under “Description of the Offered Certificates—Distributions” in the Free Writing Prospectus. |
 |
* For purposes of the foregoing chart, the Class A-Senior Certificates include the Class X-A Certificates, which are also offered certificates, in regards to payments of interest. |
| ** For purposes of the foregoing chart, the Class X-B Certificates have the same payment priority as the Class A Senior Certificates in regards payments of interest. The foregoing chart does not address the Class V Certificates (which represent interests in excess interest in respect of any anticipated repayment date loans). |
| (12) | Not offered pursuant to the Prospectus, the Free Writing Prospectus or this Term Sheet. Information provided in this Term Sheet regarding the characteristics of these certificates is provided only to enhance your understanding of the offered certificates. The privately offered certificates also include the Class V and Class R Certificates, which do not have a certificate principal balance, notional amount, pass-through rate, rating or rated final distribution date, and which are not shown in the chart. The Class V Certificates represent a beneficial ownership interest held through the grantor trust in certain excess interest in respect of mortgage loans having anticipated repayment dates, if any. The Class R Certificates represent the beneficial ownership of the residual interest in each of the real estate mortgage investment conduits, as further described in the Free Writing Prospectus. |
This is not a research report and was not prepared by the Underwriters’ research departments. Please see additional important information and qualifications at the end of this Term Sheet. |
T-3
MSBAM 2015-C22 | Structural Overview |
Issue Characteristics
| Offered Certificates: | $950,914,000 (approximate) monthly pay, multi-class, commercial mortgage pass-through certificates, consisting of nine principal balance classes (Class A-1, Class A-2, Class A-SB, Class A-3, Class A-4, Class A-S, Class B, Class PST and Class C) and one interest-only class (Class X-A) | |
| Co-Lead Bookrunning Managers: | Morgan Stanley & Co. LLC and Merrill Lynch, Pierce, Fenner & Smith Incorporated | |
| Co-Managers: | CIBC World Markets Corp. and Drexel Hamilton, LLC | |
| Mortgage Loan Sellers: | Morgan Stanley Mortgage Capital Holdings LLC, Bank of America, National Association, CIBC Inc. and Starwood Mortgage Funding III LLC | |
| Rating Agencies: | Moody’s Investors Service, Inc., Fitch Ratings, Inc. and Kroll Bond Rating Agency, Inc. | |
| Master Servicer: | Wells Fargo Bank, National Association | |
| Special Servicer: | Midland Loan Services, a Division of PNC Bank, National Association | |
Certificate Administrator/ Certificate Registrar/Custodian: | Wells Fargo Bank, National Association | |
| Trustee: | Wilmington Trust, National Association | |
| Trust Advisor: | Park Bridge Lender Services LLC | |
Initial Controlling Class Representative: | DoubleLine Capital LP or its affiliate | |
| Cut-off Date: | April 1, 2015. For purposes of the information contained in this term sheet (this “Term Sheet”), scheduled payments due in April 2015 with respect to mortgage loans not having payment dates on the first day of each month have been deemed received on April 1, 2015, not the actual day on which such scheduled payments were due | |
| Expected Pricing Date: | Week of April 6, 2015 | |
| Expected Closing Date: | Week of April 20, 2015 | |
| Determination Dates: | The 11th calendar day of each month (if the 11th calendar day is not a business day, the next succeeding business day), commencing in May 2015 | |
| Distribution Dates: | The 4th business day following the Determination Date in each month, commencing in May 2015 | |
| Rated Final Distribution Date: | The Distribution Date in April 2048 | |
| Interest Accrual Period: | Preceding calendar month | |
| Payment Structure: | Sequential pay | |
| Tax Treatment: | REMIC, except that the Class A-S, Class B, Class PST and Class C Certificates will evidence an interest in the grantor trust | |
| Optional Termination: | 1.00% clean-up call | |
| Minimum Denominations: | $10,000 for each class of Offered Certificates (other than Class X-A); $100,000 for the Class X-A Certificates | |
| Settlement Terms: | DTC, Euroclear and Clearstream | |
| Legal/Regulatory Status: | Each class of Offered Certificates is expected to be eligible for exemptive relief under ERISA. No class of Offered Certificates is SMMEA eligible. | |
| Analytics: | The certificate administrator is expected to make available all distribution date statements, CREFC® reports and supplemental notices received by it to certain modeling financial services as described in the Free Writing Prospectus. | |
| Bloomberg Ticker: | MSBAM 2015-C22 <MTGE><GO> | |
| Risk Factors: | THE CERTIFICATES INVOLVE CERTAIN RISKS AND MAY NOT BE SUITABLE FOR ALL INVESTORS. SEE THE “RISK FACTORS” SECTION OF THE FREE WRITING PROSPECTUS AND THE “RISK FACTORS” SECTION OF THE PROSPECTUS. |
This is not a research report and was not prepared by the Underwriters’ research departments. Please see additional important information and qualifications at the end of this Term Sheet. |
T-4
MSBAM 2015-C22 | Structural Overview |
Structural Overview
| Accrual: | Each class of Offered Certificates will accrue interest on a 30/360 basis. | |
| Amount and Order of Distributions: | On each distribution date, certificateholders will be entitled to receive distributions of interest and principal from funds received with respect to the mortgage loans and available for distribution. Funds available for distribution on the certificates will be net of excess interest, excess liquidation proceeds and specified trust expenses, including, without limitation, all advance reimbursements (with interest) and all servicing fees and expenses, certificate administrator fees (including trustee fees and custodian fees) and expenses, special servicer compensation, trust advisor fees (together with certain trust advisor consulting fees), CREFC® License Fees and expenses as set forth below. Distributions to certificateholders on each distribution date out of payments (or advances in lieu thereof) and other collections on the mortgage loans will be in an amount equal to each class’s interest and principal entitlement, subject to: (i) payment of the respective interest entitlement for any other class of certificates bearing an earlier alphanumeric designation (except (x) in respect of the distribution of interest among the Class A-1, Class A-2, Class A-SB, Class A-3, Class A-4, Class X-A and Class X-B Certificates, which will have the same senior priority and be distributed pro rata, and (y) in respect of the distribution of interest among the Class A-S, Class B, Class PST and Class C Certificates as described below under “Allocations and Distributions on the Exchangeable Certificates”); (ii) if applicable, payment of the respective principal entitlement for the distribution date to the outstanding classes of principal balance certificates, first, to the Class A-SB Certificates, until the principal balance of such class has been reduced to the planned principal balance for the related distribution date set forth on Appendix VII to the Free Writing Prospectus, then, to the Class A-1, Class A-2, Class A-3, Class A-4 and Class A-SB Certificates, in that order (or pro rata among such classes if the principal balance of all other classes of certificates has been reduced to zero as a result of the allocation of mortgage loan losses or trust advisor expenses to such other classes, or if the aggregate appraisal reduction equals or exceeds the aggregate principal balance of the Class A-S through Class H Certificates (including the Class PST Certificates)), until the principal balance of each such class has been reduced to zero, then, to the Class A-S, Class B, Class PST and Class C Certificates as described below under “Allocations and Distributions on the Exchangeable Certificates” until the principal balance of each such class has been reduced to zero, and then to the Class D, Class E, Class F, Class G and Class H Certificates, in that order, until the principal balance of each such class has been reduced to zero; and (iii) the allocation of trust advisor expenses, (a) first, to reduce payments of interest on the Class D Certificates, the Class C trust component and the Class B trust component, in that order, (b) second, to reduce payments of principal on the Class D Certificates, the Class C trust component, the Class B trust component and the Class A-S trust component, in that order, and (c) third, to reduce payments of principal on the Class A-1, Class A-2, Class A-SB, Class A-3 and Class A-4 Certificates on a pro rata basis. No trust advisor expenses (which do not include the trust advisor fee) will be allocated to or otherwise borne by the Control Eligible Certificates. As a result, none of the classes of such certificates will provide protection to the more senior classes of certificates for the purposes of allocating losses based on trust advisor expenses. Trust advisor expenses allocated to the Class A-S trust component, the Class B trust component and the Class C trust component will be allocated to the Class A-S, Class B, Class PST and Class C Certificates as described below under “Allocations and Distributions on the Exchangeable Certificates.” | |
| Interest and Principal Entitlements: | Interest distributable on any class of certificates (other than the Exchangeable Certificates and the Class V and Class R Certificates) or trust component on any distribution date, with various adjustments described under “Description of the Offered Certificates—Distributions” in the Free Writing Prospectus, represents all unpaid interest accrued with respect to that class of certificates or trust component through the end of the interest accrual period that corresponds to that distribution date. Interest accrues with respect to each such interest-bearing certificate and each trust component during each interest accrual period at the applicable pass-through rate for, and on the principal balance or notional amount, as applicable, of that certificate or trust component outstanding immediately prior to, the distribution date that corresponds to that interest accrual period. However, as described in “Description of the Offered Certificates—Distributions” in the Free Writing Prospectus, there are circumstances relating to the timing of prepayments in which the interest entitlement with respect to any certificate or trust component for a distribution date could be less than one full month’s interest at the pass-through rate on the certificate’s or trust component’s principal balance or notional amount. In addition, certain specified trust fund expenses, the right of the master servicer, the special servicer and the trustee to reimbursement for payment of advances (with interest thereon), and the rights of such parties and of the certificate administrator, the custodian and, subject to certain limitations, the trust advisor to the payments of compensation and reimbursement of certain costs and expenses will be prior to a certificateholder’s right to receive distributions of principal or interest. In addition, the right of the trust advisor to receive reimbursement of trust advisor expenses will be prior to the right of the holders of the Class B, Class PST, Class C and Class D Certificates to receive payments of interest, and to the right of the holders of the Class A-1, Class A-2, Class A-SB, Class A-3, Class A-4, Class A-S, Class B, Class PST, Class C and Class D Certificates to receive payments of principal. The amount of principal available to be distributed on the classes entitled to principal on a particular distribution date will, in general, be equal to the sum of: (i) the principal portion of all scheduled payments, other than balloon payments, to the extent received during the related collection period or advanced by the |
This is not a research report and was not prepared by the Underwriters’ research departments. Please see additional important information and qualifications at the end of this Term Sheet. |
T-5
MSBAM 2015-C22 | Structural Overview |
master servicer or other party (in accordance with the pooling and servicing agreement) in respect of such distribution date; (ii) all principal prepayments and the principal portion of balloon payments received during the related collection period; (iii) the principal portion of other collections on the mortgage loans received during the related collection period, for example liquidation proceeds, condemnation proceeds, insurance proceeds and income on other “real estate owned” (“REO”); and (iv) the principal portion of proceeds of mortgage loan repurchases received during the related collection period; subject to certain adjustments described in the Free Writing Prospectus relating to the payment or reimbursement of nonrecoverable advances, workout-delayed reimbursement amounts and trust advisor expenses, and exclusive of any late collections of principal received during the related collection period for which there is an outstanding advance. The Class V, Class R, Class X-A and Class X-B Certificates will not be entitled to principal distributions. | ||
| Allocations and Distributions on the Exchangeable Certificates: | On the closing date, the upper-tier REMIC of the issuing entity will issue the Class A-S, Class B and Class C trust components (each a “trust component”), which will have outstanding principal balances on the closing date of $60,903,000, $63,671,000 and $51,214,000, respectively. The trust components will be held in the grantor trust for the benefit of the holders of the Class A-S, Class B, Class PST and Class C Certificates. Each class of the Class A-S, Class B and Class C Certificates will, at all times, represent an undivided beneficial ownership interest, held through the grantor trust, in a percentage of the outstanding principal balance of the trust component with the same alphabetical class designation. The Class PST Certificates will, at all times, represent an undivided beneficial ownership interest, held through the grantor trust, in the remaining percentages of the outstanding principal balances of the Class A-S, Class B and Class C trust components, which portions of these trust components are respectively referred to in this Term Sheet as the “Class PST Component A-S,” “Class PST Component B” and “Class PST Component C” (collectively, the “Class PST Components”). Distributions of principal and interest will be made sequentially with respect to the trust components in alphabetic order of class designation after all required distributions of interest and principal have been made with respect to the Class A-1, Class A-2, Class A-SB, Class A-3, Class A-4, Class X-A and Class X-B Certificates. Interest, principal, prepayment premiums, yield maintenance charges, voting rights and any losses (including, without limitation, as a result of trust advisor expenses) or collateral support deficits that are allocated to the Class A-S, Class B or Class C trust component will be distributed or allocated, as applicable, as between the Class A-S, Class B or Class C Certificates, as applicable, on the one hand, and Class PST Component A-S, Class PST Component B or Class PST Component C, as applicable (and correspondingly, the Class PST Certificates), on the other hand, pro rata, based on their respective percentage interests in the Class A-S, Class B or Class C trust component, as applicable. For a complete description of the allocations and distributions with respect to the Class A-S trust component, the Class B trust component and the Class C trust component (and correspondingly the Class A-S, Class B, Class PST and Class C Certificates and the Class PST Component A-S, Class PST Component B and Class PST Component C), see “Description of the Offered Certificates” in the Free Writing Prospectus. See “Material Federal Income Tax Consequences” in the Free Writing Prospectus for a discussion of the tax treatment of the Exchangeable Certificates. | |
| Exchanges of Exchangeable Certificates: | If you own Class A-S, Class B and Class C Certificates, you will be able to exchange them for a proportionate interest in the Class PST Certificates, and vice versa, as described in the Free Writing Prospectus. You can exchange your Exchangeable Certificates by notifying the certificate administrator. Holders of Class PST Certificates will be entitled to receive principal and interest that would otherwise be payable on the applicable proportion of the Class A-S, Class B and Class C Certificates exchangeable therefor. Any such allocations of principal and interest as between classes of Exchangeable Certificates will have no effect on the principal or interest entitlements of any other class of certificates. The Free Writing Prospectus describes the available combinations of Exchangeable Certificates eligible for exchange. | |
| Special Servicer Compensation: | The special servicer is entitled to a special servicing fee payable from general collections on the mortgage loans (and any related B note or serviced companion loan). The special servicing fee for each distribution date is calculated based on the outstanding principal balance of each mortgage loan (other than any non-serviced mortgage loan) that is a specially serviced mortgage loan (and any related B note or serviced companion loan) or as to which the related mortgaged property has become an REO property at the special servicing fee rate, which will be 0.25% per annum. Any primary servicing fee or sub-servicing fee will be paid by the special servicer out of the fees described above. The special servicer is also entitled to additional fees and amounts, including, without limitation, income on the amounts held in certain permitted investments. The special servicer will also be entitled to (i) liquidation fees generally equal to 1.0% of liquidation proceeds in respect of a specially serviced mortgage loan (and any related B note or serviced companion loan) or REO property and (ii) workout fees generally equal to 1.0% of interest and principal payments made in respect of a rehabilitated mortgage loan (and any related B note or serviced companion loan), subject to a cap with respect to each such fee of $1,000,000 with respect to any mortgage loan, loan pair, non-serviced loan combination, A/B whole loan or REO property and subject to certain adjustments and exceptions as described in the Free Writing Prospectus under “Servicing of the Mortgage Loans—The Special Servicer—Special Servicer Compensation.” With respect to any non-serviced mortgage loan, the related special servicer under the related other pooling and servicing agreement pursuant to which such mortgage loan is being serviced will be entitled to similar compensation as that described above with respect to such non-serviced mortgage loan under such other pooling and servicing agreement as further described in the Free Writing Prospectus, although any related fees may accrue at a different rate and there may be a higher (or no) cap on liquidation and workout fees. |
This is not a research report and was not prepared by the Underwriters’ research departments. Please see additional important information and qualifications at the end of this Term Sheet. |
T-6
MSBAM 2015-C22 | Structural Overview |
| Prepayment Premiums/Yield Maintenance Charges: | On any distribution date, prepayment premiums or yield maintenance charges collected in respect of each mortgage loan during the related collection period will be distributed by the certificate administrator on the classes of certificates or trust components as follows: to each class of principal balance certificates (other than the Exchangeable Certificates and the Class E, Class F, Class G and Class H Certificates) and each trust component then entitled to distributions of principal on such distribution date, an amount equal to the product of (a) a fraction, the numerator of which is the amount distributed as principal to that class or trust component on that distribution date, and the denominator of which is the total amount distributed as principal to all classes of principal balance certificates (other than the Exchangeable Certificates) and trust components on that distribution date, (b) the Base Interest Fraction for the related principal prepayment and that class or trust component and (c) the amount of the prepayment premium or yield maintenance charge collected in respect of such principal prepayment during the one month period ending on the related determination date. Any prepayment premiums or yield maintenance charges relating to the mortgage loans collected during the related collection period and remaining after those distributions described above (as to the applicable distribution date, the “Class X YM Distribution Amount”) will be distributed to the holders of the Class X Certificates, as follows: first, to holders of the Class X-A Certificates in an amount equal to the product of (a) a fraction, the numerator of which is the total amount of principal distributed on the applicable distribution date with respect to the class(es) of certificates and/or trust component(s) whose certificate principal balances comprise the notional amount of such class of Class X Certificates, and the denominator of which is the total amount of principal distributed on the applicable distribution date with respect to all classes of principal balance certificates (other than the Exchangeable Certificates) and trust component(s), multiplied by (b) the Class X YM Distribution Amount for the applicable distribution date; and second, to the holders of the Class X-B Certificates in an amount equal to the portion of the Class X YM Distribution Amount remaining after the distributions to the holders of the Class X-A Certificates. Distributions of prepayment premiums and yield maintenance charges made on the Class A-S trust component, the Class B trust component and the Class C trust component will be distributed to the Class A-S, Class B and Class C Certificates and the Class PST Components (and correspondingly the Class PST Certificates) as described above in “Allocations and Distributions on the Exchangeable Certificates.” No prepayment premiums or yield maintenance charges will be distributed to holders of the Class E, Class F, Class G, Class H, Class V or Class R Certificates. The “Base Interest Fraction,” with respect to any principal prepayment of any mortgage loan that provides for payment of a prepayment premium or yield maintenance charge, and with respect to any class of principal balance certificates (other than the Exchangeable Certificates and the Class E, Class F, Class G and Class H Certificates) or trust component, is a fraction (A) whose numerator is the greater of (x) zero and (y) the difference between (i) the pass-through rate on that class of certificates or trust component, as applicable, and (ii) the applicable discount rate and (B) whose denominator is the difference between (i) the mortgage interest rate on the related mortgage loan and (ii) the applicable discount rate; provided that under no circumstances will the Base Interest Fraction be greater than one. If the discount rate referred to above is greater than or equal to the mortgage interest rate on the related mortgage loan, then the Base Interest Fraction will equal zero; provided that if the discount rate referred to above is greater than or equal to the mortgage interest rate on the related mortgage loan, but is less than the pass-through rate on the subject class of certificates or trust component, the Base Interest Fraction shall be equal to 1.0. Consistent with the foregoing, the Base Interest Fraction is equal to: |
| (Pass-Through Rate – Discount Rate) | |||
| (Mortgage Rate – Discount Rate) |
Collateral Support Deficits: | On each distribution date, immediately following the distributions made to the certificateholders on that date, the certificate administrator will be required to calculate the amount, if any, by which (1) the aggregate stated principal balance of pool of the mortgage loans, including any mortgage loans as to which the related mortgaged properties have become REO properties, expected to be outstanding immediately following that distribution date, is less than (2) the aggregate principal balance of the principal balance certificates after giving effect to distributions of principal on that distribution date and the allocation of any excess trust advisor expenses to reduce the principal balances of the principal balance certificates that are not Control Eligible Certificates on that distribution date (any such deficit, a “Collateral Support Deficit”). On each distribution date, the certificate administrator will be required to allocate any Collateral Support Deficit to the respective classes of principal balance certificates (other than the Exchangeable Certificates) and the trust components in the following order: to the Class H Certificates, the Class G Certificates, the Class F Certificates, the Class E Certificates, the Class D Certificates, the Class C trust component, the Class B trust component, and the Class A-S trust component, in that order, in each case in reduction of and until the remaining principal balance of that class of certificates or trust components has been reduced to zero. Following the reduction of the principal balances of all such classes of certificates to zero, the certificate administrator will be required to allocate the Collateral Support Deficit to the Class A-1, Class A-2, Class A-SB, Class A-3 and Class A-4 Certificates, pro rata (based upon their respective principal balances), until the remaining principal balances of those classes of certificates have been reduced to zero. Any Collateral Support Deficit allocated to a class of certificates will be allocated to the respective certificates of such class in proportion to the percentage interests evidenced by the respective certificates. Any such Collateral Support Deficit allocated to the Class A-S, Class B and Class C trust components will, in turn, be allocated to the Class A-S, Class B, Class PST and Class C Certificates as described above in “Allocations and Distributions on the Exchangeable Certificates.” | |
| A/B Whole Loans and Loan Pairs: | The mortgaged property identified on Appendix I to the Free Writing Prospectus as 300 South Riverside Plaza Fee secures on a pari passu basis (i) a mortgage loan (the “300 South Riverside Plaza Fee mortgage loan”) |
This is not a research report and was not prepared by the Underwriters’ research departments. Please see additional important information and qualifications at the end of this Term Sheet. |
T-7
MSBAM 2015-C22 | Structural Overview |
with an outstanding principal balance as of the cut-off date of $100,000,000, representing approximately 9.0% of the initial pool balance, and (ii) a pari passu promissory note that has an outstanding principal balance as of the cut-off date of $67,000,000 (the “300 South Riverside Plaza Fee serviced companion loan” and a “serviced companion loan”) that is not part of the mortgage pool and that is currently held by Morgan Stanley Bank, N.A. The 300 South Riverside Plaza Fee mortgage loan and the 300 South Riverside Plaza Fee serviced companion loan together constitute the “300 South Riverside Plaza Fee loan pair” and a “loan pair,” are pari passu in right of payment and will be serviced pursuant to the related intercreditor agreement and the pooling and servicing agreement for this transaction. With respect to the 300 South Riverside Plaza Fee mortgage loan, any holder of the 300 South Riverside Plaza Fee serviced companion loan will have certain consultation rights under the pooling and servicing agreement with respect to certain major decisions and other matters related to the 300 South Riverside Plaza Fee loan pair. | ||
The mortgaged property identified on Appendix I to the Free Writing Prospectus as Waterfront at Port Chester secures on a pari passu basis (i) a mortgage loan (the “Waterfront at Port Chester mortgage loan”) with an outstanding principal balance as of the cut-off date of $80,000,000, representing approximately 7.2% of the initial pool balance, and (ii) a pari passu promissory note that has an outstanding principal balance as of the cut-off date of $53,500,000 (the “Waterfront at Port Chester serviced companion loan” and a “serviced companion loan”) that is not part of the mortgage pool and that is currently held by Morgan Stanley Bank, N.A. The Waterfront at Port Chester mortgage loan and the Waterfront at Port Chester serviced companion loan together constitute the “Waterfront at Port Chester loan pair” and a “loan pair,” are pari passu in right of payment and will be serviced pursuant to the related intercreditor agreement and the pooling and servicing agreement for this transaction. With respect to the Waterfront at Port Chester mortgage loan, any holder of the Waterfront at Port Chester serviced companion loan will have certain consultation rights under the pooling and servicing agreement with respect to certain major decisions and other matters related to the Waterfront at Port Chester loan pair. The mortgaged property identified on Appendix I to the Free Writing Prospectus as Hilton Garden Inn W 54th Street secures (i) on a generally senior pari passu basis (a) a mortgage loan (the “Hilton Garden Inn W 54th Street mortgage loan”) with an outstanding principal balance as of the cut-off date of $75,000,000, representing approximately 6.8% of the initial pool balance, and (b) two pari passu promissory notes (collectively, the “Hilton Garden Inn W 54th Street serviced companion loan” and a “serviced companion loan”) with an aggregate outstanding principal balance as of the cut-off date of $80,000,000, which promissory notes are pari passu in right of payment with the Hilton Garden Inn W 54th Street mortgage loan, are not included in the issuing entity and are currently held by Morgan Stanley Bank, N.A., (ii) on a generally subordinate basis relative to the Hilton Garden Inn W 54th Street mortgage loan and the Hilton Garden Inn W 54th Street serviced companion loan, a subordinate promissory note (the “Hilton Garden Inn W 54th Street B note” and a “B note”) with an outstanding principal balance as of the cut-off date of $20,000,000, which promissory note is not included in the issuing entity and is currently held by Morgan Stanley Bank, N.A. The Hilton Garden Inn W 54th Street mortgage loan, the Hilton Garden Inn W 54th Street serviced companion loan and the Hilton Garden Inn W 54th Street B note are collectively referred to herein as the “Hilton Garden Inn W 54th Street loan pair” and a “loan pair.” The Hilton Garden Inn W 54th Street loan pair will be serviced pursuant to the related intercreditor agreement and the pooling and servicing agreement for this transaction. There are no other “loan pairs,” and there are no “A/B whole loans,” related to the issuing entity. See “Description of the Mortgage Pool—The A/B Whole Loans and the Loan Pairs” in the Free Writing Prospectus. With respect to any mortgage loan that is part of a loan pair, unless otherwise indicated, all LTV, DSCR and Debt Yield calculations herein include the related pari passu serviced companion loan (and in the case of the Hilton Garden Inn W 54th Street mortgage loan, such calculations exclude the Hilton Garden Inn W 54th Street B note). | ||
| Non-Serviced Loan Combinations: | The mortgaged property identified on Appendix I to the Free Writing Prospectus as 555 11th Street NW secures (1) on a generally senior pari passu basis (a) a mortgage loan (the “555 11th Street NW mortgage loan”) with an outstanding principal balance as of the cut-off date of $30,000,000, representing approximately 2.7% of the initial pool balance, and (b) one pari passu promissory note that has an outstanding principal balance as of the cut-off date of $60,000,000 (the “555 11th Street NW non-serviced companion loan” and a “non-serviced companion loan”), which promissory note is pari passu in right of payment with the 555 11th Street NW mortgage loan, is not included in the issuing entity and is currently held by the MSBAM 2015-C21 securitization trust, and (2) on a generally subordinate basis relative to the 555 11th Street NW mortgage loan and the 555 11th Street NW non-serviced companion loan, (a) a subordinated promissory note with an outstanding principal balance as of the cut-off date of $30,000,000 (the “555 11th Street NW MSBAM 2015-C21 trust B note” and a “B note”), which 555 11th Street NW MSBAM 2015-C21 trust B note is, in general, subordinate in right of payment to the 555 11th Street NW mortgage loan and the 555 11th Street NW non-serviced companion loan and, in general, senior in right of payment to the 555 11th Street NW non-securitized B note, is not included in the issuing entity and is currently held by the MSBAM 2015-C21 securitization trust, and (b) two subordinated promissory notes with an aggregate outstanding principal balance as of the cut-off date of $57,000,000 (collectively, the “555 11th Street NW non-securitized B note” and a “B note” and, together with the 555 11th Street MSBAM 2015-C21 trust B note, the “555 11th Street NW B note”), which 555 11th Street NW non-securitized B note is, in general, subordinate in right of payment to the 555 11th Street NW mortgage loan, the 555 11th Street NW non-serviced companion loan and the 555 11th Street NW MSBAM 2015-C21 trust B note, is not included in the issuing entity or mortgage pool and is currently held by Principal Life Insurance Company. The 555 11th Street NW mortgage loan, the 555 11th Street NW non-serviced companion loan and the 555 11th Street NW B note are collectively referred to herein as the “555 11th Street NW non-serviced loan combination” and a “non-serviced loan combination.” The 555 11th Street NW non-serviced loan combination will be serviced pursuant to the related intercreditor agreement and the MSBAM 2015-C21 pooling and servicing agreement. |
This is not a research report and was not prepared by the Underwriters’ research departments. Please see additional important information and qualifications at the end of this Term Sheet. |
T-8
MSBAM 2015-C22 | Structural Overview |
No mortgage loans, other than the 555 11th Street NW mortgage loan, have a non-serviced companion loan associated with them, and all of the mortgage loans, other than the 555 11th Street NW mortgage loan, are being serviced under the pooling and servicing agreement for this transaction. Accordingly, other than with respect to the 555 11th Street NW non-serviced loan combination, there are no other “non-serviced loan combinations” with respect to the issuing entity. See “Description of the Mortgage Pool—The A/B Whole Loans and the Loan Pairs” and “—The Non-Serviced Loan Combinations” in the Free Writing Prospectus. With respect to any mortgage loan that is part of a non-serviced loan combination, unless otherwise indicated, all LTV, DSCR and Debt Yield calculations herein include the related pari passu non-serviced companion loan (and, in the case of the 555 11th Street NW mortgage loan, such calculations exclude the 555 11th Street NW B note). | ||
| Appraisal Reductions: | The occurrence of certain adverse events affecting a mortgage loan (other than a non-serviced mortgage loan) (“Appraisal Events”) will require the special servicer to obtain a new appraisal or other valuation of the related mortgaged property. In general, if the principal amount of a mortgage loan plus all other amounts due under the mortgage loan and interest on advances made with respect to the mortgage loan exceeds 90% of the value of the mortgaged property determined by an appraisal or other valuation, an appraisal reduction may be created in the amount of the excess as described in the Free Writing Prospectus. Any appraisal reduction in respect of any non-serviced mortgage loan generally will be calculated in accordance with the related non-serviced mortgage loan pooling and servicing agreement, which calculations are expected to be generally similar to those provided for in the pooling and servicing agreement for this transaction. Notwithstanding the foregoing, if an appraisal is required to be obtained in accordance with the applicable pooling and servicing agreement (including with respect to any non-serviced mortgage loan) but is not obtained within 120 days following the applicable Appraisal Event, then, until such appraisal is obtained and solely for purposes of determining the amounts of P&I advances, the appraisal reduction will equal 25% of the stated principal balance of the related mortgage loan; provided that, upon receipt of an appraisal, the appraisal reduction for such mortgage loan will be recalculated generally in accordance with the preceding paragraphs. If any mortgage loan is part of an A/B whole loan, a loan pair or a non-serviced loan combination, any appraisal reduction will be calculated in respect of such A/B whole loan, loan pair or non-serviced loan combination taken as a whole. With respect to an A/B whole loan, any such appraisal reduction will be allocated first to the related B note and then to the related A note. With respect to a loan pair or non-serviced loan combination, any such appraisal reduction will be allocated between the mortgage loan and the related serviced companion loan or non-serviced companion loan, respectively, on a pro rata basis by unpaid principal balance (provided that, in the case of (i) the Hilton Garden Inn W 54th Street loan pair, such allocation will occur after the allocation of appraisal reductions to the Hilton Garden Inn W 54th Street B note, and (ii) the 555 11th Street NW non-serviced loan combination, such allocation will occur after the allocation of appraisal reductions to the 555 11th Street NW B note). If an appraisal reduction exists for, or is allocable to, any mortgage loan, the interest portion of the amount required to be advanced on that mortgage loan will be reduced in the same proportion that the appraisal reduction bears to the stated principal balance of that mortgage loan. This will reduce the funds available to pay interest on the certificates or trust components, as applicable, then outstanding. For a discussion of how appraisal reductions are calculated and allocated, see “Description of the Offered Certificates—Appraisal Reductions” in the Free Writing Prospectus. | |
| Control Rights: | During any Subordinate Control Period, the controlling class representative will have certain consent and consultation rights under the pooling and servicing agreement with respect to certain major decisions and other matters. A “Subordinate Control Period” means any period when the aggregate principal balance of the Class E Certificates (taking into account the application of any appraisal reductions to notionally reduce the aggregate principal balance of such class) is at least 25% of the initial aggregate principal balance of that class. During any Collective Consultation Period, the controlling class representative will not have any consent rights, but the controlling class representative and the trust advisor will each have certain non-binding consultation rights under the pooling and servicing agreement with respect to certain major decisions and other matters. A “Collective Consultation Period” means any period when both (i) the aggregate principal balance of the Class E Certificates (taking into account the application of any appraisal reductions to notionally reduce the aggregate principal balance of such class), is less than 25% of the initial aggregate principal balance of the Class E Certificates and (ii) the aggregate principal balance of that class (without regard to any appraisal reductions allocable to such class), is at least 25% of the initial aggregate principal balance of that class. During any Senior Consultation Period, the controlling class representative will not have any consent or consultation rights, except with respect to any rights expressly set forth in the pooling and servicing agreement, and the trust advisor will retain certain non-binding consultation rights under the pooling and servicing agreement with respect to certain major decisions and other matters. A “Senior Consultation Period” means a period when the aggregate principal balance of the Class E Certificates (without regard to any appraisal reductions allocable to such class) is less than 25% of the initial aggregate principal balance of that class. Notwithstanding any of the foregoing to the contrary, if any mortgage loan is part of an A/B whole loan, loan pair or non-serviced loan combination, the controlling class representative’s consent and/or consultation rights with respect thereto may be limited as described in the Free Writing Prospectus. See “Servicing of the Mortgage Loans—The Controlling Class Representative” in the Free Writing Prospectus. |
This is not a research report and was not prepared by the Underwriters’ research departments. Please see additional important information and qualifications at the end of this Term Sheet. |
T-9
MSBAM 2015-C22 | Structural Overview |
| A/B Whole Loan, Loan Pair and Non-Serviced Loan Combination Control Rights: | The existence of a Subordinate Control Period, Collective Consultation Period or Senior Consultation Period will not limit any control and/or consultation rights of the holder of any related B note or companion loan. In particular, (i) with respect to the Hilton Garden Inn W 54th Street loan pair, the holder of the related B note will have certain consent and consultation rights with respect to the Hilton Garden Inn W 54th Street loan pair, and will have the right to replace the special servicer with respect to such loan pair, so long as the principal balance of such B note has not been reduced or notionally reduced, as applicable, by the application of payments, losses and appraisal reductions, below 25% of its original principal balance (as reduced by principal payments), and (ii) with respect to the 555 11th Street NW non-serviced loan combination, the holder of the B note designated as the “control note” under the related intercreditor agreement (or, if such B note is an asset of the MSBAM 2015-C21 securitization trust, the designated class of certificates under the related pooling and servicing agreement) will have certain consent and consultation rights with respect to the 555 11th Street NW non-serviced loan combination, and will have the right to replace the special servicer with respect to such non-serviced loan combination, so long as the principal balance of such B note has not been reduced or notionally reduced, as applicable, by the application of payments, losses and appraisal reductions, below 25% of its original principal balance (as reduced by principal payments). See “Risk Factors—Risks Related to the Offered Certificates—Realization on a Mortgage Loan That Is Part of an A/B Whole Loan or Loan Pair May Be Adversely Affected by the Rights of the Related Directing Holder” and “Description of the Mortgage Pool—The A/B Whole Loans and the Loan Pairs” and “—The Non-Serviced Loan Combinations” in the Free Writing Prospectus. | |
| Control Eligible Certificates: | The “Control Eligible Certificates” will be the Class E, Class F, Class G and Class H Certificates. | |
| Controlling Class Representative/ Controlling Class: | The controlling class representative will be the representative appointed by more than 50% of the Controlling Class (by principal balance). The “Controlling Class” will be the most subordinate class of Control Eligible Certificates then outstanding that has an aggregate principal balance (taking into account the application of any appraisal reductions to notionally reduce the aggregate principal balance of such class) at least equal to 25% of the initial aggregate principal balance of such class; provided that if no class of Control Eligible Certificates has an aggregate principal balance (taking into account the application of any appraisal reductions to notionally reduce the aggregate principal balance of such class) at least equal to 25% of the initial aggregate principal balance of such class, then the Controlling Class will be the most senior class of Control Eligible Certificates. A summary of the consent and consultation rights of the controlling class representative, and the limitations thereon, is set forth above under “Control Rights.” The Controlling Class on the closing date will be the Class H Certificates. The initial controlling class representative is expected to be DoubleLine Capital LP or its affiliate. | |
| Appraised-Out Class: | Any class of Control Eligible Certificates, the aggregate principal balance of which (taking into account the application of any appraisal reductions to notionally reduce the aggregate principal balance of such class) has been reduced to less than 25% of its initial aggregate principal balance, is referred to as an “Appraised-Out Class.” | |
| Appraisal Remedy: | The holders of the majority (by principal balance) of an Appraised-Out Class will have the right, at their sole expense, to present to the special servicer a second appraisal for any mortgage loan (other than with respect to any non-serviced mortgage loan) for which an Appraisal Event has occurred prepared by an MAI appraiser on an “as-is” basis acceptable to the special servicer in accordance with the Servicing Standard. Upon receipt of such second appraisal, the special servicer will be required to determine, in accordance with the Servicing Standard, whether, based on its assessment of such second appraisal, any recalculation of the applicable appraisal reduction is warranted and, if so warranted, will recalculate such appraisal reduction based upon such second appraisal. If required by any such recalculation, any applicable Appraised-Out Class will have its related principal balance notionally restored to the extent required by such recalculation of the appraisal reduction, and there will be a redetermination of whether a Subordinate Control Period, a Collective Consultation Period or a Senior Consultation Period is then in effect. However, until an Appraised-Out Class is restored as the Controlling Class, the next most senior class of Control Eligible Certificates that is not an Appraised-Out Class (or, if all classes of Control Eligible Certificates are Appraised-Out Classes, the most senior class of Control Eligible Certificates), if any, will be the Controlling Class. The right of any Appraised-Out Class to present a second appraisal of any mortgage loan for which an Appraisal Event has occurred is limited to one appraisal with respect to each mortgaged property relating to the affected mortgage loan, subject to certain exceptions regarding a material change in circumstance. No certificateholders of an Appraised-Out Class will have appraisal remedies in respect of a non-serviced mortgage loan under the pooling and servicing agreement for this transaction. If, as a result of an appraisal reduction, the Hilton Garden Inn W 54th Street B note is no longer the “Control Note” under the related intercreditor agreement, the holder of such B note will have a similar right to present a second appraisal of the Hilton Garden Inn W 54th Street loan pair. Any resulting recalculation of an appraisal reduction with respect to the Hilton Garden Inn W 54th Street mortgaged property may result in such B note holder remaining the directing holder with respect to the Hilton Garden Inn W 54th Street loan pair. If, as a result of an appraisal reduction, a promissory note comprising a part of the 555 11th Street NW B note is no longer the “Control Note” under the related intercreditor agreement, the holder of such B note (or, if such B note is an asset of the MSBAM 2015-C21 securitization trust, the designated class of certificates under the related pooling and servicing agreement) will have a similar right to present a second appraisal of the 555 |
This is not a research report and was not prepared by the Underwriters’ research departments. Please see additional important information and qualifications at the end of this Term Sheet. |
T-10
MSBAM 2015-C22 | Structural Overview |
11th Street NW non-serviced loan combination. Any resulting recalculation of an appraisal reduction with respect to the 555 11th Street NW mortgaged property may result in such B note holder remaining the directing holder with respect to the 555 11th Street NW non-serviced loan combination. | ||
| Sale of Defaulted Loans: | Defaulted serviced mortgage loans will be sold in a process similar to the sale process for REO property, as described under “Servicing of the Mortgage Loans—Sale of Defaulted Mortgage Loans and REO Properties” in the Free Writing Prospectus. There will be no “fair market value purchase option,” and the controlling class representative will have no right of first refusal with respect to the sale of defaulted loans. Non-serviced mortgage loans that become defaulted loans may be sold pursuant to a similar process under the related pooling and servicing agreement governing the servicing thereof. In addition, with respect to each of the 300 South Riverside Plaza Fee mortgage loan, the Waterfront at Port Chester mortgage loan and the Hilton Garden Inn W 54th Street mortgage loan, if such mortgage loan becomes a defaulted mortgage loan and the special servicer determines to sell such mortgage loan, the special servicer will be required to sell such mortgage loan together with the related serviced companion loan as one whole loan, in each case in accordance with the provisions of the related intercreditor agreement and the pooling and servicing agreement. See “Description of the Mortgage Pool—The A/B Whole Loans and the Loan Pairs—The 300 South Riverside Plaza Fee Loan Pair,” “—The Waterfront at Port Chester Loan Pair” and “—The Hilton Garden Inn W 54th Street Loan Pair” in the Free Writing Prospectus. In addition, with respect to the 555 11th Street NW mortgage loan, if such mortgage loan becomes a defaulted mortgage loan and the special servicer under the MSBAM 2015-C21 pooling and servicing agreement determines to sell the related non-serviced companion loan, such special servicer will be required to sell such non-serviced companion loan and the 555 11th Street NW mortgage loan (and will be required to sell such mortgage loan together with the 555 11th Street NW MSBAM 2015-C21 trust B note) together as one whole loan, in accordance with the provisions of the related intercreditor agreement and the MSBAM 2015-C21 pooling and servicing agreement. See “Description of the Mortgage Pool—The Non-Serviced Loan Combinations—The 555 11th Street NW Non-Serviced Loan Combination” in the Free Writing Prospectus. | |
| Appointment and Termination of Special Servicer: | The controlling class representative will appoint the initial special servicer (but not with respect to any non-serviced mortgage loan). At any time during the Subordinate Control Period, the special servicer (other than with respect to any non-serviced mortgage loan) may be replaced by the controlling class representative. During any Collective Consultation Period and any Senior Consultation Period, the special servicer (other than with respect to any non-serviced mortgage loan) will be subject to termination without cause if certificateholders evidencing not less than 25% of voting rights request a vote of certificateholders to replace the special servicer. The certificate administrator would present the proposal to all certificateholders, and replacement would be conditioned on receipt, within one hundred eighty (180) days thereafter, of approval of the termination from holders of 75% of the voting rights of the certificates. The holders initiating such vote will be responsible for the fees and expenses of the issuing entity in connection with the replacement. During any Senior Consultation Period, if the trust advisor determines that the special servicer is not performing its duties in accordance with the Servicing Standard, the trust advisor will have the right to recommend the replacement of the special servicer with respect to the applicable mortgage loan or mortgage loans. The trust advisor’s recommendation to replace the special servicer must be confirmed by an affirmative vote of holders of a majority of the voting rights of the principal balance certificates. For purposes of the voting rights described above, the Class A-S, Class B, Class PST and Class C Certificates will be allocated voting rights in accordance with their respective percentage interests in the applicable Class A-S, Class B and Class C trust components as described in the Free Writing Prospectus. If any mortgage loan is part of an A/B whole loan, a loan pair or a non-serviced loan combination, to the extent set forth in the related intercreditor agreement, the related directing holder may have the right to replace the special servicer, with respect to the related A/B whole loan, loan pair or non-serviced loan combination to the extent set forth in the related intercreditor agreement. In particular, notwithstanding any of the foregoing to the contrary, so long as the principal balance of the Hilton Garden Inn W 54th Street B note (as reduced or notionally reduced, as applicable, by the application of payments, losses and appraisal reductions) is at least 25% of its original principal balance (as reduced by principal payments), such B note holder will have the sole right to replace the special servicer with respect to the Hilton Garden Inn W 54th Street loan pair. In addition, subject to the terms of any related intercreditor agreement (including the rights of any related directing holder thereunder), with respect to any non-serviced loan combination, the related special servicer under the related other pooling and servicing agreement pursuant to which such non-serviced loan combination is being serviced may be replaced on terms set forth in such other pooling and servicing agreement that are similar to those described above for the special servicer under the pooling and servicing agreement for this transaction; provided, that in the case of the 555 11th Street NW non-serviced loan combination, (a) the holder of the B note designated as the “control note” under the related intercreditor agreement (or, if such B note is an asset of the MSBAM 2015-C21 securitization trust, the designated class of certificates under the related pooling and servicing agreement) will have the sole right to replace the special servicer with respect to such non-serviced loan combination without cause, so long as the principal balance of such B note has not been reduced or notionally reduced, as applicable, by the application of payments, losses and appraisal reductions, below 25% of its original principal balance (as reduced by principal payments) and (b) if no such B note holder is the designated “control note,” the controlling class representative under the MSBAM 2015-C21 pooling and servicing agreement may not replace the special servicer without cause during any subordinate control period unless (i) the MSBAM 2015-C21 Class E Certificates is the controlling class of certificates under the MSBAM 2015-C21 pooling and servicing agreement, (ii) LNR Partners, LLC or its affiliate is not acting as the special servicer under the MSBAM 2015-C21 pooling and servicing agreement or (iii) LNR Securities Holdings, LLC or its |
This is not a research report and was not prepared by the Underwriters’ research departments. Please see additional important information and qualifications at the end of this Term Sheet. |
T-11
MSBAM 2015-C22 | Structural Overview |
affiliate owns less than 15% of the then controlling class of certificates under the MSBAM 2015-C21 pooling and servicing agreement. See “Description of the Mortgage Pool—The A/B Whole Loans and the Loan Pairs” and “—The Non-Serviced Loan Combinations” in the Free Writing Prospectus. | ||
| Servicing Standard: | Each of the master servicer and the special servicer is obligated to service and administer the mortgage loans (and, if applicable, the related B notes and serviced companion loans) in accordance with the definition of the “Servicing Standard” described in the Free Writing Prospectus and the terms of the pooling and servicing agreement, provided that each non-serviced mortgage loan, if any, will be serviced by another master servicer or special servicer under the pooling and servicing agreement with respect to the securitization of the related companion loan or applicable portion thereof. | |
Defaulted Mortgage Loan Waterfall: | Amounts received by the issuing entity in respect of defaulted mortgage loans in connection with liquidation of any mortgage loan, net of unreimbursed advances and interest thereon, servicing compensation and other amounts payable or reimbursable therefrom, will be applied so that amounts allocated as a recovery of accrued and unpaid interest will not, in the first instance, include any amount by which the interest portion of P&I advances previously made was reduced as a result of appraisal reductions. After the adjusted interest amount is so allocated, any remaining net proceeds will be allocated to pay principal on the mortgage loan until the unpaid principal amount of the mortgage loan has been reduced to zero. Any remaining proceeds would then be allocated as a recovery of accrued and unpaid interest corresponding to the amount by which the interest portion of P&I advances previously made was reduced as a result of appraisal reductions. | |
| Trust Advisor: | The trust advisor will be required to promptly review all information available to certain privileged persons on the certificate administrator’s website related to any specially serviced mortgage loan or REO property and each asset status report with respect to specially serviced mortgage loans (provided that during any Subordinate Control Period, the trust advisor may only review final asset status reports). During any Collective Consultation Period and any Senior Consultation Period, within sixty (60) days after the end of each calendar year during which any mortgage loan was a specially serviced mortgage loan or any mortgaged property was an REO property, the trust advisor will be required to meet with representatives of the special servicer to review certain operational practices of the special servicer related to specially serviced mortgage loans and REO properties. In addition, during any Collective Consultation Period and any Senior Consultation Period, based on (i) the trust advisor’s annual meeting with the special servicer and (ii) the trust advisor’s review of any asset status reports and other information delivered to the trust advisor by the special servicer and any other information available to certain privileged persons on the certificate administrator’s website, the trust advisor will be required to prepare an annual report to be provided to the certificate administrator (and to be made available through the certificate administrator’s website) setting forth its assessment of the special servicer’s performance of its duties under the pooling and servicing agreement during the prior calendar year on a platform-level basis with respect to the resolution and liquidation of specially serviced mortgage loans and REO properties. No such annual report will be required to be prepared or delivered with respect to any calendar year as to which no annual meeting has occurred or with respect to any calendar year during which no asset status reports have been prepared in connection with a specially serviced mortgage loan or REO property. However, the trust advisor’s obligations described in the preceding three paragraphs will not apply to non-serviced mortgage loans. Furthermore, during any Collective Consultation Period and any Senior Consultation Period, the special servicer will be required to consult (on a non-binding basis) the trust advisor in connection with certain major decisions involving any serviced mortgage loan, A/B whole loan, loan pair or any related REO property to the extent described in this Term Sheet and the Free Writing Prospectus and as set forth in the pooling and servicing agreement; provided that, with respect to matters relating to any A/B whole loan or loan pair, the special servicer will only be required to consult the trust advisor with regard to such matters if the holder of the related B note or serviced companion loan, as applicable, is not (or is no longer) the directing holder with respect to such A/B whole loan or loan pair pursuant to the terms of the applicable intercreditor agreement. The trust advisor will have no consultation rights with respect to any non-serviced mortgage loan or any related non-serviced companion loan. During any Subordinate Control Period, there will be no annual meeting between the trust advisor and the special servicer or any annual report prepared by the trust advisor, and the trust advisor will not distribute any report based on any review of the special servicer’s actions. In addition, the trust advisor will not be permitted to consult or consent with regard to any particular servicing actions or otherwise opine on the actions of the special servicer with respect to any mortgage loan during any Subordinate Control Period. | |
| Trust Advisor Expenses: | The trust advisor will be entitled, on each distribution date, to reimbursement for any trust advisor expenses, including unreimbursed indemnification amounts and other expenses (which do not include trust advisor fees) payable to the trust advisor pursuant to the terms of the pooling and servicing agreement. No trust advisor expenses (which do not include trust advisor fees) will be allocated to or otherwise borne by the Control Eligible Certificates, and all trust advisor expenses will be allocated to reduce amounts due and owing to certain classes of the non-Control Eligible Certificates as described in the Free Writing Prospectus and above in this Term Sheet. |
This is not a research report and was not prepared by the Underwriters’ research departments. Please see additional important information and qualifications at the end of this Term Sheet. |
T-12
MSBAM 2015-C22 | Structural Overview |
| Termination and Replacement of Trust Advisor: | The trust advisor may be terminated or replaced without cause as described in the Free Writing Prospectus under “Servicing of the Mortgage Loans—The Trust Advisor—Termination of the Trust Advisor Without Cause.” | |
| Deal Website: | The certificate administrator will be required to maintain a deal website which will include, among other items, (i) distribution date statements, (ii) CREFC® reports, (iii) summaries of final asset status reports, (iv) inspection reports, (v) appraisals, (vi) various special notices described in the Free Writing Prospectus, (vii) the “Investor Q&A Forum” and (viii) a voluntary “Investor Registry.” Investors may access the deal website following execution of an investor certification as described in the Free Writing Prospectus. |
This is not a research report and was not prepared by the Underwriters’ research departments. Please see additional important information and qualifications at the end of this Term Sheet. |
T-13
| MSBAM 2015-C22 | Collateral Overview |
| Mortgage Loan Sellers | No. of Mortgage Loans | No. of Mortgaged Properties | Aggregate Cut-off Date Balance | % of Pool(1) |
| Morgan Stanley Mortgage Capital Holdings LLC | 22 | 25 | $492,515,003 | 44.5% |
| Bank of America, National Association | 29 | 33 | $300,291,688 | 27.1% |
| CIBC Inc. | 18 | 21 | $220,116,019 | 19.9% |
| Starwood Mortgage Funding III LLC | 8 | 12 | $94,401,306 | 8.5% |
| Total: | 77 | 91 | $1,107,324,016 | 100.0% |
Pool Statistics
| Aggregate Cut-off Date Balance: | $1,107,324,016 |
| Number of Mortgage Loans: | 77 |
| Average Cut-off Date Balance per Mortgage Loan: | $14,380,831 |
| Number of Mortgaged Properties: | 91 |
| Average Cut-off Date Balance per Mortgaged Property: | $12,168,396 |
| Weighted Average Mortgage Rate: | 4.266% |
| % of Pool Secured by 5 Largest Mortgage Loans: | 33.1% |
| % of Pool Secured by 10 Largest Mortgage Loans: | 47.9% |
% of Pool Secured by ARD Loans(2): | 9.0% |
Weighted Average Original Term to Maturity (months)(2): | 116 |
Weighted Average Remaining Term to Maturity (months)(2): | 115 |
| Weighted Average Seasoning (months): | 1 |
| % of Pool Secured by Single Tenant Mortgaged Properties: | 12.0% |
Additional Debt
% of Pool with Pari Passu Mortgage Debt: | 25.7% |
| % of Pool with Mezzanine Debt: | 9.5% |
| % of Pool with Subordinate Mortgage Debt: | 9.5% |
Credit Statistics(3)
| Weighted Average UW NOI DSCR: | 1.86x |
| Weighted Average UW NOI Debt Yield: | 10.0% |
| Weighted Average UW NCF DSCR: | 1.74x |
| Weighted Average UW NCF Debt Yield: | 9.3% |
Weighted Average Cut-off Date LTV Ratio(4): | 67.5% |
Weighted Average Maturity Date LTV Ratio(2)(4): | 59.2% |
Footnotes are set forth on the following page.
| This is not a research report and was not prepared by the Underwriters’ research departments. Please see additional important information and qualifications at the end of this Term Sheet. |
T-14
| MSBAM 2015-C22 | Collateral Overview |
Amortization
| Weighted Average Original Amortization Term (months): | 346 |
| Weighted Average Remaining Amortization Term (months): | 346 |
| % of Pool Amortizing Balloon: | 38.5% |
| % of Pool Interest Only followed by Amortizing Balloon: | 34.5% |
% of Pool Interest Only through Maturity(2): | 27.0% |
Lockboxes
| % of Pool with Hard Lockboxes: | 46.8% |
| % of Pool with Soft Lockboxes: | 11.7% |
| % of Pool with Springing Lockboxes: | 39.2% |
| % of Pool with No Lockboxes: | 2.3% |
Reserves
| % of Pool Requiring Tax Reserves: | 71.4% |
| % of Pool Requiring Insurance Reserves: | 46.4% |
| % of Pool Requiring Replacement Reserves: | 72.3% |
% of Pool Requiring TI/LC Reserves(5): | 79.4% |
Call Protection
| % of Pool with lockout period, followed by defeasance until open period: | 89.2% |
| % of Pool with lockout period, followed by the greater of a prepayment premium and yield maintenance until open period: | 10.1% |
| % of Pool with lockout period, followed by defeasance or the greater of a prepayment premium and yield maintenance until open period: | 0.5% |
| % of Pool with the greater of a prepayment premium and yield maintenance until open period: | 0.2% |
| (1) | Unless otherwise indicated, all references to “% of Pool” in this Term Sheet reflect a percentage of the aggregate principal balance of the mortgage pool as of the Cut-off Date, after application of all payments of principal due during or prior to April 2015. |
| (2) | With respect to any ARD Loan, unless otherwise indicated, references in this Term Sheet to the applicable “maturity date” refer to the applicable anticipated repayment date with respect to such ARD Loan, and such applicable anticipated repayment date is treated as its maturity date for all purposes hereof. |
| (3) | With respect to any mortgage loan that is part of a loan pair or a non-serviced loan combination, unless otherwise indicated, all balance per SF/Unit, LTV ratio, DSCR and Debt Yield calculations in this term sheet include the related pari passu companion loan and exclude any subordinate B notes, as applicable. Additionally, LTV ratio, DSCR and Debt Yield figures in this Term Sheet are calculated for mortgage loans without regard to any additional indebtedness that may be incurred at a future date. With respect to any cross-collateralized mortgage loans, unless otherwise indicated, all balance per SF/Unit, LTV ratio, DSCR and Debt Yield statistics in this Term Sheet are calculated on an aggregate basis. With respect to any leased fee loans, the SF and all balance per SF/Unit figures in this Term Sheet are based on the size of the non-collateral improvements. |
| (4) | The LTV ratios set forth in this Term Sheet are generally based on the “as-is” values of the related mortgaged properties; provided, that such LTV ratios may be based on “as-stabilized” values in certain cases in which reserves have been established at origination for the applicable condition or circumstance that is expected to result in stabilization. See the definition of “Appraised Value” under “Description of the Mortgage Pool—Additional Mortgage Loan Information” in the Free Writing Prospectus. |
| (5) | Excludes hospitality, multifamily, manufactured housing, self-storage and leased fee properties. |
| This is not a research report and was not prepared by the Underwriters’ research departments. Please see additional important information and qualifications at the end of this Term Sheet. |
T-15
| MSBAM 2015-C22 | Characteristics of the Mortgage Loans |
| Top 10 Mortgage Loans | ||||||||||||||
Loan No. | Mortgage Loan Seller | Property Name | City | State | Property Type | Cut-off Date Balance | % of Pool | SF/Units | Cut-off Date Balance per SF/Unit | UW NCF DSCR | UW NOI Debt Yield | Cut-off Date LTV | Maturity Date LTV | |
| 1 | MSMCH | 300 South Riverside Plaza Fee(1) | Chicago | IL | Leased Fee | $100,000,000 | 9.0% | 1,055,273 | $158.25 | 1.48x | 5.9% | 72.9% | 72.9% | |
| 2 | MSMCH | Waterfront at Port Chester(2) | Port Chester | NY | Retail | $80,000,000 | 7.2% | 349,743 | $381.71 | 1.66x | 7.1% | 75.0% | 75.0% | |
| 3 | MSMCH | Hilton Garden Inn W 54th Street(3) | New York | NY | Hospitality | $75,000,000 | 6.8% | 401 | $386,533.67 | 2.64x | 11.7% | 61.8% | 61.8% | |
| 4 | CIBC | Dallas Marriott Las Colinas | Irving | TX | Hospitality | $65,900,000 | 6.0% | 364 | $181,043.96 | 1.56x | 11.0% | 69.0% | 56.7% | |
| 5 | BANA | Hilton Houston Westchase | Houston | TX | Hospitality | $45,250,000 | 4.1% | 297 | $152,356.90 | 1.71x | 12.3% | 68.8% | 65.7% | |
| 6 | MSMCH | Bozzuto’s Distribution Center | Cheshire | CT | Industrial | $43,884,335 | 4.0% | 986,565 | $44.48 | 1.65x | 13.0% | 61.8% | 37.7% | |
| 7 | BANA | Harrison Creek Apartments | Petersburg | VA | Multifamily | $34,300,000 | 3.1% | 336 | $102,083.33 | 1.30x | 7.8% | 76.2% | 63.6% | |
| 8 | MSMCH | 555 11th Street NW(4) | Washington | D.C. | Office | $30,000,000 | 2.7% | 414,204 | $217.28 | 5.49x | 17.6% | 29.1% | 29.1% | |
| 9 | CIBC | Columbus Commons | Philadelphia | PA | Retail | $28,200,000 | 2.5% | 124,443 | $226.61 | 1.31x | 7.9% | 75.0% | 60.0% | |
| 10 | MSMCH | Ayrsley Town Center | Charlotte | NC | Mixed Use | $27,500,000 | 2.5% | 189,905 | $144.81 | 1.35x | 9.0% | 73.1% | 62.8% | |
| Total/Wtd. Avg. | $530,034,335 | 47.9% | 1.92x | 9.7% | 67.8% | 61.8% | ||||||||
| (1) | The 300 South Riverside Plaza Fee mortgage loan is part of a $167,000,000 pari passu loan pair that is evidenced by two pari passu promissory notes. The 300 South Riverside Plaza Fee mortgage loan is evidenced by one of such pari passu notes (Note A-1) with an outstanding principal balance as of the Cut-off Date of $100,000,000. The pari passu note not included in the Issuing Entity (Note A-2) evidences the related serviced companion loan, which has an outstanding balance as of the Cut-off Date of $67,000,000. Unless otherwise indicated, all LTV, DSCR, Debt Yield and Cut-off Date Balance PSF/Unit calculations include the related pari passu serviced companion loan. See “Description of the Mortgage Pool—The A/B Whole Loans and the Loan Pairs—The 300 South Riverside Plaza Fee Loan Pair” in the Free Writing Prospectus. |
| (2) | The Waterfront at Port Chester mortgage loan is part of a $133,500,000 pari passu loan pair that is evidenced by two pari passu promissory notes. The Waterfront at Port Chester mortgage loan is evidenced by one of such pari passu notes (Note A-1) with an outstanding principal balance as of the Cut-off Date of $80,000,000. The pari passu note not included in the Issuing Entity (Note A-2) evidences the related serviced companion loan, which has an outstanding balance as of the Cut-off Date of $53,500,000. Unless otherwise indicated, all LTV, DSCR, Debt Yield and Cut-off Date Balance PSF/Unit calculations include the related pari passu serviced companion loan. See “Description of the Mortgage Pool—The A/B Whole Loans and the Loan Pairs—The Waterfront at Port Chester Loan Pair” in the Free Writing Prospectus. |
| (3) | The Hilton Garden Inn W 54th Street mortgage loan is part of a loan pair evidenced by (i) three pari passu senior promissory notes: (a) Note A-2, representing the Hilton Garden Inn W 54th Street mortgage loan, which has an outstanding principal balance as of the Cut-off Date of $75,000,000, and (b) Note A-1 and Note A-3, which have an aggregate outstanding principal balance as of the Cut-off Date of $80,000,000 and are currently held by Morgan Stanley Bank, N.A. and (ii) one subordinate note (Note B), which has an outstanding principal balance as of the Cut-off Date of $20,000,000 and is currently held by Morgan Stanley Bank, N.A. Unless otherwise indicated, all LTV, DSCR, Debt Yield and Cut-off Date Balance per SF/Unit calculations include the related pari passu serviced companion loan but do not include the related B note. The annual interest rate payable on the Hilton Garden Inn W 54th Street B note is 7.000% and the UW NCF DSCR, UW NOI Debt Yield and Cut-off Date LTV for the Hilton Garden Inn W 54th Street loan pair, including the Hilton Garden Inn W 54th Street B note, are equal to 2.16x, 10.4% and 69.7%, respectively. See “Description of the Mortgage Pool—The A/B Whole Loans and the Loan Pairs—The Hilton Garden Inn W 54th Street Loan Pair” in the Free Writing Prospectus. |
| (4) | The 555 11th Street NW mortgage loan is part of a non-serviced loan combination evidenced by (i) two pari passu senior promissory notes: (a) Note A-1B, representing the 555 11th Street NW mortgage loan, which has an outstanding principal balance as of the Cut-off Date of $30,000,000, and (b) Note A-1A, referred to as the “555 11th Street NW non-serviced companion loan,” which has an outstanding principal balance as of the Cut-off Date of $60,000,000 and is included in the MSBAM 2015-C21 securitization trust, (ii) one subordinate note (Note A-2, referred to as the “555 11th Street NW MSBAM 2015-C21 trust B note”), which has an outstanding principal balance as of the Cut-off Date of $30,000,000 and is also included in the MSBAM 2015-C21 securitization trust, and (iii) two subordinate notes (Note A-3 and Note B, referred to collectively as the “555 11th Street NW non-securitized B note”), which have an aggregate outstanding principal balance as of the Cut-off Date of $57,000,000 and are currently held by Principal Life Insurance Company. Unless otherwise indicated, all LTV, DSCR, Debt Yield and Cut-off Date Balance per SF/Unit calculations include the related pari passu non-serviced companion loan without regard to the related B notes. The annual interest rates payable on the 555 11th Street NW MSBAM 2015-C21 trust B note and the 555 11th Street NW non-securitized B note are 3.16633333% and 4.99280702%, respectively, and the UW NCF DSCR, UW NOI Debt Yield and Cut-off Date LTV for the 555 11th Street NW non-serviced loan combination, including the 555 11th Street NW MSBAM 2015-C21 trust B note and the 555 11th Street NW non-securitized B note, are equal to 2.35x, 9.0% and 57.3%, respectively. See “Description of the Mortgage Pool—The Non-Serviced Loan Combinations—The 555 11th Street NW Non-Serviced Loan Combination” in the Free Writing Prospectus. See “Description of the Mortgage Pool—The Non-Serviced Loan Combinations—The 555 11th Street NW Non-Serviced Loan Combination” in the Free Writing Prospectus. |
| This is not a research report and was not prepared by the Underwriters’ research departments. Please see additional important information and qualifications at the end of this Term Sheet. |
T-16
| MSBAM 2015-C22 | Characteristics of the Mortgage Loans |
Mortgage Loans with Pari Passu Companion Loans | |||||||||||||||||||||||||
Loan No. | Mortgage Loan Seller | Property Name | Mortgage Loan Cut-off Date Balance | Companion Loan Cut-off Date Balance | Combined Cut-off Date Balance | Lead Pooling and Servicing Agreement | Master Servicer | Special Servicer | Control Rights | Combined UW NCF DSCR | Combined UW NOI Debt Yield | Combined Cut-off Date LTV | |||||||||||||
| 1 | MSMCH | 300 South Riverside Plaza Fee | $100,000,000 | $67,000,000 | $167,000,000 | MSBAM 2015-C22 | Wells Fargo | Midland | MSBAM 2015-C22 | 1.48x | 5.9% | 72.9% | |||||||||||||
| 2 | MSMCH | Waterfront at Port Chester | $80,000,000 | $53,500,000 | $133,500,000 | MSBAM 2015-C22 | Wells Fargo | Midland | MSBAM 2015-C22 | 1.66x | 7.1% | 75.0% | |||||||||||||
| 3 | MSMCH | Hilton Garden Inn W 54th Street(1) | $75,000,000 | $80,000,000 | $155,000,000 | MSBAM 2015-C22 | Wells Fargo | Midland | MSBAM 2015-C22(3) | 2.64x | 11.7% | 61.8% | |||||||||||||
| 8 | MSMCH | 555 11th Street NW(2) | $30,000,000 | $60,000,000 | $90,000,000 | MSBAM 2015-C21 | KeyBank | LNR | MSBAM 2015-C21(4) | 5.49x | 17.6% | 29.1% | |||||||||||||
| (1) | The Hilton Garden Inn W 54th Street mortgage loan is part of a loan pair evidenced by (i) three pari passu senior promissory notes: (a) Note A-2, representing the Hilton Garden Inn W 54th Street mortgage loan, which has an outstanding principal balance as of the Cut-off Date of $75,000,000, and (b) Note A-1 and Note A-3, which have an aggregate outstanding principal balance as of the Cut-off Date of $80,000,000 and are currently held by Morgan Stanley Bank, N.A. and (ii) one subordinate note (Note B), which has an outstanding principal balance as of the Cut-off Date of $20,000,000 and is currently held by Morgan Stanley Bank, N.A. Unless otherwise indicated, all LTV, DSCR, Debt Yield and Cut-off Date Balance per SF/Unit calculations include the related pari passu serviced companion loan but do not include the related B note. The annual interest rate payable on the Hilton Garden Inn W 54th Street B note is 7.000% and the UW NCF DSCR, UW NOI Debt Yield and Cut-off Date LTV for the Hilton Garden Inn W 54th Street loan pair, including the Hilton Garden Inn W 54th Street B note, are equal to 2.16x, 10.4% and 69.7%, respectively. See “Description of the Mortgage Pool—The A/B Whole Loans and the Loan Pairs—The Hilton Garden Inn W 54th Street Loan Pair” in the Free Writing Prospectus. |
| (2) | The 555 11th Street NW mortgage loan is part of a non-serviced loan combination evidenced by (i) two pari passu senior promissory notes: (a) Note A-1B, representing the 555 11th Street NW mortgage loan, which has an outstanding principal balance as of the Cut-off Date of $30,000,000, and (b) Note A-1A, referred to as the “555 11th Street NW non-serviced companion loan,” which has an outstanding principal balance as of the Cut-off Date of $60,000,000 and is included in the MSBAM 2015-C21 securitization trust, (ii) one subordinate note (Note A-2, referred to as the “555 11th Street NW MSBAM 2015-C21 trust B note”), which has an outstanding principal balance as of the Cut-off Date of $30,000,000 and is also included in the MSBAM 2015-C21 securitization trust, and (iii) two subordinate notes (Note A-3 and Note B, referred to collectively as the “555 11th Street NW non-securitized B note”), which have an aggregate outstanding principal balance as of the Cut-off Date of $57,000,000 and are currently held by Principal Life Insurance Company. Unless otherwise indicated, all LTV, DSCR, Debt Yield and Cut-off Date Balance per SF/Unit calculations include the related pari passu non-serviced companion loan without regard to the related B notes. The annual interest rates payable on the 555 11th Street NW MSBAM 2015-C21 trust B note and the 555 11th Street NW non-securitized B note are 3.16633333% and 4.99280702%, respectively, and the UW NCF DSCR, UW NOI Debt Yield and Cut-off Date LTV for the 555 11th Street NW non-serviced loan combination, including the 555 11th Street NW MSBAM 2015-C21 trust B note and the 555 11th Street NW non-securitized B note, are equal to 2.35x, 9.0% and 57.3%, respectively. See “Description of the Mortgage Pool—The Non-Serviced Loan Combinations—The 555 11th Street NW Non-Serviced Loan Combination” in the Free Writing Prospectus. See “Description of the Mortgage Pool—The Non-Serviced Loan Combinations—The 555 11th Street NW Non-Serviced Loan Combination” in the Free Writing Prospectus. |
| (3) | The Hilton Garden Inn W 54th Street loan pair will be serviced pursuant to the MSBAM 2015-C22 pooling and servicing agreement. Such loan pair will be administered by the master servicer and the special servicer under the MSBAM 2015-C22 pooling and servicing agreement in accordance with the servicing standard, and the special servicer in respect of such loan pair may be removed or replaced by the holder of the related B note, so long as the principal balance of such B note (as reduced or notionally reduced, as applicable, by the application of payments, losses and appraisal reductions) has not been reduced or notionally reduced, as applicable, below 25% of its original principal balance (as reduced by principal payments), and (if the related B note fails to satisfy such criteria) by the controlling class representative or MSBAM 2015-C22 certificateholders with the requisite voting rights under the MSBAM 2015-C22 pooling and servicing agreement, all pursuant to the terms of the related intercreditor agreement and the MSBAM 2015-C22 pooling and servicing agreement. See “Description of the Mortgage Pool—The A/B Whole Loan and the Loan Pairs—The Hilton Garden Inn W 54th Street Loan pair” in the Free Writing Prospectus. |
| (4) | The 555 11th Street NW non-serviced loan combination will be serviced pursuant to the MSBAM 2015-C21 pooling and servicing agreement. Such non-serviced loan combination will be administered by the master servicer and the special servicer under the MSBAM 2015-C21 pooling and servicing agreement in accordance with the servicing standard thereunder, and the special servicer in respect of such loan pair may be removed or replaced by the holder of the most junior related B note (or, if such B note is an asset of the MSBAM 2015-C21 issuing entity, the majority holder (or designee thereof) of the designated class of certificates evidencing interests therein), the principal balance of which B note (as reduced or notionally reduced, as applicable, by the application of payments, losses and appraisal reductions) has not been reduced below 25% of its original principal balance (as reduced by principal payments), and (if no related B note satisfies such criteria) by the MSBAM 2015-C21 controlling class representative or MSBAM 2015-C21 certificateholders with the requisite MSBAM 2015-C21 voting rights, as applicable, all pursuant to the terms of the related intercreditor agreement and the MSBAM 2015-C21 pooling and servicing agreement. See “Description of the Mortgage Pool—The Non-Serviced Loan Combinations—The 555 11th Street NW Non-Serviced Loan Combination” in the Free Writing Prospectus. |
| This is not a research report and was not prepared by the Underwriters’ research departments. Please see additional important information and qualifications at the end of this Term Sheet. |
T-17
| MSBAM 2015-C22 | Characteristics of the Mortgage Loans |
| Mortgage Loans with Subordinate Mortgage Debt | |||||||||||
Loan No. | Mortgage Loan Seller | Property Name | Mortgage Loan Cut-off Date Balance | Cut-off Date Balance per Unit/SF | Subordinate Debt Cut-off Date Balance | UW NCF DSCR | UW NOI Debt Yield | Cut-off Date LTV | Total Mortgage Debt UW NCF DSCR | Total Mortgage Debt UW NOI Debt Yield | Total Mortgage Debt Cut-off Date LTV |
| 3 | MSMCH | Hilton Garden Inn W 54th Street(1) | $75,000,000 | $386,533.67 | $20,000,000 | 2.64x | 11.7% | 61.8% | 2.16x | 10.4% | 69.7% |
| 8 | MSMCH | 555 11th Street NW(2) | $30,000,000 | $217.28 | $87,000,000 | 5.49x | 17.6% | 29.1% | 2.35x | 9.0% | 57.3% |
| (1) | See Footnote (1) to the table entitled “Mortgage Loans with Pari Passu Companion Loans” for a description of the Hilton Garden Inn W 54th Street loan pair. |
| (2) | See Footnote (2) to the table entitled “Mortgage Loans with Pari Passu Companion Loans” for a description of the 555 11th Street NW non-serviced loan combination. |
| Mortgage Loans with Mezzanine Debt | |||||||||||
Loan No. | Mortgage Loan Seller | Property Name | Mortgage Loan Cut-off Date Balance | Cut-off Date Balance per Unit/SF | Mezzanine Debt Cut-off Date Balance | UW NCF DSCR | UW NOI Debt Yield | Cut-off Date LTV | Total Debt UW NCF DSCR | Total Debt UW NOI Debt Yield | Total Debt Cut-off Date LTV |
| 3 | MSMCH | Hilton Garden Inn W 54th Street(1) | $75,000,000 | $386,533.67 | $25,000,000 | 2.64x | 11.7% | 61.8% | 1.62x | 9.1% | 79.7% |
| 8 | MSMCH | 555 11th Street NW(2) | $30,000,000 | $217.28 | $50,000,000 | 5.49x | 17.6% | 29.1% | 1.66x | 7.0% | 73.5% |
| (1) | Total Debt UW NCF DSCR, Total Debt UW NOI Debt Yield and Total Debt Cut-off Date LTV figures shown above are calculated based on the $155,000,000 pari passu notes, the $20,000,000 subordinate note and the $25,000,000 mezzanine debt. |
| (2) | Total Debt UW NCF DSCR, Total Debt UW NOI Debt Yield and Total Debt Cut-off Date LTV figures shown above are calculated based on the $90,000,000 pari passu notes, the $87,000,000 subordinate notes and the $50,000,000 mezzanine debt. |
| This is not a research report and was not prepared by the Underwriters’ research departments. Please see additional important information and qualifications at the end of this Term Sheet. |
T-18
| MSBAM 2015-C22 | Characteristics of the Mortgage Loans |
Prior Securitization History(1) | ||||||||||||||
Loan No. | Mortgage Loan Seller | Property Name | City | State | Property Type | Cut-off Date Balance | % of Pool | SF/Units | Cut-off Date Balance per SF/Unit | UW NCF DSCR | UW NOI Debt Yield | Cut-off Date LTV | Maturity Date LTV | Prior Securitization |
| 2 | MSMCH | Waterfront at Port Chester | Port Chester | NY | Retail | $80,000,000 | 7.2% | 349,743 | $381.71 | 1.66x | 7.1% | 75.0% | 75.0% | BACM 2006-1 |
| 4 | CIBC | Dallas Marriott Las Colinas | Irving | TX | Hospitality | $65,900,000 | 6.0% | 364 | $181,043.96 | 1.56x | 11.0% | 69.0% | 56.7% | WBCMT 2006-C23 |
| 5 | BANA | Hilton Houston Westchase | Houston | TX | Hospitality | $45,250,000 | 4.1% | 297 | $152,356.90 | 1.71x | 12.3% | 68.8% | 65.7% | UBSCM 2007-FL1 |
| 6 | MSMCH | Bozzuto’s Distribution Center | Cheshire | CT | Industrial | $43,884,335 | 4.0% | 986,565 | $44.48 | 1.65x | 13.0% | 61.8% | 37.7% | MLMT 2005-MKB2 |
| 9 | CIBC | Columbus Commons | Philadelphia | PA | Retail | $28,200,000 | 2.5% | 124,443 | $226.61 | 1.31x | 7.9% | 75.0% | 60.0% | GMACC 2005-C1 |
| 11 | BANA | Oliveira Plaza | Port Hueneme | CA | Retail | $25,000,000 | 2.3% | 116,002 | $215.51 | 1.33x | 8.2% | 71.0% | 64.7% | GSMS 2010-C1 |
| 12 | SMF III | Bowman Station and Chenal Place Shopping Center | Little Rock | AR | Retail | $21,675,000 | 2.0% | 161,546 | $134.17 | 1.40x | 9.0% | 75.0% | 64.0% | GMACC 2005-C1 |
| 13 | MSMCH | Doubletree by Hilton Hotel Chicago - Alsip | Alsip | IL | Hospitality | $16,454,898 | 1.5% | 193 | $85,258.54 | 1.63x | 12.3% | 58.6% | 47.7% | CD 2006-CD3 |
| 17 | SMF III | Mesa Dunes | Mesa | AZ | Manuf. Housing | $14,600,000 | 1.3% | 422 | $34,597.16 | 1.39x | 8.5% | 74.3% | 64.9% | JPMCC 2005-LDP2 |
| 22 | SMF III | Sherwood Gardens | Salinas | CA | Retail | $13,400,000 | 1.2% | 169,968 | $78.84 | 1.83x | 11.7% | 57.5% | 52.6% | MSC 2005-HQ6 |
| 23 | CIBC | Pathmark - Linden | Linden | NJ | Retail | $13,275,000 | 1.2% | 59,250 | $224.05 | 1.36x | 8.7% | 75.0% | 64.1% | CWCI 2007-C2 |
| 27 | CIBC | Shopper’s World Outlots | Clifton Park | NY | Retail | $5,000,000 | 0.5% | 10,200 | $479.62 | 1.41x | 8.1% | 69.0% | 58.2% | JPMCC 2005-CB11 |
| 28 | CIBC | Cathedral Village Shopping Center | Cathedral City | CA | Retail | $11,815,000 | 1.1% | 100,631 | $117.41 | 2.01x | 12.5% | 56.3% | 44.9% | JPMCC 2005-CB12 |
| 29 | BANA | Stratford Apartments | Indianapolis | IN | Multifamily | $11,750,000 | 1.1% | 458 | $25,655.02 | 1.43x | 10.0% | 74.0% | 63.4% | JPMCC 2005-LDP2 |
| 31 | BANA | Green Meadows Apartments | Houston | TX | Multifamily | $11,100,000 | 1.0% | 240 | $46,250.00 | 1.50x | 9.3% | 75.0% | 68.4% | FNA 2013-M13 |
| 32 | BANA | Santa Ana Plaza | Santa Ana | CA | Retail | $11,000,000 | 1.0% | 45,415 | $242.21 | 2.35x | 10.5% | 60.8% | 60.8% | MSC 2005-HQ6 |
| 36 | BANA | Beach Boulevard Self Storage | Westminster | CA | Mixed Use | $9,987,403 | 0.9% | 71,997 | $138.72 | 1.43x | 8.7% | 69.8% | 56.2% | JPMCC 2005-LDP2 |
| 38 | CIBC | Dover II Shopping Center | Westminster | CA | Retail | $9,750,000 | 0.9% | 58,898 | $165.54 | 2.26x | 14.1% | 40.5% | 32.4% | LBUBS 2005-C2 |
| 49 | MSMCH | Walgreens - Marina del Rey | Marina del Rey | CA | Retail | $7,000,000 | 0.6% | 11,208 | $624.55 | 1.45x | 8.8% | 58.3% | 50.7% | MSC 2005-HQ6 |
| 50 | CIBC | Williamsburg Square Apartments | Independence | MO | Multifamily | $6,637,500 | 0.6% | 144 | $46,093.75 | 1.42x | 8.9% | 75.0% | 65.3% | JPMCC 2005-CB12 |
| 57 | CIBC | Newhall Shopping Center | Santa Clarita | CA | Retail | $5,504,686 | 0.5% | 21,402 | $257.20 | 2.07x | 12.6% | 53.4% | 42.7% | JPMCC 2005-CB12 |
| 58 | BANA | Sunrise Lake Village | Pearland | TX | Retail | $5,193,802 | 0.5% | 40,268 | $128.98 | 1.69x | 10.6% | 71.7% | 58.2% | BSCMS 2006-PW11 |
| 59 | SMF III | Hampton Inn Carbondale | Carbondale | IL | Hospitality | $5,094,070 | 0.5% | 80 | $63,675.88 | 1.83x | 13.0% | 70.3% | 57.3% | GCCFC 2007-GG9 |
| 75 | BANA | Walgreens - Lebanon, IN | Lebanon | IN | Retail | $2,695,596 | 0.2% | 14,820 | $181.89 | 1.44x | 9.8% | 56.2% | 41.7% | WBCMT 2005-C17 |
| 77 | BANA | Rite Aid - Midland, MI | Midland | MI | Retail | $1,946,631 | 0.2% | 11,180 | $174.12 | 2.43x | 16.5% | 50.6% | 37.1% | WBCMT 2005-C17 |
| Total | $472,113,923 | 42.6% | ||||||||||||
| This is not a research report and was not prepared by the Underwriters’ research departments. Please see additional important information and qualifications at the end of this Term Sheet. |
T-19
| MSBAM 2015-C22 | Characteristics of the Mortgage Loans |
Mortgage Loans with Scheduled Balloon Payments and Related Classes(1)
| Class A-2 ($66,500,000) | |||||||||||||||||
Loan No. | Mortgage Loan Seller | Property Name | State | Property Type | Cut-off Date Balance | % of Pool | Maturity Date Balance | % of Class A-2 Certificate Principal Balance | SF/ Units | Cut-off Date Balance per SF/Unit | UW NCF DSCR | UW NOI Debt Yield | Cut-off Date LTV | Maturity Date LTV | Rem. IO Period (mos.) | Rem. Term to Maturity (mos.) | |
| 5 | BANA | Hilton Houston Westchase | TX | Hospitality | $45,250,000 | 4.1% | $43,211,187 | 65.0% | 297 | $152,356.90 | 1.71x | 12.3% | 68.8% | 65.7% | 23 | 59 | |
| 18 | CIBC | Saucon Valley Plaza | PA | Office | $14,175,000 | 1.3% | $13,083,085 | 19.7% | 83,056 | $170.67 | 1.45x | 9.7% | 74.8% | 69.0% | 0 | 60 | |
| 37 | BANA | Towamencin Corporate Center | PA | Office | $9,839,874 | 0.9% | $9,121,076 | 13.7% | 77,077 | $127.66 | 1.33x | 9.9% | 66.9% | 62.0% | 0 | 59 | |
| Total/Wtd. Avg. | $69,264,874 | 6.3% | $65,415,348 | 98.4% | 1.60x | 11.4% | 69.7% | 65.8% | 15 | 59 | |||||||
| (1) | The table above reflects the mortgage loans whose balloon payments will be applied to pay down the Class A-2 Certificates, assuming (i) that none of the mortgage loans experience prepayments, defaults or losses; (ii) there are no extensions of maturity dates; and (iii) each mortgage loan is paid in full on its stated maturity date or, in the case of any mortgage loan with an anticipated repayment date, on such anticipated repayment date. The table above is otherwise based on the Structuring Assumptions set forth under “Yield, Prepayment and Maturity Considerations” in the Free Writing Prospectus. |
| This is not a research report and was not prepared by the Underwriters’ research departments. Please see additional important information and qualifications at the end of this Term Sheet. |
T-20
(THIS PAGE INTENTIONALLY LEFT BLANK)
T-21
| MSBAM 2015-C22 | Characteristics of the Mortgage Loans |
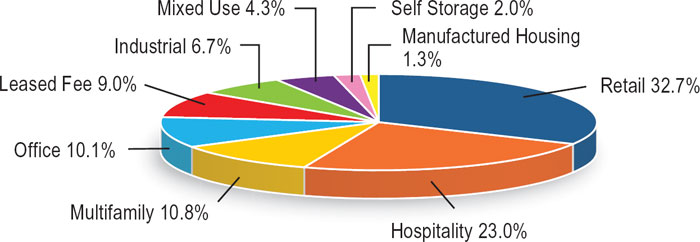
Property Type Distribution(1) | |||||||||
| Property Type | Number of Mortgaged Properties | Aggregate Cut-off Date Balance | % of Pool | Wtd. Avg. Mortgage Rate | Wtd. Avg. UW NCF DSCR | Wtd. Avg. UW NOI Debt Yield | Wtd. Avg. Cut-off Date LTV | Wtd. Avg. Maturity Date LTV | |
| Retail | 38 | $362,407,606 | 32.7% | 4.230% | 1.57x | 9.2% | 69.3% | 60.6% | |
| Anchored | 17 | $251,051,148 | 22.7% | 4.179% | 1.55x | 8.8% | 70.7% | 62.7% | |
| Free-Standing | 9 | $44,431,842 | 4.0% | 4.359% | 1.45x | 9.2% | 66.5% | 55.9% | |
| Shadow Anchored | 4 | $34,230,000 | 3.1% | 4.179% | 1.97x | 11.2% | 61.2% | 54.4% | |
| Unanchored | 8 | $32,694,615 | 3.0% | 4.496% | 1.48x | 10.0% | 71.4% | 57.2% | |
| Hospitality | 11 | $254,832,524 | 23.0% | 4.528% | 1.96x | 12.0% | 65.5% | 58.3% | |
| Full Service | 4 | $142,304,898 | 12.9% | 4.754% | 1.62x | 11.7% | 67.8% | 58.5% | |
| Select Service | 2 | $83,500,000 | 7.5% | 4.069% | 2.56x | 12.0% | 61.9% | 60.2% | |
| Limited Service | 5 | $29,027,626 | 2.6% | 4.738% | 1.87x | 13.5% | 64.3% | 52.1% | |
| Multifamily | 13 | $119,497,500 | 10.8% | 4.165% | 1.43x | 8.9% | 72.3% | 62.8% | |
| Garden | 12 | $113,697,500 | 10.3% | 4.160% | 1.43x | 8.9% | 72.3% | 62.8% | |
| Student Housing | 1 | $5,800,000 | 0.5% | 4.260% | 1.35x | 8.1% | 73.0% | 62.1% | |
| Office | 9 | $111,991,710 | 10.1% | 4.201% | 2.53x | 11.8% | 57.2% | 50.2% | |
| Suburban | 5 | $56,832,892 | 5.1% | 4.577% | 1.49x | 10.0% | 66.5% | 56.7% | |
| CBD | 2 | $36,200,000 | 3.3% | 3.352% | 4.80x | 16.4% | 35.6% | 34.0% | |
| Medical | 2 | $18,958,818 | 1.7% | 4.693% | 1.32x | 8.5% | 70.6% | 61.6% | |
Leased Fee(2) | 1 | $100,000,000 | 9.0% | 3.950% | 1.48x | 5.9% | 72.9% | 72.9% | |
| Leased Fee | 1 | $100,000,000 | 9.0% | 3.950% | 1.48x | 5.9% | 72.9% | 72.9% | |
| Industrial | 9 | $74,144,335 | 6.7% | 4.037% | 1.62x | 11.9% | 64.7% | 45.7% | |
| Warehouse/Distribution | 6 | $55,984,335 | 5.1% | 4.001% | 1.61x | 12.4% | 62.5% | 41.1% | |
| Warehouse/Flex | 2 | $9,500,000 | 0.9% | 4.210% | 1.45x | 9.1% | 69.3% | 55.6% | |
| Flex | 1 | $8,660,000 | 0.8% | 4.080% | 1.82x | 11.9% | 73.7% | 64.0% | |
| Mixed Use | 3 | $47,970,489 | 4.3% | 4.589% | 1.40x | 9.4% | 72.3% | 59.5% | |
| Office/Retail | 1 | $27,500,000 | 2.5% | 4.650% | 1.35x | 9.0% | 73.1% | 62.8% | |
| Retail/Industrial | 1 | $10,483,086 | 0.9% | 4.750% | 1.49x | 11.2% | 72.3% | 53.9% | |
| Self Storage/Retail | 1 | $9,987,403 | 0.9% | 4.250% | 1.43x | 8.7% | 69.8% | 56.2% | |
| Self Storage | 6 | $21,879,853 | 2.0% | 4.172% | 2.18x | 12.3% | 58.4% | 51.8% | |
| Self Storage | 6 | $21,879,853 | 2.0% | 4.172% | 2.18x | 12.3% | 58.4% | 51.8% | |
| Manufactured Housing | 1 | $14,600,000 | 1.3% | 4.351% | 1.39x | 8.5% | 74.3% | 64.9% | |
| Manufactured Housing | 1 | $14,600,000 | 1.3% | 4.351% | 1.39x | 8.5% | 74.3% | 64.9% | |
| Total/Wtd. Avg. | 91 | $1,107,324,016 | 100.0% | 4.266% | 1.74x | 10.0% | 67.5% | 59.2% | |
| (1) | All numerical information concerning the mortgage loans is approximate and, in the case of mortgage loans secured by multiple properties, is based on allocated loan amounts with respect to such properties. All weighted average information regarding the mortgage loans reflects the weighting of the mortgage loans based on their outstanding principal balances as of the Cut-off Date or, in the case of mortgage loans secured by multiple properties, allocated loan amounts. The sum of numbers and percentages in columns may not match the “Total” due to rounding. With respect to any mortgage loan that is part of a loan pair or a non-serviced loan combination, unless otherwise indicated, all LTV, DSCR and Debt Yield calculations include the related pari passu companion loan and exclude any subordinate notes, as applicable. |
| (2) | One of the mortgaged properties, representing approximately 9.0% of the initial pool balance by allocated loan amount, is comprised of a fee interest in air rights subject to an air rights lease granted by the borrower to another party, which party owns the improvements. The related leasehold estate is not collateral for the mortgage loan included in the issuing entity and is operated as an office property. |
| This is not a research report and was not prepared by the Underwriters’ research departments. Please see additional important information and qualifications at the end of this Term Sheet. |
T-22
| MSBAM 2015-C22 | Characteristics of the Mortgage Loans |
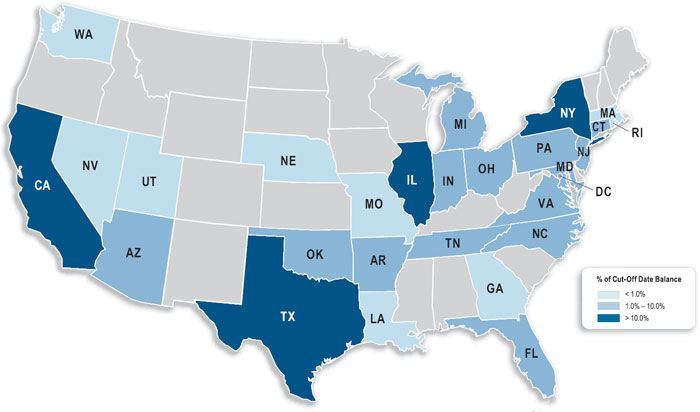
Geographic Distribution(1) | ||||||||
| State or Other Jurisdiction | Number of Mortgaged Properties | Aggregate Cut-off Date Balance | % of Pool | Wtd. Avg. Mortgage Rate | Wtd. Avg. UW NCF DSCR | Wtd. Avg. UW NOI Debt Yield | Wtd. Avg. Cut-off Date LTV | Wtd. Avg. Maturity Date LTV |
| New York | 5 | $169,348,248 | 15.3% | 4.067% | 2.08x | 9.3% | 68.6% | 67.6% |
| California | 15 | $156,495,755 | 14.1% | 4.229% | 1.76x | 10.9% | 60.8% | 52.2% |
California – Southern(2) | 12 | $121,110,675 | 10.9% | 4.276% | 1.76x | 10.8% | 62.9% | 53.8% |
California – Northern(2) | 3 | $35,385,080 | 3.2% | 4.067% | 1.76x | 11.2% | 53.4% | 46.7% |
| Illinois | 9 | $149,748,968 | 13.5% | 4.149% | 1.49x | 7.5% | 71.0% | 66.6% |
| Texas | 8 | $147,918,802 | 13.4% | 4.703% | 1.61x | 11.3% | 69.6% | 60.3% |
| Pennsylvania | 5 | $58,029,489 | 5.2% | 4.508% | 1.38x | 9.0% | 72.3% | 61.1% |
| Connecticut | 3 | $48,841,748 | 4.4% | 3.979% | 1.63x | 12.7% | 62.2% | 39.3% |
| North Carolina | 3 | $40,339,298 | 3.6% | 4.557% | 1.39x | 9.5% | 72.8% | 59.4% |
| New Jersey | 3 | $34,685,958 | 3.1% | 4.363% | 1.43x | 9.2% | 72.3% | 59.7% |
| Virginia | 1 | $34,300,000 | 3.1% | 4.050% | 1.30x | 7.8% | 76.2% | 63.6% |
| Arkansas | 3 | $30,037,500 | 2.7% | 4.259% | 1.47x | 9.4% | 74.5% | 64.6% |
| District of Columbia | 1 | $30,000,000 | 2.7% | 3.166% | 5.49x | 17.6% | 29.1% | 29.1% |
| Florida | 3 | $26,413,818 | 2.4% | 4.079% | 1.54x | 9.6% | 72.9% | 64.6% |
| Arizona | 2 | $25,830,328 | 2.3% | 4.320% | 1.40x | 9.0% | 71.4% | 58.2% |
| Michigan | 3 | $21,429,717 | 1.9% | 4.591% | 1.86x | 13.0% | 65.5% | 50.4% |
| Indiana | 3 | $19,145,596 | 1.7% | 4.444% | 1.50x | 10.1% | 71.3% | 61.2% |
| Ohio | 5 | $17,650,000 | 1.6% | 4.413% | 1.49x | 9.9% | 69.6% | 60.0% |
| Oklahoma | 1 | $15,875,000 | 1.4% | 4.740% | 1.29x | 8.3% | 72.5% | 63.9% |
| Tennessee | 4 | $12,810,000 | 1.2% | 4.245% | 1.53x | 9.3% | 72.0% | 65.8% |
| Maryland | 1 | $10,850,000 | 1.0% | 4.320% | 1.41x | 9.0% | 66.2% | 53.3% |
| Washington | 2 | $9,500,000 | 0.9% | 4.210% | 1.45x | 9.1% | 69.3% | 55.6% |
| Georgia | 2 | $9,009,853 | 0.8% | 4.386% | 2.03x | 13.4% | 54.4% | 44.1% |
| Nebraska | 1 | $8,700,000 | 0.8% | 4.200% | 1.66x | 10.8% | 64.4% | 58.8% |
| Nevada | 3 | $8,140,813 | 0.7% | 4.489% | 1.60x | 10.5% | 63.5% | 51.5% |
| Missouri | 1 | $6,637,500 | 0.6% | 4.200% | 1.42x | 8.9% | 75.0% | 65.3% |
| Utah | 1 | $5,800,000 | 0.5% | 4.260% | 1.35x | 8.1% | 73.0% | 62.1% |
| Louisiana | 1 | $4,991,287 | 0.5% | 4.300% | 1.81x | 13.4% | 64.8% | 47.5% |
| Rhode Island | 1 | $3,457,143 | 0.3% | 4.150% | 1.49x | 10.1% | 65.2% | 53.7% |
| Massachusetts | 1 | $1,337,196 | 0.1% | 4.150% | 1.49x | 10.1% | 65.2% | 53.7% |
| Total/Wtd. Avg. | 91 | $1,107,324,016 | 100.0% | 4.266% | 1.74x | 10.0% | 67.5% | 59.2% |
| (1) | All numerical information concerning the mortgage loans is approximate and, in the case of mortgage loans secured by multiple properties, is based on allocated loan amounts with respect to such properties. All weighted average information regarding the mortgage loans reflects the weighting of the mortgage loans based on their outstanding principal balances as of the Cut-off Date or, in the case of mortgage loans secured by multiple properties, allocated loan amounts. The sum of numbers and percentages in columns may not match the “Total” due to rounding. With respect to any mortgage loan that is part or a loan pair or a non-serviced loan combination, unless otherwise indicated, all LTV, DSCR and Debt Yield calculations include the related pari passu companion loan and exclude any subordinate notes, as applicable. |
| (2) | “California – Northern” includes zip codes above 93600, and “California – Southern” includes zip codes at or below 93600. |
| This is not a research report and was not prepared by the Underwriters’ research departments. Please see additional important information and qualifications at the end of this Term Sheet. |
T-23
| MSBAM 2015-C22 | Collateral Statistics |
Collateral Statistics(1)
Cut-off Date Balance ($)
No. of Mortgage Loans | Aggregate Cut-off Date Balance ($) | % of Pool | |||||
| 1 - 10,000,000 | 44 | 257,573,403 | 23.3 | ||||
| 10,000,001 - 20,000,000 | 21 | 273,041,279 | 24.7 | ||||
| 20,000,001 - 30,000,000 | 5 | 132,375,000 | 12.0 | ||||
| 30,000,001 - 40,000,000 | 1 | 34,300,000 | 3.1 | ||||
| 40,000,001 - 50,000,000 | 2 | 89,134,335 | 8.0 | ||||
| 60,000,001 - 70,000,000 | 1 | 65,900,000 | 6.0 | ||||
| 70,000,001 - 80,000,000 | 2 | 155,000,000 | 14.0 | ||||
| 90,000,001 - 100,000,000 | 1 | 100,000,000 | 9.0 | ||||
| Total: | 77 | $1,107,324,016 | 100.0 | % | |||
| Min: $1,946,631 | Max: $100,000,000 | Avg: $14,380,831 | |||||
| State or Other Jurisdiction | |||||||
| No. of | Aggregate | ||||||
| Mortgaged | Cut-off Date | % of | |||||
| Properties | Balance ($) | Pool | |||||
| New York | 5 | 169,348,248 | 15.3 | ||||
| California | 15 | 156,495,755 | 14.1 | ||||
California – Southern(2) | 12 | 121,110,675 | 10.9 | ||||
California – Northern(2) | 3 | 35,385,080 | 3.2 | ||||
| Illinois | 9 | 149,748,968 | 13.5 | ||||
| Texas | 8 | 147,918,802 | 13.4 | ||||
| Pennsylvania | 5 | 58,029,489 | 5.2 | ||||
| Connecticut | 3 | 48,841,748 | 4.4 | ||||
| North Carolina | 3 | 40,339,298 | 3.6 | ||||
| New Jersey | 3 | 34,685,958 | 3.1 | ||||
| Virginia | 1 | 34,300,000 | 3.1 | ||||
| Arkansas | 3 | 30,037,500 | 2.7 | ||||
| District of Columbia | 1 | 30,000,000 | 2.7 | ||||
| Florida | 3 | 26,413,818 | 2.4 | ||||
| Arizona | 2 | 25,830,328 | 2.3 | ||||
| Michigan | 3 | 21,429,717 | 1.9 | ||||
| Indiana | 3 | 19,145,596 | 1.7 | ||||
| Ohio | 5 | 17,650,000 | 1.6 | ||||
| Oklahoma | 1 | 15,875,000 | 1.4 | ||||
| Tennessee | 4 | 12,810,000 | 1.2 | ||||
| Maryland | 1 | 10,850,000 | 1.0 | ||||
| Washington | 2 | 9,500,000 | 0.9 | ||||
| Georgia | 2 | 9,009,853 | 0.8 | ||||
| Nebraska | 1 | 8,700,000 | 0.8 | ||||
| Nevada | 3 | 8,140,813 | 0.7 | ||||
| Missouri | 1 | 6,637,500 | 0.6 | ||||
| Utah | 1 | 5,800,000 | 0.5 | ||||
| Louisiana | 1 | 4,991,287 | 0.5 | ||||
| Rhode Island | 1 | 3,457,143 | 0.3 | ||||
| Massachusetts | 1 | 1,337,196 | 0.1 | ||||
| Total: | 91 | $1,107,324,016 | 100.0 | % | |||
| Property Type | |||||||
| No. of | Aggregate | ||||||
| Mortgaged | Cut-off Date | % of | |||||
| Properties | Balance ($) | Pool | |||||
| Retail | 38 | 362,407,606 | 32.7 | ||||
| Anchored | 17 | 251,051,148 | 22.7 | ||||
| Free-Standing | 9 | 44,431,842 | 4.0 | ||||
| Shadow Anchored | 4 | 34,230,000 | 3.1 | ||||
| Unanchored | 8 | 32,694,615 | 3.0 | ||||
| Hospitality | 11 | 254,832,524 | 23.0 | ||||
| Full Service | 4 | 142,304,898 | 12.9 | ||||
| Select Service | 2 | 83,500,000 | 7.5 | ||||
| Limited Service | 5 | 29,027,626 | 2.6 | ||||
| Multifamily | 13 | 119,497,500 | 10.8 | ||||
| Garden | 12 | 113,697,500 | 10.3 | ||||
| Student Housing | 1 | 5,800,000 | 0.5 | ||||
| Office | 9 | 111,991,710 | 10.1 | ||||
| Suburban | 5 | 56,832,892 | 5.1 | ||||
| CBD | 2 | 36,200,000 | 3.3 | ||||
| Medical | 2 | 18,958,818 | 1.7 | ||||
Leased Fee(3) | 1 | 100,000,000 | 9.0 | ||||
| Leased Fee | 1 | 100,000,000 | 9.0 | ||||
| Industrial | 9 | 74,144,335 | 6.7 | ||||
| Warehouse/Distribution | 6 | 55,984,335 | 5.1 | ||||
| Warehouse/Flex | 2 | 9,500,000 | 0.9 | ||||
| Flex | 1 | 8,660,000 | 0.8 | ||||
| Mixed Use | 3 | 47,970,489 | 4.3 | ||||
| Office/Retail | 1 | 27,500,000 | 2.5 | ||||
| Retail/Industrial | 1 | 10,483,086 | 0.9 | ||||
| Self Storage/Retail | 1 | 9,987,403 | 0.9 | ||||
| Self Storage | 6 | 21,879,853 | 2.0 | ||||
| Self Storage | 6 | 21,879,853 | 2.0 | ||||
| Manufactured Housing | 1 | 14,600,000 | 1.3 | ||||
| Manufactured Housing | 1 | 14,600,000 | 1.3 | ||||
| Total: | 91 | $1,107,324,016 | 100.0 | % |
Mortgage Rate (%)
No. of Mortgage Loans | Aggregate Cut-off Date Balance ($) | % of Pool | ||||||
| 3.001 - 3.500 | 1 | 30,000,000 | 2.7 | |||||
| 3.501 - 4.000 | 8 | 200,901,915 | 18.1 | |||||
| 4.001 - 4.500 | 51 | 618,640,208 | 55.9 | |||||
| 4.501 - 5.000 | 15 | 241,942,019 | 21.8 | |||||
| 5.001 - 5.500 | 2 | 15,839,874 | 1.4 | |||||
| Total: | 77 | $1,107,324,016 | 100.0 | % | ||||
| Min: 3.166% | Max: 5.150% | Wtd Avg: 4.266% | ||||||
| Original Term to Maturity (mos.) | ||||||||
| No. of | Aggregate | |||||||
| Mortgage | Cut-off Date | % of | ||||||
| Loans | Balance ($) | Pool | ||||||
| 60 | 3 | 69,264,874 | 6.3 | |||||
| 84 | 2 | 9,623,556 | 0.9 | |||||
| 120 | 72 | 1,028,435,586 | 92.9 | |||||
| Total: | 77 | $1,107,324,016 | 100.0 | % | ||||
| Min: 60 mos. | Max: 120 mos. | Wtd Avg: 116 mos. | ||||||
| Remaining Term to Maturity (mos.) | ||||||||
| No. of | Aggregate | |||||||
| Mortgage | Cut-off Date | % of | ||||||
| Loans | Balance ($) | Pool | ||||||
| 55 - 60 | 3 | 69,264,874 | 6.3 | |||||
| 79 - 84 | 2 | 9,623,556 | 0.9 | |||||
| 115 - 120 | 72 | 1,028,435,586 | 92.9 | |||||
| Total: | 77 | $1,107,324,016 | 100.0 | % | ||||
| Min: 59 mos. | Max: 120 mos. | Wtd Avg: 115 mos. | ||||||
| Original Amortization Term (mos.) | ||||||||
| No. of | Aggregate | |||||||
| Mortgage | Cut-off Date | % of | ||||||
| Loans | Balance ($) | Pool | ||||||
| Interest Only | 6 | 299,500,000 | 27.0 | |||||
| 204 | 1 | 4,000,000 | 0.4 | |||||
| 240 | 1 | 43,884,335 | 4.0 | |||||
| 300 | 13 | 82,066,475 | 7.4 | |||||
| 330 | 1 | 12,100,000 | 1.1 | |||||
| 360 | 55 | 665,773,206 | 60.1 | |||||
| Total: | 77 | $1,107,324,016 | 100.0 | % | ||||
| Min: 204 mos. | Max: 360 mos. | Wtd Avg: 346 mos. | ||||||
Remaining Amortization Term (mos.)
No. of Mortgage Loans | Aggregate Cut-off Date Balance ($) | % of Pool | |||||
| Interest Only | 6 | 299,500,000 | 27.0 | ||||
| 201 - 230 | 1 | 4,000,000 | 0.4 | ||||
| 231 - 300 | 14 | 125,950,811 | 11.4 | ||||
| 301 - 350 | 1 | 12,100,000 | 1.1 | ||||
| 351 - 360 | 55 | 665,773,206 | 60.1 | ||||
| Total: | 77 | $1,107,324,016 | 100.0 | % | |||
| Min: 204 mos. | Max: 360 mos. | Wtd Avg: 346 mos. |
Mortgage Loan Sellers
No. of Mortgage Loans | Aggregate Cut-off Date Balance ($) | % of Pool | |||||
| Morgan Stanley | |||||||
| Mortgage Capital | |||||||
| Holdings LLC | 22 | 492,515,003 | 44.5 | ||||
| Bank of America, | |||||||
| National Association | 29 | 300,291,688 | 27.1 | ||||
| CIBC Inc. | 18 | 220,116,019 | 19.9 | ||||
| Starwood Mortgage | |||||||
| Funding III LLC | 8 | 94,401,306 | 8.5 | ||||
| Total: | 77 | $1,107,324,016 | 100.0 | % |
Amortization Type
No. of Mortgage Loans | Aggregate Cut-off Date Balance ($) | % of Pool | |||||
| Amortizing Balloon | 41 | 426,184,016 | 38.5 | ||||
| Partial Interest Only | 30 | 381,640,000 | 34.5 | ||||
| Interest Only | 6 | 299,500,000 | 27.0 | ||||
| Total: | 77 | $1,107,324,016 | 100.0 | % |
Cut-off Date LTV Ratio (%)
No. of Mortgage Loans | Aggregate Cut-off Date Balance ($) | % of Pool | |||||
| 20.1 - 30.0 | 1 | 30,000,000 | 2.7 | ||||
| 30.1 - 40.0 | 1 | 3,500,000 | 0.3 | ||||
| 40.1 - 50.0 | 3 | 23,304,933 | 2.1 | ||||
| 50.1 - 60.0 | 8 | 72,816,812 | 6.6 | ||||
| 60.1 - 70.0 | 30 | 413,588,966 | 37.4 | ||||
| 70.1 - 80.0 | 34 | 564,113,306 | 50.9 | ||||
| Total: | 77 | $1,107,324,016 | 100.0 | % | |||
| Min: 29.1% | Max: 76.2% | Wtd Avg: 67.5% | |||||
| Maturity Date LTV Ratio (%) | |||||||
| No. of | Aggregate | ||||||
| Mortgage | Cut-off Date | % of | |||||
| Loans | Balance ($) | Pool | |||||
| 20.1 - 30.0 | 1 | 30,000,000 | 2.7 | ||||
| 30.1 - 40.0 | 7 | 76,635,899 | 6.9 | ||||
| 40.1 - 50.0 | 13 | 99,090,228 | 8.9 | ||||
| 50.1 - 60.0 | 26 | 289,963,717 | 26.2 | ||||
| 60.1 - 70.0 | 28 | 431,634,172 | 39.0 | ||||
| 70.1 - 80.0 | 2 | 180,000,000 | 16.3 | ||||
| Total: | 77 | $1,107,324,016 | 100.0 | % | |||
| Min: 29.1% | Max: 75.0% | Wtd Avg: 59.2% | |||||
| UW DSCR (x) | |||||||
| No. of | Aggregate | ||||||
| Mortgage | Cut-off Date | % of | |||||
| Loans | Balance ($) | Pool | |||||
| 1.21 - 1.30 | 3 | 60,845,029 | 5.5 | ||||
| 1.31 - 1.40 | 18 | 218,499,035 | 19.7 | ||||
| 1.41 - 1.50 | 18 | 234,537,403 | 21.2 | ||||
| 1.51 - 1.60 | 7 | 117,767,468 | 10.6 | ||||
| 1.61 - 1.70 | 12 | 211,358,474 | 19.1 | ||||
| 1.71 - 1.80 | 3 | 52,600,000 | 4.8 | ||||
| 1.81 - 1.90 | 6 | 48,630,437 | 4.4 | ||||
| 2.01 - 2.10 | 2 | 17,319,686 | 1.6 | ||||
| 2.11 - 2.20 | 1 | 9,000,000 | 0.8 | ||||
| 2.21 - 2.30 | 1 | 9,750,000 | 0.9 | ||||
| 2.31 - 2.40 | 1 | 11,000,000 | 1.0 | ||||
| 2.41 - 2.50 | 3 | 82,516,484 | 7.5 | ||||
| 4.01 - 4.10 | 1 | 3,500,000 | 0.3 | ||||
| 5.41 - 5.50 | 1 | 30,000,000 | 2.7 | ||||
| Total: | 77 | $1,107,324,016 | 100.0 | % | |||
| Min: 1.29x | Max: 5.49x | Wtd Avg: 1.74x | |||||
| UW NOI Debt Yield (%) | |||||||
| No. of | Aggregate | ||||||
| Mortgage | Cut-off Date | % of | |||||
| Loans | Balance ($) | Pool | |||||
| 5.6 - 6.0 | 1 | 100,000,000 | 9.0 | ||||
| 7.1 - 7.5 | 1 | 80,000,000 | 7.2 | ||||
| 7.6 - 8.0 | 3 | 68,800,000 | 6.2 | ||||
| 8.1 - 8.5 | 10 | 106,015,029 | 9.6 | ||||
| 8.6 - 9.0 | 10 | 107,839,903 | 9.7 | ||||
| 9.1 - 9.5 | 6 | 47,462,650 | 4.3 | ||||
| 9.6 - 10.0 | 10 | 100,213,034 | 9.1 | ||||
| 10.1 - 10.5 | 7 | 58,997,732 | 5.3 | ||||
| 10.6 - 11.0 | 3 | 79,793,802 | 7.2 | ||||
| 11.1 - 11.5 | 3 | 18,262,468 | 1.6 | ||||
| 11.6 - 12.0 | 5 | 117,943,556 | 10.7 | ||||
| 12.1 - 12.5 | 5 | 85,504,978 | 7.7 | ||||
| 12.6 - 13.0 | 3 | 54,483,092 | 4.9 | ||||
| 13.1 - 13.5 | 2 | 10,991,287 | 1.0 | ||||
| 14.1 - 14.5 | 4 | 30,000,000 | 2.7 | ||||
| 16.1 - 16.5 | 2 | 7,516,484 | 0.7 | ||||
| 17.1 - 17.5 | 1 | 3,500,000 | 0.3 | ||||
| 17.6 - 18.0 | 1 | 30,000,000 | 2.7 | ||||
| Total: | 77 | $1,107,324,016 | 100.0 | % | |||
| Min: 5.9% | Max: 17.6% | Wtd Avg: 10.0% | |||||
| (1) | All numerical information concerning the mortgage loans is approximate and, in the case of mortgage loans secured by multiple properties, is based on allocated loan amounts with respect to such properties. All weighted average information regarding the mortgage loans reflects the weighting of the mortgage loans based on their outstanding principal balances as of the Cut-off Date or, in the case of mortgage loans secured by multiple properties, allocated loan amounts. The sum of numbers and percentages in columns may not match the “Total” due to rounding. With respect to any mortgage loan that is part of a loan pair or a non-serviced loan combination, unless otherwise indicated, all LTV, DSCR and Debt Yield calculations include the related pari passu companion loan and exclude any subordinate notes, as applicable. |
| (2) | “California – Northern” includes zip codes above 93600, and “California – Southern” includes zip codes at or below 93600. |
| (3) | One of the mortgaged properties, representing approximately 9.0% of the initial pool balance by allocated loan amount, is comprised of a fee interest in air rights subject to an air rights lease granted by the borrower to another party, which party owns the improvements. The related leasehold estate is not collateral for the mortgage loan included in the issuing entity and is operated as an office property. |
| This is not a research report and was not prepared by the Underwriters’ research departments. Please see additional important information and qualifications at the end of this Term Sheet. |
T-24
| MSBAM 2015-C22 | Collateral Statistics |
Prepayment Restrictions
Percentage of Collateral by Prepayment Restrictions (%)(1)(2)(3)(4)
| Prepayment Restrictions | April 2015 | April 2016 | April 2017 | April 2018 | April 2019 |
| Locked Out | 99.8% | 99.8% | 89.6% | 89.3% | 89.4% |
| Yield Maintenance Total | 0.2% | 0.2% | 10.4% | 10.7% | 10.6% |
| Open | 0.0% | 0.0% | 0.0% | 0.0% | 0.0% |
| TOTAL | 100.0% | 100.0% | 100.0% | 100.0% | 100.0% |
| Pool Balance Outstanding | $1,107,324,016 | $1,099,394,139 | $1,090,447,961 | $1,078,479,092 | $1,065,043,966 |
| % Initial Pool Balance | 100.0% | 99.3% | 98.5% | 97.4% | 96.2% |
| Prepayment Restrictions | April 2020 | April 2021 | April 2022 | April 2023 | April 2024 |
| Locked Out | 88.8% | 88.8% | 89.3% | 89.4% | 83.5% |
| Yield Maintenance Total | 11.2% | 11.2% | 10.7% | 10.6% | 10.6% |
| Open | 0.0% | 0.0% | 0.0% | 0.0% | 6.0% |
| TOTAL | 100.0% | 100.0% | 100.0% | 100.0% | 100.0% |
| Pool Balance Outstanding | $985,714,558 | $970,211,687 | $945,538,502 | $928,816,555 | $911,422,028 |
| % Initial Pool Balance | 89.0% | 87.6% | 85.4% | 83.9% | 82.3% |
| (1) | The analysis is based on Structuring Assumptions and a 0% CPR as discussed in the Free Writing Prospectus. |
| (2) | See description of Yield Maintenance under “Description of the Offered Certificates—Distributions of Prepayment Premiums and Yield Maintenance Charges” in the Free Writing Prospectus. |
| (3) | Mortgage loans modeled as Yield Maintenance include mortgage loans characterized by YM1 and DEF/YM1 on Appendix I to the Free Writing Prospectus. |
| (4) | There may be limited exceptions to the indicated prepayment restrictions arising out of casualties, condemnations, property releases and the application of earnout reserves. |
| This is not a research report and was not prepared by the Underwriters’ research departments. Please see additional important information and qualifications at the end of this Term Sheet. |
T-25
| MSBAM 2015-C22 | 300 South Riverside Plaza Fee |
Mortgage Loan No. 1 – 300 South Riverside Plaza Fee

| This is not a research report and was not prepared by the Underwriters’ research departments. Please see additional important information and qualifications at the end of this Term Sheet. |
T-26
| MSBAM 2015-C22 | 300 South Riverside Plaza Fee |
Mortgage Loan No. 1 – 300 South Riverside Plaza Fee
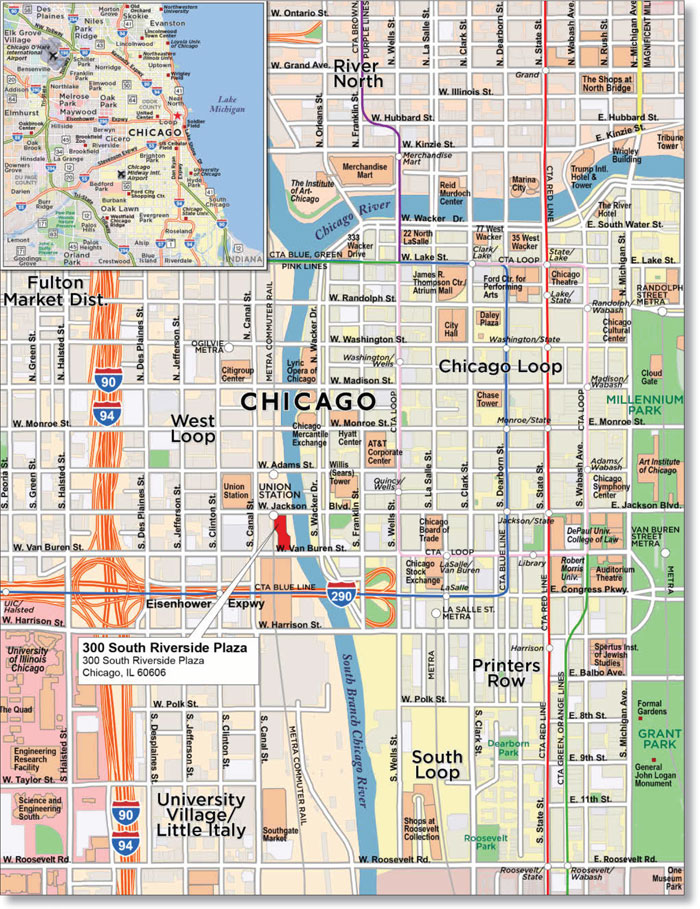
| This is not a research report and was not prepared by the Underwriters’ research departments. Please see additional important information and qualifications at the end of this Term Sheet. |
T-27
| MSBAM 2015-C22 | 300 South Riverside Plaza Fee |
| Mortgage Loan Information | Mortgaged Property Information(5) | ||||||
| Mortgage Loan Seller: | MSMCH | Single Asset/Portfolio: | |||||
Original Balance(1): | Location: | ||||||
Cut-off Date Balance(1): | General Property Type(5): | ||||||
| % of Initial Pool Balance: | 9.0% | Detailed Property Type(5): | |||||
| Loan Purpose: | Title Vesting: | ||||||
| Sponsor: | Year Built/Renovated: | ||||||
| Mortgage Rate: | Size: | ||||||
| Note Date: | Cut-off Date Balance per Unit(1): | ||||||
| First Payment Date: | Maturity Date Balance per Unit(1)(2): | ||||||
Effective Maturity Date(2): | Property Manager: | ||||||
Original Term to Maturity(2): | |||||||
| Original Amortization Term: | Underwriting and Financial Information(6) | ||||||
| IO Period: | UW NOI: | ||||||
| Seasoning: | UW NOI Debt Yield(1): | ||||||
Prepayment Provisions(3): | UW NOI Debt Yield at Maturity(1)(2): | ||||||
| Lockbox/Cash Mgmt Status: | UW NCF DSCR(1): | ||||||
| Additional Debt Type: | Most Recent NOI(7): | ||||||
| Additional Debt Balance: | 2nd Most Recent NOI(7): | ||||||
| Future Debt Permitted (Type): | 3rd Most Recent NOI(7): | ||||||
Reserves(4) | Most Recent Occupancy(7): | ||||||
| Type | Initial | Monthly | Cap | 2nd Most Recent Occupancy(7): | |||
| RE Tax: | 3rd Most Recent Occupancy(7): | ||||||
| Insurance: | Appraised Value (as of): | ||||||
Cut-off Date LTV Ratio(1): | |||||||
Maturity Date LTV Ratio(1)(2): | 72.9% | ||||||
| Sources and Uses | |||||||
| Sources | Proceeds | % of Total | Uses | Proceeds | % of Total | ||
Loan Amount(1): | 75.3% | 99.2% | |||||
| Closing Costs: | 0.8% | ||||||
| Total Sources: | 100.0% | Total Uses: | 100.0% | ||||
| (1) | The 300 South Riverside Plaza Fee Mortgage Loan is part of the 300 South Riverside Plaza Fee Loan Pair, which is comprised of two pari passu notes with an aggregate principal balance of $167,000,000. The Cut-off Date Balance per Unit, Maturity Date Balance per Unit, UW NOI Debt Yield, UW NOI Debt Yield at Maturity, UW NCF DSCR, Cut-off Date LTV Ratio and Maturity Date LTV Ratio presented above are based on the aggregate note balance of the 300 South Riverside Plaza Fee Loan Pair. |
| (2) | The 300 South Riverside Plaza Fee Loan Pair has an anticipated repayment date (“ARD”) of March 5, 2025 and a stated maturity date of March 5, 2045. In the event the 300 South Riverside Plaza Fee Loan Pair is not repaid in full by the ARD, the interest rate will increase from the initial interest rate of 3.950% to the greater of (a) 5.0% above the current interest rate and (b) 5.0% above the 20-year interpolated U.S. Treasury Rate. After the ARD, the lender may apply any excess cash to the reduction of the principal balance of the 300 South Riverside Plaza Fee Loan Pair. References herein to “maturity” and “maturity date” refer to the ARD. |
| (3) | The final lockout and defeasance periods will be determined based on the securitization date of the last component of the 300 South Riverside Plaza Fee Loan Pair. |
| (4) | See “—Escrows and Reserves” below for further discussion of reserve requirements. |
| (5) | The 300 South Riverside Plaza Fee Mortgage Loan is secured by the air rights associated with space occupied by a 22-story office building located at 300 South Riverside Plaza in Chicago, IL and encumbered by a ground lease. The improvements are not collateral for the 300 South Riverside Plaza Fee Mortgage Loan other than of the 300 South Riverside Plaza Fee Borrower’s reversionary interest therein. Certain property information, such as Size, Cut-off Date Balance per Unit, Maturity Date Balance per Unit, and Year Built/Renovated relate to the Non-Collateral Improvements (defined below) and are for informational purposes only. |
| (6) | Underwriting and Financial information is based on the current annual ground lease payment due under the ground lease described below under “—The Property.” |
| (7) | The underwritten cash flow is based on the ground lease described below under “—The Property.” Historical NOI and occupancy data are not available for this new ground lease; however, certain historical operating information and occupancy data related to the Non-Collateral Improvements are available. See “—Operating History and Underwritten Cash Flow” below for further details. |
The Mortgage Loan. The largest mortgage loan (the “300 South Riverside Plaza Fee Mortgage Loan”) is part of a loan pair (the “300 South Riverside Plaza Fee Loan Pair”) evidenced by two pari passu promissory notes (Notes A-1 and A-2) in the aggregate principal amount of $167,000,000 as of the Cut-off Date, both of which are secured by the same first priority fee mortgage encumbering certain air rights associated with land under a 22-story office building located at 300 South Riverside Plaza, in Chicago, Illinois (the “300 South Riverside Plaza Fee Property”). Promissory Note A-1, in the original principal amount of $100,000,000, represents the 300 South Riverside Plaza Fee Mortgage Loan and Promissory Note A-2, in the original principal amount of $67,000,000 (the “300 South Riverside Plaza Fee Serviced Companion Loan”), is expected to be held by Morgan Stanley Bank, N.A. or an affiliate on the closing date of this transaction and may be contributed to one or more future securitization transactions. See “Description of the Mortgage Pool—The A/B Whole Loans and the Loan Pairs—The 300 South Riverside Plaza Fee Loan Pair” and “Servicing of the Mortgage Loans” in the Free Writing Prospectus. The 300 South Riverside Plaza Fee Loan Pair will be serviced pursuant to terms of the MSBAM 2015-C22 pooling and servicing agreement. The proceeds of the 300 South Riverside Plaza Fee Loan Pair were used to acquire the 300 South Riverside Plaza Fee Property for a purchase price of approximately $220,000,000.
| This is not a research report and was not prepared by the Underwriters’ research departments. Please see additional important information and qualifications at the end of this Term Sheet. |
T-28
| MSBAM 2015-C22 | 300 South Riverside Plaza Fee |
The Borrower and the Sponsor. The borrowers are Lionshead 110 Riverside LLC and Lionshead 53 Riverside LLC, two single-purpose, Delaware limited liability companies that own the 300 South Riverside Plaza Fee Property as tenants-in-common (collectively, the “300 South Riverside Plaza Fee Borrower”). The 300 South Riverside Plaza Fee Borrower is majority owned and controlled by Jim Stanton, David Lowenfeld and the Estate of Victor Elmaleh (including family members of each of the foregoing). Schron Company affiliates own a minority indirect interest in the 300 South Riverside Plaza Fee Borrower. World-Wide Holdings Corporation (“World-Wide”) is the nonrecourse carve-out guarantor.
World-Wide is a New York City-based real estate development company that has developed over $7 billion of residential, commercial and mixed-use properties. James Stanton is president of World-Wide and David Lowenfeld is a partner. The company’s October 31, 2014 consolidated balance sheet indicates total assets of approximately $53.3 million and liabilities of approximately $7.0 million.
The Property. The 300 South Riverside Plaza Fee Property consists of air rights associated with a 2.08 acre parcel located at 300 South Riverside Plaza above rail lines that lead to the neighboring Chicago Union Station in Chicago, IL. The 300 South Riverside Plaza Fee Property is currently subject to a 99-year ground lease of such air rights, dated February 10, 2015 (the “Ground Lease”) with South Riverside Building LLC (the “Ground Lessee”), which owns the improvements located on the 300 South Riverside Plaza Fee Property (the “Non-Collateral Improvements”). The Non-Collateral Improvements, which were constructed in 1983 and renovated in 2012, consist of a Class A, 22-story, 1,055,273 SF office building. The Non-Collateral Improvements are owned by the Ground Lessee, and only the 300 South Riverside Plaza Fee Borrower’s reversionary interest therein serves as collateral for the 300 South Riverside Plaza Fee Mortgage Loan. The Ground Lessee pays ground rent in the initial amount of $9,900,000, annually, on an absolute net basis, subject to annual CPI adjustments capped at 3% per year. Furthermore, the ground rent is scheduled to increase by an additional $500,000 per year upon each 10th anniversary during the ground lease term, plus any shortfall in CPI adjustments due to the aforementioned 3% annual adjustment cap. An affiliate of the Ground Lessee was the previous owner of the 300 South Riverside Plaza Fee Property.
The following table presents a summary regarding the largest tenants at the Non-Collateral Improvements located on the 300 South Riverside Plaza Fee Property:
Non-Collateral Improvements Tenant Summary(1) | ||||||||||||||
| Tenant Name | Credit Rating(Fitch/Moody’s/S&P)(2) | Tenant SF | Approximate % of SF | Annual UW Rent | % of Total Annual UW Rent | Annual UW Rent PSF(3) | Lease Expiration | |||||||
| Anchor/Major Tenants | ||||||||||||||
| JP Morgan Chase | A+/A3/A | 486,143 | 46% | $9,980,474 | 46% | $20.53 | 9/30/2021(4) | |||||||
| Zurich American Insurance | NR/A3/A | 107,807 | 10% | $2,736,949 | 13% | $25.39 | 4/30/2026 | |||||||
| DeVry | NR/NR/NR | 77,116 | 7% | $1,542,320 | 7% | $20.00 | 4/30/2023 | |||||||
| National Futures Association | NR/NR/NR | 71,125 | 7% | $1,356,786 | 6% | $19.08 | 8/31/2023 | |||||||
| FDIC | AAA/Aaa/AA+ | 68,013 | 6% | $1,503,612 | 7% | $22.11 | 8/31/2019 | |||||||
| Subtotal/Wtd. Avg. | 810,204 | 77% | $17,120,141 | 79% | $21.13 | |||||||||
| Other Tenants | 223,358 | 21% | $4,657,603 | 21% | $20.85 | |||||||||
| Vacant Space | 21,711 | 2% | $0 | 0% | $0.00 | |||||||||
| Total/Wtd. Avg. | 1,055,273 | 100% | $21,777,744 | 100% | $21.07 | |||||||||
| (1) | The Non-Collateral Improvements are not collateral for the 300 South Riverside Plaza Fee Mortgage Loan (except for the reversionary interest of the 300 South Riverside Plaza Fee Borrower therein). The tenant information above represents leases of the Ground Lessee’s Non-Collateral Improvements and is provided for informational purposes only. |
| (2) | Certain ratings are those of the parent company whether or not the parent guarantees the lease. |
| (3) | Wtd. Avg. Annual UW Rent PSF Rolling excludes vacant space. |
| (4) | JP Morgan Chase has a lease termination option effective September 30, 2016 upon notice to Ground Lessee no later than nine months prior to such date. If such termination notice is given, the Ground Lessee is required to deposit $333,333 per month with the lender or a designee during the notice period until a $3,000,000 balance is on deposit. Such balance is to be applied (and released) as payment of the last $3,000,000 of JP Morgan Chase base rent payable during the calendar year 2017. |
The Market. The 300 South Riverside Plaza Fee Property is located in the West Loop submarket, within the central business district (CBD) of Chicago, Cook County, Illinois. The 300 South Riverside Plaza Fee Property is located adjacent to Chicago Union Station along the Chicago River. As of September 30, 2014, the overall Chicago office market had a 14.1% vacancy rate and an average asking rental rate of $22.12 PSF, the West Loop submarket, with approximately 52.6 million SF, had an 11.9% vacancy rate with an average asking rental rate of $31.07 PSF, and the West Loop Class A market, with approximately 34.7 million SF, had an 11.6% vacancy rate and an average asking rental rate of $33.39 PSF. The appraisal notes two office projects totaling approximately 2.3 million SF currently under construction in the West Loop submarket. For large office spaces (50,000 SF+) leases comparable to the leases of the Non-Collateral Improvements indicate base rental rates from $18.50 PSF to $25.00 PSF.
| This is not a research report and was not prepared by the Underwriters’ research departments. Please see additional important information and qualifications at the end of this Term Sheet. |
T-29
| MSBAM 2015-C22 | 300 South Riverside Plaza Fee |
The following table presents Chicago Class A rental properties comparable to the Non-Collateral Improvements located on the 300 South Riverside Plaza Fee Property:
| Non-Collateral Improvements Competitive Property Summary | ||||||||||||||||||||||||
| Property Name/Location | NRA | Year Built/Ren. | Occupancy | Tenant Name | Lease Date | Size (SF) | Term (years) | Rent PSF | Avg. Esc./Yr. | Concessions | TI/SF | |||||||||||||
300 S. Wacker Dr. 300 S. Wacker Dr. | 561,865 | 1971/1990 | 85.8% | MBHB | 12/1/2014 | 60,782 | 5.0 | $18.50 | 2.6% | 17 months | $75 | |||||||||||||
Willis Tower 233 S. Wacker Dr. | 3,549,487 | 1973/1991 | 83.8% | Dentons US LLP | 9/1/2014 | 125,553 | 15.0 | $19.00 | 2.3% | N/A | $84 | |||||||||||||
Citigroup Center 500 W. Madison St. | 1,455,688 | 1987/2005 | 95.5% | AIG | 6/1/2014 | 74,460 | 10.0 | $19.00 | 2.3% | 10 months | $68 | |||||||||||||
191 N. Wacker Dr. 191 N. Wacker Dr. | 732,000 | 2003/N/A | 92.2% | Heitman Financial | 6/1/2013 | 58,264 | 10.0 | $25.00 | 1.9% | 10 months | $55 | |||||||||||||
One North Wacker 1 N. Wacker Dr. | 1,373,754 | 2001/N/A | 88.7% | Options Clearing | 6/1/2013 | 57,383 | 10.0 | $23.15 | 2.0% | 5 months | $43 | |||||||||||||
Source: Appraisal
The following table presents certain information relating to the lease rollover schedule for at the Non-Collateral Improvements located on the 300 South Riverside Plaza Fee Property:
Non-Collateral Improvements Rollover Schedule(1) | ||||||||||||||||||
| Year | # of Leases Rolling | SF Rolling | Annual UW Rent PSF Rolling(2) | Approx. % of Total SF Rolling | Approx. Cumulative % of SF Rolling | Total UW Rent Rolling | Approx. % of Total UW Rent Rolling | Approx. Cumulative % of Total UW Rent Rolling | ||||||||||
| MTM | 3 | 3 | $0.00 | 0% | 0% | $0 | 0% | 0% | ||||||||||
| 2015 | 0 | 0 | $0.00 | 0% | 0% | $0 | 0% | 0% | ||||||||||
| 2016 | 1 | 9,956 | $34.76 | 1% | 1% | $346,071 | 2% | 2% | ||||||||||
| 2017 | 1 | 0 | $0.00 | 0% | 1% | $0 | 0% | 2% | ||||||||||
| 2018 | 4 | 46,385 | $20.86 | 4% | 5% | $967,762 | 4% | 6% | ||||||||||
| 2019 | 3 | 107,191 | $22.16 | 10% | 15% | $2,375,839 | 11% | 17% | ||||||||||
| 2020 | 5 | 25,966 | $11.92 | 2% | 18% | $309,472 | 1% | 18% | ||||||||||
| 2021 | 2 | 486,143 | $20.53 | 46% | 64% | $9,980,474 | 46% | 64% | ||||||||||
| 2022 | 0 | 0 | $0.00 | 0% | 64% | $0 | 0% | 64% | ||||||||||
| 2023 | 4 | 156,786 | $19.63 | 15% | 79% | $3,078,026 | 14% | 78% | ||||||||||
| 2024 | 0 | 0 | $0.00 | 0% | 79% | $0 | 0% | 78% | ||||||||||
| 2025 | 2 | 28,744 | $19.56 | 3% | 82% | $562,370 | 3% | 81% | ||||||||||
| 2026 | 2 | 172,388 | $24.12 | 16% | 98% | $4,157,731 | 19% | 100% | ||||||||||
| 2027 | 0 | 0 | $0.00 | 0% | 98% | $0 | 0% | 100% | ||||||||||
| 2028 & Beyond | 0 | 0 | $0.00 | 0% | 98% | $0 | 0% | 100% | ||||||||||
| Vacant | 0 | 21,711 | $0.00 | 2% | 100% | $0 | 0% | 100% | ||||||||||
| Total/Wtd. Avg. | 27 | 1,055,273 | $21.07 | 100% | $21,777,744 | 100% | ||||||||||||
| (1) | The Non-Collateral Improvements are not collateral for the 300 South Riverside Plaza Fee Mortgage Loan (except for the reversionary interest of the 300 South Riverside Plaza Fee Borrower therein). The lease rollover schedule above represents leases of the Ground Lessee’s Non-Collateral Improvements and is provided for informational purposes only. |
| (2) | Wtd. Avg. UW Rent PSF Rolling excludes vacant space. |
| This is not a research report and was not prepared by the Underwriters’ research departments. Please see additional important information and qualifications at the end of this Term Sheet. |
T-30
| MSBAM 2015-C22 | 300 South Riverside Plaza Fee |
Operating History and Underwritten Cash Flow. The following table presents certain information relating to the historic operating results of the Non-Collateral Improvements and the underwritten cash flow at the 300 South Riverside Plaza Fee Property:
| Leasehold 2011 | Leasehold 2012 | Leasehold 2013 | Leasehold 2014 | Assumed with JP Morgan Chase “Marked to Market”(2) | UW(3) | UW PSF | ||||||||||
| Base Rent | $14,245,194 | $13,995,540 | $15,203,291 | $14,514,574 | $22,269,215 | $9,900,000 | $9.38 | |||||||||
| Total Recoveries | $13,605,646 | $14,504,680 | $14,137,082 | $11,586,828 | $14,193,158 | $0 | $0.00 | |||||||||
| Other Income | $785,501 | $913,637 | $791,242 | $810,476 | $791,242 | $0 | $0.00 | |||||||||
| Discounts Concessions | $0 | $0 | $0 | $0 | $0 | $0 | $0.00 | |||||||||
| Less Vacancy & Credit Loss | $0 | $0 | $0 | $0 | ($3,026,377) | $0 | $0.00 | |||||||||
| Effective Gross Income | $28,636,341 | $29,413,856 | $30,131,615 | $26,911,878 | $34,227,238 | $9,900,000 | $9.38 | |||||||||
Total Expenses(4) | $13,355,490 | $13,509,310 | $13,957,600 | $14,573,938 | $14,331,423 | $0 | $0.00 | |||||||||
| Net Operating Income | $15,280,851 | $15,904,546 | $16,174,015 | $12,337,940 | $19,895,815 | $9,900,000 | $9.38 | |||||||||
| Capital Expenditures | $0 | $0 | $0 | $0 | $316,939 | $0 | $0.00 | |||||||||
| TI/LC | $0 | $0 | $0 | $0 | $1,285,850 | $0 | $0.00 | |||||||||
| Net Cash Flow | $15,280,851 | $15,904,546 | $16,174,015 | $12,337,940 | $18,293,025 | $9,900,000 | $9.38 | |||||||||
| Occupancy % | 87.6% | 96.7% | 78.5% | (5) | 97.0% | (5) | 91.7% | N/A | ||||||||
| 2.28x | 2.38x | 2.42x | 1.84x | 2.97x | 1.48x | |||||||||||
| 2.28x | 2.38x | 2.42x | 1.84x | 2.74x | 1.48x | |||||||||||
| NOI Debt Yield | 9.2% | 9.5% | 9.7% | 7.4% | 11.9% | 5.9% | ||||||||||
| NCF Debt Yield | 9.2% | 9.5% | 9.7% | 7.4% | 11.0% | 5.9% | ||||||||||
| (1) | The Non-Collateral Improvements are not collateral for the 300 South Riverside Plaza Fee Mortgage Loan (except for the reversionary interest of the 300 South Riverside Plaza Fee Borrower therein). The cash flow analysis table above represents historical financial results of the Non-Collateral Improvements and this historical financial data is provided for informational purposes only. The historical Occupancy % numbers reflect the occupancy of the Non-Collateral Improvements. The underwritten column above reflects the underwritten cash flow and related statistics associated with the 300 South Riverside Plaza Fee Property. |
| (2) | The Assumed with JP Morgan Chase “Marked to Market” column represents an underwriting assumption that the current office lease with JP Morgan Chase, totaling 482,722 SF, is leased at the appraiser’s estimate of market rent associated with such office space. The JP Morgan Chase tenant currently pays $5,430,945 in annual base rent, or approximately $11.25 PSF. The appraiser estimates that such space, if available to lease, could currently be rented at approximately $22.00 PSF The appraiser’s estimate of market rent may or may not be achievable and is presented for informational purposes only. |
| (3) | The UW cash flow represents the ground rent payable to the 300 South Riverside Plaza Fee Borrower. The contractual annual rent payment is $9,900,000 on an absolute net basis. The lease has certain contractual rent steps as described above. See “—The Property” above for details. |
| (4) | The historical expenses do not reflect the related party air rights rent of $647,764 (2011, 2012, 2013) and $651,724 (2014) per annum paid to the former owner of the 300 South Riverside Plaza Fee Property. |
| (5) | A former tenant, National Union Fire, vacated approximately 199,214 SF in 2013. Approximately 172,000 SF of the former National Union Fire space was released to Zurich American Insurance and Newark Corporation effective May 1, 2014 and September 1, 2014, respectively. This temporary vacancy impacted the occupancy as of 12/31/2013 and the 2014 leasehold operating results. The 2014 occupancy rate reflects a rent roll dated 9/30/14. |
Escrows and Reserves. Pursuant to the Ground Lease, the Ground Lessee under the Ground Lease is obligated to pay real estate taxes, insurance premiums, tenant improvements, leasing commissions, operating expenses and capital expenditures with respect to the 300 South Riverside Plaza Fee Mortgaged Property. If at any time the Ground Lease is not in full force and effect, the lender may require the 300 South Riverside Plaza Fee Borrower to establish promptly and maintain with the lender reserves for the payment of tenant improvements, leasing commissions, operating expenses and capital expenditures. If at any time the Ground Lease is not in full force and effect, an event of default on the 300 South Riverside Plaza Fee Mortgage Loan has occurred and is continuing or the ground tenant is subject to a bankruptcy or insolvency proceeding, the 300 South Riverside Plaza Fee Borrower will be required to deposit with the lender monthly 1/12 of the annual estimated tax payments and 1/12 of the annual estimated insurance premiums.
Lockbox and Cash Management. A hard lockbox is in place with respect to the 300 South Riverside Plaza Fee Mortgage Loan. The 300 South Riverside Plaza Fee Mortgage Loan has springing cash management. Provided a Cash Sweep Period (as defined below) has not commenced, funds in the lockbox account are swept daily to an account designated by the 300 South Riverside Plaza Fee Borrower. During the continuance of a Cash Sweep Period, funds in the lockbox account are applied on each monthly payment date (i) to pay debt service on the 300 South Riverside Plaza Fee Mortgage Loan, (ii) to disburse, provided no event of default on the 300 South Riverside Plaza Fee Mortgage Loan has occurred and is continuing, to the 300 South Riverside Plaza Fee Borrower the monthly amount payable for operating expenses incurred by the 300 South Riverside Plaza Fee Borrower in connection with the operation and maintenance of the 300 South Riverside Plaza Fee Mortgaged Property and approved by the lender of the 300 South Riverside Plaza Fee Mortgage Loan, and (iii) to remit the remainder to an account to be held by the lender as additional security for the 300 South Riverside Plaza Fee Mortgage Loan.
A “Cash Sweep Period” will (a) commence on March 5, 2025 and continue thereafter without expiration or (b) commence upon the occurrence of an event of default under the 300 South Riverside Plaza Fee Mortgage Loan and continue until such event of default is cured.
Additional Secured Indebtedness (not including trade debts). The 300 South Riverside Plaza Fee Property also secures an additional pari passu promissory note, the 300 South Riverside Plaza Fee Serviced Companion Loan, with a Cut-off Date balance of $67,000,000. The current holder of the 300 South Riverside Plaza Fee Serviced Companion Loan is Morgan Stanley Bank, N.A., and such note is expected to be contributed to one or more future trusts. The note evidencing the 300 South Riverside Plaza Fee Serviced Companion Loan accrues interest at the same rate as the 300 South Riverside Plaza Fee Mortgage Loan. The 300 South Riverside Plaza Fee Mortgage Loan is entitled to payments of principal and interest on a pro rata and pari passu basis with the 300 South Riverside Plaza Fee Serviced Companion Loan. The holders of the 300 South Riverside Plaza Fee Mortgage Loan and the 300 South Riverside Plaza Fee Serviced Companion Loan have entered into a co-lender agreement which sets forth the allocation of collections on the 300 South Riverside Plaza Fee Loan Pair. The 300 South Riverside Plaza Fee Mortgage Loan represents the controlling interest in the 300 South Riverside Plaza Fee Loan Pair. The 300 South Riverside Plaza Fee Loan Pair will be serviced pursuant to the terms of the pooling and
| This is not a research report and was not prepared by the Underwriters’ research departments. Please see additional important information and qualifications at the end of this Term Sheet. |
T-31
| MSBAM 2015-C22 | 300 South Riverside Plaza Fee |
servicing agreement for the MSBAM 2015-C22 securitization trust. See “Description of the Mortgage Pool—The A/B Whole Loans and the Loan Pairs—The 300 South Riverside Plaza Fee Loan Pair” in the Free Writing Prospectus and “Servicing of the Mortgage Loans” in the Free Writing Prospectus.
Mezzanine Loans and Preferred Equity. Not permitted.
Release of Property. Not permitted.
Terrorism Insurance. Generally, the 300 South Riverside Plaza Fee Borrower is required to obtain insurance against acts of terrorism or other similar acts or events (or “fire following”) to the extent such insurance is available in form and substance satisfactory to the lender in an amount determined by the lender in its sole discretion (in an amount not more than the sum of 100% of full replacement costs and 24 months of business interruption insurance). Notwithstanding the foregoing, for so long as the Terrorism Risk Insurance Program Reauthorization Act of 2007 (“TRIPRA”) (or any extension thereof or other federal government program with substantially similar protection) is in effect, the 300 South Riverside Plaza Fee Borrower is required to maintain, and lender is required to accept, terrorism insurance that covers “covered acts” (as defined by such statute or other program) as full compliance so long as such statute or other program covers both domestic and foreign acts of terrorism.
| This is not a research report and was not prepared by the Underwriters’ research departments. Please see additional important information and qualifications at the end of this Term Sheet. |
T-32
(THIS PAGE INTENTIONALLY LEFT BLANK)
T-33
| MSBAM 2015-C22 | Waterfront at Port Chester |
Mortgage Loan No. 2 – Waterfront at Port Chester
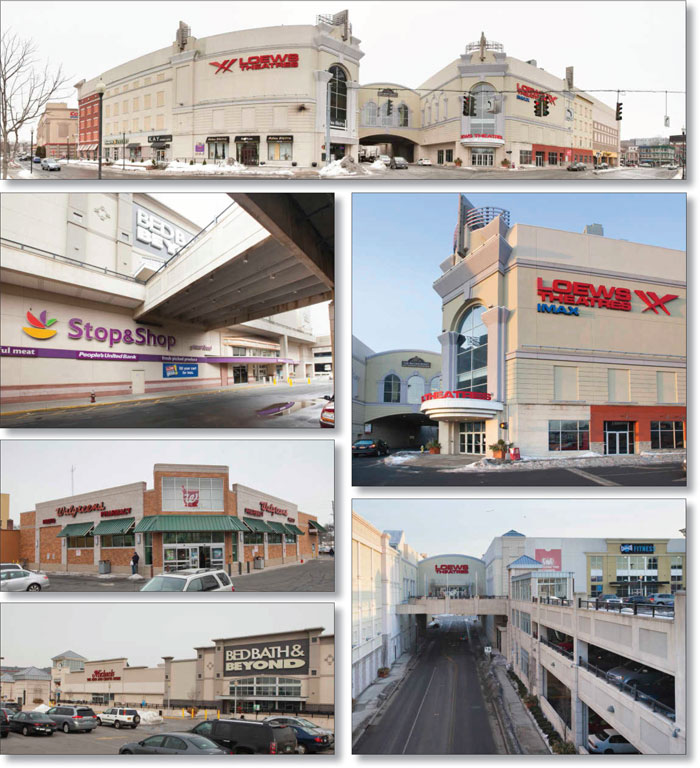
| This is not a research report and was not prepared by the Underwriters’ research departments. Please see additional important information and qualifications at the end of this Term Sheet. |
T-34
| MSBAM 2015-C22 | Waterfront at Port Chester |
Mortgage Loan No. 2 – Waterfront at Port Chester
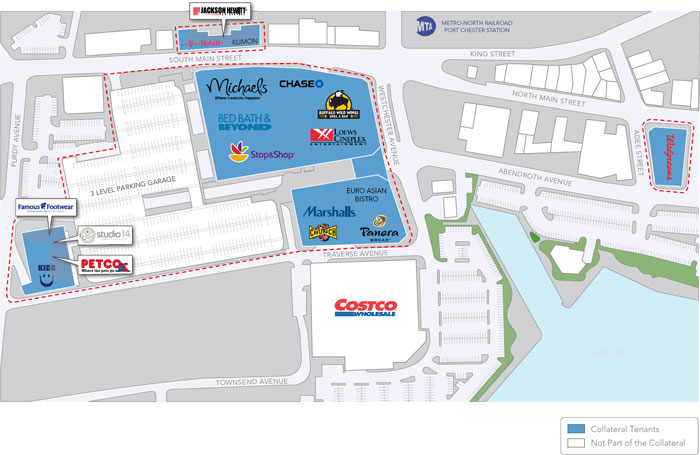
| This is not a research report and was not prepared by the Underwriters’ research departments. Please see additional important information and qualifications at the end of this Term Sheet. |
T-35
| MSBAM 2015-C22 | Waterfront at Port Chester |
Mortgage Loan No. 2 – Waterfront at Port Chester

| This is not a research report and was not prepared by the Underwriters’ research departments. Please see additional important information and qualifications at the end of this Term Sheet. |
T-36
| MSBAM 2015-C22 | Waterfront at Port Chester |
| Mortgage Loan Information | Mortgaged Property Information | ||||||
| Mortgage Loan Seller: | MSMCH | Single Asset/Portfolio: | |||||
Original Balance(1): | Location: | ||||||
Cut-off Date Balance(1): | General Property Type: | ||||||
| % of Initial Pool Balance: | 7.2% | Detailed Property Type: | |||||
| Loan Purpose: | Title Vesting(4): | ||||||
| Sponsor: | Year Built/Renovated: | ||||||
| Mortgage Rate: | Size: | ||||||
| Note Date: | Cut-off Date Balance per Unit(1): | ||||||
| First Payment Date: | Maturity Date Balance per Unit(1): | ||||||
| Maturity Date: | Property Manager: | ||||||
| Original Term to Maturity: | |||||||
| Original Amortization Term: | Underwriting and Financial Information | ||||||
| IO Period: | UW NOI: | ||||||
| Seasoning: | UW NOI Debt Yield(1): | ||||||
Prepayment Provisions(2): | UW NOI Debt Yield at Maturity(1): | ||||||
| Lockbox/Cash Mgmt Status: | UW NCF DSCR(1): | ||||||
| Additional Debt Type: | Most Recent NOI: | ||||||
| Additional Debt Balance: | 2nd Most Recent NOI: | ||||||
| Future Debt Permitted (Type): | 3rd Most Recent NOI: | ||||||
Reserves(3) | Most Recent Occupancy: | ||||||
| Type | Initial | Monthly | Cap | 2nd Most Recent Occupancy: | |||
| RE Tax: | 3rd Most Recent Occupancy: | ||||||
| Insurance: | Appraised Value (as of): | ||||||
| Recurring Replacements: | Cut-off Date LTV Ratio(1): | ||||||
| TI/LC: | $0 | $29,240 | $1,200,000 | Maturity Date LTV Ratio(1): | 75.0% | ||
Other(3): | $62,500 | $0 | N/A | ||||
| Sources | Proceeds | % of Total | Uses | Proceeds | % of Total | ||
Loan Amount(1): | 100.0% | Loan Payoff(5): | 87.7% | ||||
| Reserves: | 0.3% | ||||||
| Closing Costs: | $2,297,178 | 1.7% | |||||
| Return of Equity: | $13,702,610 | 10.3% | |||||
| Total Sources: | 100.0% | Total Uses: | 100.0% | ||||
| (1) | The Waterfront at Port Chester Mortgage Loan is part of the Waterfront at Port Chester Loan Pair, which is comprised of two pari passu notes with an aggregate principal balance of $133,500,000. The Cut-off Date Balance per Unit, Maturity Date Balance per Unit, UW NOI Debt Yield, UW NOI Debt Yield at Maturity, UW NCF DSCR, Cut-off Date LTV Ratio and Maturity Date LTV Ratio numbers presented above are based on the aggregate note balance of the Waterfront at Port Chester Loan Pair. |
| (2) | The final lockout and defeasance periods will be determined based on the securitization date of the last component of the Waterfront at Port Chester Loan Pair. |
| (3) | See “—Escrows and Reserves” below for further discussion of reserve requirements. At loan origination, the Waterfront at Port Chester Borrower deposited $62,500 into an escrow for an environmental condition. |
| (4) | The Village of Port Chester Industrial Development Agency (“IDA”) owns the fee interest in the Waterfront at Port Chester Property and the Waterfront at Port Chester Borrower owns the leasehold interest; however, the IDA has provided a mortgage of its fee interest in the Waterfront at Port Chester Property as security for the Waterfront at Port Chester Mortgage Loan. |
| (5) | The loan payoff includes a previous loan balance and a related defeasance premium totaling $101,520,142, plus a second loan of approximately $15,566,735. |
The Mortgage Loan. The second largest mortgage loan (the “Waterfront at Port Chester Mortgage Loan”) is part of a loan pair (the “Waterfront at Port Chester Loan Pair”) evidenced by two pari passu promissory notes in the aggregate Cut-off Date principal balance of $133,500,000, both of which are secured by the same first priority fee mortgage encumbering an anchored shopping center known as the Waterfront at Port Chester, in Port Chester, New York (the “Waterfront at Port Chester Property”). Promissory Note A-1, in the original principal amount of $80,000,000, represents the Waterfront at Port Chester Mortgage Loan and Promissory Note A-2, in the original principal amount of $53,500,000 (the “Waterfront at Port Chester Serviced Companion Loan”), is expected to be held by Morgan Stanley Bank, N.A. or an affiliate on the closing date of this transaction and may be contributed to one or more future securitization transactions. See “Description of the Mortgage Pool—The A/B Whole Loans and the Loan Pairs—The Waterfront at Port Chester Loan Pair” and “Servicing of the Mortgage Loans” in the Free Writing Prospectus. The Waterfront at Port Chester Loan Pair will be serviced pursuant to terms of the MSBAM 2015-C22 pooling and servicing agreement. The proceeds of the Waterfront at Port Chester Loan Pair were primarily used to refinance two previous loans secured by different portions of the Waterfront at Port Chester Property, totaling approximately $117,086,877 (including defeasance premiums), and return equity to the Waterfront at Port Chester Borrower. A previous loan secured by a portion of the Waterfront at Port Chester Property was included in the BACM 2006-1 transaction.
The Borrower and the Sponsor. The borrowers are G&S Port Chester Retail 1 DE, LLC, G&S Port Chester Unit 2A DE, LLC, G&S Port Chester Unit 4A DE, LLC, and G&S Port Chester Unit 2C DE, LLC (collectively, the “Waterfront at Port Chester Borrower”), each a single-purpose Delaware limited
| This is not a research report and was not prepared by the Underwriters’ research departments. Please see additional important information and qualifications at the end of this Term Sheet. |
T-37
| MSBAM 2015-C22 | Waterfront at Port Chester |
liability company with two independent directors. The president and majority owner of the Waterfront at Port Chester Borrower, nonrecourse carve-out guarantor and sponsor is Gregg Wasser.
Mr. Wasser is a founder of G&S Investors (“G&S”), a New York City-based real estate development company primarily operating in New York and New Jersey. The Waterfront at Port Chester Property was developed by G&S in 2005-2007.
The Property. The Waterfront at Port Chester Property is a 349,743 SF, five-building power center anchored by a Super Stop & Shop. Three of the five buildings are two-story buildings, are located on a contiguous parcel (the “Main Parcel”), and are connected by a shared three-level, 1,334-space parking structure (the “Parking Structure”) with a sky-bridge between two of the three buildings. A fourth building comprises retail strip space located across South Main Street from the Main Parcel. The fifth building is a free-standing Walgreens store located a block north of the Main Parcel. In addition to the 70,216 SF Super Stop & Shop, the Waterfront at Port Chester Property is anchored by a Bed Bath & Beyond, a Marshalls, a Michaels and a Petco. There is also a 14-screen AMC Loews Theater and a 23,404 SF Crunch Fitness health club. There is an adjacent Costco shadow anchor, adjacent to the Main Parcel, which is not part of the Waterfront at Port Chester Property and is not collateral for the Waterfront at Port Chester Mortgage Loan. There is a total of 1,500 parking spaces, including the Parking Structure and additional surface parking.
The Waterfront at Port Chester Property is located one block from the Metro-North Railroad Port Chester Station. The Parking Structure is subject to a two-unit condominium regime whereby Levels 1 and 3, containing 984 spaces (Unit A), and representing approximately 73.8% of the common interests (a controlling interest), are owned by the Waterfront at Port Chester Borrower and Level 2, containing 350 spaces (Unit B), and representing approximately 26.2% of the common interests, is owned by the Metropolitan Transportation Authority (the “MTA”) or an affiliate. The MTA has exclusive use of level 2 during certain “peak” hours for train station related parking. During “non-peak” hours, parking is available on Level 2 for visitors to the Waterfront at Port Chester Property. The MTA reimburses the Waterfront at Port Chester Borrower for its pro-rata share of expenses associated with the maintenance of the Parking Structure. The Waterfront at Port Chester Borrower’s ownership interest in Unit A is collateral for the Waterfront at Port Chester Mortgage Loan.
The Waterfront at Port Chester Property was constructed between 2005 and 2007 pursuant to an agreement with the Port Chester Industrial Development Authority (the “IDA”). The Waterfront at Port Chester Borrower owns the leasehold interest in the Waterfront at Port Chester Property and the IDA owns the fee interest; however, the IDA has pledged its fee interest in the Waterfront at Port Chester Property as security for the Waterfront at Port Chester Mortgage Loan. The IDA agreement includes a 20-year PILOT program applicable to the Waterfront at Port Chester Property.
Major Tenants.
Super Stop & Shop (70,216 SF, 20% of NRA, 26% of underwritten base rent). Stop & Shop Supermarket Company LLC (“Super Stop & Shop”) leases 70,216 SF at the Waterfront at Port Chester Property. The lease began on October 13, 2000 and has a current expiration date of August 31, 2030, with four automatic five-year lease renewal periods followed by five additional five-year lease renewal options. The lease is guaranteed by the tenant’s parent, Koninklijke Ahold N.V. (AHLN.AS) (“Ahold”). As of its 2013 annual report, Ahold, through two U.S. based subsidiaries, operated 397 Stop & Shop stores in New England and Metropolitan New York.
AMC Loews Theater (70,000 SF, 20% of NRA, 22% of underwritten base rent). RKO Century Warner Theaters, Inc. (“AMC Loews Theater”) leases 70,000 SF at the Waterfront at Port Chester Property and operates the space as a 14-screen movie theater. The lease began on October 28, 2005 and has a current expiration date of December 31, 2030, with four five-year lease renewal options followed by one three-year lease renewal option. The lease is guaranteed by Loews Cineplex Entertainment Corporation. AMC Entertainment, Inc. (“AMC”) is the second largest movie theatre operator in the United States. The company operates approximately 345 theatres in the U.S., Canada, France, Hong Kong, Japan, Portugal, Spain and the United Kingdom under the banners American Multi-Cinema, Inc., AMC, International Theatrical Exhibition and National Cinema Network, Inc. AMC merged with Loews Cineplex Entertainment Corporation in 2006.
Bed Bath & Beyond (36,068 SF, 10% of NRA, 8% of underwritten base rent).Bed Bath & Beyond Inc. (“Bed Bath & Beyond”) (NASDAQ: BBY) leases 36,068 SF at the Waterfront at Port Chester Property. The lease began on March 3, 2006 and has a current expiration date of January 31, 2022, with three five-year lease renewal options. Bed Bath & Beyond and its subsidiaries operate approximately 1,400 stores under various brand names, including Bed Bath & Beyond, in the United States, Canada and Mexico.
Marshalls (30,105 SF, 9% of NRA, 8% of underwritten base rent). Marshalls of MA, Inc. (“Marshalls”) leases 30,105 SF at the Waterfront at Port Chester Property. The lease began on May 26, 2005 and has a current expiration date of May 31, 2020, with four five-year lease renewal options. Marshalls is a subsidiary of the TJX Companies, Inc. (NYSE: TJX), an off-price retailer of apparel and home fashions under various brands in the U.S. and worldwide, with more than 3,200 stores in six countries.
Crunch Fitness (23,404 SF, 7% of NRA, 8% of underwritten base rent). Fitness Holdings Port Chester LLC (“Crunch Fitness”) leases 23,404 SF at the Waterfront at Port Chester Property. The lease began on July 1, 2014 and has a current expiration date of December 31, 2025, with three five-year lease renewal options. Crunch is a health club chain founded in 1989, based in New York City, and co-owned by New Evolution Ventures and Angelo Gordon. The lease at the Waterfront at Port Chester Property is with a franchisor affiliate of Greenwich, Connecticut-based RLB Holdings.
| This is not a research report and was not prepared by the Underwriters’ research departments. Please see additional important information and qualifications at the end of this Term Sheet. |
T-38
| MSBAM 2015-C22 | Waterfront at Port Chester |
The following table presents certain information relating to the leases at the Waterfront at Port Chester Property:
Tenant Summary(1) | ||||||||||||||||||
| Tenant Name | Credit Rating (Fitch/Moody’s/S&P)(2) | Tenant SF | Approximate % of SF | Annual UW Rent | % of Total Annual UW Rent | Annual UW Rent PSF(3) | Lease Expiration | 2014 Sales PSF/Screen | ||||||||||
| Anchor/Major Tenants | ||||||||||||||||||
| Super Stop & Shop | BBB/Baa3/BBB | 70,216 | 20% | $2,597,992 | 26% | $37.00 | 8/31/2030 | $597 | ||||||||||
| AMC Loews Theater | NR/NR/B+ | 70,000 | 20% | $2,200,000 | 22% | $31.43 | 12/31/2030 | $652,759 | ||||||||||
| Bed Bath & Beyond | NR/Baa1/A- | 36,068 | 10% | $775,000 | 8% | $21.49 | 1/31/2022 | $279 | ||||||||||
| Marshalls | NR/A3/A+ | 30,105 | 9% | $810,000 | 8% | $26.91 | 5/31/2020 | $355 | (4) | |||||||||
| Crunch Fitness | NR/NR/NR | 23,404 | 7% | $816,482 | 8% | $34.89 | 12/31/2025 | N/A | ||||||||||
| Michaels | NR/NR/NR | 21,390 | 6% | $427,800 | 4% | $20.00 | 3/31/2016 | $195 | ||||||||||
| Petco | NR/B3/B | 19,691 | 6% | $531,657 | 5% | $27.00 | 5/31/2017 | $131 | (4) | |||||||||
| Walgreens | NR/Baa2/BBB | 11,210 | 3% | $384,160 | 4% | $34.27 | 1/31/2028 | $341 | ||||||||||
| Subtotal/Wtd. Avg. | 282,084 | 81% | $8,543,091 | 85% | $30.29 | |||||||||||||
| Other Tenants | 52,434 | 15% | $1,476,121 | 15% | $28.15 | |||||||||||||
| Vacant Space | 15,225 | 4% | $0 | 0% | $0.00 | |||||||||||||
| Total/Wtd. Avg. | 349,743 | 100% | $10,019,212 | 100% | $29.95 | |||||||||||||
| (1) | Information is based on the underwritten rent roll, except the Super Stop & Shop SF and base rent, which is based on the tenant’s provided lease estoppel. |
| (2) | Certain ratings are those of the parent company whether or not the parent guarantees the lease. |
| (3) | Wtd. Avg. Annual UW Rent PSF Rolling excludes vacant space. |
| (4) | Marshalls and Petco sales are for the 2013 calendar year. |
The following table presents certain information relating to the lease rollover schedule at the Waterfront at Port Chester Property:
Lease Rollover Schedule(1)(2) | ||||||||||||||||||
| Year | # of Leases Rolling | SF Rolling | UW Rent PSF Rolling(3) | Approx. % of Total SF Rolling | Approx. Cumulative % of SF Rolling | Total UW Rent Rolling | Approx. % of Total Rent Rolling | Approx. Cumulative % of Total Rent Rolling | ||||||||||
| MTM | 0 | 0 | $0.00 | 0% | 0% | $0 | 0% | 0% | ||||||||||
| 2015 | 5 | 15,365 | $36.28 | 4% | 4% | $557,396 | 6% | 6% | ||||||||||
| 2016 | 1 | 21,390 | $20.00 | 6% | 11% | $427,800 | 4% | 10% | ||||||||||
| 2017 | 4 | 34,471 | $24.65 | 10% | 20% | $849,772 | 8% | 18% | ||||||||||
| 2018 | 1 | 1,844 | $25.23 | 1% | 21% | $46,533 | 0% | 19% | ||||||||||
| 2019 | 0 | 0 | $0.00 | 0% | 21% | $0 | 0% | 19% | ||||||||||
| 2020 | 3 | 40,110 | $27.79 | 11% | 32% | $1,114,570 | 11% | 30% | ||||||||||
| 2021 | 1 | 873 | $29.00 | 0% | 33% | $25,317 | 0% | 30% | ||||||||||
| 2022 | 1 | 36,068 | $21.49 | 10% | 43% | $775,000 | 8% | 38% | ||||||||||
| 2023 | 1 | 5,142 | $15.01 | 1% | 44% | $77,190 | 1% | 39% | ||||||||||
| 2024 | 2 | 4,425 | $33.22 | 1% | 46% | $147,000 | 1% | 40% | ||||||||||
| 2025 | 1 | 23,404 | $34.89 | 7% | 52% | $816,482 | 8% | 48% | ||||||||||
| 2026 | 0 | 0 | $0.00 | 0% | 52% | $0 | 0% | 48% | ||||||||||
| 2027 | 0 | 0 | $0.00 | 0% | 52% | $0 | 0% | 48% | ||||||||||
| 2028 & Beyond | 3 | 151,426 | $34.22 | 43% | 96% | $5,182,152 | 52% | 100% | ||||||||||
| Vacant | 0 | 15,225 | $0.00 | 4% | 100% | $0 | 0% | 100% | ||||||||||
| Total/Wtd. Avg. | 23 | 349,743 | $29.95 | 100% | $10,019,212 | 100% | ||||||||||||
| (1) | Information is based on the underwritten rent roll, except the Super Stop & Shop SF and base rent, which is based on the tenant’s provided lease estoppel. |
| (2) | Certain tenants may have lease termination options that are exercisable prior to the originally stated expiration date of the subject lease and that are not considered in the lease rollover schedule. |
| (3) | Wtd. Avg. UW Rent PSF Rolling excludes vacant space. |
| This is not a research report and was not prepared by the Underwriters’ research departments. Please see additional important information and qualifications at the end of this Term Sheet. |
T-39
| MSBAM 2015-C22 | Waterfront at Port Chester |
The Market. The Waterfront at Port Chester Property is located in the Village of Port Chester, Westchester County, New York near the borders of Rye, New York and Byram (Greenwich), Connecticut, and within the Central Westchester retail submarket. As of September 30, 2014, the Central Westchester retail submarket had a retail inventory of approximately 3.3 million SF, a 9.2% average vacancy rate and an average asking rent of $39.08 PSF. Estimated 2014 population within a three-mile radius was 73,813 people and estimated 2014 average household income within a three-mile radius was $133,685.
The following table presents recent occupancy and leasing data at five primary competitive centers to the Waterfront at Port Chester Property:
| Competitive Property Summary | ||||||||||||||||||
| Property Name/Location | Type | Year Built | Year Renov. | Occ. | Total GLA (SF) | Anchor Tenants | Rent PSF | Distance to Subject | ||||||||||
Port Chester Shopping Center 421-575 Boston Post Road Port Chester, NY | Regional Center | 1970 | 2007 | 97% | 530,000 | Kohl’s Whole Foods Home Goods Party City | $18.00 - $45.00 | 0.8 miles South | ||||||||||
Post Road Plaza 260 & 262 Boston Post Road Port Chester, NY | Neighborhood Center | 1985 | 2013 | 100% | 60,000 | LA Fitness Sleepy’s Apple Farm Market | $20.00 - $40.00 | 0.6 miles South | ||||||||||
Rye Ridge Shopping Center 126 South Ridge Street Rye Brook, NY | Community Center | 1961 | 2010 | 98% | 232,346 | D’Agostino Grocery CVS Pharmacy Ace Hardware Medical Office Building | $30.00 - $50.00 | 0.9 miles West | ||||||||||
Washington Park Plaza 251 South Ridge Street Rye Brook, NY | Neighborhood Center | 1979 | 2012 | 100% | 55,000 | A&P Fresh Market CVS Pharmacy Wells Fargo Bank | $20.00 - $35.00 | 1.1 miles West | ||||||||||
White Plains City Center 5 City Place White Plains, NY | Regional Center | 2004 | 2010 | 98% | 515,000 | Target Shop Rite Nordstroms Rack Showcase Cinemas | $22.00 - $55.00 | 5.2 miles West | ||||||||||
Source: Appraisal
Operating History and Underwritten Cash Flow. The following table presents certain information relating to the underwritten cash flow at the Waterfront at Port Chester Property:
| 2011 | 2012 | 2013 | 2014 | UW | UW PSF | |||||||||
Base Rent(1) | N/A | $10,437,488 | $10,432,354 | $10,306,816 | $10,475,848 | $29.95 | ||||||||
| Total Recoveries | N/A | $2,016,441 | $2,145,970 | $1,837,025 | $1,795,744 | $5.13 | ||||||||
| Other Income | N/A | $559,452 | $815,055 | $685,919 | $773,521 | $2.21 | ||||||||
| Discounts Concessions | N/A | ($322,483) | ($324,239) | $0 | $0 | $0.00 | ||||||||
| Less Vacancy & Credit Loss | N/A | $0 | $0 | ($411,340) | ($498,706) | ($1.43) | ||||||||
| Effective Gross Income | N/A | $12,690,898 | $13,069,140 | $12,418,420 | $12,546,407 | $35.87 | ||||||||
| Total Operating Expenses | N/A | $2,655,741 | $2,557,288 | $2,668,847 | $3,023,714 | $8.65 | ||||||||
| Net Operating Income | N/A | $10,035,157 | $10,511,852 | $9,749,573 | $9,522,693 | $27.23 | ||||||||
| Capital Expenditures | N/A | $0 | $0 | $0 | $52,632 | $0.15 | ||||||||
| TI/LC | N/A | $0 | $0 | $0 | $168,423 | $0.48 | ||||||||
| Net Cash Flow | N/A | $10,035,157 | $10,511,852 | $9,749,573 | $9,301,637 | $26.60 | ||||||||
Occupancy %(2) | N/A | 99.0% | 99.0% | 95.7% | 95.2% | |||||||||
| N/A | 1.80x | 1.88x | 1.74x | 1.70x | ||||||||||
| N/A | 1.80x | 1.88x | 1.74x | 1.66x | ||||||||||
| NOI Debt Yield | N/A | 7.5% | 7.9% | 7.3% | 7.1% | |||||||||
| NCF Debt Yield | N/A | 7.5% | 7.9% | 7.3% | 7.0% | |||||||||
| (1) | Underwritten Rent associated with the Super Stop & Shop tenant is based on the average base rent during the loan term. |
| (2) | Historical occupancy represents year-end data. A 30,000 SF former tenant vacated is space during the first quarter of 2014 and was replaced by the Crunch Fitness tenant effective July 1, 2014. |
Escrows and Reserves. The Waterfront at Port Chester Borrower deposited $350,835 in escrow for annual real estate taxes at loan origination and is required to escrow monthly 1/12 of the annual estimated tax payments. The Waterfront at Port Chester Borrower is required to escrow monthly 1/12 of the annual estimated insurance premiums (unless the Waterfront at Port Chester Borrower maintains insurance under an acceptable blanket insurance policy). The Waterfront at Port Chester Borrower is required to make monthly deposits of $4,386 for replacement reserves (which amount may be increased by the lender if the lender reasonably determines that an increase is necessary to maintain proper operation of the Waterfront at Port Chester Property), provided that such deposits are not required to the extent that the amount then on deposit in the replacement reserve exceeds $250,000. The Waterfront at Port Chester Borrower is required to make monthly deposits of $29,240 for TI/LC reserves, provided that such deposits are not required to the extent that the amount then on deposit in the TI/LC reserve exceeds $1,200,000. The Waterfront at Port Chester Borrower also deposited in escrow at loan origination $62,500 for costs which may be incurred as a result of environmental conditions at the Waterfront at Port Chester Property, which amount will be disbursed to the Waterfront at Port Chester Borrower, amongst other conditions, upon delivery to the lender of a reasonably satisfactory
| This is not a research report and was not prepared by the Underwriters’ research departments. Please see additional important information and qualifications at the end of this Term Sheet. |
T-40
| MSBAM 2015-C22 | Waterfront at Port Chester |
site inspection with respect to such conditions. With respect to the aforementioned environmental escrow, $6,250 of the escrow amount is to be released to the Waterfront at Port Chester Borrower annually during the loan term if there are no costs incurred with respect to the noted environmental conditions.
Lockbox and Cash Management. A hard lockbox is in place with respect to the Waterfront at Port Chester Mortgage Loan. The Waterfront at Port Chester Mortgage Loan has springing cash management. Provided a Cash Sweep Period has not commenced, funds in the lockbox account are swept daily to an account designated by the Waterfront at Port Chester Borrower. During the continuance of a Cash Sweep Period, funds in the lockbox account are applied on each monthly payment date to pay debt service on the Waterfront at Port Chester Mortgage Loan, to fund the required reserves deposits as described above under “—Escrows and Reserves,” to disburse, provided no event of default has occurred and is continuing, to the Waterfront at Port Chester Borrower the monthly amount payable for operating expenses not otherwise paid or reserved for as described above under “—Escrows and Reserves” and referenced in the annual budget approved by lender together with other amounts incurred by the Waterfront at Port Chester Borrower in connection with the operation and maintenance of the Waterfront at Port Chester Property approved by lender, and to remit the remainder to an account to be held by the lender as additional security for the Waterfront at Port Chester Mortgage Loan.
A “Cash Sweep Period” will commence upon the occurrence of an event of default, a DSCR Event (as defined below), a Tenant Credit Event (as defined below) or a Major Lease Termination Event (as defined below) and continue until:
| (i) | in the case of an event of default, the lender’s acceptance of a cure of such event of default, or |
| (ii) | in the case of DSCR Event, the debt service coverage ratio, measured as of the end of any calendar quarter, is greater than 1.25x for the trailing six consecutive month period, or |
| (iii) | in the case of a Tenant Credit Event, either (1) if the Tenant Credit Event is caused pursuant to an event described in clause (a) of the definition thereof, the date on which the Major Tenant’s lease has been affirmed in bankruptcy or (2) if the Tenant Credit Event is caused pursuant to an event described in clause (b) of definition thereof, the earliest to occur of (x) the date which is three months after the date on which such Major Tenant is re-opened for business and is in physical occupancy of its space at the Waterfront at Port Chester Property for such continuous period under the applicable lease which has been approved by the lender in its sole discretion, (y) the date on which the Major Tenant’s entire space has been re-let to a new tenant pursuant to a new lease on terms and conditions approved by the lender in its sole discretion or (z) the date on which the Waterfront at Port Chester Mortgage Loan has been partially defeased in part in accordance with the loan agreement for the Waterfront at Port Chester Mortgage Loan and the applicable individual parcel comprising the Waterfront at Port Chester Property has been released from the lien of the related mortgage, or |
| (iv) | in the case of a Major Lease Termination Event, the earliest to occur of (x) the date on which the tenant under the subject Major Lease executes a renewal of the applicable lease for the demised space pursuant to the terms and conditions of the loan agreement for the Waterfront at Port Chester Mortgage Loan, (y) the date on which the applicable Major Tenant’s entire space has been re-let to a new tenant pursuant to a new lease on terms and conditions approved by the lender in its sole discretion or (z) the date on which the Waterfront at Port Chester Mortgage Loan has been partially defeased in part in accordance with the loan agreement for the Waterfront at Port Chester Mortgage Loan and the applicable individual parcel comprising the Waterfront at Port Chester Property has been released from the lien of the related mortgage. |
A “DSCR Event” means the debt service coverage ratio, measured as of the end of any calendar quarter, has been less than 1.20x for the trailing six consecutive month period.
A “Major Lease” means each of (i) that certain lease, dated as of October 13, 2000, as amended between the Waterfront at Port Chester Borrower’s predecessor in interest as landlord and The Stop & Shop Supermarket Company, as tenant, (ii) that certain lease agreement, dated as of June 28, 2002, between the Waterfront at Port Chester Borrower’s predecessor in interest as landlord and Loews Mohawk Mall Cinemas, Inc., as tenant or (iii) any replacement lease entered into for the premises demised under either of the leases referred to in clauses (i) and (ii) of this definition.
A “Major Lease Termination Event” means, on the date which is 12 months prior to the expiration date of a Major Lease, a Major Tenant has not renewed such Major Lease, either by failing to give notice of its intent to renew, by giving notice of non-renewal or otherwise giving notice of its intent to terminate or vacate the demised premises.
A “Major Tenant” means any tenant which is party to a Major Lease.
A “Tenant Credit Event” means either (a) a Major Tenant files a voluntary bankruptcy petition or an involuntary bankruptcy petition is filed against a Major Tenant (or a Major Tenant consents to or otherwise acquiesces or joins in such a filing), consents to (or otherwise acquiesces or joins in an application for) a receiver or examiner, makes an assignment for the benefit of creditors or admits in writing its insolvency or inability to pay its debts as they come due or (b) a Major Tenant has “gone dark” for thirty consecutive days or vacated or surrendered its demised premises at the Waterfront at Port Chester Property.
Additional Secured Indebtedness (not including trade debts). The Waterfront at Port Chester Property also secures an additional pari passu promissory note, the Waterfront at Port Chester Serviced Companion Loan, with a Cut-off Date balance of $53,500,000. The current holder of the Waterfront at Port Chester Serviced Companion Loan is Morgan Stanley Bank, N.A., and such note is expected to be contributed to one or more future trusts. The note evidencing the Waterfront at Port Chester Serviced Companion Loan accrues interest at the same rate as the Waterfront at Port Chester Mortgage Loan. The Waterfront at Port Chester Mortgage Loan is entitled to payments of principal and interest on a pro rata and pari passu basis with the Waterfront at Port Chester Serviced Companion Loan. The holders of the Waterfront at Port Chester Mortgage Loan and the Waterfront at Port Chester Serviced Companion Loan have entered into a co-lender agreement which sets forth the allocation of collections on the Waterfront at Port Chester Loan Pair. The Waterfront at Port Chester Mortgage Loan represents the controlling interest in the Waterfront at Port Chester Loan Pair. The Waterfront at Port Chester Loan Pair will be serviced pursuant to the terms of the pooling and servicing agreement for the MSBAM 2015-C22 securitization trust. See “Description of the Mortgage Pool—The A/B Whole Loans and the Loan Pairs—The Waterfront at Port Chester Loan Pair” in the Free Writing Prospectus and “Servicing of the Mortgage Loans” in the Free Writing Prospectus.
Mezzanine Loan and Preferred Equity. Not permitted.
Release of Property. Not permitted.
| This is not a research report and was not prepared by the Underwriters’ research departments. Please see additional important information and qualifications at the end of this Term Sheet. |
T-41
| MSBAM 2015-C22 | Waterfront at Port Chester |
Terrorism Insurance. Generally, the Waterfront at Port Chester Borrower is required to obtain insurance against acts of terrorism or other similar acts or events (or “fire following”) to the extent such insurance is available in form and substance satisfactory to lender (in an amount not more than the sum of 100% of full replacement costs and 12 months of business interruption insurance). Notwithstanding the foregoing, for so long as the Terrorism Risk Insurance Program Reauthorization Act of 2007 (or any extension thereof or other federal government program with substantially similar protection) is in effect, the Waterfront at Port Chester Borrower is required to maintain, and lender is required to accept, terrorism insurance which covers “covered acts” (as defined by such statute or other program), as full compliance, so long as such statute or other program covers both domestic and foreign acts of terrorism.
| This is not a research report and was not prepared by the Underwriters’ research departments. Please see additional important information and qualifications at the end of this Term Sheet. |
T-42
(THIS PAGE INTENTIONALLY LEFT BLANK)
T-43
| MSBAM 2015-C22 | Hilton Garden Inn W 54th Street |
Mortgage Loan No. 3 – Hilton Garden Inn W 54th Street

This is not a research report and was not prepared by the Underwriters’ research departments. Please see additional important information and qualifications at the end of this Term Sheet. |
T-44
| MSBAM 2015-C22 | Hilton Garden Inn W 54th Street |
Mortgage Loan No. 3 – Hilton Garden Inn W 54th Street
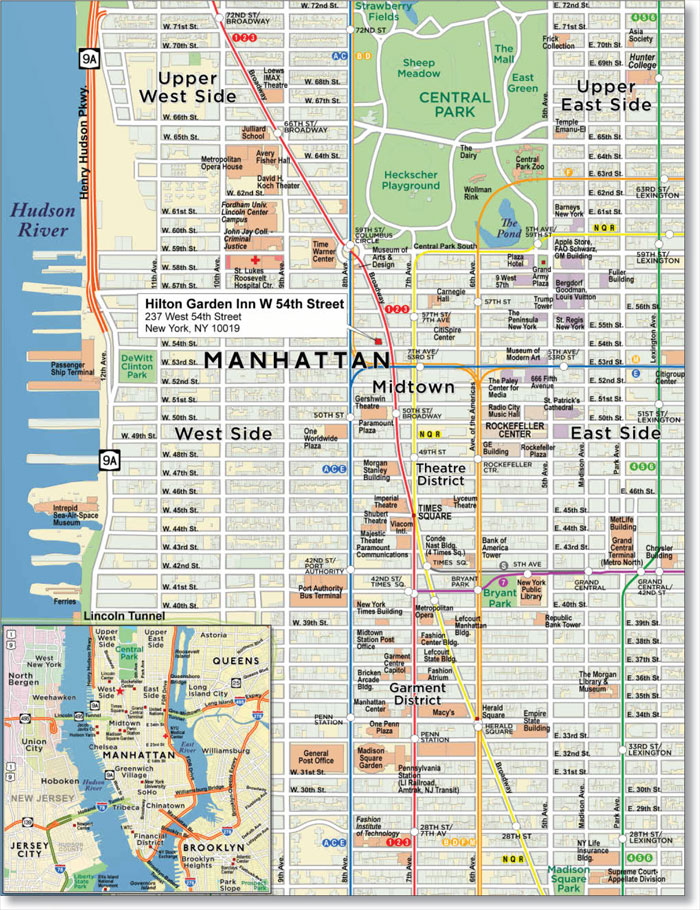
This is not a research report and was not prepared by the Underwriters’ research departments. Please see additional important information and qualifications at the end of this Term Sheet. |
T-45
| MSBAM 2015-C22 | Hilton Garden Inn W 54th Street |
| Mortgage Loan Information | Mortgaged Property Information | ||||||
| Mortgage Loan Seller: | MSMCH | Single Asset/Portfolio: | |||||
Original Balance(1): | Location: | ||||||
Cut-off Date Balance(1): | General Property Type: | ||||||
| % of Initial Pool Balance: | 6.8% | Detailed Property Type: | |||||
Loan Purpose(2): | Title Vesting: | ||||||
| Sponsor: | Year Built/Renovated: | ||||||
| Mortgage Rate: | Size: | ||||||
| Note Date: | Cut-off Date Balance per Unit(1): | ||||||
| First Payment Date: | Maturity Date Balance per Unit(1): | ||||||
| Maturity Date: | Property Manager: | ||||||
| Original Term to Maturity: | |||||||
| Original Amortization Term: | Underwriting and Financial Information | ||||||
| IO Period: | UW NOI: | ||||||
| Seasoning: | UW NOI Debt Yield(1): | ||||||
Prepayment Provisions(3): | UW NOI Debt Yield at Maturity(1): | ||||||
| Lockbox/Cash Mgmt Status: | UW NCF DSCR(1): | ||||||
| Additional Debt Type: | Most Recent NOI: | ||||||
| Additional Debt Balance: | 2nd Most Recent NOI: | ||||||
| Future Debt Permitted (Type): | 3rd Most Recent NOI(5): | ||||||
Reserves(4) | Most Recent Occupancy: | ||||||
| Type | Initial | Monthly | Cap | 2nd Most Recent Occupancy: | |||
| RE Tax: | 3rd Most Recent Occupancy(5): | ||||||
| Insurance: | Appraised Value (as of): | ||||||
| Recurring Replacements: | Cut-off Date LTV Ratio(1): | ||||||
Maturity Date LTV Ratio(1): | 61.8% | ||||||
| Sources and Uses | ||||||
| Sources | Proceeds | % of Total | Uses | Proceeds | % of Total | |
Return of Equity(2): | 96.2% | |||||
| Mezzanine Loan: | $25,000,000 | 12.5% | Closing Costs: | $7,575,865 | 3.8% | |
| Total Sources: | 100.0% | Total Uses: | 100.0% | |||
| (1) | The Hilton Garden Inn W 54th Street Mortgage Loan is part of the Hilton Garden Inn W 54th Street Loan Pair, which is comprised of three pari passu senior notes and one subordinate B note with an aggregate principal balance of $175,000,000. The three Hilton Garden Inn W 54th Street pari passu senior notes have a combined original principal balance of $155,000,000, and the subordinate B note has an original principal balance of $20,000,000. The Cut-off Date Balance per Unit, Maturity Date Balance per Unit, UW NOI Debt Yield, UW NOI Debt Yield at Maturity, UW NCF DSCR, Cut-off Date LTV Ratio and Maturity Date LTV Ratio presented above are based on the aggregate note balance of the pari passu senior notes without regard to the B note. The Cut-off Date Balance per Unit, Maturity Date Balance per Unit, UW NOI Debt Yield, UW NOI Debt Yield at Maturity, UW NCF DSCR, Cut-off Date LTV Ratio and Maturity Date LTV Ratio based on the aggregate note balance of the Hilton Garden Inn W 54th Street Loan Pair (including the subordinate B note) are $436,409, $436,409, 10.4%, 10.4%, 2.16x, 69.7% and 69.7%, respectively. |
| (2) | The Hilton Garden Inn W 54th Street Property was previously unencumbered by mortgage debt. |
| (3) | The final lockout and defeasance periods will be determined based on the securitization date of the last component of the Hilton Garden Inn W 54th Street Loan Pair. |
| (4) | See “—Escrows and Reserves” below for further discussion of reserve requirements. |
| (5) | The Hilton Garden Inn W 54th Street Property is newly constructed. Historical financial and occupancy information prior to 2014 is not available. |
The Mortgage Loan. The third largest mortgage loan (the “Hilton Garden Inn W 54th Street Mortgage Loan”) is part of a loan pair (the “Hilton Garden Inn W 54th Street Loan Pair”) evidenced by three pari passu notes (Notes A-1, A-2 and A-3) in the aggregate balance of $155,000,000 and one subordinate note in the original principal balance of $20,000,000 (the “Hilton Garden Inn West 54th Street B Note”), all of which are secured by the same first priority fee mortgage encumbering a select service hospitality property known as Hilton Garden Inn W 54th Street in the Midtown West neighborhood of Manhattan, New York, New York (the “Hilton Garden Inn W 54th Street Property”).
Note A-2, in the original principal balance of $75,000,000, represents the Hilton Garden Inn W 54th Street Mortgage Loan, and Note A-1 and Note A-3, in the aggregate original principal balance of $80,000,000, collectively represent the “Hilton Garden Inn W 54th Street Serviced Companion Loan.” The Hilton Garden Inn W 54th Street Serviced Companion Loan is expected to be held by Morgan Stanley Bank, N.A. on the closing date of this transaction and may be contributed to one or more future securitization transactions. The holders of the respective promissory notes evidencing the Hilton Garden Inn W 54th Street Loan Pair have entered into an agreement between note holders that sets forth the respective rights of each such note holder. The Hilton Garden Inn W 54th Street Loan Pair will be serviced pursuant to the terms of the pooling and servicing agreement for the MSBAM 2015-C22 securitization trust. See “—Additional Secured Indebtedness” below for additional information. See also “Description of the Mortgage Pool—The A/B Whole Loans and the Loan Pairs—The Hilton Garden Inn W 54th Street Loan Pair” in the Free Writing Prospectus and “Servicing of the Mortgage Loans” in the Free Writing Prospectus.
The proceeds of the Hilton Garden Inn W 54th Street Loan Pair, and the Hilton Garden Inn W 54th Street Mezzanine Loan were used to recapitalize the Hilton Garden Inn W 54th Street Borrower as the Hilton Garden Inn W 54th Street Property was previously unencumbered by mortgage debt. The Hilton Garden Inn W 54th Street Borrower constructed the Hilton Garden Inn W 54th Street Property in 2013 and has provided a statement indicating total
This is not a research report and was not prepared by the Underwriters’ research departments. Please see additional important information and qualifications at the end of this Term Sheet. |
T-46
| MSBAM 2015-C22 | Hilton Garden Inn W 54th Street |
construction costs were approximately $131.5 million, including land valued at approximately $61.3 million, which was contributed by an affiliate of the Hilton Garden Inn W 54th Street Borrower.
The Borrower and the Sponsor. The borrower is 237 West 54 Owner, L.L.C. (the “Hilton Garden Inn W 54th Street Borrower”), a recycled, single-purpose Delaware limited liability company with two independent directors. The Hilton Garden Inn W 54th Street Borrower is 74.95% indirectly owned by Morad Ghadamian, and 25.05% indirectly owned by Joseph Moinian. The nonrecourse carve-out guarantors are Morad Ghadamian and Joseph Moinian.
Morad Ghadamian is a real estate investor and President of the Marjan International Corporation, a New York City based home furnishings company specializing in floor coverings. Joseph Moinian is the CEO of The Moinian Group, a privately held New York City based real estate firm founded in 1982. The Moinian Group reports ownership positions in a portfolio in excess of 20 million SF of commercial real estate across major cities including New York, Chicago, Dallas and Los Angeles.
The Property. The Hilton Garden Inn W 54th Street Property is a 34-story select service hospitality property with 401 hotel rooms, including 243 king rooms, 135 double rooms and 23 suites, and a ground-level retail space leased on a 10-year term to RJJ Restaurant LLC and operated as a 200-seat Empire Steakhouse restaurant. It is located on West 54th Street between Broadway and Eighth Avenue in Midtown Manhattan, a few blocks north of Times Square. The Hilton Garden Inn W 54th Street Property was constructed in 2013 as a joint venture between Starwood Capital Group Global, L.P. (“Starwood”) and The Moinian Group. (Starwood affiliates subsequently sold their various interests in the Hilton Garden Inn W 54th Street Property to one of the Hilton Garden Inn W 54th Street Mortgage Loan sponsors.) The hotel opened for business in January, 2014. Hotel amenities include approximately 820 SF of meeting space, a fitness center, a business center, a pantry and a guest laundry room. The Hilton Garden Inn W 54th Street Property is subject to a franchise agreement with Hilton Garden Inns Franchise LLC, an affiliate of Hilton Worldwide, through December 31, 2034.
Demand at the Hilton Garden Inn W 54th Street Property in 2014, the hotel’s first year of operations, was approximately 35% commercial, 5% meeting and group and 60% leisure.
| Hilton Garden Inn W 54th Street Historical Occupancy, ADR, RevPAR | |||||||||
| Competitive Set | Hilton Garden Inn W 54th Street | Penetration Factor | |||||||
| Year | Occupancy | ADR | RevPAR | Occupancy | ADR | RevPAR | Occupancy | ADR | RevPAR |
| 2014 | 94.2% | $245.36 | $231.24 | 90.1% | $245.70 | $221.46 | 95.6% | 100.1% | 95.8% |
Source: Industry Report
The Market. The Hilton Garden Inn W 54th Street Property is located in the Midtown West neighborhood of Manhattan in New York, New York. Specifically, the hotel is located on West 54th Street between Broadway and Eighth Avenue, which is within the Midtown/Times Square market area. As of September 30, 2014, the overall Manhattan hotel market consisted of approximately 86,478 rooms with an average 86.7% occupancy rate, an average room rate of $278.99 and a RevPAR of $241.94. A total of 4,737 new hotels rooms are expected to be delivered in the Borough of Manhattan in 2015 and 4,373 new rooms are expected in 2016, including approximately 2,805 rooms in Midtown West over those two years.
Competitive properties to the Hilton Garden Inn W 54th Street Property are shown in the table below:
| Primary Competitive Hotel Supply – Occupancy and Average Rate Comparison (Estimated) | ||||||||||
| Property Name | Rooms | 2013 Occupancy | 2013 Average Rate | 2013 RevPAR | 2014 Occupancy | 2014 Average Rate | 2014 RevPAR | Occupancy Penetration | Yield Penetration | |
| Hampton Inn Manhattan Times Square North | 300 | 99% | $274.00 | $271.26 | 100% | $272.00 | $272.00 | 110.5% | 118.0% | |
| Hilton Garden Inn Times Square | 369 | 84% | $271.00 | $227.64 | 100% | $266.00 | $266.00 | 110.5% | 115.4% | |
| Courtyard by Marriott New York Manhattan Central Park | 378 | Opened December 2013 | 68% | $280.00 | $190.40 | 75.1% | 82.6% | |||
| Residence Inn by Marriott New York Manhattan Central Park | 261 | Opened December 2013 | 70% | $278.00 | $194.60 | 77.3% | 84.5% | |||
Source: Appraisal
This is not a research report and was not prepared by the Underwriters’ research departments. Please see additional important information and qualifications at the end of this Term Sheet. |
T-47
| MSBAM 2015-C22 | Hilton Garden Inn W 54th Street |
Operating History and Underwritten Cash Flow. The following table presents certain information relating to the underwritten cash flow at the Hilton Garden Inn W 54th Street Property:
| 2011 | 2012 | 2013 | 2014 | 2/28/2015 TTM | UW(2) | ||||||||||
| Occupancy | N/A | N/A | N/A | 90.1% | 94.6% | 94.6% | |||||||||
| ADR | N/A | N/A | N/A | $245.72 | $236.31 | $254.56 | |||||||||
| RevPAR | N/A | N/A | $221.50 | $223.47 | $240.81 | ||||||||||
| N/A | |||||||||||||||
| Rooms Revenue | N/A | N/A | N/A | $30,732,747 | $32,942,825 | $35,246,706 | $87,897 | ||||||||
| Food & Beverage | N/A | N/A | N/A | $5,700 | $6,075 | $6,075 | $15 | ||||||||
Other Income(3) | N/A | N/A | N/A | $1,096,505 | $1,255,913 | $1,255,913 | $3,132 | ||||||||
| Total Revenue | N/A | N/A | N/A | $31,834,953 | $34,204,812 | $36,508,694 | $91,044 | ||||||||
| Total Expenses | N/A | N/A | N/A | $15,268,197 | $17,349,472 | $18,395,077 | $45,873 | ||||||||
| Net Op. Income | N/A | N/A | N/A | $16,566,756 | $16,855,340 | $18,113,617 | $45,171 | ||||||||
| FF&E | N/A | N/A | N/A | $636,701 | $682,399 | $1,460,348 | $3,642 | ||||||||
| Net Cash Flow | N/A | N/A | N/A | $15,930,055 | $16,172,942 | $16,653,269 | $41,529 | ||||||||
| N/A | N/A | N/A | 2.63x | 2.67x | 2.87x | ||||||||||
| N/A | N/A | N/A | 2.53x | 2.56x | 2.64x | ||||||||||
| NOI Debt Yield | N/A | N/A | N/A | 10.7% | 10.9% | 11.7% | |||||||||
| NCF Debt Yield | N/A | N/A | N/A | 10.3% | 10.4% | 10.7% | |||||||||
| (1) | The Hilton Garden Inn W 54th Street Property was constructed in 2013 and opened for business in January 2014. Therefore, historical operating data is limited. |
| (2) | The Hilton Garden Inn W 54th Street Property is a newly constructed hotel. Underwritten income is based on the TTM occupancy rate and the estimated 2014 average competitive primary and secondary competitive hotel room rate of $254.56. |
| (3) | Other Income includes miscellaneous income, rental income (for instance, the Empire Steakhouse base rent was $360,000 per year in 2014) and telecommunications income. |
Escrows and Reserves. The Hilton Garden Inn W 54th Street Borrower is required to escrow monthly 1/12 of the annual estimated tax payments and 1/12 of the annual estimated insurance premiums (unless either (i) the manager is paying or has reserved funds for payment of such taxes or insurance premiums in accordance with the management agreement or (ii) with respect to insurance premiums only, the Hilton Garden Inn W 54th Street Borrower maintains insurance under an acceptable blanket insurance policy). The Hilton Garden Inn W 54th Street Borrower is also required to make monthly deposits in a reserve for FF&E reasonably approved by the lender equal to the greater of (i) the amount required to be reserved for FF&E pursuant to the management agreement, if any, or (ii) 4% of the operating income for the Hilton Garden Inn W 54th Street Property for the calendar month which is two months prior to the applicable monthly payment date; provided, that the Hilton Garden Inn W 54th Street Borrower will not be required to make deposits to the FF&E reserve so long as the property manager is reserving such amounts for FF&E in accordance with the management agreement.
Lockbox and Cash Management. A soft lockbox is in place with respect to the Hilton Garden Inn W 54th Street Mortgage Loan (i.e. all revenues from the Hilton Garden Inn W 54th Street Property remaining after payment by the property manager of all operating expenses are deposited directly by the Hilton Garden Inn W 54th Street Borrower, or its property manager, and the operating lessee into the lockbox account). The Hilton Garden Inn W 54th Street Mortgage Loan has springing cash management. Provided a Trigger Period (as defined below) has not commenced, funds in the lockbox account are swept to an account designated by the Hilton Garden Inn W 54th Street Borrower. Upon the occurrence and during the continuance of a Trigger Period, funds in the lockbox account are disbursed on each monthly payment date to pay debt service on the Hilton Garden Inn W 54th Street Mortgage Loan, to fund required deposits to the reserves as described above under “—Escrows and Reserves,” including from and after the first anniversary of the origination of the Hilton Garden Inn W 54th Street Mortgage Loan, to make any required deposits into the FF&E reserve only if and so long as the property manager is not reserving such amounts for FF&E accordance with the management agreement, to pay the servicing fees, if any, due under the Hilton Garden Inn W 54th Street Mortgage Loan and the Hilton Garden Inn W 54th Street Mezzanine Loan (as defined below), to disburse to the Hilton Garden Inn W 54th Street Borrower the monthly amount payable for operating expenses and capital expenditures not otherwise reserved for and referenced in the annual budget approved by lender and any extraordinary expenses approved by the lender, to pay, provided no event of default on the Hilton Garden Inn W 54th Street Mortgage Loan has occurred and is continuing, debt service due on the Hilton Garden Inn W 54th Street Mezzanine Loan and to remit any excess to an account to be held by the lender as additional security for the Hilton Garden Inn W 54th Street Mortgage Loan.
A “Trigger Period” will (i) commence upon the occurrence of an event of default under the Hilton Garden Inn W 54th Street Mortgage Loan and/or the Hilton Garden Inn W 54th Street Mezzanine Loan and continue until, in the case of an event of default under the Hilton Garden Inn W 54th Street Mortgage Loan, the cure or waiver of such event of default under the Hilton Garden Inn W 54th Street Mortgage Loan which is accepted by the lender under the Hilton Garden Inn W 54th Street Mortgage Loan in writing or, in the case of an event of default under the Hilton Garden Inn W 54th Street Mezzanine Loan, the cure or waiver of such event of default under the Hilton Garden Inn W 54th Street Mezzanine Loan which is accepted by the lender under the Hilton Garden Inn W 54th Street Mezzanine Loan in writing and such lender shall not have otherwise accelerated the Hilton Garden Inn W 54th Street Mezzanine Loan, moved for a receiver or commenced foreclosure proceedings or (ii) commence upon the debt yield being less than 7.50% (or, on and after March 1, 2017, 9.00%) for two consecutive calendar quarters and continue until the debt yield equals or exceeds 8.00% (or, on and after March 1, 2017, 9.50%) for two consecutive calendar quarters. Notwithstanding the foregoing, in no event may a Trigger Period occur as a result of the debt yield being less than 7.50% prior to March 1, 2016.
Additional Secured Indebtedness (not including trade debts). The Hilton Garden Inn W 54th Street Property also secures the Hilton Garden Inn W 54th Street Serviced Companion Loan, which has a combined Cut-off Date balance of $80,000,000, and the Hilton Garden Inn W 54th Street B Note, which has a Cut-off Date balance of $20,000,000. The current holder of the Hilton Garden Inn W 54th Street Serviced Companion Loan is Morgan Stanley Bank, N.A., and such notes are expected to be contributed to one or more future securitization trusts. The current holder of the Hilton Garden Inn W 54th Street B Note is Morgan Stanley Bank, N.A., and such note may be transferred at any time. The notes evidencing the Hilton Garden Inn W 54th Street Serviced Companion Loan accrue interest at the same rate as the Hilton Garden Inn W 54th Street Mortgage Loan. The Hilton Garden Inn W
This is not a research report and was not prepared by the Underwriters’ research departments. Please see additional important information and qualifications at the end of this Term Sheet. |
T-48
| MSBAM 2015-C22 | Hilton Garden Inn W 54th Street |
54th Street Mortgage Loan is entitled to payments of principal and interest on a pro rata and pari passu basis with the Hilton Garden Inn W 54th Street Serviced Companion Loan. The Hilton Garden Inn W 54th Street Mortgage Loan and the Hilton Garden Inn W 54th Street Serviced Companion Loan will be entitled to payments of interest and principal on a senior basis relative to the Hilton Garden Inn W 54th Street B Note. Such priorities and the allocation of collections on the Hilton Garden Inn W 54th Street Loan Pair are set forth in an agreement between note holders governing the promissory notes comprising the Hilton Garden Inn W 54th Street Loan Pair. The Hilton Garden Inn W 54th Street Mortgage Loan represents the controlling interest in the Hilton Garden Inn W 54th Street Loan Pair. The Hilton Garden Inn W 54th Street Loan Pair will be serviced pursuant to the terms of the pooling and servicing agreement for the MSBAM 2015-C22 securitization trust. See “Description of the Mortgage Pool—The A/B Whole Loans and the Loan Pairs—The Hilton Garden Inn W 54th Street Loan Pair” in the Free Writing Prospectus and “Servicing of the Mortgage Loans” in the Free Writing Prospectus.
The following table presents certain information relating to the Hilton Garden Inn W 54th Street Loan Pair and the Hilton Garden Inn W 54th Street Mezzanine Loan:
| Full Debt Summary | ||||||||
| Notes | Original Principal Balance | Interest Rate | Original Term to Maturity (mos.) | Original Amort. Term (mos.) | Original IO Term (mos.) | Total Debt UW NCF DSCR | Total Debt UW NOI Debt Yield | Total Debt Cut-off Date LTV |
| Mortgage Loan | $75,000,000 | 4.01290323% | 120 | 0 | 120 | 2.64x | 11.7% | 61.8% |
| Serviced Companion Loan | $80,000,000 | 4.01290323% | 120 | 0 | 120 | 2.64x | 11.7% | 61.8% |
| B Note | $20,000,000 | 7.000% | 120 | 0 | 120 | 2.16x | 10.4% | 69.7% |
| Mezzanine Loan | $25,000,000 | 10.000% | 120 | 0 | 120 | 1.62x | 9.1% | 79.7% |
| Total/Wtd. Avg. | $200,000,000 | 5.060% | 120 | 0 | 120 | 1.62x | 9.1% | 79.7% |
Mezzanine Loan and Preferred Equity. The “Hilton Garden Inn W 54th Street Mezzanine Loan” refers to a loan in the principal amount of $25,000,000 made by Morgan Stanley Mortgage Capital Holdings LLC to 237 West 54 Mezz Two Owner, L.L.C. (the “Hilton Garden Inn W 54th Street Mezzanine Borrower”), secured by 100% of the direct equity interest in the Hilton Garden Inn W 54th Street Borrower and put in place simultaneously with the origination of the Hilton Garden Inn W 54th Street Mortgage Loan. The Hilton Garden Inn W 54th Street Mezzanine Loan and the Hilton Garden Inn W 54th Street Mortgage Loan are subject to an intercreditor agreement. The Hilton Garden Inn W 54th Street Mezzanine Loan was transferred to 237 West 54th Mezzanine LLC on March 17, 2015.
In addition, a preferred equity (or other similar) investment (such investment, the “Permitted Preferred Equity”) is permitted subject to various conditions, including amongst other conditions: (i) no event of default is continuing, (ii) the investment is in the direct or indirect owner of the Hilton Garden Inn W 54th Street Mezzanine Borrower in an amount not to exceed $20,000,000, (iii) the investment is not secured by the Hilton Garden Inn W 54th Street Property (or any direct or indirect equity interests in the Hilton Garden Inn W 54th Street Borrower or the Hilton Garden Inn W 54th Street Mezzanine Borrower) or evidenced by a promissory note, (iv) the investment does not require the lender under the Hilton Garden Inn W 54th Street Mortgage Loan or the Hilton Garden Inn W 54th Street Mezzanine Loan to enter into an intercreditor agreement (or other recognition agreement) with the investor in the Permitted Preferred Equity or provide any rights or remedies to such investor arising out of any defaults that would lead to a change in control of the Hilton Garden Inn W 54th Street Borrower or Hilton Garden Inn W 54th Street Mezzanine Borrower or the Hilton Garden Inn W 54th Street Mortgaged Property, (v) the Permitted Preferred Equity requires fixed payment obligations only and is payable only from excess cash flow on the Hilton Garden Inn W 54th Street Mortgaged Property and (vi) the preferred equity documents and payments to the investor in the Permitted Preferred Equity are subordinate to the loan documents, and payments required pursuant to the loan documents, for the Hilton Garden Inn W 54th Street Mortgage Loan and the Hilton Garden Inn W 54th Street Mezzanine Loan.
Release of Property. Not permitted.
Terrorism Insurance. Generally, the Hilton Garden Inn W 54th Street Borrower is required to obtain insurance against terrorism, terrorist acts or similar acts of sabotage with amounts, terms and coverage consistent with those required with respect to the comprehensive all risk insurance, the commercial general liability insurance and the business interruption insurance required to be maintained by the Hilton Garden Inn W 54th Street Borrower so long as such coverage is available.
This is not a research report and was not prepared by the Underwriters’ research departments. Please see additional important information and qualifications at the end of this Term Sheet. |
T-49
| MSBAM 2015-C22 | Dallas Marriott Las Colinas |
Mortgage Loan No. 4 – Dallas Marriott Las Colinas

| This is not a research report and was not prepared by the Underwriters’ research departments. Please see additional important information and qualifications at the end of this Term Sheet. |
T-50
| MSBAM 2015-C22 | Dallas Marriott Las Colinas |
Mortgage Loan No. 4 – Dallas Marriott Las Colinas

| This is not a research report and was not prepared by the Underwriters’ research departments. Please see additional important information and qualifications at the end of this Term Sheet. |
T-51
| MSBAM 2015-C22 | Dallas Marriott Las Colinas |
| Mortgage Loan No. 4 – Dallas Marriott Las Colinas |
| Mortgage Loan Information | Mortgaged Property Information | ||||||
| Mortgage Loan Seller: | CIBC | Single Asset/Portfolio: | Single Asset | ||||
| Original Balance: | $65,900,000 | Location: | Irving, TX 75039 | ||||
| Cut-off Date Balance: | $65,900,000 | General Property Type: | Hospitality | ||||
| % of Initial Pool Balance: | 6.0% | Detailed Property Type: | Full Service | ||||
| Loan Purpose: | Refinance | Title Vesting: | Fee | ||||
| Sponsor: | Columbia Sussex Corporation; CSC Holdings LLC | Year Built/Renovated: | 1999/2011 | ||||
| Size: | 364 Rooms | ||||||
| Mortgage Rate: | 4.890% | Cut-off Date Balance per Unit: | $181,044 | ||||
| Note Date: | 3/18/2015 | Maturity Date Balance per Unit: | $148,669 | ||||
| First Payment Date: | 5/1/2015 | Property Manager: | Columbia Sussex Management, LLC (borrower-related) | ||||
| Maturity Date: | 4/1/2025 | ||||||
| Original Term to Maturity: | 120 months | Underwriting and Financial Information | |||||
| Original Amortization Term: | 360 months | UW NOI: | $7,234,926 | ||||
| IO Period: | 0 months | UW NOI Debt Yield: | 11.0% | ||||
| Seasoning: | 0 months | UW NOI Debt Yield at Maturity: | 13.4% | ||||
| Prepayment Provisions: | LO (24); DEF (93); O (3) | UW NCF DSCR: | 1.56x | ||||
| Lockbox/Cash Mgmt Status: | Hard/Springing | Most Recent NOI: | $7,540,665 (2/28/2015 TTM) | ||||
| Additional Debt Type: | N/A | 2nd Most Recent NOI: | $6,450,687 (12/31/2013) | ||||
| Additional Debt Balance: | N/A | 3rd Most Recent NOI: | $5,472,123 (12/31/2012) | ||||
| Future Debt Permitted (Type): | No (N/A) | Most Recent Occupancy: | 61.8% (2/28/2015) | ||||
Reserves(1) | 2nd Most Recent Occupancy: | 59.5% (12/31/2013) | |||||
| Type | Initial | Monthly | Cap | 3rd Most Recent Occupancy: | 55.9% (12/31/2012) | ||
| RE Tax: | $357,029 | $89,257 | N/A | Appraised Value (as of): | $95,500,000 (12/29/2014) | ||
| Insurance: | $110,898 | $12,714 | N/A | Cut-off Date LTV Ratio: | 69.0% | ||
| FF&E: | $0 | $58,014 | N/A | Maturity Date LTV Ratio: | 56.7% | ||
| Other: | $0 | Springing | N/A | ||||
| Sources and Uses | ||||||
| Sources | Proceeds | % of Total | Uses | Proceeds | % of Total | |
| Loan Amount: | $65,900,000 | 100.0% | Loan Payoff(2): | $53,466,030 | 81.1% | |
| Reserves: | $467,927 | 0.7% | ||||
| Closing Costs: | $507,892 | 0.8% | ||||
| Return of Equity: | $11,458,151 | 17.4% | ||||
| Total Sources: | $65,900,000 | 100.0% | Total Uses: | $65,900,000 | 100.0% | |
| (1) | See “—Escrows and Reserves” below for further discussion of reserve requirements. |
| (2) | Loan Payoff includes defeasance costs of $1,992,788. |
The Mortgage Loan. The fourth largest mortgage loan (the “Dallas Marriott Las Colinas Mortgage Loan”) is secured by a first mortgage encumbering a full service hotel known as the Dallas Marriott Las Colinas (the “Dallas Marriott Las Colinas Property”) located in Irving, Texas. The proceeds of the Dallas Marriott Las Colinas Mortgage Loan were used to defease existing debt which was included in the WBCMT 2006-C23 transaction, fund upfront reserves, pay closing costs and return equity to the Dallas Marriott Las Colinas Borrower.
The Borrower and the Sponsor. The borrower is Columbia Properties Dallas, L.P., an Ohio limited partnership (the “Dallas Marriott Las Colinas Borrower”) and single-purpose entity whose sole general partner has two independent directors. The Dallas Marriott Las Colinas Borrower is majority owned and controlled by CSC Holdings LLC, which is controlled by Columbia Sussex Corporation. CSC Holdings LLC and Columbia Sussex Corporation (“Columbia Sussex”) are the Dallas Marriott Las Colinas Mortgage Loan sponsors and nonrecourse carve-out guarantors. Columbia Sussex is a privately owned hotel company founded by William J. Yung III in 1972. Columbia Sussex is one of the largest franchisors of full-service Marriott hotels in the United States. Its current portfolio consists of 35 hotels with approximately 11,400 rooms.
The Property. The Dallas Marriott Las Colinas Property is a 14-story full service hotel located in the Las Colinas community of the city of Irving, Texas. The Dallas Marriott Las Colinas Property is located within walking distance to the Irving Convention Center, approximately 12 miles northwest of the Dallas central business district, approximately 27 miles northeast of Fort Worth, and approximately four miles west of the Dallas/Fort Worth International Airport. The Dallas Marriott Las Colinas Property is situated on an approximately 5.0-acre parcel located at the northeast corner of Las Colinas Boulevard and O’Connor Boulevard, directly on the western shore of Lake Carolyn.
The Dallas Marriott Las Colinas Property opened in 2000 and features 364 guestrooms, a 108-seat bistro restaurant and 46-seat lounge, six meeting and banquet spaces totaling 15,594 SF, a business center and recreational facilities that include an indoor pool and a fitness center.
The Dallas Marriott Las Colinas Property’s guestroom configuration consists of 212 king rooms, 149 double/double rooms and three hospitality suites. Standard guestrooms are 392 SF with either city- or lake-views and a balcony. Hospitality suites are 952 SF with lake-views and feature two bedrooms,
| This is not a research report and was not prepared by the Underwriters’ research departments. Please see additional important information and qualifications at the end of this Term Sheet. |
T-52
| MSBAM 2015-C22 | Dallas Marriott Las Colinas |
separate dining and living areas and additional amenities such as a wet-bar area with a microwave and small refrigerator. All guestrooms and guest bathrooms were completely renovated in 2011 as part of a $2.3 million renovation, which also included renovations to the lobby, commons areas, meeting spaces, restaurant and lounge.
The Dallas Marriott Las Colinas Property was developed by the sponsor at a cost basis of approximately $47.9 million, excluding development fees. Since 2010, the sponsor has invested a total of $3.5 million in renovations and repairs to the Dallas Marriott Las Colinas Property.
More specific information about the Dallas Marriott Las Colinas Property and the related competitive set is set forth in the table below:
Dallas Marriott Las Colinas Property and Market Historical Occupancy, ADR, RevPAR | |||||||||
| Competitive Set | Dallas Marriott Las Colinas Property | Penetration Factor | |||||||
| Year | Occupancy | ADR | RevPAR | Occupancy | ADR | RevPAR | Occupancy | ADR | RevPAR |
| 2010 | 61.5% | $114.66 | $70.53 | 48.9% | $134.30 | $65.71 | 79.5% | 117.1% | 93.2% |
| 2011 | 66.0% | $118.68 | $78.31 | 53.8% | $139.40 | $75.01 | 81.5% | 117.5% | 95.8% |
| 2012 | 65.5% | $118.20 | $77.47 | 55.9% | $142.51 | $79.60 | 85.2% | 120.6% | 102.8% |
| 2013 | 68.3% | $122.46 | $83.60 | 59.5% | $144.61 | $86.02 | 87.1% | 118.1% | 102.9% |
| 2014 | 69.6% | $129.24 | $89.90 | 60.3% | $158.49 | $95.62 | 86.7% | 122.6% | 106.4% |
Source: Industry Report
The Market. The Dallas Marriott Las Colinas Property is located in Irving, within Dallas County, Texas. Dallas County had a population of approximately 2.5 million and a workforce of approximately 2.0 million people as of 2013. The Dallas Marriott Las Colinas Property is located within the Las Colinas Urban Center (the “Urban Center”) development section of Irving, Texas, which is centered on the 125-acre Lake Carolyn. The first phase of the Urban Center is the Irving Convention Center, located 1/2 mile from the Dallas Marriott Las Colinas Property, which opened in 2011 and attracted a total of approximately 230,000 attendees for the years 2012 and 2013. The second phase of the Urban Center began development in August 2014, and includes the construction of the Irving Music Factory adjacent to the Dallas Marriott Las Colinas Property which will include a 100,000 SF, 8,000-seat concert venue, 300,000 SF of retail and restaurant space and 100,000 SF of office space. Other developments in the Urban Center include Water Street, a 70,000 SF restaurant and retail development and North Shore, a planned development that is expected to include up to 1,400 residential units, 145,000 SF of commercial space and the 160-room Texican Hotel.
Demand at the Dallas Marriott Las Colinas Property is approximately 50% commercial driven, 35% meeting and group driven and 15% leisure driven. Commercial demand is generated primarily by the variety of corporate tenants in the Irving/Las Colinas area. The global headquarters of Commercial Metals, ExxonMobil, Kimberly-Clark, Celanese, Fluor Corporation, Zale Corporation, Michaels, Flowserve and Pioneer Natural Resources are located in Irving. Additionally major corporations in technology, professional services and healthcare are located in Irving, such as Microsoft, Oracle, Nokia, Verizon, AT&T, Blackberry, IBM, NEC Corporation, Allstate Insurance, State Farm Insurance, Citigroup, Nissan, Baylor Medical Center, Las Colinas Medical Center, CVS Health, and Humana. Meeting and group demand is generated primarily by the proximity to the Irving Convention Center and the Dallas/Fort Worth International Airport as well as the various companies located in Irving as outlined above. Leisure demand is generated by tourism in the area which peaks between May and September and weekend demand generated by travelers en route to other destinations and other similar weekend demand generators. Primary attractions in the area include the Irving Arts Center complex, AT&T Stadium which is the home field of the Dallas Cowboys and hosts concerts and other sporting events, the Grapevine Mills outlet mall, and the Gaylord Texan Resort and Convention Center.
The estimated 2014 population within a one-, three- and five-mile radius of the Dallas Marriott Las Colinas Property was 6,906, 78,269 and 255,789, respectively. The estimated 2014 median household income within a one-, three- and five-mile radius was $64,133, $50,564 and $44,399, respectively.
Competing properties to the Dallas Marriott Las Colinas Property are shown in the table below:
| Competitive Property Summary | ||||||||||
| Property Name | Location | Rooms | Year Opened(1) | Comm. % | Meeting & Group % | Leisure % | 2014 Est Occ. | 2014 Est ADR | 2014 Est RevPAR | |
| Primary Competitors | ||||||||||
| Dallas Marriott Las Colinas (subject) | 223 West Las Colinas Boulevard | 364 | 2000 | 50% | 35% | 15% | 62% | $156 | $96.72 | |
| Omni Mandalay at Las Colinas | 221 E Las Colinas Blvd | 421 | 1996 | 45% | 35% | 20% | 66% | $160 | $105.60 | |
| Marriott Dallas Fort Worth Airport | 8440 Freeport Parkway | 491 | 1982 | 60% | 30% | 10% | 75% | $135 | $101.25 | |
| Westin Dallas Fort Worth Airport | 4545 W John Carpenter Fwy | 506 | 2006 | 60% | 30% | 10% | 77% | $119 | $91.63 | |
| Sheraton DFW Airport Hotel | 4440 W John Carpenter Fwy | 300 | 1981 | 60% | 30% | 10% | 70% | $108 | $75.60 | |
| Sub-total/Wtd. Avg | 2,082 | 56% | 32% | 13% | 71% | $135 | $95.30 | |||
| Secondary Competitors | 341 | 65% | 15% | 20% | 64% | $105 | $67.02 | |||
| Total/Wtd. Avg. | 2,423 | 57% | 30% | 13% | 70% | $132 | $92.39 | |||
Source: Appraisal
| (1) | Indicates the year that the property was opened under its current flag. |
The appraiser identified one proposed hotel with approximately 350 rooms, The Irving Convention Center Hotel, in the planning stages, expected to open in 2017, which was estimated to be 75% competitive to the Dallas Marriott Las Colinas Property.
Tax Abatement. The Dallas Marriott Las Colinas Property benefits from a tax abatement program designed to incentivize development within the Dallas County Utility and Reclamation District. The tax abatement is scheduled to expire in 2020.
| This is not a research report and was not prepared by the Underwriters’ research departments. Please see additional important information and qualifications at the end of this Term Sheet. |
T-53
| MSBAM 2015-C22 | Dallas Marriott Las Colinas |
Operating History and Underwritten Cash Flow. The following table presents certain information relating to the historical operating performance and the Underwritten Cash Flow at the Dallas Marriott Las Colinas Property:
| Cash Flow Analysis | ||||||||||||||
| 2011 | 2012 | 2013 | 2014 | 2/28/2015 TTM | UW | UW per Room | ||||||||
| Occupancy | N/A | 55.9% | 59.5% | 61.1% | 61.8% | 61.1% | ||||||||
| Average Daily Rate | N/A | $143.05 | $145.74 | $156.55 | $157.00 | $156.54 | ||||||||
| RevPAR | N/A | $79.89 | $86.72 | $95.59 | $97.07 | $95.58 | ||||||||
| Rooms | N/A | $10,644,307 | $11,520,704 | $12,699,052 | $12,896,499 | $12,699,200 | $34,888 | |||||||
| Food/Beverage | N/A | $3,695,798 | $4,482,968 | $4,528,538 | $4,399,465 | $4,528,538 | $12,441 | |||||||
| Other | N/A | $215,806 | $199,591 | $176,573 | $172,365 | $176,573 | $485 | |||||||
| Total Revenue | N/A | $14,555,911 | $16,203,263 | $17,404,163 | $17,468,329 | $17,404,311 | $47,814 | |||||||
Total Expenses(1) | N/A | $9,083,788 | $9,752,576 | $9,957,868 | $9,927,664 | $10,169,385 | $27,938 | |||||||
| NOI | N/A | $5,472,123 | $6,450,687 | $7,446,295 | $7,540,665 | $7,234,926 | $19,876 | |||||||
FF&E(2) | N/A | $582,236 | $648,131 | $696,167 | $698,733 | $696,172 | $1,913 | |||||||
| NCF | N/A | $4,889,887 | $5,802,556 | $6,750,128 | $6,841,932 | $6,538,754 | $17,964 | |||||||
| NOI DSCR | N/A | 1.31x | 1.54x | 1.78x | 1.80x | 1.73x | ||||||||
| NCF DSCR | N/A | 1.17x | 1.38x | 1.61x | 1.63x | 1.56x | ||||||||
| NOI Debt Yield | N/A | 8.3% | 9.8% | 11.3% | 11.4% | 11.0% | ||||||||
| NCF Debt Yield | N/A | 7.4% | 8.8% | 10.2% | 10.4% | 9.9% | ||||||||
| (1) | Underwritten real estate taxes based on the 2014 unabated tax amount reduced by the present value of the projected tax savings due to the tax abatement. The 2014 abated tax amount was $973,715 versus the unabated tax amount of $1,286,827. |
| (2) | FF&E is based on 4% of Total Revenue for all historical data points as well the underwritten amount. |
Escrows and Reserves. The Dallas Marriott Las Colinas Borrower is required to deposit 1/12 of the estimated annual real estate taxes monthly and 1/12 of the estimated annual insurance premiums monthly. For furniture, fixtures and equipment (“FF&E”), the Dallas Marriott Las Colinas Borrower is required to deposit monthly an amount equal to 1/12th of 4% of the gross revenues, which as of the Dallas Marriott Las Colinas Mortgage Loan origination date was $58,014.
The current franchise agreement expires July 11, 2020. Commencing 18 months prior to the expiration date of the franchise agreement, or if the franchise agreement is otherwise terminated, the Dallas Marriott Las Colinas Borrower is required to deposit excess cash flow into a reserve (the “Franchise Expiration Reserve”). In the event that a property improvement plan (“PIP Improvements”) is required by the existing or replacement franchisor, the Dallas Marriott Las Colinas Borrower is required to deposit an amount equal to at least 110% of the anticipated cost of the PIP Improvements into a reserve (the “PIP Reserve”). Such funds will come first from the then current balance of the Franchise Expiration Reserve, then the FF&E reserve, and then from the Dallas Marriott Las Colinas Borrower’s own funds, provided that no funds may be transferred from the Franchise Expiration Reserve unless a replacement franchise agreement has been entered into. Following the establishment of the PIP Reserve and possible transfer of funds from the Franchise Expiration Reserve to the PIP Reserve, deposits into the Franchise Expiration Reserve will not be subject to transfer to the PIP Reserve, but instead will accumulate in the Franchise Expiration Reserve. If no PIP Improvements are then required or anticipated to be required by the franchisor and a replacement franchise agreement has been entered into, and so long as no other Cash Management Period (as defined below) then exists, any amounts remaining in the Franchise Expiration Reserve will be disbursed to the Dallas Marriott Las Colinas Borrower, provided however, that the lender will have the right, but not the obligation, at any time during the continuation of an event of default, in its sole and absolute discretion, to transfer any and all funds in the Franchise Expiration Reserve to an account to be held by the lender as additional security for the Dallas Marriott Las Colinas Mortgage Loan. All amounts in the PIP Reserve will be used for the reimbursement of costs expended by the Dallas Marriott Las Colinas Borrower to complete the PIP Improvements.
Lockbox and Cash Management. A hard lockbox is in place with respect to the Dallas Marriott Las Colinas Mortgage Loan. The Dallas Marriott Las Colinas Mortgage Loan has springing cash management. Provided a Cash Management Period has not commenced, funds in the lockbox account are swept daily to an account designated by the Dallas Marriott Las Colinas Borrower. During the continuance of a Cash Management Period, funds in the lockbox account are applied on each monthly payment date to pay debt service on the Dallas Marriott Las Colinas Mortgage Loan, to fund the required reserves deposits as described above under “—Escrows and Reserves,” to disburse to the Dallas Marriott Las Colinas Borrower the amount of monthly operating expenses (not otherwise paid or reserved for in the required reserves) referenced in an annual budget approved by lender together with other amounts incurred by the Dallas Marriott Las Colinas Borrower in connection with the operation and maintenance of the Dallas Marriott Las Colinas Mortgaged Property approved by lender, and to remit the remainder to an account to be held by the lender as additional security for the Dallas Marriott Las Colinas Mortgage Loan.
A “Cash Management Period” will commence:
(i) upon the occurrence of an event of default and will continue until lender’s acceptance of the cure of such event of default;
(ii) if the debt service coverage ratio being less than 1.25x at the end of any calendar quarter and will continue until the debt service coverage ratio has been not less than 1.25x for two consecutive calendar quarters;
(iii) 18 months prior to the expiration date of the franchise agreement or if the franchise agreement is otherwise terminated and will continue until a replacement franchise agreement has been entered into; or
(iv) if the nonrecourse carve-out guarantors fail to maintain a combined net worth of at least $100 million and a combined liquidity of at least $10 million (together the “Guarantor Financial Covenants”) and will continue until the lender determines that the Guarantor Financial Covenants are again satisfied.
| This is not a research report and was not prepared by the Underwriters’ research departments. Please see additional important information and qualifications at the end of this Term Sheet. |
T-54
| MSBAM 2015-C22 | Dallas Marriott Las Colinas |
Property Management. The Dallas Marriott Las Colinas Property is managed by Columbia Sussex Management, LLC, an affiliate of the Dallas Marriott Las Colinas Borrower.
Additional Secured Indebtedness (not including trade debts). Not permitted.
Mezzanine Loan and Preferred Equity. Not permitted.
Release of Property. Not permitted.
Terrorism Insurance. The Dallas Marriott Las Colinas Borrower is required to obtain and maintain property insurance, public liability insurance and rental loss and/or business interruption insurance that covers perils of terrorism and acts of terrorism, both foreign and domestic.
| This is not a research report and was not prepared by the Underwriters’ research departments. Please see additional important information and qualifications at the end of this Term Sheet. |
T-55
| MSBAM 2015-C22 | Hilton Houston Westchase |
Mortgage Loan No. 5 – Hilton Houston Westchase

| This is not a research report and was not prepared by the Underwriters’ research departments. Please see additional important information and qualifications at the end of this Term Sheet. |
T-56
| MSBAM 2015-C22 | Hilton Houston Westchase |
Mortgage Loan No. 5 – Hilton Houston Westchase
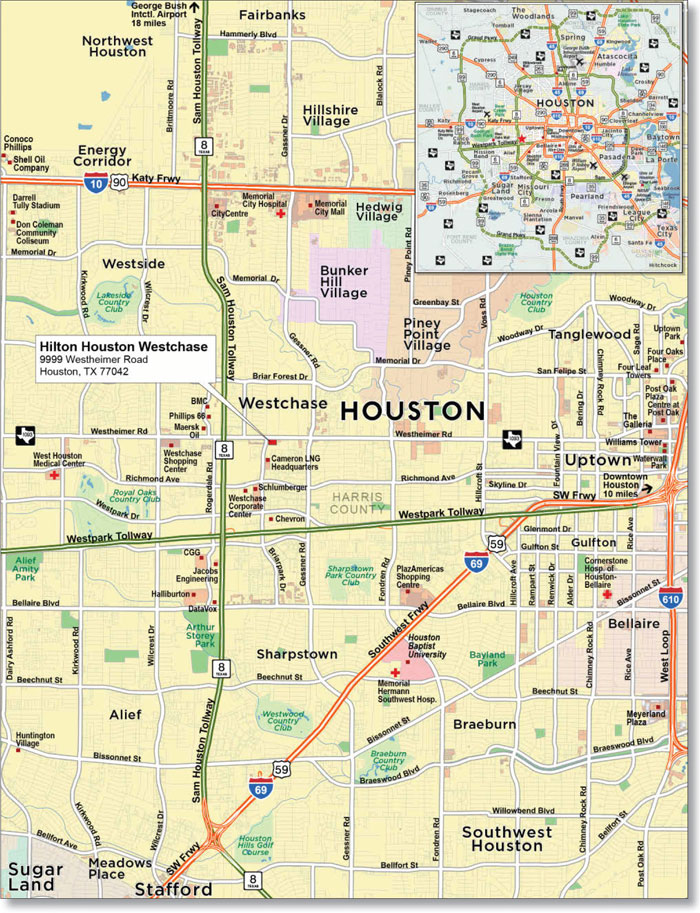
| This is not a research report and was not prepared by the Underwriters’ research departments. Please see additional important information and qualifications at the end of this Term Sheet. |
T-57
| MSBAM 2015-C22 | Hilton Houston Westchase |
| Mortgage Loan No. 5 – Hilton Houston Westchase |
| Mortgage Loan Information | Mortgaged Property Information | ||||||
| Mortgage Loan Seller: | BANA | Single Asset/Portfolio: | Single Asset | ||||
| Original Balance: | $45,250,000 | Location: | Houston, TX 77042 | ||||
| Cut-off Date Balance: | $45,250,000 | General Property Type: | Hospitality | ||||
| % of Initial Pool Balance: | 4.1% | Detailed Property Type: | Full Service | ||||
Loan Purpose(2): | Acquisition | Title Vesting: | Fee | ||||
| Sponsor: | Kui Cai | Year Built/Renovated: | 1980/2014 | ||||
| Mortgage Rate: | 4.718% | Size: | 297 Rooms | ||||
| Note Date: | 2/13/2015 | Cut-off Date Balance per Unit: | $152,357 | ||||
| First Payment Date: | 4/1/2015 | Maturity Date Balance per Unit: | $145,492 | ||||
| Maturity Date: | 3/1/2020 | Property Manager: | Interstate Management Company, LLC | ||||
| Original Term to Maturity: | 60 months | Underwriting and Financial Information | |||||
| Original Amortization Term: | 360 months | UW NOI: | $5,578,443 | ||||
| IO Period: | 24 months | UW NOI Debt Yield: | 12.3% | ||||
| Seasoning: | 1 month | UW NOI Debt Yield at Maturity: | 12.9% | ||||
| Prepayment Provisions: | LO (25); DEF (31); O (4) | UW NCF DSCR: | 1.71x | ||||
| Lockbox/Cash Mgmt Status: | Hard/Springing | Most Recent NOI: | $5,699,252 (12/31/2014) | ||||
| Additional Debt Type: | N/A | 2nd Most Recent NOI: | $4,418,734 (12/31/2013) | ||||
| Additional Debt Balance: | N/A | 3rd Most Recent NOI: | $3,510,555 (12/31/2012) | ||||
| Future Debt Permitted (Type): | No (N/A) | Most Recent Occupancy: | 81.3% (1/31/2015) | ||||
Reserves(1) | 2nd Most Recent Occupancy: | 73.1% (12/31/2013) | |||||
| Type | Initial | Monthly | Cap | 3rd Most Recent Occupancy: | 68.5% (12/31/2012) | ||
| RE Tax: | $133,964 | $66,982 | N/A | Appraised Value (as of): | $65,800,000 (12/19/2014) | ||
| Insurance: | $0 | Springing | N/A | Cut-off Date LTV Ratio: | 68.8% | ||
| Recurring Replacements: | $215,000 | Springing | N/A | Maturity Date LTV Ratio: | 65.7% | ||
Sources and Uses | ||||||
| Sources | Proceeds | % of Total | Uses | Proceeds | % of Total | |
| Loan Amount: | $45,250,000 | 67.2% | Purchase Price: | $65,500,000 | 97.3% | |
| Borrower Equity: | $22,074,141 | 32.8% | Reserves: | $348,964 | 0.5% | |
| Closing Costs: | $1,475,176 | 2.2% | ||||
| Total Sources: | $67,324,141 | 100.0% | Total Uses: | $67,324,141 | 100.0% | |
| (1) | See “—Escrows and Reserves” below for further discussion of reserve requirements. |
The Mortgage Loan. The fifth largest mortgage loan (the “Hilton Houston Westchase Mortgage Loan”) is evidenced by a promissory note with an original principal balance of $45,250,000 secured by a first mortgage encumbering a full service hotel known as Hilton Houston Westchase (the “Hilton Houston Westchase Property”) located in Houston, Texas.
The Borrower and the Sponsor. The borrower is 9999 Westheimer Road, Houston, LLC, a Delaware limited liability company (the “Hilton Houston Westchase Borrower”), with one independent director. The majority equity interest (80%) in the Hilton Houston Westchase Borrower is held by Apollo Bright LLC. Apollo Bright LLC and Silver Sage Investment LLC are the nonrecourse carve out guarantors.
Apollo Bright LLC and Silver Sage Investment LLC are both wholly owned by Kui Cai, the Hilton Houston Westchase Mortgage Loan sponsor. Kui Cai is the co-founder and approximately 28% shareholder of Longfor Properties Co. Ltd. (SEHK: 960), which is one of China’s biggest property developers. Through his companies in the U.S., he owns a portfolio of seven hotels: the Hilton Houston Westchase, Fullerton Marriott at California State University, Detroit Marriott Southfield, Atlanta Marriott Norcross, Hilton Atlanta Northeast, DoubleTree by Hilton Berkeley Marina and DoubleTree by Hilton Hotel Wilmington.
The Property. The Hilton Houston Westchase Property is a full service hotel containing 297 rooms in two thirteen-story buildings located on a 7.8-acre parcel along Westheimer Road off the Sam Houston Tollway, in the center of the Westchase District of Houston, Texas. The Hilton Houston Westchase Property was built in 1980 and has recently completed a four-year renovation to the guestrooms, corridors, restaurant, meeting space and other infrastructure at a cost of $8,274,837 ($27,861/room).
The Hilton Houston Westchase Property operates as a Hilton hotel under a franchise agreement that runs through February 28, 2030. It has a guestroom configuration that consists of 109 king rooms, 77 double/double rooms, 25 suites, and additionally on the top three floors of the hotel (the Executive Level) 65 king rooms, nine double/double rooms, three junior suites, eight one-bedroom suites, and one presidential suite. Amenities at the Hilton Houston Westchase Property include a fitness center, outdoor pool and jacuzzi, sundry shop, daily room-service, complementary parking and Wi-Fi access throughout the hotel. The Executive Level includes a concierge lounge, a business center and conference room. The Hilton Houston Westchase Property offers an award-winning, full-service, 250-seat restaurant open for breakfast, lunch, dinner and Sunday brunch known as Rio Ranch, and a 50-seat Atrium Lobby Bar. Additionally, there is 15,268 SF of flexible event space.
| This is not a research report and was not prepared by the Underwriters’ research departments. Please see additional important information and qualifications at the end of this Term Sheet. |
T-58
| MSBAM 2015-C22 | Hilton Houston Westchase |
Demand at the Hilton Houston Westchase is approximately 45% commercial driven, 35% meeting and group driven and 20% leisure driven. Demand is primarily generated by a heavy concentration of surrounding office development and large employers such as Chevron, Phillips, Dow Chemical, Halliburton, Jacobs Engineering, MI Swaco and BMC Software. The ten largest corporate accounts for the Hilton Houston Westchase Property are a diverse group of companies, who combined represented a total of 18,821 room nights and approximately $2.86 million in revenue as of November, 2014 year-to-date. They include Schlumberger, Expedia, Chevron, CWT Hotel Programme, Phillips 66, Shell Oil, IBM, A P Moller Maersk, National Oilwell Varco and CGG Veritas.
More specific information about the Hilton Houston Westchase Property and the related competitive set is set forth in the table below:
| Market Historical Occupancy, ADR, RevPAR | |||||||||
| Competitive Set | Hilton Houston Westchase Property | Penetration Factor | |||||||
| Year | Occupancy | ADR | RevPAR | Occupancy | ADR | RevPAR | Occupancy | ADR | RevPAR |
| 2007 | 66.6% | $117.69 | $78.40 | 69.9% | $139.27 | $97.36 | 104.9% | 118.3% | 124.2% |
| 2008 | 65.9% | $130.62 | $86.13 | 69.6% | $149.96 | $104.36 | 105.5% | 114.8% | 121.2% |
| 2009 | 52.1% | $118.63 | $61.76 | 62.5% | $123.92 | $77.40 | 120.0% | 104.5% | 125.3% |
| 2010 | 52.0% | $112.32 | $58.38 | 66.2% | $114.09 | $75.55 | 127.4% | 101.6% | 129.4% |
| 2011 | 57.4% | $111.66 | $64.07 | 69.1% | $117.72 | $81.29 | 120.3% | 105.4% | 126.9% |
| 2012 | 61.6% | $117.36 | $72.26 | 68.5% | $128.64 | $88.07 | 111.2% | 109.6% | 121.9% |
| 2013 | 64.2% | $126.87 | $81.49 | 73.1% | $136.86 | $100.10 | 113.9% | 107.9% | 122.8% |
| 1/31/2015 TTM | 66.0% | $132.21 | $87.26 | 81.3% | $144.74 | $117.65 | 123.2% | 109.5% | 134.8% |
Source: Industry Report
The Market. The Hilton Houston Westchase Property is located in the center of Houston’s Westchase District, which is due west of the Houston central business district. The Westchase District is a 4.2 square mile commercial area with 17.7 million SF of office and retail space, 17,639 residential units, over 100 restaurants, and five colleges/universities. The Westchase District has a diverse employment base of 81,879 people. Both William P. Hobby (HOU) and George Bush Intercontinental (IAH) airports are located 30 minutes away, downtown Houston is eight miles away and Houston Galleria is six miles away. The Hilton Houston Westchase Property is close to corporate businesses such as Chevron, Phillips 66, Cameron and BMC Software and is adjacent to Houston’s Energy Corridor. Primary access to the Westchase District is via The Sam Houston Tollway (Beltway 8), Interstate Highway 10, the Southwest Freeway, Westheimer Road, and the West Park Toll Road.
2014 estimated population within a one-, three- and five-mile radius of the Hilton Houston Westchase Property, was 19,938, 192,953 and 545,874, respectively. 2014 estimated average household income within a one-, three- and five-mile radius, was $65,757, $72,071 and $71,926, respectively.
The Hilton Houston Westchase Property is within the Katy Freeway West submarket, which contains 90 hotels and 10,624 rooms as of November 2014 and had a trailing 12-month ADR of $112.79 and an occupancy of 73.2% resulting in a RevPAR of $82.56, which was a 9.6% increase over the prior year period.
The Hilton Houston Westchase Property and its primary competitive set are shown in the chart below:
| Competitive Property Summary | |||||||||||||
| Estimated 2014 Market Mix | September 30, 2014 TTM Occupancy, ADR and RevPAR | ||||||||||||
| Property Name | Rooms | Meeting Space (SF) | Commercial | Meeting/ Group | Leisure | Occ. | Occ. Penetr. | ADR | ADR Penetr. | RevPAR | RevPAR Penetr. | ||
| Hilton Houston Westchase | 297 | 15,268 | 45% | 35% | 20% | 77% | 107% | $144.76 | 114% | $111.37 | 122% | ||
| Wyndham (fka Crowne Plaza) | 344 | 9,218 | 60% | 20% | 10% | 65% | 90% | $85.08 | 67% | $55.05 | 60% | ||
| Marriott Westchase | 600 | 43,000 | 65% | 20% | 15% | 73% | 102% | $135.10 | 106% | $98.89 | 108% | ||
| Omni Westside | 400 | 25,000 | 60% | 20% | 10% | 73% | 101% | $151.92 | 119% | $110.75 | 121% | ||
| Hilton Houston Southwest | 292 | 15,600 | 50% | 25% | 15% | 71% | 99% | $107.29 | 84% | $76.28 | 83% | ||
| Courtyard by Marriott | 153 | 1,250 | 70% | 5% | 25% | 72% | 100% | $116.02 | 91% | $83.77 | 92% | ||
| Total/Wtd. Avg. | 2,086 | 59% | 22% | 15% | 72% | $127.17 | $91.44 | ||||||
Source: Appraisal
| This is not a research report and was not prepared by the Underwriters’ research departments. Please see additional important information and qualifications at the end of this Term Sheet. |
T-59
| MSBAM 2015-C22 | Hilton Houston Westchase |
Operating History and Underwritten Cash Flow. The following table presents certain information relating to the historical operating performance and the Underwritten Cash Flow at the Hilton Houston Westchase Property:
| Cash Flow Analysis | |||||||||||||
| 2011 | 2012 | 2013 | 2014 | UW | UW per Room | ||||||||
Occupancy(1) | 69.1% | 68.5% | 73.1% | 80.5% | 80.0% | ||||||||
ADR(1) | $117.72 | $128.64 | $136.86 | $144.17 | $144.17 | ||||||||
RevPAR(1) | $81.29 | $88.07 | $100.10 | $116.00 | $115.34 | ||||||||
| Rooms Revenue | $8,812,154 | $9,573,349 | $10,850,949 | $12,575,089 | $12,502,717 | $42,097 | |||||||
| Food & Beverage | $5,203,087 | $5,520,429 | $5,802,433 | $6,009,498 | $5,974,912 | $20,118 | |||||||
| Other Income | $353,729 | $299,146 | $315,076 | $275,146 | $273,562 | $921 | |||||||
| Total Revenue | $14,368,970 | $15,392,924 | $16,968,458 | $18,859,733 | $18,751,191 | $63,135 | |||||||
| Total Expenses | $11,198,896 | $11,882,369 | $12,549,724 | $13,160,481 | $13,172,748 | $44,353 | |||||||
| Net Operating Income | $3,170,074 | $3,510,555 | $4,418,734 | $5,699,252 | $5,578,443 | $18,783 | |||||||
| FF&E | $574,759 | $615,717 | $678,738 | $754,389 | $750,048 | $2,525 | |||||||
| Net Cash Flow | $2,595,315 | $2,894,838 | $3,739,996 | $4,944,863 | $4,828,395 | $16,257 | |||||||
| NOI DSCR | 1.12x | 1.24x | 1.57x | 2.02x | 1.98x | ||||||||
| NCF DSCR | 0.92x | 1.03x | 1.33x | 1.75x | 1.71x | ||||||||
| NOI Debt Yield | 7.0% | 7.8% | 9.8% | 12.6% | 12.3% | ||||||||
| NCF Debt Yield | 5.7% | 6.4% | 8.3% | 10.9% | 10.7% | ||||||||
| (1) | Sourced from Industry Report |
Escrows and Reserves. The Hilton Houston Westchase Borrower deposited $133,964 at loan origination for taxes and is required to deposit 1/12 of the estimated annual taxes monthly and 1/12 of the estimated annual insurance premiums monthly (unless the Hilton Houston Westchase Property is covered under a “blanket policy” acceptable to the lender). The Hilton Houston Westchase Borrower deposited $215,000 at loan origination for replacements and repairs to furniture, fixtures and equipment required by the current Property Improvement Plan (“PIP”) at the Hilton Houston Westchase Property and will be required to deposit monthly to the FF&E reserve as and when may be required by any future PIP.
Lockbox and Cash Management. A hard lockbox is in place with respect to the Hilton Houston Westchase Mortgage Loan. The Hilton Houston Westchase Mortgage Loan has springing cash management upon the commencement of a Cash Sweep Period (defined below). Also during a Cash Sweep Period, the Hilton Houston Westchase Borrower will be required to deposit all excess cash with respect to the Hilton Houston Westchase Mortgage Loan to an account to be held by the lender as additional security for the Hilton Houston Westchase Mortgage Loan.
A “Cash Sweep Period” will generally commence when the DSCR is less than 1.25x for any calendar quarter, and will generally end when the DSCR equals or exceeds 1.30x for two consecutive calendar quarters.
Property Management. The Hilton Houston Westchase Property is managed by Interstate Management Company, LLC (dba Interstate MC, LLC) (“Interstate”). Founded in 1960, Interstate is a U.S.-based global hotel management company that currently manages 435 hotels with over 79,000 rooms. Interstate manages one other hotel for the Hilton Houston Westchase sponsor.
Additional Secured Indebtedness (not including trade debts). Not permitted.
Mezzanine Loan and Preferred Equity. Not permitted.
Release of Property. Not permitted.
Terrorism Insurance. The Hilton Houston Westchase Borrower is required to obtain and maintain property insurance, public liability insurance and rental loss and/or business interruption insurance that covers perils of terrorism and acts of terrorism, both foreign and domestic.
| This is not a research report and was not prepared by the Underwriters’ research departments. Please see additional important information and qualifications at the end of this Term Sheet. |
T-60
(THIS PAGE INTENTIONALLY LEFT BLANK)
T-61
MSBAM 2015-C22 | Bozzuto’s Distribution Center |
Mortgage Loan No. 6 – Bozzuto’s Distribution Center

This is not a research report and was not prepared by the Underwriters’ research departments. Please see additional important information and qualifications at the end of this Term Sheet. |
T-62
MSBAM 2015-C22 | Bozzuto’s Distribution Center |
Mortgage Loan No. 6 – Bozzuto’s Distribution Center

This is not a research report and was not prepared by the Underwriters’ research departments. Please see additional important information and qualifications at the end of this Term Sheet. |
T-63
MSBAM 2015-C22 | Bozzuto’s Distribution Center |
| Mortgage Loan Information | Mortgaged Property Information | ||||||
| Mortgage Loan Seller: | MSMCH | Single Asset/Portfolio: | |||||
| Original Balance: | Location: | ||||||
| Cut-off Date Balance: | General Property Type: | ||||||
| % of Initial Pool Balance: | 4.0% | Detailed Property Type: | |||||
| Loan Purpose: | Title Vesting: | ||||||
| Sponsor: | Year Built/Renovated: | ||||||
| Mortgage Rate: | Size: | 986,565 SF | |||||
| Note Date: | Cut-off Date Balance per Unit: | $44 | |||||
| First Payment Date: | Maturity Date Balance per Unit: | $27 | |||||
| Maturity Date: | Property Manager: | ||||||
| Original Term to Maturity: | |||||||
| Original Amortization Term: | Underwriting and Financial Information(2) | ||||||
| IO Period: | UW NOI: | ||||||
| Seasoning: | UW NOI Debt Yield: | ||||||
| Prepayment Provisions: | UW NOI Debt Yield at Maturity: | ||||||
| Lockbox/Cash Mgmt Status: | UW NCF DSCR: | ||||||
| Additional Debt Type: | Most Recent NOI: | ||||||
| Additional Debt Balance: | 2nd Most Recent NOI: | ||||||
| Future Debt Permitted (Type): | 3rd Most Recent NOI: | ||||||
Reserves(1) | Most Recent Occupancy: | ||||||
| Type | Initial | Monthly | Cap | 2nd Most Recent Occupancy: | |||
| RE Tax: | $0 | Springing | N/A | 3rd Most Recent Occupancy: | |||
| Insurance: | $0 | Springing | N/A | Appraised Value (as of): | |||
Other(1): | $3,188,458 | $0 | N/A | Cut-off Date LTV Ratio: | |||
| Maturity Date LTV Ratio: | 37.7% | ||||||
| Sources and Uses | |||||||
| Sources | Proceeds | % of Total | Uses(1) | Proceeds | % of Total | ||
| Loan Amount: | 100.0% | 91.9% | |||||
| Closing Costs: | 0.4% | ||||||
| Return of Equity: | 7.6% | ||||||
| Total Sources: | 100.0% | Total Uses: | 100.0% | ||||
| (1) | See “—Escrows and Reserves” below for further discussion of reserve requirements. The Bozzuto’s Distribution Center Borrower posted with lender an irrevocable letter of credit in the amount of $3,188,458, representing one year of debt service renewable for the term of the Bozzuto’s Distribution Center Mortgage Loan. Because the letter of credit was not a cash escrow deposit at closing it is not reflected in the uses section of the Sources and Uses table. |
| (2) | Underwriting and Financial Information is based on a lease in place with the sole tenant at the Bozzuto’s Distribution Center Property, Bozzuto’s Inc., an affiliate of the Bozzuto’s Distribution Center Borrower. The Bozzuto’s Distribution Center Property is encumbered by an absolute net lease to a single tenant whereby the tenant is responsible for all structural and non-structural maintenance, utilities, and management, and pays real estate taxes and insurance directly. The Bozzuto’s Distribution Center Property has been 100% leased since lease commencement in 1999, and historical financial information is not available. |
The Mortgage Loan. The sixth largest mortgage loan (the “Bozzuto’s Distribution Center Mortgage Loan”) is evidenced by a promissory note in the original principal amount of $44,000,000 secured by a first priority fee mortgage encumbering a 986,565 SF warehouse and distribution center in Cheshire, Connecticut (the “Bozzuto’s Distribution Center Property”). The proceeds of the Bozzuto’s Distribution Center Mortgage Loan were primarily used to refinance a previous loan of approximately $40,452,709, secured by the Bozzuto’s Distribution Center Property and included in the MLMT 2005-MKB2 transaction.
The Borrower and the Sponsor. The borrower is Industrial Avenue L.L.C., a previously existing single-purpose Connecticut limited liability company with two independent directors (the “Bozzuto’s Distribution Center Borrower”). The Bozzuto’s Distribution Center Borrower is 100% owned by Michael Bozzuto and Jayne Bozzuto, the majority shareholders of Bozzuto’s, Inc. (“Bozzuto’s”), the sole tenant at the Bozzuto’s Distribution Center Property and the nonrecourse carve-out guarantor. Michael Bozzuto is the Chairman, CEO, President and Treasurer of Bozzuto’s and Jayne Bozzuto is the company’s Vice President.
According to the company’s 2014 fiscal year-end financial report, Bozzuto’s had total assets of approximately $209 million and total stockholders’ equity of approximately $34.3 million. The company reported a net income (loss), after depreciation, for its fiscal years ending in 2014, 2013, 2012, 2011 and 2010 of ($2,915,892), $420,103, $5,855,026, $1,726,265 and $3,467,245, respectively. The company indicates that the 2014 results were affected by an approximately $5,600,000 LIFO adjustment, which increased the cost of revenues accordingly and an $800,000 bonus depreciation expense related to certain 2013 and 2014 acquisitions. Excluding these adjustments, the company indicated that 2014 taxable income would be $4,599,343.
The Property. The Bozzuto’s Distribution Center Property is a 986,565 SF grocery warehouse and distribution center located in Cheshire, Connecticut, approximately 16 miles north of New Haven, Connecticut and 100 miles northeast of New York City. The Bozzuto’s Distribution Center Property has Interstate 691 and Interstate 84 access within approximately one mile. The Bozzuto’s Distribution Center Property consists of two contiguous buildings
This is not a research report and was not prepared by the Underwriters’ research departments. Please see additional important information and qualifications at the end of this Term Sheet. |
T-64
MSBAM 2015-C22 | Bozzuto’s Distribution Center |
located at 400 Industrial Avenue (the “400 Industrial Avenue Building”) and 275 Schoolhouse Road (the “275 Schoolhouse Road Building”), respectively. The 400 Industrial Avenue Building was constructed in 1995, was expanded in 1997, and totals 736,565 SF, including 303,865 SF of refrigerated and freezer space (-15 degrees F to 35 degrees F) and 35,000 SF of second-story administrative office space. The dry warehouse space has 36-foot clear ceiling heights and the refrigerator/freezer space has 28-foot clear ceiling heights. The 275 Schoolhouse Road Building was constructed in 1969 and totals 250,000 SF, including 20,000 SF of administrative office space. The 400 Industrial Avenue Building and the 275 Schoolhouse Road Building contain a total of 74 loading dock doors, one drive-in door and approximately 960 surface parking spaces, including 125 measured for truck trailer storage.
The Bozzuto’s Distribution Center Property is 100% leased and occupied by Bozzuto’s, a grocery wholesale and distribution company founded in 1945 and an affiliate of the Bozzuto’s Distribution Center Borrower. The company is a third-party distributor primarily serving northeast-based grocers that do not have their own distribution facilities. Clients include Big Y Supermarkets, King Kullen, Food Bazaar, Roche Brothers Supermarkets, Dave’s Markets, Mars Super Market, and IGA members in New Jersey, New York, Pennsylvania and New England. The Bozzuto’s lease in place is on an absolute net basis. The Bozzuto’s lease commenced on December 1, 1999, and is scheduled to expire on January 1, 2030.
The Market. The Bozzuto’s Distribution Center Property is located in Cheshire, New Haven County, Connecticut, approximately 21 miles southwest of Hartford and 100 miles northeast of New York City. The Bozzuto’s Distribution Center Property is located within the Northern New Haven industrial submarket. The general warehouse/distribution vacancy rate within the submarket was 14.6% as of September 30, 2014 and the average rental rate was $4.60 PSF. The appraiser’s estimated market rent of $6.50 PSF for the Bozzuto’s Distribution Center Property reflects a blended market rate of $4.00 PSF for dry-storage warehouse space and $12.00 PSF for refrigerated/freezer space.
Competitive properties to the Bozzuto’s Distribution Center Property are shown in the tables below. The Bozzuto’s Distribution Center Property is comprised of dry-storage warehouse space and refrigerated/freezer space. Competitive properties for each component are shown in the following tables:
| Competitive Cold Storage Property Summary | |||||||||||||||||||||||
| Property Name/Location | Size (NSF) | Year Built | Dock High Doors | Clear Height | Percent Office | Tenant Name | Lease Date | Term (yrs.) | Initial Rent | Rent Steps | Lease Type | ||||||||||||
Refrigerated Warehouse 45 Campanelli Dr. Westfield, MA | 150,000 | 2005 | 20 | 33’-59’ | 4.0% | N/A | Dec-14 | N/A | $12.15 | N/A | Net | ||||||||||||
Seafrigo Refrigerated Warehouse 735 Dowd Ave. Elizabeth, NJ | 175,000 | 2013 | 25 | 40’ | 9.0% | Seafrigo Cold Storage | Jul-13 | 20 | $13.56 | 2.5% Annual Yrs. 6-10, 1.5% Annual Yrs. 11-20 | Net | ||||||||||||
Refrigerated Warehouse Blair Rd. Woodbridge, NJ | 190,000 | 2014 | 24 | 48’ | 10.0% | N/A | Jul-13 | 25 | $16.75 | 10% Every 5 Yrs. | Net | ||||||||||||
Preferred Freezer Warehouse 150 Bayway Rd. Elizabeth, NJ | 150,826 | 2011 | 39 | 42’ | 10.0% | Preferred Freezer | May-13 | 25 | $20.75 | 5% Every 5 Yrs. | Net | ||||||||||||
Airport 100 1020 Airport Way Hanover, MD | 321,600 | 2001 | 24 | 30’ | 1.0% | Peapod | Feb-13 | 5 | $5.51 | 2.5% Annual | Net | ||||||||||||
Orefield Cold Storage 3824 Route 309 North Whitehall Township, PA | 352,945 | 1957 | 0 | 38’ | 2.0% | Godiva Chocolatier | Feb-11 | 2 | $11.41 | 1.5% Annual | Net | ||||||||||||
Richmond Cold Storage 5100 Corrugated Rd. Richmond, VA | 182,659 | 1990 | 24 | 35’ | 4.0% | Richmond Cold Storage | Jan-11 | 15 | $9.00 | 10% Every 5 Yrs. | Net | ||||||||||||
This is not a research report and was not prepared by the Underwriters’ research departments. Please see additional important information and qualifications at the end of this Term Sheet. |
T-65
MSBAM 2015-C22 | Bozzuto’s Distribution Center |
| Competitive Warehouse Property Summary | |||||||||||||||||||||||
| Property Name/Location | Size (NSF) | Year Built | Dock High Doors | Clear Height | Percent Office | Tenant Name | Lease Date | Term (yrs.) | Initial Rent | Rent Steps | Lease Type | ||||||||||||
Industrial Flex Building 119 Empire Ave. Meriden, CT | 166,330 | 1957 | 11 | 27.0’ | 5.6% | Available | May-14 | N/A | $2.50 | N/A | Net | ||||||||||||
Industrial Flex Building 297 State St. North Haven, CT | 385,656 | 1962 & 1995 | 26 | 18’6”-36’5” | 7.3% | Red Thread | Mar-14 | 10.3 | $3.85 | $0.25/SF Every 2 Yrs. | Net | ||||||||||||
Industrial Flex Building 297 State St. North Haven, CT | 385,656 | 1962 & 1995 | 26 | 18’6”-36’5” | 7.3% | 1-800-Pack-Rat | Jan-14 | 5.3 | $3.50 | $0.25/SF Annual | Net | ||||||||||||
Newington Business Center 475 Willard Ave. Newington, CT | 616,000 | 1965 | 14 | 18.0’ | 5.0% | Davidson Foods | May-12 | 10 | $3.50 | Annual | Net | ||||||||||||
Industrial Warehouse 15 Massimo Dr. North Haven, CT | 74,681 | 1977 | 7 | 21.0’ | 5.0% | Connecticut Container Corp. | Jun-11 | 5 | $3.25 | $3.50/SF Yr. 3 $3.75/SF Yr. 4 $4.00/SF Yr. 5 | Net | ||||||||||||
Wallingford Business Park 718 North Colony Rd. Wallingford, CT | 274,903 | 1949 | 15 | 12.0’-24.0’ | 6.0% | CCI Logistics | Jun-11 | 6.10 | $3.67 | Flat | Net | ||||||||||||
Berlin Commerce Park 91-99 Clark Dr. Berlin, CT | 70,000 | 1988 | 8 | 20.0’ | 8.6% | Fletcher Terry Co. | May-11 | 7 | $4.50 | Flat | Net | ||||||||||||
Operating History and Underwritten Cash Flow. The following table presents certain information relating to the Underwritten Cash Flow at the Bozzuto’s Distribution Center Property:
| 2011 | 2012 | 2013 | 2014 | UW | UW PSF | ||||||||
| Base Rent | N/A | N/A | N/A | N/A | $6,230,000 | $6.31 | |||||||
| Total Recoveries | N/A | N/A | N/A | N/A | $4,129,090 | $4.19 | |||||||
| Other Income | N/A | N/A | N/A | N/A | $0 | $0.00 | |||||||
| Discounts Concessions | N/A | N/A | N/A | N/A | $0 | $0.00 | |||||||
| Less Vacancy & Credit Loss | N/A | N/A | N/A | N/A | ($518,143) | ($0.53) | |||||||
| Effective Gross Income | N/A | N/A | N/A | N/A | $9,840,946 | $9.97 | |||||||
| Total Operating Expenses | N/A | N/A | N/A | N/A | $4,138,956 | $4.20 | |||||||
| Net Operating Income | N/A | N/A | N/A | N/A | $5,701,991 | $5.78 | |||||||
| Capital Expenditures | N/A | N/A | N/A | N/A | $217,044 | $0.22 | |||||||
| TI/LC | N/A | N/A | N/A | N/A | $226,910 | $0.23 | |||||||
| Net Cash Flow | N/A | N/A | N/A | $5,258,037 | $5.33 | ||||||||
| Occupancy % | N/A | N/A | N/A | N/A | 95.0% | ||||||||
| NOI DSCR | N/A | N/A | N/A | N/A | 1.79x | ||||||||
| NCF DSCR | N/A | N/A | N/A | N/A | 1.65x | ||||||||
| NOI Debt Yield | N/A | N/A | N/A | N/A | 13.0% | ||||||||
| NCF Debt Yield | N/A | N/A | N/A | N/A | 12.0% | ||||||||
| (1) | The Cash Flow Analysis is underwritten based on the lease in place with Bozzuto’s, the sole tenant at the Bozzuto’s Distribution Center Property. The tenant is responsible for all structural and non-structural maintenance, utilities, and management, and pays real estate taxes and insurance directly. The Bozzuto’s Distribution Center Property has been 100% leased since lease commencement in 1999, and historical financial information is not available. |
Escrows and Reserves. During a Cash Sweep Period (as defined below), the Bozzuto’s Distribution Center Borrower is required to escrow monthly 1/12 of the annual estimated tax payments and 1/12 of the annual estimated insurance premiums (unless the Bozzuto’s Distribution Center Borrower maintains insurance under an acceptable blanket insurance policy). The Bozzuto’s Distribution Center Borrower provided a letter of credit at loan origination in the amount of $3,188,458 in lieu of a debt service reserve which the lender may apply to repay the Bozzuto’s Distribution Center Mortgage Loan if an event of default occurs or if a Tenant Vacancy Event (as defined below) occurs.
Lockbox and Cash Management. A hard lockbox is in place with respect to the Bozzuto’s Distribution Center Mortgage Loan. The Bozzuto’s Distribution Center Mortgage Loan has in place cash management. Funds in the lockbox account are applied on each monthly payment date to pay debt service on the Bozzuto’s Distribution Center Mortgage Loan, to fund required deposits to the reserves, if any, as described above under “—Escrows and Reserves,” to disburse during a Cash Sweep Period (other than a Cash Sweep Period which is due to an event of default on the Bozzuto’s Distribution Center Mortgage Loan that occurred and is then continuing) to the Bozzuto’s Distribution Center Borrower the monthly amount payable for operating expenses referenced in the annual budget approved by lender, together with other amounts incurred by the Bozzuto’s Distribution Center Borrower in
This is not a research report and was not prepared by the Underwriters’ research departments. Please see additional important information and qualifications at the end of this Term Sheet. |
T-66
MSBAM 2015-C22 | Bozzuto’s Distribution Center |
connection with the operation and maintenance of the Bozzuto’s Distribution Center Property approved by lender, and to disburse any excess to the Bozzuto’s Distribution Center Borrower; provided, that if a Cash Sweep Period has occurred and is continuing, then any excess will be remitted to an account to be held by the lender as additional security for the Bozzuto’s Distribution Center Mortgage Loan.
A “Cash Sweep Period” will commence upon the occurrence of an event of default and/or a Tenant Vacancy Event and continue until:
(i) in the case of an event of default, no event of default has occurred and is continuing, or
(ii) in the case of a Tenant Vacancy Event which is caused by a Bozzuto’s Bankruptcy Event, the lender receives an estoppel in form and substance reasonably acceptable to the lender evidencing that the lease for the Bozzuto’s Space has been affirmed in bankruptcy and Bozzuto’s continues to lease the Bozzuto’s Space, is open for business and operations and continues to pay full unabated rent pursuant to the lease for the Bozzuto’s Space, or
(iii) in the case of a Tenant Vacancy Event which is caused by Bozzuto’s Tenant vacating all or a material portion of the Bozzuto’s Space and/or Bozzuto’s Tenant “going dark” or otherwise ceasing to operate its business in the Bozzuto’s Space, the lender receives an estoppel in form and substance reasonably acceptable to the lender evidencing that Bozzuto’s Tenant either (1) is in occupancy of the entirety of the Bozzuto’s Space, is operating its business at the Bozzuto’s Space and is paying full unabated rent pursuant to the lease for the Bozzuto’s Space or (2) the entire Bozzuto’s Space (or the applicable portion of the Bozzuto’s Space, if Bozzuto’s Tenant vacated only a portion of the Bozzuto’s Space) has been re-let to one or more replacement tenant(s) pursuant to a replacement lease(s) on terms and conditions approved by the lender in its sole discretion.
“Bozzuto’s Tenant” means each of Bozzuto’s Inc. and any replacement tenant that complies with the loan agreement for the Bozzuto’s Distribution Center Mortgage Loan, is reasonably acceptable to the lender for the Bozzuto’s Distribution Center Mortgage Loan and occupies all or a portion of the Bozzuto’s Space pursuant to a lease that is reasonably acceptable to the lender for the Bozzuto’s Distribution Center Mortgage Loan.
A “Bozzuto’s Bankruptcy Event” means (a) Bozzuto’s files a voluntary bankruptcy petition or an involuntary bankruptcy petition is filed against Bozzuto’s (or Bozzuto’s consents to or otherwise acquiesces or joins in such a filing), (b) consents to (or otherwise acquiesces or joins in an application for) a receiver or examiner or (c) admits in writing its insolvency or inability to pay its debts as they come due.
A “Tenant Vacancy Event” means the earliest of (a) the date that a Bozzuto’s Bankruptcy Event occurs, (b) the date that the tenant vacates all or a material portion of the space demised pursuant to that certain Amendment and Restatement of Lease Agreements, dated December 30, 1999, as amended on February 22, 2005 and on the closing date of the Bozzuto’s Distribution Center Mortgage Loan, between the landlord of the Bozzuto’s Distribution Center Property and Bozzuto’s (the “Bozzuto’s Space”) or (c) the date on which the tenant in the Bozzuto’s Space “goes dark” and ceases to open for business and operate in the Bozzuto’s Space.
Additional Secured Indebtedness (not including trade debts). Not permitted.
Mezzanine Loan and Preferred Equity. Not permitted
Release of Property. Not permitted.
Terrorism Insurance. Generally, the Bozzuto’s Distribution Center Borrower is required to obtain insurance against acts of terrorism or other similar acts or events (or “fire following”) to the extent such insurance is available in form and substance satisfactory to lender (but in no event more than the sum of 100% of full replacement cost and 12 months of business interruption insurance). Notwithstanding the foregoing, for so long as the Terrorism Risk Insurance Program Reauthorization Act of 2007 (or any extension thereof or other federal government program with substantially similar protection) is in effect, the Bozzuto’s Distribution Center Borrower is required to maintain, and lender is required to accept, terrorism insurance which covers “covered acts” (as defined by such statute or other program), as full compliance as it relates to the risks required to be covered pursuant to the preceding sentence, so long as such statute or other program covers both domestic and foreign acts of terrorism.
This is not a research report and was not prepared by the Underwriters’ research departments. Please see additional important information and qualifications at the end of this Term Sheet. |
T-67
MSBAM 2015-C22 | Harrison Creek Apartments |
Mortgage Loan No. 7 – Harrison Creek Apartments
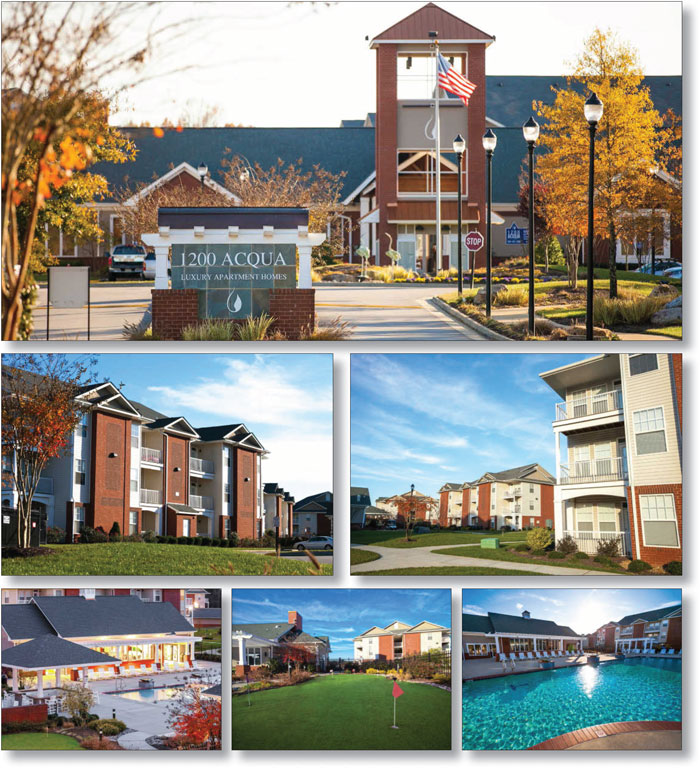
This is not a research report and was not prepared by the Underwriters’ research departments. Please see additional important information and qualifications at the end of this Term Sheet. |
T-68
MSBAM 2015-C22 | Harrison Creek Apartments |
Mortgage Loan No. 7 – Harrison Creek Apartments

This is not a research report and was not prepared by the Underwriters’ research departments. Please see additional important information and qualifications at the end of this Term Sheet. |
T-69
MSBAM 2015-C22 | Harrison Creek Apartments |
| Mortgage Loan No. 7 – Harrison Creek Apartments |
| Mortgage Loan Information | Mortgaged Property Information | ||||||
| Mortgage Loan Seller: | BANA | Single Asset/Portfolio: | Single Asset | ||||
| Original Balance: | $34,300,000 | Location: | Petersburg, VA 23803 | ||||
| Cut-off Date Balance: | $34,300,000 | General Property Type: | Multifamily | ||||
| % of Initial Pool Balance: | 3.1% | Detailed Property Type: | Garden | ||||
| Loan Purpose: | Refinance | Title Vesting: | Fee | ||||
| Sponsor: | C. Burton Cutright; Eric G. Olson | Year Built/Renovated: | 2010/N/A | ||||
| Mortgage Rate: | 4.050% | Size: | 336 Units | ||||
| Note Date: | 1/20/2015 | Cut-off Date Balance per Unit: | $102,083 | ||||
| First Payment Date: | 3/1/2015 | Maturity Date Balance per Unit: | $85,140 | ||||
| Maturity Date: | 2/1/2025 | Property Manager: | BECO Asset Management, LLC | ||||
| Original Term to Maturity: | 120 months | Underwriting and Financial Information | |||||
| Original Amortization Term: | 360 months | UW NOI: | $2,660,844 | ||||
| IO Period: | 18 months | UW NOI Debt Yield: | 7.8% | ||||
| Seasoning: | 2 months | UW NOI Debt Yield at Maturity: | 9.3% | ||||
| Prepayment Provisions: | LO (26); DEF (89); O (5) | UW NCF DSCR: | 1.30x | ||||
| Lockbox/Cash Mgmt Status: | Springing/Springing | Most Recent NOI: | $2,666,550 (12/31/2014) | ||||
| Additional Debt Type: | N/A | 2nd Most Recent NOI: | $2,704,311 (12/31/2013) | ||||
| Additional Debt Balance: | N/A | 3rd Most Recent NOI: | $2,530,317 (12/31/2012) | ||||
| Future Debt Permitted (Type): | No (N/A) | Most Recent Occupancy: | 88.3% (3/1/2015) | ||||
Reserves(1) | 2nd Most Recent Occupancy: | 90.4% (12/31/2014) | |||||
| Type | Initial | Monthly | Cap | 3rd Most Recent Occupancy: | 92.8% (12/31/2013) | ||
| RE Tax: | $65,752 | $21,917 | N/A | Appraised Value (as of): | $45,000,000 (12/19/2014) | ||
| Insurance: | $26,939 | $4,490 | N/A | Cut-off Date LTV Ratio: | 76.2% | ||
| Recurring Replacements: | $0 | $5,270 | N/A | Maturity Date LTV Ratio: | 63.6% | ||
Sources and Uses | |||||||
| Sources | Proceeds | % of Total | Uses | Proceeds | % of Total | ||
| Loan Amount: | $34,300,000 | 100.0% | Loan Payoff: | $27,961,322 | 81.5% | ||
| Reserves: | $92,691 | 0.3% | |||||
| Closing Costs: | $175,690 | 0.5% | |||||
| Return of Equity: | $6,070,297 | 17.7% | |||||
| Total Sources: | $34,300,000 | 100.0% | Total Uses: | $34,300,000 | 100.0% | ||
| (1) | See “—Escrows and Reserves” below for further discussion of reserve requirements. |
The Mortgage Loan. The seventh largest mortgage loan (the “Harrison Creek Apartments Mortgage Loan”) is evidenced by a promissory note in the original principal amount of $34,300,000 secured by a first priority fee mortgage encumbering a Class “A,” 336-unit garden-style apartment community in Petersburg, Virginia known as 1200 Acqua (the “Harrison Creek Apartments Property”).
The Borrower and the Sponsor. The borrower is 1200 Acqua, LLC, a single-purpose Delaware limited liability company (the “Harrison Creek Apartments Borrower”), with at least one independent director. The Harrison Creek Apartments Borrower is 100% indirectly owned by C. Burton Cutright (50%) and Eric G. Olson (50%). C. Burton Cutright and Eric G. Olson are the Harrison Creek Apartments Mortgage Loan sponsors and nonrecourse carve-out guarantors. C. Burton Cutright and Eric G. Olson are the founders of BECO Asset Management, LLC (“BECO”). BECO was founded over 30 years ago, is comprised of over 34 active companies, and is involved in the construction, holding and operation of commercial buildings and upper end apartment complexes with an estimated market value of nearly $288 million.
The Property. The Harrison Creek Apartments Property is a Class “A,” 336-unit garden-style apartment complex with 14 three-story apartment buildings located in Petersburg, Virginia, which is approximately 23 miles south of Richmond. The Harrison Creek Apartments Property was constructed in 2010 by the Harrison Creek Apartments Mortgage Loan sponsors at an approximate cost of $24,980,000.
Each unit at the Harrison Creek Apartments Property contains a fully equipped kitchen featuring California-style granite counters, patio or balcony with storage, nine-foot ceilings with crown molding, oversized garden tubs, walk-in closets, internet/cable access, central air conditioning and washer/dryer connections. The Harrison Creek Apartments Property is marketed as “resort style living” and property amenities include a gated entrance, clubhouse with 24-hour business center, Wi-Fi cafe and lounge, 24-hour fitness center, resort-style pool complete with grill area, cabana, fire pit and 16-person hot tub, putting green, sand volleyball court, enclosed dog runs and pet stations, car care center and 686 parking spaces (2.04 spaces/unit).
This is not a research report and was not prepared by the Underwriters’ research departments. Please see additional important information and qualifications at the end of this Term Sheet. |
T-70
MSBAM 2015-C22 | Harrison Creek Apartments |
The chart below shows the apartment mix at the Harrison Creek Apartments Property:
| Unit Mix Summary | |||||
| Floor Plan | No. of Units | % of Total | SF | Total SF | |
| 1 Bedroom/1 Bath - The Agean | 120 | 36% | 875 | 105,000 | |
| 2 Bedroom/2 Bath - Caspian | 96 | 29% | 1,030 | 98,880 | |
| 2 Bedroom/2 Bath - Baltic | 120 | 36% | 1,170 | 140,400 | |
| Total/Avg. | 336 | 100% | 1,025 | 344,280 | |
Source: Appraisal
The Market. The Harrison Creek Apartments Property is located at 1200 Harrison Creek Boulevard, south of County Drive (Route 460), in Petersburg, Virginia in the Richmond, VA metropolitan statistical area.
The local area is currently undergoing redevelopment with the recently constructed Southside Regional Medical Center, a 300-bed, 50-acre medical campus. Also, Rolls Royce is developing a $500 million jet engine manufacturing factory expected to bring 140 new jobs and a Chinese pharmaceutical company is redeveloping the Boehringer Ingelheim Plant expected to bring 376 new jobs. Approximately 18 miles north of the Harrison Creek Apartments Property is Meadowville Technology Park, a 900 acre site still under development and currently home to a one million SF fulfillment center for Amazon, a 242,000 SF data center for Capital One and a 400,000 SF distribution facility for Medline Industries, Inc. Petersburg is also influenced by the Fort Lee area which is home to the Combined Arms Support Command as well as the Quartermaster Center and School, the U.S. Army Logistics Management College and the Defense Commissary Agency.
2013 estimated population within a one-, three- and five-mile radius of the Harrison Creek Apartments Property was 2,839, 27,535 and 69,329, respectively. 2013 average household income within a one-, three- and five-mile radius was $49,365, $55,768 and $55,441, respectively.
As of July, 2014, the Richmond apartment market had a 6.2% vacancy rate and an average monthly rental rate of $933. Approximately 73% of the 66,083 apartments in the market were built over 15 years ago; only 8.4% were built in the last five years.
Comparable rental properties to the Harrison Creek Apartments Property are shown in the chart below:
| Competitive Rental Property Summary | |||||||||||||||||||
| Property Name | Location | Total Units | Property Occupancy | Year Built | One Bedroom Avg SF | One Bedroom Rental Rates | Two Bedroom Avg SF | Two Bedroom Rental Rates | |||||||||||
| Addison at Crater Woods | Petersburg | 324 | (1) | 93% | 2008 | 740 | $742 | 1,068 | $949 | ||||||||||
| White Oak | Chester | 238 | (1) | 91% | 2008 | 786 | $976 | 1,122 | $1,099 | ||||||||||
| Independence Place | Prince George | 188 | (1) | 85% | 2011 | 725 | $845 | 967 | $935 | ||||||||||
| River Forest | Chester | 300 | 91% | 2005 | 768 | $818 | 1,073 | $978 | |||||||||||
| Garden Springs | Chester | 148 | (1) | 95% | 2009 | 868 | $985 | 1,121 | $1,176 | ||||||||||
| Total/Avg. | 1,198 | 91% | 2008 | 777 | $873 | 1,070 | $1,027 | ||||||||||||
| Harrison Creek Apartments (Subject) | Petersburg | 336 | 93% | 2010 | 875 | $845 | 1,030 | $935 | |||||||||||
Source: Appraisal
| (1) | Total Units include three- and four-bedroom units not shown in this table. |
This is not a research report and was not prepared by the Underwriters’ research departments. Please see additional important information and qualifications at the end of this Term Sheet. |
T-71
MSBAM 2015-C22 | Harrison Creek Apartments |
Operating History and Underwritten Cash Flow. The following table presents certain information relating to the historical operating performance and the Underwritten Cash Flow at the Harrison Creek Apartments Property:
| Cash Flow Analysis | |||||||||||||
| 2011 | 2012 | 2013 | 2014 | UW | UW per Unit | ||||||||
| Base Rent | $4,112,845 | $3,830,949 | $3,670,141 | $3,675,855 | $3,727,907 | $11,095 | |||||||
Other Income(1) | $785,731 | $964,562 | $1,209,858 | $1,226,670 | $1,226,670 | $3,651 | |||||||
| Discounts Concessions | ($106,073) | ($154,891) | ($56,394) | ($63,265) | ($11,761) | ($35) | |||||||
| Less Vacancy & Credit Loss | ($299,763) | ($557,876) | ($253,259) | ($267,841) | ($371,397) | ($1,105) | |||||||
| Effective Gross Income | $4,492,740 | $4,082,744 | $4,570,346 | $4,571,419 | $4,571,419 | $13,605 | |||||||
| Total Operating Expenses | $1,405,124 | $1,552,427 | $1,866,035 | $1,904,869 | $1,910,575 | $5,686 | |||||||
| Net Operating Income | $3,087,616 | $2,530,317 | $2,704,311 | $2,666,550 | $2,660,844 | $7,919 | |||||||
| Capital Expenditures | $0 | $0 | $0 | $0 | $84,000 | $250 | |||||||
| Net Cash Flow | $3,087,616 | $2,530,317 | $2,704,311 | $2,666,550 | $2,576,844 | $7,669 | |||||||
Occupancy %(2) | 96.4% | 91.3% | 92.3% | 90.4% | 90.0% | ||||||||
| NOI DSCR | 1.56x | 1.28x | 1.37x | 1.35x | 1.35x | ||||||||
| NCF DSCR | 1.56x | 1.28x | 1.37x | 1.35x | 1.30x | ||||||||
| NOI Debt Yield | 9.00% | 7.38% | 7.88% | 7.77% | 7.76% | ||||||||
| NCF Debt Yield | 9.00% | 7.38% | 7.88% | 7.77% | 7.51% | ||||||||
| (1) | Other Income includes income from cable service/Internet, damages/cleaning, late fees and admin fees, utilities, garage and washer/dryer rental. |
| (2) | Occupancy information is based on the underwritten rent roll, 2014 occupancy information is based on the Harrison Creek Apartments Borrower rent roll dated December 31, 2014. |
Escrows and Reserves. The Harrison Creek Apartments Borrower deposited $65,752 in escrow for annual real estate taxes at loan origination and is required to escrow monthly 1/12 of the annual estimated tax payments. The Harrison Creek Apartments Borrower deposited $26,939 in escrow for annual insurance premiums at loan origination and is required to escrow monthly 1/12 of the annual estimated insurance premiums (unless the Harrison Creek Apartments Borrower maintains an acceptable blanket insurance policy). The Harrison Creek Apartments Borrower is required to make monthly deposits of $5,270 for replacement reserves.
Lockbox and Cash Management. The Harrison Creek Apartments Mortgage Loan has a springing lockbox with springing cash management upon the commencement of a Cash Sweep Period (as defined below). Also during a Cash Sweep Period, the Harrison Creek Apartments Borrower will be required to deposit all excess cash with respect to the Harrison Creek Apartments Mortgage Loan to an account to be held by the lender as additional security for the Harrison Creek Apartments Mortgage Loan.
A “Cash Sweep Period” will generally commence upon the date upon which the DSCR is less than 1.15x on a trailing 12-month basis, tested quarterly. A Cash Sweep Period will generally end upon the date upon which the DSCR is at least 1.25x on a trailing 12-month basis, tested quarterly for two consecutive quarters.
Property Management. The Harrison Creek Apartments Property is subject to a management agreement with BECO Asset Management, LLC, an affiliate of the Harrison Creek Apartments Mortgage Loan sponsors. BECO Asset Management, LLC currently manages six multifamily communities in Virginia, including the Harrison Creek Apartments Property.
Additional Secured Indebtedness (not including trade debts). Not permitted.
Mezzanine Loan and Preferred Equity. Not permitted.
Release of Property. Not permitted.
Terrorism Insurance. The Harrison Creek Apartments Borrower is required to obtain and maintain property insurance, public liability insurance and rental loss and/or business interruption insurance that covers perils of terrorism and acts of terrorism, both foreign and domestic.
This is not a research report and was not prepared by the Underwriters’ research departments. Please see additional important information and qualifications at the end of this Term Sheet. |
T-72
(THIS PAGE INTENTIONALLY LEFT BLANK)
T-73
| MSBAM 2015-C22 | 555 11th Street NW |
Mortgage Loan No. 8 – 555 11th Street NW
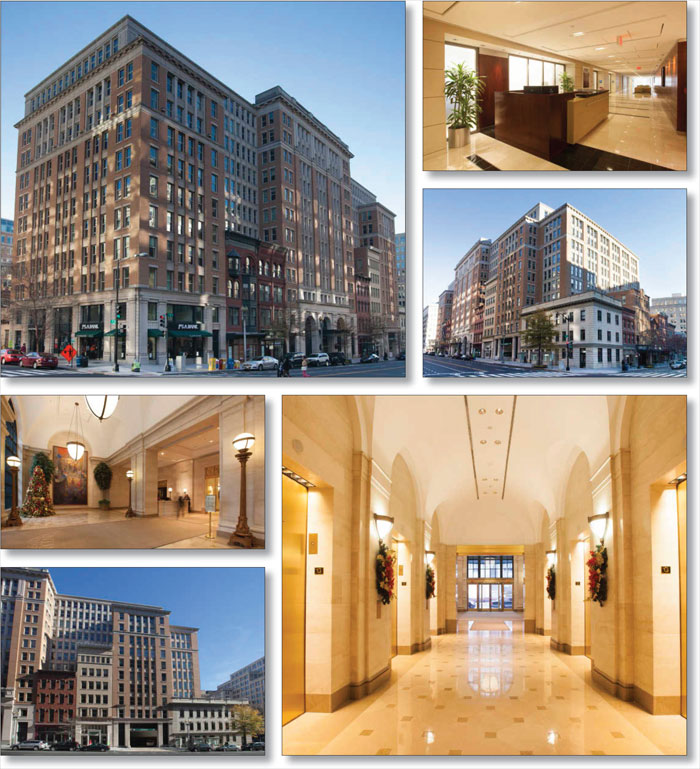
This is not a research report and was not prepared by the Underwriters’ research departments. Please see additional important information and qualifications at the end of this Term Sheet. |
T-74
| MSBAM 2015-C22 | 555 11th Street NW |
Mortgage Loan No. 8 – 555 11th Street NW
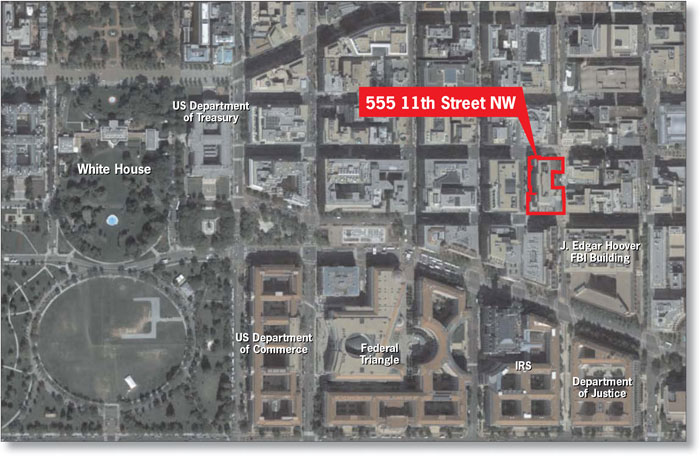
This is not a research report and was not prepared by the Underwriters’ research departments. Please see additional important information and qualifications at the end of this Term Sheet. |
T-75
| MSBAM 2015-C22 | 555 11th Street NW |
Mortgage Loan No. 8 – 555 11th Street NW

This is not a research report and was not prepared by the Underwriters’ research departments. Please see additional important information and qualifications at the end of this Term Sheet. |
T-76
| MSBAM 2015-C22 | 555 11th Street NW |
Mortgage Loan No. 8 – 555 11th Street NW
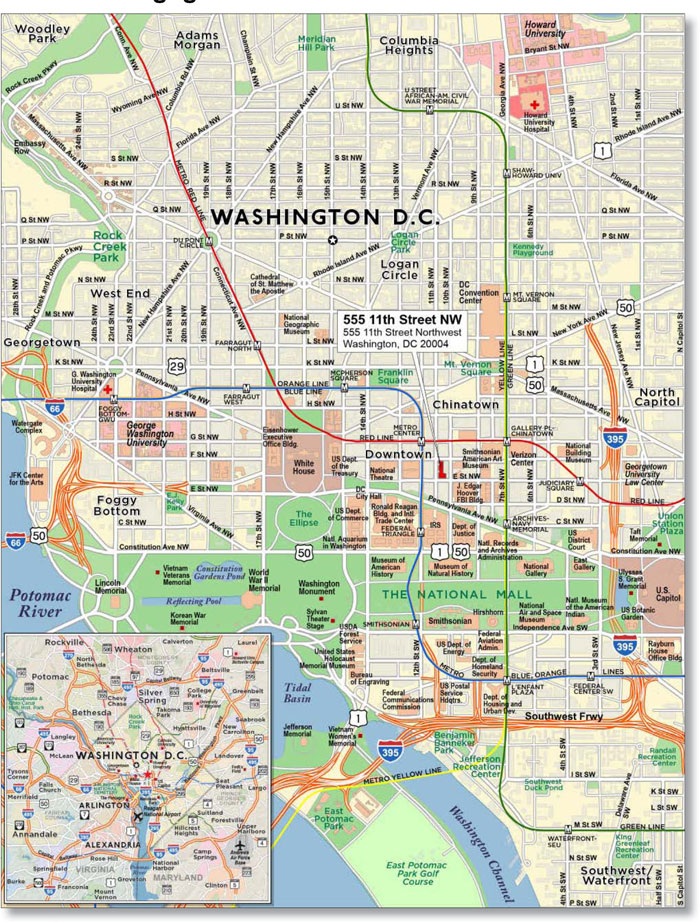
This is not a research report and was not prepared by the Underwriters’ research departments. Please see additional important information and qualifications at the end of this Term Sheet. |
T-77
| MSBAM 2015-C22 | 555 11th Street NW |
| Mortgage Loan No. 8 – 555 11th Street NW |
| Mortgage Loan Information | Mortgaged Property Information | |||||
| Mortgage Loan Seller: | MSMCH | Single Asset/Portfolio: | Single Asset | |||
Original Balance(1): | $30,000,000 | Location: | Washington, D.C. 20004 | |||
Cut-off Date Balance(1): | $30,000,000 | General Property Type: | Office | |||
| % of Initial Pool Balance: | 2.7% | Detailed Property Type: | CBD | |||
| Loan Purpose: | Acquisition | Title Vesting: | Fee | |||
| Sponsor: | Rockrose Development Corp. | Year Built/Renovated: | 2001/N/A | |||
| Mortgage Rate: | 3.16633333% | Size: | 414,204 SF | |||
| Note Date: | 10/30/2014 | Cut-off Date Balance per Unit(1): | $217 | |||
| First Payment Date: | 12/4/2014 | Maturity Date Balance per Unit(1): | $217 | |||
| Maturity Date: | 11/4/2024 | Property Manager: | Rockrose Development Corp. (borrower related) | |||
| Original Term to Maturity: | 120 months | |||||
| Original Amortization Term: | 0 months | Underwriting and Financial Information | ||||
| IO Period: | 120 months | UW NOI: | $15,855,660 | |||
| Seasoning: | 5 months | UW NOI Debt Yield(1): | 17.6% | |||
| Prepayment Provisions: | LO (29); DEF (84); O (7) | UW NOI Debt Yield at Maturity(1): | 17.6% | |||
| Lockbox/Cash Mgmt Status: | Soft/Springing | UW NCF DSCR(1): | 5.49x | |||
| Additional Debt Type: | Pari Passu/Senior B Note/Junior B Note/ Mezzanine | Most Recent NOI(3): | $18,178,050 (12/31/2013) | |||
| 2nd Most Recent NOI: | $16,881,623 (12/31/2012) | |||||
| Additional Debt Balance: | $60,000,000/$30,000,000/$57,000,000/ $50,000,000 | 3rd Most Recent NOI: | $17,167,093 (12/31/2011) | |||
| Most Recent Occupancy: | 85.2% (1/16/2015) | |||||
| Future Debt Permitted (Type): | Yes (Mezzanine) | 2nd Most Recent Occupancy: | 97.0% (12/31/2013) | |||
Reserves(2) | 3rd Most Recent Occupancy: | 97.0% (12/13/2012) | ||||
| Type | Initial | Monthly | Cap | Appraised Value (as of): | $309,000,000 (9/5/2014) | |
| RE Tax: | $0 | Springing | N/A | Cut-off Date LTV Ratio(1): | 29.1% | |
| Insurance: | $0 | Springing | N/A | Maturity Date LTV Ratio(1): | 29.1% | |
| TI/LC: | $4,000,000 | $0 | N/A | |||
| Sources and Uses | ||||||
| Sources | Proceeds | % of Total | Uses | Proceeds | % of Total | |
Loan Amount(1): | $177,000,000 | 55.7% | Purchase Price: | $300,000,000 | 94.5% | |
| Mezzanine Loan: | $50,000,000 | 15.7% | Reserves: | 1.3% | ||
| Borrower Equity: | $90,606,668 | 28.6% | Closing Costs(4): | $13,606,668 | 4.3% | |
| Total Sources: | $317,606,668 | 100.0% | Total Uses: | $317,606,668 | 100.0% | |
| (1) | The 555 11th Street NW Mortgage Loan is part of the 555 11th Street NW Non-Serviced Loan Combination, which is comprised of two pari passu senior notes and three subordinate notes and has an aggregate principal balance of $177,000,000. The two 555 11th Street NW pari passu senior notes have a combined original principal balance of $90,000,000 and the three subordinate notes have a combined original principal balance of $87,000,000. The Cut-off Date Balance per Unit, Maturity Date Balance per Unit, UW NOI Debt Yield, UW NOI Debt Yield at Maturity, UW NCF DSCR, Cut-off Date LTV Ratio and Maturity Date LTV Ratio numbers presented above are based on the aggregate principal balance of the pari passu senior notes without regard to the subordinate notes. The Cut-off Date Balance per Unit, Maturity Date Balance per Unit, UW NOI Debt Yield, UW NOI Debt Yield at Maturity, UW NCF DSCR, Cut-off Date LTV Ratio and Maturity Date LTV Ratio based on the entire 555 11th Street NW Non-Serviced Loan Combination (including the subordinate notes) are $427, $427, 9.0%, 9.0%, 2.35x, 57.3% and 57.3%, respectively. |
| (2) | See “—Escrows and Reserves” below for further discussion of reserve requirements. |
| (3) | The 555 11th Street NW Borrower purchased the 555 11th Street NW Property in October 2014. Historical financial operating statements were provided by the seller. The 555 11th Street NW Borrower indicates that property operating statements for the approximately first 10 months of 2014 were not provided by the seller. |
| (4) | Closing costs include approximately $7,830,498 in outstanding leasing commissions associated with the Latham & Watkins lease renewal and approximately $317,818 of free rent reimbursements paid to the Latham & Watkins tenant. |
The Mortgage Loan. The eighth largest mortgage loan (the “555 11th Street NW Mortgage Loan”) is part of a non-serviced loan combination (the “555 11th Street NW Non-Serviced Loan Combination”) evidenced by (i) two pari passu notes, (a) Promissory Note A-1B in the original principal amount of $30,000,000, which represents the 555 11th Street NW Mortgage Loan and (b) Promissory Note A-1A in the original principal amount of $60,000,000 (the “555 11th Street NW Non-Serviced Companion Loan”), (ii) one subordinate note, designated as Promissory Note A2 in the original principal amount of $30,000,000 (the “555 11th Street NW Senior B Note”), that is generally subordinate to the 555 11th Street NW Mortgage Loan and the 555 11th Street Non-Serviced Companion Loan, and (iii) two subordinate notes, designated as Promissory Note A3 and Promissory Note B in the aggregate original principal amount of $57,000,000 (collectively, the “555 11th Street NW Junior B Note”), that are generally subordinate to the 555 11th Street NW Mortgage Loan, the 555 11th Street NW Non-Serviced Companion Loan and the 555 11th Street NW Senior B Note. The 555 11th Street NW Non-Serviced Loan Combination is secured by a first priority fee mortgage encumbering an office building in Washington, D.C. (the “555 11th Street NW Property”). See “Description of the Mortgage Pool—The Non-Serviced Loan Combinations—The 555 11th Street NW Non-Serviced Loan Combination” and “Servicing of the Mortgage Loans” in the Free Writing Prospectus.
The 555 11th Street NW Mortgage Loan will be included in the MSBAM 2015-C22 securitization trust. The 555 11th Street NW Non-Serviced Companion Loan was contributed to the MSBAM 2015-C21 securitization trust. The 555 11th Street NW Senior B Note was also included in the MSBAM 2015-C21 securitization trust; however, the 555 11th Street NW Senior B Note was not included in the mortgage pool, but rather supports separate loan-specific securities issued in connection with that transaction. The 555 11th Street NW Junior B Note will not be included in the MSBAM 2015-C22
This is not a research report and was not prepared by the Underwriters’ research departments. Please see additional important information and qualifications at the end of this Term Sheet. |
T-78
| MSBAM 2015-C22 | 555 11th Street NW |
securitization trust and is currently held by Principal Life Insurance Company. The 555 11th Street NW Non-Serviced Loan Combination will be serviced pursuant to terms of the MSBAM 2015-C21 pooling and servicing agreement.
The proceeds of the 555 11th Street NW Non-Serviced Loan Combination, together with a $50,000,000 mezzanine loan (the “555 11th Street NW Mezzanine Loan”) (see “—Mezzanine Loan and Preferred Equity” below for additional information) were used to acquire the 555 11th Street NW Property for a purchase price of approximately $300,000,000.
When analyzed on a stand-alone basis, Fitch has indicated that the 555 11th Street NW Mortgage Loan has credit characteristics commensurate with a “A-” rated obligation, and Moody’s has indicated that the 555 11th Street NW Mortgage Loan has credit characteristics commensurate with a “Baa2” rated obligation.
The Borrower and the Sponsor. The borrower is 555 11th Owner L.L.C. (the “555 11th Street NW Borrower”), a single-purpose Delaware limited liability company with two independent directors. The 555 11th Street NW Borrower is 98% indirectly owned by Rockrose Master L.L.C. and H. Henry Elghanayan, the CEO of Rockrose Development Corp., and 2% indirectly owned by Lincoln United, LLC, a District of Columbia limited liability company. Rockrose Master L.L.C. is 100% directly owned by H. Henry Elghanayan (99.8%) and Nancy Elghanayan (0.2%). The nonrecourse carve-out guarantor is Rockrose General Equities Holdings L.L.C.
Rockrose Development Corp. is a privately held New York City based real estate developer and owner established in 1970. Since its founding, the company and affiliates have acquired, built or repositioned approximately 60 projects encompassing 10,000 residential units, 2.5 million SF of office space and 500,000 SF of retail space.
The Property. The 555 11th Street NW Property, also known as Lincoln Square, is a 414,204 SF, 13-story office building with a 330 space subterranean parking garage. The building contains approximately 16,805 SF of ground floor retail space and the 40,000 SF subterranean Landmark Theater with a street level entrance. The 555 11th Street NW Property was constructed in 2001 incorporating nine historic facades which were preserved and restored during the redevelopment. The 555 11th Street NW Property is located in Washington, D.C. between the White House and the U.S. Capitol Building. It is approximately five blocks from the White House.
The 555 11th Street NW Property was 85.2% occupied by 11 tenants as of January 16, 2015. The largest tenant, Latham & Watkins LLP (“Latham & Watkins”), recently renewed its lease for eight full floors, totaling 238,300 SF of office space, plus 2,293 SF of storage space, at the 555 11th Street NW Property. Latham & Watkins is an original tenant at the 555 11th Street NW Property and executed its 15 year lease renewal effective February 1, 2016 until January 31, 2031, subject to three partial lease termination options, exercisable prior to June 30, 2017, March 31, 2021 and April 30, 2026, respectively, totaling approximately 65,611 SF. See “—Major Tenants” below for additional information.
Major Tenants.
Latham & Watkins LLP (240,593 SF, 58% of NRA, 71% of underwritten base rent). Latham & Watkins leases 240,593 SF at the 555 11th Street NW Property. The underwritten lease is a renewal that commences on February 1, 2016, and has an expiration date of January 31, 2031, with two five-year lease renewal options. The tenant’s current lease, which commenced on January 11, 2001 and expires on January 31, 2016, requires total annual base rent payments of approximately $12,569,868 for approximately 232,099 SF of space. The 555 11th Street NW Mortgage Loan underwriting is based on the lease extension commencing on February 1, 2016. The tenant has three separate lease contraction options within its renewal lease exercisable prior to June 30, 2017, March 31, 2021 and April 30, 2026, respectively. The contraction options relate to space the tenant leases on the 5th and 7th floors of the 555 11th Street NW Property, totaling approximately 65,611 SF. The contraction options require payment from the tenant to the 555 11th Street NW Borrower of an amount equal to 50% of the then unamortized costs incurred in leasing any contracted space to the tenant. In addition, the tenant is entitled to a 100% rent abatement associated with the 5th floor space (33,979 SF) and a 30% rent abatement associated with all other leased space commencing on January 1, 2014 through December 31, 2015. Commencing on January 1, 2016, and ending on June 30, 2017, the tenant is entitled to a $1,298,735 rent abatement, which will be applied against the tenant’s total base rent obligations in equal monthly installments of approximately $72,152. The tenant is entitled to reimbursement from the 555 11th Street NW Borrower for certain tenant improvement expenditures totaling approximately $21,311,531, pursuant to its February 1, 2016 lease extension. The planned tenant improvement expenditures must take place no later than June 30, 2018. The tenant’s contractual remedy for non-reimbursement of such expenditures by the 555 11th Street NW Borrower is an equal reduction of contractual rental payments to the 555 11th Street NW Borrower. Reimbursement of such tenant improvement expenditures is guaranteed by Rockrose General Equities L.L.C. Rockrose General Equities L.L.C. reported that as of December 31, 2013, it had an estimated net worth exceeding $1 billion based on its internal value estimates for 15 properties in which it had indirect ownership interests and the related loan balances then in place. No reserve was taken at closing with respect to such tenant improvement obligations.
Latham & Watkins is a full-service global law firm specializing in transactional, litigation, corporate and regulatory areas. The firm has approximately 2,000 attorneys in over 30 offices around the world. The firm was founded in 1934 and had estimated revenue of approximately $2.29 billion in 2013. The firm is listed as #3 on the Am Law 100 Top Grossing Law Firms.
Landmark Theaters (40,000 SF, 10% of NRA, 4% of underwritten base rent). Silver Cinemas Acquisition Co. d/b/a Landmark Theaters (“Landmark”) leases 40,000 SF of subterranean theater space with a street level entrance at the 555 11th Street NW Property and operates it as the eight-screen “E Street Cinema,” specializing in first-run independent and foreign language films, documentary features and classic revivals. The lease began on January 15, 2004 and has a current expiration date of January 31, 2019. Landmark was founded in 1974 and currently operates 48 theaters with 226 screens. Landmark is part of the Wagner/Cuban Companies.
SmartBrief, Inc. (31,300 SF, 8% of NRA, 10% of underwritten base rent). SmartBrief, Inc. (“SmartBrief”) leases 31,300 SF at the 555 11th Street NW Property. The lease began on November 1, 2011 and has a current expiration date of March 31, 2017, with one five-year lease renewal option. SmartBrief is a business news targeting company that was founded in 1999.
American Cancer Society (24,307 SF, 6% of NRA, 8% of underwritten base rent). The American Cancer Society Action Network, Inc. (“ACS”) leases 24,307 SF at the 555 11th Street NW Property. The lease began on October 1, 2011 and has a current expiration date of October 31, 2021, with one five-year lease renewal option. ACS is a nationwide, community-based voluntary health organization dedicated to eliminating cancer as a major health problem. ACS is a not for profit, 501(c)(3) organization headquartered in Atlanta. ACS reported total 2013 revenues, including public support, of approximately $970.5 million, and total mission expenses of approximately $936.7 million.
This is not a research report and was not prepared by the Underwriters’ research departments. Please see additional important information and qualifications at the end of this Term Sheet. |
T-79
| MSBAM 2015-C22 | 555 11th Street NW |
The following table presents a summary regarding the largest tenants at the 555 11th Street NW Property:
| Tenant Summary | |||||||||
| Tenant Name | Credit Rating (Fitch/Moody’s/S&P) | Tenant SF | Approximate % of SF | Annual UW Rent | % of Total Annual UW Rent | Annual UW Rent PSF(1) | Lease Expiration | ||
| Anchor/Major Tenants | |||||||||
| Latham & Watkins LLP | NR/NR/NR | 240,593 | 58% | $11,953,662 | 71% | $49.68 | 1/31/2031(2) | ||
| Landmark Theaters | NR/NR/NR | 40,000 | 10% | $650,000 | 4% | $16.25 | 1/31/2019 | ||
| SmartBrief, Inc. | NR/NR/NR | 31,300 | 8% | $1,761,251 | 10% | $56.27 | 3/31/2017 | ||
| American Cancer Society | NR/NR/NR | 24,307 | 6% | $1,361,192 | 8% | $56.00 | 10/31/2021 | ||
| Subtotal/Wtd. Avg. | 336,200 | 81% | $15,726,105 | 93% | $46.78 | ||||
| Other Tenants | 16,805 | 4% | $1,206,583 | 7% | $71.80 | ||||
| Vacant Space | 61,199 | 15% | $0 | 0% | $0.00 | ||||
| Total/Wtd. Avg. | 414,204 | 100% | $16,932,688 | 100% | $47.97 | ||||
| (1) | Wtd. Avg. Annual UW Rent PSF Rolling excludes vacant space. |
| (2) | Latham & Watkins LLP has three lease contraction options totaling 65,611 SF exercisable prior to June 30, 2017, March 31, 2021 and April 30, 2026, respectively, as described above. |
The Market. The 555 11th Street NW Property is located in the East End submarket of Washington, D.C., approximately five blocks east of the White House. As of June 30, 2014, the East End submarket, with approximately 36.9 million SF of office inventory, had a total vacancy rate of 12.5% and an overall weighted average Class A asking rent of $62.34 PSF. There are two office buildings under construction in the submarket totaling approximately 589,466 SF. The overall Washington D.C. market, with approximately 107.9 million SF of office inventory, had a vacancy rate of 13.7% and an overall weighted average rent of $49.73 PSF. The Washington D.C. office market is heavily influenced by U.S. Federal Government and supporting business demand.
The following table presents comparable Washington D.C. Class A rental properties to the 555 11th Street NW Property:
| Competitive Property Summary | |||||||||||||
| Property Name/Location | Size (NSF) | Year Built | Stories | Tenant Name | Lease Date | Size (NSF) | Term (years) | Initial Rent PSF | Rent Steps | Months Free | TI/SF | ||
The Presidential Building 1111 Pennsylvania Avenue NW | 355,855 | 2001 | 12 | Morgan Lewis & Bockius LLP | Aug-14 | 268,000 | 15 | $47.50 | 2.50% | 0 | $100 | ||
The Warner 1299 Pennsylvania Avenue NW | 650,000 | 1992 | 13 | Cooley LLP (Expansion) | Aug-14 | 13,000 | 9 | $48.00 | 2.50% | 14 | N/A | ||
The Homer Building 601 13th Street NW | 448,426 | 1990 | 12 | Albright Stonebridge Group LLC | Apr-14 | 32,075 | 10 | $45.00 | 2.50% | 12 | $50 | ||
Liberty Place 325 7th Street NW | 149,959 | 1991 | 12 | National Grid | Apr-14 | 4,474 | 6 | $51.00 | 2.25% | 9 | $30 | ||
One Franklin Square 1301 K Street NW | 321,177 | 1990 | 12 | Reed Smith | Apr-14 | 79,546 | 12 | $42.00 | 2.50% | 12 | $90 | ||
600 13th 600 13th Street NW | 256,702 | 1997 | 12 | MetLife | Feb-14 | 14,000 | 10 | $45.00 | 2.50% | 12 | $100 | ||
Source: Appraisal
This is not a research report and was not prepared by the Underwriters’ research departments. Please see additional important information and qualifications at the end of this Term Sheet. |
T-80
| MSBAM 2015-C22 | 555 11th Street NW |
The following table presents certain information relating to the lease rollover schedule at the 555 11th Street NW Property:
Lease Rollover Schedule(1) | |||||||||
| Year | # of Leases Rolling | SF Rolling | UW Rent PSF Rolling(2) | Approx. % of Total SF Rolling | Approx. Cumulative % of SF Rolling | Total UW Rent Rolling | Approx. % of Total Rent Rolling | Approx. Cumulative % of Total Rent Rolling | |
| MTM | 0 | 0 | $0.00 | 0% | 0% | $0 | 0% | 0% | |
| 2014 | 0 | 0 | $0.00 | 0% | 0% | $0 | 0% | 0% | |
| 2015 | 2 | 6,220 | $72.63 | 2% | 2% | $451,743 | 3% | 3% | |
| 2016 | 0 | 0 | $0.00 | 0% | 2% | $0 | 0% | 3% | |
| 2017 | 1 | 31,300 | $56.27 | 8% | 9% | $1,761,251 | 10% | 13% | |
| 2018 | 0 | 0 | $0.00 | 0% | 9% | $0 | 0% | 13% | |
| 2019 | 1 | 40,000 | $16.25 | 10% | 19% | $650,000 | 4% | 17% | |
| 2020 | 0 | 0 | $0.00 | 0% | 19% | $0 | 0% | 17% | |
| 2021 | 2 | 26,967 | $58.43 | 7% | 25% | $1,575,575 | 9% | 26% | |
| 2022 | 1 | 1,650 | $80.50 | 0% | 26% | $132,825 | 1% | 27% | |
| 2023 | 1 | 4,850 | $64.95 | 1% | 27% | $315,008 | 2% | 29% | |
| 2024 | 1 | 1,425 | $65.00 | 0% | 27% | $92,625 | 1% | 29% | |
| 2025 | 0 | 0 | $0.00 | 0% | 27% | $0 | 0% | 29% | |
| 2026 | 0 | 0 | $0.00 | 0% | 27% | $0 | 0% | 29% | |
| 2027 & Beyond | 1 | 240,593 | $49.68 | 58% | 85% | $11,953,662 | 71% | 100% | |
| Vacant | 0 | 61,199 | $0.00 | 15% | 100% | $0 | 0% | 100% | |
| Total/Wtd. Avg. | 10 | 414,204 | $47.97 | 100% | $16,932,688 | 100% | |||
| (1) | Certain tenants have lease termination options that are exercisable prior to the originally stated expiration date of the related lease and that are not considered in the lease rollover schedule. |
| (2) | Wtd. Avg. UW Rent PSF Rolling excludes vacant space. |
Operating History and Underwritten Cash Flow. The following table presents certain information relating to the underwritten cash flow at the 555 11th Street NW Property:
| 2011 | 2012 | 2013 | 2014(1) | (1) | UW | UW PSF | ||||||
Base Rent(2) | $19,172,253 | $20,539,458 | $20,815,931 | N/A | $16,932,688 | $40.88 | ||||||
| Total Recoveries | $4,811,525 | $3,752,519 | $4,543,193 | N/A | $6,417,251 | $15.49 | ||||||
Other Income(3) | $1,599,060 | $1,266,296 | $1,159,168 | N/A | $1,165,975 | $2.81 | ||||||
| Discounts Concessions | ($394,369) | ($835,025) | $0 | N/A | $0 | $0.00 | ||||||
| Less Vacancy & Credit Loss | ($132,847) | $0 | $0 | N/A | $0 | $0.00 | ||||||
| Effective Gross Income | $25,055,621 | $24,723,248 | $26,518,293 | N/A | $24,515,915 | $59.19 | ||||||
| Total Expenses | $7,888,528 | $7,841,625 | $8,340,243 | N/A | $8,660,254 | $20.91 | ||||||
| Net Operating Income | $17,167,093 | $16,881,623 | $18,178,050 | N/A | $15,855,660 | $38.28 | ||||||
| Capital Expenditures | $1,835,999 | $923,773 | $115,831 | N/A | $103,551 | $0.25 | ||||||
| TI/LC | $1,125,239 | $268,803 | $0 | N/A | $261,705 | $0.63 | ||||||
Reserve Underwriting Offset(4) | $0 | $0 | $0 | N/A | ($365,256) | ($0.88) | ||||||
| Net Cash Flow | $14,205,855 | $15,689,047 | $18,062,219 | N/A | $15,855,660 | $38.28 | ||||||
| Occupancy % | 97.0% | 97.0% | 97.0% | N/A | 85.2% | (5) | ||||||
| NOI DSCR | 5.94x | 5.84x | 6.29x | N/A | 5.49x | |||||||
| NCF DSCR | 4.92x | 5.43x | 6.25x | N/A | 5.49x | |||||||
| NOI Debt Yield | 19.1% | 18.8% | 20.2% | N/A | 17.6% | |||||||
| NCF Debt Yield | 15.8% | 17.4% | 20.1% | N/A | 17.6% | |||||||
| (1) | The 555 11th Street NW Borrower purchased the 555 11th Street NW Property in October 2014. Historical financial operating statements were provided by the seller. The 555 11th Street NW Borrower indicates that property operating statements for the approximately first 10 months of 2014 were not provided by the seller. |
| (2) | Underwritten base rent reflects a lease renewal for the Latham & Watkins tenant effective February 1, 2016 and includes approximately $830,612 of averaged rent steps associated with the Latham & Watkins lease over the loan term. |
| (3) | Underwritten and other income primarily represents parking income. A parking management contract is in place at $1,100,000 per year. The current contract, with Colonial Parking, Inc., expires on June 30, 2017. |
| (4) | The 555 11th Street NW Borrower deposited $4,000,000 into a TI/LC reserve account at closing. This reserve is utilized as an offset to underwritten capital and TI/LC expenses over the 10-year loan term. |
| (5) | Two leases with the United States Government, totaling approximately 47,991 SF, expired on 12/31/2013. |
Escrows and Reserves. During a Trigger Period (as defined below), the 555 11th Street NW Borrower is required to escrow monthly 1/12 of the annual estimated tax payments and 1/12 of the annual estimated insurance premiums (unless the 555 11th Street NW Borrower maintains insurance under an acceptable blanket insurance policy). The 555 11th Street NW Borrower deposited in escrow at loan origination $4,000,000 for tenant improvements and
This is not a research report and was not prepared by the Underwriters’ research departments. Please see additional important information and qualifications at the end of this Term Sheet. |
T-81
| MSBAM 2015-C22 | 555 11th Street NW |
leasing commissions at the 555 11th Street NW Mortgaged Property with respect to the 61,199 rentable SF of space not occupied by tenants under leases as of closing.
Lockbox and Cash Management. A soft lockbox is in place with respect to the 555 11th Street NW Mortgage Loan. The 555 11th Street NW Mortgage Loan has springing cash management. Provided a Trigger Period has not commenced, funds in the lockbox account are swept daily to an account designated by the 555 11th Street NW Borrower. During the continuance of a Trigger Period, funds in the lockbox account are applied on each monthly payment date to pay debt service on the 555 11th Street NW Mortgage Loan (i) to fund the required reserves deposits as described above under “—Escrows and Reserves,” (ii) to disburse, provided no event of default on the 555 11th Street NW Mortgage Loan has occurred and is continuing, to the 555 11th Street NW Borrower the monthly amount payable for operating expenses referenced in the annual budget approved by lender, (iii) to pay, provided no event of default on the 555 11th Street NW Mortgage Loan has occurred and is continuing, debt service due on the 555 11th Street NW Mezzanine Loan (as defined below) (or, provided no event of default on the 555 11th Street NW Mortgage Loan has occurred and is continuing, if an event of default exists under the 555 11th Street NW Mezzanine Loan, to pay remaining available funds to the lender under the 555 11th Street NW Mezzanine Loan), and (iv) to remit, provided no event of default on the 555 11th Street NW Mezzanine Loan has occurred and is continuing, the remainder to an account to be held by the lender as additional security for the 555 11th Street NW Mortgage Loan.
A “Trigger Period” will (a) commence upon the occurrence of an event of default under the 555 11th Street NW Mortgage Loan and continue until such event of default is cured or (b) commence upon the occurrence of an event of default under the 555 11th Street NW Mezzanine Loan and continue until such event of default is cured. A Trigger Period event of default occurs only after any cure period has lapsed.
Additional Secured Indebtedness (not including trade debts). In addition to the 555 11th Street NW Mortgage Loan, the 555 11th Street NW Property also secures the 555 11th Street NW Non-Serviced Companion Loan, the 555 11th Street Senior B Note (which was included in the MSBAM 2015-C21 securitization trust and supports only the loan-specific securities issued in connection with that transaction) and the 555 11th Street Junior B Note (which will not be included in the MSBAM 2015-C22 securitization trust). The 555 11th Street NW Mortgage Loan, the 555 11th Street NW Non-Serviced Companion Loan, the 555 11th Street NW Senior B Note and the 555 11th Street NW Junior B Note accrue interest at rates equal to 3.16633333% per annum, 3.16633333% per annum, 3.16633333% per annum, and 4.99280702% per annum, respectively. The 555 11th Street NW Mortgage Loan is entitled to payments of interest and principal on a pro rata basis with the 555 11th Street NW Non-Serviced Companion Loan. Prior to an event of default, each of the promissory notes comprising the 555 11th Street NW Non-Serviced Loan Combination is entitled to payments of interest and principal on a pro rata basis with each of the other promissory notes comprising such Non-Serviced Loan Combination. After an event of default, the 555 11th Street NW Mortgage Loan and the 555 11th Street NW Non-Serviced Companion Loan will continue to be entitled to payments of interest and principal on a pro rata basis as between such notes; however, the 555 11th Street NW Mortgage Loan and the 555 11th Street NW Non-Serviced Companion Loan will be entitled to payments of interest and principal on a senior basis to the 555 11th Street NW Senior B Note and the 555 11th Street NW Junior B Note (and the 555 11th Street NW Senior B Note will be entitled to payments of interest and principal on a senior basis to the 555 11th Street NW Junior B Note). Such priorities and the allocation of collections on the 555 11th Street Non-Serviced Loan Combination are set forth in an agreement between note holders governing the promissory notes comprising the 555 11th Street NW Non-Serviced Loan Combination. See “Description of the Mortgage Pool—The Non-Serviced Loan Combinations—The 555 11th Street NW Non-Serviced Loan Combination” in the Free Writing Prospectus.
The following table presents certain information relating to the 555 11th Street NW Non-Serviced Loan Combination and the 555 11th Street NW Mezzanine Loan:
| Full Debt Summary | |||||||||
| Notes | Original Principal Balance | Interest Rate | Original Term to Maturity (mos.) | Original Amort. Term (mos.) | Original IO Term (mos.) | Total Debt UW NCF DSCR | Total Debt UW NOI Debt Yield | Total Debt Cut-off Date LTV | |
| Mortgage Loan | $30,000,000 | 3.16633333% | 120 | 0 | 120 | 5.49x | 17.6% | 29.1% | |
| Non-Serviced Companion Loan | $60,000,000 | 3.16633333% | 120 | 0 | 120 | 5.49x | 17.6% | 29.1% | |
| Senior B Note | $30,000,000 | 3.16633333% | 120 | 0 | 120 | 4.12x | 13.2% | 38.8% | |
Junior B Note(1) | $57,000,000 | 4.99280702% | 120 | 0 | 120 | 2.35x | 9.0% | 57.3% | |
| Mezzanine Loan | $50,000,000 | 5.550% | 120 | 0 | 120 | 1.66x | 7.0% | 73.5% | |
| Total/Wtd. Avg. | $227,000,000 | 4.150% | 120 | 0 | 120 | 1.66x | 7.0% | 73.5% | |
| (1) | The Junior B Note represents two notes with original principal balances of $32,000,000 and $25,000,000 and with interest rates of 4.870% and 5.150%, respectively. |
Mezzanine Loans and Preferred Equity. The “555 11th Street NW Mezzanine Loan” refers to a loan in the principal amount of $50,000,000 made by Morgan Stanley Bank, N.A. to 555 11th Mezz L.L.C. (the “555 11th Street NW Mezzanine Borrower”), secured by 100% of the direct or indirect equity interest in the 555 11th Street NW Borrower and put in place simultaneously with the origination of the 555 11th Street NW Non-Serviced Loan Combination. The 555 11th Street NW Mezzanine Loan was subsequently transferred to 555 11th Street Mezz Lender LLC (the “555 11th Street NW Mezzanine Lender”), an affiliate of J.P. Morgan Asset Management. The 555 11th Street NW Mezzanine Loan and the 555 11th Street NW Non-Serviced Loan Combination are subject to an intercreditor agreement between the 555 11th Street NW Non-Serviced Loan Combination lender and the 555 11th Street NW Mezzanine Lender.
In addition, a single junior mezzanine financing (such financing, the “Permitted Junior Mezzanine Financing”) is permitted subject to various conditions, including amongst other conditions: (i) no default or event of default exists, (ii) the principal amount of the Permitted Junior Mezzanine Financing will not result in an aggregate LTV ratio (including the 555 11th Street NW Mortgage Loan and the 555 11th Street NW Mezzanine Loan) greater than 65% (based upon a new appraisal dated no more than 30 days before the closing of the Permitted Junior Mezzanine Financing) or an aggregate DSCR (including the 555 11th Street NW Mortgage Loan and the 555 11th Street NW Mezzanine Loan) less than 1.25x, (iii) the collateral for the Permitted Junior Mezzanine Financing is a pledge of 100% of the direct or indirect ownership interests in the 555 11th Street NW Mezzanine Borrower, (iv) the junior mezzanine lender shall be an entity which satisfies the definition of a “Qualified Mezzanine Lender” (as set forth in the loan documents for the 555 11th Street NW Non-Serviced Loan Combination) and shall enter into an intercreditor agreement reasonably acceptable to the lender under the 555 11th Street NW Non-Serviced Loan Combination, (v) the term of the Permitted Junior Mezzanine Financing is at least co-terminus with the 555 11th Street NW Non-Serviced Loan Combination and all other terms and provisions of the Permitted Junior Mezzanine Financing, including the loan documents, are
This is not a research report and was not prepared by the Underwriters’ research departments. Please see additional important information and qualifications at the end of this Term Sheet. |
T-82
| MSBAM 2015-C22 | 555 11th Street NW |
reasonably acceptable to the lender under the 555 11th Street NW Mortgage Loan, (vi) if the Permitted Junior Mezzanine Financing is a floating rate loan, the borrower shall purchase an interest rate cap with a notional amount equal to the original principal balance of the Permitted Junior Mezzanine Financing and a strike price such that the aggregate DSCR (including the 555 11th Street NW Non-Serviced Loan Combination and the 555 11th Street NW Mezzanine Loan) is not less than 1.25x and (vii) 555 11th Street NW Borrower shall deliver a rating agency confirmation as to the Permitted Junior Mezzanine Financing and, if required by the lender under the 555 11th Street NW Non-Serviced Loan Combination, an updated substantive non-consolidation legal opinion.
Release of Property. Not permitted.
Terrorism Insurance. Generally, the 555 11th Street NW Borrower is required to obtain insurance against acts of terrorism or other similar acts or events to the extent such insurance is available in form and substance reasonably satisfactory to the lender in an amount determined by the lender for the 555 11th Street NW Mortgage Loan in its sole discretion (but not more than an amount equal to the sum of 100% of hard replacement costs and 12 months business interruption insurance). Notwithstanding the foregoing, (x) for so long as the Terrorism Risk Insurance Program Reauthorization Act of 2007 (“TRIPRA”) (or any extension thereof or other federal government program with substantially similar protection) is in effect, the 555 11th Street NW Borrower is required to maintain, and lender is required to accept, terrorism insurance which covers “covered acts” (as defined by such statute or other program), as full compliance as it relates to the risks required to be covered pursuant to the preceding sentence and (y) 555 11th Street NW Borrower is not required to pay annual premiums in excess of $240,000 for the coverage required under this paragraph (and if the annual premiums for the coverage required under this paragraph exceed such amount, then the 555 11th Street NW Borrower will only be required to purchase the maximum amount of terrorism insurance available for such amount of funds).
This is not a research report and was not prepared by the Underwriters’ research departments. Please see additional important information and qualifications at the end of this Term Sheet. |
T-83
| MSBAM 2015-C22 | Columbus Commons |
Mortgage Loan No. 9 – Columbus Commons
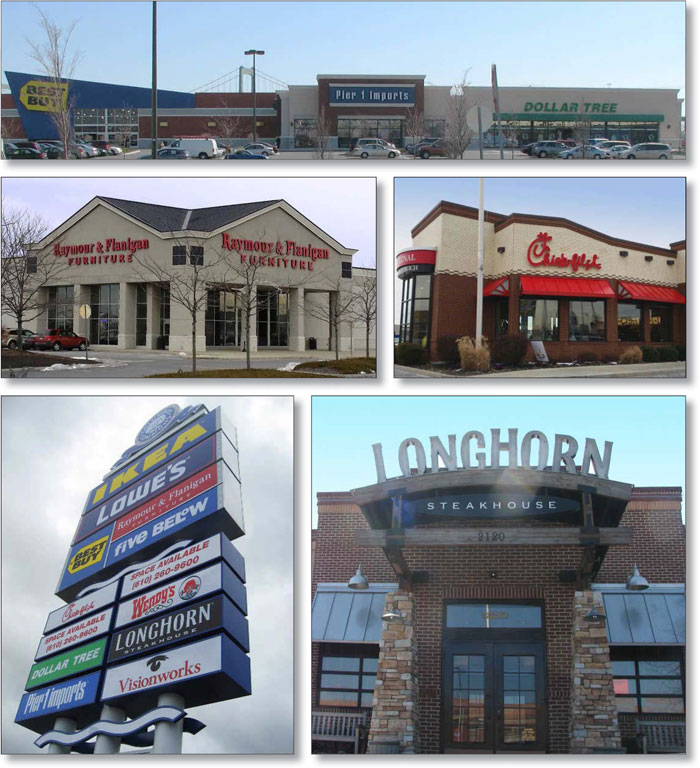
| This is not a research report and was not prepared by the Underwriters’ research departments. Please see additional important information and qualifications at the end of this Term Sheet. |
T-84
| MSBAM 2015-C22 | Columbus Commons |
Mortgage Loan No. 9 – Columbus Commons
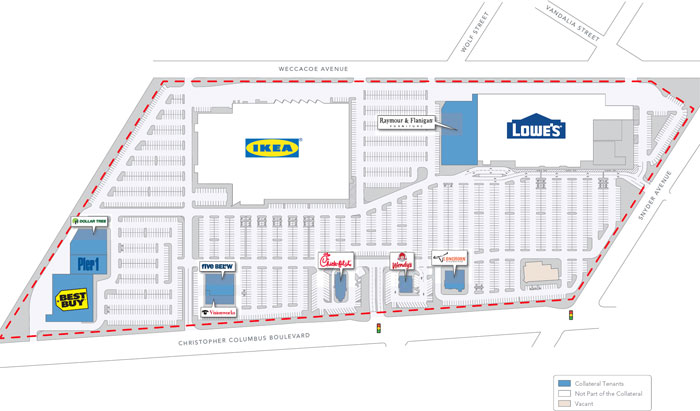
| This is not a research report and was not prepared by the Underwriters’ research departments. Please see additional important information and qualifications at the end of this Term Sheet. |
T-85
| MSBAM 2015-C22 | Columbus Commons |
Mortgage Loan No. 9 – Columbus Commons
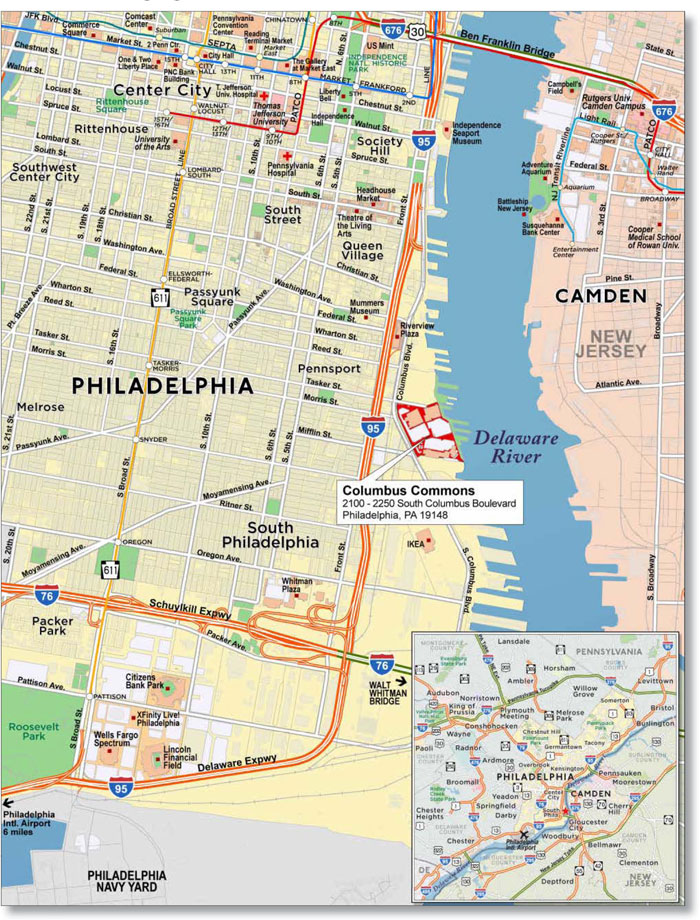
| This is not a research report and was not prepared by the Underwriters’ research departments. Please see additional important information and qualifications at the end of this Term Sheet. |
T-86
| MSBAM 2015-C22 | Columbus Commons |
| Mortgage Loan No. 9 – Columbus Commons |
| Mortgage Loan Information | Mortgaged Property Information | ||||||
| Mortgage Loan Seller: | CIBC | Single Asset/Portfolio: | Single Asset | ||||
| Original Balance: | $28,200,000 | Location: | Philadelphia, PA 19148 | ||||
| Cut-off Date Balance: | $28,200,000 | General Property Type: | Retail | ||||
| % of Initial Pool Balance: | 2.5% | Detailed Property Type: | Anchored | ||||
| Loan Purpose: | Refinance | Title Vesting: | Fee | ||||
| Sponsor: | Kenneth N. Goldenberg | Year Built/Renovated: | 2004/N/A | ||||
| Mortgage Rate: | 4.140% | Size: | 124,443 SF | ||||
| Note Date: | 3/2/2015 | Cut-off Date Balance per Unit: | $227 | ||||
| First Payment Date: | 5/1/2015 | Maturity Date Balance per Unit: | $181 | ||||
| Maturity Date: | 4/1/2025 | Property Manager: | Goldenberg Management, Inc. (borrower related) | ||||
| Original Term to Maturity: | 120 months | ||||||
| Original Amortization Term: | 360 months | Underwriting and Financial Information | |||||
| IO Period: | 0 months | UW NOI: | $2,218,549 | ||||
| Seasoning: | 0 months | UW NOI Debt Yield: | 7.9% | ||||
| Prepayment Provisions: | LO (24); DEF (92); O (4) | UW NOI Debt Yield at Maturity: | 9.8% | ||||
| Lockbox/Cash Mgmt Status: | Hard/Springing | UW NCF DSCR: | 1.31x | ||||
| Additional Debt Type: | N/A | Most Recent NOI: | $2,102,872 (12/31/2014) | ||||
| Additional Debt Balance: | N/A | 2nd Most Recent NOI: | |||||
| Future Debt Permitted (Type): | Yes (Mezzanine) | 3rd Most Recent NOI: | $2,577,423 (12/31/2012) | ||||
Reserves(1) | Most Recent Occupancy: | 92.9% (2/25/2015) | |||||
| Type | Initial | Monthly | Cap | 2nd Most Recent Occupancy: | 100.0% (12/31/2013) | ||
| RE Tax: | $54,519 | $18,173 | N/A | 3rd Most Recent Occupancy: | 100.0% (12/31/2012) | ||
| Insurance: | $0 | Springing | N/A | Appraised Value (as of): | $37,600,000 (11/25/2014) | ||
| Recurring Replacements: | $0 | $1,556 | N/A | Cut-off Date LTV Ratio: | 75.0% | ||
| TI/LC: | $0 | $6,250 | $300,000 | Maturity Date LTV Ratio: | 60.0% | ||
| Other: | $250,000 | Springing | Various | ||||
| Sources and Uses | |||||||
| Sources | Proceeds | % of Total | Uses | Proceeds | % of Total | ||
| Loan Amount: | $28,200,000 | 100.0% | Loan Payoff: | $20,938,757 | 74.3% | ||
| Reserves: | $304,519 | 1.1% | |||||
| Closing Costs: | $508,553 | 1.8% | |||||
| Return of Equity: | $6,448,171 | 22.9% | |||||
| Total Sources: | $28,200,000 | 100.0% | Total Uses: | $28,200,000 | 100.0% | ||
| (1) | See “—Escrows and Reserves” below for further discussion of reserve requirements. |
The Mortgage Loan. The ninth largest mortgage loan (the “Columbus Commons Mortgage Loan”) is evidenced by a promissory note in the original principal balance of $28,200,000 secured by a first priority fee mortgage encumbering a 124,443 SF anchored retail center in Philadelphia, Pennsylvania (the “Columbus Commons Property”). The proceeds of the Columbus Commons Mortgage Loan were used to pay off existing debt which was included in the GMACC 2005-C1 transaction, fund upfront reserves, pay closing costs and return equity to the Columbus Commons Borrower (as defined below).
The Borrower and the Sponsor. The borrower is Delaware East Associates, L.P., a single-purpose Pennsylvania limited partnership, with one independent director (the “Columbus Commons Borrower”). Kenneth N. Goldenberg, the Columbus Commons Mortgage Loan sponsor and nonrecourse carve-out guarantor, indirectly controls and owns the majority of the Columbus Commons Borrower. Mr. Goldenberg is the founder, president and chief executive officer of The Goldenberg Group Inc., an integrated and diversified real estate development company based in Pennsylvania which has developed, owns and manages over seven million SF of commercial space.
The Property. The Columbus Commons Property is a 124,443 SF, seven-building anchored retail center in Philadelphia, Pennsylvania, located approximately four miles south of Center City Philadelphia. The Columbus Commons Property is situated on an approximately 13.7 acre parcel of land and was originally developed by an affiliate of the Columbus Commons Borrower in 2004. The Columbus Commons Property is shadow anchored by a 311,185 IKEA and a 161,713 SF Lowe’s Home Improvement Store, both of which purchased their respective pad sites from the developer in 2002. Major tenants at the Columbus Commons Property include Raymour & Flanigan, Best Buy, Dollar Tree, Pier 1 Imports and Five Below. As of February 25, 2015, the Columbus Commons Property was 92.9% occupied.
Major Tenants.
Raymour & Flanigan (35,308 SF, 28% of NRA, 27% of underwritten rent). Raymours Furniture Company, Inc. (“Raymour & Flanigan”) leases 35,308 SF at the Columbus Commons Property. The lease began on October 22, 2004 and has a current expiration date of October 31, 2019, with three five-year lease renewal options. Raymour & Flanigan is a family owned and operated furniture store founded in 1947, with 107 locations in New York,
| This is not a research report and was not prepared by the Underwriters’ research departments. Please see additional important information and qualifications at the end of this Term Sheet. |
T-87
| MSBAM 2015-C22 | Columbus Commons |
Connecticut, Rhode Island, New Jersey and Pennsylvania. Raymour & Flanigan reported 2014 sales of $296 PSF at the Columbus Commons Property, which equates to an occupancy cost of 7%.
Best Buy (30,144 SF, 24% of NRA, 24% of underwritten rent). Best Buy Stores, L.P. (“Best Buy”) leases 30,144 SF at the Columbus Commons Property. The lease began on November 1, 2004 and has a current expiration date of October 31, 2019, with two five-year and one four-year-and-10-months lease renewal options. Best Buy has the option to terminate its lease as of January 31 of the last lease year of the original lease term or any extension upon providing 60 days prior written notice. Best Buy’s lease is guaranteed by its parent company, Best Buy Co., Inc. (NYSE: BBY), a multinational retailer of consumer electronics, home office products, entertainment software, appliances and related services through its retail stores as well as its web site.
Dollar Tree (13,557 SF, 11% of NRA, 11% of underwritten rent). Dollar Tree Stores, Inc. (“Dollar Tree”) leases 13,557 SF at the Columbus Commons Property. The lease began on May 25, 2006 and has a current expiration date of May 31, 2016, with two five-year lease renewal options. Dollar Tree (NASDAQ: DLTR) operates a discount variety store chain, offering a variety of merchandise at the $1 price point. As of January 31, 2015, the company operated over 5,000 stores across the United States and Canada.
Pier 1 Imports (10,771 SF, 9% of NRA, 11% of underwritten rent). Pier 1 Imports (U.S.), Inc. (“Pier 1 Imports”) leases 10,771 SF at the Columbus Commons Property. The lease began on November 7, 2004 and in 2014, was extended to February 28, 2020. Pier 1 Imports currently has one five-year lease renewal option remaining. Pier 1 Imports’ parent company, Pier 1 Imports, Inc. (NYSE: PIR) is a retailer of decorative home furnishings, gifts and related items and, as of November 29, 2014, operated 1,074 stores in the United States and Canada.
Five Below (8,958 SF, 7% of NRA, 5% of underwritten rent). Five Below, Inc. (“Five Below”) leases 8,958 SF at the Columbus Commons Property. The lease began on November 5, 2009 and has a current expiration date of January 31, 2020, with two five-year lease renewal options. Five Below (NASDAQ: FIVE) is a specialty value retailer which offers products such as crafts, party, candy, sports, media and seasonal products geared toward the teen and pre-teen market at a price point between $1 to $5. As of November 1, 2014, Five Below operated 365 stores in the 21 states in the United States.
The following table presents a summary regarding major tenants at the Columbus Commons Property:
Tenant Summary(1) | |||||||||||
| Tenant Name | Credit Rating (Fitch/ Moody’s/ S&P)(2) | Tenant SF | Approximate % of SF | Annual UW Rent | % of Total Annual UW Rent | Annual UW Rent PSF | Lease Expiration | Concluded Market Rent(3) | 2014 Sales PSF | Occupancy Cost | |
| Anchor/Major Tenants | |||||||||||
| Raymour & Flanigan | NR/NR/NR | 35,308 | 28% | $670,852 | 27% | $19.00 | 10/31/2019 | $20.00 | $296 | 7% | |
| Best Buy | BB/Baa2/BB | 30,144 | 24% | $585,095 | 24% | $19.41 | 1/31/2019(4) | $20.00 | N/A | N/A | |
| Dollar Tree | NR/Ba2/BB | 13,557 | 11% | $271,140 | 11% | $20.00 | 5/31/2016 | $22.00 | $200 | 11% | |
| Pier 1 Imports | NR/NR/B+ | 10,771 | 9% | $260,658 | 11% | $24.20 | 2/28/2020 | $24.00 | $208 | 13% | |
| Five Below | NR/NR/NR | 8,958 | 7% | $125,412 | 5% | $14.00 | 1/31/2020 | $22.00 | N/A | N/A | |
| Subtotal/Wtd. Avg. | 98,738 | 79% | $1,913,157 | 78% | $19.38 | ||||||
| Other Tenants | |||||||||||
| Longhorn Steakhouse | 5,544 | 4% | $145,197 | 6% | $26.19 | 12/31/2019 | $35.00 | $693 | 4% | ||
| Chick-Fil-A | 4,294 | 3% | $133,114 | 5% | $31.00 | 12/31/2024 | $35.00 | $1,022(5) | 3% | ||
| Visionworks | 3,907 | 3% | $136,745 | 6% | $35.00 | 8/31/2022 | $35.00 | $276 | 14% | ||
| Wendy’s | 3,100 | 2% | $117,614 | 5% | $37.94 | 12/31/2015 | $45.00 | $474 | 9% | ||
| Subtotal/Wtd. Avg. | 16,845 | 14% | $532,670 | 22% | $31.62 | ||||||
| Vacant Space | 8,860 | 7% | $0 | 0% | $0.00 | $20.00 | N/A | N/A | |||
Total/Wtd. Avg.(6) | 124,443 | 100% | $2,445,828 | 100% | $21.16 | ||||||
| (1) | Information is based on the underwritten rent roll. |
| (2) | Certain ratings are those of the parent company whether or not the parent guarantees the lease. |
| (3) | Source: Appraisal |
| (4) | Best Buy has the option to terminate its lease as of January 31st of the last lease year of the original lease term or any extension upon providing 60 days prior written notice. The stated lease expiration date is October 31, 2019. |
| (5) | Sales PSF as of 2013 |
| (6) | Wtd. Avg. Annual UW Rent PSF excludes vacant space. |
| This is not a research report and was not prepared by the Underwriters’ research departments. Please see additional important information and qualifications at the end of this Term Sheet. |
T-88
| MSBAM 2015-C22 | Columbus Commons |
The following table presents certain information relating to the lease rollover schedule at the Columbus Commons Property:
Lease Rollover Schedule(1)(2) | |||||||||
| Year | # of Leases Rolling | SF Rolling | UW Rent PSF Rolling(3) | Approx. % of Total SF Rolling | Approx. Cumulative % of SF Rolling | Total UW Rent Rolling | Approx. % of Total UW Rent Rolling | Approx. Cumulative % of Total UW Rent Rolling | |
| 2015 | 1 | 3,100 | $37.94 | 2% | 2% | $117,614 | 5% | 5% | |
| 2016 | 1 | 13,557 | $20.00 | 11% | 13% | $271,140 | 11% | 16% | |
| 2017 | 0 | 0 | $0.00 | 0% | 13% | $0 | 0% | 16% | |
| 2018 | 0 | 0 | $0.00 | 0% | 13% | $0 | 0% | 16% | |
| 2019 | 3 | 70,996 | $19.74 | 57% | 70% | $1,401,144 | 57% | 73% | |
| 2020 | 2 | 19,729 | $19.57 | 16% | 86% | $386,070 | 16% | 89% | |
| 2021 | 0 | 0 | $0.00 | 0% | 86% | $0 | 0% | 89% | |
| 2022 | 1 | 3,907 | $35.00 | 3% | 89% | $136,745 | 6% | 95% | |
| 2023 | 0 | 0 | $0.00 | 0% | 89% | $0 | 0% | 95% | |
| 2024 | 1 | 4,294 | $31.00 | 3% | 93% | $133,114 | 5% | 100% | |
| 2025 | 0 | 0 | $0.00 | 0% | 93% | $0 | 0% | 100% | |
| 2026 & Beyond | 0 | 0 | $0.00 | 0% | 93% | $0 | 0% | 100% | |
| Vacant | 0 | 8,860 | $0.00 | 7% | 100% | $0 | 0% | 100% | |
| Total/Wtd. Avg. | 9 | 124,443 | $21.16 | 100% | $2,445,828 | 100% | |||
| (1) | Information is based on the underwritten rent roll. |
| (2) | Certain tenants may have lease termination options that are exercisable prior to the originally stated expiration date of the subject lease that are not considered in the lease rollover schedule. |
| (3) | Wtd. Avg. UW Rent PSF Rolling excludes vacant space. |
The Market. The Columbus Commons Property is located in the South Philadelphia retail submarket of the Philadelphia Metro retail market, approximately four miles south of Center City Philadelphia. Center City includes the central business district and central neighborhoods of Philadelphia. As of 2010, the residential population in Center City was the third most populous downtown in the United States, behind New York and Chicago. Land uses in the immediate vicinity of the Columbus Commons Property include a mix of residential, commercial and recreational uses. Casino Revolution is an estimated $428 million project that is planned approximately two miles southwest of the Columbus Commons Property. In addition, approximately three miles from the Columbus Commons Property are Philadelphia’s primary professional sports arenas consisting of Lincoln Financial Field (NFL: Eagles), Citizens Bank Park (MLB: Phillies) and the Wells Fargo Center (NBA: 76ers, NHL: Flyers). In addition, approximately four miles from the Columbus Commons Property is the 1,200-acre Philadelphia Navy Yard, which is home to 145 companies and 11,000 employees in the office, industrial/manufacturing and research and development sectors.
Primary access to the area surrounding the Columbus Commons Property is provided by I-95, I-76 and Christopher Columbus Boulevard. I-95 is a major north-south interstate highway that connects Philadelphia with New York City and Boston to the north and Baltimore and Washington D.C. to the south. I-76 offers access to the western portion of the central business district and the western suburbs of Philadelphia. I-95 and I-76 intersect one mile from the Columbus Commons Property, offering convenient highway access to the market area. Columbus Boulevard offers local, north-south linkage along Philadelphia’s eastern perimeter. The Columbus Commons Property is located at the traffic signaled intersection of Snyder Avenue and Columbus Boulevard which, according to an industry report, has average daily traffic counts of 9,000 and 8,700 vehicles respectively.
According to an industry report, as of year-end 2014, the South Philadelphia retail submarket consisted of 13.2 million SF with a vacancy rate of 3.5%. The appraiser identified six retail properties that were considered primary competition to the Columbus Commons Property which were all fully occupied. The appraiser conducted a survey of recent comparable leases and found that annual in-place rents for junior box and large freestanding space (Raymour & Flanigan, Best Buy, vacant space) ranged from $14.00 PSF to $41.00 PSF. Annual in-place rents for large in-line space (Dollar Tree, Five Below) ranged from $15.00 PSF to $23.50 PSF. Annual in-place rents for ground leases (Chick-fil-A, Wendy’s, Longhorn Steakhouse) ranged from $19.88 PSF to $26.78 PSF. The appraiser concluded to a vacancy and collection loss factor of 5.0%, excluding ground leases given the ground leased tenants’ capital investments in their buildings.
According to an industry report, the estimated 2014 population within the Philadelphia metropolitan statistical area was approximately 6 million people and 2014 estimated median household income was $60,770.
| This is not a research report and was not prepared by the Underwriters’ research departments. Please see additional important information and qualifications at the end of this Term Sheet. |
T-89
| MSBAM 2015-C22 | Columbus Commons |
The following table presents recent occupancy at six primary competitive centers to the Columbus Commons Property:
| Competitive Property Summary | ||||||||
| Property Name | Address | Year Built | Year Reno. | Size (SF) | Occupancy | Major Tenants | ||
Columbus Crossing | 2106 S. Christopher Columbus Blvd. Philadelphia, PA | 2004 | N/A | 480,600 | 100% | Walmart, Home Depot | ||
Quartermaster Plaza | 2200 W. Oregon Avenue Philadelphia, PA | 2004 | N/A | 369,728 | 100% | Home Depot, BJ’s Wholesale | ||
South Philadelphia Shopping Center | 2301 W. Oregon Avenue Philadelphia, PA | 1950 | 2003 | 283,415 | 100% | ShopRite Supermarket | ||
River View Shopping Center | 1100 S. Columbus Blvd. Philadelphia, PA | 1991 | N/A | 198,197 | 100% | United Artist, Avalon Carpet & Tile | ||
Snyder Plaza East | 1 Mifflin Street Philadelphia, PA | 1975 | N/A | 247,520 | 100% | Target, ShopRite Supermarket | ||
Whiteman Plaza | 424 W. Oregon Avenue Philadelphia, PA | 1980 | N/A | 279,728 | 100% | Big Kmart, Pathmark, Burlington Coat Factory | ||
Source: Appraisal
Operating History and Underwritten Cash Flow. The following table presents certain information relating to the underwritten cash flow at the Columbus Commons Property:
| 2009 | 2010 | 2011 | 2012 | 2013 | 2014 | UW | UW PSF | ||||||||||
Base Rent(1) | $2,244,248 | $2,503,683 | $2,542,081 | $2,559,429 | $2,583,981 | $2,417,365 | $2,445,828 | $19.65 | |||||||||
Vacant Rent(2) | $0 | $0 | $0 | $0 | $0 | $0 | $177,200 | $1.42 | |||||||||
| Total Recoveries | $638,010 | $655,533 | $644,483 | $629,047 | $497,247 | $444,625 | $483,934 | $3.89 | |||||||||
| Other Income | $4,070 | ($7,342) | $7 | $39,704 | $65,011 | $31,868 | $0 | $0.00 | |||||||||
Vacancy & Credit Loss(3) | $0 | $0 | $0 | $0 | $0 | $0 | ($229,014) | ($1.84) | |||||||||
| Effective Gross Income | $2,886,328 | $3,151,874 | $3,186,571 | $3,228,180 | $3,146,239 | $2,893,858 | $2,877,947 | $23.13 | |||||||||
| Total Operating Expenses | $690,217 | $827,426 | $764,980 | $650,757 | $643,742 | $790,986 | $659,399 | $5.30 | |||||||||
| Net Operating Income | $2,196,111 | $2,324,448 | $2,421,591 | $2,577,423 | $2,502,497 | $2,102,872 | $2,218,549 | $17.83 | |||||||||
| Capital Expenditures | $0 | $0 | $0 | $9,753 | $0 | $0 | $18,666 | $0.15 | |||||||||
| TI/LC | $0 | $0 | $0 | $76,733 | $0 | $0 | $50,026 | $0.40 | |||||||||
| Net Cash Flow | $2,196,111 | $2,324,448 | $2,421,591 | $2,490,937 | $2,502,497 | $2,102,872 | $2,149,856 | $17.28 | |||||||||
| Occupancy % | 96.9% | 100.0% | 100.0% | 100.0% | 100.0% | 92.9% | 92.6% | (5) | |||||||||
| NOI DSCR | 1.34x | 1.41x | 1.47x | 1.57x | 1.52x | 1.28x | 1.35x | ||||||||||
| NCF DSCR | 1.34x | 1.41x | 1.47x | 1.52x | 1.52x | 1.28x | 1.31x | ||||||||||
| NOI Debt Yield | 7.8% | 8.2% | 8.6% | 9.1% | 8.9% | 7.5% | 7.9% | ||||||||||
| NCF Debt Yield | 7.8% | 8.2% | 8.6% | 8.8% | 8.9% | 7.5% | 7.6% | ||||||||||
| (1) | Rents in Place based on leases in place. |
| (2) | UW Vacant Rent based on the appraiser’s concluded annual market rent of $20 PSF for the vacant pad site. |
| (3) | Vacancy & Credit Loss and UW Occupancy % are based on the actual economic vacancy of 7.4%. |
Escrows and Reserves. The Columbus Commons Borrower deposited $54,519 in escrow for annual real estate taxes at loan origination and is required to escrow 1/12 of the annual estimated tax payments monthly. In the event that an event of default has occurred and is continuing or the Columbus Commons Borrower fails to maintain an acceptable blanket insurance policy, the Columbus Commons Borrower will be required to escrow 1/12 of the annual estimated insurance premiums monthly. The Columbus Commons Borrower is required to make monthly deposits of $1,556 for replacement reserves. The Columbus Commons Borrower is required to make monthly deposits of $6,250 for TI/LC reserves, provided that such deposits are not required at any time that the amount then on deposit in the TI/LC reserve exceeds $300,000.
In addition, at loan origination, the Columbus Commons Borrower deposited $250,000 into a reserve (the “Lease-up Reserve”). In the event that there exist no funds in the TI/LC reserve, so long as no event of default is continuing, the lender will disburse to the Columbus Commons Borrower from the Lease-up Reserve the amount paid or incurred by the Columbus Commons Borrower as leasing costs subject to the terms of the Columbus Commons Mortgage Loan documents. Provided that (x) no event of default is continuing and (y) both the Best Buy and Raymour & Flanigan leases have been extended or replaced, the lender is required to disburse all of the funds in the Lease-up Reserve as follows: (i) first, to the TI/LC reserve until the TI/LC reserve balance is equal to $300,000, and then (ii) the remainder of the funds to the Columbus Commons Borrower.
During a Raymour & Flanigan Lease Sweep Period (as defined below), excess cash flow will be swept into a reserve (the “Raymour & Flanigan Lease Sweep Reserve”). So long as no default is continuing, the lender is required to disburse to the Columbus Commons Borrower the amount paid or incurred as leasing costs in connection with the extension or replacement of the lease for the Raymour & Flanigan space. Provided no default exists and no other Cash Management Period (as defined below) is continuing, following the end of a Raymour & Flanigan Lease Sweep Period, the lender is
| This is not a research report and was not prepared by the Underwriters’ research departments. Please see additional important information and qualifications at the end of this Term Sheet. |
T-90
| MSBAM 2015-C22 | Columbus Commons |
required to return the remaining funds in the Raymour & Flanigan Lease Sweep Reserve to the Columbus Commons Borrower so long as all leasing costs have been paid in full.
A “Raymour & Flanigan Lease Sweep Period” will commence on the date which is 12 months prior to the expiration of the Raymour & Flanigan lease or any replacement lease, provided that Raymour & Flanigan has not already extended its lease for at least five years and will end upon (x) Raymour & Flanigan extending its lease for at least five years, (y) the Columbus Commons Borrower leasing the Raymour & Flanigan space to a third party tenant or tenants on terms reasonably acceptable to the lender for at least five years and the replacement tenant or tenants paying full unabated rent, among other conditions or (z) the amount on deposit in the Raymour & Flanigan Lease Sweep Reserve reaching $706,160.
��
During a Best Buy Lease Sweep Period (as defined below), excess cash flow will be swept into a reserve (the “Best Buy Lease Sweep Reserve”). So long as no default is continuing, the lender is required to disburse to the Columbus Commons Borrower the amount paid or incurred as leasing costs in connection with the extension or replacement of the lease for the Best Buy space. Provided no default exists and no other Cash Management Period is continuing, following the end of a Best Buy Lease Sweep Period, the lender is required to return the remaining funds in the Best Buy Lease Sweep Reserve to the Columbus Commons Borrower so long as all leasing costs have been paid in full.
A “Best Buy Lease Sweep Period” will commence upon each occurrence of the following, provided that Best Buy has not already extended its lease for at least five years: (i) the date which is 12 months prior to the expiration of the Best Buy lease or any replacement lease or (ii) the date which is 12 months prior to January 31 of any last Lease Year (as defined in the Best Buy lease) of the Best Buy lease. A Best Buy Lease Sweep Period will end upon (x) Best Buy extending its lease for at least five years, (y) the Columbus Commons Borrower leasing the Best Buy space to a third party tenant or tenants on terms reasonably acceptable to the lender for at least five years and the replacement tenant or tenants paying full unabated rent, among other conditions, or (z) the amount on deposit in the Best Buy Lease Sweep Reserve reaching $602,880.
Lockbox and Cash Management. A hard lockbox is in place with respect to the Columbus Commons Mortgage Loan. The Columbus Commons Mortgage Loan has springing cash management. Provided a Cash Management Period has not commenced, funds in the lockbox account are swept daily to an account designated by the Columbus Commons Borrower. During the continuance of a Cash Management Period, funds in the lockbox account are applied on each monthly payment date to pay debt service on the Columbus Commons Mortgage Loan, to fund the required reserves deposits as described above under “—Escrows and Reserves,” to disburse to the Columbus Commons Borrower the amount of monthly operating expenses (not otherwise paid or reserved for in the required reserves) referenced in an annual budget approved by lender together with other amounts incurred by the Columbus Commons Borrower in connection with the operation and maintenance of the Columbus Commons Mortgaged Property approved by lender, and to remit the remainder to an account to be held by the lender as additional security for the Columbus Commons Mortgage Loan.
A “Cash Management Period” will:
(i) commence upon the occurrence of an event of default and continue until lender’s acceptance of the cure of such event of default; or
(ii) commence upon the debt service coverage ratio being less than 1.15x for two consecutive calendar quarters and continue until the debt service coverage ratio has been not less than 1.15x for two consecutive calendar quarters; or
(iii) commence upon the debt yield being less than 6.4% for two consecutive calendar quarters and continue until the debt yield has been not less than 6.4% for two consecutive calendar quarters; or
(iv) exist during a Raymour & Flanigan Lease Sweep Period; or
(v) exist during a Best Buy Lease Sweep Period.
Additional Secured Indebtedness (not including trade debts). Not permitted.
Mezzanine Loan and Preferred Equity. Future mezzanine debt is permitted, subject to certain conditions, including, but not limited to, the combined debt service coverage ratio being not less than 1.15x, the combined debt yield being not less than 8.25%, the combined loan-to-value ratio being not more than 80% and the mezzanine lender entering into an intercreditor agreement acceptable to lender and the rating agencies.
Release of Property. Not permitted.
Terrorism Insurance. The Columbus Commons Borrower is required to obtain and maintain property insurance, public liability insurance and rental loss and/or business interruption insurance that covers perils of terrorism and acts of terrorism, both foreign and domestic.
| This is not a research report and was not prepared by the Underwriters’ research departments. Please see additional important information and qualifications at the end of this Term Sheet. |
T-91
| MSBAM 2015-C22 | Ayrsley Town Center |
Mortgage Loan No. 10 – Ayrsley Town Center
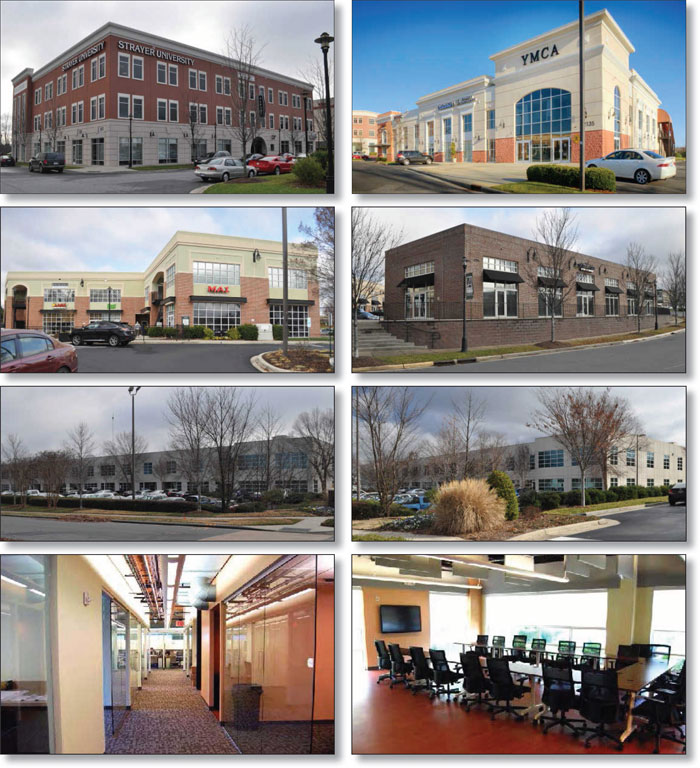
| This is not a research report and was not prepared by the Underwriters’ research departments. Please see additional important information and qualifications at the end of this Term Sheet. |
T-92
| MSBAM 2015-C22 | Ayrsley Town Center |
Mortgage Loan No. 10 – Ayrsley Town Center
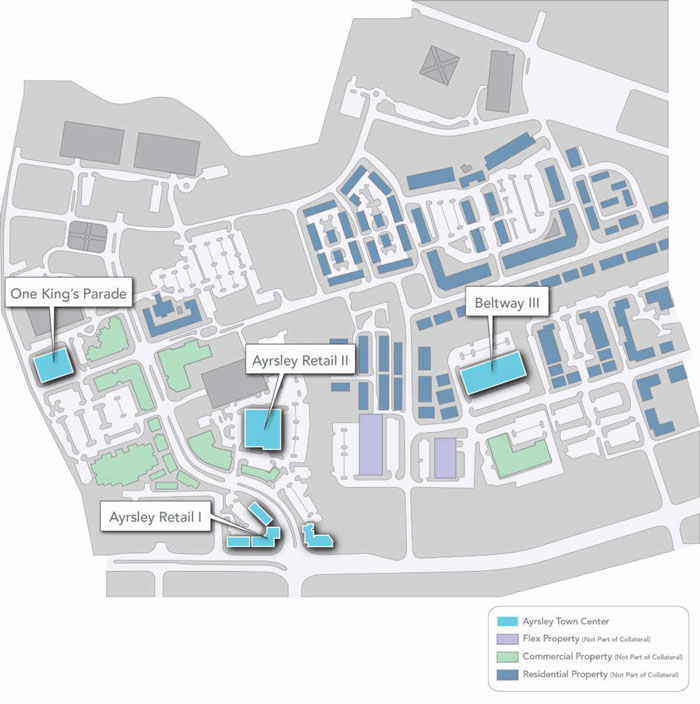
| This is not a research report and was not prepared by the Underwriters’ research departments. Please see additional important information and qualifications at the end of this Term Sheet. |
T-93
| MSBAM 2015-C22 | Ayrsley Town Center |
Mortgage Loan No. 10 – Ayrsley Town Center
| This is not a research report and was not prepared by the Underwriters’ research departments. Please see additional important information and qualifications at the end of this Term Sheet. |
T-94
| MSBAM 2015-C22 | Ayrsley Town Center |
| Mortgage Loan No. 10 – Ayrsley Town Center |
Mortgage Loan Information | Mortgaged Property Information | ||||||
| Mortgage Loan Seller: | MSMCH | Single Asset/Portfolio: | Single Asset | ||||
| Original Balance: | $27,500,000 | Location: | Charlotte, NC 28273 | ||||
| Cut-off Date Balance: | $27,500,000 | General Property Type: | Mixed Use | ||||
| % of Initial Pool Balance: | 2.5% | Detailed Property Type: | Office/Retail | ||||
| Loan Purpose: | Refinance | Title Vesting: | Fee | ||||
| Sponsor: | Charles T. Hodges | Year Built/Renovated: | 1979; 1999; 2003; 2008/2003 | ||||
| Mortgage Rate: | 4.650% | Size: | 189,905 SF | ||||
| Note Date: | 12/31/2014 | Cut-off Date Balance per Unit: | $145 | ||||
| First Payment Date: | 2/1/2015 | Maturity Date Balance per Unit: | $124 | ||||
| Maturity Date: | 1/1/2025 | Property Manager: | New Forum, Inc. (borrower related) | ||||
| Original Term to Maturity: | 120 months | ||||||
| Original Amortization Term: | 360 months | Underwriting and Financial Information | |||||
| IO Period: | 24 months | UW NOI: | $2,488,623 | ||||
| Seasoning: | 3 months | UW NOI Debt Yield: | 9.0% | ||||
| Prepayment Provisions: | LO (27); YM1 (89); O (4) | UW NOI Debt Yield at Maturity: | 10.5% | ||||
| Lockbox/Cash Mgmt Status: | Springing/Springing | UW NCF DSCR: | 1.35x | ||||
| Additional Debt Type: | N/A | Most Recent NOI: | $2,268,503 (12/31/2014) | ||||
| Additional Debt Balance: | N/A | 2nd Most Recent NOI: | $1,930,165 (12/31/2013) | ||||
| Future Debt Permitted (Type): | No (N/A) | 3rd Most Recent NOI: | $2,161,646 (12/31/2012) | ||||
Reserves(1) | Most Recent Occupancy(2): | 96.4% (3/1/2015) | |||||
| Type | Initial | Monthly | Cap | 2nd Most Recent Occupancy: | 81.9% (12/31/2013) | ||
| RE Tax: | $26,325 | $26,325 | N/A | 3rd Most Recent Occupancy: | 81.8% (12/31/2012) | ||
| Insurance: | $0 | Springing | N/A | Appraised Value (as of)(3): | $37,600,000 (10/1/2015) | ||
| Recurring Replacements: | $0 | $3,164 | $113,905 | Cut-off Date LTV Ratio: | 73.1% | ||
| TI/LC: | Maturity Date LTV Ratio: | ||||||
| Other: | $1,777,888 | $0 | N/A | ||||
| Sources and Uses | ||||||
| Sources | Proceeds | % of Total | Uses | Proceeds | % of Total | |
| Loan Amount: | $27,500,000 | 100.0% | Loan Payoff: | $20,166,928 | 73.3% | |
| Reserves: | $2,179,213 | 7.9% | ||||
| Closing Costs: | $620,364 | 2.3% | ||||
Return of Equity(4): | $4,533,495 | 16.5% | ||||
| Total Sources: | $27,500,000 | 100.0% | Total Uses: | $27,500,000 | 100.0% | |
| (1) | See “—Escrows and Reserves” below for further discussion of reserve requirements. |
| (2) | The Most Recent Occupancy includes the 20,934 SF Piedmont Social Club tenant, which is expected to open for business on or about June 1, 2015. The Piedmont Social Club tenant accounts for approximately 11% of Ayrsley Town Center Property space and 10% of underwritten base rents. See “—Escrows and Reserves” below for further discussion of a tenant-related reserve. |
| (3) | The Appraised Value represents a “stabilized value” dependent upon a 95% occupancy rate. A holdback is in place pending occupancy of the Piedmont Social Club tenant, which is expected to bring the Ayrsley Town Center Property to a stabilized occupancy level. See “—Escrows and Reserves” below for further discussion of a tenant-related reserve. |
| (4) | Approximately $4,554,924 was paid to former and current borrower members to buyout or dilute certain borrower membership interests. |
The Mortgage Loan. The tenth largest mortgage loan (the “Ayrsley Town Center Mortgage Loan”) is evidenced by a promissory note in the original principal balance of $27,500,000 secured by a first priority fee mortgage encumbering a 189,905 SF mixed-use, primarily office and retail property in Charlotte, North Carolina (the “Ayrsley Town Center Property”). The proceeds of the Ayrsley Town Center Mortgage Loan were primarily used to refinance previous loans totaling approximately $20,166,928, secured by or related to Ayrsley Town Center Property, and to return equity to the Ayrsley Town Center Borrower. The Ayrsley Town Center Borrower primarily utilized the return of equity to partially or fully redeem certain membership interests in the Ayrsley Town Center Borrower.
The Borrower and the Sponsor. The borrower is Old Forum, LLC (the “Ayrsley Town Center Borrower”), a single-purpose North Carolina limited liability company. The managing member, Old Forum Manager, Inc., a single-purpose North Carolina corporation, has one independent director. The Ayrsley Town Center Borrower is partially owned and controlled by Charles T. Hodges, the sponsor and nonrecourse carve-out guarantor. Mr. Hodges is the president and CEO of New Forum, Inc., a Charlotte-based real estate developer and owner. New Forum is the developer of the Town of Ayrsley, a Charlotte, North Carolina development with approximately 2 million SF of office and retail space, 1,200 residential units, a 14-screen theater, 12 restaurants and 242 hotel rooms. The Ayrsley Town Center Property is a part of the Town of Ayrsley development.
The Property. The Ayrsley Town Center Property is a 189,905 SF mixed-use, primarily office and retail (including restaurant) property, within the Town of Ayrsley development, a master-planned community within the city limits of Charlotte, NC. The Ayrsley Town Center Property consists of seven, one to three-floor buildings on five non-contiguous parcels of land. The buildings were constructed at various times between 1979 and 2008. The building constructed in 1979 was renovated in 2003. There are 474 surface parking spaces associated with the Ayrsley Town Center Property.
| This is not a research report and was not prepared by the Underwriters’ research departments. Please see additional important information and qualifications at the end of this Term Sheet. |
T-95
| MSBAM 2015-C22 | Ayrsley Town Center |
Office space accounts for approximately 110,215 SF of the Ayrsley Town Center Property and approximately 55% of the underwritten base rents. Retail space, including approximately 19,071 SF of restaurant space, accounts for approximately 76,990 SF of the Ayrsley Town Center Property and approximately 45% of the underwritten base rents. There is approximately 2,700 SF of warehouse space accounting for less than 1% of underwritten base rents at the Ayrsley Town Center Property.
The second largest underwritten tenant, Piedmont Social Club, an Ayrsley Town Center Borrower related entity, is not yet open for business. The tenant is in possession of its space, is paying rent as of January 1, 2015, and expected to open for business at the Ayrsley Town Center Property on or about June 1, 2015.
Major Tenants.
Strayer University (21,021 SF, 11% of NRA, 14% of underwritten base rent). Strayer University, Inc. leases 21,021 SF of office space at the Ayrsley Town Center Property. The lease began on August 1, 2007 for 17,544 SF, with a 3,477 SF expansion on August 1, 2011, and has a current expiration date of July 31, 2017, with two five-year lease renewal options. Strayer University is a private, for-profit higher education institution. The university enrolls about 38,000 students through its online learning programs and at 80 campuses located in 24 U.S. states. The university specializes in degree programs for working adults and offers undergraduate and graduate degrees in subjects such as accounting, business administration, criminal justice, education, health services administration, information technology and public administration. It was founded in 1892 as Strayer’s Business College and later became Strayer College, before being granted university status in 1998. Strayer University is accredited by the Middle States Commission on Higher Education. In December 2011, the university acquired the Jack Welch Management Institute from Chancellor University. The institute offers a fully online Executive MBA program, as well as certificate programs.
Piedmont Social Club (20,934 SF, 11% of NRA, 10% of underwritten base rent). PSH Operators, LLC (“Piedmont Social Club”) leases 20,934 SF of retail space at the Ayrsley Town Center Property. The lease began on January 1, 2015 and has a current expiration date of December 31, 2029, with two five-year lease extension options. The tenant, which is related to the Ayrsley Town Center Borrower, is in possession of its space, is paying rent, and is expected to open for business on or about June 1, 2015. Piedmont Social Club is an entertainment venue with food and beverage service, television screens, video games and bowling lanes. Charles T. Hodges has provided a five year surety agreement for payment of all amounts due under the Piedmont Social Club lease.
Huron Consulting (19,578 SF, 10% of NRA, 13% of underwritten base rent). Huron Consulting Services, LLC (“Huron Consulting”) leases 19,578 SF of office space at the Ayrsley Town Center Property. The lease began on October 1, 2009, was extended on December 1, 2014, and has a current expiration date of June 30, 2017, and has one five-year lease extension option. Huron Consulting (NASDAQ: HURN) provides consulting services to a variety of organizations and reported 2013 operating income of approximately $119.9 million. Huron Consulting has 15 North American office locations.
Peak 10 (19,500 SF, 10% of NRA, 7% of underwritten base rent). Peak 10, Inc. leases 19,500 SF at the Ayrsley Town Center Property under two separate lease agreements. The leases began on January 1, 2012 for 16,800 SF of office space and on August 9, 2013 for 2,700 SF of warehouse space. The 16,800 SF lease expires on December 31, 2017, with two five-year lease extension options. The 2,700 SF lease is currently on a month-to-month basis. Peak 10 is a national IT infrastructure provider founded in 2000. The company is headquartered in Charlotte.
YMCA (11,205 SF, 6% of NRA, 6% of underwritten base rent). YMCA of Greater Charlotte (“YMCA”) leases 11,205 SF of retail space at the Ayrsley Town Center Property. The lease began on January 5, 2004 and has a current lease expiration date of December 31, 2017, with two one-year lease extension options. The YMCA is a worldwide organization founded in 1844.
The following table presents a summary regarding major tenants at the Ayrsley Town Center Property:
Tenant Summary(1) | |||||||
| Tenant Name | Credit Rating (Fitch/Moody’s/S&P)(2) | Tenant SF | Approximate % of SF | Annual UW Base Rent | % of Total Annual UW Base Rent | Annual UW Rent PSF(3) | Lease Expiration |
| Anchor/Major Tenants | |||||||
| Strayer University | NR/NR/NR | 21,021 | 11% | $414,448 | 14% | $19.72 | 7/31/2017 |
Piedmont Social Club(4) | NR/NR/NR | 20,934 | 11% | $308,777 | 10% | $14.75 | 12/31/2029 |
| Huron Consulting | NR/NR/NR | 19,578 | 10% | $381,771 | 13% | $19.50 | 6/30/2017 |
| Peak 10 | NR/B3/B | 19,500 | 10% | $203,700 | 7% | $10.45 | 12/31/2017/MTM(5) |
| YMCA | NR/NR/NR | 11,205 | 6% | $190,149 | 6% | $16.97 | 12/31/2017 |
| Subtotal/Wtd. Avg. | 92,238 | 49% | $1,498,845 | 50% | $16.25 | ||
| Other Tenants | 90,743 | 48% | $1,488,793 | 50% | $16.41 | ||
| Vacant Space | 6,924 | 4% | $0 | 0% | $0.00 | ||
| Total/Wtd. Avg. | 189,905 | 100% | $2,987,637 | 100% | $16.33 | ||
(1) | Information is based on the underwritten rent roll. |
| (2) | Certain ratings are those of the parent company whether or not the parent guarantees the lease. |
| (3) | Wtd. Avg. Annual UW Rent PSF Rolling excludes vacant space. |
| (4) | The Piedmont Social Club tenant is scheduled to open for business on or about June 1, 2015 and is related to the Ayrsley Town Center Borrower. The Piedmont Social Club lease and rent payments commenced on January 1, 2015. |
| (5) | 16,800 SF of the Peak 10 space has a current lease expiration date of December 31, 2017, and 2,700 SF of the Peak 10 space is currently leased on a MTM basis. |
| This is not a research report and was not prepared by the Underwriters’ research departments. Please see additional important information and qualifications at the end of this Term Sheet. |
T-96
| MSBAM 2015-C22 | Ayrsley Town Center |
The following table presents certain information relating to the lease rollover schedule at the Ayrsley Town Center Property:
Lease Rollover Schedule(1)(2) | |||||||||
| Year | # of Leases Rolling | SF Rolling | UW Rent PSF Rolling(3) | Approx. % of Total SF Rolling | Approx. Cumulative % of SF Rolling | Total UW Rent Rolling | Approx. % of Total UW Rent Rolling | Approx. Cumulative % of Total UW Rent Rolling | |
| MTM | 1 | 2,700 | $7.00 | 1% | 1% | $18,900 | 1% | 1% | |
| 2015 | 6 | 19,551 | $15.28 | 10% | 12% | $298,650 | 10% | 11% | |
| 2016 | 3 | 9,818 | $21.10 | 5% | 17% | $207,174 | 7% | 18% | |
| 2017 | 10 | 90,523 | $15.96 | 48% | 65% | $1,444,727 | 48% | 66% | |
| 2018 | 6 | 22,517 | $21.43 | 12% | 76% | $482,604 | 16% | 82% | |
| 2019 | 2 | 5,605 | $16.65 | 3% | 79% | $93,310 | 3% | 85% | |
| 2020 | 2 | 10,243 | $11.12 | 5% | 85% | $113,876 | 4% | 89% | |
| 2021 | 1 | 1,090 | $18.00 | 1% | 85% | $19,620 | 1% | 90% | |
| 2022 | 0 | 0 | $0.00 | 0% | 85% | $0 | 0% | 90% | |
| 2023 | 0 | 0 | $0.00 | 0% | 85% | $0 | 0% | 90% | |
| 2024 | 0 | 0 | $0.00 | 0% | 85% | $0 | 0% | 90% | |
| 2025 | 0 | 0 | $0.00 | 0% | 85% | $0 | 0% | 90% | |
| 2026 | 0 | 0 | $0.00 | 0% | 85% | $0 | 0% | 90% | |
| 2027 | 0 | 0 | $0.00 | 0% | 85% | $0 | 0% | 90% | |
| 2028 & Beyond | 1 | 20,934 | $14.75 | 11% | 96% | $308,777 | 10% | 100% | |
| Vacant | 0 | 6,924 | $0.00 | 4% | 100% | $0 | 0% | 100% | |
| Total/Wtd. Avg. | 32 | 189,905 | $16.33 | 100% | $2,987,637 | 100% | |||
| (1) | Information is based on the underwritten rent roll. |
| (2) | Certain tenants may have lease termination options that are exercisable prior to the originally stated expiration date of the subject lease and that are not considered in the lease rollover schedule. |
| (3) | Wtd. Avg. UW Rent PSF Rolling excludes vacant space. |
The Market. The Ayrsley Town Center Property is located in Charlotte, Mecklenburg County, North Carolina within the I-77/Southwest submarket and a community known as the “Town of Ayrsley,” an approximately 180-acre master-planned urban development, approximately 11 miles southwest of the Charlotte central business district. The Ayrsley Town Center Property consists primarily of office and retail space. As of June 30, 2014, the greater Charlotte retail market was 8.6% vacant and had an average base rental rate of $19.15 PSF. The I-77/Southwest retail submarket had a 6.6% vacancy rate and average base rent of $23.61 PSF. As of June 30, 2014, the greater Charlotte office market was 14.5% vacant and had an average base rental rate of $22.82 PSF. The I-77/Southwest office submarket had a 19.6% vacancy rate and average base rent of $17.39 PSF. The 2014 estimated population within a five-mile radius was 123,699.
The following table presents recent occupancy and leasing data at six primary competitive centers to the Ayrsley Town Center Property. Three of the properties represent retail comparables and three represent office comparables.
| Competitive Property Summary | |||||||||||
| Property Name/Location/Comp Type | Year Built | Overall Occ. | Expense Basis | Tenant Name | Lease Size (SF) | Lease Term (Yrs.) | Base Rent (PSF Ann.) | Property Rent Ranges (PSF) | |||
The Shops at Whitehall Commons 8146-8170 South Tryon Street, Charlotte NC Retail Comparable | 2003-2004 | 97.0% | NNN | Panera Bread | 4,798 | 10 | $28.00 | $21.00- $28.00 | |||
Village at Whitehall 8943-8951 South Tryon Street, Charlotte NC Retail Comparable | 2004 | 96.0% | NNN | Alteration Fortune Cookie GameStop Starbucks | 1,200 2,400 1,500 1,500 | 5 10 10 10 | $22.50 $22.50 $29.00 $31.00 | $20.00- $31.00 | |||
Toringdon Circle 12206 Copper Way, Charlotte NC Retail Comparable | 2006 | 98.0% | NNN | Confidential | 1,400 | 5 | $23.00 | $22.00- $29.00 | |||
Toringdon III 3440 Toringdon Way, Toringdon Office Park, Charlotte NC Office Comparable | 2003 | 78.0% | Full Service | Global Rest Coldwell Banker Infrascience | 2,229 18,361 3,135 | 10 13 5 | $17.00 $27.42 $22.25 | $22.50 (asking rate) | |||
Carmel Commons Office Park 11440 Carmel Commons Boulevard, Charlotte NC Office Comparable | 1998 | 99.0% | Full Service | Confidential Confidential | 2,358 1,530 | 5 5 | $18.00 $20.08 | $21.00 (asking rate) | |||
Madison at Belle Grove at the Arboretum Office Park 3135 Springbank Lane, Charlotte NC Office Comparable | 2003 | 91.1% | Full Service | Confidential | 1,456 | 5 | $23.50 | $24.00 (asking rate) | |||
Source: Appraisal
| This is not a research report and was not prepared by the Underwriters’ research departments. Please see additional important information and qualifications at the end of this Term Sheet. |
T-97
| MSBAM 2015-C22 | Ayrsley Town Center |
Operating History and Underwritten Cash Flow. The following table presents certain information relating to the underwritten cash flow at the Ayrsley Town Center Property:
| Cash Flow Analysis | ||||||||||||||
| 2010 | 2011 | 2012 | 2013 | 2014 | UW | UW PSF | ||||||||
| Base Rent | $3,208,254 | $2,773,434 | $2,892,870 | $2,661,180 | $2,846,468 | $3,128,666 | $16.47 | |||||||
| Total Recoveries | $61,612 | $542,954 | $624,203 | $615,445 | $692,418 | $751,323 | $3.96 | |||||||
| Other Income | $17,004 | $39,418 | $26,283 | $75,684 | $40,024 | $3,674 | $0.02 | |||||||
| Discounts Concessions | ($94,022) | ($16,073) | ($6,559) | ($99,460) | $0 | $0 | $0.00 | |||||||
| Less Vacancy & Credit Loss | ($149,493) | ($180,236) | ($232,243) | ($262,266) | ($232,463) | ($349,199) | ($1.84) | |||||||
| Effective Gross Income | $3,043,355 | $3,159,497 | $3,304,554 | $2,990,583 | $3,346,447 | $3,534,464 | $18.61 | |||||||
| Total Operating Expenses | $1,261,567 | $1,042,622 | $1,142,908 | $1,060,418 | $1,077,944 | $1,045,841 | $5.51 | |||||||
| Net Operating Income | $1,781,788 | $2,116,875 | $2,161,646 | $1,930,165 | $2,268,503 | $2,488,623 | $13.10 | |||||||
| Capital Expenditures | $0 | $0 | $0 | $0 | $0 | $32,219 | $0.17 | |||||||
| TI/LC | $0 | $0 | $0 | $0 | $0 | $201,299 | $1.06 | |||||||
Offset to UW TI/LC(1) | $0 | $0 | $0 | $0 | $0 | ($37,500) | ($0.20) | |||||||
| Net Cash Flow | $1,781,788 | $2,116,875 | $2,161,646 | $1,930,165 | $2,268,503 | $2,292,605 | $12.07 | |||||||
| Occupancy % | 86.8% | 87.0% | 81.8% | 81.9% | 90.8% | 91.0% | ||||||||
| NOI DSCR | 1.05x | 1.24x | 1.27x | 1.13x | 1.33x | 1.46x | ||||||||
| NCF DSCR | 1.05x | 1.24x | 1.27x | 1.13x | 1.33x | 1.35x | ||||||||
| NOI Debt Yield | 6.5% | 7.7% | 7.9% | 7.0% | 8.2% | 9.0% | ||||||||
| NCF Debt Yield | 6.5% | 7.7% | 7.9% | 7.0% | 8.2% | 8.3% | ||||||||
| (1) | The Ayrsley Town Center Borrower deposited $375,000 into the TI/LC reserve at loan origination. The escrow is utilized as an offset to underwritten TI/LC expenses over the 10-year loan term. |
Escrows and Reserves. The Ayrsley Town Center Borrower deposited $26,325 in escrow for annual real estate taxes at loan origination and is required to escrow monthly 1/12 of the annual estimated tax payments. The Ayrsley Town Center Borrower is required to escrow monthly 1/12 of the annual estimated insurance premiums (unless the Ayrsley Town Center Borrower maintains insurance under an acceptable blanket insurance policy). The Ayrsley Town Center Borrower is required to make monthly deposits of $3,164 for replacement reserves (which amount may be increased by the lender if the lender reasonably determines that an increase is necessary to maintain proper operation of the Ayrsley Town Center Property), provided that such deposits are not required to the extent that the amount then on deposit in the replacement reserve equals or exceeds $113,905. The Ayrsley Town Center Borrower deposited in escrow at loan origination $375,000 and is required to make monthly deposits of $23,730 (or, on the monthly payment date in February 2017 and on each monthly payment date thereafter, $11,865), in each case, for TI/LC reserves.
The Ayrsley Town Center Borrower also deposited in escrow at loan origination (x) $17,888, as a reserve for the rent payable by the tenant at the Ayrsley Town Center Property located at 2215 Ayrsley Town Boulevard, Charlotte, North Carolina, doing business as “Olive’s Mediterranean Grill,” which amount will be disbursed to the Ayrsley Town Center Borrower upon, amongst other conditions, the Ayrsley Town Center Borrower providing evidence to the lender that such tenant is in occupancy and paying full unabated contractual rent under its lease and (y) $1,760,000, with respect to the occupancy by Piedmont Social Club of the 20,934 SF of space demised at 2135 Ayrsley Town Boulevard, Charlotte, North Carolina, pursuant to the lease agreement, dated December 22, 2014, between the Ayrsley Town Center Borrower’s predecessor-in-interest as landlord and Piedmont Social Club as tenant, which amount will be disbursed to the Ayrsley Town Center Borrower upon, amongst other conditions, the Ayrsley Town Center Borrower submitting to the lender a copy of the certificate of occupancy for the space demised by the Piedmont Social Club (if required by the applicable governmental authority) and an estoppel from the Piedmont Social Club on a form reasonably acceptable to the lender confirming, amongst other items, that (i) the lease agreement is in full force and effect with no defaults existing thereunder, (ii) the Piedmont Social Club is in occupancy of and open for business in the entire space demised under the lease and (iii) all monthly rent, reimbursements required to be paid and tenant improvements, leasing commissions and other similar amounts under the lease have been paid.
Lockbox and Cash Management. A springing hard lockbox is in place with respect to the Ayrsley Town Center Mortgage Loan (i.e. upon the commencement of the initial Cash Sweep Period for the Ayrsley Town Center Mortgage Loan, the Ayrsley Town Center Borrower has agreed to establish and maintain a hard lockbox following the commencement of such Cash Sweep Period). Provided a Cash Sweep Period has occurred but is no longer continuing, funds in the lockbox account are swept daily to an account designated by the Ayrsley Town Center Borrower. The Ayrsley Town Center Mortgage Loan has springing cash management (i.e. the Ayrsley Town Center Mortgage Loan has cash management only during a Cash Sweep Period). During the continuance of a Cash Sweep Period for the Ayrsley Town Center Mortgage Loan, funds in the lockbox account are transferred each business day to the cash management account and applied on each monthly payment date to pay debt service on the Ayrsley Town Center Mortgage Loan, to fund the required reserves deposits as described above under “—Escrows and Reserves,” to disburse, provided no event of default has occurred, to the Ayrsley Town Center Borrower the monthly amount payable for operating expenses not otherwise paid or reserved for as described above under “—Escrows and Reserves” and referenced in the annual budget approved by lender together with other amounts incurred by the Ayrsley Town Center Borrower in connection with the operation and maintenance of the Ayrsley Town Center Property approved by lender, and to disburse the remainder to an account to be held by the lender as additional security for the Ayrsley Town Center Mortgage Loan.
A “Cash Sweep Period” will:
(i) commence upon the occurrence of an event of default under the Ayrsley Town Center Mortgage Loan and continue until the date on which the event of default under the Ayrsley Town Center Mortgage Loan is cured to the lender’s reasonable satisfaction, or
(ii) commence upon the date the lender determines that the debt service coverage ratio on the Ayrsley Town Center Mortgage Loan has fallen below 1.10x for six consecutive calendar months and continue until the date the lender determines that the debt service coverage ratio on the Ayrsley Town Center Mortgage Loan has been equal to or greater than 1.25x for the immediately preceding six consecutive calendar months.
| This is not a research report and was not prepared by the Underwriters’ research departments. Please see additional important information and qualifications at the end of this Term Sheet. |
T-98
| MSBAM 2015-C22 | Ayrsley Town Center |
Additional Secured Indebtedness (not including trade debts). Not permitted.
Mezzanine Loan and Preferred Equity. Not permitted.
Release of Property. Not permitted.
Terrorism Insurance. Generally, the Ayrsley Town Center Borrower is required to obtain insurance against acts of terrorism or other similar acts or events (or “fire following”) to the extent such insurance is available in form and substance satisfactory to lender (but in no event more than the sum of 100% of full replacement cost and 12 months of business interruption insurance). Notwithstanding the foregoing, for so long as the Terrorism Risk Insurance Program Reauthorization Act of 2007 (or any extension thereof or other federal government program with substantially similar protection) is in effect, the Ayrsley Town Center Borrower is required to maintain, and lender is required to accept, terrorism insurance which covers “covered acts” (as defined by such statute or other program), as full compliance as it relates to the risks required to be covered pursuant to the preceding sentence, so long as such statute or other program covers both domestic and foreign acts of terrorism.
| This is not a research report and was not prepared by the Underwriters’ research departments. Please see additional important information and qualifications at the end of this Term Sheet. |
T-99
| MSBAM 2015-C22 | Oliveira Plaza |
| Mortgage Loan No. 11 – Oliveira Plaza |
| Mortgage Loan Information | Mortgaged Property Information | ||||||
| Mortgage Loan Seller: | BANA | Single Asset/Portfolio: | Single Asset | ||||
| Original Balance: | $25,000,000 | Location: | Port Hueneme, CA 93041 | ||||
| Cut-off Date Balance: | $25,000,000 | General Property Type: | Retail | ||||
| % of Initial Pool Balance: | 2.3% | Detailed Property Type: | Anchored | ||||
| Loan Purpose: | Refinance | Title Vesting: | Leasehold | ||||
| Sponsor: | Aria Mehrabi | Year Built/Renovated: | 1979/2009; 2013 | ||||
| Mortgage Rate: | 4.139% | Size: | 116,002 SF | ||||
| Note Date: | 3/9/2015 | Cut-off Date Balance per Unit: | $216 | ||||
| First Payment Date: | 5/1/2015 | Maturity Date Balance per Unit: | $196 | ||||
| Maturity Date: | 4/1/2025 | Property Manager: | Pacific Star Capital, LLC | ||||
| Original Term to Maturity: | 120 months | ||||||
| Original Amortization Term: | 360 months | Underwriting and Financial Information | |||||
| IO Period: | 60 months | UW NOI: | $2,049,310 | ||||
| Seasoning: | 0 months | UW NOI Debt Yield: | 8.2% | ||||
| Prepayment Provisions: | LO (24); DEF (92); O (4) | UW NOI Debt Yield at Maturity: | 9.0% | ||||
| Lockbox/Cash Mgmt Status: | Hard/Springing | UW NCF DSCR: | 1.33x | ||||
| Additional Debt Type: | N/A | Most Recent NOI: | $1,936,081 (12/31/2014) | ||||
| Additional Debt Balance: | N/A | 2nd Most Recent NOI: | $1,826,954 (12/31/2013) | ||||
| Future Debt Permitted (Type): | No (N/A) | 3rd Most Recent NOI: | $1,747,995 (12/31/2012) | ||||
| Reserves | Most Recent Occupancy: | 94.7% (2/5/2015) | |||||
| Type | Initial | Monthly | Cap | 2nd Most Recent Occupancy: | 90.4% (12/31/2013) | ||
| RE Tax: | $0 | $23,482 | N/A | 3rd Most Recent Occupancy: | 86.0% (12/31/2012) | ||
| Insurance: | $21,316 | $1,776 | N/A | Appraised Value (as of): | $35,200,000 (1/21/2015) | ||
| Recurring Replacements: | $0 | $1,934 | N/A | Cut-off Date LTV Ratio: | 71.0% | ||
TI/LC(1): | $29,875 | $8,333 | $300,000 | Maturity Date LTV Ratio: | 64.7% | ||
Other(2): | $58,369 | $0 | N/A | ||||
| Sources and Uses | |||||||
| Sources | Proceeds | % of Total | Uses | Proceeds | % of Total | ||
| Loan Amount: | $25,000,000 | 100.0% | Loan Payoff: | $16,248,957 | 65.0% | ||
| Reserves: | $109,560 | 0.4% | |||||
| Closing Costs: | $4,407,286 | 17.6% | |||||
| Return of Equity: | $4,234,197 | 16.9% | |||||
| Total Sources: | $25,000,000 | 100.0% | Total Uses: | $25,000,000 | 100.0% | ||
| (1) | At loan origination, the Oliveira Plaza Borrower deposited with the lender $29,875 for tenant improvement and leasing commissions related to Boar’s Breath ($11,252 for tenant improvements), Cricket Wireless ($7,511 for leasing commissions), Michelle Ranae Salon ($6,048 for leasing commissions) and Rahim Siam (Ice Cream Shop) ($5,064 for leasing commissions). |
| (2) | At loan origination, the Oliveira Plaza Borrower deposited with the lender $58,369 for free rent related to Boar’s Breath ($22,504), Cricket Wireless ($10,125), Michelle Ranae Salon ($18,144) and Rahim Siam (Ice Cream Shop) ($7,596). |
The Mortgage Loan. The eleventh largest mortgage loan (the “Oliveira Plaza Mortgage Loan”) is evidenced by a promissory note in the original principal amount of $25,000,000, secured by a first priority leasehold mortgage encumbering an anchored retail center known as Oliveira Plaza, located in Port Hueneme, California (the “Oliveira Plaza Property”). The proceeds of the Oliveira Plaza Mortgage Loan were used to refinance a previous loan that was previously included in the GSMS 2010-C1 transaction of approximately $16,250,000.
The Borrower and the Sponsor. The borrower is Oliveira Plaza Associates, LLC (the “Oliveira Plaza Borrower”), a single-purpose Delaware limited liability company. Equity ownership in the Oliveira Plaza Borrower is held by Oliveira Plaza Associates, LLC, which is held by Aria Mehrabi (99.45%) and limited investor members (0.55%).
Aria Mehrabi is the Oliveira Plaza Mortgage Loan sponsor and the co-founder of Pacific Star Capital (“PacStar”). Founded in June 2003 and headquartered in Santa Monica, California, PacStar has developed and acquired a real estate portfolio totaling in excess of $700,000,000. Aria Mehrabi has over 20 years of operating experience in real estate. Aria Mehrabi began his career in commercial real estate, as Vice President of Acquisitions for an opportunity fund, RPD Catalyst, where he conducted acquisitions in commercial real estate deals, including stabilized and value added office and industrial projects in 20 different markets across the US. Prior to working at RPD Catalyst, Aria Mehrabi worked privately in the residential multi-family sector and developed and sold multiple housing tracts and a portfolio of condominium projects in Southern California.
The Property. The Oliveira Plaza Property is an 116,002 SF anchored retail center located in Port Hueneme, California. The Oliveira Plaza Property was built in 1979 and renovated in 2009 and 2013 on a 9.34-acre parcel along the intersection of two primary thoroughfares: W. Channel Islands Boulevard and Victoria Avenue in the Ventura South retail submarket, approximately three miles southwest of the Oxnard, California central business district. As of February 5, 2015, the Oliveira Plaza Property was 94.7% leased to 23 different tenants with no more than 23.3% of SF expiring in any year. The Oliveira Plaza Property tenants include Big Lots, Rite Aid, West Marine, Bank of America and Dollar Tree. The Oliveira Plaza Property has
| This is not a research report and was not prepared by the Underwriters’ research departments. Please see additional important information and qualifications at the end of this Term Sheet. |
T-100
| MSBAM 2015-C22 | Oliveira Plaza |
474 surface parking spaces (4.09 spaces per 1,000 SF). The Oliveira Plaza Property is ground leased by the Oliveira Plaza Borrower on a lease expiring on September 30, 2031 with four 15-year renewal options. The ground lease payment is $280,200 annually plus the greater of 6% of the annual fixed rents received from tenants or 25% of the annual percentage rents received from its tenants.
The following table presents a summary regarding major tenants at the Oliveira Plaza Property:
Tenant Summary(1) | |||||||||||||||
| Tenant Name | Credit Rating (Fitch/Moody’s/S&P)(2) | Tenant SF | Approximate % of SF | Annual UW Rent | % of Total Annual UW Rent | Annual UW Rent PSF(3) | Lease Expiration | ||||||||
| Major Tenants | |||||||||||||||
| Big Lots | NR/NR/BBB- | 19,973 | 17% | $279,622 | 11% | $14.00 | 1/31/2019 | ||||||||
| Rite Aid | B/B2/B | 17,340 | 15% | $567,885 | 23% | $32.75 | 1/31/2029 | ||||||||
| West Marine | NR/NR/NR | 15,000 | 13% | $288,750 | 12% | $19.25 | 8/31/2017 | ||||||||
| Bank of America | A/Baa2/A- | 10,989 | 9% | $133,195 | 5% | $12.12 | 1/31/2021 | ||||||||
| Dollar Tree | NR/Ba2/BB | 10,080 | 9% | $166,320 | 7% | $16.50 | 2/28/2018 | ||||||||
| Subtotal/Wtd. Avg. | 73,382 | 63% | $1,435,772 | 58% | $19.57 | ||||||||||
| Other Tenants | 36,475 | 31% | $1,055,814 | 42% | $28.95 | ||||||||||
| Vacant Space | 6,145 | 5% | $0 | 0% | $0.00 | ||||||||||
| Total/Wtd. Avg. | 116,002 | 100% | $2,491,586 | 100% | $22.68 | ||||||||||
| (1) | Information is based on the underwritten rent roll. |
| (2) | Certain ratings are those of the parent company whether or not the parent guarantees the lease. |
| (3) | Wtd. Avg. Annual UW Rent PSF excludes vacant space. |
The Market. The Oliveira Plaza Property is located in the Ventura South submarket of Los Angeles, California. As of the fourth quarter of 2014, the submarket had approximately 11.3 million SF of retail space with an average vacancy of 7.9% and an average annual asking rent of $23.91 PSF. The estimated 2014 population within a three-mile radius of the Oliveira Plaza Property was 129,958 people and the 2014 estimated average household income within a three-mile radius was $56,835.
The following table presents five primary competitive centers to the Oliveira Plaza Property:
| Competitive Property Summary | ||||||||||||||
| Property Name | Address | Year Built | Occupancy | Total GLA (SF) | Anchors | Annual Base Rent (PSF) (NNN ) | ||||||||
| Mandalay Village Marketplace | 555‐637 W. Channel Islands Blvd Port Hueneme, CA | 1995 | 83% | 197,331 | Ralph’s grocery store; Petco; CVS; Ross Dress for Less | $24.00 - $25.00 | ||||||||
| Seabridge Marketplace | 1291 Victoria Ave Oxnard, CA | 2006 | 88% | 91,631 | Ralph’s grocery store | $28.00 - $36.00 | ||||||||
| Island Plaza | 2824 Saviers Rd Oxnard, CA | 1970 | 95% | 170,000 | El Super Grocery Store; Office Depot; O’Reilly’s Auto Parts | $21.00 | ||||||||
| Rose Ranch | 1600‐1831 Rose Ave Oxnard, CA | 2010 | 83% | 72,515 | Fresh & Easy; Walgreens | $30.00 | ||||||||
| Freemont Square Shopping Center | 702‐944 N. Ventura Blvd Oxnard, CA | 1987 | 93% | 184,385 | Rite Aid; ACE Hardware; Auto Zone; Dollar Tree | $21.00 | ||||||||
Source: Appraisal
| This is not a research report and was not prepared by the Underwriters’ research departments. Please see additional important information and qualifications at the end of this Term Sheet. |
T-101
| MSBAM 2015-C22 | Oliveira Plaza |
Operating History and Underwritten Cash Flow. The following table presents certain information relating to the historical operating performance and the Underwritten Cash Flow at the Oliveira Plaza Property:
| Cash Flow Analysis | ||||||||||||||
| 2011 | 2012 | 2013 | 2014 | UW | UW PSF | |||||||||
| Base Rent | N/A | $2,228,653 | $2,336,174 | $2,356,600 | $2,639,066 | $22.75 | ||||||||
| Total Recoveries | N/A | $440,170 | $436,670 | $488,505 | $514,377 | $4.43 | ||||||||
| Percentage Rent | N/A | $0 | $4,533 | $44,239 | $44,239 | $0.38 | ||||||||
| Other Income | N/A | $2,692 | $2,400 | $2,400 | $3,600 | $0.03 | ||||||||
| Less Vacancy & Credit Loss | N/A | $0 | $0 | $0 | ($179,102) | (5.7%) | ||||||||
| Effective Gross Income | N/A | $2,671,515 | $2,779,777 | $2,891,744 | $3,022,180 | $26.05 | ||||||||
Total Operating Expenses(1) | N/A | $923,520 | $952,823 | $955,663 | $972,870 | $8.39 | ||||||||
| Net Operating Income | N/A | $1,747,995 | $1,826,954 | $1,936,081 | $2,049,310 | $17.67 | ||||||||
| TI/LC | N/A | $0 | $0 | $0 | $93,884 | $0.81 | ||||||||
| Capital Expenditures | N/A | $0 | $0 | $0 | $23,200 | $0.20 | ||||||||
| Net Cash Flow | N/A | $1,747,995 | $1,826,954 | $1,936,081 | $1,932,226 | $16.66 | ||||||||
| Occupancy % | N/A | 86.0% | 90.4% | 94.7%(2) | 94.3% | |||||||||
| NOI DSCR | N/A | 1.20x | 1.25x | 1.33x | 1.41x | |||||||||
| NCF DSCR | N/A | 1.20x | 1.25x | 1.33x | 1.33x | |||||||||
| NOI Debt Yield | N/A | 7.0% | 7.3% | 7.7% | 8.2% | |||||||||
| NCF Debt Yield | N/A | 7.0% | 7.3% | 7.7% | 7.7% | |||||||||
| (1) | Ground rent is flat over the term at $280,200 annually plus the greater of 6% of annual fixed rents and 25% of annual percentage rent. |
| (2) | Based on the Oliveira Plaza Borrower rent roll dated February 5, 2015. |
| This is not a research report and was not prepared by the Underwriters’ research departments. Please see additional important information and qualifications at the end of this Term Sheet. |
T-102
(THIS PAGE INTENTIONALLY LEFT BLANK)
T-103
| MSBAM 2015-C22 | Bowman Station and Chenal Place Shopping Center |
| Mortgage Loan Information | Mortgaged Property Information | ||||||
| Mortgage Loan Seller: | SMF III | Single Asset/Portfolio: | |||||
| Original Balance: | Location: | ||||||
| Cut-off Date Balance: | General Property Type: | ||||||
| % of Initial Pool Balance: | 2.0% | Detailed Property Type: | |||||
| Loan Purpose: | Title Vesting: | ||||||
| Sponsors: | Year Built/Renovated: | ||||||
| Size: | 161,546 SF | ||||||
| Mortgage Rate: | Cut-off Date Balance per Unit: | $134 | |||||
| Note Date: | Maturity Date Balance per Unit: | $114 | |||||
| First Payment Date: | Property Manager: | West Group Real Estate LLC | |||||
| Maturity Date: | |||||||
| Original Term to Maturity: | |||||||
| Original Amortization Term: | Underwriting and Financial Information | ||||||
| IO Period: | UW NOI: | ||||||
| Seasoning: | UW NOI Debt Yield: | ||||||
| Prepayment Provisions: | UW NOI Debt Yield at Maturity: | ||||||
| Lockbox/Cash Mgmt Status: | UW NCF DSCR: | ||||||
| Additional Debt Type: | Most Recent NOI: | ||||||
| Additional Debt Balance: | 2nd Most Recent NOI: | ||||||
| Future Debt Permitted (Type): | 3rd Most Recent NOI: | ||||||
| Reserves | Most Recent Occupancy(2): | ||||||
| Type | Initial | Monthly | Cap | 2nd Most Recent Occupancy: | |||
| RE Tax: | 3rd Most Recent Occupancy: | ||||||
| Insurance: | Appraised Value (as of): | ||||||
| Recurring Replacements: | Cut-off Date LTV Ratio: | ||||||
| TI/LC: | $200,000 | $13,462 | $485,000 | Maturity Date LTV Ratio: | 64.0% | ||
Other(1): | $120,000 | $28,543 | N/A | ||||
| Sources | Proceeds | % of Total | Uses | Proceeds | % of Total | |
| Loan Amount: | 100.0% | Loan Payoff: | 92.8% | |||
| Reserves: | 1.6% | |||||
| Closing Costs: | $541,372 | 2.5% | ||||
| Return of Equity: | $673,629 | 3.1% | ||||
| Total Sources: | 100.0% | Total Uses: | 100.0% | |||
| (1) | At closing, the Bowman Station and Chenal Place Shopping Center Borrower deposited $120,000 related to TI/LCs for the tenant Epoch Health Clinic. Additionally, the Bowman Station and Chenal Place Shopping Center Borrower is required to make monthly payments of $28,543 into a reserve for the first 12 months of the loan term to be used for costs associated with leasing the space currently occupied by Staples. |
| (2) | Most Recent Occupancy includes one tenant that has signed a lease but has not yet taken occupancy. Epoch Health Clinic has signed a lease and commenced paying rent for 6,473 SF, but has not yet taken occupancy of the related space. Epoch Health Clinic is expected to take occupancy by the end of May 2015. Excluding Epoch Health Clinic, the Bowman Station and Chenal Place Shopping Center Property was 88.6% occupied as of March 5, 2015. |
The Mortgage Loan. The twelfth largest mortgage loan (the “Bowman Station and Chenal Place Shopping Center Mortgage Loan”) is evidenced by a promissory note in the original principal amount of $21,675,000 and is secured by a first priority fee mortgage encumbering two anchored retail properties located in Little Rock, Arkansas (together, the “Bowman Station and Chenal Place Shopping Center Property”). The previous loans secured by the Bowman Station and Chenal Place Shopping Center Property were included in the GMACC 2005-C1 transaction. The proceeds of the Bowman Station and Chenal Place Shopping Center Mortgage Loan were primarily used to refinance existing debt on the Bowman Station and Chenal Place Shopping Center Property, return equity to the Bowman Station and Chenal Place Shopping Center Borrower, pay closing costs and fund reserves.
The Borrower and the Sponsor. The borrowers are Bowman Station Properties, LLC and Chenal Place Properties, LLC (collectively, the “Bowman Station and Chenal Place Shopping Center Borrower”), each a single-purpose Arkansas limited liability company. The sponsors and nonrecourse carve-out guarantors are Bernard E. Kaiser III, Willis R. Smith and Clarence J. Cropper. Bernard E. Kaiser III, Willis R. Smith and Clarence J. Cropper are the founders of West Group, LLC, a Little Rock-based privately held real estate investment firm. West Group, LLC was founded in 1996 and focuses primarily on planning, developing and managing retail properties in the greater Little Rock area.
The Property. The Bowman Station and Chenal Place Shopping Center Property, located at 12305-12319 Chenal Parkway (such portion, the “Chenal Place Shopping Center Property”) and 801 and 1001 South Bowman Road (such portion, the “Bowman Station Shopping Center Property”), consists of two anchored retail properties totaling 161,546 SF leased to 19 tenants. The Chenal Place Shopping Center Property contains 480 surface parking spaces, while the Bowman Station Shopping Center Property contains 309 surface parking spaces. The Bowman Station and Chenal Place Shopping Center Property is accessible via Interstate 630 and Interstate 430. The Chenal Place Shopping Center Property is anchored by Bed Bath & Beyond and
| This is not a research report and was not prepared by the Underwriters’ research departments. Please see additional important information and qualifications at the end of this Term Sheet. |
T-104
| MSBAM 2015-C22 | Bowman Station and Chenal Place Shopping Center |
Staples, and located along a commercial corridor that includes Wal-Mart Supercenter, Sam’s Club, Target, Best Buy, Home Depot and other national retailers. The Bowman Station Shopping Center Property is anchored by Savers and shadow anchored by Wal-Mart Supercenter and Sam’s Club. The most recent large-scale retail development in the area, known as The Promenade at Chenal, an open-air, lifestyle/regional shopping center consisting of approximately 330,000 SF of retail space and an IMAX multi-screen movie theater, is located approximately three miles from the Bowman Station and Chenal Place Shopping Center Property.
Provided no Sweep Event Period (as defined below) has occurred or is continuing, the Bowman Station and Chenal Place Shopping Center Borrower may release one of the individual Bowman Station and Chenal Place Shopping Center Property, provided that, among other things, (i) the Bowman Station and Chenal Place Shopping Center Borrower will partially defease the loan in an amount equal to the greater of (x) if the first release property is (A) the Bowman Station Shopping Center Property, 115% of the loan amount allocated to the Bowman Station Shopping Center Property, as determined by the lender, or (B) the Chenal Place Shopping Center Property, 120% of the loan amount allocated to such release property, as determined by the lender, (ii) the loan-to-value ratio for the Bowman Station and Chenal Place Shopping Center Property immediately following such partial release is equal to or less than 75%, as determined by the lender, (iii) the debt service coverage ratio for the Bowman Station and Chenal Place Shopping Center Property immediately following such partial release is equal to or greater than 1.30x, as determined by the lender and (iv) the debt yield for the Bowman Station and Chenal Place Shopping Center Property immediately following such partial release is equal to or greater than 8.0%, as determined by the lender.
A “Sweep Event Period” will commence upon (i) the occurrence of an event of default under the Bowman Station and Chenal Place Shopping Center Loan and continue until such event of default is no longer continuing and (ii) the DSCR, calculated based on the trailing 12 calendar months, being less than 1.10x for either individual Bowman Station and Chenal Place Shopping Center Property and continue until the DSCR, calculated based on the trailing 12 calendar months, for two consecutive quarters thereafter is equal to or greater than 1.20x.
The table below summarizes the details of the two properties comprising the Bowman Station and Chenal Place Shopping Center Property:
| Property Summary | ||||||||
| Property | Allocated Cut-off Date Loan Amount | % of Allocated Loan Amount | Location | Area (SF) | Year Built/ Renovated | Occupancy | Appraised Value | UW NCF |
| Chenal Place Shopping Center | $14,625,000 | 67% | Little Rock, AR | 101,642 | 1999/N/A | 95.6% | $19,500,000 | $1,212,911 |
| Bowman Station Shopping Center | $7,050,000 | 33% | Little Rock, AR | 59,904 | 1990/N/A | 87.5% | $9,400,000 | $601,266 |
| Total/Wtd. Avg. | $21,675,000 | 100% | 161,546 | 92.6% | $28,900,000 | $1,814,177 | ||
The following table presents a summary regarding major tenants at the Bowman Station and Chenal Place Shopping Center Property:
Tenant Summary(1) | |||||||
| Tenant Name | Credit Rating (Fitch/Moody’s/S&P)(2) | Tenant SF | Approximate % of SF | Annual UW Rent | % of Total Annual UW Rent | Annual UW Rent PSF(3) | Lease Expiration |
| Anchor/Major Tenants | |||||||
| Bed Bath & Beyond | NR/Baa1/A- | 37,813 | 23% | $404,599 | 19% | $10.70 | 1/31/2020 |
| Savers | NR/NR/NR | 28,098 | 17% | $280,980 | 14% | $10.00 | 3/31/2020 |
| Staples | BBB-/Baa2/BBB- | 24,049 | 15% | $312,637 | 15% | $13.00 | 2/29/2016 |
| Guitar Center | NR/NR/NR | 12,230 | 8% | $226,255 | 11% | $18.50 | 10/31/2022 |
| Subtotal/Wtd. Avg. | 102,190 | 63% | $1,224,471 | 59% | $11.98 | ||
Other Tenants(4) | 47,408 | 29% | $855,716 | 41% | $18.05 | ||
| Vacant Space | 11,948 | 7% | $0 | 0% | $0.00 | ||
| Total/Wtd. Avg. | 161,546 | 100% | $2,080,187 | 100% | $13.91 | ||
| (1) | Information is based on the underwritten rent roll. |
| (2) | Certain ratings are those of the parent company whether or not the parent guarantees the lease. |
| (3) | Wtd. Avg. Annual UW Rent PSF Rolling excludes vacant space. |
| (4) | Other Tenants includes one tenant that has signed a lease but has not yet taken occupancy. Epoch Health Clinic has signed a lease and commenced paying rent for 6,473 SF, but has not yet taken occupancy of the related space. Epoch Health Clinic is expected to take occupancy by the end of May 2015. Excluding Epoch Health Clinic, the Bowman Station and Chenal Place Shopping Center Property was 88.6% occupied as of March 5, 2015. |
The Market. The Bowman Station and Chenal Place Shopping Center Property is located in Little Rock, Pulaski County, Arkansas, about eight miles from the Little Rock CBD. The Bowman Station and Chenal Place Shopping Center Property is situated in the West Little Rock submarket. 2014 population and median household income within a five-mile radius of the Bowman Station and Chenal Place Shopping Center Property were 115,046 people and $52,653, respectively. The appraisal noted a general submarket vacancy rate of 4.8% as of the third quarter of 2014.
| This is not a research report and was not prepared by the Underwriters’ research departments. Please see additional important information and qualifications at the end of this Term Sheet. |
T-105
| MSBAM 2015-C22 | Bowman Station and Chenal Place Shopping Center |
The following table reflects competitive retail properties in the submarket:
Competitive Property Summary(1) | |||||||||||
| Property Name | Address | Year Built | NRA (SF) | Occ. | Tenant Name | Lease Area | Lease Date | Lease Term (Yrs.) | Annual Base Rent PSF | ||
Bowman Heights | 301-303 South Bowman Road Little Rock, AR | 1997 | 44,000 | 98% | Vacant - Offering K Oriental Store El Torito Chic Nails & Spa Quoted | 860 3,650 1,100 2,027 --- | Dec-14 May-14 Oct-12 Jun-12 --- | 3.0 5.0 3.0 3.0 --- | $17.00 $15.00 $16.75 $16.75 $17.00 | ||
| Chenal Commons | 12801 Chenal Parkway Little Rock, AR | 1999 | 70,147 | 100% | Great Clips Salon Kirkland’s Elegant Nails Old Navy | 1,100 9,604 1,000 15,378 | Nov-12 Nov-10 Jan-06 Jan-04 | 10.0 10.0 10.0 11.5 | $28.00 $20.00 $28.65 $13.00 | ||
| Westchase Plaza | 301 North Shackleford Road Little Rock, AR | 1986 | 64,709 | 92% | Vacant - Offering Vapor Oasis Slim Chickens Merry Maids | 4,972 1,200 2,752 1,195 | Oct-14 May-14 Sep-13 Nov-12 | 3.0 3.0 5.0 3.0 | $13.00 $13.00 $17.00 $13.00 | ||
| Colonnade Shopping Center | 315 North Bowman Road Little Rock, AR | 1988 | 23,710 | 86% | Vacant (2 suites) - Offering Jordan Cooper Rogue Vapors Bruno’s Italian Bistro | 3,350 1,500 1,500 3,200 | Dec-14 Jul-13 Jul-13 Jul-12 | 3.0 5.0 2.0 5.0 | $11.00 $14.00 $11.00 $13.13 | ||
| The Promenade at Chenal | 17711 Chenal Parkway Little Rock, AR | 2008 | 237,492 | 87% | Dickinson Theatre Ya Ya’s Euro Bistro Ann Taylor Loft Bravo Cucina Apple Nike Local Lime GNC Boneheads | 32,130 5,828 5,559 8,000 7,537 12,562 3,493 1,125 2,400 | Jun-08 Feb-09 Mar-09 May-10 Sep-11 Oct-11 Oct-12 Feb-15 Feb-15 | 20.0 10.0 11.0 10.0 10.0 10.0 6.0 5.0 10.0 | $21.88 $42.28 $23.00 $41.87 $31.84 $17.00 $24.00 $28.50 $33.50 | ||
| (1) | Source: Appraisal. |
Operating History and Underwritten Cash Flow. The following table presents certain information relating to the historical operating performance and the Underwritten Cash Flow at the Bowman Station and Chenal Place Shopping Center Property:
| Cash Flow Analysis | |||||||||||||
| 2011 | 2012 | 2013 | 2014 | UW | UW PSF | ||||||||
| Base Rent | $2,026,538 | $2,035,980 | $2,090,049 | $2,052,977 | $2,351,335 | $14.56 | |||||||
| Total Recoveries | $295,977 | $315,064 | $313,198 | $335,419 | $348,599 | $2.16 | |||||||
| Other Income | $2,335 | $619 | $427 | $1,005 | $0 | $0.00 | |||||||
| Discounts Concessions | $0 | $0 | $0 | $0 | $0 | $0.00 | |||||||
| Less Vacancy & Credit Loss | $0 | $0 | $0 | $0 | ($276,743) | ($1.71) | |||||||
| Effective Gross Income | $2,324,850 | $2,351,663 | $2,403,674 | $2,389,402 | $2,423,191 | $15.00 | |||||||
| Total Operating Expenses | $426,501 | $415,961 | $424,893 | $450,305 | $467,977 | $2.90 | |||||||
| Net Operating Income | $1,898,349 | $1,935,701 | $1,978,781 | $1,939,096 | $1,955,215 | $12.10 | |||||||
| Capital Expenditures | $0 | $0 | $0 | $0 | $39,810 | $0.25 | |||||||
| TI/LC | $0 | $0 | $0 | $0 | $101,227 | $0.63 | |||||||
| Net Cash Flow | $1,898,349 | $1,935,701 | $1,978,781 | $1,939,096 | $1,814,177 | $11.23 | |||||||
| Occupancy % | 90.4% | 93.3% | 92.0% | 95.4% | 89.6% | ||||||||
| NOI DSCR | 1.46x | 1.49x | 1.52x | 1.49x | 1.51x | ||||||||
| NCF DSCR | 1.46x | 1.49x | 1.52x | 1.49x | 1.40x | ||||||||
| NOI Debt Yield | 8.8% | 8.9% | 9.1% | 8.9% | 9.0% | ||||||||
| NCF Debt Yield | 8.8% | 8.9% | 9.1% | 8.9% | 8.4% | ||||||||
| This is not a research report and was not prepared by the Underwriters’ research departments. Please see additional important information and qualifications at the end of this Term Sheet. |
T-106
(THIS PAGE INTENTIONALLY LEFT BLANK)
T-107
| MSBAM 2015-C22 | Doubletree by Hilton Hotel Chicago - Alsip |
| Mortgage Loan No. 13 – Doubletree by Hilton Hotel Chicago - Alsip |
| Mortgage Loan Information | Mortgaged Property Information | ||||||
| Mortgage Loan Seller: | MSMCH | Single Asset/Portfolio: | Single Asset | ||||
| Original Balance: | $16,500,000 | Location: | Alsip, IL 60803 | ||||
| Cut-off Date Balance: | $16,454,898 | General Property Type: | Hospitality | ||||
| % of Initial Pool Balance: | 1.5% | Detailed Property Type: | Full Service | ||||
| Loan Purpose: | Refinance | Title Vesting: | Fee | ||||
| Sponsor: | Frank S. Allgauer; Robert J. Washlow | Year Built/Renovated: | 1975/2009 | ||||
| Mortgage Rate: | 4.570% | Size: | 193 Rooms | ||||
| Note Date: | 1/6/2015 | Cut-off Date Balance per Unit: | $85,259 | ||||
| First Payment Date: | 3/1/2015 | Maturity Date Balance per Unit: | $69,444 | ||||
| Maturity Date: | 2/1/2025 | Property Manager: | Newtel Management, L.L.C. | ||||
| Original Term to Maturity: | 120 months | ||||||
| Original Amortization Term: | 360 months | Underwriting and Financial Information | |||||
| IO Period: | 0 months | UW NOI: | $2,019,749 | ||||
| Seasoning: | 2 months | UW NOI Debt Yield: | 12.3% | ||||
| Prepayment Provisions: | LO (26); DEF (90); O (4) | UW NOI Debt Yield at Maturity: | 15.1% | ||||
| Lockbox/Cash Mgmt Status: | Springing/Springing | UW NCF DSCR: | 1.63x | ||||
| Additional Debt Type: | N/A | Most Recent NOI: | $1,759,260 (12/31/2014) | ||||
| Additional Debt Balance: | N/A | 2nd Most Recent NOI: | $2,026,918 (12/31/2013) | ||||
| Future Debt Permitted (Type): | No (N/A) | 3rd Most Recent NOI: | $1,673,659 (12/31/2012) | ||||
| Reserves | Most Recent Occupancy: | 77.1% (10/31/2014) | |||||
| Type | Initial | Monthly | Cap | 2nd Most Recent Occupancy: | 75.5% (12/31/2013) | ||
| RE Tax: | $48,190 | $48,190 | N/A | 3rd Most Recent Occupancy: | 73.1% (12/31/2012) | ||
| Insurance: | $0 | Springing | N/A | Appraised Value (as of): | $28,100,000 (12/1/2014) | ||
| Recurring Replacements: | $0 | $24,080 | N/A | Cut-off Date LTV Ratio: | 58.6% | ||
| PIP Reserve: | $200,000 | $0 | N/A | Maturity Date LTV Ratio: | 47.7% | ||
| Sources and Uses | ||||||
| Sources | Proceeds | % of Total | Uses | Proceeds | % of Total | |
| Loan Amount: | $16,500,000 | 100.0% | Loan Payoff: | $11,820,902 | 71.6% | |
| Reserves: | $248,190 | 1.5% | ||||
| Closing Costs: | $641,284 | 3.9% | ||||
| Return of Equity: | $3,789,625 | 23.0% | ||||
| Total Sources: | $16,500,000 | 100.0% | Total Uses: | $16,500,000 | 100.0% | |
The Mortgage Loan. The thirteenth largest loan (the “Doubletree by Hilton Hotel Chicago - Alsip Mortgage Loan”) is evidenced by a promissory note in the original principal amount of $16,500,000, secured by a first priority fee mortgage on a hospitality property in Alsip, Illinois (the “Doubletree by Hilton Hotel Chicago - Alsip Property”). The proceeds of the Doubletree by Hilton Hotel Chicago - Alsip Mortgage Loan were used primarily to refinance a previously existing loan of $11,820,902 (including defeasance premiums and fees) secured by the Doubletree by Hilton Hotel Chicago - Alsip Property and return equity to the Doubletree by Hilton Hotel Chicago - Alsip Borrower. The previous loan was included in the CD 2006-CD3 transaction.
The Borrower and the Sponsor. The borrower is Alsip Hospitality of Delaware, LLC (the “Doubletree by Hilton Hotel Chicago - Alsip Borrower”), a single-purpose Delaware limited liability company. The Doubletree by Hilton Hotel Chicago - Alsip Borrower is majority owned and controlled by Frank S. Allgauer and Robert J. Washlow. Mr. Allgauer is currently a member of the Hilton Owner’s board that makes policy and sets brand standards. Mr. Allgauer and Mr. Washlow are the nonrecourse carve-out guarantors.
The Property. The Doubletree by Hilton Hotel Chicago - Alsip Property is a five-story, 193 room (91 king rooms and 102 double/double rooms) full service hotel in Alsip, Illinois, approximately 20 miles south of downtown Chicago. The Doubletree by Hilton Hotel Chicago - Alsip Property was constructed in 1975 as a Holiday Inn, was purchased by the loan sponsors and converted to a Radisson in 1996, and then converted to a Doubletree in 2004, with a franchise agreement currently scheduled to expire on June 30, 2016. There is a planned 15-year franchise extension period conditioned on agreement to, but not prior completion of, certain property improvements as discussed below. Since 1996, approximately $12.7 million of capital expenses has been invested in the Doubletree by Hilton Hotel Chicago - Alsip Property. A property improvement program and FF&E upgrade (“PIP/FF&E””) is scheduled over the 18-36 month period following October 27, 2014, with a budget of approximately $1.258 million. The PIP/FF&E work is currently in process. In addition to on-going FF&E reserve collections, a $200,000 PIP reserve was established at closing and can be utilized toward the planned PIP expenditures after the Doubletree by Hilton Hotel Chicago - Alsip Borrower has spent at least $300,000 unassociated with any lender held reserves and any amounts held in the FF&E reserve. In addition, the nonrecourse carve-out guarantors have provided a full PIP guaranty of completion.
In addition to approximately 18,432 SF in meeting space, hotel amenities include a 70-seat restaurant, a 50-seat lounge, an indoor swimming pool, a fitness room, a business center and high speed internet access. As of 2013, demand at the Doubletree by Hilton Hotel Chicago - Alsip Property is approximately 35% commercial, 30% meeting and group, 30% leisure and 5% extended stay.
| This is not a research report and was not prepared by the Underwriters’ research departments. Please see additional important information and qualifications at the end of this Term Sheet. |
T-108
| MSBAM 2015-C22 | Doubletree by Hilton Hotel Chicago - Alsip |
| 2014 Market Historical Occupancy, ADR, RevPAR | |||||||||
| Competitive Set | Doubletree by Hilton Hotel Chicago - Alsip | Penetration Factor | |||||||
| Year | Occupancy | ADR | RevPAR | Occupancy | ADR | RevPAR | Occupancy | ADR | RevPAR |
| 2012 | 60.7% | $103.04 | $62.53 | 71.5% | $108.82 | $77.80 | 117.8% | 105.6% | 124.4% |
| 2013 | 60.9% | $104.35 | $63.50 | 74.6% | $114.63 | $85.56 | 122.6% | 109.9% | 134.7% |
| 2014 | 69.0% | $103.57 | $71.43 | 77.3% | $116.92 | $90.35 | 112.0% | 112.9% | 126.5% |
Source: Industry Report
The Market. The Doubletree by Hilton Hotel Chicago - Alsip Property is located in Alsip, Cook County, Illinois, approximately 20 miles south of downtown Chicago at the intersection of I-294 and West 127th Street, and approximately 9 miles south of Chicago Midway Airport. Demand is generated by numerous companies with a presence in the area. The appraiser does not note any new direct competition currently coming on line.
Competitive properties to the Doubletree by Hilton Hotel Chicago - Alsip Property are shown in the table below:
Competitive Property Summary | ||||||||
| Property Name | Rooms | Commercial % | Meeting & Group % | Leisure % | Extended Stay | Est. 2013 Occupancy | Est. 2013 ADR | Est. 2013 RevPAR |
| Holiday Inn Matteson Conference Center | 202 | 30% | 35% | 30% | 5% | 56% | $104.00 | $58.24 |
| Hilton Chicago Oak Lawn | 184 | 40% | 20% | 35% | 5% | 65% | $116.00 | $75.40 |
| Comfort Inn Southwest Orland Park | 159 | 25% | 50% | 20% | 5% | 61% | $94.00 | $57.34 |
| Holiday Inn Express Crestwood | 123 | 45% | 5% | 45% | 5% | 67% | $96.00 | $64.32 |
| Baymont Alsip | 100 | 40% | 5% | 45% | 10% | 58% | $92.00 | $53.36 |
| Holiday Inn Chicago Tinley Park | 202 | 20% | 55% | 20% | 5% | 63% | $113.00 | $71.19 |
Source: Appraisal
Operating History and Underwritten Cash Flow. The following table presents certain information relating to the historical operating performance and the Underwritten Cash Flow at the Doubletree by Hilton Hotel Chicago - Alsip Property:
| Cash Flow Analysis | |||||||||||||||||
| 2009 | 2010 | 2011 | 2012 | 2013 | 2014 | UW | |||||||||||
| Occupancy | 62.7% | 63.4% | 68.1% | 73.1% | 75.5% | 78.0% | 77.1% | ||||||||||
| ADR | $101.17 | $99.07 | $99.73 | $106.36 | $112.72 | $116.00 | $116.22 | ||||||||||
| RevPAR | $63.40 | $62.85 | $67.94 | $77.74 | $85.09 | $90.45 | $89.61 | ||||||||||
| Rooms Revenue | $4,466,598 | $4,427,894 | $4,785,636 | $5,490,928 | $5,993,941 | $6,354,863 | $6,313,974 | $32,715 | |||||||||
| Food & Beverage | $2,939,816 | $2,956,631 | $3,009,318 | $3,220,180 | $3,059,033 | $3,027,033 | $3,015,762 | $15,626 | |||||||||
| Other Income | $102,409 | $75,814 | $74,553 | $65,750 | $50,703 | $60,145 | $60,799 | $315 | |||||||||
| Total Revenue | $7,508,823 | $7,460,339 | $7,869,507 | $8,776,858 | $9,103,677 | $9,442,041 | $9,390,535 | $48,656 | |||||||||
| Total Expenses | $6,770,741 | $6,617,800 | $6,808,891 | $7,103,199 | $7,076,759 | $7,682,781 | $7,370,786 | $38,191 | |||||||||
| Net Op. Income | $738,082 | $842,539 | $1,060,616 | $1,673,659 | $2,026,918 | $1,759,260 | $2,019,749 | $10,465 | |||||||||
| FF&E | $0 | $0 | $0 | $0 | $0 | $0 | $375,621 | $1,946 | |||||||||
| Net Cash Flow | $738,082 | $842,539 | $1,060,616 | $1,673,659 | $2,026,918 | $1,759,260 | $1,644,128 | $8,519 | |||||||||
| NOI DSCR | 0.73x | 0.83x | 1.05x | 1.65x | 2.00x | 1.74x | 2.00x | ||||||||||
| NCF DSCR | 0.73x | 0.83x | 1.05x | 1.65x | 2.00x | 1.74x | 1.63x | ||||||||||
| NOI Debt Yield | 4.5% | 5.1% | 6.4% | 10.2% | 12.3% | 10.7% | 12.3% | ||||||||||
| NCF Debt Yield | 4.5% | 5.1% | 6.4% | 10.2% | 12.3% | 10.7% | 10.0% | ||||||||||
| This is not a research report and was not prepared by the Underwriters’ research departments. Please see additional important information and qualifications at the end of this Term Sheet. |
T-109
| MSBAM 2015-C22 | St. Anthony Healthplex South |
| Mortgage Loan No. 14 – St. Anthony Healthplex South |
| Mortgage Loan Information | Mortgaged Property Information | ||||||
| Mortgage Loan Seller: | BANA | Single Asset/Portfolio: | Single Asset | ||||
| Original Balance: | $15,875,000 | Location: | Oklahoma City, OK 73170 | ||||
| Cut-off Date Balance: | $15,875,000 | General Property Type: | Office | ||||
| % of Initial Pool Balance: | 1.4% | Detailed Property Type: | Medical | ||||
| Loan Purpose: | Refinance | Title Vesting: | Fee | ||||
| Sponsor: | G. David Neff, Jr.; D. Darin Miller | Year Built/Renovated: | 2012/N/A | ||||
| Mortgage Rate: | 4.740% | Size: | 52,795 SF | ||||
| Note Date: | 10/21/2014 | Cut-off Date Balance per Unit: | $301 | ||||
| First Payment Date: | 12/1/2014 | Maturity Date Balance per Unit: | $265 | ||||
| Maturity Date: | 11/1/2024 | Property Manager: | Commercial Realty Management, LLC | ||||
| Original Term to Maturity: | 120 months | ||||||
| Original Amortization Term: | 360 months | Underwriting and Financial Information | |||||
| IO Period: | 36 months | UW NOI: | $1,319,465 | ||||
| Seasoning: | 5 months | UW NOI Debt Yield: | 8.3% | ||||
| Prepayment Provisions: | LO (29); DEF (87); O (4) | UW NOI Debt Yield at Maturity: | 9.4% | ||||
| Lockbox/Cash Mgmt Status: | Springing/Springing | UW NCF DSCR: | 1.29x | ||||
| Additional Debt Type: | N/A | Most Recent NOI: | |||||
| Additional Debt Balance: | N/A | 2nd Most Recent NOI: | |||||
| Future Debt Permitted (Type): | No (N/A) | 3rd Most Recent NOI: | $999,283 (12/31/2012) | ||||
| Reserves | Most Recent Occupancy: | 78.6% (2/28/2015) | |||||
| Type | Initial | Monthly | Cap | 2nd Most Recent Occupancy: | |||
| RE Tax: | $11,014 | $1,224 | N/A | 3rd Most Recent Occupancy: | 72.0% (12/31/2012) | ||
| Insurance: | $42,803 | $3,891 | N/A | Appraised Value (as of): | $21,900,000 (9/15/2014) | ||
| Recurring Replacements: | $0 | $440 | N/A | Cut-off Date LTV Ratio: | 72.5% | ||
| TI/LC: | $0 | $3,035 | N/A | Maturity Date LTV Ratio: | |||
Other(1): | $0 | Springing | N/A | ||||
| Sources and Uses | |||||||
| Sources | Proceeds | % of Total | Uses | Proceeds | % of Total | ||
| Loan Amount: | $15,875,000 | 100.0% | Loan Payoff: | $12,026,639 | 75.8% | ||
| Reserves: | $53,817 | 0.3% | |||||
| Closing Costs: | $660,758 | 4.2% | |||||
| Return of Equity: | $3,133,787 | 19.7% | |||||
| Total Sources: | $15,875,000 | 100.0% | Total Uses: | $15,875,000 | 100.0% | ||
| (1) | On or prior to January 31, 2020 (the SSM Health Care of Oklahoma, Inc. initial lease expiration date), the St. Anthony Healthplex South Borrower will either (i) deposit to an SSM TI Reserve Account $1,500,000 in the form of either cash or a letter of credit, (ii) provide evidence that the St. Anthony Healthplex South Borrower has obtained the SSM TI Preferred Equity Financing resulting in a net amount of additional capital for the St. Anthony Healthplex South Borrower of not less than $1,500,000, which shall be restricted to use solely for the satisfaction of the SSM TI Obligations or (iii) deposit all excess cash with the lender to be held as additional collateral for the St. Anthony Healthplex South Mortgage Loan. |
The Mortgage Loan. The fourteenth largest mortgage loan (the “St. Anthony Healthplex South Mortgage Loan”) is evidenced by a promissory note in the original principal balance of $15,875,000 and is secured by a first priority fee mortgage encumbering a medical office building located in Oklahoma City, OK (the “St. Anthony Healthplex South Property”). The proceeds of the St. Anthony Healthplex South Mortgage Loan were primarily used to refinance a loan of approximately $12,026,639 secured by the St. Anthony Healthplex South Property and to return equity to the related borrower.
The Borrower and the Sponsor. The borrower is TWODSVENTURE2, LLC (the “St. Anthony Healthplex South Borrower”), a single-purpose Oklahoma limited liability company. The St. Anthony Healthplex South Mortgage Loan sponsors are G. David Neff, Jr. and D. Darin Miller, who co-founded Miller Neff Development (“MN”). MN funds, develops and owns healthcare facilities and commercial office buildings in the United States. Darin Miller is the founder and CEO of Miller Architects Inc. and has over 25 years of experience in healthcare design and construction having completed over 300 projects across the United States. David Neff is the founder of Ancon Development Corporation and, in the last four years, has sold over 20 office buildings and built four medical office buildings.
The Property. The St. Anthony Healthplex South Property consists of a three-story, class “A” medical office building (“MOB”) constructed in 2012 as one part of the four St. Anthony Medical campuses and is located on an 8.00-acre parcel on the east side of Tulsa Avenue just southeast of the intersection of IH-44 and SW 134th Street, approximately six miles west of Moore and four miles south of the Will Rogers Airport. SSM Health Care of Oklahoma, Inc., a Catholic, not-for-profit health care provider, is the largest tenant (37,996 SF and 93% of underwritten base rent) and leases the emergency room (“ER”) hospital and 2nd floor of the MOB space under a lease expiring on January 31, 2022 with four five-year renewal options. The lease provides for a current total rental rate of approximately $34.80 PSF with rent adjustments capped at of 2.5% per year. The ER portion operates under license of St. Anthony Hospital located just north of downtown Oklahoma City. The St. Anthony Healthplex South Borrower has agreed to spend approximately $1,500,000 in tenant improvements upon renewal of the SSM Health Care of Oklahoma, Inc. lease in 2022. Oklahoma Sports & Orthopedics Institute, a sports treatment provider, is the second largest tenant (3,513 SF and 7% of underwritten base rent) and leases the 3rd floor
| This is not a research report and was not prepared by the Underwriters’ research departments. Please see additional important information and qualifications at the end of this Term Sheet. |
T-110
| MSBAM 2015-C22 | St. Anthony Healthplex South |
MOB space under a lease expiring on February 28, 2020 with one five-year renewal option. The lease provides for a current base rental rate of $26.26 PSF, which is scheduled to increase to $28.99 by February 1, 2019. The St. Anthony Healthplex South Property has 220 surface parking spaces (approximately 4.17 spaces per 1,000 SF).
The following table presents a summary of the tenants at the St. Anthony Healthplex South Property:
Tenant Summary(1) | ||||||||
| Tenant Name | Credit Rating (Fitch/Moody’s/S&P)(2) | Tenant SF | Approximate % of SF | Annual UW Rent | % of Total Annual UW Rent | Annual UW Rent PSF(3) | Lease Expiration | |
| SSM Health Care of Oklahoma, Inc. | NR/NR/A+ | 37,996 | 72% | $1,322,261 | 93% | $34.80 | 1/31/2022 | |
| Oklahoma Sports & Orthopedics Institute | NR/NR/NR | 3,513 | 7% | $92,271 | 7% | $26.27 | 2/28/2020 | |
| Subtotal/Wtd. Avg. | 41,509 | 79% | $1,414,532 | 100% | $34.08 | |||
| Vacant Space | 11,286 | 21% | $0 | 0% | $0.00 | |||
| Total/Wtd. Avg. | 52,795 | 100% | $1,414,532 | 100% | $34.08 | |||
| (1) | Information is based on the underwritten rent roll. |
| (2) | Certain ratings are those of the parent company whether or not the parent guarantees the lease. |
| (3) | Wtd. Avg. Annual UW Rent PSF excludes vacant space. |
The Market. The St. Anthony Healthplex South Property is located in Oklahoma City, Cleveland County, Oklahoma. The Oklahoma City market has a total of 1,974,127 SF of medical office with an overall vacancy rate of 5.9% and an average rental rate of $18.40 PSF. The 2014 estimated population within a one-, three- and five-mile radius, was 275, 18,971 and 83,767, respectively. The 2014 estimated average household income within a one-, three- and five-mile radius, was $75,085, $76,208 and $58,213, respectively.
The following table presents a summary regarding comparable hospital rentals to the St. Anthony Healthplex South Property:
| Directly Competitive Hospital Buildings Summary | ||||||||||||
| Property Name | Address | Year Built | Stories | SF | Lease Start | Term (Mos.) | Rent PSF (NNN) | Parking Ratio | ||||
| St. Anthony Healthplex East | 3400 S. Douglas Blvd. Oklahoma City, OK | 2012 | 3 | 37,996 | Jan-12 | 121 | $31.26 | 4.2/1,000 | ||||
| St. Anthony Healthplex North | 2000 W. Memorial Rd. Oklahoma City, OK | 2015 | 3 | 67,717 | Jan-15 | 120 | $34.19 | 2.4/1,000 | ||||
| St. Anthony Healthplex West | 900 SW. 74th St. Mustang, OK | 2015 | 3 | 58,500 | Jan-15 | 120 | $33.89 | 2.0/1,000 | ||||
Source: Appraisal
The following table presents a summary regarding comparable MOB rentals to the St. Anthony Healthplex South Property:
| Directly Competitive MOB Buildings Summary | ||||||||||||||
| Property Name | Address | Year Built | Stories | SF | Lease Start | Term (Mos.) | Rent PSF (Full Service) | Parking Ratio | ||||||
| Water Oak Medical Center | 10914 Hefner Pointe Dr. Oklahoma City, OK | 2001 | 3 | 3,250 5,600 | Oct-12 Jul-14 | 36 84 | $22.00 $20.00 | 4.4/1,000 | ||||||
| St. Anthony Healthplex East | 3400 S. Douglas Blvd. Oklahoma City, OK | 2012 | 3 | 3,513 2,193 | May-14 Jun-14 | 60 36 | $26.00 $21.89 | 4.2/1,000 | ||||||
Source: Appraisal
| This is not a research report and was not prepared by the Underwriters’ research departments. Please see additional important information and qualifications at the end of this Term Sheet. |
T-111
| MSBAM 2015-C22 | St. Anthony Healthplex South |
Operating History and Underwritten Cash Flow. The following table presents certain information relating to the historical operating performance and the underwritten cash flow at the St. Anthony Healthplex South Property:
| 2011 | 2012 | 2013 | 2014 | UW | UW PSF | ||||||||
| Base Rent | N/A | $1,104,455 | $1,363,979 | $1,304,841 | $1,696,682 | $32.14 | |||||||
| Expense Reimbursements | N/A | $70,489 | $180,147 | $177,131 | $171,918 | $3.26 | |||||||
| CAM Reimbursement | N/A | $0 | $0 | $0 | $0 | $0.00 | |||||||
| Other Income | N/A | $0 | $4,931 | $5,334 | $0 | $0.00 | |||||||
| Less Vacancy & Credit Loss | N/A | $0 | $0 | $0 | ($282,150) | (15.1%) | |||||||
| Effective Gross Income | N/A | $1,174,944 | $1,549,057 | $1,487,306 | $1,586,450 | $30.05 | |||||||
| Total Operating Expenses | N/A | $175,661 | $240,452 | $239,029 | $266,985 | $5.06 | |||||||
| Net Operating Income | N/A | $999,283 | $1,308,605 | $1,248,277 | $1,319,465 | $24.99 | |||||||
| Capital Expenditures | N/A | $0 | $0 | $0 | $5,280 | $0.10 | |||||||
| TI/LC | N/A | $0 | $0 | $0 | $36,500 | $0.69 | |||||||
| Net Cash Flow | N/A | $999,283 | $1,308,605 | $1,248,277 | $1,277,685 | $24.20 | |||||||
| Occupancy | N/A | 72.0% | 78.6% | 78.6%(1) | 84.9% | ||||||||
| NOI DSCR | N/A | 1.01x | 1.32x | 1.26x | 1.33x | ||||||||
| NCF DSCR | N/A | 1.01x | 1.32x | 1.26x | 1.29x | ||||||||
| NOI Debt Yield | N/A | 6.3% | 8.2% | 7.9% | 8.3% | ||||||||
| NCF Debt Yield | N/A | 6.3% | 8.2% | 7.9% | 8.0% | ||||||||
| (1) | Information is based on the St. Anthony Healthplex South Borrower rent roll dated February 28, 2015. |
| This is not a research report and was not prepared by the Underwriters’ research departments. Please see additional important information and qualifications at the end of this Term Sheet. |
T-112
(THIS PAGE INTENTIONALLY LEFT BLANK)
T-113
| MSBAM 2015-C22 | Marriott Hotel Visalia |
| Mortgage Loan No. 15 – Marriott Hotel Visalia |
| Mortgage Loan Information | Mortgaged Property Information | ||||||
| Mortgage Loan Seller: | BANA | Single Asset/Portfolio: | Single Asset | ||||
| Original Balance: | $14,700,000 | Location: | Visalia, CA 93291 | ||||
| Cut-off Date Balance: | $14,700,000 | General Property Type: | Hospitality | ||||
| % of Initial Pool Balance: | 1.3% | Detailed Property Type: | Full Service | ||||
| Loan Purpose: | Acquisition | Title Vesting: | Fee | ||||
| Sponsor: | Amar Shokeen | Year Built/Renovated: | 1990/2006 | ||||
| Mortgage Rate: | 4.464% | Size: | 195 Rooms | ||||
| Note Date: | 3/12/2015 | Cut-off Date Balance per Unit: | $75,385 | ||||
| First Payment Date: | 5/1/2015 | Maturity Date Balance per Unit: | $61,027 | ||||
| Maturity Date: | 4/1/2025 | Property Manager: | Welcome Group Management LLC | ||||
| Original Term to Maturity: | 120 months | ||||||
| Original Amortization Term: | 360 months | Underwriting and Financial Information | |||||
| IO Period: | 0 months | UW NOI: | $1,769,067 | ||||
| Seasoning: | 0 months | UW NOI Debt Yield: | 12.0% | ||||
| Prepayment Provisions: | LO (24); DEF (92); O (4) | UW NOI Debt Yield at Maturity: | 14.9% | ||||
| Lockbox/Cash Mgmt Status: | Springing/Springing | UW NCF DSCR: | 1.61x | ||||
| Additional Debt Type: | N/A | Most Recent NOI: | $1,792,654 (2/28/2015 TTM) | ||||
| Additional Debt Balance: | N/A | 2nd Most Recent NOI: | $1,807,996 (12/31/2014) | ||||
| Future Debt Permitted (Type): | No (N/A) | 3rd Most Recent NOI: | $1,796,342 (12/31/2013) | ||||
| Reserves | Most Recent Occupancy: | 73.2% (2/28/2015) | |||||
| Type | Initial | Monthly | Cap | 2nd Most Recent Occupancy: | 71.1% (12/31/2013) | ||
| RE Tax: | $0 | $13,471 | N/A | 3rd Most Recent Occupancy: | 67.4% (12/31/2012) | ||
| Insurance: | $0 | Springing | N/A | Appraised Value (as of)(2): | $20,950,000 (1/9/2017) | ||
Recurring Replacements(1): | $0 | $28,000 | N/A | Cut-off Date LTV Ratio(2): | 70.2% | ||
PIP(2): | $1,780,600 | $0 | N/A | Maturity Date LTV Ratio(2): | 56.8% | ||
| Sources and Uses | ||||||
| Sources | Proceeds | % of Total | Uses | Proceeds | % of Total | |
| Loan Amount: | $14,700,000 | 76.2% | Purchase Price: | $17,250,000 | 89.4% | |
| Borrower Equity: | $4,601,620 | 23.8% | Reserves: | $1,780,600 | 9.2% | |
| Closing Costs: | $271,020 | 1.4% | ||||
| Total Sources: | $19,301,620 | 100.0% | Total Uses: | $19,301,620 | 100.0% | |
| (1) | The FF&E monthly payment amount will be adjusted annually. |
| (2) | The appraised value represents the “Prospective upon Completion & Stabilization” value, which is dependent on a stabilized occupancy and the completion over the next 18 months of a property improvement plan for which $1,780,600 was reserved at origination. The “as is” appraised value as of January 9, 2015 is $17,250,000, which would result in a Cut-off Date LTV Ratio of 85.2%. |
The Mortgage Loan. The fifteenth largest mortgage loan (the “Marriott Hotel Visalia Mortgage Loan”) is evidenced by a promissory note in the original principal amount of $14,700,000, secured by a first priority fee mortgage encumbering a full service hospitality property located in Visalia, California (the “Marriott Hotel Visalia Property”). The proceeds of the Marriott Hotel Visalia Mortgage Loan were used to finance the acquisition of the Marriott Hotel Visalia Property for a purchase price of approximately $17.3 million.
The Borrower and the Sponsor. The borrower is Hotel Circle GL Holding LLC (the “Marriott Hotel Visalia Borrower”), a single-purpose Delaware limited liability company. The Marriott Hotel Visalia Borrower is indirectly wholly owned by Amar Shokeen. Amar Shokeen is the nonrecourse carve-out guarantor and sponsor. Amar Shokeen is an experienced real estate investor with a focus on hospitality and the founder and chief executive officer of RJT Compuquest, Inc., an enterprise resource planning and information technology consulting services provider, and founder and president of the Welcome Group Management LLC, the Marriott Hotel Visalia Property manager, which currently owns and manages seven hotel properties, located in five states: three in California, one in Massachusetts, one in Connecticut, one in Indiana and one in Virginia.
The Property. The Marriott Hotel Visalia Property is an eight-story, 195-room full service hospitality property built in 1990 in conjunction with the expansion of the Visalia Convention Center. With 114,000 SF of gross meeting space and 49,500 SF of exhibit and meeting space, the Visalia Convention Center is a complementary facility to the Marriott Hotel Visalia Property. In 2006, the Marriott Hotel Visalia Property was converted to a Marriott from a Radisson hotel through an approximate $6,250,000 property improvement plan. The Marriott Hotel Visalia Property is currently undergoing the first phase of another property improvement plan expected to be completed over the next 18 months for which $1,780,600 has been reserved. The Marriott Hotel Visalia Property is centrally located in the downtown area of the city of Visalia and just north of Highway 198, approximately 35 miles northeast from the Sequoia and Kings Canyon National parks. The Marriott Hotel Visalia Property has a guest room configuration that consists of 89 standard king rooms, 99 standard double rooms, one two-bedroom suite, five one-bedroom suites and a presidential suite. Amenities at the Marriott Hotel Visalia Property include approximately 5,018 SF of meeting space, an on-site restaurant and lounge, outdoor heated pool and spa, fitness room and business center. The Marriott Hotel Visalia Property carries a Marriott International, Inc. flag under a franchise agreement that runs through January 12, 2027.
| This is not a research report and was not prepared by the Underwriters’ research departments. Please see additional important information and qualifications at the end of this Term Sheet. |
T-114
| MSBAM 2015-C22 | Marriott Hotel Visalia |
| Marriott Hotel Visalia Property Market Historical Occupancy, ADR, RevPAR | |||||||||
| Competitive Set | Marriott Hotel Visalia Property | Penetration Factor | |||||||
| Year | Occupancy | ADR | RevPAR | Occupancy | ADR | RevPAR | Occupancy | ADR | RevPAR |
| 2009 | 55.2% | $77.98 | $43.03 | 61.5% | $107.67 | $66.20 | 111.4% | 138.1% | 153.8% |
| 2010 | 55.5% | $74.83 | $41.50 | 64.3% | $105.35 | $67.77 | 116.0% | 140.8% | 163.3% |
| 2011 | 58.9% | $75.56 | $44.52 | 65.3% | $109.79 | $71.75 | 110.9% | 145.3% | 161.1% |
| 2012 | 58.9% | $76.55 | $45.06 | 67.4% | $108.56 | $73.12 | 114.4% | 141.8% | 162.3% |
| 2013 | 62.1% | $78.83 | $48.92 | 71.1% | $113.23 | $80.55 | 114.6% | 143.6% | 164.7% |
| 2/28/2015 TTM | 69.5% | $80.88 | $56.24 | 73.2% | $118.25 | $86.61 | 105.3% | 146.2% | 154.0% |
Source: Industry Report
The Market. The Marriott Hotel Visalia Property is located in Visalia, within Tulare County, California. Hotel demand for the neighborhood is primarily generated by business and group travelers (approximately 45% and 20%, respectively, of the competitive set demand) who desire full-service hotel amenities and easy convenience to the Visalia Convention Center. Leisure demand (approximately 33% of the competitive set demand) is also generated by visitors to Sequoia and Kings Canyon National Parks. Government comprises approximately 2% of the competitive set demand.
The city of Visalia is located in the west central portion of Tulare County and as the largest city and county seat, is considered to be the cultural, economic and commercial hub of the county. The five largest employers in Visalia are County of Tulare (approximately 3,200 employees), Visalia Unified School District (approximately 2,130 employees), Kaweah Delta District Hospital (approximately 2,000 employees), College of Sequoias (approximately 1,106 employees) and Nash De Camp (approximately 800 employees). The 2014 estimated population within a one-, three- and five-mile radius of the Marriott Hotel Visalia Property was 14,060, 105,611 and 144,114, respectively. The 2014 estimated average household income within a one-, three- and five-mile radius, was $44,114, $62,314 and $66,326, respectively.
Competitive properties to the Marriott Hotel Visalia Property are shown in the table below:
| Competitive Property Summary | ||||||||
| Property Name | Rooms | Commercial % | Meeting & Group % | Leisure % | Government % | 2014 Occupancy | 2014 ADR | 2014 RevPAR |
| Marriott Hotel Visalia Property | 195 | 55% | 22% | 21% | 2% | 74% | $118.54 | $87.58 |
| Holiday Inn Visalia | 256 | 45% | 25% | 28% | 2% | 64% | $95.00 | $60.80 |
| Fairfield Inn Visalia | 63 | 35% | 10% | 53% | 2% | 75% | $107.00 | $80.25 |
| Hampton Inn Visalia | 88 | 35% | 10% | 53% | 2% | 76% | $108.00 | $82.08 |
| Comfort Inn Visalia | 64 | 25% | 8% | 65% | 2% | 75% | $90.00 | $67.50 |
| Best Western Town & Country | 93 | 25% | 10% | 63% | 2% | 68% | $85.00 | $57.80 |
| Marriott Bakersfield Convention Ctr. | 259 | 55% | 22% | 21% | 2% | 79% | $98.00 | $77.42 |
| Radisson Fresno Conference Ctr. | 197 | 45% | 25% | 28% | 2% | 69% | $95.00 | $65.55 |
| Total/Wtd. Avg. | 1,215 | 45% | 20% | 33% | 2% | 72% | $100.23 | $72.08 |
Source: Appraisal
Operating History and Underwritten Cash Flow. The following table presents certain information relating to the historical operating performance and the Underwritten Cash Flow at the Marriott Hotel Visalia Property:
| Cash Flow Analysis | |||||||||||
| 2012 | 2013 | 2014 | 2/28/2015 TTM | UW | |||||||
Occupancy(1) | 67.4% | 71.1% | 73.9% | 73.2% | 73.2% | ||||||
ADR(1) | $108.56 | $113.23 | $117.10 | $118.25 | $119.88 | ||||||
RevPAR(1) | $73.12 | $80.55 | $86.53 | $86.61 | $87.75 | ||||||
| Rooms Revenue | $5,290,710 | $5,800,089 | $6,233,350 | $6,244,952 | $6,244,952 | $32,025 | |||||
| Food and Beverage | $1,580,263 | $2,069,861 | $1,945,732 | $1,998,197 | $1,998,197 | $10,247 | |||||
| Other Income | $177,249 | $149,475 | $140,103 | $140,591 | $145,722 | $747 | |||||
| Total Revenue | $7,048,222 | $8,019,425 | $8,319,185 | $8,383,740 | $8,388,871 | $43,020 | |||||
| Total Expenses | $5,523,170 | $6,223,083 | $6,511,189 | $6,591,086 | $6,619,804 | $33,948 | |||||
| Net Op. Income | $1,525,052 | $1,796,342 | $1,807,996 | $1,792,654 | $1,769,067 | $9,072 | |||||
| FF&E | $0 | $0 | $0 | $0 | $335,555 | $1,721 | |||||
| Net Cash Flow | $1,525,052 | $1,796,342 | $1,807,996 | $1,792,654 | $1,433,512 | $7,351 | |||||
| NOI DSCR | 1.71x | 2.02x | 2.03x | 2.01x | 1.99x | ||||||
| NCF DSCR | 1.71x | 2.02x | 2.03x | 2.01x | 1.61x | ||||||
| NOI Debt Yield | 10.4% | 12.2% | 12.3% | 12.2% | 12.0% | ||||||
| NCF Debt Yield | 10.4% | 12.2% | 12.3% | 12.2% | 9.8% | ||||||
| (1) | Sourced from Industry Report |
| This is not a research report and was not prepared by the Underwriters’ research departments. Please see additional important information and qualifications at the end of this Term Sheet. |
T-115
| MSBAM 2015-C22 |
This Term Sheet was prepared by sales, trading, banking or other non-research personnel of one of the following: Morgan Stanley & Co. LLC, Morgan Stanley & Co. International Limited, Morgan Stanley Japan Limited and/or Morgan Stanley Dean Witter Asia Limited (together with their affiliates, hereinafter “Morgan Stanley”), Merrill Lynch, Pierce, Fenner & Smith Incorporated (together with its affiliates, “BofA Merrill Lynch”), CIBC World Markets Corp. (together with its affiliates, “CIBCWM”) or Drexel Hamilton, LLC (together with its affiliates, “Drexel” and, collectively with Morgan Stanley, BofA Merrill Lynch and CIBCWM, the “Underwriters”). This Term Sheet was not produced by an Underwriter’s research analyst, although it may refer to a Morgan Stanley, BofA Merrill Lynch or CIBCWM research analyst or research report. Unless otherwise indicated, these views (if any) are the author’s and may differ from those of the fixed income or equity research departments of the Underwriters or others in those firms.
This Term Sheet may have been prepared by or in conjunction with the respective trading desks of the Underwriters that may deal as principal in or own or act as market maker or liquidity provider for the securities/instruments (or related derivatives) mentioned herein. The trading desk may have accumulated a position in the subject securities/instruments based on the information contained herein. Trading desk materials are not independent of the proprietary interests of the Underwriters, which may conflict with your interests. Each of the Underwriters may also perform or seek to perform investment banking services for the issuers of the securities and instruments mentioned herein.
The information contained in this Term Sheet is subject to change, completion or amendment from time to time, and the information in this Term Sheet supersedes information in any other communication other than in any other Free Writing Prospectus relating to the securities referred to in this Term Sheet. This Term Sheet is not a solicitation to participate in any trading strategy, and is not an offer to sell any security or instrument or a solicitation of an offer to buy or sell any security or instrument in any jurisdiction where the offer, solicitation or sale is not permitted. Unless otherwise set forth in this material, any securities referred to in this material may not have been registered under the U.S. Securities Act of 1933, as amended, and, if not, may not be offered or sold absent an exemption therefrom. Recipients are required to comply with any legal or contractual restrictions on their purchase, holding, sale, exercise of rights or performance of obligations under any securities/instruments transaction.
The securities/instruments discussed in this Term Sheet may not be suitable for all investors. This Term Sheet has been prepared and issued by the Underwriters for intended distribution to market professionals and institutional investor clients. Other recipients should seek independent investment advice prior to making any investment decision based on this Term Sheet. This Term Sheet does not provide individually tailored investment advice or offer tax, regulatory, accounting or legal advice. Prior to entering into any proposed transaction, recipients should determine, in consultation with their own investment, legal, tax, regulatory and accounting advisors, the economic risks and merits, as well as the legal, tax, regulatory and accounting characteristics and consequences, of the transaction. You should consider this Term Sheet as only a single factor in making an investment decision.
The value of and income from investments may vary because of changes in interest rates, foreign exchange rates, default rates, prepayment rates, securities/instruments prices, market indexes, operational or financial conditions of companies or other factors. There may be time limitations on the exercise of options or other rights in securities/instruments transactions. Past performance is not necessarily a guide to future performance. Estimates of future performance are based on assumptions that may not be realized. Actual events may differ from those assumed and changes to any assumptions may have a material impact on any projections or estimates. Other events not taken into account may occur and may significantly affect the projections or estimates. Certain assumptions may have been made for modeling purposes only to simplify the presentation and/or calculation of any projections or estimates, and the Underwriters do not represent that any such assumptions will reflect actual future events. Accordingly, there can be no assurance that estimated returns or projections will be realized or that actual returns or performance results will not materially differ from those estimated herein. Some of the information contained in this document may be aggregated data of transactions in securities or other financial instruments executed by one or more Underwriters that has been compiled so as not to identify the underlying transactions of any particular customer.
Notwithstanding anything herein to the contrary, the Underwriters and each recipient hereof (and their employees, representatives, and other agents) may disclose to any and all persons, without limitation of any kind from the commencement of discussions, the U.S. federal and state income tax treatment and tax structure of the transaction and all materials of any kind (including opinions or other tax analyses) that are provided to it relating to the tax treatment and tax structure (as such terms are defined in Treasury Regulation 1.6011-4). For this purpose, “tax structure” is limited to facts relevant to the U.S. federal and state income tax treatment of the transaction and does not include information relating to the identity of the parties, their affiliates, agents or advisors. This authorization of tax disclosure is retroactively effective to the commencement of discussions with prospective investors regarding the transactions contemplated herein.
In the United Kingdom, this Free Writing Prospectus is directed only at persons who (i) have professional experience in matters relating to investments and who qualify as investment professionals in accordance with Article 19(5) or (ii) are persons falling within Article 49(2) (“high net worth companies, unincorporated associations etc.”) of the Financial Services and Markets Act 2000 (Financial Promotion) Order 2005 (all such persons together being referred to as “relevant persons”). This Free Writing Prospectus must not be acted on or relied on by persons who are not relevant persons. Any investment or investment activity to which this Free Writing Prospectus relates is available only to relevant persons and will be engaged in only with relevant persons.
THE OFFERED CERTIFICATES HAVE NOT BEEN AND WILL NOT BE REGISTERED UNDER THE FINANCIAL INSTRUMENTS EXCHANGE ACT OF JAPAN (LAW NO. 25 OF 1948, AS AMENDED (THE “FIEL”)), AND EACH UNDERWRITER HAS AGREED THAT IT WILL NOT OFFER OR SELL ANY OFFERED CERTIFICATES, DIRECTLY OR INDIRECTLY, IN JAPAN OR TO, OR FOR THE BENEFIT OF, ANY JAPANESE PERSON, OR TO OTHERS FOR RE-OFFERING OR RESALE, DIRECTLY OR INDIRECTLY, IN JAPAN OR TO ANY JAPANESE PERSON, EXCEPT PURSUANT TO AN EXEMPTION FROM THE REGISTRATION REQUIREMENTS OF, AND OTHERWISE IN COMPLIANCE WITH, THE FIEL AND ANY OTHER APPLICABLE LAWS AND REGULATIONS. FOR THE PURPOSES OF THIS PARAGRAPH, “JAPANESE PERSON” SHALL MEAN ANY PERSON RESIDENT IN JAPAN, INCLUDING ANY CORPORATION OR OTHER ENTITY ORGANIZED UNDER THE LAWS AND REGULATIONS OF JAPAN.
© 2015 Morgan Stanley