
June 30, 2024 Investor Presentation Fidelis Insurance Group

Cautionary Note Regarding Forward-Looking Statements This document (including the documents incorporated herein) contains, and our officers and representatives may from time to time make (including on our related conference call), "forward-looking statements" which include all statements that do not relate solely to historical or current facts and which may concern our strategy, plans, projections or intentions and are made pursuant to the safe harbor provisions of the U.S. Private Securities Litigation Reform Act of 1995 (“PSLRA”). Forward-looking statements can be identified by words such as: "anticipate," "intend," "plan," "goal," "seek," "believe," "project," "estimate," "expect," "strategy," "predict," "potential," "assumption," "future," "likely," "may," "should," "could," "will" and the negative of these and also similar terms and phrases. Forward-looking statements are neither historical facts nor assurances of future performance. Instead, they are qualified by these cautionary statements, because they are based only on our current beliefs, expectations and assumptions regarding the future of our business, future plans and strategies, projections, anticipated events and trends, the economy and other future conditions, but are subject to significant business, economic and competitive uncertainties, many of which are beyond our control or are subject to change. Our actual results and financial condition may differ materially from those indicated in the forward-looking statements. Therefore, you should not rely on any of these forward-looking statements. Examples of forward-looking statements include, among others, statements we make in relation to: discussion relating to net income and net income per share; expected operating results, such as revenue growth and earnings; our expectations regarding our strategy and the performance of our business; information regarding our estimates for catastrophes and other loss events; our liquidity and capital resources; and expectations of the effect on our financial condition of claims, litigation, environmental costs, contingent liabilities and governmental and regulatory investigations and proceedings. Our actual results in the future could differ materially from those anticipated in any forward-looking statements as a result of changes in assumptions, risks, uncertainties and other factors impacting us, many of which are outside our control, including: the ongoing trend of premium rate hardening and factors likely to drive continued rate hardening; expected growth across our portfolio; the availability of outwards reinsurance and capital resources as required; the development and pattern of earned and written premiums impacting embedded premium value; changes in accounting principles or the application thereof; the level of underwriting leverage; the level and timing of catastrophe and other losses and related reserves on the business we underwrite; the performance of our investment portfolios; our strategic relationship with The Fidelis Partnership; the maintenance of financial strength ratings; the impact of global geopolitical and economic uncertainties impacting the lines of business we write; the impact of tax reform and insurance regulation in the jurisdictions where our businesses are located; and those risks, uncertainties and other factors disclosed under the section titled ‘Risk Factors’ in Fidelis Insurance Holdings Limited’s Form 20-F and other SEC filings made by the Company and available on www.sec.gov. Any forward-looking statements, expectations, beliefs and projections made by us in this release and on our related conference call speak only as of the date on which they are made and are expressed in good faith and our management believes that there is reasonable basis for them, based only on information currently available to us. However, there can be no assurance that management’s expectations, beliefs, and projections will be achieved and actual results may vary materially from what is expressed or indicated by the forward-looking statements. Furthermore, our past performance, and that of our management team and of The Fidelis Partnership, should not be construed as a guarantee of future performance. We undertake no obligation to publicly update any forward-looking statement, whether written or oral, that may be made from time to time, whether as a result of new information, future developments or otherwise. RPI Measure Renewal price index (RPI) is a measure that Fidelis has used to assess an approximate index of rate increases on a particular set of contracts, using the base of 100% for the rates for the relevant prior year. Although management considers RPI to be an appropriate statistical measure, it is not a financial measure that directly relates to the Fidelis consolidated financial results. Management’s calculation of RPI involves a degree of judgment in relation to comparability of contracts and the relative impacts of changes in price, exposure, retention levels, as well as any other changing terms and conditions on the RPI calculation. Consideration is given to potential renewals of a comparable nature so it does not reflect every contract in Fidelis’ portfolio. The future profitability and performance of a portfolio of contracts expressed within the RPI is dependent upon many factors besides the trends in premium rates, including policy terms, conditions and wording. Safe Harbor Statement 2
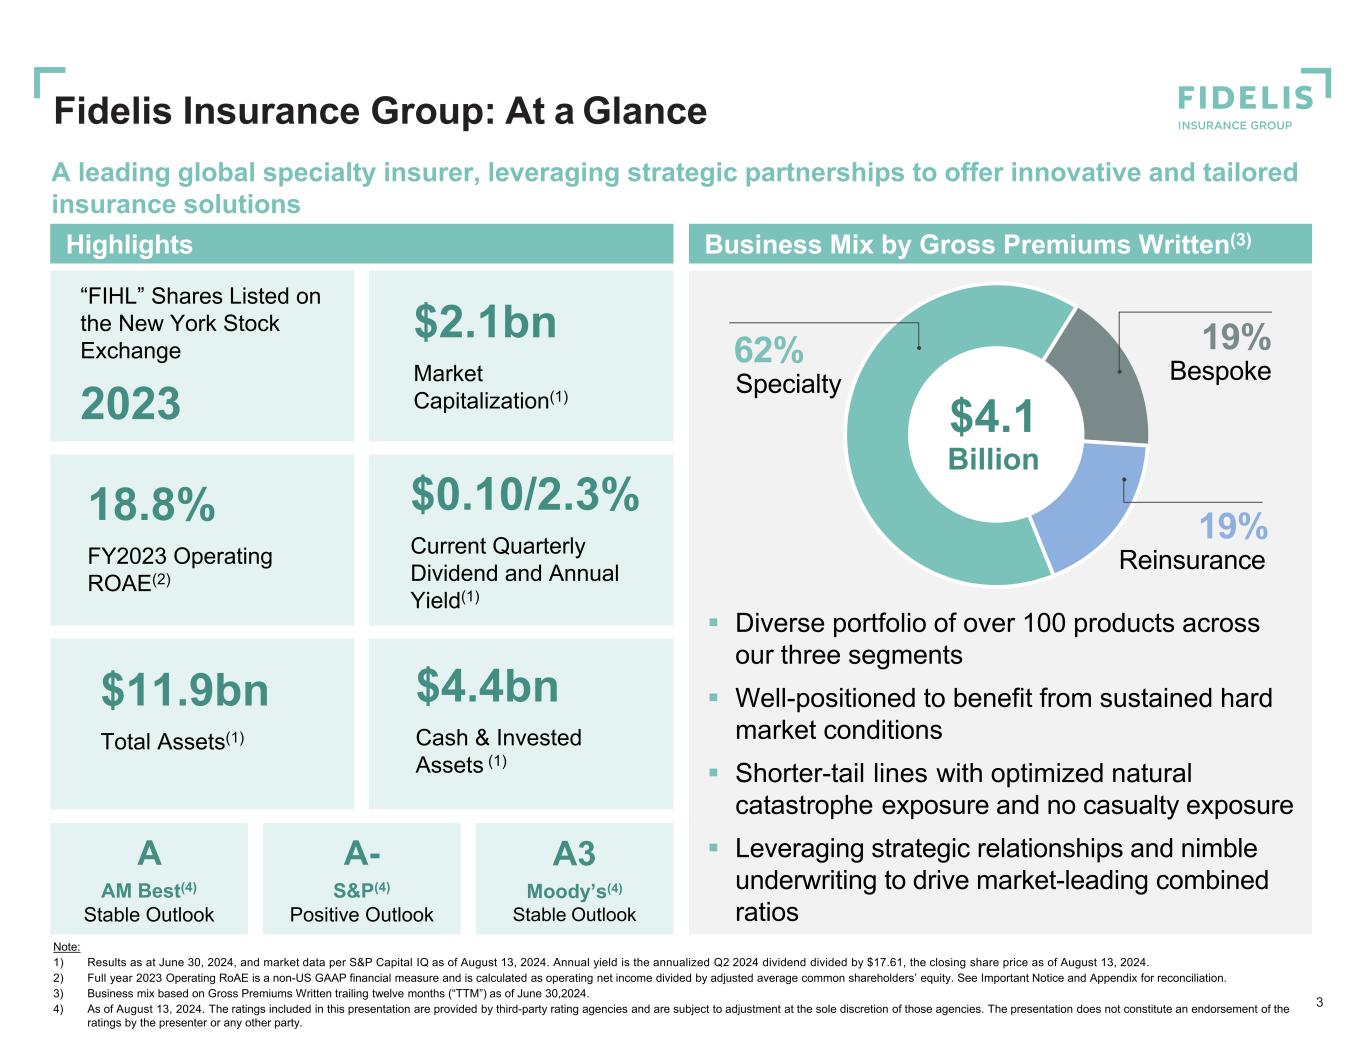
Highlights A leading global specialty insurer, leveraging strategic partnerships to offer innovative and tailored insurance solutions 3 Note: 1) Results as at June 30, 2024, and market data per S&P Capital IQ as of August 13, 2024. Annual yield is the annualized Q2 2024 dividend divided by $17.61, the closing share price as of August 13, 2024. 2) Full year 2023 Operating RoAE is a non-US GAAP financial measure and is calculated as operating net income divided by adjusted average common shareholders’ equity. See Important Notice and Appendix for reconciliation. 3) Business mix based on Gross Premiums Written trailing twelve months (“TTM”) as of June 30,2024. 4) As of August 13, 2024. The ratings included in this presentation are provided by third-party rating agencies and are subject to adjustment at the sole discretion of those agencies. The presentation does not constitute an endorsement of the ratings by the presenter or any other party. Business Mix by Gross Premiums Written(3) 19% Reinsurance 19% Bespoke62% Specialty Diverse portfolio of over 100 products across our three segments Well-positioned to benefit from sustained hard market conditions Shorter-tail lines with optimized natural catastrophe exposure and no casualty exposure Leveraging strategic relationships and nimble underwriting to drive market-leading combined ratios $11.9bn Total Assets(1) 18.8% FY2023 Operating ROAE(2) $0.10/2.3% Current Quarterly Dividend and Annual Yield(1) A AM Best(4) Stable Outlook A- S&P(4) Positive Outlook A3 Moody’s(4) Stable Outlook Fidelis Insurance Group: At a Glance $4.1 Billion $2.1bn Market Capitalization(1) $4.4bn Cash & Invested Assets (1) “FIHL” Shares Listed on the New York Stock Exchange 2023

5.7% 18.8% 12.0% 13 – 15% 2020-2022 Avg. 2023 Q1 2024 Annualized Long-Term Target Operating RoAE Operating RoAE(4) (3) Building on a Strong Foundation for Scale and Profitable Growth 4 GPW Growth Q2 2024 YTD YoY Growth of 22.9% ($bn) Note: Peer set includes Beazley (“BEZ”), Lancashire (“LRE”), Conduit (“CRE”), Hamilton (“HG”), Everest (“EG”), Axis (“AXS”), Berkley (“WRB”), and Markel (“MKL”). 1) Calculated as the sum of losses and loss adjustment expenses, policy acquisition expenses and general and administrative expenses as a percentage of NPE in all periods except 2018. 2) CRE, BEZ and LRE excluded in 2023 peer average as combined ratios are no longer reported on a like for like basis vs. previous years following adoption of IFRS 17. Furthermore, CRE is excluded from 2018 – 2020 peer average and HG for 2018. 3) Annualized Q2 2024 RoAE is based on an operating RoAE of 6.0% for the six months ended June 30, 2024. 4) Operating RoAE is a non-US GAAP financial measure and is calculated as operating net income divided by adjusted average common shareholders’ equity. See Important Notice and Appendix for reconciliation. 5) This slide contains statements covered by the PSLRA that do not relate solely to historical or current facts, and which may concern the Company's strategy, plans, projections, or intentions. These statements are subject to certain assumptions, which reflect the Company's current, long-term views with respect to ongoing and future events and market conditions. The company's actual results in the future could differ materially from these anticipated in any forward-looking statements. The company's expectations, beliefs, and projections are expressed in good faith and the Company believes that there is reasonable basis for them. However, there can be no assurance that management's expectations, beliefs, and projections will result or be achieved, and actual results may vary materially from what is expressed or indicated by the forward-looking statements. See Safe Harbor Statement on Slide 2. Combined Ratio(1) 2018 – 2023 Peer(2) Avg: 100.2% 2018 – 2023 Fidelis Avg: 85.8% $0.7 $0.8 $1.6 $2.8 $3.0 $3.6 2018 2019 2020 2021 2022 2023 Q2 2024 TTM 81% 86% 80% 93% 92% 82% 89% 2018 2019 2020 2021 2022 2023 Q1 2024 (5) 2 $4.1 2 YTD YTD

Long-Term Shareholder Value Creation Framework 5 Capital Management 13-15%(1) Long-Term Target Underwriting Profitability Investment Returns Mid to High 80s%(1) Long-Term Target Combined Ratio ■ Allocating capital into attractive underwriting opportunities ■ Constantly reassessing our outwards reinsurance purchasing ■ Optimizing returning excess capital to shareholders through a combination of dividends and opportunistic share buybacks Operating ROAE Maximizing value for shareholders, long-term, by growing book value, generating consistent returns, and optimizing capital management Note: 1) This slide contains statements covered by the PSLRA that do not relate solely to historical or current facts, and which may concern the Company’s strategy, plans, projections, or intentions. These statements are subject to certain assumptions, which reflect the Company’s current, long-term views with respect to ongoing and future events and market conditions. The company’s actual results in the future could differ materially from these anticipated in any forward- looking statements. The company’s expectations, beliefs, and projections are expressed in good faith and the Company believes that there is reasonable basis for them. However, there can be no assurance that management’s expectations, beliefs, and projections will result or be achieved, and actual results may vary materially from what is expressed or indicated by the forward-looking statements. See Safe Harbor Statement on Slide 2. Embedded portfolio yield + new money rate

Why Invest in Fidelis Insurance Group 6 High quality book of specialty insurance business that creates long-term value by delivering returns to shareholders Note: 1) This slide contains forward looking statements covered by the PSLRA. See Safe Harbor Statement on Slide 2. High quality, mature, and well positioned specialty insurance portfolio with historically leading performance Strong premium growth in attractive lines capitalizing on hard market conditions Track record of delivering compelling combined ratios compared to peers Robust capital position with a disciplined and nimble approach to capital management, including returning capital to shareholders Highly experienced leadership team with extensive underwriting, capital, and investment management expertise
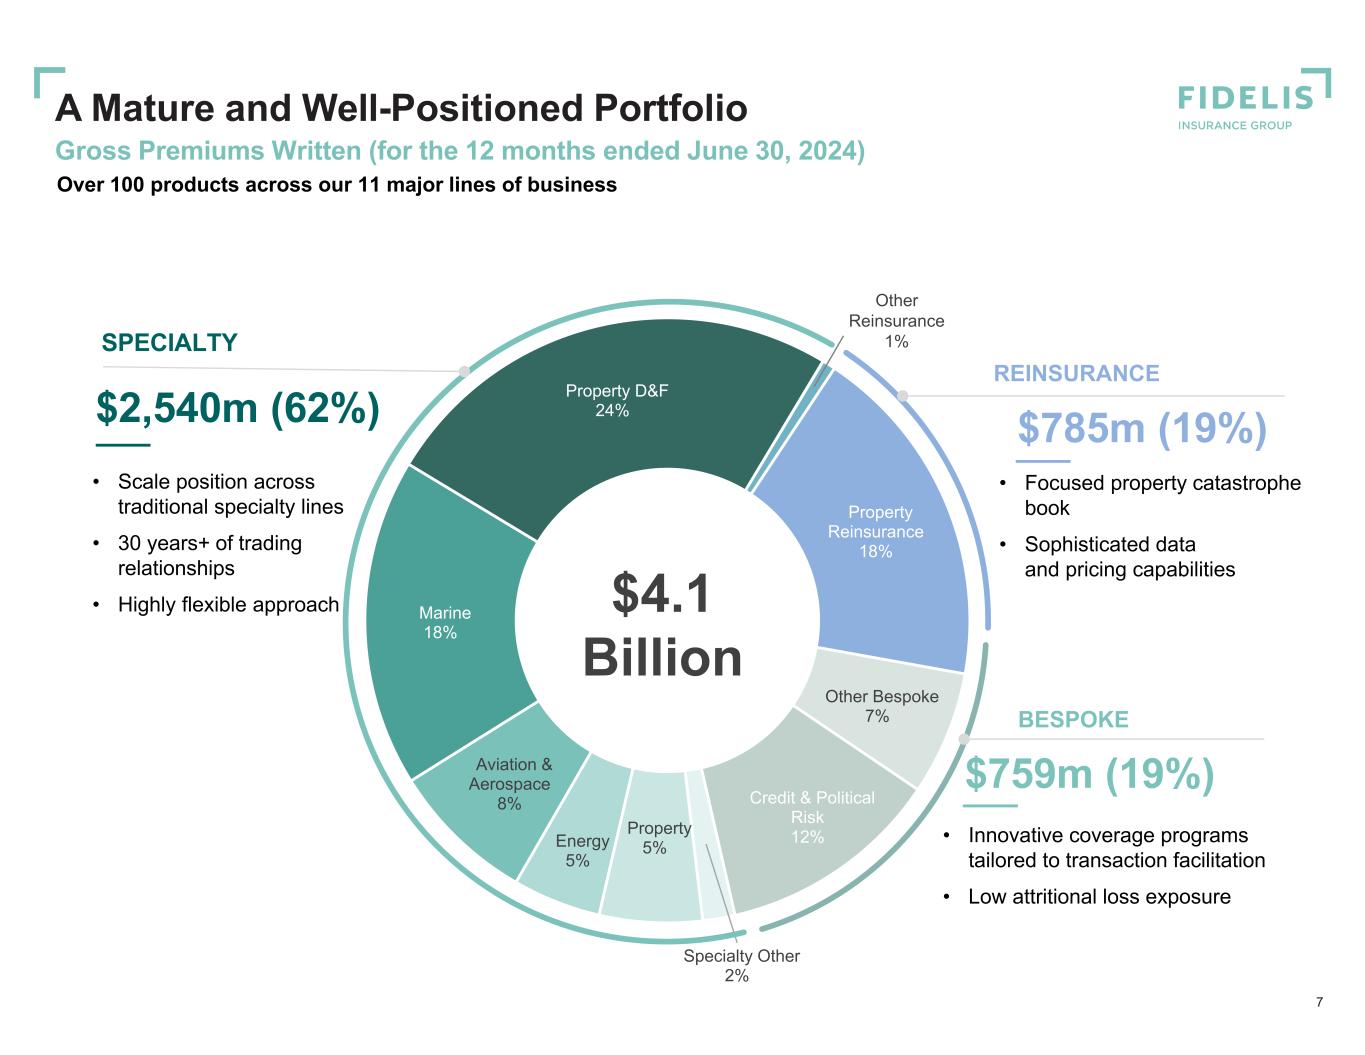
Property Reinsurance 18% Other Bespoke 7% Credit & Political Risk 12% Specialty Other 2% Property 5%Energy 5% Aviation & Aerospace 8% Marine 18% Property D&F 24% $4.1 Billion A Mature and Well-Positioned Portfolio Gross Premiums Written (for the 12 months ended June 30, 2024) SPECIALTY $2,540m (62%) REINSURANCE $785m (19%) BESPOKE $759m (19%) • Scale position across traditional specialty lines • 30 years+ of trading relationships • Highly flexible approach • Innovative coverage programs tailored to transaction facilitation • Low attritional loss exposure • Focused property catastrophe book • Sophisticated data and pricing capabilities Other Reinsurance 1% 7 Over 100 products across our 11 major lines of business
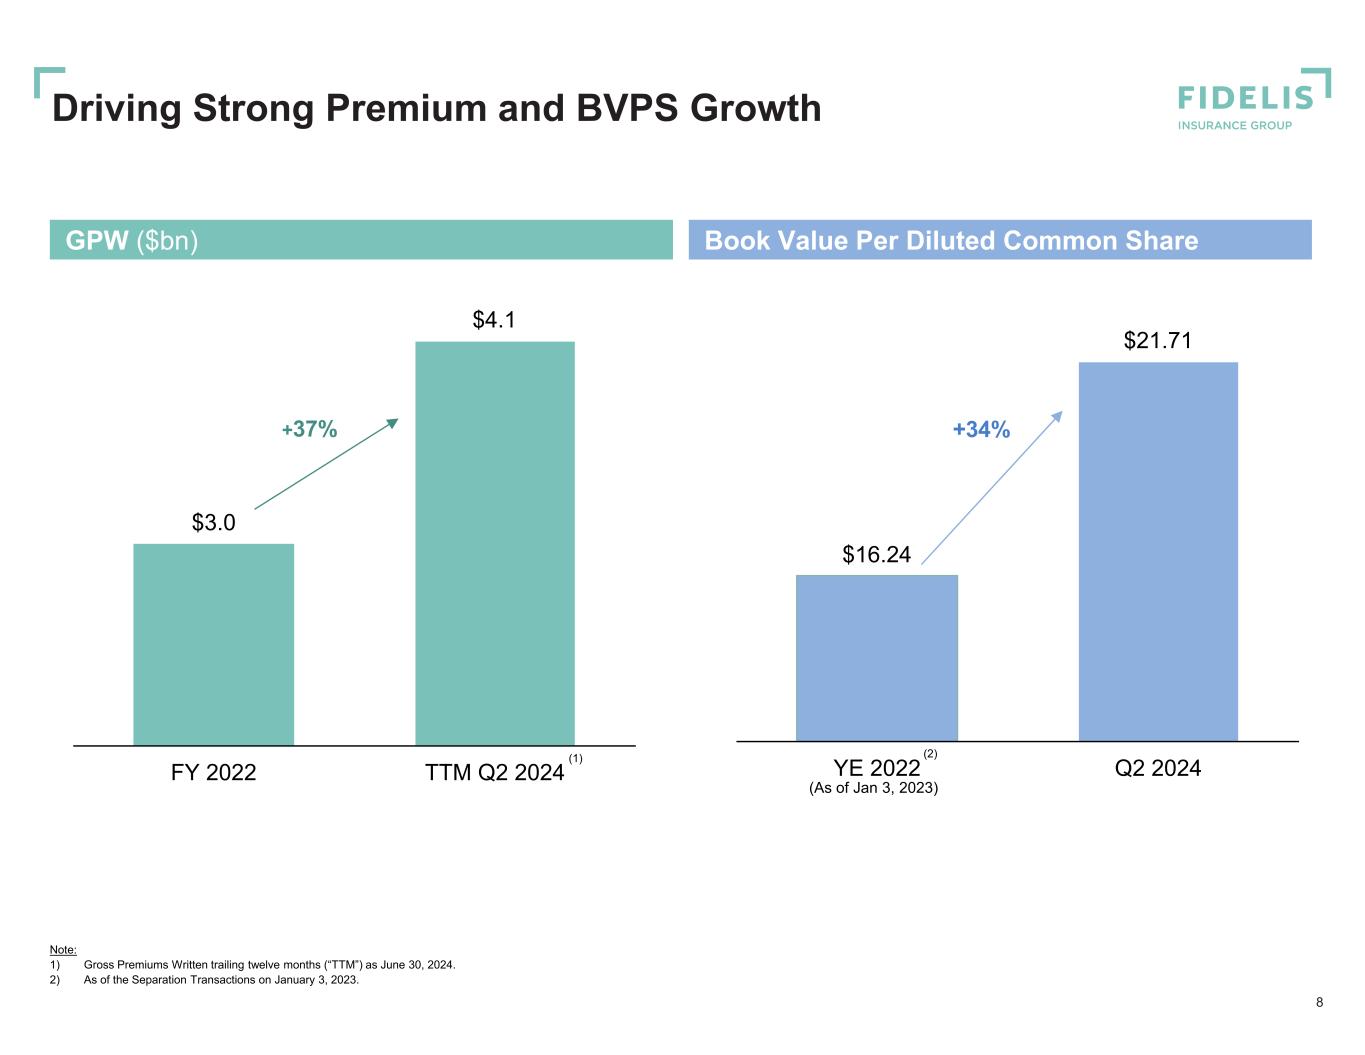
GPW ($bn) Book Value Per Diluted Common Share $16.24 $21.71 YE 2022 Q2 2024 $3.0 FY 2022 TTM Q2 2024 +37% +34% 8 Note: 1) Gross Premiums Written trailing twelve months (“TTM”) as June 30, 2024. 2) As of the Separation Transactions on January 3, 2023. (2)(1) Driving Strong Premium and BVPS Growth (As of Jan 3, 2023) $4.1
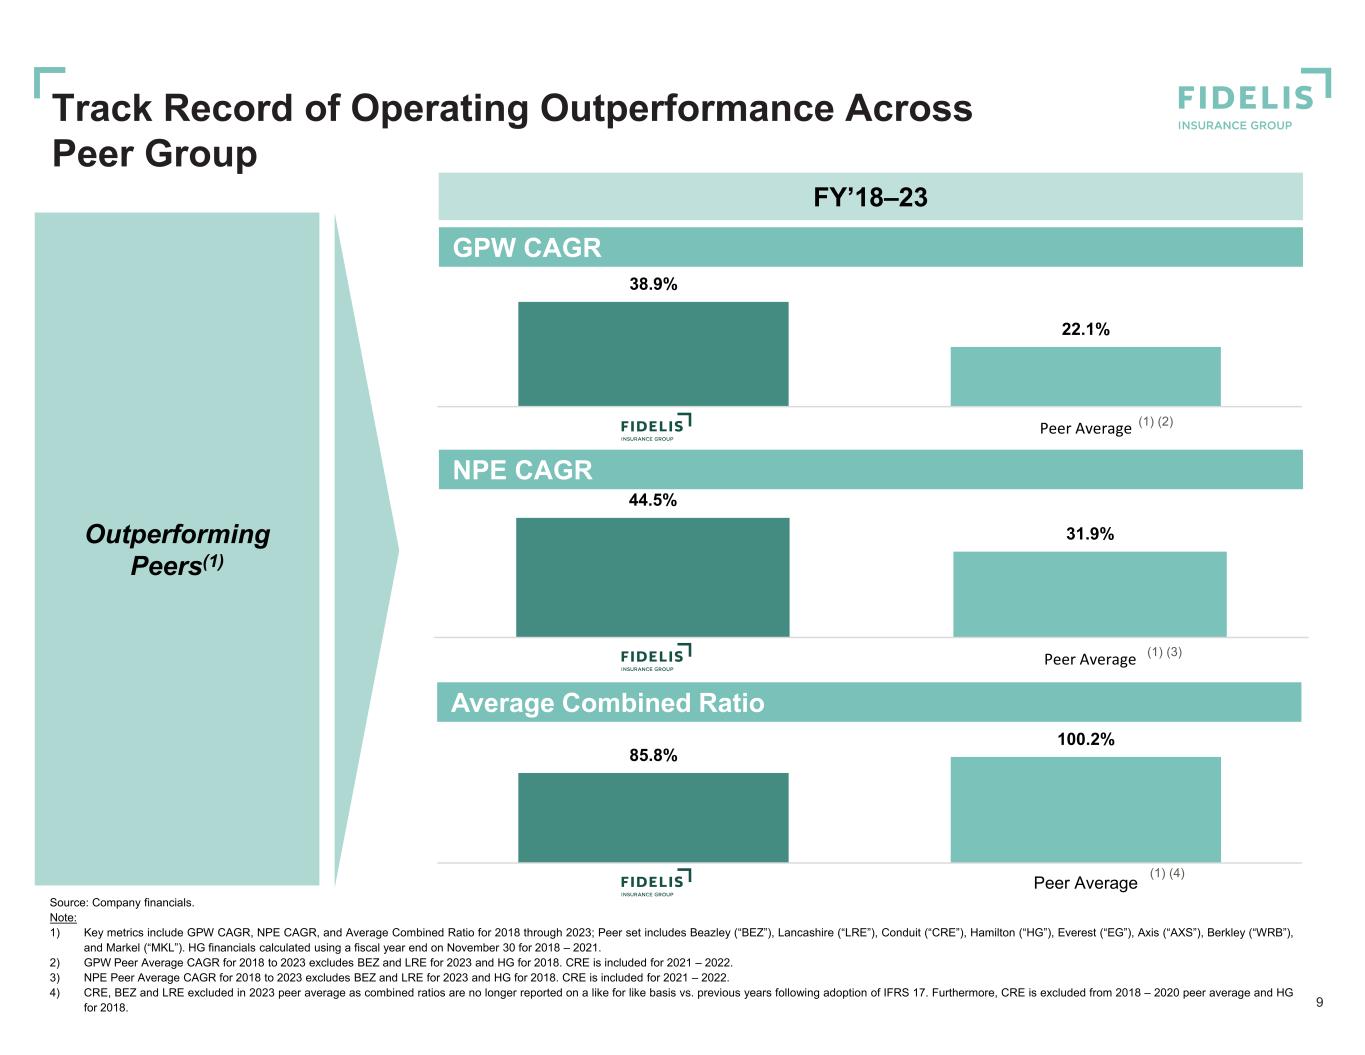
44.5% 31.9% FIHL Peer Average 38.9% 22.1% FIHL Peer Average 85.8% 100.2% Fidelis Peer Average 9 Source: Company financials. Note: 1) Key metrics include GPW CAGR, NPE CAGR, and Average Combined Ratio for 2018 through 2023; Peer set includes Beazley (“BEZ”), Lancashire (“LRE”), Conduit (“CRE”), Hamilton (“HG”), Everest (“EG”), Axis (“AXS”), Berkley (“WRB”), and Markel (“MKL”). HG financials calculated using a fiscal year end on November 30 for 2018 – 2021. 2) GPW Peer Average CAGR for 2018 to 2023 excludes BEZ and LRE for 2023 and HG for 2018. CRE is included for 2021 – 2022. 3) NPE Peer Average CAGR for 2018 to 2023 excludes BEZ and LRE for 2023 and HG for 2018. CRE is included for 2021 – 2022. 4) CRE, BEZ and LRE excluded in 2023 peer average as combined ratios are no longer reported on a like for like basis vs. previous years following adoption of IFRS 17. Furthermore, CRE is excluded from 2018 – 2020 peer average and HG for 2018. FY’18–23 (1) (2) (1) (3) (1) (4) GPW CAGR Outperforming Peers(1) Track Record of Operating Outperformance Across Peer Group NPE CAGR Average Combined Ratio
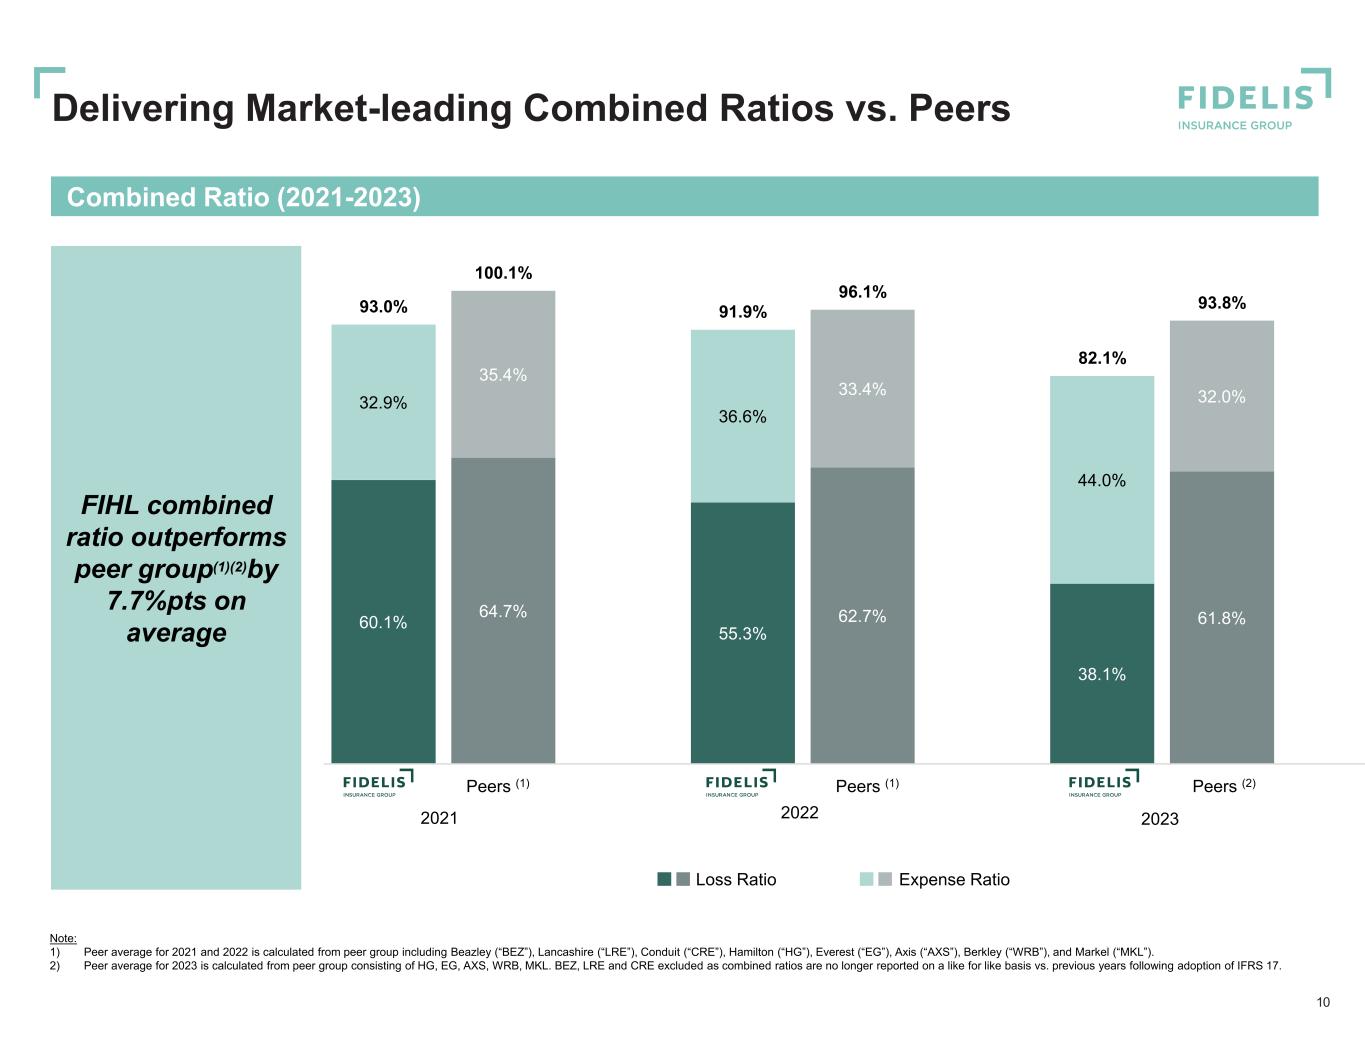
60.1% 64.7% 55.3% 62.7% 38.1% 61.8% 32.9% 35.4% 36.6% 33.4% 44.0% 32.0% 93.0% 100.1% 91.9% 96.1% 82.1% 93.8% Combined Ratio (2021-2023) 10 Note: 1) Peer average for 2021 and 2022 is calculated from peer group including Beazley (“BEZ”), Lancashire (“LRE”), Conduit (“CRE”), Hamilton (“HG”), Everest (“EG”), Axis (“AXS”), Berkley (“WRB”), and Markel (“MKL”). 2) Peer average for 2023 is calculated from peer group consisting of HG, EG, AXS, WRB, MKL. BEZ, LRE and CRE excluded as combined ratios are no longer reported on a like for like basis vs. previous years following adoption of IFRS 17. FIHL combined ratio outperforms peer group(1)(2)by 7.7%pts on average Delivering Market-leading Combined Ratios vs. Peers Peers (1) Peers (1) Peers (2) 2021 2022 2023 Loss Ratio Expense Ratio
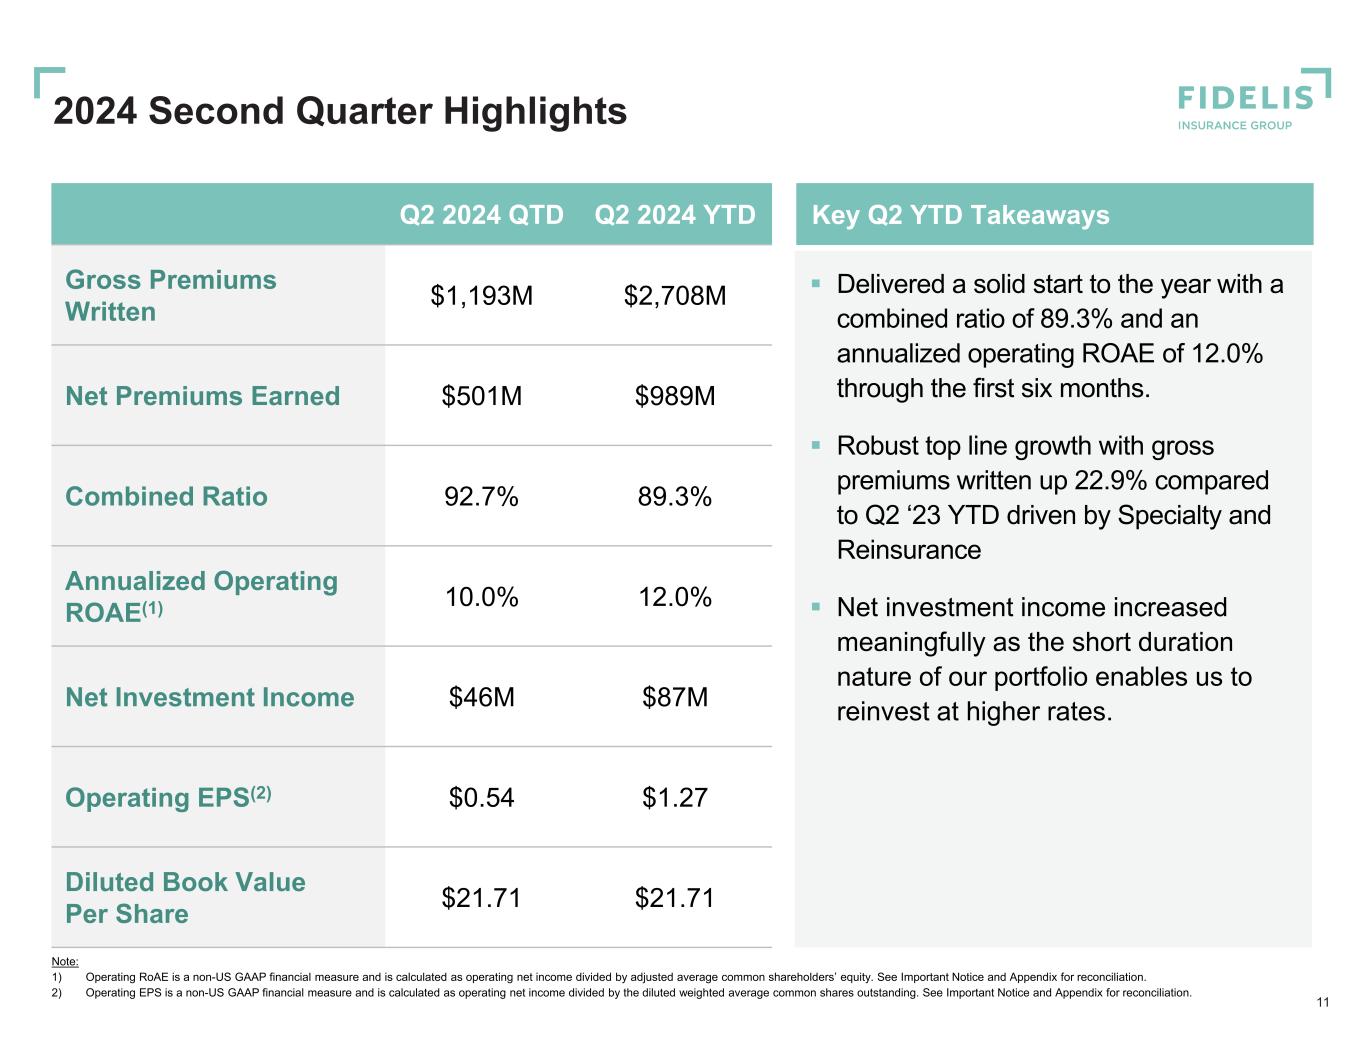
Key Q2 YTD Takeaways 2024 Second Quarter Highlights 11 Note: 1) Operating RoAE is a non-US GAAP financial measure and is calculated as operating net income divided by adjusted average common shareholders’ equity. See Important Notice and Appendix for reconciliation. 2) Operating EPS is a non-US GAAP financial measure and is calculated as operating net income divided by the diluted weighted average common shares outstanding. See Important Notice and Appendix for reconciliation. Q2 2024 YTDQ2 2024 QTD $2,708M$1,193MGross Premiums Written $989M$501MNet Premiums Earned 89.3%92.7%Combined Ratio 12.0%10.0%Annualized Operating ROAE(1) $87M$46MNet Investment Income $1.27$0.54Operating EPS(2) $21.71$21.71Diluted Book Value Per Share Delivered a solid start to the year with a combined ratio of 89.3% and an annualized operating ROAE of 12.0% through the first six months. Robust top line growth with gross premiums written up 22.9% compared to Q2 ‘23 YTD driven by Specialty and Reinsurance Net investment income increased meaningfully as the short duration nature of our portfolio enables us to reinvest at higher rates.

2024 Second Quarter Highlights by Segment 12 Specialty 63.4% $657.3 $756.5 Q2 2023 Q2 2024 Bespoke 7.6% $54.7 $90.6 Q2 2023 Q2 2024 Reinsurance 29.0% $245.2 $346.1 Q2 2023 Q2 2024 Note: 1) The Fidelis Partnership fees are not allocated to the segment level and policy acquisition costs as presented in the underwriting ratio are third party acquisition costs. 80.3% Pe rc en t o f T ot al Q 2 20 24 G PW Yo Y G PW G ro w th U nd er w rit in g R at io Lo ss R at io Total Q2 2024 GPW: $1,193M 54.2% 71.3% 35.4% 31.3% 1.2% (1 )

Fixed Income Portfolio Credit QualityAsset Allocation 1% Other Investments 45% Corporates(1) 18% US Treasuries 6% Agency MBS(2) <1% BB 11% BBB 40% A 38% AA 11% AAA 13 2.7yrs Duration $3.5bn Fixed Income Portfolio ~89% Rated A- or Better AA- Weighted-Average Credit Quality $4.4bn Total Cash and Investments 38% Cash and US Treasuries Securities As of June 30, 2024 As of June 30, 2024 Conservative portfolio earning attractive market yields Strategy focused on delivering attractive investment income while targeting an above-average risk- adjusted total return through all market cycles 10% Other ABS 20% Cash(3) Note: 1) Includes Quasi Government and Non US-Government securities. 2) Includes agency residential mortgage-backed and an immaterial amount of commercial mortgage-backed fixed maturity investments. 3) Includes cash and cash equivalents and includes restricted cash. Diversified Investment Portfolio
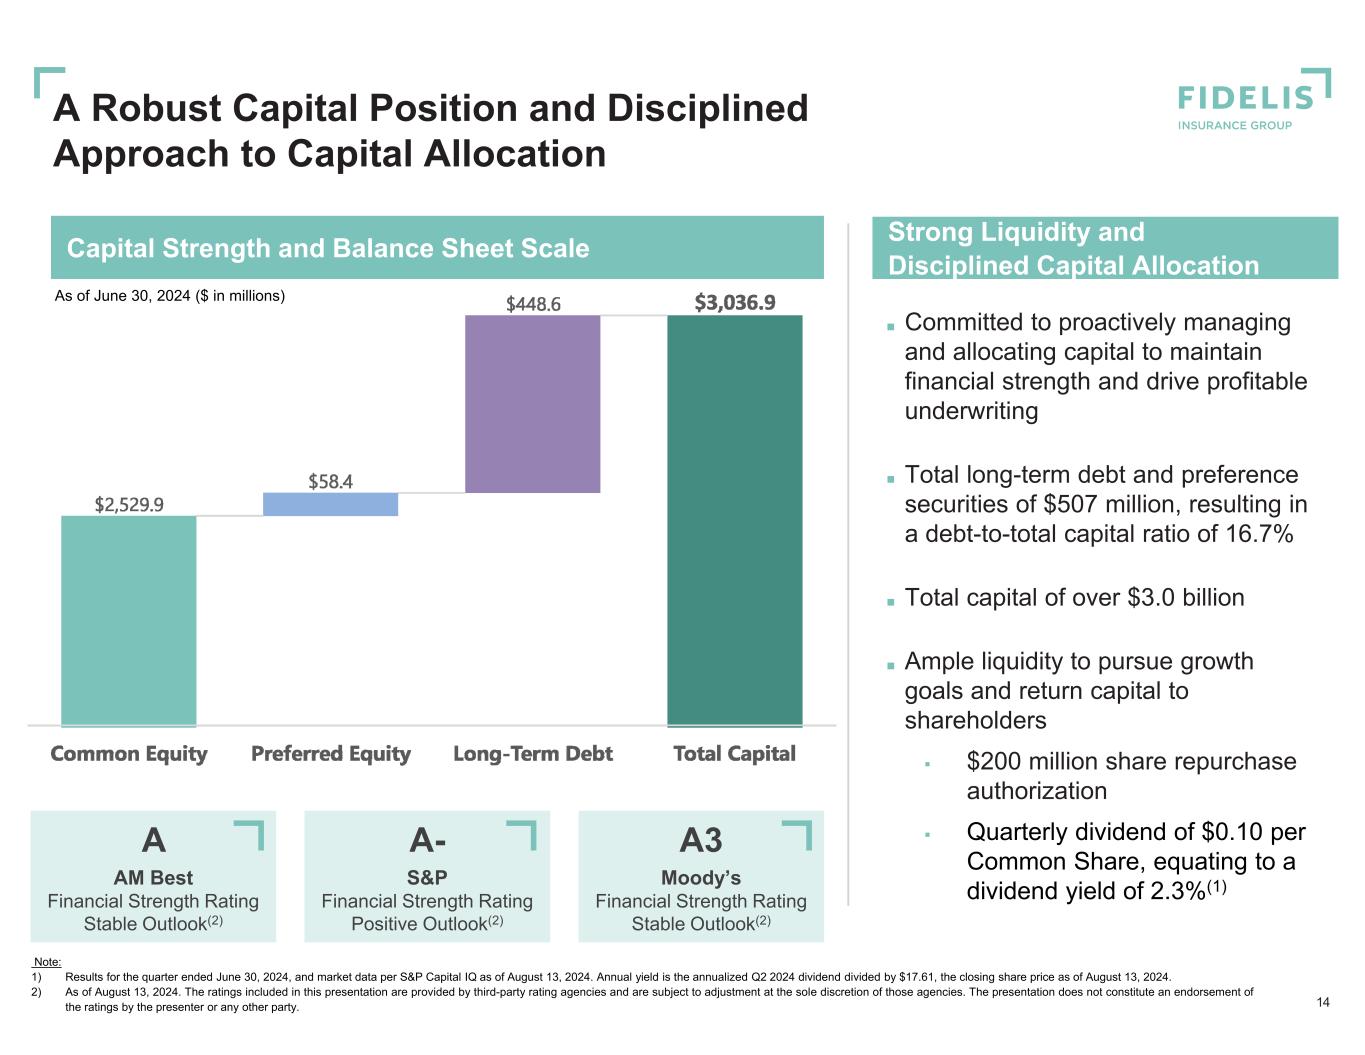
Strong Liquidity and Disciplined Capital AllocationCapital Strength and Balance Sheet Scale 14 ■ Committed to proactively managing and allocating capital to maintain financial strength and drive profitable underwriting ■ Total long-term debt and preference securities of $507 million, resulting in a debt-to-total capital ratio of 16.7% ■ Total capital of over $3.0 billion ■ Ample liquidity to pursue growth goals and return capital to shareholders $200 million share repurchase authorization Quarterly dividend of $0.10 per Common Share, equating to a dividend yield of 2.3%(1)$9.9bn Total Assets A AM Best Financial Strength Rating Stable Outlook(2) A- S&P Financial Strength Rating Positive Outlook(2) A3 Moody’s Financial Strength Rating Stable Outlook(2) As of June 30, 2024 ($ in millions) Note: 1) Results for the quarter ended June 30, 2024, and market data per S&P Capital IQ as of August 13, 2024. Annual yield is the annualized Q2 2024 dividend divided by $17.61, the closing share price as of August 13, 2024. 2) As of August 13, 2024. The ratings included in this presentation are provided by third-party rating agencies and are subject to adjustment at the sole discretion of those agencies. The presentation does not constitute an endorsement of the ratings by the presenter or any other party. A Robust Capital Position and Disciplined Approach to Capital Allocation
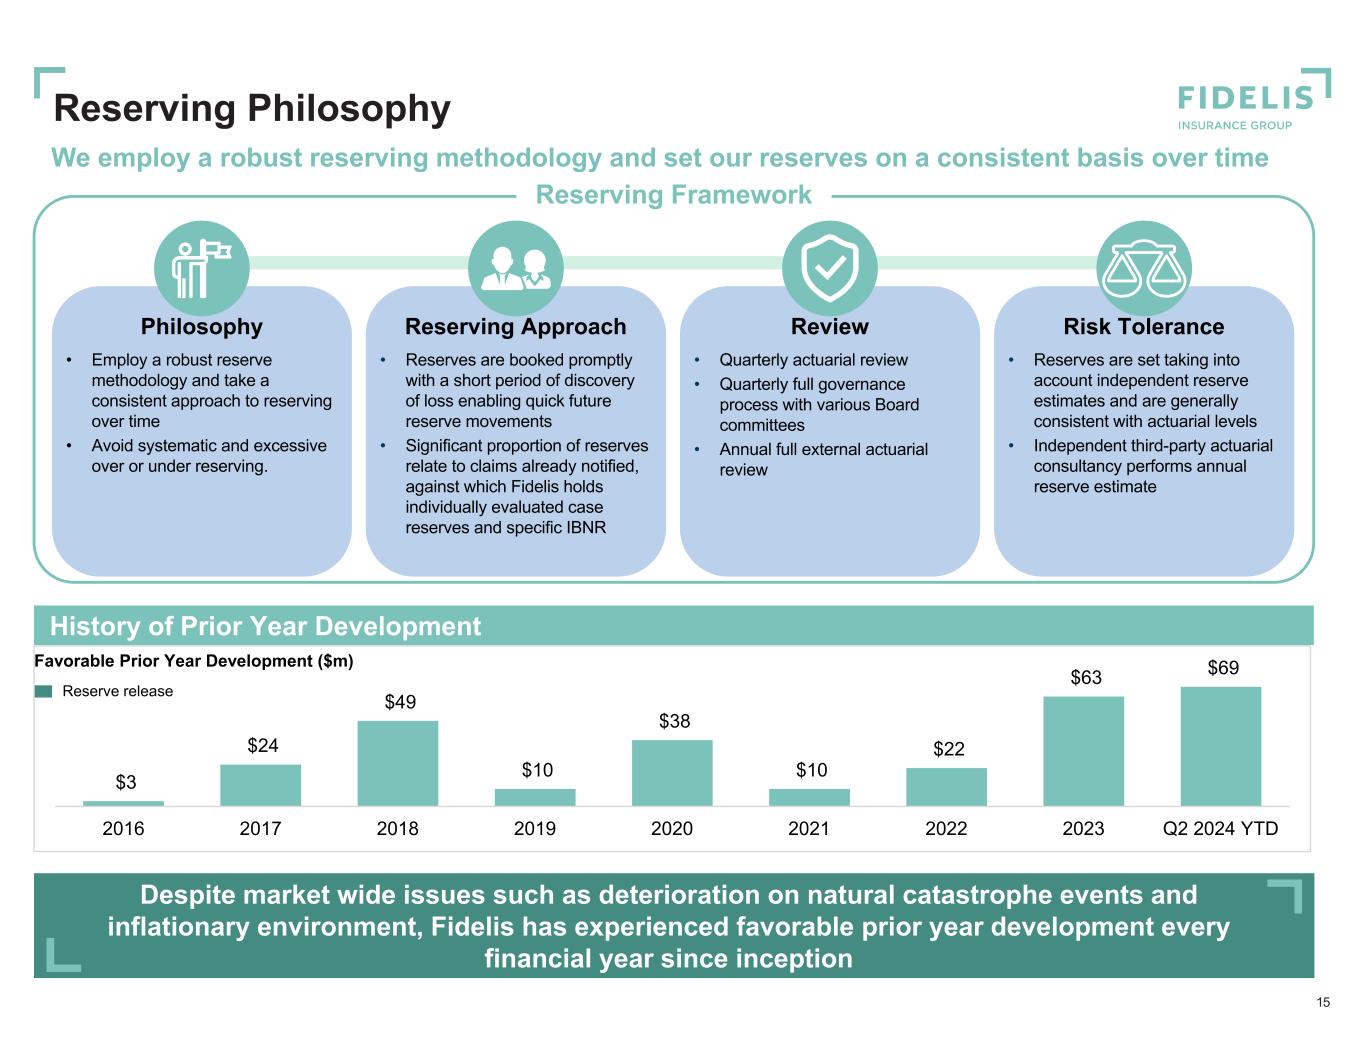
Reserve release Favorable Prior Year Development ($m) We employ a robust reserving methodology and set our reserves on a consistent basis over time Reserving Framework • Employ a robust reserve methodology and take a consistent approach to reserving over time • Avoid systematic and excessive over or under reserving. Philosophy • Reserves are set taking into account independent reserve estimates and are generally consistent with actuarial levels • Independent third-party actuarial consultancy performs annual reserve estimate Risk Tolerance • Reserves are booked promptly with a short period of discovery of loss enabling quick future reserve movements • Significant proportion of reserves relate to claims already notified, against which Fidelis holds individually evaluated case reserves and specific IBNR Reserving Approach • Quarterly actuarial review • Quarterly full governance process with various Board committees • Annual full external actuarial review Review History of Prior Year Development 15 Reserving Philosophy Despite market wide issues such as deterioration on natural catastrophe events and inflationary environment, Fidelis has experienced favorable prior year development every financial year since inception $3 $24 $49 $10 $38 $10 $22 $63 $69 2016 2017 2018 2019 2020 2021 2022 2023 Q2 2024 YTD
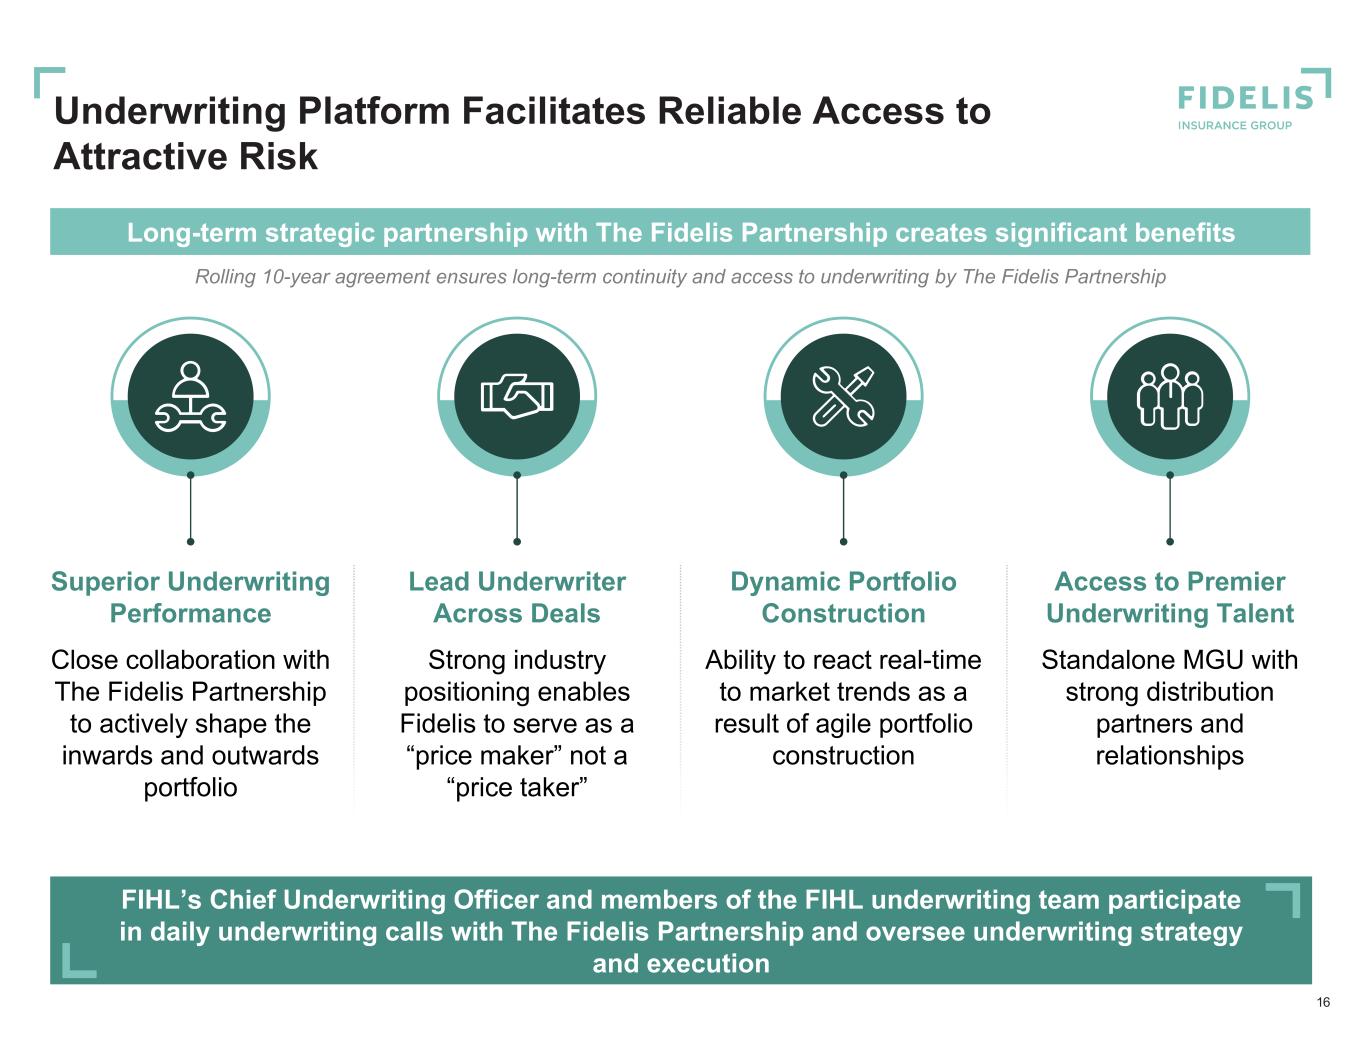
Underwriting Platform Facilitates Reliable Access to Attractive Risk 16 Rolling 10-year agreement ensures long-term continuity and access to underwriting by The Fidelis Partnership Long-term strategic partnership with The Fidelis Partnership creates significant benefits FIHL’s Chief Underwriting Officer and members of the FIHL underwriting team participate in daily underwriting calls with The Fidelis Partnership and oversee underwriting strategy and execution Superior Underwriting Performance Close collaboration with The Fidelis Partnership to actively shape the inwards and outwards portfolio Lead Underwriter Across Deals Strong industry positioning enables Fidelis to serve as a “price maker” not a “price taker” Dynamic Portfolio Construction Ability to react real-time to market trends as a result of agile portfolio construction Access to Premier Underwriting Talent Standalone MGU with strong distribution partners and relationships
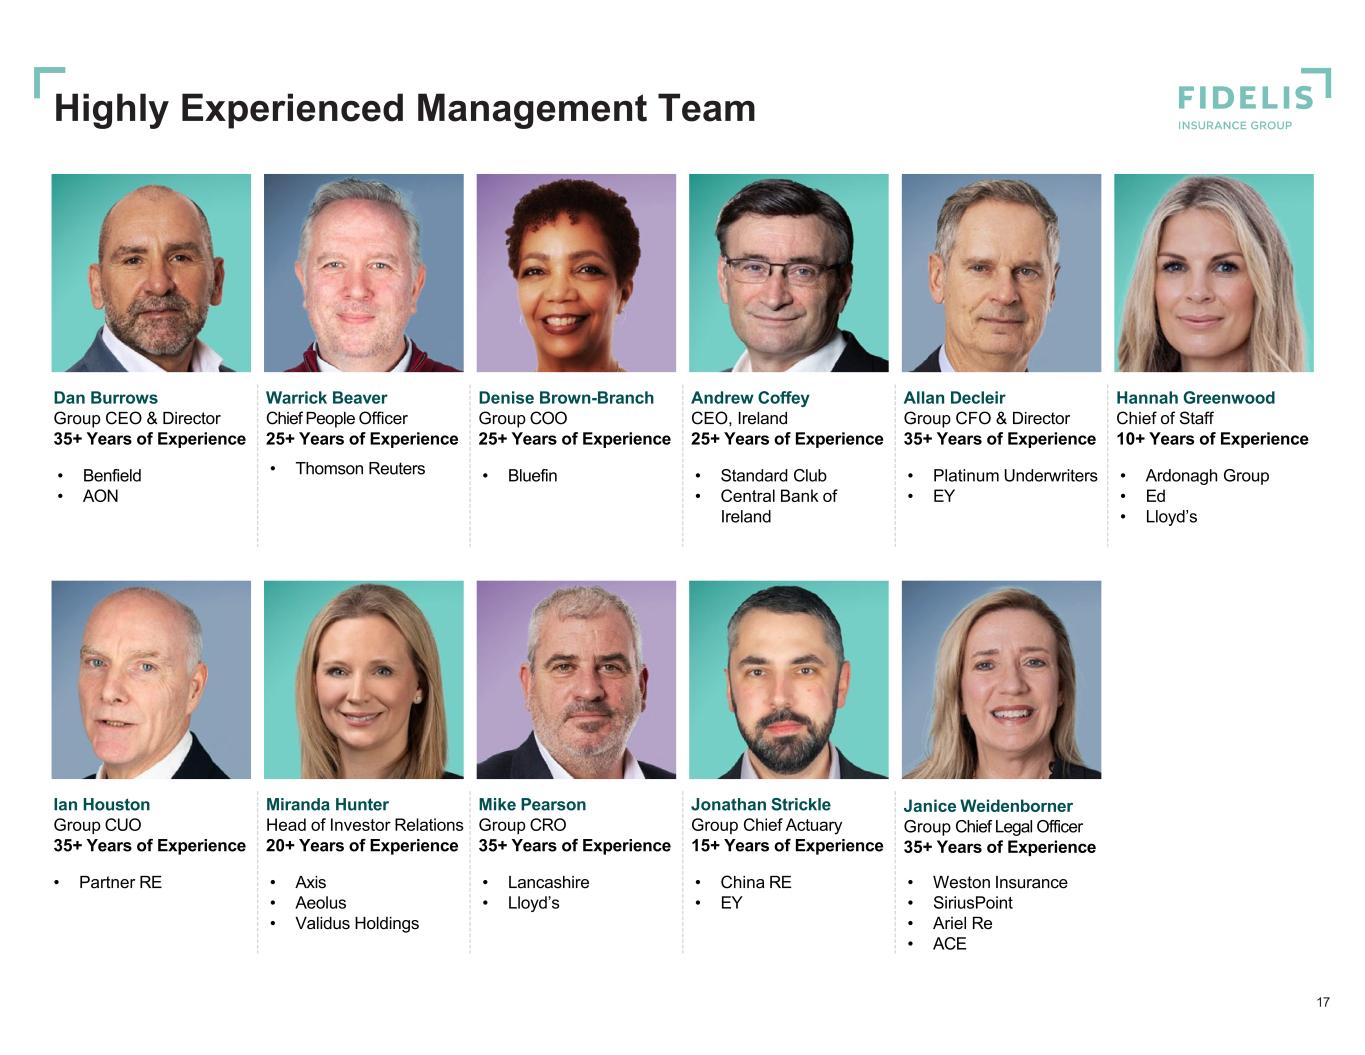
Allan Decleir Group CFO & Director 35+ Years of Experience Hannah Greenwood Chief of Staff 10+ Years of Experience • Platinum Underwriters • EY • Ardonagh Group • Ed • Lloyd’s Dan Burrows Group CEO & Director 35+ Years of Experience Denise Brown-Branch Group COO 25+ Years of Experience Warrick Beaver Chief People Officer 25+ Years of Experience Andrew Coffey CEO, Ireland 25+ Years of Experience • Thomson Reuters• Benfield • AON • Bluefin • Standard Club • Central Bank of Ireland Mike Pearson Group CRO 35+ Years of Experience Ian Houston Group CUO 35+ Years of Experience Janice Weidenborner Group Chief Legal Officer 35+ Years of Experience Jonathan Strickle Group Chief Actuary 15+ Years of Experience Miranda Hunter Head of Investor Relations 20+ Years of Experience • Lancashire • Lloyd’s • Partner RE • Weston Insurance • SiriusPoint • Ariel Re • ACE • China RE • EY • Axis • Aeolus • Validus Holdings 17 Highly Experienced Management Team

Strong Foundation for Profitable Growth 18 Note: 1) This slide contains forward looking statements covered by the PSLRA. See Safe Harbor Statement on Slide 2.. Leading combined ratio compared to peers and efficient capital deployment Diversified book of business driving consistent, long-term profitability Attractive pipeline with strong continued organic growth driven by differentiated positions and attractive market conditions Underwriting Profitability at Scale Capital Management & Investment Thoughtful and disciplined approach to risk and capital allocation and deployment Short duration investment portfolio drives potential for opportunistic reinvestment Investment in Lloyds Syndicate 3123 providing access to an enhanced ratings platform, global licensing, and Lloyd’s only business Targeting delivery of Operating ROAE of 14-16%(1) in 2024
Appendix

Q2 2024 Financial Highlights

Underwriting RatioGross Premiums Written Specialty Overview 21 ■ Portfolio of tailored risks across traditional specialty business lines including Aviation and Aerospace, Energy, Marine, Property and Property Direct & Facultative (“Property D&F”) ■ ‘Hard’ market conditions following years of compound rate increases across multiple business lines within the Specialty segment have provided opportunities for targeted growth, and the ability to leverage leadership and scale combined with long established relationships has enabled Fidelis to build across specialty classes ■ Industry leading results, including expected mid-40%’s loss ratio(2) ■ Premiums written for the Marine and Aviation and Aerospace lines are more heavily weighted to the first half of the year, while the Property D&F book has a more even distribution of premium across the quarters $1,121 $1,616 $2,241 $1,491 $1,791 $0 $500 $1,000 $1,500 $2,000 $2,500 2021 2022 2023 2Q23 2Q24 38.6% 59.9% 48.5% 48.5% 51.8% 20.4% 22.3% 24.0% 25.1% 27.2%59.0% 82.2% 72.5% 73.6% 79.0% 0% 10% 20% 30% 40% 50% 60% 70% 80% 90% 100% 2021 2022 2023 2Q23 2Q24 Loss Ratio Policy Acquisition Expense Ratio $ in millions Note: 1) The Fidelis Partnership fees are not allocated to the segment level and policy acquisition costs as presented in the underwriting ratio are third party acquisition costs. 2) Expected loss ratios are on the portfolio written to date, assuming normal loss experience. This slide contains forward looking statements covered by the PSLRA. See Safe Harbour Statement on Slide 2. (1) Segment Highlights
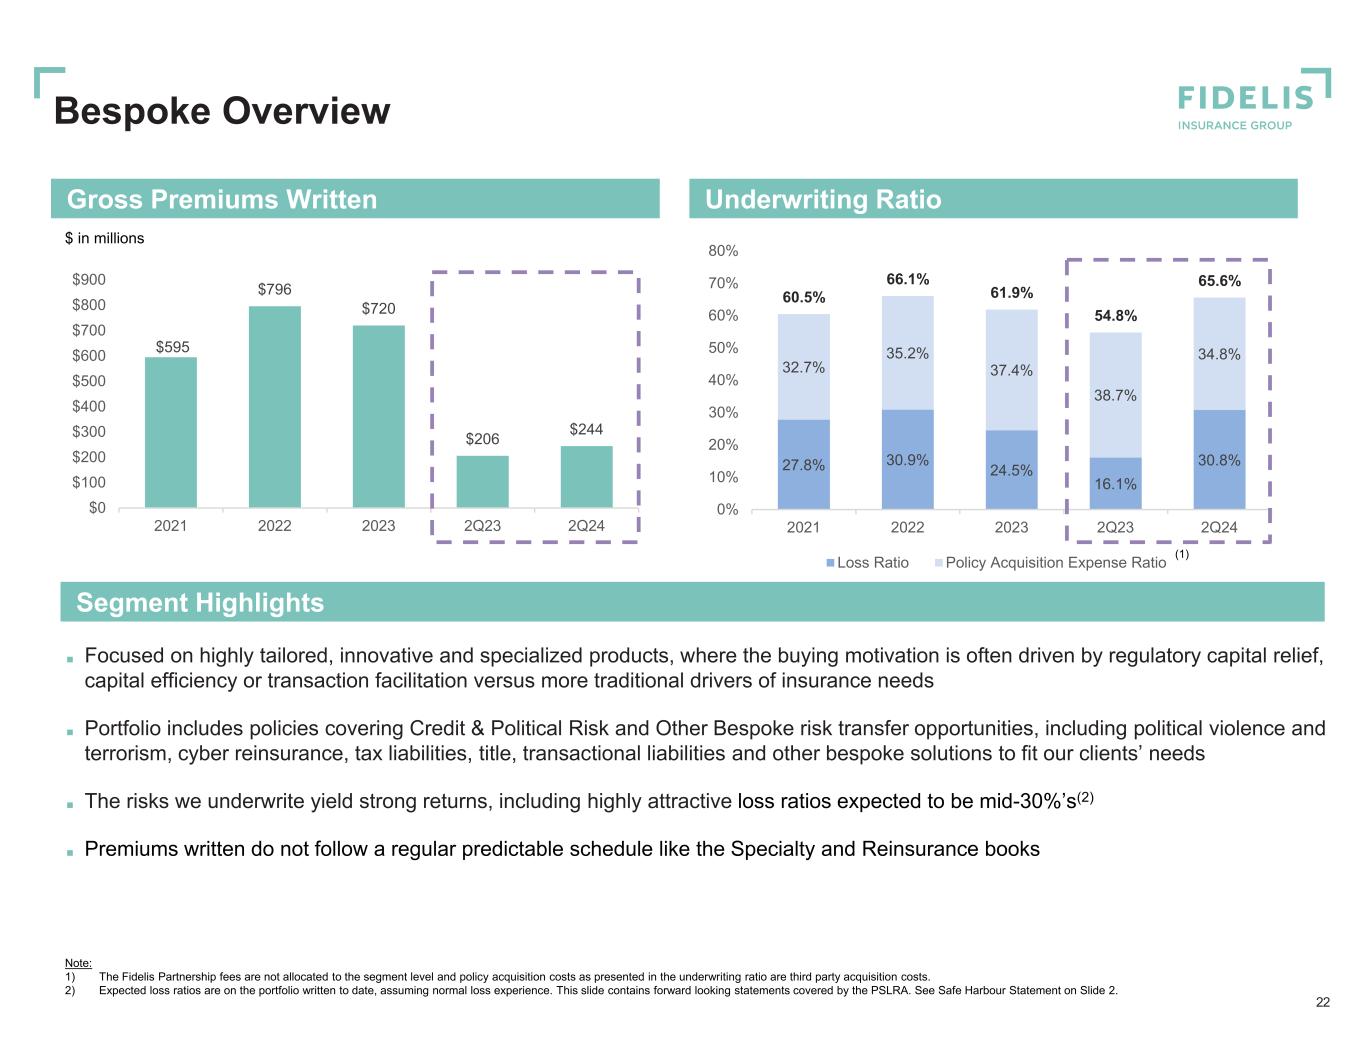
Segment Highlights Underwriting RatioGross Premiums Written Bespoke Overview 22 ■ Focused on highly tailored, innovative and specialized products, where the buying motivation is often driven by regulatory capital relief, capital efficiency or transaction facilitation versus more traditional drivers of insurance needs ■ Portfolio includes policies covering Credit & Political Risk and Other Bespoke risk transfer opportunities, including political violence and terrorism, cyber reinsurance, tax liabilities, title, transactional liabilities and other bespoke solutions to fit our clients’ needs ■ The risks we underwrite yield strong returns, including highly attractive loss ratios expected to be mid-30%’s(2) ■ Premiums written do not follow a regular predictable schedule like the Specialty and Reinsurance books $595 $796 $720 $206 $244 $0 $100 $200 $300 $400 $500 $600 $700 $800 $900 2021 2022 2023 2Q23 2Q24 $ in millions 27.8% 30.9% 24.5% 16.1% 30.8% 32.7% 35.2% 37.4% 38.7% 34.8% 60.5% 66.1% 61.9% 54.8% 65.6% 0% 10% 20% 30% 40% 50% 60% 70% 80% 2021 2022 2023 2Q23 2Q24 Loss Ratio Policy Acquisition Expense Ratio 0 (1) Note: 1) The Fidelis Partnership fees are not allocated to the segment level and policy acquisition costs as presented in the underwriting ratio are third party acquisition costs. 2) Expected loss ratios are on the portfolio written to date, assuming normal loss experience. This slide contains forward looking statements covered by the PSLRA. See Safe Harbour Statement on Slide 2.
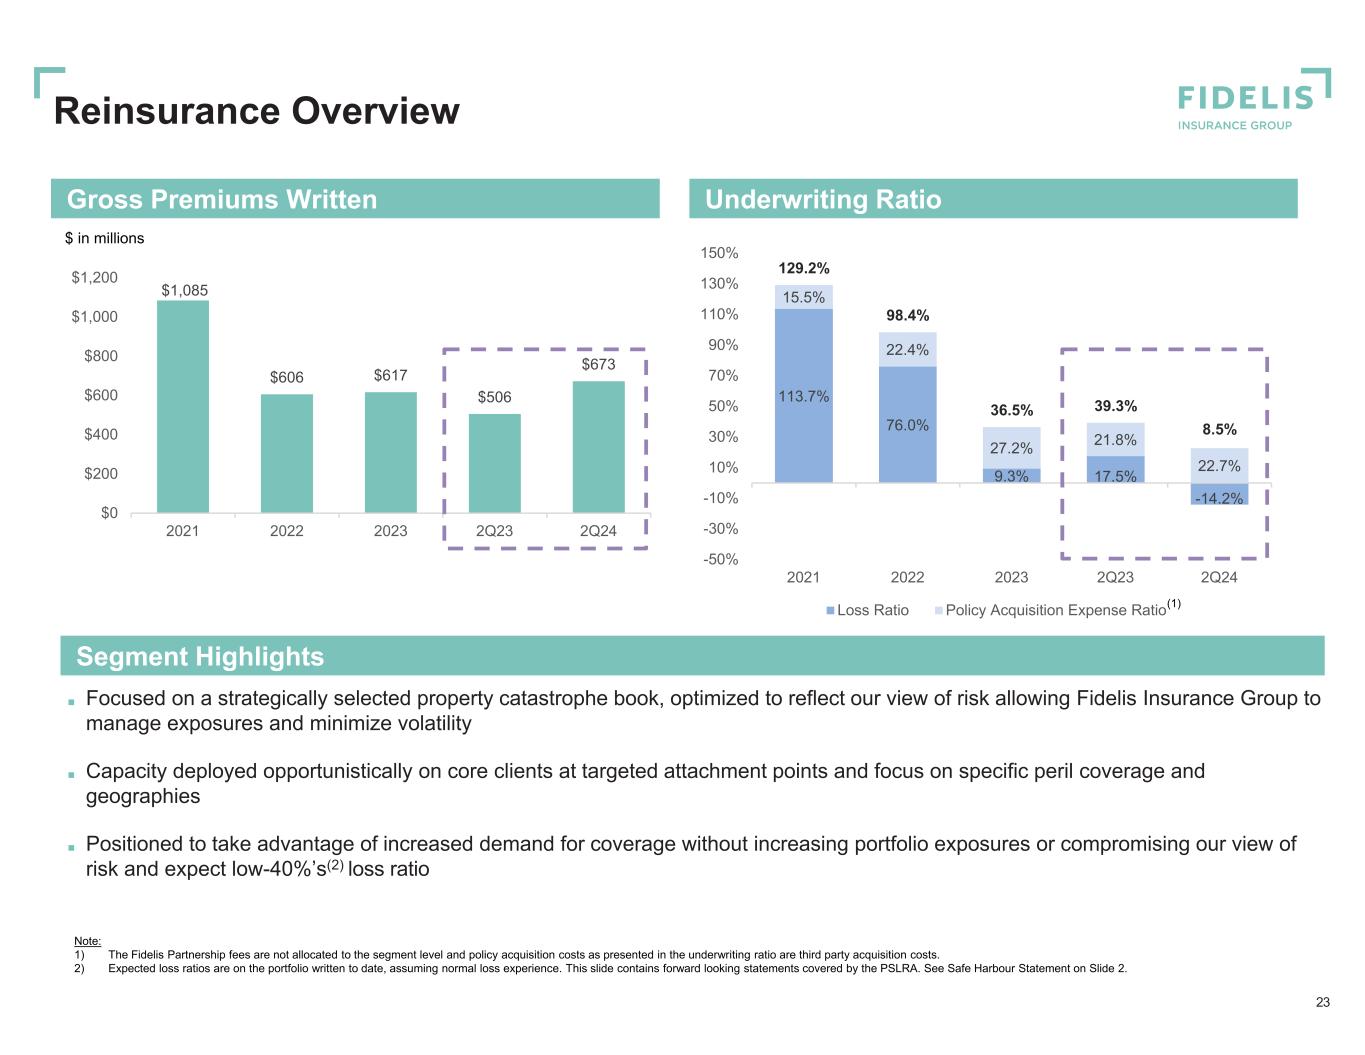
Reinsurance Overview 23 ■ Focused on a strategically selected property catastrophe book, optimized to reflect our view of risk allowing Fidelis Insurance Group to manage exposures and minimize volatility ■ Capacity deployed opportunistically on core clients at targeted attachment points and focus on specific peril coverage and geographies ■ Positioned to take advantage of increased demand for coverage without increasing portfolio exposures or compromising our view of risk and expect low-40%’s(2) loss ratio $1,085 $606 $617 $506 $673 $0 $200 $400 $600 $800 $1,000 $1,200 2021 2022 2023 2Q23 2Q24 $ in millions 113.7% 76.0% 9.3% 17.5% -14.2% 15.5% 22.4% 27.2% 21.8% 22.7% 129.2% 98.4% 36.5% 39.3% 8.5% -50% -30% -10% 10% 30% 50% 70% 90% 110% 130% 150% 2021 2022 2023 2Q23 2Q24 Loss Ratio Policy Acquisition Expense Ratio(1) Note: 1) The Fidelis Partnership fees are not allocated to the segment level and policy acquisition costs as presented in the underwriting ratio are third party acquisition costs. 2) Expected loss ratios are on the portfolio written to date, assuming normal loss experience. This slide contains forward looking statements covered by the PSLRA. See Safe Harbour Statement on Slide 2. Underwriting RatioGross Premiums Written Segment Highlights

Additional Partnership Details

Framework Agreement with The Fidelis Partnership 25 Termination provisions Include underwriting performance thresholds, termination rights under fraud, insolvency and material breach of contract conditions and provisions for regulatory issue or rating downgrades FIHL agrees Annual Plan with TFP Sets out terms of new business , risk appetites , outwards reinsurance requirements, capital and solvency requirements Mutual first access via Fidelis IG Right of First Refusal (ROFR) and TFP Right of First Offer (ROFO) Mutual first access for business that is not already set out in the annual plan and option to source business with 3rd party broker thereafter Rolling 10-year term Auto renews in year 1–3 with written election by FIHL required for subsequent renewals Exclusive relationship governed by a long-term Framework Agreement providing strong economic alignment between FIHL and TFP How it Works A long-term relationship with aligned economic and strategic interest, designed to capture the core competencies of FIHL and The Fidelis Partnership (“TFP”) Ceding Commission (charged on NPW) Portfolio Management Fee (charged on NPW) Profit Commission (annual performance related) O ut so ur ci ng Ag re em en t O ut so ur ci ng Ag re em en t Fr am ew or k Ag re em en t Fr am ew or k Ag re em en t Underwriting Actuarial Pricing Claims handling Wordings Performed In collaboration with Fidelis IG Outwards RI Portfolio optimization Exposure management Cycle management Risk selection and placement Sourcing additional scale 2 3 Fee type Services Service Fee (billed quarterly) Fee income on quota shares 4 Economic alignment Performance management Credit control and technical accounting IT support services Strongly incentivized to provide sophisticated underwriting with a fee structure that rewards both profitability and strong growth, all consistent with arm’s length market pricing Fee Structure 1 Fees TFP directly originated business: 11.5% Pine Walk: ~10%(1) Third party originated: 3% Portfolio management fee: 3% of NPW Any run-off fees to be agreed 20% of Binder Operating ROE(2) above 5% annual hurdle QS ceding commissions paid to TFP (Fidelis IG retains 1% of QS premium) Provided on a cost / cost plus basis Third party suppliers and contracts procured at cost Note: 1) Pine Walk agreements are separate from binder and calculated based on GPW. Commission % based on TFP commissions from Pine Walk divided by total Pine Walk cells’ GPW; Pine Walk cells are The Fidelis Partnership HoldCo’s operating subsidiaries focused on underwriter talent incubation in specialized practice areas. 2) Broadly defined as Fidelis IG’s net underwriting margin less certain expenses and debt interest divided by TFP’s proportion of opening shareholders’ equity adjusted for dividends and equity raises. Binder Operating ROE excludes investment returns and includes deficit account for losses which carryforward 3 years
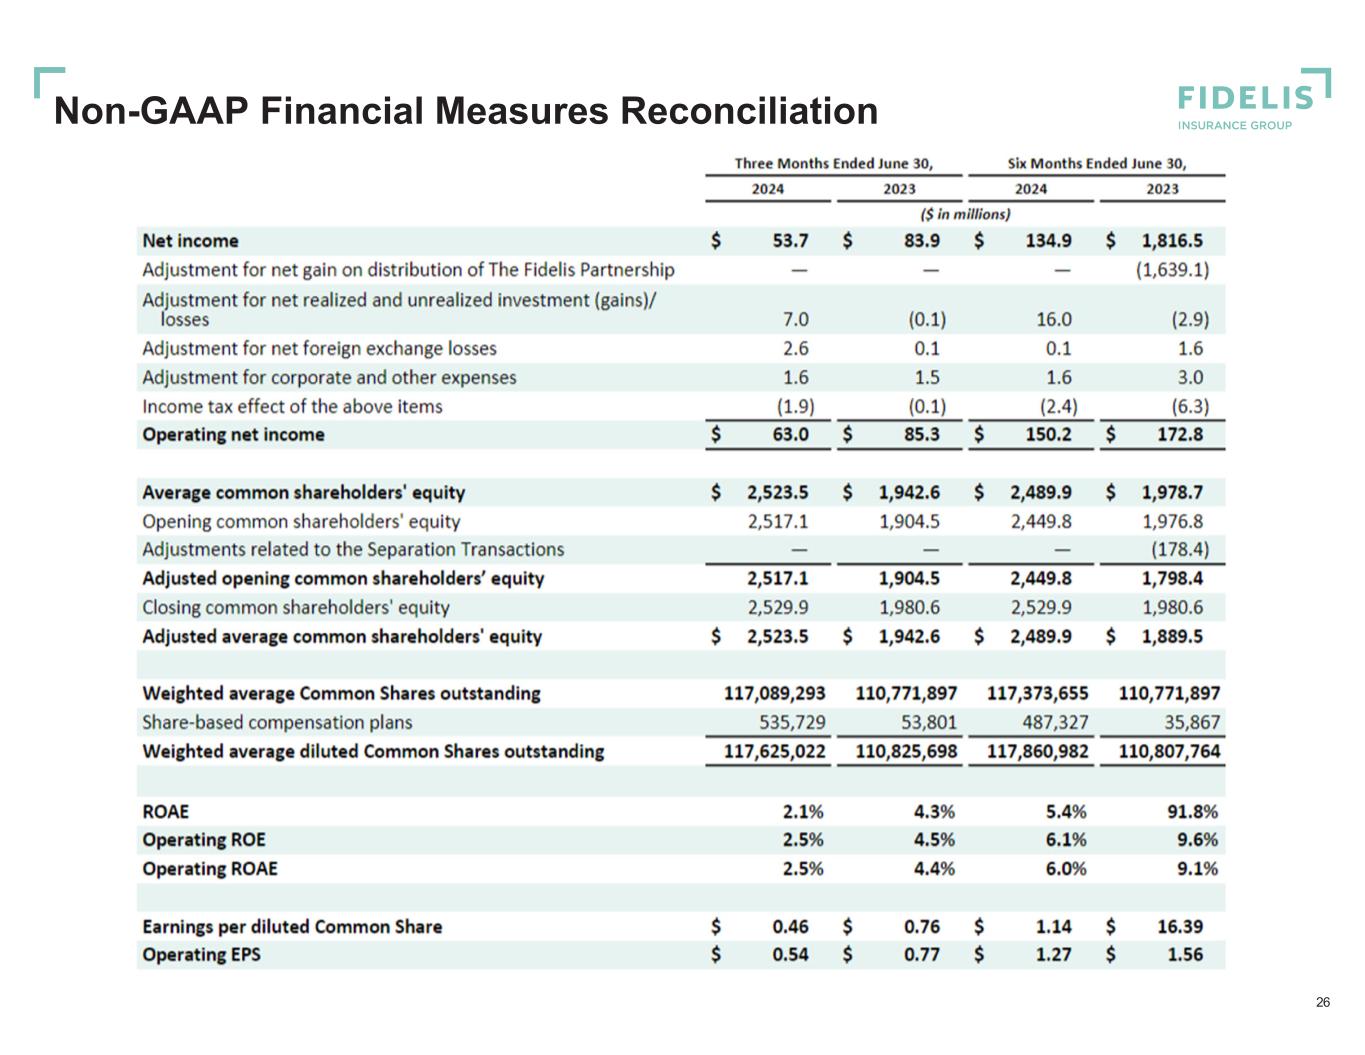
Non-GAAP Financial Measures Reconciliation 26
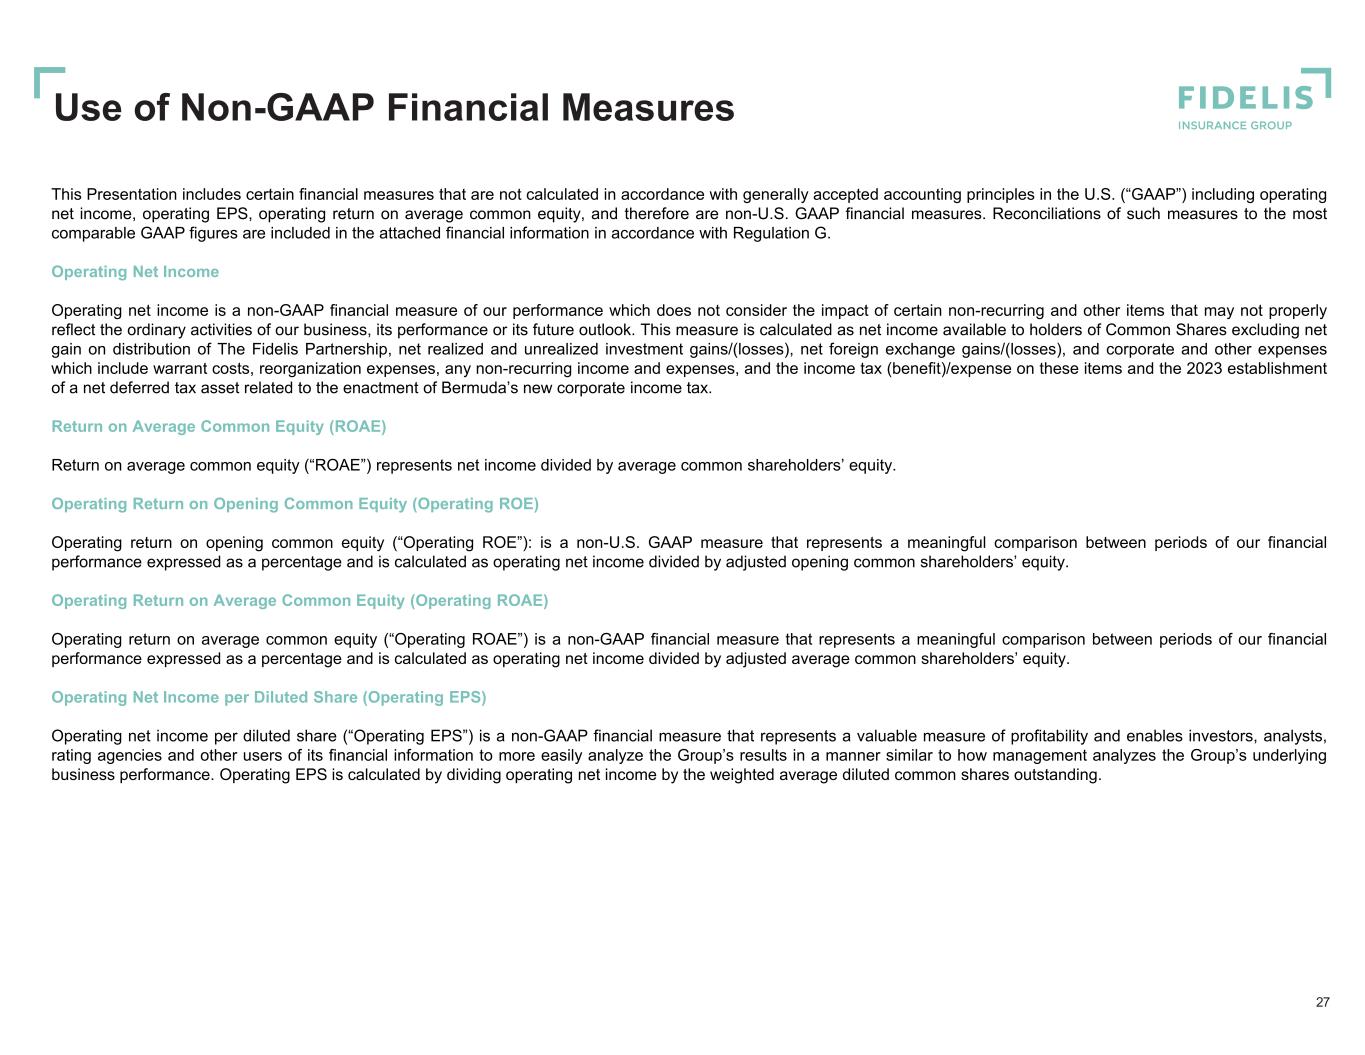
This Presentation includes certain financial measures that are not calculated in accordance with generally accepted accounting principles in the U.S. (“GAAP”) including operating net income, operating EPS, operating return on average common equity, and therefore are non-U.S. GAAP financial measures. Reconciliations of such measures to the most comparable GAAP figures are included in the attached financial information in accordance with Regulation G. Operating Net Income Operating net income is a non-GAAP financial measure of our performance which does not consider the impact of certain non-recurring and other items that may not properly reflect the ordinary activities of our business, its performance or its future outlook. This measure is calculated as net income available to holders of Common Shares excluding net gain on distribution of The Fidelis Partnership, net realized and unrealized investment gains/(losses), net foreign exchange gains/(losses), and corporate and other expenses which include warrant costs, reorganization expenses, any non-recurring income and expenses, and the income tax (benefit)/expense on these items and the 2023 establishment of a net deferred tax asset related to the enactment of Bermuda’s new corporate income tax. Return on Average Common Equity (ROAE) Return on average common equity (“ROAE”) represents net income divided by average common shareholders’ equity. Operating Return on Opening Common Equity (Operating ROE) Operating return on opening common equity (“Operating ROE”): is a non-U.S. GAAP measure that represents a meaningful comparison between periods of our financial performance expressed as a percentage and is calculated as operating net income divided by adjusted opening common shareholders’ equity. Operating Return on Average Common Equity (Operating ROAE) Operating return on average common equity (“Operating ROAE”) is a non-GAAP financial measure that represents a meaningful comparison between periods of our financial performance expressed as a percentage and is calculated as operating net income divided by adjusted average common shareholders’ equity. Operating Net Income per Diluted Share (Operating EPS) Operating net income per diluted share (“Operating EPS”) is a non-GAAP financial measure that represents a valuable measure of profitability and enables investors, analysts, rating agencies and other users of its financial information to more easily analyze the Group’s results in a manner similar to how management analyzes the Group’s underlying business performance. Operating EPS is calculated by dividing operating net income by the weighted average diluted common shares outstanding. Use of Non-GAAP Financial Measures 27


