|
Filed Pursuant to Rule 433 under the Securities Act of 1933 Registration Statement No. 333-203138 June 15, 2015
HORIZON GLOBAL
DRIVEN TO DELIVER
June 2015
|
Disclaimers
Forward-Looking Statements
Any “forward-looking” statements contained herein, including those relating to market conditions or the Company’s financial condition and results, expense reductions, liquidity expectations, business goals and sales growth, involve risks and uncertainties, including, but not limited to, risks and uncertainties with respect to the successful execution of the spin-off from TriMas Corporation within the expected timeframe or at all, the taxable nature of the spin-off, future prospects of the Company as an independent company, general economic and currency conditions, various conditions specific to the Company’s business and industry, the Company’s leverage, liabilities imposed by the Company’s debt instruments, market demand, competitive factors, supply constraints, material and energy costs, technology factors, litigation, government and regulatory actions, the Company’s accounting policies, future trends, and other risks which are detailed in the Company’s Registration Statement filed on Form S-1 (available at www.sec.gov). These risks and uncertainties may cause actual results to differ materially from those indicated by the forward-looking statements. All forward-looking statements made herein are based on information currently available, and the Company assumes no obligation to update any forward-looking statements.
Registration Statement
The Company has filed a registration statement (including a prospectus) with the SEC for the spin-off to which this communication relates. You should read the prospectus in that registration statement and other documents the issuer has filed with the SEC for more complete information about the issuer and the spin-off. You may get these documents for free by visiting EDGAR on the SEC website at www.sec.gov. Alternatively, the Company will arrange to send you the prospectus if you request it by contacting it at 248-631-5467.
NYSE: HZN DRIVEN TO DELIVER June 2015 2
|
Agenda
Company Overview & Strategy
Q&A
NYSE: HZN DRIVEN TO DELIVER June 2015 3
|
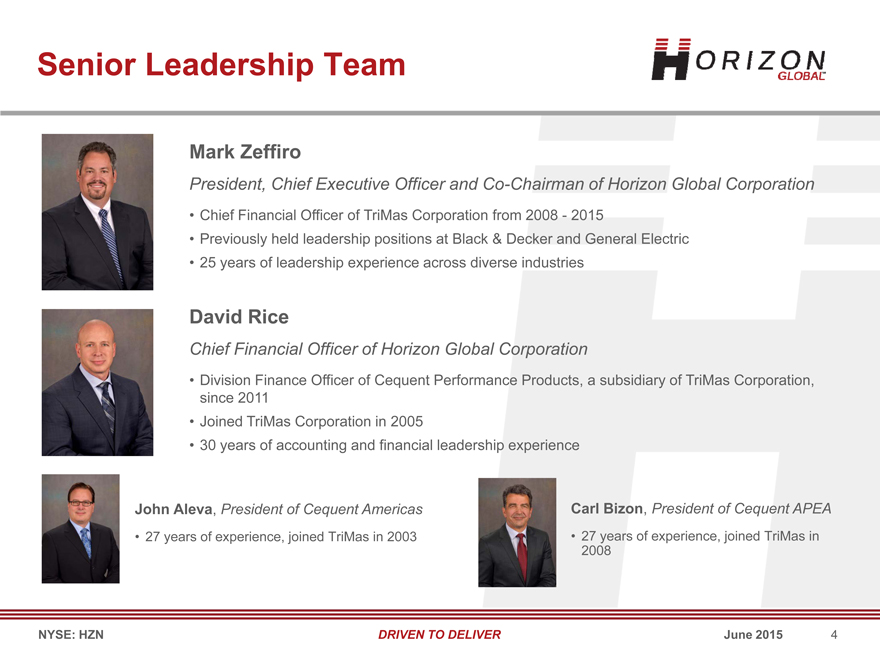
Senior Leadership Team
Mark Zeffiro
President, Chief Executive Officer and Co-Chairman of Horizon Global Corporation
Chief Financial Officer of TriMas Corporation from 2008—2015
Previously held leadership positions at Black & Decker and General Electric
25 years of leadership experience across diverse industries
David Rice
Chief Financial Officer of Horizon Global Corporation
Division Finance Officer of Cequent Performance Products, a subsidiary of TriMas Corporation, since 2011
Joined TriMas Corporation in 2005
30 years of accounting and financial leadership experience
John Aleva, President of Cequent Americas Carl Bizon, President of Cequent APEA
27 years of experience, joined TriMas in 2003 27 years of experience, joined TriMas in 2008
NYSE: HZN DRIVEN TO DELIVER June 2015 4
|
Company Overview & Strategy
|
Our Mission
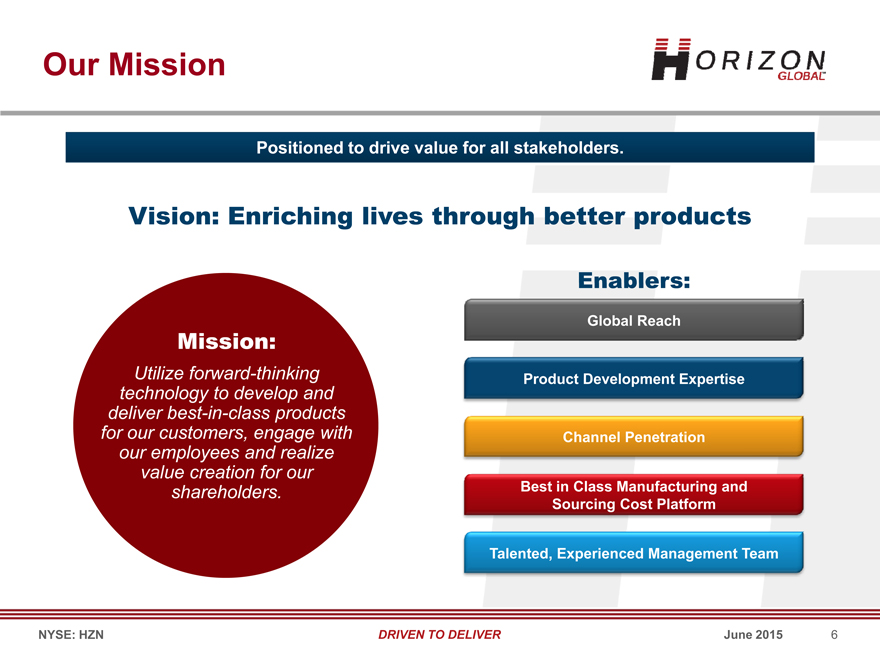
Positioned to drive value for all stakeholders.
Vision: Enriching lives through better products
Enablers:
Global Reach
Mission:
Utilize forward-thinking Product Development Expertise
technology to develop and deliver best-in-class products for our customers, engage with Channel Penetration our employees and realize
value creation for our Best in Class Manufacturing and
shareholders.
Sourcing Cost Platform
Talented, Experienced Management Team
NYSE: HZN DRIVEN TO DELIVER June 2015 6
|
Horizon Global Overview
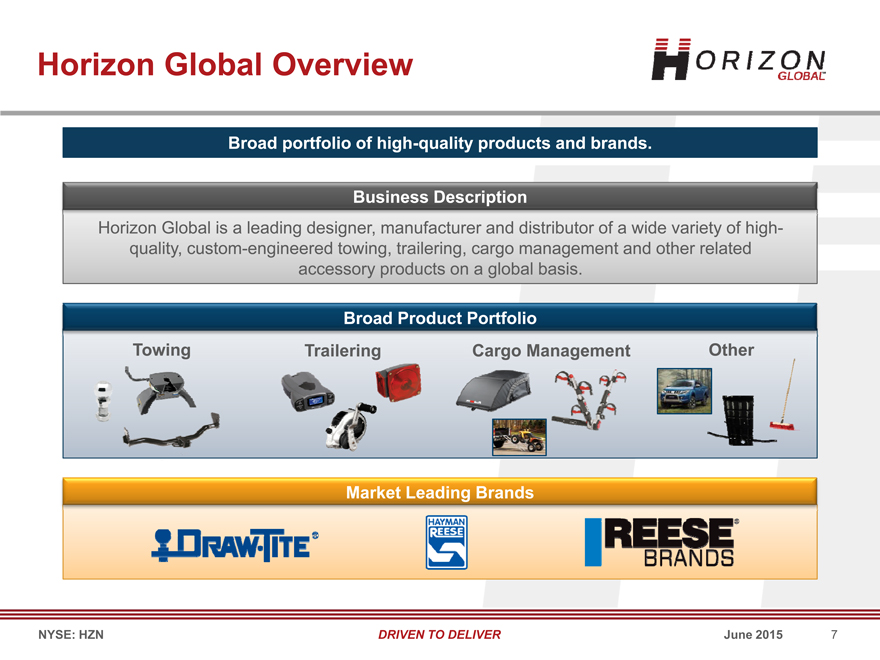
Broad portfolio of high-quality products and brands.
Business Description
Horizon Global is a leading designer, manufacturer and distributor of a wide variety of high-quality, custom-engineered towing, trailering, cargo management and other related
accessory products on a global basis.
Broad Product Portfolio
Towing
Trailering
Cargo Management
Other
Market Leading Brands
NYSE: HZN
DRIVEN TO DELIVER
June 2015
7
|
Key Investment Considerations
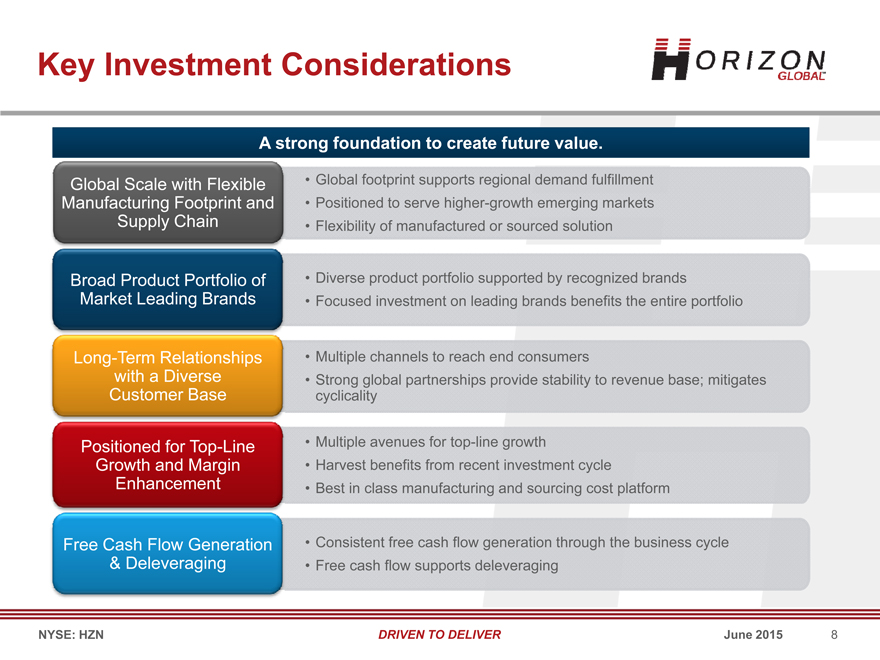
A strong foundation to create future value.
Global Scale with Flexible • Global footprint supports regional demand fulfillment Manufacturing Footprint and • Positioned to serve higher-growth emerging markets Supply Chain • Flexibility of manufactured or sourced solution
Broad Product Portfolio of • Diverse product portfolio supported by recognized brands
Market Leading Brands • Focused investment on leading brands benefits the entire portfolio
Long-Term Relationships • Multiple channels to reach end consumers with a Diverse • Strong global partnerships provide stability to revenue base; mitigates
Customer Base cyclicality
Positioned for Top-Line • Multiple avenues for top-line growth
Growth and Margin • Harvest benefits from recent investment cycle
Enhancement • Best in class manufacturing and sourcing cost platform
Free Cash Flow Generation • Consistent free cash flow generation through the business cycle
& Deleveraging
NYSE: HZN DRIVEN TO DELIVER June 2015 8
|
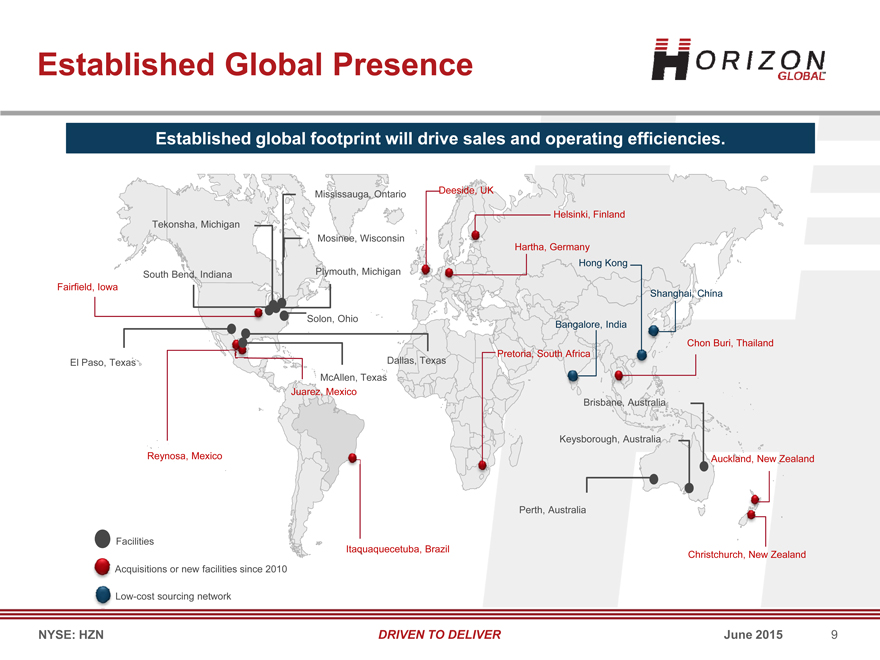
Established Global Presence
Established global footprint will drive sales and operating efficiencies.
Mississauga, Ontario Deeside, UK
Helsinki, Finland Tekonsha, Michigan Mosinee, Wisconsin Hartha, Germany Plymouth, Michigan Hong Kong South Bend, Indiana Fairfield, Iowa
Shanghai, China
Solon, Ohio
Bangalore, India
Chon Buri, Thailand Pretoria, South Africa El Paso, Texas Dallas, Texas McAllen, Texas Juarez, Mexico Brisbane, Australia
Keysborough, Australia
Reynosa, Mexico Auckland, New Zealand
Perth, Australia
Facilities
Itaquaquecetuba, Brazil
Christchurch, New Zealand Acquisitions or new facilities since 2010
Low-cost sourcing network
NYSE: HZN DRIVEN TO DELIVER June 2015 9
|
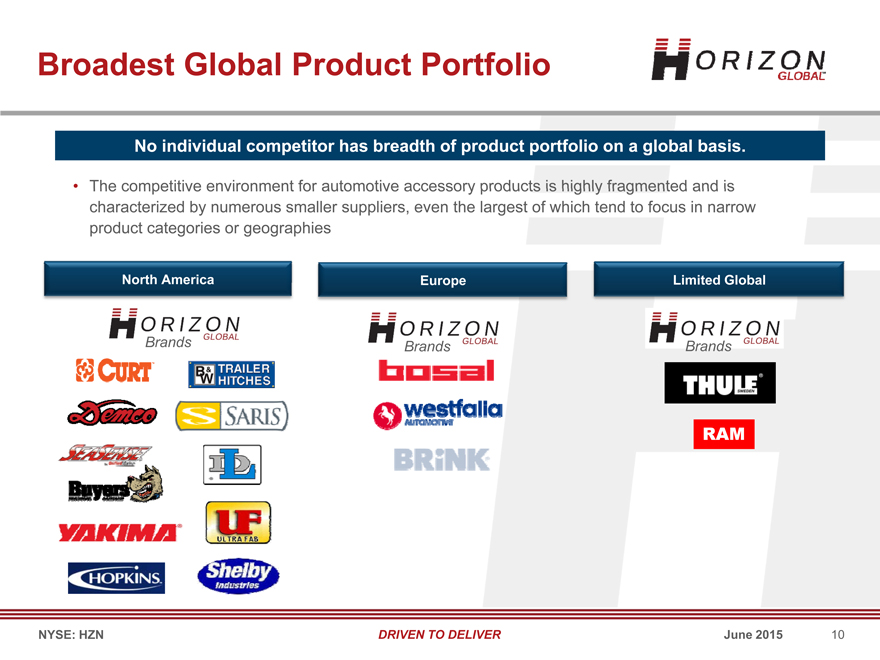
Broadest Global Product Portfolio
No individual competitor has breadth of product portfolio on a global basis.
The competitive environment for automotive accessory products is highly fragmented and is characterized by numerous smaller suppliers, even the largest of which tend to focus in narrow product categories or geographies
North America Europe Limited Global
Brands Brands Brands
RAM
NYSE: HZN DRIVEN TO DELIVER June 2015 10
|
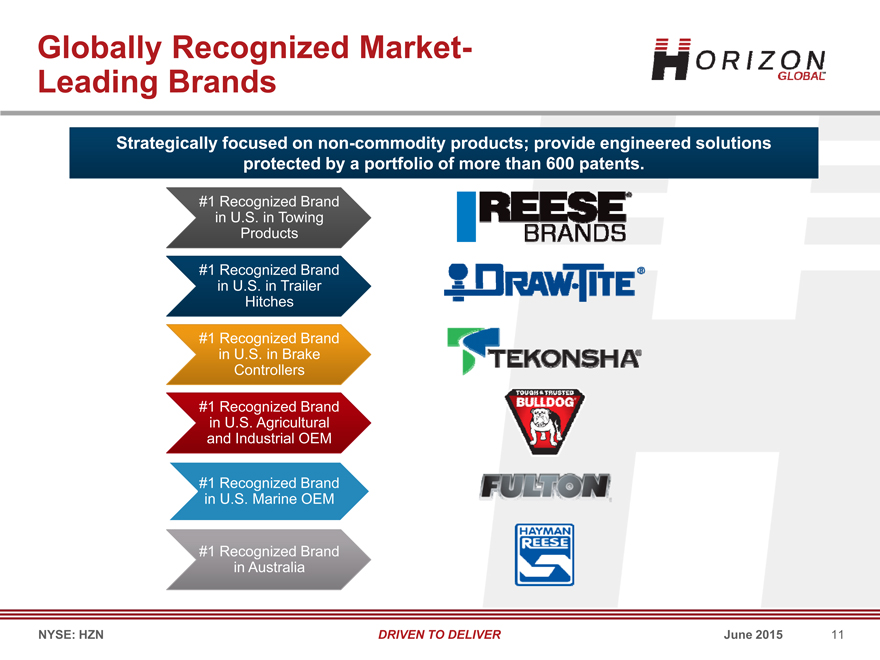
Globally Recognized Market-Leading Brands
Strategically focused on non-commodity products; provide engineered solutions protected by a portfolio of more than 600 patents.
#1 Recognized Brand in U.S. in Towing Products
in U.S. in Trailer Hitches
#1 Recognized Brand in U.S. Agricultural and Industrial OEM
#1 Recognized Brand in U.S. Marine OEM #1 Recognized Brand in
Australia
NYSE: HZN DRIVEN TO DELIVER June 2015 11
|
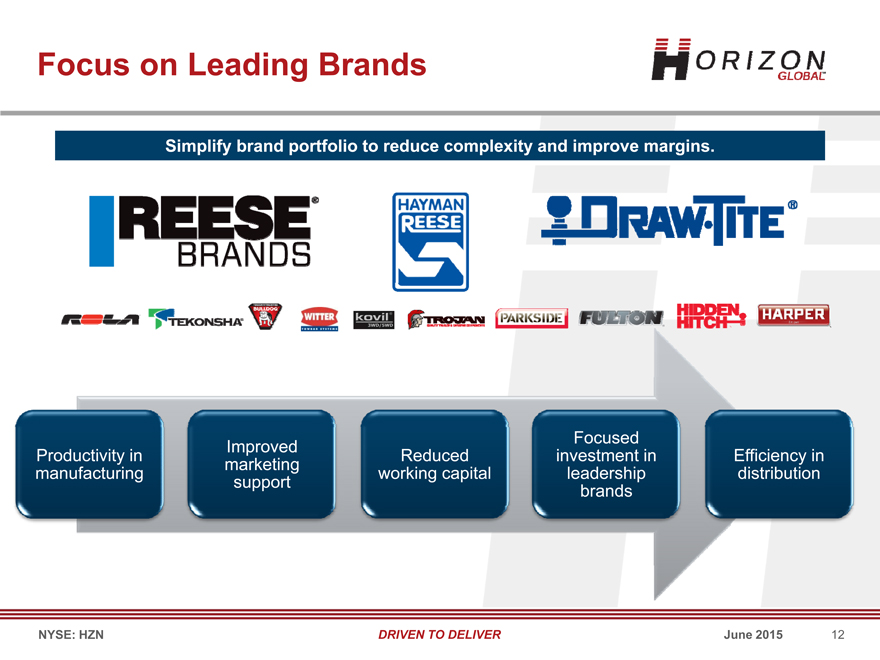
Focus on Leading Brands
Simplify brand portfolio to reduce complexity and improve margins.
Focused Improved
Productivity in Reduced investment in Efficiency in marketing manufacturing working capital leadership distribution support brands
NYSE: HZN DRIVEN TO DELIVER June 2015 12
|
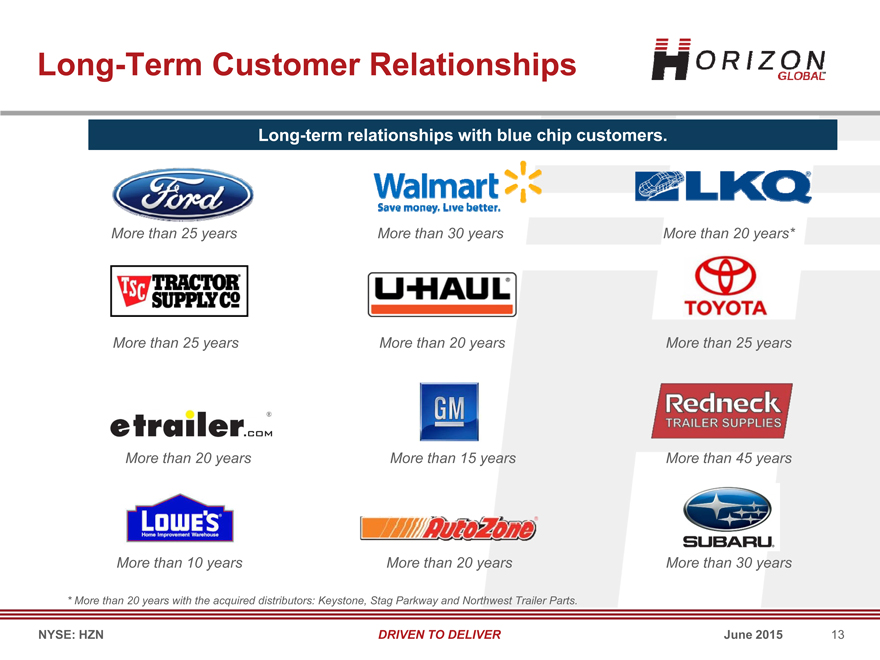
Long-Term Customer Relationships
Long-term relationships with blue chip customers.
More than 25 years More than 30 years More than 20 years* More than 25 years More than 20 years More than 25 years More than 20 years More than 15 years More than 45 years
More than 10 years More than 20 years More than 30 years
* More than 20 years with the acquired distributors: Keystone, Stag Parkway and Northwest Trailer Parts.
NYSE: HZN DRIVEN TO DELIVER June 2015 13
|
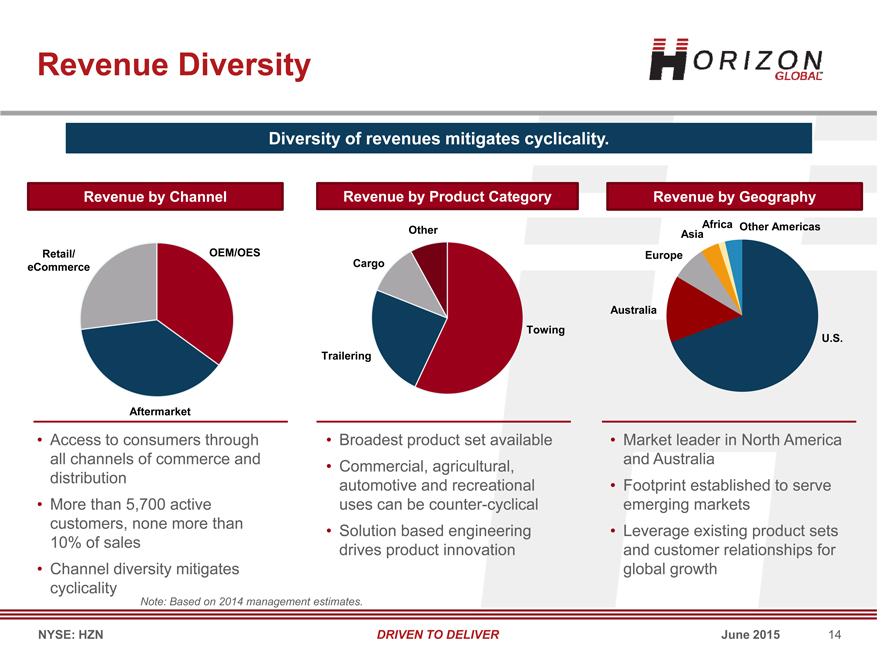
Revenue Diversity
Diversity of revenues mitigates cyclicality.
Revenue by Channel Revenue by Product Category Revenue by Geography
Africa Other Americas Other Asia Retail/ OEM/OES Europe eCommerce Cargo
Australia Towing
U.S. Trailering
Aftermarket
Access to consumers through Broadest product set available Market leader in North America all channels of commerce and and Australia
Commercial, agricultural, distribution automotive and recreational Footprint established to serve
More than 5,700 active uses can be counter-cyclical emerging markets customers, none more than
Solution based engineering Leverage existing product sets 10% of sales drives product innovation and customer relationships for
Channel diversity mitigates global growth cyclicality
Note: Based on 2014 management estimates.
NYSE: HZN DRIVEN TO DELIVER June 2015 14
|

Financial Overview & Key Objectives
|
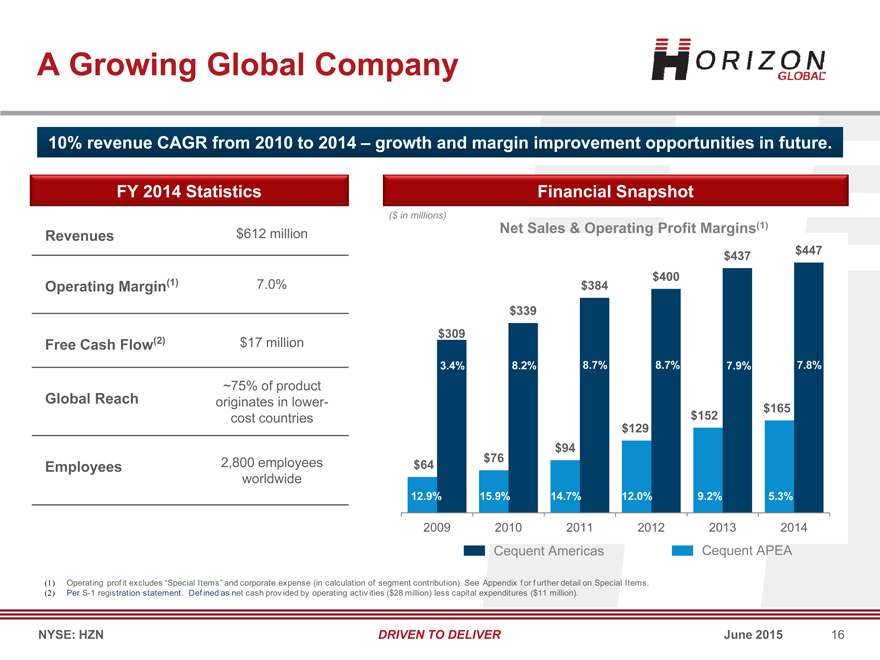
A Growing Global Company
10% revenue CAGR from 2010 to 2014 – growth and margin improvement opportunities in future.
FY 2014 Statistics Financial Snapshot
($ in millions)
Net Sales & Operating Profit Margins(1)
Revenues $612 million $447 $437 $400
Operating Margin(1) 7.0% $384 $339 $309
Free Cash Flow(2) $17 million
3.4% 8.2% 8.7% 8.7% 7.9% 7.8%
Global Reach ~75% of product originates in lower$165 cost countries $152 $129 $94
2,800 employees $76
Employees $64 worldwide
12.9% 15.9% 14.7% 12.0% 9.2% 5.3%
2009 2010 2011 2012 2013 2014
Cequent Americas Cequent APEA
(1) Operating prof it excludes “Special Items” and corporate expense (in calculation of segment contribution). See Appendix f or f urther detail on Special Items. (2) Per S-1 registration statement. Def ined as net cash prov ided by operating activ ities ($28 million) less capital expenditures ($11 million).
NYSE: HZN DRIVEN TO DELIVER June 2015 16
|
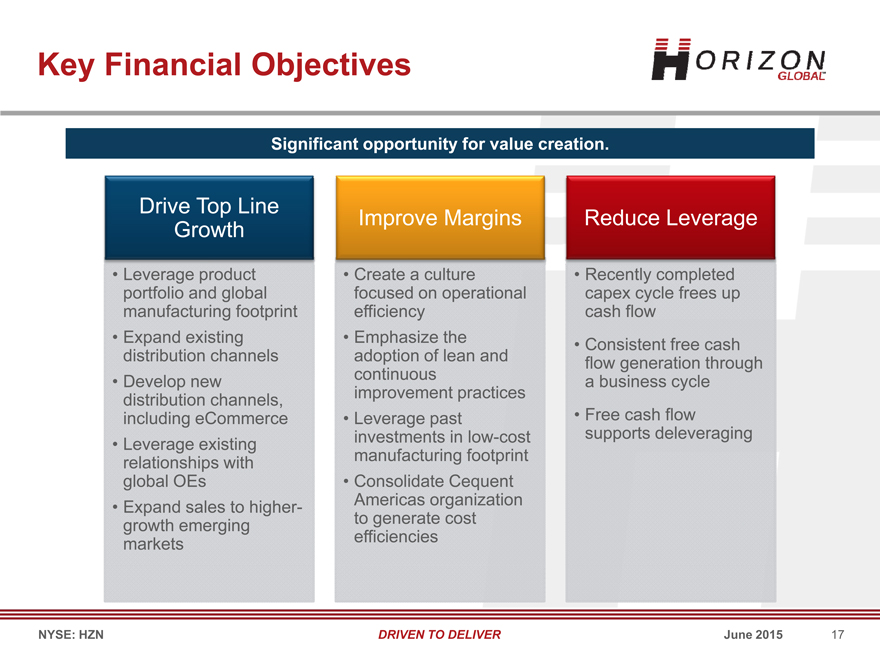
Key Financial Objectives
Significant opportunity for value creation.
Drive Top Line
Improve Margins Reduce Leverage Growth
Leverage product Create a culture Recently completed portfolio and global focused on operational capex cycle frees up manufacturing footprint efficiency cash flow
Expand existing Emphasize the Consistent free cash distribution channels adoption of lean and flow generation through
Develop new continuous a business cycle distribution channels, improvement practices including eCommerce Leverage past Free cash flow investments in low-cost supports deleveraging
Leverage existing relationships with manufacturing footprint global OEs Consolidate Cequent
Expand sales to higher- Americas organization growth emerging to generate cost markets efficiencies
NYSE: HZN DRIVEN TO DELIVER June 2015 17
|
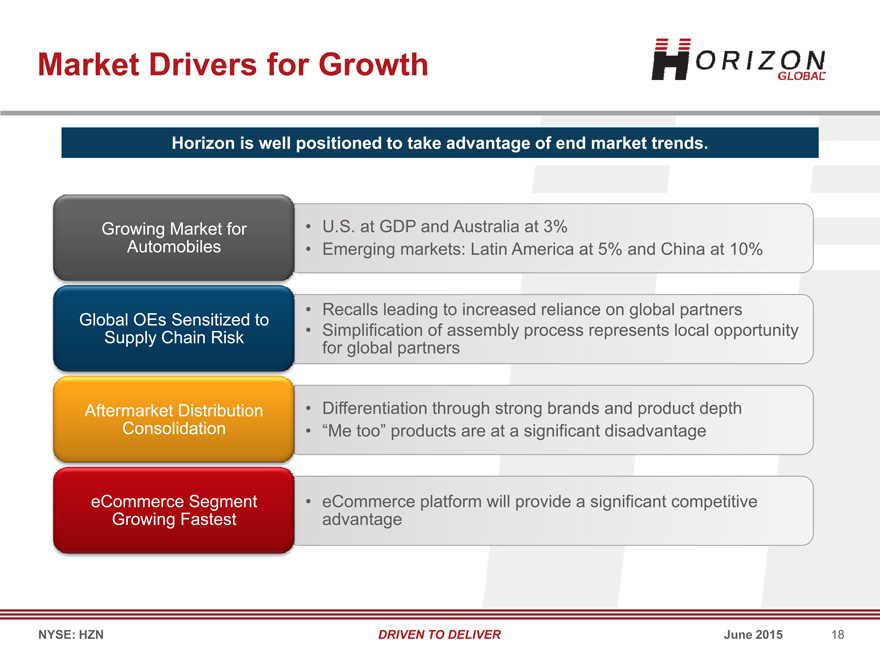
Market Drivers for Growth
Horizon is well positioned to take advantage of end market trends.
Growing Market for • U.S. at GDP and Australia at 3%
Automobiles • Emerging markets: Latin America at 5% and China at 10%
Recalls leading to increased reliance on global partners Global OEs Sensitized to Supply Chain Risk Simplification of assembly process represents local opportunity for global partners
Aftermarket Distribution • Differentiation through strong brands and product depth Consolidation • “Me too” products are at a significant disadvantage
eCommerce Segment • eCommerce platform will provide a significant competitive Growing Fastest advantage
NYSE: HZN DRIVEN TO DELIVER June 2015 18
|
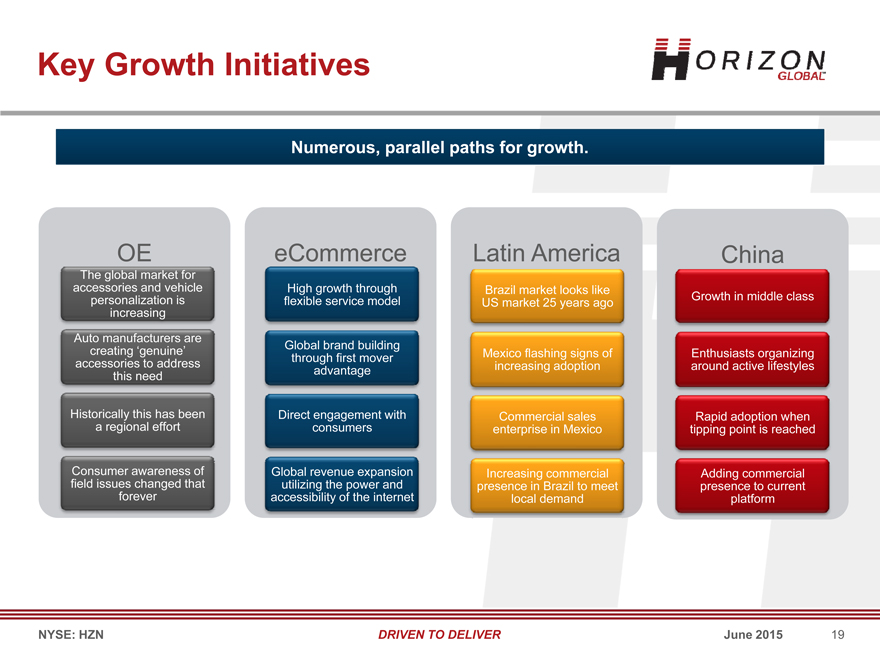
Key Growth Initiatives
Numerous, parallel paths for growth.
OE eCommerce Latin America China
The global market for accessories and vehicle High growth through Brazil market looks like personalization is flexible service model Growth in middle class US market 25 years ago increasing
Auto manufacturers are
Global brand building creating ‘genuine’ Mexico flashing signs of Enthusiasts organizing accessories to address through first mover advantage increasing adoption around active lifestyles this need
Historically this has been Direct engagement with Commercial sales Rapid adoption when a regional effort consumers enterprise in Mexico tipping point is reached
Consumer awareness of Global revenue expansion Increasing commercial Adding commercial field issues changed that utilizing the power and presence in Brazil to meet presence to current forever accessibility of the internet local demand platform
NYSE: HZN DRIVEN TO DELIVER June 2015 19
|
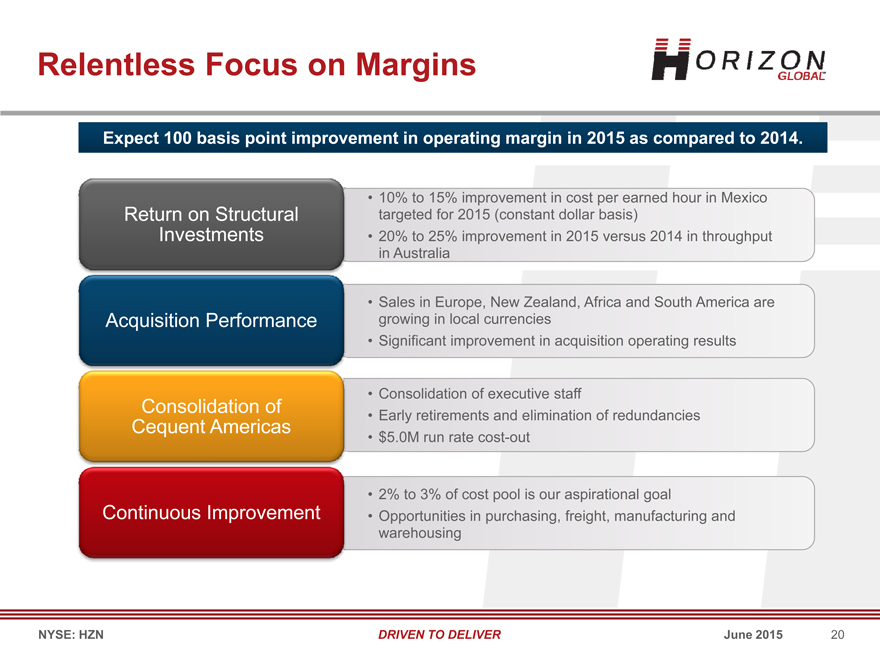
Relentless Focus on Margins
Expect 100 basis point improvement in operating margin in 2015 as compared to 2014.
10% to 15% improvement in cost per earned hour in Mexico Return on Structural targeted for 2015 (constant dollar basis) Investments 20% to 25% improvement in 2015 versus 2014 in throughput in Australia
Sales in Europe, New Zealand, Africa and South America are Acquisition Performance growing in local currencies
Significant improvement in acquisition operating results
Consolidation of executive staff
Consolidation of
Early retirements and elimination of redundancies
Cequent Americas
$5.0M run rate cost-out
2% to 3% of cost pool is our aspirational goal
Continuous Improvement • Opportunities in purchasing, freight, manufacturing and warehousing
NYSE: HZN DRIVEN TO DELIVER June 2015 20
|
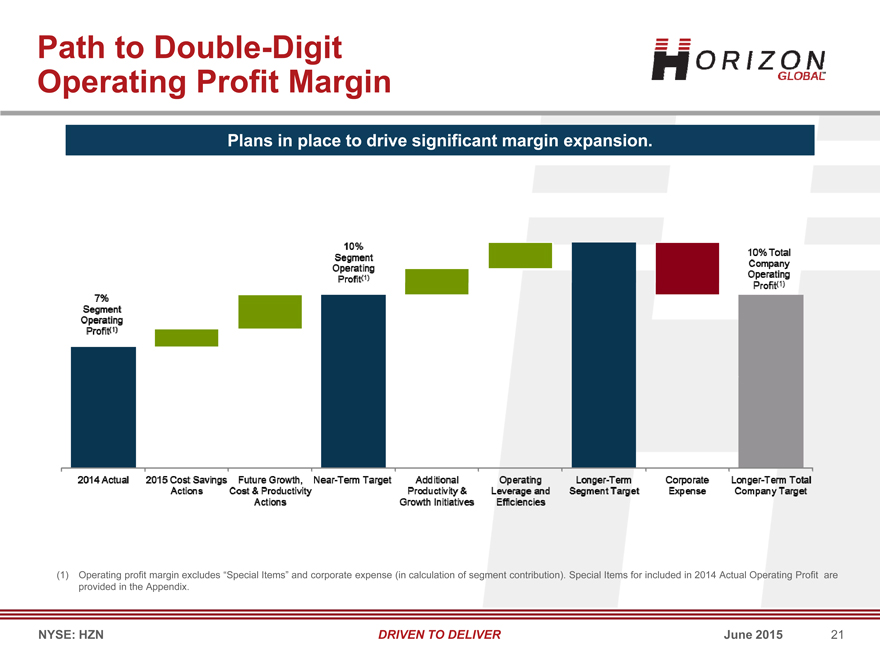
Path to Double-Digit Operating Profit Margin
Plans in place to drive significant margin expansion.
(1) Operating profit margin excludes “Special Items” and corporate expense (in calculation of segment contribution). Special Items for included in 2014 Actual Operating Profit are provided in the Appendix.
NYSE: HZN DRIVEN TO DELIVER June 2015 21
|
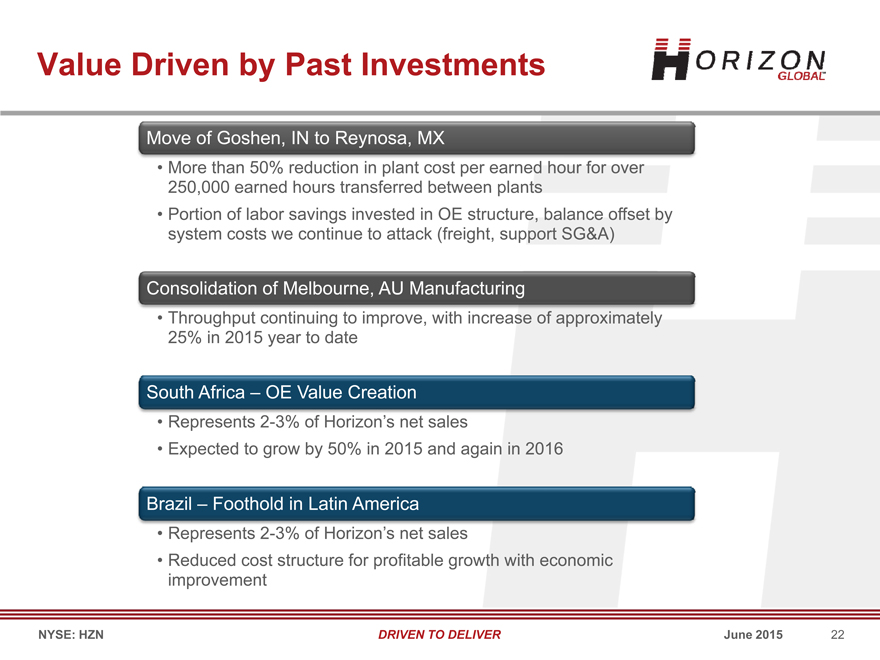
Value Driven by Past Investments
Move of Goshen, IN to Reynosa, MX
More than 50% reduction in plant cost per earned hour for over 250,000 earned hours transferred between plants
Portion of labor savings invested in OE structure, balance offset by system costs we continue to attack (freight, support SG&A)
Consolidation of Melbourne, AU Manufacturing
Throughput continuing to improve, with increase of approximately 25% in 2015 year to date
South Africa – OE Value Creation
Represents 2-3% of Horizon’s net sales
Expected to grow by 50% in 2015 and again in 2016
Brazil – Foothold in Latin America
Represents 2-3% of Horizon’s net sales
Reduced cost structure for profitable growth with economic improvement
NYSE: HZN DRIVEN TO DELIVER June 2015 22
|

Margin Enhancement Through Productivity
Annual goal of 2 to 3% productivity improvements.
Manu- Distri-
Purchasing Freight facturing bution
Steel costs Labor costs from Product availability Best practices Mexico manufacturing Midwest steel • Processes
Asian buy-sell footprint • Systems
Mexican material Intercompany
Tribal knowledge • Metrics management team • Productivity shipments
Inventory
Outsourcing Asian shipment
Mexico supply chain • On demand cartons
Quality
Asian team focus OE readiness consolidation Short term customer
Asian vendor Continuous New transportation logistic solutions improvement activities management New tools – WMS & consolidation
Insourcing system voice picking
NYSE: HZN DRIVEN TO DELIVER June 2015 23
|
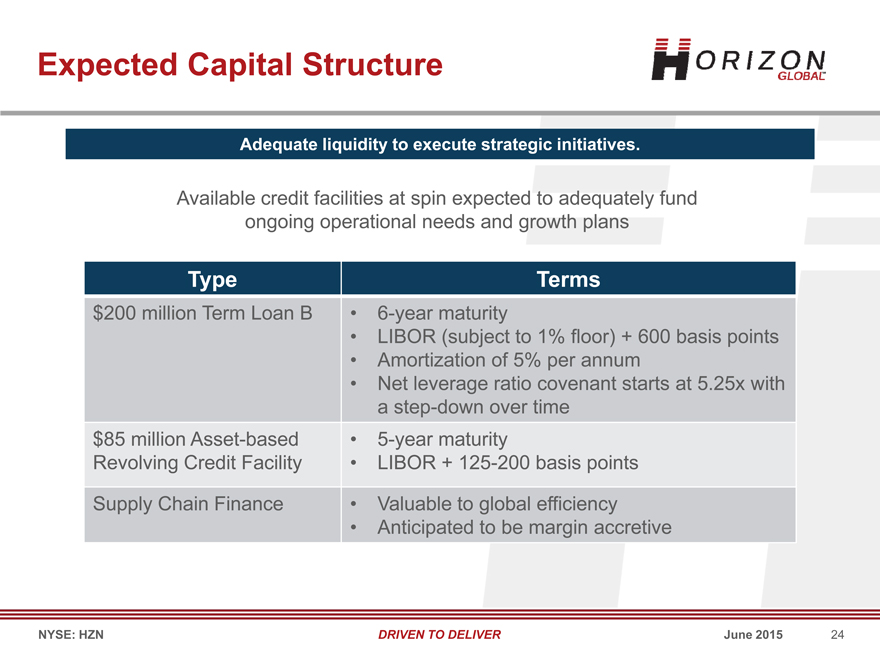
Expected Capital Structure
Adequate liquidity to execute strategic initiatives.
Available credit facilities at spin expected to adequately fund ongoing operational needs and growth plans
Type Terms $200 million Term Loan B • 6-year maturity
LIBOR (subject to 1% floor) + 600 basis points
Amortization of 5% per annum
Net leverage ratio covenant starts at 5.25x with a step-down over time $85 million Asset-based 5-year maturity Revolving Credit Facility LIBOR + 125-200 basis points
Supply Chain Finance • Valuable to global efficiency
Anticipated to be margin accretive
NYSE: HZN DRIVEN TO DELIVER June 2015 24
|
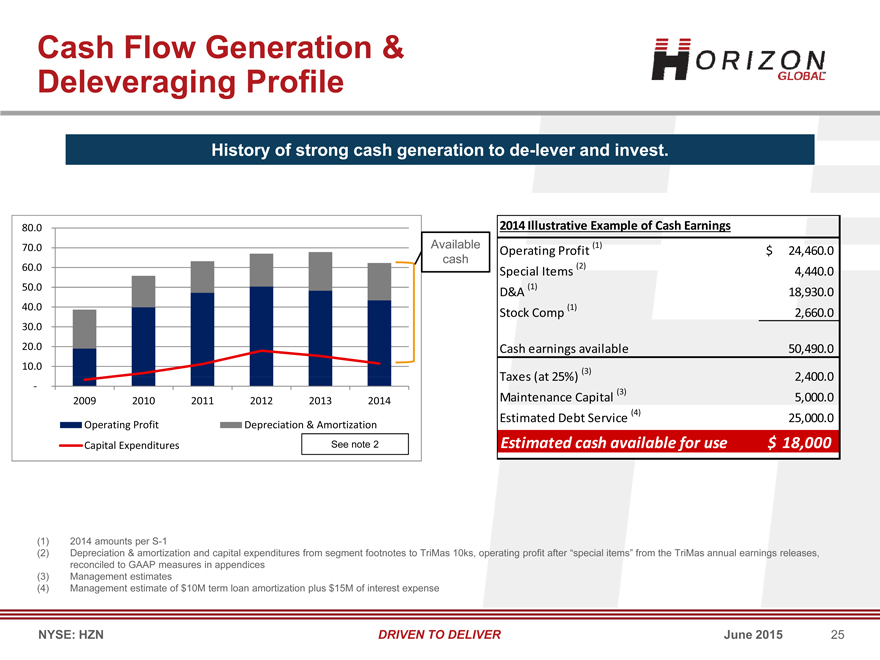
Cash Flow Generation & Deleveraging Profile
History of strong cash generation to de-lever and invest.
80.0 2014 Illustrative Example of Cash Earnings
70.0 Available (1)
Operating Profit $ 24,460.0 cash
60.0 (2)
Special Items 4,440.0
50.0 (1)
D&A 18,930.0
40.0 (1)
Stock Comp 2,660.0
30.0
20.0 Cash earnings available 50,490.0
10.0
(3)
Taxes (at 25%) 2,400.0
(3)
2009 2010 2011 2012 2013 2014 Maintenance Capital 5,000.0
(4)
Estimated Debt Service 25,000.0
Operating Profit Depreciation & Amortization
Capital Expenditures See note 2 Estimated cash available for use $ 18,000
(1) 2014 amounts per S-1
(2) Depreciation & amortization and capital expenditures from segment footnotes to TriMas 10ks, operating profit after “special items” from the TriMas annual earnings releases, reconciled to GAAP measures in appendices (3) Management estimates (4) Management estimate of $10M term loan amortization plus $15M of interest expense
NYSE: HZN DRIVEN TO DELIVER June 2015 25
|
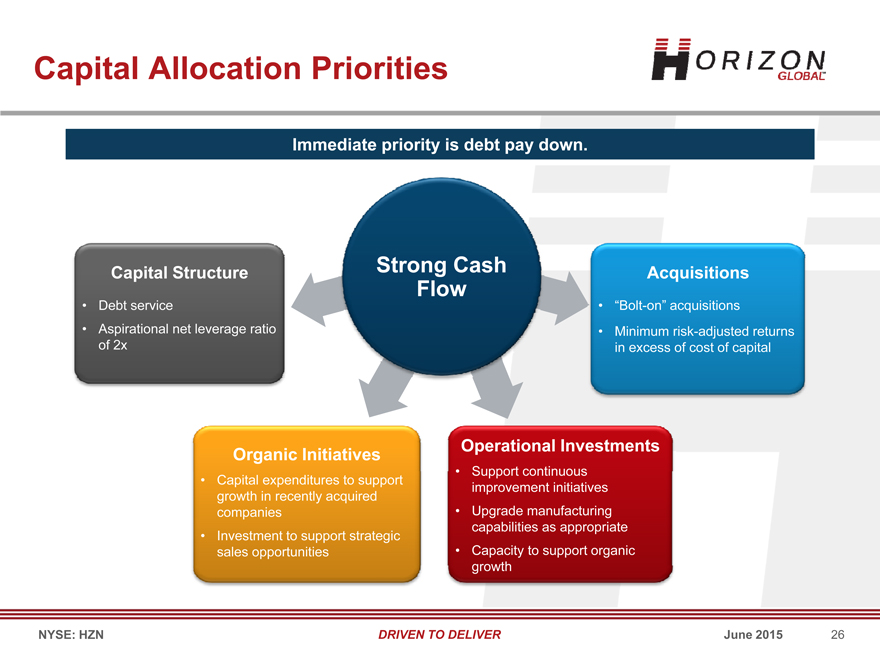
Capital Allocation Priorities
Immediate priority is debt pay down.
Capital Structure Strong Cash Acquisitions
Flow
Debt service “Bolt-on” acquisitions
Aspirational net leverage ratio Minimum risk-adjusted returns of 2x in excess of cost of capital
Operational Investments Organic Initiatives
Support continuous
Capital expenditures to support improvement initiatives growth in recently acquired companies Upgrade manufacturing capabilities as appropriate
Investment to support strategic sales opportunities Capacity to support organic
NYSE: HZN DRIVEN TO DELIVER June 2015 26
|
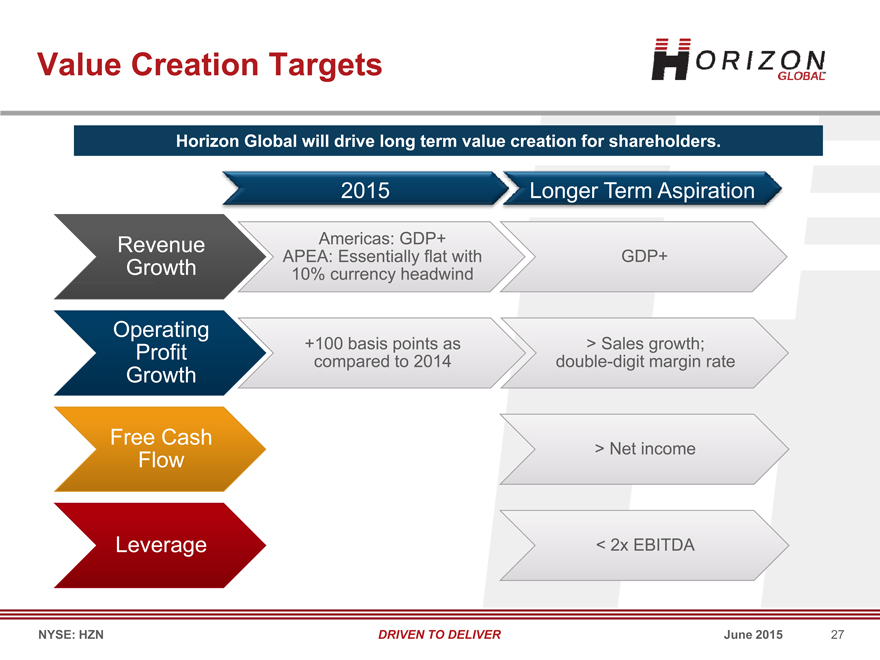
Value Creation Targets
Horizon Global will drive long term value creation for shareholders.
2015 Longer Term Aspiration
Revenue Growth Operating Profit Growth Free Cash Flow
Leverage Americas: GDP+ APEA: Essentially flat with 10% currency headwind
+100 basis points as compared to 2014 GDP+
>Sales growth double-digit margin rate
>Net income <2x EBITDA NYSE: HZN DRIVEN TO DELIVER June 2015 27
|

Key Investment Considerations
A strong foundation to create future value.
Global Scale with Flexible • Global footprint supports regional demand fulfillment Manufacturing Footprint and • Positioned to serve higher-growth emerging markets Supply Chain • Flexibility of manufactured or sourced solution
Broad Product Portfolio of • Diverse product portfolio supported by recognized brands
Market Leading Brands • Focused investment on leading brands benefits the entire portfolio
Long-Term Relationships • Multiple channels to reach end consumers with a Diverse • Strong global partnerships provide stability to revenue base; mitigates
Customer Base cyclicality
Positioned for Top-Line • Multiple avenues for top-line growth
Growth and Margin • Harvest benefits from recent investment cycle Enhancement • Best-in-class cost structure
Free Cash Flow Generation • Consistent free cash flow generation through the business cycle
& Deleveraging
NYSE: HZN DRIVEN TO DELIVER June 2015 28
|

Questions & Answers
|
Appendix
|
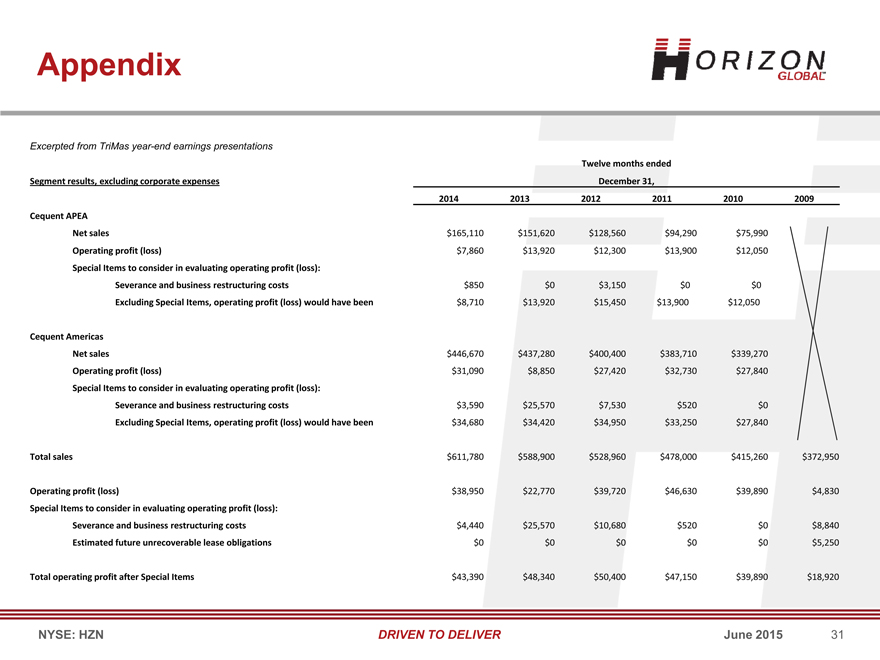
Appendix
Excerpted from TriMas year-end earnings presentations
Twelve months ended
Segment results, excluding corporate expenses December 31,
2014 2013 2012 2011 2010 2009
Cequent APEA
Net sales $165,110 $151,620 $128,560 $94,290 $75,990
Operating profit (loss) $7,860 $13,920 $12,300 $13,900 $12,050
Special Items to consider in evaluating operating profit (loss):
Severance and business restructuring costs $850 $0 $3,150 $0 $0
Excluding Special Items, operating profit (loss) would have been $8,710 $13,920 $15,450 $13,900 $12,050
Cequent Americas
Net sales $446,670 $437,280 $400,400 $383,710 $339,270
Operating profit (loss) $31,090 $8,850 $27,420 $32,730 $27,840
Special Items to consider in evaluating operating profit (loss):
Severance and business restructuring costs $3,590 $25,570 $7,530 $520 $0
Excluding Special Items, operating profit (loss) would have been $34,680 $34,420 $34,950 $33,250 $27,840
Total sales $611,780 $588,900 $528,960 $478,000 $415,260 $372,950
Operating profit (loss) $38,950 $22,770 $39,720 $46,630 $39,890 $4,830
Special Items to consider in evaluating operating profit (loss):
Severance and business restructuring costs $4,440 $25,570 $10,680 $520 $0 $8,840
Estimated future unrecoverable lease obligations $0 $0 $0 $0 $0 $5,250
Total operating profit after Special Items $43,390 $48,340 $50,400 $47,150 $39,890 $18,920
NYSE: HZN DRIVEN TO DELIVER June 2015 31
|
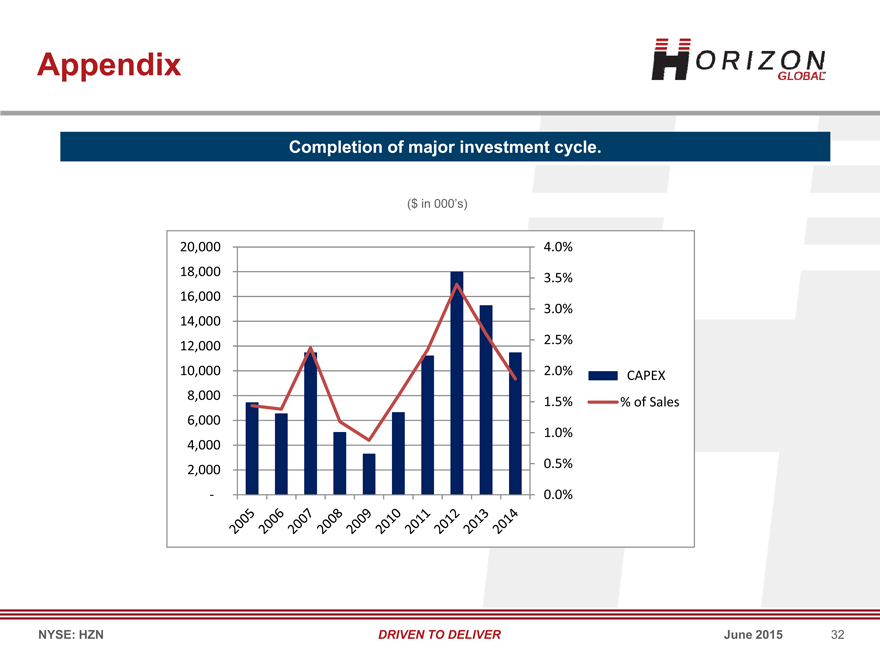
Appendix
Completion of major investment cycle.
($ in 000’s)
20,000 4.0%
18,000
3.5% 16,000
3.0% 14,000
2.5% 12,000
10,000 2.0% CAPEX 8,000
1.5% % of Sales 6,000
1.0% 4,000
0.5%
2,000
0.0%
NYSE: HZN DRIVEN TO DELIVER June 2015 32