Filed by Milacron Holdings Corp.
pursuant to Rule 425 under the Securities Act of 1933
and deemed filed pursuant to Rule 14a-12
under the Securities Exchange Act of 1934
Subject Company: Milacron Holdings Corp.
Commission File No.: 001-37458

Q2 2019 EARNINGS CALL JULY 30, 2019
|
IMPORTANT INFORMATION Forward Looking Statements These slides contain (and the accompanying oral discussion will contain) “forward looking statements”. All statements other than statements of historical fact or relating to present facts or current conditions are forward-looking statements. Such statements involve known and unknown risks, uncertainties and other factors that could cause the actual results of the Company to differ materially from the results expressed or implied by such statements, including general economic and business conditions, conditions affecting the industries served by the Company and its subsidiaries, conditions affecting the Company’s customers and suppliers, competitor responses to the Company’s products and services, the overall market acceptance of such products and services, increases in the Company’s cost structure, the rate of economic development and growth in emerging markets, the Company’s exposure to fluctuations in currencies, the Company’s ability to successfully implement its strategic initiatives to increase cost savings and improve operating margins, the integration of acquisitions and other factors disclosed in the Company’s periodic reports. Such risks and other factors that may impact management’s beliefs and assumptions are more particularly described in the Company’s Form 10-K filed with the Securities and Exchange Commission (the “SEC”) on February 28, 2019 under the caption “Risk Factors.” Consequently such forward-looking statements should be regarded as the Company’s current plans, estimates and beliefs. The forward looking statements in these slides are made only as of the date hereof. The Company does not undertake and specifically declines any obligation to publicly release the results of any revisions to these forward-looking statements that may be made to reflect any future events or circumstances after the date of such statements or to reflect the occurrence of anticipated or unanticipated events, except to the extent required by law. All of the Company’s forward-looking statements should be considered in light of these factors. Non-GAAP Financial Measures These slides contain financial measures which have not been calculated in accordance with generally accepted accounting principles in the United States (“U.S. GAAP”), including Adjusted EBITDA, Adjusted Net Income, Free Cash Flow, Pro forma Net Sales and Pro forma New Orders. These non-GAAP financial measures should be considered only as supplemental to, and not as an alternative to, financial measures prepared in accordance with U.S. GAAP. Please refer to the appendix of this presentation for a reconciliation of Adjusted EBITDA, Adjusted Net Income, Free Cash Flow, Pro forma Net Sales and Pro forma New Orders to the most directly comparable U.S. GAAP financial measures. We believe that the inclusion of Adjusted EBITDA is useful to provide additional information to investors about certain material non-cash items, as well as items considered to be one-time or non-recurring to the operations of the business. We believe the presentation of Adjusted Net Income enhances our investors’ overall understanding of the financial performance and cash flows of our business. We believe the presentation of Free Cash Flow is useful to investors because it measures the operating cash flow of the Company, excluding the capital that is spent to continue and improve business operations, such as investment in the Company’s existing business. We believe the inclusion of Pro forma Net Sales and Pro forma New Orders is useful to investors because it excludes net sales and new orders, respectively, directly attributable to certain product lines which no longer align with our long-term strategic focus or certain product lines which have been re-launched. Our use of the terms Adjusted EBITDA, Adjusted Net Income, Free Cash Flow, Pro forma Net Sales and Pro forma New Orders may vary from that of others in our industry. This presentation should be read in conjunction with Management’s Discussion and Analysis of Financial Condition and Results of Operations and the Consolidated Financial Statements presented within our Form 10K filed with the SEC on February 28, 2019. 2a Q2’19 Earnings Presentation | 30 July 2019
|
Cautionary Statement This presentation contains statements, including statements regarding the proposed acquisition of Milacron Holdings Corp., a Delaware corporation (the “Company”) by Hillenbrand, Inc., an Indiana corporation (“Parent”) that are forward-looking statements within the meaning of the Private Securities Litigation Reform Act of 1995. Forward-looking statements may include, among other things, statements relating to future sales, earnings, cash flow, results of operations, uses of cash, financings, share repurchases and other measures of financial performance or potential future plans or events, strategies, objectives, expectations, beliefs, prospects, assumptions, projected costs or savings or transactions of Parent, the Company or the combined company following Parent’s proposed acquisition of the Company (the “Proposed Transaction”), the anticipated benefits of the Proposed Transaction, including estimated synergies, the expected timing of completion of the transaction and other statements that are not strictly historical in nature. In some cases, forward-looking statements can be identified by the following words: “may,” “will,” “could,” “would,” “should,” “expect,” “intend,” “plan,” “anticipate,” “believe,” “estimate,” “predict,” “project,” “potential,” “continue,” “ongoing,” “outlook,” “guidance” and similar expressions, although not all forward-looking statements contain these words. Forward-looking statements are not guarantees of future performance or events, and actual results or events could differ materially from those set forth in any forward-looking statement due to any number of factors. These factors include, but are not limited to: the impact of the 2017 Tax Cuts and Jobs Act, enacted by the U.S. government on December 22, 2017, on Parent’s or the Company’s financial position, results of operations, and cash flows; the outcome of any legal proceedings that may be instituted against Parent, the Company or any companies each may acquire; global market and economic conditions, including those related to the credit and equity markets and international trade related matters, tariffs and other trade matters; volatility of our respective investment portfolios; adverse foreign currency fluctuations; involvement in claims, lawsuits and governmental proceedings related to operations; labor disruptions; the dependence of Parent’s business units on relationships with several large providers; demand for our respective products being significantly affected by general economic conditions; increased costs or unavailability of raw materials; continued fluctuations in mortality rates and increased cremations; competition from nontraditional sources in the death care industry; any decline in the use of plastic; cyclical demand for industrial capital goods; the competitiveness of the industries in which we operate and the financial resources of our competitors; certain tax-related matters; changes to legislation, regulation, treaties or government policy, including any resulting from the current political environment; the ability of Parent and the Company to receive the required regulatory approvals for the Proposed Transaction, or that such regulatory approvals are obtained subject to conditions that are not anticipated or that could adversely affect the combined company or the expected benefits of the Proposed Transaction, the ability of the Company to receive the approval of the Company’s stockholders and the ability of the Company and Parent to satisfy the other conditions to the closing of the Proposed Transaction on a timely basis or at all; the occurrence of events that may give rise to a right of one or both of Parent and the Company to terminate the merger agreement; negative effects of the announcement or the consummation of the Proposed Transaction on the market price of Parent’s and/or the Company’s common stock and/or on their respective businesses, financial conditions, results of operations and financial performance (including the ability of the Company to maintain relationships with its customers, suppliers and others with whom it does business); uncertainties as to access to available financing of the Proposed Transaction (including financing for the Proposed Transaction) on a timely basis and on reasonable terms; uncertainties as to the long-term value of the common stock of Parent following the merger, including the dilution caused by Parent’s issuance of additional shares of its common stock in connection with the Proposed Transaction; the impact of the additional indebtedness Parent will incur in connection with the Proposed Transaction; risks relating to the value of the Parent shares to be issued in the Proposed Transaction; significant transaction costs and/or unknown liabilities of the Proposed Transaction; the possibility that the anticipated benefits from the Proposed Transaction cannot be realized by Parent in full or at all or may take longer to realize than expected; risks related to disruption of the Company’s management’s attention from the Company’s ongoing business operations due to the Proposed Transaction; risks associated with contracts containing consent and/or other provisions that may be triggered by the Proposed Transaction; risks associated with transaction-related litigation; the possibility that costs or difficulties related to the integration of the Company’s operations with those of Parent will be greater than expected; the ability of the Company and the combined company to retain and hire key personnel; the impact of new or changes in current laws, regulatory or other industry standards, including privacy and cybersecurity laws and regulations; and events beyond Parent’s and the Company’s control, such as acts of terrorism. There can be no assurance that the Proposed Transaction or any other transaction described above will in fact be consummated in the manner described or at all. Stockholders, potential investors and other readers are urged to consider these risks and uncertainties in evaluating forward- looking statements and are cautioned not to place undue reliance on the forward-looking statements. For additional information on identifying factors that may cause actual results to vary materially from those stated in forward-looking statements, please see Parent’s and the Company’s reports on Forms 10-K, 10-Q and 8-K filed with or furnished to the U.S. Securities and Exchange Commission (the “SEC”) and other written statements made by Parent and/or the Company from time to time. The forward-looking information herein is given as of this date only, and neither Parent nor the Company undertakes any obligation to revise or update it. Additional Information and Where to Find It In connection with the proposed acquisition by Hillenbrand, Inc., an Indiana corporation (“Parent”), of Milacron Holdings Corp., a Delaware corporation (the “Company”) (the “Proposed Transaction”), Parent will file with the SEC a registration statement on Form S-4 to register the shares of Parent’s common stock to be issued in connection with the Proposed Transaction. The registration statement will include a document that serves as a prospectus of Parent and a proxy statement of the Company (the “proxy statement/prospectus”), and each party will file other documents regarding the Proposed Transaction with the SEC. INVESTORS AND SECURITY HOLDERS ARE URGED TO READ THE REGISTRATION STATEMENT, PROXY STATEMENT/PROSPECTUS, INCLUDING ANY AMENDMENTS OR SUPPLEMENTS TO THOSE DOCUMENTS, AND ANY OTHER RELEVANT DOCUMENTS FILED OR TO BE FILED WITH THE SEC IN CONNECTION WITH THE PROPOSED TRANSACTION WHEN THEY BECOME AVAILABLE, BECAUSE THEY DO AND THEY WILL CONTAIN IMPORTANT INFORMATION ABOUT THE PROPOSED TRANSACTION AND THE PARTIES TO THE PROPOSED TRANSACTION. A definitive proxy statement/prospectus will be sent to the Company’s stockholders when it becomes available. Investors and security holders will be able to obtain the registration statement and the proxy statement/prospectus free of charge from the SEC’s website or from Parent or the Company when it becomes available. The documents filed by Parent with the SEC may be obtained free of charge at Parent’s website at www.hillenbrand.com or at the SEC’s website at www.sec.gov. These documents may also be obtained free of charge from Parent by requesting them by mail at Hillenbrand, Inc., One Batesville Boulevard, Batesville, IN 47006, or by telephone at (812) 931-6000. The documents filed by the Company with the SEC may be obtained free of charge at the Company’s website at www.milacron.com or at the SEC’s website at www.sec.gov. These documents may also be obtained free of charge from the Company by requesting them by mail at Milacron Holdings Corp., 10200 Alliance Road, Suite 200, Cincinnati, OH, 45242, or by telephone at (513) 487-5000. Participants in the Solicitation Hillenbrand, Inc., an Indiana corporation (“Parent”), Milacron Holdings Corp., a Delaware corporation (the “Company”) and their respective directors and executive officers and other members of management and employees may be deemed to be participants in the solicitation of proxies from the Company’s stockholders with respect to the Proposed Transaction. Information about Parent’s directors and executive officers is available in Parent’s Annual Report on Form 10-K for the fiscal year ended September 30, 2018 filed with the SEC on November 13, 2018 and its definitive proxy statement for the 2019 annual meeting of shareholders filed with the SEC on January 2, 2019. Inform
|
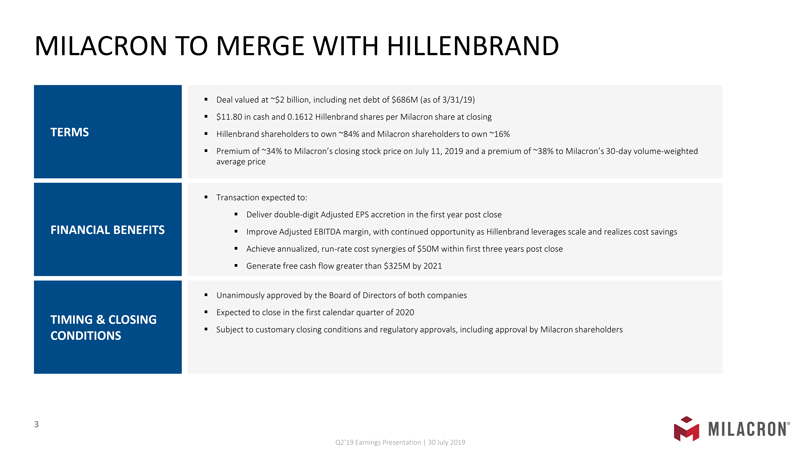
MILACRON TO MERGE WITH HILLENBRAND TERMS FINANCIAL BENEFITS TIMING & CLOSING CONDITIONS • Deal valued at ~$2 billion, including net debt of $686M (as of 3/31/19) • $11.80 in cash and 0.1612 Hillenbrand shares per Milacron share at closing • Hillenbrand shareholders to own ~84% and Milacron shareholders to own ~16% • Premium of ~34% to Milacron’s closing stock price on July 11, 2019 and a premium of ~38% to Milacron’s 30-day volume-weighted average price • Transaction expected to: • Deliver double-digit Adjusted EPS accretion in the first year post close • Improve Adjusted EBITDA margin, with continued opportunity as Hillenbrand leverages scale and realizes cost savings • Achieve annualized, run-rate cost synergies of $50M within first three years post close • Generate free cash flow greater than $325M by 2021 • Unanimously approved by the Board of Directors of both companies • Expected to close in the first calendar quarter of 2020 • Subject to customary closing conditions and regulatory approvals, including approval by Milacron shareholders Q2’19 Earnings Presentation | 30 July 2019
|
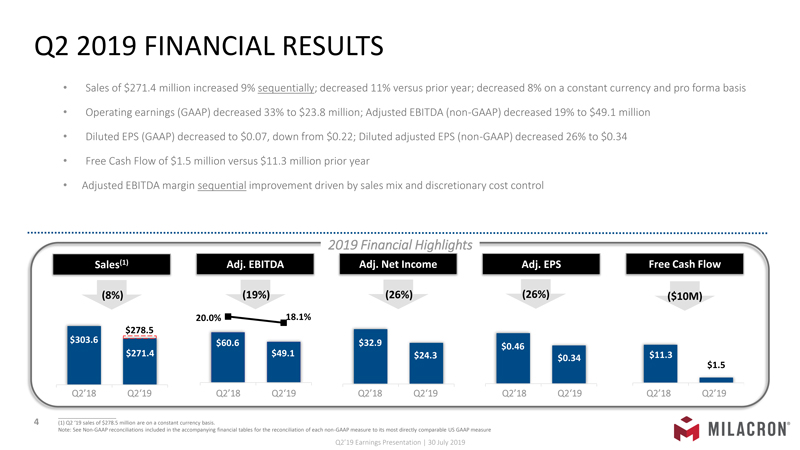
Q2 2019 FINANCIAL RESULTS • Sales of $271.4 million increased 9% sequentially; decreased 11% versus prior year; decreased 8% on a constant currency and pro forma basis • Operating earnings (GAAP) decreased 33% to $23.8 million; Adjusted EBITDA (non-GAAP) decreased 19% to $49.1 million • Diluted EPS (GAAP) decreased to $0.07, down from $0.22; Diluted adjusted EPS (non-GAAP) decreased 26% to $0.34 • Free Cash Flow of $1.5 million versus $11.3 million prior year • Adjusted EBITDA margin sequential improvement driven by sales mix and discretionary cost control 2019 Financial Highlights Adj. EPS Adj. Net Income Free Cash Flow Sales(1) Adj. EBITDA Q2’18 Q2’19 (8%) $60.6 $49.1 20.0% 18.1% (26%) (26%) ($10M) $32.9 $24.3 $0.46 $0.34 ____________________ (1) Q2 ‘19 sales of $278.5 million are on a constant currency basis. Note: See Non-GAAP reconciliations included in the accompanying financial tables for the reconciliation of each non -GAAP measure to its most directly comparable US GAAP measure (19%) $271.4 $303.6 $278.5 $1.5 $11.3 Q2’18 Q2’19 Q2’18 Q2’19 Q2’18 Q2’19 Q2’18 Q2’19 Q2’19 Earnings Presentation | 30 July 2019
|
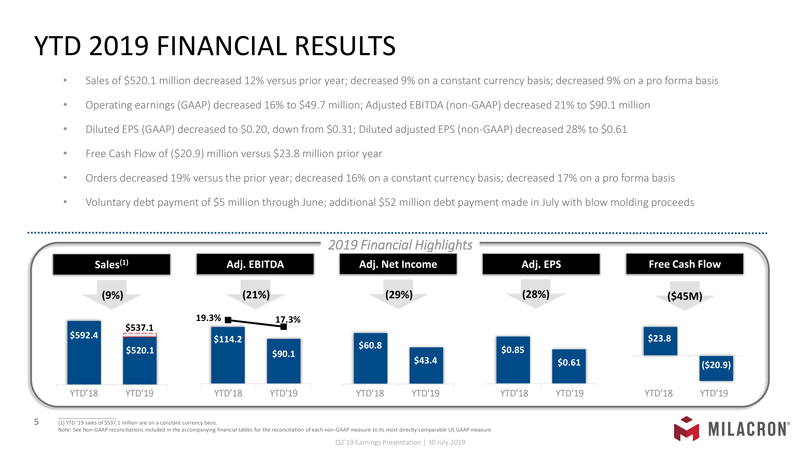
YTD 2019 FINANCIAL RESULTS • Sales of $520.1 million decreased 12% versus prior year; decreased 9% on a constant currency basis; decreased 9% on a pro forma basis • Operating earnings (GAAP) decreased 16% to $49.7 million; Adjusted EBITDA (non-GAAP) decreased 21% to $90.1 million • Diluted EPS (GAAP) decreased to $0.20, down from $0.31; Diluted adjusted EPS (non-GAAP) decreased 28% to $0.61 • Free Cash Flow of ($20.9) million versus $23.8 million prior year • Orders decreased 19% versus the prior year; decreased 16% on a constant currency basis; decreased 17% on a pro forma basis • Voluntary debt payment of $5 million through June; additional $52 million debt payment made in July with blow molding proceeds 2019 Financial Highlights Adj. EPS Adj. Net Income Free Cash Flow Sales(1) Adj. EBITDA YTD’18 YTD’19 (9%) $114.2 $90.1 19.3% 17.3% (29%) (28%) ($45M) $60.8 $43.4 $0.85 $0.61 (21%) $520.1 $592.4 $537.1 ($20.9) $23.8 YTD’18 YTD’19 YTD’18 YTD’19 YTD’18 YTD’19 YTD’18 YTD’19 ____________________ (1) YTD ‘19 sales of $537.1 million are on a constant currency basis. Note: See Non-GAAP reconciliations included in the accompanying financial tables for the reconciliation of each non -GAAP measure to its most directly comparable US GAAP measure Q2’19 Earnings Presentation | 30 July 2019
|
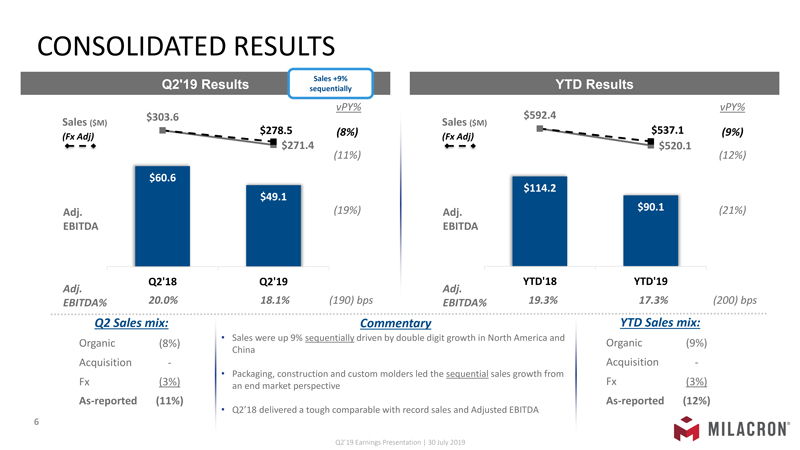
CONSOLIDATED RESULTS Q2’19 Results YTD Results Sales +9% sequentially vPY% vPY% $592.4 $303.6 Sales ($M) Sales ($M) $537.1 $278.5 (8%) (9%) (Fx Adj) (Fx Adj) $271.4 $520.1 $60.6$49.1 (11%) (12%) (19%) $114.2$90.1 (21%) Adj. Adj. EBITDA EBITDA Q2’18 Adj. 20.0% EBITDA% Q2 Sales mix: (8%) - (3%) (11%) Q2’19 Adj. YTD’18 18.1% (190) bps EBITDA% 19.3% Commentary Sales were up 9% sequentially driven by double digit growth in North America and China Packaging, construction and custom molders led the sequential sales growth from an end market perspective Q2’18 delivered a tough comparable with record sales and Adjusted EBITDA Q2’19 Earnings Presentation | 30 July 2019 YTD’19 17.3% (200) bps YTD Sales mix: Organic (9%) Acquisition - Fx (3%) As-reported (12%) Organic Acquisition Fx As-reported
|
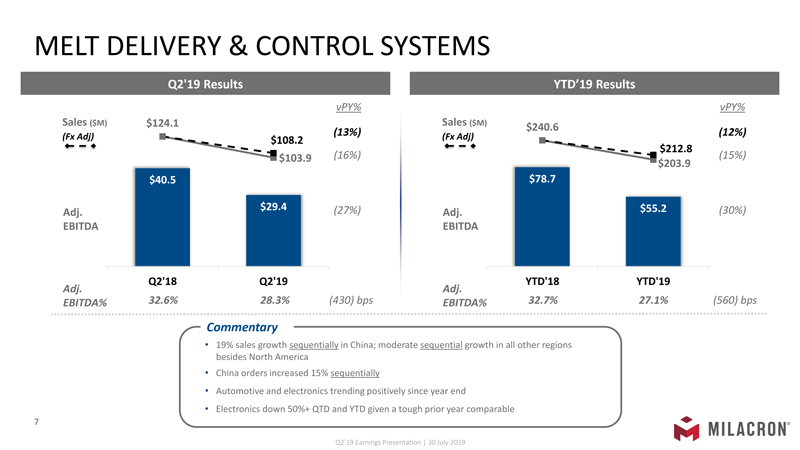
MELT DELIVERY & CONTROL SYSTEMS Q2’19 Results YTD’19Results vPY% Sales ($M) $124.1 (13%) (Fx Adj) $108.2 (16%) $103.9 $40.5 $29.4 (27%) Adj. EBITDA Q2’18 Q2’19 Adj. 32.6% 28.3% (430) bps EBITDA% $78.7 $55.2 $203.9 vPY% Sales ($M) $240.6 (12%) (Fx Adj) $212.8 (15%) (30%) Adj. EBITDA YTD’18 YTD’19 Adj. 32.7% 27.1% (560) bps EBITDA% Commentary •19% sales growth sequentially in China; moderate sequential growth in all other regions besides North America •China orders increased 15% sequentially •Automotive and electronics trending positively since year end •Electronics down 50%+ QTD and YTD given a tough prior year comparable 7 Q2’19 Earnings Presentation | 30 July 2019
|
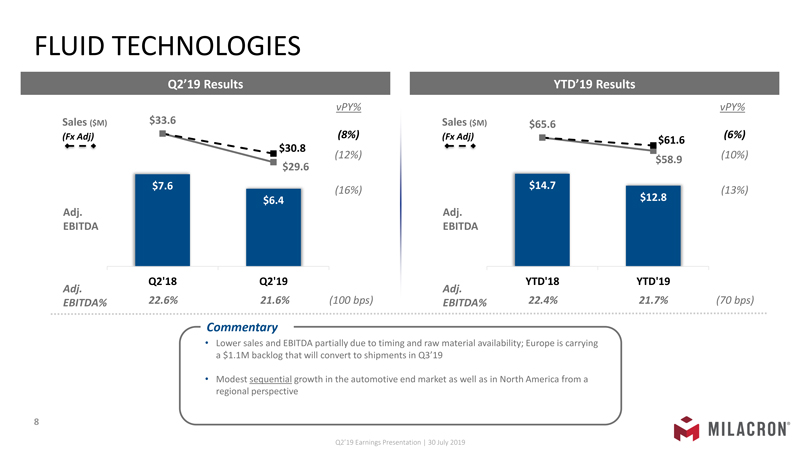
FLUID TECHNOLOGIES YTD’19Results Q2’19Results vPY% Sales ($M) $33.6 (8%) (Fx Adj) $30.8 (12%) $7.6 $6.4 (16%) $29.6 Adj. EBITDA Q2’18 Q2’19 Adj. 22.6% 21.6% (100 bps) EBITDA% vPY% Sales ($M) $65.6 (6%) (Fx Adj) $61.6 (10%) $58.9 $14.7 $12.8 (13%) Adj. EBITDA YTD’18 YTD’19 Adj. 22.4% 21.7% (70 bps) EBITDA% Commentary •Lower sales and EBITDA partially due to timing and raw material availability; Europe is carrying a $1.1M backlog that will convert to shipments in Q3’19 •Modest sequential growth in the automotive end market as well as in North America from a regional perspective 8 Q2’19 Earnings Presentation | 30 July 2019
|
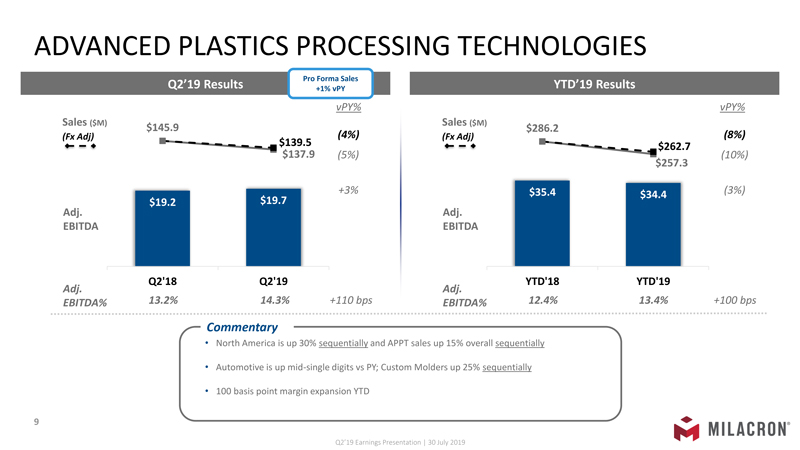
ADVANCED PLASTICS PROCESSING TECHNOLOGIES YTD’19Results Q2’19Results Pro Forma Sales +1% vPY vPY% Sales ($M) $145.9 (4%) (Fx Adj) $139.5 $137.9 (5%) +3% Adj. EBITDA $19.2 $19.7 Q2’18 Q2’19 Adj. 13.2% 14.3% +110 bps EBITDA% vPY% Sales ($M) $286.2 (8%) (Fx Adj) $262.7 (10%) $257.3 $35.4$34.4 (3%) Adj. EBITDA YTD’18 YTD’19 Adj. 12.4% 13.4% +100 bps EBITDA% Commentary •North America is up 30% sequentially and APPT sales up 15% overall sequentially •Automotive is up mid-single digits vs PY; Custom Molders up 25% sequentially •100 basis point margin expansion YTD 9 Q2’19 Earnings Presentation | 30 July 2019
|
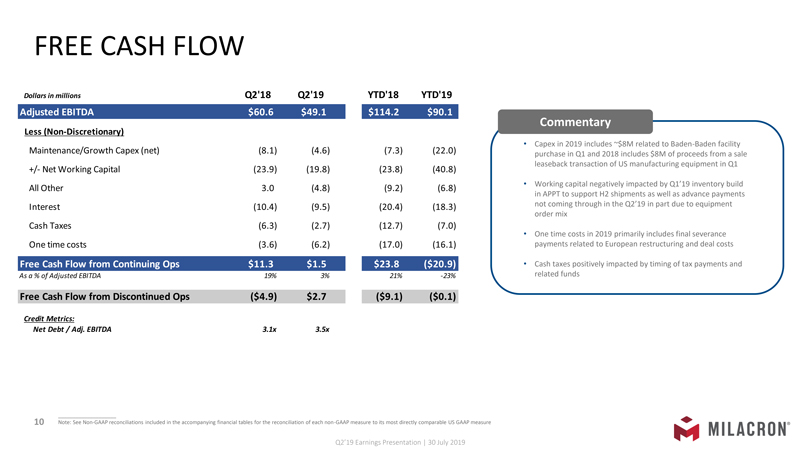
FREE CASH FLOW • Capex in 2019 includes ~$8M related to Baden-Baden facility purchase in Q1 and 2018 includes $8M of proceeds from a sale leaseback transaction of US manufacturing equipment in Q1 • Working capital negatively impacted by Q1’19 inventory build in APPT to support H2 shipments as well as advance payments not coming through in the Q2’19 in part due to equipment order mix • One time costs in 2019 primarily includes final severance payments related to European restructuring and deal costs • Cash taxes positively impacted by timing of tax payments and related funds Dollars in millions Q2’ 18Q2’ 19YTD’ 18YTD’ 19Adjusted EBITDA $60.6 $49.1 $114.2 $90.1 Less (Non-Discretionary) Maintenance/Growth Capex (net)(8.1) (4.6) (7.3) (22.0) +/- Net Working Capital(23.9) (19.8) (23.8) (40.8) All Other3.0 (4.8) (9.2) (6.8) Interest(10.4) (9.5) (20.4) (18.3) Cash Taxes(6.3) (2.7) (12.7) (7.0) One time costs(3.6) (6.2) (17.0) (16.1) Free Cash Flow from Continuing Ops$11.3$1.5$23.8($20.9) As a % of Adjusted EBITDA19%3%21%-23% Free Cash Flow from Discontinued Ops($4.9)$2.7($9.1)($0.1) Credit Metrics: Net Debt / Adj. EBITDA3.1x3.5xCommentary 10 Note: See Non-GAAP reconciliations included in the accompanying financial tables for the reconciliation of each non -GAAP measure to its most directly comparable US GAAP measure Q2’19 Earnings Presentation | 30 July 2019
|
Q2 2019 WRAP UP The year is progressing as expected; posting 9% sequential sales growth • Q2’19 and H1’19 results were as expected • Double digit sequential sales and orders growth in China • QTD margin of 18.1% • 100 bps improvement in APPT margin year over year • $52M of debt repayment from blow molding sale that closed July 1st • $57M of debt repayment in 2019 • On track to meet 2019 guidance range Q2’19 Earnings Presentation | 30 July 2019
|

APPENDIX
|
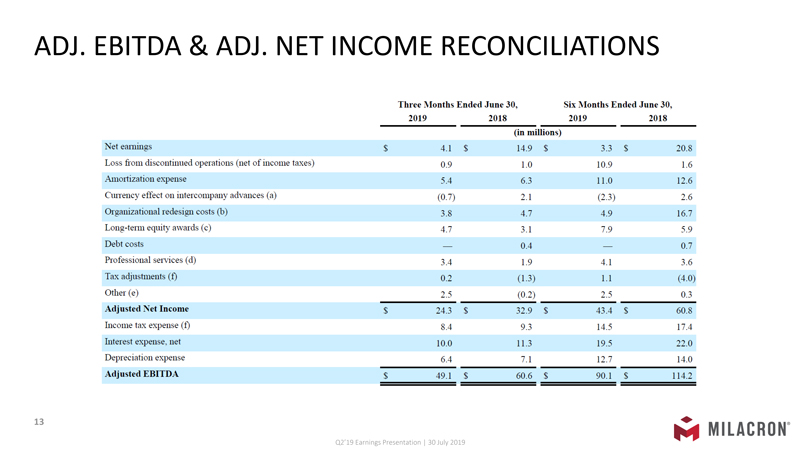
Q2’19 Earnings Presentation | 30 July 2019 ADJ. EBITDA & ADJ. NET INCOME RECONCILIATIONS Three Months Ended June 30, Six Months Ended June 30, 2019 2018 2019 2018 (in millions) Net eam ings $ 4 .1 $ 14 .9 $ 3 .3 $ 20.8 Loss from discontinued operations (net of income taxes) 0 .9 1. 0 10.9 1.6 Ammtization expense 5.4 6 .3 11.0 12.6 Cunency effect on intercompany advances (a) (0 .7) 2 . 1 (2 .3) 2 .6 Organizational redesign costs (b) 3.8 4 .7 4 .9 16.7 Long-te1m equity awards (c) 4.7 3. 1 7 .9 5.9 Debt costs 0 .4 0.7 Professional services (d) 3.4 1. 9 4 .1 3.6 Tax adjustments (f) 0.2 (1 .3) 1. 1 (4 .0) Other (e) 2.5 (0 .2) 2 .5 0 .3 Adjusted Net Income $ 24.3 $ 32.9 $ 43.4 $ 60.8 Income tax expense (f) 8.4 9 .3 14.5 17.4 Interest expense, net 10.0 11.3 19 .5 22 .0 Depreciation expense 6.4 7. 1 12 .7 14 .0 Adjusted EBITDA $ 49 .1 $ 60.6 $ 90 .1 $ 114 .2 Q2’19 Earnings Presentation | 30 July 2019
|
ADJ. EBITDA & ADJ. NET INCOME RECONCILIATIONS (a) Non-cash currency effect on intercompany advances primarily relates to advances denominated in foreign currencies. The most significant exposure relates to the Canadian dollar and the Czech koruna pursuant to intercompany advances within the MDCS and Corporate segments, respectively. (b) Organizational redesign costs in the three and six months ended June 30, 2019 primarily included $1.7 million and $2.1 million, respectively, for termination costs as a result of eliminated positions. Organizational redesign costs in the three and six months ended June 30, 2018 primarily included $4.1 million and $12.2 million, respectively, for termination costs as a result of eliminated positions. (c) Long-term equity awards include the charges associated with stock-based compensation awards granted to certain members of management and independent directors in the three and six months ended June 30, 2019 and 2018. (d) Professional fees in the three months ended June 30, 2019 and 2018 included $3.4 million and $1.9 million, respectively, of costs for strategic organizational initiatives. Professional fees in the six months ended June 30, 2019 and 2018 included $4.1 million and $3.6 million, respectively, of costs for strategic organizational initiatives. (e) Other costs in the three and six months ended June 30, 2019 included costs associated with the Company’s blow molding business which did not qualify for discontinued operations as well as costs associated with a discontinued product line. (f) Tax adjustments primarily include the tax expense (benefit) associated with reconciling net (loss) earnings to Adjusted Net Income and reflects the impact to the quarterly tax provision utilizing the annual effective tax recomputed with anticipated tax rate reductions that have not been recognized for U.S. GAAP purposes as the Company is awaiting regulatory approval. The reductions have historically been approved although there are no guarantees that the regulatory authorities will accept the Company’s applications.. Q2’19 Earnings Presentation | 30 July 2019
|
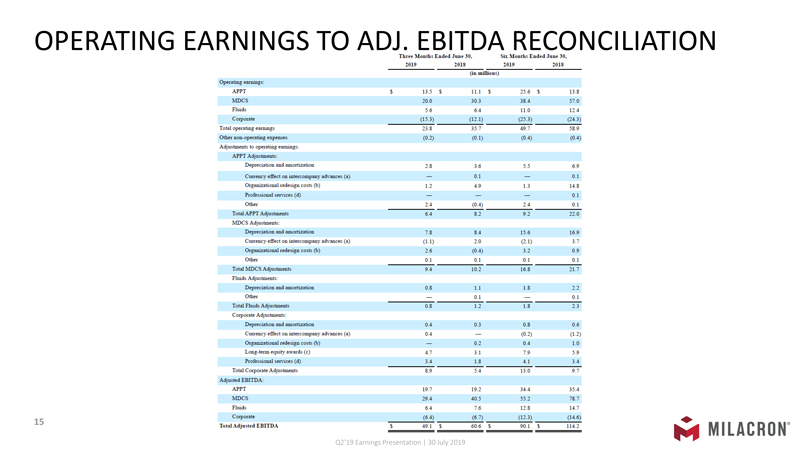
END OPERATING EARNINGS TO ADJ. EBITDA RECONCILIATION Q2’19 Earnings Presentation | 30 July 2019 T hr•• Month• End•d J un• 30, Su Mouths End•d J un• 30, 2019 1018 2019 2018 (in million•) Operating earnings: APPT s 13.5 s 11.1 s 25.6 s 13.8 MDCS 20.0 30.3 38.4 57.0 Fluids 5.6 6.4 11.0 12.4 Cruporate (15.3) (12.1) (25.3) (24.3) Total oporating earnings 23.8 35.7 49.7 58.9 Other non operating expenses (0.2) (0.1) (0.4) (0.4) Adjustments to oporating earnings: APPT Adjustments: Dep.~ciation and amo1tization 2.8 3.6 5.5 6.9 Currency effect on intercompany advances (a) 0.1 0.1 Organizational redesign cosrs (b) 1.2 4.9 1.3 14.8 Professional services (d) 0.1 Other 2.4 (0.4) 2.4 0. 1 Total APPT Adjustments 6.4 8.2 9.2 22.0 MDCS Adjusunents: Depreciation and amo1tization 7.8 8.4 15.6 16.9 Currency effect on intercompany advances (a) (1.1) 2.0 (2. 1) 3.7 Organizational redesign cosrs (b) 2.6 (0.4) 3.2 0.9 Other 0.1 0.1 0. 1 0.1 Total MDCS Adjustments 9.4 10.2 16.8 21.7 Fluids Adju.stm•nts: Depreciation and amortization 0.8 1.1 1.8 2.2 Other 0.1 0.1 Total Fluids Adjustments 0.8 1.2 1.8 2.3 Cruporate Adjustments: Depreciation and amortization 0.4 0.3 0.8 0.6 Currency effect on intercompany advances (a) 0.4 (0.2) (1.2) Organizational redesign costs (b) 0.2 0.4 1.0 Long-term equity awards (c) 4.7 3.1 7.9 5.9 Professional services (d) 3.4 1.8 4. 1 3.4 Total Corporate Adjustments 8.9 5.4 13.0 9.7 Adjusted EBITDA: APPT 19.7 19.2 34.4 35.4 MDCS 29.4 40.5 55.2 78.7 Fluids 6.4 7.6 12 .8 14.7 Cruporate (6.4) (6.7) (12.3) (14.6) Total Adjusttd EBITDA s 49.1 s 60.6 s 90. 1 s 114.2 Q2’19 Earnings Presentation | 30 July 2019
|
END OPERATING EARNINGS TO ADJ. EBITDA RECONCILIATION (a) Non-cash currency effect on intercompany advances primarily relates to advances denominated in foreign currencies. The most significant exposure relates to the Canadian dollar and the Czech koruna pursuant to intercompany advances within the MDCS and Corporate segments, respectively. (b) Organizational redesign costs in the three and six months ended June 30, 2019 included $1.2 million and $1.3 million, respectively, for termination costs as a result of eliminated positions in APPT. Organizational redesign costs in the three and six months ended June 30, 2018 included $3.5 million and $11.4 million, respectively, for termination costs as a result of eliminated positions in APPT. (c) Long-term equity awards in Corporate include the charges associated with stock-based compensation awards granted to certain members of management and independent directors during the six months ended June 30, 2019 and 2018. (d) Professional fees incurred by Corporate in the three months ended June 30, 2019 and 2018 included $3.4 million and $1.8 million, respectively, of costs for strategic organizational initiatives. Professional fees incurred by Corporate in the six months ended June 30, 2019 and 2018 included $4.1 million and $3.4 million, respectively, of costs for strategic organizational initiatives. Q2’19 Earnings Presentation | 30 July 2019
|
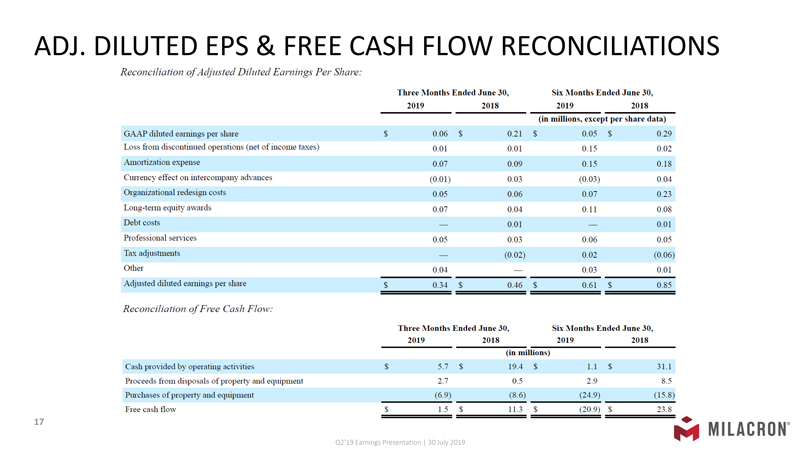
ADJ. DILUTED EPS & FREE CASH FLOW RECONCILIATIONS Reconciliation ofAdjusted Diluted Earnings Per Share: Three Months Ended June 30, Six Months Ended June 30, 2019 2018 2019 2018 (in millions, except per share data) GAAP diluted eamings per share $ 0.06 $ 0.21 $ 0.05 $ 0.29 Loss from discontinued operations (net of income taxes) 0 .01 0 .01 0 .15 0.02 Amo11ization expense 0 .07 0 .09 0.15 0 .1 8 Cunency effect on intercompany advances (0 .01) 0 .03 (0 .03) 0 .04 Organizational redesign costs 0 .05 0 .06 0 .07 0.23 Long-tem1 equity awards 0 .07 0 .04 0 .11 0 .08 Debt costs 0 .01 0.01 Professional services 0 .05 0 .03 0 .06 0 .05 Tax adjustments (0 .02) 0 .02 (0 .06) Other 0 .04 0 .03 0 .01 Adjusted diluted eatuings per share $ 0 .34 $ 0 .46 $ 0 .61 $ 0. 85 Reconciliation ofFree Cash Flow: Three Months Ended June 30, Six Months Ended June 30, 2019 2018 2019 2018 (in millions) Cash provided by operating activities $ 5.7 $ 19.4 $ 1.1 $ 31.1 Proceeds from disposals of propetty and equipment 2.7 0.5 2.9 8.5 Pmchases of prope1ty and equipment (6.9) (8. 6) (24.9) (15 .8) Free cash flow $ 1.5 $ 11.3 $ (20.9) $ 23 .8 Q2’19 Earnings Presentation | 30 July 2019
|
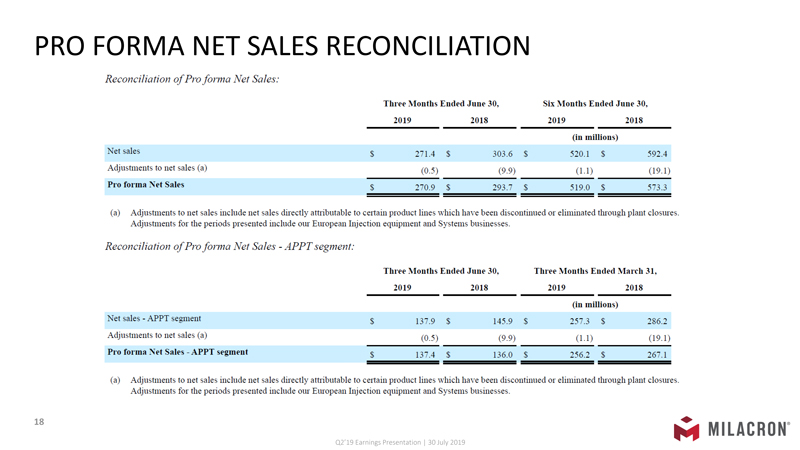
PRO FORMA NET SALES RECONCILIATION Reconciliation ofPro forma Net Sales: Three Months Ended June 30, Six Months Ended June 30, 2019 2018 2019 2018 (in millions) Net sales $ 271.4 $ 303. 6 $ 520.1 $ 592.4 Adjustments to net sales (a) (0 .5) (9.9) (1.1) (19 . 1) ------- Pro forma ::\et Sales $ 270 .9 $ 293.7 $ 51 9.0 $ 573.3 ===== (a) Adjustments to net sales include net sales directly attributable to certain product lines which have been discontinued or eliminated through plant closures. Adjustments for the periods presented include our European Injection equipment and Systems businesses. Reconciliation ofPro forma Net Sales - APPT segment: Three Months Ended June 30, Three Months Ended March 31, 2019 2018 2019 2018 (in millions) et sales - APPT segment $ 137.9 $ 145 .9 $ 257. 3 $ 286. 2 Adjustments to net sales (a) (0 .5) (9.9) (1.1) (19.1) ------- Pro forma ::\et Sales - APPT segment $ 137 .4 $ 136.0 $ 256 .2 $ 267.1 ===== (a) Adjustments to net sales include net sales directly attributable to certain product lines which have been discontinued or eliminated through plant closures. Adjustments for the periods presented include our European Injection equipment and Systems businesses. Q2’19 Earnings Presentation | 30 July 2019
|
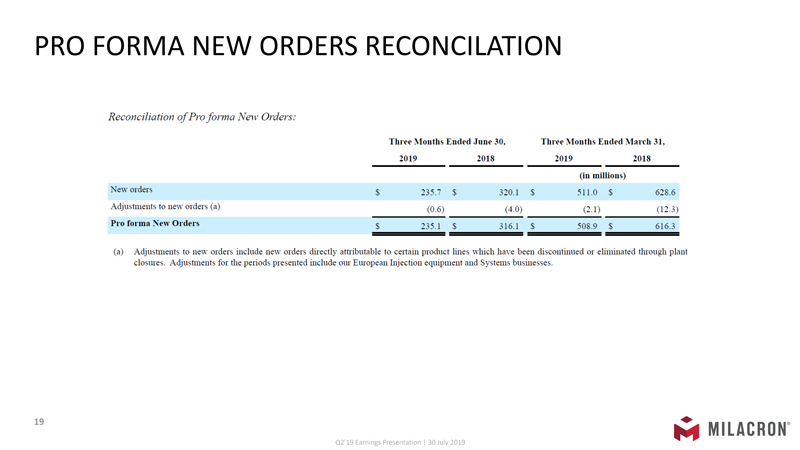
PRO FORMA NEW ORDERS RECONCILIATION Reconciliation of Pro forma New Orders: Three Months Ended June 30, Three Months Ended : March 31, 2019 2018 2019 2018 (in millions) New orders $ 235.7 $ 320.1 $ 511.0 $ 628.6 Adjustments to new orders (a) (0.6) (4.0) (2.1) (12.3) Pro forma : Orders $ 235 .1 $ 316. 1 $ 508 .9 $ 616.3 (a) Adjustments to new orders include new orders directly attributable to certain product lines which have been discontinued or eliminated through plant closures. Adjustments for the periods presented include our European Injection equipment and Systems businesses . Q2’19 Earnings Presentation | 30 July 2019