Legal Disclaimer Forward-Looking Statements Statements contained in this presentation, including the question and answer portion of the presentation, other than statements of historical fact, are forward-looking statements. In some cases, you can identify forward-looking statements by terms such as “may,” “will,” “should,” “could,” “would,” “expects,” “plans,” “anticipates,” “believes,” “estimates,” “projects,” “predicts,” “potential,” or the negative of those terms, and similar expressions and comparable terminology intended to identify forward-looking statements. These forward-looking statements include, without limitation, statements regarding the anticipated timing and strength of the opportunities in our pipeline of potential acquisitions, the anticipated timing and terms of the offering proceeds, as well as the future financial position of Surgery Partners, Inc. and its subsidiaries (the “Company”), including financial targets, business strategy, plans and objectives for future operations and future operating results and cash flows. These statements are subject to risks and uncertainties, including, without limitation: that we may not be able to consummate the notes offering on the terms or timeline set forth in this presentation, if at all, the impact of future legislation and other healthcare regulatory reform actions, and the effect of that legislation and other regulatory actions on our business, our ability to comply with current healthcare laws and regulations, reductions in payments from government healthcare programs and managed care organizations, our ability to contract with private third-party payors, changes in our payor mix or surgical case mix, failure to maintain or develop relationships with our physicians on beneficial terms, or at all, the impact of payor controls designed to reduce the number of surgical procedures, our efforts to integrate operations of acquired businesses and surgical facilities, attract new physician partners, or acquire additional surgical facilities, shortages or quality control issues with surgery-related products, equipment and medical supplies, competition for physicians, nurses, strategic relationships, acquisitions and managed care contracts, our ability to attract and retain qualified healthcare professionals, our ability to enforce non-compete restrictions against our physicians, our ability to manage material liabilities whether known or unknown incurred as a result of acquiring surgical facilities, economic and competitive conditions, the outcome of legal and regulatory proceedings that have been or may be brought against us, changes in the regulatory, economic and other conditions of the states where our surgical facilities are located, substantial payments we are required to make under the tax receivable agreement, our substantial indebtedness, and to realize the anticipated benefits, as well as other factors set forth under “Risk Factors” in the Company’s Annual Report on Form 10-K for fiscal year 2018 (“10-K”) filed with the Securities and Exchange Commission (the “SEC”) and other information we file with the SEC, including “Management’s Discussion and Analysis of Financial Condition and Results of Operations” in the Company’s 10-K. You should read the Company’s annual report and any and all other filings with the SEC, available at www.sec.gov, for a discussion of these and other risks and uncertainties. The forward-looking statements contained in this presentation speak only as of the date of the presentation, and the Company undertakes no obligation to update or revise any forward-looking statements for any reason, except as required by law. The business of the Company is subject to substantial risks and uncertainties, including those referenced above. Investors, potential investors, and others should give careful consideration to these risks and uncertainties and should not place considerable reliance on the forward-looking statements contained in this presentation. Data and Information Contained in this Presentation This presentation also contains market research, estimates and forecasts, which are inherently subject to uncertainties and actual events or circumstances may differ materially from events and circumstances reflected in this information. Certain data in this presentation was obtained from various external sources, and neither the Company nor its affiliates, advisers or representatives has verified such data with independent sources. Accordingly, neither the Company nor any of its affiliates, advisers or representatives makes any representations as to the accuracy or completeness of that data or to update such data after the date of this presentation. Such data involves risks and uncertainties and is subject to change based on various factors. The trademarks included herein are the property of the owners thereof and are used for reference purposes only. Such use should not be construed as an endorsement of the products or services of such owners. Non-GAAP Financial Measures This presentation contains certain non-GAAP financial measures, including EBITDA, Adjusted EBITDA and Credit Agreement EBITDA. A “non-GAAP financial measure” is defined as a numerical measure of a company’s financial performance that excludes or includes amounts so as to be different than the most directly comparable measure calculated and presented in accordance with GAAP in the statements of income, balance sheets or statements of cash flow of the company. We present non-GAAP financial measures when we believe that the additional information is useful and meaningful to investors. Non-GAAP financial measures do not have any standardized meaning and are therefore unlikely to be comparable to similar measures presented by other companies. The presentation of non-GAAP financial measures is not intended to be a substitute for, and should not be considered in isolation from, the financial measures reported in accordance with GAAP. For additional information about our non-GAAP financial measures, and a reconciliation of certain non-GAAP financial measures to the most nearly comparable GAAP measures, see slides 23 and 24 of this presentation and the Company’s 10-K. Important Notice Regarding Information Contained in this Presentation This investor presentation (this “Presentation”) is intended to facilitate discussions with representatives of certain institutions regarding a notes offering for Surgery Partners, Inc. and its subsidiaries. You should not rely on the information contained in this Presentation and this Presentation does not purport to be all-inclusive or to contain all of the information that a prospective participant may consider material or desirable in making its decision to become an investor in the notes. In all cases, prospective participants should conduct their own investigation and analysis of the Company, their assets, financial condition and prospects, and of the data set forth in this Presentation. 2
Transaction Section 1 Overview
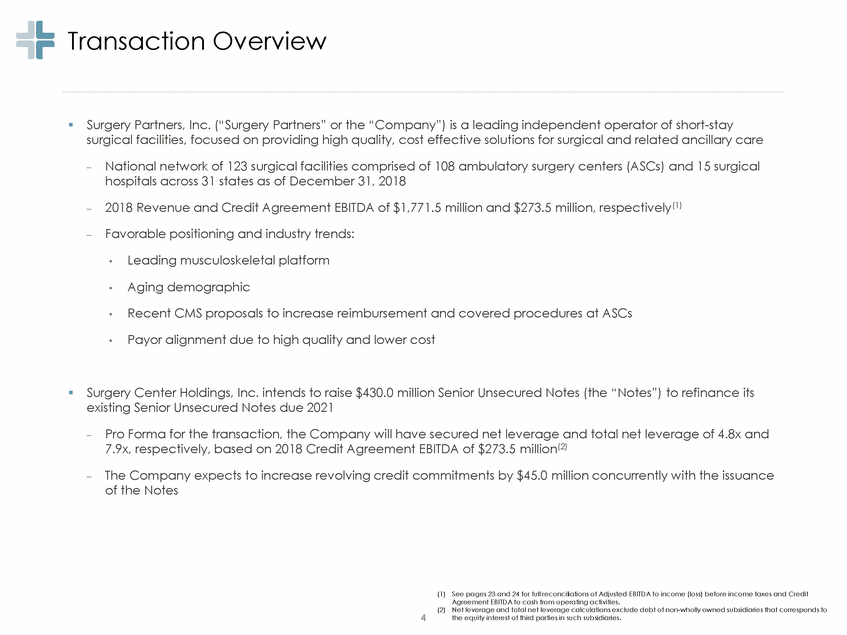
Transaction Overview Surgery Partners, Inc. (“Surgery Partners” or the “Company”) is a leading independent operator of short-stay surgical facilities, focused on providing high quality, cost effective solutions for surgical and related ancillary care National network of 123 surgical facilities comprised of 108 ambulatory surgery centers (ASCs) and 15 surgical hospitals across 31 states as of December 31, 2018 – 2018 Revenue and Credit Agreement EBITDA of $1,771.5 million and $273.5 million, respectively(1) – Favorable positioning and industry trends: – Leading musculoskeletal platform • Aging demographic • Recent CMS proposals to increase reimbursement and covered procedures at ASCs • Payor alignment due to high quality and lower cost • Surgery Center Holdings, Inc. intends to raise $430.0 million Senior Unsecured Notes (the “Notes”) to refinance its existing Senior Unsecured Notes due 2021 Pro Forma for the transaction, the Company will have secured net leverage and total net leverage of 4.8x and 7.9x, respectively, based on 2018 Credit Agreement EBITDA of $273.5 million(2) – The Company expects to increase revolving credit commitments by $45.0 million concurrently with the issuance of the Notes – (1) See pages 23 and 24 for full reconciliations of Adjusted EBITDA to income (loss) before income taxes and Credit Agreement EBITDA to cash from operating activities. Net leverage and total net leverage calculations exclude debt of non-wholly owned subsidiaries that corresponds to the equity interest of third parties in such subsidiaries. (2) 4
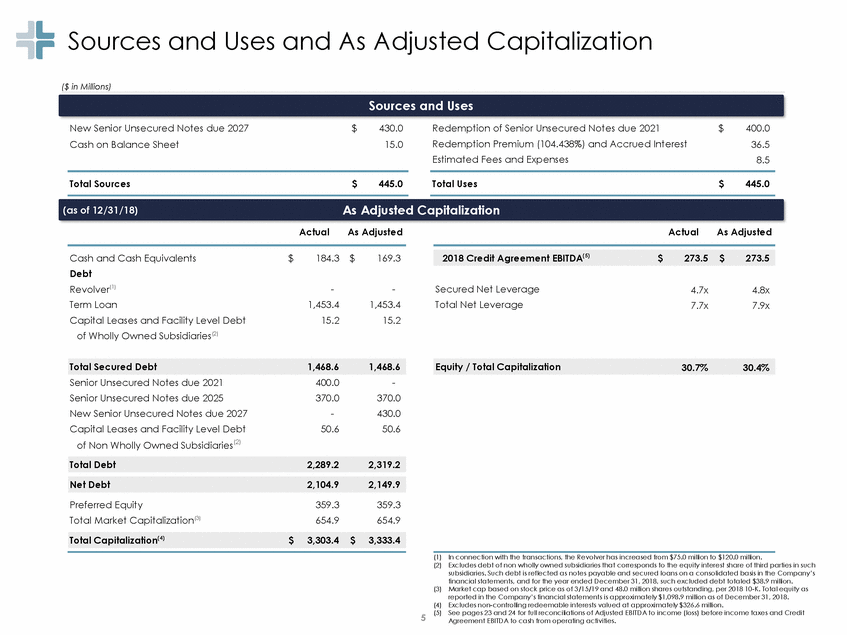
Sources and Uses and As Adjusted Capitalization ($ in Millions) New Senior Unsecured Notes due 2027 Cash on Balance Sheet $ 430.0 15.0 Redemption of Senior Unsecured Notes due 2021 Redemption Premium (104.438%) and Accrued Interest Estimated Fees and Expenses $ 400.0 36.5 8.5 Total Sources $ 445.0 Total Uses $ 445.0 Actual As Adjusted Actual As Adjusted Cash and Cash Equivalents Debt Revolver(1) Term Loan Capital Leases and Facility Level Debt of Wholly Owned Subsidiaries(2) $ 184.3 $ 169.3 - 1,453.4 15.2 - 1,453.4 15.2 Secured Net Leverage Total Net Leverage 4.7x 7.7x 4.8x 7.9x Senior Unsecured Notes due 2021 Senior Unsecured Notes due 2025 New Senior Unsecured Notes due 2027 Capital Leases and Facility Level Debt of Non Wholly Owned Subsidiaries(2) 400.0 370.0 - 50.6 - 370.0 430.0 50.6 Preferred Equity Total Market Capitalization(3) 359.3 654.9 359.3 654.9 (1) (2) In connection with the transactions, the Revolver has increased from $75.0 million to $120.0 million. Excludes debt of non wholly owned subsidiaries that corresponds to the equity interest share of third parties in such subsidiaries. Such debt is reflected as notes payable and secured loans on a consolidated basis in the Company’s financial statements, and for the year ended December 31, 2018, such excluded debt totaled $38.9 million. Market cap based on stock price as of 3/15/19 and 48.0 million shares outstanding, per 2018 10-K. Total equity as reported in the Company’s financial statements is approximately $1,098.9 million as of December 31, 2018. Excludes non-controlling redeemable interests valued at approximately $326.6 million. See pages 23 and 24 for full reconciliations of Adjusted EBITDA to income (loss) before income taxes and Credit Agreement EBITDA to cash from operating activities. (3) (4) (5) 5 Total Capitalization(4)$3,303.4$3,333.4 Net Debt2,104.92,149.9 Total Debt2,289.22,319.2 Equity / Total Capitalization30.7%30.4% Total Secured Debt1,468.61,468.6 2018 Credit Agreement EBITDA(5)$273.5$273.5 (as of 12/31/18)As Adjusted Capitalization Sources and Uses
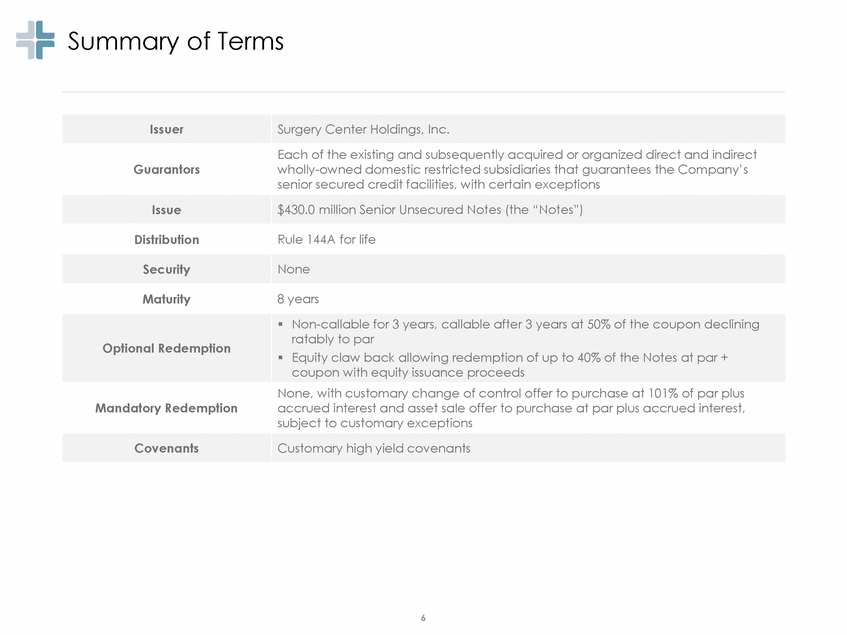
Summary of Terms 6 Issuer Surgery Center Holdings, Inc. Guarantors Each of the existing and subsequently acquired or organized direct and indirect wholly-owned domestic restricted subsidiaries that guarantees the Company’s senior secured credit facilities, with certain exceptions Issue $430.0 million Senior Unsecured Notes (the “Notes”) Distribution Rule 144A for life Security None Maturity 8 years Optional Redemption Non-callable for 3 years, callable after 3 years at 50% of the coupon declining ratably to par Equity claw back allowing redemption of up to 40% of the Notes at par + coupon with equity issuance proceeds Mandatory Redemption None, with customary change of control offer to purchase at 101% of par plus accrued interest and asset sale offer to purchase at par plus accrued interest, subject to customary exceptions Covenants Customary high yield covenants
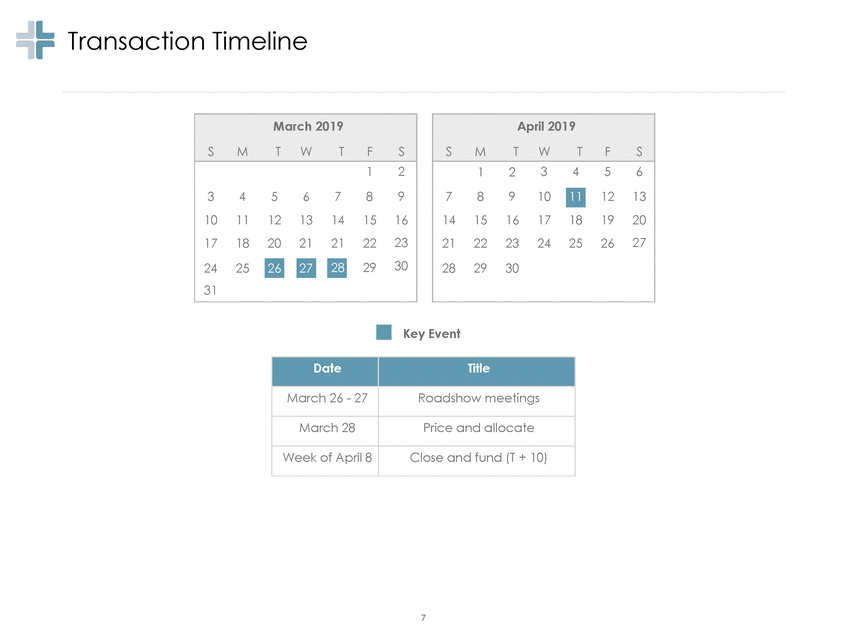
Transaction Timeline Key Event 7 Date Title March 26 - 27 Roadshow meetings March 28 Price and allocate Week of April 8 Close and fund (T + 10) March 2019 SMTWTFS 12 3456789 10111213141516 17182021212223 24252930 31 26 28 27 April 2019 SMTWTFS 123456 789101213 14151617181920 21222324252627 282930 11
Company Section 2 Update
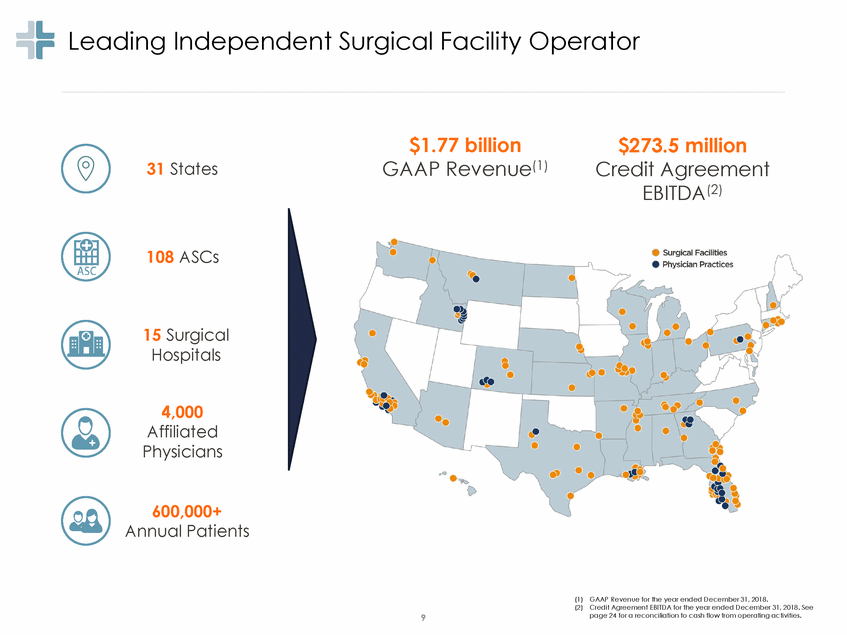
Leading Independent Surgical Facility Operator $1.77 billion $273.5 million Credit Agreement EBITDA(2) GAAP Revenue(1) 31 States 108 ASCs 15 Surgical Hospitals 4,000 Affiliated Physicians 600,000+ Annual Patients (1) GAAP Revenue for the year ended December 31, 2018. (2) Credit Agreement EBITDA for the year ended December 31, 2018. See page 24 for a reconciliation to cash flow from operating activities. 9
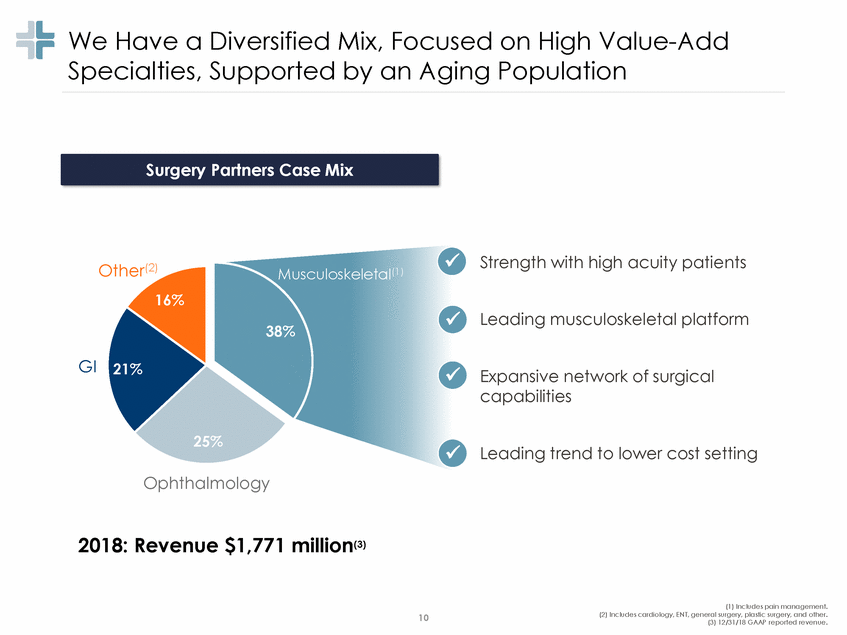
We Have a Specialties, Diversified Mix, Focused on High Value-Add Population Supported by an Aging Strength with high acuity patients Other(2) 16% Musculoskeletal(1) Leading musculoskeletal platform 38% GI Expansive network of surgical capabilities 25% Leading trend to lower cost setting Ophthalmology 2018: Revenue $1,771 million(3) (1) Includes pain management. (2) Includes cardiology, ENT, general surgery, plastic surgery, and other. (3) 12/31/18 GAAP reported revenue. 10 Surgery Partners Case Mix
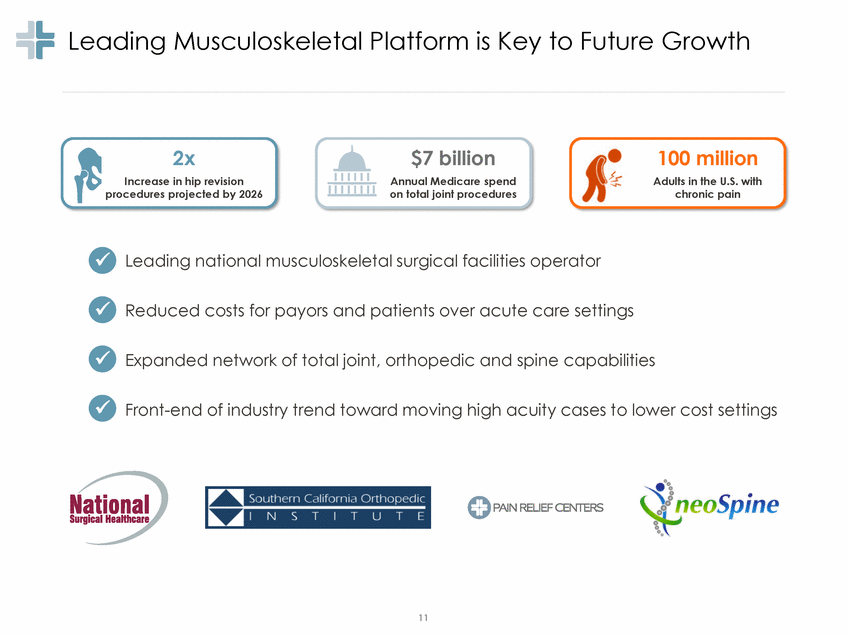
Leading Musculoskeletal Platform is Key to Future Growth 2x Increase in hip revision procedures projected by 2026 $7 billion Annual Medicare spend on total joint procedures 100 million Adults in the U.S. with chronic pain Leading national musculoskeletal surgical facilities operator Reduced costs for payors and patients over acute care settings Expanded network of total joint, orthopedic and spine capabilities Front-end of industry trend toward moving high acuity cases to lower cost settings 11
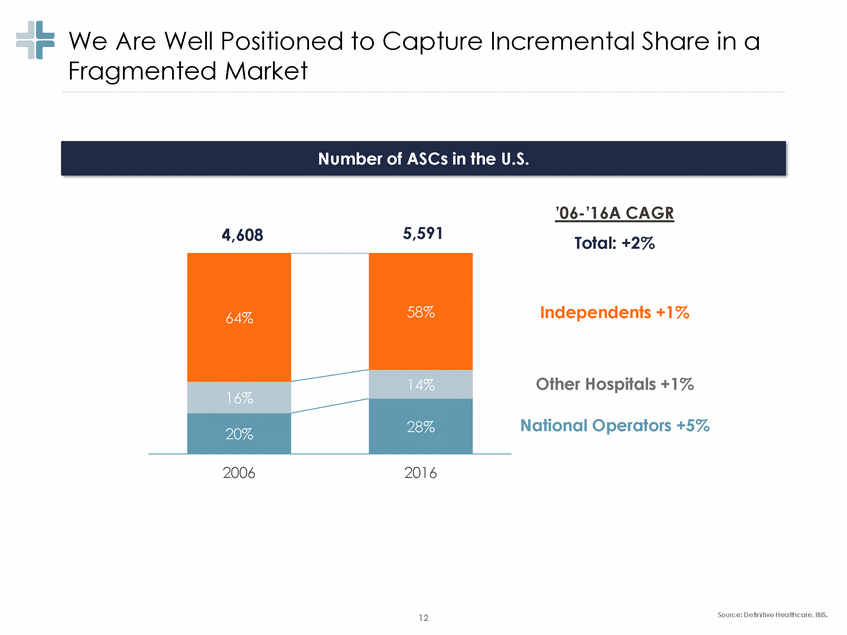
We Are Well Positioned to Capture Incremental Share in a Fragmented Market ’0 6 -’1 6A CAGR 5,591 4,608 Total: +2% Independents +1% Other Hospitals +1% National Operators +5% 2006 2016 Source: Definitive Healthcare, IBIS. 12 64% 58% 14% 16% 28% 20% Number of ASCs in the U.S.
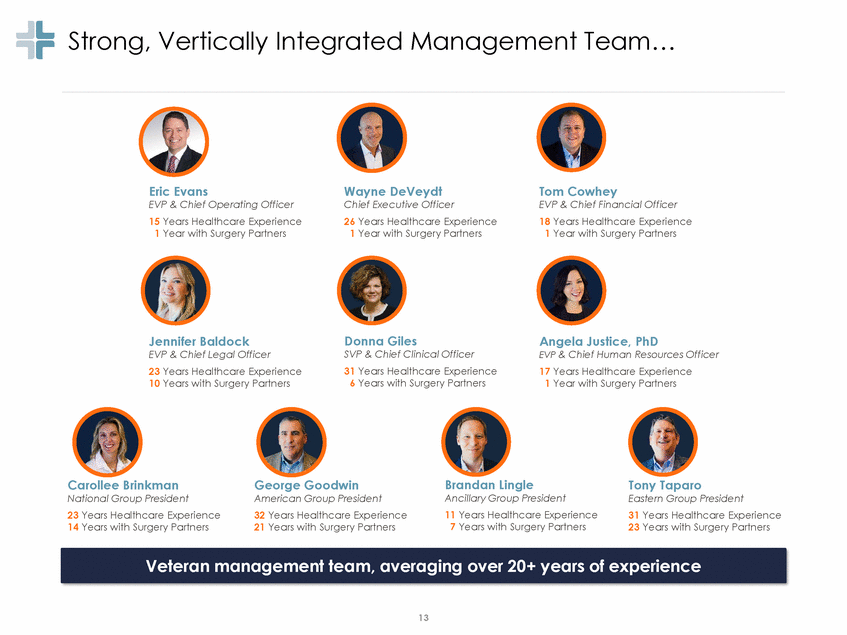
Strong, Vertically Integrated Management Team… Eric Evans EVP & Chief Operating Officer 15 Years Healthcare Experience 1 Year with Surgery Partners Wayne DeVeydt Chief Executive Officer 26 Years Healthcare Experience 1 Year with Surgery Partners Tom Cowhey EVP & Chief Financial Officer 18 Years Healthcare Experience 1 Year with Surgery Partners Donna Giles SVP & Chief Clinical Officer 31 Years Healthcare Experience 6 Years with Surgery Partners Jennifer Baldock EVP & Chief Legal Officer 23 Years Healthcare Experience 10 Years with Surgery Partners Angela Justice, PhD EVP & Chief Human Resources Officer 17 Years Healthcare Experience 1 Year with Surgery Partners Brandan Lingle Ancillary Group President 11 Years Healthcare Experience 7 Years with Surgery Partners Carollee Brinkman National Group President 23 Years Healthcare Experience 14 Years with Surgery Partners George Goodwin American Group President 32 Years Healthcare Experience 21 Years with Surgery Partners Tony Taparo Eastern Group President 31 Years Healthcare Experience 23 Years with Surgery Partners 13 Veteran management team, averaging over 20+ years of experience
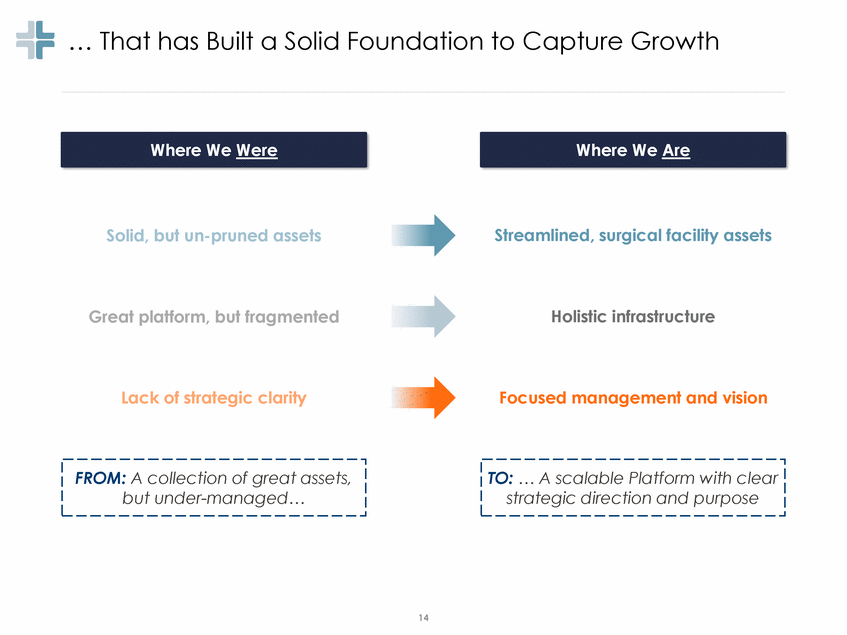
… That has Built a Solid Foundation to Capture Growth Solid, but un-pruned assets Streamlined, surgical facility assets Holistic infrastructure Great platform, but fragmented Lack of strategic clarity Focused management and vision 14 TO: … A scalable Platform with clear strategic direction and purpose FROM: A collection of great assets, but under-managed… Where We Are Where We Were
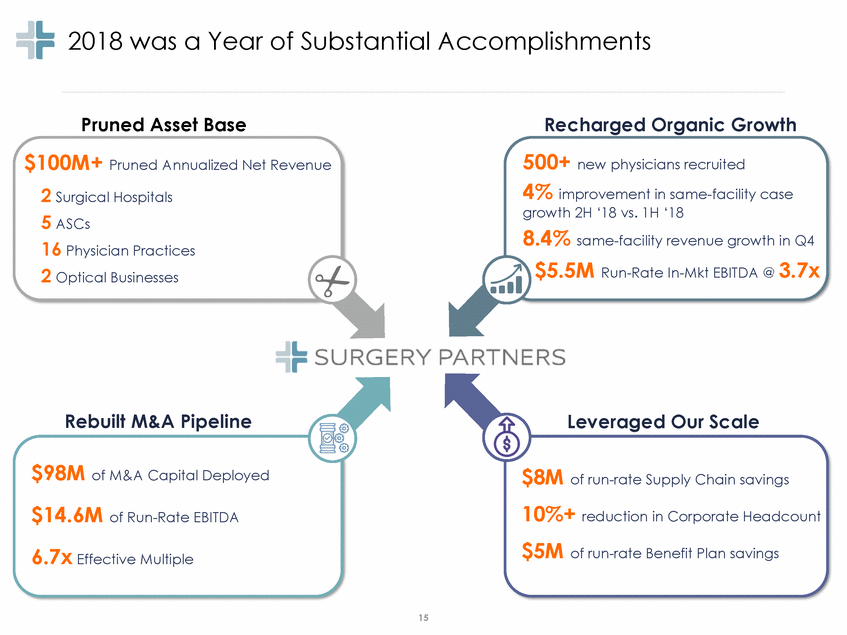
2018 was a Year of Substantial Accomplishments Pruned Asset Base $100M+ Pruned Annualized Net Revenue 2 Surgical Hospitals 5 ASCs 16 Physician Practices 2 Optical Businesses Recharged Organic Growth 500+ new physicians recruited 4% improvement in same-facility case growth 2H ‘18 vs. 1H ‘18 8.4% same-facility revenue growth in Q4 $5.5M Run-Rate In-Mkt EBITDA @ 3.7x Rebuilt M&A Pipeline Leveraged Our Scale $98M of M&A Capital Deployed $14.6M of Run-Rate EBITDA 6.7x Effective Multiple $8M of run-rate Supply Chain savings 10%+ reduction in Corporate Headcount $5M of run-rate Benefit Plan savings 15
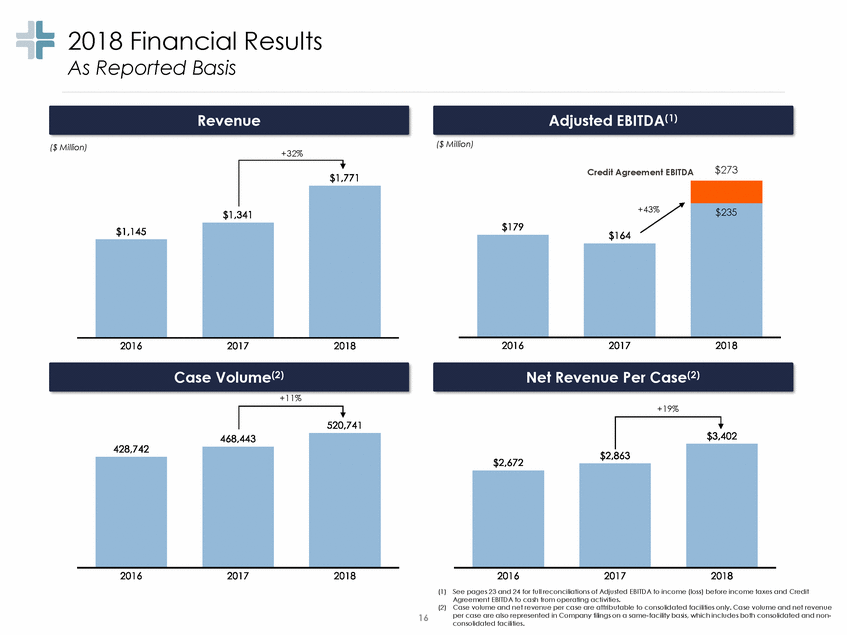
2018 Financial Results As Reported Basis ($ Million) ($ Million) +32% $273 Credit Agreement EBITDA +11% +19% (1) See pages 23 and 24 for full reconciliations of Adjusted EBITDA to income (loss) before income taxes and Credit Agreement EBITDA to cash from operating activities. Case volume and net revenue per case are attributable to consolidated facilities only. Case volume and net revenue per case are also represented in Company filings on a same-facility basis, which includes both consolidated and non-consolidated facilities. (2) 16 Net Revenue Per Case(2) Case Volume(2) +43% $235 Adjusted EBITDA(1) Revenue
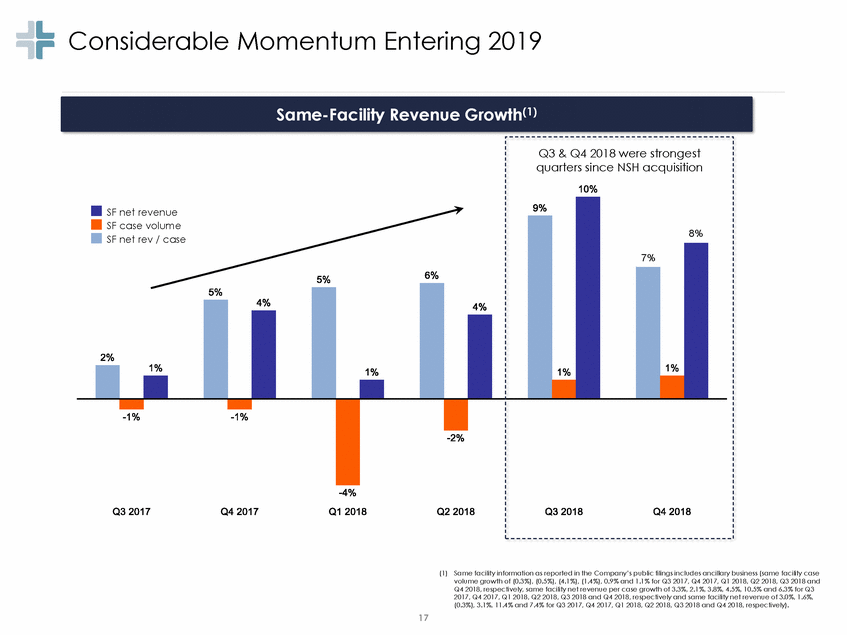
Considerable Momentum Entering 2019 (1) Same facility information as reported in the Company’s public filings includes ancillary business (same facility case volume growth of (0.3%), (0.5%), (4.1%), (1.4%), 0.9% and 1.1% for Q3 2017, Q4 2017, Q1 2018, Q2 2018, Q3 2018 and Q4 2018, respectively, same facility net revenue per case growth of 3.3%, 2.1%, 3.8%, 4.5%, 10.5% and 6.3% for Q3 2017, Q4 2017, Q1 2018, Q2 2018, Q3 2018 and Q4 2018, respectively and same facility net revenue of 3.0%, 1.6%, (0.3%), 3.1%, 11.4% and 7.4% for Q3 2017, Q4 2017, Q1 2018, Q2 2018, Q3 2018 and Q4 2018, respectively). 17 SF net revenue SF case volume SF net rev / case Q3 & Q4 2018 were strongest quarters since NSH acquisition 8% 7% Same-Facility Revenue Growth(1)
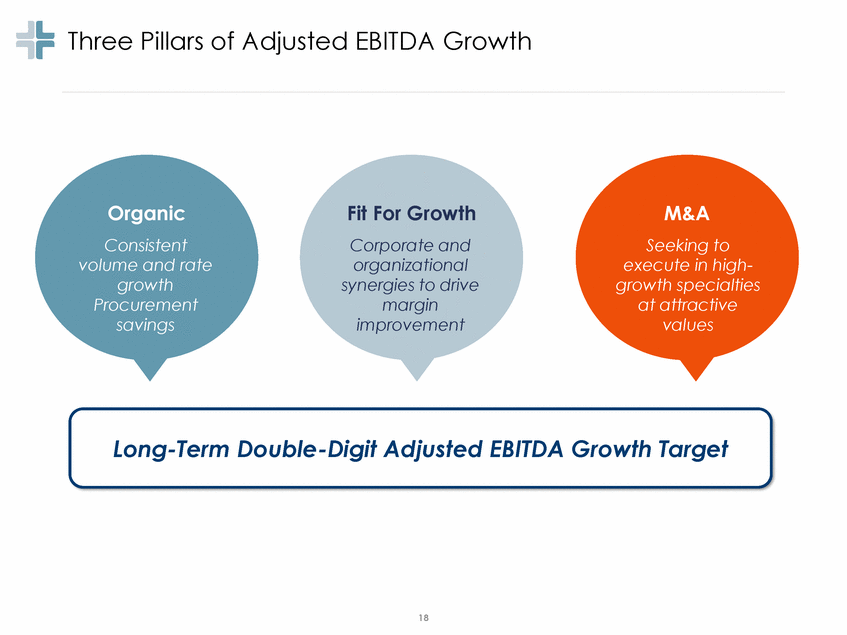
Three Pillars of Adjusted EBITDA Growth Organic Consistent volume and rate growth Procurement savings Fit For Growth Corporate and organizational synergies to drive margin improvement M&A Seeking to execute in high-growth specialties at attractive values Long-Term Double-Digit Adjusted EBITDA Growth Target 18
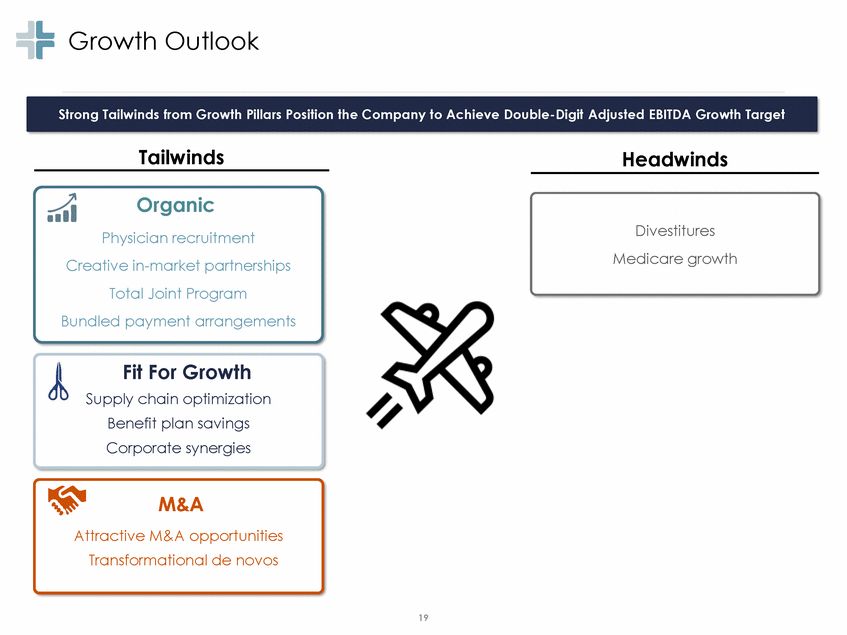
Growth Outlook Tailwinds Headwinds Organic ,, , Divestitures Medicare growth Physician recruitment Creative in-market partnerships Total Joint Program Bundled payment arrangements Fit For Growth Supply chain optimization Benefit plan savings Corporate synergies M&A Attractive M&A opportunities Transformational de novos 19 Strong Tailwinds from Growth Pillars Position the Company to Achieve Double-Digit Adjusted EBITDA Growth Target
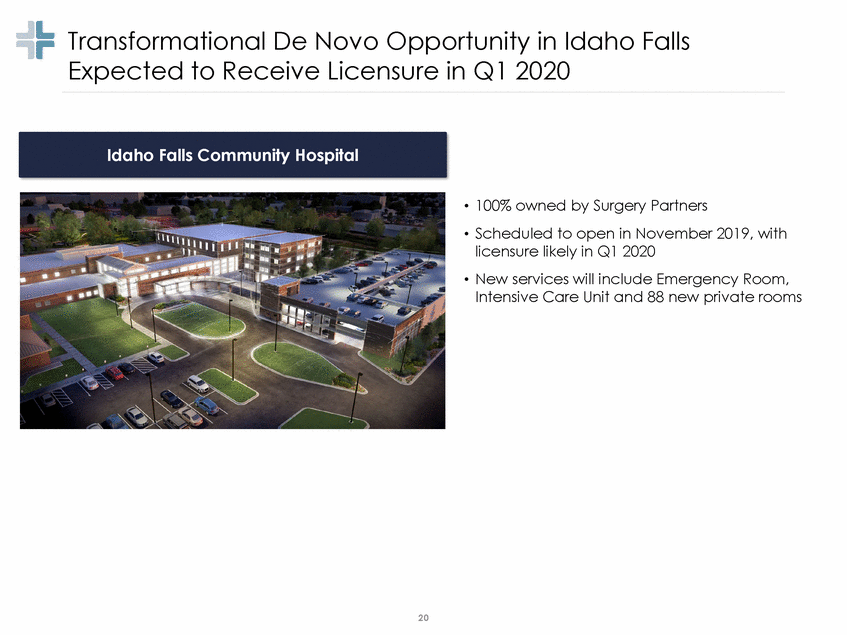
Transformational De Novo Opportunity in Idaho Falls Expected to Receive Licensure in Q1 2020 • • 100% owned by Surgery Partners Scheduled to open in November 2019, licensure likely in Q1 2020 with • New services will include Emergency Room, Intensive Care Unit and 88 new private rooms 20 Idaho Falls Community Hospital
Key Credit Highlights Large and Growing Industry with Favorable Outpatient Dynamics Physician Centric Value Proposition Designed to Drive High Care in a Low Cost Setting Quality Patient Diversified Mix of Payors and Procedures Multiple Growth Opportunities with Successful Track Record Attractive Financial Profile with Strong Free Cash Flow Characteristics Experienced Management Team 21
Appendix
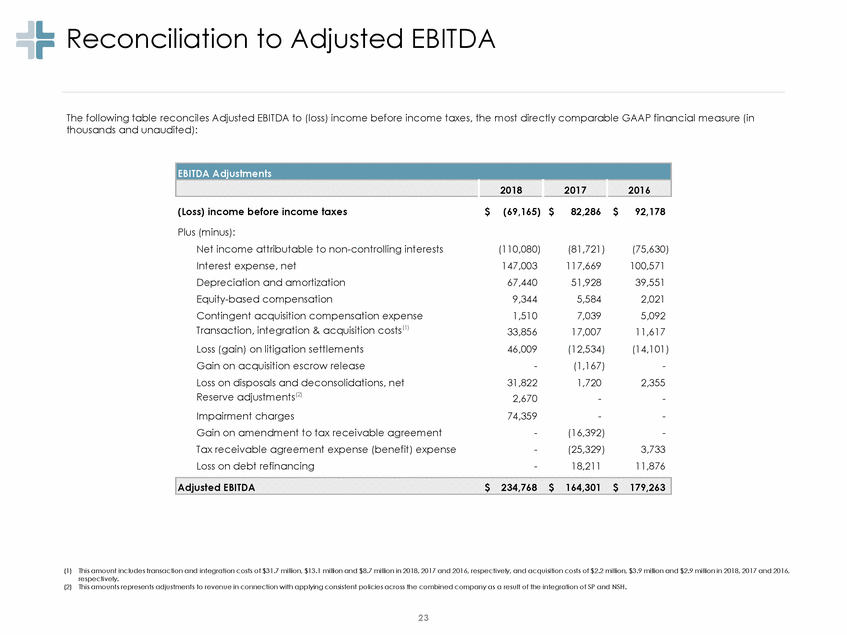
Reconciliation to Adjusted EBITDA The following table reconciles Adjusted EBITDA to (loss) income before income taxes, the most directly comparable GAAP financial measure (in thousands and unaudited): (Loss) income before income taxes $ (69,165) $ 82,286 $ 92,178 Plus (minus): Net income attributable to non-controlling interests Interest expense, net Depreciation and amortization Equity-based compensation Contingent acquisition compensation expense Transaction, integration & acquisition costs(1) Loss (gain) on litigation settlements Gain on acquisition escrow release Loss on disposals and deconsolidations, net Reserve adjustments(2) Impairment charges Gain on amendment to tax receivable agreement Tax receivable agreement expense (benefit) expense Loss on debt refinancing (110,080) 147,003 67,440 9,344 1,510 33,856 46,009 - 31,822 2,670 74,359 - - - (81,721) 117,669 51,928 5,584 7,039 17,007 (12,534) (1,167) 1,720 - - (16,392) (25,329) 18,211 (75,630) 100,571 39,551 2,021 5,092 11,617 (14,101) - 2,355 - - - 3,733 11,876 (1) This amount includes transaction and integration costs of $31.7 million, $13.1 million and $8.7 million in 2018, 2017 and 2016, respectively, and acquisition costs of $2.2 million, $3.9 million and $2.9 million in 2018, 2017 and 2016, respectively. (2) This amounts represents adjustments to revenue in connection with applying consistent policies across the combined company as a result of the integration of SP and NSH. 23 Adjusted EBITDA$234,768$164,301$179,263 EBITDA Adjustments 2018 2017 2016
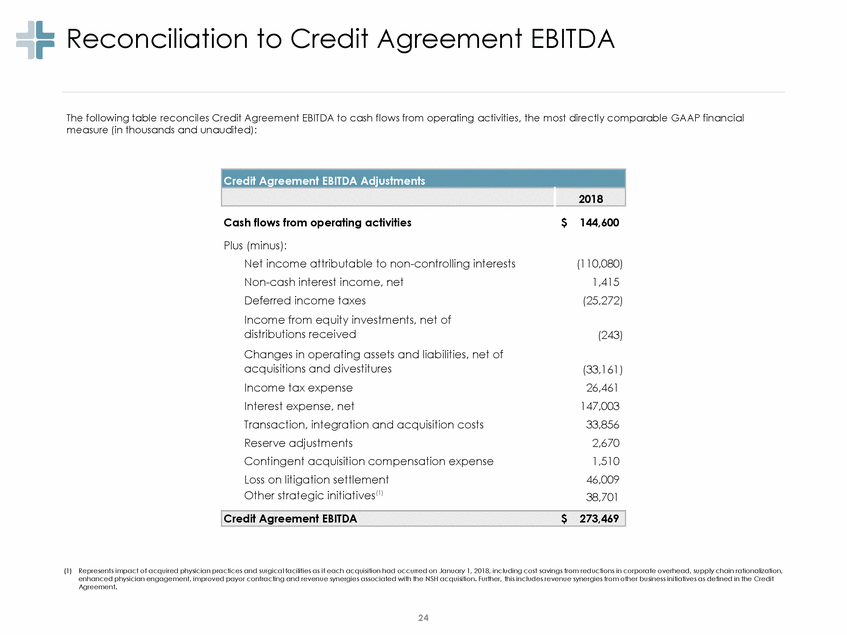
Reconciliation to Credit Agreement EBITDA The following table reconciles Credit Agreement EBITDA to cash flows from operating activities, the most directly comparable GAAP financial measure (in thousands and unaudited): Cash flows from operating activities $ 144,600 Plus (minus): Net income attributable to non-controlling interests Non-cash interest income, net Deferred income taxes Income from equity investments, net of distributions received Changes in operating assets and liabilities, net of acquisitions and divestitures Income tax expense Interest expense, net Transaction, integration and acquisition costs Reserve adjustments Contingent acquisition compensation expense Loss on litigation settlement Other strategic initiatives(1) (110,080) 1,415 (25,272) (243) (33,161) 26,461 147,003 33,856 2,670 1,510 46,009 38,701 (1) Represents impact of acquired physician practices and surgical facilities as if each acquisition had occurred on January 1, 2018, including cost savings from reductions in corporate overhead, supply chain rationalization, enhanced physician engagement, improved payor contracting and revenue synergies associated with the NSH acquisition. Further, this includes revenue synergies from other business initiatives as defined in the Credit Agreement. 24 Credit Agreement EBITDA $ 273,469 Credit Agreement EBITDA Adjustments 2018