Investor Presentation March 2016 Exhibit 99.2
Presenters Chief Executive Officer and Director since 2009 Previously served as President and Chief Operating Officer since 2004 when Surgery Partners was formed More than 20 years of healthcare experience with both an extensive management background and clinical experience Formerly served as Senior Vice President of Operations at HealthSouth Mike Doyle Chief Executive Officer Teresa Sparks Chief Financial Officer Executive Vice President and Chief Financial Officer since Symbion acquisition in November 2014 Previously served as Senior Vice President and Chief Financial Officer of Symbion (2007 to November 2014) and Corporate Controller (1996 through 2007) More than 20 years of healthcare experience with an extensive management background Previously served as Assistant Controller for HealthWise
Agenda Acquisition Strategy 3 Financial Overview 4 Executive Summary 1 Company Overview 2 Appendix 5
Executive Summary
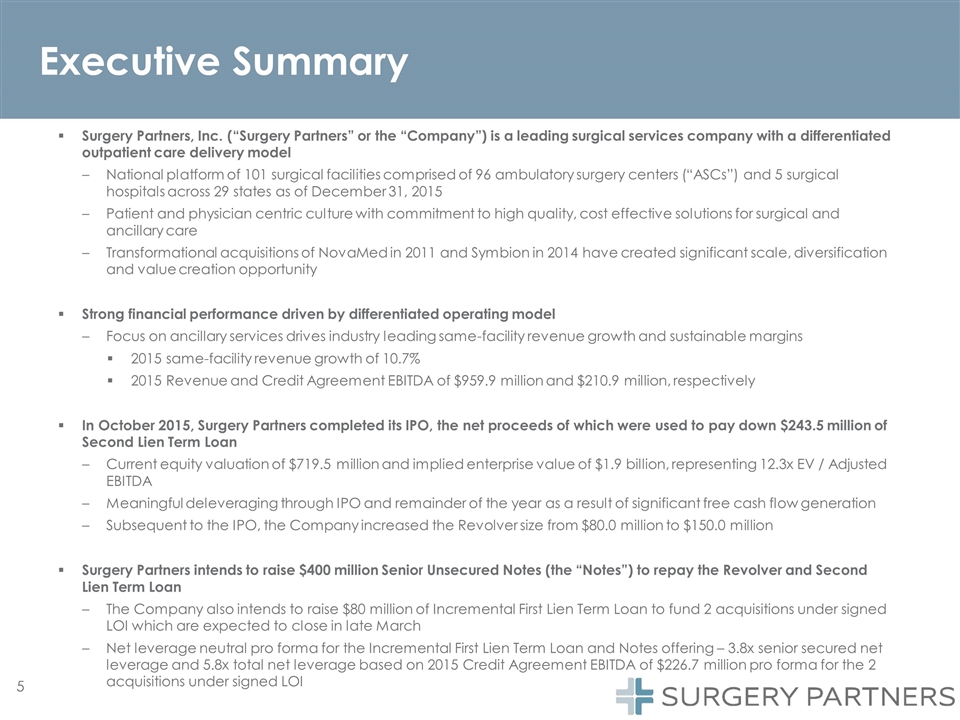
Executive Summary Surgery Partners, Inc. (“Surgery Partners” or the “Company”) is a leading surgical services company with a differentiated outpatient care delivery model National platform of 101 surgical facilities comprised of 96 ambulatory surgery centers (“ASCs”) and 5 surgical hospitals across 29 states as of December 31, 2015 Patient and physician centric culture with commitment to high quality, cost effective solutions for surgical and ancillary care Transformational acquisitions of NovaMed in 2011 and Symbion in 2014 have created significant scale, diversification and value creation opportunity Strong financial performance driven by differentiated operating model Focus on ancillary services drives industry leading same-facility revenue growth and sustainable margins 2015 same-facility revenue growth of 10.7% 2015 Revenue and Credit Agreement EBITDA of $959.9 million and $210.9 million, respectively In October 2015, Surgery Partners completed its IPO, the net proceeds of which were used to pay down $243.5 million of Second Lien Term Loan Current equity valuation of $719.5 million and implied enterprise value of $1.9 billion, representing 12.3x EV / Adjusted EBITDA Meaningful deleveraging through IPO and remainder of the year as a result of significant free cash flow generation Subsequent to the IPO, the Company increased the Revolver size from $80.0 million to $150.0 million Surgery Partners intends to raise $400 million Senior Unsecured Notes (the “Notes”) to repay the Revolver and Second Lien Term Loan The Company also intends to raise $80 million of Incremental First Lien Term Loan to fund 2 acquisitions under signed LOI which are expected to close in late March Net leverage neutral pro forma for the Incremental First Lien Term Loan and Notes offering – 3.8x senior secured net leverage and 5.8x total net leverage based on 2015 Credit Agreement EBITDA of $226.7 million pro forma for the 2 acquisitions under signed LOI
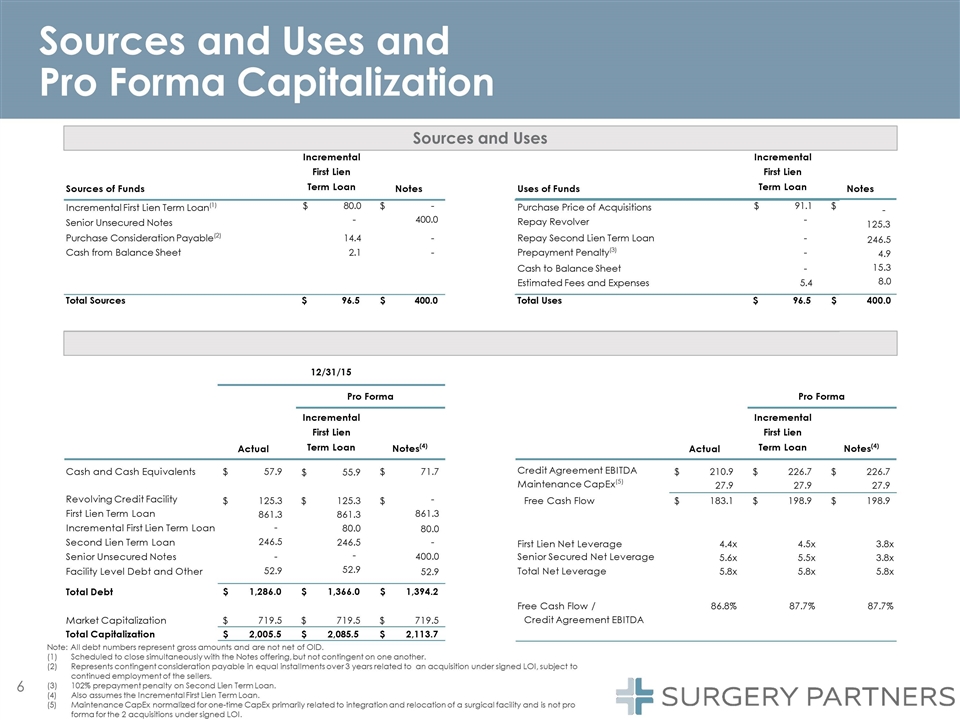
Incremental First Lien Term Loan Incremental First Lien Term Loan Sources of Funds Notes Uses of Funds Notes 198.9 $ First Lien Net Leverage Senior Secured Net Leverage Total Net Leverage 4.4x 5.6x 5.8x 4.5x 5.5x 5.8x 3.8x 3.8x 5.8x 1,286.0 $ 1,366.0 $ 1,394.2 $ Free Cash Flow / Credit Agreement EBITDA 86.8% 87.7% 87.7% Market Capitalization$719.5$719.5$719.5 Total Capitalization$2,005.5$2,085.5$2,113.7 - 125.3 246.5 4.9 15.3 8.0 400.0 Pro Forma Capitalization 12/31/15 Pro Forma Pro Forma Incremental First Lien Term Loan $55.9 Incremental First Lien Term Loan Actual Notes(4) Actual Notes(4) Cash and Cash Equivalents 57.9 $ 71.7 $ Credit Agreement EBITDA Maintenance CapEx(5) Free Cash Flow 210.9 27.9 $ 226.7 27.9 $ 226.7 27.9 $ Revolving Credit Facility First Lien Term Loan Incremental First Lien Term Loan Second Lien Term Loan Senior Unsecured Notes Facility Level Debt and Other Total Debt 125.3 861.3 - 246.5 - 52.9 $ 125.3 861.3 80.0 246.5 - 52.9 $ - 861.3 80.0 - 400.0 52.9 $ 183.1 $ 198.9 $ 6 Sources and Uses and Pro Forma Capitalization Sources and Uses Note: All debt numbers represent gross amounts and are not net of OID. Scheduled to close simultaneously with the Notes offering, but not contingent on one another. Represents contingent consideration payable in equal installments over 3 years related to an acquisition under signed LOI, subject to continued employment of the sellers. 102% prepayment penalty on Second Lien Term Loan. Also assumes the Incremental First Lien Term Loan. Maintenance CapEx normalized for one-time CapEx primarily related to integration and relocation of a surgical facility and is not pro forma for the 2 acquisitions under signed LOI. Incremental First Lien Term Loan(1) Senior Unsecured Notes $80.0 - $- 400.0 Purchase Price of Acquisitions Repay Revolver $91.1 - $ Purchase Consideration Payable(2) 14.4 - Repay Second Lien Term Loan - Cash from Balance Sheet 2.1 - Prepayment Penalty(3) - Cash to Balance Sheet - Estimated Fees and Expenses 5.4 Total Sources $96.5 $400.0 Total Uses $96.5 $
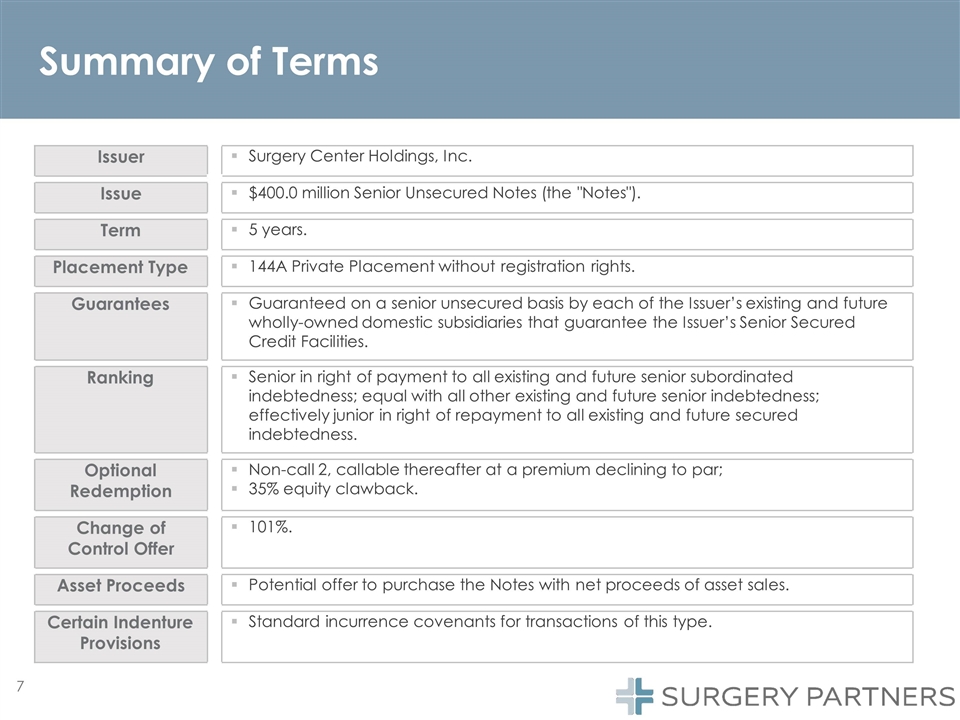
Summary of Terms Issuer Surgery Center Holdings, Inc. Issue $400.0 million Senior Unsecured Notes (the "Notes"). Term 5 years. Placement Type 144A Private Placement without registration rights. Guarantees Guaranteed on a senior unsecured basis by each of the Issuer’s existing and future wholly-owned domestic subsidiaries that guarantee the Issuer’s Senior Secured Credit Facilities. Ranking Senior in right of payment to all existing and future senior subordinated indebtedness; equal with all other existing and future senior indebtedness; effectively junior in right of repayment to all existing and future secured indebtedness. Optional Redemption Non-call 2, callable thereafter at a premium declining to par; 35% equity clawback. Change of Control Offer § 101%. Asset Proceeds Potential offer to purchase the Notes with net proceeds of asset sales. Certain Indenture Provisions Standard incurrence covenants for transactions of this type.
Company Overview
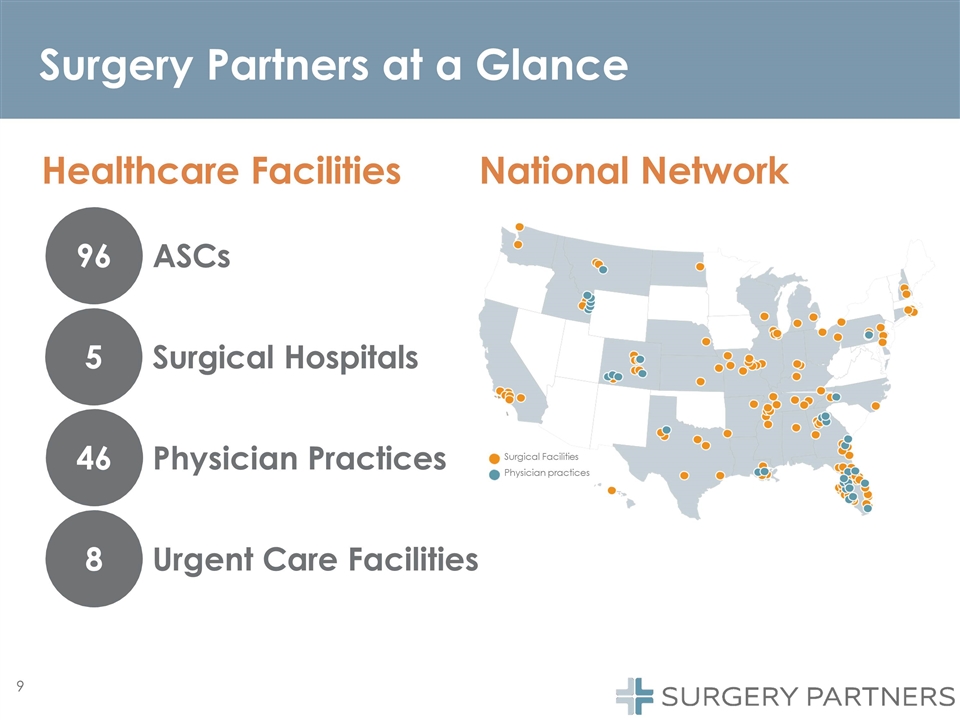
Surgery Partners at a Glance 8Urgent Care Facilities Healthcare Facilities 96ASCs 5Surgical Hospitals 46Physician Practices Surgical Facilities Physician practices National Network
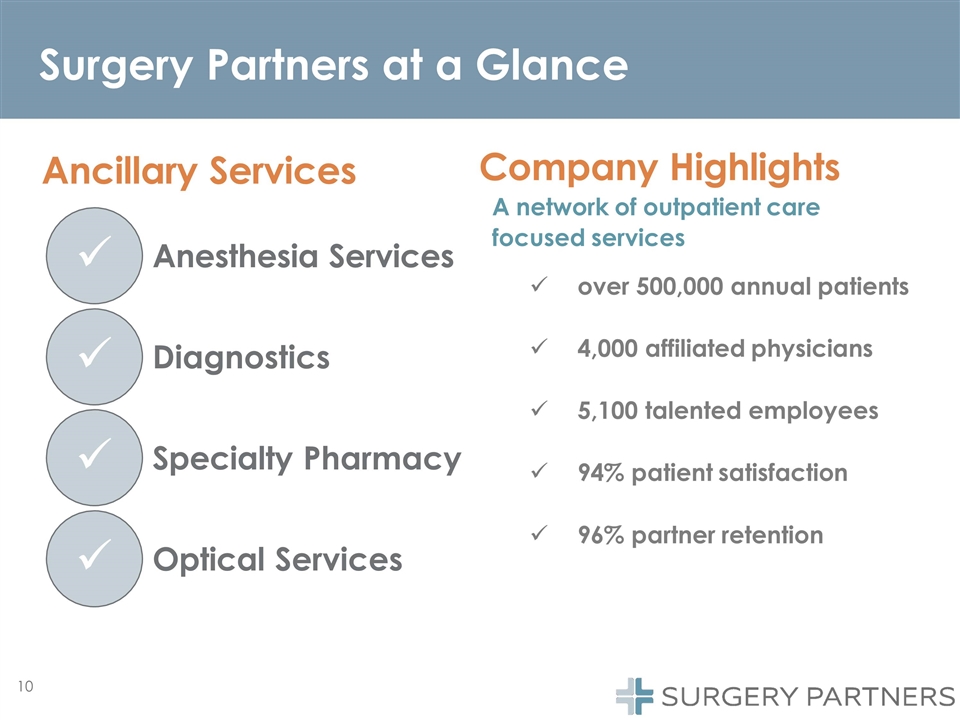
Surgery Partners at a Glance Optical Services Anesthesia Services Diagnostics Specialty Pharmacy Ancillary Services ü Company Highlights A network of outpatient care focused services over 500,000 annual patients 4,000 affiliated physicians 5,100 talented employees 94% patient satisfaction 96% partner retention 10 ü ü ü
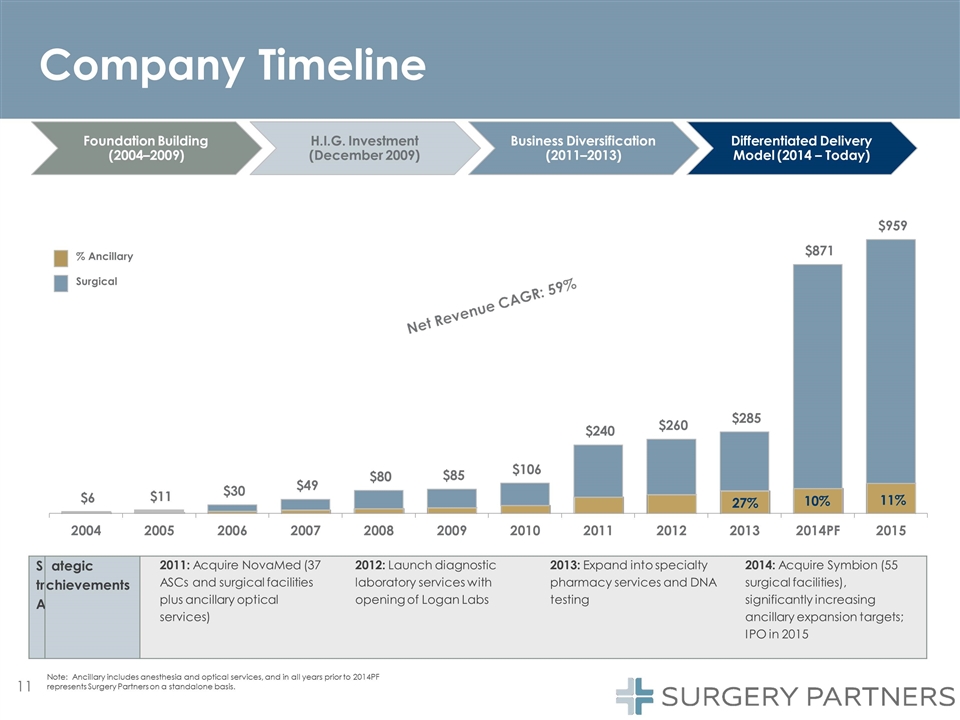
Company Timeline $6 $11 $30 $49 $80 $85 $106 $240 $260 $285 $871 $959 2004 2005 2006 2007 2008 2009 2010 2011 2012 2013 2014PF 2015 10% % Ancillary Surgical Foundation Building (2004–2009) Business Diversification (2011–2013) Differentiated Delivery Model (2014 – Today) represents Surgery Partners on a standalone basis. H.I.G. Investment (December 2009) 11% 27% Note: Ancillary includes anesthesia and optical services, and in all years prior to 2014PF Str A ategic chievements 2011: Acquire NovaMed (37 ASCs and surgical facilities plus ancillary optical services) 2012: Launch diagnostic laboratory services with opening of Logan Labs 2013: Expand into specialty pharmacy services and DNA testing 2014: Acquire Symbion (55 surgical facilities), significantly increasing ancillary expansion targets; IPO in 2015
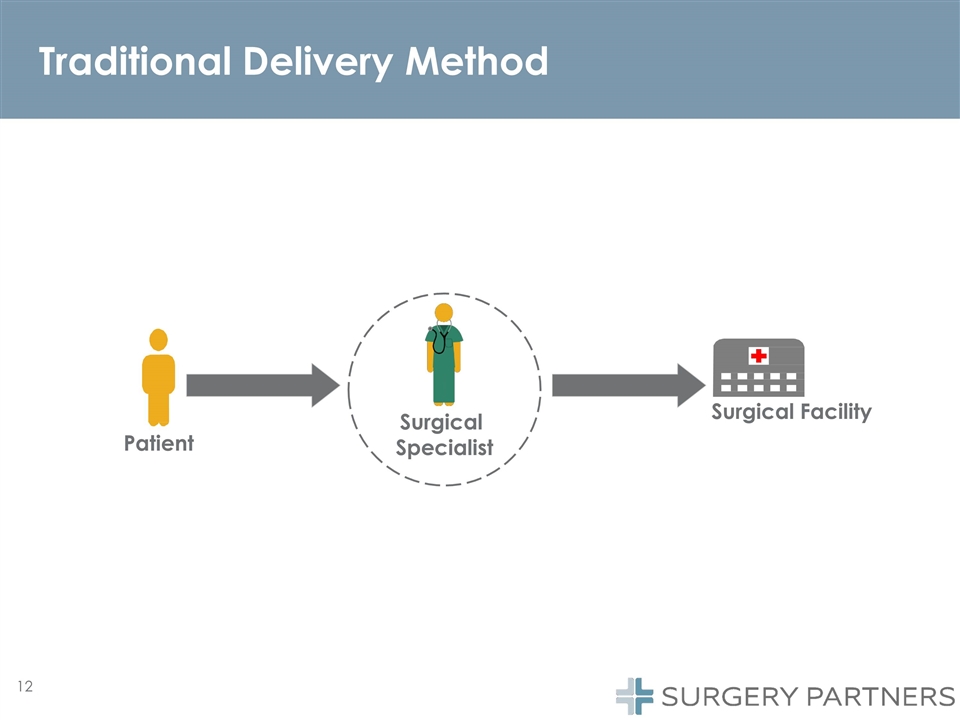
Traditional Delivery Method Patient Surgical Specialist Surgical Facility
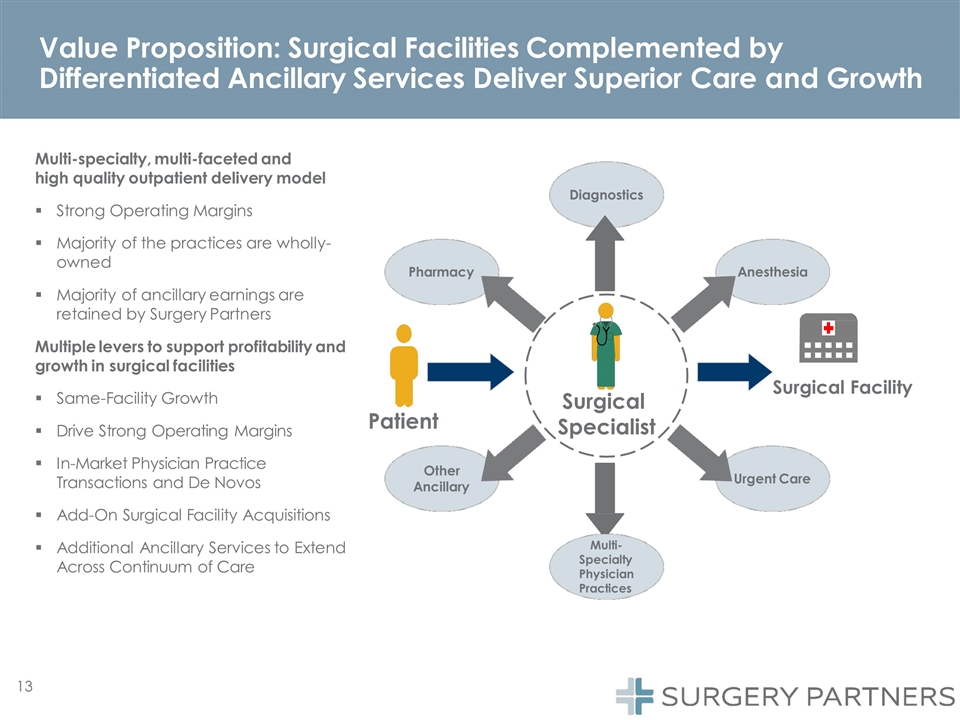
Value Proposition: Surgical Facilities Complemented by Differentiated Ancillary Services Deliver Superior Care and Growth Multi-specialty, multi-faceted and high quality outpatient delivery model Strong Operating Margins Majority of the practices are wholly- owned Majority of ancillary earnings are retained by Surgery Partners Multiple levers to support profitability and growth in surgical facilities Same-Facility Growth Drive Strong Operating Margins § In-Market Physician Practice Transactions and De Novos Add-On Surgical Facility Acquisitions Additional Ancillary Services to Extend Across Continuum of Care Surgical Specialist Diagnostics Anesthesia Other Ancillary Urgent Care Pharmacy Patient Surgical Facility Multi- Specialty Physician Practices
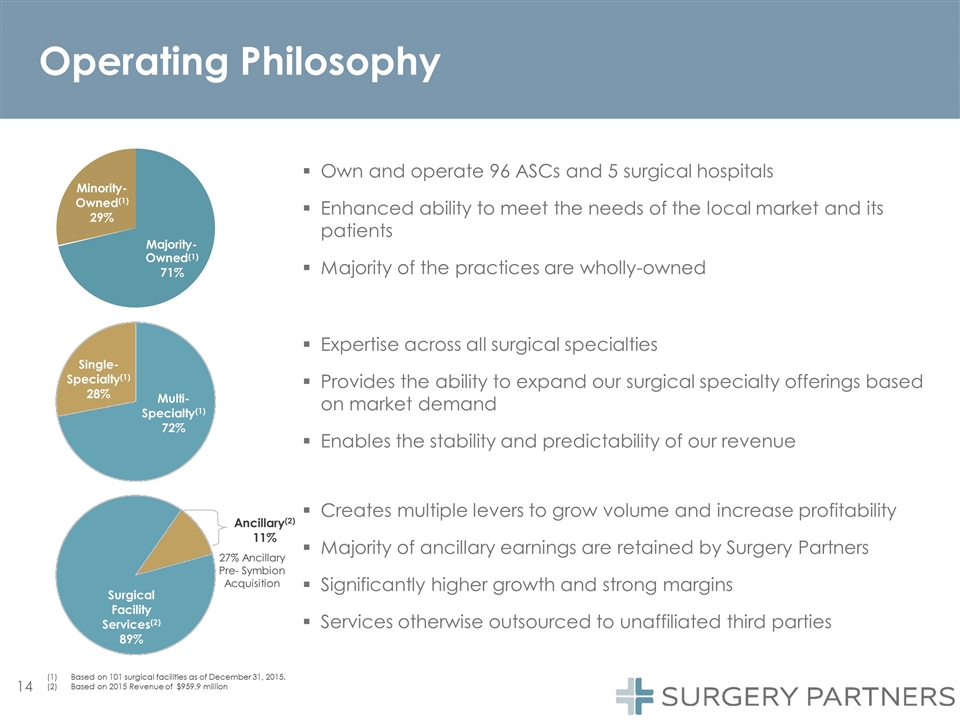
Operating Philosophy Ancillary(2) 11% 27% Ancillary Pre- Symbion Acquisition Own and operate 96 ASCs and 5 surgical hospitals Enhanced ability to meet the needs of the local market and its patients Majority of the practices are wholly-owned Expertise across all surgical specialties Provides the ability to expand our surgical specialty offerings based on market demand Enables the stability and predictability of our revenue Creates multiple levers to grow volume and increase profitability Majority of ancillary earnings are retained by Surgery Partners Significantly higher growth and strong margins Services otherwise outsourced to unaffiliated third parties Surgical Facility Services(2) 89% Multi- Specialty(1) 72% Single- Specialty(1) 28% Majority- (2)Based on 2015 Revenue of $959.9 million Owned 71% (1) Minority- Owned(1) 29% (1)Based on 101 surgical facilities as of December 31, 2015.
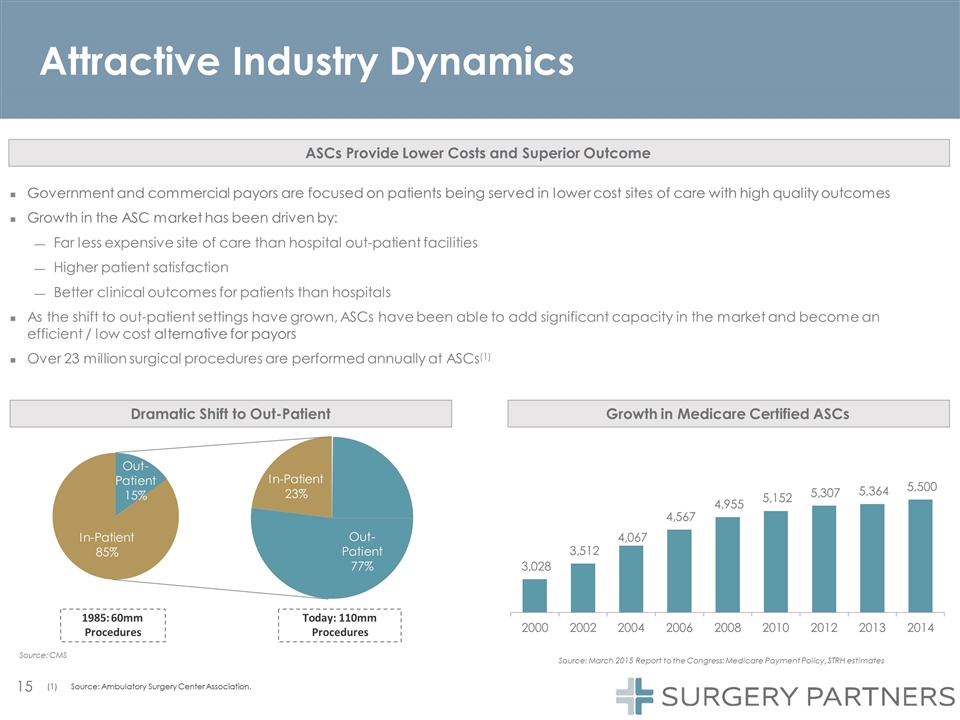
Out- Patient 77% In-Patient 23% Out- Patient 15% In-Patient 85% Attractive Industry Dynamics ASCs Provide Lower Costs and Superior Outcome Government and commercial payors are focused on patients being served in lower cost sites of care with high quality outcomes Growth in the ASC market has been driven by: Far less expensive site of care than hospital out-patient facilities Higher patient satisfaction Better clinical outcomes for patients than hospitals As the shift to out-patient settings have grown, ASCs have been able to add significant capacity in the market and become an efficient / low cost alternative for payors Over 23 million surgical procedures are performed annually at ASCs(1) Growth in Medicare Certified ASCs Dramatic Shift to Out-Patient 3,028 3,512 4,067 4,567 4,955 5,152 5,307 5,364 5,500 2000 2002200420062008201020122013 Source: March 2015 Report to the Congress: Medicare Payment Policy, STRH estimates 2014 1985: 60mm Procedures Today: 110mm Procedures (1)Source: Ambulatory Surgery Center Association. Source: CMS
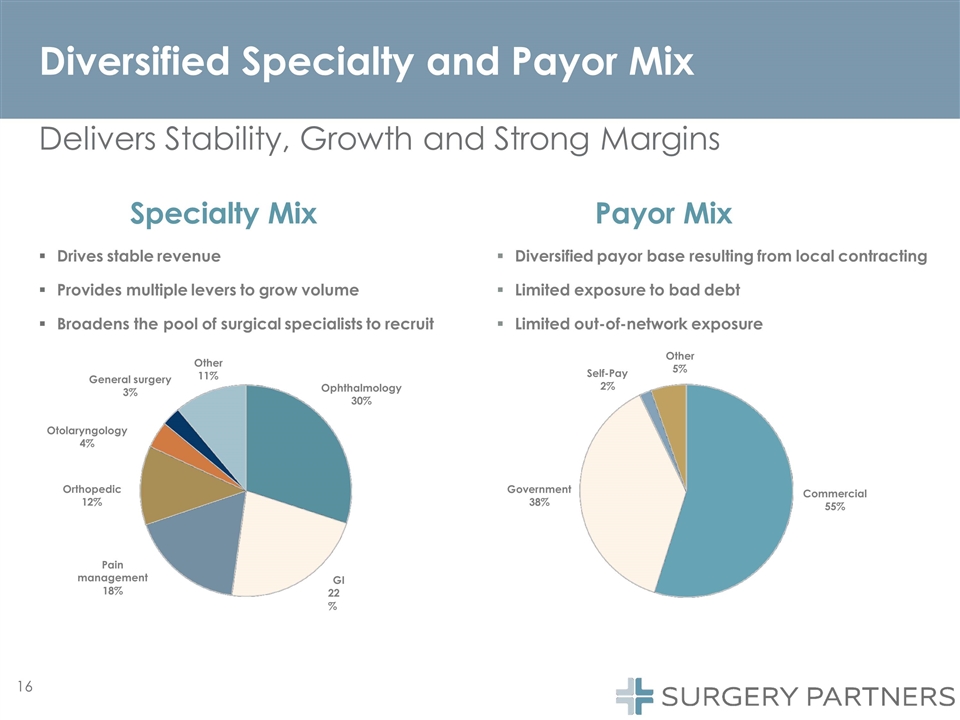
Diversified Specialty and Payor Mix Ophthalmology 30% GI 22% Pain management 18% Orthopedic 12% Otolaryngology 4% General surgery 3% Other 11% Commercial 55% Government 38% Self-Pay 2% Other 5% Specialty Mix Drives stable revenue Payor Mix Diversified payor base resulting from local contracting Delivers Stability, Growth and Strong Margins Provides multiple levers to grow volume Broadens the pool of surgical specialists to recruit Limited exposure to bad debt Limited out-of-network exposure

Physician Engagement Strategy Drives success in recruiting and retaining high quality physicians Over 100 Employed Physicians Operate in 46 practices, majority of which are wholly-owned ~1,000 Partnered Physicians Hold ownership positions in surgical facilities and receive pro-rata share of cash flows ~3,000 Affiliated Physicians Utilize Surgery Partners’ facilities to capitalize on procedural and administrative efficiencies compared to alternative sites of care 96% Physician Partner Retention Rate for Last 5 Full Years Flexible approach to physician engagement Physician-centric culture focused on customer service
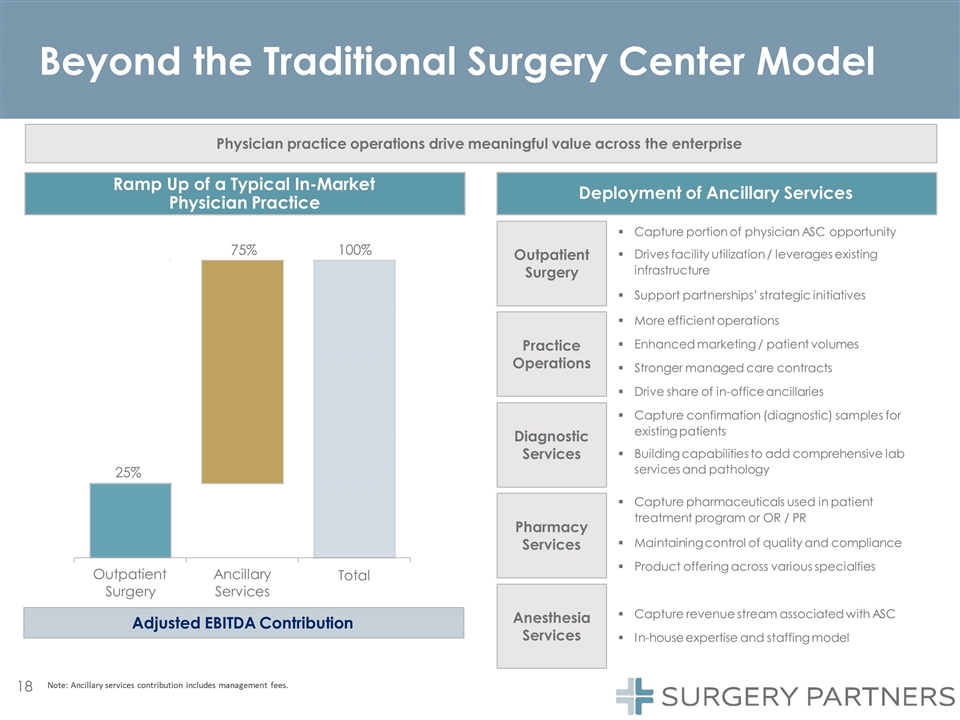
25% 75% 100% Outpatient Surgery Ancillary Services Total Practice Operations More efficient operations Enhanced marketing / patient volumes Stronger managed care contracts Drive share of in-office ancillaries Capture confirmation (diagnostic) samples for existing patients Building capabilities to add comprehensive lab services and pathology Outpatient Surgery Diagnostic Services Pharmacy Services Capture portion of physician ASC opportunity Drives facility utilization / leverages existing infrastructure Support partnerships’ strategic initiatives Capture pharmaceuticals used in patient treatment program or OR / PR Maintaining control of quality and compliance Product offering across various specialties Anesthesia Services Capture revenue stream associated with ASC In-house expertise and staffing model Adjusted EBITDA Contribution Ramp Up of a Typical In-Market Physician Practice Deployment of Ancillary Services Physician practice operations drive meaningful value across the enterprise Note: Ancillary services contribution includes management fees. Beyond the Traditional Surgery Center Model
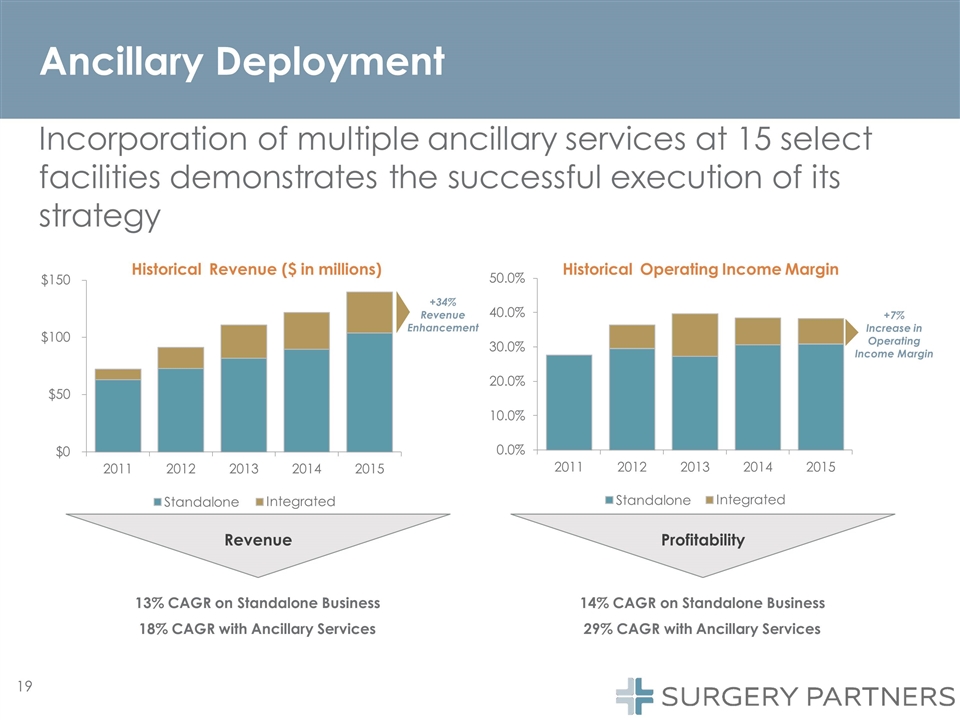
$0 20.0% $50 10.0% $100 $150 2011 20122013 Standalone 2014 2015 Integrated Ancillary Deployment +34% Revenue Enhancement +7% Increase in Operating Income Margin Incorporation of multiple ancillary services at 15 select facilities demonstrates the successful execution of its strategy 0.0% 30.0% 40.0% 50.0% 2011 20122013 Standalone 2014 2015 Integrated 14% CAGR on Standalone Business 29% CAGR with Ancillary Services Historical Revenue ($ in millions)Historical Operating Income Margin Profitability 13% CAGR on Standalone Business 18% CAGR with Ancillary Services Revenue 19
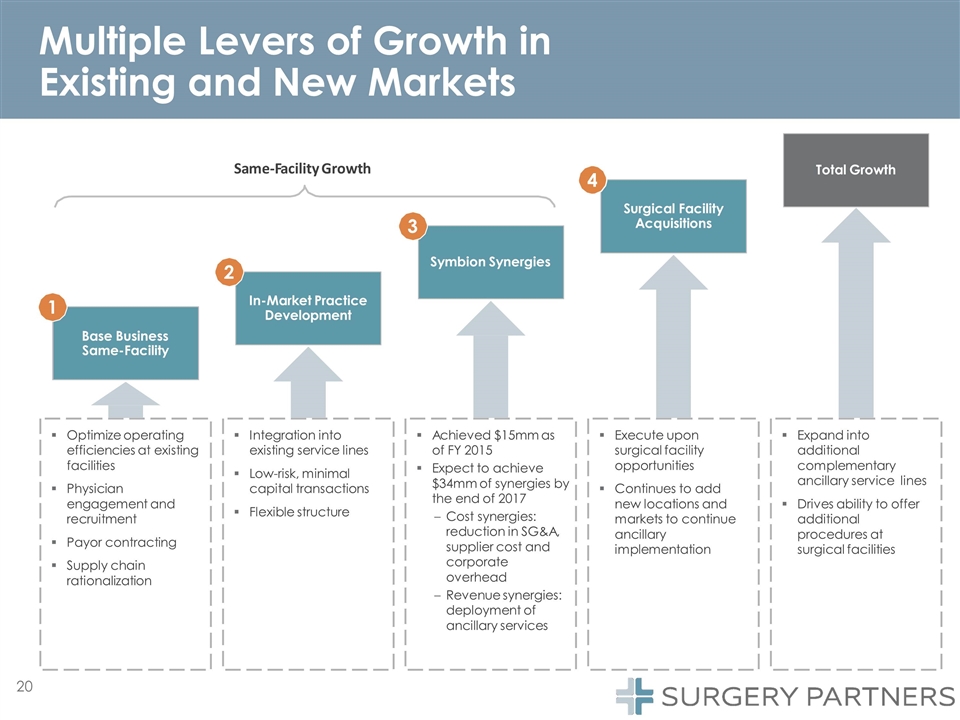
Multiple Levers of Growth in Existing and New Markets Total Growth Base Business Same-Facility In-Market Practice Development Symbion Synergies Surgical Facility Acquisitions Same-Facility Growth Optimize operating efficiencies at existing facilities Physician engagement and recruitment Payor contracting Supply chain rationalization Integration into existing service lines Low-risk, minimal capital transactions Flexible structure Achieved $15mm as of FY 2015 Expect to achieve $34mm of synergies by the end of 2017 Cost synergies: reduction in SG&A, supplier cost and corporate overhead Revenue synergies: deployment of ancillary services Execute upon surgical facility opportunities Continues to add new locations and markets to continue ancillary implementation Expand into additional complementary ancillary service lines Drives ability to offer additional procedures at surgical facilities 1 2 3 4 20
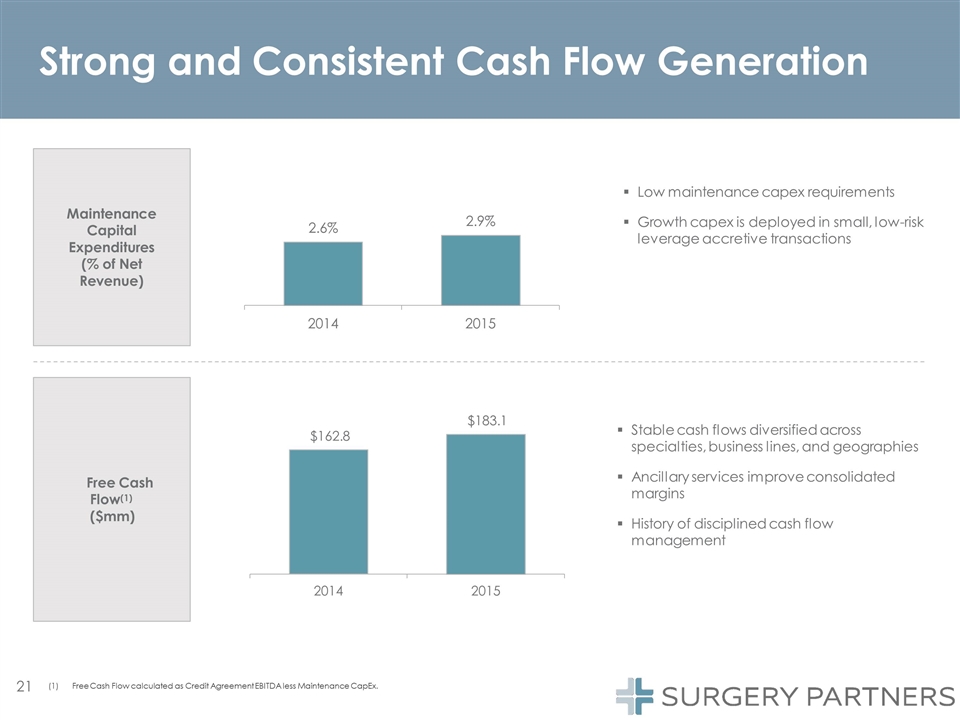
Strong and Consistent Cash Flow Generation Low maintenance capex requirements Growth capex is deployed in small, low-risk leverage accretive transactions Stable cash flows diversified across specialties, business lines, and geographies Ancillary services improve consolidated margins History of disciplined cash flow management Free Cash Flow(1) ($mm) Maintenance Capital Expenditures (% of Net Revenue) 2.6% 2.9% 2014 2015 $162.8 (1)Free Cash Flow calculated as Credit Agreement EBITDA less Maintenance CapEx. $183.1 2014 2015
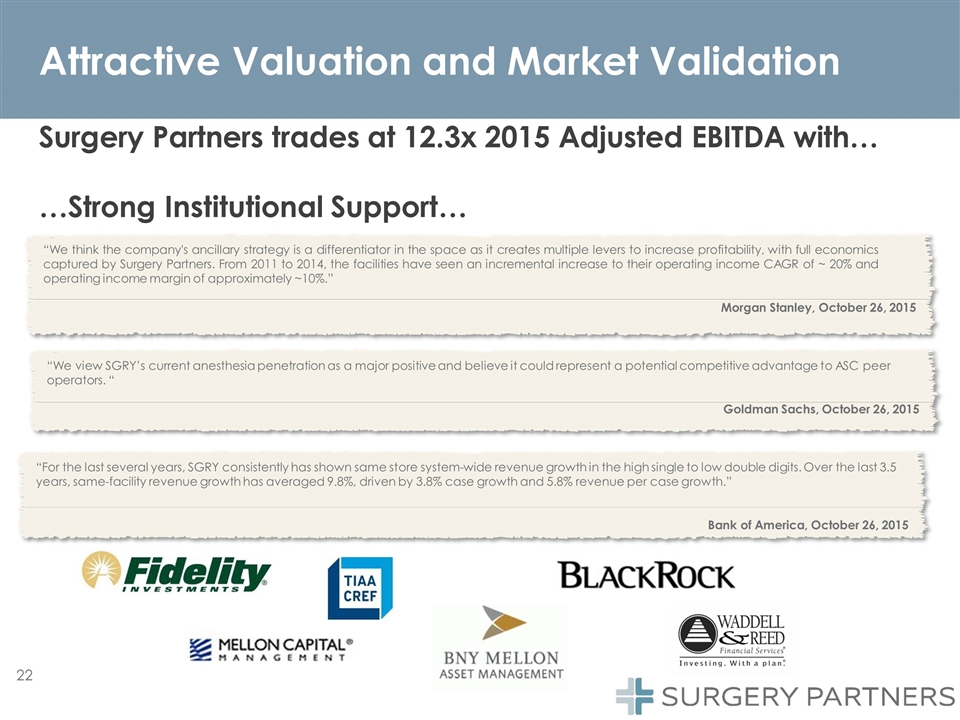
Surgery Partners trades at 12.3x 2015 Adjusted EBITDA with… …Strong Institutional Support… “We think the company's ancillary strategy is a differentiator in the space as it creates multiple levers to increase profitability, with full economics captured by Surgery Partners. From 2011 to 2014, the facilities have seen an incremental increase to their operating income CAGR of ~ 20% and operating income margin of approximately ~10%.” Morgan Stanley, October 26, 2015 Attractive Valuation and Market Validation “We view SGRY’s current anesthesia penetration as a major positive and believe it could represent a potential competitive advantage to ASC peer operators. “ Goldman Sachs, October 26, 2015 “For the last several years, SGRY consistently has shown same store system-wide revenue growth in the high single to low double digits. Over the last 3.5 years, same-facility revenue growth has averaged 9.8%, driven by 3.8% case growth and 5.8% revenue per case growth.” Bank of America, October 26, 2015
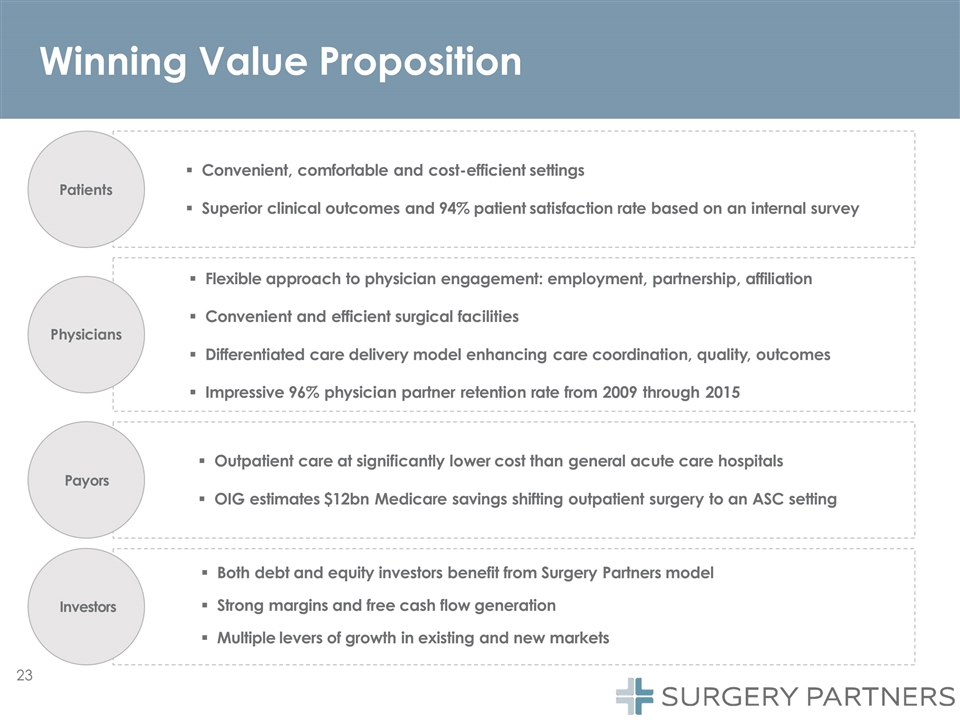
Winning Value Proposition Convenient, comfortable and cost-efficient settings Patients Superior clinical outcomes and 94% patient satisfaction rate based on an internal survey Flexible approach to physician engagement: employment, partnership, affiliation Convenient and efficient surgical facilities Physicians Differentiated care delivery model enhancing care coordination, quality, outcomes Impressive 96% physician partner retention rate from 2009 through 2015 Outpatient care at significantly lower cost than general acute care hospitals Payors OIG estimates $12bn Medicare savings shifting outpatient surgery to an ASC setting Both debt and equity investors benefit from Surgery Partners model Strong margins and free cash flow generation Multiple levers of growth in existing and new markets Investors

Acquisition Strategy
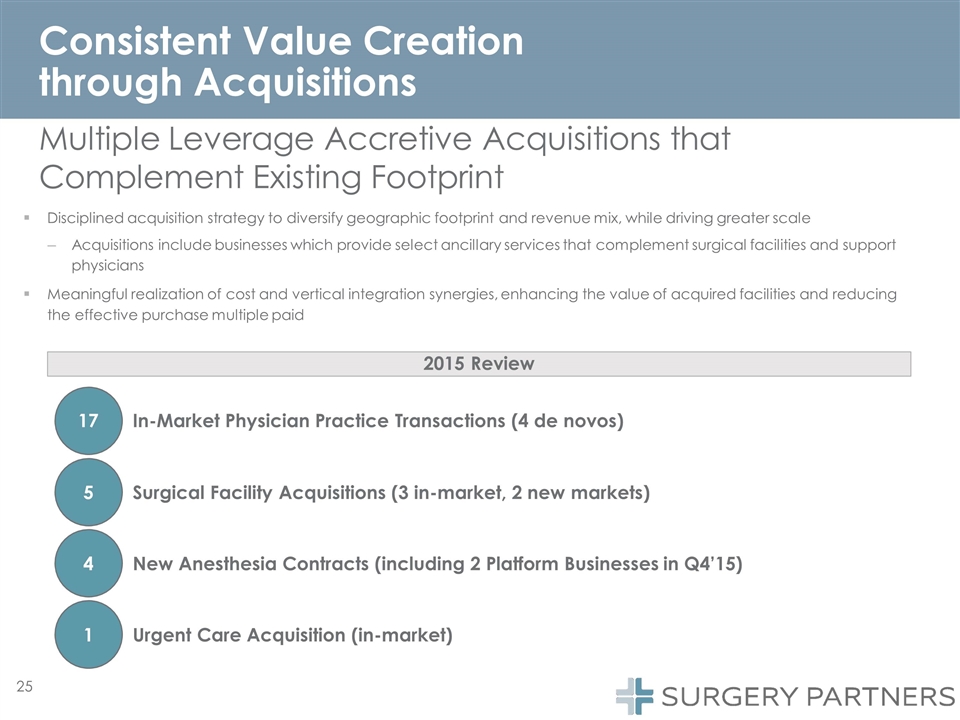
Consistent Value Creation through Acquisitions New Anesthesia Contracts (including 2 Platform Businesses in Q4’15) Urgent Care Acquisition (in-market) 4 1 Multiple Leverage Accretive Acquisitions that Complement Existing Footprint Disciplined acquisition strategy to diversify geographic footprint and revenue mix, while driving greater scale –Acquisitions include businesses which provide select ancillary services that complement surgical facilities and support physicians Meaningful realization of cost and vertical integration synergies, enhancing the value of acquired facilities and reducing the effective purchase multiple paid 2015 Review 17In-Market Physician Practice Transactions (4 de novos) Surgical Facility Acquisitions (3 in-market, 2 new markets) 5
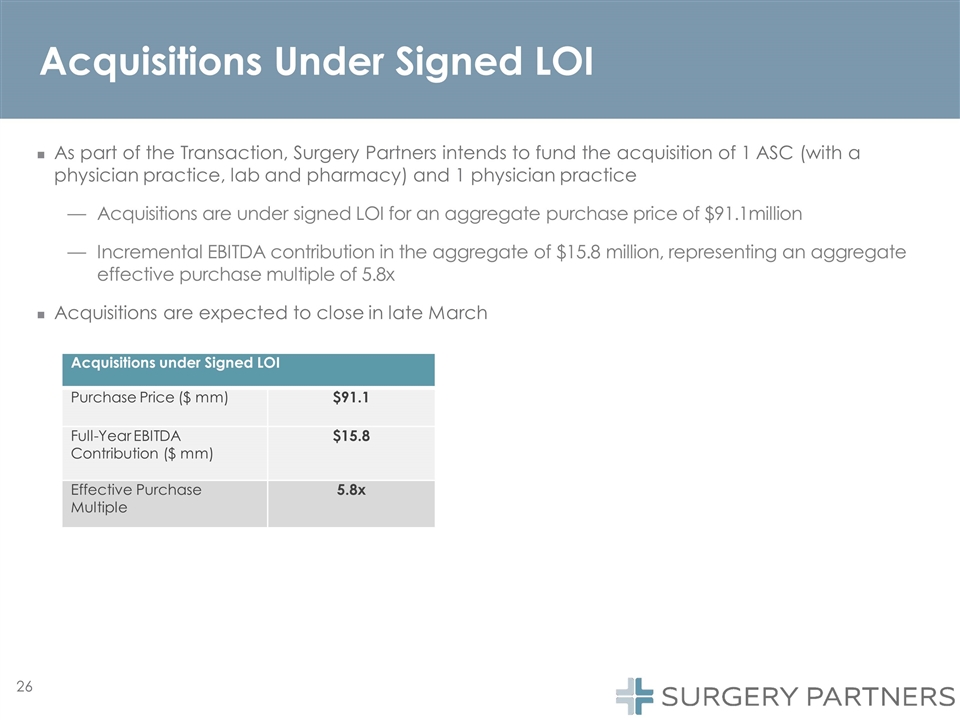
Acquisitions Under Signed LOI As part of the Transaction, Surgery Partners intends to fund the acquisition of 1 ASC (with a physician practice, lab and pharmacy) and 1 physician practice Acquisitions are under signed LOI for an aggregate purchase price of $91.1million Incremental EBITDA contribution in the aggregate of $15.8 million, representing an aggregate effective purchase multiple of 5.8x Acquisitions are expected to close in late March Acquisitions under Signed LOI Purchase Price ($ mm) $91.1 Full-Year EBITDA Contribution ($ mm) $15.8 Effective Purchase Multiple 5.8x
Financial Overview
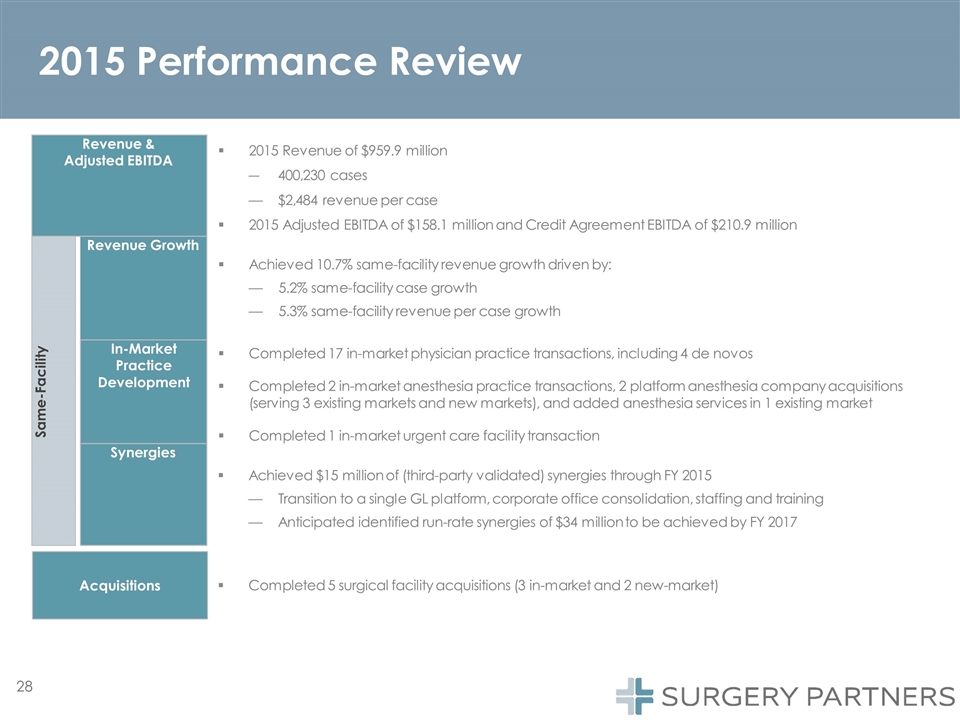
2015 Performance Review 2015 Revenue of $959.9 million ―400,230 cases $2,484 revenue per case 2015 Adjusted EBITDA of $158.1 million and Credit Agreement EBITDA of $210.9 million Achieved 10.7% same-facility revenue growth driven by: 5.2% same-facility case growth 5.3% same-facility revenue per case growth Completed 17 in-market physician practice transactions, including 4 de novos Completed 2 in-market anesthesia practice transactions, 2 platform anesthesia company acquisitions (serving 3 existing markets and new markets), and added anesthesia services in 1 existing market Completed 1 in-market urgent care facility transaction Achieved $15 million of (third-party validated) synergies through FY 2015 Transition to a single GL platform, corporate office consolidation, staffing and training Anticipated identified run-rate synergies of $34 million to be achieved by FY 2017 Completed 5 surgical facility acquisitions (3 in-market and 2 new-market) Acquisitions Revenue & Adjusted EBITDA Same-Facility Revenue Growth In-Market Practice Development Synergies
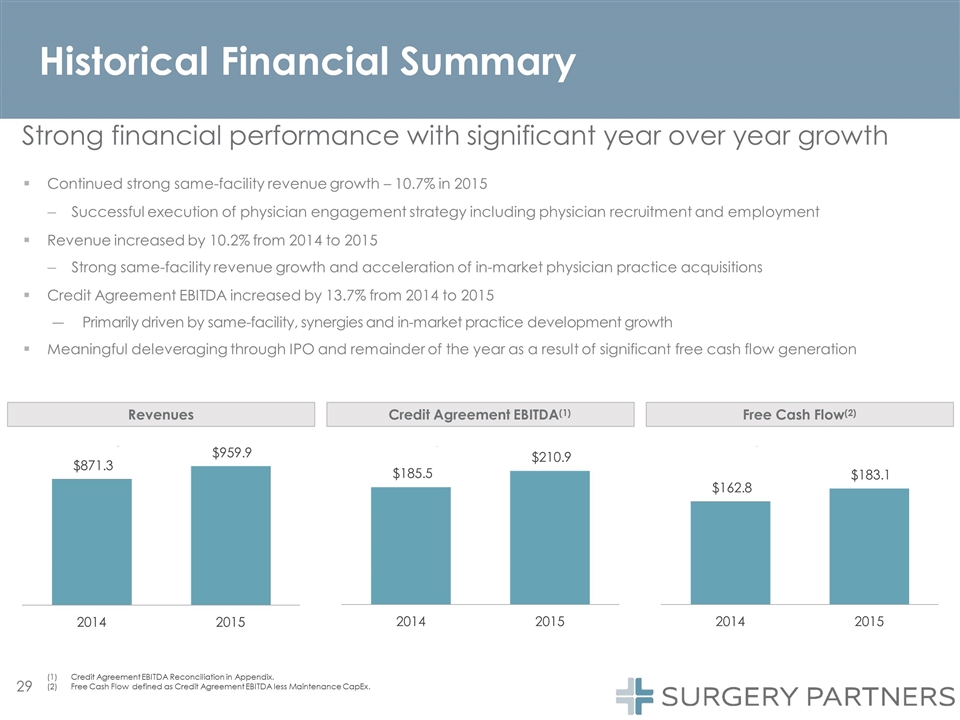
Historical Financial Summary $871.3 $959.9 2014 2015 $185.5 $210.9 2014 2015 $162.8 $183.1 2014 2015 Revenues Credit Agreement EBITDA(1) Free Cash Flow(2) (2)Free Cash Flow defined as Credit Agreement EBITDA less Maintenance CapEx. (1)Credit Agreement EBITDA Reconciliation in Appendix. Continued strong same-facility revenue growth – 10.7% in 2015 Successful execution of physician engagement strategy including physician recruitment and employment Revenue increased by 10.2% from 2014 to 2015 Strong same-facility revenue growth and acceleration of in-market physician practice acquisitions Credit Agreement EBITDA increased by 13.7% from 2014 to 2015 ―Primarily driven by same-facility, synergies and in-market practice development growth Meaningful deleveraging through IPO and remainder of the year as a result of significant free cash flow generation Strong financial performance with significant year over year growth
Appendix 30
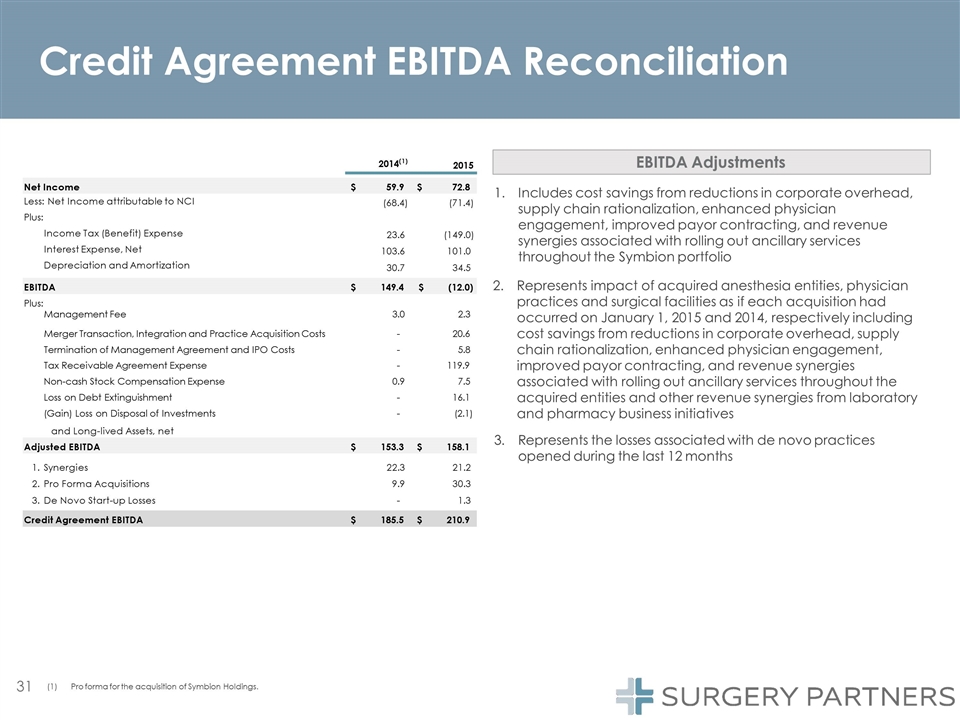
Credit Agreement EBITDA Reconciliation Includes cost savings from reductions in corporate overhead, supply chain rationalization, enhanced physician engagement, improved payor contracting, and revenue synergies associated with rolling out ancillary services throughout the Symbion portfolio Represents impact of acquired anesthesia entities, physician practices and surgical facilities as if each acquisition had occurred on January 1, 2015 and 2014, respectively including cost savings from reductions in corporate overhead, supply chain rationalization, enhanced physician engagement, improved payor contracting, and revenue synergies associated with rolling out ancillary services throughout the acquired entities and other revenue synergies from laboratory and pharmacy business initiatives Represents the losses associated with de novo practices opened during the last 12 months EBITDA Adjustments 2014(1) 2015 Net Income 59.9 $ $ 72.8 Less: Net Income attributable to NCI Plus: Income Tax (Benefit) Expense Interest Expense, Net Depreciation and Amortization (68.4) (71.4) 23.6 103.6 30.7 (149.0) 101.0 34.5 EBITDA 149.4 $ $ (12.0) Plus: and Long-lived Assets, net Adjusted EBITDA 153.3 $ $ 158.1 Synergies Pro Forma Acquisitions De Novo Start-up Losses 22.3 9.9 - 21.2 30.3 1.3 Credit Agreement EBITDA 185.5 $ $ 210.9 31 (1)Pro forma for the acquisition of Symbion Holdings. Management Fee 3.0 2.3 Merger Transaction, Integration and Practice Acquisition Costs - 20.6 Termination of Management Agreement and IPO Costs - 5.8 Tax Receivable Agreement Expense - 119.9 Non-cash Stock Compensation Expense 0.9 7.5 Loss on Debt Extinguishment - 16.1 (Gain) Loss on Disposal of Investments - (2.1)
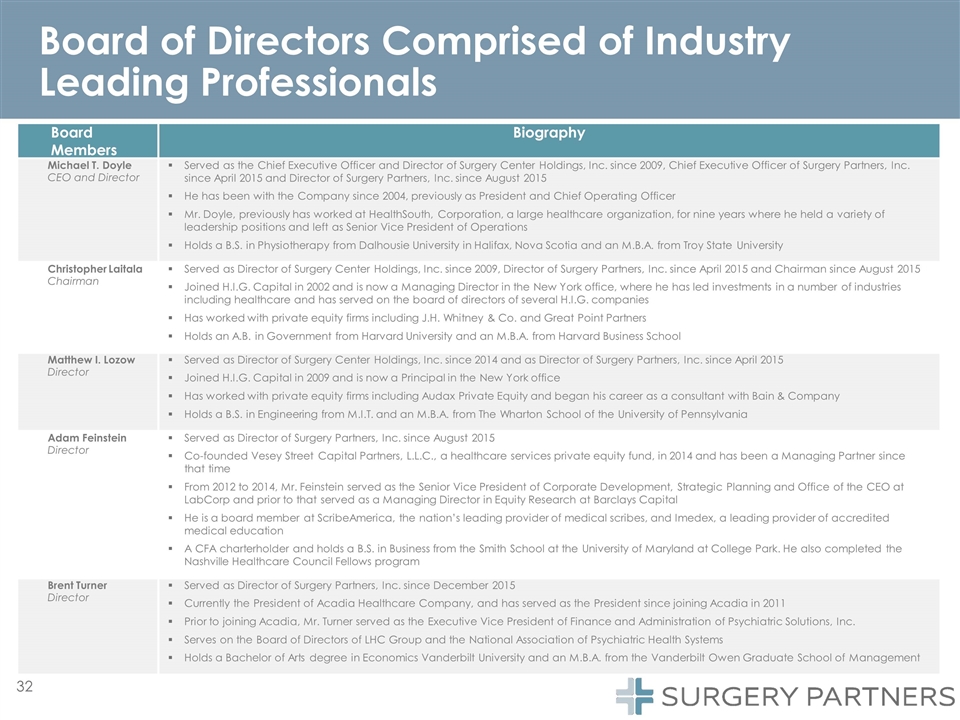
Board of Directors Comprised of Industry Leading Professionals 32 Board Members Biography Michael T. Doyle CEO and Director Served as the Chief Executive Officer and Director of Surgery Center Holdings, Inc. since 2009, Chief Executive Officer of Surgery Partners, Inc. since April 2015 and Director of Surgery Partners, Inc. since August 2015 He has been with the Company since 2004, previously as President and Chief Operating Officer Mr. Doyle, previously has worked at HealthSouth, Corporation, a large healthcare organization, for nine years where he held a variety of leadership positions and left as Senior Vice President of Operations Holds a B.S. in Physiotherapy from Dalhousie University in Halifax, Nova Scotia and an M.B.A. from Troy State University Christopher Laitala Chairman Served as Director of Surgery Center Holdings, Inc. since 2009, Director of Surgery Partners, Inc. since April 2015 and Chairman since August 2015 Joined H.I.G. Capital in 2002 and is now a Managing Director in the New York office, where he has led investments in a number of industries including healthcare and has served on the board of directors of several H.I.G. companies Has worked with private equity firms including J.H. Whitney & Co. and Great Point Partners Holds an A.B. in Government from Harvard University and an M.B.A. from Harvard Business School Matthew I. Lozow Director Served as Director of Surgery Center Holdings, Inc. since 2014 and as Director of Surgery Partners, Inc. since April 2015 Joined H.I.G. Capital in 2009 and is now a Principal in the New York office Has worked with private equity firms including Audax Private Equity and began his career as a consultant with Bain & Company Holds a B.S. in Engineering from M.I.T. and an M.B.A. from The Wharton School of the University of Pennsylvania Adam Feinstein Director Served as Director of Surgery Partners, Inc. since August 2015 Co-founded Vesey Street Capital Partners, L.L.C., a healthcare services private equity fund, in 2014 and has been a Managing Partner since that time From 2012 to 2014, Mr. Feinstein served as the Senior Vice President of Corporate Development, Strategic Planning and Office of the CEO at LabCorp and prior to that served as a Managing Director in Equity Research at Barclays Capital He is a board member at ScribeAmerica, the nation’s leading provider of medical scribes, and Imedex, a leading provider of accredited medical education A CFA charterholder and holds a B.S. in Business from the Smith School at the University of Maryland at College Park. He also completed the Nashville Healthcare Council Fellows program Brent Turner Director Served as Director of Surgery Partners, Inc. since December 2015 Currently the President of Acadia Healthcare Company, and has served as the President since joining Acadia in 2011 Prior to joining Acadia, Mr. Turner served as the Executive Vice President of Finance and Administration of Psychiatric Solutions, Inc. Serves on the Board of Directors of LHC Group and the National Association of Psychiatric Health Systems Holds a Bachelor of Arts degree in Economics Vanderbilt University and an M.B.A. from the Vanderbilt Owen Graduate School of Management