
Q2 FY2025 Highlights
•Peloton exceeded guidance on key metrics in Q2, including Paid Connected Fitness Subscriptions, Total Revenue, Total Gross Margin and Adjusted EBITDA*. Operating expenses were down 25% Y/Y, and we generated over $100 million of both GAAP Net Cash Provided by Operating Activities and non-GAAP Free Cash Flow*.
•We achieved meaningful improvements in Member happiness. Member loyalty, as measured by Net Promoter Scores (NPS), improved across all of our core products, with all Bike and Tread products above 70 in Q2. Member support satisfaction (MSAT) reached 4.3, on a scale of 1 to 5, from 3.1 in Q2 FY24.
•We are delivering on key initiatives, including improved new subscription attach rates from Tread sales Y/Y, increased mix of engagement toward Strength workouts1, and higher relative adoption by men, who accounted for 42% of Paid Connected Fitness Subscription gross additions in Q2, an increase of 280 bps Q/Q and 240 bps Y/Y.
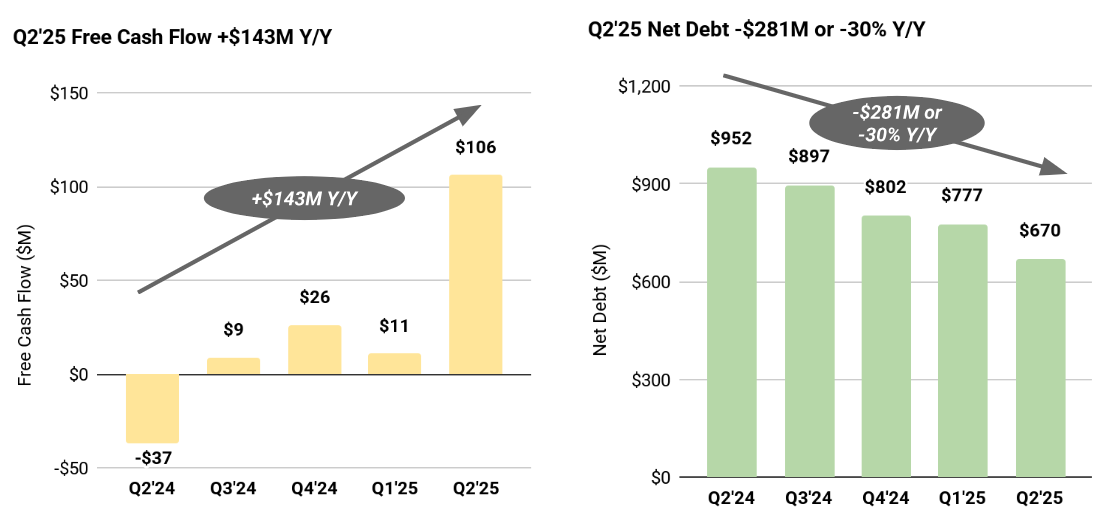
•Our balance sheet is deleveraging substantially, with Total Debt decreasing $190.1 million Y/Y and Net Debt* decreasing $281.4 million or 30% Y/Y in Q2.
•We are raising our full year FY25 guidance range for Adjusted EBITDA by $60 million to $300 - $350 million from $240 - $290, million and our Free Cash Flow target to at least $200 million from $125 million.
* For a reconciliation of all non-GAAP financial measures to their most directly comparable GAAP financial measure, and rationale for why we rely on these measures, see the reconciliation tables below.
Q2 FY2025 Shareholder Letter
February 6, 2025
Dear Shareholders,
We are grateful to Karen Boone and Chris Bruzzo for their leadership over the past few quarters. With their support, we delivered results that exceeded our guidance on key metrics in Q2. Upon Peter joining as CEO and President on January 1, Karen and Chris have now returned their focus to Board duties. We hope they feel the satisfaction that comes from a hard, important job well done and look forward to their contributions as Board Members.
Peloton is a category-defining brand that is beloved by its Members. Our products enable people to live better the more they use them. We believe that the better our Members feel, the more likely they are to stay committed and recommend us to their friends, which makes our business stronger.
We see significant opportunities ahead, but we have a steep hill to climb to reach sustained, profitable growth. Returning to growth begins with a new focus on and execution against our purpose – empowering people to live fit, strong, long and happy. While it’s still early days for our new CEO, it's already clear where we need to focus to serve this purpose: innovation on new products and experiences that lead to even better outcomes for Members; presence in more places so we can meet Members wherever they are; more ways to connect Members with Peloton and our supportive community; and improved unit economics with a cost structure that’s right-sized for our business.
Innovating on our products and experiences so we can deliver even better outcomes for our Members is our most important long-term opportunity. Third-party research studies have shown that people benefit from engaging in multiple fitness disciplines. This variety is not only good for our Members but also for our business, as we believe it drives higher engagement and retention. Our monthly churn rate is roughly 60% lower for Connected Fitness subscriptions engaging with two or more disciplines per month versus those engaging with just one.
While Peloton is best known for cardio workouts, and Cycling in particular, we are also a leader in Strength workouts. In Q2, over 2 million unique Members completed a Strength workout, representing 735 million minutes of total workout time. Furthermore, the number of Strength workouts taken in Q2 equaled 75% of the total number of Cycling workouts taken. On the cardio side, we also continue to elevate our Tread products, achieving higher new subscription attach rates Y/Y in Q2, thanks to our marketing efforts.
1 Strength workouts include Strength, Bootcamp, Yoga and Pilates classes, as well as non-class Strength and Yoga workouts taken on the Strength+ App or Peloton App.
1
With the release of our 10K training program in Q2, Peloton now offers training options for all major race distances. Over 300,000 Members have already trained for a race with Peloton.
We’re also seeing the impact of innovative, new software features like Pace Targets, which offer running instruction with personalized intensity levels. Nearly 60% of our Members who take Instructor-led workouts on our Tread products are using Pace Targets, and we're seeing improved running paces as a result.
Meeting Members in more places is another way to improve our service and grow our business. In December, we launched Strength+, a new app designed for gym-based strength workouts with audio guidance from expert coaches, as well as a custom strength workout generator. It reached over 220,000 monthly active users in Q2 and represents another value-add for our Members.
Third-party retail enables us to meet more new Members in places where they already shop. Our new seasonal partnership with Costco drove more Bike+ unit sales than any other third-party retail partner during Q2. We also remain focused on meeting more Members around the globe. We are encouraged by hardware sales in International markets in Q2, which exceeded our expectations, as well as the continued growth in International Connected Fitness Subscriptions, which was accomplished with greater capital efficiency and improved unit economics.
As you may know, Peloton is named after the pack of cyclists who ride closely together to reduce their collective resistance, thereby going further, faster. And research shows that people achieve better fitness outcomes when they work out together. So we’re focused on deepening connections among our more than six million Members, both with Peloton and with our supportive community. In September, we launched Teams, which enables Members to share workouts and compete in challenges. 70,000 Teams have been created since launch, and Members who join them are more likely to work out. In Q2, we hosted the 11th annual Thanksgiving Day Turkey Burn where over 50,000 Members worked out together live. This year’s Turkey Burn also brought "The Feast," our first Thanksgiving live Strength class and the largest live Strength class in Peloton’s history.
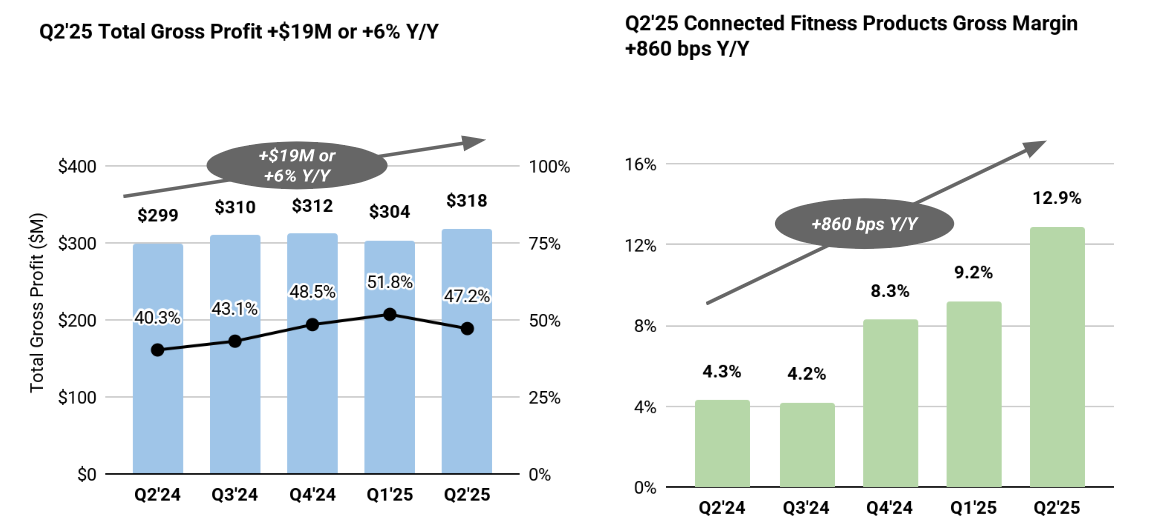
We’ve discussed in recent quarters that improving our unit economics and right-sizing our costs are both critical to our long-term success. During this important holiday quarter, we demonstrated continued progress on improving our hardware unit economics by selling a favorable mix of premium priced products and real discipline by aligning our discounts with the margins of our products. In Q2, we achieved a 12.9% Connected Fitness Products Gross Margin, reaching double digits for the first time in over three years.
We also remain focused on optimizing costs across our business, delivering strong performance in our Q2 GAAP and non-GAAP profitability metrics, which we believe are useful to investors for understanding and evaluating our operating results.
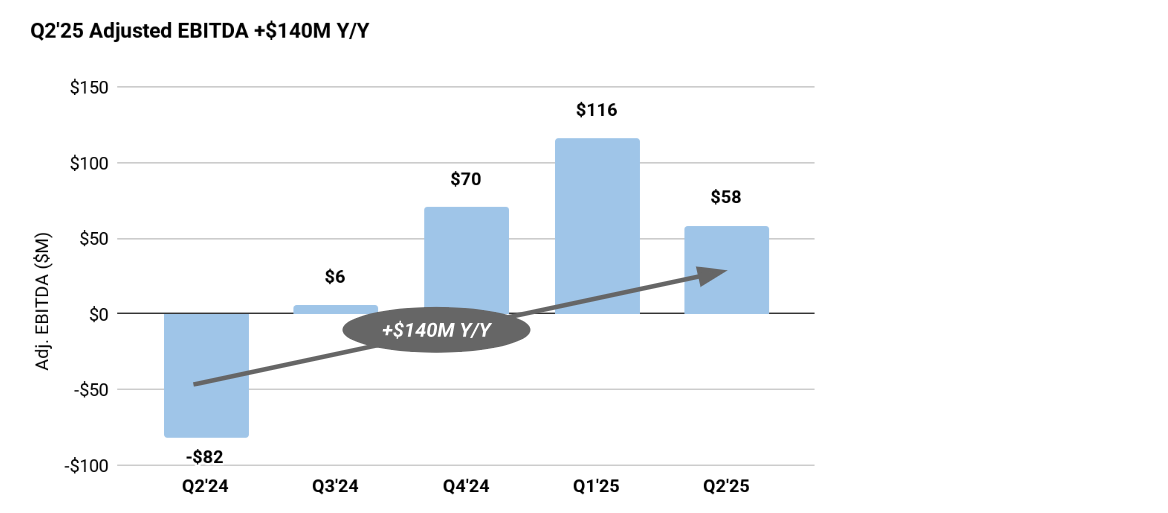
Our GAAP Net Loss for Q2 was $92.0 million, an improvement of $102.9 million Y/Y, and our GAAP Operating Loss was $45.9 million, which was an improvement of $141.2 million Y/Y. In Q2, we achieved $58.4 million of Adjusted EBITDA*, an increase of $140.1 million Y/Y.
Our Net Cash Provided by Operating Activities was $106.7 million, an increase of $137.9 million Y/Y. In Q2, we achieved $106.0 million of Free Cash Flow*, an increase of $143.2 million Y/Y.
* For a reconciliation of all non-GAAP financial measures to their most directly comparable GAAP financial measure, and rationale for why we rely on these measures, see the reconciliation tables below.
2
FY 2025 Q2 Operating Metrics and Financial Summary
| % Change | |||||||||||||||||||||||||||||
| User Metrics | Q2 FY24 | Q1 FY25 | Q2 FY25 | Y/Y | Q/Q | ||||||||||||||||||||||||
| Members (in millions) | 6.4 | 6.2 | 6.2 | (4) | % | (1) | % | ||||||||||||||||||||||
| Ending Paid Connected Fitness Subscriptions (in millions) | 3.004 | 2.900 | 2.879 | (4) | % | (1) | % | ||||||||||||||||||||||
| Average Net Monthly Paid Connected Fitness Subscription Churn | 1.2 | % | 1.9 | % | 1.4 | % | 20 bps | (50) bps | |||||||||||||||||||||
| Ending Paid App Subscriptions (in millions) | 0.718 | 0.582 | 0.579 | (19) | % | (1) | % | ||||||||||||||||||||||
| Average Monthly Paid App Subscription Churn | 7.2 | % | 7.1 | % | 6.4 | % | (80) bps | (70) bps | |||||||||||||||||||||
| Financial Results (dollars in millions) | |||||||||||||||||||||||||||||
| Connected Fitness Products Revenue | $ | 319.1 | $ | 159.6 | $ | 253.4 | (21) | % | 59 | % | |||||||||||||||||||
| Subscription Revenue | 424.5 | 426.3 | 420.6 | (1) | % | (1) | % | ||||||||||||||||||||||
| Total Revenue | $ | 743.6 | $ | 586.0 | $ | 673.9 | (9) | % | 15 | % | |||||||||||||||||||
| Connected Fitness Products Gross Profit | $ | 13.8 | $ | 14.6 | $ | 32.8 | 137 | % | 124 | % | |||||||||||||||||||
| Connected Fitness Products Gross Margin | 4.3 | % | 9.2 | % | 12.9 | % | 860 bps | 380 bps | |||||||||||||||||||||
| Subscription Gross Profit | $ | 285.6 | $ | 289.1 | $ | 285.6 | 0 | % | (1) | % | |||||||||||||||||||
| Subscription Gross Margin | 67.3 | % | 67.8 | % | 67.9 | % | 60 bps | 10 bps | |||||||||||||||||||||
Subscription Contribution Margin (1) | 71.7 | % | 71.7 | % | 72.1 | % | 50 bps | 40 bps | |||||||||||||||||||||
| Total Gross Profit | $ | 299.4 | $ | 303.8 | $ | 318.4 | 6 | % | 5 | % | |||||||||||||||||||
| Total Gross Margin | 40.3 | % | 51.8 | % | 47.2 | % | 700 bps | (460) bps | |||||||||||||||||||||
| Total Operating Expenses | $ | 486.5 | $ | 291.2 | $ | 364.3 | (25) | % | 25 | % | |||||||||||||||||||
| Net Loss | $ | (194.9) | $ | (0.9) | $ | (92.0) | 53 | % | (10,414) | % | |||||||||||||||||||
Adjusted EBITDA (1) | $ | (81.7) | $ | 115.8 | $ | 58.4 | 171 | % | (50) | % | |||||||||||||||||||
| Net Cash (Used in) Provided by Operating Activities | $ | (31.2) | $ | 12.5 | $ | 106.7 | 441 | % | 753 | % | |||||||||||||||||||
Free Cash Flow (1) | $ | (37.2) | $ | 10.7 | $ | 106.0 | 385 | % | 893 | % | |||||||||||||||||||
____________________________________
(1) For a reconciliation of each non-GAAP financial measure to the most directly comparable GAAP financial measure, and rationale for why we rely on these measures, please refer to the reconciliation tables in the section titled “Non-GAAP Financial Measures.”
OPERATING METRICS AND FINANCIAL SUMMARY
Subscriptions
We ended the quarter with 2.88 million Ending Paid Connected Fitness Subscriptions, reflecting a net decrease of 21 thousand in the quarter. This exceeded the high end of our guidance range by 19 thousand subscriptions. Outperformance was driven by favorable net churn, partially offset by lower gross additions.
Average Net Monthly Paid Connected Fitness Subscription Churn was 1.4%. This reflects a 50 basis points improvement Q/Q, exceeding our expectations for seasonal improvement in Q2, and an increase of 20 basis points Y/Y primarily offset by a one-time benefit in net pauses in Q2 of last year. Net churn was positively impacted by lower-than-expected subscription cancellations, lower subscription pauses and higher reactivations. Reactivation performance was positively impacted by recent Marketing efforts to re-engage churned subscriptions.
Our gross additions performance was due to slightly lower hardware unit sales, a higher Tread portfolio share of total hardware sales, which have lower new subscription attach rates than our Bike products, as well as longer delivery times for Tread+ units that delayed subscription activations until Q3. Secondary market activations were in-line with internal expectations and represented roughly 40% of total gross additions in the quarter.
3
We ended the second quarter with 579 thousand Paid App subscriptions, inclusive of Strength+ subscriptions, reflecting a net decrease of 4 thousand in the quarter. This result exceeded the midpoint of our guidance range by 9 thousand.
Revenue
Total Revenue was $673.9 million in the second quarter, comprising $253.4 million of Connected Fitness Products Revenue, a decrease of $65.8 million or 21% Y/Y, and $420.6 million of Subscription Revenue, a decrease of $4.0 million or 1% Y/Y. Total Revenue was $13.9 million above the high end of our $640 million to $660 million guidance range, due to higher than expected Revenue from both segments.
The holiday season is a critical period for Connected Fitness Products Revenue, as Q2 historically represents over 40% of annual hardware unit sales. Connected Fitness Products Revenue exceeded expectations from higher than expected premium-priced hardware sales, predominantly Tread and Tread+, partly offset by slightly softer overall unit sales. Due to higher-than-expected Tread+ sales, we faced inventory constraints that temporarily led to longer delivery times, delaying some Tread+ deliveries to Q3. We also observed higher-than-expected sales for our low-priced Refurbished Bike. Offsetting favorable Tread portfolio and Refurbished Bike sales, we observed lower unit sales in the mid-range price point, specifically the original Bike.
Subscription Revenue was higher-than-expected as a result of higher Paid Connected Fitness Subscriptions. Seasonally higher hardware sales in Q2 is reflected in the revenue mix of 38% Connected Fitness Products Revenue and 62% Subscription Revenue.
Importantly, we are acquiring new Members more cost effectively and improving our LTV/CAC ratio Y/Y, and our holiday performance reflects the continued progress we’ve made in evolving our marketing strategy. In Q2, our advertising and marketing spend was down $64.4 million or 38% Y/Y while our Connected Fitness Products revenue was down by 21% Y/Y. Our “Find Your Power” marketing campaign, which launched in November and featured J.J. and T.J. Watt, targeted men and highlighted Tread and Strength products. Following this campaign, we converted a higher mix of male Members. In Q2, men accounted for 42% of Paid Connected Fitness Subscription gross additions, a 280 bps increase Q/Q and 240 bps increase Y/Y. In addition to advertising more towards men, our marketing efforts were also focused on demonstrating the full value of a Peloton membership through better education of our extensive offerings. Among Latine and our core female audiences, we observed a lift in awareness of non-Cycling modalities like Walking, Running, Yoga, and High Intensity Interval Training among those that were exposed to our holiday campaign. We also saw an increase in the Latine audience that would consider using Peloton, which is a leading indicator of future intent to purchase.
Gross Profit and Margin
Total Gross Profit was $318.4 million in Q2, an increase of $19.0 million or 6% Y/Y. Total Gross Margin was 47.2%, 70 basis points above our guidance, due to favorable Connected Fitness Products Gross Margin and favorable Subscription Gross Margin, partially offset by revenue mix shift toward our Connected Fitness Products segment.
Connected Fitness Products gross margin was 12.9%, up 860 basis points Y/Y, primarily driven by a mix shift toward higher margin products, lower warehousing and transportation related costs, and a reduction in inventory reserves. Subscription gross margin was 67.9%, up 60 basis points Y/Y.
4
Operating Expenses
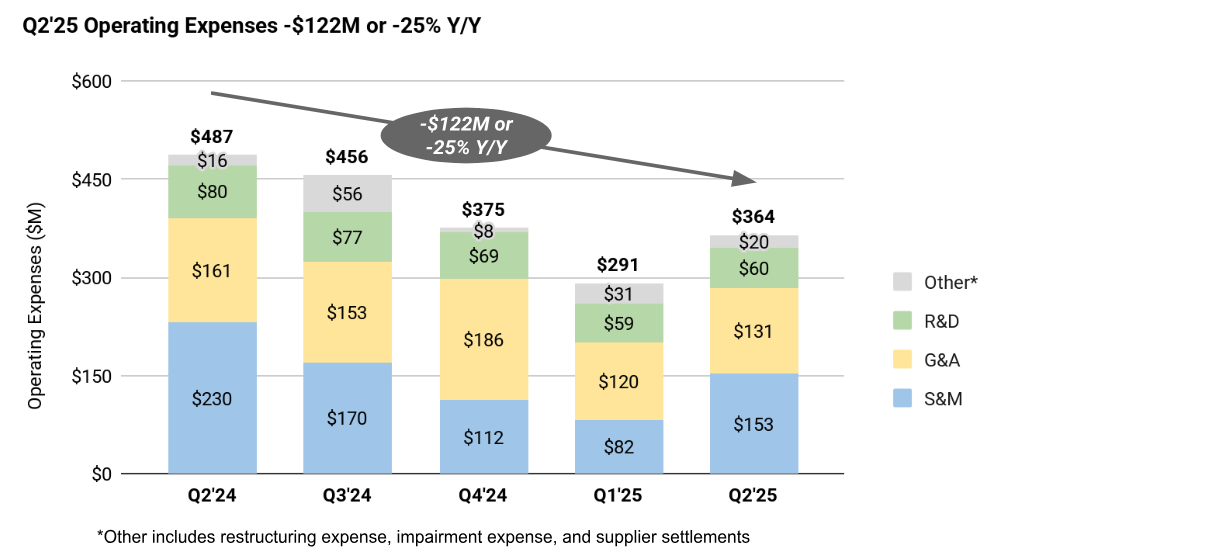
Total Operating Expenses, including Restructuring and Impairment expenses, were $364.3 million in the second quarter, a $122.2 million or 25% reduction Y/Y, reflecting the progress we’ve made thus far toward right-sizing our cost structure. We are tracking ahead of our cost savings targets for FY25.
Sales and Marketing expense was $152.7 million, a decrease of $77.6 million or 34% Y/Y, primarily from a decrease in advertising and marketing spend, and personnel-related and stock-based compensation expense.
General and Administrative expense was $131.3 million, a decrease of $29.5 million or 18% Y/Y, primarily driven by a decrease in settlement costs, professional service fees (comprising legal, accounting, and consulting fees) and personnel-related expenses.
Research and Development expenses were $60.3 million, a decrease of $19.6 million or 25% Y/Y, primarily driven by a decrease in employee-related and contractor expenses.
In Q2 we recognized $20.0 million of Impairment and Restructuring expenses, of which $16.7 million was non-cash. The non-cash charges were primarily related to asset write-downs in relation to retail showroom exits. The cash charges consisted of $3.3 million of severance and other exit and disposal costs as we continue executing on our restructuring efforts.
Adjusted EBITDA*
Adjusted EBITDA was $58.4 million in the second quarter, which was $28.4 million above the high end of our guidance range and a $140.1 million improvement Y/Y.
Free Cash Flow*, Cash Balance & Net Debt*
We generated $106.0 million of Free Cash Flow in the second quarter, an improvement of $95.3 million Q/Q and $143.2 million Y/Y. This delivered our fourth consecutive quarter of positive Free Cash Flow and Net Cash Provided by Operating Activities. We ended the
5
quarter with $829.0 million in unrestricted Cash and cash equivalents, an increase of $106.6 million Q/Q. We continue to make progress toward deleveraging our balance sheet, as Net Debt* decreased $281.4 million or 30% Y/Y.
* For a reconciliation of all non-GAAP financial measures to their most directly comparable GAAP financial measure, and rationale for why we rely on these measures, see the reconciliation tables below.
Q3 FY25 OUTLOOK
| Q3 FY25 Range | % Change (Midpoint) | ||||||||||||||||||||||||||||||||||
| User Metrics (in millions) | Q3 FY24 | Q2 FY25 | Low | High | Y/Y | Q/Q | |||||||||||||||||||||||||||||
| Ending Paid Connected Fitness Subscriptions | 3.06 | 2.88 | 2.85 | 2.87 | (6)% | (1)% | |||||||||||||||||||||||||||||
| Ending Paid App Subscriptions | 0.67 | 0.58 | 0.56 | 0.58 | (15)% | (1)% | |||||||||||||||||||||||||||||
| Financial Results (dollars in millions) | |||||||||||||||||||||||||||||||||||
| Total Revenue | $717.7 | $673.9 | $605.0 | $625.0 | (14)% | (9)% | |||||||||||||||||||||||||||||
| Total Gross Margin | 43.1% | 47.2% | 50.0% | 50.0% | 690 bps | 280 bps | |||||||||||||||||||||||||||||
| Adjusted EBITDA | $5.8 | $58.4 | $70.0 | $85.0 | 1,230% | 33% | |||||||||||||||||||||||||||||
FY25 OUTLOOK
| FY25 Range | % Change (Midpoint) | ||||||||||||||||||||||
| User Metrics (in millions) | FY24 | Low | High | Y/Y | |||||||||||||||||||
| Ending Paid Connected Fitness Subscriptions | 2.98 | 2.75 | 2.79 | (7)% | |||||||||||||||||||
| Ending Paid App Subscriptions | 0.62 | 0.55 | 0.60 | (7)% | |||||||||||||||||||
| Financial Results (dollars in millions) | |||||||||||||||||||||||
| Total Revenue | $2,700.5 | $2,430.0 | $2,480.0 | (9)% | |||||||||||||||||||
| Total Gross Margin | 44.7% | 50.0% | 50.0% | 530 bps | |||||||||||||||||||
| Adjusted EBITDA | $3.5 | $300.0 | $350.0 | 9,096% | |||||||||||||||||||
6
Following our outperformance in Q2, we are raising the midpoint of our Full Year FY25 guidance across our key financial metrics, including Ending Paid Connected Fitness Subscriptions, Total Revenue, Total Gross Margin, and Adjusted EBITDA. We are prioritizing these metrics along with delivering Free Cash Flow.
We are raising our full year FY25 guidance range for Ending Paid Connected Fitness Subscriptions to 2.75 to 2.79 million, reflecting a narrower range and an increase of 55 thousand at the midpoint. This increase reflects our expectations for lower net churn, due to continued favorability across subscription cancellations, pauses and reactivations, partially offset by our expectations for lower gross additions, due to softer hardware sales and mix shift into Tread products, which have lower new subscription attachment rates than our Bike products. Our guidance for Q3 FY25 Ending Paid Connected Fitness Subscriptions of 2.85 to 2.87 million reflects our expectations for seasonally lower hardware sales trends following the holiday season and for our Average Net Monthly Paid Connected Fitness Subscription Churn Rate to remain relatively in-line with Q2.
Our FY25 guidance range for Ending Paid App Subscriptions of 550 thousand to 600 thousand remains unchanged. Our outlook for Q3 FY25 Ending Paid App Subscriptions is 560 thousand to 580 thousand.
Our FY25 outlook for Total Revenue of $2.43 billion to $2.48 billion reflects a narrower range and an increase of $5 million at the midpoint. This reflects our expectations for favorable Subscription Revenue from higher Paid Connected Fitness Subscriptions and favorable Connected Fitness Products Revenue from higher Tread portfolio sales, partly offset by lower Bike portfolio sales. Q3 Revenue guidance of $605 million to $625 million reflects our expectations for seasonally lower hardware sales compared to Q2.
We are increasing our FY25 outlook for Total Gross Margin to 50.0%, reflecting a 100 bps increase from prior guidance from expected favorability in Connected Fitness Products segment gross margin and higher Subscription segment gross margin, as well as a slight revenue mix shift toward our Subscription segment. Our Q3 Total Gross Margin guidance of 50% reflects an expected sequential increase in gross margin of 280 bps as a result of a seasonal mix-shift toward our Subscription segment in Q3.
We are raising our FY25 Adjusted EBITDA guidance by $60 million to $300 million to $350 million, which reflects our continued improvements in profitability, largely due to expectations for gross margin expansion and continued operating cost savings. Our Q3 Adjusted EBITDA guidance of $70 million to $85 million reflects a sequential increase of $19 million at the midpoint, mainly due to seasonally lower Sales & Marketing expenses following the holiday season.
We are also raising our FY25 Free Cash Flow target to at least $200 million, an increase of $75 million from our previous target. This reflects faster than expected improvements in operating expense reductions, a higher degree of confidence for full year hardware sales performance following the holiday season, and inventory-related net working capital efficiencies. We expect to continue making meaningful progress in deleveraging our balance sheet throughout FY25 and beyond.
* * *
Within the broader Fitness industry, there are many companies that make fitness equipment, dozens of fitness apps, and hundreds of thousands of personal trainers. We believe Peloton is unique because we combine the most durable and beautiful hardware, the most intuitive and innovative software, and expert human coaches, with the world’s most supportive community of Members. It’s this combination that makes Peloton so special, providing us with a strong foundation from which we can continue to innovate and grow, and gives us great optimism about the future.
Winning is about focusing on what matters most: improving outcomes for our Members, meeting them in more places, and deepening the connections between them and Peloton, and with each other. This will take operational excellence and attention to the details that will raise our performance for Members and as a business. It will be hard work, but we are excited about the journey ahead.
Team Peloton
7
Webcast
We will host a call at 8:30 a.m. ET on Thursday, February 6, 2025 to discuss our financial results. A live webcast of the call will be available at https://investor.onepeloton.com/news-and-events/events and a replay will be available on the investor relations page of the Company's website for 30 days.
Safe Harbor Statement
This shareholder letter contains forward-looking statements within the meaning of the Private Securities Litigation Reform Act of 1995. We intend such forward-looking statements to be covered by the safe harbor provisions for forward-looking statements contained in Section 27A of the Securities Act of 1933, as amended and Section 21E of the Securities Exchange Act of 1934, as amended. All statements contained in this shareholder letter other than statements of historical fact, including, without limitation, statements regarding our expected financial results for the third quarter of and full fiscal year 2025; our execution of and timing of and the expected benefits from our restructuring initiatives and cost-saving measures; the cost savings and other efficiencies of expanding relationships with our third-party partners; details regarding and the timing of the launch of new products and services; our new initiatives with retailer partners and our efforts to optimize our retail showroom footprint, the prices of our products and services in the future; our future operating results and financial position, including our ability to achieve and maintain our Free Cash Flow, revenue, gross margin, adjusted EBITDA and subscription targets; our profitability; our business strategy and plans, market growth, and our objectives for future operations, are forward-looking statements. The words “believe,” “may,” “will,” “estimate,” “potential,” “continue,” “anticipate,” “intend,” “expect,” “could,” “would,” “project,” “plan,” “target,” and similar expressions are intended to identify forward-looking statements, though not all forward-looking statements use these words or expressions.
We have based these forward-looking statements on our current expectations and projections about future events and trends that we believe may affect our financial condition, results of operations, business strategy, short-term and long-term business operations and objectives, and financial needs. These forward-looking statements are subject to a number of risks, uncertainties, and assumptions and other important factors that could cause actual results to differ materially from those stated, including, without limitation: our ability to achieve and maintain future profitability and positive free cash flow; our ability to attract and maintain Subscribers; our ability to accurately forecast consumer demand of our products and services and adequately manage our inventory; our ability to execute and achieve the expected benefits of our restructuring initiatives and other cost-saving measures and whether our efforts will result in further actions or additional asset impairment charges that adversely affect our business; our ability to anticipate consumer preferences and successfully develop and offer new products and services in a timely manner, and effectively manage the introduction of new or enhanced products and services; demand for our products and services and growth of the Connected Fitness Products Market; our ability to maintain the value and reputation of the Peloton brand; disruptions or failures of our information technology systems or websites, or those of third parties on whom we rely; our reliance on a limited number of suppliers, contract manufacturers, and logistics partners for our Connected Fitness Products; our lack of control over suppliers, contract manufacturers, and logistics partners for our Connected Fitness Products; our ability to predict our long-term performance and changes to our revenue as our business matures; any declines in sales of our Connected Fitness Products; the effects of increased competition in our markets and our ability to compete effectively; our dependence on third-party licenses for use of music in our content; actual or perceived defects in, or safety of, our products, including any impact of product recalls or legal or regulatory claims, proceedings or investigations involving our products; increases in component costs, long lead times, supply shortages or other supply chain disruptions; accidents, safety incidents or workforce disruptions; seasonality or other fluctuations in our quarterly results; our ability to generate class content; risks related to acquisitions or dispositions and our ability to integrate any such acquired companies into our operations and control environment, including Precor; risks related to expansion into international markets; risks related to payment processing, cybersecurity, or data privacy; risks related to the Peloton App and its ability to work with a range of mobile and streaming technologies, systems, networks, and standards; our ability to effectively price and market our Connected Fitness Products and subscriptions and our limited operating history with which to predict the profitability of our subscription model; any inaccuracies in, or failure to achieve, operational and business metrics or forecasts of market growth; our ability to maintain effective internal control over financial and management systems and remediate material weaknesses, including with respect to Precor; impacts from warranty claims or product returns; our ability to maintain, protect, and enhance our intellectual property; our ability to comply with laws and regulations that currently apply or become applicable to our business both in the United States and internationally; risks related to changes in global trade policies, including our ability to mitigate the effects of tariffs and other non-tariff restrictions, such as taxes, quotas, local content rules, customs detentions and other protectionist measures; our reliance on third parties for computing, storage, processing and similar services and delivery and installation of our products; our ability to attract and retain highly skilled personnel and maintain our culture; risks related to our common stock and indebtedness; and those risks and uncertainties described in the Company’s Annual Report on Form 10-K, Quarterly Reports on Form 10-Q and Current Reports on Form 8-K filed with the Securities and Exchange Commission, as such risks and uncertainties may be updated in our filings with the Securities and Exchange Commission, which are available on the Investor Relations page of our website at https://investor.onepeloton.com/investor-relations and on the SEC website at www.sec.gov.You should not rely upon forward-looking statements as predictions of future events. The events and circumstances reflected in the forward-looking statements may not be achieved or occur. Although we believe that the expectations reflected in the forward-looking statements are reasonable, we cannot guarantee future results, performance, or achievements. Our forward-looking statements speak only as of the date of this shareholder letter, and we undertake no obligation to update any of these forward-looking statements for any reason after the date of this shareholder letter or to conform these statements to actual results or revised expectations, except as required by law.
8
FINANCIAL TABLES
CONDENSED CONSOLIDATED BALANCE SHEETS
(in millions, except share and per share amounts)
| December 31, | June 30, | ||||||||||
| 2024 | 2024 | ||||||||||
| (unaudited) | |||||||||||
| ASSETS | |||||||||||
| Current assets: | |||||||||||
| Cash and cash equivalents | $ | 829.0 | $ | 697.6 | |||||||
| Accounts receivable, net | 96.8 | 103.6 | |||||||||
| Inventories, net | 257.8 | 329.7 | |||||||||
| Prepaid expenses and other current assets | 123.9 | 135.1 | |||||||||
| Total current assets | 1,307.5 | 1,266.0 | |||||||||
| Property and equipment, net | 294.7 | 353.7 | |||||||||
| Intangible assets, net | 10.0 | 15.0 | |||||||||
| Goodwill | 41.2 | 41.2 | |||||||||
| Restricted cash | 47.9 | 53.2 | |||||||||
| Operating lease right-of-use assets, net | 387.2 | 435.0 | |||||||||
| Other assets | 21.1 | 21.0 | |||||||||
| Total assets | $ | 2,109.8 | $ | 2,185.2 | |||||||
| LIABILITIES AND STOCKHOLDERS’ DEFICIT | |||||||||||
| Current liabilities: | |||||||||||
| Accounts payable and accrued expenses | $ | 390.6 | $ | 432.3 | |||||||
| Deferred revenue and customer deposits | 159.7 | 163.7 | |||||||||
| Current portion of long-term debt | 10.0 | 10.0 | |||||||||
| Operating lease liabilities, current | 70.1 | 75.3 | |||||||||
| Other current liabilities | 4.4 | 3.9 | |||||||||
| Total current liabilities | 634.7 | 685.2 | |||||||||
| Convertible senior notes, net | 541.0 | 540.0 | |||||||||
| Term loan, net | 948.3 | 950.1 | |||||||||
| Operating lease liabilities, non-current | 457.1 | 503.3 | |||||||||
| Other non-current liabilities | 25.8 | 25.7 | |||||||||
| Total liabilities | 2,607.0 | 2,704.3 | |||||||||
| Commitments and contingencies (Note 8) | |||||||||||
| Stockholders’ deficit | |||||||||||
| Common stock, $0.000025 par value; 2,500,000,000 and 2,500,000,000 shares of Class A common stock authorized, 373,793,790 and 358,120,105 shares of Class A common stock issued and outstanding as of December 31, 2024 and June 30, 2024, respectively; 2,500,000,000 and 2,500,000,000 shares of Class B common stock authorized, 16,065,806 and 18,141,608 shares of Class B common stock issued and outstanding as of December 31, 2024 and June 30, 2024, respectively. | — | — | |||||||||
| Additional paid-in capital | 5,060.3 | 4,948.6 | |||||||||
| Accumulated other comprehensive income | 19.0 | 15.9 | |||||||||
| Accumulated deficit | (5,576.5) | (5,483.7) | |||||||||
| Total stockholders’ deficit | (497.2) | (519.1) | |||||||||
| Total liabilities and stockholders' deficit | $ | 2,109.8 | $ | 2,185.2 | |||||||
9
CONDENSED CONSOLIDATED STATEMENTS OF OPERATIONS AND COMPREHENSIVE LOSS
(unaudited)
(in millions, except share and per share amounts)
| Three Months Ended December 31, | Six Months Ended December 31, | ||||||||||||||||||||||
| 2024 | 2023 | 2024 | 2023 | ||||||||||||||||||||
| Revenue: | |||||||||||||||||||||||
| Connected Fitness Products | $ | 253.4 | $ | 319.1 | $ | 413.0 | $ | 499.7 | |||||||||||||||
| Subscription | 420.6 | 424.5 | 846.9 | 839.5 | |||||||||||||||||||
| Total revenue | 673.9 | 743.6 | 1,259.9 | 1,339.2 | |||||||||||||||||||
| Cost of revenue: | |||||||||||||||||||||||
| Connected Fitness Products | 220.6 | 305.3 | 365.5 | 480.2 | |||||||||||||||||||
| Subscription | 135.0 | 139.0 | 272.2 | 274.2 | |||||||||||||||||||
| Total cost of revenue | 355.6 | 444.2 | 637.8 | 754.4 | |||||||||||||||||||
| Gross profit | 318.4 | 299.4 | 622.1 | 584.8 | |||||||||||||||||||
| Operating expenses: | |||||||||||||||||||||||
| Sales and marketing | 152.7 | 230.3 | 234.6 | 376.4 | |||||||||||||||||||
| General and administrative | 131.3 | 160.8 | 250.8 | 311.8 | |||||||||||||||||||
| Research and development | 60.3 | 79.9 | 118.8 | 158.6 | |||||||||||||||||||
| Impairment expense | 16.7 | 3.6 | 21.6 | 27.7 | |||||||||||||||||||
| Restructuring expense | 3.3 | 13.4 | 6.2 | 31.2 | |||||||||||||||||||
| Supplier settlements | — | (1.5) | 23.5 | (1.5) | |||||||||||||||||||
| Total operating expenses | 364.3 | 486.5 | 655.5 | 904.2 | |||||||||||||||||||
| Loss from operations | (45.9) | (187.1) | (33.4) | (319.4) | |||||||||||||||||||
| Other expense, net: | |||||||||||||||||||||||
| Interest expense | (34.6) | (27.7) | (70.0) | (54.9) | |||||||||||||||||||
| Interest income | 7.7 | 8.4 | 15.8 | 16.9 | |||||||||||||||||||
| Foreign exchange (loss) gain | (18.5) | 9.6 | (3.7) | 1.9 | |||||||||||||||||||
| Other income, net | 0.2 | 0.1 | 0.1 | 0.4 | |||||||||||||||||||
| Total other expense, net | (45.3) | (9.5) | (57.8) | (35.7) | |||||||||||||||||||
| Loss before provision for income taxes | (91.2) | (196.6) | (91.3) | (355.1) | |||||||||||||||||||
| Income tax expense (benefit) | 0.7 | (1.7) | 1.6 | (1.0) | |||||||||||||||||||
| Net loss | $ | (92.0) | $ | (194.9) | $ | (92.8) | $ | (354.1) | |||||||||||||||
| Net loss attributable to Class A and Class B common stockholders | $ | (92.0) | $ | (194.9) | $ | (92.8) | $ | (354.1) | |||||||||||||||
| Net loss per share attributable to common stockholders, basic and diluted | $ | (0.24) | $ | (0.54) | $ | (0.24) | $ | (0.98) | |||||||||||||||
| Weighted-average of shares of Class A and Class B common stock outstanding, basic and diluted | 385,591,039 | 362,334,326 | 382,059,323 | 360,440,945 | |||||||||||||||||||
| Other comprehensive income: | |||||||||||||||||||||||
| Change in foreign currency translation adjustment | 13.0 | 0.8 | 3.1 | 2.7 | |||||||||||||||||||
| Total other comprehensive income | 13.0 | 0.8 | 3.1 | 2.7 | |||||||||||||||||||
| Comprehensive loss | $ | (79.0) | $ | (194.1) | $ | (89.8) | $ | (351.5) | |||||||||||||||
10
CONDENSED CONSOLIDATED STATEMENTS OF CASH FLOWS
(unaudited)
(in millions)
| Six Months Ended December 31, | |||||||||||
| 2024 | 2023 | ||||||||||
| Cash Flows from Operating Activities: | |||||||||||
| Net loss | $ | (92.8) | $ | (354.1) | |||||||
| Adjustments to reconcile net loss to net cash used in operating activities: | |||||||||||
| Depreciation and amortization expense | 47.6 | 55.9 | |||||||||
| Stock-based compensation expense | 108.7 | 140.8 | |||||||||
| Non-cash operating lease expense | 28.6 | 33.7 | |||||||||
| Amortization of debt discount and issuance costs | 4.4 | 7.0 | |||||||||
| Impairment expense | 21.6 | 27.7 | |||||||||
| Loss on sale of subsidiary | — | 3.8 | |||||||||
| Foreign exchange loss (gain) | 3.7 | (1.9) | |||||||||
| Changes in operating assets and liabilities: | |||||||||||
| Accounts receivable | 6.7 | (44.0) | |||||||||
| Inventories | 78.8 | 80.1 | |||||||||
| Prepaid expenses and other current assets | 14.5 | (21.1) | |||||||||
| Other assets | (0.1) | (1.2) | |||||||||
| Accounts payable and accrued expenses | (56.4) | 8.6 | |||||||||
| Deferred revenue and customer deposits | (4.0) | 1.9 | |||||||||
| Operating lease liabilities, net | (42.2) | (44.5) | |||||||||
| Other liabilities | 0.1 | (3.0) | |||||||||
| Net cash provided by (used in) operating activities | 119.2 | (110.4) | |||||||||
| Cash Flows from Investing Activities: | |||||||||||
| Capital expenditures | (2.5) | (10.0) | |||||||||
| Proceeds from sale of subsidiary and net assets | — | 14.6 | |||||||||
| Proceeds from sale of Peloton Output Park | 4.2 | — | |||||||||
| Net cash provided by investing activities | 1.7 | 4.6 | |||||||||
| Cash Flows from Financing Activities: | |||||||||||
| Principal repayment of Term Loan | (5.0) | (3.8) | |||||||||
| Proceeds, net from employee stock purchase plan withholdings | 1.9 | 1.9 | |||||||||
| Proceeds from employee stock plans | 7.1 | 19.1 | |||||||||
| Principal repayments of finance leases | — | (0.5) | |||||||||
| Net cash provided by financing activities | 4.0 | 16.8 | |||||||||
| Effect of exchange rate changes | 1.2 | 1.7 | |||||||||
| Net change in cash, cash equivalents, and restricted cash | 126.1 | (87.3) | |||||||||
| Cash, cash equivalents, and restricted cash — Beginning of period | 750.9 | 885.5 | |||||||||
| Cash, cash equivalents, and restricted cash — End of period | $ | 876.9 | $ | 798.1 | |||||||
| Supplemental Disclosures of Cash Flow Information: | |||||||||||
| Cash paid for interest | $ | 76.1 | $ | 47.8 | |||||||
| Cash paid for income taxes | $ | 3.1 | $ | 1.9 | |||||||
| Supplemental Disclosures of Non-Cash Investing and Financing Information: | |||||||||||
| Accrued and unpaid capital expenditures, including software | $ | 0.2 | $ | 2.2 | |||||||
11
NON-GAAP FINANCIAL MEASURES
In addition to our results determined in accordance with accounting principles generally accepted in the United States, or GAAP, we believe the following non-GAAP financial measures are useful in evaluating our operating performance. These non-GAAP financial measures have limitations as analytical tools in that they do not reflect all of the amounts associated with our results of operations as determined in accordance with GAAP. Because of these limitations, Adjusted EBITDA, Subscription Contribution, Subscription Contribution Margin, Free Cash Flow, and Net Debt should be considered along with other operating and financial performance measures presented in accordance with GAAP.
The presentation of these non-GAAP financial measures is not intended to be considered in isolation or as a substitute for, or superior to, financial information prepared and presented in accordance with GAAP. Investors are encouraged to review the reconciliation of these non-GAAP financial measures to their most directly comparable GAAP financial measures. A reconciliation of the non-GAAP financial measures to such GAAP measures can be found below.
A reconciliation of the Company’s Adjusted EBITDA and Free Cash Flow guidance to the most directly comparable GAAP financial measures cannot be provided without unreasonable efforts and is not provided herein because of the inherent difficulty in forecasting and quantifying certain amounts that are necessary for such reconciliations, including net income (loss) and adjustments that are made for other expense (income), net, income tax expense (benefit), depreciation and amortization expense, stock-based compensation expense, restructuring expense, impairment expense, supplier settlements, product recall related matters, litigation and settlement expenses, transaction and integration costs, and other adjustments reflected in our reconciliation of historical Adjusted EBITDA, the amounts of which could be material.
Adjusted EBITDA
We calculate Adjusted EBITDA as net (loss) income adjusted to exclude: other expense (income), net; income tax expense; depreciation and amortization expense; stock-based compensation expense; impairment expense; product recall related matters; certain litigation and settlement expenses; transaction and integration costs; reorganization, severance, exit, disposal and other costs associated with restructuring plans; supplier settlements; and other adjustment items that arise outside the ordinary course of our business.
We use Adjusted EBITDA as a measure of operating performance and the operating leverage in our business. We believe that this non-GAAP financial measure is useful to investors for period-to-period comparisons of our business and in understanding and evaluating our operating results for the following reasons:
•Adjusted EBITDA is widely used by investors and securities analysts to measure a company’s operating performance without regard to items such as stock-based compensation expense, depreciation and amortization expense, other expense (income), net, and provision for income taxes that can vary substantially from company to company depending upon their financing, capital structures, and the method by which assets were acquired;
•Our management uses Adjusted EBITDA in conjunction with financial measures prepared in accordance with GAAP for planning purposes, including the preparation of our annual operating budget, as a measure of our core operating results and the effectiveness of our business strategy, and in evaluating our financial performance; and
•Adjusted EBITDA provides consistency and comparability with our past financial performance, facilitates period-to-period comparisons of our core operating results, and may also facilitate comparisons with other peer companies, many of which use a similar non-GAAP financial measure to supplement their GAAP results.
Our use of Adjusted EBITDA has limitations as an analytical tool, and you should not consider this measure in isolation or as a substitute for analysis of our financial results as reported under GAAP. Some of these limitations are, or may in the future be, as follows:
•Although depreciation and amortization expense are non-cash charges, the assets being depreciated and amortized may have to be replaced in the future, and Adjusted EBITDA does not reflect cash capital expenditure requirements for such replacements or for new capital expenditure requirements;
•Adjusted EBITDA excludes stock-based compensation expense, which has recently been, and will continue to be for the foreseeable future, a significant recurring expense for our business and an important part of our compensation strategy;
•Adjusted EBITDA does not reflect: (1) changes in, or cash requirements for, our working capital needs; (2) interest expense, or the cash requirements necessary to service interest or principal payments on our debt, which reduces cash available to us; or (3) tax payments that may represent a reduction in cash available to us;
•Adjusted EBITDA does not reflect gains (losses) associated with refinancing efforts that we have determined are outside of the ordinary course of business and are nonrecurring, infrequent or unusual based on factors such as the nature and strategy of the refinancing, as well as our frequency and past practice of performing refinancing activities.
•Adjusted EBITDA does not reflect certain litigation expenses, consisting of legal settlements and related fees for specific proceedings that we have determined arise outside of the ordinary course of business and are nonrecurring, infrequent or unusual based on the following considerations which we assess regularly: (1) the frequency of similar cases that have been brought to date, or are expected to be brought within two years; (2) the complexity of the case; (3) the nature of the remedy(ies) sought, including the size of any monetary damages sought; (4) offensive versus defensive posture of us; (5) the counterparty involved; and (6) our overall litigation strategy. Following a change in practice beginning during the fiscal year
12
ended June 30, 2022, we no longer adjust adjusted EBITDA for costs from new patent litigation or consumer arbitration claims, unless we consider the matter to be nonrecurring, infrequent or unusual. We continue to adjust adjusted EBITDA for historical patent infringement and consumer arbitration claims that were determined, prior to our change in practice, to be nonrecurring, infrequent, or unusual;
•Adjusted EBITDA does not reflect transaction and integration costs related to acquisitions;
•Adjusted EBITDA does not reflect impairment charges for goodwill and fixed assets, and gains (losses) on disposals for fixed assets;
•Adjusted EBITDA does not reflect the impact of purchase accounting adjustments to inventory related to the Precor acquisition;
•Adjusted EBITDA does not reflect costs associated with certain product recall related matters including adjustments to the return reserves, inventory write-downs, logistics costs associated with Member requests, the cost to move the recalled product for those that elect the option, subscription waiver costs of service, and recall-related hardware development and repair costs. We make adjustments for product recall related matters that we have determined arise outside of the ordinary course of business and are nonrecurring, infrequent or unusual based on factors including the nature of the product recall, our experience with similar product recalls at the time of such assessment, the impacts on us of the recall remedy and associated logistics, supply chain, and other externalities, as well as the expected consumer demand for such a remedy, and operational complexities in the design, regulatory approval and deployment of a remedy;
•Adjusted EBITDA does not reflect reorganization, severance, exit, disposal, and other costs associated with restructuring plans;
•Adjusted EBITDA does not reflect nonrecurring supplier settlements that are outside of the ordinary course of business and are nonrecurring, infrequent or unusual based on factors such as the nature of the settlements, as well as our frequency and past practice of performing refinancing activities; and
•The expenses and other items that we exclude in our calculation of Adjusted EBITDA may differ from the expenses and other items, if any, that other companies may exclude from Adjusted EBITDA when they report their operating results and we may, in the future, exclude other significant, unusual expenses or other items from this financial measure. Because companies in our industry may calculate this measure differently than we do, its usefulness as a comparative measure can be limited.
Because of these limitations, Adjusted EBITDA should be considered along with other operating and financial performance measures presented in accordance with GAAP.
The following table presents a reconciliation of Adjusted EBITDA to Net loss, the most directly comparable financial measure prepared in accordance with GAAP, for each of the periods indicated:
Adjusted EBITDA
| Three Months Ended December 31, | Three Months Ended September 30, | Three Months and Fiscal Year Ended | Three Months Ended March 31, | ||||||||||||||||||||||||||||||||||||||||||||
| 2024 | 2023 | 2024 | June 30, 2024 | 2024 | |||||||||||||||||||||||||||||||||||||||||||
| (in millions) | |||||||||||||||||||||||||||||||||||||||||||||||
| Net loss | $ | (92.0) | $ | (194.9) | $ | (0.9) | $ | (30.5) | $ | (551.9) | $ | (167.3) | |||||||||||||||||||||||||||||||||||
| Adjusted to exclude the following: | |||||||||||||||||||||||||||||||||||||||||||||||
| Total other expense, net | 45.3 | 9.5 | 12.6 | 20.7 | 76.8 | 20.4 | |||||||||||||||||||||||||||||||||||||||||
| Net gain on debt refinancing | — | — | — | (53.6) | (53.6) | — | |||||||||||||||||||||||||||||||||||||||||
| Income tax expense (benefit) | 0.7 | (1.7) | 0.8 | 0.1 | (0.2) | 0.6 | |||||||||||||||||||||||||||||||||||||||||
| Depreciation and amortization expense | 22.8 | 25.1 | 24.8 | 25.8 | 108.8 | 27.1 | |||||||||||||||||||||||||||||||||||||||||
| Stock-based compensation expense | 61.5 | 66.6 | 47.2 | 105.4 | 305.2 | 66.1 | |||||||||||||||||||||||||||||||||||||||||
| Impairment expense | 16.7 | 3.6 | 4.9 | 10.6 | 57.3 | 19.0 | |||||||||||||||||||||||||||||||||||||||||
| Restructuring expense | 3.3 | 13.9 | 2.9 | (2.8) | 67.1 | 37.6 | |||||||||||||||||||||||||||||||||||||||||
| Supplier settlements | — | (1.5) | 23.5 | (0.3) | (2.6) | (0.9) | |||||||||||||||||||||||||||||||||||||||||
| Product recall related matters | — | (6.5) | — | (5.8) | (14.0) | — | |||||||||||||||||||||||||||||||||||||||||
| Litigation and settlement expenses | — | 4.2 | — | 0.6 | 10.8 | 3.1 | |||||||||||||||||||||||||||||||||||||||||
| Adjusted EBITDA | $ | 58.4 | $ | (81.7) | $ | 115.8 | $ | 70.3 | $ | 3.5 | $ | 5.8 | |||||||||||||||||||||||||||||||||||
13
Subscription Contribution and Subscription Contribution Margin
We define “Subscription Contribution” as Subscription Revenue less Subscription Cost of revenue, adjusted to exclude from Subscription Cost of revenue, depreciation and amortization expense, and stock-based compensation expense. Subscription Contribution Margin is calculated by dividing Subscription Contribution by Subscription Revenue.
We use Subscription Contribution and Subscription Contribution Margin to measure our ability to scale and leverage the costs of our Connected Fitness Subscriptions. We believe that these non-GAAP financial measures are useful to investors for period-to-period comparisons of our business and in understanding and evaluating our operating results because our management uses Subscription Contribution and Subscription Contribution Margin in conjunction with financial measures prepared in accordance with GAAP for planning purposes, including the preparation of our annual operating budget, as a measure of our core operating results and the effectiveness of our business strategy, and in evaluating our financial performance.
The use of Subscription Contribution and Subscription Contribution Margin as analytical tools has limitations, and you should not consider these in isolation or as substitutes for analysis of our financial results as reported under GAAP. Some of these limitations are as follows:
•Although depreciation and amortization expense are non-cash charges, the assets being depreciated and amortized may have to be replaced in the future, and Subscription Contribution and Subscription Contribution Margin do not reflect cash capital expenditure requirements for such replacements or for new capital expenditure requirements; and
•Subscription Contribution and Subscription Contribution Margin exclude stock-based compensation expense, which has recently been, and will continue to be for the foreseeable future, a significant recurring expense for our business and an important part of our compensation strategy.
Because of these limitations, Subscription Contribution and Subscription Contribution Margin should be considered along with other operating and financial performance measures presented in accordance with GAAP.
The following table presents a reconciliation of Subscription Contribution and Subscription Contribution Margin to Subscription Gross Profit and Subscription Gross Margin, respectively, which are the most directly comparable financial measures prepared in accordance with GAAP, for each of the periods indicated:
| Three Months Ended December 31, | Three Months Ended September 30, | ||||||||||||||||
| 2024 | 2023 | 2024 | |||||||||||||||
| (dollars in millions) | |||||||||||||||||
| Subscription Revenue | $ | 420.6 | $ | 424.5 | $ | 426.3 | |||||||||||
| Less: Subscription Cost of revenue | 135.0 | 139.0 | 137.2 | ||||||||||||||
| Subscription Gross Profit | $ | 285.6 | $ | 285.6 | $ | 289.1 | |||||||||||
| Subscription Gross Margin | 67.9 | % | 67.3 | % | 67.8 | % | |||||||||||
| Add back: | |||||||||||||||||
| Depreciation and amortization expense | $ | 7.5 | $ | 8.7 | $ | 7.9 | |||||||||||
| Stock-based compensation expense | 10.3 | 10.0 | 8.7 | ||||||||||||||
| Subscription Contribution | $ | 303.4 | $ | 304.3 | $ | 305.7 | |||||||||||
| Subscription Contribution Margin | 72.1 | % | 71.7 | % | 71.7 | % | |||||||||||
We believe continued growth of our Connected Fitness Subscription base will allow us to improve our Subscription Contribution Margin. While there are variable costs, including music royalties, associated with our Connected Fitness Subscriptions, a significant portion of our content creation costs are fixed given that we operate with a limited number of production studios and Instructors. We expect the fixed nature of those expenses to scale over time as we grow our Connected Fitness Subscription base.
Free Cash Flow
We define Free Cash Flow as Net cash provided by (used in) operating activities less capital expenditures. Free Cash Flow reflects an additional way of viewing our liquidity that, we believe, when viewed with our GAAP results, provides management, investors, and other users of our financial information with a more complete understanding of factors and trends affecting our cash flows.
The use of Free Cash Flow as an analytical tool has limitations due to the fact that it does not represent the residual cash flow available for discretionary expenditures. For example, Free Cash Flow does not incorporate payments made for purchases of marketable securities, business combinations and asset acquisitions. Because of these limitations, Free Cash Flow should be considered along with other operating and financial performance measures presented in accordance with GAAP.
14
The following table presents a reconciliation of Free Cash Flow to Net cash provided by (used in) operating activities, the most directly comparable financial measure prepared in accordance with GAAP, for each of the periods indicated:
| Three Months Ended December 31, | Three Months Ended September 30, | Three Months Ended June 30, | Three Months Ended March 31, | ||||||||||||||||||||||||||
| 2024 | 2023 | 2024 | 2024 | 2024 | |||||||||||||||||||||||||
| (in millions) | |||||||||||||||||||||||||||||
| Net cash provided by (used in) operating activities | $ | 106.7 | $ | (31.2) | $ | 12.5 | $ | 32.7 | $ | 11.6 | |||||||||||||||||||
| Capital expenditures | (0.7) | (6.0) | (1.8) | (6.7) | (3.0) | ||||||||||||||||||||||||
| Free Cash Flow | $ | 106.0 | $ | (37.2) | $ | 10.7 | $ | 26.0 | $ | 8.6 | |||||||||||||||||||
Net Debt
We define Net Debt as Total debt less Cash and cash equivalents. Total debt consists of Current portion of long-term debt, Convertible senior notes, net, and Term loan, net. Net debt reflects an additional way of viewing our liquidity that, we believe, when viewed with our GAAP results, provides management, investors, and other users of our financial information with a more complete understanding of factors and trends affecting our capital structure and balance sheet leverage.
Net debt has limitations as an analytical tool and may vary from similarly titled measures used by other companies. Because of this, Net debt should not be considered in isolation or as a substitute for an analysis of our financial measures prepared and presented in accordance with GAAP.
The following table presents a reconciliation of Net Debt to Total Debt, the most comparable financial measure prepared in accordance with GAAP, for each of the periods indicated:
| December 31, 2024 | September 30, 2024 | June 30, 2024 | March 31, 2024 | December 31, 2023 | |||||||||||||||||||||||||
| (in millions) | |||||||||||||||||||||||||||||
| Current portion of long-term debt | $ | 10.0 | $ | 10.0 | $ | 10.0 | $ | 7.5 | $ | 7.5 | |||||||||||||||||||
| Convertible senior notes, net | 541.0 | 540.5 | 540.0 | 991.4 | 990.3 | ||||||||||||||||||||||||
| Term loan, net | 948.3 | 949.1 | 950.1 | 692.1 | 691.6 | ||||||||||||||||||||||||
| Total debt | 1,499.3 | 1,499.6 | 1,500.0 | 1,691.0 | 1,689.4 | ||||||||||||||||||||||||
| Less: Cash and cash equivalents | 829.0 | 722.3 | 697.6 | 794.5 | 737.7 | ||||||||||||||||||||||||
| Net Debt | $ | 670.3 | $ | 777.3 | $ | 802.4 | $ | 896.5 | $ | 951.7 | |||||||||||||||||||
15