SECURITIES AND EXCHANGE COMMISSION
Washington, D.C. 20549
FORM 6-K
REPORT OF FOREIGN PRIVATE ISSUER
Pursuant to Rule 13a-16 or 15d-16
under the Securities Exchange Act of 1934
For the Month of August, 2018
Commission File Number: 001-37668
FERROGLOBE PLC
(Name of Registrant)
2nd Floor West Wing, Lansdowne House
57 Berkeley Square
London, W1J 6ER
(Address of Principal Executive Office)
Indicate by check mark whether the registrant files or will file annual reports under cover of Form 20-F or Form 40-F.
Form 20-F ☒ | Form 40-F ☐ |
Indicate by check mark if the registrant is submitting the Form 6-K in paper as permitted by Regulation S-T Rule 101(b)(1): ☐
Indicate by check mark if the registrant is submitting the Form 6-K in paper as permitted by Regulation S-T Rule 101(b)(7): ☐
Indicate by check mark whether the registrant by furnishing the information contained in this Form is also thereby furnishing the information to the Commission pursuant to Rule 12g3-2(b) under the Securities Exchange Act of 1934.
Yes ☐ | No ☒ |
If "Yes" is marked, indicate below the file number assigned to the registrant in connection with Rule 12g3-2(b): N/A
This Form 6-K consists of the following materials, which appear immediately following this page
• Press release dated August 21, 2018 announcing results for the quarter ended June 30, 2018
• Second quarter earnings call presentation

Ferroglobe Reports Results for Second Quarter of 2018
Sales of $583 Million; Net Profit of $66 Million, Adjusted EBITDA of $86 Million
| o | Sales of $583.0 million, an increase of 4.0% from $560.7 million in Q1 2018 |
| o | Net profit of $66.0 million, or $0.39 on a fully diluted per share basis, a 85.4% increase from a net profit of $35.6 million, or $0.21 per share, in the prior quarter. Adjusted net profit of $25.7 million, or $0.14 on a fully diluted per share basis, a 22.9% decrease compared to adjusted net profit of $33.3 million, or $0.19 on a fully diluted per share basis, in the prior quarter |
| o | Reported EBITDA of $130.9 million, an increase of 40.0% compared to reported EBITDA of $93.5 million in Q1 2018 |
| o | Adjusted EBITDA of $86.3 million, a decrease of 3.7% compared to $89.6 million adjusted EBITDA in Q1 2018. |
LONDON, August 21, 2018 – Ferroglobe PLC (NASDAQ: GSM) ("Ferroglobe" or the "Company"), the world's leading producer of silicon metal, and a leading silicon-and manganese-based specialty alloys producer, today announced results for the second quarter of 2018.
In Q2 2018, Ferroglobe posted a net profit of $66.0 million, or $0.39 per share on a fully diluted basis. On an adjusted basis, Q2 2018 net profit was $25.7 million, or $0.14 per share on a fully diluted basis.
Q2 2018 reported EBITDA was $130.9 million, up from $93.5 million in the prior quarter. On an adjusted basis, Q2 2018 EBITDA was $86.3 million, down 3.7% from Q1 2018 adjusted EBITDA of $89.6 million. The Company reported adjusted EBITDA margin of 14.8% for Q2 2018, compared to adjusted EBITDA margin of 16.0% for Q1 2018. Year-to-date (H1 2018) adjusted EBITDA was $175.9 million, up 135% from the same period in 2017.
The differences between reported and adjusted figures derive from the bargain purchase gain that has been recorded as a result of the Company's acquisition of manganese alloys plants at Mo I Rana, Norway and Dunkirk, France.
During the second quarter, cash flow used for operations was $4.6 million, with working capital increasing by $70.0 million during the period. As a consequence, net debt was $475.3 million as of June 30, 2018, up from $449.3 million as of March 31, 2018.
Sales in Q2 2018 totaled $583.0 million, up 4.0% from $560.7 million in Q1 2018. During Q2 2018, the average selling prices for:
| · | Silicon metal increased by 0.4% to $2,773/MT in Q2 2018, as compared to $2,762/MT in Q1 2018; |
| · | Silicon-based alloys decreased by 2.4% to $1,908/MT in Q2 2018, as compared to $1,956/MT in Q1 2018; and |
| · | Manganese-based alloys decreased by 5.2% to $1,304/MT in Q2 2018, as compared to $1,375/MT in Q1 2018. |
While sales volumes of:
| · | Silicon metal experienced a 6.2% decrease quarter-over-quarter, |
| · | Silicon-based alloys experienced a 2.5% increase quarter-over-quarter, and |
| · | Manganese-based alloys experienced a 51.0% increase quarter-over-quarter. |
| Quarter Ended | Quarter Ended | Quarter Ended | Six Months Ended | Six Months Ended | |||||||||||
| June 30, 2018 | March 31, 2018 | June 30, 2017 | June 30, 2018 | June 30, 2017 | |||||||||||
| Shipments in metric tons: | |||||||||||||||
| Silicon Metal | 85,913 | 91,615 | 82,881 | 177,528 | 158,634 | ||||||||||
| Silicon-based Alloys | 78,214 | 76,328 | 70,913 | 154,542 | 146,299 | ||||||||||
| Manganese-based Alloys | 107,457 | 71,176 | 64,403 | 178,633 | 128,103 | ||||||||||
| Total shipments* | 271,584 | 239,119 | 218,197 | 510,703 | 433,036 | ||||||||||
| Quarter Ended | Quarter Ended | Quarter Ended | Six Months Ended | Six Months Ended | |||||||||||
| June 30, 2018 | March 31, 2018 | June 30, 2017 | June 30, 2018 | June 30, 2017 | |||||||||||
| Average selling price ($/MT): | |||||||||||||||
| Silicon Metal | $ | 2,773 | $ | 2,762 | $ | 2,210 | $ | 2,767 | $ | 2,148 | |||||
| Silicon-based Alloys | $ | 1,908 | $ | 1,956 | $ | 1,586 | $ | 1,932 | $ | 1,528 | |||||
| Manganese-based Alloys | $ | 1,304 | $ | 1,375 | $ | 1,308 | $ | 1,332 | $ | 1,303 | |||||
| Total* | $ | 1,943 | $ | 2,092 | $ | 1,741 | $ | 2,013 | $ | 1,688 | |||||
| Quarter Ended | Quarter Ended | Quarter Ended | Six Months Ended | Six Months Ended | |||||||||||
| June 30, 2018 | March 31, 2018 | June 30, 2017 | June 30, 2018 | June 30, 2017 | |||||||||||
| Average selling price ($/lb.): | |||||||||||||||
| Silicon Metal | $ | 1.26 | $ | 1.25 | $ | 1.00 | $ | 1.26 | $ | 0.97 | |||||
| Silicon-based Alloys | $ | 0.87 | $ | 0.89 | $ | 0.72 | $ | 0.88 | $ | 0.69 | |||||
| Manganese-based Alloys | $ | 0.59 | $ | 0.62 | $ | 0.59 | $ | 0.60 | $ | 0.59 | |||||
| Total* | $ | 0.88 | $ | 0.95 | $ | 0.79 | $ | 0.91 | $ | 0.77 | |||||

* Excludes by-products and other
"This was a solid quarter for Ferroglobe, culminating a first half of the year which confirms the improved fundamentals of our business and validates the positive momentum in the markets we are serving," said Pedro Larrea, CEO of Ferroglobe. "In the year to date we have significantly increased volumes and selling prices and our EBITDA has more than doubled compared with the same period last year. The steel industries in North America and Europe - the main end markets for most of our alloys - are experiencing strong demand and high capacity utilizations in the wake of recent trade protection measures. Prices of our products have remained broadly stable overall, and current supply/demand dynamics in our industry should support continued healthy pricing."
Cash flow generation impacted by acquisition related working capital
During the second quarter, cash flows used for operations was $4.6 million, the main driver being a working capital increase of $70.0 million during Q2 2018. Approximately half of that increase is from the recently acquired manganese-alloy plants that have built their operating working capital, with a further increase from seasonally high raw materials and finished products inventories in the rest of our operations.
Ferroglobe's net debt was $475.3 million as of June 30, 2018, up from $449.3 million as of March 31, 2018. The increase in net debt is mainly due to the $70 million working capital increase noted above. Excluding the acquisition impact of the manganese-alloy plants, net debt has decreased by $1.6 million as compared with December 31, 2017.
"We continue to be focused on cash generation and deleveraging the balance sheet," said Phillip Murnane, Ferroglobe's CFO. "Although the first half of the year has required meaningful cash investment in working capital for the new manganese assets, we have a rigorous cash generation initiative in place that will provide significant cash flow release in the second half of the year."
The Company has declared an interim dividend
Ferroglobe's Board of Directors has declared an interim dividend of $0.06 per share, further reflecting its confidence in the underlying strength of Ferroglobe's business and long-term outlook. The dividend will have a record date of September 5, 2018 and a payment date of September 20, 2018.
Adjusted EBITDA:
| Quarter Ended | Quarter Ended | Quarter Ended | Six Months Ended | Six Months Ended | |||||||||||
| June 30, 2018 | March 31, 2018 | June 30, 2017 | June 30, 2018 | June 30, 2017 | |||||||||||
| Profit (loss) attributable to the parent | $ | 67,438 | $ | 36,680 | $ | 2,859 | $ | 104,118 | $ | (3,695) | |||||
| Loss attributable to non-controlling interest | (1,408) | (1,066) | (1,859) | (2,474) | (3,420) | ||||||||||
| Income tax expense (benefit) | 14,302 | 15,668 | (1,949) | 29,970 | (3,163) | ||||||||||
| Net finance expense | 14,412 | 13,156 | 14,547 | 27,568 | 27,517 | ||||||||||
| Financial derivatives (gain) loss | (2,832) | 1,765 | 4,071 | (1,067) | 4,071 | ||||||||||
| Exchange differences | 8,708 | (729) | (7,263) | 7,979 | (7,243) | ||||||||||
| Depreciation and amortization charges, operating allowances and write-downs | 30,309 | 28,016 | 26,401 | 58,325 | 53,623 | ||||||||||
| EBITDA | 130,929 | 93,490 | 36,807 | 224,419 | 67,690 | ||||||||||
| Non-controlling interest settlement | — | — | 1,751 | — | 1,751 | ||||||||||
| Power credit | — | — | (3,696) | — | (3,696) | ||||||||||
| Long lived asset charge due to reclassification of discontinued operations to continuing operations | — | — | 2,608 | — | 2,608 | ||||||||||
| Accrual of contingent liabilities | — | — | 6,400 | — | 6,400 | ||||||||||
| Bargain purchase gain | (44,633) | — | — | (44,633) | — | ||||||||||
| Share-based compensation | — | (3,886) | — | (3,886) | — | ||||||||||
| Adjusted EBITDA | $ | 86,296 | $ | 89,604 | $ | 43,870 | $ | 175,900 | $ | 74,753 | |||||
Adjusted profit attributable to Ferroglobe:
| Quarter Ended | Quarter Ended | Quarter Ended | Six Months Ended | Six Months Ended | |||||||||||
| June 30, 2018 | March 31, 2018 | June 30, 2017 | June 30, 2018 | June 30, 2017 | |||||||||||
| Profit (loss) attributable to the parent | $ | 67,438 | $ | 36,680 | $ | 2,859 | 104,118 | $ | (3,695) | ||||||
| Tax rate adjustment | (11,404) | (742) | (1,645) | (12,146) | 126 | ||||||||||
| Non-controlling interest settlement | — | — | 1,191 | — | 1,191 | ||||||||||
| Power credit | — | — | (2,513) | — | (2,513) | ||||||||||
| Long lived asset charge due to reclassification of discontinued operations to continuing operations | — | — | 1,773 | — | 1,773 | ||||||||||
| Accrual of contingent liabilities | — | — | 4,352 | — | 4,352 | ||||||||||
| Bargain purchase gain | (30,350) | — | — | (30,350) | — | ||||||||||
| Share-based compensation | — | (2,642) | — | (2,642) | — | ||||||||||
| Adjusted profit attributable to the parent | $ | 25,684 | $ | 33,296 | $ | 6,017 | 58,980 | $ | 1,234 | ||||||
Adjusted diluted profit per share:
| Quarter Ended | Quarter Ended | Quarter Ended | Six Months Ended | Six Months Ended | |||||||||||
| June 30, 2018 | March 31, 2018 | June 30, 2017 | June 30, 2018 | June 30, 2017 | |||||||||||
| Diluted profit (loss) per ordinary share | $ | 0.39 | $ | 0.21 | $ | 0.02 | $ | 0.60 | $ | (0.02) | |||||
| Tax rate adjustment | (0.07) | — | (0.01) | (0.07) | — | ||||||||||
| Non-controlling interest settlement | — | — | 0.01 | — | 0.01 | ||||||||||
| Power credit | — | — | (0.01) | — | (0.01) | ||||||||||
| Long lived asset charge due to reclassification of discontinued operations to continuing operations | — | — | 0.01 | — | 0.01 | ||||||||||
| Accrual of contingent liabilities | — | — | 0.03 | — | 0.03 | ||||||||||
| Bargain purchase gain | (0.18) | — | — | (0.18) | — | ||||||||||
| Share-based compensation | — | (0.02) | — | (0.02) | — | ||||||||||
| Adjusted diluted profit per ordinary share | $ | 0.14 | $ | 0.19 | $ | 0.05 | $ | 0.33 | $ | 0.02 | |||||
Conference Call
Ferroglobe management will review the second quarter results of 2018 during a conference call at 9 a.m. Eastern Time on Wednesday, August 22, 2018.
The dial-in number for participants in the United States is 877‑293‑5491 (conference ID 6293829). International callers should dial +1 914‑495‑8526 (conference ID 6293829). Please dial in at least five minutes prior to the call to register. The call may also be accessed via an audio webcast available at https://edge.media-server.com/m6/p/5bqj5wmw
About Ferroglobe
Ferroglobe is one of the world's leading suppliers of silicon metal, silicon-based specialty alloys, and ferroalloys serving a customer base across the globe in dynamic and fast-growing end markets, such as solar, automotive, consumer products, construction and energy. The Company is based in London. For more information, visit http://investor.ferroglobe.com.
Forward-Looking Statements
This release contains "forward-looking statements" within the meaning of U.S. securities laws. Forward-looking statements are not historical facts but are based on certain assumptions of management and describe the Company's future plans, strategies and expectations. Forward-looking statements often use forward-looking terminology, including words such as "anticipate", "believe", "could", "estimate", "expect", "forecast", "guidance", "intends", "likely", "may", "plan", "potential", "predicts", "seek", "will" and words of similar meaning or the negative thereof.
Forward-looking statements contained in this press release are based on information currently available to the Company and assumptions that management believe to be reasonable, but are inherently uncertain. As a result, Ferroglobe's actual results, performance or achievements may differ materially from those expressed or implied by these forward-looking statements, which are not guarantees of future performance and involve known and unknown risks, uncertainties and other factors that are, in some cases, beyond the Company's control.
Forward-looking financial information and other metrics presented herein represent the Company's goals and are not intended as guidance or projections for the periods referenced herein or any future periods.
All information in this press release is as of the date of its release. Ferroglobe does not undertake any obligation to update publicly any of the forward-looking statements contained herein to reflect new information, events or circumstances arising after the date of this press release. You should not place undue reliance on any forward-looking statements, which are made only as of the date of this press release.
Non-IFRS Measures
EBITDA, adjusted EBITDA, adjusted diluted profit (loss) per ordinary share and adjusted profit (loss) are non-IFRS financial metrics that, we believe, are pertinent measures of Ferroglobe's success.
Ferroglobe has included these financial metrics to provide supplemental measures of its performance. The Company believes these metrics are important because they eliminate items that have less bearing on the Company's current and future operating performance and highlight trends in its core business that may not otherwise be apparent when relying solely on IFRS financial measures.
* * *
CONTACT:
Phillip Murnane: +44 (0) 203 129 2265
Chief Financial Officer
Email: phillip.murnane@ferroglobe.com
Ferroglobe PLC and Subsidiaries
Unaudited Condensed Consolidated Income Statement
(in thousands of U.S. dollars, except per share amounts)
| Quarter Ended | Quarter Ended | Quarter Ended | Six Months Ended | Six Months Ended | |||||||||||
| June 30, 2018 | March 31, 2018 | June 30, 2017 | June 30, 2018 | June 30, 2017 | |||||||||||
| Sales | $ | 582,977 | $ | 560,704 | $ | 425,810 | $ | 1,143,681 | $ | 821,847 | |||||
| Cost of sales | (343,817) | (320,678) | (250,279) | (664,495) | (491,417) | ||||||||||
| Other operating income | 8,511 | 6,786 | 4,008 | 15,297 | 5,637 | ||||||||||
| Staff costs | (88,743) | (82,423) | (74,168) | (171,166) | (140,653) | ||||||||||
| Other operating expense | (75,384) | (70,862) | (65,009) | (146,246) | (125,133) | ||||||||||
| Depreciation and amortization charges, operating allowances and write-downs | (30,309) | (28,016) | (26,401) | (58,325) | (53,623) | ||||||||||
| Bargain purchase gain | 44,633 | — | — | 44,633 | — | ||||||||||
| Other gain (loss) | 2,752 | (37) | (3,555) | 2,715 | (2,591) | ||||||||||
| Operating profit | 100,620 | 65,474 | 10,406 | 166,094 | 14,067 | ||||||||||
| Net finance expense | (14,412) | (13,156) | (14,547) | (27,568) | (27,517) | ||||||||||
| Financial derivatives gain (loss) | 2,832 | (1,765) | (4,071) | 1,067 | (4,071) | ||||||||||
| Exchange differences | (8,708) | 729 | 7,263 | (7,979) | 7,243 | ||||||||||
| Profit (loss) before tax | 80,332 | 51,282 | (949) | 131,614 | (10,278) | ||||||||||
| Income tax (expense) benefit | (14,302) | (15,668) | 1,949 | (29,970) | 3,163 | ||||||||||
| Profit (loss) for the period | 66,030 | 35,614 | 1,000 | 101,644 | (7,115) | ||||||||||
| Loss attributable to non-controlling interest | 1,408 | 1,066 | 1,859 | 2,474 | 3,420 | ||||||||||
| Profit (loss) attributable to the parent | $ | 67,438 | $ | 36,680 | $ | 2,859 | $ | 104,118 | $ | (3,695) | |||||
| EBITDA | $ | 130,929 | $ | 93,490 | $ | 36,807 | $ | 224,419 | $ | 67,690 | |||||
| Adjusted EBITDA | $ | 86,296 | $ | 89,604 | $ | 43,870 | $ | 175,900 | $ | 74,753 | |||||
| Weighted average shares outstanding | |||||||||||||||
| Basic | 171,987 | 171,977 | 171,947 | 171,982 | 171,947 | ||||||||||
| Diluted | 172,127 | 172,215 | 172,047 | 172,144 | 171,947 | ||||||||||
| Profit (loss) per ordinary share | |||||||||||||||
| Basic | $ | 0.39 | $ | 0.21 | $ | 0.02 | $ | 0.61 | $ | (0.02) | |||||
| Diluted | $ | 0.39 | $ | 0.21 | $ | 0.02 | $ | 0.60 | $ | (0.02) | |||||
Ferroglobe PLC and Subsidiaries
Unaudited Condensed Consolidated Statement of Financial Position
(in thousands of U.S. dollars)
| June 30, | March 30, | December 31, | |||||||
| 2018 | 2018 | 2017 | |||||||
| ASSETS | |||||||||
| Non-current assets | |||||||||
| Goodwill | $ | 203,717 | $ | 204,537 | $ | 205,287 | |||
| Other intangible assets | 57,897 | 61,774 | 58,658 | ||||||
| Property, plant and equipment | 947,229 | 980,101 | 917,974 | ||||||
| Non-current financial assets | 116,974 | 147,744 | 89,315 | ||||||
| Deferred tax assets | 3,972 | 6,581 | 5,273 | ||||||
| Non-current receivables from related parties | 2,332 | 2,464 | 2,400 | ||||||
| Other non-current assets | 18,887 | 32,125 | 30,059 | ||||||
| Total non-current assets | 1,351,008 | 1,435,326 | 1,308,966 | ||||||
| Current assets | |||||||||
| Inventories | 532,574 | 493,108 | 361,231 | ||||||
| Trade and other receivables | 151,062 | 142,641 | 111,463 | ||||||
| Current receivables from related parties | 5,550 | 8,841 | 4,572 | ||||||
| Current income tax assets | 10,405 | 6,524 | 17,158 | ||||||
| Current financial assets | 854 | 897 | 2,469 | ||||||
| Other current assets | 18,283 | 16,095 | 9,926 | ||||||
| Cash and cash equivalents | 155,984 | 197,669 | 184,472 | ||||||
| Total current assets | 874,712 | 865,775 | 691,291 | ||||||
| Total assets | $ | 2,225,720 | $ | 2,301,101 | $ | 2,000,257 | |||
| EQUITY AND LIABILITIES | |||||||||
| Equity | $ | 1,004,125 | $ | 979,504 | $ | 937,758 | |||
| Non-current liabilities | |||||||||
| Deferred income | 5,387 | 7,321 | 3,172 | ||||||
| Provisions | 78,767 | 82,957 | 82,397 | ||||||
| Bank borrowings | 108,143 | 71,242 | - | ||||||
| Obligations under finance leases | 61,078 | 68,101 | 69,713 | ||||||
| Debt instruments | 340,564 | 341,036 | 339,332 | ||||||
| Other financial liabilities | 42,138 | 58,288 | 49,011 | ||||||
| Other non-current liabilities | 21,178 | 64,457 | 3,536 | ||||||
| Deferred tax liabilities | 64,689 | 64,733 | 65,142 | ||||||
| Total non-current liabilities | 721,944 | 758,135 | 612,303 | ||||||
| Current liabilities | |||||||||
| Provisions | 22,563 | 30,162 | 33,095 | ||||||
| Bank borrowings | 1,241 | 850 | 1,003 | ||||||
| Obligations under finance leases | 13,024 | 13,478 | 12,920 | ||||||
| Debt instruments | 10,936 | 2,735 | 10,938 | ||||||
| Other financial liabilities | 54,158 | 91,243 | 88,420 | ||||||
| Payables to related parties | 17,599 | 10,671 | 12,973 | ||||||
| Trade and other payables | 276,289 | 298,438 | 192,859 | ||||||
| Current income tax liabilities | 4,210 | 5,889 | 7,419 | ||||||
| Other current liabilities | 99,631 | 109,996 | 90,569 | ||||||
| Total current liabilities | 499,651 | 563,462 | 450,196 | ||||||
| Total equity and liabilities | $ | 2,225,720 | $ | 2,301,101 | $ | 2,000,257 | |||
Ferroglobe PLC and Subsidiaries
Unaudited Condensed Consolidated Statement of Cash Flows
(in thousands of U.S. dollars)
| Quarter Ended | Quarter Ended | Quarter Ended | Six Months Ended | Six Months Ended | |||||||||||
| June 30, 2018 | March 31, 2018 | June 30, 2017 | June 30, 2018 | June 30, 2017 | |||||||||||
| Cash flows from operating activities: | |||||||||||||||
| Profit (loss) for the period | $ | 66,030 | $ | 35,614 | $ | 1,000 | $ | 101,644 | $ | (7,115) | |||||
Adjustments to reconcile net profit (loss) to net cash (used) provided by operating activities: | |||||||||||||||
| Income tax expense (benefit) | 14,302 | 15,668 | (1,949) | 29,970 | (3,163) | ||||||||||
Depreciation and amortization charges, operating allowances and write-downs | 30,309 | 28,016 | 26,401 | 58,325 | 53,623 | ||||||||||
| Net finance expense | 14,412 | 13,156 | 14,547 | 27,568 | 27,517 | ||||||||||
| Financial derivatives (gain) loss | (2,832) | 1,765 | 4,071 | (1,067) | 4,071 | ||||||||||
| Exchange differences | 8,708 | (729) | (7,263) | 7,979 | (7,243) | ||||||||||
| Bargain purchase gain | (44,633) | — | — | (44,633) | — | ||||||||||
| Share-based compensation | 33 | 699 | — | 732 | — | ||||||||||
| Other adjustments | (2,752) | 37 | 3,556 | (2,715) | 2,592 | ||||||||||
| Changes in operating assets and liabilities | |||||||||||||||
| (Increase) decrease in inventories | (59,050) | (107,481) | (11,943) | (166,531) | (4,835) | ||||||||||
| (Increase) decrease in trade receivables | (19,257) | (513) | 9,456 | (19,770) | 13,221 | ||||||||||
| Increase in trade payables | 476 | 70,375 | (8,943) | 70,851 | 9,213 | ||||||||||
| Other | 6,817 | (49,770) | (506) | (42,953) | (35,051) | ||||||||||
| Income taxes paid | (14,186) | (9,982) | (3,919) | (24,168) | (6,216) | ||||||||||
| Interest paid | (2,957) | (17,301) | (4,378) | (20,258) | (14,107) | ||||||||||
| Net cash (used) provided by operating activities | (4,580) | (20,446) | 20,130 | (25,026) | 32,507 | ||||||||||
| Cash flows from investing activities: | |||||||||||||||
| Payments due to investments: | |||||||||||||||
| Other intangible assets | (2,221) | (703) | — | (2,924) | (410) | ||||||||||
| Property, plant and equipment | (29,778) | (22,531) | (14,319) | (52,309) | (26,681) | ||||||||||
| Other | (8) | — | — | (8) | (14) | ||||||||||
| Disposals: | |||||||||||||||
| Other non-current assets | 12,734 | — | — | 12,734 | — | ||||||||||
| Other | 1,904 | 4,010 | — | 5,914 | — | ||||||||||
| Acquisition of subsidiary | — | (20,379) | — | (20,379) | — | ||||||||||
| Interest and finance income received | 2,273 | 79 | 211 | 2,352 | 564 | ||||||||||
| Net cash used by investing activities | (15,096) | (39,524) | (14,108) | (54,620) | (26,541) | ||||||||||
| Cash flows from financing activities: | |||||||||||||||
| Dividends paid | (10,321) | — | — | (10,321) | — | ||||||||||
| Payment for debt issuance costs | — | (4,476) | (3,078) | (4,476) | (13,555) | ||||||||||
| Repayment of other financial liabilities | (33,096) | — | — | (33,096) | — | ||||||||||
| Proceeds from debt issuance | — | — | — | — | 350,000 | ||||||||||
| Increase/(decrease) in bank borrowings: | |||||||||||||||
| Borrowings | 37,668 | 182,364 | 30 | 220,032 | 31,455 | ||||||||||
| Payments | — | (106,514) | (15,300) | (106,514) | (387,680) | ||||||||||
| Proceeds from stock option exercises | 240 | — | — | 240 | — | ||||||||||
| Other amounts paid due to financing activities | (4,648) | (2,987) | (10,694) | (7,635) | (17,905) | ||||||||||
| Net cash (used) provided by financing activities | (10,157) | 68,387 | (29,042) | 58,230 | (37,685) | ||||||||||
| Total net cash flows for the period | (29,833) | 8,417 | (23,020) | (21,416) | (31,719) | ||||||||||
| Beginning balance of cash and cash equivalents | 197,669 | 184,472 | 193,031 | 184,472 | 196,982 | ||||||||||
Exchange differences on cash and cash equivalents in foreign currencies | (11,852) | 4,780 | 13,550 | (7,072) | 18,298 | ||||||||||
| Ending balance of cash and cash equivalents | $ | 155,984 | $ | 197,669 | $ | 183,561 | $ | 155,984 | $ | 183,561 | |||||
SIGNATURES
Pursuant to the requirements of the Securities Exchange Act of 1934, the registrant has duly caused this report to be signed on its behalf by the undersigned, thereunto duly authorized.
Date: August 21, 2018
| FERROGLOBE PLC | ||
| By: | Phillip Murnane | |
| Name: Phillip Murnane | ||
| Title: Chief Financial Officer and Principal Accounting Officer (Principal Financial Officer) | ||

Advancing Materials Innovation NASDAQ: GSM Second Quarter 2018
Forward-Looking Statements and non-IFRS Financial Metrics This presentation contains forward-looking statements within the meaning of Section 27A of the United States Securities Act of 1933, as amended, and Section 21E of the United States Securities Exchange Act of 1934, as amended. Forward-looking statements are not historical facts but are based on certain assumptions of management and describe our future plans, strategies and expectations. Forward-looking statements can generally be identified by the use of forward-looking terminology, including, but not limited to, "may," “could,” “seek,” “guidance,” “predict,” “potential,” “likely,” "believe," "will," "expect," "anticipate," "estimate," "plan," "intend," "forecast," or variations of these terms and similar expressions, or the negative of these terms or similar expressions. Forward-looking statements contained in this presentation are based on information presently available to Ferroglobe PLC (“we,” “us,” “Ferroglobe,” the “Company” or the “Parent”) and assumptions that we believe to be reasonable, but are inherently uncertain. As a result, our actual results, performance or achievements may differ materially from those expressed or implied by these forward-looking statements, which are not guarantees of future performance and involve known and unknown risks, uncertainties and other factors that are, in some cases, beyond our control. You are cautioned that all such statements involve risks and uncertainties, including without limitation, risks that Ferroglobe will not successfully integrate the businesses of Globe Specialty Metals, Inc. and Grupo FerroAtlántica SAU, that we will not realize estimated cost savings, value of certain tax assets, synergies and growth, and/or that such benefits may take longer to realize than expected. Important factors that may cause actual results to differ include, but are limited to: (i) risks relating to unanticipated costs of integration, including operating costs, customer loss and business disruption being greater than expected; (ii) our organizational and governance structure; (iii) the ability to hire and retain key personnel; (iv) regional, national or global political, economic, business, competitive, market and regulatory conditions including, among others, changes in metals prices; (v) increases in the cost of raw materials or energy; (vi) competition in the metals and foundry industries; (vii) environmental and regulatory risks; (viii) ability to identify liabilities associated with acquired properties prior to their acquisition; (ix) ability to manage price and operational risks including industrial accidents and natural disasters; (x) ability to manage foreign operations; (xi) changes in technology; (xii) ability to acquire or renew permits and approvals; (xiii) changes in legislation or governmental regulations affecting Ferroglobe; (xiv) conditions in the credit markets; (xv) risks associated with assumptions made in connection with critical accounting estimates and legal proceedings; (xvi) Ferroglobe's international operations, which are subject to the risks of currency fluctuations and foreign exchange controls; and (xvii) the potential of international unrest, economic downturn or effects of currencies, tax assessments, tax adjustments, anticipated tax rates, raw material costs or availability or other regulatory compliance costs. The foregoing list is not exhaustive. You should carefully consider the foregoing factors and the other risks and uncertainties that affect our business, including those described in the “Risk Factors” section of our Registration Statement on Form F-1, Annual Reports on Form 20-F, Current Reports on Form 6-K and other documents we file from time to time with the United States Securities and Exchange Commission. We do not give any assurance (1) that we will achieve our expectations or (2) concerning any result or the timing thereof, in each case, with respect to any regulatory action, administrative proceedings, government investigations, litigation, warning letters, consent decree, cost reductions, business strategies, earnings or revenue trends or future financial results. Forward- looking financial information and other metrics presented herein represent our key goals and are not intended as guidance or projections for the periods presented herein or any future periods. We do not undertake or assume any obligation to update publicly any of the forward-looking statements in this presentation to reflect actual results, new information or future events, changes in assumptions or changes in other factors affecting forward-looking statements. If we update one or more forward-looking statements, no inference should be drawn that we will make additional updates with respect to those or other forward-looking statements. We caution you not to place undue reliance on any forward-looking statements, which are made only as of the date of this presentation.EBITDA, adjusted EBITDA, adjusted diluted profit (loss) per ordinary share and adjusted profit (loss) attributable to Ferroglobe are, we believe, pertinent non-IFRS financial metrics that Ferroglobe utilizes to measure its success. The Company has included these financial metrics to provide supplemental measures of its performance. We believe these metrics are important because they eliminate items that have less bearing on the Company’s current and future operating performance and highlight trends in its core business that may not otherwise be apparent when relying solely on IFRS financial measures. For additional information, including a reconciliation of the differences between such non-IFRS financial measures and the comparable IFRS financial measures, refer to the press release dated August 22, 2018 accompanying this presentation, which is incorporated by reference herein.

Table of Contents Q2 2018 OverviewSelected Financial HighlightsPositioned for Growth
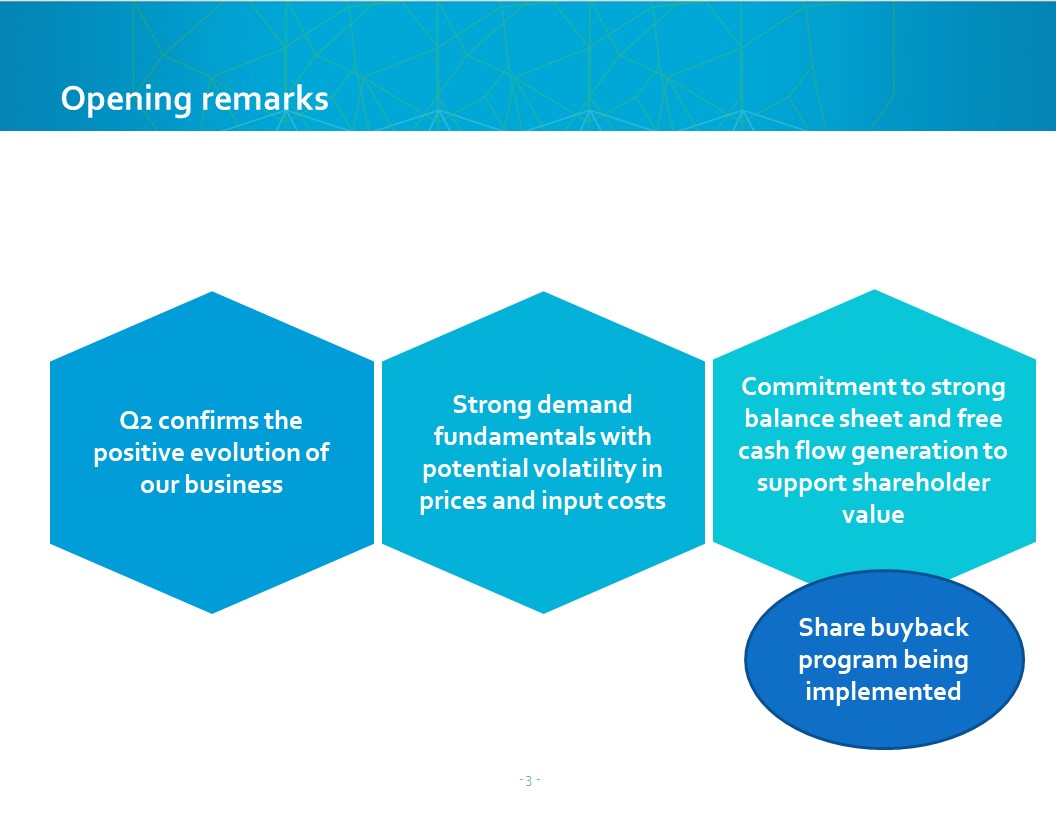
Q2 confirms the positive evolution of our business Strong demand fundamentals with potential volatility in prices and input costs Commitment to strong balance sheet and free cash flow generation to support shareholder value Opening remarks Share buyback program being implemented
I. Q2 2018 Overview Pedro Larrea, Chief Executive Officer
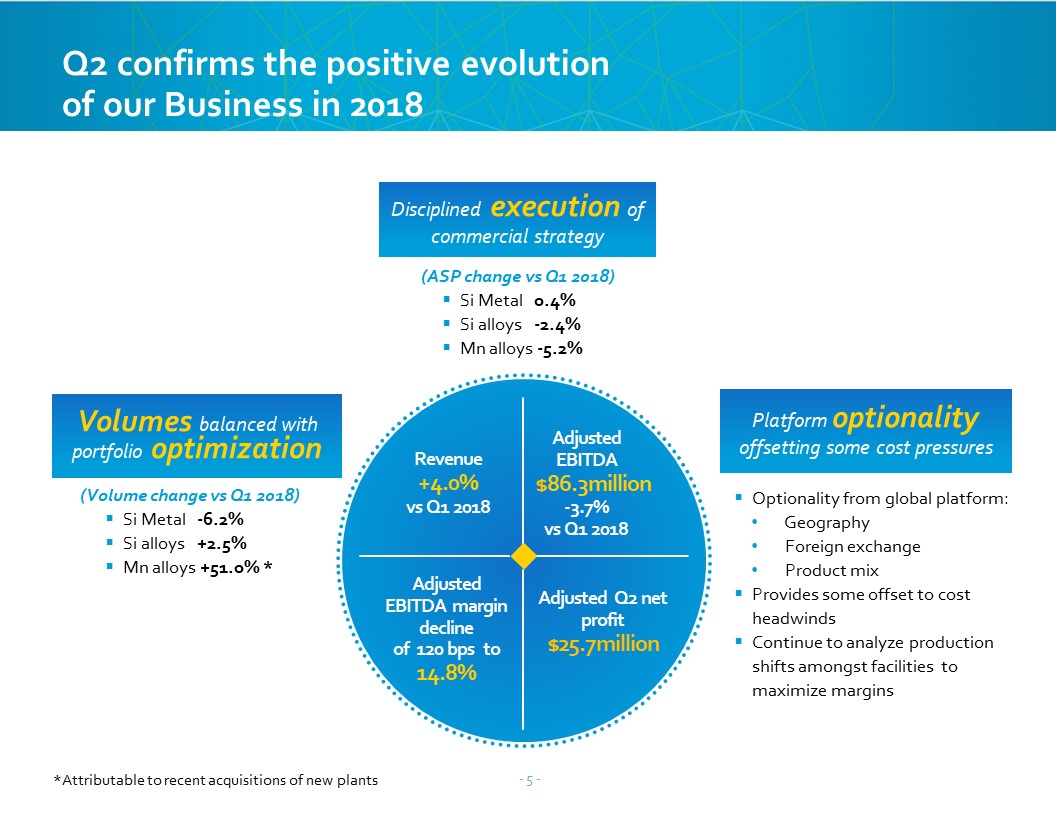
Volumes balanced with portfolio optimization (Volume change vs Q1 2018)Si Metal -6.2%Si alloys +2.5%Mn alloys +51.0% * (ASP change vs Q1 2018)Si Metal 0.4%Si alloys -2.4%Mn alloys -5.2% Revenue +4.0% vs Q1 2018 Adjusted EBITDA $86.3million-3.7% vs Q1 2018 Adjusted EBITDA margin declineof 120 bps to 14.8% Adjusted Q2 net profit $25.7million Platform optionalityoffsetting some cost pressures Optionality from global platform: Geography Foreign exchange Product mixProvides some offset to cost headwindsContinue to analyze production shifts amongst facilities to maximize margins *Attributable to recent acquisitions of new plants Disciplined execution of commercial strategy Q2 confirms the positive evolution of our Business in 2018
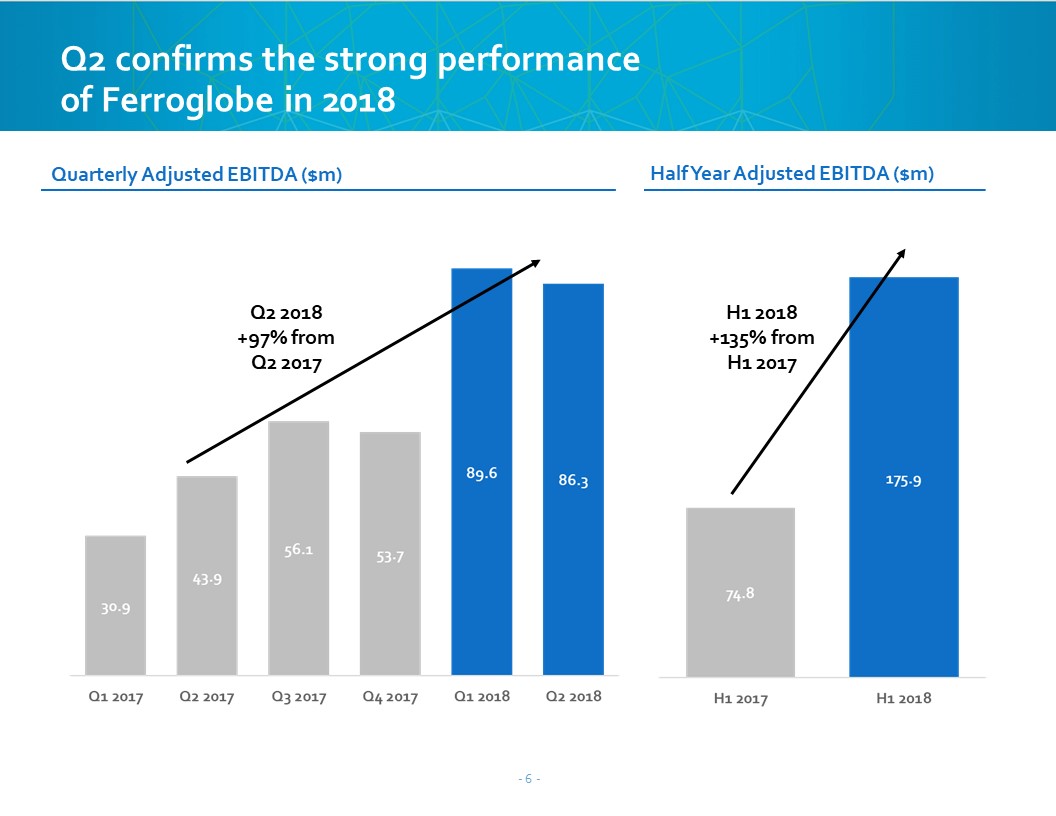
Quarterly Adjusted EBITDA ($m) Half Year Adjusted EBITDA ($m) Q2 confirms the strong performance of Ferroglobe in 2018 Q2 2018 +97% from Q2 2017 H1 2018 +135% from H1 2017
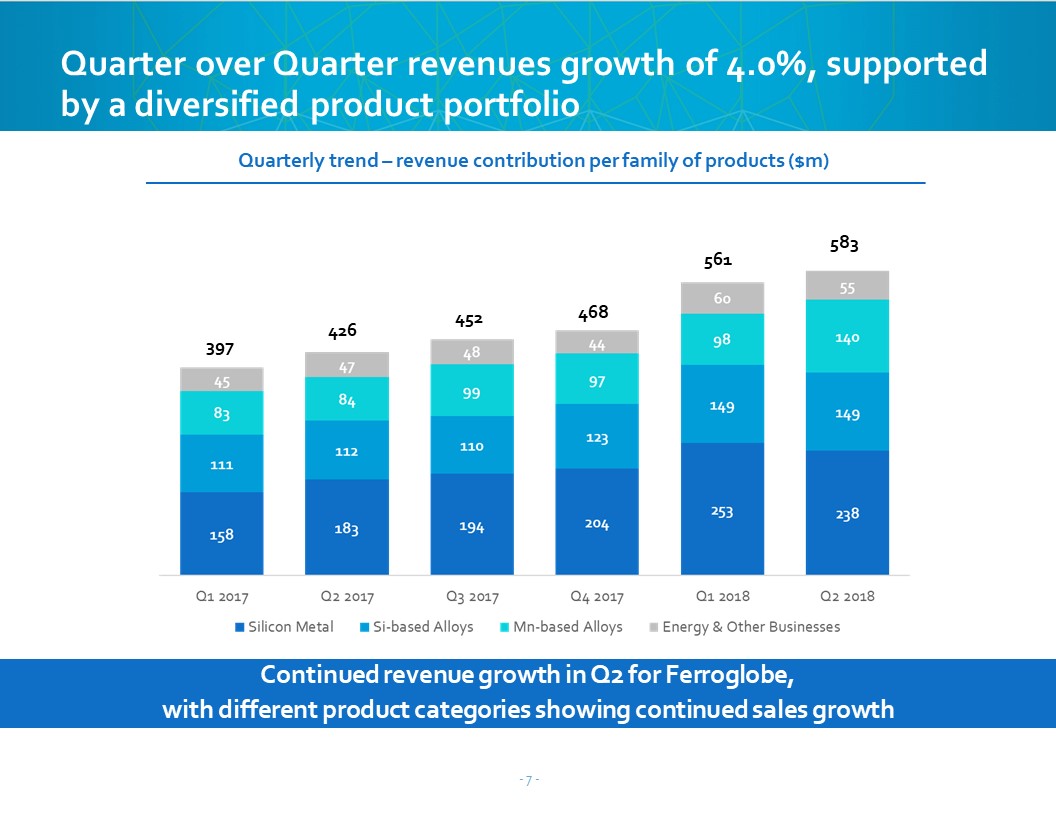
Quarterly trend – revenue contribution per family of products ($m) 397 426 452 468 561 583 Continued revenue growth in Q2 for Ferroglobe, with different product categories showing continued sales growth Quarter over Quarter revenues growth of 4.0%, supported by a diversified product portfolio
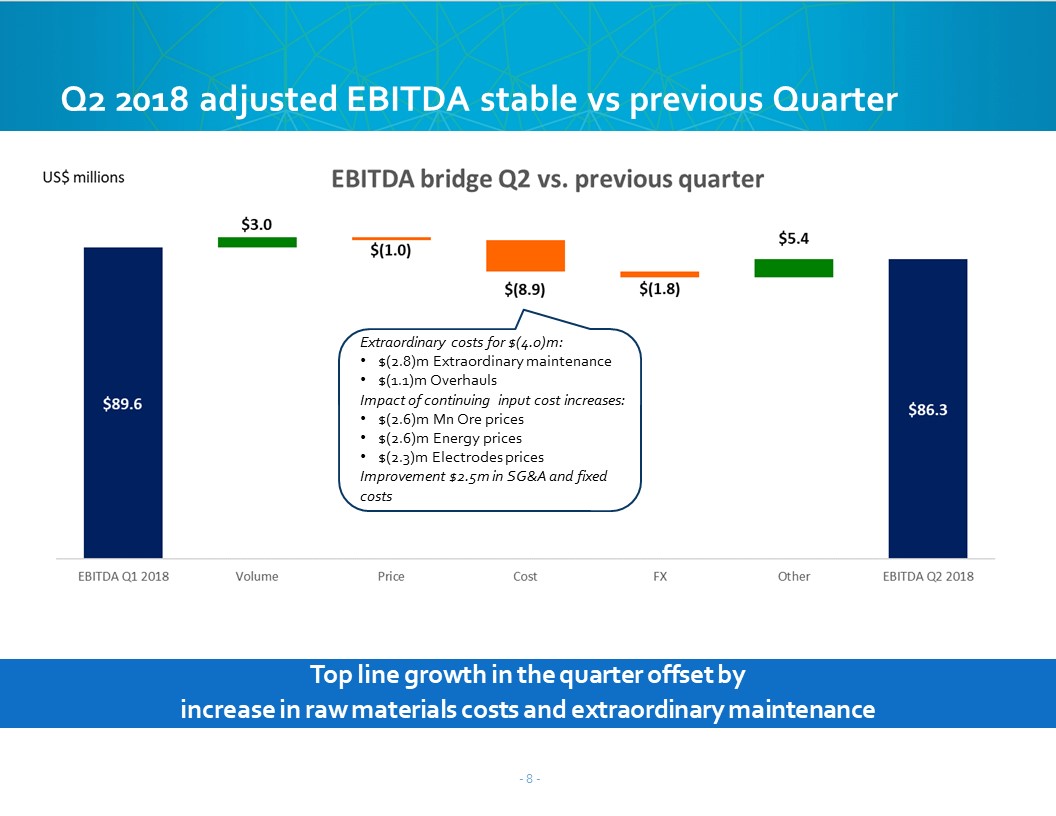
Top line growth in the quarter offset by increase in raw materials costs and extraordinary maintenance Q2 2018 adjusted EBITDA stable vs previous Quarter Extraordinary costs for $(4.0)m:$(2.8)m Extraordinary maintenance$(1.1)m OverhaulsImpact of continuing input cost increases:$(2.6)m Mn Ore prices$(2.6)m Energy prices$(2.3)m Electrodes pricesImprovement $2.5m in SG&A and fixed costs
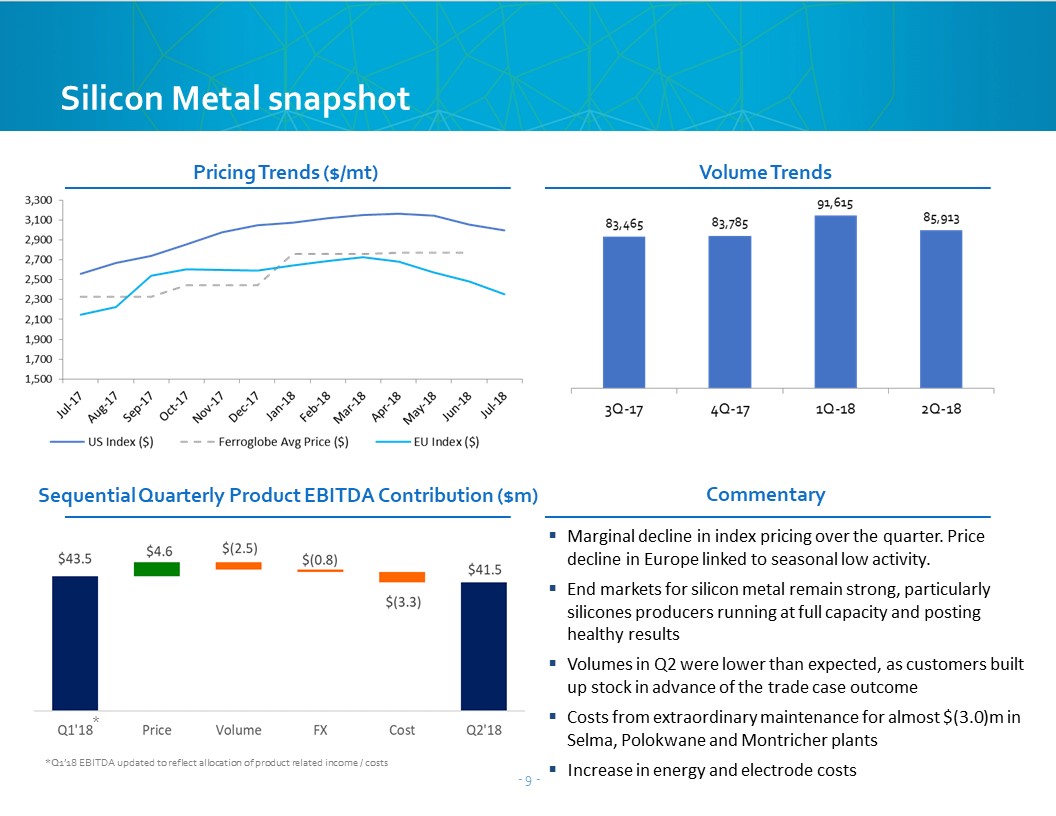
Volume Trends Sequential Quarterly Product EBITDA Contribution ($m) Commentary Marginal decline in index pricing over the quarter. Price decline in Europe linked to seasonal low activity.End markets for silicon metal remain strong, particularly silicones producers running at full capacity and posting healthy resultsVolumes in Q2 were lower than expected, as customers built up stock in advance of the trade case outcomeCosts from extraordinary maintenance for almost $(3.0)m in Selma, Polokwane and Montricher plantsIncrease in energy and electrode costs Pricing Trends ($/mt) Silicon Metal snapshot *Q1’18 EBITDA updated to reflect allocation of product related income / costs *
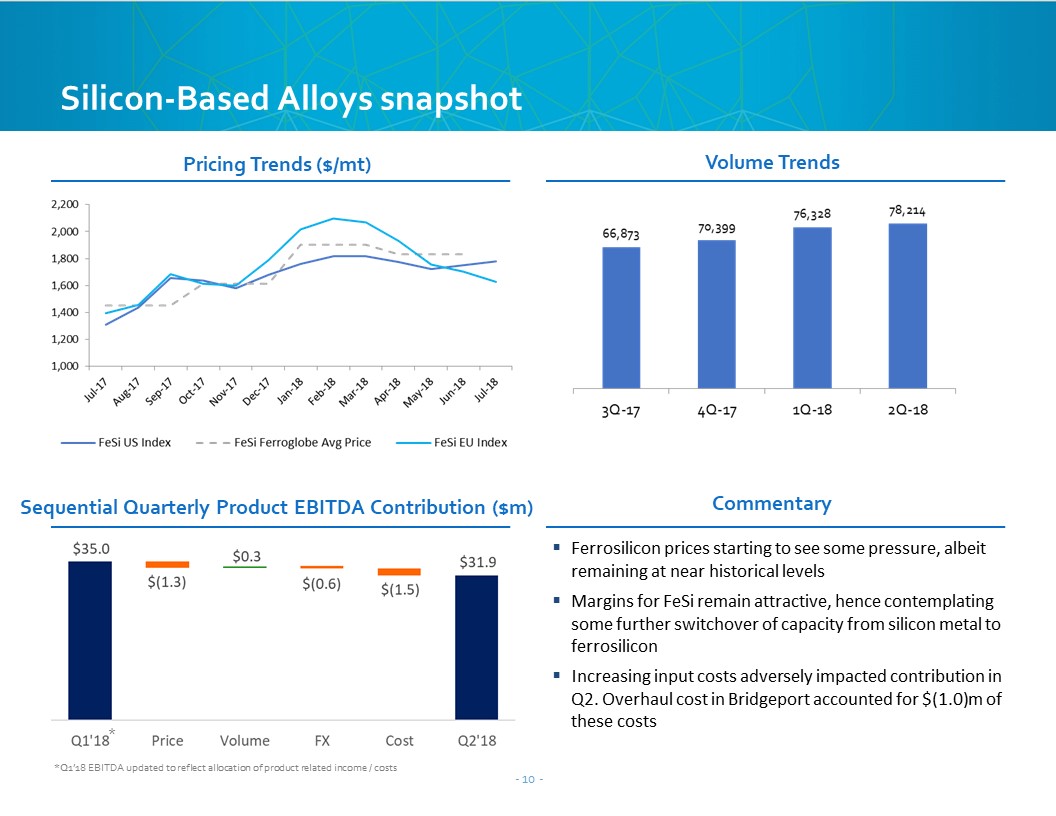
Volume Trends Commentary Ferrosilicon prices starting to see some pressure, albeit remaining at near historical levelsMargins for FeSi remain attractive, hence contemplating some further switchover of capacity from silicon metal to ferrosiliconIncreasing input costs adversely impacted contribution in Q2. Overhaul cost in Bridgeport accounted for $(1.0)m of these costs Sequential Quarterly Product EBITDA Contribution ($m) Pricing Trends ($/mt) Silicon-Based Alloys snapshot * *Q1’18 EBITDA updated to reflect allocation of product related income / costs
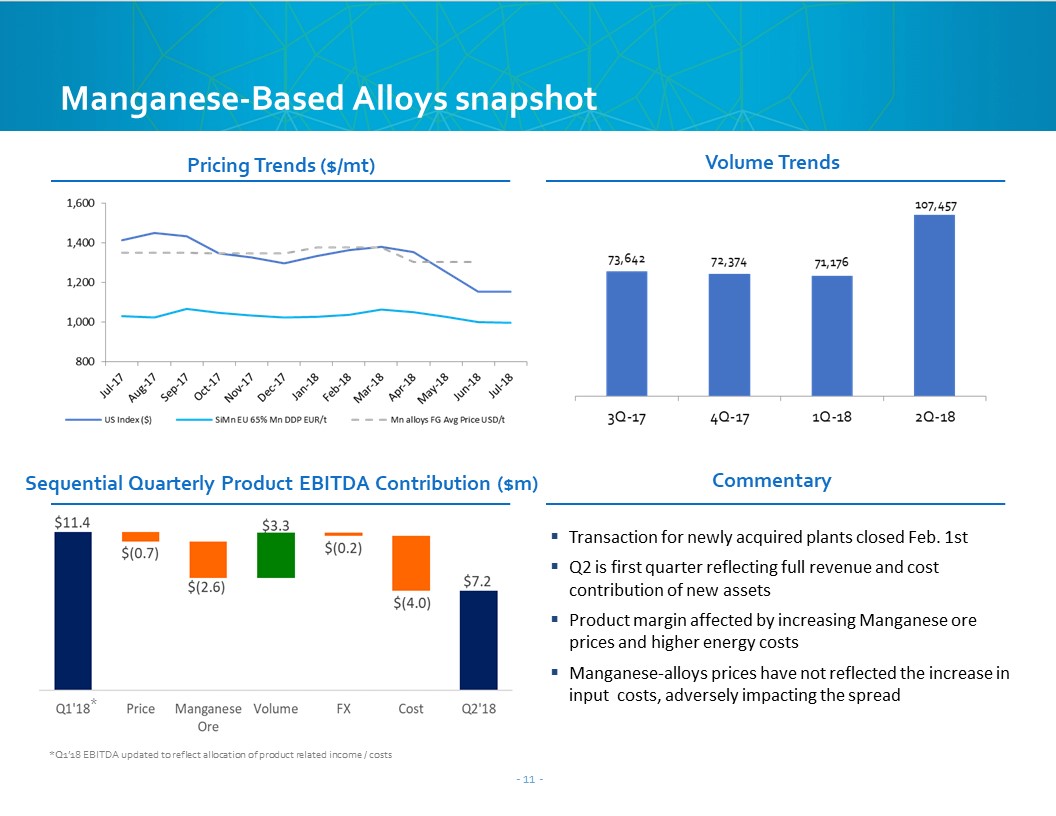
Commentary Volume Trends Pricing Trends ($/mt) Sequential Quarterly Product EBITDA Contribution ($m) Transaction for newly acquired plants closed Feb. 1stQ2 is first quarter reflecting full revenue and cost contribution of new assetsProduct margin affected by increasing Manganese ore prices and higher energy costsManganese-alloys prices have not reflected the increase in input costs, adversely impacting the spread Manganese-Based Alloys snapshot *Q1’18 EBITDA updated to reflect allocation of product related income / costs *

Selected Financial Highlights Phillip Murnane, Chief Financial Officer
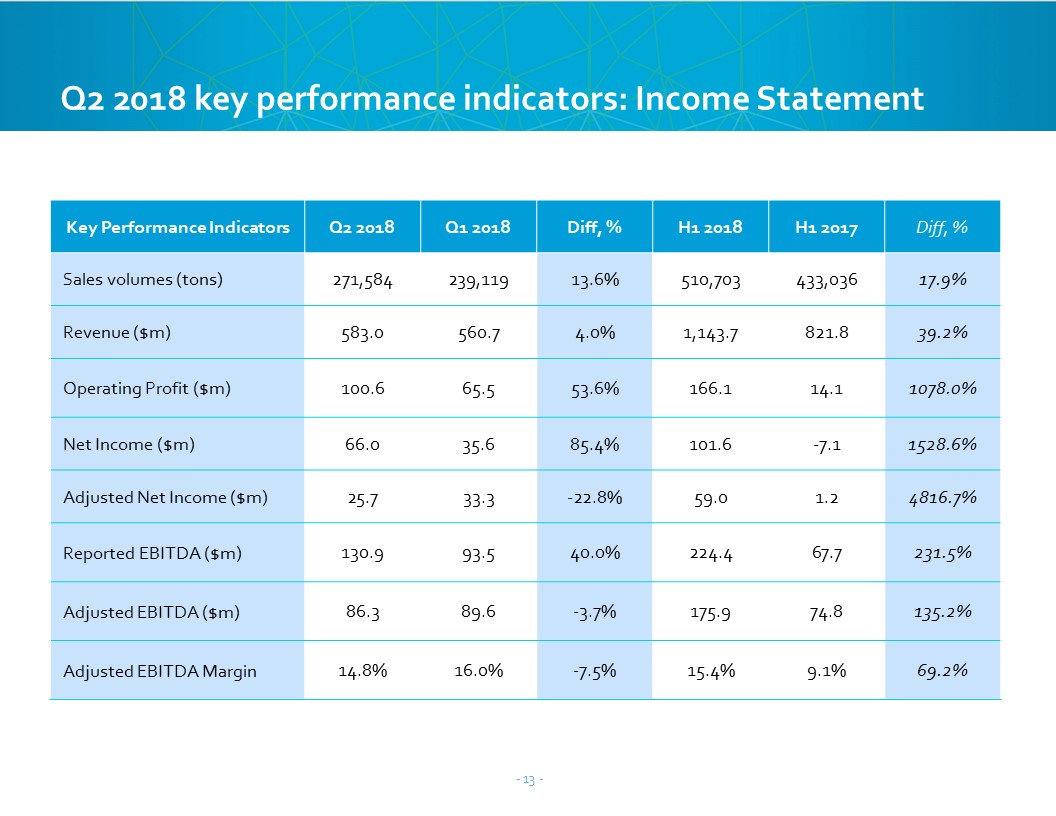
Q2 2018 key performance indicators: Income Statement Key Performance Indicators Q2 2018 Q1 2018 Diff, % H1 2018 H1 2017 Diff, % Sales volumes (tons) 271,584 239,119 13.6% 510,703 433,036 17.9% Revenue ($m) 583.0 560.7 4.0% 1,143.7 821.8 39.2% Operating Profit ($m) 100.6 65.5 53.6% 166.1 14.1 1078.0% Net Income ($m) 66.0 35.6 85.4% 101.6 -7.1 1528.6% Adjusted Net Income ($m) 25.7 33.3 -22.8% 59.0 1.2 4816.7% Reported EBITDA ($m) 130.9 93.5 40.0% 224.4 67.7 231.5% Adjusted EBITDA ($m) 86.3 89.6 -3.7% 175.9 74.8 135.2% Adjusted EBITDA Margin 14.8% 16.0% -7.5% 15.4% 9.1% 69.2%
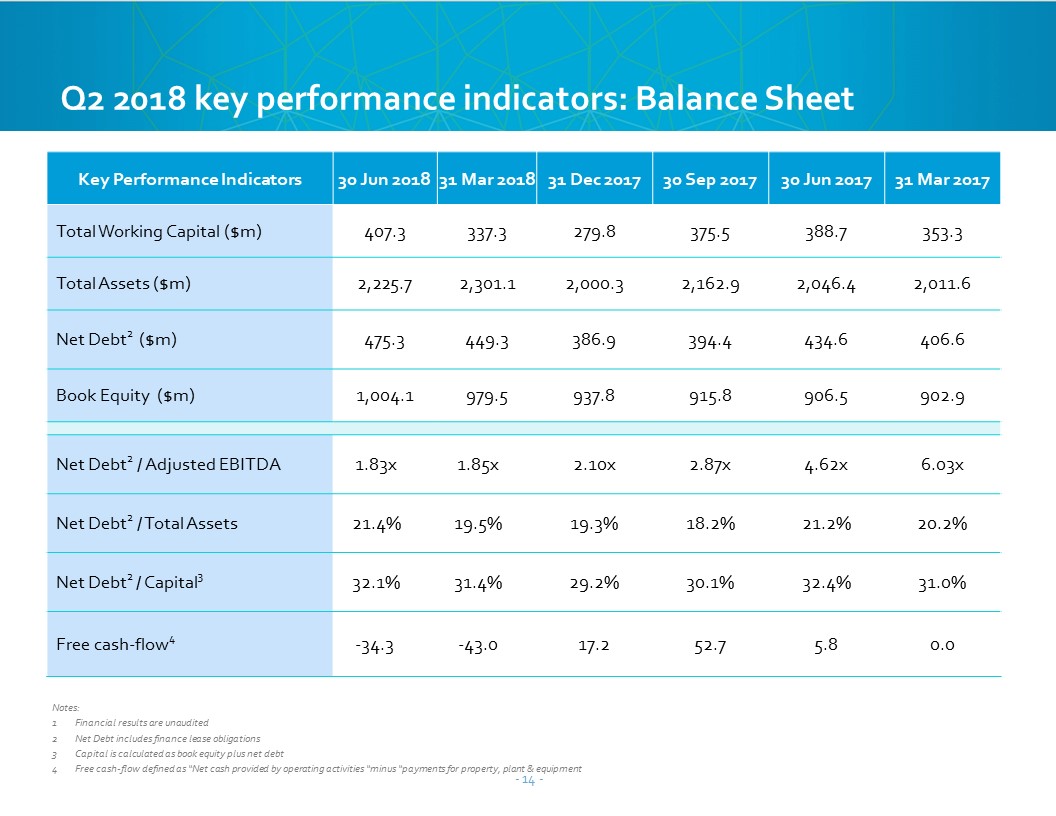
Notes:Financial results are unauditedNet Debt includes finance lease obligations Capital is calculated as book equity plus net debtFree cash-flow defined as “Net cash provided by operating activities “minus “payments for property, plant & equipment Key Performance Indicators 30 Jun 2018 31 Mar 2018 31 Mar 2018 31 Dec 2017 30 Sep 2017 30 Jun 2017 31 Mar 2017 Total Working Capital ($m) 407.3 337.3 337.3 279.8 375.5 388.7 353.3 Total Assets ($m) 2,225.7 2,301.1 2,301.1 2,000.3 2,162.9 2,046.4 2,011.6 Net Debt2 ($m) 475.3 449.3 449.3 386.9 394.4 434.6 406.6 Book Equity ($m) 1,004.1 979.5 979.5 937.8 915.8 906.5 902.9 Net Debt2 / Adjusted EBITDA 1.83x 1.85x 2.10x 2.87x 4.62x 6.03x Net Debt2 / Total Assets 21.4% 19.5% 19.3% 18.2% 21.2% 20.2% Net Debt2 / Capital3 32.1% 31.4% 29.2% 30.1% 32.4% 31.0% Free cash-flow4 -34.3 -43.0 17.2 52.7 5.8 0.0 Q2 2018 key performance indicators: Balance Sheet
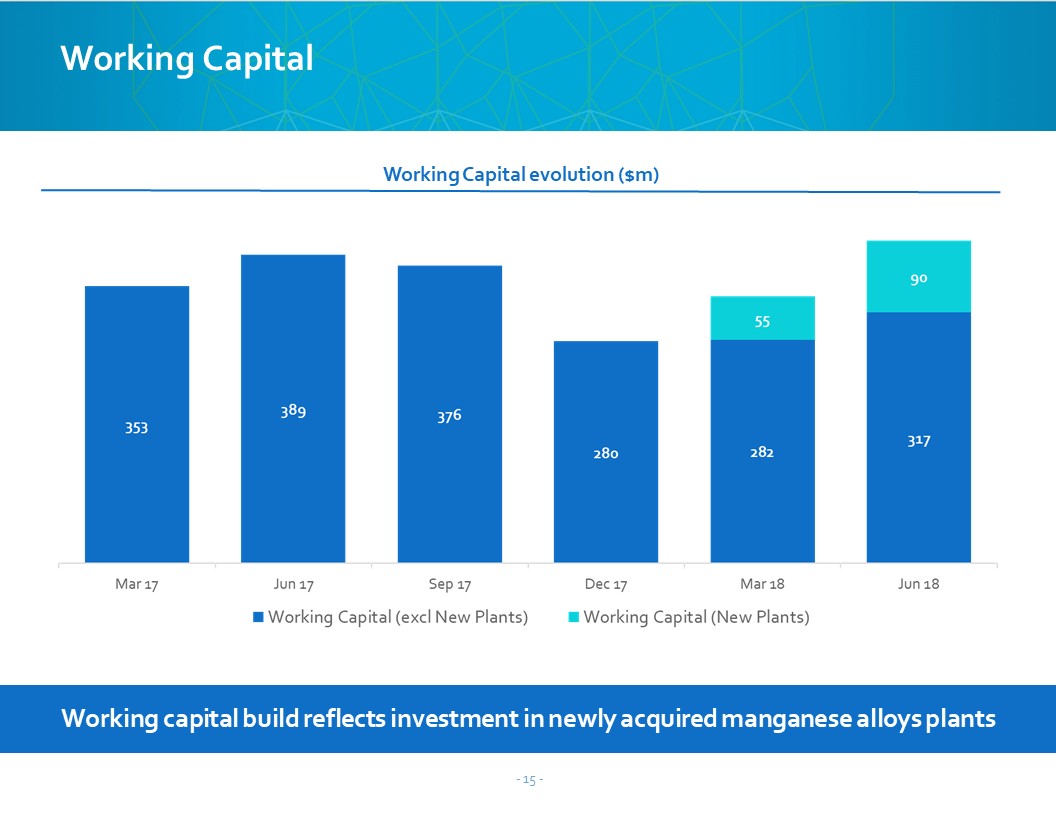
Working capital build reflects investment in newly acquired manganese alloys plants Working Capital Working Capital evolution ($m)
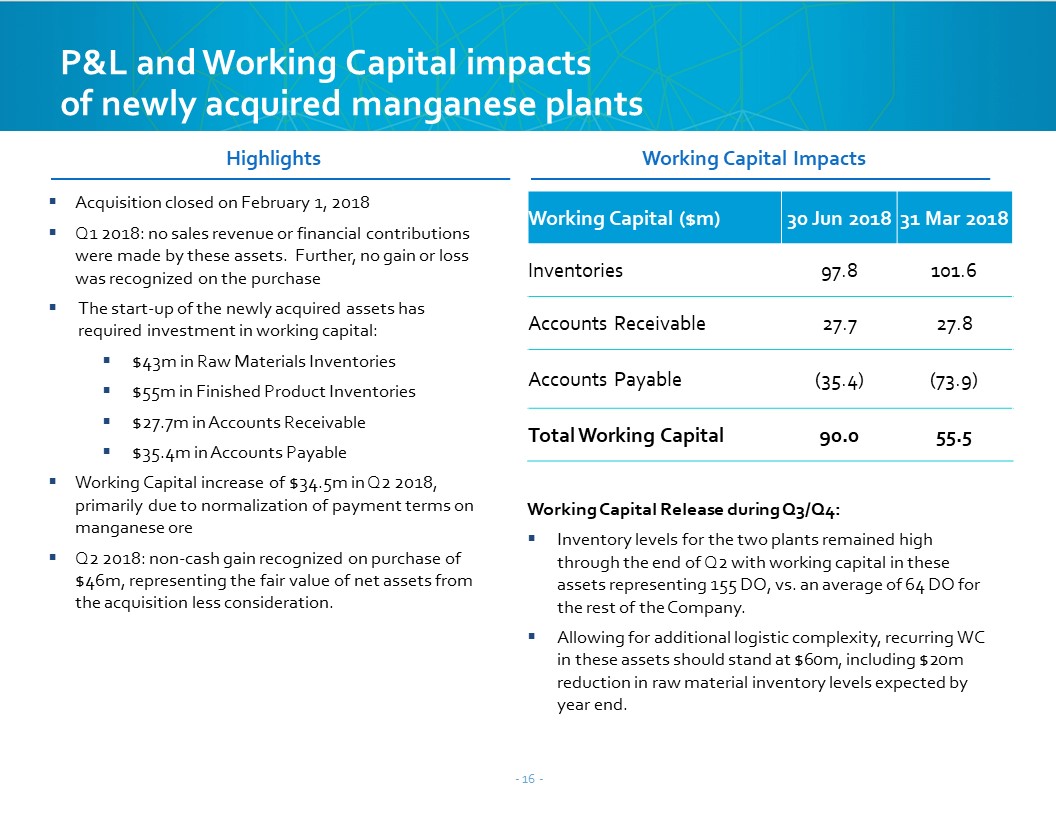
Working Capital ($m) 30 Jun 2018 31 Mar 2018 Inventories 97.8 101.6 Accounts Receivable 27.7 27.8 Accounts Payable (35.4) (73.9) Total Working Capital 90.0 55.5 Acquisition closed on February 1, 2018Q1 2018: no sales revenue or financial contributions were made by these assets. Further, no gain or loss was recognized on the purchaseThe start-up of the newly acquired assets has required investment in working capital:$43m in Raw Materials Inventories$55m in Finished Product Inventories$27.7m in Accounts Receivable $35.4m in Accounts PayableWorking Capital increase of $34.5m in Q2 2018, primarily due to normalization of payment terms on manganese oreQ2 2018: non-cash gain recognized on purchase of $46m, representing the fair value of net assets from the acquisition less consideration. Working Capital Release during Q3/Q4:Inventory levels for the two plants remained high through the end of Q2 with working capital in these assets representing 155 DO, vs. an average of 64 DO for the rest of the Company.Allowing for additional logistic complexity, recurring WC in these assets should stand at $60m, including $20m reduction in raw material inventory levels expected by year end. Highlights Working Capital Impacts P&L and Working Capital impacts of newly acquired manganese plants
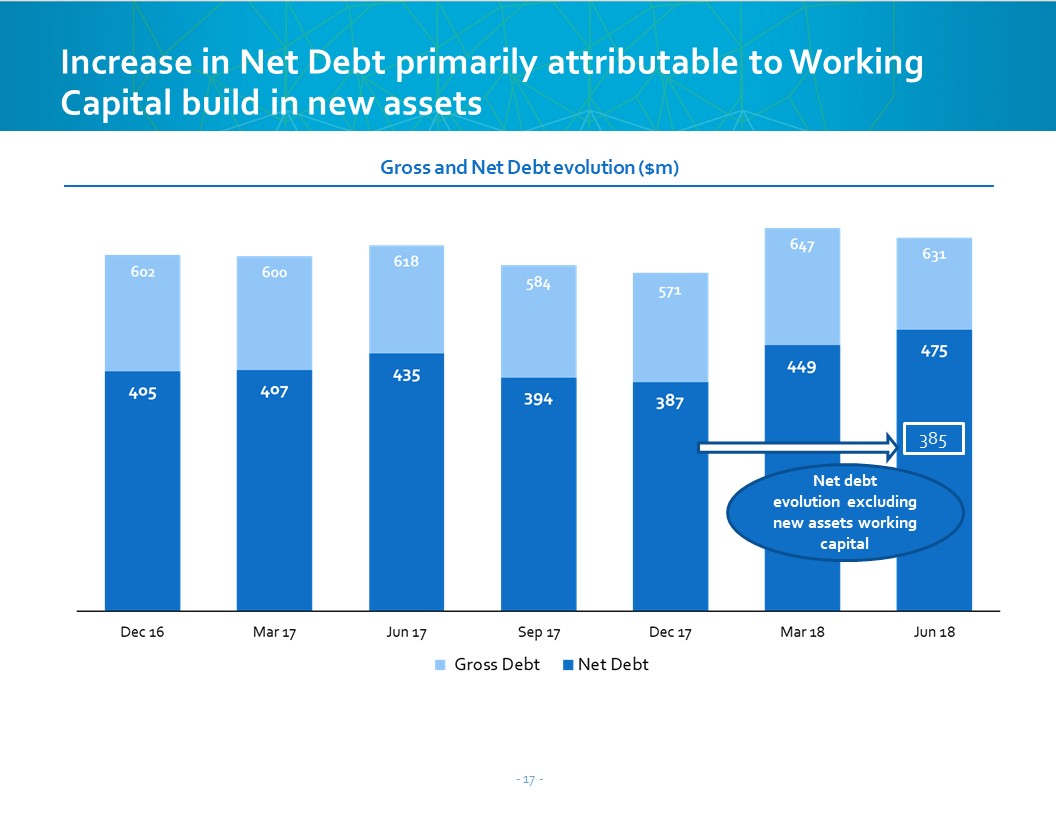
385 Net debt evolution excluding new assets working capital Gross and Net Debt evolution ($m) Increase in Net Debt primarily attributable to Working Capital build in new assets
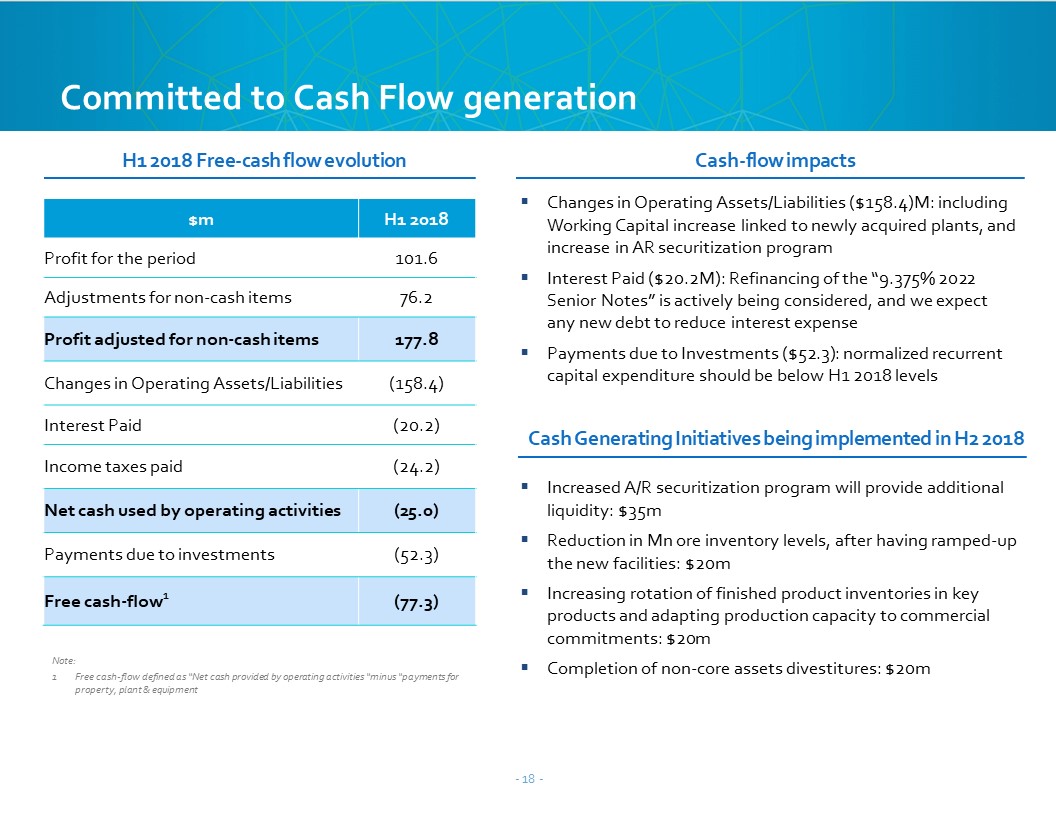
H1 2018 Free-cash flow evolution Cash-flow impacts Increased A/R securitization program will provide additional liquidity: $35mReduction in Mn ore inventory levels, after having ramped-up the new facilities: $20m Increasing rotation of finished product inventories in key products and adapting production capacity to commercial commitments: $20mCompletion of non-core assets divestitures: $20m Committed to Cash Flow generation Note:Free cash-flow defined as “Net cash provided by operating activities “minus “payments for property, plant & equipment Changes in Operating Assets/Liabilities ($158.4)M: including Working Capital increase linked to newly acquired plants, and increase in AR securitization program Interest Paid ($20.2M): Refinancing of the “9.375% 2022 Senior Notes” is actively being considered, and we expect any new debt to reduce interest expense Payments due to Investments ($52.3): normalized recurrent capital expenditure should be below H1 2018 levels Cash Generating Initiatives being implemented in H2 2018 $m H1 2018 Profit for the period 101.6 Adjustments for non-cash items 76.2 Profit adjusted for non-cash items 177.8 Changes in Operating Assets/Liabilities (158.4) Interest Paid (20.2) Income taxes paid (24.2) Net cash used by operating activities (25.0) Payments due to investments (52.3) Free cash-flow1 (77.3)
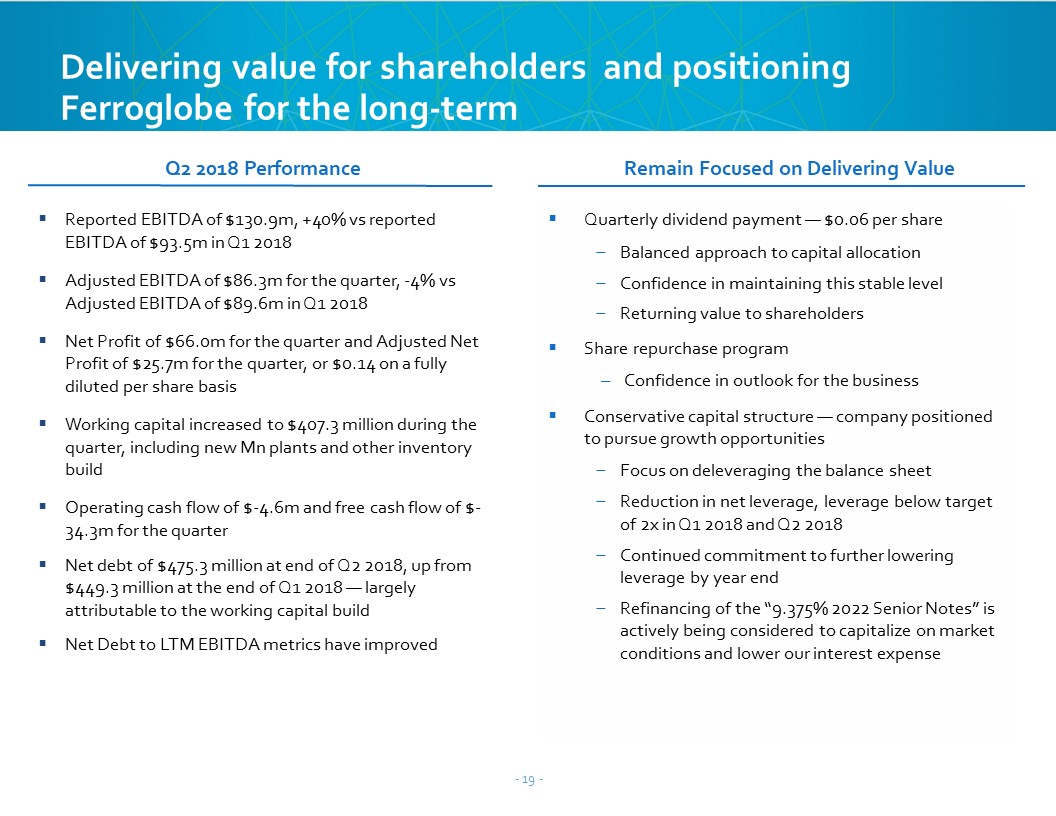
Quarterly dividend payment — $0.06 per shareBalanced approach to capital allocationConfidence in maintaining this stable levelReturning value to shareholdersShare repurchase programConfidence in outlook for the businessConservative capital structure — company positioned to pursue growth opportunitiesFocus on deleveraging the balance sheetReduction in net leverage, leverage below target of 2x in Q1 2018 and Q2 2018Continued commitment to further lowering leverage by year endRefinancing of the “9.375% 2022 Senior Notes” is actively being considered to capitalize on market conditions and lower our interest expense Q2 2018 Performance Remain Focused on Delivering Value Reported EBITDA of $130.9m, +40% vs reported EBITDA of $93.5m in Q1 2018Adjusted EBITDA of $86.3m for the quarter, -4% vs Adjusted EBITDA of $89.6m in Q1 2018Net Profit of $66.0m for the quarter and Adjusted Net Profit of $25.7m for the quarter, or $0.14 on a fully diluted per share basisWorking capital increased to $407.3 million during the quarter, including new Mn plants and other inventory buildOperating cash flow of $-4.6m and free cash flow of $-34.3m for the quarterNet debt of $475.3 million at end of Q2 2018, up from $449.3 million at the end of Q1 2018 — largely attributable to the working capital buildNet Debt to LTM EBITDA metrics have improved Delivering value for shareholders and positioning Ferroglobe for the long-term
Positioned for Growth Pedro Larrea, Chief Executive Officer
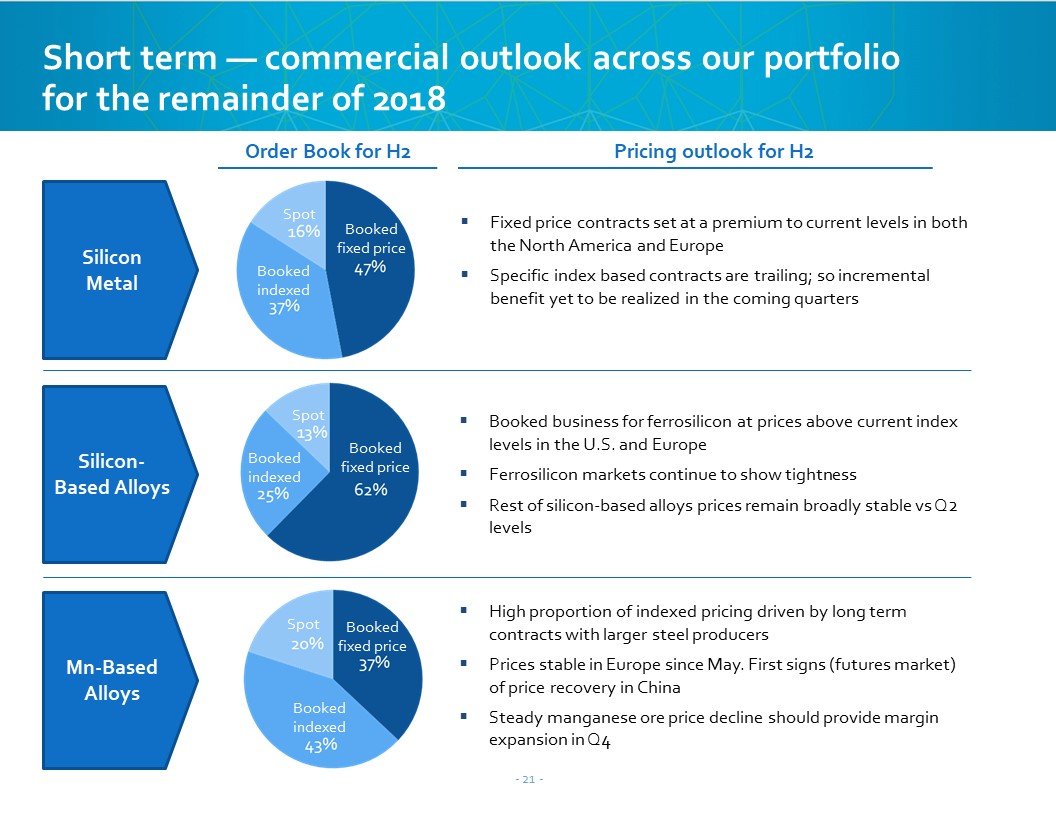
Pricing outlook for H2 Order Book for H2 Fixed price contracts set at a premium to current levels in both the North America and EuropeSpecific index based contracts are trailing; so incremental benefit yet to be realized in the coming quarters Silicon Metal Booked fixed price Booked indexed Spot Booked business for ferrosilicon at prices above current index levels in the U.S. and EuropeFerrosilicon markets continue to show tightnessRest of silicon-based alloys prices remain broadly stable vs Q2 levels Booked fixed price Booked indexed Spot High proportion of indexed pricing driven by long term contracts with larger steel producersPrices stable in Europe since May. First signs (futures market) of price recovery in ChinaSteady manganese ore price decline should provide margin expansion in Q4 Booked fixed price Booked indexed Spot Silicon-Based Alloys Mn-Based Alloys Short term ― commercial outlook across our portfolio for the remainder of 2018
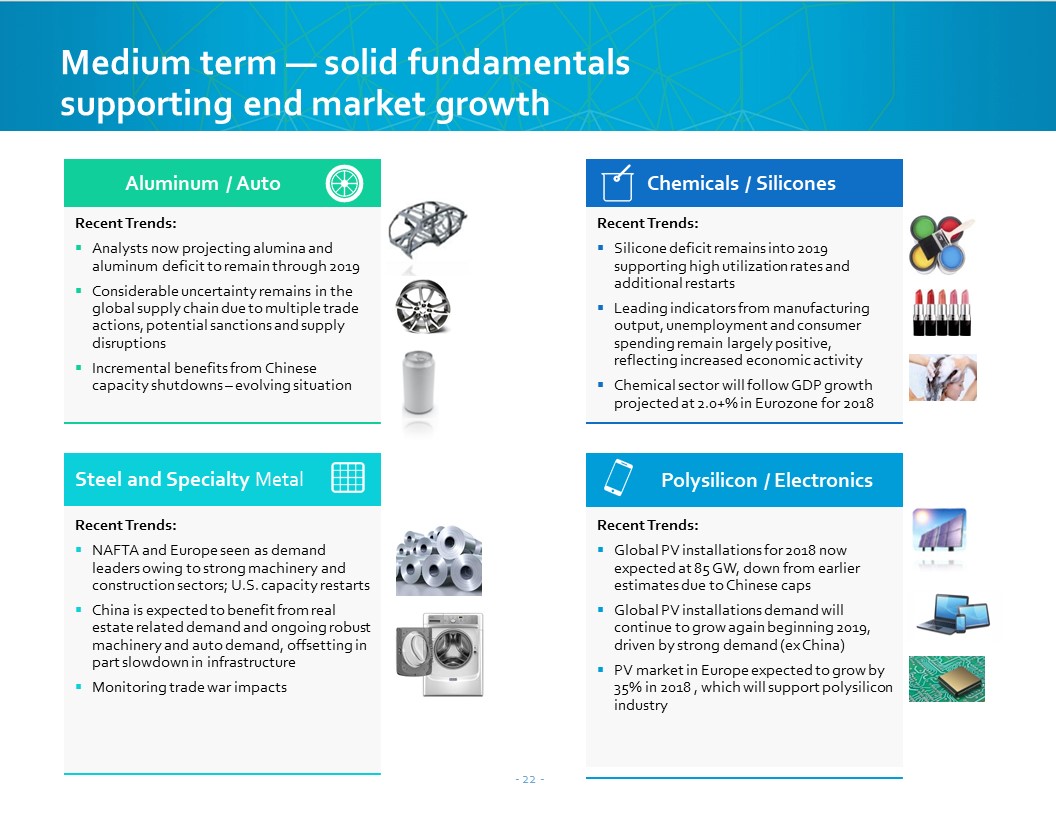
Recent Trends:NAFTA and Europe seen as demand leaders owing to strong machinery and construction sectors; U.S. capacity restarts China is expected to benefit from real estate related demand and ongoing robust machinery and auto demand, offsetting in part slowdown in infrastructureMonitoring trade war impacts Polysilicon / Electronics Recent Trends:Global PV installations for 2018 now expected at 85 GW, down from earlier estimates due to Chinese capsGlobal PV installations demand will continue to grow again beginning 2019, driven by strong demand (ex China)PV market in Europe expected to grow by 35% in 2018 , which will support polysilicon industry Recent Trends:Analysts now projecting alumina and aluminum deficit to remain through 2019Considerable uncertainty remains in the global supply chain due to multiple trade actions, potential sanctions and supply disruptionsIncremental benefits from Chinese capacity shutdowns – evolving situation Aluminum / Auto Recent Trends:Silicone deficit remains into 2019 supporting high utilization rates and additional restarts Leading indicators from manufacturing output, unemployment and consumer spending remain largely positive, reflecting increased economic activityChemical sector will follow GDP growth projected at 2.0+% in Eurozone for 2018 Chemicals / Silicones XX% XX% Steel and Specialty Metal Medium term ― solid fundamentals supporting end market growth
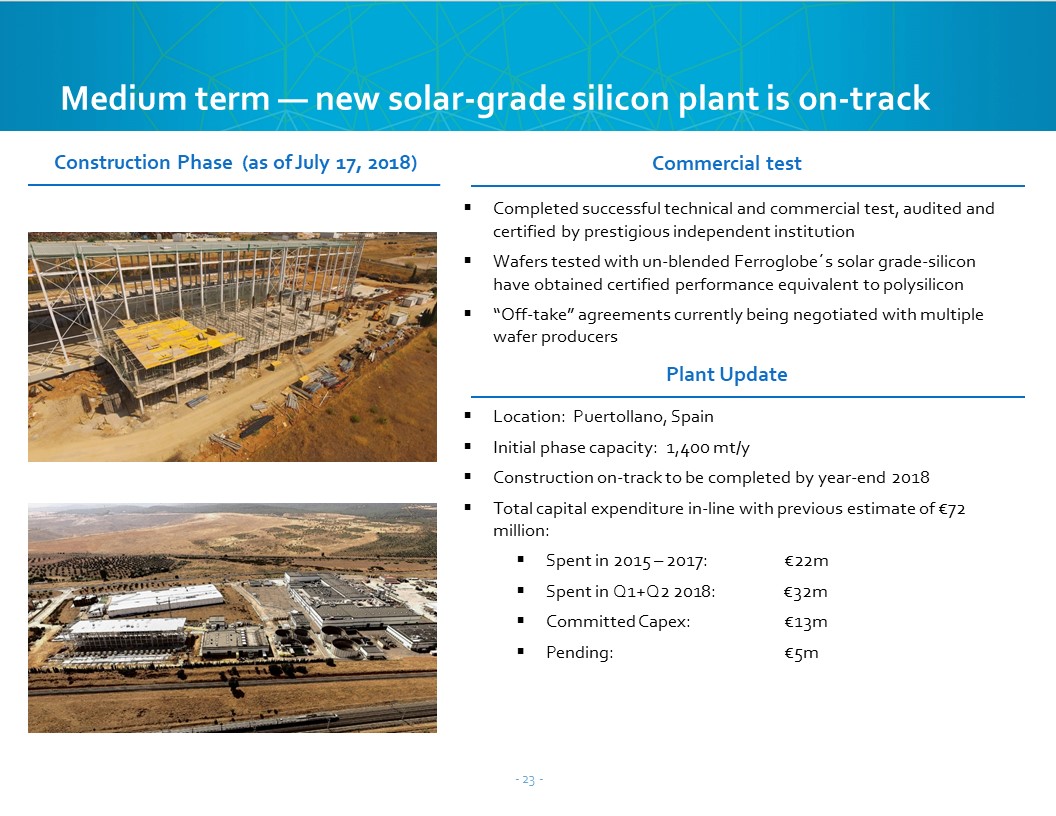
Construction Phase (as of July 17, 2018) Commercial test Completed successful technical and commercial test, audited and certified by prestigious independent institutionWafers tested with un-blended Ferroglobe´s solar grade-silicon have obtained certified performance equivalent to polysilicon “Off-take” agreements currently being negotiated with multiple wafer producers Plant Update Location: Puertollano, SpainInitial phase capacity: 1,400 mt/yConstruction on-track to be completed by year-end 2018 Total capital expenditure in-line with previous estimate of €72 million:Spent in 2015 – 2017: €22mSpent in Q1+Q2 2018: €32mCommitted Capex: €13mPending: €5m Medium term ― new solar-grade silicon plant is on-track

Exploring new comercial opportunities Project Development stage Product and process commercially and technically provenFirst phase plant under constructionCommercial negotiations underway 2019-2020 2021-2022 First production 1,400 tpy$20m annualized revenuePotential unit margin affected by scale Launching full scale plant 20,000-30,000 tpy$300-400 m revenueSignificant margin potential Need of a new business model? Enhancing value of by-productsLow cost process for high value added products. Fast industrial implementationExploring commercial alternatives 3,000 tpy$20m revenue$2m EBITDA per quarter Installing production equipment Multiple R&D routes Multiple collaborations with start-ups and research institutionsEarly success on silicon anode technologyLooking into implications for Mn content in cathodes Potential production for Si-Cathodes The right business model depends on the results achieved High value added products target to contribute up to 15-20% to Ferroglobe´s results Medium to long term ― New products and technologies provide significant growth potential Solar Grade Silicon High Value Powders Batteries
Q2 confirms the positive evolution of our business Strong demand fundamentals with potential volatility in prices and input costs Commitment to strong balance sheet and free cash flow generation to support shareholder value Closing remarks

Q&A
Advancing Materials Innovation NASDAQ: GSM Second Quarter 2018