Exhibit 99.1

Q2 2023 Update July 25th, 2023 1

Table of Contents Key Highlights Financial Summary MAUs & Subscribers Product & Platform Outlook Financial Statements Executive Summary p.03 22 p.04 p.06 p.13 p.16 p.20 p.23

USER & FINANCIAL SUMMARY Q2 2022 Q1 2023 Q2 2023 Y/Y Q/Q USERS (M) Total Monthly Active Users ("MAUs") 433 515 551 27% 7% Premium Subscribers 188 210 220 17% 5% Ad-Supported MAUs 256 317 343 34% 8% FINANCIALS (€M) Premium 2,504 2,713 2,773 11% 2% Ad-Supported 360 329 404 12% 23% Total Revenue 2,864 3,042 3,177 11% 4% Gross Profit 704 766 766 9% 0% Gross Margin 24.6% 25.2% 24.1% -- -- Adjusted Gross Margin* 25.3% -- 25.5% -- -- Operating (Loss)/Income (194) (156) (247) -- -- Operating Margin (6.8%) (5.1%) (7.8%) -- -- Adjusted Operating (Loss)/Income* (174) (112) (112) -- -- Adjusted Operating Margin* (6.1%) (3.7%) (3.5%) -- -- Net Cash Flows From Operating Activities 39 59 13 -- -- Free Cash Flow* 37 57 9 -- -- The business performed very well in Q2, led by exceptionally strong MAU and Subscriber results. MAU net additions of 36 million were 21 million above guidance—an all-time high for the company—while Subscriber net additions of 10 million were 3 million ahead of guidance and the highest Q2 in company history. Revenue was in-line with guidance. Reported Gross Margin and Operating Loss were both primarily impacted by charges related to our actions to streamline operations and reduce costs. Excluding these items, Adjusted Gross Margin* of 25.5% was in-line and up 22 bps Y/Y (consistent with how we guided the quarter). Adjusted Operating Loss* of (€112) million was better than guidance, aided by lower marketing spend. Free Cash Flow* was €9 million in the quarter. Overall, we are encouraged by the strength we saw in Q2 and our momentum heading into the back half of 2023. Executive Summary * Adjusted Gross Margin, Adjusted Operating Loss, Adjusted Operating Margin and Free Cash Flow are non-IFRS measures. See "Use of Non-IFRS Measures" and "Reconciliation of IFRS to Non-IFRS Results" for additional information. 3

All time high MAU growth and strongest Q2 to date for Subscriber net additions Key Highlights Accelerating constant currency* Revenue growth and Adjusted Gross Margin* expansion Total Revenue grew 11% Y/Y to €3.2 billion On a constant currency* basis, Total Revenue grew 14% Y/Y vs. 13% in Q1’23 Adjusted Gross Margin* finished at 25.5% (up 22 bps Y/Y) excluding one-time charges related to efficiency measures Unveiled new personalized experiences for users and tools for advertisers MAUs grew 27% Y/Y to 551 million, 21 million above guidance. Net additions of 36 million represented our largest quarterly net addition performance in our history All regions outperformed and saw higher MAU net additions relative to the prior year period, aided by improved retention and marketing efficiencies Premium Subscribers grew 17% Y/Y to 220 million, 3 million above guidance Expanded AI DJ to Premium users in the United Kingdom and Ireland Rolled out a redesigned desktop experience and added an additional 11 new languages for users around the world Announced a new Original podcast with Trevor Noah coming to Spotify later this year Launched Spotify Ad Analytics, a free tool designed to provide advertisers with audio advertising measurement services * Constant Currency adjusted measures and Adjusted Gross Margin are non-IFRS measures. See "Use of Non-IFRS Measures" and "Reconciliation of IFRS to Non-IFRS Results" for additional information. 4
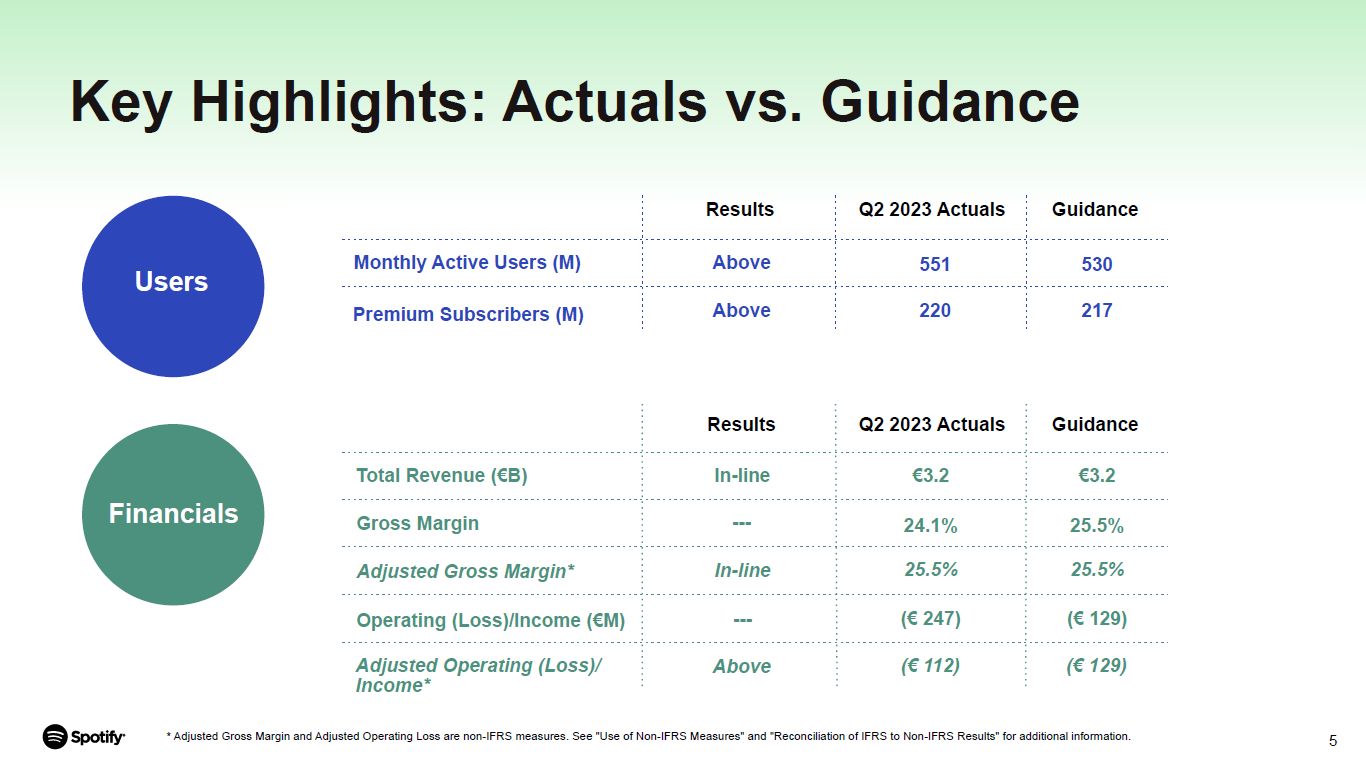
Key Highlights: Actuals vs. Guidance Premium Subscribers (M) Users Monthly Active Users (M) Above Above 551 220 Results Q2 2023 Actuals Guidance 530 217 Results Q2 2023 Actuals Guidance Total Revenue (€B) In-line €3.2 €3.2 Gross Margin --- 24.1% 25.5% Adjusted Gross Margin* In-line 25.5% 25.5% Operating (Loss)/Income (€M) --- (€ 247) (€ 129) Adjusted Operating (Loss)/ Income* Above (€ 112) (€ 129) Financials * Adjusted Gross Margin and Adjusted Operating Loss are non-IFRS measures. See "Use of Non-IFRS Measures" and "Reconciliation of IFRS to Non-IFRS Results" for additional information. 5

FINANCIAL SUMMARY 6

Financial Summary * Free Cash Flow and Constant Currency adjusted measures (FXN) are non-IFRS measures. See “Use of Non-IFRS Measures” and “Reconciliation of IFRS to Non-IFRS Results” for additional information. USER, FINANCIAL & LIQUIDITY SUMMARY Q2 2022 Q3 2022 Q4 2022 Q1 2023 Q2 2023 Y/Y Y/Y FXN* USERS (M) Total Monthly Active Users ("MAUs") 433 456 489 515 551 27% -- Premium Subscribers 188 195 205 210 220 17% -- Ad-Supported MAUs 256 273 295 317 343 34% -- FINANCIALS (€M) Premium 2,504 2,651 2,717 2,713 2,773 11% 14% Ad-Supported 360 385 449 329 404 12% 15% Total Revenue 2,864 3,036 3,166 3,042 3,177 11% 14% Gross Profit 704 750 801 766 766 9% 12% Gross Margin 24.6% 24.7% 25.3% 25.2% 24.1% -- -- Total Operating Expenses 898 978 1,032 922 1,013 13% 16% Operating (Loss)/Income (194) (228) (231) (156) (247) -- -- Operating Margin (6.8%) (7.5%) (7.3%) (5.1%) (7.8%) -- -- FREE CASH FLOW & LIQUIDITY (€M, unless otherwise denoted) Net Cash Flows From Operating Activities 39 40 (70) 59 13 -- -- Free Cash Flow* 37 35 (73) 57 9 -- -- Cash & Cash Equivalents, Restricted Cash & Short Term Investments (€B) 3.6 3.7 3.4 3.5 3.5 -- -- 7

Revenue Profitability Free Cash Flow & Liquidity Revenue of €3,177 million grew 11% Y/Y in Q2 (or 14% Y/Y constant currency*), reflecting: Premium Revenue growth of 11% Y/Y (or 14% Y/Y constant currency*), led by subscriber gains; and Ad-Supported Revenue growth of 12% Y/Y (or 15% Y/Y constant currency*) Gross Margin was 24.1% in Q2, down 47 bps Y/Y due to €44 million in net charges primarily related to the shut down of various podcast shows and the impairment of excess real estate. Excluding these charges, Adjusted Gross Margin* was 25.5% and up 22 bps Y/Y, reflecting: Improvement in podcast profitability, growth in Marketplace activity and Other Cost of Revenue favorability; partially offset by Higher music royalty costs Operating Loss of (€247) million in Q2 was impacted by €135 million in net charges. These charges include the aforementioned impact to Gross Margin and an additional €91 million related primarily to our real estate optimization plan and severance. Excluding these charges, Adjusted Operating Loss* was (€112) million and reflected: Higher Social Charges Y/Y; and Higher personnel costs, partially offset by lower marketing and legal costs Free Cash Flow* was €9 million in Q2. Our liquidity and balance sheet remained strong, with €3.5 billion in cash and cash equivalents, restricted cash and short term investments. At the end of Q2, our workforce consisted of 9,473 FTEs globally. Financial Summary * Constant Currency adjusted measures, Adjusted Gross Margin, Adjusted Operating Loss and Free Cash Flow are non-IFRS measures. See "Use of Non-IFRS Measures" and "Reconciliation of IFRS to Non-IFRS Results" for additional information. 8

Revenue Consistent Premium growth, led by subscribers Premium Revenue grew 11% Y/Y to €2,773 million (or 14% Y/Y constant currency*), reflecting subscriber growth of 17% Y/Y and a Premium ARPU* decline of 6% Y/Y to €4.27 (or down 3% constant currency*). Excluding the impact of FX, ARPU performance was impacted by product and market mix. Broad based Ad-Supported growth Ad-Supported revenue grew 12% Y/Y (or 15% Y/Y constant currency*), reflecting double-digit Y/Y growth across nearly all regions. Music advertising revenue grew mid single-digits Y/Y, reflecting double-digit Y/Y growth in impressions sold, partially offset by softer pricing due to the macroeconomic environment. Podcast advertising revenue growth re-accelerated to more than 30% Y/Y with sold impressions across Original and Licensed podcasts and the Spotify Audience Network hitting an all-time-high, partially offset by softer pricing. The Spotify Audience Network saw double digit Q/Q growth in participating advertisers and publishers and high single digit Q/Q growth in participating shows. * Constant Currency adjusted measures are non-IFRS measures. See "Use of Non-IFRS Measures" and "Reconciliation of IFRS to Non-IFRS Results" for additional information. ARPU means Premium Average Revenue per User. Last Twelve Months (LTM) represents annual performance covering the preceding 12 months relative to the last day of the quarter. 9
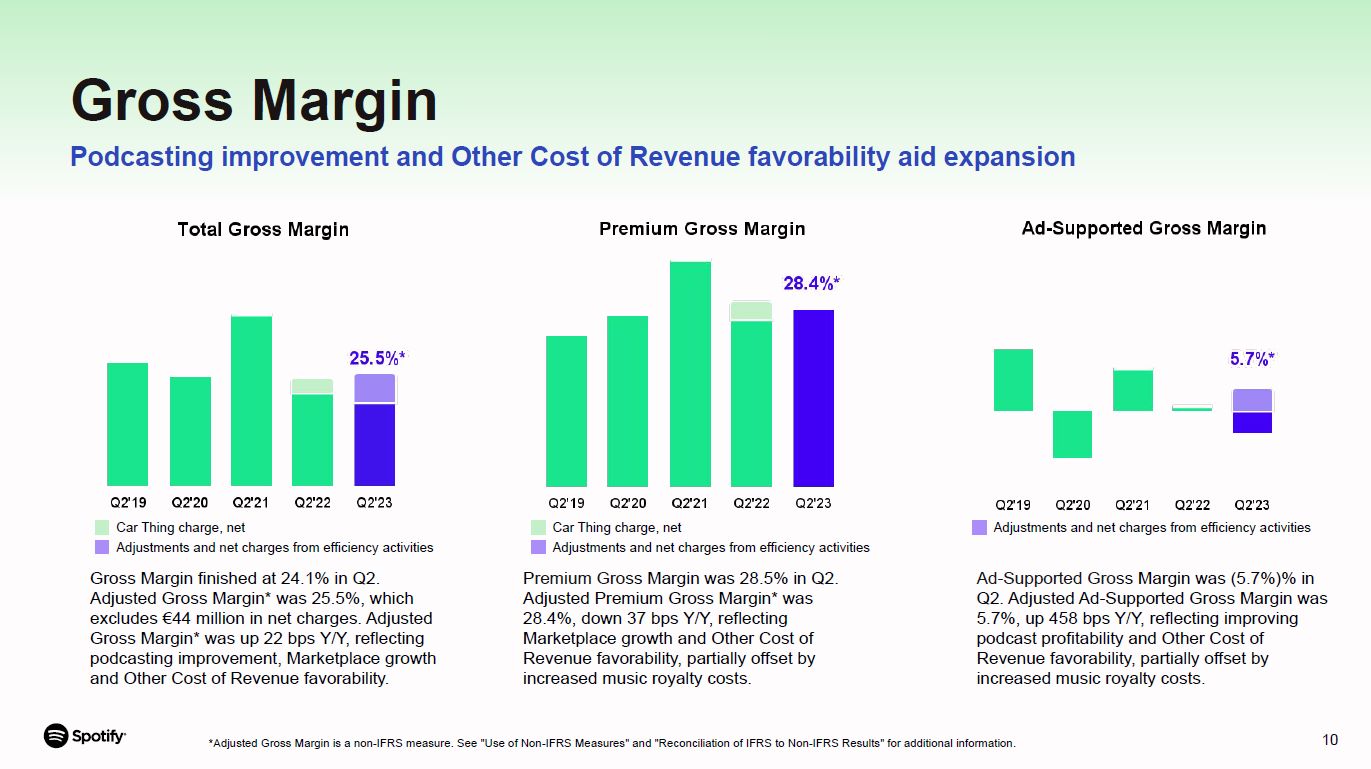
Premium Gross Margin was 28.5% in Q2. Adjusted Premium Gross Margin* was 28.4%, down 37 bps Y/Y, reflecting Marketplace growth and Other Cost of Revenue favorability, partially offset by increased music royalty costs. Gross Margin finished at 24.1% in Q2. Adjusted Gross Margin* was 25.5%, which excludes €44 million in net charges. Adjusted Gross Margin* was up 22 bps Y/Y, reflecting podcasting improvement, Marketplace growth and Other Cost of Revenue favorability. Gross Margin Podcasting improvement and Other Cost of Revenue favorability aid expansion Ad-Supported Gross Margin was (5.7%)% in Q2. Adjusted Ad-Supported Gross Margin was 5.7%, up 458 bps Y/Y, reflecting improving podcast profitability and Other Cost of Revenue favorability, partially offset by increased music royalty costs. *Adjusted Gross Margin is a non-IFRS measure. See "Use of Non-IFRS Measures" and "Reconciliation of IFRS to Non-IFRS Results" for additional information. Car Thing charge, net Adjustments and net charges from efficiency activities Car Thing charge, net Adjustments and net charges from efficiency activities Adjustments and net charges from efficiency activities 10

Operating Expenses grew 13% Y/Y (or 16% constant currency*), driven predominantly by charges related to efficiency efforts of €91 million (contributing ~1,000 bps to Y/Y Operating Expense growth), of which roughly €83 million were related to real-estate impairments and the remaining €8 million were severance-related and other charges. Additionally, Y/Y changes in Social Charge movements of €35 million impacted Y/Y expense growth by 400 bps. All remaining Operating Expense growth reflected higher personnel costs related to Y/Y headcount growth and acquisitions, partially offset by lower marketing and legal costs in the quarter. As a reminder, Social Charges are payroll taxes associated with employee salaries and benefits in select countries where we operate. Since a portion of these taxes is tied to the intrinsic value of share-based compensation awards, movements in our stock price can lead to fluctuations in the taxes we accrue. This resulted in Social Charges related to share-based compensation of €25 million in the current period vs. (€10) million in the prior year period. Operating Expenses Primarily driven by efficiency related charges * Constant Currency adjusted measures are non-IFRS measures. See “Use of Non-IFRS Measures” and “Reconciliation of IFRS to Non-IFRS Results” for additional information. 11
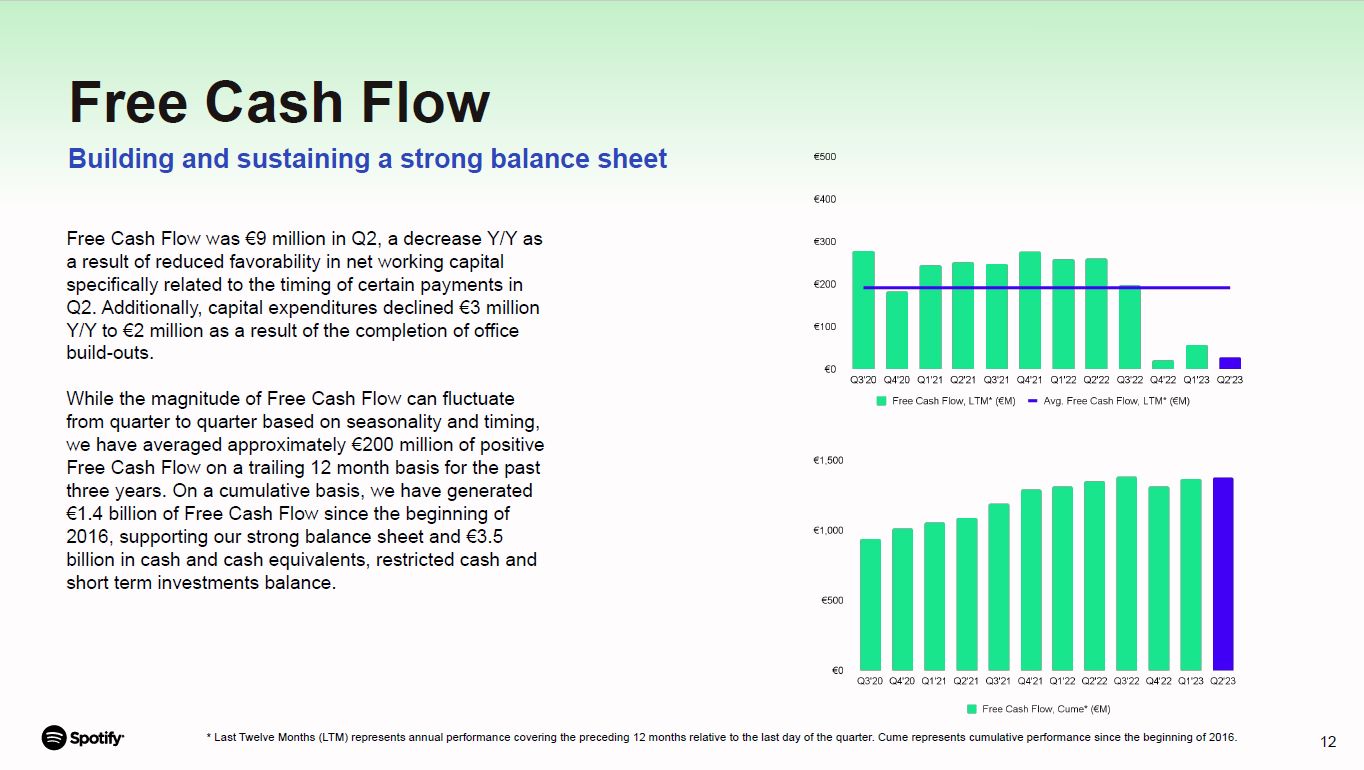
Free Cash Flow Building and sustaining a strong balance sheet Free Cash Flow was €9 million in Q2, a decrease Y/Y as a result of reduced favorability in net working capital specifically related to the timing of certain payments in Q2. Additionally, capital expenditures declined €3 million Y/Y to €2 million as a result of the completion of office build-outs. While the magnitude of Free Cash Flow can fluctuate from quarter to quarter based on seasonality and timing, we have averaged approximately €200 million of positive Free Cash Flow on a trailing 12 month basis for the past three years. On a cumulative basis, we have generated €1.4 billion of Free Cash Flow since the beginning of 2016, supporting our strong balance sheet and €3.5 billion in cash and cash equivalents, restricted cash and short term investments balance. * Last Twelve Months (LTM) represents annual performance covering the preceding 12 months relative to the last day of the quarter. Cume represents cumulative performance since the beginning of 2016. 12

MAUS & SUBSCRIBERS 13
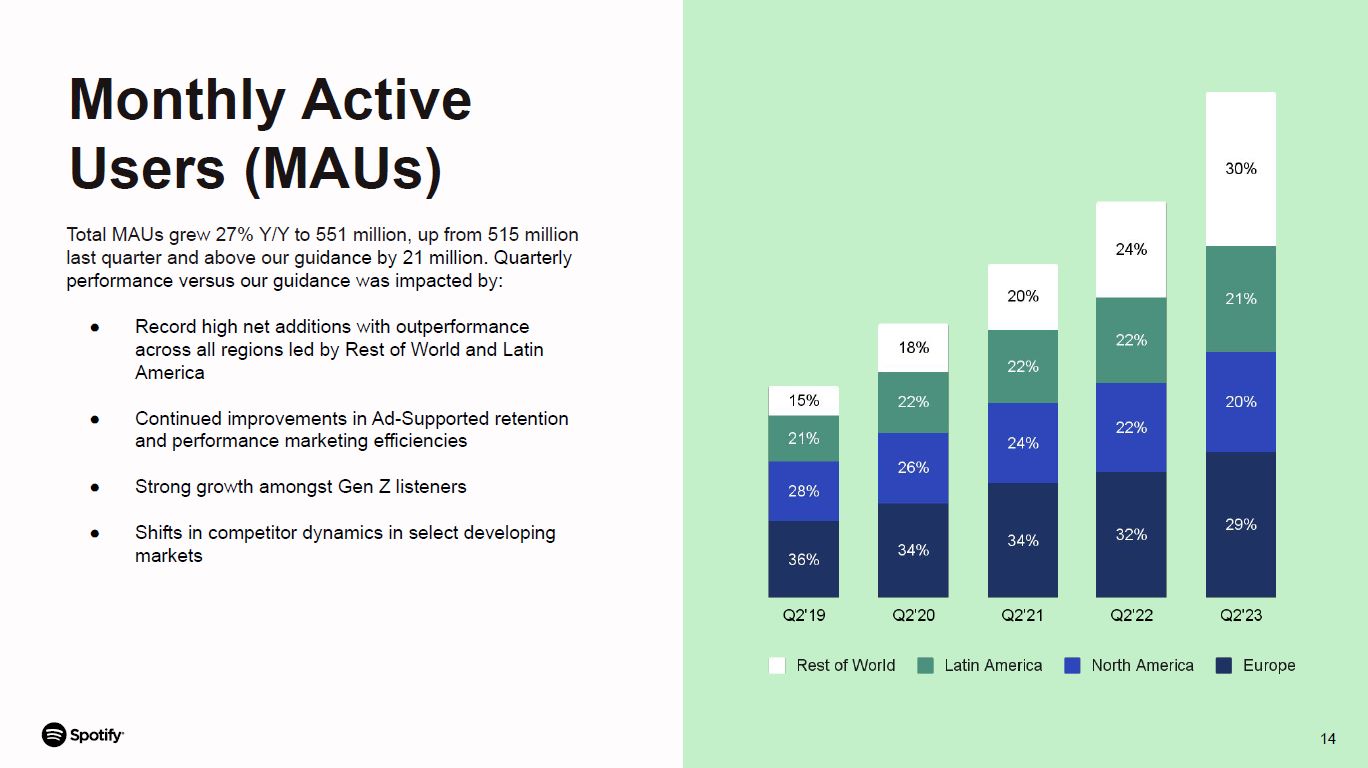
Total MAUs grew 27% Y/Y to 551 million, up from 515 million last quarter and above our guidance by 21 million. Quarterly performance versus our guidance was impacted by: Record high net additions with outperformance across all regions led by Rest of World and Latin America Continued improvements in Ad-Supported retention and performance marketing efficiencies Strong growth amongst Gen Z listeners Shifts in competitor dynamics in select developing markets Monthly Active Users (MAUs) 14

Our Premium Subscribers grew 17% Y/Y to 220 million, up from 210 million last quarter. Quarterly performance versus our guidance was impacted by: Largest Q2 Subscriber net additions in company history across nearly all regions Q2 promotional campaign contributing to subscriber upside Outperformance across all regions, led by Europe and Latin America Premium Subscribers 14

PRODUCT & PLATFORM 16

Building the World’s #1 Audio Network Rolled out AI DJ to Premium users in the United Kingdom and Ireland, the most commonly requested feature by users on social media. Continued to personalize the user experience with 11 new languages and dialects across mobile, bringing the total number of languages on Spotify to 74. Redesigned our Desktop experience with a new look for the Your Library and Now Playing views to provide a richer experience, more context, and quicker access to personal favorites. Launched Spotify Ad Analytics, a free global measurement and reporting service for brands and agencies. 23

Podcasting Deepened engagement with users around the world with more than 100,000 video podcasts now available on Spotify (up from 70,000 in March 2023). Announced a new Spotify Original launching later this year with comedian and former The Daily Show host, Trevor Noah. Unveiled to Megaphone publishers broadcast-to-podcast technology that allows broadcast publishers to increase reach and monetization using our Whooshkaa acquisition. 23

Music Peso Pluma's GENESIS became the most streamed Musica Mexicana album in a week ever after its release on June 23rd. Loreen won big at Eurovision and on Spotify: By the competition finale, “Tattoo” reached 60+ million Spotify streams globally. For the first time ever, we allowed fans to take over and curate the editorial Latin Gen-Z driven playlist: Fuego, by submitting their curation through a unique microsite experience. 23

OUTLOOK 23

Outlook for Q3’23 The following forward-looking statements reflect Spotify’s expectations for Q3 2023 as of July 25, 2023 and are subject to substantial uncertainty. Total MAUs 572 million Implies the addition of approximately 21 million net new MAUs in the quarter Total Premium Subscribers 224 million Implies the addition of approximately 4 million net new subscribers in the quarter Total Revenue €3.3 billion Assumes approximately 600 bps headwind to growth Y/Y due to foreign exchange rate movements; announced price increases are expected to have a minimal impact on Total Revenue in Q3 Gross Margin 26.0% Primarily driven by Y/Y improvement in podcasting and Other Cost of Revenue Operating (Loss)/Income €(45) million Assumes approximately 600 bps benefit to Operating Expense growth Y/Y due to foreign exchange movements 23
Webcast Information We will host a live question and answer session starting at 8:00 a.m. ET today on investors.spotify.com. Daniel Ek, our Founder and CEO, and Paul Vogel, our Chief Financial Officer, will be on hand to answer questions submitted through slido.com using the event code #SpotifyEarningsQ223. Participants also may join using the listen-only conference line by registering through the following site: https://conferencingportals.com/event/txExvogt We use investors.spotify.com and newsroom.spotify.com websites as well as other social media listed in the “Resources – Social Media” tab of our Investors website to disclose material company information. Use of Non-IFRS Measures To supplement our financial information presented in accordance with IFRS, we use the following non-IFRS financial measures: Revenue excluding foreign exchange effect, Premium revenue excluding foreign exchange effect, Ad-Supported revenue excluding foreign exchange effect, Operating expense excluding foreign exchange effect, adjusted gross profit, adjusted gross margin, Premium adjusted gross margin, Ad-Supported adjusted gross margin, adjusted operating income/(loss), adjusted operating margin and Free Cash Flow. Management believes that Revenue excluding foreign exchange effect, Premium revenue excluding foreign exchange effect, Ad-Supported revenue excluding foreign exchange effect, Operating expense excluding foreign exchange effect, gross profit excluding foreign exchange impact, adjusted gross margin, Premium adjusted gross margin, Ad-Supported adjusted gross margin, adjusted operating income/(loss) and adjusted operating margin are useful to investors because they present measures that facilitate comparison to our historical performance. However, these should be considered in addition to, not as a substitute for or superior to, Revenue, Premium revenue, Ad-Supported revenue, Operating expense, gross profit, gross margin, Premium gross margin, ad-supported gross margin, operating loss, and operating margin or other financial measures prepared in accordance with IFRS. Management believes that Free Cash Flow is useful to investors because it presents a measure that approximates the amount of cash generated that is available to repay debt obligations, to make investments, and for certain other activities that exclude certain infrequently occurring and/or non-cash items. However, Free Cash Flow should be considered in addition to, not as a substitute for or superior to, net cash flows (used in)/from operating activities or other financial measures prepared in accordance with IFRS. For more information on these non-IFRS financial measures, please see “Reconciliation of IFRS to Non-IFRS Results” section below. Forward Looking Statements This shareholder update contains estimates and forward-looking statements. All statements other than statements of historical fact are forward-looking statements. The words “may,” “might,” “will,” “could,” “would,” “should,” “expect,” “plan,” “anticipate,” “intend,” “seek,” “believe,” “estimate,” “predict,” “potential,” “continue,” “contemplate,” “possible,” and similar words are intended to identify estimates and forward-looking statements. Our estimates and forward-looking statements are mainly based on our current expectations and estimates of future events and trends, which affect or may affect our businesses and operations. Although we believe that these estimates and forward-looking statements are based upon reasonable assumptions, they are subject to numerous risks and uncertainties and are made in light of information currently available to us. Many important factors may adversely affect our results as indicated in forward-looking statements. These factors include, but are not limited to: our ability to attract prospective users, retain existing users, and monetize our products and services; competition for users, user listening time, and advertisers; risks associated with our international operations and our ability to manage our growth; risks associated with our new products or services and our emphasis on long-term user engagement over short-term results; our ability to predict, recommend, and play content that our users enjoy; our ability to be profitable or generate positive cash flow on a sustained basis; our ability to convince advertisers of the benefits of our advertising offerings; our ability to forecast or optimize advertising inventory amid emerging industry trends in digital advertising; our ability to generate revenues from podcasts, audiobooks, and other non-music content; potential disputes or liabilities associated with content made available on our premium service and ad-supported service (collectively, the “Service”); risks relating to acquisitions, investments, and strategic alliances; our dependence upon third-party licenses for most of the content we stream; our lack of control over third-party content providers who are concentrated and can unilaterally affect our access to content; our ability to comply with complex license agreements; our ability to accurately estimate royalty payments under our license agreements and relevant statutes; the limitations on our operating flexibility due to financial commitments required under certain of our license agreements; our ability to identify the compositions embodied in sound recordings and ownership thereof in order to obtain licenses or comply with existing license agreements; assertions by third parties of infringement or other violations by us of their intellectual property rights; our ability to protect our intellectual property; the dependence of streaming on operating systems, online platforms, hardware, networks, regulations, and standards that we do not control; our ability to maintain the integrity of our technology structure and systems or the security of confidential information; undetected errors, bugs or vulnerabilities in our products; interruptions, delays, or discontinuations in service arising from our systems or systems of third parties; changes in laws or regulations affecting us; risks relating to privacy and data security; our ability to maintain, protect, and enhance our brand; risks associated with increased scrutiny of environmental, social, and governance matters; payment-related risks; our dependence on key personnel and ability to attract, retain, and motivate highly skilled employees; our ability to access to additional capital to support growth; risks relating to currency exchange rate fluctuations and foreign exchange controls; the impact of economic, social, or political conditions, including the continuing effects of the COVID-19 pandemic, rising inflation and interest rates, financial market volatility resulting from recent bank failures, the continued conflict between Russia and Ukraine, and supply chain disruptions; our ability to accurately estimate user metrics and other estimates; our ability to manage and remediate attempts to manipulate streams and attempts to gain or provide unauthorized access to certain features of our Service; risks related to our indebtedness, including risks related to our Exchangeable Notes; fluctuation of our operating results and fair market value of ordinary shares; tax-related risks; the concentration of voting power among our founders, which limits shareholders’ ability to influence our governance and business; and risks related to our status as a foreign private issuer and a Luxembourg company. A detailed discussion of these and other risks and uncertainties that could cause actual results and events to differ materially from our estimates and forward-looking statements is included in our filings with the U.S. Securities and Exchange Commission (“SEC”), including our Annual Report on Form 20-F filed with the SEC on February 2, 2023, as updated by subsequent reports filed with the SEC. We undertake no obligation to update forward-looking statements to reflect events or circumstances occurring after the date of this shareholder update. Rounding Certain monetary amounts, percentages, and other figures included in this update have been subject to rounding adjustments. The sum of individual metrics may not always equal total amounts indicated due to rounding. 23

FINANCIAL STATEMENTS 23
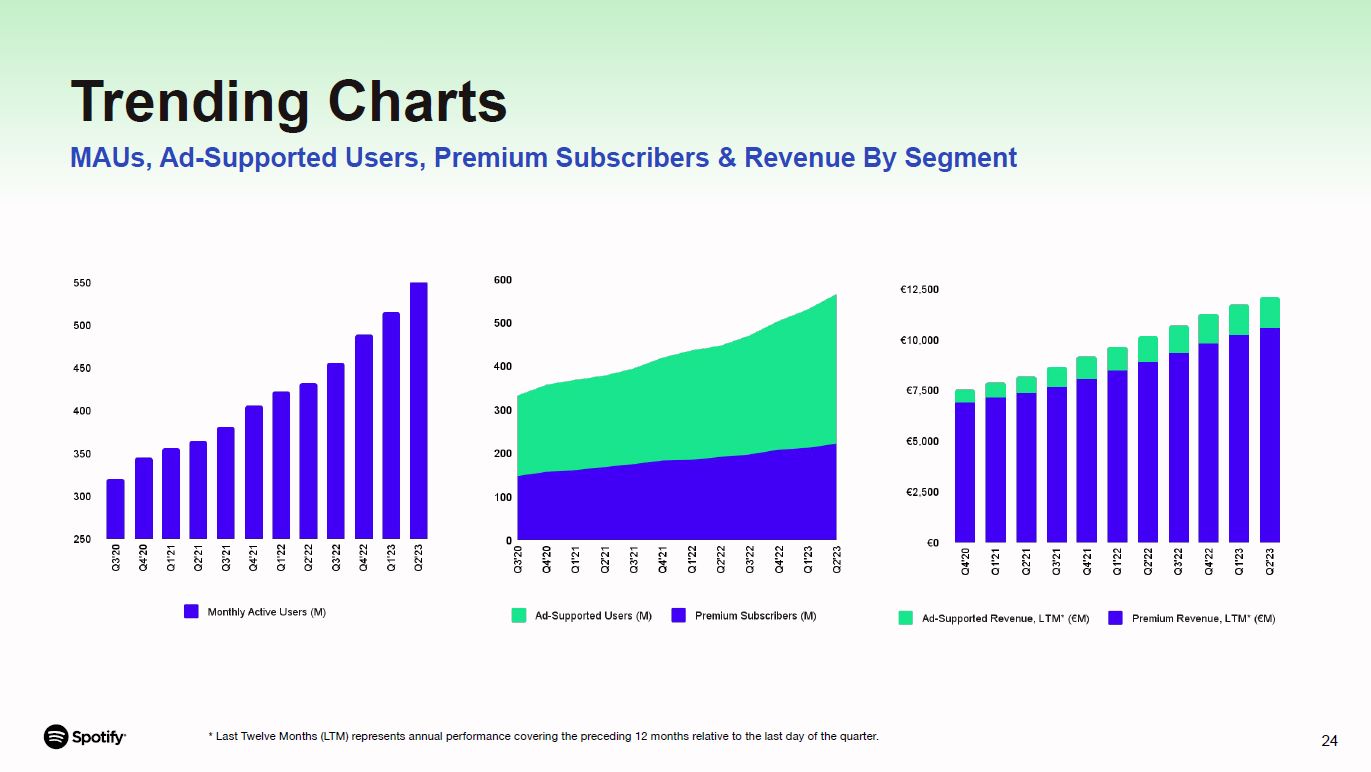
Trending Charts MAUs, Ad-Supported Users, Premium Subscribers & Revenue By Segment * Last Twelve Months (LTM) represents annual performance covering the preceding 12 months relative to the last day of the quarter. 25
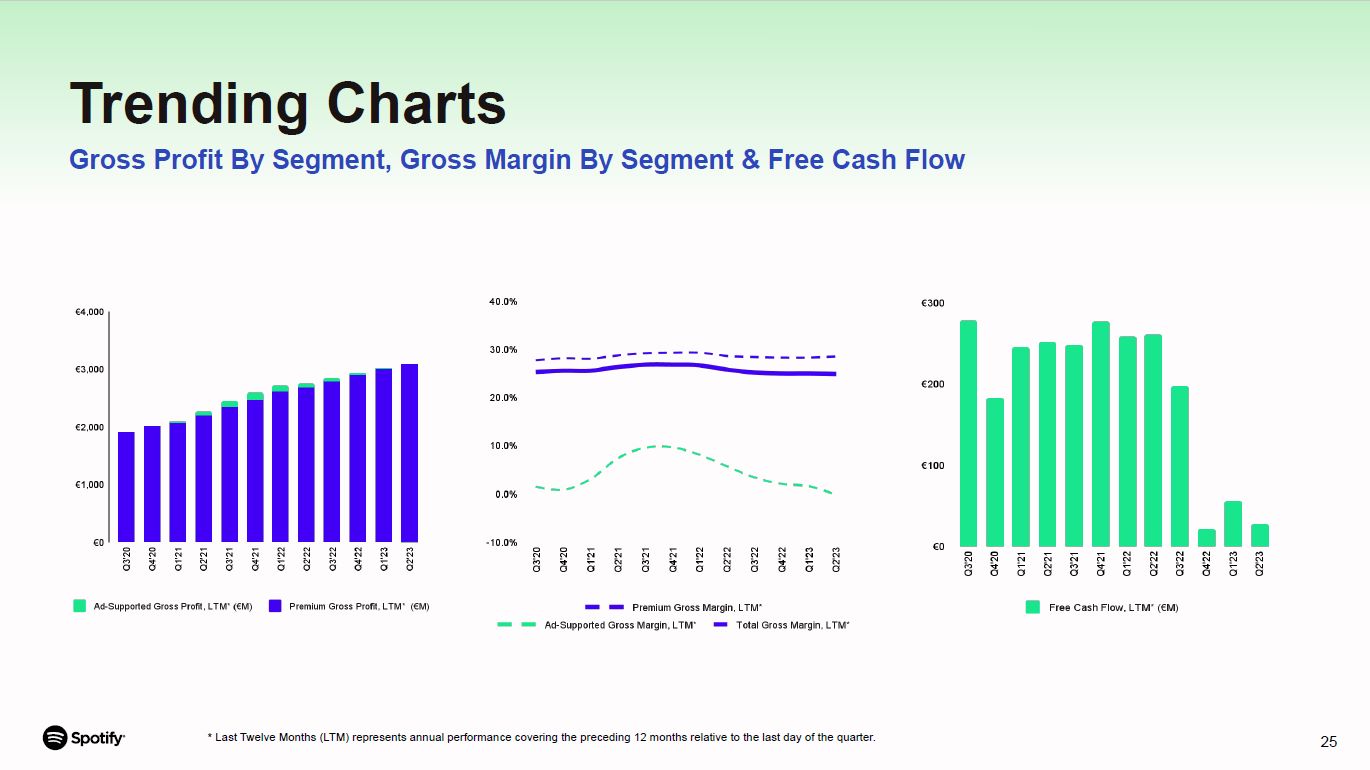
Trending Charts Gross Profit By Segment, Gross Margin By Segment & Free Cash Flow * Last Twelve Months (LTM) represents annual performance covering the preceding 12 months relative to the last day of the quarter. 25
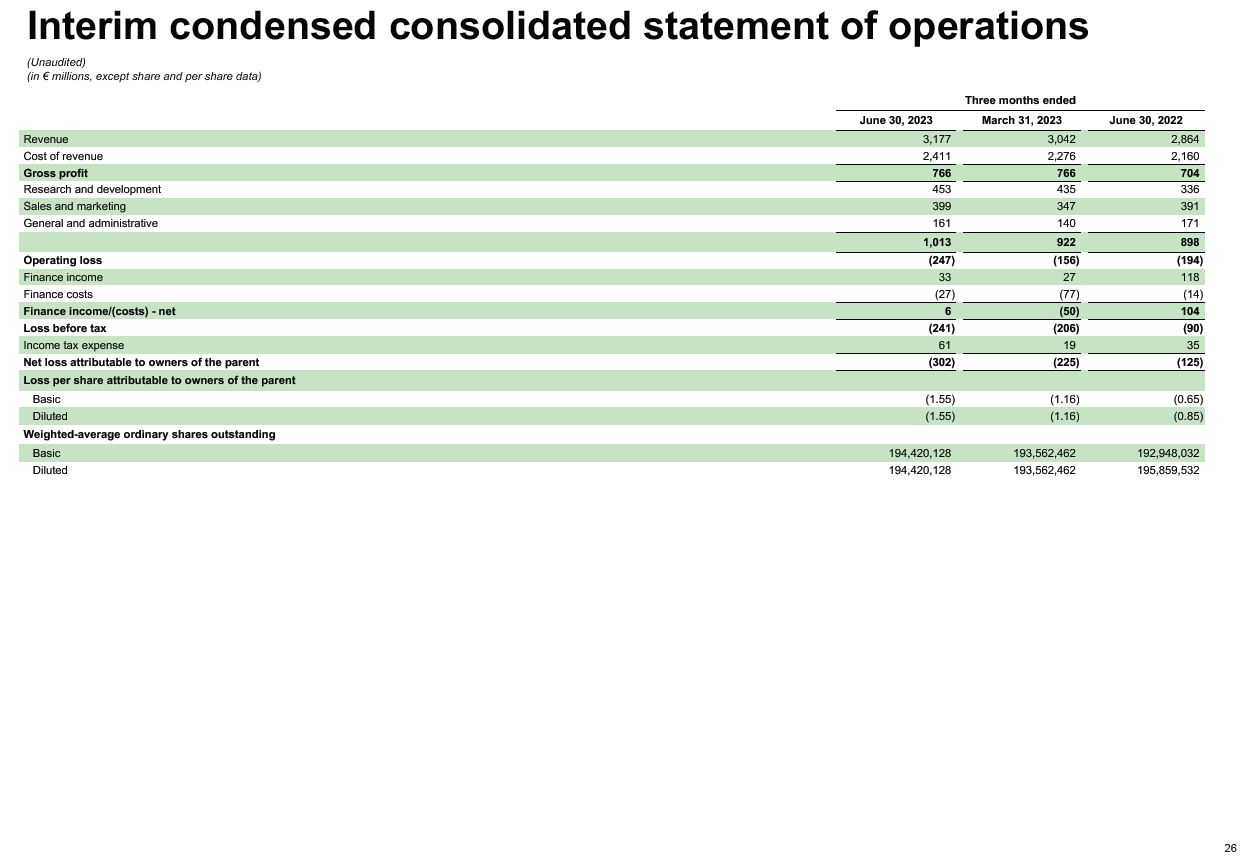
32 Interim condensed consolidated statement of operations (Unaudited) (in € millions, except share and per share data) Three months ended June 30, 2023 March 31, 2023 June 30, 2022 Revenue 3,177 3,042 2,864 Cost of revenue 2,411 2,276 2,160 Gross profit 766 766 704 Research and development 453 435 336 Sales and marketing 399 347 391 General and administrative 161 140 171 1,013 922 898 Operating loss (247) (156) (194) Finance income 33 27 118 Finance costs (27) (77) (14) Finance income/(costs) - net 6 (50) 104 Loss before tax (241) (206) (90) Income tax expense 61 19 35 Net loss attributable to owners of the parent (302) (225) (125) Loss per share attributable to owners of the parent Basic (1.55) (1.16) (0.65) Diluted (1.55) (1.16) (0.85) Weighted-average ordinary shares outstanding Basic 194,420,128 193,562,462 192,948,032 Diluted 194,420,128 193,562,462 195,859,532

June 30, 2023 December 31, 2022 Assets Non-current assets Lease right-of-use assets 344 417 Property and equipment 280 348 Goodwill 1,148 1,168 Intangible assets 105 127 Long term investments 1,015 1,138 Restricted cash and other non-current assets 76 78 Deferred tax assets 15 8 2,983 3,284 Current assets Trade and other receivables 632 690 Income tax receivable 8 5 Short term investments 866 867 Cash and cash equivalents 2,550 2,483 Other current assets 273 307 4,329 4,352 Total assets 7,312 7,636 Equity and liabilities Equity Share capital — — Other paid in capital 4,899 4,789 Treasury shares (262) (262) Other reserves 1,594 1,521 Accumulated deficit (4,177) (3,647) Equity attributable to owners of the parent 2,054 2,401 Non-current liabilities Exchangeable Notes 1,167 1,128 Lease liabilities 522 555 Accrued expenses and other liabilities 14 28 Provisions 3 3 Deferred tax liabilities 6 5 1,712 1,719 Current liabilities Trade and other payables 893 845 Income tax payable 11 11 Deferred revenue 536 520 Accrued expenses and other liabilities 2,053 2,093 Provisions 25 26 Derivative liabilities 28 21 3,546 3,516 Total liabilities 5,258 5,235 Total equity and liabilities 7,312 7,636 Interim condensed consolidated statement of financial position (Unaudited) (in € millions) 32
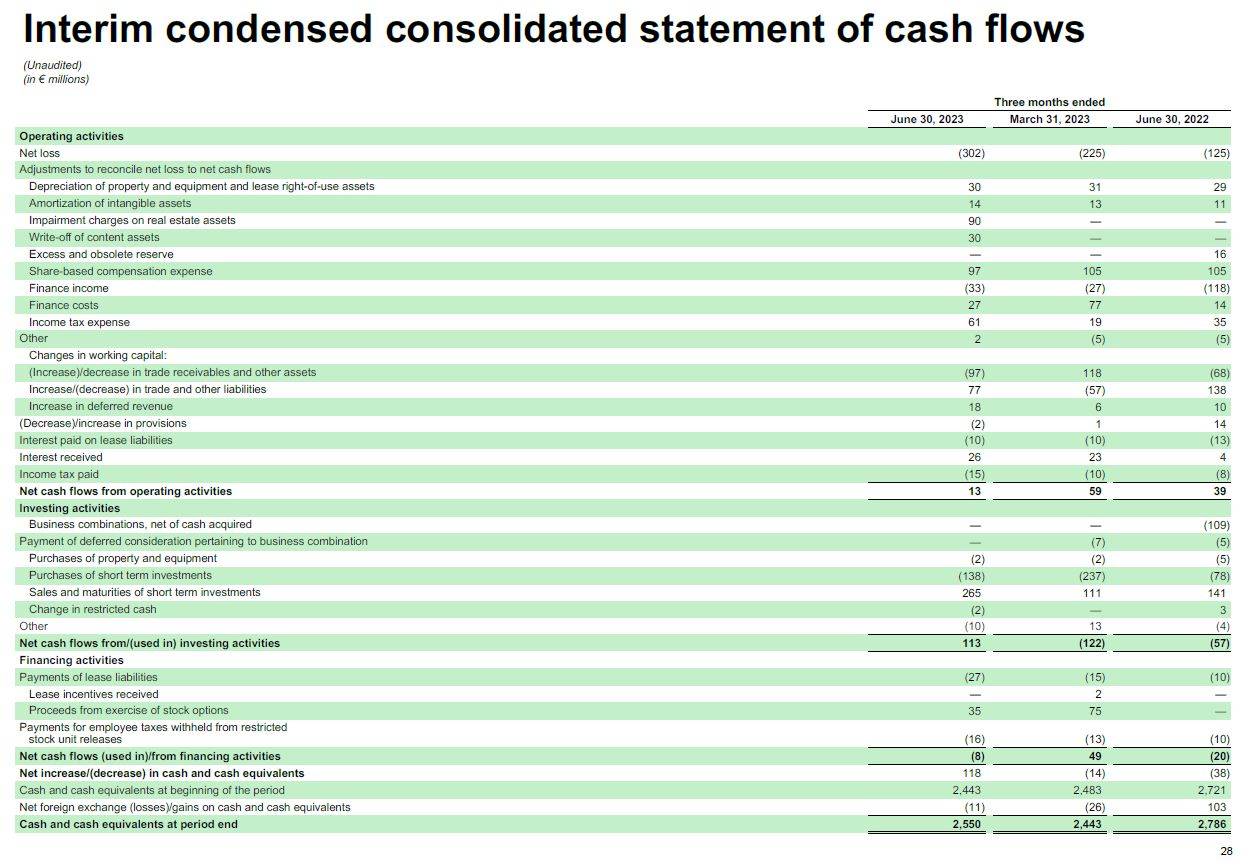
June 30, 2023 March 31, 2023 June 30, 2022 Operating activities Net loss (302) (225) (125) Adjustments to reconcile net loss to net cash flows Depreciation of property and equipment and lease right-of-use assets 30 31 29 Amortization of intangible assets 14 13 11 Impairment charges on real estate assets 90 — — Write-off of content assets 30 — — Excess and obsolete reserve — — 16 Share-based compensation expense 97 105 105 Finance income (33) (27) (118) Finance costs 27 77 14 Income tax expense 61 19 35 Other 2 (5) (5) Changes in working capital: (Increase)/decrease in trade receivables and other assets (97) 118 (68) Increase/(decrease) in trade and other liabilities 77 (57) 138 Increase in deferred revenue 18 6 10 (Decrease)/increase in provisions (2) 1 14 Interest paid on lease liabilities (10) (10) (13) Interest received 26 23 4 Income tax paid (15) (10) (8) Net cash flows from operating activities 13 59 39 Investing activities Business combinations, net of cash acquired — — (109) Payment of deferred consideration pertaining to business combination — (7) (5) Purchases of property and equipment (2) (2) (5) Purchases of short term investments (138) (237) (78) Sales and maturities of short term investments 265 111 141 Change in restricted cash (2) — 3 Other (10) 13 (4) Net cash flows from/(used in) investing activities 113 (122) (57) Financing activities Payments of lease liabilities (27) (15) (10) Lease incentives received — 2 — Proceeds from exercise of stock options 35 75 — Payments for employee taxes withheld from restricted stock unit releases (16) (13) (10) Net cash flows (used in)/from financing activities (8) 49 (20) Net increase/(decrease) in cash and cash equivalents 118 (14) (38) Cash and cash equivalents at beginning of the period 2,443 2,483 2,721 Net foreign exchange (losses)/gains on cash and cash equivalents (11) (26) 103 Cash and cash equivalents at period end 2,550 2,443 2,786 Interim condensed consolidated statement of cash flows 32 (Unaudited) (in € millions) Three months ended
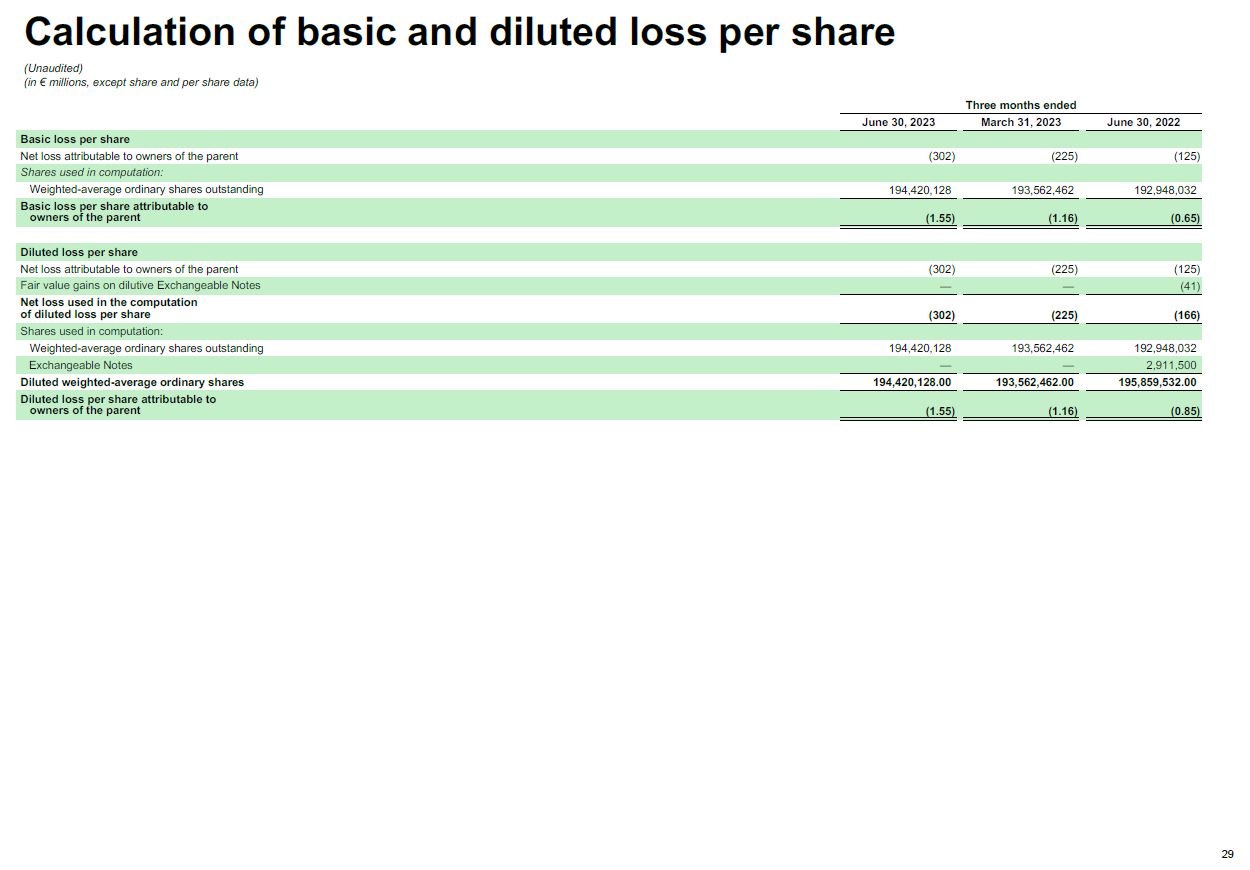
Diluted loss per share Net loss attributable to owners of the parent (302) (225) (125) Fair value gains on dilutive Exchangeable Notes — — (41) Net loss used in the computation of diluted loss per share (302) (225) (166) Shares used in computation: Weighted-average ordinary shares outstanding 194,420,128 193,562,462 192,948,032 Exchangeable Notes — — 2,911,500 Diluted weighted-average ordinary shares 194,420,128.00 193,562,462.00 195,859,532.00 Diluted loss per share attributable to owners of the parent (1.55) (1.16) (0.85) (Unaudited) (in € millions, except share and per share data) Three months ended June 30, 2023 March 31, 2023 June 30, 2022 Basic loss per share Net loss attributable to owners of the parent (302) (225) (125) Shares used in computation: Weighted-average ordinary shares outstanding 194,420,128 193,562,462 192,948,032 Basic loss per share attributable to owners of the parent (1.55) (1.16) (0.65) 32 Calculation of basic and diluted loss per share

32 June 30, 2023 June 30, 2022 IFRS revenue 3,177 2,864 Foreign exchange effect on 2023 revenue using 2022 rates (94) Revenue excluding foreign exchange effect 3,271 IFRS revenue year-over-year change % 11% Revenue excluding foreign exchange effect year-over-year change % 14% IFRS Premium revenue 2,773 2,504 Foreign exchange effect on 2023 Premium revenue using 2022 rates (84) Premium revenue excluding foreign exchange effect 2,857 IFRS Premium revenue year-over-year change % 11% Premium revenue excluding foreign exchange effect year-over-year change % 14% IFRS Ad-Supported revenue 404 360 Foreign exchange effect on 2023 Ad-Supported revenue using 2022 rates (10) Ad-Supported revenue excluding foreign exchange effect 414 IFRS Ad-Supported revenue year-over-year change % 12% Ad-Supported revenue excluding foreign exchange effect year-over-year change % 15% Three months ended Revenue on a constant currency basis (Unaudited) (in € millions, except percentages) Reconciliation of IFRS to non-IFRS results Operating expenses on a constant currency basis (Unaudited) (in € millions, except percentages) June 30, 2023 June 30, 2022 IFRS Operating expenses 1,013 898 Foreign exchange effect on 2023 operating expenses using 2022 rates (27) Operating expenses excluding foreign exchange effect 1,040 IFRS Operating expenses year over year change % 13 % Operating expenses excluding foreign exchange effect year-over-year change % 16 % Three months ended
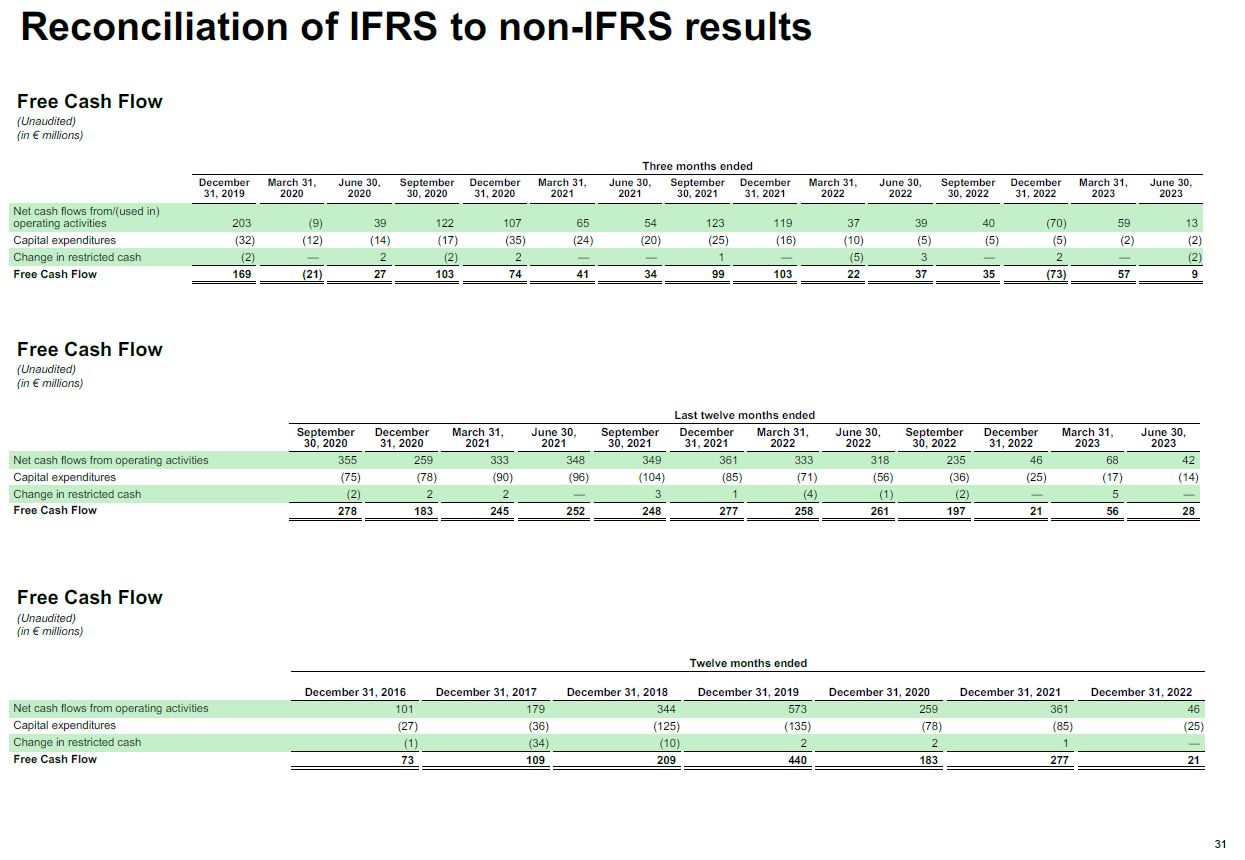
Three months ended December March 31, June 30, September December March 31, June 30, September December March 31, June 30, September December March 31, June 30, 31, 2019 2020 2020 30, 2020 31, 2020 2021 2021 30, 2021 31, 2021 2022 2022 30, 2022 31, 2022 2023 2023 Net cash flows from/(used in) operating activities 203 (9) 39 122 107 65 54 123 119 37 39 40 (70) 59 13 Capital expenditures (32) (12) (14) (17) (35) (24) (20) (25) (16) (10) (5) (5) (5) (2) (2) Change in restricted cash (2) — 2 (2) 2 — — 1 — (5) 3 — 2 — (2) Free Cash Flow 169 (21) 27 103 74 41 34 99 103 22 37 35 (73) 57 9 Last twelve months ended September December March 31, June 30, September December March 31, June 30, September December March 31, June 30, 30, 2020 31, 2020 2021 2021 30, 2021 31, 2021 2022 2022 30, 2022 31, 2022 2023 2023 Net cash flows from operating activities 355 259 333 348 349 361 333 318 235 46 68 42 Capital expenditures (75) (78) (90) (96) (104) (85) (71) (56) (36) (25) (17) (14) Change in restricted cash (2) 2 2 — 3 1 (4) (1) (2) — 5 — Free Cash Flow 278 183 245 252 248 277 258 261 197 21 56 28 Free Cash Flow (Unaudited) (in € millions) Reconciliation of IFRS to non-IFRS results Free Cash Flow (Unaudited) (in € millions) Free Cash Flow (Unaudited) (in € millions) Twelve months ended December 31, 2016 December 31, 2017 December 31, 2018 December 31, 2019 December 31, 2020 December 31, 2021 December 31, 2022 Net cash flows from operating activities 101 179 344 573 259 361 46 Capital expenditures (27) (36) (125) (135) (78) (85) (25) Change in restricted cash (1) (34) (10) 2 2 1 — Free Cash Flow 73 109 209 440 183 277 21 32
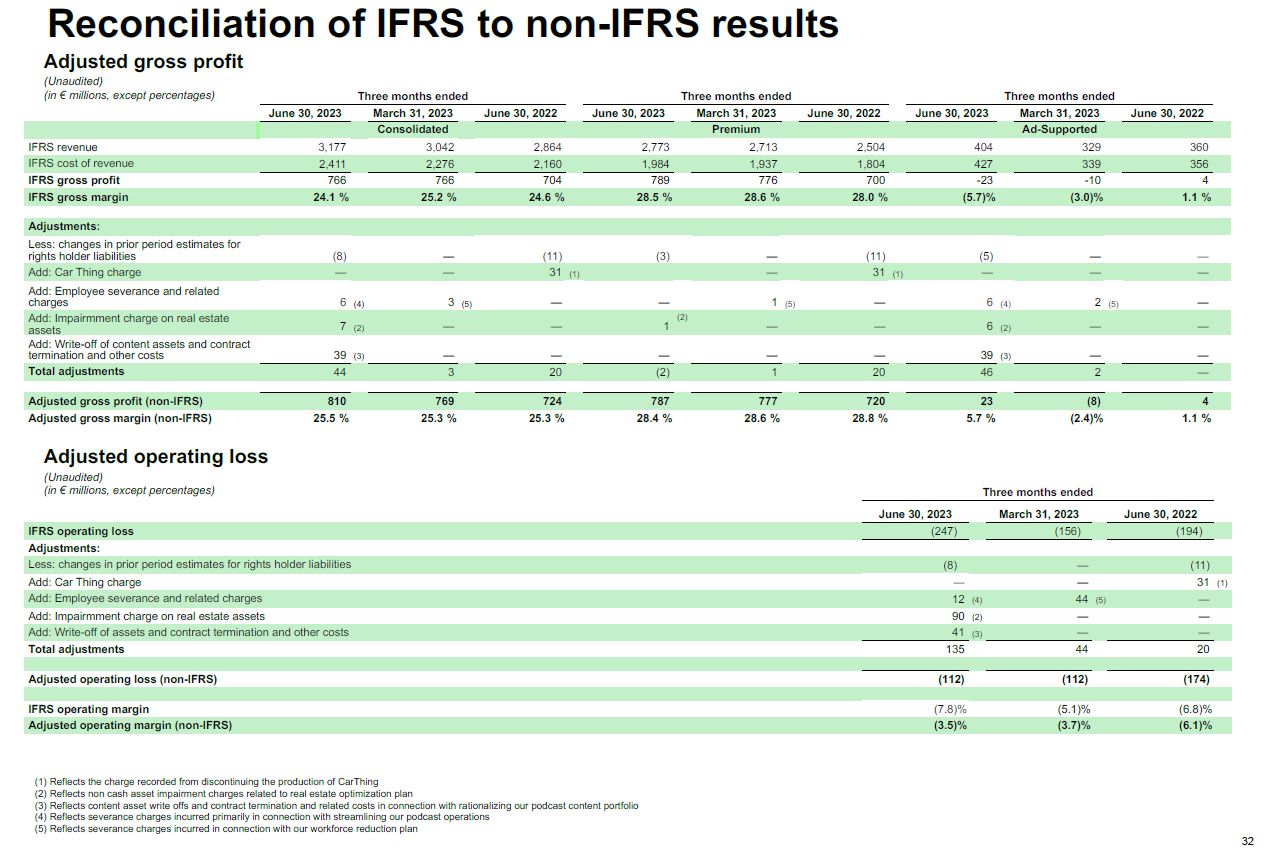
Three months ended June 30, 2023 March 31, 2023 June 30, 2022 Consolidated Premium Ad-Supported IFRS revenue 3,177 3,042 2,864 2,773 2,713 2,504 404 329 360 IFRS cost of revenue 2,411 2,276 2,160 1,984 1,937 1,804 427 339 356 IFRS gross profit 766 766 704 789 776 700 -23 -10 4 IFRS gross margin 24.1 % 25.2 % 24.6 % 28.5 % 28.6 % 28.0 % (5.7)% (3.0)% 1.1 % Adjustments: Less: changes in prior period estimates for rights holder liabilities (8) — (11) (3) — (11) (5) — — Add: Car Thing charge — — 31 (1) — 31 (1) — — — Add: Employee severance and related charges 6 (4) 3 (5) — — 1 (5) — 6 (4) 2 (5) — Add: Impairmment charge on real estate assets 7 (2) — — (2) 1 — — 6 (2) — — Add: Write-off of content assets and contract termination and other costs 39 (3) — — — — — 39 (3) — — Total adjustments 44 3 20 (2) 1 20 46 2 — Adjusted gross profit (non-IFRS) 810 769 724 787 777 720 23 (8) 4 Adjusted gross margin (non-IFRS) 25.5 % 25.3 % 25.3 % 28.4 % 28.6 % 28.8 % 5.7 % (2.4)% 1.1 % 32 Adjusted operating loss (Unaudited) (in € millions, except percentages) Three months ended June 30, 2023 March 31, 2023 June 30, 2022 IFRS operating loss (247) (156) (194) Adjustments: Less: changes in prior period estimates for rights holder liabilities (8) — (11) Add: Car Thing charge — — 31 (1) Add: Employee severance and related charges 12 (4) 44 (5) — Add: Impairmment charge on real estate assets 90 (2) — — Add: Write-off of assets and contract termination and other costs 41 (3) — — Total adjustments 135 44 20 Adjusted operating loss (non-IFRS) (112) (112) (174) IFRS operating margin (7.8)% (5.1)% (6.8)% Adjusted operating margin (non-IFRS) (3.5)% (3.7)% (6.1)% Reconciliation of IFRS to non-IFRS results Adjusted gross profit (Unaudited) (in € millions, except percentages) Three months ended Three months ended June 30, 2023 March 31, 2023 June 30, 2022 June 30, 2023 March 31, 2023 June 30, 2022 Reflects the charge recorded from discontinuing the production of CarThing Reflects non cash asset impairment charges related to real estate optimization plan Reflects content asset write offs and contract termination and related costs in connection with rationalizing our podcast content portfolio Reflects severance charges incurred primarily in connection with streamlining our podcast operations Reflects severance charges incurred in connection with our workforce reduction plan

APPENDIX 33
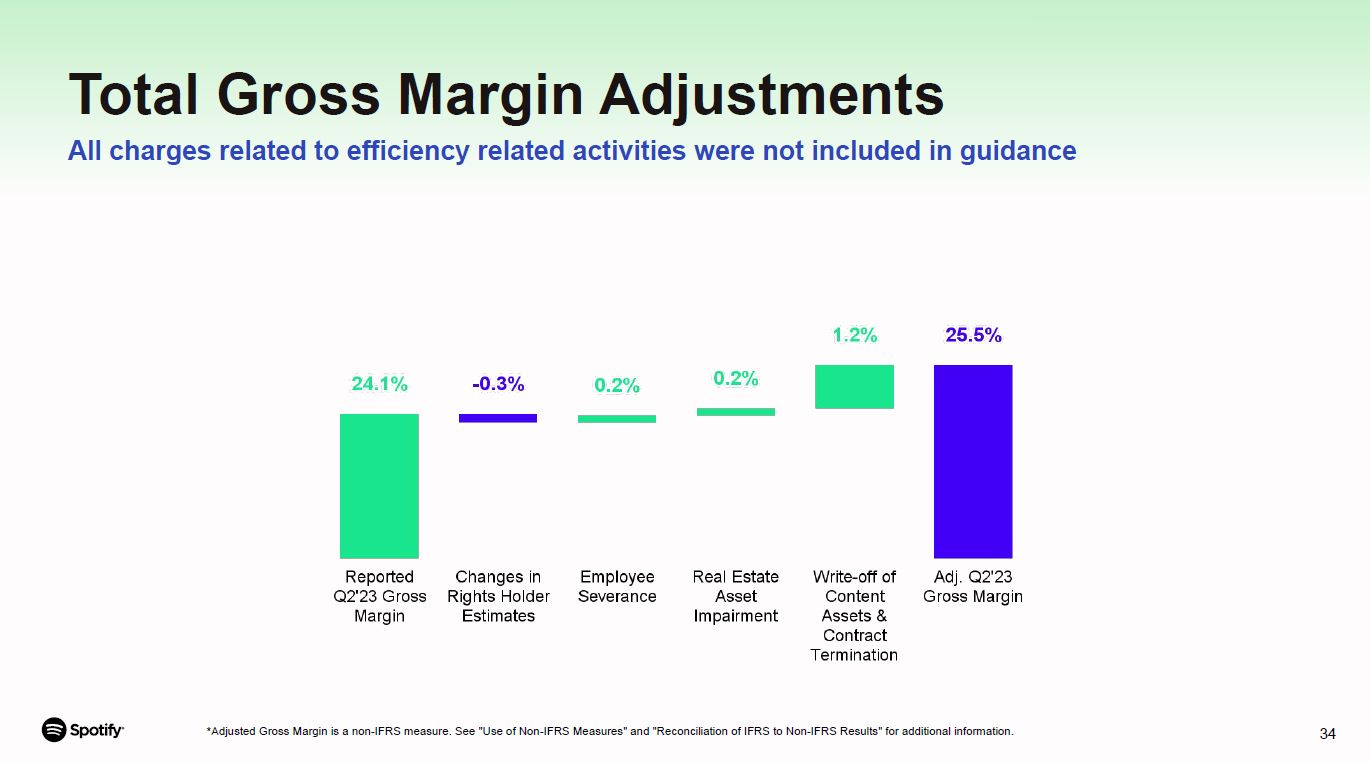
Total Gross Margin Adjustments All charges related to efficiency related activities were not included in guidance *Adjusted Gross Margin is a non-IFRS measure. See "Use of Non-IFRS Measures" and "Reconciliation of IFRS to Non-IFRS Results" for additional information. 34

Social Charges Sensitivity Meaningful movements in our stock price can lead to Social Charge variance Our guidance incorporates the impact of Social Charges, the vast majority of which appear in Operating Expenses. The amount of Social Charges we accrue for and ultimately pay can be volatile, as they are tied to the value of our share price. Since we do not forecast stock price changes in our guidance, meaningful movements in our stock price over the course of a quarter can lead to meaningful changes in Social Charges. As an example, at the Q2 close, our stock price was $160.55. In Q3, a 10% increase or decrease in our stock price compared to the quarter-end price would have an approximate +/- €18M impact on Social Charges. 35
