Exhibit 99.1

Q3 2023 Update October 24th, 2023 1
Table of Contents Key Highlights Financial Summary MAUs & Subscribers Product & Platform Outlook Financial Statements Executive Summary p.03 22 p.04 p.06 p.13 p.16 p.21 p.24

USER & FINANCIAL SUMMARY Q3 2022 Q2 2023 Q3 2023 Y/Y Q/Q USERS (M) Total Monthly Active Users ("MAUs") 456 551 574 26% 4% Premium Subscribers 195 220 226 16% 3% Ad-Supported MAUs 273 343 361 32% 5% FINANCIALS (€M) Premium 2,651 2,773 2,910 10% 5% Ad-Supported 385 404 447 16% 11% Total Revenue 3,036 3,177 3,357 11% 6% Gross Profit 750 766 885 18% 16% Gross Margin 24.7% 24.1% 26.4% -- -- Adjusted Gross Margin* -- 25.5% -- -- -- Operating (Loss)/Income (228) (247) 32 -- -- Operating Margin (7.5%) (7.8%) 1.0% -- -- Adjusted Operating (Loss)/Income* -- (112) -- -- -- Adjusted Operating Margin* -- (3.5%) -- -- -- Net Cash Flows From Operating Activities 40 13 211 -- -- Free Cash Flow* 35 9 216 -- -- The business delivered strong results in Q3, as all of our KPIs exceeded guidance. Our MAU performance remained solid, with net additions of 23 million surpassing guidance by 2 million. Subscriber net additions of 6 million were also ahead by 2 million. Revenue was better and grew 17% Y/Y on a constant currency* basis, reflecting ~300 bps of sequential acceleration vs. Q2’23. Gross Margin of 26.4% was also ahead of guidance and up 166 bps Y/Y. Operating Income of €32 million was better due to the higher Gross Margin, as well as lower than expected personnel and related costs and marketing spend. Free Cash Flow* was €216 million in the quarter. Overall, we are pleased with our performance in Q3, and view the business as well positioned to drive continued progress towards delivering against our Investor Day goals. Executive Summary * Constant Currency, Adjusted Gross Margin, Adjusted Operating Loss, Adjusted Operating Margin and Free Cash Flow are non-IFRS measures. See "Use of Non-IFRS Measures" and "Reconciliation of IFRS to Non-IFRS Results" for additional information. 3

Second largest Q3 for MAU net additions with continued Subscriber outperformance Expanded AI DJ to 50 additional markets and unveiled new user features such as Jam and daylist Unveiled AI Voice Translation for select podcasts Released Showcase, a tool to help artists promote music releases In October, incorporated over 150,000 audiobook titles into our Premium offering in the United Kingdom and Australia Key Highlights Accelerating constant currency* Revenue growth with return to Profitability Total Revenue grew 11% Y/Y to €3.4 billion On a constant currency* basis, Total Revenue grew 17% Y/Y vs. 14% in Q2’23 Gross Margin finished at 26.4% (up 166 bps Y/Y) Achieved Operating Income of €32 million Unveiled new personalized experiences for users and tools for creators MAUs grew 26% Y/Y to 574 million, 2 million above guidance. Net additions of 23 million represented our second largest Q3 net addition performance in our history Premium Subscribers grew 16% Y/Y to 226 million, 2 million above guidance * Constant Currency adjusted measures are non-IFRS measures. See "Use of Non-IFRS Measures" and "Reconciliation of IFRS to Non-IFRS Results" for additional information. 4

Results Q3 2023 Actuals Guidance Total Revenue (€B) Above €3.4 €3.3 Gross Margin Above 26.4% 26.0% Operating (Loss)/Income (€M) Above €32 (€45) Key Highlights: Actuals vs. Guidance Users Results Q3 2023 Actuals Guidance Monthly Active Users (M) Above 574 572 Premium Subscribers (M) Above 226 224 Financials 6

FINANCIAL SUMMARY 6

Financial Summary * Free Cash Flow and Constant Currency adjusted measures (FXN) are non-IFRS measures. See “Use of Non-IFRS Measures” and “Reconciliation of IFRS to Non-IFRS Results” for additional information. USER, FINANCIAL & LIQUIDITY SUMMARY Q3 2022 Q4 2022 Q1 2023 Q2 2023 Q3 2023 Y/Y Y/Y FXN* USERS (M) Total Monthly Active Users ("MAUs") 456 489 515 551 574 26% -- Premium Subscribers 195 205 210 220 226 16% -- Ad-Supported MAUs 273 295 317 343 361 32% -- FINANCIALS (€M) Premium 2,651 2,717 2,713 2,773 2,910 10% 16% Ad-Supported 385 449 329 404 447 16% 24% Total Revenue 3,036 3,166 3,042 3,177 3,357 11% 17% Gross Profit 750 801 766 766 885 18% 24% Gross Margin 24.7% 25.3% 25.2% 24.1% 26.4% -- -- Total Operating Expenses 978 1,032 922 1,013 853 -13% -8% Operating (Loss)/Income (228) (231) (156) (247) 32 -- -- Operating Margin (7.5%) (7.3%) (5.1%) (7.8%) 1.0% -- -- FREE CASH FLOW & LIQUIDITY (€M, unless otherwise denoted) Net Cash Flows From Operating Activities 40 (70) 59 13 211 -- -- Free Cash Flow* 35 (73) 57 9 216 -- -- Cash & Cash Equivalents, Restricted Cash & Short Term Investments (€B) 3.7 3.4 3.5 3.5 3.8 -- -- 7
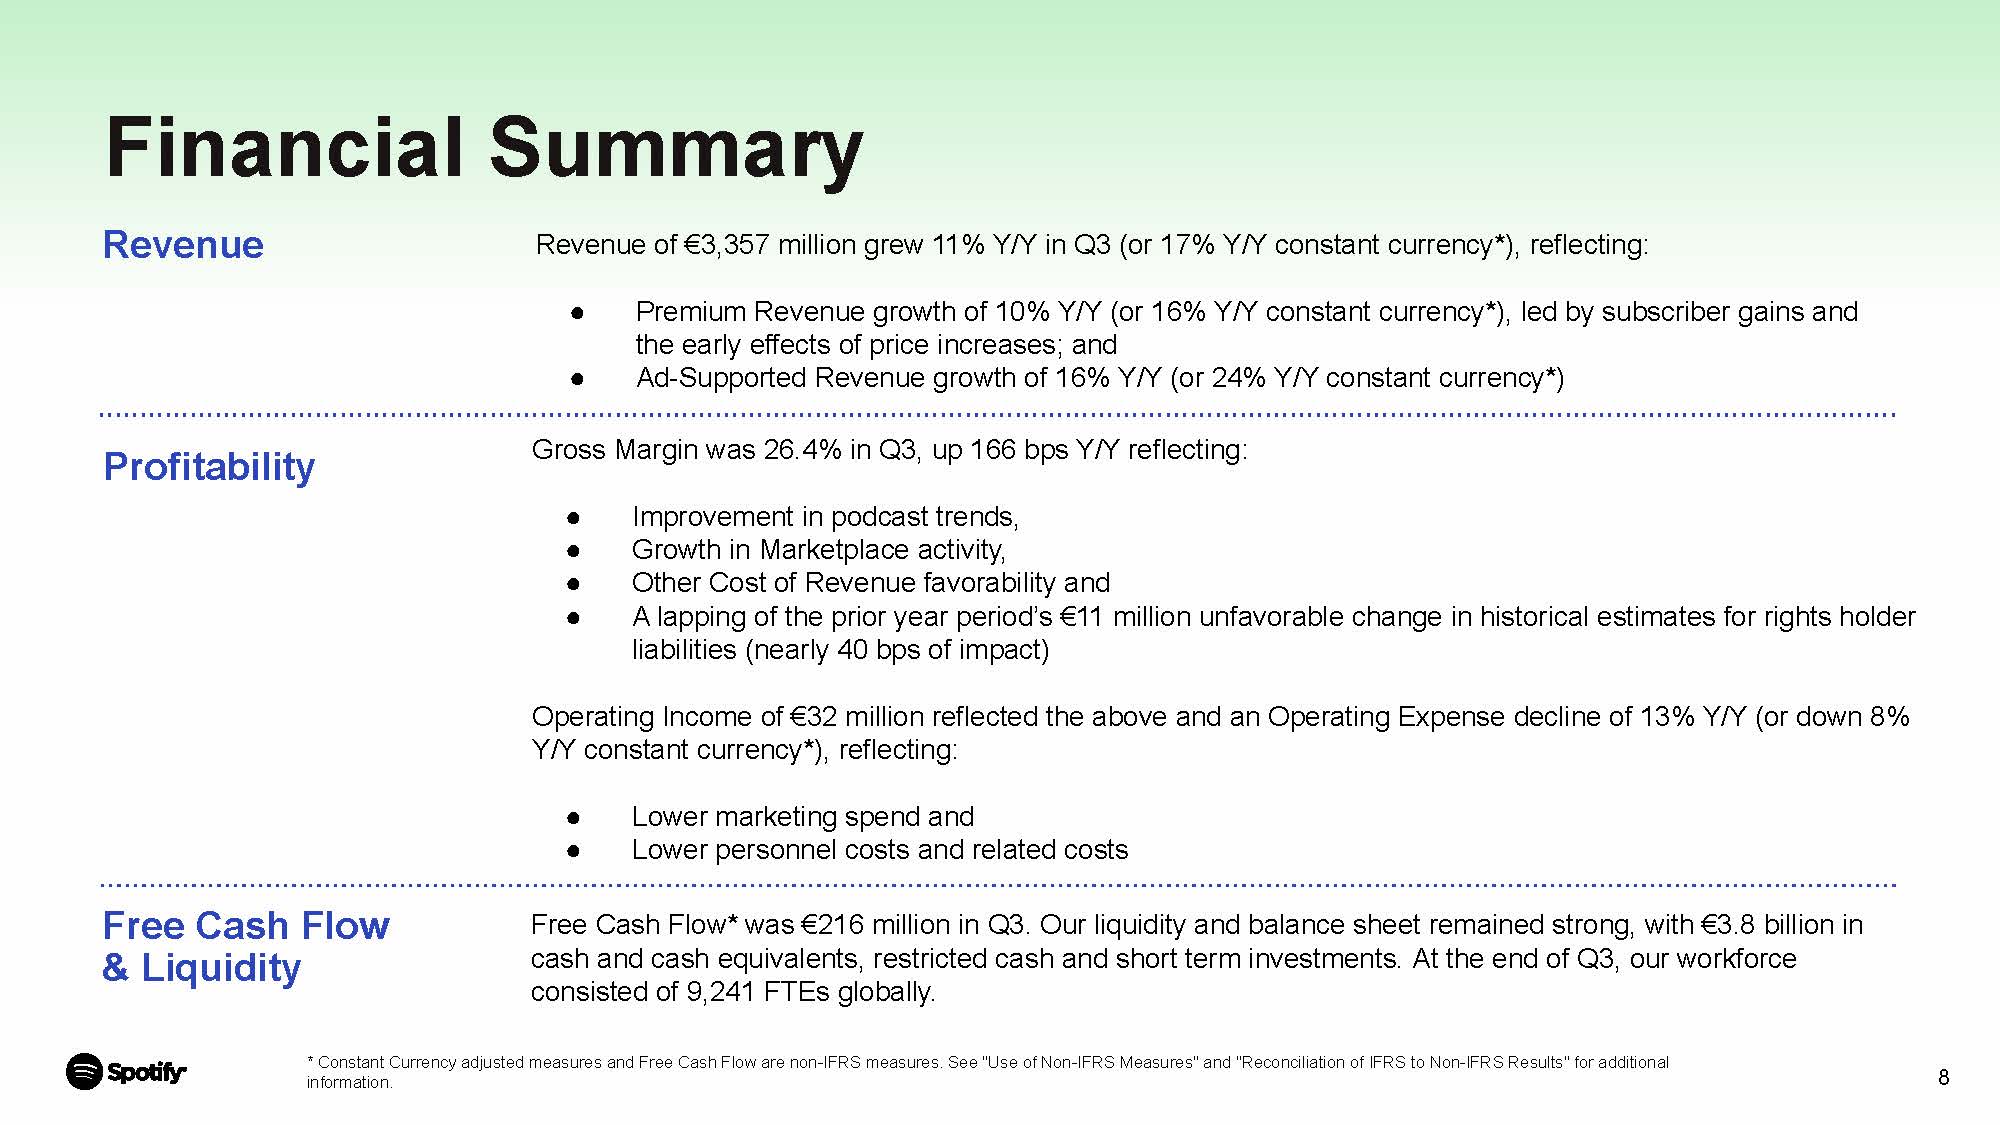
Revenue Profitability Free Cash Flow & Liquidity Revenue of €3,357 million grew 11% Y/Y in Q3 (or 17% Y/Y constant currency*), reflecting: Premium Revenue growth of 10% Y/Y (or 16% Y/Y constant currency*), led by subscriber gains and the early effects of price increases; and Ad-Supported Revenue growth of 16% Y/Y (or 24% Y/Y constant currency*) Gross Margin was 26.4% in Q3, up 166 bps Y/Y reflecting: Improvement in podcast trends, Growth in Marketplace activity, Other Cost of Revenue favorability and A lapping of the prior year period’s €11 million unfavorable change in historical estimates for rights holder liabilities (nearly 40 bps of impact) Operating Income of €32 million reflected the above and an Operating Expense decline of 13% Y/Y (or down 8% Y/Y constant currency*), reflecting: Lower marketing spend and Lower personnel costs and related costs Free Cash Flow* was €216 million in Q3. Our liquidity and balance sheet remained strong, with €3.8 billion in cash and cash equivalents, restricted cash and short term investments. At the end of Q3, our workforce consisted of 9,241 FTEs globally. Financial Summary * Constant Currency adjusted measures and Free Cash Flow are non-IFRS measures. See "Use of Non-IFRS Measures" and "Reconciliation of IFRS to Non-IFRS Results" for additional information. 8
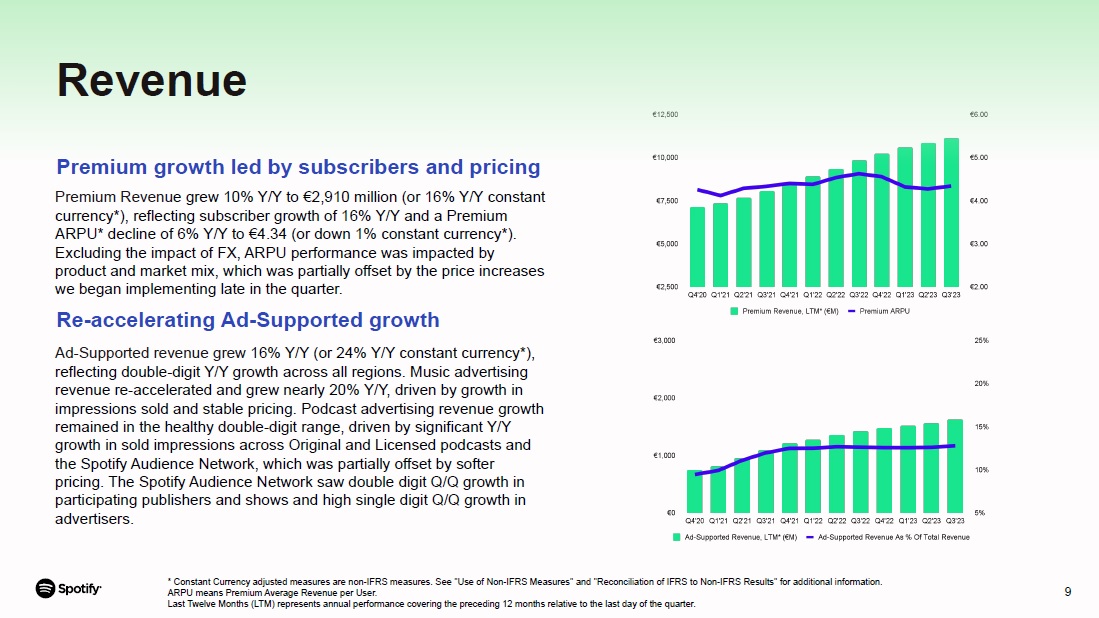
Revenue * Constant Currency adjusted measures are non-IFRS measures. See "Use of Non-IFRS Measures" and "Reconciliation of IFRS to Non-IFRS Results" for additional information. ARPU means Premium Average Revenue per User. Last Twelve Months (LTM) represents annual performance covering the preceding 12 months relative to the last day of the quarter. Premium growth led by subscribers and pricing Premium Revenue grew 10% Y/Y to €2,910 million (or 16% Y/Y constant currency*), reflecting subscriber growth of 16% Y/Y and a Premium ARPU* decline of 6% Y/Y to €4.34 (or down 1% constant currency*). Excluding the impact of FX, ARPU performance was impacted by product and market mix, which was partially offset by the price increases we began implementing late in the quarter. Re-accelerating Ad-Supported growth Ad-Supported revenue grew 16% Y/Y (or 24% Y/Y constant currency*), reflecting double-digit Y/Y growth across all regions. Music advertising revenue re-accelerated and grew nearly 20% Y/Y, driven by growth in impressions sold and stable pricing. Podcast advertising revenue growth remained in the healthy double-digit range, driven by significant Y/Y growth in sold impressions across Original and Licensed podcasts and the Spotify Audience Network, which was partially offset by softer pricing. The Spotify Audience Network saw double digit Q/Q growth in participating publishers and shows and high single digit Q/Q growth in advertisers. 9
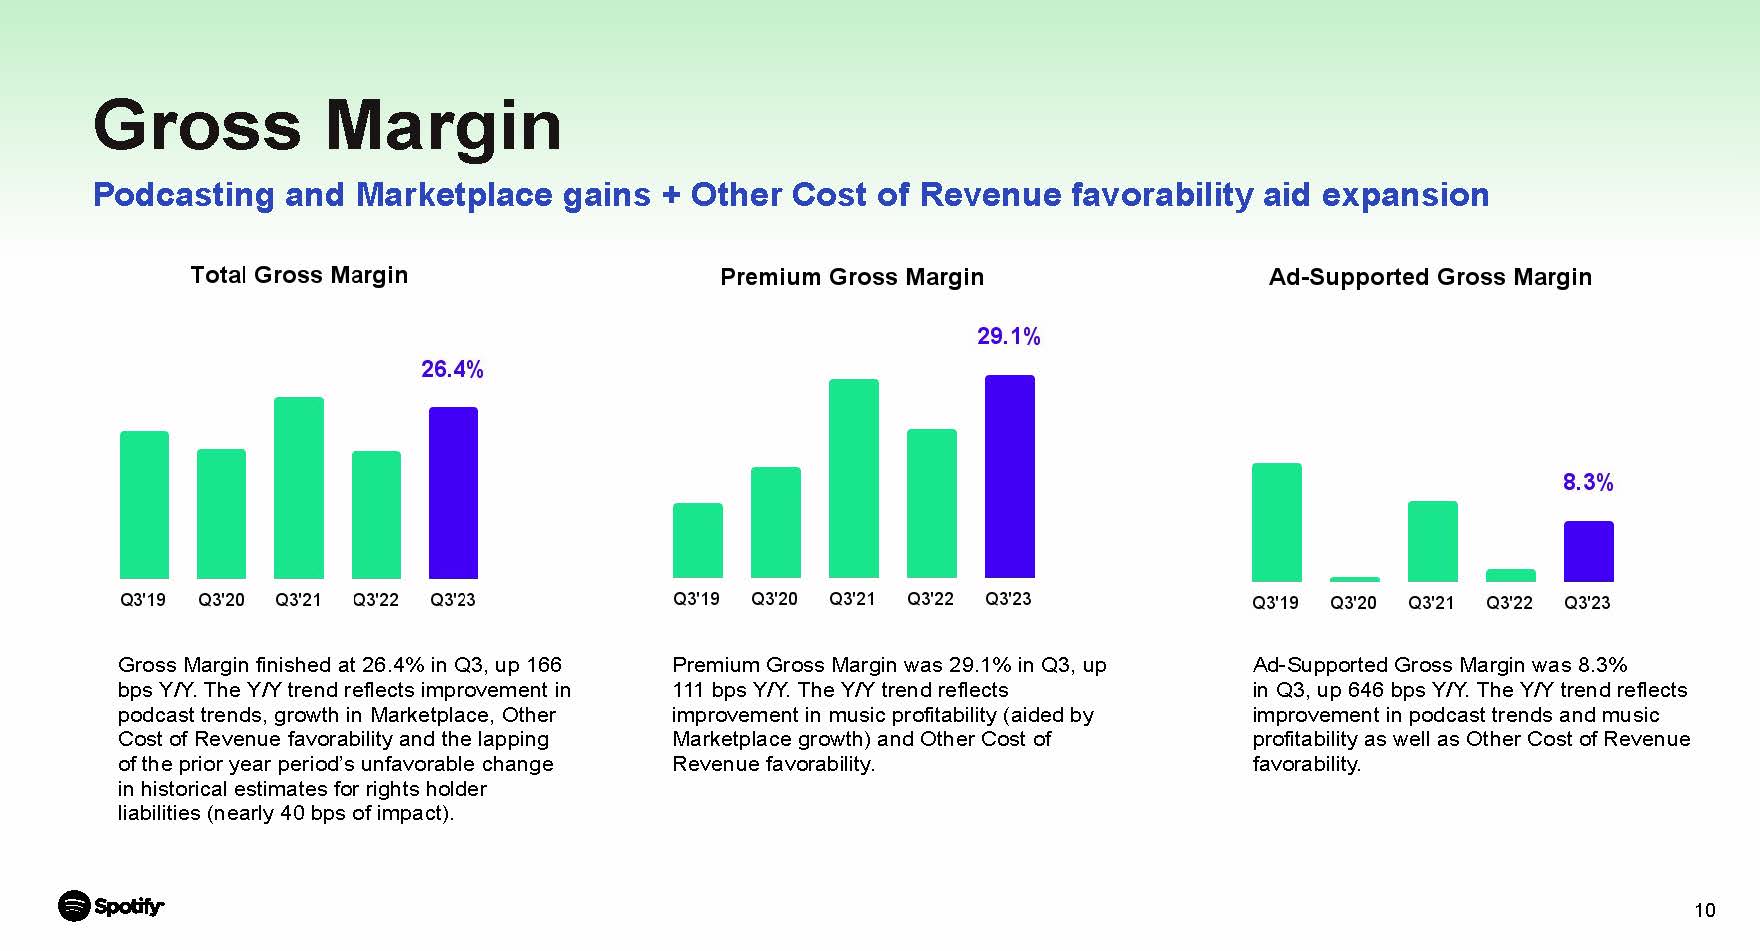
Premium Gross Margin was 29.1% in Q3, up 111 bps Y/Y. The Y/Y trend reflects improvement in music profitability (aided by Marketplace growth) and Other Cost of Revenue favorability. Gross Margin Podcasting and Marketplace gains + Other Cost of Revenue favorability aid expansion Gross Margin finished at 26.4% in Q3, up 166 bps Y/Y. The Y/Y trend reflects improvement in podcast trends, growth in Marketplace, Other Cost of Revenue favorability and the lapping of the prior year period’s unfavorable change in historical estimates for rights holder liabilities (nearly 40 bps of impact). Ad-Supported Gross Margin was 8.3% in Q3, up 646 bps Y/Y. The Y/Y trend reflects improvement in podcast trends and music profitability as well as Other Cost of Revenue favorability. 10

Operating Expenses declined 13% Y/Y (or down 8% Y/Y on a constant currency* basis), driven primarily by lower marketing expenses and a decrease in personnel and related costs. Social Charge movements were modestly better than expected but not a meaningful driver of the Y/Y trend. We are encouraged by the early results we have seen from select efficiency initiatives. As a reminder, Social Charges are payroll taxes associated with employee salaries and benefits in select countries where we operate. Since a portion of these taxes is tied to the intrinsic value of share-based compensation awards, movements in our stock price can lead to fluctuations in the taxes we accrue. Operating Expenses Y/Y decline led by lower marketing and personnel costs * Constant Currency adjusted measures are non-IFRS measures. See “Use of Non-IFRS Measures” and “Reconciliation of IFRS to Non-IFRS Results” for additional information. 11
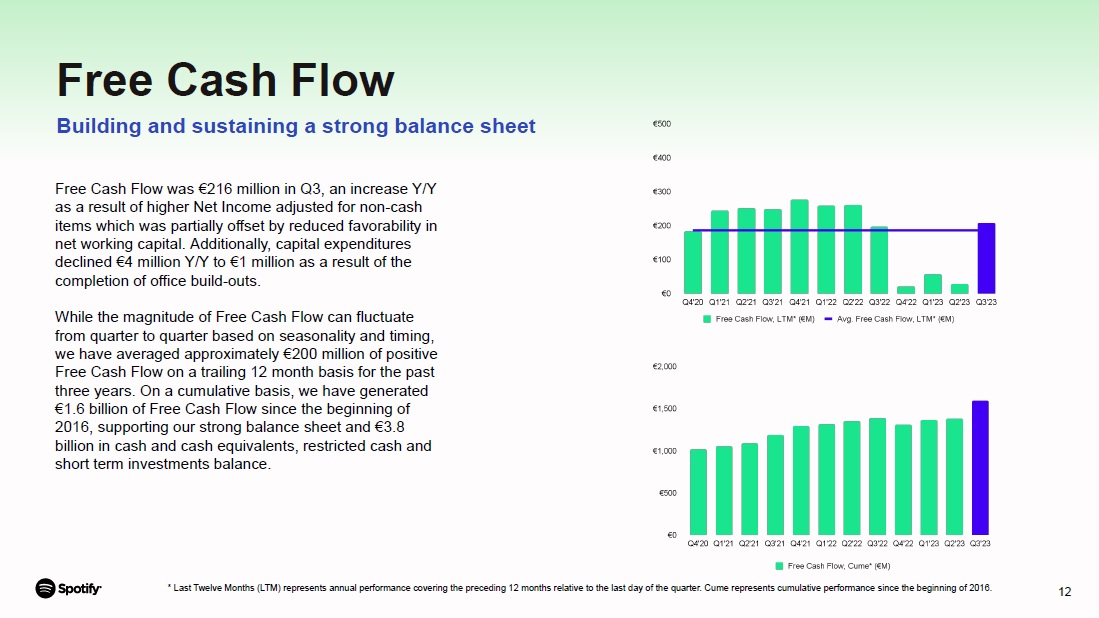
Free Cash Flow Building and sustaining a strong balance sheet Free Cash Flow was €216 million in Q3, an increase Y/Y as a result of higher Net Income adjusted for non-cash items which was partially offset by reduced favorability in net working capital. Additionally, capital expenditures declined €4 million Y/Y to €1 million as a result of the completion of office build-outs. While the magnitude of Free Cash Flow can fluctuate from quarter to quarter based on seasonality and timing, we have averaged approximately €200 million of positive Free Cash Flow on a trailing 12 month basis for the past three years. On a cumulative basis, we have generated €1.6 billion of Free Cash Flow since the beginning of 2016, supporting our strong balance sheet and €3.8 billion in cash and cash equivalents, restricted cash and short term investments balance. * Last Twelve Months (LTM) represents annual performance covering the preceding 12 months relative to the last day of the quarter. Cume represents cumulative performance since the beginning of 2016. 12

MAUS & SUBSCRIBERS 13

Total MAUs grew 26% Y/Y to 574 million, up from 551 million last quarter and above our guidance by 2 million. Quarterly performance versus our guidance was impacted by: Sustained double digit Y/Y growth in all regions Outperformance in Rest of World and Latin America Continued performance marketing efficiencies Monthly Active Users (MAUs) 14
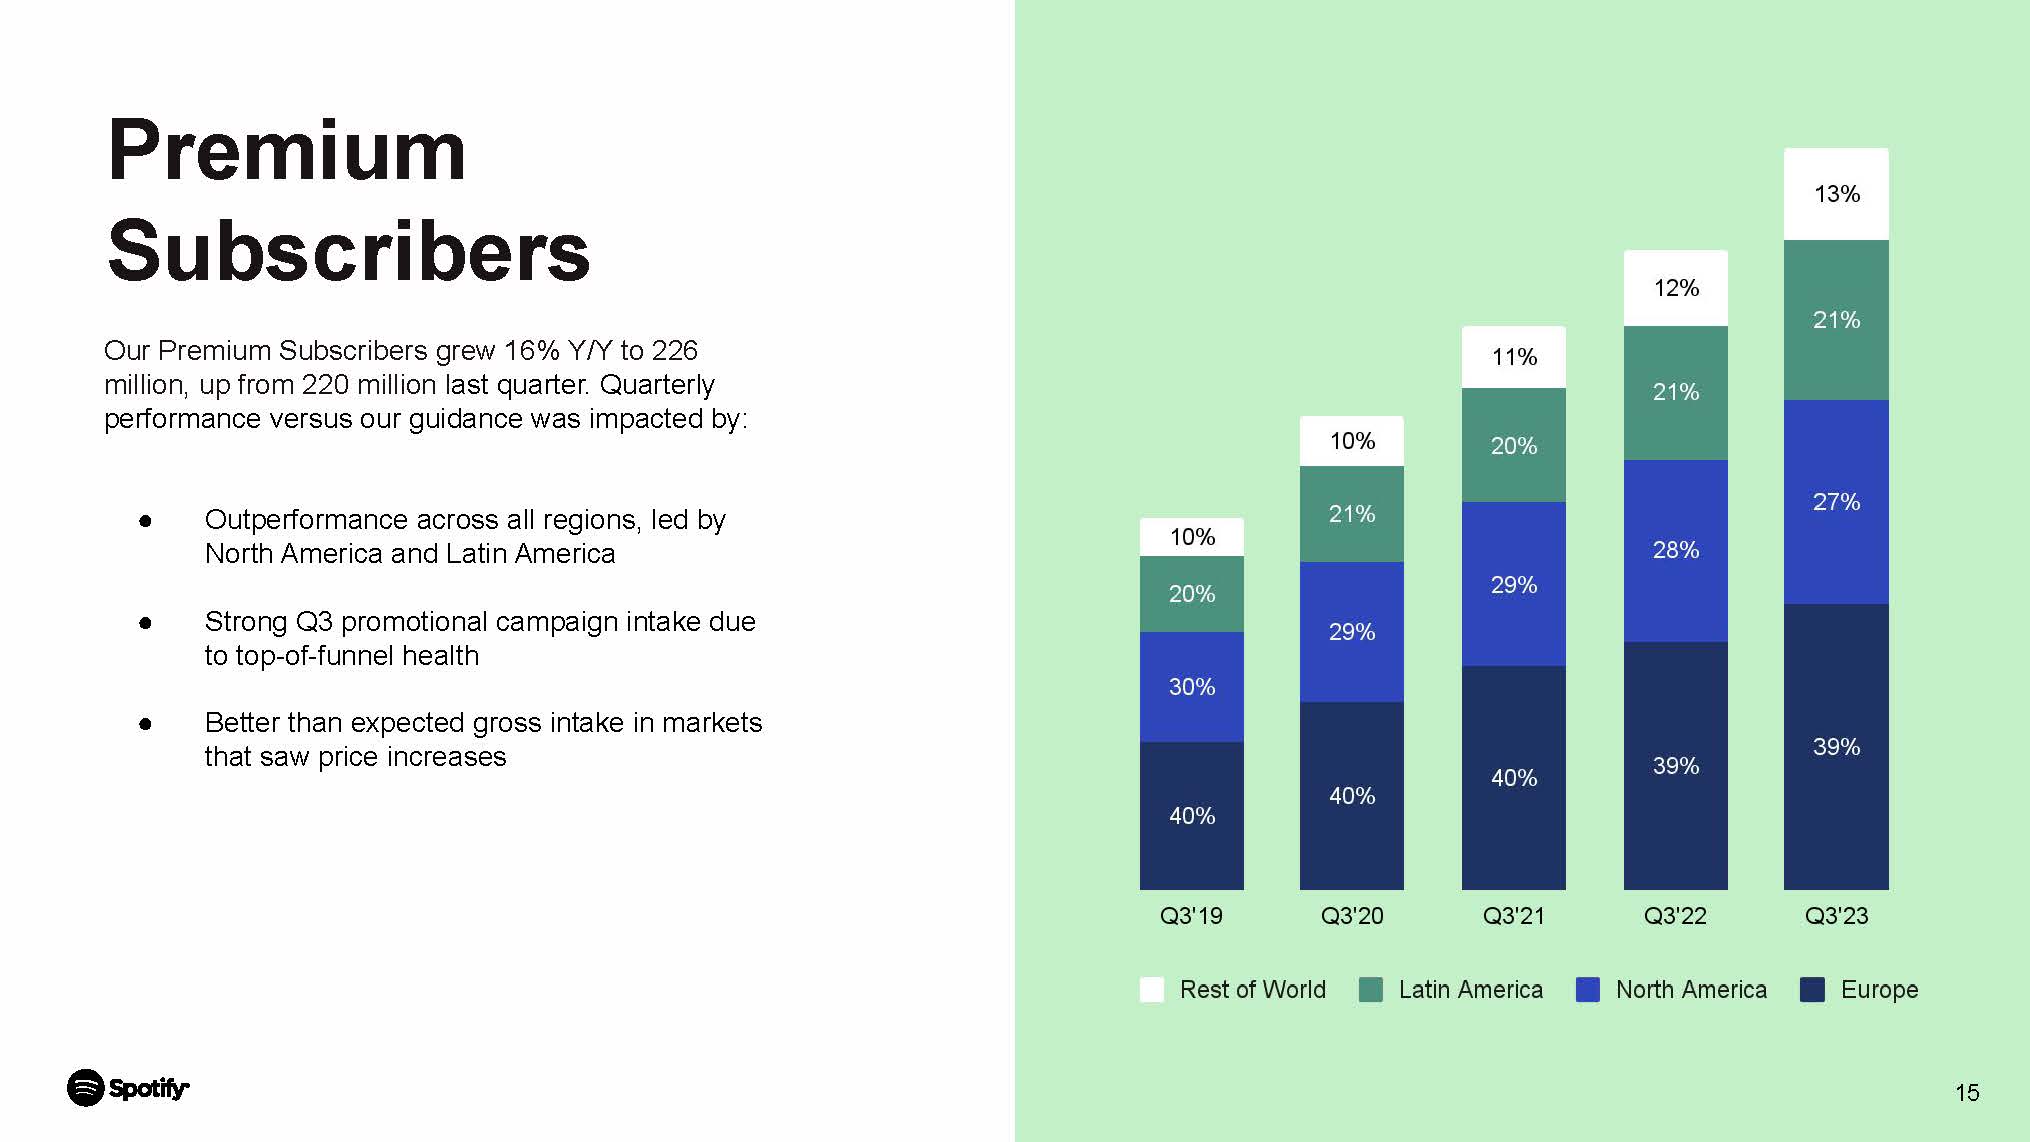
Our Premium Subscribers grew 16% Y/Y to 226 million, up from 220 million last quarter. Quarterly performance versus our guidance was impacted by: Outperformance across all regions, led by North America and Latin America Strong Q3 promotional campaign intake due to top-of-funnel health Better than expected gross intake in markets that saw price increases Premium Subscribers 14

PRODUCT & PLATFORM 16

Building the World’s #1 Audio Network Expanded AI DJ to 50 more markets and introduced new ways for users to listen with features such as Jam, a personalized way to listen with friends, and daylist, a hyper-personalized playlist that updates multiple times daily. Deepened partnership with Roku to make video ads available in the Spotify app experience on Roku connected TV (CTV) devices. In October, made over 150,000 audiobooks available to eligible Premium Subscribers in the United Kingdom and Australia with up to 15 hours of audiobook access a month. 24

Podcasting Piloted Voice Translations, powered by AI, to translate select podcasts into additional languages in the podcaster’s voice. Released a wave of new features for podcasters to get discovered and grow their audiences including customizations, impression analytics, automated ads and more. Joined forces with Stephen Colbert, Jimmy Fallon, Jimmy Kimmel, Seth Meyers and John Oliver for Strike Force Five, a new limited-run podcast. 24

Music Released a new Sponsored Recommendation, Showcase, that lets creators promote new and catalog music releases anytime at the top of Spotify’s Home. Travis Scott released his highly anticipated UTOPIA which became Spotify’s most-streamed album in a single day in 2023 with nearly 130 million global streams. Expanded Marquee self-serve buying in Spotify for Artists to all eligible artist teams in Canada. In August, Zach Bryan released his eponymous fourth studio album and has seen nearly a 500% increase in monthly listeners since being featured as a US RADAR artist back in May 2022. 24

FC Barcelona Kicked off FC Barcelona’s preseason tour and the second year of our partnership by bringing together the worlds of music and football through matches and studio tours, as well as collaborations with artists and fans. 24

OUTLOOK 24

Outlook for Q4’23 The following forward-looking statements reflect Spotify’s expectations for Q4 2023 as of October 24, 2023 and are subject to substantial uncertainty. Total MAUs 601 million Implies the addition of approximately 27 million net new MAUs in the quarter Total Premium Subscribers 235 million Implies the addition of approximately 9 million net new subscribers in the quarter Total Revenue €3.7 billion Assumes approximately 300 bps headwind to growth Y/Y due to foreign exchange rate movements Gross Margin 26.6% Primarily driven by Y/Y improvement in podcasting, music and Other Cost of Revenue Operating Income €37 million Social Charges are based on a Q3 close share price of $154.64 24
Webcast Information We will host a live question and answer session starting at 8:00 a.m. ET today on investors.spotify.com. Daniel Ek, our Founder and CEO, and Paul Vogel, our Chief Financial Officer, will be on hand to answer questions submitted through slido.com using the event code #SpotifyEarningsQ323. Participants also may join using the listen-only conference line by registering through the following site: https://conferencingportals.com/event/VqsCtILh We use investors.spotify.com and newsroom.spotify.com websites as well as other social media listed in the “Resources – Social Media” tab of our Investors website to disclose material company information. Use of Non-IFRS Measures To supplement our financial information presented in accordance with IFRS, we use the following non-IFRS financial measures: Revenue excluding foreign exchange effect, Premium revenue excluding foreign exchange effect, Ad-Supported revenue excluding foreign exchange effect, gross profit excluding foreign exchange effect, Operating expense excluding foreign exchange effect, Sales and marketing expense excluding foreign exchange effect, Research and development expense excluding foreign exchange effect, General and administrative expense excluding foreign exchange effect, adjusted gross margin, adjusted operating income/(loss), adjusted operating margin, and Free Cash Flow. Management believes that Revenue excluding foreign exchange effect, Premium revenue excluding foreign exchange effect, Ad-Supported revenue excluding foreign exchange effect, gross profit excluding foreign exchange effect, Operating expense excluding foreign exchange effect, Sales and marketing expense excluding foreign exchange effect, Research and development expense excluding foreign exchange effect, General and administrative expense excluding foreign exchange effect, adjusted gross margin, adjusted operating income/(loss), and adjusted operating margin are useful to investors because they present measures that facilitate comparison to our historical performance. However, these should be considered in addition to, not as a substitute for or superior to, Revenue, Premium revenue, Ad-Supported revenue, gross profit, Operating expense, Sales and marketing expense, Research and development expense, General and administrative expense, gross margin, operating income/(loss), operating margin, or other financial measures prepared in accordance with IFRS. Management believes that Free Cash Flow is useful to investors because it presents a measure that approximates the amount of cash generated that is available to repay debt obligations, to make investments, and for certain other activities that exclude certain infrequently occurring and/or non-cash items. However, Free Cash Flow should be considered in addition to, not as a substitute for or superior to, net cash flows (used in)/from operating activities or other financial measures prepared in accordance with IFRS. For more information on these non-IFRS financial measures, please see “Reconciliation of IFRS to Non-IFRS Results” section below. Forward Looking Statements This shareholder update contains estimates and forward-looking statements. All statements other than statements of historical fact are forward-looking statements. The words “may,” “might,” “will,” “could,” “would,” “should,” “expect,” “plan,” “anticipate,” “intend,” “seek,” “believe,” “estimate,” “predict,” “potential,” “continue,” “contemplate,” “possible,” and similar words are intended to identify estimates and forward-looking statements. Our estimates and forward-looking statements are mainly based on our current expectations and estimates of future events and trends, which affect or may affect our businesses and operations. Although we believe that these estimates and forward-looking statements are based upon reasonable assumptions, they are subject to numerous risks and uncertainties and are made in light of information currently available to us. Many important factors may adversely affect our results as indicated in forward-looking statements. These factors include, but are not limited to: our ability to attract prospective users, retain existing users, and monetize our products and services; competition for users, user listening time, and advertisers; risks associated with our international operations and our ability to manage our growth; risks associated with our new products or services and our emphasis on long-term user engagement over short-term results; our ability to predict, recommend, and play content that our users enjoy; our ability to be profitable or generate positive cash flow on a sustained basis; our ability to convince advertisers of the benefits of our advertising offerings; our ability to forecast or optimize advertising inventory amid emerging industry trends in digital advertising; our ability to generate revenues from podcasts, audiobooks, and other non-music content; potential disputes or liabilities associated with content made available on our premium service and ad-supported service (collectively, the “Service”); risks relating to acquisitions, investments, and strategic alliances; our dependence upon third-party licenses for most of the content we stream; our lack of control over third-party content providers who are concentrated and can unilaterally affect our access to content; our ability to comply with complex license agreements; our ability to accurately estimate royalty payments under our license agreements and relevant statutes; the limitations on our operating flexibility due to financial commitments required under certain of our license agreements; our ability to identify the compositions embodied in sound recordings and ownership thereof in order to obtain licenses or comply with existing license agreements; assertions by third parties of infringement or other violations by us of their intellectual property rights; our ability to protect our intellectual property; the dependence of streaming on operating systems, online platforms, hardware, networks, regulations, and standards that we do not control; our ability to maintain the integrity of our technology structure and systems or the security of confidential information; undetected errors, bugs or vulnerabilities in our products; interruptions, delays, or discontinuations in service arising from our systems or systems of third parties; changes in laws or regulations affecting us; risks relating to privacy and data security; our ability to maintain, protect, and enhance our brand; risks associated with increased scrutiny of environmental, social, and governance matters; payment-related risks; our dependence on key personnel and ability to attract, retain, and motivate highly skilled employees; our ability to access to additional capital to support growth; risks relating to currency exchange rate fluctuations and foreign exchange controls; the impact of economic, social, or political conditions, including the continued conflict between Russia and Ukraine, inflation, changes in interest rates, and related market uncertainty; our ability to accurately estimate user metrics and other estimates; our ability to manage and remediate attempts to manipulate streams and attempts to gain or provide unauthorized access to certain features of our Service; risks related to our indebtedness, including risks related to our Exchangeable Notes; fluctuation of our operating results and fair market value of ordinary shares; tax-related risks; the concentration of voting power among our founders, which limits shareholders’ ability to influence our governance and business; and risks related to our status as a foreign private issuer and a Luxembourg company. A detailed discussion of these and other risks and uncertainties that could cause actual results and events to differ materially from our estimates and forward-looking statements is included in our filings with the U.S. Securities and Exchange Commission (“SEC”), including our Annual Report on Form 20-F filed with the SEC on February 2, 2023, as updated by subsequent reports filed with the SEC. We undertake no obligation to update forward-looking statements to reflect events or circumstances occurring after the date of this shareholder update. Rounding Certain monetary amounts, percentages, and other figures included in this update have been subject to rounding adjustments. The sum of individual metrics may not always equal total amounts indicated due to rounding. 24

FINANCIAL STATEMENTS 24

Trending Charts MAUs, Ad-Supported Users, Premium Subscribers & Revenue By Segment * Last Twelve Months (LTM) represents annual performance covering the preceding 12 months relative to the last day of the quarter. 26

Trending Charts Gross Profit By Segment, Gross Margin By Segment & Free Cash Flow * Last Twelve Months (LTM) represents annual performance covering the preceding 12 months relative to the last day of the quarter. 26

27 Interim condensed consolidated statement of operations (Unaudited) (in € millions, except share and per share data) Three months ended September 30, 2023 June 30, 2023 September 30, 2022 Revenue 3,357 3,177 3,036 Cost of revenue 2,472 2,411 2,286 Gross profit 885 766 750 Research and development 369 453 386 Sales and marketing 355 399 432 General and administrative 129 161 160 853 1,013 978 Operating income/(loss) 32 (247) (228) Finance income 55 33 102 Finance costs (14) (27) (18) Finance income/(costs) - net 41 6 84 Income/(loss) before tax 73 (241) (144) Income tax expense 8 61 22 Net income/(loss) attributable to owners of the parent 65 (302) (166) Earnings/(loss) per share attributable to owners of the parent Basic 0.33 (1.55) (0.86) Diluted 0.33 (1.55) (0.99) Basic 194,881,723 194,420,128 193,077,334 Weighted-average ordinary shares outstanding Diluted 198,012,369 194,420,128 195,988,834

September 30, 2023 December 31, 2022 Assets Non-current assets Lease right-of-use assets 343 417 Property and equipment 275 348 Goodwill 1,180 1,168 Intangible assets 98 127 Long term investments 903 1,138 Restricted cash and other non-current assets 75 78 Deferred tax assets 23 8 2,897 3,284 Current assets Trade and other receivables 747 690 Income tax receivable 8 5 Short term investments 1,097 867 Cash and cash equivalents 2,618 2,483 Other current assets 225 307 4,695 4,352 Total assets 7,592 7,636 Equity and liabilities Equity Share capital — — Other paid in capital 4,931 4,789 Treasury shares (262) (262) Other reserves 1,582 1,521 Accumulated deficit (4,112) (3,647) Equity attributable to owners of the parent 2,139 2,401 Non-current liabilities Exchangeable Notes 1,209 1,128 Lease liabilities 520 555 Accrued expenses and other liabilities 14 28 Provisions 3 3 Deferred tax liabilities 6 5 1,752 1,719 Current liabilities Trade and other payables 945 845 Income tax payable 8 11 Deferred revenue 599 520 Accrued expenses and other liabilities 2,108 2,093 Provisions 24 26 Derivative liabilities 17 21 3,701 3,516 Total liabilities 5,453 5,235 Total equity and liabilities 7,592 7,636 Interim condensed consolidated statement of financial position (Unaudited) (in € millions) 27
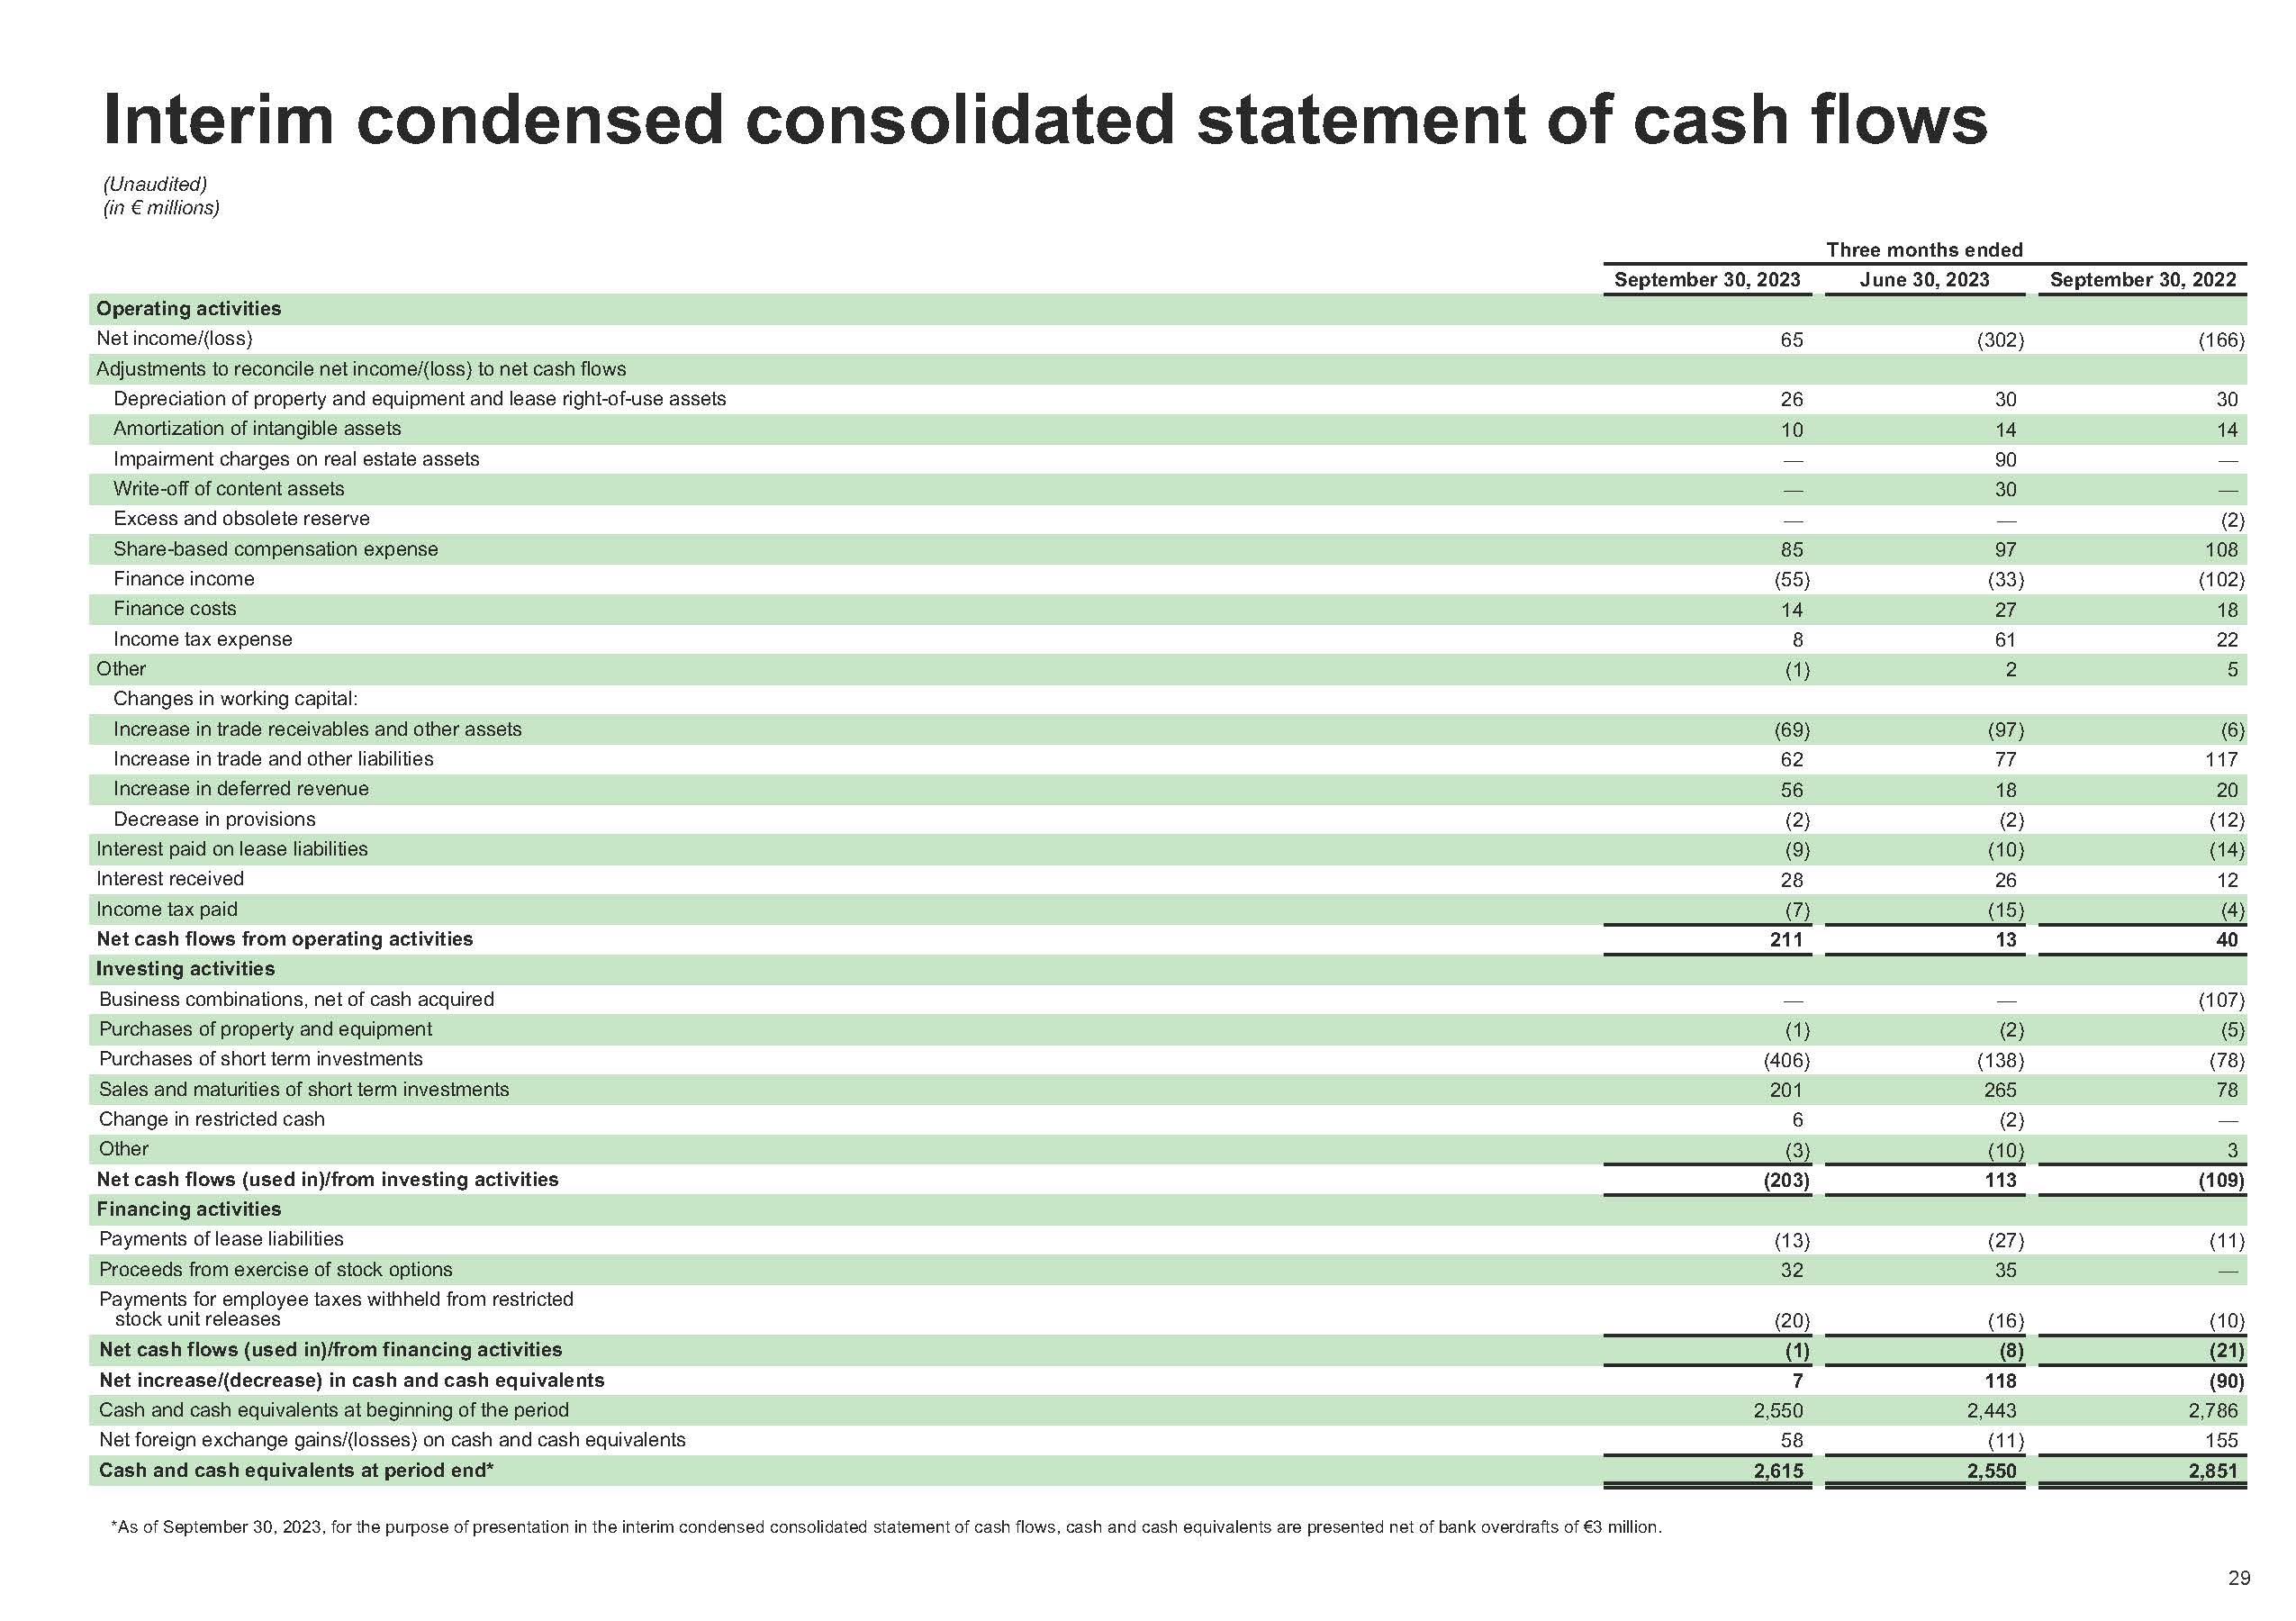
(Unaudited) (in € millions) Three months ended 27 September 30, 2023 June 30, 2023 September 30, 2022 Operating activities Net income/(loss) 65 (302) (166) Adjustments to reconcile net income/(loss) to net cash flows Depreciation of property and equipment and lease right-of-use assets 26 30 30 Amortization of intangible assets 10 14 14 Impairment charges on real estate assets — 90 — Write-off of content assets — 30 — Excess and obsolete reserve — — (2) Share-based compensation expense 85 97 108 Finance income (55) (33) (102) Finance costs 14 27 18 Income tax expense 8 61 22 Other (1) 2 5 Changes in working capital: Increase in trade receivables and other assets (69) (97) (6) Increase in trade and other liabilities 62 77 117 Increase in deferred revenue 56 18 20 Decrease in provisions (2) (2) (12) Interest paid on lease liabilities (9) (10) (14) Interest received 28 26 12 Income tax paid (7) (15) (4) Net cash flows from operating activities 211 13 40 Investing activities Business combinations, net of cash acquired — — (107) Purchases of property and equipment (1) (2) (5) Purchases of short term investments (406) (138) (78) Sales and maturities of short term investments 201 265 78 Change in restricted cash 6 (2) — Other (3) (10) 3 Net cash flows (used in)/from investing activities (203) 113 (109) Financing activities Payments of lease liabilities (13) (27) (11) Proceeds from exercise of stock options 32 35 — Payments for employee taxes withheld from restricted stock unit releases (20) (16) (10) Net cash flows (used in)/from financing activities (1) (8) (21) Net increase/(decrease) in cash and cash equivalents 7 118 (90) Cash and cash equivalents at beginning of the period 2,550 2,443 2,786 Net foreign exchange gains/(losses) on cash and cash equivalents 58 (11) 155 Cash and cash equivalents at period end* 2,615 2,550 2,851 *As of September 30, 2023, for the purpose of presentation in the interim condensed consolidated statement of cash flows, cash and cash equivalents are presented net of bank overdrafts of €3 million. Interim condensed consolidated statement of cash flows

September 30, 2023 June 30, 2023 September 30, 2022 Basic earnings/(loss) per share Net income/(loss) attributable to owners of the parent 65 (302) (166) Shares used in computation: Weighted-average ordinary shares outstanding 194,881,723 194,420,128 193,077,334 Basic earnings/(loss) per share attributable to owners of the parent 0.33 (1.55) (0.86) Diluted earnings/(loss) per share Net income/(loss) attributable to owners of the parent 65 (302) (166) Fair value gains on dilutive Exchangeable Notes — — (28) Net income/(loss) used in the computation of diluted earnings/(loss) per share 65 (302) (194) Shares used in computation: Weighted-average ordinary shares outstanding 194,881,723 194,420,128 193,077,334 Exchangeable Notes — — 2,911,500 Stock options 1,191,994 — — Restricted stock units 1,917,347 — — Other contingently issuable shares 21,305 — — Diluted weighted-average ordinary shares 198,012,369 194,420,128 195,988,834 Diluted earnings/(loss) per share attributable to owners of the parent 0.33 (1.55) (0.99) (Unaudited) (in € millions, except share and per share data) Three months ended Calculation of basic and diluted earnings/(loss) per share 27

27 Three months ended September 30, 2023 September 30, 2022 IFRS revenue 3,357 3,036 Foreign exchange effect on 2023 revenue using 2022 rates (188) Revenue excluding foreign exchange effect 3,545 IFRS revenue year-over-year change % 11% Revenue excluding foreign exchange effect year-over-year change % 17% IFRS Premium revenue 2,910 2,651 Foreign exchange effect on 2023 Premium revenue using 2022 rates (156) Premium revenue excluding foreign exchange effect 3,066 IFRS Premium revenue year-over-year change % 10% Premium revenue excluding foreign exchange effect year-over-year change % 16% IFRS Ad-Supported revenue 447 385 Foreign exchange effect on 2023 Ad-Supported revenue using 2022 rates (32) Ad-Supported revenue excluding foreign exchange effect 479 IFRS Ad-Supported revenue year-over-year change % 16% Ad-Supported revenue excluding foreign exchange effect year-over-year change % 24% Revenue on a constant currency basis (Unaudited) (in € millions, except percentages) Reconciliation of IFRS to non-IFRS results

Operating expenses on a constant currency basis (Unaudited) (in € millions, except percentages) Three months ended September 30, 2023 September 30, 2022 IFRS Research and development expenses 369 386 Foreign exchange effect on 2023 expenses using 2022 rates (19) Research and development expenses excluding foreign exchange effect 388 IFRS Research and development expenses year over year change % (4)% Research and development expenses excluding foreign exchange effect year-over-year change % 1 % Reconciliation of IFRS to non-IFRS results Three months ended September 30, 2023 September 30, 2022 IFRS Sales and marketing expenses 355 432 Foreign exchange effect on 2023 expenses using 2022 rates (19) Sales and marketing expenses excluding foreign exchange effect 374 IFRS Sales and marketing expenses year over year change % (18)% Sales and marketing expenses excluding foreign exchange effect year-over-year change % (13)% Three months ended September 30, 2023 September 30, 2022 IFRS General and administrative expenses 129 160 Foreign exchange effect on 2023 expenses using 2022 rates (11) General and administrative expenses excluding foreign exchange effect 140 IFRS General and administrative expenses year over year change % (19)% General and administrative expenses excluding foreign exchange effect year-over-year change % (13)% Three months ended September 30, 2023 September 30, 2022 IFRS Operating expenses 853 978 Foreign exchange effect on 2023 operating expenses using 2022 rates (49) Operating expenses excluding foreign exchange effect 902 IFRS Operating expenses year over year change % (13)% Operating expenses excluding foreign exchange effect year-over-year change % (8)% 27

Three months ended March 31, June 30, September December March 31, June 30, September December March 31, June 30, September December March 31, June 30, September 2020 2020 30, 2020 31, 2020 2021 2021 30, 2021 31, 2021 2022 2022 30, 2022 31, 2022 2023 2023 30, 2023 Net cash flows from/(used in) operating activities (9) 39 122 107 65 54 123 119 37 39 40 (70) 59 13 211 Capital expenditures (12) (14) (17) (35) (24) (20) (25) (16) (10) (5) (5) (5) (2) (2) (1) Change in restricted cash — 2 (2) 2 — — 1 — (5) 3 — 2 — (2) 6 Free Cash Flow (21) 27 103 74 41 34 99 103 22 37 35 (73) 57 9 216 Last twelve months ended December March 31, June 30, September December March 31, June 30, September December March 31, June 30, September 31, 2020 2021 2021 30, 2021 31, 2021 2022 2022 30, 2022 31, 2022 2023 2023 30, 2023 Net cash flows from operating activities 259 333 348 349 361 333 318 235 46 68 42 213 Capital expenditures (78) (90) (96) (104) (85) (71) (56) (36) (25) (17) (14) (10) Change in restricted cash 2 2 — 3 1 (4) (1) (2) — 5 — 6 Free Cash Flow 183 245 252 248 277 258 261 197 21 56 28 209 Free Cash Flow (Unaudited) (in € millions) Reconciliation of IFRS to non-IFRS results Free Cash Flow (Unaudited) (in € millions) Free Cash Flow (Unaudited) (in € millions) Twelve months ended December 31, 2016 December 31, 2017 December 31, 2018 December 31, 2019 December 31, 2020 December 31, 2021 December 31, 2022 Net cash flows from operating activities 101 179 344 573 259 361 46 Capital expenditures (27) (36) (125) (135) (78) (85) (25) Change in restricted cash (1) (34) (10) 2 2 1 — Free Cash Flow 73 109 209 440 183 277 21 27
