Exhibit 99.1

Q4 2023 Update February 6th, 2024 1
Table of Contents Key Highlights Financial Summary MAUs & Subscribers Product & Platform Outlook Financial Statements Executive Summary p.03 22 p.04 p.06 p.13 p.16 p.20 p.23

Executive Summary USER & FINANCIAL SUMMARY Q4 2022 Q3 2023 Q4 2023 Y/Y Q/Q USERS (M) Total Monthly Active Users ("MAUs") 489 574 602 23% 5% Premium Subscribers 205 226 236 15% 4% Ad-Supported MAUs 295 361 379 28% 5% FINANCIALS (€M) Premium 2,717 2,910 3,170 17% 9% Ad-Supported 449 447 501 12% 12% Total Revenue 3,166 3,357 3,671 16% 9% Gross Profit 801 885 980 22% 11% Gross Margin 25.3% 26.4% 26.7% -- -- Operating (Loss)/Income (231) 32 (75) -- -- Operating Margin (7.3%) 1.0% (2.0%) -- -- Net Cash Flows From Operating Activities (70) 211 397 -- -- Free Cash Flow* (73) 216 396 -- -- * Constant Currency, Adjusted Operating Income and Free Cash Flow are non-IFRS measures. See "Use of Non-IFRS Measures" and "Reconciliation of IFRS to Non-IFRS Results" for additional information. We ended 2023 with strong Q4 performance, as all of our KPIs met or exceeded guidance. MAU net additions of 28 million surpassed guidance by 1 million. Subscriber net additions of 10 million were also ahead by 1 million. Revenue grew 20% Y/Y on a constant currency* basis, reflecting another ~300 bps of sequential acceleration vs. Q3’23. Gross Margin of 26.7% was also ahead and up 140 bps Y/Y, while Operating Loss of (€75) million was better due to lower marketing and personnel and related costs. Excluding €143 million in charges associated with efficiency actions taken late in the quarter (which were incorporated into guidance), we generated €68 million in Adjusted Operating Income*, more than double the Operating Income we achieved in Q3’23. Free Cash Flow* was €396 million in the quarter. With revenue and profitability trends both inflecting favorably heading into 2024, we view the business as well positioned to deliver improving growth and profitability as we progress towards delivering against our Investor Day goals. 3
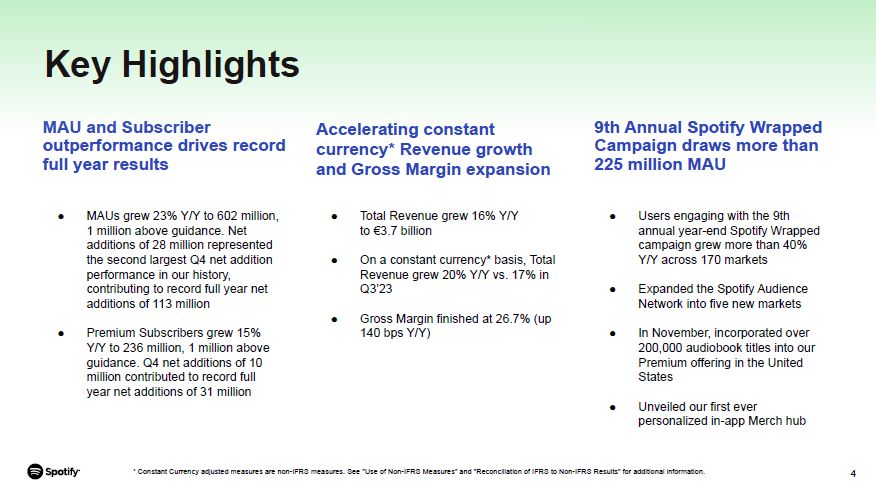
* Constant Currency adjusted measures are non-IFRS measures. See "Use of Non-IFRS Measures" and "Reconciliation of IFRS to Non-IFRS Results" for additional information. MAU and Subscriber outperformance drives record full year results Users engaging with the 9th annual year-end Spotify Wrapped campaign grew more than 40% Y/Y across 170 markets Expanded the Spotify Audience Network into five new markets In November, incorporated over 200,000 audiobook titles into our Premium offering in the United States Unveiled our first ever personalized in-app Merch hub Key Highlights Accelerating constant currency* Revenue growth and Gross Margin expansion Total Revenue grew 16% Y/Y to €3.7 billion On a constant currency* basis, Total Revenue grew 20% Y/Y vs. 17% in Q3’23 Gross Margin finished at 26.7% (up 140 bps Y/Y) 9th Annual Spotify Wrapped Campaign draws more than 225 million MAU MAUs grew 23% Y/Y to 602 million, 1 million above guidance. Net additions of 28 million represented the second largest Q4 net addition performance in our history, contributing to record full year net additions of 113 million Premium Subscribers grew 15% Y/Y to 236 million, 1 million above guidance. Q4 net additions of 10 million contributed to record full year net additions of 31 million 4
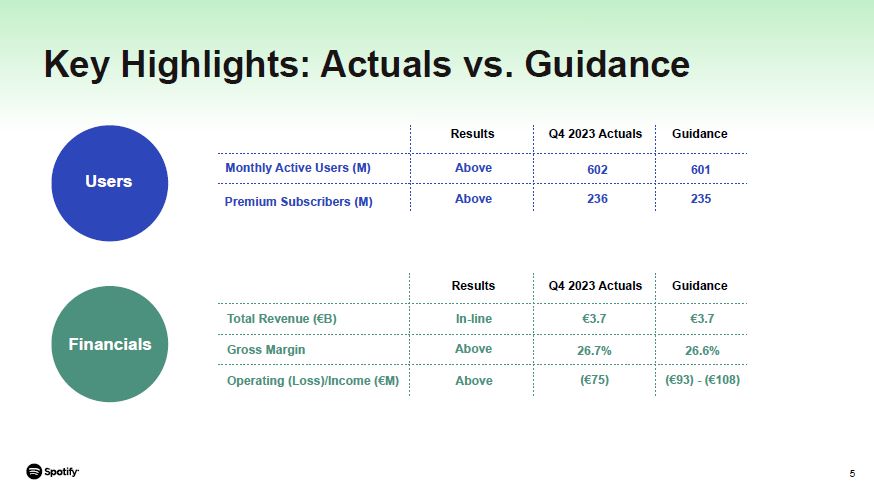
Results Q4 2023 Actuals Guidance Total Revenue (€B) In-line €3.7 €3.7 Gross Margin Above 26.7% 26.6% Operating (Loss)/Income (€M) Above (€75) (€93) - (€108) Key Highlights: Actuals vs. Guidance Users Results Q4 2023 Actuals Guidance Monthly Active Users (M) Above 602 601 Premium Subscribers (M) Above 236 235 Financials 6

FINANCIAL SUMMARY 6
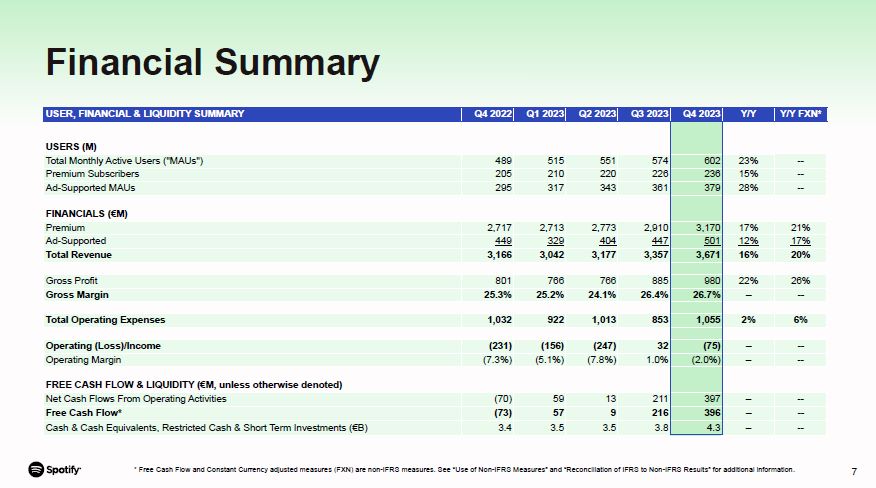
Financial Summary * Free Cash Flow and Constant Currency adjusted measures (FXN) are non-IFRS measures. See “Use of Non-IFRS Measures” and “Reconciliation of IFRS to Non-IFRS Results” for additional information. USER, FINANCIAL & LIQUIDITY SUMMARY Q4 2022 Q1 2023 Q2 2023 Q3 2023 Q4 2023 Y/Y Y/Y FXN* USERS (M) Total Monthly Active Users ("MAUs") 489 515 551 574 602 23% -- Premium Subscribers 205 210 220 226 236 15% -- Ad-Supported MAUs 295 317 343 361 379 28% -- FINANCIALS (€M) Premium 2,717 2,713 2,773 2,910 3,170 17% 21% Ad-Supported 449 329 404 447 501 12% 17% Total Revenue 3,166 3,042 3,177 3,357 3,671 16% 20% Gross Profit 801 766 766 885 980 22% 26% Gross Margin 25.3% 25.2% 24.1% 26.4% 26.7% -- -- Total Operating Expenses 1,032 922 1,013 853 1,055 2% 6% Operating (Loss)/Income (231) (156) (247) 32 (75) -- -- Operating Margin (7.3%) (5.1%) (7.8%) 1.0% (2.0%) -- -- FREE CASH FLOW & LIQUIDITY (€M, unless otherwise denoted) Net Cash Flows From Operating Activities (70) 59 13 211 397 -- -- Free Cash Flow* (73) 57 9 216 396 -- -- Cash & Cash Equivalents, Restricted Cash & Short Term Investments (€B) 3.4 3.5 3.5 3.8 4.3 -- -- 7

Revenue Profitability Free Cash Flow & Liquidity Gross Margin was 26.7% in Q4, up 140 bps Y/Y reflecting: Improved podcast and music profitability and Other Cost of Revenue favorability, partially offset by Audiobooks start-up costs and €4 million in net severance related charges Operating Loss was (€75) million in Q4 and reflected €143 million in net severance related and real estate optimization charges, €139 million of which were included in Operating Expenses. Excluding these charges, Adjusted Operating Income* was €68 million and reflected: Higher Social Charges, which were more than offset by Lower marketing spend and personnel and related costs Revenue of €3,671 million grew 16% Y/Y in Q4 (or 20% Y/Y constant currency*), reflecting: Premium Revenue growth of 17% Y/Y (or 21% Y/Y constant currency*), led by subscriber gains and the effects of price increases; and Ad-Supported Revenue growth of 12% Y/Y (or 17% Y/Y constant currency*) Free Cash Flow* was €396 million in Q4. Our liquidity and balance sheet remained strong, with €4.3 billion in cash and cash equivalents, restricted cash and short term investments. At the end of Q4, our workforce consisted of 9,248 FTEs** globally. Financial Summary * Constant Currency adjusted measures, Adjusted Operating Income and Free Cash Flow are non-IFRS measures. See "Use of Non-IFRS Measures" and "Reconciliation of IFRS to Non-IFRS Results" for additional information. ** Includes employees impacted by December 2023 workforce reduction that remained on garden leave. 8

Revenue Constant Currency adjusted measures are non-IFRS measures. See "Use of Non-IFRS Measures" and "Reconciliation of IFRS to Non-IFRS Results" for additional information. ARPU means Premium Average Revenue per User. Last Twelve Months (LTM) represents annual performance covering the preceding 12 months relative to the last day of the quarter. Premium growth led by subscribers and pricing Premium Revenue grew 17% Y/Y to €3,170 million (or 21% Y/Y constant currency*), reflecting subscriber growth of 15% Y/Y and a Premium ARPU increase of 1% Y/Y to €4.60 (or up 5% Y/Y constant currency). Excluding the impact of FX, ARPU performance was driven by price increase benefits, partially offset by product and market mix. Ad-Supported Revenue hits all-time high Ad-Supported revenue grew 12% Y/Y (or 17% Y/Y constant currency*), reflecting Y/Y growth across all regions. Music advertising revenue grew double-digits driven by growth in impressions sold and stable pricing. Podcast advertising revenue grew in the healthy double-digit range, driven by significant growth in sold impressions across Original and Licensed podcasts and the Spotify Audience Network, partially offset by softer pricing. The Spotify Audience Network saw double digit Q/Q growth in participating publishers, shows and advertisers. 9

Premium Gross Margin was 29.1% in Q4, up 45 bps Y/Y. The Y/Y trend reflects improvement in music profitability (aided by Marketplace growth) and Other Cost of Revenue favorability, partially offset by audiobooks start-up costs and severance related charges. Gross Margin Podcasting and Music gains + Other Cost of Revenue favorability aid expansion Gross Margin finished at 26.7% in Q4, up 140 bps Y/Y. The Y/Y trend reflects improvement in podcasting, music and Other Cost of Revenue favorability, partially offset by audiobooks start-up costs and severance related charges. Ad-Supported Gross Margin was 11.6% in Q4, up 645 bps Y/Y. The Y/Y trend reflects improvement in podcast trends and music profitability as well as Other Cost of Revenue favorability, partially offset by severance related charges. 10
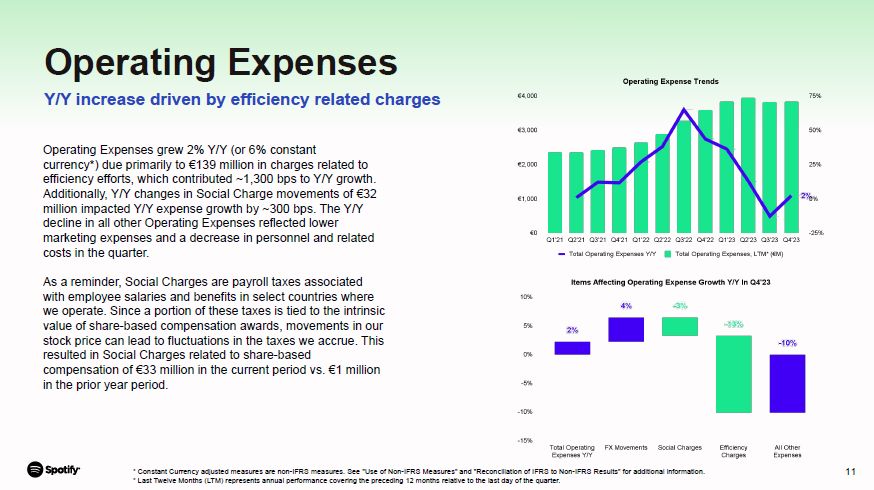
Operating Expenses grew 2% Y/Y (or 6% constant currency*) due primarily to €139 million in charges related to efficiency efforts, which contributed ~1,300 bps to Y/Y growth. Additionally, Y/Y changes in Social Charge movements of €32 million impacted Y/Y expense growth by ~300 bps. The Y/Y decline in all other Operating Expenses reflected lower marketing expenses and a decrease in personnel and related costs in the quarter. As a reminder, Social Charges are payroll taxes associated with employee salaries and benefits in select countries where we operate. Since a portion of these taxes is tied to the intrinsic value of share-based compensation awards, movements in our stock price can lead to fluctuations in the taxes we accrue. This resulted in Social Charges related to share-based compensation of €33 million in the current period vs. €1 million in the prior year period. Operating Expenses Y/Y increase driven by efficiency related charges Constant Currency adjusted measures are non-IFRS measures. See "Use of Non-IFRS Measures" and "Reconciliation of IFRS to Non-IFRS Results" for additional information. Last Twelve Months (LTM) represents annual performance covering the preceding 12 months relative to the last day of the quarter. 11

Free Cash Flow Building and sustaining a strong balance sheet Free Cash Flow was €396 million in Q4, an increase Y/Y as a result of increased favorability in net working capital and higher Net Income adjusted for non-cash items. Additionally, capital expenditures declined €4 million Y/Y to €1 million as a result of the completion of office build-outs. While the magnitude of Free Cash Flow can fluctuate from quarter to quarter based on seasonality and timing, we have averaged approximately €230 million of positive Free Cash Flow on a trailing 12 month basis for the past three years. On a cumulative basis, we have generated nearly €2.0 billion of Free Cash Flow since the beginning of 2016, supporting our strong balance sheet and €4.3 billion in cash and cash equivalents, restricted cash and short term investments balance. * Last Twelve Months (LTM) represents annual performance covering the preceding 12 months relative to the last day of the quarter. Cume represents cumulative performance since the beginning of 2016. 12

MAUS & SUBSCRIBERS 13
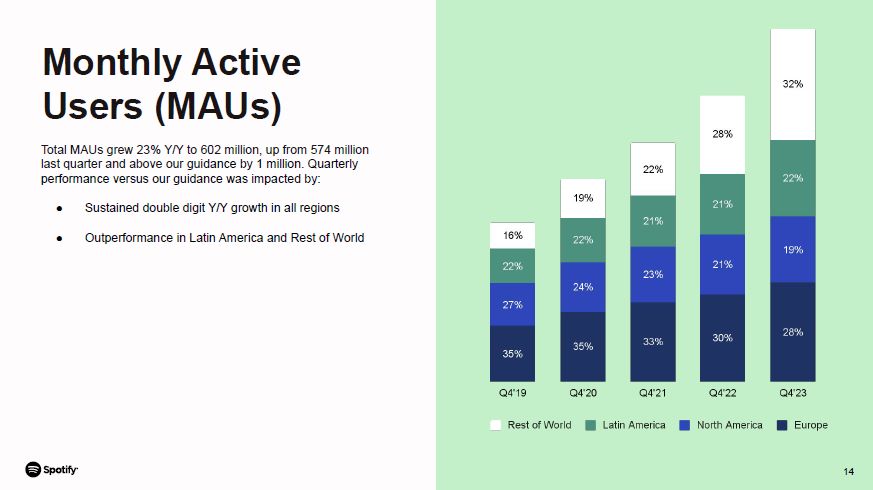
Total MAUs grew 23% Y/Y to 602 million, up from 574 million last quarter and above our guidance by 1 million. Quarterly performance versus our guidance was impacted by: Sustained double digit Y/Y growth in all regions Outperformance in Latin America and Rest of World Monthly Active Users (MAUs) 14
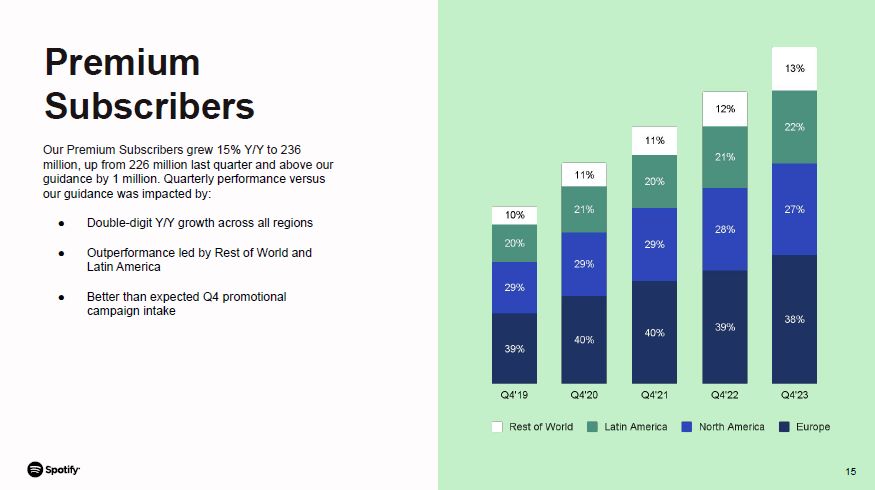
Our Premium Subscribers grew 15% Y/Y to 236 million, up from 226 million last quarter and above our guidance by 1 million. Quarterly performance versus our guidance was impacted by: Double-digit Y/Y growth across all regions Outperformance led by Rest of World and Latin America Better than expected Q4 promotional campaign intake Premium Subscribers 14

PRODUCT & PLATFORM 16
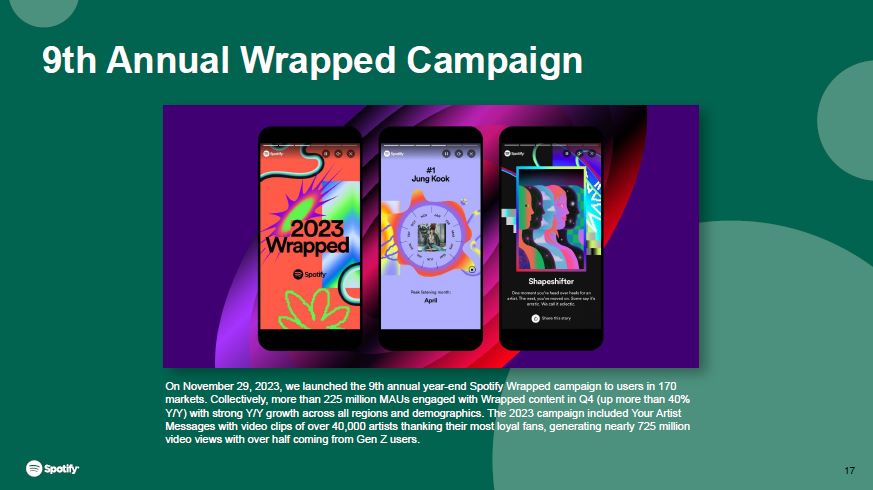
9th Annual Wrapped Campaign On November 29, 2023, we launched the 9th annual year-end Spotify Wrapped campaign to users in 170 markets. Collectively, more than 225 million MAUs engaged with Wrapped content in Q4 (up more than 40% Y/Y) with strong Y/Y growth across all regions and demographics. The 2023 campaign included Your Artist Messages with video clips of over 40,000 artists thanking their most loyal fans, generating nearly 725 million video views with over half coming from Gen Z users. 23

Building the World’s #1 Audio Network Launched a new original podcast, What Now? with Trevor Noah, featuring interviews with special guests such as entertainers, CEOs, actors, athletes and thought leaders. Expanded the Spotify Audience Network (SPAN) into five new markets, including India, Japan, Brazil, Mexico and Sweden. SPAN now operates in 14 total markets. In November, made over 200,000 audiobooks available to eligible Premium Subscribers in the United States with up to 15 hours of audiobook access a month. 23

Music Bad Bunny’s pre-release campaign for his new album, nadie sabe lo que va a pasar mañana, had the most successful Countdown Page to date and earned over 500 million streams within the first week of launch. To launch Spotify’s annual Wrapped Campaign, Taylor Swift was named the Top Global Artist for 2023 with more than 26.1 billion global streams since January 1st, 2023. Launched our first ever in-app Merch Hub, which provides personalized merchandise recommendations based on user listening habits. 23

OUTLOOK 23

Outlook for Q1’24 The following forward-looking statements reflect Spotify’s expectations for Q1 2024 as of February 6, 2024 and are subject to substantial uncertainty. Total MAUs 618 million Implies the addition of approximately 16 million net new MAUs in the quarter Total Premium Subscribers 239 million Implies the addition of approximately 3 million net new subscribers in the quarter Total Revenue €3.6 billion Assumes approximately 250 bps headwind to growth Y/Y due to foreign exchange rate movements Gross Margin 26.4% Primarily driven by Y/Y improvement in music, podcasting and Other Cost of Revenue Operating Income €180 million Social Charges are based on a Q4 close share price of $187.91 23

Webcast Information We will host a live question and answer session starting at 8:00 a.m. ET today on investors.spotify.com. Daniel Ek, our Founder and CEO, and Paul Vogel, our Chief Financial Officer, will be on hand to answer questions submitted through slido.com using the event code #SpotifyEarningsQ423. Participants also may join using the listen-only conference line by registering through the following site: https://conferencingportals.com/event/VqsCtILh We use investors.spotify.com and newsroom.spotify.com websites as well as other social media listed in the “Resources – Social Media” tab of our Investors website to disclose material company information. Use of Non-IFRS Measures To supplement our financial information presented in accordance with IFRS, we use the following non-IFRS financial measures: Revenue excluding foreign exchange effect, Premium revenue excluding foreign exchange effect, Ad-Supported revenue excluding foreign exchange effect, gross profit excluding foreign exchange effect, Operating expense excluding foreign exchange effect, adjusted operating income/(loss), and Free Cash Flow. Management believes that Revenue excluding foreign exchange effect, Premium revenue excluding foreign exchange effect, Ad-Supported revenue excluding foreign exchange effect, gross profit excluding foreign exchange effect, Operating expense excluding foreign exchange effect, and adjusted operating income/(loss) are useful to investors because they present measures that facilitate comparison to our historical performance. However, these should be considered in addition to, not as a substitute for or superior to, Revenue, Premium revenue, Ad-Supported revenue, gross profit, Operating expense, operating income/(loss), or other financial measures prepared in accordance with IFRS. Management believes that Free Cash Flow is useful to investors because it presents a measure that approximates the amount of cash generated that is available to repay debt obligations, to make investments, and for certain other activities that exclude certain infrequently occurring and/or non-cash items. However, Free Cash Flow should be considered in addition to, not as a substitute for or superior to, net cash flows (used in)/from operating activities or other financial measures prepared in accordance with IFRS. For more information on these non-IFRS financial measures, please see “Reconciliation of IFRS to Non-IFRS Results” section below. Forward Looking Statements This shareholder update contains estimates and forward-looking statements. All statements other than statements of historical fact are forward-looking statements. The words “may,” “might,” “will,” “could,” “would,” “should,” “expect,” “plan,” “anticipate,” “intend,” “seek,” “believe,” “estimate,” “predict,” “potential,” “continue,” “contemplate,” “possible,” and similar words are intended to identify estimates and forward-looking statements. Our estimates and forward-looking statements are mainly based on our current expectations and estimates of future events and trends, which affect or may affect our businesses and operations. Although we believe that these estimates and forward-looking statements are based upon reasonable assumptions, they are subject to numerous risks and uncertainties and are made in light of information currently available to us. Many important factors may adversely affect our results as indicated in forward-looking statements. These factors include, but are not limited to: our ability to attract prospective users, retain existing users, and monetize our products and services; competition for users, user listening time, and advertisers; risks associated with our international operations and our ability to manage our growth and the scope and complexity of our business; risks associated with our new products or services and our emphasis on long-term user engagement over short-term results; our ability to predict, recommend, and play content that our users enjoy; our ability to generate profit or positive cash flow on a sustained basis; our ability to convince advertisers of the benefits of our advertising offerings; our ability to forecast or optimize advertising inventory amid evolving industry trends in digital advertising; our ability to generate revenues from podcasts, audiobooks, and other non-music content; potential disputes or liabilities associated with content made available on our premium service and ad-supported service (collectively, the “Service”); risks relating to acquisitions, investments, and divestitures; our dependence upon third-party licenses for most of the content we stream; our lack of control over third-party content providers who are concentrated and can unilaterally affect our access to content; our ability to comply with complex license agreements; our ability to accurately estimate royalty payments under our license agreements and relevant statutes; the limitations on our operating flexibility due to financial commitments required under certain of our license agreements; our ability to identify the compositions embodied in sound recordings and ownership thereof in order to obtain licenses or comply with existing license agreements; assertions by third parties of infringement or other violations by us of their intellectual property rights; our ability to protect our intellectual property; the dependence of streaming on operating systems, online platforms, hardware, networks, regulations, and standards that we do not control; our ability to maintain the integrity of our technology infrastructure and systems or the security of confidential information; undetected errors, misconfigurations, bugs, or vulnerabilities in our products; interruptions, delays, or discontinuations in service arising from our systems or systems of third parties; changes in laws or regulations affecting us; risks relating to privacy and data security, content moderation, and use of artificial intelligence; our ability to maintain, protect, and enhance our brand; risks associated with increased scrutiny of environmental, social, and governance matters; payment acceptance-related risks; our dependence on key personnel and ability to attract, retain, and motivate highly skilled employees; our ability to access to additional capital to support strategic objectives; risks relating to currency exchange rate fluctuations and foreign exchange controls; the impact of economic, social, or political conditions, including inflation, changes in interest rates, geopolitical conflicts in Europe and the Middle East, and related market uncertainty; our ability to accurately estimate user metrics and other estimates; our ability to manage and remediate attempts to manipulate streams and attempts to gain or provide unauthorized access to certain features of our Service; risks related to our indebtedness, including risks related to our Exchangeable Notes; fluctuation of our operating results and fair market value of ordinary shares; tax-related risks; the concentration of voting power among our founders, which limits shareholders’ ability to influence our governance and business; and risks related to our status as a foreign private issuer and a Luxembourg company. A detailed discussion of these and other risks and uncertainties that could cause actual results and events to differ materially from our estimates and forward-looking statements is included in our filings with the U.S. Securities and Exchange Commission (“SEC”), including our Annual Report on Form 20-F filed with the SEC on February 2, 2023, as updated by subsequent reports filed with the SEC. We undertake no obligation to update forward-looking statements to reflect events or circumstances occurring after the date of this shareholder update. Rounding Certain monetary amounts, percentages, and other figures included in this update have been subject to rounding adjustments. The sum of individual metrics may not always equal total amounts indicated due to rounding. 23

FINANCIAL STATEMENTS 23
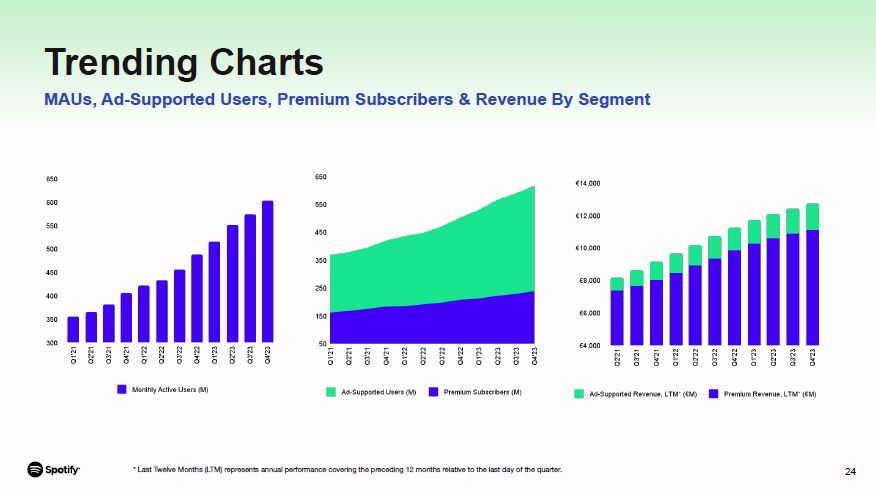
Trending Charts MAUs, Ad-Supported Users, Premium Subscribers & Revenue By Segment * Last Twelve Months (LTM) represents annual performance covering the preceding 12 months relative to the last day of the quarter. 25

Trending Charts Gross Profit By Segment, Gross Margin By Segment & Free Cash Flow * Last Twelve Months (LTM) represents annual performance covering the preceding 12 months relative to the last day of the quarter. 25

26 Consolidated statement of operations (Unaudited) (in € millions, except share and per share data) December 31, 2023 September 30, 2023 December 31, 2022 December 31, 2023 December 31, 2022 Revenue 3,671 3,357 3,166 13,247 11,727 Cost of revenue 2,691 2,472 2,365 9,850 8,801 Gross profit 980 885 801 3,397 2,926 Research and development 468 369 415 1,725 1,387 Sales and marketing 432 355 453 1,533 1,572 General and administrative 155 129 164 585 626 1,055 853 1,032 3,843 3,585 Operating (loss)/income (75) 32 (231) (446) (659) Finance income 46 55 26 161 421 Finance costs (102) (14) (86) (220) (132) Finance (costs)/income - net (56) 41 (60) (59) 289 (Loss)/income before tax (131) 73 (291) (505) (370) Income tax (benefit)/expense (61) 8 (21) 27 60 Net (loss)/income attributable to owners of the parent (70) 65 (270) (532) (430) (Loss)/earnings per share attributable to owners of the parent Basic (0.36) 0.33 (1.40) (2.73) (2.23) Diluted (0.36) 0.33 (1.40) (2.73) (2.93) Basic 196,036,080 194,881,723 193,228,229 194,732,304 192,934,862 Three months ended Twelve months ended Weighted-average ordinary shares outstanding Diluted 196,036,080 198,012,369 193,228,229 194,732,304 195,846,362
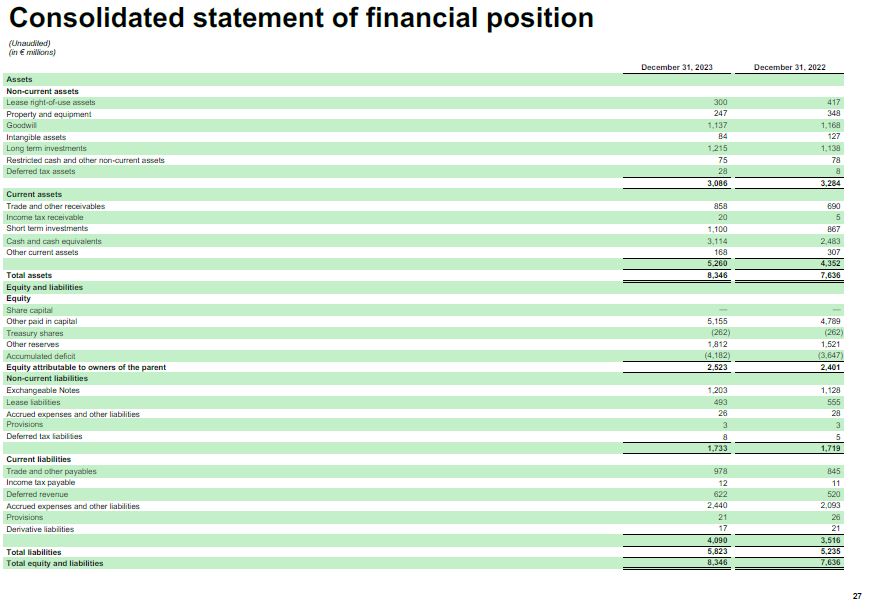
(Unaudited) (in € millions) December 31, 2023 December 31, 2022 Assets Non-current assets Lease right-of-use assets 300 417 Property and equipment 247 348 Goodwill 1,137 1,168 Intangible assets 84 127 Long term investments 1,215 1,138 Restricted cash and other non-current assets 75 78 Deferred tax assets 28 8 3,086 3,284 Current assets Trade and other receivables 858 690 Income tax receivable 20 5 Short term investments 1,100 867 Cash and cash equivalents 3,114 2,483 Other current assets 168 307 5,260 4,352 Total assets 8,346 7,636 Equity and liabilities Equity Share capital — — Other paid in capital 5,155 4,789 Treasury shares (262) (262) Other reserves 1,812 1,521 Accumulated deficit (4,182) (3,647) Equity attributable to owners of the parent 2,523 2,401 Non-current liabilities Exchangeable Notes 1,203 1,128 Lease liabilities 493 555 Accrued expenses and other liabilities 26 28 Provisions 3 3 Deferred tax liabilities 8 5 1,733 1,719 Current liabilities Trade and other payables 978 845 Income tax payable 12 11 Deferred revenue 622 520 Accrued expenses and other liabilities 2,440 2,093 Provisions 21 26 Derivative liabilities 17 21 4,090 3,516 Total liabilities 5,823 5,235 Total equity and liabilities 8,346 7,636 Consolidated statement of financial position 26
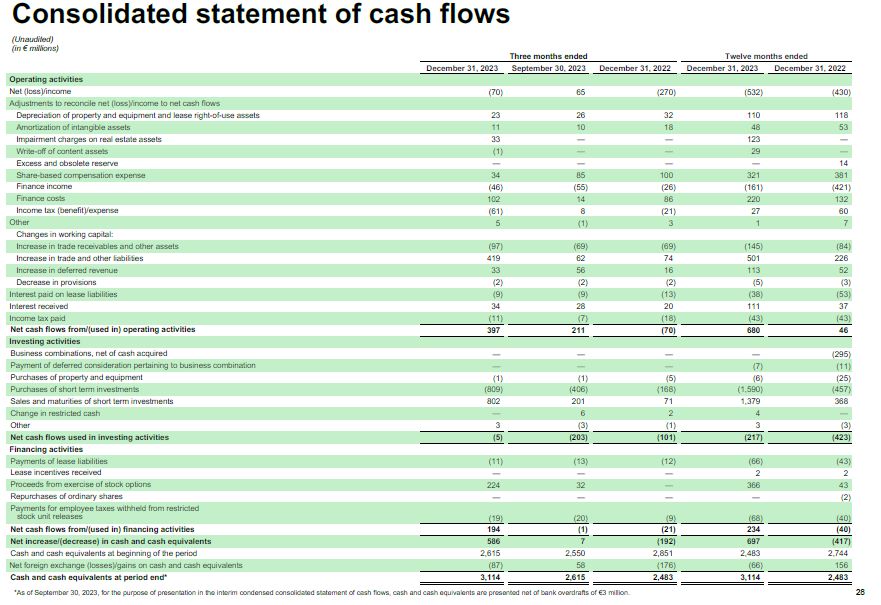
Twelve months ended December 31, 2023 September 30, 2023 December 31, 2022 December 31, 2023 December 31, 2022 Operating activities Net (loss)/income (70) 65 (270) (532) (430) Adjustments to reconcile net (loss)/income to net cash flows Depreciation of property and equipment and lease right-of-use assets 23 26 32 110 118 Amortization of intangible assets 11 10 18 48 53 Impairment charges on real estate assets 33 — — 123 — Write-off of content assets (1) — — 29 — Excess and obsolete reserve — — — — 14 Share-based compensation expense 34 85 100 321 381 Finance income (46) (55) (26) (161) (421) Finance costs 102 14 86 220 132 Income tax (benefit)/expense (61) 8 (21) 27 60 Other 5 (1) 3 1 7 Changes in working capital: Increase in trade receivables and other assets (97) (69) (69) (145) (84) Increase in trade and other liabilities 419 62 74 501 226 Increase in deferred revenue 33 56 16 113 52 Decrease in provisions (2) (2) (2) (5) (3) Interest paid on lease liabilities (9) (9) (13) (38) (53) Interest received 34 28 20 111 37 Income tax paid (11) (7) (18) (43) (43) Net cash flows from/(used in) operating activities 397 211 (70) 680 46 Investing activities Business combinations, net of cash acquired — — — — (295) Payment of deferred consideration pertaining to business combination — — — (7) (11) Purchases of property and equipment (1) (1) (5) (6) (25) Purchases of short term investments (809) (406) (168) (1,590) (457) Sales and maturities of short term investments 802 201 71 1,379 368 Change in restricted cash — 6 2 4 — Other 3 (3) (1) 3 (3) Net cash flows used in investing activities (5) (203) (101) (217) (423) Financing activities Payments of lease liabilities (11) (13) (12) (66) (43) Lease incentives received — — — 2 2 Proceeds from exercise of stock options 224 32 — 366 43 Repurchases of ordinary shares — — — — (2) Payments for employee taxes withheld from restricted stock unit releases (19) (20) (9) (68) (40) Net cash flows from/(used in) financing activities 194 (1) (21) 234 (40) Net increase/(decrease) in cash and cash equivalents 586 7 (192) 697 (417) Cash and cash equivalents at beginning of the period 2,615 2,550 2,851 2,483 2,744 Net foreign exchange (losses)/gains on cash and cash equivalents (87) 58 (176) (66) 156 Cash and cash equivalents at period end* 3,114 2,615 2,483 3,114 2,483 (Unaudited) (in € millions) Three months ended Consolidated statement of cash flows *As of September 30, 2023, for the purpose of presentation in the interim condensed consolidated statement of cash flows, cash and cash equivalents are presented net of bank overdrafts of €3 million. 28
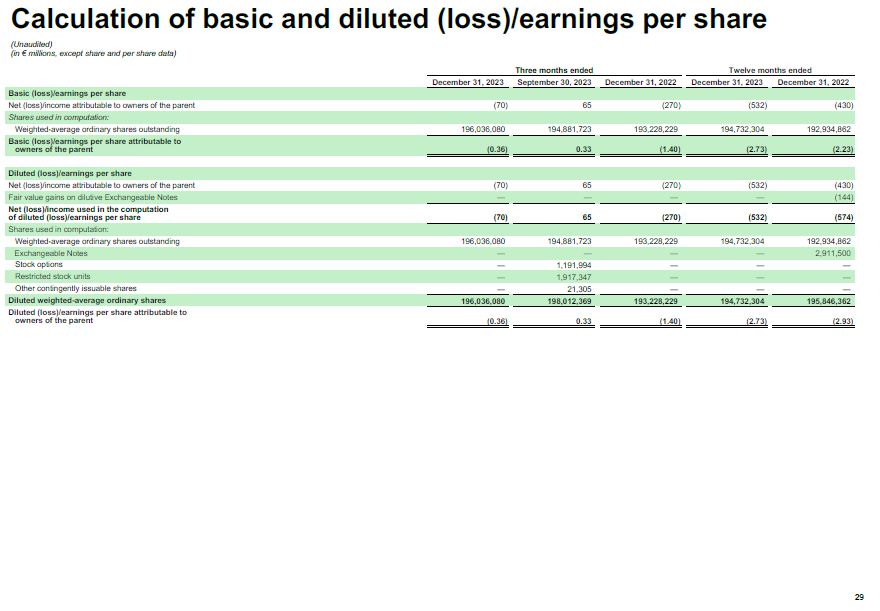
Three months ended Twelve months ended December 31, 2023 September 30, 2023 December 31, 2022 December 31, 2023 December 31, 2022 Basic (loss)/earnings per share Net (loss)/income attributable to owners of the parent (70) 65 (270) (532) (430) Shares used in computation: Weighted-average ordinary shares outstanding 196,036,080 194,881,723 193,228,229 194,732,304 192,934,862 Basic (loss)/earnings per share attributable to owners of the parent (0.36) 0.33 (1.40) (2.73) (2.23) Diluted (loss)/earnings per share Net (loss)/income attributable to owners of the parent (70) 65 (270) (532) (430) Fair value gains on dilutive Exchangeable Notes — — — — (144) Net (loss)/income used in the computation of diluted (loss)/earnings per share (70) 65 (270) (532) (574) Shares used in computation: Weighted-average ordinary shares outstanding 196,036,080 194,881,723 193,228,229 194,732,304 192,934,862 Exchangeable Notes — — — — 2,911,500 Stock options — 1,191,994 — — — Restricted stock units — 1,917,347 — — — Other contingently issuable shares — 21,305 — — — Diluted weighted-average ordinary shares 196,036,080 198,012,369 193,228,229 194,732,304 195,846,362 Diluted (loss)/earnings per share attributable to owners of the parent (0.36) 0.33 (1.40) (2.73) (2.93) Calculation of basic and diluted (loss)/earnings per share 29 (Unaudited) (in € millions, except share and per share data)
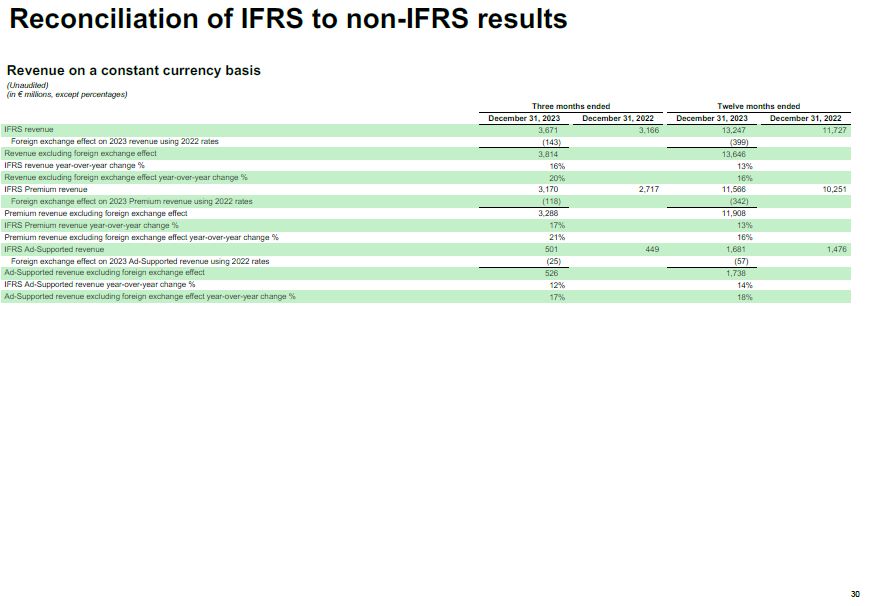
29 Three months ended Twelve months ended December 31, 2023 December 31, 2022 December 31, 2023 December 31, 2022 IFRS revenue 3,671 3,166 13,247 11,727 Foreign exchange effect on 2023 revenue using 2022 rates (143) (399) Revenue excluding foreign exchange effect 3,814 13,646 IFRS revenue year-over-year change % 16% 13% Revenue excluding foreign exchange effect year-over-year change % 20% 16% IFRS Premium revenue 3,170 2,717 11,566 10,251 Foreign exchange effect on 2023 Premium revenue using 2022 rates (118) (342) Premium revenue excluding foreign exchange effect 3,288 11,908 IFRS Premium revenue year-over-year change % 17% 13% Premium revenue excluding foreign exchange effect year-over-year change % 21% 16% IFRS Ad-Supported revenue 501 449 1,681 1,476 Foreign exchange effect on 2023 Ad-Supported revenue using 2022 rates (25) (57) Ad-Supported revenue excluding foreign exchange effect 526 1,738 IFRS Ad-Supported revenue year-over-year change % 12% 14% Ad-Supported revenue excluding foreign exchange effect year-over-year change % 17% 18% Revenue on a constant currency basis (Unaudited) (in € millions, except percentages) Reconciliation of IFRS to non-IFRS results

Operating expenses on a constant currency basis (Unaudited) (in € millions, except percentages) Three months ended December 31, 2023 December 31, 2022 Twelve months ended December 31, 2023 December 31, 2022 IFRS Research and development expenses 468 415 1,725 1,387 Foreign exchange effect on 2023 expenses using 2022 rates (17) (44) Research and development expenses excluding foreign exchange effect 485 1,769 IFRS Research and development expenses year over year change % 13 % 24 % Research and development expenses excluding foreign exchange effect year-over-year change % 17 % 28 % Reconciliation of IFRS to non-IFRS results Three months ended December 31, 2023 December 31, 2022 Twelve months ended December 31, 2023 December 31, 2022 IFRS Sales and marketing expenses 432 453 1,533 1,572 Foreign exchange effect on 2023 expenses using 2022 rates (17) (38) Sales and marketing expenses excluding foreign exchange effect 449 1,571 IFRS Sales and marketing expenses year over year change % (5)% (2)% Sales and marketing expenses excluding foreign exchange effect year-over-year change % (1)% 0 % Three months ended December 31, 2023 December 31, 2022 Twelve months ended December 31, 2023 December 31, 2022 IFRS General and administrative expenses 155 164 585 626 Foreign exchange effect on 2023 expenses using 2022 rates (7) (20) General and administrative expenses excluding foreign exchange effect 162 605 IFRS General and administrative expenses year over year change % (5)% (7)% General and administrative expenses excluding foreign exchange effect year-over-year change % (1)% (3)% Three months ended December 31, 2023 December 31, 2022 Twelve months ended December 31, 2023 December 31, 2022 IFRS Operating expenses 1,055 1,032 3,843 3,585 Foreign exchange effect on 2023 operating expenses using 2022 rates (41) (102) Operating expenses excluding foreign exchange effect 1,096 3,945 IFRS Operating expenses year over year change % 2 % 7 % Operating expenses excluding foreign exchange effect year-over-year change % 6 % 10 % 29

Three months ended June 30, September December March 31, June 30, September December March 31, June 30, September December March 31, June 30, September December 2020 30, 2020 31, 2020 2021 2021 30, 2021 31, 2021 2022 2022 30, 2022 31, 2022 2023 2023 30, 2023 31, 2023 Net cash flows from/(used in) operating activities 39 122 107 65 54 123 119 37 39 40 (70) 59 13 211 397 Capital expenditures (14) (17) (35) (24) (20) (25) (16) (10) (5) (5) (5) (2) (2) (1) (1) Change in restricted cash 2 (2) 2 — — 1 — (5) 3 — 2 — (2) 6 — Free Cash Flow 27 103 74 41 34 99 103 22 37 35 (73) 57 9 216 396 Last twelve months ended March 31, June 30, September December March 31, June 30, September December March 31, June 30, September December 2021 2021 30, 2021 31, 2021 2022 2022 30, 2022 31, 2022 2023 2023 30, 2023 31, 2023 Net cash flows from operating activities 333 348 349 361 333 318 235 46 68 42 213 680 Capital expenditures (90) (96) (104) (85) (71) (56) (36) (25) (17) (14) (10) (6) Change in restricted cash 2 — 3 1 (4) (1) (2) — 5 — 6 4 Free Cash Flow 245 252 248 277 258 261 197 21 56 28 209 678 Free Cash Flow (Unaudited) (in € millions) Reconciliation of IFRS to non-IFRS results Free Cash Flow (Unaudited) (in € millions) Free Cash Flow (Unaudited) (in € millions) Twelve months ended December 31, 2017 December 31, 2018 December 31, 2019 December 31, 2020 December 31, 2021 December 31, 2022 December 31, 2023 Net cash flows from operating activities 179 344 573 259 361 46 680 Capital expenditures (36) (125) (135) (78) (85) (25) (6) Change in restricted cash (34) (10) 2 2 1 — 4 Free Cash Flow 109 209 440 183 277 21 678 29
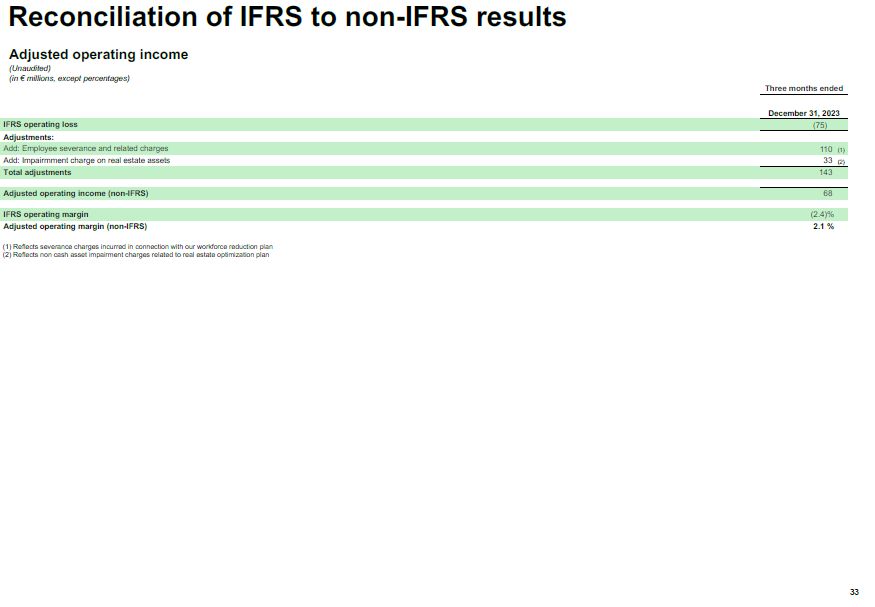
29 Adjusted operating income (Unaudited) (in € millions, except percentages) Three months ended December 31, 2023 IFRS operating loss (75) Adjustments: Add: Employee severance and related charges 110 (1) Add: Impairmment charge on real estate assets 33 (2) Total adjustments 143 Adjusted operating income (non-IFRS) 68 IFRS operating margin (2.4)% Adjusted operating margin (non-IFRS) 2.1 % Reflects severance charges incurred in connection with our workforce reduction plan Reflects non cash asset impairment charges related to real estate optimization plan Reconciliation of IFRS to non-IFRS results