| FREE WRITING PROSPECTUS | ||
| FILED PURSUANT TO RULE 433 | ||
| REGISTRATION FILE NO.: 333-193376-18 | ||
April 29, 2015
FREE WRITING PROSPECTUS
STRUCTURAL AND COLLATERAL TERM SHEET
$1,369,706,187
(Approximate Total Mortgage Pool Balance)
$1,272,114,000
(Approximate Offered Certificates)
COMM 2015-CCRE23 |
Deutsche Mortgage & Asset Receiving Corporation
Depositor
German American Capital Corporation
Cantor Commercial Real Estate Lending, L.P.
Ladder Capital Finance LLC
Jefferies LoanCore LLC
General Electric Capital Corporation
Sponsors and Mortgage Loan Sellers
| Deutsche Bank Securities | Cantor Fitzgerald & Co. | |
| Joint Bookrunning Managers and Co-Lead Managers | ||
| Jefferies | Citigroup | CastleOak Securities, L.P. |
| Co-Managers | ||
The depositor has filed a registration statement (including the prospectus) with the Securities and Exchange Commission (File No. 333-193376) for the offering to which this communication relates. Before you invest, you should read the prospectus in the registration statement and other documents the depositor has filed with the Securities and Exchange Commission for more complete information about the depositor, the issuing entity and this offering. You may get these documents for free by visiting EDGAR on the SEC website at www.sec.gov. Alternatively, the depositor or Deutsche Bank Securities Inc., any other underwriter, or any dealer participating in this offering will arrange to send you the prospectus if you request it by calling toll-free 1-800-503-4611 or by email to the following address: prospectus.cpdg@db.com. The offered certificates referred to in these materials, and the asset pool backing them, are subject to modification or revision (including the possibility that one or more classes of certificates may be split, combined or eliminated at any time prior to issuance or availability of a final prospectus) and are offered on a “when, as and if issued” basis. You understand that, when you are considering the purchase of these certificates, a contract of sale will come into being no sooner than the date on which the relevant class has been priced and we have verified the allocation of certificates to be made to you; any “indications of interest” expressed by you, and any “soft circles” generated by us, will not create binding contractual obligations for you or us.
COMM 2015-CCRE23 Mortgage Trust Capitalized terms used but not defined herein have the meanings assigned to them in the other Free Writing Prospectus expected to be dated April 30, 2015, relating to the offered certificates (hereinafter referred to as the “Free Writing Prospectus”). |
| KEY FEATURES OF SECURITIZATION |
| Offering Terms: | |
| Joint Bookrunners and Co-Lead Managers: | Deutsche Bank Securities Inc. and Cantor Fitzgerald & Co. |
| Co-Managers: | Jefferies LLC, CastleOak Securities, L.P. and Citigroup Global Markets Inc. |
| Mortgage Loan Sellers: | German American Capital Corporation* (“GACC”) (41.9%), Cantor Commercial Real Estate Lending, L.P. (“CCRE”) (28.5%), Ladder Capital Finance LLC (“LCF”) (14.9%), Jefferies LoanCore LLC (“JLC”) (7.9%) and General Electric Capital Corporation (“GECC”) (6.7%). *An indirect wholly owned subsidiary of Deutsche Bank AG. |
| Master Servicer: | Midland Loan Services, a Division of PNC Bank, National Association |
| Operating Advisor: | Pentalpha Surveillance LLC |
| Special Servicer: | CWCapital Asset Management LLC |
| Trustee: | Wilmington Trust, National Association |
| Certificate Administrator: | Wells Fargo Bank, National Association |
| Rating Agencies: | Moody’s Investors Service, Inc., DBRS, Inc. and Morningstar Credit Ratings, LLC |
| Determination Date: | The 6th day of each month, or if such 6th day is not a business day, the following business day, commencing in June 2015. |
| Distribution Date: | 4th business day following the Determination Date in each month, commencing in June 2015. |
| Cut-off Date: | Payment Date in May 2015 (or related origination date, if later). Unless otherwise noted, all Mortgage Loan statistics are based on balances as of the Cut-off Date. |
| Settlement Date: | On or about May 15, 2015 |
| Settlement Terms: | DTC, Euroclear and Clearstream, same day funds, with accrued interest. |
| ERISA Eligible: | All of the Offered Certificates are expected to be ERISA eligible. |
| SMMEA Eligible: | None of the Offered Certificates will be SMMEA eligible. |
| Day Count: | 30/360 |
| Tax Treatment: | REMIC |
| Rated Final Distribution Date: | May 2048 |
| Minimum Denominations: | $10,000 (or $100,000 with respect to Class X-A) and in each case in multiples of $1 thereafter. |
| Clean-up Call: | 1% |
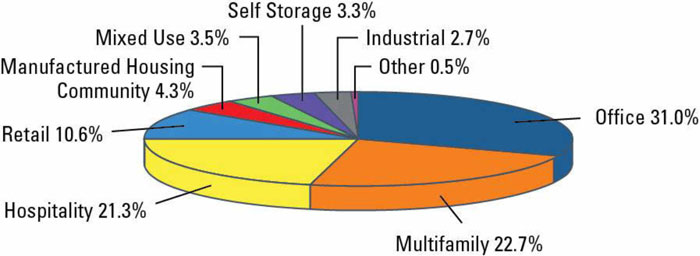
| Distribution of Collateral by Property Type |
THE INFORMATION IN THIS STRUCTURAL AND COLLATERAL TERM SHEET IS NOT COMPLETE AND MAY BE AMENDED PRIOR TO THE TIME OF SALE. THIS TERM SHEET IS NOT AN OFFER TO SELL THESE SECURITIES AND IT IS NOT A SOLICITATION OF AN OFFER TO BUY THESE SECURITIES IN ANY JURISDICTION WHERE THE OFFER OR SALE IS NOT PERMITTED.
3
COMM 2015-CCRE23 Mortgage Trust
TRANSACTION HIGHLIGHTS |
| Mortgage Loan Sellers | Number of Mortgage Loans(2)(3) | Number of Mortgaged Properties(2)(3) | Aggregate Cut-off Date Balance(1) | % of Outstanding Pool Balance(1) | ||||||||||||||
German American Capital Corporation(1)(2) | 21 | 121 | $ | 574,451,052 | 41.9 | % | ||||||||||||
| Cantor Commercial Real Estate Lending, L.P. | 31 | 37 | $ | 390,213,981 | 28.5 | % | ||||||||||||
| Ladder Capital Finance LLC | 18 | 47 | $ | 204,536,561 | 14.9 | % | ||||||||||||
Jefferies LoanCore LLC(1)(3) | 3 | 3 | $ | 108,076,155 | 7.9 | % | ||||||||||||
| General Electric Capital Corporation | 12 | 14 | $ | 92,428,438 | 6.7 | % | ||||||||||||
| Total: | 83 | 220 | $ | 1,369,706,187 | 100.0 | % | ||||||||||||
Pooled Collateral Facts(4): | |||
| Initial Outstanding Pool Balance: | $1,369,706,187 | ||
| Number of Mortgage Loans: | 83 | ||
| Number of Mortgaged Properties: | 220 | ||
| Average Mortgage Loan Cut-off Date Balance: | $16,502,484 | ||
| Average Mortgaged Property Cut-off Date Balance: | $6,225,937 | ||
| Weighted Average Mortgage Rate: | 4.2774% | ||
| Weighted Average Mortgage Loan Original Term to Maturity or ARD (months): | 113 | ||
| Weighted Average Mortgage Loan Remaining Term to Maturity or ARD (months): | 111 | ||
| Weighted Average Mortgage Loan Seasoning (months): | 2 | ||
| % of Mortgaged Properties Leased to a Single Tenant: | 5.3% | ||
Credit Statistics(1): | |||
| Weighted Average Mortgage Loan U/W NCF DSCR: | 2.09x | ||
Weighted Average Mortgage Loan Cut-off Date LTV(5)(6): | 63.8% | ||
Weighted Average Mortgage Loan Maturity Date or ARD LTV(5): | 56.3% | ||
| Weighted Average U/W NOI Debt Yield: | 11.4% | ||
Amortization Overview: | |||
% Mortgage Loans with Amortization through Maturity(7): | 31.9% | ||
| % Mortgage Loans with Interest Only through Maturity or ARD: | 31.8% | ||
| % Mortgage Loans with Interest Only followed by Amortization: | 36.3% | ||
| Weighted Average Remaining Amortization Term (months): | 352 | ||
Loan Structural Features: | |||
| % Mortgage Loans with Upfront or Ongoing Tax Reserves: | 97.3% | ||
% Mortgage Loans with Upfront or Ongoing Replacement Reserves(8): | 80.3% | ||
| % Mortgage Loans with Upfront or Ongoing Insurance Reserves: | 70.9% | ||
% Mortgage Loans with Upfront or Ongoing TI/LC Reserves(9): | 91.9% | ||
| % Mortgage Loans with Upfront Engineering Reserves: | 45.5% | ||
| % Mortgage Loans with Upfront or Ongoing Other Reserves: | 65.0% | ||
| % Mortgage Loans with In Place Hard Lockboxes: | 45.7% | ||
| % Mortgage Loans with Cash Traps Triggered at Levels ≥ 1.10x: | 60.4% | ||
| % Mortgage Loans with Cash Traps Triggered only based on Loan Specific Debt Yield: | 23.1% | ||
| % Mortgage Loans with Defeasance Only After a Lockout Period and Prior to an Open Period: | 92.6% | ||
| % Mortgage Loans with Prepayment Only After a Lockout Period and Prior to an Open Period with a Yield Maintenance Charge: | 5.1% | ||
| % Mortgage Loans with Prepayment with a Yield Maintenance Charge or Defeasance Only After a Lockout Period and Prior to an Open Period: | 2.1% | ||
| % Mortgage Loans with Prepayment with a Yield Maintenance Charge Prior to an Open Period and also Allow Defeasance after a Period of 2 Years Following the Closing Date: | 0.2% | ||
| (1) | The 9200 & 9220 Sunset Loan and the Maui Coast loan were originated by JLC and a portion of each loan was subsequently purchased by GACC. The aggregate Cut-off Date balance and % of Outstanding Pool Balance reflect the allocated amounts of each Mortgage Loan contributed by each Mortgage Loan Seller. |
| (2) | The Number of Mortgage Loans and Number of Mortgaged Properties reflect the 19 Mortgage Loans and 119 Mortgaged Properties, respectively, contributed solely by German American Capital Corporation plus the two Mortgaged Loans and two Mortgaged Properties that are being contributed by both German American Capital Corporation and Jefferies LoanCore LLC. |
| (3) | The Number of Mortgage Loans and Number of Mortgaged Properties reflect the 1 Mortgage Loan and 1 Mortgaged Property, respectively, contributed solely by Jefferies LoanCore LLC plus the two Mortgaged Loans and two Mortgaged Properties that are being contributed by both German American Capital Corporation and Jefferies LoanCore LLC. |
| (4) | With respect to the Courtyard by Marriott Loan, the numerical and statistical information related to the LTV, DSCR and debt yield includes the pari passu companion loans, but does not include the junior non-pooled component unless otherwise specified. With respect to the 9200 & 9220 Sunset Loan, the 3 Columbus Circle Loan, the La Gran Plaza Loan and the Walgreens Portfolio Loan, LTV, DSCR and debt yield calculations include the related pari passu companion loan(s). |
| (5) | With respect to 7 mortgage loans, representing 12.1% of the initial outstanding principal balance, the Cut-off Date LTV and Maturity Date or ARD LTV have in certain cases been calculated based on the “as complete” or “as stabilized” value. For additional information, see the Footnotes to Annex A-1 in the Free Writing Prospectus. |
| (6) | With respect to 1 mortgage loan, representing 2.3% of the initial outstanding principal balance, the Cut-off Date LTV has been calculated net of any related earnouts. For additional information, see the Footnotes to Annex A-1 in the Free Writing Prospectus. |
| (7) | Excludes loans which are interest only for the full loan term or through a related anticipated repayment date. |
| (8) | Includes FF&E Reserves. |
| (9) | Represents the percent of the allocated initial outstanding principal balance of retail, office, industrial and mixed use properties only. |
THE INFORMATION IN THIS STRUCTURAL AND COLLATERAL TERM SHEET IS NOT COMPLETE AND MAY BE AMENDED PRIOR TO THE TIME OF SALE. THIS TERM SHEET IS NOT AN OFFER TO SELL THESE SECURITIES AND IT IS NOT A SOLICITATION OF AN OFFER TO BUY THESE SECURITIES IN ANY JURISDICTION WHERE THE OFFER OR SALE IS NOT PERMITTED.
4
COMM 2015-CCRE23 Mortgage Trust |
| SUMMARY OF THE CERTIFICATES |
OFFERED CERTIFICATES
Class(1) | Ratings (Moody’s/DBRS/Morningstar) | Initial Certificate Balance or Notional Amount(2) | Initial Subordination Levels(3) | Weighted Average Life (years)(4) | Principal Window (months)(4) | Certificate Principal to Value Ratio(5) | Underwritten NOI Debt Yield(6) | |||||||||||||||||||
| Class A-1 | Aaa(sf)/AAA(sf)/AAA | $53,800,000 | 30.000 | %(7) | 2.72 | 1 - 56 | 44.7 | % | 16.3 | % | ||||||||||||||||
| Class A-2 | Aaa(sf)/AAA(sf)/AAA | $168,100,000 | 30.000 | %(7) | 4.86 | 56 - 59 | 44.7 | % | 16.3 | % | ||||||||||||||||
| Class A-SB | Aaa(sf)/AAA(sf)/AAA | $85,300,000 | 30.000 | %(7) | 7.36 | 59 - 115 | 44.7 | % | 16.3 | % | ||||||||||||||||
| Class A-3 | Aaa(sf)/AAA(sf)/AAA | $270,000,000 | 30.000 | %(7) | 9.69 | 115 - 118 | 44.7 | % | 16.3 | % | ||||||||||||||||
| Class A-4 | Aaa(sf)/AAA(sf)/AAA | $381,594,000 | 30.000 | %(7) | 9.87 | 118 - 119 | 44.7 | % | 16.3 | % | ||||||||||||||||
Class X-A(8) | NR(sf)/AAA(sf)/AAA | $1,059,810,000 | (9) | N/A | N/A | N/A | N/A | N/A | ||||||||||||||||||
| Class A-M | Aa2(sf)/AAA(sf)/AAA | $101,016,000 | 22.625 | % | 9.90 | 119 - 119 | 49.4 | % | 14.7 | % | ||||||||||||||||
| Class B | NR/AA(low)(sf)/AA- | $92,797,000 | 15.850 | % | 9.90 | 119 - 119 | 53.7 | % | 13.5 | % | ||||||||||||||||
| Class C | NR/A(low)(sf)/A- | $61,295,000 | 11.375 | % | 9.90 | 119 - 119 | 56.5 | % | 12.9 | % | ||||||||||||||||
| Class D | NR/BBB(low)(sf)/BBB- | $58,212,000 | 7.125 | % | 9.97 | 119 - 120 | 59.3 | % | 12.3 | % | ||||||||||||||||
NON-OFFERED CERTIFICATES
Class(1) | Ratings (Moody’s/DBRS/Morningstar) | Initial Certificate Balance or Notional Amount(2) | Initial Subordination Levels(3) | Weighted Average Life (years)(4) | Principal Window (months)(4) | Certificate Principal to Value Ratio(5) | Underwritten NOI Debt Yield(6) | |||||||||||||||||||
Class X-B(8) | NR/AAA(sf)/AAA | $154,092,000 | (9) | N/A | N/A | N/A | N/A | N/A | ||||||||||||||||||
Class X-C(8) | NR/AAA(sf)/AAA | $58,212,000 | (9) | N/A | N/A | N/A | N/A | N/A | ||||||||||||||||||
Class X-D(8) | NR/AAA(sf)/AAA | $27,394,000 | (9) | N/A | N/A | N/A | N/A | N/A | ||||||||||||||||||
| Class E | NR/BB(low)(sf)/BB- | $27,394,000 | 5.125 | % | 9.99 | 120 - 120 | 60.5 | % | 12.0 | % | ||||||||||||||||
| Class F | NR/B(low)(sf)/B- | $29,107,000 | 3.000 | % | 9.99 | 120 - 120 | 61.9 | % | 11.8 | % | ||||||||||||||||
| Class G | NR/NR/NR | $41,091,186 | 0.000 | % | 9.99 | 120 - 120 | 63.8 | % | 11.4 | % | ||||||||||||||||
NON-OFFERED CERTIFICATES: LOAN SPECIFIC CERTIFICATES(10)
Class(1) | Ratings (Moody’s/DBRS/Morningstar/KBRA) | Initial Certificate Balance or Notional Amount(2) | Initial Subordination Levels(3) | Weighted Average Life (years)(4) | Principal Window (months)(4) | Certificate Principal to Value Ratio(5) | Underwritten NOI Debt Yield(6) | |||||||||||||||||||
| Class CM-A | Aa2(sf)/AAA(sf)/ AA+/AA(sf) | $33,500,000 | 52.985 | % | 4.90 | 59 - 59 | 28.2 | % | 32.8 | % | ||||||||||||||||
| Class X-CM-CP | NR/AAA(sf)/AAA/AA(sf) | $205,381,000 | N/A | N/A | N/A | N/A | N/A | |||||||||||||||||||
| Class X-CM-EXT | Aa2(sf)/AAA(sf)/AAA/AA(sf) | $33,500,000 | N/A | N/A | N/A | N/A | N/A | |||||||||||||||||||
| Class CM-B | A3(sf)/A(low)(sf)/A-/A-(sf) | $84,500,000 | 40.373 | % | 4.90 | 59 - 59 | 35.8 | % | 25.8 | % | ||||||||||||||||
| Class CM-C | NR/NR/BBB-/BBB-(sf) | $87,381,000 | 27.331 | % | 4.90 | 59 - 59 | 43.6 | % | 21.2 | % | ||||||||||||||||
| Class CM-D | NR/NR/BB/BB-(sf) | $121,483,000 | 9.199 | % | 4.90 | 59 - 59 | 54.5 | % | 17.0 | % | ||||||||||||||||
| Class CM-E | NR/NR/B/B(sf) | $61,636,000 | 0.000 | % | 4.90 | 59 - 59 | 60.0 | % | 15.4 | % | ||||||||||||||||
| (1) | The pass-through rates applicable to the Class A-1, Class A-2, Class A-SB, Class A-3, Class A-4, Class A-M, Class B, Class C, Class D, Class E, Class F and Class G Certificates will equal one of: (i) a fixed per annum rate, (ii) the weighted average of the net mortgage rates on the mortgage loans (in each case, adjusted, if necessary, to accrue on the basis of a 360-day year consisting of twelve 30-day months) as of their respective due dates in the month preceding the month in which such distribution date occurs, (iii) a rate equal to the lesser of a specified pass-through rate and the weighted average of the net mortgage rates on the mortgage loans (in each case, adjusted, if necessary, to accrue on the basis of a 360-day year consisting of twelve 30-day months) as of their respective due dates in the month preceding the month in which such distribution date occurs, or (iv) the weighted average of the net mortgage rates on the mortgage loans) (in each case, adjusted, if necessary, to accrue on the basis of a 360-day year consisting of twelve 30-day months) as of their respective due dates in the month preceding the month in which such distribution date occurs, less a specified rate. |
| (2) | Approximate; subject to a permitted variance of plus or minus 5%. In addition, the notional amounts of the Class X-A, Class X-B, Class X-C and Class X-D Certificates may vary depending upon the final pricing of the classes of certificates and, if as a result of such pricing the pass-through rate of the Class X-A, Class X-B, Class X-C or Class X-D Certificates, as applicable, would be equal to zero, such class of certificates will not be issued on the settlement date of this securitization. |
| (3) | The credit support for the Class A-1, Class A-2, Class A-SB, Class A-3, Class A-4, Class A-M, Class B, Class C, Class D, Class E, Class F, and Class G (together with the Class X-A, Class X-B, Class X-C, Class X-D, Class V, Class R and Class LR certificates, the “Pooled Certificates”) presented in the table does not include the Courtyard by Marriott Non-Pooled Trust Companion Loans. The Class CM-A, Class CM-B, Class CM-C, Class CM-D and Class CM-E certificates will not provide credit support to any other class of certificates except to the extent of the Courtyard by Marriott Loan (in which the Class CM-A, Class X-CM-CP, Class X-CM-EXT, Class CM-B, Class CM-C, Class CM-D and Class CM-E certificates each represent an interest). |
| (4) | The weighted average life and principal window during which distributions of principal would be received as set forth in the table with respect to each class of certificates with a Certificate Balance is based on (i) modeling assumptions described in the Free Writing Prospectus, (ii) assumptions that there are no prepayments, delinquencies or losses on the mortgage loans and (iii) assumptions that there are no extensions of maturity dates and mortgage loans with anticipated repayment dates are repaid on the respective anticipated repayment dates. |
THE INFORMATION IN THIS STRUCTURAL AND COLLATERAL TERM SHEET IS NOT COMPLETE AND MAY BE AMENDED PRIOR TO THE TIME OF SALE. THIS TERM SHEET IS NOT AN OFFER TO SELL THESE SECURITIES AND IT IS NOT A SOLICITATION OF AN OFFER TO BUY THESE SECURITIES IN ANY JURISDICTION WHERE THE OFFER OR SALE IS NOT PERMITTED.
5
COMM 2015-CCRE23 Mortgage Trust |
| SUMMARY OF THE CERTIFICATES |
| (5) | “Certificate Principal to Value Ratio” for any class with a Certificate Balance (other than the loan specific certificates) is calculated as the product of (a) the weighted average Mortgage Loan Cut-off Date LTV of the mortgage pool (which excludes the Courtyard by Marriott Non-Pooled Trust Companion Loans), multiplied by (b) a fraction, the numerator of which is the total initial Certificate Balance of the related class of Certificates and all other classes, if any, that are senior to such class, and the denominator of which is the total initial Certificate Balance of all Certificates (other than the loan specific certificates). The Certificate Principal to Value Ratios of the Class A-1, Class A-2, Class A-SB, Class A-3 and Class A-4 Certificates are calculated in the aggregate for those classes as if they were a single class. |
| (6) | “Underwritten NOI Debt Yield” for any class with a Certificate Balance (other than the loan specific certificates) is calculated as the product of (a) the weighted average U/W NOI Debt Yield for the mortgage pool (which excludes the Courtyard by Marriott Non-Pooled Trust Companion Loans), multiplied by (b) a fraction, the numerator of which is the total initial Certificate Balance of all Certificates (other than the loan specific certificates) and the denominator of which is the total initial Certificate Balance of the related class of Certificates and all other classes, if any, that are senior to such class. The Underwritten NOI Debt Yields of the Class A-1, Class A-2, Class A-SB, Class A-3 and Class A-4 Certificates are calculated in the aggregate for those classes as if they were a single class. |
| (7) | The initial subordination levels for the Class A-1, Class A-2, Class A-SB, Class A-3 and Class A-4 Certificates are represented in the aggregate. |
| (8) | As further described in the Free Writing Prospectus, the pass-through rate applicable to the Class X-A, Class X-B, Class X-C and Class X-D Certificates for each Distribution Date will generally be equal to the excess of (i) the weighted average of the net mortgage rates on the mortgage loans (in each case, adjusted, if necessary to accrue on the basis of a 360 day year consisting of twelve 30-day months), over (ii)(A) with respect to the Class X-A Certificates, the weighted average of the pass-through rates of the Class A-1, Class A-2, Class A-SB, Class A-3, Class A-4 and Class A-M Certificates, (B) with respect to the Class X-B Certificates, the weighted average of the pass-through rates of the Class B and Class C Certificates, (C) with respect to the Class X-C Certificates, the pass-through rate of the Class D Certificates and (D) with respect to the Class X-D Certificates, the pass-through rate of the Class E Certificates. |
| (9) | The Class X-A, Class X-B, Class X-C and Class X-D Certificates (the “Class X Certificates”) will not have Certificate Balances. None of the Class X Certificates will be entitled to distributions of principal. The interest accrual amounts on the Class X-A Certificates will be calculated by reference to a notional amount equal to the sum of the total Certificate Balances of each of the Class A-1, Class A-2, Class A-SB, Class A-3, Class A-4 and Class A-M Certificates. The interest accrual amounts on the Class X-B Certificates will be calculated by reference to a notional amount equal to the sum of the total Certificate Balances of each of the Class B and Class C Certificates. The interest accrual amounts on the Class X-C Certificates will be calculated by reference to a notional amount equal to the Certificate Balance of the Class D Certificates. The interest accrual amounts on the Class X-D Certificates will be calculated by reference to a notional amount equal to the Certificate Balance of the Class E Certificates. |
| (10) | The holders of the Class CM-A, Class CM-B, Class CM-C, Class CM-D, Class CM-E, Class X-CM-CP and Class X-CM-EXT certificates (the “loan specific certificates”) will only be entitled to receive distributions at the related pass-through rate in respect of, and will only incur losses with respect to, the Courtyard by Marriott non-pooled trust companion loans, which companion loans are included as an asset of the issuing entity but not part of the mortgage pool backing the other classes of certificates. No class of certificates, other than the Class CM-A, Class X-CM-CP, Class X-CM-EXT, Class CM-B, Class CM-C, Class CM-D and Class CM-E certificates, will have any interest in the Courtyard by Marriott non-pooled trust companion loans. See “Description of the Mortgage Pool—Loan Combinations—The Courtyard by Marriott Loan Combination” in the Free Writing Prospectus. |
Short-Term Certificate Principal Paydown Summary(1) |
| Class | Mortgage Loan Seller | Mortgage Loan | Property Type | Cut-off Date Balance | Remaining Term to Maturity or ARD (Mos.) | Cut-off Date LTV Ratio | U/W NCF DSCR | U/W NOI Debt Yield | ||||||||||
| A-1/A-2 | CCRE | Holiday Inn Manhattan View | Hospitality | $20,863,257 | 56 | 70.7% | 1.43x | 11.8% | ||||||||||
| A-2 | CCRE | DoubleTree Norwalk | Hospitality | $20,154,587 | 58 | 67.2% | 1.60x | 12.4% | ||||||||||
| A-2 | LCF | 1815 Griffin Road | Office | $7,000,000 | 58 | 72.9% | 1.88x | 10.0% | ||||||||||
| A-2/A-SB | GACC | Courtyard by Marriott Portfolio(2) | Hospitality | $100,000,000 | 59 | 28.2% | 7.40x | 32.7% | ||||||||||
| A-2/A-SB | GACC | Preston Plano Parkway | Retail | $11,384,463 | 59 | 69.8% | 1.59x | 10.3% | ||||||||||
| A-2/A-SB | GACC | Hampton Inn Terre Haute(3) | Hospitality | $6,450,000 | 59 | 70.1% | 1.94x | 13.7% | ||||||||||
| A-2/A-SB | CCRE | 47-30 & 31 Vernon Blvd | Mixed Use | $3,296,383 | 59 | 52.3% | 1.31x | 9.1% | ||||||||||
| (1) | This table identifies loans with balloon payments due during the principal paydown window (including mortgage loans with anticipated repayment dates that are repaid on the respective anticipated repayment dates) assuming 0% CPR and no losses or extensions for the indicated Certificates. See “Yield and Maturity Considerations—Yield Considerations” in the Free Writing Prospectus. |
| (2) | With respect to the Courtyard by Marriott Portfolio the LTV, DSCR and Debt Yield calculations include the Courtyard by Marriott Pari Passu Companion Loans , but does not include the Courtyard by Marriott Non-Pooled Trust Subordinate Companion Loan unless otherwise specified. |
| (3) | With respect to the Hampton Inn Terre Haute loan, the Cut-off Date LTV Ratio has been calculated using the “as complete” value. |
THE INFORMATION IN THIS STRUCTURAL AND COLLATERAL TERM SHEET IS NOT COMPLETE AND MAY BE AMENDED PRIOR TO THE TIME OF SALE. THIS TERM SHEET IS NOT AN OFFER TO SELL THESE SECURITIES AND IT IS NOT A SOLICITATION OF AN OFFER TO BUY THESE SECURITIES IN ANY JURISDICTION WHERE THE OFFER OR SALE IS NOT PERMITTED.
6
COMM 2015-CCRE23 Mortgage Trust |
| STRUCTURE OVERVIEW |
| Principal Payments: | Payments in respect of principal of the Certificates (other than the loan specific certificates) will be distributed, first, to the Class A-SB Certificates, until the Certificate Balance of such Class is reduced to the planned principal balance for the related Distribution Date set forth on Annex A-3 to the Free Writing Prospectus, then, to the Class A-1, Class A-2, Class A-3, Class A-4, Class A-SB, Class A-M, Class B, Class C, Class D, Class E, Class F and Class G Certificates, in that order, until the Certificate Balance of each such Class is reduced to zero. Notwithstanding the foregoing, if the total principal balance of the Class A-M, Class B, Class C Class D, Class E, Class F and Class G Certificates have been reduced to zero as a result of loss allocation, payments in respect of principal of the Certificates will be distributed, first, to the Class A-1, Class A-2, Class A-SB, Class A-3 and Class A-4 Certificates, on a pro rata basis, based on the Certificate Balance of each such Class, then, to the extent of any recoveries on realized losses, to the Class A-M, Class B, Class C, Class D, Class E, Class F and Class G Certificates, in that order, in each case until the Certificate Balance of each such Class is reduced to zero (or previously allocated realized losses have been fully reimbursed). The Class X-A, Class X-B, Class X-C and Class X-D Certificates will not be entitled to receive distributions of principal; however, (i) the notional amount of the Class X-A Certificates will be reduced by the aggregate amount of principal distributions and realized losses allocated to the Class A-1, Class A-2, Class A-SB, Class A-3, Class A-4 and Class A-M Certificates; (ii) the notional amount of the Class X-B Certificates will be reduced by the aggregate amount of principal distributions and realized losses allocated to the Class B and Class C Certificates; and (iii) the notional amount of the Class X-C Certificates will be reduced by the principal distributions and realized losses allocated to the Class D Certificates and (iv) the notional amount of the Class X-D Certificates will be reduced by the principal distributions and realized losses allocated to the Class E Certificates. | |
| Interest Payments: | On each Distribution Date, interest accrued for each Class of the Certificates (other than loan specific certificates) at the applicable pass-through rate will be distributed in the following order of priority, to the extent of available funds: first, to the Class A-1, Class A-2, Class A-SB, Class A-3, Class A-4, Class X-A, Class X-B, Class X-C and Class X-D Certificates, on a pro rata basis, based on the accrued and unpaid interest on each such Class and then, to the Class A-M, Class B, Class C, Class D, Class E, Class F and Class G Certificates, in that order, in each case until the interest payable to each such Class is paid in full. The pass-through rates applicable to the Class A-1, Class A-2, Class A-SB, Class A-3, Class A-4, Class A-M, Class B, Class C, Class D, Class E, Class F and Class G Certificates for each Distribution Date will equal one of: (i) a fixed per annum rate, (ii) the weighted average of the net mortgage rates on the mortgage loans (in each case, adjusted, if necessary, to accrue on the basis of a 360-day year consisting of twelve 30-day months) as of their respective due dates in the month preceding the month in which such distribution date occurs, (iii) a rate equal to the lesser of a specified pass-through rate and the weighted average of the net mortgage rates on the mortgage loans (in each case, adjusted, if necessary, to accrue on the basis of a 360-day year consisting of twelve 30-day months) as of their respective due dates in the month preceding the month in which such distribution date occurs, or (iv) the weighted average of the net mortgage rates on the mortgage loans (in each case, adjusted, if necessary, to accrue on the basis of a 360-day year consisting of twelve 30-day months) as of their respective due dates in the month preceding the month in which such distribution date occurs, less a specified rate. As further described in the Free Writing Prospectus, the pass-through rate applicable to the Class X-A, Class X-B, Class X-C and Class X-D Certificates for each Distribution Date will generally be equal to the excess of (i) the weighted average of the net mortgage rates on the mortgage loans (in each case, adjusted, if necessary, to accrue on the basis of a 360-day year consisting of twelve 30-day months), over (ii) (A) with respect to the Class X-A Certificates, the weighted average of the pass-through rates of the Class A-1, Class A-2, Class A-SB, Class A-3, Class A-4 and Class A-M Certificates, (B) with respect to the Class X-B Certificates, the weighted average of the pass-through rates of the Class B and Class C Certificate, (C) with respect to the Class X-C Certificates, the pass-through rate of the Class D Certificates and (D) with respect to the Class X-D Certificates, the pass-through rate of the Class E Certificates. The holders of the Class CM-A, Class CM-B, Class CM-C, Class CM-D, Class CM-E, Class X-CM-CP and Class X-CM-EXT certificates (the “loan-specific certificates”) will only be entitled to |
THE INFORMATION IN THIS STRUCTURAL AND COLLATERAL TERM SHEET IS NOT COMPLETE AND MAY BE AMENDED PRIOR TO THE TIME OF SALE. THIS TERM SHEET IS NOT AN OFFER TO SELL THESE SECURITIES AND IT IS NOT A SOLICITATION OF AN OFFER TO BUY THESE SECURITIES IN ANY JURISDICTION WHERE THE OFFER OR SALE IS NOT PERMITTED.
7
COMM 2015-CCRE23 Mortgage Trust |
| STRUCTURE OVERVIEW |
| receive distributions at the related pass-through rate in respect of, and will only incur losses with respect to the Courtyard by Marriott Non-Pooled Trust Companion Loans, which companion loans are included as an asset of the issuing entity but not part of the mortgage pool backing the other classes of certificates, as described in Loss Allocation below. | |||||
| Prepayment Interest Shortfalls: | Prepayment interest shortfalls will be allocated pro rata based on interest entitlements, in reduction of the interest otherwise payable with respect to each of the interest-bearing certificate classes. | ||||
| Loss Allocation: | Losses (other than with respect to the Courtyard by Marriott Non-Pooled Trust Companion Loans) will be allocated to each Class of Certificates entitled to principal (other than loan specific certificates) in reverse alphabetical order starting with Class G through and including Class A-M and then to Class A-1, Class A-2, Class A-SB, Class A-3 and Class A-4 Certificates on a pro rata basis based on the Certificate Balance of each such class. The notional amount of any Class of Class X Certificates will be reduced by the aggregate amount of realized losses allocated to Certificates that are components of the notional amount of such Class of Class X Certificates. Losses with respect to the Courtyard by Marriott Non-Pooled Trust Companion Loans will be allocated to each class of loan-specific certificates (other than the Class X-CM-CP and Class X-CM-EXT certificates) first, to the Class CM-E Certificates, second, Class CM-D Certificates, third, to the Class CM-C Certificates, fourth, to the Class CM-B Certificates, and finally, to the Class CM-A Certificates. | ||||
| Prepayment Premiums: | A percentage of all prepayment premiums (either fixed prepayment premiums or yield maintenance amounts) collected on the Mortgage Loans will be allocated to each of the Class A-1, Class A-2, Class A-SB, Class A-3, Class A-4, Class A-M, Class B, Class C and Class D Certificates (the “YM P&I Certificates”) then entitled to principal distributions, which percentage will be equal to the product of (a) a fraction, not greater than one, the numerator of which is the amount of principal distributed to such Class on such Distribution Date and the denominator of which is the total amount of principal distributed to the holders of the Class A-1, Class A-2, Class A-SB, Class A-3, Class A-4, Class A-M, Class B, Class C, Class D, Class E, Class F and Class G on such Distribution Date, and (b) a fraction (expressed as a percentage which can be no greater than 100% nor less than 0%), the numerator of which is the excess of the pass-through rate of each such Class of Certificates currently receiving principal over the relevant Discount Rate, and the denominator of which is the excess of the Mortgage Rate of the related Mortgage Loan over the relevant Discount Rate. Prepayment Premium Allocation Percentage for all YM P&I Certificates = | ||||
| (Pass-Through Rate - Discount Rate) | X | The percentage of the principal distribution amount to such Class as described in (a) above | |||
| (Mortgage Rate - Discount Rate) | |||||
| The remaining percentage of the prepayment premiums will be allocated to the Class X-A, Class X-B, Class X-C and Class X-D Certificates in the manner described in the Free Writing Prospectus. In general, this formula provides for an increase in the percentage of prepayment premiums allocated to the YM P&I Certificates then entitled to principal distributions relative to the Class X-A, Class X-B, Class X-C and Class X-D Certificates as Discount Rates decrease and a decrease in the percentage allocated to such Classes as Discount Rates rise. | |||||
| Loan Combinations: | The Mortgaged Property identified on Annex A–1 to the Free Writing Prospectus as 9200 & 9220 Sunset secures a Mortgage Loan with an outstanding principal balance as of the Cut–off Date of $120,000,000, evidenced by controlling Note A-2 and controlling Note A-3 (the “9200 & 9220 Sunset Loan”), representing approximately 8.8% of the outstanding principal balance, and also secures on a pari passu basis one companion loan evidenced by Note A-1, in the outstanding principal balance of $90,000,000 (the “9200 & 9220 Sunset Note A-1 Companion Loan”), which is currently held by JLC is expected to be included in a future securitization . The 9200 & 9220 Sunset Loan and the 9200 & 9220 Sunset Note A-1 Companion Loans are pari passu in right of payment and are collectively referred to herein as the “9200 & 9220 Sunset Loan Combination.” The 9200 & 9220 Sunset Loan Combination will be serviced pursuant to the COMM 2015-CCRE23 pooling and servicing agreement and the related intercreditor agreement. For | ||||
THE INFORMATION IN THIS STRUCTURAL AND COLLATERAL TERM SHEET IS NOT COMPLETE AND MAY BE AMENDED PRIOR TO THE TIME OF SALE. THIS TERM SHEET IS NOT AN OFFER TO SELL THESE SECURITIES AND IT IS NOT A SOLICITATION OF AN OFFER TO BUY THESE SECURITIES IN ANY JURISDICTION WHERE THE OFFER OR SALE IS NOT PERMITTED.
8
COMM 2015-CCRE23 Mortgage Trust |
| STRUCTURE OVERVIEW |
additional information regarding the 9200 & 9220 Sunset Loan Combination, see “Description of the Mortgage Pool—Loan Combinations—9200 & 9220 Sunset Loan Combination” in the Free Writing Prospectus. The Mortgaged Property identified on Annex A–1 to the Free Writing Prospectus as Courtyard by Marriott Portfolio secures a Mortgage Loan with an outstanding principal balance as of the Cut–off Date of $100,000,000, representing approximately 7.3% of the Initial Outstanding Pool Balance, and also certain companion loans, as further described under “—The Courtyard by Marriott Loan Combination” below. The Mortgaged Property identified on Annex A–1 to the Free Writing Prospectus as 3 Columbus Circle secures a Mortgage Loan with an outstanding principal balance as of the Cut–off Date of $90,000,000, evidenced by Note A-1 (the “3 Columbus Circle Loan”), representing approximately 6.6% of the Initial Outstanding Pool Balance, and also secures on a pari passu basis five companion loans evidenced by (1) Note A-4, in the outstanding principal balance of $85,000,000 (the “3 Columbus Circle Note A-4 Companion Loan”), which is currently being held by the COMM 2015-CCRE22 Mortgage Trust, (2) Note A-2 and Note A-5, in the aggregate outstanding principal amount of $100,000,000 (the “3 Columbus Circle Note A-2 Companion Loan” and the “3 Columbus Circle Note A-5 Companion Loan”, respectively), which is currently being held by the CGMT 2015-GC29 Mortgage Trust, and (3) Note A-3 and Note A-6, in the aggregate outstanding principal amount of $75,000,000 (the “3 Columbus Circle Note A-3 Companion Loan” and the “3 Columbus Circle Note A-6 Companion Loan”, respectively, and, together with the 3 Columbus Circle Note A-1 Companion Loan, the 3 Columbus Circle Note A-2 Companion Loan and the 3 Columbus Circle Note A-5 Companion Loan, the “3 Columbus Circle Companion Loans”), which is currently being held by the WFCM 2015-LC20 Mortgage Trust. The 3 Columbus Circle Loan and the 3 Columbus Circle Companion Loans are pari passu in right of payment and are collectively referred to herein as the “3 Columbus Circle Loan Combination.” The 3 Columbus Circle Loan Combination will be serviced pursuant to the COMM 2015-CCRE23 pooling and servicing agreement and the related intercreditor agreement. For additional information regarding the 3 Columbus Circle Loan Combination, see “Description of the Mortgage Pool—Loan Combinations—3 Columbus Circle Loan Combination” in the Free Writing Prospectus. The Mortgaged Property identified on Annex A–1 to the Free Writing Prospectus as La Gran Plaza secures a Mortgage Loan with an outstanding principal balance as of the Cut–off Date of $26,000,000, evidenced by Note A-3 (the “La Gran Plaza Loan”), representing approximately 1.9% of the outstanding principal balance, and also secures on a pari passu basis two companion loans that have an aggregate outstanding principal balance as of the Cut-off Date of $50,000,000, evidenced by Note A-1 (the “La Gran Plaza Note A-1 Companion Loan”) and Note A-2 together with the La Gran Plaza Note A-1 Companion Loan, the “La Gran Plaza Companion Loans”), which are currently held by LCF, and which may be sold or further divided at any time (subject to compliance with the terms of the related co-lender agreement). The La Gran Plaza Loan and the La Gran Plaza Companion Loans are pari passu in right of payment and are collectively referred to herein as the “La Gran Plaza Loan Combination.” The La Gran Plaza Loan Combination will initially be serviced pursuant to the pooling and servicing agreement for this transaction and the related intercreditor agreement. Upon securitization of the La Gran Plaza Note A-1 Companion Loan (the “La Gran Plaza Note A-1 Securitization Date”), the servicing of the La Gran Plaza Loan Combination will transfer to the pooling and servicing agreement for that securitization. For additional information regarding the La Gran Plaza Loan Combination, see “Description of the Mortgage Pool—Loan Combinations—La Gran Plaza Combination” in the Free Writing Prospectus. In addition, prior to the La Gran Plaza Note A-1 Securitization Date, CWCapital Asset Management LLC, if necessary, will be the special servicer for the La Gran Plaza Loan Combination. After the La Gran Plaza Note A-1 Securitization Date, the special servicer under the pooling and servicing related to such securitization will be the special servicer. The Mortgaged Property identified on Annex A–1 to the Free Writing Prospectus as Walgreens Portfolio secures a Mortgage Loan with an outstanding principal balance as of the Cut–off Date of $16,000,000, evidenced by Note A-3 (the “Walgreens Portfolio Loan”), representing approximately 1.2% of the outstanding principal balance, and also secures on a pari passu basis two companion loans evidenced by (1) Note A-1, in the outstanding principal | |||||
THE INFORMATION IN THIS STRUCTURAL AND COLLATERAL TERM SHEET IS NOT COMPLETE AND MAY BE AMENDED PRIOR TO THE TIME OF SALE. THIS TERM SHEET IS NOT AN OFFER TO SELL THESE SECURITIES AND IT IS NOT A SOLICITATION OF AN OFFER TO BUY THESE SECURITIES IN ANY JURISDICTION WHERE THE OFFER OR SALE IS NOT PERMITTED.
9
COMM 2015-CCRE23 Mortgage Trust |
| STRUCTURE OVERVIEW |
balance of $64,000,000 (the “Walgreens Portfolio Note A-1 Companion Loan”), which is currently being held by the WFCM 2015-LC20 Mortgage Trust, and (2) Note A-2, in the outstanding principal balance of $39,065,000 (the “Walgreens Portfolio Note A-2 Companion Loan”), which is currently being held by the COMM 2015-LC19 Mortgage Trust. The Walgreens Portfolio Loan and the Walgreens Portfolio Companion Loans are pari passu in right of payment and are collectively referred to herein as the “Walgreens Portfolio Loan Combination.” The Walgreens Portfolio Loan Combination will be serviced pursuant to the WFCM 2015-LC20 pooling and servicing agreement and the related intercreditor agreement. For additional information regarding the Walgreens Portfolio Loan Combination, see “Description of the Mortgage Pool—Loan Combinations—Walgreens Portfolio Loan Combination” in the Free Writing Prospectus. | |||||
| Control Rights and Directing Holder: | Certain Classes of Certificates (the “Control Eligible Certificates”) will have certain control rights over servicing matters with respect to each Mortgage Loan (other than the Courtyard by Marriott Loan, the La Gran Plaza Loan and the Walgreens Portfolio Loan) and the 9200 & 9220 Sunset Loan Combination and 3 Columbus Circle Loan Combination. The majority owner or appointed representative of the Class of Control Eligible Certificates that is the Controlling Class (such owner or representative, the “Directing Holder”, except as set forth below with respect to the Courtyard by Marriott Loan Combination) will be entitled to direct the Special Servicer to take, or refrain from taking certain actions with respect to each Mortgage Loan (other than the Courtyard by Marriott Loan, the La Gran Plaza Loan and the Walgreens Portfolio Loan) and the 9200 & 9220 Sunset Loan Combination and 3 Columbus Circle Loan Combination. Furthermore, the Directing Holder will also have the right to receive notice and consent to certain material actions that the Master Servicer and the Special Servicer proposes to take with respect to such Mortgage Loan and the 9200 & 9220 Sunset Loan Combination and 3 Columbus Circle Loan Combination. It is expected that Seer Capital Partners Master Fund L.P. or its affiliate will be the initial Directing Holder with respect to each Mortgage Loan (other than the Courtyard by Marriott Loan, the La Gran Plaza Loan and the Walgreens Portfolio Loan) and the 9200 & 9220 Sunset Loan Combination and 3 Columbus Circle Loan Combination. In the case of the Courtyard by Marriott Loan Combination, the Directing Holder will initially be the majority owner or the appointed representative of the Courtyard by Marriott Controlling Class until a “Courtyard by Marriott Control Termination Event” has occurred and is continuing (i.e. no Class of Courtyard by Marriott Control Eligible Certificates has an aggregate Certificate Balance (as notionally or actually reduced by any Appraisal Reduction Amounts and realized losses) equal to or greater than 25% of the initial Certificate Balance of such Class). Following the occurrence and continuation of a Courtyard by Marriott Control Termination Event, the majority owner or appointed representative of the Controlling Class will be the Directing Holder for the Courtyard by Marriott Loan Combination. The “Courtyard by Marriott Controlling Class will be the most subordinate Class of Courtyard by Marriott Control Eligible Certificates then outstanding that has an aggregate Certificate Balance, as notionally reduced by any Appraisal Reduction Amounts allocable to such Class, equal to no less than 25% of the initial Certificate Balance of such Class. The “Courtyard by Marriott Control Eligible Certificates” are the Class CM-B, Class CM-C, Class CM-D and Class CM-E Certificates. For a description of the directing holder for the Walgreens Loan Combination see “Description of the Mortgage Pool—Loan Combinations” and “The Pooling and Servicing Agreement—The Directing Holder” in the Free Writing Prospectus. | ||||
| Control Eligible Certificates: | Class E, Class F and Class G Certificates. | ||||
| Controlling Class: | The Controlling Class will be the most subordinate Class of Control Eligible Certificates then outstanding that has an aggregate Certificate Balance, as notionally reduced by any Appraisal Reduction Amounts allocable to such Class, equal to no less than 25% of the initial Certificate Balance of such Class. The Controlling Class as of the Settlement Date will be the Class G Certificates. | ||||
| Appraised-Out Class: | Any Class of Control Eligible Certificates that has been determined, as a result of Appraisal Reductions Amounts allocable to such Class, to no longer be the Controlling Class. | ||||
THE INFORMATION IN THIS STRUCTURAL AND COLLATERAL TERM SHEET IS NOT COMPLETE AND MAY BE AMENDED PRIOR TO THE TIME OF SALE. THIS TERM SHEET IS NOT AN OFFER TO SELL THESE SECURITIES AND IT IS NOT A SOLICITATION OF AN OFFER TO BUY THESE SECURITIES IN ANY JURISDICTION WHERE THE OFFER OR SALE IS NOT PERMITTED.
10
COMM 2015-CCRE23 Mortgage Trust |
| STRUCTURE OVERVIEW |
Remedies Available to Holders of an Appraised-Out Class: | Holders of the majority of any Class of Control Eligible Certificates that is determined at any time of determination to no longer be the Controlling Class as a result of an allocation of an Appraisal Reduction Amounts in respect of such Class will have the right, at their sole expense, to require the Special Servicer to order a second appraisal for any Mortgage Loan for which an Appraisal Reduction Event has occurred. Upon receipt of the second appraisal, the Special Servicer will be required to determine, in accordance with the Servicing Standard, whether, based on its assessment of the second appraisal, a recalculation of the Appraisal Reduction Amount is warranted. If warranted, the Special Servicer will direct the Master Servicer to recalculate the Appraisal Reduction Amount based on the second appraisal, and if required by such recalculation, the Special Servicer will reinstate the Appraised-Out Class as the Controlling Class. The Holders of an Appraised-Out Class requesting a second appraisal will not be entitled to exercise any rights of the Controlling Class until such time, if any, as the Class is reinstated as the Controlling Class. | ||||
| Control Termination Event: | Will occur with respect to any Mortgage Loan (other than the Courtyard by Marriott Loan) or Serviced Loan Combination (other than the Courtyard by Marriott Loan Combination) when no Class of Control Eligible Certificates has an aggregate Certificate Balance (as notionally or actually reduced by any Appraisal Reduction Amounts and Realized Losses) equal to or greater than 25% of the initial Certificate Balance of such Class. A Control Termination Event will occur with respect to the Courtyard by Marriott Loan Combination when (a) no Class of Control Eligible Certificates has an aggregate Certificate Balance (as notionally or actually reduced by any Appraisal Reduction Amounts and Realized Losses) equal to or greater than 25% of the initial Certificate Balance of such Class and (b) a “Courtyard by Marriott Control Termination Event” exists with respect to the Courtyard by Marriott Loan Combination. Upon the occurrence and the continuance of a Control Termination Event, the Directing Holder will no longer have any Control Rights. The Directing Holder will no longer have the right to direct certain actions of the Special Servicer and will no longer have consent rights with respect to certain material actions that the Master Servicer or Special Servicer proposes to take with respect to a Mortgage Loan. Upon the occurrence and continuation of a Control Termination Event, the Directing Holder will retain non-binding consultation rights with respect to certain material actions that the Special Servicer proposes to take with respect to a Mortgage Loan (other than the Courtyard by Marriott Loan, the La Gran Plaza Loan and the Walgreens Portfolio Loan) and the 9200 & 9220 Sunset Loan Combination and 3 Columbus Circle Loan Combination. Such consultation rights will continue until the occurrence of a Consultation Termination Event. | ||||
| Consultation Termination Event: | Will occur with respect to any Mortgage Loan (other than the Courtyard by Marriott Loan) or Serviced Loan Combination (other than the Courtyard by Marriott Loan Combination) when, without giving regard to the application of any Appraisal Reduction Amounts (i.e., giving effect to principal reduction through Realized Losses only), there is no Class of Control Eligible Certificates that has an aggregate Certificate Balance equal to 25% or more of the initial Certificate Balance of such Class. A Consultation Termination Event will occur with respect to the Courtyard by Marriott Loan when (a) without giving regard to the application of any Appraisal Reduction Amounts (i.e., giving effect to principal reduction through Realized Losses only), there is no Class of Control Eligible Certificates that has an aggregate Certificate Balance equal to 25% or more of the initial Certificate Balance of such Class and (b) a “Courtyard by Marriott Control Termination Event” exists with respect to the Courtyard by Marriott Loan Combination. Upon the occurrence and continuance of a Consultation Termination Event the Directing Holder will have no rights under the pooling and servicing for this securitization (the “Pooling and Servicing Agreement”) other than those rights that all Certificateholders have. | ||||
| Appointment and Replacement of | |||||
| Special Servicer: | The Directing Holder will appoint the initial Special Servicer as of the Settlement Date. Prior to the occurrence and continuance of a Control Termination Event, the Special Servicer (other than the Courtyard by Marriott Loan, the La Gran Plaza Loan and the Walgreens Portfolio Loan) may generally be replaced at any time by the Directing Holder. | ||||
THE INFORMATION IN THIS STRUCTURAL AND COLLATERAL TERM SHEET IS NOT COMPLETE AND MAY BE AMENDED PRIOR TO THE TIME OF SALE. THIS TERM SHEET IS NOT AN OFFER TO SELL THESE SECURITIES AND IT IS NOT A SOLICITATION OF AN OFFER TO BUY THESE SECURITIES IN ANY JURISDICTION WHERE THE OFFER OR SALE IS NOT PERMITTED.
11
COMM 2015-CCRE23 Mortgage Trust |
| STRUCTURE OVERVIEW |
Upon the occurrence and during the continuance of a Control Termination Event, the Directing Holder will no longer have the right to replace the Special Servicer and such replacement (other than the Courtyard by Marriott Loan, the La Gran Plaza Loan Combination and the Walgreens Portfolio Loan Combination) will occur based on a vote of holders of all voting eligible Classes of Pooled Certificates as described below. See “Description of the Mortgage Pool—Loan Combinations” and “The Pooling and Servicing Agreement” in the Free Writing Prospectus for a description of the special servicer appointment and replacement rights with respect to the Courtyard by Marriott Loan Combination, the La Gran Plaza Loan Combination and the Walgreens Portfolio Loan Combination. | |||||
| Replacement of Special Servicer by Vote of Certificateholders: | Other than with respect to other than the Courtyard by Marriott Loan, the La Gran Plaza Loan and the Walgreens Portfolio Loan, if a Control Termination Event has occurred and is continuing, upon (i) the written direction of holders of Certificates evidencing not less than 25% of the voting rights of all Classes of Pooled Certificates entitled to principal (taking into account the application of Appraisal Reduction Amounts to notionally reduce the Certificate Balances of Classes to which such Appraisal Reduction Amounts are allocable) requesting a vote to replace the Special Servicer with a replacement Special Servicer, (ii) payment by such requesting holders to the Certificate Administrator of all reasonable fees and expenses to be incurred by the Certificate Administrator in connection with administering such vote and (iii) delivery by such holders to the Certificate Administrator of written confirmations from each Rating Agency that the appointment of the replacement Special Servicer will not result in a downgrade of the Certificates, the Certificate Administrator will be required to promptly provide written notice to all certificateholders of such request and conduct the solicitation of votes of all Certificates in such regard. Upon the written direction (within 180 days) of (i) Holders of at least 75% of a Pooled Certificateholder Quorum or (ii) the Holders of more than 50% of the voting rights of each Class of “pooled non-reduced certificates” (each Class of Pooled Certificates (other than the Class X-A, Class X-B, Class X-C, Class X-D, Class V, Class R and Class LR certificates) outstanding that has not been reduced to less than 25% of its initial Certificate Balance through the application of Appraisal Reduction Amounts and Realized Losses), the Trustee will immediately replace the Special Servicer with the replacement Special Servicer (other than the Courtyard by Marriott Loan Combination, the La Gran Plaza Loan Combination and the Walgreens Portfolio Loan Combination). “Pooled Certificateholder Quorum” means, in connection with any solicitation of votes in connection with the replacement of the Special Servicer as described above, the holders of Pooled Certificates evidencing at least 75% of the aggregate voting rights (taking into account Realized Losses and the application of any Appraisal Reduction Amounts to notionally reduce the Certificate Balance of the Certificates) of all classes of Pooled Certificates entitled to principal, on an aggregate basis. In addition, other than with respect to the Courtyard by Marriott Loan, the La Gran Plaza Loan and the Walgreens Portfolio Loan, after the occurrence of a Consultation Termination Event, if the Operating Advisor determines that the Special Servicer is not performing its duties in accordance with the Servicing Standard, the Operating Advisor will have the right to recommend the replacement of the Special Servicer. The Operating Advisor’s recommendation to replace the Special Servicer (other than the Courtyard by Marriott Loan Combination, the La Gran Plaza Loan Combination and the Walgreens Portfolio Loan Combination) must be confirmed by a majority of the voting rights of all Classes of Pooled Certificates entitled to principal (taking into account the application of Appraisal Reduction Amounts to notionally reduce the Certificate Balances of Classes to which such Appraisal Reduction Amounts are allocable) within 180 days from the time such recommendation is posted to the Certificate Administrator website and is subject to the receipt of written confirmations from each Rating Agency that the appointment of the replacement Special Servicer will not result in a downgrade of the Certificates. See “Description of the Mortgage Pool—Loan Combinations” and “The Pooling and Servicing Agreement” in the Free Writing Prospectus for a description of the special servicer appointment and replacement rights with respect to the Courtyard by Marriott Loan Combination, the La Gran Plaza Loan Combination and the Walgreens Portfolio Loan Combination. | ||||
THE INFORMATION IN THIS STRUCTURAL AND COLLATERAL TERM SHEET IS NOT COMPLETE AND MAY BE AMENDED PRIOR TO THE TIME OF SALE. THIS TERM SHEET IS NOT AN OFFER TO SELL THESE SECURITIES AND IT IS NOT A SOLICITATION OF AN OFFER TO BUY THESE SECURITIES IN ANY JURISDICTION WHERE THE OFFER OR SALE IS NOT PERMITTED.
12
COMM 2015-CCRE23 Mortgage Trust |
| STRUCTURE OVERVIEW |
| Cap on Workout and Liquidation Fees: | The workout fees and liquidation fees payable to a Special Servicer under the Pooling and Servicing Agreement will be an amount equal to the lesser of: (1) 1.0% of each collection of interest and principal following a workout or liquidation and (2) $1,000,000 per workout or liquidation. All Modification Fees actually paid to the Special Servicer in connection with a workout or liquidation or in connection with any prior workout or partial liquidation that occurred within the prior 18 months will be deducted from the total workout and/or liquidation fees payable (other than Modification Fees earned while the Mortgage Loan was not in special servicing). In addition, the total amount of workout and liquidation fees actually payable by the Trust under the Pooling and Servicing Agreement will be capped in the aggregate at $1,000,000 for each Mortgage Loan. If a new special servicer begins servicing the Mortgage Loan, all amounts paid to the prior special servicer will be disregarded for purposes of calculating the cap. | ||||
| Special Servicer Compensation: | The special servicing fee will equal 0.25% per annum of the stated principal balance of the related specially serviced loan or REO property. The Special Servicer and its affiliates will be prohibited from receiving or retaining any compensation or any other remuneration under the Pooling and Servicing Agreement (including in the form of commissions, brokerage fees, rebates, or as a result of any other fee-sharing arrangement) from any person (including the issuing entity, any borrower, any manager, any guarantor or indemnitor in respect of a Mortgage Loan or Serviced Loan Combination, if any, and any purchaser of any Mortgage Loan, Serviced Companion Loan or REO Property) in connection with the disposition, workout or foreclosure of any Mortgage Loan or Serviced Loan Combination, the management or disposition of any REO Property, or the performance of any other special servicing duties under the Pooling and Servicing Agreement, other than as expressly permitted in the Pooling and Servicing Agreement and other than commercially reasonable treasury management fees, banking fees and insurance commissions or fees received or retained by the Special Servicer or any of its Affiliates in connection with any services performed by such party with respect to any mortgage loan. Subject to certain limited exceptions, the Special Servicer will also be required to report any compensation or other remuneration the Special Servicer or its affiliates have received from any person and such information will be disclosed in the Certificateholders’ monthly distribution date statement. | ||||
Operating Advisor: | With respect to the Mortgage Loans (other than with respect to the La Gran Plaza Loan Combination and the Walgreens Portfolio Loan Combination) and prior to the occurrence of a Control Termination Event, the Operating Advisor will have access to any final asset status report and all information available with respect to the transaction on the Certificate Administrator’s website but will not have any approval or consultation rights. After the occurrence and during the continuance of a Control Termination Event, the Operating Advisor will have consultation rights with respect to certain major decisions and will have additional monitoring responsibilities on behalf of the entire trust. The Operating Advisor will be subject to termination if holders of at least 15% of the aggregate voting rights of the Pooled Certificates (in connection with termination and replacement relating to the Mortgage Loans other than the Courtyard by Marriott Loan) vote to terminate and replace the Operating Advisor and such vote is approved by holders of more than 50% of the applicable voting rights that exercise their right to vote, provided that holders of at least 50% of the applicable voting rights have exercised their right to vote. The holders initiating such vote will be responsible for the fees and expenses in connection with the vote and replacement. The Operating Advisor will not have consultation rights in respect of the La Gran Plaza Loan Combination and the Walgreens Portfolio Loan Combination. See “The Pooling and Servicing Agreement—The Operating Advisor” in the Free Writing Prospectus for a description of the Operating Advisor replacement rights with respect to the Courtyard by Marriott Loan. | ||||
| Liquidated Loan Waterfall: | On liquidation of any Mortgage Loan, all net liquidation proceeds will be applied so that amounts allocated as a recovery of accrued and unpaid interest will not, in the first instance, include any amount by which the interest portion of P&I Advances previously made was reduced as a result of Appraisal Reduction Amounts. After the adjusted interest amount is so allocated, any remaining net liquidation proceeds will be allocated to pay principal on the Mortgage Loan until the unpaid principal amount of the Mortgage Loan has been reduced to | ||||
THE INFORMATION IN THIS STRUCTURAL AND COLLATERAL TERM SHEET IS NOT COMPLETE AND MAY BE AMENDED PRIOR TO THE TIME OF SALE. THIS TERM SHEET IS NOT AN OFFER TO SELL THESE SECURITIES AND IT IS NOT A SOLICITATION OF AN OFFER TO BUY THESE SECURITIES IN ANY JURISDICTION WHERE THE OFFER OR SALE IS NOT PERMITTED.
13
COMM 2015-CCRE23 Mortgage Trust |
| STRUCTURE OVERVIEW |
| zero. Any remaining liquidation proceeds would then be allocated as a recovery of accrued and unpaid interest corresponding to the amount by which the interest portion of P&I Advances previously made was reduced as a result of Appraisal Reduction Amounts. | |||||
| Courtyard by Marriott Loan Combination: | The portfolio of Mortgaged Properties identified on Annex A–1 to the Free Writing Prospectus as Courtyard by Marriott Portfolio secures: (i) a Mortgage Loan with an outstanding principal balance as of the Cut–off Date of $100,000,000, evidenced by Note A2-A (the “Courtyard by Marriott Loan”), representing approximately 7.3% of the Initial Outstanding Pool Balance; (ii) three promissory notes (collectively referred to as the “Courtyard by Marriott Pari Passu Companion Loans”), which are generally pari passu in right of payment with the Courtyard by Marriott Loan, consisting of: (a) one promissory note designated as Note A-1 with an outstanding principal balance as of the cut-off date of $33,500,000 (referred to as the “Courtyard by Marriott Non-Pooled Trust Pari Passu Companion Loan”), which will be included in the issuing entity, (b) one promissory note designated as Note A2-B with an outstanding principal balance as of the cut-off date of $97,050,000 (referred to as “CBM Note A2-B”), which is currently held by GACC and which may be sold or further divided at any time (subject to compliance with the terms of the related co-lender agreement) and (c) one promissory note designated as Note A2-C with an outstanding principal balance as of the cut-off date of $84,450,000 (referred to together with CBM Note A2-B as the “Courtyard by Marriott Non-Trust Pari Passu Companion Loans”), which is currently held by Citigroup Global Markets Realty Corp. and which may be sold or further divided at any time (subject to compliance with the terms of the related co-lender agreement); and (iii) one promissory note designated as Note B with an outstanding principal balance as of the cut-off date of $355,000,000 (referred to as the “Courtyard by Marriott Non-Pooled Trust Subordinate Companion Loan”) which is subordinate in right of payment in respect of each of the Courtyard by Marriott Loan and the Courtyard by Marriott Pari Passu Companion Loans and will be included in the issuing entity. The Courtyard by Marriott Loan, the Courtyard by Marriott Pari Passu Companion Loans and the Courtyard by Marriott Non-Pooled Trust Subordinate Companion Loan are collectively referred to herein as the “Courtyard by Marriott Loan Combination.” The Courtyard by Marriott Loan will be pooled together with the other Mortgage Loans and interest and principal received in respect of the pooled component of the Courtyard by Marriott Loan will be available to make distributions in respect of each Class of Certificates other than the loan specific certificates and Class V Certificates. Payments of interest and principal received in respect of the Courtyard by Marriott Non-Pooled Trust Pari Passu Companion Loan and the Courtyard by Marriott Non-Pooled Trust Subordinate Companion Loan (collectively referred to as the “Courtyard by Marriott Non-Pooled Trust Companion Loans”) will be available to make distributions in respect of the loan specific certificates. Although the Courtyard by Marriott Non-Pooled Trust Companion Loans are assets of the issuing entity, unless otherwise indicated, for purposes of numerical and statistical information contained herein, the Courtyard by Marriott Non-Pooled Trust Companion Loans are not reflected herein and the term “Mortgage Loan” in that context does not include the Courtyard by Marriott Non-Pooled Trust Companion Loans. The holder of the loan-specific certificates have certain rights with respect to the Courtyard by Marriott Loan Combination as described under “Description of the Mortgage Pool—Loan Combinations—The Courtyard by Marriott Loan Combination” in the Free Writing Prospectus. The Courtyard by Marriott Loan Combination will be serviced pursuant to the COMM 2015-CCRE23 pooling and servicing agreement and the related intercreditor agreement. For additional information regarding the Courtyard by Marriott Loan Combination, see “Description of the Mortgage Pool—Loan Combinations—Courtyard by Marriott Loan Combination” in the Free Writing Prospectus. | ||||
THE INFORMATION IN THIS STRUCTURAL AND COLLATERAL TERM SHEET IS NOT COMPLETE AND MAY BE AMENDED PRIOR TO THE TIME OF SALE. THIS TERM SHEET IS NOT AN OFFER TO SELL THESE SECURITIES AND IT IS NOT A SOLICITATION OF AN OFFER TO BUY THESE SECURITIES IN ANY JURISDICTION WHERE THE OFFER OR SALE IS NOT PERMITTED.
14
COMM 2015-CCRE23 Mortgage Trust |
| OVERVIEW OF MORTGAGE POOL CHARACTERISTICS |
| Distribution of Cut-off Date Balances(1) |
Weighted Averages | ||||||||||||||||||||
| Range of Cut-off Date Balances | Number of Mortgage Loans | Aggregate Cut-off Date Balance | % of Initial Outstanding Pool Balance | Mortgage Rate | Stated Remaining Term (Mos.)(2) | U/W NCF DSCR | Cut-off Date LTV Ratio (3)(4) | Maturity Date or ARD LTV(3) | ||||||||||||
| $721,500 | - | $7,499,999 | 39 | $172,998,742 | 12.6% | 4.4581% | 113 | 1.70x | 66.3% | 54.5% | ||||||||||
| $7,500,000 | - | $14,999,999 | 15 | $147,261,913 | 10.8% | 4.3394% | 114 | 1.52x | 68.8% | 58.2% | ||||||||||
| $15,000,000 | - | $24,999,999 | 13 | $241,631,859 | 17.6% | 4.4377% | 108 | 1.44x | 69.8% | 60.6% | ||||||||||
| $25,000,000 | - | $49,999,999 | 11 | $345,693,672 | 25.2% | 4.5081% | 119 | 1.47x | 69.5% | 59.3% | ||||||||||
| $50,000,000 | - | $74,999,999 | 1 | $56,320,000 | 4.1% | 3.9300% | 119 | 2.77x | 55.0% | 55.0% | ||||||||||
| $75,000,000 | - | $120,000,000 | 4 | $405,800,000 | 29.6% | 3.9342% | 103 | 3.30x | 53.6% | 51.4% | ||||||||||
| Total/Weighted Average | 83 | $1,369,706,187 | 100.0% | 4.2774% | 111 | 2.09x | 63.8% | 56.3% | ||||||||||||
| Distribution of Mortgage Rates(1) |
Weighted Averages | ||||||||||||||||||||
| Range of Mortgage Rates | Number of Mortgage Loans | Aggregate Cut-off Date Balance | % of Initial Outstanding Pool Balance | Mortgage Rate | Stated Remaining Term (Mos.)(2) | U/W NCF DSCR | Cut-off Date LTV Ratio (3)(4) | Maturity Date or ARD LTV(3) | ||||||||||||
3.6100% | - | 4.4999% | 52 | $1,057,665,509 | 77.2% | 4.1026% | 112 | 2.29x | 62.4% | 55.6% | ||||||||||
4.5000% | - | 4.7499% | 17 | $153,392,954 | 11.2% | 4.6257% | 113 | 1.52x | 69.7% | 60.5% | ||||||||||
4.7500% | - | 5.4930% | 14 | $158,647,724 | 11.6% | 5.1060% | 101 | 1.38x | 67.4% | 56.8% | ||||||||||
| Total/Weighted Average | 83 | $1,369,706,187 | 100.0% | 4.2774% | 111 | 2.09x | 63.8% | 56.3% | ||||||||||||
Property Type Distribution(1)(5) |
| Weighted Averages | ||||||||||||||||||||||||||||||||
| Property Type | Number of Mortgaged Properties | Aggregate Cut-off Date Balance | % of Initial Outstanding Pool Balance | Number of Units/Rooms/ NRA/Beds/Homes/Pads | Cut-off Date Balance per Unit/Room/ NRA/Bed/Home /Pad | Mortgage Rate | Stated Remaining Term (Mos.)(2) | Occupancy | U/W NCF DSCR | Cut-off Date LTV Ratio(3)(4) | Maturity Date or ARD LTV(3) | |||||||||||||||||||||
| Office | 22 | $424,729,471 | 31.0% | 2,153,277 | $464 | 4.0684% | 117 | 91.0% | 1.85x | 62.5% | 57.9% | |||||||||||||||||||||
| CBD | 14 | $293,123,406 | 21.4% | 1,445,482 | $529 | 3.9500% | 117 | 89.7% | 2.00x | 59.9% | 57.3% | |||||||||||||||||||||
| Suburban | 4 | $92,183,724 | 6.7% | 591,516 | $163 | 4.2834% | 114 | 92.5% | 1.57x | 68.1% | 58.7% | |||||||||||||||||||||
| Medical | 4 | $39,422,341 | 2.9% | 116,279 | $683 | 4.4467% | 119 | 97.3% | 1.42x | 68.7% | 61.1% | |||||||||||||||||||||
| Multifamily | 26 | $311,012,747 | 22.7% | 5,431 | $117,104 | 4.5042% | 119 | 94.6% | 1.41x | 70.9% | 61.4% | |||||||||||||||||||||
| Garden | 21 | $236,702,155 | 17.3% | 4,285 | $69,116 | 4.5749% | 119 | 94.9% | 1.35x | 72.0% | 61.6% | |||||||||||||||||||||
| Mid-Rise | 3 | $38,385,592 | 2.8% | 254 | $401,348 | 4.5247% | 120 | 98.6% | 1.36x | 69.7% | 67.7% | |||||||||||||||||||||
| Independent Living | 1 | $25,000,000 | 1.8% | 139 | $179,856 | 3.9400% | 120 | 85.6% | 1.79x | 64.6% | 51.2% | |||||||||||||||||||||
| Student Housing | 1 | $10,925,000 | 0.8% | 753 | $14,509 | 4.1935% | 120 | 95.1% | 1.85x | 67.0% | 59.7% | |||||||||||||||||||||
| Hospitality | 79 | $291,541,432 | 21.3% | 11,427 | $105,307 | 4.2564% | 88 | 77.1% | 3.83x | 51.4% | 46.1% | |||||||||||||||||||||
| Full Service | 4 | $133,991,009 | 9.8% | 885 | $170,441 | 4.5062% | 100 | 84.2% | 2.05x | 63.1% | 57.7% | |||||||||||||||||||||
| Select Service | 65 | $100,000,000 | 7.3% | 9,590 | $42,408 | 3.6900% | 59 | 72.3% | 7.40x | 28.2% | 28.2% | |||||||||||||||||||||
| Limited Service | 10 | $57,550,423 | 4.2% | 952 | $62,954 | 4.6590% | 112 | 69.0% | 1.79x | 64.8% | 50.4% | |||||||||||||||||||||
| Retail | 46 | $145,734,925 | 10.6% | 1,340,984 | $179 | 4.4605% | 114 | 91.8% | 1.40x | 69.5% | 58.8% | |||||||||||||||||||||
Anchored(6) | 41 | $115,973,868 | 8.5% | 1,180,217 | $171 | 4.5038% | 118 | 91.5% | 1.37x | 69.6% | 58.1% | |||||||||||||||||||||
| Unanchored | 5 | $29,761,057 | 2.2% | 160,767 | $211 | 4.2918% | 96 | 93.1% | 1.48x | 69.3% | 61.3% | |||||||||||||||||||||
| Manufactured Housing Community | 10 | $59,470,435 | 4.3% | 1,663 | $39,582 | 4.1700% | 118 | 93.9% | 1.56x | 72.9% | 61.0% | |||||||||||||||||||||
| Mixed Use | 4 | $47,996,383 | 3.5% | 1,131,173 | $38,504 | 4.3598% | 116 | 89.1% | 1.65x | 65.3% | 54.8% | |||||||||||||||||||||
| Retail/Office | 2 | $36,900,000 | 2.7% | 1,122,275 | $87 | 4.2430% | 120 | 90.0% | 1.72x | 66.7% | 53.4% | |||||||||||||||||||||
| Multifamily/Retail | 2 | $11,096,383 | 0.8% | 8,898 | $166,258 | 4.7482% | 101 | 86.2% | 1.42x | 60.5% | 59.4% | |||||||||||||||||||||
| Self Storage | 28 | $44,608,004 | 3.3% | 1,085,213 | $45 | 4.3677% | 118 | 88.8% | 1.65x | 72.6% | 61.8% | |||||||||||||||||||||
| Industrial | 4 | $37,326,384 | 2.7% | 1,237,318 | $36 | 4.1679% | 119 | 94.9% | 1.56x | 69.5% | 56.8% | |||||||||||||||||||||
| Other | 1 | $7,286,407 | 0.5% | 1,995,484 | $4 | 4.3000% | 119 | 100.0% | 2.72x | 42.6% | 31.1% | |||||||||||||||||||||
| Total/Weighted Average | 220 | $1,369,706,187 | 100.0% | 4.2774% | 111 | 89.1% | 2.09x | 63.8% | 56.3% | |||||||||||||||||||||||
THE INFORMATION IN THIS STRUCTURAL AND COLLATERAL TERM SHEET IS NOT COMPLETE AND MAY BE AMENDED PRIOR TO THE TIME OF SALE. THIS TERM SHEET IS NOT AN OFFER TO SELL THESE SECURITIES AND IT IS NOT A SOLICITATION OF AN OFFER TO BUY THESE SECURITIES IN ANY JURISDICTION WHERE THE OFFER OR SALE IS NOT PERMITTED.
15
COMM 2015-CCRE23 Mortgage Trust |
| OVERVIEW OF MORTGAGE POOL CHARACTERISTICS |
| Geographic Distribution(1)(5) |
Weighted Averages | |||||||||||||||||||||||||
| State/Location | Number of Mortgaged Properties | Aggregate Cut-off Date Balance | % of Initial Outstanding Pool Balance | Mortgage Rate | Stated Remaining Term (Mos.)(2) | U/W NCF DSCR | Cut-off Date LTV Ratio(3)(4) | Maturity Date or ARD LTV(3) | |||||||||||||||||
| California | 19 | $344,914,540 | 25.2% | 4.2728% | 114 | 2.02x | 63.0% | 57.5% | |||||||||||||||||
Southern(7) | 14 | $313,119,764 | 22.9% | 4.3042% | 116 | 1.86x | 64.4% | 58.9% | |||||||||||||||||
Northern(7) | 5 | $31,794,776 | 2.3% | 3.9633% | 96 | 3.68x | 48.8% | 43.7% | |||||||||||||||||
| New York | 8 | $145,846,360 | 10.6% | 4.0740% | 107 | 2.09x | 56.2% | 54.0% | |||||||||||||||||
| New York City | 4 | $132,159,640 | 9.6% | 4.0304% | 107 | 2.02x | 56.1% | 54.9% | |||||||||||||||||
| Remaining New York State | 4 | $13,686,720 | 1.0% | 4.4943% | 108 | 2.77x | 57.0% | 46.0% | |||||||||||||||||
| Texas | 11 | $107,239,575 | 7.8% | 4.3599% | 111 | 1.70x | 68.6% | 58.9% | |||||||||||||||||
| Florida | 13 | $93,260,332 | 6.8% | 4.7180% | 110 | 1.83x | 68.4% | 59.2% | |||||||||||||||||
| Michigan | 6 | $61,438,819 | 4.5% | 4.1134% | 116 | 2.02x | 66.7% | 54.0% | |||||||||||||||||
| Other | 163 | $617,006,561 | 45.0% | 4.2635% | 110 | 2.25x | 64.2% | 55.5% | |||||||||||||||||
| Total/Weighted Average | 220 | $1,369,706,187 | 100.0% | 4.2774% | 111 | 2.09x | 63.8% | 56.3% | |||||||||||||||||
Distribution of Cut-off Date LTV Ratios(1)(3)(4) |
Weighted Averages | ||||||||||||||||||||||||||
Range of Cut-off Date LTV Ratios | Number of Mortgage Loans | Aggregate Cut-off Date Balance | % of Initial Outstanding Pool Balance | Mortgage Rate | Stated Remaining Term (Mos.)(2) | U/W NCF DSCR | Cut-off Date LTV Ratio | Maturity Date or ARD LTV | ||||||||||||||||||
| 27.3% | - | 54.9% | 5 | $202,248,790 | 14.8% | 3.7097% | 88 | 4.83x | 38.8% | 38.3% | ||||||||||||||||
| 55.0% | - | 59.9% | 6 | $79,770,000 | 5.8% | 4.0906% | 119 | 2.44x | 55.7% | 52.3% | ||||||||||||||||
| 60.0% | - | 64.9% | 13 | $244,267,357 | 17.8% | 4.1353% | 118 | 1.94x | 62.1% | 56.5% | ||||||||||||||||
| 65.0% | - | 69.9% | 25 | $362,859,166 | 26.5% | 4.5499% | 113 | 1.48x | 68.0% | 57.7% | ||||||||||||||||
| 70.0% | - | 74.9% | 31 | $447,610,873 | 32.7% | 4.4403% | 114 | 1.42x | 73.2% | 63.2% | ||||||||||||||||
| 75.0% | - | 75.0% | 3 | $32,950,000 | 2.4% | 4.0552% | 118 | 1.58x | 75.0% | 64.5% | ||||||||||||||||
| Total/Weighted Average | 83 | $1,369,706,187 | 100.0% | 4.2774% | 111 | 2.09x | 63.8% | 56.3% | ||||||||||||||||||
Distribution of Maturity Date or ARD LTV Ratios(1)(3) |
Weighted Averages | ||||||||||||||||||||||||||
Range of LTV Ratios at Maturity or ARD | Number of Mortgage Loans | Aggregate Cut-off Date Balance | % of Initial Outstanding Pool Balance | Mortgage Rate | Stated Remaining Term (Mos.)(2) | U/W NCF DSCR | Cut-off Date LTV Ratio(4) | Maturity Date or ARD LTV | ||||||||||||||||||
19.8% | - | 49.9% | 10 | $142,686,557 | 10.4% | 3.9568% | 76 | 5.77x | 36.4% | 32.1% | ||||||||||||||||
50.0% | - | 54.9% | 17 | $298,129,838 | 21.8% | 4.1377% | 118 | 1.83x | 60.4% | 51.8% | ||||||||||||||||
55.0% | - | 59.9% | 25 | $325,936,986 | 23.8% | 4.4155% | 119 | 1.68x | 67.7% | 57.4% | ||||||||||||||||
60.0% | - | 64.9% | 19 | $370,829,307 | 27.1% | 4.3135% | 109 | 1.69x | 67.6% | 61.7% | ||||||||||||||||
65.0% | - | 69.9% | 9 | $177,873,500 | 13.0% | 4.3492% | 117 | 1.43x | 74.2% | 65.3% | ||||||||||||||||
70.0% | - | 72.9% | 3 | $54,250,000 | 4.0% | 4.5773% | 112 | 1.38x | 71.0% | 71.0% | ||||||||||||||||
| Total/Weighted Average | 83 | $1,369,706,187 | 100.0% | 4.2774% | 111 | 2.09x | 63.8% | 56.3% | ||||||||||||||||||
Distribution of Underwritten NCF Debt Service Coverage Ratios(1) |
Weighted Averages | ||||||||||||||||||||||||||
Range of Underwritten NCF Debt Service Coverage Ratios | Number of Mortgage Loans | Aggregate Cut-off Date Balance | % of Initial Outstanding Pool Balance | Mortgage Rate | Stated Remaining Term (Mos.)(2) | U/W NCF DSCR | Cut-off Date LTV Ratio(3)(4) | Maturity Date or ARD LTV(3) | ||||||||||||||||||
1.20x | - | 1.39x | 20 | $406,079,920 | 29.6% | 4.5531% | 118 | 1.30x | 71.5% | 61.5% | ||||||||||||||||
1.40x | - | 1.44x | 9 | $137,101,180 | 10.0% | 4.4631% | 109 | 1.41x | 68.6% | 60.2% | ||||||||||||||||
1.45x | - | 1.54x | 14 | $146,163,995 | 10.7% | 4.3962% | 119 | 1.50x | 69.4% | 58.2% | ||||||||||||||||
1.55x | - | 1.99x | 31 | $289,882,233 | 21.2% | 4.3512% | 109 | 1.73x | 68.1% | 57.2% | ||||||||||||||||
2.00x | - | 2.49x | 5 | $225,206,453 | 16.4% | 3.8431% | 117 | 2.25x | 56.7% | 55.9% | ||||||||||||||||
2.50x | - | 2.99x | 2 | $63,606,407 | 4.6% | 3.9724% | 119 | 2.76x | 53.6% | 52.3% | ||||||||||||||||
| 3.00x | - | 7.40x | 2 | $101,666,000 | 7.4% | 3.6978% | 60 | 7.33x | 28.2% | 28.1% | ||||||||||||||||
| Total/Weighted Average | 83 | $1,369,706,187 | 100.0% | 4.2774% | 111 | 2.09x | 63.8% | 56.3% | ||||||||||||||||||
THE INFORMATION IN THIS STRUCTURAL AND COLLATERAL TERM SHEET IS NOT COMPLETE AND MAY BE AMENDED PRIOR TO THE TIME OF SALE. THIS TERM SHEET IS NOT AN OFFER TO SELL THESE SECURITIES AND IT IS NOT A SOLICITATION OF AN OFFER TO BUY THESE SECURITIES IN ANY JURISDICTION WHERE THE OFFER OR SALE IS NOT PERMITTED.
16
COMM 2015-CCRE23 Mortgage Trust |
| OVERVIEW OF MORTGAGE POOL CHARACTERISTICS |
Original Terms to Maturity or ARD(1)(2) |
Weighted Averages | ||||||||||||||||||||||||||
Original Terms to Maturity or ARD | Number of Mortgage Loans | Aggregate Cut-off Date Balance | % of Initial Outstanding Pool Balance | Mortgage Rate | Stated Remaining Term (Mos.) | U/W NCF DSCR | Cut-off Date LTV Ratio (3)(4) | Maturity Date or ARD LTV(3) | ||||||||||||||||||
60 | - | 60 | 7 | $169,148,690 | 12.3% | 4.1939% | 58 | 5.03x | 44.8% | 42.7% | ||||||||||||||||
117 | - | 120 | 75 | $1,160,641,342 | 84.7% | 4.2518% | 118 | 1.70x | 66.3% | 58.2% | ||||||||||||||||
132 | - | 132 | 1 | $39,916,155 | 2.9% | 5.3750% | 118 | 1.20x | 69.7% | 58.1% | ||||||||||||||||
| Total/Weighted Average | 83 | $1,369,706,187 | 100.0% | 4.2774% | 111 | 2.09x | 63.8% | 56.3% | ||||||||||||||||||
Distribution of Remaining Terms to Maturity or ARD(1)(2) |
Weighted Averages | ||||||||||||||||||||||||||
Range of Remaining Terms to Maturity or ARD | Number of Mortgage Loans | Aggregate Cut-off Date Balance | % of Initial Outstanding Pool Balance | Mortgage Rate | Stated Remaining Term (Mos.) | U/W NCF DSCR | Cut-off Date LTV Ratio (3)(4) | Maturity Date or ARD LTV(3) | ||||||||||||||||||
56 | - | 60 | 7 | $169,148,690 | 12.3% | 4.1939% | 58 | 5.03x | 44.8% | 42.7% | ||||||||||||||||
115 | - | 117 | 14 | $227,238,901 | 16.6% | 4.1694% | 116 | 1.95x | 64.0% | 58.8% | ||||||||||||||||
118 | - | 120 | 62 | $973,318,596 | 71.1% | 4.3171% | 119 | 1.62x | 67.0% | 58.1% | ||||||||||||||||
| Total/Weighted Average | 83 | $1,369,706,187 | 100.0% | 4.2774% | 111 | 2.09x | 63.8% | 56.3% | ||||||||||||||||||
Distribution of Underwritten NOI Debt Yields(1) |
Weighted Averages | ||||||||||||||||||||||||||
Range of Underwritten NOI Debt Yields | Number of Mortgage Loans | Aggregate Cut-off Date Balance | % of Initial Outstanding Pool Balance | Mortgage Rate | Stated Remaining Term (Mos.)(2) | U/W NCF DSCR | Cut-off Date LTV Ratio(3)(4) | Maturity Date or ARD LTV(3) | ||||||||||||||||||
6.0% | - | 7.9% | 6 | $102,710,000 | 7.5% | 4.4521% | 119 | 1.30x | 70.6% | 65.8% | ||||||||||||||||
8.0% | - | 8.9% | 15 | $365,855,761 | 26.7% | 4.3285% | 118 | 1.56x | 65.5% | 57.7% | ||||||||||||||||
9.0% | - | 9.9% | 22 | $379,283,357 | 27.7% | 4.1924% | 117 | 1.68x | 67.9% | 60.4% | ||||||||||||||||
10.0% | - | 12.4% | 28 | $363,275,726 | 26.5% | 4.3972% | 109 | 1.84x | 65.8% | 56.9% | ||||||||||||||||
12.5% | - | 14.9% | 6 | $32,459,481 | 2.4% | 4.5302% | 106 | 1.82x | 69.5% | 57.0% | ||||||||||||||||
15.0% | - | 32.7% | 6 | $126,121,862 | 9.2% | 3.8328% | 71 | 6.34x | 33.6% | 30.3% | ||||||||||||||||
| Total/Weighted Average | 83 | $1,369,706,187 | 100.0% | 4.2774% | 111 | 2.09x | 63.8% | 56.3% | ||||||||||||||||||
Amortization Types(1) |
Weighted Averages | ||||||||||||||||||||||||
| Amortization Type | Number of Mortgage Loans | Aggregate Cut-off Date Balance | % of Initial Outstanding Pool Balance | Mortgage Rate | Stated Remaining Term (Mos.)(2) | U/W NCF DSCR | Cut-off Date LTV Ratio(3)(4) | Maturity Date or ARD LTV(3) | ||||||||||||||||
| Interest Only, then Amortizing | 29 | $496,987,000 | 36.3% | 4.3207% | 118 | 1.45x | 71.2% | 61.6% | ||||||||||||||||
| Amortizing Balloon | 41 | $437,550,687 | 31.9% | 4.5816% | 111 | 1.55x | 67.4% | 54.8% | ||||||||||||||||
| Interest Only | 9 | $432,120,000 | 31.5% | 3.9135% | 103 | 3.39x | 51.6% | 51.6% | ||||||||||||||||
| Interest Only, ARD | 4 | $3,048,500 | 0.2% | 5.1660% | 119 | 1.91x | 65.0% | 65.0% | ||||||||||||||||
| Total/Weighted Average | 83 | $1,369,706,187 | 100.0% | 4.2774% | 111 | 2.09x | 63.8% | 56.3% | ||||||||||||||||
Footnotes:
| (1) | With respect to the Courtyard by Marriott Loan, the numerical and statistical information related to the LTV, DSCR, debt yield and cut-off date balances per Room includes the Courtyard by Marriott Pari Passu Companion Loans, but does not include the Courtyard by Marriott Non-Pooled Trust Subordinate Companion Loan unless otherwise specified. With respect to the 9200 & 9220 Sunset Loan, the 3 Columbus Circle Loan, the La Gran Plaza Loan and the Walgreens Portfolio Loan, LTV, DSCR, debt yield and cut-off balance per Unit/Room/NRA/Bed/Homes/Pads calculations include the related pari passu companion loan(s). |
| (2) | In the case of the 4 mortgage loans with anticipated repayment dates, Original Terms to Maturity or ARD (Mos.) and Remaining Terms to Maturity (Mos.) is through the related anticipated repayment date. |
| (3) | With respect to 7 mortgage loans, representing 12.1% of the initial outstanding principal balance, the Cut-off Date LTV and Maturity Date or ARD LTV have in certain cases been calculated based on the “as complete” or “as stabilized” value. For additional information, see the Footnotes to Annex A-1 in the Free Writing Prospectus. |
| (4) | With respect to 1 mortgage loan, representing 2.3% of the initial outstanding principal balance, the Cut-off Date LTV has been calculated net of any related earnouts. For additional information, see the Footnotes to Annex A-1 in the Free Writing Prospectus. |
| (5) | Reflects allocated loan amount for properties securing multi-property mortgage loans. |
| (6) | Includes anchored and single tenant properties. |
| (7) | Northern California properties have a zip code greater than 93600. Southern California properties have a zip code less than or equal to 93600. |
THE INFORMATION IN THIS STRUCTURAL AND COLLATERAL TERM SHEET IS NOT COMPLETE AND MAY BE AMENDED PRIOR TO THE TIME OF SALE. THIS TERM SHEET IS NOT AN OFFER TO SELL THESE SECURITIES AND IT IS NOT A SOLICITATION OF AN OFFER TO BUY THESE SECURITIES IN ANY JURISDICTION WHERE THE OFFER OR SALE IS NOT PERMITTED.
17
COMM 2015-CCRE23 Mortgage Trust |
| OVERVIEW OF MORTGAGE POOL CHARACTERISTICS |
Previous Securitization History(1) |
| Mortgage Loan | Mortgage Loan Seller | City, State | Property Type | Cut-off Date Balance | % of Initial Outstanding Pool Balance | Previous Securitization | ||||||
| 9200 & 9220 Sunset | GACC / JLC | West Hollywood, CA | Office | $120,000,000 | 8.8% | GSMS 2007-GG10 | ||||||
| Courtyard by Marriott Portfolio | GACC | Various, Various | Hospitality | $100,000,000 | 7.3% | Various(2) | ||||||
| Maui Coast Hotel | GACC / JLC | Kihei, HI | Hospitality | $56,320,000 | 4.1% | MLMT 2006-C2 | ||||||
| Sherman Plaza | CCRE | Van Nuys, CA | Office | $48,700,000 | 3.6% | BACM 2006-3 | ||||||
| DoubleTree San Diego | LCF | San Diego, CA | Hospitality | $36,653,165 | 2.7% | MLCFC 2006-2 | ||||||
| Lake Arrowhead Village | CCRE | Lake Arrowhead, CA | Retail | $32,924,353 | 2.4% | GCCFC 2005-GG3 | ||||||
| 100 Middle Street | CCRE | Portland, ME | Office | $31,000,000 | 2.3% | CSFB 2003-CPN1 | ||||||
| Luxe Villas | CCRE | Los Angeles, CA | Multifamily | $29,250,000 | 2.1% | CSMC 2007-C1 | ||||||
| SROA Portfolio | GACC | Various, Various | Self Storage | $26,250,000 | 1.9% | MSC 2007-IQ16 | ||||||
| ART Florida & Ohio MF Portfolio II | CCRE | Various, Various | Multifamily | $25,000,000 | 1.8% | MLMT 2007-C1 | ||||||
| Holiday Inn Manhattan View | CCRE | Long Island City, NY | Hospitality | $20,863,257 | 1.5% | GSMS 2012-GCJ7 | ||||||
| Champaign Portfolio | GACC | Champaign, IL | Various | $20,000,000 | 1.5% | JPMCC 2004-C3 | ||||||
| Jordan Creek-Westwood Apartments | LCF | West Des Moines, IA | Multifamily | $16,810,000 | 1.2% | MLCFC 2007-5 | ||||||
| Lakeshore - Holiday Plaza MHC | GECC | West Palm Beach, FL | Manufactured Housing Community | $15,325,000 | 1.1% | GECMC 2005-C2 | ||||||
| College Station and The Polos Apartments | CCRE | Starkville, MS | Multifamily | $10,925,000 | 0.8% | JPMCC 2003-LN1 | ||||||
| Washington Square Plaza | LCF | Royal Oak, MI | Mixed Use | $10,900,000 | 0.8% | CSFB 2005-C3 | ||||||
| Plaza Square North | GACC | Brookhaven, GA | Office | $9,150,000 | 0.7% | COMM 2005-LP5 | ||||||
| 8500 Valcour Industrial | CCRE | St. Louis, MO | Industrial | $9,138,382 | 0.7% | MSC 2005-HQ5 | ||||||
| Utica Medical Center | CCRE | Utica, MI | Office | $7,989,565 | 0.6% | BSCMS 2002-PBW1 | ||||||
| Hollywood Self Storage | GECC | Various, GA | Self Storage | $7,958,004 | 0.6% | Various(3) | ||||||
| Broadway Central | LCF | Denver, CO | Retail | $7,850,000 | 0.6% | MLMT 2005-CIP1 | ||||||
| 1815 Griffin Road | LCF | Dania Beach, FL | Office | $7,000,000 | 0.5% | GMACC 2005-C1 | ||||||
| Riverview MHC | GECC | Damascus, OR | Manufactured Housing Community | $6,765,238 | 0.5% | GECMC 2005-C2 | ||||||
| Hampton Inn Titusville | CCRE | Titusville, FL | Hospitality | $6,483,730 | 0.5% | GCCFC 2007-GG9 | ||||||
| Hampton Inn Terre Haute | GACC | Terre Haute, IN | Hospitality | $6,450,000 | 0.5% | LBUBS 2006-C1 | ||||||
| HomeGoods Thousand Oaks | CCRE | Thousand Oaks, CA | Retail | $5,200,000 | 0.4% | LBUBS 2005-C5 | ||||||
| Americana Apartments | CCRE | Las Vegas, NV | Multifamily | $4,530,000 | 0.3% | FNA 2013-M5 | ||||||
| Deere Road Industrial Park | CCRE | Syracuse, NY | Industrial | $3,713,002 | 0.3% | SBM7 2000-C2 | ||||||
| Stardust MHC | GECC | Colton, CA | Manufactured Housing Community | $3,525,000 | 0.3% | GECMC 2005-C2 | ||||||
| Alta Vista MHC | GECC | Henderson, NV | Manufactured Housing Community | $3,431,889 | 0.3% | CSFB 2005-C4 | ||||||
| Monument Meadow | GECC | Monument, CO | Manufactured Housing Community | $2,396,958 | 0.2% | JPMCC 2005-LDP2 | ||||||
| Townhouse MHC | GECC | Phoenix, AZ | Manufactured Housing Community | $1,987,349 | 0.1% | CSFB 2005-C1 | ||||||
| Total | $694,489,892 | 50.7% |
| (1) | Includes mortgaged properties securing mortgage loans for which the most recent prior financing of all or a significant portion of such property was included in a securitization. The table above is based on information provided by the related borrower or obtained through searches of a third-party database. The information has not otherwise been confirmed by the depositor, the mortgage loan sellers or any other underwriter. |
| (2) | The most recent financing of the Courtyard by Marriott Portfolio was previously securitized in the LBUBS 2005-C3, LBUBS 2005-C5, LBUBS 2005-C7 and LBUBS 2006-C1 securitizations. |
| (3) | The most recent financing of the Hollywood Self Storage was previously securitized in the MSC 2005-HQ7 and MLMT 2005-LC1 securitizations. |
| Ten Largest Mortgage Loans |
Mortgage Loan | Mortgage Loan Seller | City, State | Property Type | Cut-off Date Balance | % of Initial Outstanding Pool Balance | Cut-off Date Balance per Room/NRA(1) | Cut-off Date LTV Ratio(1)(2) | U/W NCF DSCR(1) | U/W NOI Debt Yield(1) | |||||||||
| 9200 & 9220 Sunset | GACC / JLC | West Hollywood, CA | Office | $120,000,000 | 8.8% | $662 | 60.9% | 2.21x | 9.1% | |||||||||
| Courtyard by Marriott Portfolio | GACC | Various, Various | Hospitality | $100,000,000 | 7.3% | $32,847 | 28.2% | 7.40x | 32.7% | |||||||||
DFW / Raleigh Portfolio(2) | GACC | Various, Various | Multifamily | $95,800,000 | 7.0% | $51,616 | 74.4% | 1.31x | 8.4% | |||||||||
| 3 Columbus Circle | GACC | New York, NY | Office | $90,000,000 | 6.6% | $666 | 50.0% | 2.30x | 8.8% | |||||||||
| Maui Coast Hotel | GACC / JLC | Kihei, HI | Hospitality | $56,320,000 | 4.1% | $212,528 | 55.0% | 2.77x | 12.1% | |||||||||
| Sherman Plaza | CCRE | Van Nuys, CA | Office | $48,700,000 | 3.6% | $182 | 69.9% | 1.40x | 9.0% | |||||||||
| Hacienda Club | JLC | Jacksonville, FL | Multifamily | $39,916,155 | 2.9% | $133,054 | 69.7% | 1.20x | 8.2% | |||||||||
DoubleTree San Diego(2) | LCF | San Diego, CA | Hospitality | $36,653,165 | 2.7% | $167,366 | 68.8% | 1.53x | 10.8% | |||||||||
| Lake Arrowhead Village | CCRE | Lake Arrowhead, CA | Retail | $32,924,353 | 2.4% | $143 | 66.5% | 1.26x | 8.8% | |||||||||
| 100 Middle Street | CCRE | Portland, ME | Office | $31,000,000 | 2.3% | $162 | 74.1% | 1.33x | 9.0% | |||||||||
| Total/Weighted Average | $651,313,672 | 47.6% | 58.4% | 2.68x | 12.9% |
| (1) | With respect to the Courtyard by Marriott Loan, the numerical and statistical information related to the LTV, DSCR, debt yield and cut-off date balances per Room includes the Courtyard by Marriott Pari Passu Companion Loans,, but does not include the Courtyard by Marriott Non-Pooled Trust Subordinate Companion Loan unless otherwise specified. With respect to the 9200 & 9220 Sunset Loan, the 3 Columbus Circle Loan, LTV, DSCR, debt yield and cut-off balance per Room /NRA calculations include the related pari passu companion loan(s). |
| (2) | With respect to the DFW / Raleigh Portfolio loan, the Cut-off Date LTV Ratio has been calculated using the “as complete” value. The “as complete” appraised value takes into account the planned renovations being performed at each property. At closing, the full cost of the renovations, approximately $9.5 million, was reserved for in a capital expenditure holdback. The “as is” appraised value Cut-off Date LTV Ratio is 81.5%. With respect to the DoubleTree San Diego loan, the Cut-off Date LTV Ratio has been calculated using the “as complete” value. The “as complete” appraised value takes into account the planned upgrades being performed at each property. At closing, the full cost of the PIP, approximately $2.4 million, was reserved for in a PIP reserve. The “as is” appraised value Cut-off Date LTV Ratio is 72.7%. |
THE INFORMATION IN THIS STRUCTURAL AND COLLATERAL TERM SHEET IS NOT COMPLETE AND MAY BE AMENDED PRIOR TO THE TIME OF SALE. THIS TERM SHEET IS NOT AN OFFER TO SELL THESE SECURITIES AND IT IS NOT A SOLICITATION OF AN OFFER TO BUY THESE SECURITIES IN ANY JURISDICTION WHERE THE OFFER OR SALE IS NOT PERMITTED.
18
COMM 2015-CCRE23 Mortgage Trust |
| OVERVIEW OF MORTGAGE POOL CHARACTERISTICS |
| Pari Passu Companion Loan Summary |
| Mortgage Loan | Mortgage Loan Cut-off Date Balance | Companion Loans Cut-off Date Balance | Loan Combination Cut-off Date Balance | Pooling & Servicing Agreement | Master Servicer | Special Servicer | Voting Rights | |||||||
| 9200 & 9220 Sunset | $120,000,000 | $90,000,000 | $210,000,000 | COMM 2015-CCRE23 | Midland | CWCapital Asset Management LLC | COMM 2015-CCRE23 | |||||||
| Courtyard by Marriott Portfolio | $100,000,000 | $215,000,000 | $670,000,000(1) | COMM 2015-CCRE23 | Midland | CWCapital Asset Management LLC | COMM 2015-CCRE23 | |||||||
| 3 Columbus Circle | $90,000,000 | $260,000,000 | $350,000,000 | COMM 2015-CCRE23 | Midland | CWCapital Asset Management LLC | COMM 2015-CCRE23 | |||||||
| La Gran Plaza | $26,000,000 | $50,000,000 | $76,000,000 | See (2) below | See (2) below | See (2) below | See (2) below | |||||||
| Walgreens Portfolio | $16,000,000 | $103,065,000 | $119,065,000 | WFCM 2015-LC20 | Wells Fargo | Rialto Capital Advisors, LLC | WFCM 2015-LC20 |
| (1) | The loan combination Cut-off Date balance is comprised of the pari passu companion loans and a B-Note in the amount of $355,000,000. |
| (2) | Prior to the securitization of the La Gran Plaza pari passu companion loan designated as Note A-1 and Note A-2, the La Gran Plaza Loan Combination will be serviced under the pooling and servicing agreement of this securitization and the related intercreditor agreement, and the directing holder will be the holder of the pari passu companion loan, which initially is expected to be held by LCF or an affiliate thereof. After the securitization of the La Gran Plaza pari passu companion loan designated as Note A-1, it is expected that the La Gran Plaza Loan Combination will be serviced under the pooling and servicing agreement entered into in connection with that securitization and the related intercreditor agreement, and it is expected that the directing holder of the La Gran Plaza Loan Combination will be the directing holder or its equivalent under that securitization. See “Description of the Mortgage Pool—Loan Combinations—The La Gran Plaza Loan Combination” in the Free Writing Prospectus. |
| Existing Mezzanine Debt Summary |
| Mortgage Loan | Mortgage Loan Cut-off Date Balance | Mezzanine Debt Cut-off Date Balance | Trust U/W NCF DSCR | Total Debt U/W NCF DSCR | Trust Cut-off Date LTV Ratio | Total Debt Cut-off Date LTV Ratio | Trust U/W NOI Debt Yield | Total Debt U/W NOI Debt Yield |
| DoubleTree San Diego | $36,653,165 | $5,750,000 | 1.53x | 1.18x | 68.8% | 79.6% | 10.8% | 9.3% |
Pooled Loan Summary(1) |
Mortgage Loan | Pooled Loan Cut-off Date Balance | Non-Pooled Component Cut- off Date Balance | Total Loan Combination Cut-off Date Balance(2) | Pooled Loan U/W NCF DSCR | Total Mortgage Loan U/W NCF DSCR | Pooled Loan Cut-off Date LTV | Total Mortgage Loan Cut-off Date LTV Ratio | Pooled Loan U/W NOI Debt Yield | Total Mortgage Loan U/W NOI Debt Yield |
| Courtyard by Marriott Portfolio | $100,000,000 | $388,500,000(3) | $670,000,000(4) | 7.40x | 3.48x | 28.2% | 60.0% | 32.7% | 15.4% |
| (1) | With respect to the Courtyard by Marriott Loan, the numerical and statistical information related to the LTV, DSCR and debt yield includes Courtyard by Marriott Pari Passu Companion Loans, but does not include the Courtyard by Marriott Non-Pooled Trust Subordinate Companion Loan unless otherwise specified. |
| (2) | As of the Cut-off date, the remaining pari passu companion loans are held by GACC and CGMRC or an affiliate thereof. See “Description of the Mortgage Pool—Loan Combinations—The Courtyard by Marriott Loan Combination” in the Free Writing Prospectus. |
| (3) | The non-pooled component Cut-off Date balance is comprised of the Note A-1 pari passu companion loan and the B-Note, in the amounts of $33,500,000 and $355,000,000, respectively. |
| (4) | In addition to the pooled loan and non-pooled components, the total loan combination amount includes a pari passu companion loan Note A2-B and Note A2-C in the amounts of $97,050,000 and $84,450,000, respectively. |
THE INFORMATION IN THIS STRUCTURAL AND COLLATERAL TERM SHEET IS NOT COMPLETE AND MAY BE AMENDED PRIOR TO THE TIME OF SALE. THIS TERM SHEET IS NOT AN OFFER TO SELL THESE SECURITIES AND IT IS NOT A SOLICITATION OF AN OFFER TO BUY THESE SECURITIES IN ANY JURISDICTION WHERE THE OFFER OR SALE IS NOT PERMITTED.
19
9200 & 9220 West Sunset Boulevard West Hollywood, CA 90069 | Collateral Asset Summary – Loan No. 1 9200 & 9220 Sunset | Cut-off Date Balance: Cut-off Date LTV: U/W NCF DSCR: U/W NOI Debt Yield: | $120,000,000 60.9% 2.21x 9.1% |
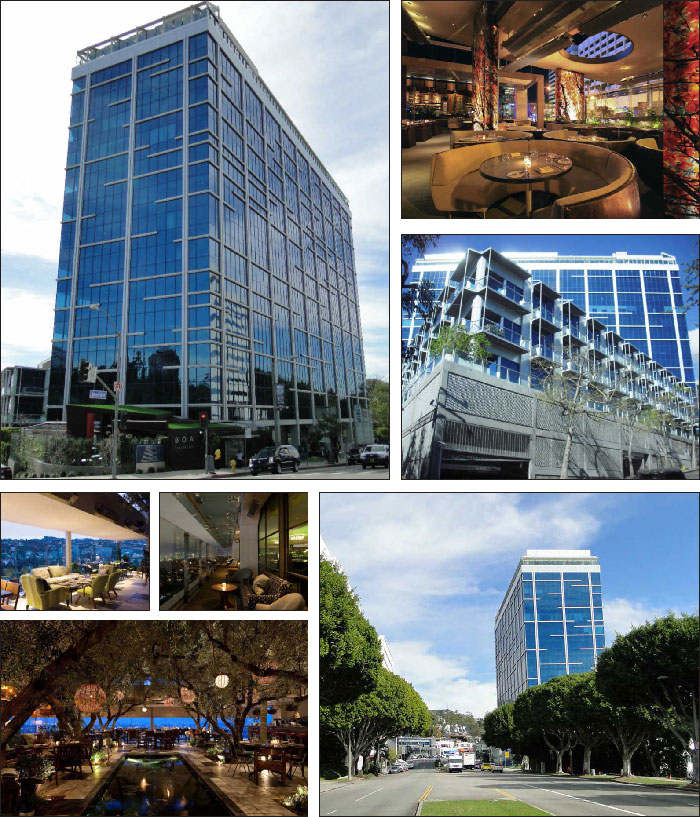
THE INFORMATION IN THIS STRUCTURAL AND COLLATERAL TERM SHEET IS NOT COMPLETE AND MAY BE AMENDED PRIOR TO THE TIME OF SALE. THIS TERM SHEET IS NOT AN OFFER TO SELL THESE SECURITIES AND IT IS NOT A SOLICITATION OF AN OFFER TO BUY THESE SECURITIES IN ANY JURISDICTION WHERE THE OFFER OR SALE IS NOT PERMITTED.
20
9200 & 9220 West Sunset Boulevard West Hollywood, CA 90069 | Collateral Asset Summary – Loan No. 1 9200 & 9220 Sunset | Cut-off Date Balance: Cut-off Date LTV: U/W NCF DSCR: U/W NOI Debt Yield: | $120,000,000 60.9% 2.21x 9.1% |
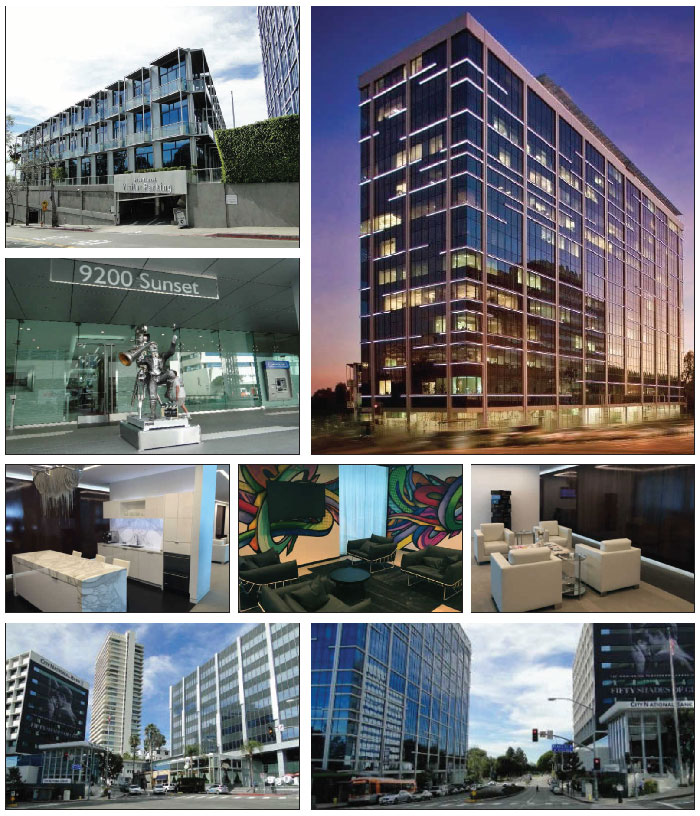
THE INFORMATION IN THIS STRUCTURAL AND COLLATERAL TERM SHEET IS NOT COMPLETE AND MAY BE AMENDED PRIOR TO THE TIME OF SALE. THIS TERM SHEET IS NOT AN OFFER TO SELL THESE SECURITIES AND IT IS NOT A SOLICITATION OF AN OFFER TO BUY THESE SECURITIES IN ANY JURISDICTION WHERE THE OFFER OR SALE IS NOT PERMITTED.
21
9200 & 9220 West Sunset Boulevard West Hollywood, CA 90069 | Collateral Asset Summary – Loan No. 1 9200 & 9220 Sunset | Cut-off Date Balance: Cut-off Date LTV: U/W NCF DSCR: U/W NOI Debt Yield: | $120,000,000 60.9% 2.21x 9.1% |
| Mortgage Loan Information | |
Loan Seller(1): | GACC / JLC |
| Loan Purpose: | Refinance |
| Sponsor: | Simon Mani; Daniel Mani |
| Borrower: | Mani Brothers 9200 Sunset (DE), LLC |
Original Balance(2): | $120,000,000 |
Cut-off Date Balance(2): | $120,000,000 |
| % by Initial UPB: | 8.8% |
| Interest Rate: | 3.9850% |
| Payment Date: | 6th of each month |
| First Payment Date: | May 6, 2015 |
| Maturity Date: | January 6, 2025 |
| Amortization: | Interest Only |
Additional Debt(2): | $90,000,000 Pari Passu Debt; |
Call Protection(3): | L(25), D(88), O(4) |
| Lockbox / Cash Management: | Soft, Springing Hard / Springing |
Reserves(4) | ||
| Initial | Monthly | |
| Taxes: | $450,000 | $154,740 |
| Insurance: | $51,000 | $9,000 |
| Replacement: | $0 | $6,608 |
| TI/LC: | $0 | $26,431 |
| Free Rent: | $501,964 | NAP |
Financial Information(5) | |
| Cut-off Date Balance / Sq. Ft.: | $662 |
| Balloon Balance / Sq. Ft.: | $662 |
| Cut-off Date LTV: | 60.9% |
| Balloon LTV: | 60.9% |
| Underwritten NOI DSCR: | 2.26x |
| Underwritten NCF DSCR: | 2.21x |
| Underwritten NOI Debt Yield: | 9.1% |
| Underwritten NCF Debt Yield: | 8.9% |
| Underwritten NOI Debt Yield at Balloon: | 9.1% |
| Underwritten NCF Debt Yield at Balloon: | 8.9% |
| Property Information | ||
| Single Asset / Portfolio: | Single Asset | |
| Property Type: | CBD Office | |
| Collateral: | Fee Simple | |
| Location: | West Hollywood, CA | |
| Year Built / Renovated: | 1964, 1971 / 2001-2002, 2009 | |
| Total Sq. Ft.: | 317,171 | |
| Property Management: | Mani Brothers, LLC | |
Underwritten NOI(6): | $19,172,673 | |
| Underwritten NCF: | $18,776,209 | |
| Appraised Value: | $345,000,000 | |
| Appraisal Date: | January 27, 2015 | |
| Historical NOI | ||
| 2014 NOI: | $16,278,907 (December 31, 2014) | |
| 2013 NOI: | $15,139,176 (December 31, 2013) | |
| 2012 NOI: | $14,157,915 (December 31, 2012) | |
| 2011 NOI: | $13,191,955 (December 31, 2011) | |
| Historical Occupancy | ||
| Most Recent Occupancy: | 92.0% (April 1, 2015) | |
| 2014 Occupancy | 91.0% (December 31, 2014) | |
| 2013 Occupancy: | 86.0% (December 31, 2013) | |
| 2012 Occupancy: | 86.0% (December 31, 2012) | |
| 2011 Occupancy: | 84.0% (December 31, 2011) | |
| (1) | The 9200 & 9220 Sunset Loan was originated by JLC and an $80,000,000 note (Note A-2) was subsequently purchased by GACC. |
| (2) | The 9200 & 9220 Sunset Loan Combination (the “9200 & 9220 Sunset Loan Combination”) is evidenced by three pari passu notes in the aggregate principal amount of $210.0 million. The controlling Note A-2 and pari passu Note A-3, with an aggregate principal balance of $120.0 million, will be included in the trust. The pari passu companion loan is comprised of the non-controlling Note A-1, with an aggregate original principal amount of $90.0 million, which is expected to be included in a future securitization. |
| (3) | The lockout period will be at least 25 payments beginning with and including the first payment date of May 6, 2015. Defeasance of the full $210 million 9200 & 9220 Sunset Loan Combination is permitted after the date that is the earlier to occur of (i) two years after the closing date of the securitization that includes the last pari passu companion loan and (ii) October 6, 2018. |
| (4) | See “Initial Reserves” and “Ongoing Reserves” herein. |
| (5) | DSCR, LTV, Debt Yield and Balance / Sq. Ft. calculations are based on the aggregate 9200 & 9220 Sunset Loan Combination. |
| (6) | The increase in underwritten NOI from 2014 NOI is primarily the result of the following: (i) the annualized amount of contractual annual rent steps for existing tenants that occurred in 2014 as the 2014 gross potential rent is a cash basis TTM figure, (ii) the 2014 NOI excludes rent abatements that occurred in 2014 totaling approximately $413,265 (and the borrower reserved approximately $501,964 at loan closing for abatements that occur in 2015), (iii) contractual rent steps for tenants occurring in January 2015 through May 2015 which are now in-place, (iv) underwritten contractual rent steps through May 2016, and (v) net new leasing (lost rental revenue from vacating tenants plus rental revenue from seven new or renewed leases). Combined, the resulting increase is equal to $2,898,702. Deducting this figure from UW gross potential rent of $19,020,713 equates to the 2014 gross potential rent amount of $16,122,011. |
THE INFORMATION IN THIS STRUCTURAL AND COLLATERAL TERM SHEET IS NOT COMPLETE AND MAY BE AMENDED PRIOR TO THE TIME OF SALE. THIS TERM SHEET IS NOT AN OFFER TO SELL THESE SECURITIES AND IT IS NOT A SOLICITATION OF AN OFFER TO BUY THESE SECURITIES IN ANY JURISDICTION WHERE THE OFFER OR SALE IS NOT PERMITTED.
22
9200 & 9220 West Sunset Boulevard West Hollywood, CA 90069 | Collateral Asset Summary – Loan No. 1 9200 & 9220 Sunset | Cut-off Date Balance: Cut-off Date LTV: U/W NCF DSCR: U/W NOI Debt Yield: | $120,000,000 60.9% 2.21x 9.1% |
The Loan. The 9200 & 9220 Sunset loan (the “9200 & 9220 Sunset Loan”) consists of the controlling Note A-2 and pasi passu Note A-3 in the aggregate original principal amount of $120.0 million of a fixed rate whole loan in the aggregate principal amount of $210.0 million (the “9200 & 9220 Sunset Loan Combination”)..The 9200 & 9220 Sunset Loan Combination is secured by the borrower’s fee simple interest in a two-building, 14-story, 317,171 sq. ft. Class A office building, which includes 36,252 sq. ft. of retail located at 9200 & 9220 West Sunset Boulevard in West Hollywood, California (the “9200 & 9220 Sunset Property”) and is comprised of three pari passu notes. Only the $80.0 million Note A-2 and the $40.0 million Note A-3 will be included in the COMM 2015-CCRE23 trust. The non-controlling Note A-1, with an original principal balance of $90.0 million is currently held by JLC and is expected to be included in a future securitization. The 9200 & 9220 Sunset Loan has an approximately a 10-year term and requires interest only payments for the term of the loan. The 9200 & 9220 Sunset Loan accrues interest at a fixed rate equal to 3.9850% and has a cut-off date balance of $120.0 million. Proceeds of the 9200 & 9220 Sunset Loan Combination were used to retire existing debt of approximately $135.0 million, cover closing costs, pay reserves, pay defeasance costs of approximately $14.6 million and return approximately $57.4 million of equity to the borrower. Based on the appraised value of $345.0 million as of January 27, 2015, the cut-off date LTV is 60.9%. The most recent prior financing of the 9200 & 9220 Sunset Property was included in the GSMS 2007-GG10 securitization.
The relationship between the holders of Note A-1, Note A-2 and Note A-3 will be governed by a co-lender agreement as described under “Description of the Mortgage Pool – Loan Combinations – The 9200 & 9220 Sunset Loan Combination” in the accompanying Free Writing Prospectus.
| Pari Passu Note Summary | |||||
| Original Balance | Cut-off Date Balance | Note Holder | Controlling Piece | ||
| Note A-2, A-3 | $120,000,000 | $120,000,000 | COMM 2015-CCRE23 | Yes | |
| Note A-1 | $90,000,000 | $90,000,000 | JLC | No | |
| Total | $210,000,000 | $210,000,000 | |||
| Sources and Uses | ||||||
| Sources | Proceeds | % of Total | Uses | Proceeds | % of Total | |
| Mortgage Loan | $210,000,000 | 100.0% | Loan Payoff | $135,000,000 | 64.3% | |
| Reserves | $1,002,964 | 0.5% | ||||
| Closing Costs | $2,002,143 | 1.0% | ||||
| Defeasance Costs | $14,606,579 | 7.0% | ||||
| Return of Equity | $57,388,315 | 27.3% | ||||
| Total Sources | $210,000,000 | 100.0% | Total Uses | $210,000,000 | 100.0% | |
The Borrower / Sponsor. The borrower, Mani Brothers 9200 Sunset (DE), LLC, is a single purpose Delaware limited liability company structured to be bankruptcy-remote with two independent directors in its organizational structure. The sponsors of the borrower and the non-recourse carveout guarantors are Simon Mani and Daniel Mani on a joint and several basis.
Simon and Daniel Mani own Mani Brothers Real Estate Group, a full service real estate investment company focused in the greater Los Angeles area. The sponsors’ portfolio of class A Southern California office buildings totals 1.3 million sq. ft. (inclusive of the 9200 & 9220 Sunset Property).
The Property. The 9200 & 9220 Sunset Property consists of two office buildings: (i) 9200 West Sunset Boulevard: a 14-story, 265,228 sq. ft. office building built in 1971 and renovated from 2001 to 2002 and (ii) 9220 West Sunset Boulevard: a 3-story, 51,943 sq. ft. office building built in 1964 and renovated in 2009. The 9200 & 9220 Sunset Property consists of primarily office space with 36,252 sq. ft. of retail space and offers spaces ranging up to full floors totaling over 20,000 sq. ft. with each space having floor to ceiling windows. The column free floor design allows for various tenant layouts and the lobby connects the two buildings and provides 24-hour security. The 9200 & 9220 Sunset Property offers unobstructed panoramic views of Beverly Hills and West Hollywood from the penthouse. The retail component consists of ground floor space leased and occupied by the BOA Steakhouse, Comerica Bank and Citrus on Sunset and the penthouse retail space is leased and occupied by SoHo House. Floors two through 13 are occupied by office tenants. According to the borrower, in the last eight years approximately $14.8 million was spent on capital improvements, including the conversion of the penthouse from the prior owner’s personal residence to 21,625 sq. ft. of income-producing, leasable retail space (2007), the enclosure of the outdoor ground floor patio area into 13,349 sq. ft. of income-producing, leasable, street-level retail space (2007), the enclosure of the parking garage (2007), restroom and elevator improvements (2007), an exterior re-cladding of the 9200 & 9220 Sunset Property (2008) and the construction of an atrium lobby (2008).
THE INFORMATION IN THIS STRUCTURAL AND COLLATERAL TERM SHEET IS NOT COMPLETE AND MAY BE AMENDED PRIOR TO THE TIME OF SALE. THIS TERM SHEET IS NOT AN OFFER TO SELL THESE SECURITIES AND IT IS NOT A SOLICITATION OF AN OFFER TO BUY THESE SECURITIES IN ANY JURISDICTION WHERE THE OFFER OR SALE IS NOT PERMITTED.
23
9200 & 9220 West Sunset Boulevard West Hollywood, CA 90069 | Collateral Asset Summary – Loan No. 1 9200 & 9220 Sunset | Cut-off Date Balance: Cut-off Date LTV: U/W NCF DSCR: U/W NOI Debt Yield: | $120,000,000 60.9% 2.21x 9.1% |
As of April 1, 2015, the 9200 & 9220 Sunset Property was 92.0% leased by 65 tenants representing the entertainment, music, legal, financial services, media, artist and technology sectors. The three largest tenants at the 9200 & 9220 Sunset Property occupy a total of 21.1% of the total net rentable area (“NRA”) and account for 24.7% of underwritten base revenue. The largest tenant, Mosaic Media Group, occupies 23,825 sq. ft., or 7.5% of total NRA, and accounts for 7.6% of underwritten base rent. The second largest tenant, SoHo House, occupies 21,625 sq. ft. or 6.8% of total NRA, and accounts for 10.1% of underwritten base rent. The third largest tenant, S&F Management Company, occupies 21,565 sq. ft., or 6.8% of total NRA, and accounts for 7.0% of underwritten base rent. No other tenant at the 9200 & 9220 Sunset Property occupies greater than 3.6% of total NRA or accounts for greater than 3.6% of underwritten base rent.
Environmental Matters. The Phase I environmental report dated February 9, 2015 recommended no further action.
| Tenant Summary | ||||||||||||
| Tenant | Ratings (Fitch/Moody’s/S&P) | Net Rentable Area (Sq. Ft.) | % of Net Rentable Area | U/W Base Rent PSF | % of Total U/W Base Rent | Lease Expiration | ||||||
| Office Tenants | ||||||||||||
| Mosaic Media Group | NR/NR/NR | 23,825 | 7.5% | $61.00 | 7.6% | 8/31/2018 | ||||||
S&F Management Company(1) | NR/NR/NR | 21,565 | 6.8% | $61.91 | 7.0% | 3/31/2021 | ||||||
Abrams Artists & Associates(1)(2) | NR/NR/NR | 11,451 | 3.6% | $60.01 | 3.6% | 1/31/2016 | ||||||
Platinum Financial(1) | NR/NR/NR | 10,939 | 3.4% | $53.43 | 3.1% | 11/30/2017 | ||||||
Lichter Grossman Nichols Adler(1) | NR/NR/NR | 10,378 | 3.3% | $63.65 | 3.5% | 6/30/2021 | ||||||
Bad Boy Films(1) | NR/NR/NR | 9,575 | 3.0% | $57.85 | 2.9% | 4/30/2019 | ||||||
Spotify USA Inc.(1) | NR/NR/NR | 8,744 | 2.8% | $64.89 | 3.0% | 3/31/2025 | ||||||
Rodeo Realty(1) | NR/NR/NR | 8,706 | 2.7% | $54.75 | 2.5% | 12/31/2018 | ||||||
| Total Major Office Tenants | 105,183 | 33.2% | $60.07 | 33.2% | ||||||||
| Remaining Office Tenants | 150,304 | 47.4% | $65.18 | 51.5% | ||||||||
| Total Occupied Office Tenants | 255,487 | 80.6% | $63.08 | 84.7% | ||||||||
| Vacant Office | 25,432 | 8.0% | ||||||||||
| Total Office | 280,919 | 88.6% | ||||||||||
| Retail Tenants | ||||||||||||
SoHo House(3)(4) | 21,625 | 6.8% | $88.42 | 10.1% | Various | |||||||
BOA Steakhouse(1)(4) | 8,979 | 2.8% | $66.29 | 3.1% | 3/31/2019 | |||||||
| Remaining Retail Tenants | 5,648 | 1.8% | $70.57 | 2.1% | Various | |||||||
| Total Retail | 36,252 | 11.4% | $80.16 | 15.3% | ||||||||
| Total | 317,171 | 100.0% | ||||||||||
| (1) | S&F Management Company has one, five-year extension option remaining. Abrams Artists & Associates has one, five-year extension option remaining. Platinum Financial has two, five-year extension options remaining. Lichter Grossman Nichols Adler has one, three or five-year extension option remaining and can terminate its lease, effective December 31, 2016, with written notice no later than June 30, 2016. Bad Boy Films has one, five-year extension option remaining. Spofity USA Inc. has one, five-year extension option remaining. Rodeo Realty has one, five-year extension option remaining. BOA Steakhouse has two, five-year extension options remaining. |
| (2) | Abrams Artists & Associates has one month of free rent in July 2015. Reserves in the amount of $501,964 were established on the closing date of the mortgage loan for all outstanding free rent due to signed tenants, which amount includes the base rent due during Abrams Artists and Associates’ free rent period. |
| (3) | SoHo House occupies five spaces with staggered lease expirations. 2,860 sq. ft. (13.2% of SoHo House sq. ft.) expires in June 2017, 16,036 sq. ft. (74.2% of SoHo House sq. ft.) expires in February 2025 and 2,729 sq. ft. (12.6% of SoHo House sq. ft.) expires in July 2025. |
| (4) | SoHo House and BOA Steakhouse each contribute percentage rent in addition to base rent. |
THE INFORMATION IN THIS STRUCTURAL AND COLLATERAL TERM SHEET IS NOT COMPLETE AND MAY BE AMENDED PRIOR TO THE TIME OF SALE. THIS TERM SHEET IS NOT AN OFFER TO SELL THESE SECURITIES AND IT IS NOT A SOLICITATION OF AN OFFER TO BUY THESE SECURITIES IN ANY JURISDICTION WHERE THE OFFER OR SALE IS NOT PERMITTED.
24
9200 & 9220 West Sunset Boulevard West Hollywood, CA 90069 | Collateral Asset Summary – Loan No. 1 9200 & 9220 Sunset | Cut-off Date Balance: Cut-off Date LTV: U/W NCF DSCR: U/W NOI Debt Yield: | $120,000,000 60.9% 2.21x 9.1% |
Lease Rollover Schedule(1) | ||||||||||||||||
| Year | # of Leases Expiring | Total Expiring Sq. Ft. | % of Total Sq. Ft. Expiring | Cumulative Sq. Ft. Expiring | Cumulative % of Sq. Ft. Expiring | Annual U/W Base Rent PSF | % U/W Base Rent Rolling | Cumulative % of U/W Base Rent | ||||||||
| 2015 | 9 | 22,351 | 7.0% | 22,351 | 7.0% | $61.20 | 7.2% | 7.2% | ||||||||
| 2016 | 6 | 22,902 | 7.2% | 45,253 | 14.3% | $62.52 | 7.5% | 14.7% | ||||||||
| 2017 | 8 | 35,901 | 11.3% | 81,154 | 25.6% | $59.44 | 11.2% | 25.9% | ||||||||
| 2018 | 14 | 62,282 | 19.6% | 143,436 | 45.2% | $62.81 | 20.6% | 46.5% | ||||||||
| 2019 | 11 | 43,125 | 13.6% | 186,561 | 58.8% | $63.68 | 14.4% | 60.9% | ||||||||
| 2020 | 11 | 26,661 | 8.4% | 213,222 | 67.2% | $71.69 | 10.0% | 70.9% | ||||||||
| 2021 | 3 | 31,943 | 10.1% | 245,165 | 77.3% | $62.48 | 10.5% | 81.5% | ||||||||
| 2022 | 0 | 0 | 0.0% | 245,165 | 77.3% | $0.00 | 0.0% | 81.5% | ||||||||
| 2023 | 2 | 7,092 | 2.2% | 252,257 | 79.5% | $64.58 | 2.4% | 83.9% | ||||||||
| 2024 | 0 | 0 | 0.0% | 252,257 | 79.5% | $0.00 | 0.0% | 83.9% | ||||||||
| 2025 | 7 | 36,518 | 11.5% | 288,775 | 91.0% | $80.65 | 15.5% | 99.4% | ||||||||
| Thereafter | 1 | 2,964 | 0.9% | 291,739 | 92.0% | $40.20 | 0.6% | 100.0% | ||||||||
| Vacant | NAP | 25,432 | 8.0% | 317,171 | 100.0% | NAP | NAP | |||||||||
| Total / Wtd. Avg. | 72 | 317,171 | 100.0% | $65.20 | 100.0% | |||||||||||
| (1) | Certain tenants have lease termination options that may become exercisable prior to the originally stated expiration date of the tenant lease that are not considered in the lease rollover schedule. |
Recent Leasing Activity(1) | |||||||
| Tenant | New / Renewal / Relocation / Expansion | Net Rentable Area | Lease/Renewal Start Date | Term (years) | Base Rent PSF | Annual Rent | |
| Suite 225: Mosaic Media Group | New / Expansion | 2,613 | 12/9/2014 | 3.7 | $60.00 | $156,780 | |
| Suite 300: Bad Boys Films | New | 9,575 | 5/1/2014 | 5 | $55.89 | $535,147 | |
| Suites 425 & 430: Spotify USA Inc. | New | 8,744 | 9/1/2014 | 10.6 | $63.00 | $550,872 | |
| Suite 112: Telemus Capital, LLC | New | 4,957 | 9/30/2014 | 5.2 | $64.20 | $318,239 | |
| Suite 520: Treehouse Pictures, LLC | New / Relocation | 4,638 | 6/30/2014 | 5 | $63.00 | $292,194 | |
| Suite PH2: Jrudes Holdings LLC | New | 3,655 | 10/31/2014 | 10.2 | $73.20 | $267,546 | |
| Suite 300:Resurgent Film Group | New | 2,483 | 2/1/2015 | 5 | $65.40 | $162,388 | |
| Suite 1212: Robin McGraw | New | 2,172 | 3/1/2014 | 2.2 | $68.04 | $147,783 | |
| Suite 407: Gerard Butler Alan Siegel Entertainment | New | 1,984 | 8/31/2014 | 6 | $63.00 | $124,992 | |
| Suite 1200: Lichter Grossman Nichols Adler | Renewal | 10,378 | 6/30/2014 | 7 | $61.80 | $641,360 | |
| Suite 404: Unique Features | Renewal | 2,487 | 12/1/2014 | 3 | $64.12 | $159,460 | |
| Suite 310: Pat Boone Enterprise, Inc. | Renewal | 2,386 | 3/1/2014 | 3 | $56.68 | $134,995 | |
| Suite 525: Dennis A. Roach | Renewal | 1,694 | 5/1/2014 | 5 | $64.89 | $109,924 | |
| Suite 309: Mitchell Management | Renewal | 1,502 | 5/23/2014 | 1.1 | $59.92 | $90,000 | |
| Total | 59,268 | $3,691,680 | |||||
| (1) | Based on a rent roll dated April 1, 2015. |
THE INFORMATION IN THIS STRUCTURAL AND COLLATERAL TERM SHEET IS NOT COMPLETE AND MAY BE AMENDED PRIOR TO THE TIME OF SALE. THIS TERM SHEET IS NOT AN OFFER TO SELL THESE SECURITIES AND IT IS NOT A SOLICITATION OF AN OFFER TO BUY THESE SECURITIES IN ANY JURISDICTION WHERE THE OFFER OR SALE IS NOT PERMITTED.
25
9200 & 9220 West Sunset Boulevard West Hollywood, CA 90069 | Collateral Asset Summary – Loan No. 1 9200 & 9220 Sunset | Cut-off Date Balance: Cut-off Date LTV: U/W NCF DSCR: U/W NOI Debt Yield: | $120,000,000 60.9% 2.21x 9.1% |
Major Tenants.
Mosaic Media Group (23,825 sq. ft.; 7.5% of NRA; 7.6% of U/W Base Rent) Mosaic Media Group is a talent management firm and production company that provides a meeting place for graphic designers, programmers and other marketing professionals. Clients include Ellen DeGeneres, Jim Carrey and Will Ferrell. The company was founded in 2008, when it took occupancy at the 9200 & 9220 Sunset Property, expanded in 2009 and expanded for a second time in December 2014. Mosaic Media Group is subject to a lease that is due to expire in August 2018.
SoHo House (21,625 sq. ft.; 6.8% of NRA; 10.1% of U/W Base Rent) SoHo House occupies five separate spaces at the 9200 & 9220 Sunset Property with staggered lease expirations: 2,860 sq. ft. (13.2% of SoHo House sq. ft.) expires in June 2017, 16,036 sq. ft. (74.2% of SoHo House sq. ft.) expires in February 2025 and 2,729 sq. ft. (12.6% of SoHo House sq. ft.) expires in July 2025. According to the borrower, upon its completion of the penthouse conversion in 2007, the SoHo House tenant subsequently invested approximately $15.0 million of its own capital to complete the installation of its second U.S. location, representing its west coast flagship location. The SoHo House has a private member’s elevator to the penthouse space and open-air patio space with unobstructed panoramic views of Los Angeles and Hollywood Hills. The SoHo House was founded in 1995, currently operates 13 locations worldwide (four in the U.S.) and reported 3,653 members worldwide as of the year end 2013 period. A summary of historical sales and percentage rent for the SoHo House is presented below.
BOA Steakhouse (8,979 sq. ft.; 2.8% of NRA; 3.1% of U/W Base Rent) BOA Steakhouse is a modern-day steakhouse owned by the Innovative Dining Group (“IDG”). IDG also owns Sushi Roku, RivaBella, Katana and other area restaurants. The restaurant features various steaks and chops of prime Omaha beef, poultry, seafood, an extensive cocktail menu and an award-winning wine list. A summary of historical sales and percentage rent for BOA Steakhouse is presented below. At lease expiration, BOA Steakhouse will have two, five-year extension options remaining.
Historical Sales and Occupancy Costs
Historical Sales and Occupancy Costs(1) | ||||||||||||
| 2011 | 2012 | 2013 | 2014 | |||||||||
Annual Sales | PSF | Occ. Costs %(2) | Annual Sales | PSF | Occ. Costs %(2) | Annual Sales | PSF | Occ. Costs %(2) | Annual Sales | PSF | Occ. Costs %(2) | |
| SoHo House | $19,994,788 | $925 | 9.6% | $20,727,485 | $958 | 9.5% | $23,076,549 | $1,067 | 9.0% | $24,485,318 | $1,132 | 8.6% |
| BOA Steakhouse | $13,303,855 | $1,482 | 4.8% | $14,277,020 | $1,590 | 4.7% | $14,074,125 | $1,567 | 4.9% | $15,056,230 | $1,677 | 4.8% |
| (1) | Based on historical sales provided by each tenant. |
| (2) | Occ. Costs % are calculated based off total underwritten rent (including reimbursements), applied consistently historically for illustrative purposes. |
Historical Percentage Rent
Historical Percentage Rent(1) | ||||||||
| 2011 | 2012 | 2013 | 2014(2) | |||||
Annual Rent | % Rent PSF | Annual Rent | % Rent PSF | Annual Rent | % Rent PSF | Annual Rent | % Rent PSF | |
| SoHo House | $799,479 | $37 | $872,749 | $40 | $1,107,655 | $51 | $1,248,532 | $58 |
| BOA Steakhouse | $267,032 | $30 | $275,314 | $31 | $255,700 | $28 | $294,222 | $33 |
| (1) | Based on historical operating statements. |
| (2) | The actual percentage rent from 2014 was used for underwritten percentage rent. |
The Market. The 9200 & 9220 Sunset Property is located within the West Los Angeles market. As of the first quarter 2015, the West Los Angeles office market contained 2,484 properties totaling approximately 75.4 million sq. ft. with an overall vacancy rate of 10.3%. Quoted rates for the market are $45.23 full service gross. The overall vacancy within the West Hollywood office market vacancy is skewed due to the delivery of Red Building East and West in 2013 totaling 423,665 sq. ft., which has been slow to absorb and is currently 10.9% occupied. As of the first quarter 2015, the West Los Angeles retail submarket contained 638 properties totaling approximately 4.6 million sq. ft. with an overall vacancy rate of 2.8%. The appraiser concluded occupancy of 92.5% and concluded $90.00 PSF NNN for both the ground floor retail and penthouse retail components of the 9200 & 9220 Sunset Property, $67.80 PSF full service gross for the office component of 9200 West Sunset Boulevard and $64.20 PSF full service gross for the office component of 9220 West Sunset Boulevard. The appraiser also assumed that the $90.00 PSF NNN retail market rental rate would also typically include market standard percentage rent in addition to base rent.
THE INFORMATION IN THIS STRUCTURAL AND COLLATERAL TERM SHEET IS NOT COMPLETE AND MAY BE AMENDED PRIOR TO THE TIME OF SALE. THIS TERM SHEET IS NOT AN OFFER TO SELL THESE SECURITIES AND IT IS NOT A SOLICITATION OF AN OFFER TO BUY THESE SECURITIES IN ANY JURISDICTION WHERE THE OFFER OR SALE IS NOT PERMITTED.
26
9200 & 9220 West Sunset Boulevard West Hollywood, CA 90069 | Collateral Asset Summary – Loan No. 1 9200 & 9220 Sunset | Cut-off Date Balance: Cut-off Date LTV: U/W NCF DSCR: U/W NOI Debt Yield: | $120,000,000 60.9% 2.21x 9.1% |
Historical and Current Occupancy
| Historical and Current Occupancy | |||||
| 2010 | 2011 | 2012 | 2013 | 2014 | Most Recent(1) |
| 89.8% | 84.0% | 86.0% | 86.0% | 91.0% | 92.0% |
| (1) | Based on a rent roll dated April 1, 2015. |
The appraiser analyzed a set of seven comparable properties within the immediate competitive area of the 9200 & 9220 Sunset Property. The chart below summarizes the competitive set as determined by the appraisal.
Competitive Set(1) | |||||
| Building | Location | Year Built | Total GLA | Occupancy | Parking/1,000 Sq. Ft. |
| 9200 & 9220 Sunset Property | 9200 & 9220 West Sunset Boulevard, West Hollywood, CA | 1964,1971 | 317,171(2) | 92%(2) | 2.3 |
| 9000 Sunset | 9000 Sunset Boulevard, West Hollywood, CA | 1964 | 139,350 | 94% | 3 |
| Sunset Doheny Towers | 9255 Sunset Boulevard, West Hollywood, CA | 1961 | 240,000 | 94% | 3 |
| Sun America Center | 1999 Avenue of the Stars, Los Angeles, CA | 1990 | 824,106 | 77% | 3 |
| 9595 Wilshire Boulevard | 9595 Wilshire Boulevard, Beverly Hills, CA | 1972 | 163,624 | 98% | 3 |
| Wilshire Beverly | 9465 Wilshire Boulevard, Beverly Hills, CA | 1963 | 186,269 | 86% | 2.5 |
| 9601 Wilshire | 9601 Wilshire Boulevard, Beverly Hills, CA | 1962 | 302,423 | 100% | 3 |
| 100 Wilshire | 100 Wilshire Boulevard, Santa Monica, CA | 1971 | 247,225 | 99% | 2.6 |
| (1) | Source: Appraisal. |
(2) | Based on rent roll dated April 1, 2015. |
Cash Flow Analysis.
| Cash Flow Analysis | ||||||
| 2011 | 2012 | 2013 | 2014 | U/W | U/W PSF | |
| Base Rent | $13,689,045 | $14,376,061 | $15,222,477 | $16,122,011 | $18,725,358 | $59.04 |
| Base Rent Steps | 0 | 0 | 0 | 0 | 499,333 | 1.57 |
| Mark-to-Market Adjustments | 0 | 0 | 0 | 0 | (203,979) | (0.64) |
| Gross Potential Rent | $13,689,045 | $14,376,061 | $15,222,477 | $16,122,011 | $19,020,713 | $59.97 |
| Total Recoveries | 810,710 | 782,096 | 810,831 | 793,176 | 1,029,626 | 3.25 |
Total % Rents(1) | 969,805 | 1,213,395 | 1,230,306 | 1,542,754 | 1,542,754 | 4.86 |
| Parking Income | 3,338,330 | 3,585,804 | 3,991,182 | 4,011,719 | 4,011,719 | 12.65 |
| Other Income | 61,323 | 50,709 | 47,715 | 301,590 | 338,143 | 1.07 |
Less: Vacancy(2) | 0 | 0 | 0 | 0 | 0 | 0 |
| Effective Gross Income | $18,869,213 | $20,008,065 | $21,302,511 | $22,771,250 | $25,942,955 | $81.79 |
| Total Operating Expenses | 5,677,258 | 5,850,150 | 6,163,335 | 6,492,343 | 6,770,282 | 21.35 |
Net Operating Income(3) | $13,191,955 | $14,157,915 | $15,139,176 | $16,278,907 | $19,172,673 | $60.45 |
| TI/LC | 0 | 0 | 0 | 0 | 317,171 | 1.00 |
| Capital Expenditures | 0 | 0 | 0 | 0 | 79,293 | 0.25 |
| Net Cash Flow | $13,191,955 | $14,157,915 | $15,139,176 | $16,278,907 | $18,776,209 | $59.20 |
| (1) | U/W Total % Rent is based on the actual year-end 2014 percentage rent paid by both SoHo House and BOA Steakhouse. |
| (2) | U/W Vacancy is based on the current in-place vacancy of 8.0%. |
| (3) | The increase in U/W Net Operating Income from 2014 Net Operating Income is primarily the result of the following: (i) the annualized amount of contractual annual rent steps for existing tenants that occurred in 2014 as the 2014 Gross Potential Rent is a cash basis TTM figure, (ii) the 2014 Net Operating Income excludes rent abatements that occurred in 2014 totaling approximately $413,265 (and the borrower reserved approximately $501,964 at loan closing to cover rent abatements that occur in 2015), (iii) contractual rent steps for tenants occurring in January 2015 through May 2015 which are now in-place, (iv) underwritten contractual rent steps through May 2016, and (v) net new leasing (lost rental revenue from vacating tenants plus rental revenue from seven new or renewed leases). Combined, the resulting increase is equal to $2,898,702. Deducting this figure from U/W Gross Potential Rent of $19,020,713 equates to the 2014 Gross Potential Rent amount of $16,122,011. |
THE INFORMATION IN THIS STRUCTURAL AND COLLATERAL TERM SHEET IS NOT COMPLETE AND MAY BE AMENDED PRIOR TO THE TIME OF SALE. THIS TERM SHEET IS NOT AN OFFER TO SELL THESE SECURITIES AND IT IS NOT A SOLICITATION OF AN OFFER TO BUY THESE SECURITIES IN ANY JURISDICTION WHERE THE OFFER OR SALE IS NOT PERMITTED.
27
9200 & 9220 West Sunset Boulevard West Hollywood, CA 90069 | Collateral Asset Summary – Loan No. 1 9200 & 9220 Sunset | Cut-off Date Balance: Cut-off Date LTV: U/W NCF DSCR: U/W NOI Debt Yield: | $120,000,000 60.9% 2.21x 9.1% |
Property Management. The 9200 & 9220 Sunset Property is managed by Mani Brothers, LLC, an affiliate of the borrower.
Lockbox / Cash Management. The 9200 & 9220 Sunset Loan is structured with a soft, springing hard lockbox and springing cash management. The borrower and property manager are required to deposit all rents into a clearing account maintained by the borrower. Unless a Cash Management Period (as defined below) has occurred, all amounts of deposit in the clearing account will be swept into the borrower’s account. From and after the commencement of a Cash Management Period, the borrower is required to instruct each tenant to deposit rents directly into a lockbox account and all amounts on deposit in the clearing account will be swept daily into a lender controlled account.
A “Cash Management Period” will occur (i) upon an event of default, (ii) on the stated maturity date or (iii) if the debt yield falls below 7.0%.
Initial Reserves. At closing, the borrower deposited (i) $450,000 into a tax reserve account, (ii) $51,000 into an insurance reserve account and (iii) $501,964 into a rent abatement reserve account representing the total outstanding free rent due to all signed tenants.
Ongoing Reserves. On a monthly basis, the borrower is required to deposit reserves of (i) 1/12 of the estimated annual real estate taxes, which currently equates to $154,740, into a tax reserve account, (ii) 1/12 of the annual insurance premiums, which currently equates to $9,000, into an insurance reserve account and (iii) $26,431 into a TI/LC reserve account. The reserve will be subject to a $600,000 cap if occupancy is greater than or equal to 92.0% and such cap will increase to $1,000,000 if occupancy is less than 92.0%.
Current Mezzanine or Subordinate Indebtedness. None.
Future Mezzanine or Subordinate Indebtedness Permitted. None.
THE INFORMATION IN THIS STRUCTURAL AND COLLATERAL TERM SHEET IS NOT COMPLETE AND MAY BE AMENDED PRIOR TO THE TIME OF SALE. THIS TERM SHEET IS NOT AN OFFER TO SELL THESE SECURITIES AND IT IS NOT A SOLICITATION OF AN OFFER TO BUY THESE SECURITIES IN ANY JURISDICTION WHERE THE OFFER OR SALE IS NOT PERMITTED.
28
9200 & 9220 West Sunset Boulevard West Hollywood, CA 90069 | Collateral Asset Summary – Loan No. 1 9200 & 9220 Sunset | Cut-off Date Balance: Cut-off Date LTV: U/W NCF DSCR: U/W NOI Debt Yield: | $120,000,000 60.9% 2.21x 9.1% |
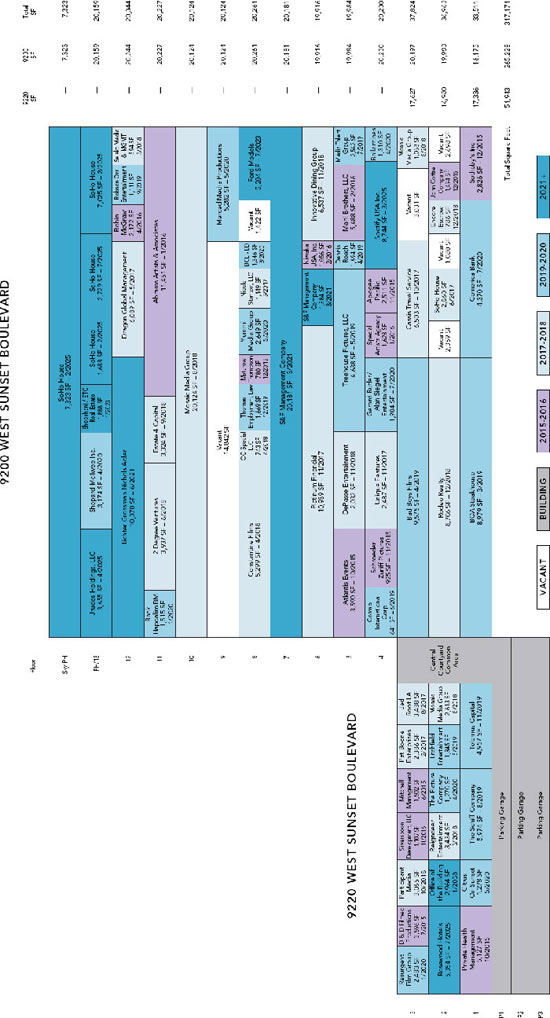
THE INFORMATION IN THIS STRUCTURAL AND COLLATERAL TERM SHEET IS NOT COMPLETE AND MAY BE AMENDED PRIOR TO THE TIME OF SALE. THIS TERM SHEET IS NOT AN OFFER TO SELL THESE SECURITIES AND IT IS NOT A SOLICITATION OF AN OFFER TO BUY THESE SECURITIES IN ANY JURISDICTION WHERE THE OFFER OR SALE IS NOT PERMITTED.
29
9200 & 9220 West Sunset Boulevard West Hollywood, CA 90069 | Collateral Asset Summary – Loan No. 1 9200 & 9220 Sunset | Cut-off Date Balance: Cut-off Date LTV: U/W NCF DSCR: U/W NOI Debt Yield: | $120,000,000 60.9% 2.21x 9.1% |
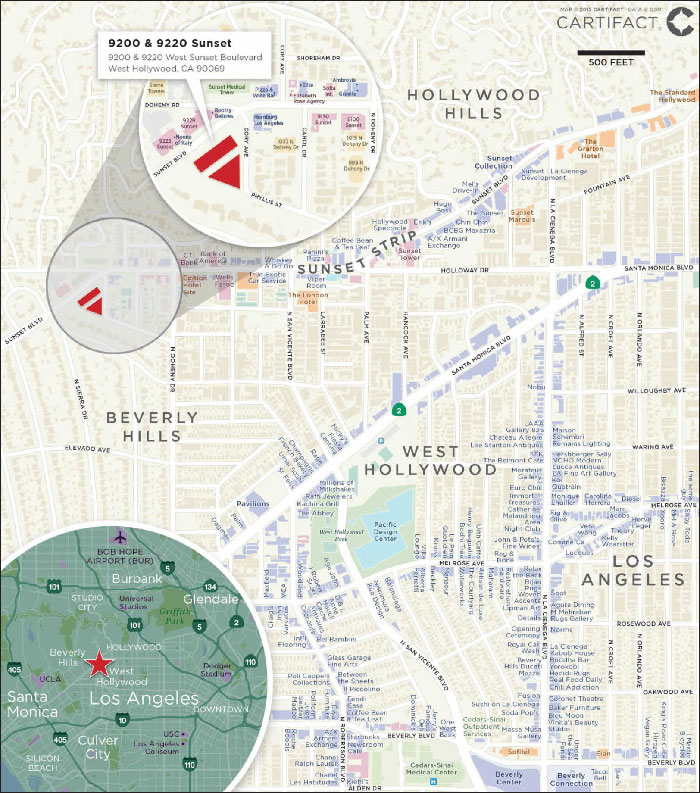
THE INFORMATION IN THIS STRUCTURAL AND COLLATERAL TERM SHEET IS NOT COMPLETE AND MAY BE AMENDED PRIOR TO THE TIME OF SALE. THIS TERM SHEET IS NOT AN OFFER TO SELL THESE SECURITIES AND IT IS NOT A SOLICITATION OF AN OFFER TO BUY THESE SECURITIES IN ANY JURISDICTION WHERE THE OFFER OR SALE IS NOT PERMITTED.
30
(THIS PAGE INTENTIONALLY LEFT BLANK)
31
Various | Collateral Asset Summary – Loan No. 2 Courtyard by Marriott Portfolio | Cut-off Date Balance: Cut-off Date LTV: U/W NCF DSCR: U/W NOI Debt Yield: | $100,000,000 28.2% 7.40x 32.7% |
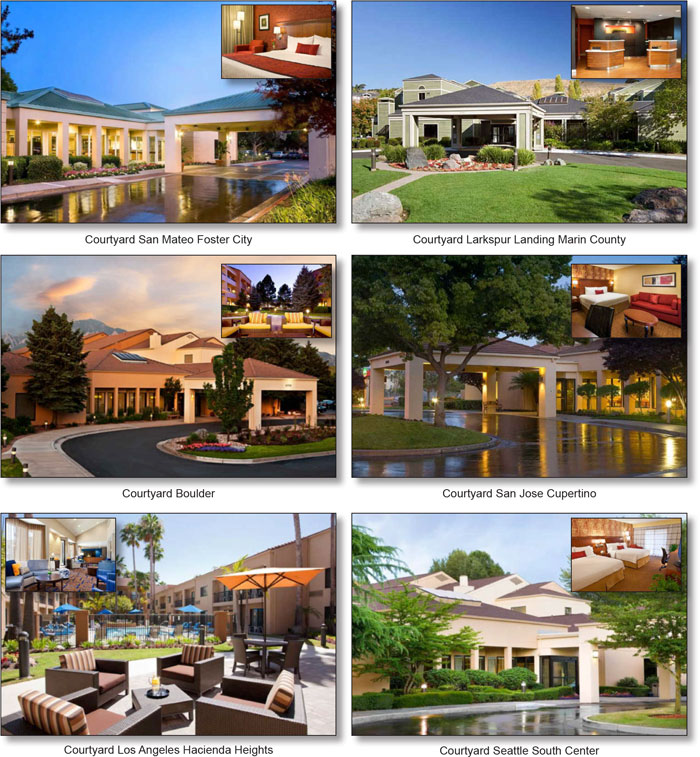
THE INFORMATION IN THIS STRUCTURAL AND COLLATERAL TERM SHEET IS NOT COMPLETE AND MAY BE AMENDED PRIOR TO THE TIME OF SALE. THIS TERM SHEET IS NOT AN OFFER TO SELL THESE SECURITIES AND IT IS NOT A SOLICITATION OF AN OFFER TO BUY THESE SECURITIES IN ANY JURISDICTION WHERE THE OFFER OR SALE IS NOT PERMITTED.
32
Various | Collateral Asset Summary – Loan No. 2 Courtyard by Marriott Portfolio | Cut-off Date Balance: Cut-off Date LTV: U/W NCF DSCR: U/W NOI Debt Yield: | $100,000,000 28.2% 7.40x 32.7% |
| Mortgage Loan Information | |
| Loan Seller: | GACC |
| Credit Assessment (Moody's/DBRS/Morningstar) | Aa2/AAA/AA+ |
| Loan Purpose: | Refinance |
| Sponsor: | CBM Joint Venture Limited Partnership |
| Borrower: | CBM Two Hotels LP; C2 Land, L.P. |
Original Balance(1): | $100,000,000 |
Cut-off Date Balance(1): | $100,000,000 |
| % by Initial UPB: | 7.3% |
| Interest Rate: | 3.6900% |
| Payment Date: | 6th of each month |
| First Payment Date: | May 6, 2015 |
| Maturity Date: | April 6, 2020 |
| Amortization: | Interest Only |
Additional Debt(1): | $215,000,000 Pari Passu Debt; $355,000,000 Subordinate Secured Debt |
Call Protection(2): | L(25), D(30), O(5) |
| Lockbox / Cash Management: | Soft Springing Hard / In Place |
Reserves(3) | ||
| Initial | Monthly | |
| Taxes: | $0 | $985,000 |
| Insurance: | $0 | Springing |
| Required Repairs: | $409,063 | NAP |
FF&E(4): | $0 | Springing |
| Ground Rent: | $0 | Springing |
Financial Information(5) | ||
| Senior Tranche | Total Debt | |
| Cut-off Date Balance / Room: | $32,847 | $69,864 |
| Balloon Balance / Room: | $32,847 | $69,864 |
Cut-off Date LTV(6): | 28.2% | 60.0% |
Balloon LTV(6): | 28.2% | 60.0% |
| Underwritten NOI DSCR: | 8.73x | 4.10x |
| Underwritten NCF DSCR: | 7.40x | 3.48x |
| Underwritten NOI Debt Yield: | 32.7% | 15.4% |
| Underwritten NCF Debt Yield: | 27.7% | 13.0% |
| Underwritten NOI Debt Yield at Balloon: | 32.7% | 15.4% |
| Underwritten NCF Debt Yield at Balloon: | 27.7% | 13.0% |
| Property Information | ||
| Single Asset / Portfolio: | Portfolio of 65 properties | |
| Property Type: | Select Service Hospitality | |
Collateral(7): | Fee Simple / Leasehold | |
| Location: | Various | |
| Year Built / Renovated: | Various | |
| Total Rooms: | 9,590 | |
| Property Management: | Courtyard Management Corporation | |
| Underwritten NOI: | $102,858,635 | |
| Underwritten NCF: | $87,204,717 | |
Appraised Value(6): | $1,116,000,000 | |
| Appraisal Date: | March 1, 2015 | |
| Historical NOI | ||
| Most Recent NOI: | $103,803,403 (T-12 February 28, 2015) | |
| 2014 NOI: | $101,146,386 (December 31, 2014) | |
| 2013 NOI: | $84,699,708 (December 31, 2013) | |
| 2012 NOI: | $76,100,616 (December 31, 2012) | |
| Historical Occupancy | ||
| Most Recent Occupancy: | 70.0% (February 28, 2015) | |
| 2014 Occupancy: | 69.5% (December 31, 2014) | |
| 2013 Occupancy: | 66.0% (December 31, 2013) | |
| 2012 Occupancy: | 65.8% (December 31, 2012) | |
| (1) | The Original Balance and Cut-off Date Balance of $100.0 million represent the Note A-2A of a $670.0 million whole loan evidenced by four pari passu notes with an aggregate original principal balance of $315.0 million and one subordinate note with an original principal balance of $355.0 million. For additional information regarding the pari passu companion loans and subordinate note see “The Loan” and “Current Mezzanine or Subordinate Indebtedness” herein. |
| (2) | The lockout period will be at least 25 payments beginning with and including the first payment date of May 6, 2015. Defeasance of the full $670 million Courtyard by Marriott Portfolio Loan (other than the non-pooled Note A-1 which permits prepayment in connection with a property release after a 12 month lockout period from loan closing) is permitted after the date that is earlier to occur of (i) two years after the closing date of the securitization that includes the last pari passu companion loan and (ii) March 31, 2018. |
| (3) | See “Initial Reserves” and “Ongoing Reserves” herein. |
| (4) | Borrower will deposit on each monthly payment date an amount equal to the greater of (i) 5% of rents (or in the case of the Courtyard Managed Properties, 5% of the gross revenues) and (ii) the amount required by the manager or any franchisor into an FF&E reserve. With respect to any Courtyard Managed Property (as defined herein), so long as the manager is depositing an amount no less than the monthly amount borrower is otherwise required to deposit into a separate FF&E reserve account owned by borrower, pledged to the lender and directly accessible by the manager, borrower’s obligation to make monthly deposits into the FF&E reserve will be suspended. |
| (5) | DSCR, LTV, Debt Yield, and Balance / Room calculations are based on the aggregate $315.0 million Courtyard by Marriott Portfolio Senior Tranche. |
| (6) | The Appraised Value of $1.116 billion reflects a premium attributed to the aggregate value of the Courtyard by Marriott Portfolio as a whole. The sum of the value of each of the properties on an individual basis is $1.041 billion, which represents a Cut-off Date LTV of 30.3% and 64.4% for the Senior Tranche and Total Debt, respectively. |
| (7) | The Courtyard by Marriott Portfolio is secured by the fee simple interest in nine hotels, leasehold interest in seven hotels under third-party ground leases and the fee and leasehold interest in 49 hotels. For additional information regarding ownership interest, see “The Properties” herein. |
Historical Occupancy, ADR, RevPAR(1) | |||||||||
| Year | Courtyard by Marriott Portfolio | Competitive Set | Penetration Factor | ||||||
Occupancy(2) | ADR(2) | RevPAR(2) | Occupancy | ADR | RevPAR | Occupancy | ADR | RevPAR | |
| 2012 | 65.6% | $102.76 | $68.16 | 64.2% | $93.38 | $60.12 | 102.2% | 110.0% | 116.0% |
| 2013 | 66.2% | $107.49 | $71.92 | 65.4% | $95.57 | $62.33 | 101.3% | 112.5% | 118.6% |
| 2014 | 69.5% | $113.91 | $80.01 | 67.9% | $98.91 | $67.64 | 102.4% | 115.2% | 120.7% |
| T-12 Feb 2015 | 70.0% | $115.14 | $81.41 | 68.4% | $99.89 | $68.65 | 102.4% | 115.3% | 120.9% |
(1) (2) | Source: Hospitality Research Report. The minor variances between the underwriting, the hospitality research report and the above table with respect to Occupancy, ADR and RevPAR at the Courtyard by Marriott Portfolio are attributable to variances in reporting methodologies and/or timing differences.” |
THE INFORMATION IN THIS STRUCTURAL AND COLLATERAL TERM SHEET IS NOT COMPLETE AND MAY BE AMENDED PRIOR TO THE TIME OF SALE. THIS TERM SHEET IS NOT AN OFFER TO SELL THESE SECURITIES AND IT IS NOT A SOLICITATION OF AN OFFER TO BUY THESE SECURITIES IN ANY JURISDICTION WHERE THE OFFER OR SALE IS NOT PERMITTED.
33
Various | Collateral Asset Summary – Loan No. 2 Courtyard by Marriott Portfolio | Cut-off Date Balance: Cut-off Date LTV: U/W NCF DSCR: U/W NOI Debt Yield: | $100,000,000 28.2% 7.40x 32.7% |
The Loan. The Courtyard by Marriott Portfolio loan (the “Courtyard by Marriott Portfolio Loan”) is a fixed rate loan secured by the borrowers’ fee simple and leasehold interests in a portfolio of 65 Courtyard by Marriott hotel properties located across 29 states, totaling 9,590 rooms (the “Courtyard by Marriott Portfolio” or the “Courtyard by Marriott Portfolio Properties”). The Courtyard by Marriott Portfolio Loan has an original principal balance of $670.0 million, consisting of a senior tranche in the amount of $315.0 million (the “Courtyard by Marriott Portfolio Senior Tranche”) and a junior tranche in the amount of $355.0 million (the “Courtyard by Marriott Portfolio Junior Tranche”). The Courtyard by Marriott Portfolio Senior Tranche is evidenced by four pari passu notes. Only the non-controlling Note A-2A with an original principal balance of $100.0 million will be included and pooled in the COMM 2015-CCRE23 trust. The non-controlling Note A-1 with an original principal balance of $33.5 million will be included in the COMM 2015-CCRE23 trust but will not be pooled. The remaining Note A-2B and Note A-2C, with an aggregate original balance of $181.5 million, are expected to be contributed to one or more future securitizations. The Courtyard by Marriott Portfolio Junior Tranche is evidenced by the controlling Note B with an original principle balance of $355.0 million which will be included in the COMM 2015-CCRE23 trust but will not be pooled.
The relationship between the holders of the Note A-1, Note A2-A, Note A2-B, Note A2-C and Note B will be governed be a co-lender agreement as described under “Description of the Mortgage Pool – Loan Combinations – Courtyard by Marriott Portfolio” in the accompanying Free Writing Prospectus.
| Loan Combination Summary | ||||||||||
| Original Balance | Cut-off Date Balance | Note Holder | Controlling Piece | Pooled/Non-Pooled | ||||||
| Note A-1 | $33,500,000 | $33,500,000 | COMM 2015-CCRE23 | No | Non-Pooled | |||||
| Note A2-A | $100,000,000 | $100,000,000 | COMM 2015-CCRE23 | No | Pooled | |||||
| Note A2-B | $97,050,000 | $97,050,000 | GACC | No | NAP | |||||
| Note A2-C | $84,450,000 | $84,450,000 | CGMRC | No | NAP | |||||
| Total – Senior Tranche | $315,000,000 | $315,000,000 | ||||||||
| Note B – Junior Tranche | $355,000,000 | $355,000,000 | COMM 2015-CCRE23 | Yes | Non-Pooled | |||||
| Total Debt | $670,000,000 | $670,000,000 | ||||||||
The Courtyard by Marriott Portfolio Loan has a five-year interest only term and accrues interest at 3.6900%. Loan proceeds were used to retire existing debt of approximately $566.8 million, fund reserves of $913,163, pay closing costs of approximately $9.0 million and return approximately $93.2 million of equity to the borrowers. Based on the portfolio appraised value of $1,116,000,000, the cut-off date LTV is 28.2%. The most recent prior financing of the Courtyard by Marriott Portfolio Properties were included in the LBUBS 2005 C-3, LBUBS 2005 C-5, LBUBS 2005 C-7 and LBUBS 2006 C-1 securitizations.
| Sources and Uses | |||||||
| Sources | Proceeds | % of Total | Uses | Proceeds | % of Total | ||
| Loan Proceeds | $670,000,000 | 100.0% | Loan Payoff | $566,832,998 | 84.6% | ||
| Reserves | $913,163 | 0.1% | |||||
| Closing Costs | $9,023,808 | 1.3% | |||||
| Return of Equity | $93,230,032 | 13.9% | |||||
| Total Sources | $670,000,000 | 100.0% | Total Uses | $670,000,000 | 100.0% | ||
The Borrower / Sponsor. The borrowers, CBM Two Hotels LP and C2 Land, L.P., are each a single purpose Delaware limited partnership, structured to be bankruptcy remote, each with two independent directors in its organizational structure. The sponsor of the borrowers and non-recourse carve out guarantor is CBM Joint Venture Limited Partnership.
CBM Joint Venture Limited Partnership is a joint venture between Clarion Partners, LLC and the State of Michigan Retirement Systems. Clarion Partners, LLC, established in 1982, is a U.S. based real estate investment firm. Clarion Partners, LLC is based in New York, New York with additional offices across North America, Europe and South America. Clarion Partners, LLC invests in properties throughout the United States, United Kingdom, Middle East, Euro zone and Mexico. The State of Michigan Retirement Systems is a domestic pension fund that administers retirement programs for Michigan’s state employees, public school employees, judges, state police and National Guard members.
The Properties. The Courtyard by Marriott Portfolio Loan is secured by the fee simple interest in nine hotels (the “Fee Simple Properties”), leasehold interest in seven hotels under third-party ground leases (the “Third Party Ground Lease Properties”) and the fee and leasehold interest in 49 hotels (the “Affiliated Ground Lease Properties”). CBM Two Hotels LP owns the leasehold interest in the Affiliated Ground Lease Properties and C2 Land, L.P. owns the fee interest. Both the fee and leasehold interest in the 49 Affiliated Ground Lease Properties serve as collateral for the loan. As such, for disclosure purposes, the Affiliated Ground Lease Properties are considered fee owned. All 65 hotels are operated under the Courtyard by Marriott brand. Courtyard by Marriott is one of the first hotel brands to focus on the upscale select service category, catering primarily to business travelers.
THE INFORMATION IN THIS STRUCTURAL AND COLLATERAL TERM SHEET IS NOT COMPLETE AND MAY BE AMENDED PRIOR TO THE TIME OF SALE. THIS TERM SHEET IS NOT AN OFFER TO SELL THESE SECURITIES AND IT IS NOT A SOLICITATION OF AN OFFER TO BUY THESE SECURITIES IN ANY JURISDICTION WHERE THE OFFER OR SALE IS NOT PERMITTED.
34
Various | Collateral Asset Summary – Loan No. 2 Courtyard by Marriott Portfolio | Cut-off Date Balance: Cut-off Date LTV: U/W NCF DSCR: U/W NOI Debt Yield: | $100,000,000 28.2% 7.40x 32.7% |
| Portfolio Summary | ||||||||||||||
| Property Name | City | State | Rooms | Year Built | Ownership Interest(1) | “As-Is” Value(2) | Allocated Loan Amt.(3) | |||||||
| Courtyard Larkspur Landing Marin County | Larkspur | CA | 146 | 1987 | Affiliated Ground Lease | $41,000,000 | $28,200,000 | |||||||
| Courtyard San Mateo Foster City | Foster City | CA | 147 | 1987 | Affiliated Ground Lease | $40,500,000 | $28,200,000 | |||||||
| Courtyard San Jose Cupertino | Cupertino | CA | 149 | 1988 | 3rd Party Ground Lease | $36,000,000 | $24,300,000 | |||||||
| Courtyard Boulder | Boulder | CO | 149 | 1988 | Affiliated Ground Lease | $35,000,000 | $24,300,000 | |||||||
| Courtyard Los Angeles Hacienda Heights | Hacienda Heights | CA | 150 | 1990 | Affiliated Ground Lease | $27,500,000 | $18,500,000 | |||||||
| Courtyard Seattle South Center | Tukwila | WA | 149 | 1989 | Affiliated Ground Lease | $27,000,000 | $17,970,000 | |||||||
| Courtyard Rye | Rye | NY | 145 | 1988 | Affiliated Ground Lease | $25,500,000 | $16,970,000 | |||||||
| Courtyard Nashville Airport | Nashville | TN | 145 | 1988 | Affiliated Ground Lease | $23,000,000 | $16,000,000 | |||||||
| Courtyard Los Angeles Torrance Palos Verdes | Torrance | CA | 149 | 1988 | Affiliated Ground Lease | $21,000,000 | $14,300,000 | |||||||
| Courtyard St. Louis Creve Coeur | Creve Coeur | MO | 154 | 1987 | Affiliated Ground Lease | $20,500,000 | $13,650,000 | |||||||
| Courtyard Portland Beaverton | Beaverton | OR | 149 | 1989 | Affiliated Ground Lease | $20,500,000 | $13,650,000 | |||||||
| Courtyard Palm Springs | Palm Springs | CA | 149 | 1988 | Affiliated Ground Lease | $19,500,000 | $13,500,000 | |||||||
| Courtyard Charlotte South Park | Charlotte | NC | 149 | 1989 | 3rd Party Ground Lease | $19,000,000 | $13,200,000 | |||||||
| Courtyard Norwalk | Norwalk | CT | 145 | 1988 | 3rd Party Ground Lease | $18,000,000 | $12,500,000 | |||||||
| Courtyard Detroit Metro Airport | Romulus | MI | 146 | 1987 | Affiliated Ground Lease | $18,500,000 | $12,310,000 | |||||||
| Courtyard Chicago Waukegan Gurnee | Waukegan | IL | 149 | 1988 | Affiliated Ground Lease | $17,500,000 | $12,000,000 | |||||||
| Courtyard Atlanta Perimeter Center | Atlanta | GA | 145 | 1987 | Affiliated Ground Lease | $17,000,000 | $11,700,000 | |||||||
| Courtyard Denver Tech Center | Greenwood Village | CO | 155 | 1987 | Affiliated Ground Lease | $17,500,000 | $11,650,000 | |||||||
| Courtyard Ft. Lauderdale Plantation | Plantation | FL | 149 | 1988 | Affiliated Ground Lease | $17,000,000 | $11,320,000 | |||||||
| Courtyard Lincroft Red Bank | Red Bank | NJ | 146 | 1988 | Affiliated Ground Lease | $17,000,000 | $11,320,000 | |||||||
| Courtyard Chicago Highland Park | Highland Park | IL | 149 | 1988 | Affiliated Ground Lease | $16,500,000 | $10,980,000 | |||||||
| Courtyard Charlottesville North | Charlottesville | VA | 150 | 1989 | Affiliated Ground Lease | $16,500,000 | $10,980,000 | |||||||
| Courtyard Raleigh Cary | Cary | NC | 149 | 1987 | Affiliated Ground Lease | $16,500,000 | $10,980,000 | |||||||
| Courtyard Detroit Livonia | Livonia | MI | 149 | 1988 | Affiliated Ground Lease | $15,500,000 | $10,800,000 | |||||||
| Courtyard Birmingham Homewood | Homewood | AL | 140 | 1985 | Fee Simple | $16,000,000 | $10,650,000 | |||||||
| Courtyard West Palm Beach | West Palm Beach | FL | 149 | 1988 | Affiliated Ground Lease | $16,000,000 | $10,650,000 | |||||||
| Courtyard New Haven Wallingford | Wallingford | CT | 149 | 1990 | Affiliated Ground Lease | $15,500,000 | $10,320,000 | |||||||
| Courtyard Dallas Plano Parkway | Plano | TX | 149 | 1988 | Fee Simple | $15,000,000 | $9,990,000 | |||||||
| Courtyard Chicago Oakbrook Terrace | Oakbrook Terrace | IL | 147 | 1986 | Fee Simple | $15,000,000 | $9,990,000 | |||||||
| Courtyard Boston Andover | Andover | MA | 146 | 1988 | Affiliated Ground Lease | $15,000,000 | $9,990,000 | |||||||
| Courtyard Kansas City Overland Park Metcalf | Overland Park | KS | 149 | 1988 | Affiliated Ground Lease | $15,000,000 | $9,990,000 | |||||||
| Courtyard Minneapolis St Paul Airport | Mendota Heights | MN | 146 | 1987 | Affiliated Ground Lease | $15,000,000 | $9,990,000 | |||||||
| Courtyard Bakersfield | Bakersfield | CA | 146 | 1988 | Affiliated Ground Lease | $14,500,000 | $9,650,000 | |||||||
| Courtyard Denver Stapleton | Denver | CO | 146 | 1987 | Fee Simple | $14,500,000 | $9,650,000 | |||||||
| Courtyard Rockford | Rockford | IL | 147 | 1986 | Fee Simple | $14,500,000 | $9,650,000 | |||||||
| Courtyard Greenville Haywood Mall | Greenville | SC | 146 | 1988 | Affiliated Ground Lease | $13,500,000 | $9,400,000 | |||||||
| Courtyard St. Louis Westport Plaza | St. Louis | MO | 149 | 1988 | Affiliated Ground Lease | $14,000,000 | $9,320,000 | |||||||
| Courtyard Chicago Lincolnshire | Lincolnshire | IL | 146 | 1987 | Fee Simple | $14,000,000 | $9,320,000 | |||||||
| Courtyard San Antonio Downtown Market Square | San Antonio | TX | 149 | 1990 | Affiliated Ground Lease | $14,000,000 | $9,320,000 | |||||||
| Courtyard Indianapolis Castleton | Indianapolis | IN | 146 | 1987 | Affiliated Ground Lease | $14,000,000 | $9,320,000 | |||||||
| Courtyard Silver Spring North | Silver Spring | MD | 146 | 1988 | Affiliated Ground Lease | $14,500,000 | $9,100,000 | |||||||
| Courtyard Lexington North | Lexington | KY | 146 | 1987 | Affiliated Ground Lease | $13,500,000 | $8,990,000 | |||||||
| Courtyard Tampa Westshore | Tampa | FL | 145 | 1986 | 3rd Party Ground Lease | $13,000,000 | $8,650,000 | |||||||
| Courtyard Chicago Deerfield | Deerfield | IL | 131 | 1986 | Fee Simple | $12,500,000 | $8,320,000 | |||||||
| Courtyard St. Petersburg Clearwater | Clearwater | FL | 149 | 1989 | Affiliated Ground Lease | $12,000,000 | $7,990,000 | |||||||
| Courtyard Toledo Airport Holland | Holland | OH | 149 | 1988 | Affiliated Ground Lease | $12,000,000 | $7,990,000 | |||||||
| Courtyard Phoenix Mesa | Mesa | AZ | 149 | 1988 | Affiliated Ground Lease | $11,000,000 | $7,320,000 | |||||||
| Courtyard Atlanta Airport South | College Park | GA | 144 | 1986 | Fee Simple | $11,000,000 | $7,320,000 | |||||||
| Courtyard Memphis Airport | Memphis | TN | 145 | 1987 | Affiliated Ground Lease | $11,000,000 | $7,320,000 | |||||||
| Courtyard Oklahoma City Airport | Oklahoma City | OK | 149 | 1988 | Affiliated Ground Lease | $11,000,000 | $7,320,000 | |||||||
| Courtyard Annapolis | Annapolis | MD | 149 | 1989 | Affiliated Ground Lease | $13,000,000 | $7,220,000 | |||||||
| Courtyard Manassas | Manassas | VA | 149 | 1989 | Affiliated Ground Lease | $11,000,000 | $6,820,000 | |||||||
| Courtyard Little Rock | Little Rock | AR | 149 | 1988 | Affiliated Ground Lease | $10,500,000 | $6,530,000 | |||||||
| Courtyard Ft. Myers | Ft. Myers | FL | 149 | 1988 | Affiliated Ground Lease | $9,000,000 | $5,680,000 | |||||||
| Courtyard Atlanta Gwinnett Mall | Duluth | GA | 146 | 1987 | Affiliated Ground Lease | $9,500,000 | $5,540,000 | |||||||
| Courtyard Chicago Arlington Heights South | Arlington Heights | IL | 147 | 1985 | Fee Simple | $8,000,000 | $5,330,000 | |||||||
| Courtyard Dallas Richardson at Spring Valley | Richardson | TX | 149 | 1988 | Affiliated Ground Lease | $8,000,000 | $5,330,000 | |||||||
| Courtyard Huntsville | Huntsville | AL | 149 | 1987 | Affiliated Ground Lease | $10,500,000 | $5,140,000 | |||||||
| Courtyard Birmingham Hoover | Hoover | AL | 153 | 1987 | Affiliated Ground Lease | $7,000,000 | $4,470,000 | |||||||
| Courtyard Phoenix North Metrocenter | Phoenix | AZ | 146 | 1987 | Affiliated Ground Lease | $6,500,000 | $4,330,000 | |||||||
| Courtyard Tucson Airport | Tucson | AZ | 149 | 1988 | Affiliated Ground Lease | $6,000,000 | $3,990,000 | |||||||
| Courtyard Dayton South Mall | Miamisburg | OH | 146 | 1987 | Affiliated Ground Lease | $7,000,000 | $2,820,000 | |||||||
| Courtyard Philadelphia Devon | Wayne | PA | 149 | 1988 | 3rd Party Ground Lease | $18,500,000 | $0 | |||||||
| Courtyard Fresno | Fresno | CA | 146 | 1986 | 3rd Party Ground Lease | $8,000,000 | $0 | |||||||
| Courtyard Poughkeepsie | Poughkeepsie | NY | 149 | 1988 | 3rd Party Ground Lease | $8,000,000 | $0 | |||||||
| Total | 9,950 | $1,041,000,000 | $670,000,000 | |||||||||||
| Total w/ Portfolio Premium | $1,116,000,000 | |||||||||||||
| (1) | With respect to the ownership interest identified as “affiliated ground lease,” the fee owner and the leasehold owner are each borrowers under the Courtyard by Marriott Portfolio Loan. As such, for disclosure purposes these properties are considered fee interests. |
| (2) | The Portfolio “As-Is” Value of $1.116 billion reflects a premium attributed to the aggregate value of the Courtyard by Marriott Portfolio as a whole. The sum of the value of each of the properties on an individual basis is $1.041 billion |
| (3) | For the purposes of calculating the release price of the properties, no debt was allocated to three of the Third Party Ground Lease Properties (the “Short Term Ground Lease Properties”). The Short Term Ground Lease Properties are subject to ground leases with remaining terms of less than 30 years as of the closing date of the Courtyard by Marriott Portfolio Loan. For purposes of calculating the release price for the Short Term Ground Lease Properties, the allocated loan amount for each property will be 62.5% of the “as is” appraised value at closing. |
THE INFORMATION IN THIS STRUCTURAL AND COLLATERAL TERM SHEET IS NOT COMPLETE AND MAY BE AMENDED PRIOR TO THE TIME OF SALE. THIS TERM SHEET IS NOT AN OFFER TO SELL THESE SECURITIES AND IT IS NOT A SOLICITATION OF AN OFFER TO BUY THESE SECURITIES IN ANY JURISDICTION WHERE THE OFFER OR SALE IS NOT PERMITTED.
35
Various | Collateral Asset Summary – Loan No. 2 Courtyard by Marriott Portfolio | Cut-off Date Balance: Cut-off Date LTV: U/W NCF DSCR: U/W NOI Debt Yield: | $100,000,000 28.2% 7.40x 32.7% |
All 65 hotels in the Courtyard by Marriott Portfolio are operated under a master management agreement with Courtyard Management Corporation, a wholly owned subsidiary of Marriott International, Inc. The hotels range in age from 25 to 30 years old with an average room count of 148. Approximately $318.7 million ($33,231 per room) of capital expenditures have been made since 2005 in order to update the portfolio and to maintain competitiveness within each asset’s market. All of the hotels have undergone guestroom case good renovations from 2003 to 2006 and have completed public area renovations and guestroom soft good upgrades from 2009-2015. The hotels are typically renovated every six to seven years and each of the hotels has completed an average of $4.9 million in capital expenditures since acquisition.
Historical Capital Expenditures(1) | |||||||||||||
| 2005-2010 | 2011 | 2012 | 2013 | 2014 | Total | ||||||||
| Total | $173,248,162 | $28,953,904 | $40,036,525 | $45,554,925 | $30,893,045 | $318,686,561 | |||||||
| Per Room | $18,066 | $3,019 | $4,175 | $4,750 | $3,221 | $33,231 | |||||||
| (1) Source: borrower. | |||||||||||||
The Courtyard by Marriott Portfolio is located across 29 states and no one region accounts for more than 26.1% of the portfolio’s total rooms or 27.4% of underwritten net cash flow. California represents the largest exposure to a single state, with eight assets totaling 12.3% of the portfolio’s total room count and 22.9% of underwritten net cash flow. No other state accounts for more than 8.9% of total underwritten net cash flow; which is represented by the seven properties in Illinois.
| Regional Breakdown | |||||||||||||||||||||
| Region | # Hotels | Rooms | % Rooms | Occupancy(1) | ADR(1) | RevPAR(1) | RevPAR Penetration (1) | Individual UW NCF(2) | % UW NCF | ||||||||||||
| Pacific West | 10 | 1,480 | 15.4% | 77.1% | $144.77 | $112.27 | 134.2% | $24,250,200 | 27.4% | ||||||||||||
| Midwest | 17 | 2,496 | 26.0% | 67.3% | $107.46 | $72.32 | 118.1% | $19,268,431 | 21.7% | ||||||||||||
| Southeast | 17 | 2,501 | 26.1% | 71.0% | $105.22 | $75.13 | 115.8% | $19,091,268 | 21.5% | ||||||||||||
| Northeast | 5 | 734 | 7.7% | 70.8% | $132.61 | $94.31 | 118.9% | $7,317,918 | 8.3% | ||||||||||||
| Mid-Atlantic | 6 | 889 | 9.3% | 66.4% | $118.44 | $79.00 | 117.9% | $7,031,949 | 7.9% | ||||||||||||
| Mountain West | 3 | 450 | 4.7% | 70.8% | $126.51 | $90.85 | 129.4% | $5,954,053 | 6.7% | ||||||||||||
| Southwest | 7 | 1,040 | 10.8% | 66.4% | $95.16 | $63.26 | 121.3% | $5,707,226 | 6.4% | ||||||||||||
| Total / Wtd. Avg. | 65 | 9,590 | 100.0% | 70.0% | $115.14 | $81.41 | 120.9% | $88,621,045 | 100.0% | ||||||||||||
| (1) | Occupancy, ADR, RevPAR and RevPAR Penetration are based on a February 2015 Hospitality Research Report. |
| (2) | UW NCF is exclusive of an approximately $1.4 million incentive management fee, which is calculated on a portfolio basis. |
Additionally, no hotel contributes more than 4.7% of total underwritten net cash flow and the top ten assets account for only 15.5% of the portfolio by room count and 30.9% of underwritten net cash flow. A breakout of the top ten Courtyard by Marriott Portfolio Properties by underwritten net cash flow is shown below.
Top Ten Properties by U/W NCF | |||||||
| Hotel Name | Rooms | % of Total Room | Individual UW NCF(1) | % of Total UW NCF | “As Is” Value(2) | Per Room | |
| Courtyard San Mateo Foster City | 147 | 1.5% | $4,164,236 | 4.7% | $40,500,000 | $275,510 | |
| Courtyard Larkspur Landing Marin County | 146 | 1.5% | $3,709,578 | 4.2% | $41,000,000 | $280,822 | |
| Courtyard Boulder | 149 | 1.6% | $3,254,133 | 3.7% | $35,000,000 | $234,899 | |
| Courtyard San Jose Cupertino | 149 | 1.6% | $3,202,254 | 3.6% | $36,000,000 | $241,611 | |
| Courtyard Los Angeles Hacienda Heights | 150 | 1.6% | $2,318,551 | 2.6% | $27,500,000 | $183,333 | |
| Courtyard Nashville Airport | 145 | 1.5% | $2,316,930 | 2.6% | $23,000,000 | $158,621 | |
| Courtyard Seattle South Center | 149 | 1.6% | $2,264,027 | 2.6% | $27,000,000 | $181,208 | |
| Courtyard Philadelphia Devon | 149 | 1.6% | $2,140,790 | 2.4% | $18,500,000 | $124,161 | |
| Courtyard Charlotte South Park | 149 | 1.6% | $2,049,150 | 2.3% | $19,000,000 | $127,517 | |
| Courtyard Los Angeles Torrance Palos Verdes | 149 | 1.6% | $1,977,240 | 2.2% | $21,000,000 | $140,940 | |
| Subtotal | 1,482 | 15.5% | $27,396,888 | 30.9% | $288,500,000 | $194,669 | |
| Remaining Hotels | 8,108 | 84.5% | $61,224,158 | 69.1% | $752,500,000 | $92,810 | |
| Total | 9,590 | 100.0% | $88,621,045 | 100.0% | $1,041,000,000 | $108,551 | |
| Total w/ Portfolio Premium | $1,116,000,000 | $116,371 | |||||
(1) | UW NCF is exclusive of an approximately $1.4 million incentive management fee, which is calculated on a portfolio basis. |
| (2) | The Portfolio “As-Is” Value of $1.116 billion reflects a premium attributed to the aggregate value of the Courtyard by Marriott Portfolio as a whole. The sum of the value of each of the properties on an individual basis is $1.041 billion. |
THE INFORMATION IN THIS STRUCTURAL AND COLLATERAL TERM SHEET IS NOT COMPLETE AND MAY BE AMENDED PRIOR TO THE TIME OF SALE. THIS TERM SHEET IS NOT AN OFFER TO SELL THESE SECURITIES AND IT IS NOT A SOLICITATION OF AN OFFER TO BUY THESE SECURITIES IN ANY JURISDICTION WHERE THE OFFER OR SALE IS NOT PERMITTED.
36
Various | Collateral Asset Summary – Loan No. 2 Courtyard by Marriott Portfolio | Cut-off Date Balance: Cut-off Date LTV: U/W NCF DSCR: U/W NOI Debt Yield: | $100,000,000 28.2% 7.40x 32.7% |
Environmental Matters. The Phase I environmental reports dated March 30, 2015 recommended further action at two of the Courtyard by Marriott Portfolio properties: The Courtyard Norwalk and the Courtyard Lincroft Red Bank. At the Courtyard Norwalk property, a phase II subsurface investigation was recommended to investigate the historical usage of underground storage tanks related to a gas station that was previously located at the property. The Phase II investigation was completed on April 7, 2015 and no further action is recommended at the property. At the Courtyard Lincroft Red Bank property, three groundwater monitoring wells were found and the Phase I environmental report recommended further documentation regarding the wells be obtained and a well abandonment be undertaken. As of April 5, 2015 the groundwater monitoring wells were removed and no further action or investigation is recommended at the property. Accordingly, the $504,100 initially held in the remediation reserve has been released to the borrowers.
The Market. The Courtyard by Marriott Portfolio has broad exposure to the hospitality industry across the United States with properties located in 29 different states covering each major region of the country. Over the past several years, the U.S. hotel industry has continued its recovery from the downturn of 2008-2009. In 2014, the U.S. hotel industry enjoyed its greatest growth in RevPAR since 2005. According to a hospitality research report, RevPAR increased 8.3% for the year, the result of a 3.6% gain in occupancy and a 4.6% increase in ADR. Furthermore, demand growth outpaced supply with a 4.4% increase over the course of the year compared to a below average 0.9% increase in supply.
The Courtyard by Marriott brand is classified as an upscale select service brand. From 2010 to 2014, ADR and RevPAR for the select service segment increased at compounded average annual growth rates of 4.2% and 6.9% respectively. Over that same time period, demand increased at a compound average annual growth rate of 5.4%. The pace of RevPAR growth is expected to slow as peak occupancy levels are realized in certain markets both this year and the next. Supply growth is expected to begin to outpace demand increases in late 2016 and early 2017. According to the appraisal, 113,000 new rooms are under construction as of October 2014, compared to 91,000 rooms as of December 2013 and 86,000 rooms as of October 2013.
In line with the larger U.S. hotel industry, the Courtyard by Marriott Portfolio has rebounded from declines in 2009 and 2010. RevPAR and net cash flow are up 38.5% and 73.5%, respectively, over the portfolio’s 2009 trough. RevPAR has consistently improved since 2009 with annual increases of 3.2%, 7.4%, 5.3%, 4.6% and 11.5% from 2010-2014, respectively.
The appraiser identified several recent sales of hotel portfolios it considered to be comparable to the Courtyard by Marriott Portfolio which are summarized in the chart below.
Sales Comparison(1) | |||||||||||||||
| Portfolio Name | Date of Sale | Price(2) | # of Hotels | # of Rooms | Price/Room | Cap Rate | Buyer / Seller | ||||||||
| Courtyard by Marriott Portfolio | NAP | $1,116,000,000 | 65 | 9,590 | $116,371 | 7.8% | NAP | ||||||||
| Apple REIT Six, Inc. Portfolio | May-13 | $1,077,067,068 | 66 | 7,658 | $140,646 | 7.6% | Blackstone / Apple REIT Six, Inc. | ||||||||
| Inland American Real Estate Trust, Inc | Nov-14 | $1,032,000,000 | 48 | 6,401 | $161,225 | 6.9% | Chatham Lodging Trust/NorthStar / Inland American REIT, Inc. | ||||||||
| CBM One Hotels Portfolio | Sep-14 | $656,000,000 | 40 | 5,832 | $112,483 | NAV | NorthStar Realty Finance / Clarion Partners | ||||||||
| Hyatt Hotels Portfolio | Nov-14 | $590,000,000 | 38 | 4,959 | $118,976 | 6.3% | Lone Star Funds / Hyatt Hotels | ||||||||
| MCR Texas Western Portfolio | Oct-13 | $430,000,000 | 26 | 3,348 | $128,435 | NAV | MCR Development, LLC / Texas Western Hospitality | ||||||||
| (1) | Source: Appraisal. |
| (2) | Price for the Courtyard by Marriott Portfolio reflects the “As Is” appraised value inclusive of the portfolio premium attributed aggregate value of the Courtyard by Marriott Portfolio as a whole. The sum of the value of each of the properties on an individual basis is $1.041 billion. |
THE INFORMATION IN THIS STRUCTURAL AND COLLATERAL TERM SHEET IS NOT COMPLETE AND MAY BE AMENDED PRIOR TO THE TIME OF SALE. THIS TERM SHEET IS NOT AN OFFER TO SELL THESE SECURITIES AND IT IS NOT A SOLICITATION OF AN OFFER TO BUY THESE SECURITIES IN ANY JURISDICTION WHERE THE OFFER OR SALE IS NOT PERMITTED.
37
Various | Collateral Asset Summary – Loan No. 2 Courtyard by Marriott Portfolio | Cut-off Date Balance: Cut-off Date LTV: U/W NCF DSCR: U/W NOI Debt Yield: | $100,000,000 28.2% 7.40x 32.7% |
Cash Flow Analysis.
| Cash Flow Analysis | |||||||||||||
| 2012 | 2013 | 2014 | T-12 2/28/2015 | U/W | U/W per Room(1) | ||||||||
| Occupancy | 65.8% | 66.0% | 69.5% | 70.0% | 70.0% | ||||||||
| ADR | $104.21 | $108.68 | $115.08 | $116.31 | $116.31 | ||||||||
| RevPAR | $68.58 | $71.74 | $80.02 | $81.42 | $81.42 | ||||||||
| Room Revenue | $239,391,188 | $253,184,871 | $280,101,273 | $284,991,726 | $284,991,726 | $29,718 | |||||||
| F&B Revenue | 18,530,388 | 20,913,301 | 22,580,700 | 22,708,342 | 22,708,342 | 2,368 | |||||||
| Other Revenue | 4,361,274 | 4,317,533 | 5,206,313 | 5,378,285 | 5,378,285 | 561 | |||||||
| Total Revenue | $262,282,851 | $278,415,705 | $307,888,286 | $313,078,352 | $313,078,352 | $32,646 | |||||||
| Operating Expenses | 77,974,425 | 80,163,388 | 84,356,326 | 84,916,737 | 84,916,737 | 8,855 | |||||||
| Undistributed Expenses | 71,514,979 | 74,869,533 | 79,945,869 | 80,970,799 | 80,970,799 | 8,443 | |||||||
| Gross Operating Profit | $112,793,447 | $123,382,784 | $143,586,092 | $147,190,815 | $147,190,815 | $15,348 | |||||||
| Management Fee | 21,612,107 | 22,579,514 | 24,877,374 | 25,266,908 | 25,266,908 | 2,635 | |||||||
Incentive Management Fee(2) | 0 | 0 | 961,267 | 1,416,328 | 1,416,328 | 148 | |||||||
| Total Fixed Charges | 26,829,721 | 28,316,616 | 29,425,460 | 29,580,660 | 30,891,214 | 3,221 | |||||||
Affiliate Ground Lease Add Back(3) | 11,748,997 | 12,213,053 | 12,824,395 | 12,876,484 | 13,242,269 | 1,381 | |||||||
| Net Operating Income | $76,100,616 | $84,699,708 | $101,146,386 | $103,803,403 | $102,858,635 | $10,726 | |||||||
| FF&E | 13,114,142 | 13,920,785 | 15,394,415 | 15,653,918 | 15,653,918 | 1,632 | |||||||
| Net Cash Flow | $62,986,473 | $70,778,922 | $85,751,972 | $88,149,485 | $87,204,717 | $9,093 | |||||||
| (1) | U/W per Room is based on a total of 9,590 rooms. |
| (2) | The Incentive Management Fee, which is calculated at a portfolio level only, is equal to 15% of operating profit in excess of the tier 1 owner’s priority plus 5% of operating profit in excess of the tier 2 owner’s priority. Tier 1 and tier 2 owner’s priority are each 9.5% of the tier 1 and tier 2 owner’s investment, initially $599,924,000 and $663,073,895 respectively. |
| (3) | The Affiliated Ground Lease Add Back accounts for the ground lease payments on the Affiliated Ground Lease Properties. |
Property Management. The Courtyard by Marriott Portfolio is managed by Courtyard Management Corporation, a wholly owned subsidiary of Marriott International, Inc.
Lockbox / Cash Management. The Courtyard by Marriott Portfolio is structured with a soft springing hard lockbox and in place cash management. So long as the properties in the Courtyard by Marriott Portfolio continue to be Courtyard Managed Properties (as defined herein), all amounts payable by the manager to the borrowers under the courtyard management agreement, including, but not limited to, operating profit payable under the Courtyard by Marriott Portfolio management agreement, related party ground rent and tax remittances, will be transmitted by the manager into a clearing account established and maintained by the borrowers and controlled by the lender. In the event that any property becomes a Non-Courtyard Managed Property (as defined herein), the borrowers will direct all rents and other payments to be deposited directly into the clearing account controlled by the lender. All funds in the clearing account are swept daily to a lender controlled deposit account and disbursed in accordance with the Courtyard by Marriott Portfolio Loan documents. Provided no Trigger Period (as defined herein) is continuing, excess cash in the deposit account will be disbursed to the manager and the borrowers in accordance with the Courtyard by Marriott Portfolio Loan documents.
The “Courtyard Managed Properties” means at any time, all individual properties with respect to which the Courtyard by Marriott Portfolio management agreement is in full force and effect and has not been terminated, cancelled, surrendered of rejected.
The “Non-Courtyard Managed Properties” means any individual property that is not a Courtyard Managed Property.
A “Trigger Period” will exist (i) during the continuance of an event of default or (ii) if the debt yield falls below 9.50%, and will end if the debt yield is at least 9.75% for two consecutive calculation dates.
Initial Reserves. At closing, the borrowers deposited (i) $409,063 into a required reserve account and (ii) $504,100 into an environmental reserve account for remediation of environmental issues identified at the Courtyard Norwalk and Courtyard Lincroft Red Bank properties. As of April 21, 2014, the environmental issues at the Courtyard by Marriott Portfolio properties have been remediated and the environmental reserve was released to the borrowers.
THE INFORMATION IN THIS STRUCTURAL AND COLLATERAL TERM SHEET IS NOT COMPLETE AND MAY BE AMENDED PRIOR TO THE TIME OF SALE. THIS TERM SHEET IS NOT AN OFFER TO SELL THESE SECURITIES AND IT IS NOT A SOLICITATION OF AN OFFER TO BUY THESE SECURITIES IN ANY JURISDICTION WHERE THE OFFER OR SALE IS NOT PERMITTED.
38
Various | Collateral Asset Summary – Loan No. 2 Courtyard by Marriott Portfolio | Cut-off Date Balance: Cut-off Date LTV: U/W NCF DSCR: U/W NOI Debt Yield: | $100,000,000 28.2% 7.40x 32.7% |
Ongoing Reserves. On a monthly basis, the borrowers are required to make deposits of (i) 1/12 of the required annual taxes, which currently equates to $985,000 into a tax reserve account, (ii) 1/12 of the required annual insurance premiums into an insurance reserve account, (iii) an amount equal to the greater of (a) 5.0% of the gross rents for the prior month and (b) the amount required by the manager or any franchisor under the courtyard management agreement into an FF&E reserve account and (iv) an amount equal to the monthly third party ground rents payable into a ground rent reserve account. Deposits into the ongoing reserve accounts will be waived (i) with respect to the insurance reserve, so long as the manager maintains the insurance required under the courtyard management agreement, (ii) with respect to the FF&E reserve account, so long as the manager deposits the amount the borrowers are otherwise required to deposit with respect to the Courtyard Managed Properties into a separate FF&E reserve account owned by the borrowers and pledged to the lender and (iii) with respect to the ground rent reserve, so long as any Third Party Ground Leased Properties continue to be Courtyard Managed Properties and the manager is paying the third party ground rent due under the third party ground leases.
Current Mezzanine or Subordinate Indebtedness. The Courtyard by Marriott Portfolio Loan is split into the Courtyard by Marriott Portfolio Senior Tranche and the Courtyard by Marriott Portfolio Junior Tranche. The Courtyard by Marriott Junior Tranche is evidenced by the controlling Note B with an original principle balance of $355.0 million. The Note B is co-terminus with pari passu Notes A-1, A2-A, A2-B and A2-C and has an interest rate of 3.6900%. The Note A-1 and Note B will be included in the COMM 2015-CCRE23 trust as a non-pooled component.
Future Mezzanine or Subordinate Indebtedness Permitted. None.
Partial Release. Any time after the expiration of the defeasance lockout period (or after the twelfth monthly payment date with respect to the first $33,500,000 of release prices), the borrowers may obtain the release of an individual property upon a bona fide third-party sale provided, among other things, (i) the DSCR for the remaining properties is not less than the greater of the DSCR immediately preceding the partial release and the closing date DSCR, (ii) the debt yield for the remaining properties is not less than the greater of the debt yield immediately preceding the partial release and the closing date debt yield, (iii) borrowers prepay or partially defease (as applicable) 115.0% of the allocated loan amount for the released property (or for the three properties that have no allocated loan amount, 62.5% of the appraised value of such properties) and (iv) such release will comply with REMIC requirements. After the twelfth monthly payment date, the borrowers may prepay a portion of the outstanding principal balance in connection with a property release, not to exceed aggregate release prices of $33,500,000, without payment of a prepayment premium, penalty or fee. All prepayments are applied entirely to Note A-1, and all defeasances are applied pro rata and pari passu among Notes A-2A, A-2B, A-2C and B.
Substitution. None.
Ground Leases. Seven of the Courtyard by Marriott Portfolio Properties, representing 14.8% of underwritten net cash flow, are subject to ground leases held by a third party entity As described below.
Courtyard San Jose Cupertino: The property is subject to a ground lease that has an initial maturity date of December 30, 2033. The ground lease is subject to rent increases every five years equal to the greater of (i) 75% of the CPI percentage increase over that five year period or (ii) 6% of annual gross revenue at the property. The ground lease has three 10-year extension options.
Courtyard Charlotte South Park: The property is subject to a ground lease that has an initial maturity date of December 31, 2019. The ground lease has an annual rent of the greater of (i) $352,051 or (ii) 6% of annual gross revenue at the property. The ground lease has three 10-year extension options.
Courtyard Norwalk: The property is subject to a ground lease that has an initial maturity date of December 29, 2023. The ground lease is subject to rent increases every five years equal to the greater of (i) the prevailing rental rate increased by 15% or (ii) the prevailing rental rate increased by 60% of the percentage increase in CPI since the opening date of the hotel. The ground lease has eight 5-year extension options.
Courtyard Tampa Westshore: The property is subject to a ground lease that has an initial maturity date of June 30, 2068. The ground lease is subject to rent increases of 5% every ten years. There are no extension options for this lease.
Courtyard Philadelphia Devon: The property is subject to a ground lease that has an initial maturity date of January, 1 2018. The ground lease has an annual rent of the greater of (i) $240,000 or (ii) 4.25% of annual gross revenue at the property. The ground lease has two 10-year extension options.
Courtyard Fresno: The property is subject to a ground lease that has a maturity date of June 30, 2024. The ground lease is subject to annual rent increases of the greater of (i) 3% over the previous year’s minimum rent or (ii) 6% of annual gross revenue. There are no extension options for this lease.
Courtyard Poughkeepsie: The property is subject to a ground lease with an initial maturity date of December 29, 2018. The ground lease has an annual rent of the greater of (i) $110,000 or (ii) 3.5% of annual gross revenue. The ground lease has three 5-year extension options.
THE INFORMATION IN THIS STRUCTURAL AND COLLATERAL TERM SHEET IS NOT COMPLETE AND MAY BE AMENDED PRIOR TO THE TIME OF SALE. THIS TERM SHEET IS NOT AN OFFER TO SELL THESE SECURITIES AND IT IS NOT A SOLICITATION OF AN OFFER TO BUY THESE SECURITIES IN ANY JURISDICTION WHERE THE OFFER OR SALE IS NOT PERMITTED.
39
Various | Collateral Asset Summary – Loan No. 2 Courtyard by Marriott Portfolio | Cut-off Date Balance: Cut-off Date LTV: U/W NCF DSCR: U/W NOI Debt Yield: | $100,000,000 28.2% 7.40x 32.7% |
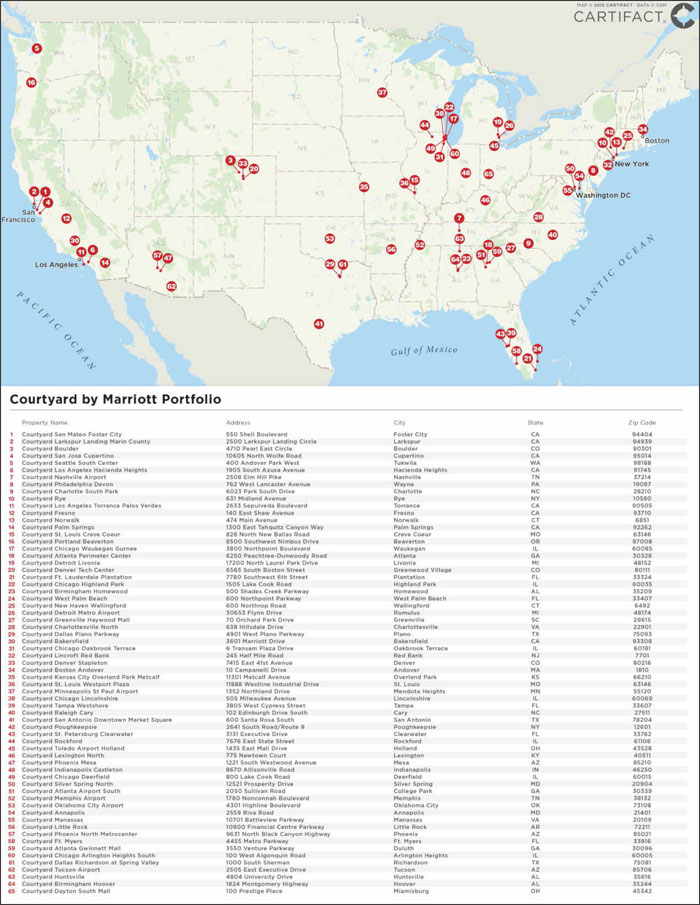
THE INFORMATION IN THIS STRUCTURAL AND COLLATERAL TERM SHEET IS NOT COMPLETE AND MAY BE AMENDED PRIOR TO THE TIME OF SALE. THIS TERM SHEET IS NOT AN OFFER TO SELL THESE SECURITIES AND IT IS NOT A SOLICITATION OF AN OFFER TO BUY THESE SECURITIES IN ANY JURISDICTION WHERE THE OFFER OR SALE IS NOT PERMITTED.
40
(THIS PAGE INTENTIONALLY LEFT BLANK)
41
| Various | Collateral Asset Summary – Loan 3 DFW / Raleigh Portfolio | Cut-off Date Balance: Cut-off Date LTV: U/W NCF DSCR: U/W NOI Debt Yield: | $95,800,000 74.4% 1.31x 8.4% |
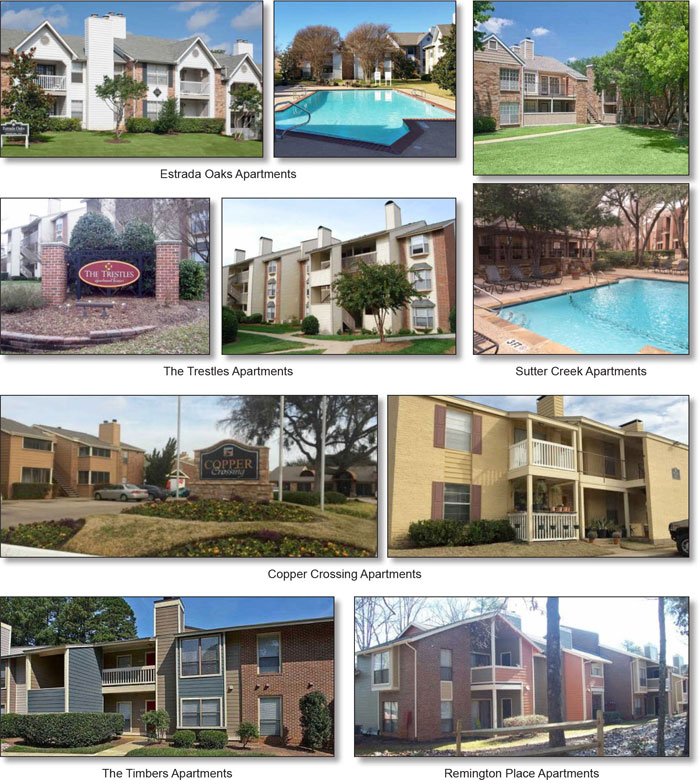
THE INFORMATION IN THIS STRUCTURAL AND COLLATERAL TERM SHEET IS NOT COMPLETE AND MAY BE AMENDED PRIOR TO THE TIME OF SALE. THIS TERM SHEET IS NOT AN OFFER TO SELL THESE SECURITIES AND IT IS NOT A SOLICITATION OF AN OFFER TO BUY THESE SECURITIES IN ANY JURISDICTION WHERE THE OFFER OR SALE IS NOT PERMITTED.
42
| Various | Collateral Asset Summary – Loan 3 DFW / Raleigh Portfolio | Cut-off Date Balance: Cut-off Date LTV: U/W NCF DSCR: U/W NOI Debt Yield: | $95,800,000 74.4% 1.31x 8.4% |
| Mortgage Loan Information | |
| Loan Seller: | GACC |
| Loan Purpose: | Acquisition |
| Sponsor: | Franck A. Ruimy |
| Borrower: | 3Mind Copper Crossing, LLC; 3Mind Estrada Oaks, LLC; 3Mind Remington Place, LLC; 3Mind Sutter Creek, LLC; 3Mind Timbers, LLC; 3Mind Trestles, LLC; DFWRA Atlantic LLC; DFWRA Moezinia LLC; DFWRA Single, LLC |
| Original Balance: | $95,800,000 |
| Cut-off Date Balance: | $95,800,000 |
| % by Initial UPB: | 7.0% |
| Interest Rate: | 4.4300% |
| Payment Date: | 6th of each month |
| First Payment Date: | May 6, 2015 |
| Maturity Date: | April 6, 2025 |
| Amortization: | Interest only for first 36 months; 360 months thereafter |
| Additional Debt: | None |
| Call Protection: | L(25), D(91), O(4) |
| Lockbox / Cash Management: | Springing Soft / Springing |
Reserves(1) | ||
| Initial | Monthly | |
| Taxes: | $459,792 | $113,517 |
| Insurance: | $5,103 | $5,103 |
| Required Repairs: | $135,250 | NAP |
| Replacement: | $0 | $38,667 |
| Capital Expenditure Holdback: | $9,475,083 | NAP |
| Financial Information | |
| Cut-off Date Balance / Unit: | $51,616 |
| Balloon Balance / Unit: | $45,112 |
| Cut-off Date LTV: | 74.4% |
| Balloon LTV: | 65.0% |
Underwritten NOI DSCR(2): | 1.39x |
Underwritten NCF DSCR(2): | 1.31x |
| Underwritten NOI Debt Yield: | 8.4% |
| Underwritten NCF Debt Yield: | 7.9% |
| Underwritten NOI Debt Yield at Balloon: | 9.6% |
| Underwritten NCF Debt Yield at Balloon: | 9.0% |
Property Information | |
| Single Asset / Portfolio: | Portfolio of six properties |
| Property Type: | Garden Multifamily |
| Collateral: | Fee Simple |
| Location: | Various |
| Year Built / Renovated: | Various |
| Total Units: | 1,856 |
| Property Management: | Vesta Management Services, LLC |
| Underwritten NOI: | $8,019,354 |
| Underwritten NCF: | $7,555,354 |
“As Complete” Appraised Value(3): | $128,800,000 |
| “As Complete” Appraisal Date: | Various |
| Historical NOI | |
| Most Recent NOI: | $7,766,471 (T-12 January 31, 2015) |
| 2014 NOI: | $7,662,611 (December 31, 2014) |
| 2013 NOI: | $7,225,998 (December 31, 2013) |
| 2012 NOI: | $6,350,800 (December 31, 2012) |
| Historical Occupancy | |
| Most Recent Occupancy: | 94.8% (January – February 2015) |
| 2014 Occupancy: | 94.6% (December 31, 2014) |
| 2013 Occupancy: | 94.7% (December 31, 2013) |
| 2012 Occupancy: | 91.1% (December 31, 2012) |
| (1) | See “Initial Reserves” and “Ongoing Reserves” herein. |
| (2) | Based on amortizing debt service payments. Based on the current interest only payments, the Underwritten NOI DSCR and Underwritten NCF DSCR are 1.86x and 1.76x, respectively. |
| (3) | The “As Complete” appraised value accounts for planned renovations being performed at each property. At closing, the full cost of the renovations, approximately $9.5 million, was held back by the lender. Based on the “As-is” Appraised value of $117,500,000, the Cut-off Date LTV for the loan is 81.5%. For further information regarding planned capital expenditures as the properties see “The Property” herein. |
| Property Summary | ||||||
| Property Name | Location | Units | Year Built / Renovated | Allocated Loan Amount | “As Complete” Appraised Value | Occupancy(1) |
| Sutter Creek Apartments | Arlington, TX | 616 | 1984 / NAP | $28,125,000 | $37,500,000 | 94.2% |
| Copper Crossing Apartments | Benbrook, TX | 400 | 1982 / 2006 | $16,550,000 | $22,100,000 | 94.0% |
| Estrada Oaks Apartments | Irving, TX | 248 | 1983 / NAP | $14,750,000 | $20,100,000 | 96.8% |
| The Trestles Apartments | Raleigh, NC | 280 | 1985 / 2015 | $13,750,000 | $18,700,000 | 93.2% |
| Remington Place Apartments | Raleigh, NC | 136 | 1987 / 2015 | $11,475,000 | $15,400,000 | 96.3% |
| The Timbers Apartments | Raleigh, NC | 176 | 1986 / 2015 | $11,150,000 | $15,000,000 | 97.7% |
| Total / Wtd. Avg. | 1,856 | $95,800,000 | $128,800,000 | 94.8% | ||
| (1) | Based on January and February 2015 borrower rent rolls. |
THE INFORMATION IN THIS STRUCTURAL AND COLLATERAL TERM SHEET IS NOT COMPLETE AND MAY BE AMENDED PRIOR TO THE TIME OF SALE. THIS TERM SHEET IS NOT AN OFFER TO SELL THESE SECURITIES AND IT IS NOT A SOLICITATION OF AN OFFER TO BUY THESE SECURITIES IN ANY JURISDICTION WHERE THE OFFER OR SALE IS NOT PERMITTED.
43
| Various | Collateral Asset Summary – Loan 3 DFW / Raleigh Portfolio | Cut-off Date Balance: Cut-off Date LTV: U/W NCF DSCR: U/W NOI Debt Yield: | $95,800,000 74.4% 1.31x 8.4% |
The Loan. The DFW / Raleigh Portfolio loan (the “DFW / Raleigh Portfolio Loan”) is a fixed rate loan secured by the borrowers’ fee simple interest as tenants-in-common in a 1,856 unit multifamily portfolio located in Raleigh, North Carolina and the Dallas/Fort Worth area of Texas (the “DFW / Raleigh Portfolio”) with an original principal balance of $95.8 million. The DFW / Raleigh Portfolio Loan has a 10-year term and amortizes on a 30-year schedule after an initial 36-month interest only period. The DFW / Raleigh Portfolio Loan accrues interest at a fixed rate of 4.4300% and has a cut-off date balance of $95.8 million. The DFW / Raleigh Portfolio Loan proceeds, along with approximately $26.7 million of sponsor equity, were used to acquire the DFW / Raleigh Portfolio for $110.5 million, fund reserves of approximately $10.1 million and pay closing costs of approximately $1.9 million. Based on the “As Complete” appraised value of $128.8 million, the cut-off date LTV is 74.4%. The most recent prior financing of the DFW / Raleigh Portfolio was not included in a securitization.
| Sources and Uses | |||||||||
| Sources | Proceeds | % of Total | Uses | Proceeds | % of Total | ||||
| Loan Amount | $95,800,000 | 78.2% | Purchase Price | $110,500,000 | 90.2% | ||||
| Sponsor Equity | $26,690,183 | 21.8% | Reserves | $10,075,228 | 8.2% | ||||
| Closing Costs | $1,914,956 | 1.6% | |||||||
| Total Sources | $122,490,183 | 100.0% | Total Uses | $122,490,183 | 100.0% | ||||
The Borrower / Sponsor. The borrowers, 3Mind Copper Crossing, LLC (“Copper Crossing Borrower”), 3Mind Estrada Oaks, LLC (“Estrada Oaks Borrower”), 3Mind Remington Place, LLC (“Remington Place Borrower”), 3Mind Sutter Creek, LLC (“Sutter Creek Borrower”), 3Mind Timbers, LLC (“Timbers Borrower”), 3Mind Trestles, LLC (“Trestles Borrower”; and together with Copper Crossing Borrower, Estrada Oaks Borrower, Remington Place Borrower, Sutter Creek Borrower and Timbers Borrower, collectively, the “3Mind Borrowers” and each a “3Mind Borrower”), DFWRA Atlantic LLC (“Atlantic Borrower”), DFWRA Moezinia LLC (“Moezinia Borrower”) and DFWRA Single, LLC (“Single Borrower”; and together with Atlantic Borrower and Moezinia Borrower, collectively, the “Core TIC Group”), are each newly formed Delaware limited liability companies. The six mortgaged properties in the portfolio are each owned by the Core TIC Group and a single 3Mind Borrower as tenants-in-common. Each borrower is managed by Franck A. Ruimy. Franck A. Ruimy is the sponsor of each of the 3Mind Borrowers, the manager of each of the borrowers and the non-recourse carve-out guarantor for the DFW / Raleigh Portfolio Loan.
Franck Ruimy has 22 years of experience in real estate investment, finance and asset management in North America and Europe. Mr. Ruimy is the chief executive officer of Aerium Group, a European real estate investment manager that acquires, owns and manages portfolios of commercial properties for investment funds. Founded in 1988, Aerium is headquartered in Luxembourg and has offices in London, Geneva, Paris, Düsseldorf and Istanbul. Aerium currently manages over €6.1 billion in property assets across 12 countries. Mr. Ruimy also served as Director of several of Aerium’s subsidiaries since 1992 and led the 2003 launch of its pan-European investment platform. Mr. Ruimy’s real estate schedule of US assets includes nine rental homes/condos located in New York, NY as well as a big box anchored retail center in Paradise Valley, AZ.
The Properties. The DFW / Raleigh Portfolio consists of six Class B garden-style apartment complexes, three of which are located in Raleigh North Carolina and three of which are located in the Dallas/Fort Worth area of Texas (in Benbrook, Irving, and Arlington). Built between 1982 and 1987, the properties have been well maintained and the borrowers indicated that they intend to invest $9,475,083 (exclusive of deferred maintenance expenditures) in capital improvements to renovate and update each of the DFW / Raleigh Portfolio properties. The planned capital improvements at the properties provide for $2,500/unit in interior renovations to update each unit with plank flooring, stained/painted cabinets, resurfaced countertops, new appliances, carpet, light fixtures, 2 inch faux-wood blinds, plumbing hardware, fresh paint and accent walls. The majority of the remaining capital expenditure budget will be used for exterior upgrades and new siding. The entirety of the capital expenditure budget was held back by the lender at closing. A summary of each property is below.
Sutter Creek Apartments is a 616-unit Class B garden-style apartment complex located at 2216 Plum Lane in Arlington, Texas. Built in 1984, the property contains 32, two and three-story residential buildings, a single-story clubhouse, two laundry facilities and two mail kiosks. The property has a total of 1,090 open surface parking spaces which equates to a parking ratio of 1.77 spaces per unit. As of February 25, 2015, Sutter Creek Apartments was 94.2% occupied.
Amenities at the property consist of an on-site leasing office, clubhouse, two swimming pools, two laundry facilities, a business center, a fitness center, a grilling area and controlled access gates. Unit amenities feature carpeting and wood laminate flooring, a standard kitchen appliance package, storage, fireplace, laundry connections (select units), walk-in closets, and a patio/balcony. The property currently has 144 upgraded units which include a black appliance package with a built-in microwave, faux-wood flooring, and 2” faux-wood blinds.
THE INFORMATION IN THIS STRUCTURAL AND COLLATERAL TERM SHEET IS NOT COMPLETE AND MAY BE AMENDED PRIOR TO THE TIME OF SALE. THIS TERM SHEET IS NOT AN OFFER TO SELL THESE SECURITIES AND IT IS NOT A SOLICITATION OF AN OFFER TO BUY THESE SECURITIES IN ANY JURISDICTION WHERE THE OFFER OR SALE IS NOT PERMITTED.
44
| Various | Collateral Asset Summary – Loan 3 DFW / Raleigh Portfolio | Cut-off Date Balance: Cut-off Date LTV: U/W NCF DSCR: U/W NOI Debt Yield: | $95,800,000 74.4% 1.31x 8.4% |
| Unit Mix Summary – Sutter Creek Apartments(1) | ||||||||||||||||||
| Unit Type | # of Units | Unit Size (Sq. Ft.) | % of Total Units | Occupied Units | Occupancy Rate | Avg. Monthly Rental Rate | Avg. Monthly Rental Rate PSF | Monthly Market Rental Rate(2) | Monthly Market Rate PSF(2) | |||||||||
| 1 Bed / 1 Bath | 144 | 518 | 23.4% | 139 | 96.5% | $560 | $1.08 | $615 | $1.19 | |||||||||
| 1 Bed / 1 Bath | 168 | 686 | 27.3% | 158 | 94.0% | $625 | $0.91 | $705 | $1.03 | |||||||||
| 1 Bed / 1 Bath | 120 | 759 | 19.5% | 116 | 96.7% | $641 | $0.84 | $720 | $0.95 | |||||||||
| 2 Bed / 2 Bath | 112 | 867 | 18.2% | 104 | 92.9% | $776 | $0.89 | $820 | $0.95 | |||||||||
| 2 Bed / 2 Bath | 72 | 953 | 11.7% | 63 | 87.5% | $830 | $0.87 | $870 | $0.91 | |||||||||
| Total / Wtd. Avg. | 616 | 725 | 100.0% | 580 | 94.2% | $662 | $0.92 | $727 | $1.00 | |||||||||
| (1) | Source: February 2015 rent roll. |
| (2) | Source: Appraisal. |
Copper Crossing Apartments is a 400-unit Class B garden-style apartment complex located at 5644 Riverwalk Drive in Benbrook, Texas. Built in 1982, the property contains 28, two-story residential buildings, a single-story leasing office/clubhouse and a storage building/laundry facility. The property has 60 covered parking spaces and 562 open surface spaces for a total of 622 spaces and a parking ratio of 1.55 spaces per unit. As of January 26, 2015, Copper Crossing Apartments was 94.0% occupied.
Amenities at the property consist of an on-site leasing office, laundry facilities, volleyball court, fitness center, business center, grilling area, two swimming pools and covered parking. Unit amenities feature a standard appliance package, pantry, ceiling fan(s), patio/balcony, fireplace and walk in closet(s). Select units feature a microwave, crown molding, extra storage and/or washer/dryer connections.
Unit Mix Summary – Copper Crossing Apartments(1) | ||||||||||||||||||
| Unit Type | # of Units | Unit Size (Sq. Ft.) | % of Total Units | Occupied Units | Occupancy Rate | Avg. Monthly Rental Rate | Avg. Monthly Rental Rate PSF | Monthly Market Rental Rate(2) | Monthly Market Rate PSF(2) | |||||||||
| 1 Bed / 1 Bath | 56 | 556 | 14.0% | 55 | 98.2% | $492 | $0.88 | $565 | $1.02 | |||||||||
| 1 Bed / 1 Bath | 40 | 605 | 10.0% | 39 | 97.5% | $500 | $0.82 | $575 | $0.95 | |||||||||
| 1 Bed / 1 Bath | 64 | 645 | 16.0% | 64 | 100.0% | $508 | $0.79 | $600 | $0.93 | |||||||||
| 1 Bed / 1 Bath | 48 | 732 | 12.0% | 47 | 97.9% | $563 | $0.77 | $650 | $0.89 | |||||||||
| 1 Bed / 1 Bath | 32 | 745 | 8.0% | 28 | 87.5% | $599 | $0.80 | $685 | $0.92 | |||||||||
| 1 Bed / 1 Bath | 16 | 845 | 4.0% | 10 | 62.5% | $679 | $0.80 | $700 | $0.83 | |||||||||
| 2 Bed / 2 Bath | 72 | 830 | 18.0% | 67 | 93.1% | $674 | $0.81 | $750 | $0.90 | |||||||||
| 2 Bed / 2 Bath | 32 | 908 | 8.0% | 31 | 96.9% | $651 | $0.72 | $760 | $0.84 | |||||||||
| 2 Bed / 2 Bath | 24 | 931 | 6.0% | 20 | 83.3% | $723 | $0.78 | $775 | $0.83 | |||||||||
| 2 Bed / 2 Bath | 16 | 1,110 | 4.0% | 15 | 93.8% | $816 | $0.74 | $840 | $0.76 | |||||||||
| Total / Wtd. Avg. | 400 | 745 | 100.0% | 376 | 94.0% | $641 | $0.79 | $669 | $0.90 | |||||||||
| (1) | Source: January 2015 rent roll. |
| (2) | Source: Appraisal. |
Estrada Oaks Apartments is a 248-unit, Class B garden-style apartment complex located at 2115 Estrada Parkway in Irving, Texas. Built in 1983, the property contains 21, two-story residential buildings and a single-story leasing office/clubhouse. The property has 412 open surface parking spaces and 80 carports for a total of 485 spaces and a parking ratio of 1.96 spaces per unit. As of January 26, 2015, Estrada Oaks Apartments was 96.8% occupied.
Amenities at the property consist of an on-site leasing office, business center, three laundry rooms, swimming pool, fitness center, playground, tennis court, and grilling areas. Unit amenities feature carpeting and vinyl tile flooring, a standard kitchen appliance package, ceiling fans, fireplace, laundry connections (select units), and patio/balconies. Existing renovated units at the property feature a black appliance package with a built-in microwave, crown molding, re-surfaced countertops, new light fixtures and new cabinetry.
THE INFORMATION IN THIS STRUCTURAL AND COLLATERAL TERM SHEET IS NOT COMPLETE AND MAY BE AMENDED PRIOR TO THE TIME OF SALE. THIS TERM SHEET IS NOT AN OFFER TO SELL THESE SECURITIES AND IT IS NOT A SOLICITATION OF AN OFFER TO BUY THESE SECURITIES IN ANY JURISDICTION WHERE THE OFFER OR SALE IS NOT PERMITTED.
45
| Various | Collateral Asset Summary – Loan 3 DFW / Raleigh Portfolio | Cut-off Date Balance: Cut-off Date LTV: U/W NCF DSCR: U/W NOI Debt Yield: | $95,800,000 74.4% 1.31x 8.4% |
Unit Mix Summary – Estrada Oaks Apartments(1) | ||||||||||||||||||
| Unit Type | # of Units | Unit Size (Sq. Ft.) | % of Total Units | Occupied Units | Occupancy Rate | Avg. Monthly Rental Rate | Avg. Monthly Rental Rate PSF | Monthly Market Rental Rate(2) | Monthly Market Rate PSF(2) | |||||||||
| 1 Bed / 1 Bath | 24 | 480 | 9.7% | 24 | 100.0% | $594 | $1.24 | $660 | $1.38 | |||||||||
| 1 Bed / 1 Bath | 56 | 608 | 22.6% | 55 | 98.2% | $616 | $1.01 | $680 | $1.12 | |||||||||
| 1 Bed / 1 Bath | 80 | 744 | 32.3% | 78 | 97.5% | $692 | $0.93 | $760 | $1.02 | |||||||||
| 2 Bed / 2 Bath | 24 | 886 | 9.7% | 23 | 95.8% | $801 | $0.90 | $880 | $0.99 | |||||||||
| 2 Bed / 2 Bath | 32 | 942 | 12.9% | 30 | 93.8% | $856 | $0.91 | $925 | $0.98 | |||||||||
| 2 Bed / 2 Bath | 32 | 1,081 | 12.9% | 30 | 93.8% | $905 | $0.84 | $995 | $0.92 | |||||||||
| Total / Wtd. Avg. | 248 | 771 | 100.0% | 240 | 96.8% | $723 | $0.97 | $795 | $1.03 | |||||||||
| (1) | Source: January 2015 rent roll. |
| (2) | Source: Appraisal. |
The Trestles Apartments is a 280-unit Class B garden-style apartment complex located 3008 Calvary Drive in Raleigh, North Carolina. Built in 1985, the property contains 19, two and three-story residential buildings and a single-story clubhouse. The property has 425 open surface parking spaces which equates to a parking ratio of 1.5 spaces per unit. As of January 26, 2015, The Trestles Apartments was 93.2% occupied.
Amenities at the property consist of an on-site leasing office, two laundry facilities, two swimming pools, and a picnic area. Unit amenities feature carpeting and vinyl tile flooring, a standard kitchen appliance package, fireplace and patio/balcony. Approximately 108 units have recently undergone full interior upgrades which included a new appliance package, faux wood flooring, new hardware, resurfaced cabinetry and resurfaced countertops.
Unit Mix Summary – The Trestles Apartments(1) | ||||||||||||||||||
| Unit Type | # of Units | Unit Size (Sq. Ft.) | % of Total Units | Occupied Units | Occupancy Rate | Avg. Monthly Rental Rate | Avg. Monthly Rental Rate PSF | Monthly Market Rental Rate(2) | Monthly Market Rate PSF(2) | |||||||||
| 1 Bed / 1 Bath | 96 | 600 | 34.3% | 88 | 91.7% | $601 | $1.00 | $620 | $1.03 | |||||||||
| 1 Bed / 1 Bath | 64 | 749 | 22.9% | 61 | 95.3% | $644 | $0.86 | $705 | $0.94 | |||||||||
| 2 Bed / 1.5 Bath | 80 | 880 | 28.6% | 76 | 95.0% | $742 | $0.84 | $760 | $0.86 | |||||||||
| 2 Bed / 2 Bath | 40 | 1,049 | 14.3% | 36 | 90.0% | $792 | $0.75 | $810 | $0.77 | |||||||||
| Total / Wtd. Avg. | 280 | 778 | 100.0% | 261 | 93.2% | $710 | $1.01 | $707 | $0.90 | |||||||||
| (1) | Source: January 2015 rent roll. |
| (2) | Source: Appraisal. |
Remington Place Apartments is a 136-unit Class B garden-style apartment complex located at 1909 Eyrie Court in Raleigh, North Carolina. Built in 1987, the property contains 13, two-story residential buildings and a single-story clubhouse. The property has 235 open surface parking spaces which equates to a parking ratio of 1.73 spaces per unit. As of January 9, 2015, Remington Place Apartments was 96.3% occupied.
Amenities at the property consist of a clubhouse, leasing office, resident business center, a swimming pool, two dog parks, fitness center, and grilling area. Unit amenities feature carpeting and vinyl tile flooring, a standard kitchen appliance package, ceiling fans, laundry connections (select units), and a patio/balcony. Approximately 45 units underwent a full interior upgrade between 2003 and 2006 including a black appliance package, faux wood flooring, new hardware, cabinetry and resurfaced countertops.
Unit Mix Summary – Remington Place Apartments(1) | ||||||||||||||||||||
| Unit Type | # of Units | Unit Size (Sq. Ft.) | % of Total Units | Occupied Units | Occupancy Rate | Avg. Monthly Rental Rate | Avg. Monthly Rental Rate PSF | Monthly Market Rental Rate(2) | Monthly Market Rate PSF(2) | |||||||||||
| 1 Bed / 1 Bath | 42 | 870 | 30.9% | 41 | 97.6% | $770 | $0.88 | $730 | $0.84 | |||||||||||
| 1 Bed / 1 Bath | 30 | 1,005 | 22.1% | 30 | 100.0% | $803 | $0.80 | $805 | $0.80 | |||||||||||
| 2 Bed / 2 Bath | 40 | 1,254 | 29.4% | 36 | 90.0% | $937 | $0.75 | $965 | $0.77 | |||||||||||
| 2 Bed / 2 Bath | 24 | 1,355 | 17.6% | 24 | 100.0% | $977 | $0.72 | $1,050 | $0.77 | |||||||||||
| Total / Wtd. Avg. | 136 | 1,098 | 100.0% | 131 | 96.3% | $861 | $0.79 | $872 | $0.80 | |||||||||||
| (1) | Source: January 2015 rent roll. |
| (2) | Source: Appraisal. |
THE INFORMATION IN THIS STRUCTURAL AND COLLATERAL TERM SHEET IS NOT COMPLETE AND MAY BE AMENDED PRIOR TO THE TIME OF SALE. THIS TERM SHEET IS NOT AN OFFER TO SELL THESE SECURITIES AND IT IS NOT A SOLICITATION OF AN OFFER TO BUY THESE SECURITIES IN ANY JURISDICTION WHERE THE OFFER OR SALE IS NOT PERMITTED.
46
| Various | Collateral Asset Summary – Loan 3 DFW / Raleigh Portfolio | Cut-off Date Balance: Cut-off Date LTV: U/W NCF DSCR: U/W NOI Debt Yield: | $95,800,000 74.4% 1.31x 8.4% |
The Timbers Apartments is a 176-unit Class B garden-style apartment complex located at 5900 Timber Creek Lane in Raleigh, North Carolina. Built in 1986, the property contains 12, two-story residential buildings and a single-story clubhouse. The property has 283 open surface parking spaces which equates to a parking ratio of 1.61 spaces per unit. As of January 26, 2015, The Timbers Apartments was 97.7% occupied.
Amenities at the property consist of an on-site leasing office, laundry facilities, swimming pool, tennis court, playground, clubhouse, and fitness center. Unit amenities feature carpeting and vinyl tile flooring, a standard kitchen appliance package, garbage disposal, ceiling fans, fireplace, laundry connections (select units), and patio/balcony. Approximately 100 units have recently undergone renovations, which included a new white appliance package, faux granite countertop finishes, resurfaced cabinetry, and new hardware.
Unit Mix Summary – The Timbers Apartments(1) | ||||||||||||||||||||||
| Unit Type | # of Units | Unit Size (Sq. Ft.) | % of Total Units | Occupied Units | Occupancy Rate | Avg. Monthly Rental Rate | Avg. Monthly Rental Rate PSF | Monthly Market Rental Rate(2) | Monthly Market Rate PSF(2) | |||||||||||||
| 1 Bed / 1 Bath | 80 | 617 | 45.5% | 79 | 98.8% | $620 | $1.00 | $630 | $1.02 | |||||||||||||
| 1 Bed / 1 Bath | 8 | 766 | 4.5% | 7 | 87.5% | $733 | $0.96 | $755 | $0.99 | |||||||||||||
| 2 Bed / 2 Bath | 80 | 847 | 45.5% | 78 | 97.5% | $751 | $0.89 | $760 | $0.90 | |||||||||||||
| 2 Bed / 2 Bath | 8 | 984 | 4.5% | 8 | 100.0% | $810 | $0.82 | $840 | $0.85 | |||||||||||||
| Total / Wtd. Avg. | 176 | 745 | 100.0% | 172 | 97.7% | $693 | $0.92 | $704 | $0.94 | |||||||||||||
| (1) | Source: January 2015 rent roll. |
| (2) | Source: Appraisal. |
Environmental Matters. The Phase I environmental reports dated December 2015 recommended no further action at the DFW / Raleigh Portfolio properties.
The Market.
Dallas / Fort Worth Market
The Sutter Creek Apartments, Copper Crossing Apartments and Estrada Oaks Apartments are located in the greater Dallas/Fort Worth area within the Dallas/Fort Worth Core Based Statistical Area (the “DFW CBSA”). The DFW CBSA is one of the largest in the nation with approximately 6.7 million residents in 2013. The DFW CSBA consists of 14 contiguous counties in north Central Texas, encompassing approximately 9,250 square miles. The Dallas / Fort Worth area has become a major distribution point for both Texas and the neighboring states. The area is served by six interstates and 18 other U.S. and state highways as well as the Dallas / Fort Worth International Airport, the world’s fourth busiest airport in terms of operations. According to the appraiser, the DFW CBSA has experienced a 1.9% growth in population from 2010-2014 and has a median household income of $59,245, compared with 0.8% and $52,076, respectively, for the country as a whole.
As of Q4 2014, the Dallas/Fort Worth multifamily market has 677,595 existing apartment units, with 3,674 new units developed over the last year and an average occupancy of 94.7%. Monthly asking rental rates averaged $919 per unit in Q4 2014, an increase of 1.8% over the previous quarter, and net absorption was 3,342 units for Q4 2014, bringing annual net absorption to 46,126 units.
Sutter Creek Apartments is located in the city of Arlington, approximately 20 miles southeast of the Fort Worth central business district and 20 miles southwest of the Dallas central business district, within the Arlington submarket. As of Q3 2014, the Arlington submarket reported a total inventory of 48,477 units, which equates to 7.2% of the Dallas/Fort Worth apartment market. According to the appraisal, average occupancy within the submarket was 94.9% as of Q3 2014 and monthly rental rates averaged $771 per unit. Additionally, the 5-year average occupancy in the Arlington market is 92.5%. Rents for the competitive set identified by the appraiser ranged from $715/unit to $757/unit with a weighted average of $726/unit. No new units have been delivered within the submarket over the past year.
Copper Crossing Apartments is located in the city of Benbrook, approximately eight miles southwest of the Fort Worth central business district and 40 miles southwest of the Dallas central business district, within the Intown Ft. Worth/University apartment submarket. As of Q4 2014, the Intown Ft. Worth/University submarket reported a total inventory of 13,522 units, which equates to 2.0% of the Dallas/Fort Worth apartment market. According to the appraisal, average occupancy within the submarket was 94.5%, as of Q4 2014 and monthly rental rates averaged $1,136 per unit. Additionally, the 5-year average occupancy in the Intown Fort Worth/University market is 93.7%. Rents for the competitive set identified by the appraiser ranged from $713/unit to $808/unit with a weighted average of $759. No new units have been delivered within the submarket over the past year.
THE INFORMATION IN THIS STRUCTURAL AND COLLATERAL TERM SHEET IS NOT COMPLETE AND MAY BE AMENDED PRIOR TO THE TIME OF SALE. THIS TERM SHEET IS NOT AN OFFER TO SELL THESE SECURITIES AND IT IS NOT A SOLICITATION OF AN OFFER TO BUY THESE SECURITIES IN ANY JURISDICTION WHERE THE OFFER OR SALE IS NOT PERMITTED.
47
| Various | Collateral Asset Summary – Loan 3 DFW / Raleigh Portfolio | Cut-off Date Balance: Cut-off Date LTV: U/W NCF DSCR: U/W NOI Debt Yield: | $95,800,000 74.4% 1.31x 8.4% |
Estrada Oaks Apartments is located in the city of Irving, approximately 16 miles northwest of the Dallas central business district and 22 miles northeast of the Fort Worth central business district within the Irving submarket. As of Q3 2014, the Irving submarket reported a total inventory of 32,692 units, which equates to 4.8% of the Dallas/Fort Worth apartment market. According to the appraisal, average occupancy within the submarket was 95.5%, as of Q3 2014 and monthly rental rates averaged $773 per unit. Additionally, the 5-year average occupancy in the Irving market is 93.3%. Rents for the competitive set identified by the appraiser ranged from $721/unit to $841/unit with a weighted average of $771/unit. No new units have been delivered within the submarket over the past year.
Raleigh/Durham Market
The Trestles Apartments, Remington Place Apartments and The Timbers Apartments are located in the city of Raleigh, North Carolina, a community within the Raleigh-Cary MSA (the “MSA”). The MSA consists of four counties Wake, Franklin, Nash and Johnston. Raleigh serves as the state capital of North Carolina and was ranked #2 on Forbes fastest growing cities of 2014. The Raleigh area is served by one interstate and four other U.S. and state highways. In addition, the MSA is served by Amtrak and many freight rail carriers that provide not only national, but international service. Triangle Transit provides regional service to several cities in addition to the RDU airport through an extensive bus network. Similarly, the Capital Area Transit (CAT) serves Raleigh and surrounding suburbs. According to the appraiser, the MSA has experienced a 1.9% growth in population from 2010-2014 and has a median household income of $59,293, compared with 0.6% and $52,076, respectively, for the country as a whole.
As of Q3 2014, the Raleigh/Durham market has 134,459 existing apartment units, with 7,956 new units developed over the last year. Average occupancy in Q3 2014 was 94.8%, 0.3% higher than the previous quarter; however, on a current quarter annualized basis, the rate has decreased by 0.5%. Monthly asking rental rates averaged $944 per unit in Q3 2014 and net absorption was 6,940 units.
The Trestles Apartments is located approximately seven miles northeast of the Raleigh central business district, within the Northeast Raleigh apartment submarket. According to the appraisal, as of Q3 2014, the Northeast Raleigh submarket reported a total inventory of 8,999 units, which equates to 6.7% of the Raleigh/Durham apartment market. Average occupancy within the submarket was 94.2% as of Q3 2014 and monthly rental rates averaged $852 per unit. Additionally, the five year average occupancy in the Northeast Raleigh submarket was 92.6%. Rents for the competitive set identified by the appraiser ranged from $772/unit to $858/unit with a weighted average of $777/unit. The appraiser reported that 779 units were added to the submarket over the past year.
Remington Place Apartments is located approximately 6.5 miles southwest of the Raleigh central business district, within the Central Raleigh apartment submarket. According to the appraisal, as of Q3 2014, the Central Raleigh submarket reported a total inventory of 18,937 units, which equates to 14.1% of the Raleigh/Durham apartment market. Average occupancy within the submarket was 95.7% as of Q3 2014 and monthly rental rates averaged $1,062 per unit. Additionally, the five year average occupancy in the Central Raleigh submarket is 93.2%. Rents for the competitive set identified by the appraiser ranged from $738/unit to $992/unit with a weighted average of $822/unit. The appraiser reported that 1,369 units were added to the submarket over the past year.
The Timbers Apartments located approximately eight miles northwest of the Raleigh central business district, within the Northwest Raleigh apartment submarket. According to the appraisal, as of Q3 2014, the Northwest Raleigh submarket reported a total inventory of 17,398 units, which equates to 12.9% of the Raleigh/Durham apartment market. Average occupancy within the submarket was 94.3% as of Q3 2014 and monthly rental rates averaged $916 per unit. Additionally, the five year average occupancy in the Northwest Raleigh submarket is 94.4%. Rents for the competitive set identified by the appraiser ranged from $651/unit to $872/unit with a weighted average of $749/unit. The appraiser reported that 1,045 units were added to the submarket over the past year.
Cash Flow Analysis.
| Cash Flow Analysis | |||||||||||
| 2012 | 2013 | 2014 | T-12 1/31/2015 | U/W | U/W per Unit | ||||||
| Gross Potential Rent | $13,463,543 | $14,001,897 | $14,749,360 | $14,805,444 | $15,115,773 | $8,144 | |||||
| Total Other Income | 1,658,510 | 1,735,150 | 1,907,444 | 1,910,350 | 1,910,350 | 1,029 | |||||
Less: Vacancy(1) | (1,157,875) | (930,035) | (855,075) | (841,702) | (899,301) | (485) | |||||
| Less: Bad Debt | (127,900) | (153,649) | (212,245) | (220,101) | (291,321) | (157) | |||||
Less: Concessions(2) | (47,367) | (13,210) | (11,386) | (11,420) | 0 | 0 | |||||
| Effective Gross Income | $13,788,911 | $14,640,154 | $15,578,098 | $15,642,570 | $15,835,501 | $8,532 | |||||
| Total Operating Expenses | 7,438,111 | 7,414,157 | 7,915,487 | 7,876,099 | 7,816,146 | 4,211 | |||||
| Net Operating Income | $6,350,800 | $7,225,998 | $7,662,611 | $7,766,471 | $8,019,354 | $4,321 | |||||
| Capital Expenditures | 117,155 | 66,019 | 231,692 | 230,728 | 464,000 | 250 | |||||
| Net Cash Flow | $6,233,645 | $7,159,978 | $7,430,920 | $7,535,743 | $7,555,354 | $4,071 | |||||
| (1) | U/W Vacancy represents 5.95% of Gross Potential Rent, which is in line with the appraiser’s concluded vacancy rate for each market. |
| (2) | Concessions are not currently offered at the property and have historically been minimal. The only concessions offered at the property are referral bonuses offered to existing tenants for referring new tenants. |
THE INFORMATION IN THIS STRUCTURAL AND COLLATERAL TERM SHEET IS NOT COMPLETE AND MAY BE AMENDED PRIOR TO THE TIME OF SALE. THIS TERM SHEET IS NOT AN OFFER TO SELL THESE SECURITIES AND IT IS NOT A SOLICITATION OF AN OFFER TO BUY THESE SECURITIES IN ANY JURISDICTION WHERE THE OFFER OR SALE IS NOT PERMITTED.
48
| Various | Collateral Asset Summary – Loan 3 DFW / Raleigh Portfolio | Cut-off Date Balance: Cut-off Date LTV: U/W NCF DSCR: U/W NOI Debt Yield: | $95,800,000 74.4% 1.31x 8.4% |
Property Management. The DFW / Raleigh Portfolio properties are managed by Vesta Management Services, LLC. Headquartered in Houston, TX, Vesta currently manages 35 properties with approximately 8,800 units.
Lockbox / Cash Management. The DFW / Raleigh Portfolio is structured with a springing soft lockbox and springing cash management. Upon the occurrence of a Trigger Period (as defined herein), borrowers will establish and maintain a separate clearing account for each property in the name of one or more of the borrowers (collectively, the “Clearing Account”). All rents and other gross revenue are required to be transmitted directly by non-residential tenants, and, for residential tenants, by the borrowers and the property manager, into the Clearing Account. During the continuance of a Trigger Period, funds deposited into the Clearing Account will be swept daily into a deposit account controlled by the lender and disbursed in accordance with the DFW / Raleigh Portfolio Loan documents.
A “Trigger Period” will commence upon the occurrence of (i) an event of default or (ii) if the debt service coverage ratio falls below 1.10x for any calendar quarter and will end if all events of default have been cured and such cure has been accepted by the lender and the debt service coverage ratio has increased to at least 1.20x for two consecutive calendar quarters.
Initial Reserves. At closing, the borrowers deposited (i) $459,792 into a tax reserve account, (ii) $5,103 into an insurance reserve account, (iii) $9,475,083 into a capital expenditure holdback reserve account for planned capital improvements at the DFW / Raleigh Portfolio properties ($2,479,165 allocated to Copper Crossing, $1,334,361 allocated to Estrada Oaks, $812,515 allocated to Remington Place, $2,575,640 allocated to Sutter Creek, $960,593 allocated to Timbers and $1,312,810 allocated to Trestles) and (iv) $135,250 into a required repairs reserve account, which represents 125% of the engineer’s recommended repairs at the properties.
Ongoing Reserves. On a monthly basis, the borrowers are required to deposit reserves of (i) 1/12 of the estimated annual real estate taxes, which currently equates to $113,517, into a tax reserve account and (ii) $1/12 of the estimated annual insurance premiums, which currently equates to $5,103, into an insurance reserve account, and (iii) $38,667 into a replacement reserve account. Deposits into the insurance reserve account will be waived so long as an acceptable blanket policy is in place.
Current Mezzanine or Subordinate Indebtedness. None.
Future Mezzanine or Subordinate Indebtedness Permitted. None.
Partial Release. After the expiration of the lockout period, the borrowers may obtain the release of an individual property upon a bona fide third-party sale provided, among other things, (i) the LTV ratio for the remaining properties does not exceed the lesser of the LTV immediately preceding such release and 74.5%, (ii) the DSCR for the remaining properties is not less than the greater of the DSCR immediately preceding the partial release and 1.31x, (iii) borrowers partially defease the loan in an amount equal to the greater of 125% of the allocated loan amount for the released property or 100% of the net sales proceeds from the released property.
Substitution. None.
THE INFORMATION IN THIS STRUCTURAL AND COLLATERAL TERM SHEET IS NOT COMPLETE AND MAY BE AMENDED PRIOR TO THE TIME OF SALE. THIS TERM SHEET IS NOT AN OFFER TO SELL THESE SECURITIES AND IT IS NOT A SOLICITATION OF AN OFFER TO BUY THESE SECURITIES IN ANY JURISDICTION WHERE THE OFFER OR SALE IS NOT PERMITTED.
49
| Various | Collateral Asset Summary – Loan 3 DFW / Raleigh Portfolio | Cut-off Date Balance: Cut-off Date LTV: U/W NCF DSCR: U/W NOI Debt Yield: | $95,800,000 74.4% 1.31x 8.4% |
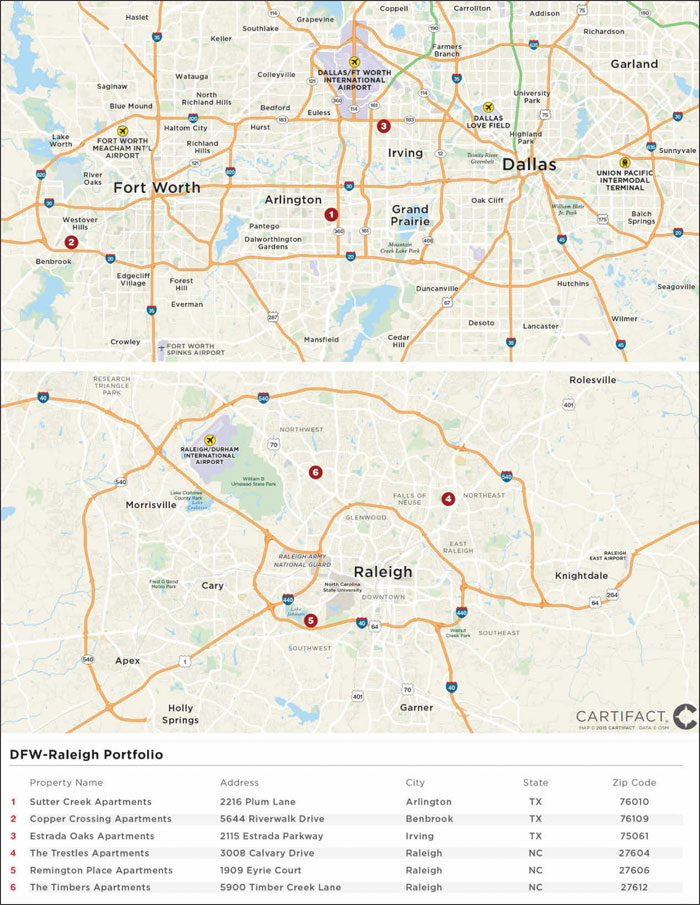
THE INFORMATION IN THIS STRUCTURAL AND COLLATERAL TERM SHEET IS NOT COMPLETE AND MAY BE AMENDED PRIOR TO THE TIME OF SALE. THIS TERM SHEET IS NOT AN OFFER TO SELL THESE SECURITIES AND IT IS NOT A SOLICITATION OF AN OFFER TO BUY THESE SECURITIES IN ANY JURISDICTION WHERE THE OFFER OR SALE IS NOT PERMITTED.
50
(THIS PAGE INTENTIONALLY LEFT BLANK)
51
3 Columbus Circle New York, NY 10019 | Collateral Asset Summary – Loan No. 4 3 Columbus Circle | Cut-off Date Balance: Cut-off Date LTV: U/W NCF DSCR: U/W NOI Debt Yield: | $90,000,000 50.0% 2.30x 8.8% |
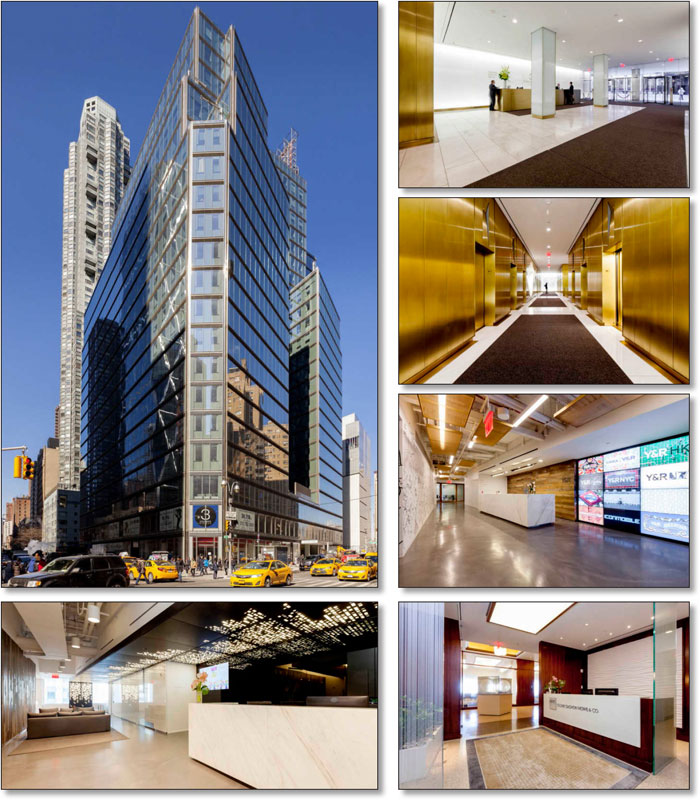
THE INFORMATION IN THIS STRUCTURAL AND COLLATERAL TERM SHEET IS NOT COMPLETE AND MAY BE AMENDED PRIOR TO THE TIME OF SALE. THIS TERM SHEET IS NOT AN OFFER TO SELL THESE SECURITIES AND IT IS NOT A SOLICITATION OF AN OFFER TO BUY THESE SECURITIES IN ANY JURISDICTION WHERE THE OFFER OR SALE IS NOT PERMITTED.
52
3 Columbus Circle New York, NY 10019 | Collateral Asset Summary – Loan No. 4 3 Columbus Circle | Cut-off Date Balance: Cut-off Date LTV: U/W NCF DSCR: U/W NOI Debt Yield: | $90,000,000 50.0% 2.30x 8.8% |
| Mortgage Loan Information | |
| Loan Seller: | GACC |
| Loan Purpose: | Refinance |
| Sponsor: | SL Green Realty Corp.; Joseph Moinian |
| Borrower: | 3 Columbus Circle LLC |
Original Balance(1): | $90,000,000 |
Cut-off Date Balance(1): | $90,000,000 |
| % by Initial UPB: | 6.6% |
| Interest Rate: | 3.6100% |
| Payment Date: | 6th of each month |
| First Payment Date: | April 6, 2015 |
| Maturity Date: | March 6, 2025 |
| Amortization: | Interest Only |
Additional Debt(1): | $260,000,000 Pari Passu Debt |
| Call Protection: | L(26), D(87), O(7) |
| Lockbox / Cash Management: | Hard / Springing |
Reserves(2) | ||
| Initial | Monthly | |
| Taxes: | $1,260,386 | $420,129 |
| Insurance: | $0 | Springing |
| TI/LC: | $4,405,062 | $0 |
| Required Repairs: | $3,500,000 | $0 |
| Rent Concession: | $840,248 | $0 |
| Signage Conversion: | $2,524,836 | $0 |
| Signage Rent: | $1,550,000 | $0 |
Financial Information(3) | ||
| Cut-off Date Balance / Sq. Ft.: | $666 | |
| Balloon Balance / Sq. Ft.: | $666 | |
| Cut-off Date LTV: | 50.0% | |
| Balloon LTV: | 50.0% | |
Underwritten NOI DSCR(4): | 2.39x | |
Underwritten NCF DSCR(4): | 2.30x | |
| Underwritten NOI Debt Yield: | 8.8% | |
| Underwritten NCF Debt Yield: | 8.4% | |
| Underwritten NOI Debt Yield at Balloon: | 8.8% | |
| Underwritten NCF Debt Yield at Balloon: | 8.4% | |
| Property Information | |
| Single Asset / Portfolio: | Single Asset |
| Property Type: | CBD Office |
| Collateral: | Fee Simple |
| Location: | New York, NY |
| Year Built / Renovated: | 1927 / 2011-2013 |
| Total Sq. Ft.: | 740,179 |
| Collateral Sq. Ft.: | 525,807 |
| Property Management: | Newmark & Company Real Estate, Inc. |
Underwritten NOI(5): | $30,648,061 |
| Underwritten NCF: | $29,494,350 |
| “As-is” Appraised Value: | $700,000,000 |
| “As-is” Appraisal Date: | February 1, 2015 |
| “As Stabilized” Value: | $820,000,000 |
| “As Stabilized” Date: | February 1, 2018 |
Historical NOI(5) | |
| Most Recent NOI: | $25,762,399 (T-12 September 30, 2014) |
| 2013 NOI: | $19,719,928 (December 31, 2013) |
| 2012 NOI: | $7,273,760 (December 31, 2012) |
| 2011 NOI: | $2,852,297 (December 31, 2011) |
Historical Occupancy(5) | |
Most Recent Occupancy(6): | 82.7% (February 28, 2015) |
| 2013 Occupancy: | 67.1% (December 31, 2013) |
| 2012 Occupancy: | 27.5% (December 31, 2012) |
| 2011 Occupancy: | 18.4% (December 31, 2011) |
| (1) | The Original Balance and Cut-off Date Balance of $90.0 million represents the controlling Note A-1 of a $350.0 million whole loan (the “3 Columbus Circle Loan Combination”) evidenced by six pari passu notes. The pari passu companion loan is comprised of the non-controlling Note A-2, non-controlling Note A-3, non-controlling Note A-4, non-controlling Note A-5 and non-controlling Note A-6, with an aggregate original principal amount of $260.0 million. The non-controlling Note A-4 was securitized in the COMM 2015-CCRE22 trust, the non-controlling Note A-2 and Note A-5 were included in the CGMT 2015-GC29 trust, and the non-controlling Note A-3 and Note A-6, were included in the WFCM 2015-LC20 trust. |
| (2) | See “Initial Reserves” and “Ongoing Reserves” herein. |
| (3) | DSCR, LTV, Debt Yield and Balance / Sq. Ft. calculations are based on the aggregate 3 Columbus Circle Loan Combination. |
| (4) | Mortgage Loan Underwritten NOI DSCR and Underwritten NCF DSCR are based on the interest only debt service payment. Based on a hypothetical 30-year amortization schedule, the Mortgage Loan Underwritten NOI DSCR and Underwritten NCF DSCR are 1.60x and 1.54x, respectively, |
| (5) | From 2011 to 2013, the 3 Columbus Circle Property underwent an extensive repositioning, during which time the majority of the rent roll was turned over, including a capital improvement program that consisted of building-wide improvements totaling approximately $82.5 million and suite-specific improvements totaling approximately $18.5 million. The increase in Underwritten NOI over Most Recent NOI is due in part to approximately $2.2 million in underwritten straight-line rents for investment grade tenants and underwritten step rents through February 2016, as well as new leases dating back to the third quarter of 2014 which contribute approximately $2.7 million in underwritten base rent. |
| (6) | Most Recent Occupancy includes Laura & John Arnold Foundation (9,708 sq. ft.) and PS Broadway (4,533 sq. ft.), which have executed leases but have not taken occupancy. |
THE INFORMATION IN THIS STRUCTURAL AND COLLATERAL TERM SHEET IS NOT COMPLETE AND MAY BE AMENDED PRIOR TO THE TIME OF SALE. THIS TERM SHEET IS NOT AN OFFER TO SELL THESE SECURITIES AND IT IS NOT A SOLICITATION OF AN OFFER TO BUY THESE SECURITIES IN ANY JURISDICTION WHERE THE OFFER OR SALE IS NOT PERMITTED.
53
3 Columbus Circle New York, NY 10019 | Collateral Asset Summary – Loan No. 4 3 Columbus Circle | Cut-off Date Balance: Cut-off Date LTV: U/W NCF DSCR: U/W NOI Debt Yield: | $90,000,000 50.0% 2.30x 8.8% |
| Tenant Summary | ||||||||||||
Tenant | Ratings (Fitch/Moody’s/S&P)(1) | Net Rentable Area (Sq. Ft.) | % of Net Rentable Area | U/W Base Rent PSF | % of Total U/W Base Rent | Lease Expiration | ||||||
| Non-Collateral Condo Tenant | ||||||||||||
| Y&R | BBB+/NR/BBB | 214,372 | NAP | $1.83(2) | 1.1% | NAP | ||||||
| Office Tenants | ||||||||||||
Y&R(3) | BBB+/NR/BBB | 159,394 | 30.3% | $62.17 | 28.0% | 7/31/2033 | ||||||
| Emerge212 | BBB-/Baa3/BB+ | 57,359 | 10.9% | $50.00 | 8.1% | 2/29/2028 | ||||||
| Gilder Gagnon Howe & Co. | NR/NR/NR | 36,076 | 6.9% | $114.93 | 11.7% | 1/31/2017 | ||||||
Jazz at Lincoln Center(4) | NR/NR/NR | 30,653 | 5.8% | $52.00 | 4.5% | 4/30/2028 | ||||||
Versace(5) | NR/NR/NR | 21,342 | 4.1% | $70.00 | 4.2% | 7/31/2025 | ||||||
| Total Major Office Tenants | 304,824 | 58.0% | $65.65 | 56.5% | ||||||||
| Remaining Office Tenants | 91,335 | 17.4% | $67.30 | 17.4% | ||||||||
| Total Occupied Office Tenants | 396,159 | 75.3% | $66.03 | 73.9% | ||||||||
| Vacant Office | 50,568 | 9.6% | ||||||||||
| Total Office | 446,727 | 85.0% | ||||||||||
| Retail Tenants | ||||||||||||
CVS(6) | NR/Baa1/BBB+ | 21,159 | 4.0% | $172.50 | 10.3% | 7/31/2028 | ||||||
Chase(7) | A+/A3/A | 10,000 | 1.9% | $357.50 | 10.1% | 4/30/2021 | ||||||
Bank of America(8) | A/Baa2/A- | 3,263 | 0.6% | $408.45 | 3.8% | 8/31/2017 | ||||||
| FPB 1775 Broadway | NR/NR/NR | 1,025 | 0.2% | $245.85 | 0.7% | 1/31/2024 | ||||||
| Total Occupied Retail Tenants | 35,447 | 6.7% | $248.53 | 24.9% | ||||||||
| Vacant Retail | 40,286 | 7.7% | ||||||||||
| Total Retail | 75,733 | 14.4% | ||||||||||
| Storage/Telecom/Other | 202 | 0.0% | $150.59 | 0.1% | ||||||||
| Total Leased Collateral | 431,808 | 82.1% | $81.05 | 98.9% | ||||||||
| Management Office | 2,831 | 0.5% | ||||||||||
| Total Occupied Collateral | 434,639 | 82.7% | $81.42 | 100.0% | ||||||||
| Vacant Retail | 40,286 | 7.7% | ||||||||||
| Vacant Office | 50,568 | 9.6% | ||||||||||
| Vacant Other | 314 | 0.1% | ||||||||||
| Total | 525,807 | 100.0% | ||||||||||
| (1) | Certain ratings are those of the parent company whether or not the parent company guarantees the lease. |
| (2) | Represents underwritten cleaning fees of $391,956 due from the non-collateral Y&R condominium which have historically been accounted for separate from the non-collateral Y&R condo fee reimbursement. |
| (3) | Y&R has two, 10-year renewal options remaining, each at an amount equal to 100.0% of fair market rent. |
| (4) | Jazz at Lincoln Center has one, five-year renewal option remaining at fair market rent. |
| (5) | Versace has one, five-year renewal option remaining at fair market rent. |
| (6) | CVS has one, 10-year renewal option remaining at the greater of 100.0% of fair market rent or 115.0% of the rent then payable at the expiration of the CVS lease term. |
| (7) | Chase has one, five-year renewal option remaining at the greater of $3,932,500 and 95.0% of fair market rent. |
| (8) | Bank of America has one, five-year renewal option remaining at the greater of 100.0% of fair market rent or the rent then payable at the expiration of the Bank of America lease term. |
THE INFORMATION IN THIS STRUCTURAL AND COLLATERAL TERM SHEET IS NOT COMPLETE AND MAY BE AMENDED PRIOR TO THE TIME OF SALE. THIS TERM SHEET IS NOT AN OFFER TO SELL THESE SECURITIES AND IT IS NOT A SOLICITATION OF AN OFFER TO BUY THESE SECURITIES IN ANY JURISDICTION WHERE THE OFFER OR SALE IS NOT PERMITTED.
54
3 Columbus Circle New York, NY 10019 | Collateral Asset Summary – Loan No. 4 3 Columbus Circle | Cut-off Date Balance: Cut-off Date LTV: U/W NCF DSCR: U/W NOI Debt Yield: | $90,000,000 50.0% 2.30x 8.8% |
Lease Rollover Schedule(1) | ||||||||
| Year | # of Leases Expiring | Total Expiring Sq. Ft. | % of Total Sq. Ft. Expiring | Cumulative Sq. Ft. Expiring | Cumulative % of Sq. Ft. Expiring | Annual U/W Base Rent PSF | % U/W Base Rent Rolling | Cumulative % of U/W Base Rent |
| MTM | 0 | 0 | 0.0% | 0 | 0.0% | $0.00 | 0.0% | 0.0% |
| 2015 | 6 | 23,697 | 4.5% | 23,697 | 4.5% | $57.40 | 3.8% | 3.8% |
| 2016 | 0 | 0 | 0.0% | 23,697 | 4.5% | $0.00 | 0.0% | 3.8% |
| 2017 | 5 | 46,282 | 8.8% | 69,979 | 13.3% | $130.08 | 17.0% | 20.9% |
| 2018 | 2 | 5,704 | 1.1% | 75,683 | 14.4% | $72.62 | 1.2% | 22.0% |
| 2019 | 3 | 13,735 | 2.6% | 89,418 | 17.0% | $76.14 | 3.0% | 25.0% |
| 2020 | 1 | 4,533 | 0.9% | 93,951 | 17.9% | $78.45 | 1.0% | 26.0% |
| 2021 | 1 | 10,000 | 1.9% | 103,951 | 19.8% | $357.50 | 10.1% | 36.1% |
| 2022 | 0 | 0 | 0.0% | 103,951 | 19.8% | $0.00 | 0.0% | 36.1% |
| 2023 | 3 | 21,226 | 4.0% | 125,177 | 23.8% | $68.00 | 4.1% | 40.2% |
| 2024 | 2 | 6,814 | 1.3% | 131,991 | 25.1% | $101.98 | 2.0% | 42.1% |
| 2025 | 2 | 31,050 | 5.9% | 163,041 | 31.0% | $65.62 | 5.8% | 47.9% |
| Thereafter | 5 | 268,565 | 51.1% | 431,606 | 82.1% | $67.10 | 50.9% | 98.8% |
Other(2) | 8 | 3,033 | 0.6% | 434,639 | 82.7% | $139.26 | 1.2% | 100.0% |
| Vacant | NAP | 91,168 | 17.3% | 525,807 | 100.0% | NAP | NAP | |
| Total / Wtd. Avg. | 38 | 525,807 | 100.0% | $81.42 | 100.0% | |||
| (1) | Certain tenants have lease termination options that may become exercisable prior to the originally stated expiration date of the tenant lease that are not considered in the lease rollover schedule. |
| (2) | Other includes management offices and telecom/storage space in the basement. |
The Loan. The 3 Columbus Circle loan (the “3 Columbus Circle Loan”) is a fixed rate loan secured by the borrower’s fee simple interest in a 525,807 sq. ft. condominium portion of a 740,179 sq. ft. office building, located at 3 Columbus Circle, New York City on the block bounded by Broadway to the east, Eighth Avenue to the west, and West 58th and West 57th Streets to the north and south, respectively (the “3 Columbus Circle Property”) with an original principal balance of $90.0 million. The 3 Columbus Circle Loan is comprised of the controlling Note A-1 of a $350.0 million whole loan that is evidenced by six pari passu notes (collectively, the “3 Columbus Circle Loan Combination”). Only the $90.0 million controlling Note A-1 will be included in the COMM 2015-CCRE23 trust. The $85.0 million non-controlling Note A-4 was included in the COMM 2015-CCRE22 trust, the non-controlling Note A-2 and non-controlling Note A-5, with an aggregate original principal balance of $100.0 million, were included in the CGMT 2015-GC29 trust, and the non-controlling Note A-3 and Note A-6, with an aggregate original principal balance of $75.0 million, were included in the WFCM 2015-LC20 trust. The 3 Columbus Circle Loan has a 10-year term and pays interest only for the term of the loan. The 3 Columbus Circle Loan accrues interest at a fixed rate equal to 3.6100% and has a cut-off date balance of $90.0 million. Loan proceeds were used to retire existing debt of approximately $228.2 million, pay closing costs of approximately $5.4 million, fund reserves of approximately $14.1 million and return approximately $102.3 million of equity to the borrower. Based on the appraised value of $700.0 million as of February 1, 2015, the cut-off date LTV is 50.0%. The most recent prior financing of the 3 Columbus Circle Property was not included in a securitization.
The relationship between the holders of the Note A-1, Note A-2, Note A-3, Note A-4, Note A-5 and Note A-6 will be governed by a co-lender agreement as described under “Description of the Mortgage Pool – Loan Combinations – The 3 Columbus Circle Loan Combination” in the accompanying Free Writing Prospectus.
| Pari Passu Note Summary | |||||
| Original Balance | Cut-off Date Balance | Note Holder | Controlling Piece | ||
| Note A-1 | $90,000,000 | $90,000,000 | COMM 2015-CCRE23 | Yes | |
| Note A-2 and A-5 | $100,000,000 | $100,000,000 | CGMT 2015-GC29 | No | |
| Note A-3 and A-6 | $75,000,000 | $75,000,000 | WFCM 2015-LC20 | No | |
| Note A-4 | $85,000,000 | $85,000,000 | COMM 2015-CCRE22 | No | |
| Total | $350,000,000 | $350,000,000 | |||
THE INFORMATION IN THIS STRUCTURAL AND COLLATERAL TERM SHEET IS NOT COMPLETE AND MAY BE AMENDED PRIOR TO THE TIME OF SALE. THIS TERM SHEET IS NOT AN OFFER TO SELL THESE SECURITIES AND IT IS NOT A SOLICITATION OF AN OFFER TO BUY THESE SECURITIES IN ANY JURISDICTION WHERE THE OFFER OR SALE IS NOT PERMITTED.
55
3 Columbus Circle New York, NY 10019 | Collateral Asset Summary – Loan No. 4 3 Columbus Circle | Cut-off Date Balance: Cut-off Date LTV: U/W NCF DSCR: U/W NOI Debt Yield: | $90,000,000 50.0% 2.30x 8.8% |
| Sources and Uses | |||||||
| Sources | Proceeds | % of Total | Uses | Proceeds | % of Total | ||
| Loan Amount | $350,000,000 | 100.0% | Loan Payoff | $228,200,410 | 65.2% | ||
| Reserves | $14,080,532 | 4.0% | |||||
| Closing Costs | $5,438,669 | 1.6% | |||||
| Return of Equity | $102,280,390 | 29.2% | |||||
| Total Sources | $350,000,000 | 100.0% | Total Uses | $350,000,000 | 100.0% | ||
The Borrower / Sponsor. The borrower, 3 Columbus Circle LLC, is a single purpose Delaware limited liability company structured to be bankruptcy-remote with two independent directors in its organizational structure. The sponsor of the borrower and the non-recourse carveout guarantors are Joseph Moinian and SL Green Realty Corp., jointly and severally.
Joseph Moinian is the founder and CEO of The Moinian Group. Founded in 1982, The Moinian Group is a New York City-based developer, investor and long-term owner of prime real estate. The Moinian Group owns in excess of 20 million sq. ft. of residential, hotel, commercial and retail properties across major cities including New York, Chicago, Dallas and Los Angeles.
SL Green Realty Corp., New York City’s largest office landlord, is a fully integrated, publicly traded (NYSE: SLG) REIT that is focused primarily on the acquisition and management of Manhattan commercial properties. As of December 31, 2014, SL Green Realty Corp. held interests in 101 Manhattan buildings totaling 42.4 million sq. ft. of space. In addition to its Manhattan investments, SL Green Realty Corp. holds ownership interests in 36 suburban buildings totaling 5.9 million sq. ft. in Brooklyn, Long Island, Westchester County, Connecticut and New Jersey.
The Property. The 3 Columbus Circle Property consists of units 1 through 20 in a 21-unit condominium and is comprised of the basement through second floor, and ninth through 26th floors of a 26-story Class A, multi-tenant office building that was originally constructed in 1927 to serve as headquarters for General Motors Corporation. The remaining unit in the condominium (the “YR Unit”), which is comprised of floors three through eight, consisting of 214,372 sq. ft., is owner-occupied by Y&R and does not serve as collateral for the 3 Columbus Circle Loan. The borrower owns a 71.9% undivided interest in the common elements of the condominium and appoints two of the three members of the Board of Managers of the condominium association.
From 2011 to 2013, the property underwent a large-scale renovation and modernization program including the installation of an entirely new glass curtain wall façade and a new lobby featuring backlit, frosted-glass walls, brushed bronze wall accents and white marble flooring. Other improvements to the building systems included new installation of a new cooling tower and HVAC equipment, air conditioning units and mechanical equipment rooms on all floors, as well as upgrades to the building’s fire, sprinkler, elevator and electrical systems. The reported cost of the renovation program was approximately $101.0 million ($136 PSF based on the total building sq. ft.). The 3 Columbus Circle Property totals 525,807 collateral sq. ft. and is comprised of 446,727 sq. ft. of office space, 75,733 sq. ft. of retail space and 3,347 sq. ft. of other building space. As of February 28, 2015, the 3 Columbus Circle Property was 82.7% occupied and the office space (73.9% of U/W Base Rent) was approximately 88.7% occupied. Office floor plates at the 3 Columbus Circle Property range from 9,200 sq. ft. to 41,202 sq. ft. with views of Central Park from the upper floors and terraces.
The 3 Columbus Circle Property spans the entire block bounded by Broadway to the east, Eighth Avenue to the west, and West 58th and West 57th Streets to the north and south, respectively. The 3 Columbus Circle Property has approximately 216.2 ft. of frontage along Broadway, 200.1 ft. of frontage along Eighth Avenue, 201.2 ft. of frontage along West 57th Street and 121.2 ft. of frontage along West 58th Street. The 3 Columbus Circle Property is served primarily by the 59th Street/Columbus Circle subway station, located to the northwest, which offers trains on the A, B, C, D and 1 lines, as well as the M20, M57 and M104 bus lines.
The three largest tenants at the 3 Columbus Circle Property occupy a total of 48.1% of the total net rentable area (“NRA”) and account for 47.8% of underwritten base revenue. The largest tenant, Y&R, occupies 159,394 sq. ft., or 30.3% of total NRA, and accounts for 28.0% of underwritten base rent. The second largest tenant, Emerge212, occupies 57,359 sq. ft. or 10.9% of total NRA, and accounts for 8.1% of underwritten base rent. The third largest tenant, Gilder Gagnon Howe & Co., occupies 36,076 sq. ft. on the top three floors of the 3 Columbus Circle Property, or 6.9% of total NRA, and accounts for 11.7% of underwritten base rent. No other tenant at the 3 Columbus Circle Property occupies more than 5.8% of total NRA or accounts for more than 10.3% of underwritten base rent. Tenants rated investment grade by at least one of Fitch/Moody’s/S&P comprise 47.8% of the NRA at the 3 Columbus Circle Property and account for 61.4% of underwritten base rent, with a weighted average remaining lease term of approximately 16.1 years.
In connection with the renovation and modernization of the property between 2011 and 2013, the majority of the 3 Columbus Circle Property’s tenant base was turned over, bringing the occupancy down to 18.4% as of December 2011. In 2012, Y&R took occupancy of 124,760 sq. ft. in addition to purchasing its 214,372 sq. ft. condominium on floors three through eight. During 2013, Emerge212 took occupancy of 57,359 sq. ft. and Y&R expanded into an additional 34,634 sq. ft. Since then, occupancy at the 3 Columbus Circle Property has steadily increased to the current occupancy level of 82.7% as of February 28, 2015.
THE INFORMATION IN THIS STRUCTURAL AND COLLATERAL TERM SHEET IS NOT COMPLETE AND MAY BE AMENDED PRIOR TO THE TIME OF SALE. THIS TERM SHEET IS NOT AN OFFER TO SELL THESE SECURITIES AND IT IS NOT A SOLICITATION OF AN OFFER TO BUY THESE SECURITIES IN ANY JURISDICTION WHERE THE OFFER OR SALE IS NOT PERMITTED.
56
3 Columbus Circle New York, NY 10019 | Collateral Asset Summary – Loan No. 4 3 Columbus Circle | Cut-off Date Balance: Cut-off Date LTV: U/W NCF DSCR: U/W NOI Debt Yield: | $90,000,000 50.0% 2.30x 8.8% |
Environmental Matters. The Phase I environmental report dated February 9, 2015 recommended the continued implementation of an asbestos operation and maintenance plan at the 3 Columbus Circle Property, which is currently in place.
Major Tenants.
Y&R (159,394 sq. ft.; 30.3% of NRA; 28.0% of U/W Base Rent; BBB+/BBB by Fitch/S&P) Y&R is a global marketing and communications company with over 6,500 employees in 95 countries specializing in advertising, digital and social media, sales promotion, direct marketing and brand identity consulting. Y&R is a subsidiary of WPP, a British multinational advertising and public relations conglomerate. The 3 Columbus Circle Property represents Y&R’s world headquarters. Y&R initially leased 124,760 sq. ft. comprising all of floors 9, 10, 18 and 19 at the 3 Columbus Circle Property beginning in 2012 and later expanded into an additional 34,634 sq. ft. on the 11th floor in 2013, in addition to its non-collateral 214,372 sq. ft. of space. Y&R’s leases expire July 31, 2033, with no early termination options and two, ten-year renewal options.
Emerge212 (57,359 sq. ft.; 10.9% of NRA; 8.1% of U/W Base Rent; BBB-/Baa3/BB+ by Fitch/Moody’s/S&P) Emerge212, a wholly-owned subsidiary of SL Green Realty Corp., is a provider of Class A boutique shared office space across three locations in Midtown Manhattan. Emerge212 offers flexible leasing plans for its fully furnished offices, with amenities that include executive boardrooms and conference rooms available for rental by the hour or day, comprehensive catering services, office and meeting supplies, gigabit LAN internet connectivity with support staff, server rack room space, local and network printing as well as temporary business staffing assistance. Emerge212 has occupied the entire 15th and part of the 16th floor of the 3 Columbus Circle Property since 2013 and its lease expires in February 2028 with no early termination options.
Gilder Gagnon Howe & Co. (36,076 sq. ft.; 6.9% of NRA; 11.7% of U/W Base Rent) Gilder Gagnon Howe & Co., founded in 1968 as R. Gilder & Co., is a registered investment advisor that manages investments for individuals on a discretionary basis. Gilder Gagnon Howe & Co. focuses on individual companies and invests based on its independent research, relying on fundamentals relating to a particular company and its industry. Gilder Gagnon Howe & Co.’s lease runs through January 31, 2017 with no early termination options.
Signage Conversion. The 3 Columbus Circle Property currently features a static electronic rooftop sign leased to Clear Channel signage through April 2015 at a rate of $1,550,000 per year which displays the CNN logo and the current time and temperature. The sponsor does not plan to renew the Clear Channel lease and intends to convert the signage to a dynamic digital LED sign. The full cost to install the digital display, in an amount equal to $2,524,836, along with $1,550,000 of signage rent was reserved at closing.
The Market. The 3 Columbus Circle Property is located in New York’s Midtown West office market within the Westside office submarket. As of Q3 2014, Midtown West Class A office inventory was comprised of approximately 37.7 million sq. ft. of office space with a vacancy rate of 10.7%. Specifically, Class A office inventory within the Westside submarket was comprised of approximately 23.8 million sq. ft. of office space with a vacancy rate of 11.1%. As of Q3 2014, Class A Midtown West office rents were $77.05 PSF with Westside office submarket rental rates of $79.66 PSF. The appraiser analyzed a set of seven directly competitive properties within the immediate competitive area of the 3 Columbus Circle Property and concluded an office market rental range of $65.00 to $135.00. Underwritten weighted average office rents at the 3 Columbus Circle Property are currently $66.03 PSF, slightly below the appraiser’s concluded office market rent for the 3 Columbus Circle Property of $73.77 PSF. The chart below summarizes the comparable set as determined by the appraisal.
Comparable Set(1) | |||||
| Building | Office Area | Available | % Occupied | Asking Rent Low | Asking Rent High |
3 Columbus Circle Property(2) | 446,727 | 50,568 | 88.7% | NAP | NAP |
40 West 57th Street | 712,000 | 50,000 | 93.0% | $115.00 | $115.00 |
| 1740 Broadway | 412,704 | 0 | 100.0% | NAP | NAP |
| 810 Seventh Avenue | 748,023 | 107,937 | 85.6% | $85.00 | $85.00 |
| 888 Seventh Avenue | 841,000 | 100,442 | 88.1% | $70.00 | $135.00 |
| 1350 Avenue of the Americas | 424,000 | 23,605 | 94.4% | $65.00 | $85.00 |
| 1370 Avenue of the Americas | 339,000 | 34,316 | 89.9% | $70.00 | $80.00 |
| 1755 Broadway | 214,425 | 0 | 100.0% | NAP | NAP |
Total / Wtd. Avg.(3): | 3,691,152 | 316,300 | 91.4% | $65.00 | $135.00 |
| (1) | Source: Appraisal. |
| (2) | Based on rent roll dated February 28, 2015. |
| (3) | Total / Wtd. Avg. excludes the 3 Columbus Circle Property. |
THE INFORMATION IN THIS STRUCTURAL AND COLLATERAL TERM SHEET IS NOT COMPLETE AND MAY BE AMENDED PRIOR TO THE TIME OF SALE. THIS TERM SHEET IS NOT AN OFFER TO SELL THESE SECURITIES AND IT IS NOT A SOLICITATION OF AN OFFER TO BUY THESE SECURITIES IN ANY JURISDICTION WHERE THE OFFER OR SALE IS NOT PERMITTED.
57
3 Columbus Circle New York, NY 10019 | Collateral Asset Summary – Loan No. 4 3 Columbus Circle | Cut-off Date Balance: Cut-off Date LTV: U/W NCF DSCR: U/W NOI Debt Yield: | $90,000,000 50.0% 2.30x 8.8% |
The below chart summarizes the appraiser’s office market rent conclusion by floor.
Office Market Rent(1) | ||
| Floors | Average Floorplate (Sq. Ft.) | Rent PSF |
| 9 to 15 | 34,162 | $68.00 |
| 16 to 18 | 33,983 | $72.00 |
| 19 to 23 | 21,255 | $80.00 |
| 24 to 26 | 14,428 | $90.00 |
| Wtd. Avg. | 26,852 | $73.77 |
| (1) | Source: Appraisal. |
The 3 Columbus Circle Property features retail space located on the ground floor, lower level and second floor. The appraiser examined six comparable on-grade retail leases in the immediate area around the 3 Columbus Circle Property as well as eight large multi-level retail leases across Manhattan to conclude market rents for the retail space. A summary of the leases is presented below.
Comparable Retail Leases – On-Grade(1) | ||||||
| Address | Tenant | Frontage | Lease Sq. Ft. | Adjusted Rent PSF | Lease Term | Lease Type |
250 West 57th Street | HSBC | West 57th Street | 3,000 | $399.30 | 10 years | Gross |
| 1841 Broadway | Luggage Company | Broadway | 1,208 | $397.00 | 5 years | Gross |
| 836 Seventh Avenue | Dunkin Donuts | Eighth Avenue | 400 | $420.00 | 10 years | Gross |
250 West 57th Street | Starbucks | Eighth Avenue | 879 | $390.00 | 10 years | Gross |
250 West 57th Street | AT&T | West 57th Street | 3,797 | $408.00 | 10 years | Gross |
| (1) | Source: Appraisal. |
Comparable Retail Leases – Multi-Level(1) | ||||||
| Address | Tenant | Frontage | Lease Sq. Ft. | Adjusted Rent PSF | Lease Term | Lease Type |
| 545 Fifth Avenue | NBA | Fifth Avenue | 24,648 | $135.00 | 20 years | Gross |
| 635 Avenue of the Americas | Lowe’s | 6th Ave. & 19th St. | 28,351 | $202.00 | 15 years | Gross |
| 105 Fifth Avenue | Banana Republic | 5th Ave. & 18th St. | 28,800 | $118.00 | 10 years | Gross |
| 101 Seventh Avenue | Barney’s | Seventh Avenue | 50,450 | $134.00 | 10 years | Gross |
| 583 Broadway | Under Armour | Broadway | 20,144 | $116.00 | 10 years | Gross |
249 West 17th Street | Room & Board | 17th Street | 60,919 | $114.00 | 15 years | Gross |
| 1095 Avenue of the Americas | Whole Foods | 6th Ave. & 41st St. | 33,338 | $130.00 | 20 years | Gross |
| 608 Fifth Avenue | Top Shop | 5th Ave. & 49th St. | 44,287 | $182.00 | 8 years | Gross |
| (1) | Source: Appraisal. |
Retail Market Rent(1) | ||
| Floors | Sq. Ft. | Rent PSF |
| Basement | 20,660 | $50.00 |
| Ground Floor | 25,906 | $393.84 |
| Second Floor | 29,267 | $100.00 |
| Total/Wtd. Avg. | 75,833 | $186.75 |
| (1) | Source: Appraisal. |
THE INFORMATION IN THIS STRUCTURAL AND COLLATERAL TERM SHEET IS NOT COMPLETE AND MAY BE AMENDED PRIOR TO THE TIME OF SALE. THIS TERM SHEET IS NOT AN OFFER TO SELL THESE SECURITIES AND IT IS NOT A SOLICITATION OF AN OFFER TO BUY THESE SECURITIES IN ANY JURISDICTION WHERE THE OFFER OR SALE IS NOT PERMITTED.
58
3 Columbus Circle New York, NY 10019 | Collateral Asset Summary – Loan No. 4 3 Columbus Circle | Cut-off Date Balance: Cut-off Date LTV: U/W NCF DSCR: U/W NOI Debt Yield: | $90,000,000 50.0% 2.30x 8.8% |
Cash Flow Analysis.
Cash Flow Analysis(1) | ||||||
| 2011 | 2012 | 2013 | T-12 9/30/2014 | U/W | U/W PSF | |
Base Rent(2) | $11,536,109 | $15,615,474 | $28,024,937 | $31,630,515 | $37,587,203 | $71.48 |
| Value of Vacant Space | 0 | 0 | 0 | 0 | 8,068,725 | 15.35 |
| Gross Potential Rent | $11,536,109 | $15,615,474 | $28,024,937 | $31,630,515 | $45,655,928 | $86.83 |
| Total Recoveries | 760,947 | 1,154,092 | 3,626,553 | 7,662,119 | 7,494,723 | 14.25 |
| Total Other Income | 1,568,146 | 1,739,456 | 1,607,205 | 1,810,923 | 1,573,077 | 2.99 |
Less: Vacancy/Bad Debt(3) | (259,017) | (61,698) | (99,510) | (118,581) | (8,068,725) | (15.35) |
| Effective Gross Income | $13,606,185 | $18,447,324 | $33,159,185 | $40,984,976 | $46,655,003 | $88.73 |
| Total Operating Expenses | 10,753,888 | 11,173,564 | 13,439,257 | 15,222,578 | 16,006,943 | 30.44 |
| Net Operating Income | $2,852,297 | $7,273,760 | $19,719,928 | $25,762,399 | $30,648,061 | $58.29 |
| TI/LC | 0 | 0 | 0 | 0 | 1,022,259 | 1.94 |
| Capital Expenditures | 0 | 0 | 0 | 0 | 131,452 | 0.25 |
| Net Cash Flow | $2,852,297 | $7,273,760 | $19,719,928 | $25,762,399 | $29,494,350 | $56.09 |
| (1) | From 2011 to 2013, the 3 Columbus Circle Property underwent an extensive repositioning, during which time the majority of the rent roll was turned over, including a capital improvement program that consisted of building-wide improvements totaling $82.5 million and suite-specific improvements totaling $18.5 million. The increase in U/W Net Operating Income over T-12 9/30/2014 Net Operating Income is due in part to approximately $2.2 million in U/W straight-line rents for investment grade tenants and underwritten step rents through February 2016, as well as new leases dating back to the third quarter of 2014 which contribute $2.7 million in U/W Base Rent. |
| (2) | U/W Base Rent includes $2,196,843 of (i) contractual rent increases through February 2016 and (ii) straight line average rent increases through the earlier of lease expiration or effective termination date for investment grade tenants. |
| (3) | U/W Vacancy/Bad Debt is based on the in-place vacancy. |
Property Management. The 3 Columbus Circle Property is managed by Newmark & Company Real Estate, Inc. Newmark & Company Real Estate, Inc. is owned by Newmark Grubb Knight Frank, which provides property and facilities management for 500 million sq. ft. in the U.S., Europe, Asia-Pacific, the Middle East and Africa.
Lockbox / Cash Management. The 3 Columbus Circle Loan is structured with a hard lockbox and springing cash management. At closing, the borrower was required to instruct all tenants to deposit all rents and other payments into the lockbox account controlled by the lender for the term of the 3 Columbus Circle Loan. All funds in the lockbox account are swept daily to the cash management account controlled by the lender. Provided no Trigger Period is continuing, all funds in the cash management account are swept daily to the borrower’s operating account. Upon the occurrence and during the continuance of a Trigger Period (as defined below), amounts in the cash management account will be disbursed monthly through the waterfall in the loan documents and excess cash swept and held as additional collateral for the loan.
A “Trigger Period” will occur upon (i) an event of default, or (ii) the debt service coverage ratio falling below 1.10x (based on an amortizing 30-year debt service payment). A Trigger Period will end: (a) with respect to clause (i) above, upon the cure of the event of default, or (b) with respect to clause (ii) above, upon the debt service coverage ratio being greater than 1.15x for two consecutive quarters or if the borrower delivers to the lender as additional collateral for the 3 Columbus Circle Loan either cash or a letter of credit in an amount by which the then outstanding principal balance would need to be reduced in order for the debt service coverage ratio to equal 1.10x.
Initial Reserves. At closing, the borrower deposited (i) $1,260,386 into a tax reserve account, (ii) $4,405,062 into a TI/LC reserve account for existing TI/LC obligations due to tenants as of the closing date, (iii) $3,500,000 into a required repairs reserve, (iv) $840,248 into a rent concession reserve for existing free rent obligations due to tenants as of the closing date, (v) $2,524,836 into the signage conversion work reserve and (vii) $1,550,000 into the signage rent reserve, which represents one year of prepaid signage rent under the in place lease.
Ongoing Reserves. On a monthly basis, the borrower is required to deposit reserves of (i) 1/12 of the estimated annual real estate taxes, which currently equates to $420,129, into a tax reserve account and (ii) 1/12 of the annual insurance premiums. Notwithstanding the foregoing, in the event that an acceptable blanket insurance policy is in effect, deposits into the insurance reserve account are suspended to the extent that insurance premiums relate to such acceptable blanket insurance policy. As of the loan closing date, an acceptable blanket insurance policy was in effect.
Current Mezzanine or Subordinate Indebtedness. None.
Future Mezzanine or Subordinate Indebtedness Permitted. None.
THE INFORMATION IN THIS STRUCTURAL AND COLLATERAL TERM SHEET IS NOT COMPLETE AND MAY BE AMENDED PRIOR TO THE TIME OF SALE. THIS TERM SHEET IS NOT AN OFFER TO SELL THESE SECURITIES AND IT IS NOT A SOLICITATION OF AN OFFER TO BUY THESE SECURITIES IN ANY JURISDICTION WHERE THE OFFER OR SALE IS NOT PERMITTED.
59
3 Columbus Circle New York, NY 10019 | Collateral Asset Summary – Loan No. 4 3 Columbus Circle | Cut-off Date Balance: Cut-off Date LTV: U/W NCF DSCR: U/W NOI Debt Yield: | $90,000,000 50.0% 2.30x 8.8% |
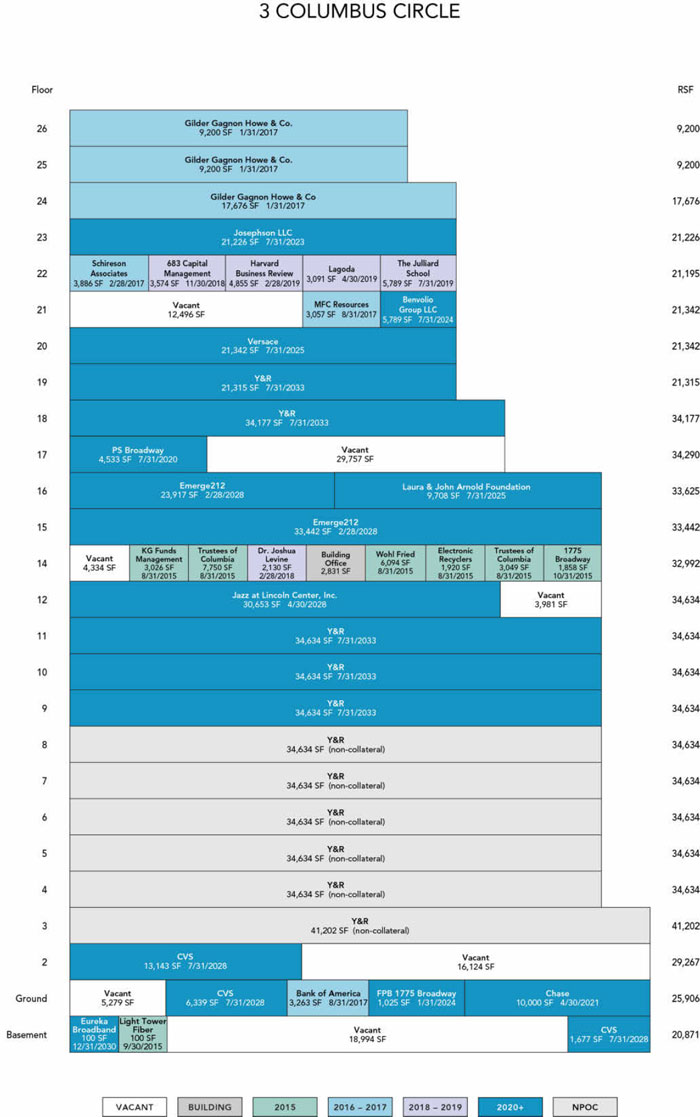
THE INFORMATION IN THIS STRUCTURAL AND COLLATERAL TERM SHEET IS NOT COMPLETE AND MAY BE AMENDED PRIOR TO THE TIME OF SALE. THIS TERM SHEET IS NOT AN OFFER TO SELL THESE SECURITIES AND IT IS NOT A SOLICITATION OF AN OFFER TO BUY THESE SECURITIES IN ANY JURISDICTION WHERE THE OFFER OR SALE IS NOT PERMITTED.
60
3 Columbus Circle New York, NY 10019 | Collateral Asset Summary – Loan No. 4 3 Columbus Circle | Cut-off Date Balance: Cut-off Date LTV: U/W NCF DSCR: U/W NOI Debt Yield: | $90,000,000 50.0% 2.30x 8.8% |
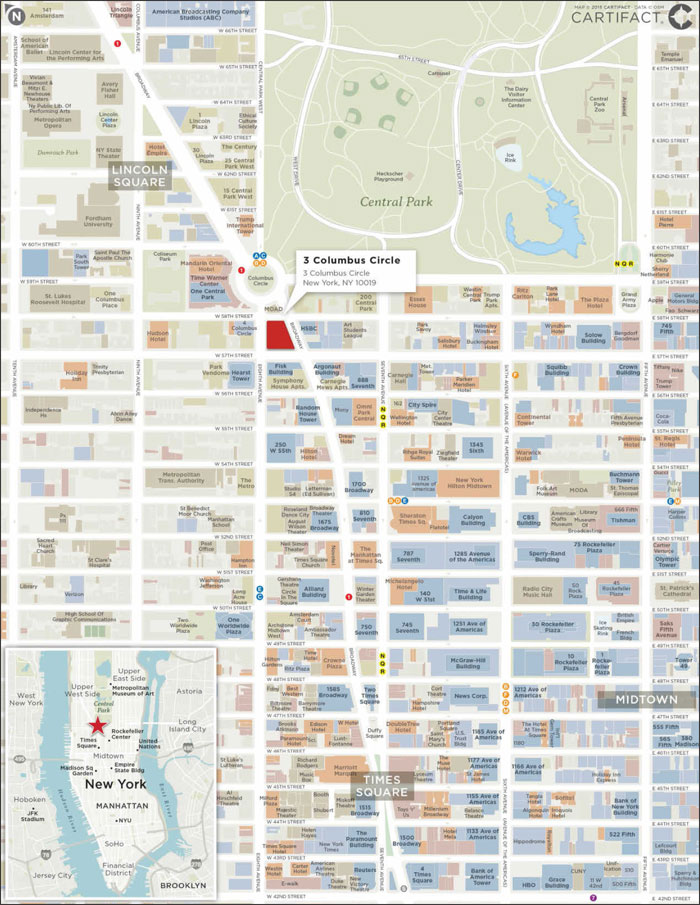
THE INFORMATION IN THIS STRUCTURAL AND COLLATERAL TERM SHEET IS NOT COMPLETE AND MAY BE AMENDED PRIOR TO THE TIME OF SALE. THIS TERM SHEET IS NOT AN OFFER TO SELL THESE SECURITIES AND IT IS NOT A SOLICITATION OF AN OFFER TO BUY THESE SECURITIES IN ANY JURISDICTION WHERE THE OFFER OR SALE IS NOT PERMITTED.
61
2259 South Kihei Road Kihei, HI 96753 | Collateral Asset Summary – Loan No. 5 Maui Coast Hotel | Cut-off Date Balance: Cut-off Date LTV: U/W NCF DSCR: U/W NOI Debt Yield: | $56,320,000 55.0% 2.77x 12.1% |
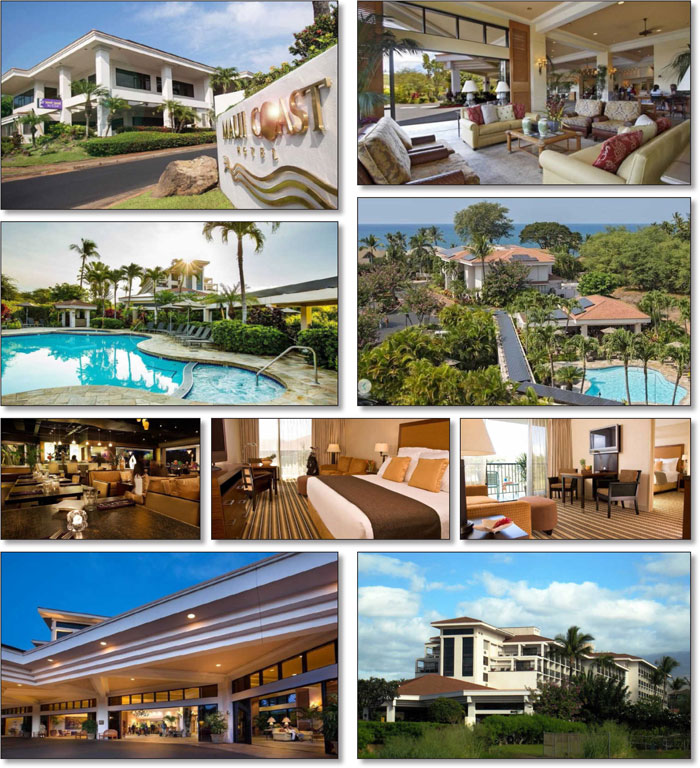
THE INFORMATION IN THIS STRUCTURAL AND COLLATERAL TERM SHEET IS NOT COMPLETE AND MAY BE AMENDED PRIOR TO THE TIME OF SALE. THIS TERM SHEET IS NOT AN OFFER TO SELL THESE SECURITIES AND IT IS NOT A SOLICITATION OF AN OFFER TO BUY THESE SECURITIES IN ANY JURISDICTION WHERE THE OFFER OR SALE IS NOT PERMITTED.
62
2259 South Kihei Road Kihei, HI 96753 | Collateral Asset Summary – Loan No. 5 Maui Coast Hotel | Cut-off Date Balance: Cut-off Date LTV: U/W NCF DSCR: U/W NOI Debt Yield: | $56,320,000 55.0% 2.77x 12.1% |
| Mortgage Loan Information | |
Loan Seller(1): | GACC / JLC |
| Loan Purpose: | Refinance |
| Sponsor: | J. Stephen Goodfellow; Rodney Olson |
| Borrower: | WC Maui Coast LLC |
| Original Balance: | $56,320,000 |
| Cut-off Date Balance: | $56,320,000 |
| % by Initial UPB: | 4.1% |
| Interest Rate: | 3.9300% |
| Payment Date: | 6th of each month |
| First Payment Date: | May 6, 2015 |
| Maturity Date: | April 6, 2025 |
| Amortization: | Interest Only |
| Additional Debt: | None |
| Call Protection: | L(25), YM1(91), O(4) |
| Lockbox / Cash Management: | Hard / Springing |
Reserves(2) | ||
| Initial | Monthly | |
| Taxes: | $42,000 | $22,252 |
| Insurance: | $287,867 | $23,989 |
| FF&E: | $0 | 1/12 of 4.0% of such year’s annual operating income |
| Financial Information | |
| Cut-off Date Balance / Room: | $212,528 |
| Balloon Balance / Room: | $212,528 |
| Cut-off Date LTV: | 55.0% |
| Balloon LTV: | 55.0% |
| Underwritten NOI DSCR: | 3.05x |
| Underwritten NCF DSCR: | 2.77x |
| Underwritten NOI Debt Yield: | 12.1% |
| Underwritten NCF Debt Yield: | 11.1% |
| Underwritten Balloon NOI Debt Yield: | 12.1% |
| Underwritten Balloon NCF Debt Yield: | 11.1% |
| Property Information | ||
| Single Asset / Portfolio: | Single Asset | |
| Property Type: | Full Service Hospitality | |
| Collateral: | Fee Simple | |
| Location: | Kihei, HI | |
| Year Built / Renovated: | 1993 / 2009 | |
| Total Rooms: | 265 | |
| Property Management: | Paramount Hotels LLC | |
| Underwritten NOI: | $6,833,491 | |
| Underwritten NCF: | $6,226,433 | |
| Appraised Value: | $102,400,000 | |
| Appraisal Date: | February 17, 2015 | |
| Historical NOI | ||
| Most Recent NOI: | $7,021,595 (T-12 March 31, 2015) | |
| 2014 NOI: | $6,708,818 (December 31, 2014) | |
| 2013 NOI: | $5,546,100 (December 31, 2013) | |
| 2012 NOI: | $4,715,666 (December 31, 2012) | |
| Historical Occupancy | ||
| Most Recent Occupancy: | 85.1% (March 31, 2015) | |
| 2014 Occupancy: | 84.4% (December 31, 2014) | |
| 2013 Occupancy: | 85.0% (December 31, 2013) | |
| 2012 Occupancy: | 87.1% (December 31, 2012) | |
| (1) | The Maui Coast Hotel Loan was originated by JLC and a $28,160,000 note was subsequently purchased by GACC. |
| (2) | See “Initial Reserves” and “Ongoing Reserves” herein. |
THE INFORMATION IN THIS STRUCTURAL AND COLLATERAL TERM SHEET IS NOT COMPLETE AND MAY BE AMENDED PRIOR TO THE TIME OF SALE. THIS TERM SHEET IS NOT AN OFFER TO SELL THESE SECURITIES AND IT IS NOT A SOLICITATION OF AN OFFER TO BUY THESE SECURITIES IN ANY JURISDICTION WHERE THE OFFER OR SALE IS NOT PERMITTED.
63
2259 South Kihei Road Kihei, HI 96753 | Collateral Asset Summary – Loan No. 5 Maui Coast Hotel | Cut-off Date Balance: Cut-off Date LTV: U/W NCF DSCR: U/W NOI Debt Yield: | $56,320,000 55.0% 2.77x 12.1% |
The Loan. The Maui Coast Hotel loan (the “Maui Coast Hotel Loan”) is an approximately $56.3 million fixed rate loan secured by the borrowers’ fee simple interest in a full service hotel totaling 265 rooms and located in Kihei, Hawaii (the “Maui Coast Hotel Property”). The Maui Coast Hotel Loan has a 10-year interest only term and accrues interest at 3.9300%. Loan proceeds were used to refinance approximately $38.5 million of existing debt, fund upfront reserves of approximately $0.3 million, pay closing costs of approximately $0.6 million and return approximately $16.9 million of equity to the borrower. Based on the appraised value of $102.4 million as of February 17, 2015, the cut-off date LTV of the Maui Coast Hotel Loan is 55.0%. The most recent prior financing of the Maui Coast Hotel Property was included in the MLMT 2006-C2 securitization.
| Sources and Uses | ||||||
| Sources | Proceeds | % of Total | Uses | Proceeds | % of Total | |
| Mortgage Loan | $56,320,000 | 100.0% | Refinance Existing Debt | $38,500,012 | 68.4% | |
| Upfront Reserves | $329,867 | 0.6% | ||||
| Closing Costs | $598,771 | 1.1% | ||||
| Return of Equity | $16,891,350 | 30.0% | ||||
| Total Sources | $56,320,000 | 100.0% | Total Uses | $56,320,000 | 100.0% | |
The Borrower / Sponsor. The borrower, WC Maui Coast LLC, is a single purpose Washington limited liability company, structured to be bankruptcy remote, with two independent managers in its organizational structure. The sponsors and non-recourse carveout guarantors are J. Stephen Goodfellow and Rodney Olson on a joint and several basis.
The Property. The Maui Coast Hotel Property consists of two buildings: (i) one two-story building located adjacent to the driveway entrance which contains “Ami Ami” Bar & Grill, a 200-seat restaurant, and a large fitness center and (ii) one six-story building which contains 265 guestrooms, 980 sq. ft. of meeting space and the lobby. Amenities include an outdoor pool, whirlpool, tennis court, well-equipped fitness center, guest laundry and dry cleaning service, concierge service and a meeting room; guests are also able to rent bicycles free of charge. There are 232 surface parking spaces dedicated for hotel guests and a van service is available to guests requiring transportation to the airport, local beaches, golf courses and restaurants. The Maui Coast Hotel Property features 265 guestrooms including 92 standard king rooms, 52 double rooms with two queen-sized beds, 60 one-bedroom suites, 51 junior suites of which 28 have king-sized beds and 23 have two queen-sized beds and 10 ADA accessible rooms. Guestrooms average 355 sq. ft. in size and the Maui Coast Hotel Property offers a high ratio of suites relative to its overall guestroom count. Standard guestroom amenities include private balconies with ocean views, mini refrigerators, coffee makers, hair dryers, ceiling fans and air conditioning. The suites include all of the standard amenities in addition to a wet bar. Built in 1993 and substantially renovated in 2009, the Maui Coast Hotel Property is in excellent condition. In total, over the past five years, approximately $4.2 million ($15,679 per room) has been spent on renovations, refurbishments, upgrades and FF&E and soft good replacements. In addition, $545,500 ($2,056 per room) has been budgeted for 2015 for guest room amenities, pool bar upgrades and fitness center equipment.
Environmental Matters. The Phase I environmental report dated February 27, 2015 recommended no further action at the Maui Coast Hotel Property.
The Market. The Maui Coast Hotel Property is located on the southwest coast of the island of Maui in the city of Kihei in Hawaii. Primary frontage is along South Kihei Drive, which connects to Highway 31 approximately four miles north of the Maui Coast Hotel Property. Kamaole Beach Park is located directly across the street and is one of the highest rated beaches on the island. The immediate neighborhood is characterized by custom single-family homes and a timeshare facility operated by Wyndham. Maui is the second largest Hawaiian island and is also the second most visited island, known for its upscale lodging destinations and beautiful beaches. Although the tourism industry is paramount to Hawaii’s economy, the state’s favorable position between mainland North America and the continent of Asia has also made the island a strategic defense site for the United States military. In addition, the year-round moderate climate is highly conducive to agriculture. As a result, the Hawaiian economy is diversified between tourism, federal government/military establishments and agricultural production.
According to a February 2015 hospitality report, the Maui Coast Hotel Property competes with seven other hotels including the Royal Lahaina Resort, Kaanapali Beach Hotel, Makena Beach & Golf Resort, Kamaole Sands, Aston Hotel at The Maui Banyan, Hotel Wailea and the Aston Hotel Maui Hill. Excluding the Maui Coast Hotel Property’s 265 rooms, the competitive set contains a total of 1,698 rooms. As of March 31, 2015, the Maui Coast Hotel Property had an occupancy of approximately 85.1% with an ADR of $172.83 and RevPAR of $147.04.
Maui Coast Hotel Property – Historical Occupancy, ADR, RevPAR(1) | |||||||||
| Year | Maui Coast Hotel Property | Competitive Set | Penetration Factor | ||||||
| Occupancy | ADR | RevPAR | Occupancy | ADR | RevPAR | Occupancy | ADR | RevPAR | |
| 2014 | 84.5% | $168.55 | $142.48 | 69.9% | $187.55 | $131.18 | 120.9% | 89.9% | 108.6% |
| T-12 Feb 2015 | 85.1% | $169.71 | $144.42 | 69.9% | $192.83 | $134.81 | 121.7% | 88.0% | 107.1% |
| (1) | Source: Hospitality Research Report. |
THE INFORMATION IN THIS STRUCTURAL AND COLLATERAL TERM SHEET IS NOT COMPLETE AND MAY BE AMENDED PRIOR TO THE TIME OF SALE. THIS TERM SHEET IS NOT AN OFFER TO SELL THESE SECURITIES AND IT IS NOT A SOLICITATION OF AN OFFER TO BUY THESE SECURITIES IN ANY JURISDICTION WHERE THE OFFER OR SALE IS NOT PERMITTED.
64
2259 South Kihei Road Kihei, HI 96753 | Collateral Asset Summary – Loan No. 5 Maui Coast Hotel | Cut-off Date Balance: Cut-off Date LTV: U/W NCF DSCR: U/W NOI Debt Yield: | $56,320,000 55.0% 2.77x 12.1% |
Demand in this submarket remains consistent throughout the year owing to Hawaii’s temperate and consistent climate. In recent years, market-wide occupancy was greater during the holiday periods, the winter months and the summertime when families tend to take vacations. As a destination leisure market with steady demand throughout the year, the Maui lodging market experiences consistent demand throughout the week.
According to the appraiser, the Maui Coast Hotel Property competitive set contains five hotels on the island of Maui totaling 1,428 rooms. The Maui Coast Hotel Property is unique in comparison to its competitive set in that it is the only full service, upscale hotel located in Kihei. The demand segmentation for the Maui Coast Hotel Property consists of 51% FIT, 35% contract, 12% wholesale and 2% meeting and group. Key demand drivers include contracts with airline crews and demand generated through internet sources including Hotwire, Orbitz and Expedia. The Maui Coast Hotel Property has created a niche in the airline crew market, benefitting from the dominance of luxury product on Maui and the relative scarcity of moderately priced competition among hotels. Airline contracts represented 27%, 29% and 40% of total room revenue in 2012, 2013 and 2014, respectively. The airline contracts with Westjet, United Airlines, American Airlines and Alaska Airlines drive the consistently high occupancy rate achieved at the Maui Coast Hotel Property.
Cash Flow Analysis.
| Cash Flow Analysis | |||||||
| 2012 | 2013 | 2014 | T-12 3/31/2015 | U/W | UW per Room | ||
| Occupancy | 87.1% | 85.0% | 84.4% | 85.1% | 85.0% | ||
| ADR | $135.49 | $150.49 | $168.94 | $172.83 | $172.83 | ||
| RevPAR | $117.94 | $127.93 | $142.52 | $147.04 | $146.91 | ||
| Room Revenue | $11,408,169 | $12,374,077 | $13,785,622 | $14,222,543 | $14,209,391 | $53,620 | |
| F&B Revenue | 26,452 | 0 | 96,000 | 96,000 | 96,000 | 362 | |
| Other Revenue | 849,581 | 861,090 | 864,556 | 851,157 | 871,061 | 3,287 | |
| Total Revenue | $12,284,202 | $13,235,167 | $14,746,178 | $15,169,700 | $15,176,452 | $57,270 | |
| Operating Expenses | 3,294,711 | 3,562,084 | 3,747,559 | 3,844,435 | 3,861,779 | 14,573 | |
| Undistributed Expenses | 3,723,566 | 3,590,447 | 3,797,907 | 3,810,421 | 3,908,721 | 14,750 | |
| Gross Operating Profit | $5,265,925 | $6,082,636 | $7,200,713 | $7,514,845 | $7,405,953 | $27,947 | |
| Total Fixed Charges | 550,259 | 536,537 | 491,894 | 493,250 | 572,462 | 2,160 | |
| Net Operating Income | $4,715,666 | $5,546,100 | $6,708,818 | $7,021,595 | $6,833,491 | $25,787 | |
| FF&E | 491,368 | 529,407 | 589,847 | 606,788 | 607,058 | 2,291 | |
| Net Cash Flow | $4,224,298 | $5,016,693 | $6,118,971 | $6,414,807 | $6,226,433 | $23,496 | |
Property Management. The Maui Coast Hotel Property is managed by Paramount Hotels LLC (the “Manager”), an affiliate of the borrower, owned and controlled by sponsor Rodney Olson (“Olson”).
Paramount Hotels LLC is based in Seattle, Washington and also manages the Paramount Hotels in Seattle and Portland. The original management agreement effective December 1, 1999 and amended on March 31, 2015, was for a term of five years, with automatic annual renewals unless terminated by either party with 60 days prior notice, provided that the borrower agrees not to terminate the Manager so long as (i) the Manager continues to own at least a 25.0% direct or indirect equity interest in the borrower and (ii) the Manager continues to be controlled by Olson, Olson’s wife or Olson’s son.
Lockbox / Cash Management. The Maui Coast Hotel Loan is structured with a hard lockbox and springing cash management. An excess cash flow sweep is required upon (i) the continuation of an event of default or (ii) the failure of the borrower as of any calculation date to maintain a debt yield greater than 8.5% (until such time that the debt yield is at least 8.5% for two consecutive calculation dates).
Initial Reserves. At closing, the borrower deposited (i) $42,000 into a tax reserve account and (ii) $287,867 into an insurance reserve account.
Ongoing Reserves. On a monthly basis, the borrower is required to make deposits of (i) 1/12 of the required annual taxes, which currently equates to $22,252, into a tax reserve account, (ii) 1/12 of the required annual insurance premiums, which currently equates to $23,989, into an insurance reserve account and (iii) 1/12 of 4.0% of such year’s gross income into a FF&E reserve account.
Current Mezzanine or Subordinate Indebtedness. None
Future Mezzanine or Subordinate Indebtedness Permitted. None.
THE INFORMATION IN THIS STRUCTURAL AND COLLATERAL TERM SHEET IS NOT COMPLETE AND MAY BE AMENDED PRIOR TO THE TIME OF SALE. THIS TERM SHEET IS NOT AN OFFER TO SELL THESE SECURITIES AND IT IS NOT A SOLICITATION OF AN OFFER TO BUY THESE SECURITIES IN ANY JURISDICTION WHERE THE OFFER OR SALE IS NOT PERMITTED.
65
2259 South Kihei Road Kihei, HI 96753 | Collateral Asset Summary – Loan No. 5 Maui Coast Hotel | Cut-off Date Balance: Cut-off Date LTV: U/W NCF DSCR: U/W NOI Debt Yield: | $56,320,000 55.0% 2.77x 12.1% |
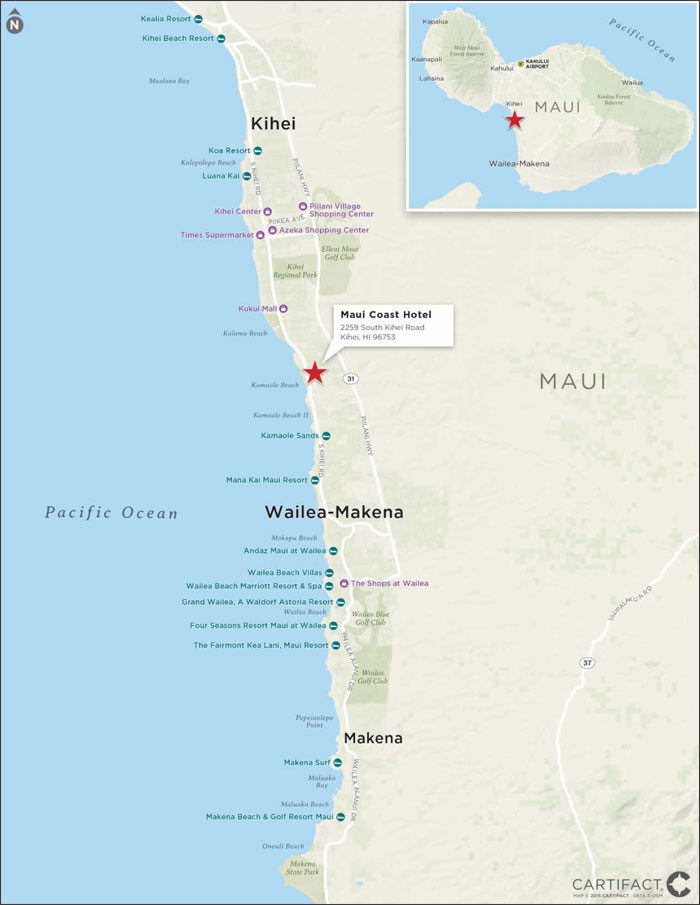
THE INFORMATION IN THIS STRUCTURAL AND COLLATERAL TERM SHEET IS NOT COMPLETE AND MAY BE AMENDED PRIOR TO THE TIME OF SALE. THIS TERM SHEET IS NOT AN OFFER TO SELL THESE SECURITIES AND IT IS NOT A SOLICITATION OF AN OFFER TO BUY THESE SECURITIES IN ANY JURISDICTION WHERE THE OFFER OR SALE IS NOT PERMITTED.
66
(THIS PAGE INTENTIONALLY LEFT BLANK)
67
15350-15400 Sherman Way Van Nuys, CA 91406 | Collateral Asset Summary – Loan No. 6 Sherman Plaza | Cut-off Date Balance: Cut-off Date LTV: U/W NCF DSCR: U/W NOI Debt Yield: | $48,700,000 69.9% 1.40x 9.0% |
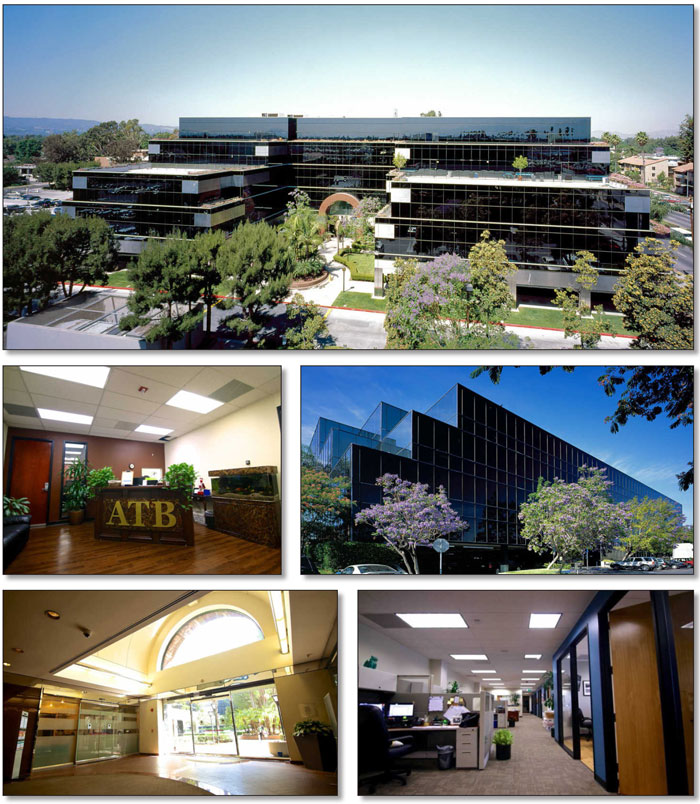
THE INFORMATION IN THIS STRUCTURAL AND COLLATERAL TERM SHEET IS NOT COMPLETE AND MAY BE AMENDED PRIOR TO THE TIME OF SALE. THIS TERM SHEET IS NOT AN OFFER TO SELL THESE SECURITIES AND IT IS NOT A SOLICITATION OF AN OFFER TO BUY THESE SECURITIES IN ANY JURISDICTION WHERE THE OFFER OR SALE IS NOT PERMITTED.
68
15350-15400 Sherman Way Van Nuys, CA 91406 | Collateral Asset Summary – Loan No. 6 Sherman Plaza | Cut-off Date Balance: Cut-off Date LTV: U/W NCF DSCR: U/W NOI Debt Yield: | $48,700,000 69.9% 1.40x 9.0% |
| Mortgage Loan Information | |
| Loan Seller: | CCRE |
| Loan Purpose: | Refinance |
| Sponsor: | Adam Saitman; Alan Marsh; David Fradin; Brian Lezak; Michael Fradin |
| Borrower: | Majestic Office Park Owner, LLC |
| Original Balance: | $48,700,000 |
| Cut-off Date Balance: | $48,700,000 |
| % by Initial UPB: | 3.6% |
| Interest Rate: | 4.3250% |
| Payment Date: | 6th of each month |
| First Payment Date: | May 6, 2015 |
| Maturity Date: | April 6, 2025 |
| Amortization: | Interest only for first 36 months; 360 months thereafter |
| Additional Debt: | None |
| Call Protection: | L(25), D(90), O(5) |
| Lockbox / Cash Management: | Hard / Springing |
Reserves(1) | ||
| Initial | Monthly | |
| Taxes: | $164,250 | $54,750 |
| Insurance: | $40,300 | $3,664 |
| Replacement: | $0 | $4,461 |
| TI/LC: | $1,250,000 | $22,303 |
Recent Leasing(2): | $605,525 | $0 |
| Lease Sweep Period: | $0 | Springing |
| Financial Information | ||
| Cut-off Date Balance / Sq. Ft.: | $182 | |
| Balloon Balance / Sq. Ft.: | $159 | |
| Cut-off Date LTV: | 69.9% | |
| Balloon LTV: | 60.9% | |
Underwritten NOI DSCR(3): | 1.51x | |
Underwritten NCF DSCR(3): | 1.40x | |
| Underwritten NOI Debt Yield: | 9.0% | |
| Underwritten NCF Debt Yield: | 8.3% | |
| Underwritten NOI Debt Yield at Balloon: | 10.3% | |
| Underwritten NCF Debt Yield at Balloon: | 9.5% | |
| Property Information | |
| Single Asset / Portfolio: | Single Asset |
| Property Type: | Suburban Office |
| Collateral: | Fee Simple |
| Location: | Van Nuys, CA |
| Year Built / Renovated: | 1983, 1988 / 2008-2009 |
| Total Sq. Ft.: | 267,648 |
| Property Management: | Majestic Asset Management, Inc. |
| Underwritten NOI: | $4,370,466 |
| Underwritten NCF: | $4,049,288 |
| Appraised Value: | $69,700,000 |
| Appraisal Date: | January 12, 2015 |
| Historical NOI | |
2014 NOI(4): | $4,281,269 (December 31, 2014) |
| 2013 NOI: | $4,745,406 (December 31, 2013) |
| 2012 NOI: | $4,489,204 (December 31, 2012) |
Historical Occupancy(5) | |
| Most Recent Occupancy: | 93.2% (February 28, 2015)(6) |
| 2014 Occupancy: | 93.2% (December 31, 2014) |
| 2013 Occupancy: | 95.8% (December 31, 2013) |
| 2012 Occupancy: | 95.1% (December 31, 2012) |
| (1) | See “Initial Reserves” and “Ongoing Reserves” herein. |
| (2) | At closing, the borrower deposited $334,241 for outstanding TI/LC and $271,284 for outstanding free rent related to three recently executed leases, which includes approximately $92,059 for North Los Angeles Regional Center, Inc.’s expansion space of approximately 8,369 sq. ft. |
| (3) | Based on amortizing payments. Based on the current interest only debt service payments, the Underwritten NOI DSCR and Underwritten NCF DSCR are 2.05x and 1.90x, respectively. |
| (4) | The decrease in Historical NOI from 2013 to 2014 is primarily due to the State of California State Board of Equalization vacating approximately 26,000 sq. ft. in December 2014. Since the CBOE vacated, the sponsor has executed leases for approximately 28,553 sq. ft. at the Sherman Plaza Property. |
| (5) | Since 2006, the Sherman Plaza Property has maintained an average occupancy of approximately 95.4%. |
| (6) | Most Recent Occupancy includes two recently executed leases for which the tenants have not yet taken occupancy, representing in the aggregate approximately 6.7% of NRA. |
THE INFORMATION IN THIS STRUCTURAL AND COLLATERAL TERM SHEET IS NOT COMPLETE AND MAY BE AMENDED PRIOR TO THE TIME OF SALE. THIS TERM SHEET IS NOT AN OFFER TO SELL THESE SECURITIES AND IT IS NOT A SOLICITATION OF AN OFFER TO BUY THESE SECURITIES IN ANY JURISDICTION WHERE THE OFFER OR SALE IS NOT PERMITTED.
69
15350-15400 Sherman Way Van Nuys, CA 91406 | Collateral Asset Summary – Loan No. 6 Sherman Plaza | Cut-off Date Balance: Cut-off Date LTV: U/W NCF DSCR: U/W NOI Debt Yield: | $48,700,000 69.9% 1.40x 9.0% |
| Tenant Summary | |||||||
Tenant | Ratings (Fitch/Moody’s/S&P)(1) | Net Rentable Area (Sq. Ft.) | % of Net Rentable Area | U/W Base Rent PSF | % of Total U/W Base Rent | Lease Expiration | |
| North Los Angeles Regional Center, Inc. | NR/NR/NR | 78,727(2) | 29.4% | $28.12 | 32.4% | 2/29/2020(3) | |
| The State of California | A+/Aa3/A+ | 47,394 | 17.7% | $28.63 | 19.8% | Various(4) | |
| GSA – Public Buildings Service | AAA/Aaa/AA+ | 26,163 | 9.8% | $24.89 | 9.5% | 8/31/2016(5) | |
| HemaCare Corporation | NR/NR/NR | 25,379 | 9.5% | $30.18 | 11.2% | 7/31/2017(6) | |
| Interviewing Services of America, Inc. | NR/NR/NR | 19,459 | 7.3% | $23.48 | 6.7% | 1/31/2020(7) | |
| Total Major Tenants | 197,122 | 73.6% | $27.62 | 79.6% | |||
| Remaining Tenants | 52,458 | 19.6% | $26.56 | 20.4% | |||
| Total Occupied Collateral | 249,580 | 93.2% | $27.40 | 100.0% | |||
| Vacant | 18,068 | 6.8% | |||||
| Total | 267,648 | 100.0% | |||||
| (1) | Certain ratings may be those of the parent company whether or not the parent company guarantees the lease. |
| (2) | North Los Angeles Regional Center, Inc.’s Net Rentable Area (Sq. Ft.) does not include an additional 2,924 sq. ft., which is subleased from LISI, Inc. |
| (3) | North Los Angeles Regional Center, Inc. has two coterminous leases, each with two, five-year renewal options. North Los Angeles Regional Center, Inc. has the one-time right with respect to 70,358 sq. ft. to terminate all or a portion of such space effective October 31, 2016 with written notice no later than January 1, 2016 subject to an early termination fee. |
| (4) | The State of California is comprised of five leases: 22,457 sq. ft. with an expiration date of July 31, 2017 and termination option at any time with 60 days’ notice; 9,693 sq. ft. with an expiration date of June 30, 2019 and termination option any time after June 30, 2015 with 30 days’ notice; 9,052 sq. ft. with an expiration date of March 31, 2020 and termination option any time after March 31, 2016 with 90 days’ notice; 4,406 sq. ft. with an expiration date of June 30, 2018 and termination option at any time with 90 days’ notice; 1,786 sq. ft. with an expiration date of September 30, 2016 and termination option at any time with 30 days’ notice. |
| (5) | GSA – Public Buildings Service may terminate its lease at any time with 90 days’ notice. |
| (6) | HemaCare Corporation has one, five-year renewal option. |
| (7) | Interviewing Services of America, Inc. has one, five-year renewal option. Additionally, Interviewing Services of America, Inc. may terminate its lease effective July 30, 2018 with nine months’ notice. |
THE INFORMATION IN THIS STRUCTURAL AND COLLATERAL TERM SHEET IS NOT COMPLETE AND MAY BE AMENDED PRIOR TO THE TIME OF SALE. THIS TERM SHEET IS NOT AN OFFER TO SELL THESE SECURITIES AND IT IS NOT A SOLICITATION OF AN OFFER TO BUY THESE SECURITIES IN ANY JURISDICTION WHERE THE OFFER OR SALE IS NOT PERMITTED.
70
15350-15400 Sherman Way Van Nuys, CA 91406 | Collateral Asset Summary – Loan No. 6 Sherman Plaza | Cut-off Date Balance: Cut-off Date LTV: U/W NCF DSCR: U/W NOI Debt Yield: | $48,700,000 69.9% 1.40x 9.0% |
Lease Rollover Schedule(1) | ||||||||
| Year | # of Leases Expiring | Total Expiring Sq. Ft. | % of Total Sq. Ft. Expiring | Cumulative Sq. Ft. Expiring | Cumulative % of Sq. Ft. Expiring | Annual U/W Base Rent PSF | % U/W Base Rent Rolling | Cumulative % of U/W Base Rent |
| MTM | 1 | 704 | 0.3% | 704 | 0.3% | $26.40 | 0.3% | 0.3% |
| 2015 | 1 | 2,924 | 1.1% | 3,628 | 1.4% | $27.00 | 1.2% | 1.4% |
| 2016 | 7 | 40,443(2) | 15.1% | 44,071 | 16.5% | $25.76 | 15.2% | 16.7% |
| 2017 | 9 | 63,798(2) | 23.8% | 107,869 | 40.3% | $29.28 | 27.3% | 44.0% |
| 2018 | 3 | 6,922(2) | 2.6% | 114,791 | 42.9% | $26.57 | 2.7% | 46.7% |
| 2019 | 1 | 9,693(2) | 3.6% | 124,484 | 46.5% | $27.68 | 3.9% | 50.6% |
| 2020 | 5 | 116,399(2) | 43.5% | 240,883 | 90.0% | $27.05 | 46.0% | 96.6% |
| 2021 | 1 | 8,697 | 3.2% | 249,580 | 93.2% | $26.40 | 3.4% | 100.0% |
| 2022 | 0 | 0 | 0.0% | 249,580 | 93.2% | $0.00 | 0.0% | 100.0% |
| 2023 | 0 | 0 | 0.0% | 249,580 | 93.2% | $0.00 | 0.0% | 100.0% |
| 2024 | 0 | 0 | 0.0% | 249,580 | 93.2% | $0.00 | 0.0% | 100.0% |
| 2025 | 0 | 0 | 0.0% | 249,580 | 93.2% | $0.00 | 0.0% | 100.0% |
| Thereafter | 0 | 0 | 0.0% | 249,580 | 93.2% | $0.00 | 0.0% | 100.0% |
| Vacant | NAP | 18,068 | 6.8% | 267,648 | 100.0% | NAP | NAP | |
| Total / Wtd. Avg. | 28 | 267,648 | 100.0% | $27.40 | 100.0% | |||
| (1) | Certain tenants may have lease termination options that may become exercisable prior to the originally stated expiration date of the tenant lease that are not considered in the lease rollover schedule. |
| (2) | The Sherman Plaza Loan is structured with a full excess cash sweep in connection to the expiration of the North Los Angeles Regional Center, Inc., GSA-Public Buildings Service, The State of California and HemaCare Corporation leases. See “Lockbox / Cash Management” herein. |
The Loan. The Sherman Plaza loan (the “Sherman Plaza Loan”) is a fixed rate loan with an original principal balance of $48.7 million, secured by the borrower’s fee simple interest in a two-building, 267,648 sq. ft. office building complex (the “Sherman Plaza Property”) located in Van Nuys, California. The Sherman Plaza Loan has a 10-year term and is interest only for the first 36 months of the term and amortizes on a 30-year schedule thereafter. The Sherman Plaza Loan accrues interest at a fixed rate equal to 4.3250% and has a cut-off date balance of approximately $48.7 million. Based on the appraised value of $69.7 million as of January 12, 2015, the cut-off date LTV ratio is 69.9%. Loan proceeds along with approximately $2.4 million of equity from the sponsors were used to retire existing debt of approximately $47.7 million, fund reserves of approximately $2.1 million and pay closing costs of approximately $1.3 million. The most recent prior financing of the Sherman Plaza Property was included in the BACM 2006-3 securitization.
| Sources and Uses | ||||||
| Sources | Proceeds | % of Total | Uses | Proceeds | % of Total | |
| Loan Amount | $48,700,000 | 95.4% | Loan Payoff | $47,738,970 | 93.5% | |
| Sponsor Equity | $2,358,806 | 4.6% | Reserves | $2,060,075 | 4.0% | |
| Closing Costs | $1,259,761 | 2.5% | ||||
| Total Sources | $51,058,806 | 100.0% | Total Uses | $51,058,806 | 100.0% | |
The Borrower / Sponsor. The borrower, Majestic Office Park Owner, LLC, is a Delaware limited liability company and single purpose entity structured to be bankruptcy-remote, with two independent directors in its organizational structure. The sponsors of the borrower and non-recourse carve-out guarantors are Adam Saitman, Alan Marsh, David Fradin, Brian Lezak and Michael Fradin on a joint and several basis.
Brian Lezak and David Fradin are the president and chief financial officer of Majestic Asset Management (“Majestic”), respectively. Majestic is a full service real estate company that specializes in the development, acquisition and management of commercial real estate. Majestic, and its affiliated entities, collectively manage a portfolio of 15 commercial properties totaling approximately 1.0 million sq. ft. located in the Los Angeles region as well as 20 multifamily properties. Majestic is headquartered at the Sherman Plaza Property.
The Property. The Sherman Plaza Property consists of a two-building, Class A office complex that contains 267,648 sq. ft. situated approximately 21.0 miles northwest of downtown Los Angeles on approximately 9.5 acres of land. The Sherman Plaza Property is located in Van Nuys within the greater San Fernando Valley region.
The Sherman Plaza Property was constructed in 1983 and 1988 and most recently renovated in 2008 and 2009 for approximately $2.1 million. Recent improvements include HVAC replacements, restroom renovations and signage upgrades. Since 2005, the Sherman Plaza Property has undergone approximately $3.7 million of capital expenditures. In 2011, the Sherman Plaza Property was awarded the Energy Star Label. The Sherman Plaza Property features an on-site café, on-site management, 24-hour security guards and gated and valet parking. Common areas include polished granite flooring and landscaped exteriors. The Sherman Plaza Property offers 901 parking spaces via subterranean parking at each building as well surface parking.
THE INFORMATION IN THIS STRUCTURAL AND COLLATERAL TERM SHEET IS NOT COMPLETE AND MAY BE AMENDED PRIOR TO THE TIME OF SALE. THIS TERM SHEET IS NOT AN OFFER TO SELL THESE SECURITIES AND IT IS NOT A SOLICITATION OF AN OFFER TO BUY THESE SECURITIES IN ANY JURISDICTION WHERE THE OFFER OR SALE IS NOT PERMITTED.
71
15350-15400 Sherman Way Van Nuys, CA 91406 | Collateral Asset Summary – Loan No. 6 Sherman Plaza | Cut-off Date Balance: Cut-off Date LTV: U/W NCF DSCR: U/W NOI Debt Yield: | $48,700,000 69.9% 1.40x 9.0% |
The Sherman Plaza Property is 93.2% occupied by 18 tenants as of February 28, 2015. The largest tenant, North Los Angeles Regional Center, Inc. leases 78,727 sq. ft., 29.4% of the total net rental area (“NRA”) and accounts for 32.4% of the U/W base rent. The second largest tenant, The State of California (A+/Aa3/A+ by Fitch/Moody’s/S&P), leases 47,394 sq. ft., 17.7% of NRA and accounts for 19.8% of U/W base rent. The third largest tenant, GSA – Public Buildings Service (AAA/Aaa/AA+ by Fitch/Moody’s/S&P), leases 26,163 sq. ft., 9.8% of NRA and accounts for 9.5% of U/W base rent. Excluding the five largest tenants, no other tenant leases more than 3.4% of the total NRA. Approximately 27.5% of the total NRA is occupied by investment grade tenants.
In December 2014, the State of California State Board of Equalization (“CBOE”) vacated approximately 26,000 sq. ft. at the Sherman Plaza Property due to the redrawing of district maps. Since the CBOE vacated, the sponsor has executed leases for approximately 28,553 sq. ft. at the Sherman Plaza Property. The Sherman Plaza Property has maintained an average occupancy of approximately 95.4% since 2006.
Environmental Matters. The Phase I environmental report dated March 19, 2015 recommended the development and implementation of an asbestos operation and maintenance plan at the Sherman Plaza Property, which is currently in place. Environmental insurance, purchased in lieu of Phase II environmental assessments, was issued by Steadfast Insurance Company. Such insurance has a $3.0 million aggregate limit covering a 10 year period coterminous with the Sherman Plaza Loan with an endorsement indicating the policy may be extending for an additional three years.
Major Tenants.
North Los Angeles Regional Center, Inc. (78,727 sq. ft.; 29.4% of NRA; 32.4% of U/W Base Rent) North Los Angeles Regional Center, Inc. (“NLARC”) is one of 21, non-profit organizations under contract with the California Department of Developmental Services to coordinate and provide community-based services to persons with developmental disabilities. NLARC has been active in the San Fernando, Santa Clarita and Antelope Valleys for more than 35 years and currently serve over 18,000 individuals and their families. NLARC occupies 78,727 sq. ft. over two leases, both of which expire in February 2020. Each lease has two, five-year renewal options. In addition, NLARC subleases approximately 2,924 sq. ft., which is subleased from LISI, Inc. NLARC has been a tenant at the Sherman Plaza Property since 2005.
The State of California (47,394 sq. ft.; 17.7% of NRA; 19.8% of U/W Base Rent; A+/Aa3/A+ by Fitch/Moody’s/S&P) The State of California occupies 47,394 sq. ft. over five leases. The State of California divisions at the Sherman Plaza Property include Employment Development Department, Unemployment Insurance Appeals Board, Franchise Tax Board and Special Education Division of the Office of Administrative Hearings. The State of California is comprised of five leases: 22,457 sq. ft. with an expiration date of July 31, 2017; 9,963 sq. ft. with an expiration date of June 30, 2019; 9,052 sq. ft. with an expiration date of March 31, 2020; 4,406 sq. ft. with an expiration date of June 30, 2018; 1,786 sq. ft. with an expiration date of September 30, 2016. The State of California has been a tenant at the Sherman Plaza Property since 1999.
GSA – Public Buildings Service (26,163 sq. ft.; 9.8% of NRA; 9.5% of U/W Base Rent; AAA/Aaa/AA+ by Fitch/Moody’s/S&P) GSA – Public Buildings Services space is occupied by the U.S. Census Bureau’s Los Angeles regional office, which is responsible for all data collection, data dissemination, and geographic operations under its area boundary. Another primary responsibility of the regional office is sourcing and vetting surveyors in order to complete census research. States within the Los Angeles Region’s service area include Alaska, California, Hawaii, Idaho, Nevada, Oregon and Washington. GSA – Public Buildings Services has been a tenant at the Sherman Plaza Property since 2006 and its lease expires in August 2016.
HemaCare Corporation (25,379 sq. ft.; 9.5% of NRA; 11.2% of U/W Base Rent) – HemaCare Corporation (“HemaCare”) is a global provider of biological blood products and services since 1978. HemaCare, provides human-derived primary blood cells and tissues for advanced biomedical research, supports cell therapy clinical trials and commercialization with apheresis collections, and provides a wide range of consulting services in “standard operating procedures” development and regulatory compliance. HemaCare has been a tenant at the Sherman Plaza Property since 2006 and its lease expires in July 2017 with one, five-year renewal option remaining.
Interviewing Services of America, Inc. (19,459 sq. ft.; 7.3% of NRA; 6.7% of U/W Base Rent) – Since 1982, Interviewing Services of America, Inc. (“ISA”) has been a premier data collection, management and processing provider. Offerings include telephone, online and face-to-face data collections as well as survey programming, data processing and sampling services. ISA is headquartered at the Sherman Plaza Property and has been a tenant since 2008. ISA’s lease expires in January 2020 and has one, five-year renewal option.
Market. The Sherman Plaza Property is located in the Van Nuys neighborhood of the city of Los Angeles, within the greater San Fernando Valley. Development in the San Fernando Valley is highly diversified with residential, retail and office components of the market being in high demand. The Sherman Plaza Property is located within the greater 218 million sq. ft. Los Angeles County office market and more specifically, within the San Fernando Valley office submarket. The Sherman Plaza Property is located within approximately 0.5 miles of Interstate 405, a heavily traveled north-south freeway providing access from Irvine to the San Fernando Valley, and approximately 3.5 miles of Ventura Freeway, the principal east-west route through Ventura County and the southern San Fernando Valley.
THE INFORMATION IN THIS STRUCTURAL AND COLLATERAL TERM SHEET IS NOT COMPLETE AND MAY BE AMENDED PRIOR TO THE TIME OF SALE. THIS TERM SHEET IS NOT AN OFFER TO SELL THESE SECURITIES AND IT IS NOT A SOLICITATION OF AN OFFER TO BUY THESE SECURITIES IN ANY JURISDICTION WHERE THE OFFER OR SALE IS NOT PERMITTED.
72
15350-15400 Sherman Way Van Nuys, CA 91406 | Collateral Asset Summary – Loan No. 6 Sherman Plaza | Cut-off Date Balance: Cut-off Date LTV: U/W NCF DSCR: U/W NOI Debt Yield: | $48,700,000 69.9% 1.40x 9.0% |
As of Q3 2014, the San Fernando Valley market contained an overall inventory of approximately 20.7 million sq. ft. with a vacancy rate of 14.4%. The San Fernando Valley market accounts for approximately 10.4% of the total rentable area for the Los Angeles county, which reported a vacancy rate of 16.0%. As of Q3 2014, the Van Nuys submarket contained an overall inventory of approximately 960,000 sq. ft. with a vacancy rate of 6.1%. From Q4 2003 to Q3 2014, the Van Nuys submarket maintained an average vacancy of 8.1%, outperforming the greater San Fernando Valley market average of 13.1%. In 2014, the population and median income within a three-mile radius of the Sherman Plaza Property was approximately 311,223 and $42,149, respectively. As of February 2015, the unemployment rate in Los Angeles County was 7.7%.
Underwritten base rent for office is approximately $27.40 PSF, which is slightly above the appraisal’s market conclusion of $26.40 PSF. The appraiser identified seven comparable offices within the Sherman Plaza Property’s market. A summary of the seven comparable offices is shown in the chart below.
Comparable Properties(1) | |||||
| Property | City, State | Year Built | NRA (Sq. Ft.) | Occupancy | Rent PSF |
| Sherman Plaza Property | Van Nuys, CA | 1983, 1988 | 267,648 | 93%(2) | $27.40(3) |
| 5085 Sepulveda | Van Nuys, CA | 1990 | 87,418 | 77% | $30.00 |
| Republic Center I | Van Nuys, CA | 1979 | 70,000 | 76% | $21.60 |
| Tri-Center Plaza | Van Nuys, CA | 1990 | 143,000 | 99% | NAV |
| 8510-8550 Balboa Boulevard | Northridge, CA | 1986 | 160,366 | 97% | $25.80 |
| Valley Office Plaza | Sherman Oaks, CA | 1966 | 197,807 | 81% | NAV |
| Sherman Oaks Atrium | Sherman Oaks, CA | 1985 | 92,996 | 78% | $24.00 |
| Columbus Center | Sherman Oaks, CA | 1987 | 63,495 | 97% | $23.40 |
Total / Wtd. Avg.(5) | 815,082 | 87% | $26.40(4) | ||
(1) | Source: Appraisal. |
(2) | The appraiser concluded a stabilized occupancy of 96.0% for the Sherman Plaza Property. |
(3) | Represents underwritten base rent at the Sherman Plaza Property. |
(4) | The appraiser determined an average market rent of $26.40 PSF. |
(5) | Total / Wtd. Avg. excludes the Sherman Plaza Property. |
Cash Flow Analysis.
| Cash Flow Analysis | |||||
| 2012 | 2013 | 2014 | U/W | U/W PSF | |
Base Rent(1)(2) | $6,918,776 | $7,078,921 | $6,800,617 | $6,837,804 | $25.55 |
| Value of Vacant Space | 0 | 0 | 0 | 476,995 | 1.78 |
| Gross Potential Rent | $6,918,776 | $7,078,921 | $6,800,617 | $7,314,799 | $27.33 |
| Total Recoveries | 120,470 | 213,974 | 103,769 | 118,524 | 0.44 |
| Total Other Income | 172,354 | 151,832 | 111,838 | 161,838 | 0.60 |
Less: Vacancy(3) | 0 | 0 | 0 | (521,788) | (1.95) |
| Effective Gross Income | $7,211,601 | $7,444,727 | $7,016,224 | $7,073,373 | $26.43 |
| Total Operating Expenses | 2,722,397 | 2,699,321 | 2,734,955 | 2,702,907 | 10.10 |
| Net Operating Income | $4,489,204 | $4,745,406 | $4,281,269 | $4,370,466 | $16.33 |
| TI/LC | 0 | 0 | 0 | 267,648 | 1.00 |
| Capital Expenditures | 0 | 0 | 0 | 53,530 | 0.20 |
| Net Cash Flow | $4,489,204 | $4,745,406 | $4,281,269 | $4,049,288 | $15.13 |
(1) | U/W Base Rent includes $44,792 of contractual rent steps through December 2015 for tenants without termination options. |
(2) | The decrease in Base Rent from 2013 to 2014 is primarily due to the State of California State Board of Equalization vacating approximately 26,000 sq. ft. in December 2014. Since the CBOE vacated, the sponsor has executed leases for approximately 28,553 sq. ft. at the Sherman Plaza Property. The Sherman Plaza Property has maintained an average occupancy of approximately 95.4% since 2006. |
(3) | U/W Vacancy is based on an economic vacancy of 7.0% of Gross Potential Rent and Total Recoveries, which is greater than the appraiser’s concluded vacancy of 4.0% and in-place economic vacancy of 6.3%. The Sherman Plaza Property is 93.2% occupied as of February 28, 2015. |
Property Management. The Sherman Plaza Property is managed by Majestic Asset Management, Inc., which is an affiliate of the borrower.
THE INFORMATION IN THIS STRUCTURAL AND COLLATERAL TERM SHEET IS NOT COMPLETE AND MAY BE AMENDED PRIOR TO THE TIME OF SALE. THIS TERM SHEET IS NOT AN OFFER TO SELL THESE SECURITIES AND IT IS NOT A SOLICITATION OF AN OFFER TO BUY THESE SECURITIES IN ANY JURISDICTION WHERE THE OFFER OR SALE IS NOT PERMITTED.
73
15350-15400 Sherman Way Van Nuys, CA 91406 | Collateral Asset Summary – Loan No. 6 Sherman Plaza | Cut-off Date Balance: Cut-off Date LTV: U/W NCF DSCR: U/W NOI Debt Yield: | $48,700,000 69.9% 1.40x 9.0% |
Lockbox / Cash Management. The Sherman Plaza Loan is structured with a hard lockbox and springing cash management. In place cash management and full excess cash flow sweep will occur upon (i) any event of default, (ii) any bankruptcy action of borrower principal, guarantor or manager, (iii) the failure by the borrower to maintain a debt service coverage ratio of at least 1.15x at the end of any calendar quarter, until the debt service coverage ratio is at least 1.20x for two consecutive calendar quarters (“Low Debt Service Period”) or (iv) the occurrence of a Lease Sweep Period (as defined herein).
The borrower may prevent or cure in place cash management and a full excess cash sweep triggered by a Low Debt Service Period by providing lender with an acceptable letter of credit or cash collateral in an amount which, if applied to the payment of the principal amount of the Sherman Plaza Loan, would cause the debt service coverage ratio to be at least 1.20x. Notwithstanding the foregoing, if the debt service coverage ratio is not greater than 1.20x for two years after the initial commencement of the trigger, a Low Debt Service Period will recommence.
A “Lease Sweep Period” will commence upon, with respect to each Lease Sweep Lease (as defined herein), (i) 12 months prior to the earliest stated expiration, (ii) the date upon which the tenant (a) fails to exercise a renewal option, (b) gives notices of its right to exercise its termination option, if applicable, (c) fails to occupy or “goes dark” in at least 50.0% of its space unless the tenant is rated investment grade by two approved rating agencies and does not have any termination options, among other things, (d) is involved in a bankruptcy action or is in default under its lease or (iii) with respect to GSA - Public Buildings Service and/or The State of California, the tenant or respective parent company is no longer rated investment grade by S&P or an equivalent rating agency.
A “Lease Sweep Lease” means the lease(s) individually or collectively with respect to (i) North Los Angeles Regional Center, Inc., (ii) GSA-Public Buildings Service, (iii) The State of California, (iv) HemaCare Corporation and/or (iv) any replacement tenant.
Initial Reserves. At closing, the borrower deposited (i) $164,250 into a tax reserve account, (ii) $40,300 into an insurance reserve account, (iii) $1,250,000 into a TI/LC reserve deposit account for tenant turnover, lease renewal or lease-up of current vacant space, (iv) $334,241 for outstanding leasing commissions and tenant improvements associated with recent leasing and (v) $271,284 into a free rent reserve account for outstanding free rent associated with recent leasing, which includes approximately $92,059 for North Los Angeles Regional Center, Inc.’s expansion space of approximately 8,369 sq. ft.
Ongoing Reserves. On a monthly basis, the borrower is required to make deposits of (i) 1/12 of the required annual taxes, which currently equates to $54,750, (ii) 1/12 of the required insurance premiums, which currently equates to $3,664, (iii) $22,303 ($1.00 PSF annually) into a TI/LC reserve account, subject to a cap of $1,350,000 and (iv) $4,461 ($0.20 PSF annually) into a capital expenditures reserve account, subject to a cap of $270,000. Additionally, upon the occurrence of a Lease Sweep Period, all excess cash flow will be deposited into a specified lease sweep reserve account.
Current Mezzanine or Subordinate Indebtedness. None.
Future Mezzanine or Subordinate Indebtedness Permitted. None.
THE INFORMATION IN THIS STRUCTURAL AND COLLATERAL TERM SHEET IS NOT COMPLETE AND MAY BE AMENDED PRIOR TO THE TIME OF SALE. THIS TERM SHEET IS NOT AN OFFER TO SELL THESE SECURITIES AND IT IS NOT A SOLICITATION OF AN OFFER TO BUY THESE SECURITIES IN ANY JURISDICTION WHERE THE OFFER OR SALE IS NOT PERMITTED.
74
15350-15400 Sherman Way Van Nuys, CA 91406 | Collateral Asset Summary – Loan No. 6 Sherman Plaza | Cut-off Date Balance: Cut-off Date LTV: U/W NCF DSCR: U/W NOI Debt Yield: | $48,700,000 69.9% 1.40x 9.0% |
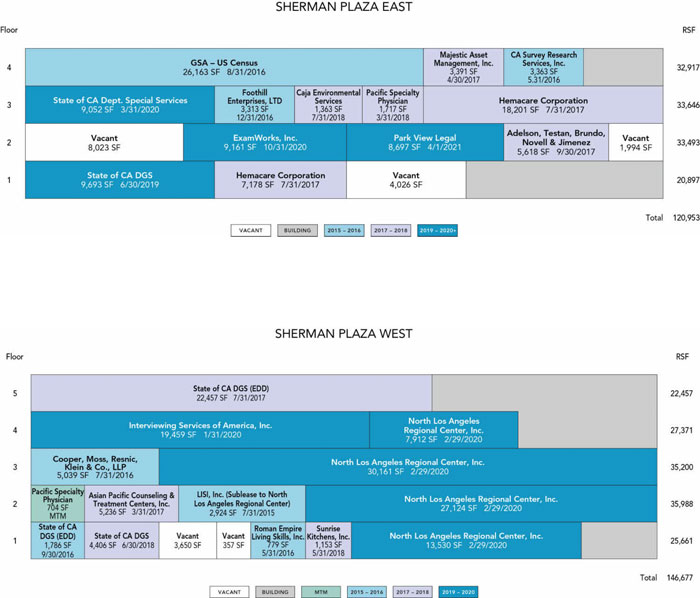
THE INFORMATION IN THIS STRUCTURAL AND COLLATERAL TERM SHEET IS NOT COMPLETE AND MAY BE AMENDED PRIOR TO THE TIME OF SALE. THIS TERM SHEET IS NOT AN OFFER TO SELL THESE SECURITIES AND IT IS NOT A SOLICITATION OF AN OFFER TO BUY THESE SECURITIES IN ANY JURISDICTION WHERE THE OFFER OR SALE IS NOT PERMITTED.
75
15350-15400 Sherman Way Van Nuys, CA 91406 | Collateral Asset Summary – Loan No. 6 Sherman Plaza | Cut-off Date Balance: Cut-off Date LTV: U/W NCF DSCR: U/W NOI Debt Yield: | $48,700,000 69.9% 1.40x 9.0% |
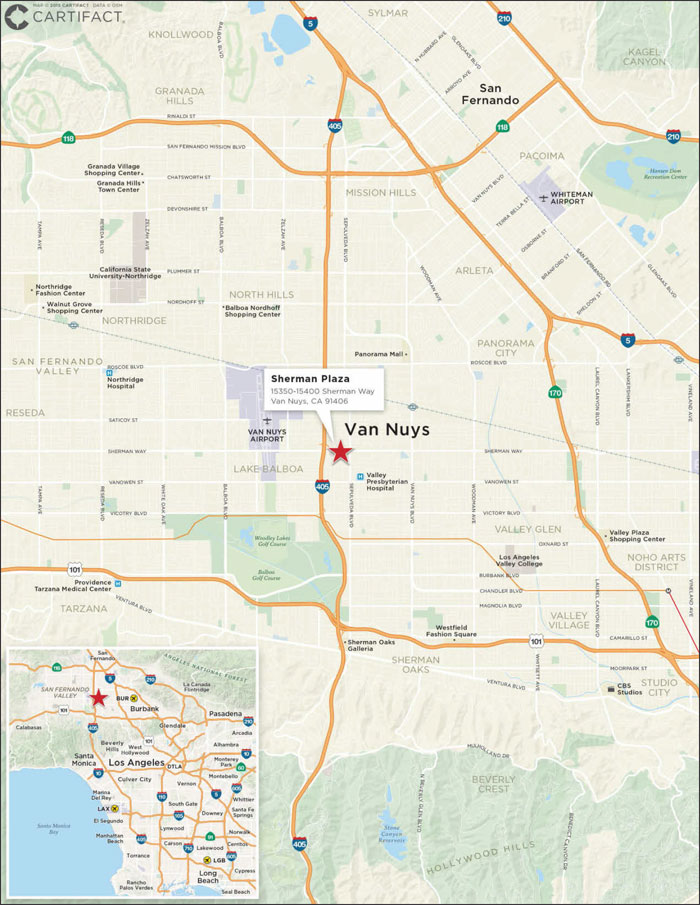
THE INFORMATION IN THIS STRUCTURAL AND COLLATERAL TERM SHEET IS NOT COMPLETE AND MAY BE AMENDED PRIOR TO THE TIME OF SALE. THIS TERM SHEET IS NOT AN OFFER TO SELL THESE SECURITIES AND IT IS NOT A SOLICITATION OF AN OFFER TO BUY THESE SECURITIES IN ANY JURISDICTION WHERE THE OFFER OR SALE IS NOT PERMITTED.
76
(THIS PAGE INTENTIONALLY LEFT BLANK)
77
8685 Baymeadows Road East Jacksonville, FL 32256 | Collateral Asset Summary – Loan No. 7 Hacienda Club | Cut-off Date Balance: Cut-off Date LTV: U/W NCF DSCR: U/W NOI Debt Yield: | $39,916,155 69.7% 1.20x 8.2% |
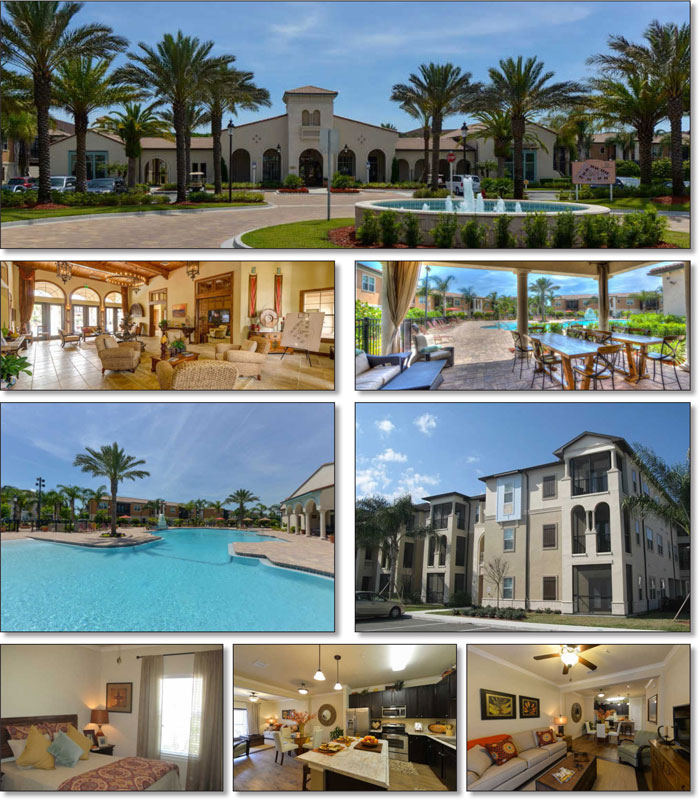
THE INFORMATION IN THIS STRUCTURAL AND COLLATERAL TERM SHEET IS NOT COMPLETE AND MAY BE AMENDED PRIOR TO THE TIME OF SALE. THIS TERM SHEET IS NOT AN OFFER TO SELL THESE SECURITIES AND IT IS NOT A SOLICITATION OF AN OFFER TO BUY THESE SECURITIES IN ANY JURISDICTION WHERE THE OFFER OR SALE IS NOT PERMITTED.
78
8685 Baymeadows Road East Jacksonville, FL 32256 | Collateral Asset Summary – Loan No. 7 Hacienda Club | Cut-off Date Balance: Cut-off Date LTV: U/W NCF DSCR: U/W NOI Debt Yield: | $39,916,155 69.7% 1.20x 8.2% |
| Mortgage Loan Information | |
| Loan Seller: | JLC |
| Loan Purpose: | Refinance |
| Sponsor: | Donald C. Fort |
| Borrower: | The Hacienda Club Rental Community, LLC |
| Original Balance: | $40,000,000 |
| Cut-off Date Balance: | $39,916,155 |
| % by Initial UPB: | 2.9% |
| Interest Rate: | 5.3750% |
| Payment Date: | 6th of each month |
| First Payment Date: | April 6, 2014 |
| Maturity Date: | March 6, 2025 |
Amortization(1): | Interest only for first 12 months; 360 months thereafter |
| Additional Debt: | None |
| Call Protection: | L(38), D(90), O(4) |
| Lockbox / Cash Management: | Soft / Springing |
Reserves(2) | ||
| Initial | Monthly | |
| Taxes: | $247,200 | $49,440 |
| Insurance: | $110,487 | $9,899 |
| Replacement: | $0 | Springing |
| Construction Reserve: | $2,547,562 | NAP |
| Debt Service Reserve: | $1,075,000 | NAP |
| Stabilization Reserve: | $4,300,000 | NAP |
| Financial Information | |||
| Cut-off Date Balance / Unit: | $133,054 | ||
| Balloon Balance / Unit: | $110,978 | ||
| Cut-off Date LTV: | 69.7% | ||
| Balloon LTV: | 58.1% | ||
| Underwritten NOI DSCR: | 1.22x | ||
| Underwritten NCF DSCR: | 1.20x | ||
| Underwritten NOI Debt Yield: | 8.2% | ||
| Underwritten NCF Debt Yield: | 8.1% | ||
| Underwritten NOI Debt Yield at Balloon: | 9.9% | ||
| Underwritten NCF Debt Yield at Balloon: | 9.7% | ||
| Property Information | |||
| Single Asset / Portfolio: | Single Asset | ||
| Property Type: | Garden Multifamily | ||
| Collateral: | Fee Simple | ||
| Location: | Jacksonville, FL | ||
| Year Built / Renovated: | 2014 / NAP | ||
| Total Units: | 300 | ||
| Property Management: | Perimeter Realty, Inc. | ||
| Underwritten NOI: | $3,291,741 | ||
| Underwritten NCF: | $3,216,741 | ||
| “As Is” Appraised Value: | $57,300,000 | ||
| “As Is” Appraisal Date: | January 16, 2015 | ||
| Historical NOI | |||
| Most Recent NOI: | $3,583,848 (T-3 March 31, 2015 Ann.) | ||
| 2015 T-6 NOI: | $3,653,441 (T-6 March 31, 2015 Ann.) | ||
| 2015 T-9 NOI: | $3,404,971 (T-9 March 31, 2015 Ann.) | ||
| 2015 T-12 NOI: | $2,973,350 (T-12 March 31, 2015) | ||
| 2014 NOI: | $2,257,637 (December 31, 2014) | ||
| Historical Occupancy | |||
| Most Recent Occupancy: | 94.7% (April 1, 2015) | ||
| 2015 T-3 Average Occupancy: | 95.8% (T-3 March 31, 2015) | ||
| 2015 T-6 Average Occupancy: | 95.7% (T-6 March 31, 2015) | ||
| 2015 T-9 Average Occupancy: | 94.3% (T-9 March 31, 2015) | ||
| 2015 T-12 Average Occupancy: | 89.5% (T-12 March 31, 2015) | ||
| 2014 Occupancy: | 83.9% (December 31, 2014) | ||
| (1) | The interest only period has concluded and as of the April 6, 2015 payment, amortization has commenced. |
| (2) | See “Initial Reserves” and “Ongoing Reserves” herein. |
THE INFORMATION IN THIS STRUCTURAL AND COLLATERAL TERM SHEET IS NOT COMPLETE AND MAY BE AMENDED PRIOR TO THE TIME OF SALE. THIS TERM SHEET IS NOT AN OFFER TO SELL THESE SECURITIES AND IT IS NOT A SOLICITATION OF AN OFFER TO BUY THESE SECURITIES IN ANY JURISDICTION WHERE THE OFFER OR SALE IS NOT PERMITTED.
79
8685 Baymeadows Road East Jacksonville, FL 32256 | Collateral Asset Summary – Loan No. 7 Hacienda Club | Cut-off Date Balance: Cut-off Date LTV: U/W NCF DSCR: U/W NOI Debt Yield: | $39,916,155 69.7% 1.20x 8.2% |
Unit Mix Summary(1) | ||||||||
| Unit Type | # of Units | % of Total | Occupied Units | Occupancy | Average Unit Size (Sq. Ft.) | Average Monthly Rental Rate Per Unit | Average Monthly Rental Rate PSF | Average Market Monthly Rental Rate Per Unit(2) |
| 1-Bed/1-Bath (Andora) | 84 | 28.0% | 84 | 100.0% | 845 | $1,035 | $1.22 | $1,090 |
| 1-Bed/1-Bath (Genoa) | 28 | 9.3% | 27 | 96.4% | 980 | $1,147 | $1.17 | $1,211 |
| 2-Bed/2-Bath (Barcelona) | 60 | 20.0% | 57 | 95.0% | 1,202 | $1,325 | $1.10 | $1,375 |
| 2-Bed/2-Bath (Cannes) | 36 | 12.0% | 30 | 83.3% | 1,224 | $1,382 | $1.13 | $1,452 |
| 2-Bed/2-Bath (Var w/ garage) | 6 | 2.0% | 6 | 100.0% | 1,274 | $1,601 | $1.26 | $1,665 |
| 2-Bed/2-Bath (Provence w/ garage) | 8 | 2.7% | 8 | 100.0% | 1,291 | $1,764 | $1.37 | $1,795 |
| 3-Bed/2-Bath (Nice) | 46 | 15.3% | 42 | 91.3% | 1,351 | $1,496 | $1.11 | $1,556 |
| 3-Bed/2-Bath (Rapallo w/ garage) | 8 | 2.7% | 8 | 100.0% | 1,401 | $1,701 | $1.21 | $1,745 |
| 3-Bed/2-Bath (Savona) | 22 | 7.3% | 20 | 90.9% | 1,545 | $1,735 | $1.12 | $1,765 |
| 3-Bed/2-Bath (Tuscany w/ garage) | 2 | 0.7% | 2 | 100.0% | 1,594 | $1,850 | $1.16 | $1,950 |
| Total / Wtd. Avg. | 300 | 100.0% | 284 | 94.7% | 1,144 | $1,400 | $1.22 | $1,376 |
| (1) | Based on a rent roll dated April 1, 2015. |
| (2) | Source: Appraisal. |
The Loan. The Hacienda Club loan (the “Hacienda Club Loan”) is a fixed rate loan secured by the borrower’s fee simple interest in a 300-unit garden multifamily property located at 8685 Baymeadows Road East in Jacksonville, Florida (the “Hacienda Club Property”) with an original principal balance of $40.0 million. The Hacienda Club Loan has an 11-year term and amortizes on a 30-year schedule after an initial 12 month interest only period (which period has concluded). The Hacienda Club Loan accrues interest at a fixed rate equal to 5.3750% and has a cut-off date balance of approximately $39.9 million. Loan proceeds were used to retire previous debt of approximately $22.7 million, fund reserves of approximately $8.3 million, pay closing costs of approximately $0.8 million and return approximately $8.3 million of equity to the sponsor. Based on the appraised value of $57.3 million as of January 16, 2015, the cut-off date LTV is 69.7%. The most recent prior financing of the Hacienda Club Property was not included in a securitization.
| Sources and Uses | |||||||
| Sources | Proceeds | % of Total | Uses | Proceeds | % of Total | ||
| Mortgage Loan | $40,000,000 | 100.0% | Loan Payoff | $22,692,893 | 56.7% | ||
| Upfront Reserves | $8,280,249 | 20.7% | |||||
| Closing Costs | $765,587 | 1.9% | |||||
| Return of Equity | $8,261,271 | 20.7% | |||||
| Total Sources | $40,000,000 | 100.0% | Total Uses | $40,000,000 | 100.0% | ||
The Borrower / Sponsor. The borrower, The Hacienda Club Rental Community, LLC, is a single purpose Florida limited liability company structured to be bankruptcy-remote. The borrower’s manager, Hacienda Club Partners, LLC, is a single purpose Delaware limited liability company with two independent directors in its organizational structure. The sponsor of the borrower and the non-recourse carve-out guarantor is Donald C. Fort.
Donald C. Fort founded and serves as president of Perimeter Realty Inc. (“PRI”). PRI was established in 1994 to manage the Fort family real estate portfolio, which is comprised of both residential and commercial real estate including multifamily, retail, medical office and industrial properties. Since inception, the company has built more than 3,800 luxury apartment units, 144,000 sq. ft. of office space and 947,000 sq. ft. of industrial space. Highlights of Mr. Fort’s portfolio include Paradise Island (1,112 units), Ocean Park (168 units) and Cabana Club (252 units). Mr. Fort and PRI are largely based out of the Jacksonville/Ponte Vedra Beach, Florida area.
The Property. The Hacienda Club Property is a newly constructed 300-unit garden-style multifamily property located on a 15.0-acre site with 10 three-story buildings and four two-story buildings located at 8685 Baymeadows Road East in Jacksonville, Florida. Construction commenced in October 2012 and was completed in June 2014. The layout is arranged in a quasi-circular pattern, with the clubhouse, pool and carriage homes at the center and ten larger three-story buildings around the perimeter. The Hacienda Club Property is 94.7% occupied as of April 1, 2015.
Amenities at the Hacienda Club Property include a pool with a waterfall, outdoor grilling, tennis courts, fitness center, cyber café and business center and a clubhouse. Unit amenities include fully equipped kitchens, outside storage units, washer/dryer and a private patio or balcony. The Hacienda Club Property offers 74 spaces housed within several garages as well as 557 surface parking spaces, representing a parking ratio of approximately 2.1 spaces per unit. Below is a chart detailing the historical occupancy for the Hacienda Club Property as new buildings were completed and units became available to lease.
THE INFORMATION IN THIS STRUCTURAL AND COLLATERAL TERM SHEET IS NOT COMPLETE AND MAY BE AMENDED PRIOR TO THE TIME OF SALE. THIS TERM SHEET IS NOT AN OFFER TO SELL THESE SECURITIES AND IT IS NOT A SOLICITATION OF AN OFFER TO BUY THESE SECURITIES IN ANY JURISDICTION WHERE THE OFFER OR SALE IS NOT PERMITTED.
80
8685 Baymeadows Road East Jacksonville, FL 32256 | Collateral Asset Summary – Loan No. 7 Hacienda Club | Cut-off Date Balance: Cut-off Date LTV: U/W NCF DSCR: U/W NOI Debt Yield: | $39,916,155 69.7% 1.20x 8.2% |
Historical Occupancy(1) | |||||||||||||
| Month | Year | Building Delivered | New Units Delivered | Total # Of Units Available To Lease | Total Units | Units Leased | Occupancy as a % of Total Units | Occupancy as a % of Units Available to Lease | |||||
| August | 2013 | 1,2 | 58 | 58 | 300 | 9 | 3.0% | 15.5% | |||||
| October | 2013 | 3 | 29 | 87 | 300 | 60 | 20.0% | 69.0% | |||||
| December | 2013 | 4,11,12,13,14 | 37 | 124 | 300 | 90 | 30.0% | 72.6% | |||||
| January | 2014 | 0 | 124 | 300 | 110 | 36.7% | 88.7% | ||||||
| February | 2014 | 5,6 | 58 | 182 | 300 | 135 | 45.0% | 74.2% | |||||
| March | 2014 | 7 | 31 | 213 | 300 | 135 | 45.0% | 63.4% | |||||
| April | 2014 | 0 | 213 | 300 | 171 | 57.0% | 80.3% | ||||||
| May | 2014 | 9,10 | 58 | 271 | 300 | 194 | 64.7% | 71.6% | |||||
| June | 2014 | 8 | 29 | 300 | 300 | 222 | 74.0% | 74.0% | |||||
| July | 2014 | 0 | 300 | 300 | 258 | 86.0% | 86.0% | ||||||
| August | 2014 | 0 | 300 | 300 | 279 | 93.0% | 93.0% | ||||||
| September | 2014 | 0 | 300 | 300 | 285 | 95.0% | 95.0% | ||||||
| October | 2014 | 0 | 300 | 300 | 285 | 95.0% | 95.0% | ||||||
| November | 2014 | 0 | 300 | 300 | 287 | 95.7% | 95.7% | ||||||
| December | 2014 | 0 | 300 | 300 | 289 | 96.3% | 96.3% | ||||||
| January | 2015 | 0 | 300 | 300 | 288 | 96.0% | 96.0% | ||||||
| February | 2015 | 0 | 300 | 300 | 290 | 96.7% | 96.7% | ||||||
| March | 2015 | 0 | 300 | 300 | 284 | 94.7% | 94.7% | ||||||
| T-12 Average | 89.5% | ||||||||||||
| T-9 Average | 94.3% | ||||||||||||
| T-6 Average | 95.7% | ||||||||||||
| T-3 Average | 95.8% | ||||||||||||
| (1) | Based on historical rent rolls and certificates of occupancy. |
Environmental Matters. The Phase I environmental report dated February 4, 2015 recommended no further action at the Hacienda Club Property.
The Market. The Hacienda Club Property is located in Jacksonville, Florida, within the Jacksonville Metropolitan Statistical Area (the “Jacksonville MSA”). According to the appraiser, the Jacksonville MSA had a 2014 total population of approximately 1.4 million. The major industries represented in the area include aviation and aerospace, finance, information technologies, health services and education, and as of late, the region is gaining a reputation for technology start-ups, offering relatively inexpensive business and labor costs and an alternative tax environment for young entrepreneurs. Due to its convenient location, mild climate, reasonable cost of living, high quality of life and business-friendly environment, Jacksonville is a popular location for corporate expansion and relocation. Tourism throughout the Jacksonville MSA remains a major economic driver through both leisure and business travel. Jacksonville is home to three Fortune 500 corporations including CSX, Fidelity National Financial and Fidelity National Information Services. According to a market research report, the average household income for the Jacksonville MSA in 2014 was $60,928, which is slightly below the state average income of $61,679. However, within a three-mile radius of the Hacienda Club Property, the average household income is approximately $86,618.
The Hacienda Club Property is located in close proximity to major traffic arteries, including U.S. Highway 1, which is located directly south of the Property and Interstate 95, which is located directly west of the Property. The Hacienda Club Property is located approximately 10 miles southeast of the Jacksonville CBD and two miles south of the Saint John’s Town Center, which is Jacksonville’s predominant concentration of retail development. Surrounding developments include a heavy concentration of retail properties along State Road 9A, limited service hotels, office properties and multifamily residences.
As of Q3 2014 the Jacksonville, Florida market had a total apartment inventory of 72,576 units in 363 buildings across 13 submarkets. The overall Jacksonville market reported a vacancy rate of 6.7% and an average rental rate of $867 for the Q3 2014 period. The Hacienda Club Property is located within the Southside/Bay Meadows submarket, which reported a vacancy rate of 6.2% and an average rental rate of $941 for the Q3 2014 period, indicating that the immediate submarket is outperforming the market as a whole. The average rental rate for Class-A establishments within the subject’s submarket is $1,066, and has increased over the years. Historically, the Jacksonville MSA has exhibited positive absorption levels, outpacing new construction and maintaining a high level of demand.
THE INFORMATION IN THIS STRUCTURAL AND COLLATERAL TERM SHEET IS NOT COMPLETE AND MAY BE AMENDED PRIOR TO THE TIME OF SALE. THIS TERM SHEET IS NOT AN OFFER TO SELL THESE SECURITIES AND IT IS NOT A SOLICITATION OF AN OFFER TO BUY THESE SECURITIES IN ANY JURISDICTION WHERE THE OFFER OR SALE IS NOT PERMITTED.
81
8685 Baymeadows Road East Jacksonville, FL 32256 | Collateral Asset Summary – Loan No. 7 Hacienda Club | Cut-off Date Balance: Cut-off Date LTV: U/W NCF DSCR: U/W NOI Debt Yield: | $39,916,155 69.7% 1.20x 8.2% |
Competitive Set(1) | ||||||
| Name | Hacienda Club Property | Cabana Club | Tattersall at Tapestry Park | Arelia James Island | Hawthorne | Citigate |
| Year Built | 2014 | 2012 | 2009 | 2009 | 2013 | 2009 |
| Number of Units | 300(2) | 252 | 280 | 270 | 240 | 444 |
| Total Occupancy | 94.7%(2) | 93.6% | 96.0% | 96.3% | 89.0% | 92.0% |
| Average Unit Size | 1,144(2) | 1,297 | 1,104 | 1,010 | 1,087 | 1,042 |
| Avg. Rental Rent Range | $1,065 – $1,950(2) | $1,095 – $1,665 | $935 – $1,395 | $930 - $1,490 | $995 - $1,745 | $935 - $1,350 |
| (1) | Source: Appraisal. |
| (2) | Based on a rent roll dated April 1, 2015. |
Cash Flow Analysis.
| Cash Flow Analysis | |||||||
| 2014 | T-12 3/31/2015 | T-9 3/31/2015(1) | T-6 3/31/2015(1) | T-3 3/31/2015(1) | U/W | U/W per Unit | |
| Gross Potential Rent | $3,934,249 | $4,514,292 | $4,695,642 | $4,736,502 | $4,737,940 | $4,766,780 | $15,889 |
| Total Recoveries | 0 | 0 | 0 | 0 | 0 | 0 | 0 |
| Total Other Income | 360,462 | 436,903 | 478,384 | 498,513 | 497,128 | 498,513 | 1,662 |
Less: Vacancy, Collection Loss, Concessions (2) | (727,625) | (543,221) | (282,916) | (111,220) | (105,293) | (267,808) | (893) |
| Effective Gross Income | $3,567,086 | $4,407,974 | $4,891,111 | $5,123,795 | $5,129,775 | $4,997,485 | $16,658 |
| Total Expenses | 1,309,449 | 1,434,624 | 1,486,139 | 1,470,354 | 1,545,927 | 1,705,744 | 5,686 |
| Net Operating Income | $2,257,637 | $2,973,350 | $3,404,971 | $3,653,441 | $3,583,848 | $3,291,741 | $10,972 |
| Capital Expenditures | 75,000 | 75,000 | 75,000 | 75,000 | 75,000 | 75,000 | 250 |
| Net Cash Flow | $2,182,637 | $2,898,350 | $3,329,971 | $3,578,441 | $3,508,848 | $3,216,741 | $10,722 |
| (1) | Annualized |
| (2) | U/W Vacancy represents 5.3% of gross income. |
Property Management. The Hacienda Club Property is managed by Perimeter Realty, Inc., a sponsor affiliate.
Lockbox / Cash Management. The Hacienda Club Loan is structured with a soft lockbox and springing cash management. All rents from the Hacienda Club Property are required to be deposited directly by the borrower or property manager within one business day of receipt and until the commencement of a Cash Management Period (as defined below), all sums deposited in the lockbox account will be transferred daily to the borrower’s operating account. Following the commencement of a Cash Management Period (as defined below), funds deposited into the clearing account are required to be swept daily by the clearing bank into a lender controlled deposit account, where the funds are required to be disbursed in accordance with the loan agreement. During a Cash Management Period, excess cash flow is deposited into a lender controlled cash collateral account.
A “Cash Management Period” will commence (i) upon and during the continuance of an event of default or (ii) if the debt yield is less than 7.75% for two consecutive calculation dates (until such time that the debt yield is greater than 7.75% for two consecutive calculation dates).
Initial Reserves. At closing, the borrower deposited (i) $247,200 into a tax reserve account, (ii) $110,487 into an insurance reserve account, (iii) $2,547,562 into a construction reserve account, the remainder of which has since been released to the borrower, (iv) $1,075,000 into a debt service reserve account and (v) $4,300,000 into a stabilization reserve account, which amount has since been released to the borrower.
Ongoing Reserves. On a monthly basis, the borrower is required to deposit reserves of (i) 1/12 of the estimated annual real estate taxes, which currently equates to $49,440, into a tax reserve account and (ii) 1/12 of the estimated annual insurance premiums into an insurance account, which currently equates to $9,899. In addition, on the 13th payment date the borrower is required to deposit $150,000 into a replacement reserve account, which will decrease to $7,500 on each payment date thereafter and is subject to a cap of $375,000.
Current Mezzanine or Subordinate Indebtedness. None.
Future Mezzanine or Subordinate Indebtedness Permitted. None.
THE INFORMATION IN THIS STRUCTURAL AND COLLATERAL TERM SHEET IS NOT COMPLETE AND MAY BE AMENDED PRIOR TO THE TIME OF SALE. THIS TERM SHEET IS NOT AN OFFER TO SELL THESE SECURITIES AND IT IS NOT A SOLICITATION OF AN OFFER TO BUY THESE SECURITIES IN ANY JURISDICTION WHERE THE OFFER OR SALE IS NOT PERMITTED.
82
8685 Baymeadows Road East Jacksonville, FL 32256 | Collateral Asset Summary – Loan No. 7 Hacienda Club | Cut-off Date Balance: Cut-off Date LTV: U/W NCF DSCR: U/W NOI Debt Yield: | $39,916,155 69.7% 1.20x 8.2% |
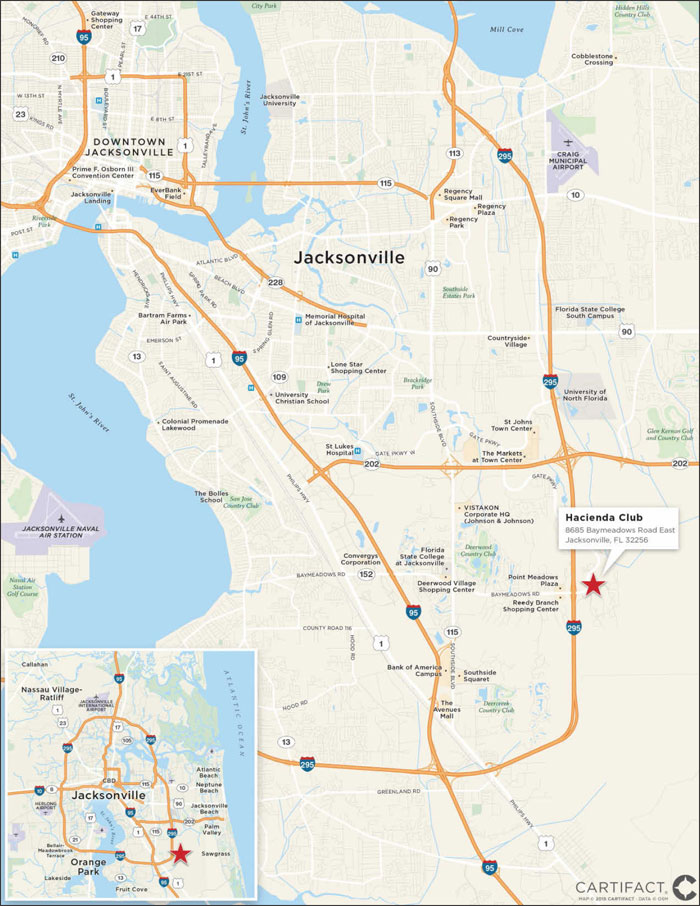
THE INFORMATION IN THIS STRUCTURAL AND COLLATERAL TERM SHEET IS NOT COMPLETE AND MAY BE AMENDED PRIOR TO THE TIME OF SALE. THIS TERM SHEET IS NOT AN OFFER TO SELL THESE SECURITIES AND IT IS NOT A SOLICITATION OF AN OFFER TO BUY THESE SECURITIES IN ANY JURISDICTION WHERE THE OFFER OR SALE IS NOT PERMITTED.
83
1515 Hotel Circle South San Diego, CA 92108 | Collateral Asset Summary – Loan No. 8 DoubleTree San Diego | Cut-off Date Balance: Cut-off Date LTV: U/W NCF DSCR: U/W NOI Debt Yield: | $36,653,165 68.8% 1.53x 10.8% |
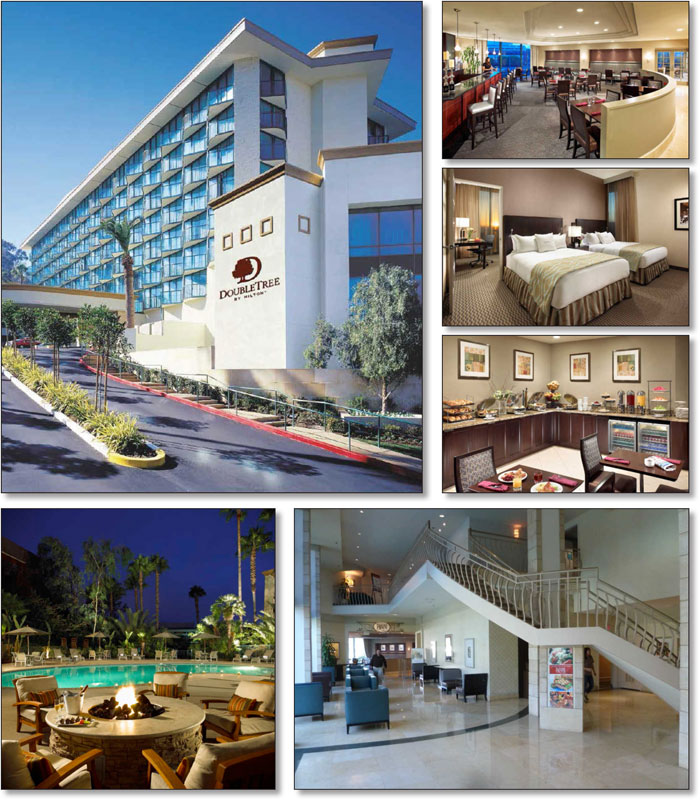
THE INFORMATION IN THIS STRUCTURAL AND COLLATERAL TERM SHEET IS NOT COMPLETE AND MAY BE AMENDED PRIOR TO THE TIME OF SALE. THIS TERM SHEET IS NOT AN OFFER TO SELL THESE SECURITIES AND IT IS NOT A SOLICITATION OF AN OFFER TO BUY THESE SECURITIES IN ANY JURISDICTION WHERE THE OFFER OR SALE IS NOT PERMITTED.
84
1515 Hotel Circle South San Diego, CA 92108 | Collateral Asset Summary – Loan No. 8 DoubleTree San Diego | Cut-off Date Balance: Cut-off Date LTV: U/W NCF DSCR: U/W NOI Debt Yield: | $36,653,165 68.8% 1.53x 10.8% |
| Mortgage Loan Information | |
| Loan Seller: | LCF |
| Loan Purpose: | Acquisition |
| Sponsor: | Graham Hershman; Julie A. Dumon; Julie A. Dumon Trust Dated March 24, 2006; Michael Payne; Gregory J. Burden |
| Borrowers: | San Diego Hotel Circle Owner, LLC; 1250 North SD, LLC |
| Original Balance: | $36,700,000 |
| Cut-off Date Balance: | $36,653,165 |
| % by Initial UPB: | 2.7% |
| Interest Rate: | 4.6723% |
| Payment Date: | 6th of each month |
| First Payment Date: | May 6, 2015 |
| Maturity Date: | April 6, 2025 |
| Amortization: | 360 months |
Additional Debt(1): | $5,750,000 Mezzanine Debt |
| Call Protection: | L(25), D(92), O(3) |
| Lockbox / Cash Management: | Hard / In Place |
Reserves(2) | ||
| Initial | Monthly | |
| Taxes: | $96,778 | $54,389 |
| Insurance: | $52,975 | $6,622 |
| FF&E: | $0 | 1/12 of 4.0% of Annual Gross Revenue |
| PIP: | $2,402,139 | $0 |
| Seasonality: | $0 | $62,500 |
| Financial Information | ||
| Mortgage Loan | Total Debt | |
| Cut-off Date Balance / Room: | $167,366 | $193,622 |
| Balloon Balance / Room: | $136,307 | $161,429 |
Cut-off Date LTV(3): | 68.8% | 79.6% |
| Balloon LTV: | 56.0% | 66.3% |
| Underwritten NOI DSCR: | 1.73x | 1.34x |
| Underwritten NCF DSCR: | 1.53x | 1.18x |
| Underwritten NOI Debt Yield: | 10.8% | 9.3% |
| Underwritten NCF Debt Yield: | 9.5% | 8.2% |
| Underwritten NOI Debt Yield at Balloon: | 13.2% | 11.2% |
| Underwritten NCF Debt Yield at Balloon: | 11.7% | 9.9% |
| Property Information | |
| Single Asset / Portfolio: | Single Asset |
| Property Type: | Full Service Hospitality |
| Collateral: | Fee Simple |
| Location: | San Diego, CA |
| Year Built / Renovated: | 1970 / 2014 |
| Total Rooms: | 219 |
| Property Management: | Portfolio Hotels LLC |
| Underwritten NOI: | $3,949,231 |
| Underwritten NCF: | $3,491,771 |
Appraised Value(3): | $53,300,000 |
Appraisal Date(3): | March 11, 2016 |
| Historical NOI | |
| Most Recent NOI: | $4,417,569 (T-12 February 28, 2015) |
| 2014 NOI: | $4,335,890 (December 31, 2014) |
| 2013 NOI: | $4,039,321 (December 31, 2013) |
| 2012 NOI: | $3,948,155 (December 31, 2012) |
| Historical Occupancy | |
| Most Recent Occupancy: | 88.3% (February 28, 2015) |
| 2014 Occupancy: | 87.6% (December 31, 2014) |
| 2013 Occupancy: | 85.7% (December 31, 2013) |
| 2012 Occupancy: | 85.2% (December 31, 2012) |
| (1) | See “Current Mezzanine or Subordinate Indebtedness” herein. |
| (2) | See “Initial Reserves” and “Ongoing Reserves” herein. |
| (3) | Cut-off Date LTV is based on the “As Complete” Appraised Value, which takes into account planned upgrades to be performed at the property. At closing, approximately $2.4 million was deposited in escrows for a PIP reserve. Based on the “As-is” Appraised Value of $50,400,000 as of March 11, 2015, the Cut-off Date LTV for the mortgage loan is 72.7% on the Mortgage Loan and 84.1% on the Total Debt. |
THE INFORMATION IN THIS STRUCTURAL AND COLLATERAL TERM SHEET IS NOT COMPLETE AND MAY BE AMENDED PRIOR TO THE TIME OF SALE. THIS TERM SHEET IS NOT AN OFFER TO SELL THESE SECURITIES AND IT IS NOT A SOLICITATION OF AN OFFER TO BUY THESE SECURITIES IN ANY JURISDICTION WHERE THE OFFER OR SALE IS NOT PERMITTED.
85
1515 Hotel Circle South San Diego, CA 92108 | Collateral Asset Summary – Loan No. 8 DoubleTree San Diego | Cut-off Date Balance: Cut-off Date LTV: U/W NCF DSCR: U/W NOI Debt Yield: | $36,653,165 68.8% 1.53x 10.8% |
The Loan. The DoubleTree San Diego loan (the “DoubleTree San Diego Loan”) is an approximately $36.7 million fixed rate loan secured by the borrowers’ fee simple interest in a 219-room full service hotel located at 1515 Hotel Circle South in San Diego, California (the “DoubleTree San Diego Property”). The DoubleTree San Diego Loan amortizes on a 30-year schedule. The DoubleTree San Diego Loan accrues interest at a fixed rate equal to 4.6723%. Loan proceeds, along with approximately $10.6 million in sponsor equity and a $5.75 million mezzanine loan, were used to acquire the DoubleTree San Diego Property for approximately $49.2 million, fund reserves of approximately $2.6 million, and pay closing costs of approximately $1.3 million. Based on the appraised value of $53.3 million as of March 11, 2016, the cut-off date LTV is 68.8%. The most recent prior financing of the DoubleTree San Diego Loan was not included in a securitization.
| Sources and Uses | ||||||
| Sources | Proceeds | % of Total | Uses | Proceeds | % of Total | |
| Loan Amount | $36,700,000 | 69.2% | Purchase Price | $49,221,000 | 92.8% | |
| Mezzanine Loan | $5,750,000 | 10.8% | Reserves | $2,551,892 | 4.8% | |
| Sponsor Equity | $10,593,517 | 20.0% | Closing Costs | $1,270,625 | 2.4% | |
| Total Sources | $53,043,517 | 100.0% | Total Uses | $53,043,517 | 100.0% | |
The Borrower / Sponsor. The borrowers, San Diego Hotel Circle Owner, LLC and 1250 North SD, LLC are single purpose Delaware limited liability companies, tenants-in-common, each structured to be bankruptcy-remote and each with one independent director. The sponsors of the borrower and nonrecourse carve-out guarantors, on a joint and several basis, are Graham Hershman, Julie A. Dumon Trust Dated March 24, 2006, Julie A. Dumon, Michael Payne, and Gregory J. Burden.
Graham Hershman and Michael Payne are each principals in Portfolio Hotels and Resorts. Portfolio Hotels & Resorts was founded in 2005. Mr. Hershman had previously created Coastal Hotel Group in 1985 and was responsible for managing luxury destination properties. Portfolio Hotels & Resorts includes a twelve-person team with expertise in the management of both franchised and independent hotels.
The Property. The DoubleTree San Diego Property is a 219-room full service hotel located in the city of San Diego, San Diego County, California. The DoubleTree San Diego Property was built in 1970 and renovated most recently in 2014. The DoubleTree San Diego Property also underwent a significant renovation in 2008, which included an approximately $6.4 million ($29,040 per room) complete renovation of all guestrooms, as well as improvements to the restaurant, outdoor pool and patio, meeting and conference rooms. The DoubleTree San Diego Property is 2.81-acres and contains an 8 story building. The site features a parking garage, 10,318 sq. ft. of meeting space, restaurant and lounge, 24-hour market, business center, fitness center, outdoor heated pool and whirlpool, and outdoor fire pit. The DoubleTree San Diego Property is operated under a franchise agreement with DoubleTree Franchise LLC, under the DoubleTree flag, which expires in March 2030. The franchise monthly program fee is 4.0% of gross rooms’ revenue and the monthly royalty fee is 4.0% of gross rooms’ revenue for 1 year and 5.0% from year 2 through the remainder of the term.
The DoubleTree San Diego Property is currently undergoing an approximately $2.4 million ($10,969 per room) property improvement program that commenced at closing and is required to be completed 12-36 months thereafter. The property improvement program includes upgrades to signage, parking, lighting, building exterior, lobby/entrance, business center, retail shop, public restrooms, restaurant facilities, meeting spaces, fitness and pool area, vending areas, back of house, circulation areas (corridors, elevators, and stairwells) and guest rooms. The guestroom renovation includes new carpets, mattresses, and televisions. Upgrades also include renovations to guest bathrooms.
The DoubleTree San Diego Property features 219 guest rooms including 57 single-king rooms, 130 double-queen rooms, 8 junior suite king rooms, 6 kid suite king rooms, and 18 kid suite double queen rooms. Each standard guest rooms features a flat-screen HDTV and Wi-Fi. The parking garage is 5 stories and features 35 surface level and 230 structured parking spaces, which equates to approximately 1.21 spaces per room. The meeting space can be divided into up to 8 different breakout rooms ranging from 64 sq. ft. to 3,200 sq. ft.
Environmental Matters. The Phase I environmental report dated February 18, 2015 recommended development and implementation of an Asbestos Operations and Maintenance Plan at the DoubleTree San Diego Property.
The Market. The DoubleTree San Diego Property is located in San Diego, California in the Mission Valley area of San Diego. The site is directly adjacent to Interstate 8 which is an east/west freeway that runs through the center of Mission Valley. Mission Valley represents the shopping and entertainment center for San Diego and is proximate to high traffic attractions including the San Diego International Airport, the Convention Center, LEGOLAND, the San Diego Zoo, Mission Bay Beach area, San Diego’s CBD, SeaWorld, Coronado Beach, and both Miramar Marine Corps Air Station and North Island Naval Air Station.
San Diego’s economy is greatly influenced by its port, which includes the only major submarine and shipbuilding yards on the west coast as well as the world’s largest naval fleet. The US military has a substantial presence in San Diego, which serves as a significant revenue generator for the area hotels. Corporate accounts at the Property include General Electric, Hewlett Packard, In Motion Entertainment, Wells Fargo, and Costco. The average guest stay at the DoubleTree San Diego Property is two to three nights.
THE INFORMATION IN THIS STRUCTURAL AND COLLATERAL TERM SHEET IS NOT COMPLETE AND MAY BE AMENDED PRIOR TO THE TIME OF SALE. THIS TERM SHEET IS NOT AN OFFER TO SELL THESE SECURITIES AND IT IS NOT A SOLICITATION OF AN OFFER TO BUY THESE SECURITIES IN ANY JURISDICTION WHERE THE OFFER OR SALE IS NOT PERMITTED.
86
1515 Hotel Circle South San Diego, CA 92108 | Collateral Asset Summary – Loan No. 8 DoubleTree San Diego | Cut-off Date Balance: Cut-off Date LTV: U/W NCF DSCR: U/W NOI Debt Yield: | $36,653,165 68.8% 1.53x 10.8% |
As of January 31, 2015, the DoubleTree San Diego Property was reported as having an occupancy, ADR and RevPAR of 88.1%, $132.18 and $116.40, respectively. The DoubleTree San Diego Property reported penetration rates of 115.4%, 98.0% and 113.1% for occupancy, ADR and RevPAR, respectively.
Historical Occupancy, ADR, RevPAR(1) | |||||||||
| DoubleTree San Diego Property | Competitive Set | Penetration Factor | |||||||
| Year | Occupancy | ADR | RevPAR | Occupancy | ADR | RevPAR | Occupancy | ADR | RevPAR |
| 2011 | 84.8% | $111.95 | $94.89 | 73.0% | $118.85 | $86.75 | 116.1% | 94.2% | 109.4% |
| 2012 | 85.2% | $121.27 | $103.29 | 75.7% | $120.96 | $91.59 | 112.5% | 100.3% | 112.8% |
| 2013 | 85.7% | $124.08 | $106.29 | 77.1% | $123.04 | $94.89 | 111.1% | 100.8% | 112.0% |
| 2014 | 87.5% | $131.83 | $115.31 | 76.3% | $134.19 | $102.45 | 114.6% | 98.2% | 112.5% |
| T-12 Jan 2015 | 88.1% | $132.18 | $116.40 | 76.3% | $134.88 | $102.91 | 115.4% | 98.0% | 113.1% |
| (1) | Source: Hospitality research report. |
The DoubleTree San Diego Property competes to varying degrees with numerous hotels in the Mission Valley area. Including the DoubleTree San Diego Property, the appraiser determined a primary competitive set of six hotels, spanning 1,402 rooms. The subsequent chart presents the primary competitive set to the DoubleTree San Diego Property:
Primary Competitive Set(1) | |||||
| Property | Rooms | Year Opened | 2014 Occupancy | 2014 ADR | 2014 RevPAR |
| DoubleTree San Diego Property | 219 | 1970 | 88% | $131.67 | $115.31 |
| DoubleTree Hotel Mission Valley | 300 | 1989 | 78% | $140.00 | $109.20 |
| Hilton San Diego Mission Valley | 349 | 1987 | 61% | $126.00 | $76.86 |
| Sheraton Hotel - Mission Valley | 260 | 1984 | 77% | $120.00 | $92.40 |
| Courtyard San Diego Old Town | 176 | 1987 | 88% | $139.00 | $122.32 |
| Courtyard by Marriott | 317 | 1974 | 89% | $138.00 | $122.82 |
| Total / Wtd. Avg. | 1,621 | 79% | $132.73 | $104.37 | |
| (1) | Source: Appraisal. |
The appraiser determined demand segmentation of 30% commercial, 15% meeting and group and 55% leisure travel for the DoubleTree San Diego Property, compared to 26% commercial, 20% meeting and group and 54% leisure travel for the primary competitive set. The market demand mix is presented in the table below:
Demand Segmentation(1) | ||||
| Estimated 2014 Market Mix | ||||
| Property | Rooms | Commercial | Meeting and Group | Leisure |
| DoubleTree San Diego Property | 219 | 30% | 15% | 55% |
| DoubleTree Hotel Mission Valley | 300 | 25% | 50% | 25% |
| Hilton San Diego Mission Valley | 349 | 30% | 20% | 50% |
| Sheraton Hotel - Mission Valley | 260 | 20% | 5% | 75% |
| Courtyard San Diego Old Town | 176 | 15% | 15% | 70% |
| Courtyard by Marriott | 317 | 30% | 14% | 56% |
| Total / Wtd. Avg. | 1,621 | 26% | 20% | 54% |
| (1) | Source: Appraisal. |
THE INFORMATION IN THIS STRUCTURAL AND COLLATERAL TERM SHEET IS NOT COMPLETE AND MAY BE AMENDED PRIOR TO THE TIME OF SALE. THIS TERM SHEET IS NOT AN OFFER TO SELL THESE SECURITIES AND IT IS NOT A SOLICITATION OF AN OFFER TO BUY THESE SECURITIES IN ANY JURISDICTION WHERE THE OFFER OR SALE IS NOT PERMITTED.
87
1515 Hotel Circle South San Diego, CA 92108 | Collateral Asset Summary – Loan No. 8 DoubleTree San Diego | Cut-off Date Balance: Cut-off Date LTV: U/W NCF DSCR: U/W NOI Debt Yield: | $36,653,165 68.8% 1.53x 10.8% |
Cash Flow Analysis.
| Cash Flow Analysis | ||||||
| 2012 | 2013 | 2014 | T-12 2/28/2015 | U/W | U/W per Room | |
| Occupancy | 85.2% | 85.7% | 87.6% | 88.3% | 88.3% | |
| ADR | $121.27 | $123.80 | $131.67 | $132.59 | $132.59 | |
| RevPAR | $103.29 | $106.05 | $115.31 | $117.07 | $117.07 | |
| Room Revenue | $8,278,939 | $8,476,955 | $9,216,915 | $9,357,797 | $9,357,797 | $42,730 |
| F&B Revenue | 1,145,338 | 1,148,817 | 1,220,480 | 1,243,596 | 1,243,596 | 5,679 |
| Telephone Revenue | 6,483 | 3,685 | 1,175 | 1,175 | 1,175 | 5 |
| Other Revenue | 689,593 | 765,080 | 822,728 | 833,938 | 833,938 | 3,808 |
| Total Revenue | $10,120,353 | $10,394,537 | $11,261,298 | $11,436,506 | $11,436,506 | $52,221 |
| Operating Expenses | 2,728,642 | 2,855,767 | 2,986,634 | 2,993,597 | 2,993,597 | 13,669 |
| Undistributed Expenses | 2,954,332 | 3,002,047 | 3,396,975 | 3,477,949 | 3,477,949 | 15,881 |
| Gross Operating Profit | $4,437,379 | $4,536,723 | $4,877,689 | $4,964,960 | $4,964,960 | $22,671 |
Management Fee(1) | 303,548 | 311,854 | 337,838 | 343,119 | 343,095 | 1,567 |
| Total Fixed Charges | 185,676 | 185,548 | 203,961 | 204,272 | 672,634 | 3,071 |
| Net Operating Income | $3,948,155 | $4,039,321 | $4,335,890 | $4,417,569 | $3,949,231 | $18,033 |
FF&E(2) | 404,814 | 415,781 | 450,452 | 457,460 | 457,460 | 2,089 |
| Net Cash Flow | $3,543,341 | $3,623,540 | $3,885,438 | $3,960,109 | $3,491,771 | $15,944 |
| (1) | U/W Management Fee is 3.0% of gross revenues. |
| (2) | U/W FF&E represents 4.0% of gross revenues. |
Property Management. The DoubleTree San Diego Property is managed by Portfolio Hotels LLC, an affiliate one of the borrowers, San Diego Hotel Circle Owner, LLC.
Lockbox / Cash Management. The DoubleTree San Diego Loan is structured with a hard lockbox and in place cash management. All rents and other gross revenue are required to be deposited directly by the credit card companies and otherwise by the borrowers or manager into a lender controlled lockbox account and, distributed pursuant to the terms of the loan documents, with any excess revenues being distributed to the borrower. During the continuance of a Sweep Period, (as defined below), all excess cash flow will be swept into an excess cash flow reserve and held as additional collateral for the loan.
A “Sweep Period” will commence upon the occurrence of (i) an event of default occurs under the loan or the property management agreement, (ii) the DSCR for the property falls below 1.35x, (iii) 12 months prior to franchise management expiration, (iv) a default under the franchise agreement; (v) failure to obtain a temporary liquor license within 35 days of note date or (vi) failure to obtain a permanent Type 47 liquor license within 120 days of the origination date of the DoubleTree San Diego Loan.
A Sweep Period will cease to exist with respect to clause (i) above, the date such default has been cured; with respect to clause (ii) above, provided the net cash flow DSCR is at least equal to or greater than 1.35x for two consecutive calendar quarters; with respect to clause (iii) above, borrower has satisfied the new license conditions and if PIP Work is required, the funds on deposit in the PIP Reserve Account are greater than or equal to the PIP reserve deposit amount; with respect to (iv) above, the date on which the default or breach under the franchise agreement has been cured and borrower has delivered to lender a “good standing” or similar letter from franchisor; with respect to (v) above, the date on which borrower obtains a valid temporary liquor license in the name of borrowers or manager for the property; and with respect to (vi) above, the date on which borrower obtains a permanent Type 47 liquor license in the name of borrowers or manager for the property.
Initial Reserves. At closing, the borrowers deposited (i) $96,778 into a tax reserve account, (ii) $52,975 into an insurance reserve account, and (iii) $2,402,139 into a PIP reserve account for property improvements at the DoubleTree San Diego Property.
Ongoing Reserves. On a monthly basis, the borrower is required to deposit monthly reserves of (i) 1/12 of the estimated annual real estate taxes, which currently equates to $54,389, into a tax reserve account, (ii) 1/12 of the estimated insurance premiums which currently equates to $6,622, (iii) 1/12 of 4.0% of the annual gross revenue into an FF&E reserve account, and (iv) for the first 4 months of the loan term, $62,500 into a seasonality reserve account until the initial seasonality reserve cap of $250,000 has been reached.
THE INFORMATION IN THIS STRUCTURAL AND COLLATERAL TERM SHEET IS NOT COMPLETE AND MAY BE AMENDED PRIOR TO THE TIME OF SALE. THIS TERM SHEET IS NOT AN OFFER TO SELL THESE SECURITIES AND IT IS NOT A SOLICITATION OF AN OFFER TO BUY THESE SECURITIES IN ANY JURISDICTION WHERE THE OFFER OR SALE IS NOT PERMITTED.
88
1515 Hotel Circle South San Diego, CA 92108 | Collateral Asset Summary – Loan No. 8 DoubleTree San Diego | Cut-off Date Balance: Cut-off Date LTV: U/W NCF DSCR: U/W NOI Debt Yield: | $36,653,165 68.8% 1.53x 10.8% |
Current Mezzanine or Subordinate Indebtedness. A $5,750,000 mezzanine loan was funded concurrently with the funding of the DoubleTree San Diego Loan. The mezzanine loan is coterminous with the DoubleTree San Diego Loan, accrues interest at a rate of 11.3000% and amortizes on a 30-year schedule. The mezzanine borrowers under the mezzanine loan are 1250 North SD Mezz LLC and San Diego Hotel Circle Mezzanine, LLC, on a joint and several basis. The current holder of the mezzanine loan is Ladder Capital Finance LLC.
Future Mezzanine or Subordinate Indebtedness Permitted. None.
THE INFORMATION IN THIS STRUCTURAL AND COLLATERAL TERM SHEET IS NOT COMPLETE AND MAY BE AMENDED PRIOR TO THE TIME OF SALE. THIS TERM SHEET IS NOT AN OFFER TO SELL THESE SECURITIES AND IT IS NOT A SOLICITATION OF AN OFFER TO BUY THESE SECURITIES IN ANY JURISDICTION WHERE THE OFFER OR SALE IS NOT PERMITTED.
89
1515 Hotel Circle South San Diego, CA 92108 | Collateral Asset Summary – Loan No. 8 DoubleTree San Diego | Cut-off Date Balance: Cut-off Date LTV: U/W NCF DSCR: U/W NOI Debt Yield: | $36,653,165 68.8% 1.53x 10.8% |
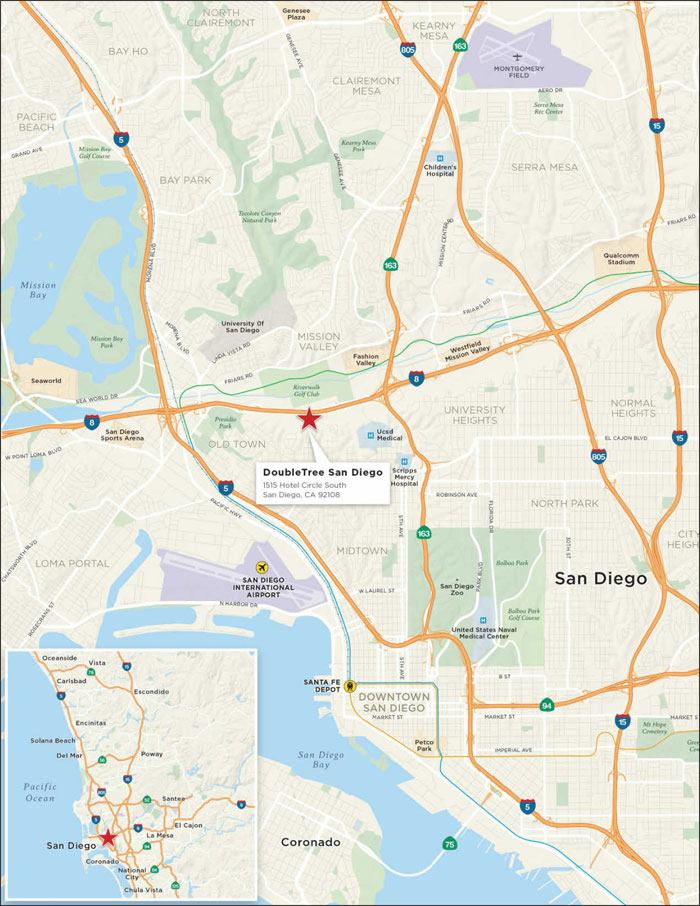
THE INFORMATION IN THIS STRUCTURAL AND COLLATERAL TERM SHEET IS NOT COMPLETE AND MAY BE AMENDED PRIOR TO THE TIME OF SALE. THIS TERM SHEET IS NOT AN OFFER TO SELL THESE SECURITIES AND IT IS NOT A SOLICITATION OF AN OFFER TO BUY THESE SECURITIES IN ANY JURISDICTION WHERE THE OFFER OR SALE IS NOT PERMITTED.
90
(THIS PAGE INTENTIONALLY LEFT BLANK)
91
28200 Highway 189 Lake Arrowhead, CA 92352 | Collateral Asset Summary – Loan No. 9 Lake Arrowhead Village | Cut-off Date Balance: Cut-off Date LTV: U/W NCF DSCR: U/W NOI Debt Yield: | $32,924,353 66.5% 1.26x 8.8% |
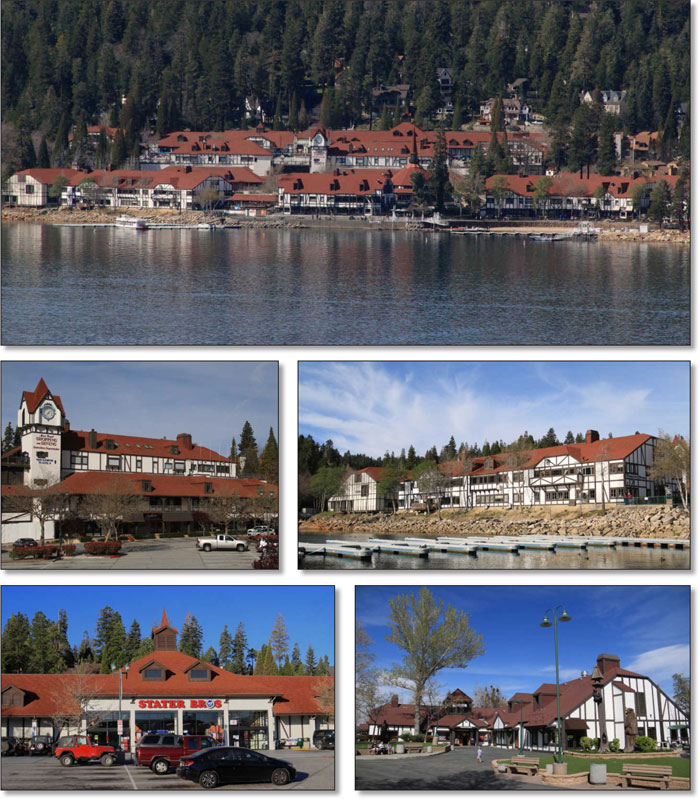
THE INFORMATION IN THIS STRUCTURAL AND COLLATERAL TERM SHEET IS NOT COMPLETE AND MAY BE AMENDED PRIOR TO THE TIME OF SALE. THIS TERM SHEET IS NOT AN OFFER TO SELL THESE SECURITIES AND IT IS NOT A SOLICITATION OF AN OFFER TO BUY THESE SECURITIES IN ANY JURISDICTION WHERE THE OFFER OR SALE IS NOT PERMITTED.
92
28200 Highway 189 Lake Arrowhead, CA 92352 | Collateral Asset Summary – Loan No. 9 Lake Arrowhead Village | Cut-off Date Balance: Cut-off Date LTV: U/W NCF DSCR: U/W NOI Debt Yield: | $32,924,353 66.5% 1.26x 8.8% |
| Mortgage Loan Information | |
| Loan Seller: | CCRE |
| Loan Purpose: | Refinance |
| Sponsor: | Peter Hollingshead; Thomas A. Cologna |
| Borrower: | Lake Arrowhead Retail LLC |
| Original Balance: | $33,000,000 |
| Cut-off Date Balance: | $32,924,353 |
| % by Initial UPB: | 2.4% |
| Interest Rate: | 4.9500% |
| Payment Date: | 6th of each month |
| First Payment Date: | April 6, 2015 |
| Maturity Date: | March 6, 2025 |
| Amortization: | 360 months |
| Additional Debt: | None |
| Call Protection: | L(26), D(89), O(5) |
| Lockbox / Cash Management: | Hard / Springing |
Reserves(1) | ||
| Initial | Monthly | |
| Taxes: | $137,250 | $45,750 |
| Insurance: | $55,494 | $8,378 |
Replacement(2): | $0 | $3,841 |
TI/LC(3): | $250,000 | $14,403 |
Required Repairs(4): | $700,000 | NAP |
USPS Rollover(5): | $300,000 | $0 |
| Financial Information | ||
| Cut-off Date Balance / Sq. Ft.: | $143 | |
| Balloon Balance / Sq. Ft.: | $118 | |
| Cut-off Date LTV: | 66.5% | |
| Balloon LTV: | 54.7% | |
| Underwritten NOI DSCR: | 1.36x | |
| Underwritten NCF DSCR: | 1.26x | |
| Underwritten NOI Debt Yield: | 8.8% | |
| Underwritten NCF Debt Yield: | 8.1% | |
| Underwritten NOI Debt Yield at Balloon: | 10.6% | |
| Underwritten NCF Debt Yield at Balloon: | 9.8% | |
| Property Information | |
| Single Asset / Portfolio: | Single Asset |
| Property Type: | Anchored Retail |
| Collateral: | Fee Simple |
| Location: | Lake Arrowhead, CA |
| Year Built / Renovated: | 1980 / 2004 |
| Total Sq. Ft.: | 230,448 |
| Property Management: | Pacific Capital Management, Inc. |
| Underwritten NOI: | $2,884,912 |
| Underwritten NCF: | $2,665,986 |
| Appraised Value: | $49,500,000 |
| Appraisal Date: | February 15, 2015 |
| Historical NOI | |
| 2014 NOI: | $2,768,279 (December 31, 2014) |
| 2013 NOI: | $2,641,371 (December 31, 2013) |
| 2012 NOI: | $2,519,582 (December 31, 2012) |
| 2011 NOI: | $2,402,648 (December 31, 2011) |
| Historical Occupancy | |
| Most Recent Occupancy: | 84.3% (March 31, 2015) |
| 2014 Occupancy | 84.3% (December 31, 2014) |
| 2013 Occupancy: | 86.3% (December 31, 2013) |
| 2012 Occupancy: | 83.1% (December 31, 2012) |
| 2011 Occupancy: | 84.9% (December 31, 2011) |
| (1) | See “Initial Reserves” and “Ongoing Reserves” herein. |
| (2) | Replacement reserves are subject to a cap of $230,448 ($1.00 PSF or five years of annual collections). If the Replacement reserve falls below $230,448, the borrower is required to re-commence monthly deposits. |
| (3) | TI/LC reserves are subject to a cap of $864,180 ($3.75 PSF or five years of annual collections) so long as the NOI debt yield as of the last day of the prior calendar month is greater than or equal to 8.5%. |
| (4) | Represents 125.0% of the engineer’s estimated cost for required repairs that primarily consists of repairs and elevator upgrades. |
| (5) | The United States Postal Service is the third largest tenant at the Lake Arrowhead Village Property and has a lease expiration of June 30, 2015 with two, five-year extension options. The borrower reserved $300,000 ($33.33 per sq. ft.) with lender related to this lease. As of April 27, 2015, the United States Postal Service renewal was out for signature. |
THE INFORMATION IN THIS STRUCTURAL AND COLLATERAL TERM SHEET IS NOT COMPLETE AND MAY BE AMENDED PRIOR TO THE TIME OF SALE. THIS TERM SHEET IS NOT AN OFFER TO SELL THESE SECURITIES AND IT IS NOT A SOLICITATION OF AN OFFER TO BUY THESE SECURITIES IN ANY JURISDICTION WHERE THE OFFER OR SALE IS NOT PERMITTED.
93
28200 Highway 189 Lake Arrowhead, CA 92352 | Collateral Asset Summary – Loan No. 9 Lake Arrowhead Village | Cut-off Date Balance: Cut-off Date LTV: U/W NCF DSCR: U/W NOI Debt Yield: | $32,924,353 66.5% 1.26x 8.8% |
Tenant Summary(1) | |||||||||
| Tenant | Ratings (Fitch/Moody’s/S&P)(2) | Total Sq. Ft. | % of Total Collateral Sq. Ft. | Lease Expiration | Annual U/W Base Rent PSF | Total Sales (000s)(3) | Sales PSF(3) | Occupancy Cost (% of Sales)(3) | |
| Collateral Anchor Tenants | |||||||||
| Stater Bros. | NR/B2/B+ | 33,580 | 14.6% | 9/30/2020(4) | $8.13 | $35,658 | $1,062 | 1.9% | |
| Major Tenants (≥ 6,000 sq. ft.) | |||||||||
| Bank of America | A/Baa2/A- | 11,500 | 5.0% | 3/31/2025(5) | $12.61 | NAP | NAP | NAP | |
| United States Postal Service | AAA/Aaa/AA+ | 9,000 | 3.9% | 6/30/2015(6) | $38.06 | NAP | NAP | NAP | |
| Bass Shoe & Clothing | NR/NR/NR | 6,786 | 2.9% | 4/30/2020 | $17.40 | $2,252 | $332 | 8.2% | |
| Subtotal | 27,286 | 11.8% | |||||||
| In-line Tenants (<6,000 sq. ft.) | 133,433 | 57.9% | $20.12 | ||||||
| Total Occupied Collateral | 194,299 | 84.3% | $18.34 | ||||||
| Vacant | 36,149 | 15.7% | |||||||
| Total Collateral | 230,448 | 100.0% | |||||||
| (1) | Based on rent roll as of March 31, 2015. |
| (2) | Certain ratings may be those of the parent company whether or not the parent company guarantees the lease. |
| (3) | Total Sales (000s) and Sales PSF were provided by the borrower as of the most recent trailing 12-month sales period provided by the tenant. Occupancy Cost (% of Sales) is based on Annual U/W Base Rent PSF, U/W expense recoveries and overage rent (if applicable). |
| (4) | Stater Bros. has one, five-year extension option. |
| (5) | Bank of America has two, ten-year extension options. |
| (6) | United States Postal Service has two, five-year extension options with 270 days prior notice. |
THE INFORMATION IN THIS STRUCTURAL AND COLLATERAL TERM SHEET IS NOT COMPLETE AND MAY BE AMENDED PRIOR TO THE TIME OF SALE. THIS TERM SHEET IS NOT AN OFFER TO SELL THESE SECURITIES AND IT IS NOT A SOLICITATION OF AN OFFER TO BUY THESE SECURITIES IN ANY JURISDICTION WHERE THE OFFER OR SALE IS NOT PERMITTED.
94
28200 Highway 189 Lake Arrowhead, CA 92352 | Collateral Asset Summary – Loan No. 9 Lake Arrowhead Village | Cut-off Date Balance: Cut-off Date LTV: U/W NCF DSCR: U/W NOI Debt Yield: | $32,924,353 66.5% 1.26x 8.8% |
Lease Rollover Schedule(1)(2) | ||||||||
| Year | # of Leases Expiring | Total Expiring Sq. Ft. | % of Total Sq. Ft. Expiring | Cumulative Sq. Ft. Expiring | Cumulative % of Sq. Ft. Expiring | Annual U/W Base Rent PSF | % U/W Base Rent Rolling | Cumulative % of U/W Base Rent |
| MTM | 3 | 2,482 | 1.1% | 2,482 | 1.1% | $30.24 | 2.1% | 2.1% |
2015(3) | 16 | 41,671 | 18.1% | 44,153 | 19.2% | $23.96 | 28.0% | 30.1% |
| 2016 | 11 | 14,610 | 6.3% | 58,763 | 25.5% | $21.14 | 8.7% | 38.8% |
| 2017 | 18 | 26,043 | 11.3% | 84,806 | 36.8% | $18.92 | 13.8% | 52.6% |
| 2018 | 12 | 17,505 | 7.6% | 102,311 | 44.4% | $21.62 | 10.6% | 63.2% |
| 2019 | 11 | 23,485 | 10.2% | 125,796 | 54.6% | $17.69 | 11.7% | 74.9% |
| 2020 | 3 | 40,666 | 17.6% | 166,462 | 72.2% | $10.19 | 11.6% | 86.5% |
| 2021 | 0 | 0 | 0.0% | 166,462 | 72.2% | $0.00 | 0.0% | 86.5% |
| 2022 | 0 | 0 | 0.0% | 166,462 | 72.2% | $0.00 | 0.0% | 86.5% |
| 2023 | 1 | 3,631 | 1.6% | 170,093 | 73.8% | $31.21 | 3.2% | 89.7% |
| 2024 | 2 | 6,238 | 2.7% | 176,331 | 76.5% | $29.65 | 5.2% | 94.9% |
| 2025 | 1 | 11,500 | 5.0% | 187,831 | 81.5% | $12.61 | 4.1% | 99.9% |
| Thereafter | 6 | 6,468 | 2.8% | 194,299 | 84.3% | $5.69 | 1.0% | 100.0% |
| Vacant | NAP | 36,149 | 15.7% | 230,448 | 100.0% | NAP | NAP | |
| Total / Wtd. Avg. | 84 | 230,448 | 100.0% | $18.34 | 100.0% | |||
| (1) | Based on rent roll as of March 31, 2015. |
| (2) | Certain tenants have lease termination options related to co-tenancy provisions and sales thresholds that may become exercisable prior to the originally stated expiration date of the tenant lease and that are not considered in the lease rollover schedule. |
| (3) | The 28.0% of U/W Base Rent Rolling in 2015 is comprised of 15 tenants, the largest of which is the United States Postal Service, which represents 9.8% of 2015 U/W Base Rent Rolling. The borrower reserved $300,000 ($33.33 per sq. ft.) with lender related to this lease. As of April 27, 2015, the United States Postal Service renewal was out for signature. |
The Loan. The Lake Arrowhead Village loan (the “Lake Arrowhead Village Loan”) is a fixed rate loan secured by the borrower’s fee simple interest in a seventeen building retail center located directly on Lake Arrowhead in Lake Arrowhead, California. Lake Arrowhead Village is a 230,448 sq. ft., grocery-anchored retail center occupied by 77 tenants that has three distinct retail sections and retail orientations. The collateral (the “Lake Arrowhead Village Property”) for the Lake Arrowhead Village Loan consists of the entire 230,448 sq. ft. as well as 1,033 surface and garage level parking spaces.
The Lake Arrowhead Village Loan has an original principal balance of $33.0 million with a 10-year term and amortizes on a 30-year schedule. The Lake Arrowhead Village Loan accrues interest at a fixed rate equal to 4.9500% and has a cut-off date balance of approximately $32.9 million. The Lake Arrowhead Village Loan proceeds were used to refinance existing debt and fund closing costs and reserves. Based on the appraised value of $49.5 million as of February 15, 2015, the cut-off date LTV ratio is 66.5%. The Lake Arrowhead Village Property was previously securitized in the GCCFC 2005-GG3 transaction.
| Sources and Uses | ||||||
| Sources | Proceeds | % of Total | Uses | Proceeds | % of Total | |
| Loan Amount | $33,000,000 | 98.9% | Existing Debt Payoff | $31,241,833 | 93.7% | |
| Borrower Equity | $359,320 | 1.1% | Reserves | $1,442,744 | 4.3% | |
| Closing Costs | $674,743 | 2.0% | ||||
| Total Sources | $33,359,320 | 100.0% | Total Uses | $33,359,320 | 100.0% | |
The Borrower / Sponsor. The borrower, Lake Arrowhead Retail LLC, is a single purpose Delaware limited liability company structured to be bankruptcy remote with one independent director in its organizational structure. The sponsors of the borrower and nonrecourse carve-out guarantors are Peter Hollingshead and Thomas A. Cologna, on a joint and several basis.
Peter Hollingshead and Thomas A. Cologna are the principals of Pacific Capital, a full-service commercial real estate company specializing in the acquisition, management, and sale of investment properties in or throughout the southwestern United States. Pacific Capital was founded in 1988 and currently owns and /or manages 34 commercial and multifamily properties valued in excess of $750.0 million. The sponsors purchased the Lake Arrowhead Village Property in 2004 for approximately $42.5 million, representing a loan to cost ratio of approximately 77.7%.
THE INFORMATION IN THIS STRUCTURAL AND COLLATERAL TERM SHEET IS NOT COMPLETE AND MAY BE AMENDED PRIOR TO THE TIME OF SALE. THIS TERM SHEET IS NOT AN OFFER TO SELL THESE SECURITIES AND IT IS NOT A SOLICITATION OF AN OFFER TO BUY THESE SECURITIES IN ANY JURISDICTION WHERE THE OFFER OR SALE IS NOT PERMITTED.
95
28200 Highway 189 Lake Arrowhead, CA 92352 | Collateral Asset Summary – Loan No. 9 Lake Arrowhead Village | Cut-off Date Balance: Cut-off Date LTV: U/W NCF DSCR: U/W NOI Debt Yield: | $32,924,353 66.5% 1.26x 8.8% |
The Property. The Lake Arrowhead Village Property is an 18.1 acre, seventeen building retail center located on Lake Arrowhead in Lake Arrowhead, CA. The Lake Arrowhead Village Property was constructed in 1980, renovated in 2004 and was 84.3% occupied as of March 31, 2015. The Lake Arrowhead Village Property is comprised of 230,448 sq. ft. that is occupied by 77 tenants and divided into three distinct retail sections (the Upper Village, Lower Village and Peninsula/Dockside) and retail orientations that collectively serve as the primary commercial property in the local area. The Lake Arrowhead Village Property contains 190,906 sq. ft. of ground floor retail space (82.8% of the Lake Arrowhead Village Property total sq. ft.) and 39,542 sq. ft. of service-oriented second floor space (17.2% of the Lake Arrowhead Village Property total sq. ft.).
The Upper Village section is anchored by a 33,580 sq. ft. Stater Bros. grocery store with a three level parking garage that also includes a United States Postal Service and a California Bank & Trust bank branch, among other in-line tenants. The Lower Village section consists of one- and two-story buildings with ground floor in-line retail as well as service-oriented second story space. Lastly, the Peninsula/Dockside section is located on Lake Arrowhead and includes outlet mall type tenants such as Coach, Pendleton, Famous Footwear, Bass Shoe & Clothing and IZOD, as well as a variety of local restaurants. Within the Peninsula/Dockside section is Lollipop Park, which is used for summer concerts.
Major Tenants.
The largest tenant at the Lake Arrowhead Village Property is Stater Bros. (rated B2/B+ by Moody’s/S&P), which occupies 14.6% of the total sq. ft. and represents 7.7% of the total Underwritten Base Rent. Stater Bros. was founded in 1936 and is the largest privately owned supermarket chain in Southern California and the largest private employer in both San Bernardino County and Riverside County. Stater Bros. operates 168 supermarkets and employs approximately 18,000 people. Stater Bros. has been at the Lake Arrowhead Village Property since its construction in 1980 and recently exercised a 5-year renewal option that extended its lease expiration date to September 30, 2020. Stater Bros. reported sales of approximately $35.7 million in 2014, $1,062 PSF, and has averaged sales in excess of $1,000 PSF since 2011.
| Stater Bros. Historical Sales PSF | |||||
| 2011 | 2012 | 2013 | 2014 | Average | |
| Gross Sales | $33,925,088 | $32,254,078 | $34,650,167 | $35,657,889 | $34,121,806 |
| Sales PSF | $1,010 | $961 | $1,032 | $1,062 | $1,016 |
Occupancy Cost(1) | 2.0% | 2.1% | 2.0% | 1.9% | 2.0% |
| (1) Occupancy Cost is based on Annual U/W Base Rent PSF, U/W expense recoveries and overage rent (if applicable). | |||||
The second largest tenant at the Lake Arrowhead Village Property is Bank of America (rated A/Baa2/A- by Fitch/Moody’s/S&P), which occupies 5.0% of the total sq. ft. and 4.1% of the total Underwritten Base Rent. Bank of America has occupied space at the Lake Arrowhead Village Property since 1980 and its current lease expiration date is March 31, 2025.
The third largest tenant at the Lake Arrowhead Village Property is the United States Postal Service (rated AAA/Aaa/AA+ by Fitch/Moody’s/S&P), which occupies 3.9% of the total sq. ft. and 9.6% of the total Underwritten Base Rent. All mail in Lake Arrowhead is delivered to post office boxes. The United States Postal Service tenant at the Lake Arrowhead Village Property serves the only United States Postal Service location in the city of Lake Arrowhead. The United States Postal Service has occupied space at the Lake Arrowhead Village Property since 1984 and its current lease expiration date is June 30, 2015. The lender reserved $300,000 ($33.33 PSF) at the origination of the Lake Arrowhead Village Loan should the United States Postal Service fail to renew its lease. As of April 27, 2015, the United States Postal Service renewal was out for signature.
Environmental Matters. The Phase I dated March 4, 2015 recommended the development and implementation of an asbestos operation and maintenance plan at the Lake Arrowhead Village Property, which is currently in place. In addition to an environmental indemnity executed by each of the sponsors, the borrower purchased an environmental insurance policy from Zurich covering environmental concerns identified in the Lake Arrowhead Village Property’s Phase I environmental report. The policy has a $3.0 million aggregate limit covering a 10-year period coterminous with the Lake Arrowhead Village Loan and provides for a three year extension period.
The Market. Lake Arrowhead is a small community located in the San Bernardino Mountains of San Bernardino County, California, within the San Bernardino National Forest, that surrounds the Lake Arrowhead Reservoir. As a scenic mountain resort, Lake Arrowhead’s economy is supported by year-round tourism, both by casual vacationers and part-time residents. Primary tourism industries include real estate, lodging, dining, recreation and retail sales. The Lake Arrowhead Village Property serves as the main commercial area for both locals and tourists and includes a number of factory outlets, boutiques and restaurants as well as the post office and supermarket. The Lake Arrowhead Village Property also hosts events all year long including a free summer concert series, the county’s largest free Oktoberfest and many other themed events such as car shows, dog shows, the Tour de Lake Arrowhead, Home Expo and the Antique Wooden Boat Show.
THE INFORMATION IN THIS STRUCTURAL AND COLLATERAL TERM SHEET IS NOT COMPLETE AND MAY BE AMENDED PRIOR TO THE TIME OF SALE. THIS TERM SHEET IS NOT AN OFFER TO SELL THESE SECURITIES AND IT IS NOT A SOLICITATION OF AN OFFER TO BUY THESE SECURITIES IN ANY JURISDICTION WHERE THE OFFER OR SALE IS NOT PERMITTED.
96
28200 Highway 189 Lake Arrowhead, CA 92352 | Collateral Asset Summary – Loan No. 9 Lake Arrowhead Village | Cut-off Date Balance: Cut-off Date LTV: U/W NCF DSCR: U/W NOI Debt Yield: | $32,924,353 66.5% 1.26x 8.8% |
Additionally, the University of California, Los Angeles operates the UCLA Conference Center approximately 4.9 miles north of the Lake Arrowhead Village Property, a full-service conference facility with lodging and meeting space. Immediately adjacent to the Lake Arrowhead Village Property are residential condominiums, other retail stores, the Lake Arrowhead hotels and resort as well as Lake Arrowhead.
The Lake Arrowhead Village Property is located on Highway 189, which acts as the primary route for the area. Highway 189 also provides access to the nearby towns of Blue Jay and Big Bear Lake as well as San Bernardino. Highway 189 intersects with Interstate 210, which provides access to the greater Southern California freeway system. Los Angeles, California is located approximately 79.9 miles west of Lake Arrowhead and an approximately 1 hour and 35 minute drive.
Lake Arrowhead is located within the Colton/Redlands/San Bernardino submarket of the greater San Bernardino/Riverside retail market. Since 2010, the San Bernardino/Riverside retail market experienced decreased vacancy levels. As of year-end 2014, the San Bernardino/Riverside retail submarket had a total inventory of 51.0 million sq. ft. and net absorption of 235,000 sq. ft. Neighborhood and community centers within the retail market averaged a vacancy rate of 9.6% and asking rents of $21.15 PSF As of year-end 2014, the Colton/Redlands/San Bernardino retail submarket had a total inventory of 9.5 million sq. ft. and net absorption of 36,000 sq. ft. Neighborhood and community centers within the submarket averaged a vacancy rate of 10.8% and asking rents of $17.96 PSF
As the main commercial area for both locals and tourists, competitive properties with the Lake Arrowhead Village Property are primarily located in the surrounding towns of Blue Jay and Big Bear. The appraiser analyzed a set of five competitive properties for the Lake Arrowhead Village Property. The appraiser’s competitive set is detailed below.
Lake Arrowhead Village Property Competitive Set(1) | ||||||
| Name | Lake Arrowhead Village Property | Blue Jay Village | Rite Aid Center | The Village & Courtyard | Kmart Center | Interlaken Shopping Center |
| Distance from Subject | NAP | 1.5 mi. | 1.5 mi. | 28.0 mi. | 28.0 mi. | 28.0 mi. |
| City, State | Lake Arrowhead, CA | Blue Jay, CA | Blue Jay, CA | Big Bear, CA | Big Bear, CA | Big Bear, CA |
| Property Type | Anchored Retail | Neighborhood Center | Neighborhood Center | Convenience/ Strip Center | Convenience/ Strip Center | Neighborhood Center |
| Year Built / Renovated | 1980 / 2004 | 1999 / 2004 | 1991 / NAP | 1922 / 2013 | 1992 / NAP | 1973 / 2000 |
| Total Occupancy | 84.3%(2) | 86.0% | 100.0% | 100.0% | 96.0% | 92.0% |
| Anchor Size (Sq. Ft.) | 54,080(2) | 28,000 | 14,000 | 0 | 0 | 75,200 |
| Total Size (Sq. Ft.) | 230,448(2) | 112,414 | 32,600 | 5,843 | 74,707 | 113,228 |
| Anchor Tenants | Stater Bros., Bank of America, United States Postal Service | Jensen’s Food | Rite Aid | None | Kmart (Shadow) | Vons, Dollar Tree, Starbucks |
| (1) | Source: Appraisal |
| (2) | Based on rent roll dated March 31, 2015 |
Cash Flow Analysis.
| Cash Flow Analysis | ||||||
| 2011 | 2012 | 2013 | 2014 | U/W | U/W PSF | |
| Base Rent | $3,244,917 | $3,391,430 | $3,512,868 | $3,444,803 | $3,563,561 | $15.46 |
| Value of Vacant Space | 0 | 0 | 0 | 0 | 874,422 | 3.79 |
| Gross Potential Rent | $3,2,44,917 | $3,391,430 | $3,512,868 | $3,444,803 | $4,437,983 | $19.26 |
| Total Recoveries | 1,303,855 | 1,259,713 | 1,292,676 | 1,405,121 | 1,408,214 | 6.11 |
| Total % Rents | 107,529 | 112,300 | 77,016 | 108,549 | 108,549 | 0.47 |
Total Other Income(1) | 204,944 | 153,292 | 178,734 | 180,691 | 180,691 | 0.78 |
Less: Vacancy & Credit Loss(2) | 0 | 0 | 0 | 0 | (874,422) | (3.79) |
| Effective Gross Income | $4,861,245 | $4,916,735 | $5,061,294 | $5,139,164 | $5,261,015 | $22.83 |
| Total Operating Expenses | 2,458,597 | 2,397,153 | 2,419,923 | 2,370,885 | 2,376,103 | 10.31 |
| Net Operating Income | $2,402,648 | $2,519,582 | $2,641,371 | $2,768,279 | $2,884,912 | $12.52 |
| TI/LC | 0 | 0 | 0 | 0 | 172,836 | 0.75 |
| Capital Expenditures | 0 | 0 | 0 | 0 | 46,090 | 0.20 |
| Net Cash Flow | $2,402,648 | $2,519,582 | $2,641,371 | $2,768,279 | $2,665,986 | $11.57 |
| (1) | Total Other Income is comprised primarily of event income from seasonal events such as concerts. |
| (2) | U/W Vacancy & Credit Loss is based on actual in-place economic vacancy of 14.7% of Gross Potential Rent, Total Recoveries and Total % Rents. |
THE INFORMATION IN THIS STRUCTURAL AND COLLATERAL TERM SHEET IS NOT COMPLETE AND MAY BE AMENDED PRIOR TO THE TIME OF SALE. THIS TERM SHEET IS NOT AN OFFER TO SELL THESE SECURITIES AND IT IS NOT A SOLICITATION OF AN OFFER TO BUY THESE SECURITIES IN ANY JURISDICTION WHERE THE OFFER OR SALE IS NOT PERMITTED.
97
28200 Highway 189 Lake Arrowhead, CA 92352 | Collateral Asset Summary – Loan No. 9 Lake Arrowhead Village | Cut-off Date Balance: Cut-off Date LTV: U/W NCF DSCR: U/W NOI Debt Yield: | $32,924,353 66.5% 1.26x 8.8% |
Property Management. The Lake Arrowhead Village Property is managed by Pacific Capital Management, Inc., which is an affiliate of the sponsor.
Lockbox / Cash Management. The Lake Arrowhead Village Loan is structured with a hard lockbox and springing cash management. In place cash management will occur upon (i) the commencement of any Cash Trap Period (as defined below) or (ii) the failure by the borrower after the end of two consecutive calendar quarters to maintain a DSCR of 1.15x until the DSCR is at least equal to 1.25x for two consecutive calendar quarters. Additionally, an excess cash flow sweep will occur during a “Cash Trap Period”, which will commence upon (i) any event of default or (ii) any bankruptcy action of borrower, principal, guarantor or manager.
Initial Reserves. At loan closing, the borrowers deposited (i) $137,250 into a tax reserve account, (ii) $55,494 into an insurance reserve account, (iii) $250,000 into a TI/LC reserve account for future tenant lease expiration, (iv) $700,000 into a required repairs reserve account, which represents 125% of the engineer’s recommendation and (v) $300,000 into a Post Office Rollover reserve account pending lease renewal, which is currently out for signature.
Ongoing Reserves. On a monthly basis, the borrower is required to deposit reserves of (i) 1/12 of the estimated annual real estate taxes, which currently equates to $45,750, (ii) 1/12 of the estimated annual insurance premiums, which currently equates to $8,378, (iii) $3,841 into a replacement reserve account, subject to a cap of $230,448 and (iv) $14,403 into a TI/LC reserve account, subject to a cap of $864,180 so long as the debt yield is greater than or equal to 8.5%.
Current Mezzanine or Subordinate Indebtedness. None.
Future Mezzanine or Subordinate Indebtedness Permitted. None.
THE INFORMATION IN THIS STRUCTURAL AND COLLATERAL TERM SHEET IS NOT COMPLETE AND MAY BE AMENDED PRIOR TO THE TIME OF SALE. THIS TERM SHEET IS NOT AN OFFER TO SELL THESE SECURITIES AND IT IS NOT A SOLICITATION OF AN OFFER TO BUY THESE SECURITIES IN ANY JURISDICTION WHERE THE OFFER OR SALE IS NOT PERMITTED.
98
28200 Highway 189 Lake Arrowhead, CA 92352 | Collateral Asset Summary – Loan No. 9 Lake Arrowhead Village | Cut-off Date Balance: Cut-off Date LTV: U/W NCF DSCR: U/W NOI Debt Yield: | $32,924,353 66.5% 1.26x 8.8% |
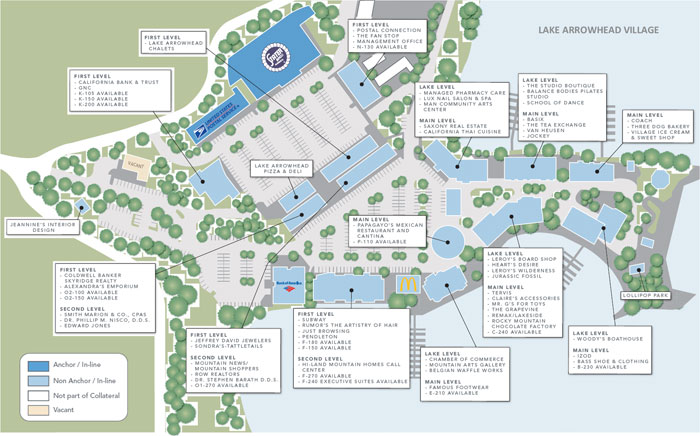
THE INFORMATION IN THIS STRUCTURAL AND COLLATERAL TERM SHEET IS NOT COMPLETE AND MAY BE AMENDED PRIOR TO THE TIME OF SALE. THIS TERM SHEET IS NOT AN OFFER TO SELL THESE SECURITIES AND IT IS NOT A SOLICITATION OF AN OFFER TO BUY THESE SECURITIES IN ANY JURISDICTION WHERE THE OFFER OR SALE IS NOT PERMITTED.
99
28200 Highway 189 Lake Arrowhead, CA 92352 | Collateral Asset Summary – Loan No. 9 Lake Arrowhead Village | Cut-off Date Balance: Cut-off Date LTV: U/W NCF DSCR: U/W NOI Debt Yield: | $32,924,353 66.5% 1.26x 8.8% |
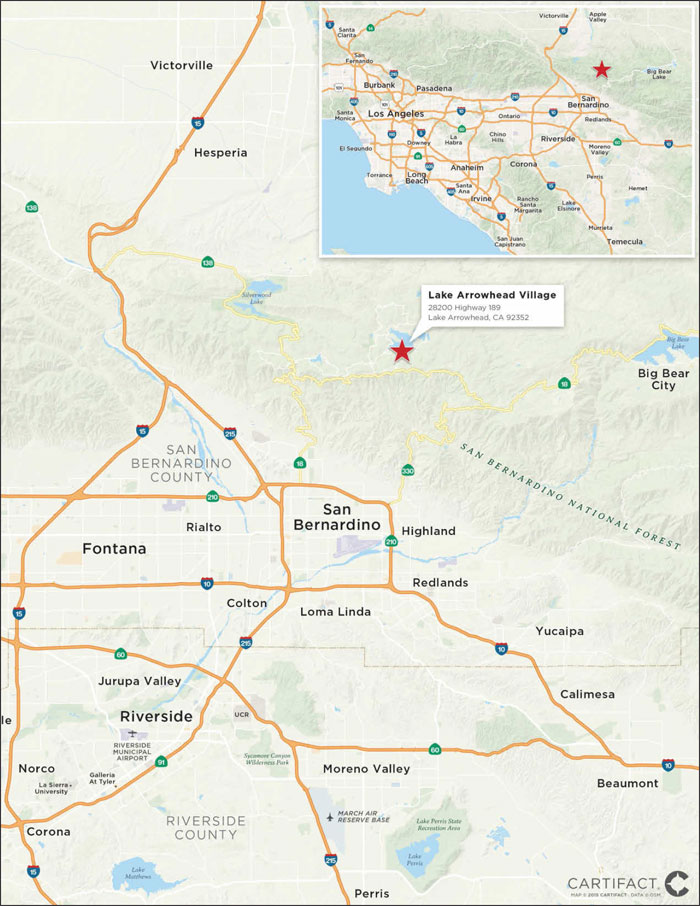
THE INFORMATION IN THIS STRUCTURAL AND COLLATERAL TERM SHEET IS NOT COMPLETE AND MAY BE AMENDED PRIOR TO THE TIME OF SALE. THIS TERM SHEET IS NOT AN OFFER TO SELL THESE SECURITIES AND IT IS NOT A SOLICITATION OF AN OFFER TO BUY THESE SECURITIES IN ANY JURISDICTION WHERE THE OFFER OR SALE IS NOT PERMITTED.
100
(THIS PAGE INTENTIONALLY LEFT BLANK)
101
100 Middle Street Portland, ME 04101 | Collateral Asset Summary – Loan No. 10 100 Middle Street | Cut-off Date Balance: Cut-off Date LTV: U/W NCF DSCR: U/W NOI Debt Yield: | $31,000,000 74.1% 1.33x 9.0% |
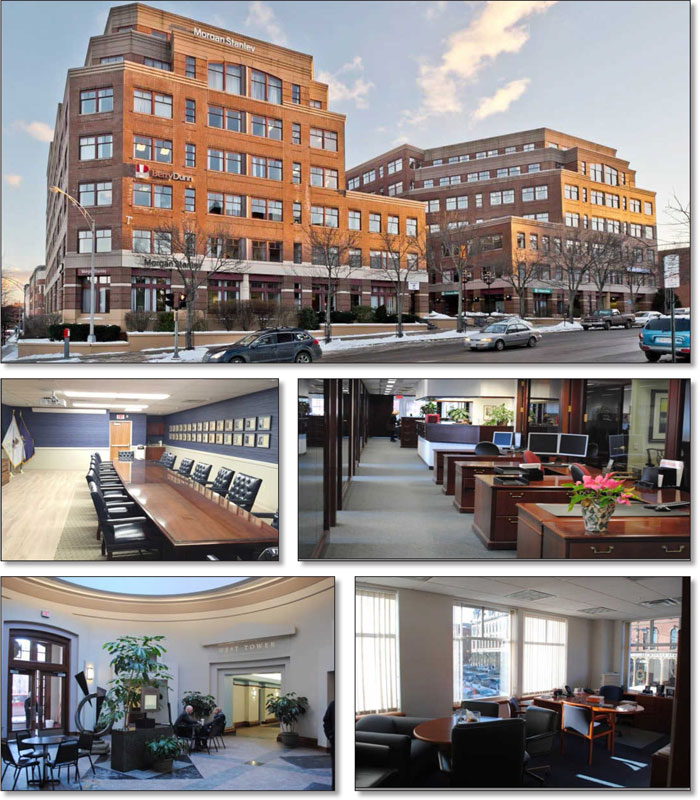
THE INFORMATION IN THIS STRUCTURAL AND COLLATERAL TERM SHEET IS NOT COMPLETE AND MAY BE AMENDED PRIOR TO THE TIME OF SALE. THIS TERM SHEET IS NOT AN OFFER TO SELL THESE SECURITIES AND IT IS NOT A SOLICITATION OF AN OFFER TO BUY THESE SECURITIES IN ANY JURISDICTION WHERE THE OFFER OR SALE IS NOT PERMITTED.
102
100 Middle Street Portland, ME 04101 | Collateral Asset Summary – Loan No. 10 100 Middle Street | Cut-off Date Balance: Cut-off Date LTV: U/W NCF DSCR: U/W NOI Debt Yield: | $31,000,000 74.1% 1.33x 9.0% |
| Mortgage Loan Information | |
| Loan Seller: | CCRE |
| Loan Purpose: | Acquisition |
| Sponsor: | Mark J. McInerney; Christopher J. Knisley |
| Borrower: | Albany Road-Portland LLC |
| Original Balance: | $31,000,000 |
| Cut-off Date Balance: | $31,000,000 |
| % by Initial UPB: | 2.3% |
| Interest Rate: | 4.2690% |
| Payment Date: | 6th of each month |
| First Payment Date: | May 6, 2015 |
| Maturity Date: | April 6, 2025 |
| Amortization: | Interest only for the first 48 months; 300 months thereafter |
| Additional Debt: | None |
| Call Protection: | L(25), D(91), O(4) |
| Lockbox / Cash Management: | Hard / Springing |
Reserves(1) | ||
| Initial | Monthly | |
| Taxes: | $116,134 | $58,067 |
| Insurance: | $7,645 | $3,822 |
Replacement(2): | $2,554,635 | Springing |
TI/LC(3): | $2,600,000 | Springing |
Holdback(4): | $1,000,000 | $0 |
| Financial Information | ||
| Cut-off Date Balance / Sq. Ft.: | $162 | |
| Balloon Balance / Sq. Ft.: | $138 | |
Cut-off Date LTV(5): | 74.1% | |
Balloon LTV(5): | 65.1% | |
Underwritten NOI DSCR(6): | 1.39x | |
Underwritten NCF DSCR(6): | 1.33x | |
| Underwritten NOI Debt Yield: | 9.0% | |
| Underwritten NCF Debt Yield: | 8.7% | |
Underwritten NOI Debt Yield at Balloon: | 10.6% | |
Underwritten NCF Debt Yield at Balloon: | 10.2% | |
| Property Information | |
| Single Asset / Portfolio: | Single Asset |
| Property Type: | CBD Office |
| Collateral: | Fee Simple |
| Location: | Portland, ME |
| Year Built / Renovated: | 1987 / 2015 |
| Total Sq. Ft.: | 191,654 |
| Property Management: | Albany Road Asset Services LLC; CBRE/Boulos Asset Management |
| Underwritten NOI: | $2,799,840 |
| Underwritten NCF: | $2,684,110 |
| “As Is” Appraised Value: | $40,500,000 |
| “As Is” Appraisal Date: | February 13, 2015 |
“As Stabilized” Appraised Value(5): | $43,000,000 |
“As Stabilized” Appraisal Date(5): | December 13, 2016 |
| Historical NOI | |
| 2014 NOI: | $2,952,515 (December 31, 2014) |
| 2013 NOI: | $2,735,966 (December 31, 2013) |
| 2012 NOI: | $2,726,168 (December 31, 2012) |
| 2011 NOI: | $2,646,095 (December 31, 2011) |
| Historical Occupancy | |
| Most Recent Occupancy: | 99.2% (March 9, 2015) |
| 2014 Occupancy: | 99.4% (December 31, 2014) |
| 2013 Occupancy: | 97.5% (December 31, 2013) |
| 2012 Occupancy: | 99.7% (December 31, 2012) |
| 2011 Occupancy: | 100.0% (December 31, 2011) |
| (1) | See “Initial Reserves” and “Ongoing Reserves” herein. |
| (2) | Lender reserved $2,554,635 to fund an elective capital improvement plan. Additionally, the borrower will be required to commence monthly deposits of $3,200 ($0.20 PSF annually), subject to a cap of $200,000 ($1.04 PSF), upon the balance in the replacement reserve account falling below $115,000 ($0.60 PSF). |
| (3) | Lender reserved $2,600,000 for non-tenant specific future rollover. Additionally, the borrower will be required to commence monthly deposits of $15,000 ($0.94 PSF annually), subject to a cap of $500,000 ($2.61 PSF), upon the balance in the replacement reserve account falling below $500,000. |
| (4) | Bank of America currently occupies 24,065 sq. ft. (12.6% of total NRA) but has notified the borrower that it will not renew upon expiration. Amounts in the Holdback reserve may be disbursed to the borrower, not more than once per quarter, prior to March 19, 2017 and provided no cash management period is continuing, provided the (i) net cash flow debt yield is greater than or equal to 8.0% and (ii) net cash flow DSCR is greater than or equal to 1.25x, as calculated based on the outstanding loan balance net of any outstanding Holdback reserve amounts after the disbursement. Notwithstanding the foregoing, at any time prior to March 19, 2017, and provided no event of default is continuing, the lender will disburse funds in the holdback reserve upon borrower’s delivery of an acceptable letter of credit equal to the outstanding balance of the Holdback reserve funds. Any funds remaining in the Holdback reserve after March 19, 2017 will be, at lender’s discretion, (i) held for the remaining term of the loan or (ii) used to prepay the outstanding principal balance subject to the payment of a yield maintenance payment. |
| (5) | Cut-off Date LTV is calculated net of the $1,000,000 Holdback reserve and using the “As is” appraisal value. Based on the “As Stabilized” Appraised Value that assumes the completion of the borrower’s capital improvement program and a forecast of 12-months to release the Bank of America space, the 100 Middle Street Loan Cut-off Date LTV and Balloon LTV are 72.1% and 61.3%, respectively. |
| (6) | Based on amortizing debt service payments. Based on the current interest only payments, the DSCR based on Underwritten NOI and Underwritten NCF are 2.09x and 2.00x respectively. |
THE INFORMATION IN THIS STRUCTURAL AND COLLATERAL TERM SHEET IS NOT COMPLETE AND MAY BE AMENDED PRIOR TO THE TIME OF SALE. THIS TERM SHEET IS NOT AN OFFER TO SELL THESE SECURITIES AND IT IS NOT A SOLICITATION OF AN OFFER TO BUY THESE SECURITIES IN ANY JURISDICTION WHERE THE OFFER OR SALE IS NOT PERMITTED.
103
100 Middle Street Portland, ME 04101 | Collateral Asset Summary – Loan No. 10 100 Middle Street | Cut-off Date Balance: Cut-off Date LTV: U/W NCF DSCR: U/W NOI Debt Yield: | $31,000,000 74.1% 1.33x 9.0% |
| Tenant Summary | |||||||
Tenant | Ratings (Fitch/Moody’s/S&P)(1) | Net Rentable Area (Sq. Ft.) | % of Net Rentable Area | U/W Base Rent PSF | % of Total U/W Base Rent | Lease Expiration | |
| BSSN | NR/NR/NR | 56,275(2) | 29.4% | $14.50 | 18.7% | 12/31/2022(3) | |
GSA (4) | AAA/Aaa/AA+ | 40,032 | 20.9% | $31.80 | 29.2% | Various | |
| Berry Dunn | NR / NR / NR | 35,578 | 18.6% | $26.00 | 21.2% | 12/31/2023 | |
| Bank of America | A/Baa2/A- | 24,065 | 12.6% | $23.50 | 13.0% | 12/31/2015(5) | |
| Morgan Stanley | A/Baa2/A- | 22,155 | 11.6% | $23.12 | 11.8% | 10/31/2018(6) | |
| Total Major Tenants | 178,105 | 92.9% | $22.97 | 94.0% | |||
| Remaining Tenants | 12,036 | 6.3% | $21.88 | 6.0% | |||
| Total Occupied Collateral | 190,141 | 99.2% | $22.90 | 100.0% | |||
| Vacant | 1,513 | 0.8% | |||||
| Total | 191,654 | 100.0% | |||||
| (1) | Certain ratings may be those of the parent company whether or not the parent company guarantees the lease. |
| (2) | At any time, in the event the number of lawyers employed as full-time practicing attorneys of BSSN decreases to 54 or fewer for a period of 120 consecutive business days or more, BSSN may reduce its leased premises by either or both of (i) 5,000 sq. ft. of space located on the third floor and (ii) 7,080 sq. ft. of space located on the fourth floor, with six months prior notice. |
| (3) | BSSN has five, 5-year extension options. |
| (4) | The GSA leases three different spaces at the 100 Middle Street Property for United States Attorney, Federal Bureau of Investigation and Secret Service office use. The United States Attorney leases 30,620 sq. ft. expiring March 14, 2023, the Federal Bureau of Investigation leases 7,028 sq. ft. expiring June 14, 2018 and the Secret Service leases 2,384 sq. ft. expiring September 29, 2016. The GSA has the right to (i) return up to 2,040 sq. ft. of the United States Attorney space at any time with at least 30 days prior notice and (ii) terminate the Secret Service space at any time with at least 60 days prior notice. |
| (5) | Bank of America has notified the borrower that it will not renew upon expiration. The borrower reserved $1.0 million be disbursed to the borrower, not more than once per quarter, prior to March 19, 2017 and provided no cash management period is continuing, provided the (i) net cash flow debt yield is greater than or equal to 8.0% and (ii) net cash flow DSCR is greater than or equal to 1.25x, as calculated based on the outstanding loan balance net of any outstanding Holdback reserve amounts after the disbursement. |
| (6) | Morgan Stanley has two, five-year extension options. |
Lease Rollover Schedule(1) | ||||||||||
| Year | # of Leases Expiring | Total Expiring Sq. Ft. | % of Total Sq. Ft. Expiring | Cumulative Sq. Ft. Expiring | Cumulative % of Sq. Ft. Expiring | Annual U/W Base Rent PSF | % U/W Base Rent Rolling | Cumulative % of U/W Base Rent | ||
| MTM | 1 | 615 | 0.3% | 615 | 0.3% | $18.43 | 0.3% | 0.3% | ||
| 2015 | 1 | 24,065 | 12.6% | 24,680 | 12.9% | $23.50 | 13.0% | 13.2% | ||
| 2016 | 1 | 2,384 | 1.2% | 27,064 | 14.1% | $22.73 | 1.2% | 14.5% | ||
| 2017 | 0 | 0 | 0.0% | 27,064 | 14.1% | $0.00 | 0.0% | 14.5% | ||
| 2018 | 3 | 31,972 | 16.7% | 59,036 | 30.8% | $24.23 | 17.8% | 32.3% | ||
| 2019 | 2 | 8,282 | 4.3% | 67,318 | 35.1% | $21.04 | 4.0% | 36.3% | ||
| 2020 | 1 | 350 | 0.2% | 67,668 | 35.3% | $27.00 | 0.2% | 36.5% | ||
| 2021 | 0 | 0 | 0.0% | 67,668 | 35.3% | $0.00 | 0.0% | 36.5% | ||
| 2022 | 1 | 56,275 | 29.4% | 123,943 | 64.7% | $14.50 | 18.7% | 55.2% | ||
| 2023 | 2 | 66,198 | 34.5% | 190,141 | 99.2% | $29.45 | 44.8% | 100.0% | ||
| 2024 | 0 | 0 | 0.0% | 190,141 | 99.2% | $0.00 | 0.0% | 100.0% | ||
| 2025 | 0 | 0 | 0.0% | 190,141 | 99.2% | $0.00 | 0.0% | 100.0% | ||
| Thereafter | 0 | 0 | 0.0% | 190,141 | 99.2% | $0.00 | 0.0% | 100.0% | ||
| Vacant | NAP | 1,513 | 0.8% | 191,654 | 100.0% | NAP | NAP | |||
| Total / Wtd. Avg. | 12 | 191,654 | 100.0% | $22.90 | 100.0% | |||||
(1) | Certain tenants may have lease termination options that may become exercisable prior to the originally stated expiration date of the tenant lease that are not considered in the lease rollover schedule. |
The Loan. The 100 Middle Street loan (the “100 Middle Street Loan”) is a fixed rate loan with an original principal balance of $31.0 million, secured by the borrower’s fee simple interest in a two-tower, 191,654 sq. ft. CBD office building (the “100 Middle Street Property”) located in Portland, Maine. The 100 Middle Street Loan has a 10-year term and amortizes on a 25-year schedule after an interest-only term of 48 months. The 100 Middle Street Loan accrues interest at a fixed rate equal to 4.2690% and has a cut-off date balance of $31.0 million. Based on the appraised value of $40.5 million as of February 13, 2015 and net of the $1,000,000 Holdback reserve, the cut-off date LTV ratio is 74.1%. Loan proceeds along with approximately $10.8 million of equity from the sponsors were used to acquire the 100 Middle Street Property for $35.3 million in an off-market transaction and fund reserves of approximately $6.3 million. The most recent financing of the 100 Middle Street Property was not included in a securitization.
THE INFORMATION IN THIS STRUCTURAL AND COLLATERAL TERM SHEET IS NOT COMPLETE AND MAY BE AMENDED PRIOR TO THE TIME OF SALE. THIS TERM SHEET IS NOT AN OFFER TO SELL THESE SECURITIES AND IT IS NOT A SOLICITATION OF AN OFFER TO BUY THESE SECURITIES IN ANY JURISDICTION WHERE THE OFFER OR SALE IS NOT PERMITTED.
104
100 Middle Street Portland, ME 04101 | Collateral Asset Summary – Loan No. 10 100 Middle Street | Cut-off Date Balance: Cut-off Date LTV: U/W NCF DSCR: U/W NOI Debt Yield: | $31,000,000 74.1% 1.33x 9.0% |
| Sources and Uses | ||||||
| Sources | Proceeds | % of Total | Uses | Proceeds | % of Total | |
| Loan Amount | $31,000,000 | 74.2% | Purchase Price | $35,300,000 | 84.5% | |
| Sponsor Equity | $10,774,871 | 25.8% | Reserves | $6,278,414 | 15.0% | |
| Closing Costs | $196,457 | 0.5% | ||||
| Total Sources | $41,774,871 | 100.0% | Total Uses | $41,774,871 | 100.0% | |
The Borrower / Sponsor. The borrower, Albany Road-Portland LLC, is a Delaware limited liability company and single purpose entity structured to be bankruptcy-remote, with one independent director in its organizational structure. The sponsors of the borrower and non-recourse carve-out guarantors are Christopher J. Knisley and Mark J. McInerney, on a joint and several basis.
Christopher J. Knisley is the president and Mark J. McInerney is a partner of Albany Road Real Estate Partners, a real estate investment and management company founded in 2012 and headquartered in Boston, Massachusetts. Since inception, Albany Road Real Estate Partners has acquired 23 properties totaling 3.1 million sq. ft. with a gross asset value of approximately $340.0 million. In addition to its headquarter office in Boston, Massachusetts, Albany Road Real Estate Partners recently opened a regional office in Nashville, Tennessee in order to pursue and manage investments across the southeastern United States.
The Property. The 100 Middle Street Property consists of two, Class-A, seven-story, adjoining towers that contain 191,654 sq. ft. and are located in Portland, Maine. The 100 Middle Street Property was constructed in 1987 and is currently undergoing a renovation totaling approximately $2.6 million that is further detailed below. Additionally, the 100 Middle Street Property includes a 285 space parking garage, which is accessible via the south side of Middle Street and north side of Fore Street.
At loan closing, the borrower escrowed with lender $2,554,635, or 100.0% of the borrower’s budget, for elective capital improvements that are detailed below. Approximately $712,203 of the total budget is expected to be used for outstanding tenant improvements associated with the Berstein Shur lease and the Berry Dunn lease.
| Capital Improvements Budget | |
| Description | Budgeted Cost / Reserved Amount |
| Garage Repairs | $50,000 |
| Repair of Pavement and Sidewalks | $50,000 |
| Façade Repairs | $100,000 |
| Roof Replacement | $250,000 |
| Upgrade of Main Lobby and Corridors | $100,000 |
| Replace Cooling Towers | $250,000 |
| Pump, Boiler, Vent Replacement | $145,000 |
| Heat Pumps Replacement | $100,000 |
| Elevator Upgrades | $600,000 |
| Fire Panel Replacement | $50,000 |
| Energy Audit | $147,432 |
| Future Tenant Space Upgrades Due | $712,203 |
| Total | $2,554,635 |
Primary access to the 100 Middle Street Property is provided by Route 295, the coastal loop of the Maine Turnpike, which runs northeast from its junction with Interstate 95 in South Portland through the city of Portland north to its reconnection with Interstate 95 in Gray, just south of Augusta. Route 295 merges with Route 1, the major north-south highway servicing the eastern part of the state that encircles the 100 Middle Street Property. Exit 5 of Route 295 at Congress and Park Streets is located approximately 0.7 miles from the 100 Middle Street Property. Within a 5-mile radius of the 100 Middle Street Property as of 2015, there was a population and average household income of 105,886 and $70,366, respectively.
The 100 Middle Street Property is 99.2% leased to 12 tenants as of March 9, 2015 and is comprised of 191,304 sq. ft. of traditional office space as well as a 350 sq. ft. café. The 100 Middle Street Property has averaged an occupancy rate of greater than 97.4% since 2010. The largest tenant, BSSN, leases 56,275 sq. ft., 29.4% of the total net rentable area (“NRA”) and accounts for 18.7% of the U/W base rent. The second largest tenant, the GSA, leases 20.9% of the total NRA and accounts for 29.2% of the U/W base rent. The third largest tenant, Berry Dunn, leases 18.6% of the total NRA and accounts for 21.2% of the U/W base rent. No other tenant leases more than 12.6% of the total NRA. Investment-grade rated tenants including the GSA, Morgan Stanley and Citizens Bank occupy 34.2% or the total NRA and account for approximately 42.6% of underwritten base rent.
THE INFORMATION IN THIS STRUCTURAL AND COLLATERAL TERM SHEET IS NOT COMPLETE AND MAY BE AMENDED PRIOR TO THE TIME OF SALE. THIS TERM SHEET IS NOT AN OFFER TO SELL THESE SECURITIES AND IT IS NOT A SOLICITATION OF AN OFFER TO BUY THESE SECURITIES IN ANY JURISDICTION WHERE THE OFFER OR SALE IS NOT PERMITTED.
105
100 Middle Street Portland, ME 04101 | Collateral Asset Summary – Loan No. 10 100 Middle Street | Cut-off Date Balance: Cut-off Date LTV: U/W NCF DSCR: U/W NOI Debt Yield: | $31,000,000 74.1% 1.33x 9.0% |
Environmental Matters. The Phase I environmental report dated March 12, 2015 recommended no further action at the 100 Middle Street Property aside from the implementation of an asbestos containing-material operations and maintenance plan, which is currently in place.
Major Tenants
BSSN (56,275 sq. ft.; 29.4% of NRA; 18.7% of U/W Base Rent) Bernstein, Shur, Sawyer & Nelson P.A. (“BSSN”) has more than 100 attorneys in offices in Maine and New Hampshire. Founded in 1915, the firm provides counsel in the areas of business law, litigation, and municipal law to clients throughout the region and around the world. BSSN is Maine’s exclusive member of Lex Mundi, the world’s leading association of independent law firms. BSSN has its headquarters at the 100 Middle Street Property since 1988 and its lease expires December 2022 with five, 5-year extension options.
GSA (40,032 sq. ft.; 20.9% of NRA; 29.2% of U/W Base Rent) The General Serviced Administration (“GSA”) is an independent agency of the United States government, established in 1949 to help manage and support the basic functioning of federal agencies. The GSA supplies products and communications for United States government offices, provides transportation and office space to federal employees and develops government-wide cost-minimizing policies and other management tasks. The GSA leases three different spaces at the 100 Middle Street Property for United States Attorney, Federal Bureau of Investigation and Secret Service office use. The United States Attorney, Federal Bureau of Investigation and Secret Service have each been at the 100 Middle Street Property since 1989, 2010 and 2011, respectively, and each lease expires in March 2023, June 2018 and September 2016, respectively.
Berry Dunn (35,578 sq. ft.; 18.6% of NRA; 21.2% of U/W Base Rent) Berry Dunn McNeil & Parker (“Berry Dunn”), established in 1974, is the largest certified public accounting and management consulting firm headquartered in northern New England, with offices in Portland and Bangor, Maine, and Manchester, New Hampshire. Berry Dunn has been at the 100 Middle Street Property since 1987 and its lease expires December 2023.
Market. The 100 Middle Street Property is located in the city of Portland and is situated in the eastern portion of Cumberland County, Maine. Portland is a coastal community that serves as a premier New England summer destination due to its cobblestone sidewalks lined with shops and restaurants and waterfront scenery. Parenting Magazine named Portland the third best city for families in 2012 and Travel + Leisure Magazine named Portland as the seventh-greenest city in 2012. Additionally, Forbes.com named Portland as one of the top 10 cities for Job prospects in 2012 and Bon Appétit named Portland as America’s Foodiest Small Town in 2009.
The 100 Middle Street Property is located within the Downtown Portland office submarket within the Greater Portland office market. As of Q4 2014, the Downtown Portland submarket contained an overall inventory of approximately 4.5 million sq. ft. with an occupancy rate of 90.0%. Specifically, the Class-A, the Downtown Portland submarket contained an overall inventory of approximately 2.0 million sq. ft. with an occupancy rate of 91.2%. Additionally, the appraiser identified a peer group of 49 competitive properties totaling 3.3 million sq. ft. that reported an average occupancy of 92.3% with asking rents ranging from $10.00 to $28.00 on a modified gross basis. The appraiser concluded a stabilized occupancy rate of 96.8% for the 100 Middle Street Property.
Underwritten base rent at the 100 Middle Street Property is approximately $22.90 PSF, which is in line with the competitive group range of $10.00 to $28.00 PSF and the appraiser’s concluded market rent of $23.50 PSF The appraiser identified seven comparable offices within the 100 Middle Street Property’s market. A summary of the seven comparable offices is shown in the chart below.
Comparable Office Buildings(1) | |||||
| Property | City, State | Year Built | NRA (sq. ft.) | Occupancy | Rent PSF |
| 100 Middle Street Property | Portland, ME | 1987 | 191,654(2) | 99.2%(2) | $22.90(2) |
| Portland Square | Portland, ME | 1987 | 258,984 | 97.0% | $25.50 |
| 970 Baxter Boulevard | Portland, ME | 1985 | 30,807 | 100.0% | $14.50 |
| 54-68 Marginal Way | Portland, ME | 2002 | 41,250 | 100.0% | $20.00 |
| 161 Marginal Way | Portland, ME | 2000 | 50,400 | 100.0% | $18.00 |
| Harbour Place | Portland, ME | 1986 | 109,172 | 95.0% | $32.00 |
| One New Hampshire | Portland, ME | 2001 | 107,746 | 95.0% | $23.00 |
| 2 International Drive | Portland, ME | 1998 | 88,467 | 43.0% | $22.00 |
Total / Wtd. Avg.(3) | 686,826 | 90.0% | $24.32 | ||
| (1) | Source: Appraisal. |
| (2) | Based on the underwritten rent roll dated March 9, 2015. |
| (3) | Total / Wtd. Avg. does not include the 100 Middle Street Property. |
THE INFORMATION IN THIS STRUCTURAL AND COLLATERAL TERM SHEET IS NOT COMPLETE AND MAY BE AMENDED PRIOR TO THE TIME OF SALE. THIS TERM SHEET IS NOT AN OFFER TO SELL THESE SECURITIES AND IT IS NOT A SOLICITATION OF AN OFFER TO BUY THESE SECURITIES IN ANY JURISDICTION WHERE THE OFFER OR SALE IS NOT PERMITTED.
106
100 Middle Street Portland, ME 04101 | Collateral Asset Summary – Loan No. 10 100 Middle Street | Cut-off Date Balance: Cut-off Date LTV: U/W NCF DSCR: U/W NOI Debt Yield: | $31,000,000 74.1% 1.33x 9.0% |
Cash Flow Analysis.
| Cash Flow Analysis | ||||||
| 2011 | 2012 | 2013 | 2014 | U/W | U/W PSF | |
Base Rent(1) | $3,837,810 | $3,841,229 | $4,001,496 | $4,305,383 | $4,355,038 | $22.72 |
| Value of Vacant Space | 0 | 0 | 0 | 0 | 35,556 | 0.19 |
| Gross Potential Rent | $3,837,810 | $3,841,229 | $4,001,496 | $4,305,383 | $4,390,594 | $22.91 |
| Total Recoveries | 512,118 | 573,174 | 515,105 | 486,448 | 536,396 | 2.80 |
| Total Other Income | 114,335 | 114,430 | 113,455 | 122,630 | 122,630 | 0.64 |
Less: Vacancy(2) | (14,994) | (8,419) | (43,160) | (76,560) | (394,159) | (2.06) |
| Effective Gross Income | 4,449,269 | 4,520,413 | $4,586,896 | $4,837,901 | $4,655,460 | $24.29 |
| Total Operating Expenses | 1,803,174 | 1,794,245 | 1,850,930 | 1,885,386 | 1,855,620 | 9.68 |
| Net Operating Income | $2,646,095 | $2,726,168 | $2,735,966 | $2,952,515 | $2,799,840 | $14.61 |
TI/LC(3) | 0 | 0 | 0 | 0 | 76,662 | 0.40 |
Capital Expenditures(4) | 0 | 0 | 0 | 0 | 39,068 | 0.20 |
| Net Cash Flow | $2,646,095 | $2,726,168 | $2,735,966 | $2,952,515 | $2,684,110 | $14.00 |
| (1) | U/W Base Rent includes $33,365 of contractual rent steps through April 2016 and $8,343 of averaged contractual rent increases for Morgan Stanley and Citizens Bank through their respective lease expiration dates. |
| (2) | U/W Vacancy is based on an economic vacancy of 9.0% of Gross Potential Rent, greater than the appraiser’s concluded vacancy of 3.2%. The 100 Middle Street Property is 99.2% occupied as of March 9, 2015. |
| (3) | The borrower reserved $2.6 million for non-specific general tenant rollover. |
| (4) | The borrower reserved approximately $2.6 million for an elective capital improvement plan. |
Property Management. The 100 Middle Street Property is primarily managed by Albany Road Asset Services, LLC, which is an affiliate of the borrower, and sub-managed by CBRE/Boulos Asset Management.
Lockbox / Cash Management. The 100 Middle Street Loan is structured with a hard lockbox and springing cash management. Cash management and an excess cash flow sweep will be triggered upon (i) an event of default, (ii) the failure by the borrower after the end of two calendar quarters to maintain a net cash flow debt service coverage ratio of at least 1.15x (a “DSCR Trigger Event”) or (iii) the occurrence of a Lease Sweep Period (as defined below). Notwithstanding the foregoing, so long as no event of default is occurring, the borrower may cure an excess cash flow sweep caused by a DSCR Trigger Event by (i) depositing funds or delivering, within 20 days of receipt of notice of the commencement of a DSCR Trigger Event, an acceptable letter of credit in each case, in an amount which, if applied to the payment of the outstanding principal balance of the loan, would cause the net cash flow DSCR to be greater than or equal to 1.20x.
A “Lease Sweep Period” will commence upon the earlier of: (i) the date that BSSN delivers to borrower a written notice terminating its lease, (ii) the date that BSSN delivers to borrower a written notice that it does not intend to renew its lease, (iii) twelve months prior to the then current expiration date of the BSSN lease or (iv) BSSN becoming a debtor in any bankruptcy or insolvency proceeding.
Initial Reserves. At loan closing, the borrower deposited (i) $116,134 into a tax reserve account, (ii) $7,645 into an insurance reserve account, (iii) $2,554,635 into a replacement reserve account to fund the borrower’s elective capital improvement program, (iv) $2,600,000 into a TI/LC reserve account for general future tenant rollover and (v) $1,000,000 into a Holdback reserve account in connection with the expiration of the Bank of America lease.
Amounts in the Holdback reserve may be disbursed to the borrower, not more than once per quarter, prior to March 19, 2017 and provided no cash management period is continuing, provided the (i) net cash flow debt yield excluding Bank of America is greater than or equal to 8.0% and (ii) net cash flow debt service coverage ratio excluding Bank of America is greater than or equal to 1.25x, as calculated based on the outstanding 100 Middle Street Loan balance net of any outstanding Holdback reserve amounts after the disbursement. Notwithstanding the foregoing, at any time prior to March 19, 2017 and provided no event of default is continuing, the lender will disburse funds in the Holdback reserve upon borrower’s delivery of an acceptable letter of credit equal to the outstanding balance of the Holdback reserve funds. Any funds remaining in the Holdback reserve account after March 9, 2017 will be, at lender’s discretion, (i) held for the remaining term of the loan or (ii) used to prepay the outstanding principal balance subject to the payment of a yield maintenance payment.
Ongoing Reserves. On a monthly basis, the borrowers will be required to make deposits of (i) 1/12 of the required annual taxes, which currently equates to $58,067 and (ii) 1/12 of the required insurance premiums, which currently equates to $3,822. Additionally, the borrower will be required to commence monthly deposits of (i) $3,200 ($0.20 PSF annually) into the replacement reserve account, subject to a cap of $200,000 ($1.04 PSF), upon the balance in the replacement reserve account falling below $115,000 ($0.60 PSF) and (ii) $15,000 ($0.94 PSF annually) into the TI/LC reserve account, subject to a cap of $500,000 ($2.61 PSF), upon the balance in the replacement reserve account falling below $500,000.
THE INFORMATION IN THIS STRUCTURAL AND COLLATERAL TERM SHEET IS NOT COMPLETE AND MAY BE AMENDED PRIOR TO THE TIME OF SALE. THIS TERM SHEET IS NOT AN OFFER TO SELL THESE SECURITIES AND IT IS NOT A SOLICITATION OF AN OFFER TO BUY THESE SECURITIES IN ANY JURISDICTION WHERE THE OFFER OR SALE IS NOT PERMITTED.
107
100 Middle Street Portland, ME 04101 | Collateral Asset Summary – Loan No. 10 100 Middle Street | Cut-off Date Balance: Cut-off Date LTV: U/W NCF DSCR: U/W NOI Debt Yield: | $31,000,000 74.1% 1.33x 9.0% |
Current Mezzanine or Subordinate Indebtedness. None.
Future Mezzanine or Subordinate Indebtedness Permitted. None.
THE INFORMATION IN THIS STRUCTURAL AND COLLATERAL TERM SHEET IS NOT COMPLETE AND MAY BE AMENDED PRIOR TO THE TIME OF SALE. THIS TERM SHEET IS NOT AN OFFER TO SELL THESE SECURITIES AND IT IS NOT A SOLICITATION OF AN OFFER TO BUY THESE SECURITIES IN ANY JURISDICTION WHERE THE OFFER OR SALE IS NOT PERMITTED.
108
100 Middle Street Portland, ME 04101 | Collateral Asset Summary – Loan No. 10 100 Middle Street | Cut-off Date Balance: Cut-off Date LTV: U/W NCF DSCR: U/W NOI Debt Yield: | $31,000,000 74.1% 1.33x 9.0% |
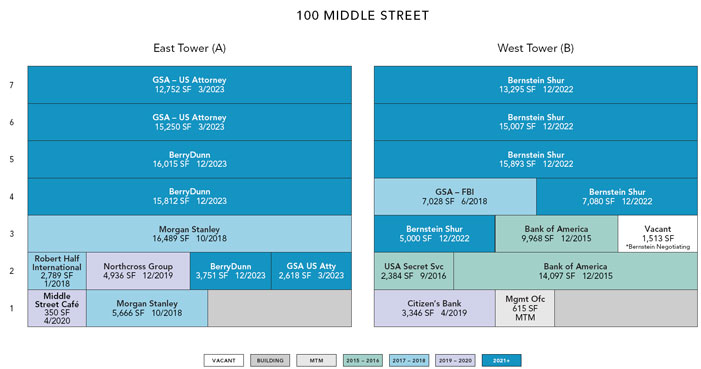
THE INFORMATION IN THIS STRUCTURAL AND COLLATERAL TERM SHEET IS NOT COMPLETE AND MAY BE AMENDED PRIOR TO THE TIME OF SALE. THIS TERM SHEET IS NOT AN OFFER TO SELL THESE SECURITIES AND IT IS NOT A SOLICITATION OF AN OFFER TO BUY THESE SECURITIES IN ANY JURISDICTION WHERE THE OFFER OR SALE IS NOT PERMITTED.
109
100 Middle Street Portland, ME 04101 | Collateral Asset Summary – Loan No. 10 100 Middle Street | Cut-off Date Balance: Cut-off Date LTV: U/W NCF DSCR: U/W NOI Debt Yield: | $31,000,000 74.1% 1.33x 9.0% |
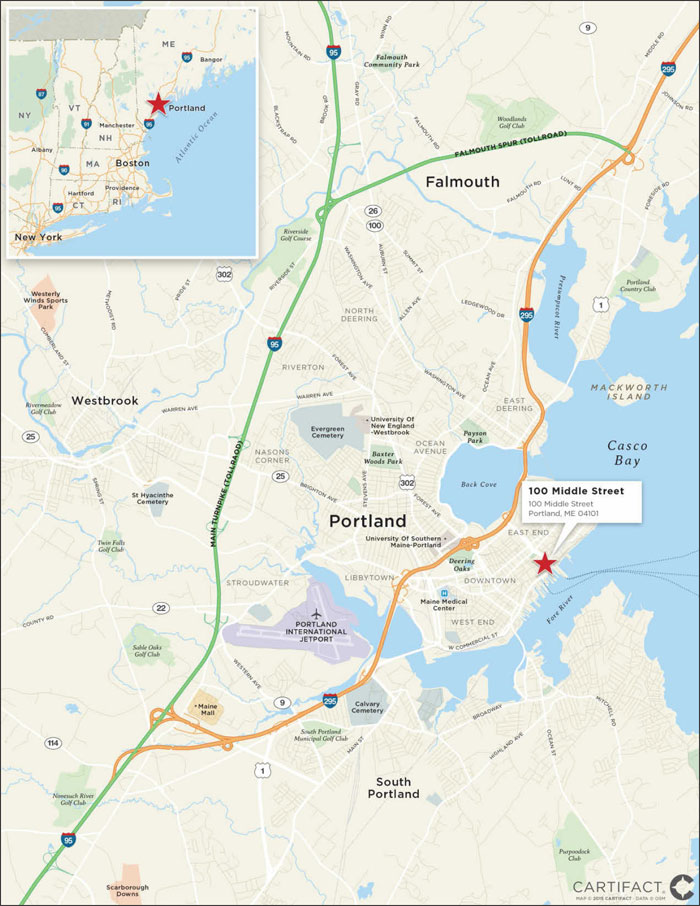
THE INFORMATION IN THIS STRUCTURAL AND COLLATERAL TERM SHEET IS NOT COMPLETE AND MAY BE AMENDED PRIOR TO THE TIME OF SALE. THIS TERM SHEET IS NOT AN OFFER TO SELL THESE SECURITIES AND IT IS NOT A SOLICITATION OF AN OFFER TO BUY THESE SECURITIES IN ANY JURISDICTION WHERE THE OFFER OR SALE IS NOT PERMITTED.
110
(THIS PAGE INTENTIONALLY LEFT BLANK)
111
11640 Mayfield Avenue Los Angeles, CA 90049 | Collateral Asset Summary – Loan No. 11 Luxe Villas | Cut-off Date Balance: Cut-off Date LTV: U/W NCF DSCR: U/W NOI Debt Yield: | $29,250,000 71.0% 1.25x 6.0% |
| Mortgage Loan Information | |
| Loan Seller: | CCRE |
| Loan Purpose: | Refinance |
| Sponsors: | Naum Neil Shekhter; Margot V. Shekhter |
| Borrower: | MayfieldNM, LLC |
| Original Balance: | $29,250,000 |
| Cut-off Date Balance: | $29,250,000 |
| % by Initial UPB: | 2.1% |
| Interest Rate: | 4.6605% |
| Payment Date: | 6th of each month |
| First Payment Date: | June 6, 2015 |
| Maturity Date: | May 6, 2025 |
| Amortization: | Interest only |
| Additional Debt: | None |
| Call Protection: | L(24), D(93), O(3) |
Lockbox / Cash Management(1): | Springing Soft / Springing |
| Reserves | ||
| Initial | Monthly | |
| Taxes: | $72,000 | $18,000 |
| Insurance: | $1,787 | $1,787 |
| Replacement: | $0 | $1,352 |
| Financial Information | |
| Cut-off Date Balance / Unit: | $495,763 |
| Balloon Balance / Unit: | $495,763 |
| Cut-off Date LTV: | 71.0% |
| Balloon LTV: | 71.0% |
Underwritten NOI DSCR(2): | 1.26x |
Underwritten NCF DSCR(2): | 1.25x |
Underwritten NOI Debt Yield(2): | 6.0% |
Underwritten NCF Debt Yield(2): | 5.9% |
| Property Information | |
| Single Asset / Portfolio: | Single Asset |
| Property Type: | Mid-Rise Multifamily |
| Collateral: | Fee Simple |
| Location: | Los Angeles, CA |
| Year Built / Renovated: | 2006 / NAP |
| Total Units: | 59 |
| Property Management: | NMS Properties, Inc. |
Underwritten NOI(2): | $1,742,272 |
Underwritten NCF(2): | $1,726,047 |
| Appraised Value: | $41,200,000 |
| Appraisal Date: | February 27, 2015 |
| Historical NOI | |
| Most Recent NOI: | $1,732,485 (T-12 March 31, 2015) |
| 2014 NOI: | $1,686,118 (December 31, 2014) |
| 2013 NOI: | $1,531,375 (December 31, 2013) |
| 2012 NOI: | $1,294,306 (December 31, 2012) |
| Historical Occupancy | |
| Most Recent Occupancy: | 100.0% (April 23, 2015) |
2014 Occupancy(3): | 91.0% (December 31, 2014) |
| 2013 Occupancy: | 99.7% (December 31, 2013) |
| 2012 Occupancy: | 99.8% (December 31, 2012) |
| (1) | A soft lockbox and in place cash management will be triggered upon (i) any Cash Trap Period (as defined below) or (ii) failure of the borrower to maintain a NOI DSCR of at least 1.20x at the end of two consecutive calendar quarters until such time that the NOI DSCR is at least 1.25x for two consecutive calendar quarters. Additionally, an excess cash flow sweep will occur during a “Cash Trap Period”, which will commence upon (i) any event of default, (ii) the occurrence of any bankruptcy action of the borrower, principal, guarantor or manager or (iii) failure of the borrower to maintain a NOI DSCR of at least 1.15x at the end of two consecutive calendar quarters until such time that the NOI DSCR is at least 1.20x for four consecutive calendar quarters. |
| (2) | Underwritten NOI DSCR, NCF DSCR, NOI Debt Yield, NCF Debt Yield, NOI and NCF include underwritten real estate taxes based on the millage rate multiplied by the loan amount. Based on the in place, assessed real estate tax amount, the Underwritten NOI DSCR, NCF DSCR, NOI Debt Yield, NCF Debt Yield, NOI and NCF are 1.37x, 1.36x, 6.5%, 6.4%, $1,889,603 and $1,873,378, respectively. |
| (3) | The decrease in occupancy from 2013 to 2014 occupancy is primarily the result of the expiration of a ten-unit group lease that expired in 2014. All ten units were re-leased resulting in an occupancy rate of 100% as of April 23, 2015. |
| TRANSACTION HIGHLIGHTS |
● | Property. Luxe Villas is a 59-unit, Class A, luxury multifamily property built in 2006 and located in the Brentwood community of Los Angeles, California. The property is comprised of five residential floors of apartment units built over one ground level of garage parking and one subterranean level of garage parking. The unit mix consists of only two-bedroom apartments with an average unit size of 980 sq. ft. Unit amenities include a balcony, 9 ft. ceilings, granite countertops, Berber carpet, stainless steel appliances, in-unit washer/dryer and hardwood-style floors. Property amenities include a fitness center, resident rooftop lounge with a fireplace, controlled access entry, on-site management, bike storage, Italian style courtyard with cabana, subterranean controlled access parking, on-site maintenance and on-site storage. |
● | Location. Luxe Villas is located approximately three miles east of the Pacific Ocean in the Brentwood community of Los Angeles, California, which is considered one of the prime residential districts in West Los Angeles. Mayfield Avenue is located directly off of San Vicente Boulevard, a major east/west street that houses a high concentration of retail and mid-rise office, specifically the Brentwood Village. Luxe Villas’ location along San Vicente provides walking access to high-end dining, shopping and entertainment along both San Vicente and the Wilshire Boulevard retail corridor as well as nearby access to UCLA and the beach. |
● | Market. As of Q4 2014, LA/Westwood/Brentwood multifamily submarket reported a year end vacancy rate of 2.9%. Since 2006, the LA/Westwood/Brentwood submarket has averaged a vacancy rate of 3.6% and has never risen above a 5.8% vacancy rate. The appraiser concluded a weighted average market rent at the property of $3,533 per unit per month, which is in line with the weighted average in place rent of $3,515 at Luxe Villas. |
● | Sponsorship. Naum Neil Shekhter is the founder and chief executive officer of NMS Properties, Inc., a privately owned real estate development and management firm founded in 1988 that specializes in the acquisition, entitlement, development and management of multifamily and mixed-use properties in the greater Los Angeles area. NMS Properties, Inc. manages more than 50 properties with approximately 2,000 units and 320,000 sq. ft. of retail and commercial space. |
THE INFORMATION IN THIS STRUCTURAL AND COLLATERAL TERM SHEET IS NOT COMPLETE AND MAY BE AMENDED PRIOR TO THE TIME OF SALE. THIS TERM SHEET IS NOT AN OFFER TO SELL THESE SECURITIES AND IT IS NOT A SOLICITATION OF AN OFFER TO BUY THESE SECURITIES IN ANY JURISDICTION WHERE THE OFFER OR SALE IS NOT PERMITTED.
112
| Kentucky and Ohio | Collateral Asset Summary – Loan No. 12 SROA Portfolio | Cut-off Date Balance: Cut-off Date LTV: U/W NCF DSCR: U/W NOI Debt Yield: | $26,250,000 74.9% 1.70x 10.5% |
| Mortgage Loan Information | |
| Loan Seller: | GACC |
| Loan Purpose: | Acquisition |
| Sponsor: | Benjamin Macfarland; Todd Marshall |
| Borrowers: | Storage Rentals of America Elite, LLC |
| Original Balance: | $26,250,000 |
| Cut-off Date Balance: | $26,250,000 |
| % by Initial UPB: | 1.9% |
| Interest Rate: | 4.2200% |
| Payment Date: | 6th of each month |
| First Payment Date: | May 6, 2015 |
| Maturity Date: | April 6, 2025 |
| Amortization: | Interest only for first 36 months; 360 months thereafter |
| Additional Debt: | None |
Call Protection(1): | L(25), D(91), O(4) |
Lockbox / Cash Management(2): | Hard / Springing |
| Reserves | ||
| Initial | Monthly | |
| Taxes: | $68,120 | $15,761 |
| Insurance: | $9,575 | $9,575 |
| Replacement: | $0 | $9,830 |
| Required Repairs: | $36,831 | NAP |
| Financial Information | ||
| Cut-off Date Balance / Sq. Ft.: | $36 | |
| Balloon Balance / Sq. Ft.: | $31 | |
| Cut-off Date LTV: | 74.9% | |
| Balloon LTV: | 65.1% | |
Underwritten NOI DSCR(3): | 1.78x | |
Underwritten NCF DSCR(3): | 1.70x | |
| Underwritten NOI Debt Yield: | 10.5% | |
| Underwritten NCF Debt Yield: | 10.0% | |
| Property Information | |
| Single Asset / Portfolio: | Portfolio of 23 properties |
| Property Type: | Self Storage |
| Collateral: | Fee Simple |
| Location: | Kentucky and Ohio |
| Year Built / Renovated: | Various |
| Total Sq. Ft.: | 725,510 |
| Total Units: | 5,884 |
| Property Management: | Elite Stor Management, LLC |
| Underwritten NOI: | $2,750,515 |
| Underwritten NCF: | $2,632,550 |
| Appraised Value: | $35,060,000 |
| Appraisal Date: | January 2015 |
| Historical NOI | |
| 2014 NOI: | $2,751,638 (December 31, 2014) |
| 2013 NOI: | $2,794,262 (December 31, 2013) |
| 2012 NOI: | NAV |
| Historical Occupancy | |
| Most Recent Occupancy: | 92.2% (January 31, 2015) |
| 2014 Occupancy: | 92.0% (December 31, 2014) |
| 2013 Occupancy: | 89.7% (December 31, 2013) |
| 2012 Occupancy: | NAV |
| (1) | Any time after the expiration of the lockout period, the borrower may obtain the release of an individual property upon a bona fide third-party sale provided, among other things, (i) the LTV for the remaining properties does not exceed the lesser of the LTV immediately preceding such release and 75.0%, (ii) the DSCR for the remaining properties is not less than the greater of the DSCR immediately preceding the partial release and 1.55x, (iii) borrower partially defeases the greater of 125% of the allocated loan amount for the released property or 100% of the net sales proceeds from the released property. |
| (2) | Cash management will be triggered (i) upon an event of default or (ii) if the DSCR falls below 1.15x until such time that the DSCR is at least 1.20x for two consecutive calendar quarters. |
| (3) | Based on amortizing debt service payments. Based on the current interest only payments, the Underwritten NOI DSCR and Underwritten NCF DSCR are 2.45x and 2.34x, respectively. |
| TRANSACTION HIGHLIGHTS |
● | Properties. The SROA Portfolio consists of 23 self-storage properties located in the states of Kentucky (17 assets, 5,095 units and 621,585 sq. ft.) and Ohio (6 assets, 789 units, and 103,925 sq. ft.). The properties were constructed between 1980 and 2009 with an average age of 15 years. The portfolio is granular, with no individual property accounting for more than 11.2% of underwritten net cash flow. As of January 31, 2015, overall occupancy for the SROA Portfolio was 92.2%. |
● | Markets. According to the 2014 market research report (which reflects 2013 data), the United States self-storage market encompasses approximately 52,151 storage facilities, comprised of approximately 48,500 primary facilities and 4,000 secondary facilities. While public companies dominate the industry in terms of size of operations, small owners and operators still control the majority of the business, creating a sector that is both highly institutional and highly fragmented. According to the market research report, there are more than 27,000 firms that own and operate just one facility. The Kentucky properties are located in the South Atlantic region of the self-storage market, which experienced an increase in physical occupancy from 83.7% in Q4 2012 to 86.9% in Q2 2013. The Ohio properties are located in the Midwest region of the self-storage market, which experienced an increase in physical occupancy from 85.3% in Q4 2012 to 88.3% in Q2 2013. |
● | Sponsorship. The borrower is owned and controlled by the sponsors, Benjamin Macfarland and Todd Marshall. Benjamin Macfarland is the founder of Benjamin Macfarland Company, LLC, a commercial real estate brokerage firm based in Palm Beach, Florida, and President and CIO of Calidus Holdings, LLC, a real estate management and development company based in West Palm Beach, Florida. Todd Marshall has been involved in real estate investment, development and ownership for 27 years. Since 1986, Mr. Marshall has served as the President of Stow-A-Way Management Company, an entity that oversees the day-to-day operations of various storage investment properties. |
● | Borrower Equity. The borrower contributed $10.18 million of equity in connection with the purchase of the SROA Portfolio properties. |
THE INFORMATION IN THIS STRUCTURAL AND COLLATERAL TERM SHEET IS NOT COMPLETE AND MAY BE AMENDED PRIOR TO THE TIME OF SALE. THIS TERM SHEET IS NOT AN OFFER TO SELL THESE SECURITIES AND IT IS NOT A SOLICITATION OF AN OFFER TO BUY THESE SECURITIES IN ANY JURISDICTION WHERE THE OFFER OR SALE IS NOT PERMITTED.
113
4200 South Freeway Fort Worth, TX 76115 | Collateral Asset Summary – Loan No. 13 La Gran Plaza | Cut-off Date Balance: Cut-off Date LTV: U/W NCF DSCR: U/W NOI Debt Yield: | $26,000,000 65.2% 1.73x 11.2% |
| Mortgage Loan Information | |
| Loan Seller: | LCF |
| Loan Purpose: | Refinance |
| Sponsor: | Andrew J. Segal |
| Borrower: | Town Center Mall, L.P. |
Original Balance(1): | $26,000,000 |
Cut-off Date Balance(1): | $26,000,000 |
| % by Initial UPB: | 1.9% |
| Interest Rate: | 4.2400% |
| Payment Date: | 6th of each month |
| First Payment Date: | June 6, 2015 |
| Maturity Date: | May 6, 2025 |
| Amortization: | 360 months |
Additional Debt(1)(2): | $50,000,000 Pari Passu Debt; Future Mezzanine Debt Permitted |
Call Protection(3): | L(24), D(92), O(4) |
Lockbox / Cash Management(4): | Hard / Springing |
| Reserves | ||
| Initial | Monthly | |
| Taxes: | $546,391 | $91,065 |
| Insurance: | $77,827 | $8,647 |
Replacement(5): | $0 | $17,177 |
TI/LC(6): | $0 | $47,038 |
| Development Agreement: | $5,000,000 | NAP |
Mercado(7): | $1,318,168 | NAP |
| Free Rent: | $104,518 | NAP |
| Unfunded Obligations: | $1,436,051 | NAP |
| Financial Information | |
| Cut-off Date Balance / Sq. Ft.: | $74 |
| Balloon Balance / Sq. Ft.: | $59 |
| Cut-off Date LTV: | 65.2% |
| Balloon LTV: | 52.2% |
| Underwritten NOI DSCR: | 1.90x |
| Underwritten NCF DSCR: | 1.73x |
| Underwritten NOI Debt Yield: | 11.2% |
| Underwritten NCF Debt Yield: | 10.2% |
| Property Information | |
| Single Asset / Portfolio: | Single Asset |
| Property Type: | Retail/Office Mixed Use |
| Collateral: | Fee Simple |
| Location: | Fort Worth, TX |
| Year Built / Renovated: | 1961 / 2004 |
| Total Sq. Ft.: | 1,030,613 |
| Property Management: | Group Zocalo, LP. |
| Underwritten NOI: | $8,506,329 |
| Underwritten NCF: | $7,733,266 |
| Appraised Value: | $116,600,000 |
| Appraisal Date: | February 27, 2015 |
| Historical NOI | |
| Most Recent NOI: | $8,193,256 (T-12 January 31, 2015) |
| 2014 NOI: | $8,124,040 (December 31, 2014) |
| 2013 NOI: | $7,965,063 (December 31, 2013) |
| 2012 NOI: | $7,973,309 (December 31, 2012) |
| Historical Occupancy | |
| Most Recent Occupancy: | 85.8% (April 6, 2015) |
| 2014 Occupancy: | 88.8% (December 31, 2014) |
| 2013 Occupancy: | 88.4% (December 31, 2013) |
| 2012 Occupancy: | 90.2% (December 31, 2012) |
| (1) | The Original Balance and Cut-off Date Balance of $26.0 million represent the non-controlling Note A-3 of a $76 million loan combination, that is evidenced by such Note A-3, a controlling $26 million Note A-1 and a non-controlling $24 million Note A-2. The pari passu note A-1 and A-2 are currently held by LCF or its affiliate and are expected to be included in one or more future securitizations. |
| (2) | Mezzanine debt is permitted provided, among other things, (i) the combined LTV is less than or equal to 70.0% (ii) the combined DSCR is equal to or greater than 1.45x |
| (3) | The lockout period will be at least 24 payment dates beginning with and including the payment date of June 6, 2015. Defeasance of the La Gran Plaza loan combination is permitted on or after the date that is the earlier to occur of (i) two years after the closing date of the securitization that includes the last pari passu note to be securitized and (ii) April 13, 2018. |
| (4) | A hard lockbox is in place from day one with all rents being directed to the clearing account. Cash management and an excess cash flow sweep will be triggered upon (i) an event of default under the loan or the property management agreement, (ii) the DSCR for the property falling below 1.35x, or (iii) the occurrence of the borrower failing to replenish the Mercado Reserve 45 days after a distribution from such account. |
| (5) | Monthly Replacement reserve deposits will be capped at an aggregate amount of $420,000 provided, however, that on each capital expenditure additional work determination date (and continuing thereafter for the remainder of the term), the capital expenditure cap amount shall be increased by the capital expenditure additional deposit amount. |
| (6) | Monthly TI/LC deposits will be capped at the greater of (i) $1,150,000 or (ii) $10.00 multiplied by the sq. ft. of all specified leases with expiration dates occurring during the subsequent 12 calendar months. |
| (7) | Initial Mercado reserve deposit capped at $1,318,168. |
| TRANSACTION HIGHLIGHTS |
● | Property. La Gran Plaza property is a 1,030,613 sq. ft. mixed use property located in Fort Worth, Texas. The property includes 898,606 sq. ft. of retail space, 132,007 sq. ft. of office building space and a total of 4,068 available parking spaces. La Gran Plaza property benefits from 5.5 million visitors annually. Additionally, La Gran Plaza includes property one of the seven bus transfer stations for Fort Worth, known as the “T Transfer Center.” The property is located directly off I-35, 1 mile from the I-20 interchange, providing access to the Dallas Metroplex. 169,000 vehicles pass by the property on a daily basis. Anchor tenants at the La Gran Plaza property include Burlington Coat Factory (7.8% NRA, April 30, 2018 expiration, rated B3/B+ by Moody’s/S&P) and Fiesta Mart (5.7% NRA, July 31, 2028 expiration), a grocer that generated $595 PSF in sales, representing a 1.3% occupancy cost in 2014. |
● | Market. La Gran Plaza property is located in the Southwest Tarrant/North Johnson submarket within the southern part of the Fort Worth retail and office market, which exhibited a submarket vacancy of 13.7% and average asking rents of $13.29 PSF as of Q4 2014. The 2014 population within a five mile radius is 267,137. The 2014 median household income within a five mile radius was $37,488 and the average home value within a five mile radius was $113,471. |
● | Sponsorship. The sponsor of the borrower is Andrew J. Segal, founder and CEO of Boxer Property. Boxer Property was founded in 1992 to acquire, manage, lease, administer and sell closely held commercial properties. Boxer Property currently manages 14.4 million sq. ft. in Texas. |
THE INFORMATION IN THIS STRUCTURAL AND COLLATERAL TERM SHEET IS NOT COMPLETE AND MAY BE AMENDED PRIOR TO THE TIME OF SALE. THIS TERM SHEET IS NOT AN OFFER TO SELL THESE SECURITIES AND IT IS NOT A SOLICITATION OF AN OFFER TO BUY THESE SECURITIES IN ANY JURISDICTION WHERE THE OFFER OR SALE IS NOT PERMITTED.
114
27475 Huron Circle Novi, MI 48377 | Collateral Asset Summary – Loan No. 14 Waltonwood Twelve Oaks | Cut-off Date Balance: Cut-off Date LTV: U/W NCF DSCR: U/W NOI Debt Yield: | $25,000,000 64.6% 1.79x 10.4% |
| Mortgage Loan Information | |
| Loan Seller: | GACC |
| Loan Purpose: | Refinance |
| Sponsors: | Gurmale S. Grewal; Jeat S. Grewal; Lushman S. Grewal |
| Borrower: | Waltonwood at Twelve Oaks I, L.L.C. |
| Original Balance: | $25,000,000 |
| Cut-off Date Balance: | $25,000,000 |
| % by Initial UPB: | 1.8% |
| Interest Rate: | 3.9400% |
| Payment Date: | 6th of each month |
| First Payment Date: | June 6, 2015 |
| Maturity Date: | May 6, 2025 |
| Amortization: | 360 months |
| Additional Debt: | None |
| Call Protection: | L(24), D(92), O(4) |
Lockbox / Cash Management(1): | Springing Soft / Springing |
| Reserves | ||
| Initial | Monthly | |
| Taxes: | $227,844 | $23,222 |
Insurance(2): | $0 | Springing |
| Replacement: | $0 | $3,475 |
Declaration Reserve(3): | $175,867 | $1,000 |
| Financial Information | |
| Cut-off Date Balance / Unit: | $179,856 |
| Balloon Balance / Unit: | $142,585 |
| Cut-off Date LTV: | 64.6% |
| Balloon LTV: | 51.2% |
| Underwritten NOI DSCR: | 1.82x |
| Underwritten NCF DSCR: | 1.79x |
| Underwritten NOI Debt Yield: | 10.4% |
| Underwritten NCF Debt Yield: | 10.2% |
| Property Information | |
| Single Asset / Portfolio: | Single Asset |
| Property Type: | Independent Living |
| Collateral: | Fee Simple |
| Location: | Novi, MI |
| Year Built / Renovated: | 1999 / 2012-2013 |
| Total Units: | 139 |
| Property Management: | Singh Senior Living, LLC |
| Underwritten NOI: | $2,588,494 |
| Underwritten NCF: | $2,546,794 |
| Appraised Value: | $38,700,000 |
| Appraisal Date: | February 15, 2015 |
| Historical NOI | |
| 2014 NOI: | $2,691,302 (December 31, 2014) |
| 2013 NOI: | $2,563,933 (December 31, 2013) |
| 2012 NOI: | $2,438,972 (December 31, 2012) |
| Historical Occupancy | |
| Most Recent Occupancy: | 85.6% (March 5, 2015) |
| 2014 Occupancy: | 92.1% (December 31, 2014) |
| 2013 Occupancy: | 89.7% (December 31, 2013) |
| 2012 Occupancy: | 80.4% (December 31, 2012) |
| (1) | Cash management and a soft lockbox will be triggered (i) upon an event of default or (ii) if the DSCR falls below 1.20x until such time that the DSCR is at least 1.25x for two consecutive calendar quarters. |
| (2) | If an acceptable blanket insurance policy is no longer in place, borrower is required to deposit 1/12 of the annual insurance premiums into the insurance account. |
| (3) | Declaration Reserve relates to the borrower’s share of maintenance costs for certain private roads adjacent to the Waltonwood Twelve Oaks property for which the borrower has not yet been invoiced by the adjacent property owner. The upfront reserves equal 125.0% of the amount that has accrued. |
| TRANSACTION HIGHLIGHTS |
● | Property. The Waltonwood Twelve Oaks property is a 139-unit, three-story Class A independent living community located in Novi, Michigan. Built in 1999 and renovated in 2012-2013, the property is made up of 80 one-bedroom and 59 two-bedroom floor plans. The building is designed in an “8” shape with independent living occupying the southern half of the building. The first floor contains the lobby, main dining room, mechanical rooms, offices and various common areas, as well as some apartment units. The second and third floors contain resident rooms as well as various common area lounges. In 2012 and 2013, the sponsor invested approximately $915,000 towards the renovation of the common area carpeting, painting, replacement of wall coverings and furnishings, new furniture, security system upgrades and replacement of all bathroom tiles. |
● | Amenities. All units are fully equipped with kitchens with range cook tops, microwaves, sinks and full-size refrigerators. All bathrooms are designed for barrier free access and include shower with full ceramic tile and vanities. Additionally, resident amenities include 24-hour emergency call systems, bi-weekly housekeeping services, exercise programs, on-site health screening, social activities, enrichment seminars, a hair salon, library, outdoor gazebo and a parlor with fireplaces. |
● | Location. The property is located in Novi, Michigan, approximately 25 miles from the Detroit central business district (“CBD”). The property has access to the submarket via Twelve Mile Road, which provides access to I-96 and State Route 5, two major thoroughfares that run to the Detroit CBD. The property is located in a suburban area characterized by mixed use residential and commercial development. Land in the immediate neighborhood is approximately 90% developed. The Twelve Oaks Mall, a 1.5 million sq. ft. super regional mall with over 180 stores anchored by Macy’s, Lord & Taylor, Nordstrom, JCPenney and Sears, is located adjacent to the property. |
● | Market. The property’s primary market area (“PMA”) encompasses an area with approximately a 5-mile radius of the Waltonwood Twelve Oaks property, which is part of the greater Detroit market. 60.0% of residents at the Waltonwood Twelve Oaks property originate from the PMA. According to the appraisal, six directly competitive properties were identified within the PMA which range in occupancy from 85.0% to 100.0%, with an average occupancy of 96.0%. Current rental rates for independent living units in the competitive market area begin at approximately $1,640 per month for a studio unit and increase to approximately $3,750 per month for a one-bedroom unit and $4,500 per month for a two-bedroom unit. The in-place rents for the Waltonwood Twelve Oaks Property range from $2,895 to $3,095 for a one-bedroom and $3,795 to $4,695 for a two-bedroom. |
● | Demographics. The property is subject to a use restriction in place through December 2027 that requires the property may only be operated as a senior citizen’s residential housing complex (and incidental uses). According to an industry report dated November 4, 2014, the senior population (ages 65 and over) is 24,579 people, which represents 15.0% of the total population within the property’s PMA. The total population is expected to increase 4.2% by 2019, while the senior population is expected to grow 21.3% to 29,806 people over the same period of time. Comparatively, the national average of residents age 65 and over constituted 13.1% of the total population in 2011. |
THE INFORMATION IN THIS STRUCTURAL AND COLLATERAL TERM SHEET IS NOT COMPLETE AND MAY BE AMENDED PRIOR TO THE TIME OF SALE. THIS TERM SHEET IS NOT AN OFFER TO SELL THESE SECURITIES AND IT IS NOT A SOLICITATION OF AN OFFER TO BUY THESE SECURITIES IN ANY JURISDICTION WHERE THE OFFER OR SALE IS NOT PERMITTED.
115
123 Justison Street Wilmington, DE 19801 | Collateral Asset Summary – Loan No. 15 Star Building | Cut-off Date Balance: Cut-off Date LTV: U/W NCF DSCR: U/W NOI Debt Yield: | $25,000,000 65.4% 1.89x 12.0% |
| Mortgage Loan Information | |
| Loan Seller: | GECC |
| Loan Purpose: | Refinance |
| Sponsor: | Gregory Pettinaro |
| Borrower: | Star Building, LLC |
| Original Balance: | $25,000,000 |
| Cut-off Date Balance: | $25,000,000 |
| % by Initial UPB: | 1.8% |
| Interest Rate: | 4.2100% |
| Payment Date: | 1st of each month |
| First Payment Date: | February 1, 2015 |
| Maturity Date: | January 1, 2025 |
| Amortization: | Interest only for first 12 months; 360 months thereafter |
| Additional Debt: | None |
| Call Protection: | L(28), D(88), O(4) |
Lockbox / Cash Management(1): | Soft Springing Hard / Springing |
| Reserves | ||
| Initial | Monthly | |
| Taxes: | $153,377 | $21,556 |
| Insurance: | $8,202 | $4,101 |
| Replacement: | $0 | $1,867 |
TI/LC(2): | $0 | $16,843 |
| Unicare TI/LC Reserve: | $716,674 | $0 |
| Unicare Rent Allowance: | $147,312 | $0 |
| Navient Rent Allowance: | $970,636 | $0 |
| Navient TI Allowance: | $2,969,005 | $0 |
Navient Lease Renewal Fund(3): | $0 | Springing |
| Financial Information | |
| Cut-off Date Balance / Sq. Ft.: | $167 |
| Balloon Balance / Sq. Ft.: | $138 |
| Cut-off Date LTV: | 65.4% |
| Balloon LTV: | 54.0% |
Underwritten NOI DSCR(4): | 2.04x |
Underwritten NCF DSCR(4): | 1.89x |
| Underwritten NOI Debt Yield: | 12.0% |
| Underwritten NCF Debt Yield: | 11.1% |
| Property Information | |
| Single Asset / Portfolio: | Single Asset |
| Property Type: | Suburban Office |
| Collateral: | Fee Simple |
| Location: | Wilmington, DE |
| Year Built / Renovated: | 2010 / NAP |
| Total Sq. Ft.: | 149,323 |
| Property Management: | Pettinaro Management, LLC |
| Underwritten NOI: | $2,991,790 |
| Underwritten NCF: | $2,776,089 |
| Appraised Value: | $38,200,000 |
| Appraisal Date: | September 30, 2014 |
| Historical NOI | |
| 2014 NOI: | $1,119,494 (December 31, 2014) |
| 2013 NOI: | $902,827 (December 31, 2013) |
2012 NOI(5): | $-9,722 (December 31, 2012) |
| Historical Occupancy | |
| Most Recent Occupancy: | 95.1% (March 31, 2015) |
| 2014 Occupancy: | 41.7% (December 31, 2014) |
| 2013 Occupancy: | 35.5% (December 31, 2013) |
| 2012 Occupancy: | 14.0% (December 31, 2012) |
| (1) | A hard lockbox with cash management will be triggered upon an event of default or if Navient Solutions, Inc. doesn’t renew lease by December 1, 2020. |
| (2) | TI/LC reserve account is subject to a $500,000 cap. |
| (3) | If Navient Solutions, Inc. has not exercised its lease renewal option by November 30, 2021, then beginning December 1, 2021 sweep net cash flow on a monthly basis; sweep fund to be released upon (a) minimum rate of $22/sq. ft. with lease term extending at least beyond September 30, 2026 without any termination options (b) property leased to a 92% occupancy and achieves a 9.0% debt yield for any month ending on or after January 31, 2022. |
| (4) | Based on amortizing debt service payments. Based on current interest only payments, the Underwritten NOI DSCR and Underwritten NCF DSCR are 2.80x and 2.60x, respectively. |
| (5) | In 2012, the property had a negative NOI because it was a newly constructed building and was only 14.0% leased. |
| TRANSACTION HIGHLIGHTS |
● | Property. The Star Building is a 7-story, Class A office building located in Wilmington, Delaware. The property was developed all cash, on a site that has been in continuous family ownership since 1991. Construction was completed in 2010 and the building was selectively leased by ownership to insure a high quality and stable rent roll. |
● | Tenancy. The Star Building is currently 95.1% leased to 5 tenants with an eight year average lease term. Tenants include, Sallie Mae (Navient) (Fitch/Moody’s/S&P: BB/Ba3/BB), Grant & Eisenhofer, P.A., DuPont E.I., DeNemours & Co. (Fitch/Moody’s/S&P: A/A2/A), Unicare Life & Health Insurance (a subdivision of Wellpoint (Fitch/Moody’s/S&P: BBB/Baa2/A-)) and Bernardon, Haber, Holloway. |
● | Sponsor / Ownership. The project is owned by the developers’ family trusts. The sponsor is local, experienced and very strong. Based in Delaware, Gregory Pettinaro has been building, developing and operating commercial real estate since the 1960’s. |
THE INFORMATION IN THIS STRUCTURAL AND COLLATERAL TERM SHEET IS NOT COMPLETE AND MAY BE AMENDED PRIOR TO THE TIME OF SALE. THIS TERM SHEET IS NOT AN OFFER TO SELL THESE SECURITIES AND IT IS NOT A SOLICITATION OF AN OFFER TO BUY THESE SECURITIES IN ANY JURISDICTION WHERE THE OFFER OR SALE IS NOT PERMITTED.
116
| Florida & Ohio | Collateral Asset Summary – Loan No. 16 ART Florida & Ohio MF Portfolio II | Cut-off Date Balance: Cut-off Date LTV: U/W NCF DSCR: U/W NOI Debt Yield: | $25,000,000 74.4% 1.46x 9.5% |
| Mortgage Loan Information | |
| Loan Seller: | CCRE |
| Loan Purpose: | Refinance |
| Sponsor: | Arbor Realty SR, Inc. |
| Borrowers: | Woodlands Apartments of Columbus, LLC; Woodlands Apartments of Columbus, II, LLC; Woodlands Apartments of Columbus, III, LLC; Miguel Place Apartments, LLC; Timbercreek Apartments of Toledo, LLC; Oakwood Village Apartments, LLC; Oakwood Village Apartments II LLC; Annhurst Apartments of Columbus, LLC; Annhurst Apartments of Columbus, II, LLC; Annhurst Apartments of Columbus, III, LLC |
| Original Balance: | $25,000,000 |
| Cut-off Date Balance: | $25,000,000 |
| % by Initial UPB: | 1.8% |
| Interest Rate: | 4.2235% |
| Payment Date: | 6th of each month |
| First Payment Date: | May 6, 2015 |
| Maturity Date: | April 6, 2025 |
| Amortization: | Interest only for first 24 months; 360 months thereafter |
| Additional Debt: | None |
Call Protection(1): | L(25), D(91), O(4) |
Lockbox / Cash Management(2): | Soft / Springing |
| Reserves | ||
| Initial | Monthly | |
| Taxes: | $97,030 | $18,497 |
| Insurance: | $37,937 | $7,587 |
| Replacement: | $0 | $18,416 |
Immediate Repairs(3): | $100,000 | NAP |
| Financial Information | |
| Cut-off Date Balance / Unit: | $38,052 |
| Balloon Balance / Unit: | $32,256 |
| Cut-off Date LTV: | 74.4% |
| Balloon LTV: | 63.1% |
Underwritten NOI DSCR(4): | 1.61x |
Underwritten NCF DSCR(4): | 1.46x |
| Underwritten NOI Debt Yield: | 9.5% |
| Underwritten NCF Debt Yield: | 8.6% |
| Property Information | |
| Single Asset / Portfolio: | Portfolio of 5 properties |
| Property Type: | Garden Multifamily |
| Collateral: | Fee Simple |
| Location: | Florida & Ohio |
| Year Built / Renovated: | 1984-1988 / 2012-2014 |
| Total Units: | 657 |
| Property Management: | Elon Property Management Company, L.L.C. |
| Underwritten NOI: | $2,370,208 |
| Underwritten NCF: | $2,149,219 |
| Appraised Value: | $33,600,000 |
| Appraisal Date: | February 2015 |
| Historical NOI | |
| 2014 NOI: | $2,277,060 (December 31, 2014) |
| 2013 NOI: | $2,151,603 (December 31, 2013) |
| 2012 NOI: | NAV |
| Historical Occupancy | |
| Most Recent Occupancy: | 92.5% (February 24, 2015) |
| 2014 Occupancy: | 92.3% (December 31, 2014) |
| 2013 Occupancy: | 87.8% (December 31, 2013) |
| 2012 Occupancy: | NAV |
| (1) | On any date after the expiration of the lockout period and prior to the open prepayment date, the borrowers may obtain the release of an individual property provided, among other things, the borrower partially defeases to lender an amount equal to the greater of (i) 115% of the Allocated Loan Amount (as defined below) and (ii) an amount such that after the release (1) the LTV of the remaining properties is less than or equal to 74.4% and (2) the NOI DSCR of the remaining properties is greater than or equal to 1.48x. |
| (2) | In place cash management and an excess cash flow sweep will be triggered upon (i) any event of default or (ii) failure of the borrower to maintain a NOI DSCR of at least 1.10x at the end of one calendar quarter until such time that the NOI DSCR is at least 1.15x for two consecutive calendar quarters. |
| (3) | The borrower reserved 125.0% of the engineer’s estimated required repairs, which includes is primarily comprised of miscellaneous repairs. |
| (4) | Based on amortizing debt service payments. Based on the current interest-only payments, Underwritten NOI DSCR and Underwritten NCF DSCR are 2.21x and 2.01x. |
| TRANSACTION HIGHLIGHTS |
● | Properties. The ART Florida & Ohio MF Portfolio II is comprised of five single-story garden style apartment communities, containing 657 units. The properties are located in Columbus, Gahanna and Toledo, Ohio and Port Richey and Hudson, Florida. The ART Florida & Ohio MF Portfolio II properties have increased in occupancy since acquisition by Arbor Realty SR, Inc. from 87.8% in 2013 to 92.5% as of February 24, 2015. |
● | Market. As of Q4 2014, the respective multifamily submarkets reported vacancy rates ranging from 4.0% to 8.9%. |
● | Sponsorship. Arbor Realty SR, Inc., a subsidiary of Arbor Realty Trust, Inc. (“Arbor”) (NYSE:ABR), acquired the portfolio in 2011. Arbor is a REIT that invests in a diversified portfolio of multifamily and commercial real estate-related bridge and mezzanine loans and preferred equity. |
THE INFORMATION IN THIS STRUCTURAL AND COLLATERAL TERM SHEET IS NOT COMPLETE AND MAY BE AMENDED PRIOR TO THE TIME OF SALE. THIS TERM SHEET IS NOT AN OFFER TO SELL THESE SECURITIES AND IT IS NOT A SOLICITATION OF AN OFFER TO BUY THESE SECURITIES IN ANY JURISDICTION WHERE THE OFFER OR SALE IS NOT PERMITTED.
117
| Washington, DC 20002 | Collateral Asset Summary – Loan No. 17 Wexford Portfolio | Cut-off Date Balance: Cut-off Date LTV: U/W NCF DSCR: U/W NOI Debt Yield: | $21,500,000 68.3% 1.25x 7.8% |
| Mortgage Loan Information | |
| Loan Seller: | CCRE |
| Loan Purpose: | Refinance |
| Sponsor: | Eric S. Kretschman |
| Borrowers: | 1825 Maryland Associates, LLC; Capital East Partners, LLC; Capitol East Partners II, LLC |
| Original Balance: | $21,500,000 |
Cut-off Date Balance: | $21,500,000 |
| % by Initial UPB: | 1.6% |
| Interest Rate: | 4.4165% |
| Payment Date: | 6th of each month |
| First Payment Date: | May 6, 2015 |
| Maturity Date: | April 6, 2025 |
| Amortization: | Interest only for first 60 months; 360 months thereafter |
Additional Debt(1): | Future Mezzanine Debt |
Call Protection(2): | L(25), D(92), O(3) |
Lockbox / Cash Management(3): | Springing Soft / Springing |
| Reserves | ||
| Initial | Monthly | |
| Taxes: | $31,167 | $15,583 |
| Insurance: | $67,456 | $6,132 |
| Replacement: | $0 | $4,021 |
| Required Repairs: | $12,420 | NAP |
Zoning(4): | $285,000 | $0 |
| Financial Information | |
| Cut-off Date Balance / Unit: | $111,399 |
| Balloon Balance / Unit: | $101,802 |
| Cut-off Date LTV: | 68.3% |
| Balloon LTV: | 62.4% |
Underwritten NOI DSCR(5): | 1.29x |
Underwritten NCF DSCR(5): | 1.25x |
| Underwritten NOI Debt Yield: | 7.8% |
| Underwritten NCF Debt Yield: | 7.5% |
| Property Information | |
| Single Asset / Portfolio: | Portfolio of 3 properties |
| Property Type: | Garden Multifamily |
| Collateral: | Fee Simple |
| Location: | Washington, DC |
| Year Built / Renovated: | 1927 & 1961 / 2014 |
| Total Units: | 193 |
| Property Management: | Wexford Property Management, LLC |
| Underwritten NOI: | $1,667,618 |
| Underwritten NCF: | $1,619,368 |
| Appraised Value: | $31,500,000 |
| Appraisal Date: | March 2, 2015 |
| Historical NOI | |
| Most Recent NOI: | $1,549,848 (T-12 February 28, 2015) |
| 2014 NOI: | $1,480,191 (December 31, 2014) |
| 2013 NOI: | $1,459,127 (December 31, 2013) |
| 2012 NOI: | $1,329,188 (December 31, 2012) |
| Historical Occupancy | |
| Most Recent Occupancy: | 96.3% (March 3, 2015) |
| 2014 Occupancy: | 93.9% (December 31, 2014) |
| 2013 Occupancy: | 88.5% (December 31, 2013) |
| 2012 Occupancy: | 95.0% (December 31, 2012) |
| (1) | Future mezzanine debt is permitted after the expiration of the lockout period provided, among other things, (i) the combined LTV is equal to or less than 75.0% and (ii) the combined DSCR is equal to or greater than 1.20x. |
| (2) | After the expiration of the lockout period, the borrowers may obtain the release of an individual property upon an arm’s-length bona fide cash sale provided, among other things, the borrower partially defeases to lender the greater of (i) 120.0% of the allocated loan amount, (ii) 100.0% of net sale proceeds, (iii) an amount that, after giving effect to such release results in a debt service coverage ratio of the remaining properties not less than the greater of 1.20x and the debt service coverage ratio prior to release. |
| (3) | Cash management and a soft lockbox will be triggered upon (i) the commencement of any Cash Trap Period (as defined below), (ii) a mezzanine borrower obtaining a mezzanine loan or (iii) failure of the borrower to maintain a DSCR of at least 1.15x at the end of one calendar quarter. A “Cash Trap Period” will commence upon (i) any event of default, (ii) any bankruptcy action of borrower, principal, guarantor or manager or (iii) failure of the borrower to maintain a DSCR of at least 1.10x at the end of one calendar quarter. |
| (4) | The borrower reserved $250,000 for future sprinkler/alarm work and $35,000 for zoning protection insurance (each related to a legal non-conforming use at the Lexington Apartments property). On or before April 1, 2016, the borrower is required to obtain a zoning variance with respect to such property permitting the rebuilding as a multifamily use in the event of a casualty or destruction. If the borrower is unable to obtain the variance on or before April 1, 2016, the borrower will be required, on or before July 1, 2016 to (i) install sprinklers at the property and (ii) obtain zoning protection insurance for such property. |
| (5) | Based on amortizing debt service payments. Based on the current interest-only payments, Underwritten NOI DSCR and Underwritten NCF DSCR are 1.73x and 1.68x. |
| TRANSACTION HIGHLIGHTS |
● | Properties. The Wexford Portfolio is comprised of three garden apartment buildings containing 193 units. The Capitol East Apartments property was constructed in 1927, renovated from 2014-2015 and consists of 120 units that were 95.8% occupied as of March 3, 2015. The Lexington Apartments property was constructed in 1927, renovated in 2014-2015 and consists of 48 units that were 95.8% occupied as of March 3, 2015. The 1825 Maryland property was constructed in 1961, renovated in 2014-2015 and consists of 25 units that were100.0% occupied as of March 3, 2015. |
● | Market. As of Q4 2014, the Washington, DC multifamily market exhibited an occupancy rate of 95.8% and the Anacostia/northeast submarket exhibited an occupancy rate of 94.3%, in line with the Wexford Portfolio occupancy of 96.3% as of March 3, 2015. |
● | Sponsorship. The sponsor, Eric S. Kretschman, is the chairman and president of Wexford Property Management, LLC, a boutique management company that specializes in the management of apartment, condominium, homeowner association and cooperative buildings containing between 20 and 200 units. |
THE INFORMATION IN THIS STRUCTURAL AND COLLATERAL TERM SHEET IS NOT COMPLETE AND MAY BE AMENDED PRIOR TO THE TIME OF SALE. THIS TERM SHEET IS NOT AN OFFER TO SELL THESE SECURITIES AND IT IS NOT A SOLICITATION OF AN OFFER TO BUY THESE SECURITIES IN ANY JURISDICTION WHERE THE OFFER OR SALE IS NOT PERMITTED.
118
1969 Portage Trail Cuyahoga Falls, OH 44223 | Collateral Asset Summary – Loan No. 18 Portage Crossing Shopping Center | Cut-off Date Balance: Cut-off Date LTV: U/W NCF DSCR: U/W NOI Debt Yield: | $21,000,000 74.6% 1.28x 7.9% |
| Mortgage Loan Information | |
| Loan Seller: | LCF |
| Loan Purpose: | Refinance |
| Sponsor: | Robert L. Stark |
| Borrower: | Portage Crossing Property, LLC |
| Original Balance: | $21,000,000 |
| Cut-off Date Balance: | $21,000,000 |
| % by Initial UPB: | 1.5% |
| Interest Rate: | 4.2000% |
| Payment Date: | 6th of each month |
| First Payment Date: | June 6, 2015 |
| Maturity Date: | May 6, 2025 |
| Amortization: | 360 Months |
| Additional Debt: | None |
| Call Protection: | L(24), DorYM1(92), O(4) |
Lockbox / Cash Management(1): | Hard / Springing |
| Reserves | ||
| Initial | Monthly | |
| Taxes: | $30,080 | $30,685 |
| Insurance: | $4,167 | $2,083 |
| Replacement: | $0 | $1,505 |
| TI/LC: | $921,837 | $3,750 |
| Free Rent: | $318,584 | NAP |
Performance Reserve(2): | $2,000,000 | NAP |
| Financial Information | |
| Cut-off Date Balance / Sq. Ft.: | $174 |
| Balloon Balance / Sq. Ft.: | $139 |
| Cut-off Date LTV: | 74.6% |
| Balloon LTV: | 59.7% |
| Underwritten NOI DSCR: | 1.35x |
| Underwritten NCF DSCR: | 1.28x |
| Underwritten NOI Debt Yield: | 7.9% |
| Underwritten NCF Debt Yield: | 7.5% |
| Property Information | |
| Single Asset / Portfolio: | Single Asset |
| Property Type: | Anchored Retail |
| Collateral: | Fee Simple |
| Location: | Cuyahoga Falls, OH |
| Year Built / Renovated: | 2014 / NAP |
| Total Sq. Ft.: | 120,541 |
| Property Management: | Robert L. Stark Enterprises, Inc. |
| Underwritten NOI: | $1,663,209 |
| Underwritten NCF: | $1,573,985 |
| Appraised Value: | $28,140,000 |
| Appraisal Date: | January 28, 2015 |
Historical NOI(3) | |
| Most Recent NOI: | NAP |
| 2014 NOI: | NAP |
Historical Occupancy(3) | |
| Most Recent Occupancy: | 91.2% (April 8, 2015) |
| 2014 Occupancy: | NAP |
| (1) | Cash management and an excess cash flow sweep will be triggered if (i) an event of default occurs under the loan or the property management agreement, (ii) the DSCR for the property falls below 1.15x for two consecutive quarters, (iii) any tenant occupying more than 25.0% of the property ceases to conduct its normal business operations at substantially all of its leased premises, and/or any tenant occupying more than 25.0% of the property becomes insolvent or files for bankruptcy or exercises a termination option under its lease. |
| (2) | At closing, lender escrowed $2,000,000 which is available to borrower for tenant improvement and leasing costs associated with new leases at currently vacant space at the property until two years after the closing date. In order to obtain disbursements from such reserves, among other items, (x) (i) the borrower must have executed a lease(s) for at least 3 years, at market rent and otherwise acceptable in all respects to the lender for all or a portion of the unleased space at the property (ii) the tenant(s) shall have accepted such space, commenced conducting normal business operations in substantially all of such space, and paying full, unabated rent and shall have delivered an estoppel certificate(s) acceptable to the lender and (y) debt yield including the new lease(s) is equal to or greater than 8.0%. Notwithstanding the foregoing, if one or more new leases have been executed prior to the date that is two years after the closing date, but the conditions for disbursement have not been satisfied solely because either (x) one or more of such tenant(s) is not yet in occupancy, open for business or conducting normal business operations, or (y) there exist outstanding landlord obligations thereunder, the lender shall make such applicable disbursement at such time the applicable conditions are satisfied but no later than later than six (6) months after the initial two year period (such period, as extended, the “New Leasing Disbursement Deadline”). Any remaining funds held in the Performance Reserve as of the New Leasing Disbursement Deadline shall be applied as follows: (a) the lesser of $500,000 or the remaining balance of the Performance Reserve, if any, shall be applied to the TI/LC Reserve and (b) and the balance, if any, applied to the outstanding loan balance with yield maintenance or held as additional collateral, at the lender’s discretion. |
| (3) | The property was completed in 2014. As such, Historical NOI and Historical Occupancy are not available. |
| TRANSACTION HIGHLIGHTS |
● | Property. Portage Crossing Shopping Center property is a 120,541 sq. ft. anchored retail property located in Cuyahoga Falls, Ohio. The property is shadow anchored by a Giant Eagle Market District. Top tenants include an L.A. Fitness (37.3% NRA, 11/30/2030 expiration, rated B2/B by Moody’s/S&P), Cinemark (28.9% NRA, 12/31/2029 expiration, rated BB- by S&P), and Pet Supply Plus (8.3% NRA, 2/28/2029 expiration). The property is newly constructed. |
● | Market. Portage Crossing Shopping Center property is located in the Akron submarket within the Cleveland retail market, which exhibited a submarket vacancy of 7.0% with average asking rents of $10.06 PSF as of Q4 2014. The 2014 population within a five mile radius of the property is 156,913. The 2014 median household income within a five mile radius was $44,768 and the average home value within a five mile radius was $164,461. |
● | Sponsorship. The sponsor of the borrower is Robert L. Stark, CEO of Robert L. Stark Enterprises (“Stark Enterprises”). Stark Enterprises, founded in 1978, has experience acquiring and developing real estate in Northeast Ohio. Stark Enterprises specializes on developing, constructing and managing shopping centers, hotels, multi-family housing properties and mixed-use lifestyle venues. Stark Enterprises currently has a portfolio in excess of 7 million square feet of retail, office, apartment and hotel properties. The retail portion of the portfolio is concentrated in northeastern Ohio, with 12 shopping centers totaling more than 2.9 million sq. ft. |
THE INFORMATION IN THIS STRUCTURAL AND COLLATERAL TERM SHEET IS NOT COMPLETE AND MAY BE AMENDED PRIOR TO THE TIME OF SALE. THIS TERM SHEET IS NOT AN OFFER TO SELL THESE SECURITIES AND IT IS NOT A SOLICITATION OF AN OFFER TO BUY THESE SECURITIES IN ANY JURISDICTION WHERE THE OFFER OR SALE IS NOT PERMITTED.
119
39-05 29th Street Long Island City, NY 11101 | Collateral Asset Summary – Loan No. 19 Holiday Inn Manhattan View | Cut-off Date Balance: Cut-off Date LTV: U/W NCF DSCR: U/W NOI Debt Yield: | $20,863,257 70.7% 1.43x 11.8% |
| Mortgage Loan Information | |
| Loan Seller: | CCRE |
| Loan Purpose: | Refinance |
| Sponsor: | Delwar Hussain; Hafeez Choudhary; Mark Farruqui |
| Borrower: | Queens Plaza North, LLC |
| Original Balance: | $21,000,000 |
| Cut-off Date Balance: | $20,863,257 |
| % by Initial UPB: | 1.5% |
| Interest Rate: | 5.2510% |
| Payment Date: | 6th of each month |
| First Payment Date: | February 6, 2015 |
| Maturity Date: | January 6, 2020 |
| Amortization: | 300 months |
| Additional Debt: | None |
| Call Protection: | L(28), D(28), O(4) |
Lockbox / Cash Management(1): | Hard / In-Place |
| Reserves | ||
| Initial | Monthly | |
| Taxes: | $3,334 | $3,334 |
| Insurance: | $65,460 | $6,546 |
| Replacement: | $0 | 1/12th of 4.0% of Gross income from operations |
| Required Repairs: | $12,500 | NAP |
| Ground Rent Reserve: | $280,000 | $0 |
DSCR Reserve(2): | $0 | Springing |
| Financial Information | |
| Cut-off Date Balance / Room: | $153,406 |
| Balloon Balance / Room: | $137,951 |
| Cut-off Date LTV: | 70.7% |
| Balloon LTV: | 63.6% |
| Underwritten NOI DSCR: | 1.63x |
| Underwritten NCF DSCR: | 1.43x |
| Underwritten NOI Debt Yield: | 11.8% |
| Underwritten NCF Debt Yield: | 10.4% |
| Property Information | |
| Single Asset / Portfolio: | Single Asset |
| Property Type: | Full Service Hospitality |
Collateral(3): | Leasehold |
| Location: | Long Island City, NY |
| Year Built / Renovated: | 2008 / NAP |
| Total Rooms: | 136 |
| Property Management: | M&R Hospitality Management Corp. |
| Underwritten NOI: | $2,464,101 |
| Underwritten NCF: | $2,163,359 |
| Appraised Value: | $29,500,000 |
| Appraisal Date: | December 1, 2014 |
| Historical NOI | |
| Most Recent NOI: | $3,659,224 (T-12 January 31, 2015) |
| 2013 NOI: | $3,750,739 (December 31, 2013) |
| 2012 NOI: | $3,587,874 (December 31, 2012) |
| 2011 NOI: | $2,213,554 (December 31, 2011) |
| Historical Occupancy | |
| Most Recent Occupancy: | 86.3% (January 31, 2015) |
| 2013 Occupancy: | 86.6% (December 31, 2013) |
| 2012 Occupancy: | 85.2% (December 31, 2012) |
| 2011 Occupancy: | 80.7% (December 31, 2011) |
| (1) | An excess cash flow sweep will be triggered during a “Cash Trap Period”. A “Cash Trap Period” will commence upon (i) an event of default, (ii) any borrower, principal, guarantor or property manager bankruptcy, (iii) the commencement of a Franchise Agreement Discontinuation Period or (iv) the failure by the borrower to maintain a NOI DSCR of at least 1.20x for two consecutive calendar quarters, until the NOI DSCR is at least 1.40x for four consecutive calendar quarters. A “Franchise Agreement Discontinuation Period” will occur (i) (a) one year prior to the loan maturity date or (b) two years prior to then current franchise agreement expiration date, unless at such time, the expiration date of the then current franchise agreement (exclusive of any extension options) extends at least five years beyond the loan maturity date, (ii) upon the franchise agreement terminating, being cancelled, expiring or discontinuing, or (iii) the franchisor giving notice of its intent to terminate, cancel or discontinue the franchise agreement. |
| (2) | Upon the occurrence of a Cash Trap Period triggered by a low DSCR period, the borrower may suspend such Cash Trap Period by depositing into the DSCR reserve an amount such that, if applied to the outstanding principal balance, would satisfy a NOI DSCR of 1.20x. At any time, the borrower will have the option to replace cash deposited into the DSCR reserve with a letter of credit acceptable to lender in an amount equal to the amount then on deposit in the DSCR reserve. Notwithstanding the foregoing, the borrower will not be allowed to deliver any letter of credit if the amount is greater than 10.0% of the outstanding principal balance. |
| (3) | The property is subject to a long term ground lease expiring December 31, 2113 with no additional extension options. |
| TRANSACTION HIGHLIGHTS |
● | Property. Holiday Inn Manhattan View is located in Long Island City, New York, with views of Manhattan. The improvements were constructed in 2008 and consist of a 17-story, 136-room room Holiday Inn hotel with facilities and amenities including a business center, fitness center, complimentary Wi-Fi, Rio Grande Churrascarria Steak House, Lobby Bar and Lounge, approximately 1,800 sq. ft. of meeting space and 23 parking spaces. |
● | Market. As of December 2014, the Holiday Inn Manhattan View exhibited 2014 year-end occupancy, ADR and RevPAR of 87.2%, $167.46 and $145.99, respectively, resulting in occupancy, ADR and RevPar penetration rates of 109.5%, 116.5% and 127.6%, respectively. The Holiday Inn Manhattan View has averaged occupancy, ADR and RevPar penetration rates of 111.2%, 116.7% and 129.9% since 2012. |
● | Sponsorship. The borrower, Queens Plaza North, LLC, is a partnership including the three guarantors of the loan, Delwar Hussain, Hafeez Choudhary and Mark Farruqui. Each individual has over has a minimum of 10 years of experience in the commercial real estate and construction industry. The property is managed by M&R Hospitality Management, Corp., which currently operates 18 hotels including 16 in New York City, one in suburban Boston and one in St. Maarten. |
THE INFORMATION IN THIS STRUCTURAL AND COLLATERAL TERM SHEET IS NOT COMPLETE AND MAY BE AMENDED PRIOR TO THE TIME OF SALE. THIS TERM SHEET IS NOT AN OFFER TO SELL THESE SECURITIES AND IT IS NOT A SOLICITATION OF AN OFFER TO BUY THESE SECURITIES IN ANY JURISDICTION WHERE THE OFFER OR SALE IS NOT PERMITTED.
120
789 Connecticut Avenue Norwalk, CT 06854 | Collateral Asset Summary – Loan No. 20 DoubleTree Norwalk | Cut-off Date Balance: Cut-off Date LTV: U/W NCF DSCR: U/W NOI Debt Yield: | $20,154,587 67.2% 1.60x 12.4% |
| Mortgage Loan Information | |
| Loan Seller: | CCRE |
| Loan Purpose: | Refinance |
| Sponsor: | John A. Bobango; Stephen M. Balton |
| Borrower: | CT Hotel Partners, L.P. |
| Original Balance: | $20,200,000 |
| Cut-off Date Balance: | $20,154,587 |
| % by Initial UPB: | 1.5% |
| Interest Rate: | 5.0435% |
| Payment Date: | 6th of each month |
| First Payment Date: | April 6, 2015 |
| Maturity Date: | March 6, 2020 |
| Amortization: | 360 months |
| Additional Debt: | None |
| Call Protection: | L(26), D(30), O(4) |
Lockbox / Cash Management(1): | Hard / Springing |
| Reserves | ||
| Initial | Monthly | |
| Taxes: | $105,000 | $35,000 |
Insurance(2): | $0 | Springing |
| Replacement: | $0 | 1/12th of 4.0% of gross income from operations |
Seasonality(3): | $112,000 | Springing |
| Financial Information | |
| Cut-off Date Balance / Room: | $76,055 |
| Balloon Balance / Room: | $70,360 |
| Cut-off Date LTV: | 67.2% |
| Balloon LTV: | 62.2% |
| Underwritten NOI DSCR: | 1.91x |
| Underwritten NCF DSCR: | 1.60x |
| Underwritten NOI Debt Yield: | 12.4% |
| Underwritten NCF Debt Yield: | 10.4% |
| Property Information | |
| Single Asset / Portfolio: | Single Asset |
| Property Type: | Full Service Hospitality |
| Collateral: | Fee Simple |
| Location: | Norwalk, CT |
| Year Built / Renovated: | 1971 / 2005, 2008-2011 |
| Total Rooms: | 265 |
| Property Management: | Hospitality Management Advisors, Inc. |
| Underwritten NOI: | $2,498,102 |
| Underwritten NCF: | $2,092,174 |
| Appraised Value: | $30,000,000 |
| Appraisal Date: | February 1, 2015 |
| Historical NOI | |
| Most Recent NOI: | $2,527,645 (T-12 January 31, 2015) |
| 2014 NOI: | $2,445,627 (December 31, 2014) |
| 2013 NOI: | $1,956,343 (December 31, 2013) |
| 2012 NOI: | $2,083,757 (December 31, 2012) |
| Historical Occupancy | |
| Most Recent Occupancy: | 71.9% (January 31, 2015) |
| 2014 Occupancy: | 70.4% (December 31, 2014) |
| 2013 Occupancy: | 69.9% (December 31, 2013) |
| 2012 Occupancy: | 67.9% (December 31, 2012) |
| (1) | Cash management and an excess cash flow sweep will be triggered during a Cash Trap Period. A “Cash Trap Period” will commence upon (i) an event of default, (ii) any borrower, principal, guarantor or property manager bankruptcy or (iii) the failure by the borrower to maintain a debt service coverage ratio of at least 1.25x for two consecutive calendar quarters, until the debt service coverage ratio is at least 1.40x for four consecutive calendar quarters. |
| (2) | The borrower will be required to deposit 1/12 of the annual insurance premiums upon (i) a Cash Trap Period or (ii) failure to pay insurance premiums directly, among other things. |
| (3) | The borrower will be required to deposit (i) $10,625 monthly on each payment date occurring in May through December 2015 and (ii) on each payment thereafter that occurs between the months of May and December, an amount equal to the aggregate funds withdrawn during the previous calendar year, pro-rated over the remaining payments dates such that the account balance equals $197,000. |
| TRANSACTION HIGHLIGHTS |
● | Property. DoubleTree Norwalk is an eight-story, 265-key full service hotel located in Norwalk, Connecticut. Constructed in 1971 and most recently renovated in 2008-2011, the property features a business center, fitness center, indoor swimming pool, 120-seat Saffire restaurant and bar, 24-hour convenience store, in-room dining, guest-self laundry facilities, approximately 5,868 sq. ft. of meeting space and approximately 273 surface and garage parking spaces. DoubleTree Norwalk is the only-full service hotel in the Norwalk lodging market and features the largest meeting space amongst its competitive set. |
● | Recent Renovation. Since acquiring the property in 2008, the sponsor has invested approximately $4.25 million ($16,075 per room). Capital expenditures include a complete lobby renovation, amenity enhancements, upgraded mechanical systems and guestroom improvements. The sponsor has a total cost basis of approximately $33.5 million, resulting in a loan-to-cost ratio of approximately 62.6%. |
● | Market. As of January 2015, DoubleTree Norwalk exhibited trailing 12-month occupancy, ADR and RevPAR of 71.9%, $124.97 and $89.88, respectively, resulting in occupancy, ADR and RevPAR penetration rates of 101.6%, 93.6% and 95.1%, respectively. |
● | Location. DoubleTree Norwalk is located on the south side of Connecticut Avenue, approximately 0.3 miles from Interstate 95 and 1.5 miles from the Rowayton Metro-North train station. Interstate 95 is the main highway on the east coast serving areas between Florida and New England. The Rowayton Metro-North train station is an approximate one hour commute to Midtown Manhattan. |
THE INFORMATION IN THIS STRUCTURAL AND COLLATERAL TERM SHEET IS NOT COMPLETE AND MAY BE AMENDED PRIOR TO THE TIME OF SALE. THIS TERM SHEET IS NOT AN OFFER TO SELL THESE SECURITIES AND IT IS NOT A SOLICITATION OF AN OFFER TO BUY THESE SECURITIES IN ANY JURISDICTION WHERE THE OFFER OR SALE IS NOT PERMITTED.
121
STATEMENT REGARDING ASSUMPTIONS AS TO
SECURITIES, PRICING ESTIMATES AND OTHER INFORMATION
This material is for your information, and none of Deutsche Bank Securities Inc., Cantor Fitzgerald & Co., Jefferies LLC, Citigroup Global Markets Inc. and CastleOak Securities, L.P., (the “Underwriters”) are soliciting any action based upon it. This material is not to be construed as an offer to sell or the solicitation of any offer to buy any security in any jurisdiction where such an offer or solicitation would be illegal.
Neither this document nor anything contained herein shall form the basis for any contract or commitment whatsoever. The information contained herein is preliminary as of the date hereof. These materials are subject to change, completion or amendment from time to time. The information contained herein will be superseded by similar information delivered to you as part of the offering document relating to the COMM 2015-CCRE23 Mortgage Trust Commercial Mortgage Pass-Through Certificates (the “Offering Document”). The Information supersedes any such information previously delivered. The Information should be reviewed only in conjunction with the entire Offering Document. All of the information contained herein is subject to the same limitations and qualifications contained in the Offering Document. The Information contained herein does not contain all relevant information relating to the underlying mortgage loans or mortgaged properties. Such information is described elsewhere in the Offering Document. The information contained herein will be more fully described elsewhere in the Offering Document. The information contained herein should not be viewed as projections, forecasts, predictions or opinions with respect to value. Prior to making any investment decision, prospective investors are strongly urged to read the Offering Document its entirety. Neither the Securities and Exchange Commission nor any state securities commission has approved or disapproved of these securities or determined if this free writing prospectus is truthful or complete. Any representation to the contrary is a criminal offense.
The attached information contains certain tables and other statistical analyses (the “Computational Materials”) which have been prepared in reliance upon information furnished by the Mortgage Loan Sellers. Numerous assumptions were used in preparing the Computational Materials, which may or may not be reflected herein. As such, no assurance can be given as to the Computational Materials’ accuracy, appropriateness or completeness in any particular context; or as to whether the Computational Materials and/or the assumptions upon which they are based reflect present market conditions or future market performance. The Computational Materials should not be construed as either projections or predictions or as legal, tax, financial or accounting advice. You should consult your own counsel, accountant and other advisors as to the legal, tax, business, financial and related aspects of a purchase of these securities. Any weighted average lives, yields and principal payment periods shown in the Computational Materials are based on prepayment and/or loss assumptions, and changes in such prepayment and/or loss assumptions may dramatically affect such weighted average lives, yields and principal payment periods. In addition, it is possible that prepayments or losses on the underlying assets will occur at rates higher or lower than the rates shown in the attached Computational Materials. The specific characteristics of the securities may differ from those shown in the Computational Materials due to differences between the final underlying assets and the preliminary underlying assets used in preparing the Computational Materials. The principal amount and designation of any security described in the Computational Materials are subject to change prior to issuance. None of Underwriters or any of their respective affiliates makes any representation or warranty as to the actual rate or timing of payments or losses on any of the underlying assets or the payments or yield on the securities.
This document contains forward-looking statements. Those statements are subject to certain risks and uncertainties that could cause the success of collections and the actual cash flow generated to differ materially from the information set forth herein. While such information reflects projections prepared in good faith based upon methods and data that are believed to be reasonable and accurate as of the dates thereof, the depositor undertakes no obligation to revise these forward-looking statements to reflect subsequent events or circumstances. Individuals should not place undue reliance on forward-looking statements and are advised to make their own independent analysis and determination with respect to the forecasted periods, which reflect the issuer’s view only as of the date hereof.
IMPORTANT NOTICE RELATING TO AUTOMATICALLY GENERATED EMAIL DISCLAIMERS
Any legends, disclaimers or other notices that may appear at the bottom of the email communication to which this free writing prospectus is attached relating to (1) these materials not constituting an offer (or a solicitation of an offer), (2) no representation being made that these materials are accurate or complete and may not be updated or (3) these materials possibly being confidential, are not applicable to these materials and should be disregarded. Such legends, disclaimers or other notices have been automatically generated as a result of these materials having been sent via Bloomberg or another system.