UNITED STATES
SECURITIES AND EXCHANGE COMMISSION
Washington, D.C. 20549
FORM N-CSR
Certified Shareholder Report of
Registered Management Investment Companies
Investment Company Act File Number: 811-23053
American Funds Retirement Income Portfolio Series
(Exact Name of Registrant as Specified in Charter)
6455 Irvine Center Drive
Irvine, California 92618
(Address of Principal Executive Offices)
Registrant's telephone number, including area code: (213) 486-9200
Date of fiscal year end: October 31
Date of reporting period: April 30, 2018
Steven I. Koszalka
American Funds Retirement Income Portfolio Series
333 South Hope Street
Los Angeles, California 90071
(Name and Address of Agent for Service)
ITEM 1 – Reports to Stockholders
 | American Funds
Retirement Income
Portfolio SeriesSM Semi-annual report
for the six months ended
April 30, 2018 |

Portfolios designed
to help address
your retirement
income needs
American Funds, from Capital Group, is one of the nation’s largest mutual fund families. For more than 85 years, Capital has invested with a long-term focus based on thorough research and attention to risk.
American Funds Retirement Income Portfolio — ConservativeSM strives for the accomplishment of three investment objectives: current income, long-term growth of capital and conservation of capital, with an emphasis on income and conservation of capital.
American Funds Retirement Income Portfolio — ModerateSM strives for the balanced accomplishment of three investment objectives: current income, long-term growth of capital and conservation of capital.
American Funds Retirement Income Portfolio — EnhancedSM strives for the accomplishment of three investment objectives: current income, long-term growth of capital and conservation of capital, with an emphasis on income and growth of capital.
Fund results shown in this report, unless otherwise indicated, are for Class A shares at net asset value. If a sales charge (maximum 5.75%) had been deducted, the results would have been lower. Results are for past periods and are not predictive of results for future periods. Current and future results may be lower or higher than those shown. Share prices and returns will vary, so investors may lose money. For current information and month-end results, visit americanfunds.com.
Here are the total returns on a $1,000 investment with all distributions reinvested for periods ended March 31, 2018 (the most recent calendar quarter-end). Returns reflect the maximum 5.75% sales charge. Also shown are the gross and net expense ratios as of the series prospectus dated January 1, 2018. Expense ratios for American Funds Retirement Income Portfolio — Conservative are restated to reflect current fees:
| Class A shares | | 1 year | | Lifetime
(since 8/28/15) | | Gross
expense ratio | | Net
expense ratio |
| | | | | | | | | | | | | | | | | |
| American Funds Retirement Income Portfolio — Conservative | | | –1.76 | % | | | 2.93 | % | | | 0.71 | % | | | 0.68 | % |
| American Funds Retirement Income Portfolio — Moderate | | | –0.51 | | | | 4.32 | | | | 0.70 | | | | 0.69 | |
| American Funds Retirement Income Portfolio — Enhanced | | | 1.04 | | | | 5.79 | | | | 0.72 | | | | 0.71 | |
American Funds Retirement Income Portfolio Series funds invest in Class R-6 shares of the underlying funds.
Investment results assume all distributions are reinvested and reflect applicable fees and expenses. When applicable, investment results reflect expense reimbursements, without which results would have been lower. Please see americanfunds.com for more information.
The investment adviser is currently reimbursing a portion of other expenses for all funds and share classes. Investment results and net expense ratios shown reflect the reimbursements, without which the results would have been lower and the expenses would have been higher. The reimbursement will be in effect through at least January 1, 2019. The adviser may elect at its discretion to extend, modify or terminate the reimbursement at that time.
For other share class results, visit americanfunds.com and americanfundsretirement.com.
The Retirement Income Portfolio Series investment allocations may not achieve fund objectives, and adequate income through retirement is not guaranteed. There are expenses associated with the underlying funds in addition to fund-of-funds expenses. The funds’ risks are directly related to the risks of the underlying funds. Payments consisting of return of capital will result in a decrease in an investor’s fund share balance. Higher rates of withdrawal and withdrawals during declining markets may result in a more rapid decrease in an investor’s fund share balance. Persistent returns of capital could ultimately result in a zero account balance. Refer to the series prospectus and the Risk Factors section of this report for more information on these and other risks associated with investing in the funds.
Investments are not FDIC-insured, nor are they deposits of or guaranteed by a bank or any other entity, so they may lose value.
Fellow investors:
Two of the three portfolios within the American Funds Retirement Income Portfolio Series registered positive returns for the first half of their fiscal year.
For the six months ended April 30, 2018, the Conservative portfolio fell –0.54% and posted an income return of 1.11%. The Moderate portfolio rose 0.10%, with an income return of 1.27%. The Enhanced portfolio gained 0.78%, with an income return of 1.37%. All income returns were the same whether dividends were reinvested or taken in cash.
About the series
The series was created by the American Funds Portfolio Oversight Committee, a group of seasoned investment professionals with varied backgrounds, diverse investment approaches and decades of experience. In creating the series, the Committee carefully selects a mix of individual American Funds, employing an objective-based process and rigorous analysis. The Committee regularly monitors each fund in the series.
This series offers three distinct portfolios of individual American Funds, each designed to provide retirement income based on different withdrawal rates as well as an investor’s risk tolerance. For more information on each portfolio, please see page 3.
Results at a glance
For periods ended April 30, 2018, with all distributions reinvested
| | | Cumulative
total returns | | Average annual
total returns |
| | | 6 months | | 1 year | | Lifetime
(since 8/28/15) |
| | | | | | | |
| American Funds Retirement Income Portfolio — Conservative (Class A shares) | | | –0.54 | % | | | 3.38 | % | | | 5.07 | % |
| American Funds Retirement Income Portfolio — Moderate (Class A shares) | | | 0.10 | | | | 4.98 | | | | 6.55 | |
| American Funds Retirement Income Portfolio — Enhanced (Class A shares) | | | 0.78 | | | | 6.80 | | | | 8.07 | |
| Standard & Poor’s Target Date Retirement Income Index* | | | 0.67 | | | | 4.49 | | | | 4.76 | |
| Lipper Retirement Income Funds Index† | | | –0.01 | | | | 4.17 | | | | 4.89 | |
| * | The S&P Target Date Retirement Income Index, a component of the S&P Target Date Index Series, comprises multi-asset classes based on funds with glide paths that aim to be more sensitive to longevity risk at, and beyond, the retirement date. The index is fully investable with varying levels of exposures to the asset classes determined during an annual survey process of target date funds’ holdings. The current universe of eligible asset classes includes: U.S. Large-Cap, U.S. Mid-Cap, U.S. Small-Cap, International Equities, Emerging Markets Equities, U.S. REITs, International REITs, Core Fixed Income, Cash Equivalents, TIPS, High-Yield Corporate Bonds and Commodities. Each asset class is represented in the indexes via a different ETF. When used as a benchmark, the market index is unmanaged and, therefore, has no expenses. Investors cannot invest directly in an index. S&P source: S&P Dow Jones Indices LLC. While this index is used as a benchmark, American Funds Retirement Income Portfolio Series funds are not target date funds. |
| † | The Lipper Retirement Income Funds Index is composed of funds designed to combine professional asset management with professionally managed withdrawals to assist investors in retirement. The results of the underlying funds in the index include reinvestment of dividends and capital gain distributions, as well as brokerage commissions paid by the funds for portfolio transactions and other expenses, but do not reflect the effect of sales charges, account fees or U.S. federal income taxes. Lipper indexes track the largest mutual funds (no more than 30), represented by one share class per fund, in the corresponding Lipper category. Source: Thomson Reuters Lipper. There have been periods when the funds have lagged the index. |
| American Funds Retirement Income Portfolio Series | 1 |
The economy
For the first half of the funds’ fiscal year, the global economy continued to grow at a moderate pace. Most major economies were healthy. In the United States, the unemployment rate continued to fall and stood at 4.1% in March, while gross domestic product rose 2.9% in the fourth quarter of 2017. Consumer confidence was steady, and inflation remained low.
The picture was similar overseas. In the eurozone, fourth quarter GDP gained 2.7%, while unemployment stood at 8.5% for February — still high, but the lowest figure reported since 2008. Economic activity in Japan continued to increase modestly, while in China growth has stabilized at a strong rate over the past several years.
The stock market
Over the six months, volatility returned to a number of equity markets — some for the first time in years. In several instances it could be attributed to geopolitical concerns, such as continuing conflicts in Syria and changes to U.S. trade policies. Corporate earnings were generally sound throughout much of the world, however.
Domestically, the Standard & Poor’s 500 Composite Index, a market capitalization-weighted index based on the results of approximately 500 widely held common stocks, gained 3.82% during the period. The MSCI ACWI (All Country World Index) ex USA, which reflects the returns of more than 40 developed and developing country stock markets, climbed 3.47%, while the MSCI Emerging Markets Index, measuring markets in more than 20 developing countries, advanced 4.80%.
The bond market
With the U.S. economy on sound footing, the Federal Reserve continued its slow, steady progression of rate hikes, the most recent of which increased the benchmark (the rate at which the central bank loans money to other banks) to a range of 1.50% to 1.75%. This remains well below historical norms.
During the period, the yield on the 10-year U.S. Treasury bond — a widely regarded benchmark for the U.S. bond market — increased 58 basis points to 2.95%, despite the volatility in equities. The Bloomberg Barclays U.S. Aggregate Index, which measures investment-grade U.S. bonds (rated BBB/Baa and above), fell 1.87% — not unexpected in the wake of the Fed’s moves. Global bonds fared better, with the Bloomberg Barclays Global Aggregate Index, a measure of global investment-grade bonds (rated BBB/Baa and above), rising 1.19%.
How the series fared
Despite volatility in equity markets during the period, both the Moderate and Enhanced portfolios had positive returns. The Enhanced portfolio is weighted heavily toward dividend-paying equities, while the Moderate portfolio has a more balanced allocation of stocks and bonds. The Conservative portfolio, with its considerable weighting in bonds, posted a slightly negative result. As always, we remind investors that six months is a limited period from which to extract and examine results.
Moving forward
Looking ahead, we believe the global economy will continue to grow over the short term, buoyed by a general trend toward deregulation and lower taxes in the United States. However, trade policy remains a concern. While current disputes between the U.S. and China have had little real economic impact, the possibility of escalation is worrisome.
In light of this and other geopolitical issues, we expect to see higher levels of volatility in equity markets. This is not necessarily a sign of trouble, but rather a return to normalcy as the past year’s lack of volatility was unusual. Overall we believe the market environment, given a foundation of strong corporate earnings, will be positive.
As always, we thank you for placing your trust in American Funds, and look forward to reporting to you again in six months.
Cordially,

Bradley J. Vogt
Vice Chairman of the Board

Walter R. Burkley
President
June 13, 2018
For current information about the series, visit americanfunds.com.
| 2 | American Funds Retirement Income Portfolio Series |
| American Funds Conservative Portfolio | unaudited |
| Investment portfolio April 30, 2018 | |
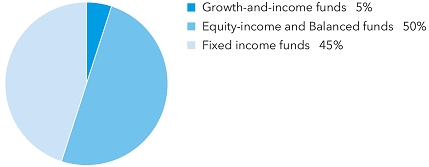
| Growth-and-income funds 5% | | Shares | | | Value
(000) | |
| American Mutual Fund, Class R-6 | | | 643,627 | | | $ | 25,745 | |
| | | | | | | | | |
| Equity-income and Balanced funds 50% | | | | | | | | |
| Capital Income Builder, Class R-6 | | | 1,699,189 | | | | 103,226 | |
| The Income Fund of America, Class R-6 | | | 3,397,721 | | | | 77,400 | |
| American Balanced Fund, Class R-6 | | | 1,922,619 | | | | 51,564 | |
| American Funds Global Balanced Fund, Class R-6 | | | 791,577 | | | | 25,766 | |
| | | | | | | | 257,956 | |
| | | | | | | | | |
| Fixed income funds 45% | | | | | | | | |
| The Bond Fund of America, Class R-6 | | | 10,341,268 | | | | 129,473 | |
| U.S. Government Securities Fund, Class R-6 | | | 3,885,130 | | | | 51,711 | |
| American Funds Inflation Linked Bond Fund, Class R-6 | | | 2,690,067 | | | | 25,825 | |
| American Funds Mortgage Fund, Class R-6 | | | 2,632,912 | | | | 25,802 | |
| | | | | | | | 232,811 | |
| | | | | | | | | |
| Total investment securities 100% (cost: $513,302,000) | | | | | | | 516,512 | |
| Other assets less liabilities 0% | | | | | | | (189 | ) |
| | | | | | | | | |
| Net assets 100% | | | | | | $ | 516,323 | |
See Notes to Financial Statements
| American Funds Retirement Income Portfolio Series | 3 |
| American Funds Moderate Portfolio | unaudited |
| Investment portfolio April 30, 2018 | |
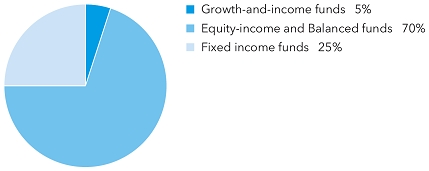
| Growth-and-income funds 5% | | Shares | | | Value
(000) | |
| American Mutual Fund, Class R-6 | | | 873,793 | | | $ | 34,952 | |
| | | | | | | | | |
| Equity-income and Balanced funds 70% | | | | | | | | |
| Capital Income Builder, Class R-6 | | | 2,883,389 | | | | 175,166 | |
| The Income Fund of America, Class R-6 | | | 7,689,458 | | | | 175,166 | |
| American Balanced Fund, Class R-6 | | | 3,916,837 | | | | 105,049 | |
| American Funds Global Balanced Fund, Class R-6 | | | 1,075,881 | | | | 35,020 | |
| | | | | | | | 490,401 | |
| | | | | | | | | |
| Fixed income funds 25% | | | | | | | | |
| The Bond Fund of America, Class R-6 | | | 5,623,107 | | | | 70,401 | |
| U.S. Government Securities Fund, Class R-6 | | | 2,641,838 | | | | 35,163 | |
| American Funds Mortgage Fund, Class R-6 | | | 3,585,121 | | | | 35,134 | |
| American Funds Inflation Linked Bond Fund, Class R-6 | | | 3,657,459 | | | | 35,112 | |
| | | | | | | | 175,810 | |
| | | | | | | | | |
| Total investment securities 100% (cost: $684,864,000) | | | | | | | 701,163 | |
| Other assets less liabilities 0% | | | | | | | (158 | ) |
| | | | | | | | | |
| Net assets 100% | | | | | | $ | 701,005 | |
See Notes to Financial Statements
| 4 | American Funds Retirement Income Portfolio Series |
| American Funds Enhanced Portfolio | unaudited |
| Investment portfolio April 30, 2018 | |
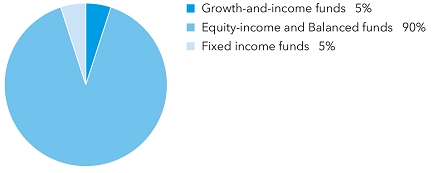
| Growth-and-income funds 5% | | Shares | | | Value
(000) | |
| American Mutual Fund, Class R-6 | | | 867,349 | | | $ | 34,694 | |
| | | | | | | | | |
| Equity-income and Balanced funds 90% | | | | | | | | |
| Capital Income Builder, Class R-6 | | | 3,428,120 | | | | 208,258 | |
| The Income Fund of America, Class R-6 | | | 9,142,156 | | | | 208,258 | |
| American Balanced Fund, Class R-6 | | | 5,176,457 | | | | 138,833 | |
| American Funds Global Balanced Fund, Class R-6 | | | 2,131,924 | | | | 69,394 | |
| | | | | | | | 624,743 | |
| | | | | | | | | |
| Fixed income funds 5% | | | | | | | | |
| American Funds Inflation Linked Bond Fund, Class R-6 | | | 3,627,091 | | | | 34,820 | |
| | | | | | | | | |
| Total investment securities 100% (cost: $668,360,000) | | | | | | | 694,257 | |
| Other assets less liabilities 0% | | | | | | | (168 | ) |
| | | | | | | | | |
| Net assets 100% | | | | | | $ | 694,089 | |
See Notes to Financial Statements
| American Funds Retirement Income Portfolio Series | 5 |
| Financial statements | |
| | |
Statements of assets and liabilities
at April 30, 2018 | unaudited
(dollars in thousands) |
| | | Conservative
Portfolio | | | Moderate
Portfolio | | | Enhanced
Portfolio | |
| | | | | | | | | | |
| Assets: | | | | | | | | | | | | |
| Investment securities, at value: | | | | | | | | | | | | |
| Unaffiliated issuers | | $ | 516,512 | | | $ | 701,163 | | | $ | 694,257 | |
| Receivables for: | | | | | | | | | | | | |
| Sales of fund’s shares | | | 720 | | | | 738 | | | | 1,708 | |
| Dividends | | | 424 | | | | 282 | | | | — | |
| Total assets | | | 517,656 | | | | 702,183 | | | | 695,965 | |
| | | | | | | | | | | | | |
| Liabilities: | | | | | | | | | | | | |
| Payables for: | | | | | | | | | | | | |
| Purchases of investments | | | 913 | | | | 823 | | | | 1,292 | |
| Repurchases of fund’s shares | | | 231 | | | | 197 | | | | 416 | |
| Services provided by related parties | | | 189 | | | | 158 | | | | 168 | |
| Trustees’ deferred compensation | | | — | * | | | — | * | | | — | * |
| Total liabilities | | | 1,333 | | | | 1,178 | | | | 1,876 | |
| Net assets at April 30, 2018 | | $ | 516,323 | | | $ | 701,005 | | | $ | 694,089 | |
| | | | | | | | | | | | | |
| Net assets consist of: | | | | | | | | | | | | |
| Capital paid in on shares of beneficial interest | | $ | 507,414 | | | $ | 674,893 | | | $ | 656,234 | |
| Undistributed (distributions in excess of) net investment income | | | 375 | | | | 110 | | | | (71 | ) |
| Undistributed net realized gain | | | 5,324 | | | | 9,703 | | | | 12,029 | |
| Net unrealized appreciation | | | 3,210 | | | | 16,299 | | | | 25,897 | |
| Net assets at April 30, 2018 | | $ | 516,323 | | | $ | 701,005 | | | $ | 694,089 | |
| | | | | | | | | | | | | |
| Investment securities in unaffiliated issuers, at cost | | $ | 513,302 | | | $ | 684,864 | | | $ | 668,360 | |
| * | Amount less than one thousand. |
See Notes to Financial Statements
| 6 | American Funds Retirement Income Portfolio Series |
unaudited
(dollars and shares in thousands, except per-share amounts)
| | | | | Conservative
Portfolio | | | Moderate
Portfolio | | | Enhanced
Portfolio | |
| | | | | | | | | | | | |
Shares of beneficial interest issued and outstanding
(no stated par value) — unlimited shares authorized | | | | | | | | | | | | |
| | | | | | | | | | | | | |
| Class A: | | Net assets | | $ | 340,912 | | | $ | 562,829 | | | $ | 511,227 | |
| | | Shares outstanding | | | 31,588 | | | | 50,611 | | | | 44,489 | |
| | | Net asset value per share | | $ | 10.79 | | | $ | 11.12 | | | $ | 11.49 | |
| Class C: | | Net assets | | $ | 72,486 | | | $ | 74,541 | | | $ | 62,447 | |
| | | Shares outstanding | | | 6,746 | | | | 6,731 | | | | 5,454 | |
| | | Net asset value per share | | $ | 10.75 | | | $ | 11.07 | | | $ | 11.45 | |
| Class T: | | Net assets | | $ | 10 | | | $ | 10 | | | $ | 10 | |
| | | Shares outstanding | | | 1 | | | | 1 | | | | 1 | |
| | | Net asset value per share | | $ | 10.80 | | | $ | 11.12 | | | $ | 11.49 | |
| Class F-1: | | Net assets | | $ | 9,545 | | | $ | 14,215 | | | $ | 22,764 | |
| | | Shares outstanding | | | 884 | | | | 1,278 | | | | 1,980 | |
| | | Net asset value per share | | $ | 10.80 | | | $ | 11.12 | | | $ | 11.49 | |
| Class F-2: | | Net assets | | $ | 40,915 | | | $ | 45,113 | | | $ | 94,435 | |
| | | Shares outstanding | | | 3,786 | | | | 4,051 | | | | 8,207 | |
| | | Net asset value per share | | $ | 10.81 | | | $ | 11.14 | | | $ | 11.51 | |
| Class F-3: | | Net assets | | $ | 644 | | | $ | 1,567 | | | $ | 1,045 | |
| | | Shares outstanding | | | 60 | | | | 141 | | | | 91 | |
| | | Net asset value per share | | $ | 10.80 | | | $ | 11.12 | | | $ | 11.50 | |
| Class R-1: | | Net assets | | $ | 676 | | | $ | 108 | | | $ | 67 | |
| | | Shares outstanding | | | 63 | | | | 10 | | | | 6 | |
| | | Net asset value per share | | $ | 10.78 | | | $ | 11.12 | | | $ | 11.49 | |
| Class R-2: | | Net assets | | $ | 755 | | | $ | 1,394 | | | $ | 754 | |
| | | Shares outstanding | | | 70 | | | | 126 | | | | 66 | |
| | | Net asset value per share | | $ | 10.78 | | | $ | 11.10 | | | $ | 11.45 | |
| Class R-2E: | | Net assets | | $ | 11 | | | $ | 11 | | | $ | 12 | |
| | | Shares outstanding | | | 1 | | | | 1 | | | | 1 | |
| | | Net asset value per share | | $ | 10.81 | | | $ | 11.14 | | | $ | 11.51 | |
| Class R-3: | | Net assets | | $ | 1,586 | | | $ | 595 | | | $ | 367 | |
| | | Shares outstanding | | | 147 | | | | 53 | | | | 32 | |
| | | Net asset value per share | | $ | 10.80 | | | $ | 11.11 | | | $ | 11.49 | |
| Class R-4: | | Net assets | | $ | 35,692 | | | $ | 384 | | | $ | 397 | |
| | | Shares outstanding | | | 3,306 | | | | 34 | | | | 34 | |
| | | Net asset value per share | | $ | 10.80 | | | $ | 11.13 | | | $ | 11.50 | |
| Class R-5E: | | Net assets | | $ | 1,635 | | | $ | 11 | | | $ | 11 | |
| | | Shares outstanding | | | 151 | | | | 1 | | | | 1 | |
| | | Net asset value per share | | $ | 10.80 | | | $ | 11.13 | | | $ | 11.50 | |
| Class R-5: | | Net assets | | $ | 11 | | | $ | 13 | | | $ | 12 | |
| | | Shares outstanding | | | 1 | | | | 1 | | | | 1 | |
| | | Net asset value per share | | $ | 10.81 | | | $ | 11.14 | | | $ | 11.51 | |
| Class R-6: | | Net assets | | $ | 11,445 | | | $ | 214 | | | $ | 541 | |
| | | Shares outstanding | | | 1,058 | | | | 19 | | | | 47 | |
| | | Net asset value per share | | $ | 10.81 | | | $ | 11.14 | | | $ | 11.51 | |
| American Funds Retirement Income Portfolio Series | 7 |
Statements of operations
for the six months ended April 30, 2018 | unaudited
(dollars in thousands) |
| | | Conservative
Portfolio | | | Moderate
Portfolio | | | Enhanced
Portfolio | |
| | | | | | | | | | |
| Investment income: | | | | | | | | | | | | |
| Income: | | | | | | | | | | | | |
| Dividends | | $ | 6,574 | | | $ | 9,313 | | | $ | 9,777 | |
| | | | | | | | | | | | | |
| Fees and expenses*: | | | | | | | | | | | | |
| Distribution services | | | 871 | | | | 1,090 | | | | 1,043 | |
| Transfer agent services | | | 90 | | | | 113 | | | | 130 | |
| Reports to shareholders | | | 9 | | | | 11 | | | | 11 | |
| Registration statement and prospectus | | | 122 | | | | 142 | | | | 127 | |
| Trustees’ compensation | | | — | † | | | 1 | | | | 1 | |
| Auditing and legal | | | 1 | | | | 1 | | | | 1 | |
| Custodian | | | 5 | | | | 5 | | | | 5 | |
| Other | | | 4 | | | | 6 | | | | 6 | |
| Total fees and expenses before reimbursements | | | 1,102 | | | | 1,369 | | | | 1,324 | |
| Less reimbursements of fees and expenses: | | | | | | | | | | | | |
| Transfer agent services reimbursements | | | — | † | | | — | † | | | — | † |
| Total fees and expenses after reimbursements | | | 1,102 | | | | 1,369 | | | | 1,324 | |
| Net investment income | | | 5,472 | | | | 7,944 | | | | 8,453 | |
| | | | | | | | | | | | | |
| Net realized gain and unrealized depreciation: | | | | | | | | | | | | |
| Net realized loss on sale of investments | | | (78 | ) | | | (49 | ) | | | (198 | ) |
| Capital gain distributions received | | | 5,459 | | | | 9,841 | | | | 12,286 | |
| | | | 5,381 | | | | 9,792 | | | | 12,088 | |
| Net unrealized depreciation | | | (14,065 | ) | | | (18,770 | ) | | | (17,237 | ) |
| Net realized gain and unrealized depreciation | | | (8,684 | ) | | | (8,978 | ) | | | (5,149 | ) |
| Net (decrease) increase in net assets resulting from operations | | $ | (3,212 | ) | | $ | (1,034 | ) | | $ | 3,304 | |
| * | Additional information related to class-specific fees and expenses is included in the Notes to Financial Statements. |
| † | Amount less than one thousand. |
See Notes to Financial Statements
| 8 | American Funds Retirement Income Portfolio Series |
| Statements of changes in net assets | (dollars in thousands) |
| | | Conservative
Portfolio | | | Moderate
Portfolio | | | Enhanced
Portfolio | |
| | | Six months
ended
April 30
2018* | | | Year ended
October 31
2017 | | | Six months
ended
April 30
2018* | | | Year ended October 31 2017 | | | Six months
ended
April 30
2018* | | | Year ended
October 31
2017 | |
| Operations: | | | | | | | | | | | | | | | | | | |
| Net investment income | | $ | 5,472 | | | $ | 5,886 | | | $ | 7,944 | | | $ | 9,741 | | | $ | 8,453 | | | $ | 10,349 | |
| Net realized gain | | | 5,381 | | | | 1,180 | | | | 9,792 | | | | 2,008 | | | | 12,088 | | | | 1,945 | |
| Net unrealized (depreciation) appreciation | | | (14,065 | ) | | | 15,033 | | | | (18,770 | ) | | | 31,659 | | | | (17,237 | ) | | | 40,033 | |
| Net (decrease) increase in net assets resulting from operations | | | (3,212 | ) | | | 22,099 | | | | (1,034 | ) | | | 43,408 | | | | 3,304 | | | | 52,327 | |
| | | | | | | | | | | | | | | | | | | | | | | | | |
| Dividends and distributions paid to shareholders: | | | | | | | | | | | | | | | | | | | | | | | | |
| Dividends from net investment income | | | (5,163 | ) | | | (6,140 | ) | | | (7,931 | ) | | | (9,896 | ) | | | (8,570 | ) | | | (10,344 | ) |
| Distributions from net realized gain on investments | | | (856 | ) | | | (323 | ) | | | (1,633 | ) | | | (814 | ) | | | (1,787 | ) | | | (1,188 | ) |
| Total dividends and distributions paid to shareholders | | | (6,019 | ) | | | (6,463 | ) | | | (9,564 | ) | | | (10,710 | ) | | | (10,357 | ) | | | (11,532 | ) |
| | | | | | | | | | | | | | | | | | | | | | | | | |
| Net capital share transactions | | | 98,316 | | | | 200,685 | | | | 137,455 | | | | 227,081 | | | | 123,589 | | | | 245,203 | |
| | | | | | | | | | | | | | | | | | | | | | | | | |
| Total increase in net assets | | | 89,085 | | | | 216,321 | | | | 126,857 | | | | 259,779 | | | | 116,536 | | | | 285,998 | |
| | | | | | | | | | | | | | | | | | | | | | | | | |
| Net assets: | | | | | | | | | | | | | | | | | | | | | | | | |
| Beginning of period | | | 427,238 | | | | 210,917 | | | | 574,148 | | | | 314,369 | | | | 577,553 | | | | 291,555 | |
| End of period | | $ | 516,323 | | | $ | 427,238 | | | $ | 701,005 | | | $ | 574,148 | | | $ | 694,089 | | | $ | 577,553 | |
| Undistributed (distributions in excess of) net investment income | | $ | 375 | | | $ | 66 | | | $ | 110 | | | $ | 97 | | | $ | (71 | ) | | $ | 46 | |
See Notes to Financial Statements
| American Funds Retirement Income Portfolio Series | 9 |
| Notes to financial statements | unaudited |
1. Organization
American Funds Retirement Income Portfolio Series (the “series”) is registered under the Investment Company Act of 1940 as an open-end, diversified management investment company. The series consists of three funds (the “funds”). The assets of each fund are segregated, with each fund accounted for separately. The funds’ investment objectives are as follows:
| American Funds Conservative Portfolio | Seeks current income, long-term growth of capital and conservation of capital, with an emphasis on income and conservation of capital. |
| American Funds Moderate Portfolio | Seeks current income, long-term growth of capital and conservation of capital. |
| American Funds Enhanced Portfolio | Seeks current income, long-term growth of capital and conservation of capital, with an emphasis on income and growth of capital. |
Each fund will attempt to achieve its investment objectives by investing in a mix of American Funds (the “underlying funds”) in different combinations and weightings. Capital Research and Management Company (“CRMC”), the series’ investment adviser, is also the investment adviser to the underlying funds.
Each fund in the series has 14 share classes consisting of six retail share classes (Classes A, C, T, F-1, F-2 and F-3) and eight retirement plan share classes (Classes R-1, R-2, R-2E, R-3, R-4, R-5E, R-5 and R-6). The eight retirement plan share classes are generally offered only through eligible employer-sponsored retirement plans. The funds’ share classes are described further in the following table:
| Share class | | Initial sales charge | | Contingent deferred sales charge
upon redemption | | Conversion feature |
| Class A | | Up to 5.75% | | None (except 1% for certain redemptions within 18 months of purchase without an initial sales charge) | | None |
| Class C | | None | | 1% for redemptions within one year of purchase | | Class C converts to Class F-1 after 10 years |
| Class T* | | Up to 2.50% | | None | | None |
| Classes F-1, F-2 and F-3 | | None | | None | | None |
| Classes R-1, R-2, R-2E, R-3, R-4, R-5E, R-5 and R-6 | | None | | None | | None |
| * | Class T shares are not available for purchase. |
Holders of all share classes of each fund have equal pro rata rights to the assets, dividends and liquidation proceeds of each fund held. Each share class of each fund has identical voting rights, except for the exclusive right to vote on matters affecting only its class. Share classes have different fees and expenses (“class-specific fees and expenses”), primarily due to different arrangements for distribution and transfer agent services. Differences in class-specific fees and expenses will result in differences in net investment income and, therefore, the payment of different per-share dividends by each share class of each fund.
2. Significant accounting policies
Each fund in the series is an investment company that applies the accounting and reporting guidance issued in Topic 946 by the U.S. Financial Accounting Standards Board. Each fund’s financial statements have been prepared to comply with U.S. generally accepted accounting principles (“U.S. GAAP”). These principles require the series’ investment adviser to make estimates and assumptions that affect reported amounts and disclosures. Actual results could differ from those estimates. Subsequent events, if any, have been evaluated through the date of issuance in the preparation of the financial statements. The funds follow the significant accounting policies in this section, as well as the valuation policies described in the next section on valuation.
Security transactions and related investment income — Security transactions are recorded by the funds as of the date the trades are executed. Realized gains and losses from security transactions are determined based on the specific identified cost of the securities. Dividend income is recognized on the ex-dividend date.
| 10 | American Funds Retirement Income Portfolio Series |
Fees and expenses — The fees and expenses of the underlying funds are not included in the fees and expenses reported for each of the funds; however, they are indirectly reflected in the valuation of each of the underlying funds. These fees are included in the net effective expense ratios that are provided as supplementary information in the financial highlights tables.
Class allocations — Income, fees and expenses (other than class-specific fees and expenses) and realized and unrealized gains and losses are allocated daily among the various share classes of each fund based on their relative net assets. Class-specific fees and expenses, such as distribution, transfer agent and administrative services, are charged directly to the respective share class of each fund.
Dividends and distributions to shareholders — Dividends and distributions to shareholders are recorded on each fund’s ex-dividend date.
3. Valuation
Security valuation — The net asset value of each share class of each fund is calculated based on the reported net asset values of the underlying funds in which each fund invests. The net asset value of each underlying fund is calculated based on the policies and procedures of the underlying fund contained in each underlying fund’s statement of additional information. Generally, the funds and the underlying funds determine the net asset value of each share class as of approximately 4:00 p.m. New York time each day the New York Stock Exchange is open.
Processes and structure — The series’ board of trustees has delegated authority to the series’ investment adviser to make fair value determinations, subject to board oversight. The investment adviser has established a Joint Fair Valuation Committee (the “Fair Valuation Committee”) to administer, implement and oversee the fair valuation process, and to make fair value decisions. The Fair Valuation Committee regularly reviews its own fair value decisions, as well as decisions made under its standing instructions to the investment adviser’s valuation teams. The Fair Valuation Committee reviews changes in fair value measurements from period to period and may, as deemed appropriate, update the fair valuation guidelines to better reflect the results of back testing and address new or evolving issues. The Fair Valuation Committee reports any changes to the fair valuation guidelines to the board of trustees with supplemental information to support the changes. The series’ board and audit committee also regularly review reports that describe fair value determinations and methods. Pricing decisions, processes and controls over security valuation are also subject to additional internal reviews, including an annual control self-evaluation program facilitated by the investment adviser’s compliance group.
Classifications — The series’ investment adviser classifies each fund’s assets and liabilities into three levels based on the method used to value the assets or liabilities. Level 1 values are based on quoted prices in active markets for identical securities. Level 2 values are based on significant observable market inputs, such as quoted prices for similar securities and quoted prices in inactive markets. Level 3 values are based on significant unobservable inputs that reflect the investment adviser’s determination of assumptions that market participants might reasonably use in valuing the securities. The valuation levels are not necessarily an indication of the risk or liquidity associated with the underlying investment. At April 30, 2018, all of the investment securities held by each fund were classified as Level 1.
4. Risk factors
Investing in the funds may involve certain risks including, but not limited to, those described below.
Periodic withdrawal risks — There is no guarantee that the fund will provide adequate income through retirement. The fund is not designed to, and is not expected to, generate distributions that equal a fixed percentage of the fund’s current net asset value per share. An investor taking periodic withdrawals from the fund should not assume that the source of a distribution is dividend or interest income or capital gains; rather, all or a portion of a distribution from the fund may consist of a return of capital. A return of capital is a return of all or part of an investor’s original investment in the fund. The fund’s ability to preserve capital while making periodic distributions to investors is subject to market conditions at the time an investor invests in the fund and during the length of time such investor holds shares of the fund. Even if the fund’s portfolio value grows over time, such growth may be insufficient to enable the fund to make periodic distributions to investors without returning capital to shareholders. Payments consisting of return of capital will result in a decrease in an investor’s fund share balance. Higher rates of withdrawal and withdrawals during declining markets may result in a more rapid decrease in an investor’s fund share balance. Persistent returns of capital could ultimately result in a zero account balance.
Additionally, as periodic withdrawals by investors will be made from fund assets and investors are generally not expected to reinvest such distributions in additional fund shares, distributions to investors will reduce the amount of assets available for investment by the fund. The fund may suffer substantial investment losses and simultaneously experience additional asset reductions as a result of its distributions to shareholders.
| American Funds Retirement Income Portfolio Series | 11 |
Allocation risk — Investments in the fund are subject to risks related to the investment adviser’s allocation choices. The selection of the underlying funds and the allocation of the fund’s assets could cause the fund to lose value or its results to lag relevant benchmarks or other funds with similar objectives.
Fund structure — The fund invests in underlying funds and incurs expenses related to the underlying funds. In addition, investors in the fund will incur fees to pay for certain expenses related to the operations of the fund. An investor holding the underlying funds directly and in the same proportions as the fund would incur lower overall expenses but would not receive the benefit of the portfolio management and other services provided by the fund.
Underlying fund risks — Because the fund’s investments consist of underlying funds, the fund’s risks are directly related to the risks of the underlying funds. For this reason, it is important to understand the risks associated with investing in the underlying funds, as described below and on the following page.
Market conditions — The prices of, and the income generated by, the common stocks, bonds and other securities held by the underlying funds may decline — sometimes rapidly or unpredictably — due to various factors, including events or conditions affecting the general economy or particular industries; overall market changes; local, regional or global political, social or economic instability; governmental or governmental agency responses to economic conditions; and currency exchange rate, interest rate and commodity price fluctuations.
Issuer risks — The prices of, and the income generated by, securities held by the underlying funds may decline in response to various factors directly related to the issuers of such securities, including reduced demand for an issuer’s goods or services, poor management performance and strategic initiatives such as mergers, acquisitions or dispositions and the market response to any such initiatives.
Investing in growth-oriented stocks — Growth-oriented common stocks and other equity-type securities (such as preferred stocks, convertible preferred stocks and convertible bonds) may involve larger price swings and greater potential for loss than other types of investments.
Investing in income-oriented stocks — Income provided by an underlying fund may be reduced by changes in the dividend policies of, and the capital resources available for dividend payments at, the companies in which the underlying fund invests.
Investing in debt instruments — The prices of, and the income generated by, bonds and other debt securities held by an underlying fund may be affected by changing interest rates and by changes in the effective maturities and credit ratings of these securities.
Rising interest rates will generally cause the prices of bonds and other debt securities to fall. Falling interest rates may cause an issuer to redeem, call or refinance a debt security before its stated maturity, which may result in the fund having to reinvest the proceeds in lower yielding securities. Longer maturity debt securities generally have greater sensitivity to changes in interest rates and may be subject to greater price fluctuations than shorter maturity debt securities.
Bonds and other debt securities are also subject to credit risk, which is the possibility that the credit strength of an issuer will weaken and/or an issuer of a debt security will fail to make timely payments of principal or interest and the security will go into default. Credit risk is gauged, in part, by the credit ratings of the debt securities in which the underlying fund invests. However, ratings are only the opinions of the rating agencies issuing them and are not guarantees as to credit quality or an evaluation of market risk. The underlying funds’ investment adviser relies on its own credit analysts to research issuers and issues in seeking to mitigate various credit and default risks.
Investing in lower rated debt instruments — Lower rated bonds and other lower rated debt securities generally have higher rates of interest and involve greater risk of default or price declines due to changes in the issuer’s creditworthiness than those of higher quality debt securities. The market prices of these securities may fluctuate more than the prices of higher quality debt securities and may decline significantly in periods of general economic difficulty. These risks may be increased with respect to investments in junk bonds.
Investing in securities backed by the U.S. government — Securities backed by the U.S. Treasury or the full faith and credit of the U.S. government are guaranteed only as to the timely payment of interest and principal when held to maturity. Accordingly, the current market values for these securities will fluctuate with changes in interest rates. Securities issued by government-sponsored entities and federal agencies and instrumentalities that are not backed by the full faith and credit of the U.S. government are neither issued nor guaranteed by the U.S. government.
| 12 | American Funds Retirement Income Portfolio Series |
Investing in mortgage-related and other asset-backed securities — Mortgage-related securities, such as mortgage-backed securities, and other asset-backed securities, include debt obligations that represent interests in pools of mortgages or other income-bearing assets, such as consumer loans or receivables. Such securities often involve risks that are different from or more acute than the risks associated with investing in other types of debt securities. Mortgage-backed and other asset-backed securities are subject to changes in the payment patterns of borrowers of the underlying debt. When interest rates fall, borrowers are more likely to refinance or prepay their debt before its stated maturity. This may result in an underlying fund having to reinvest the proceeds in lower yielding securities, effectively reducing the underlying fund’s income. Conversely, if interest rates rise and borrowers repay their debt more slowly than expected, the time in which the mortgage-backed and other asset-backed securities are paid off could be extended, reducing an underlying fund’s cash available for reinvestment in higher yielding securities.
Liquidity risk — Certain underlying fund holdings may be deemed to be less liquid or illiquid because they cannot be readily sold without significantly impacting the value of the holdings. Liquidity risk may result from the lack of an active market for a holding, legal or contractual restrictions on resale, or the reduced number and capacity of market participants to make a market in such holding. Market prices for less liquid or illiquid holdings may be volatile, and reduced liquidity may have an adverse impact on the market price of such holdings. Additionally, the sale of less liquid or illiquid holdings may involve substantial delays (including delays in settlement) and additional costs and the underlying fund may be unable to sell such holdings when necessary to meet its liquidity needs.
Investing outside the U.S. — Securities of issuers domiciled outside the U.S., or with significant operations or revenues outside the U.S., may lose value because of adverse political, social, economic or market developments (including social instability, regional conflicts, terrorism and war) in the countries or regions in which the issuers operate or generate revenue. These securities may also lose value due to changes in foreign currency exchange rates against the U.S. dollar and/or currencies of other countries. Issuers of these securities may be more susceptible to actions of foreign governments, such as the imposition of price controls or punitive taxes, that could adversely impact the value of these securities. Securities markets in certain countries may be more volatile and/or less liquid than those in the U.S. Investments outside the U.S. may also be subject to different accounting practices and different regulatory, legal and reporting standards and practices, and may be more difficult to value, than those in the U.S. In addition, the value of investments outside the U.S. may be reduced by foreign taxes, including foreign withholding taxes on interest and dividends. Further, there may be increased risks of delayed settlement of securities purchased or sold by an underlying fund. The risks of investing outside the U.S. may be heightened in connection with investments in emerging markets.
Investing in emerging markets — Investing in emerging markets may involve risks in addition to and greater than those generally associated with investing in the securities markets of developed countries. For instance, developing countries may have less developed legal and accounting systems than those in developed countries. The governments of these countries may be less stable and more likely to impose capital controls, nationalize a company or industry, place restrictions on foreign ownership and on withdrawing sale proceeds of securities from the country, and/or impose punitive taxes that could adversely affect the prices of securities. In addition, the economies of these countries may be dependent on relatively few industries that are more susceptible to local and global changes. Securities markets in these countries can also be relatively small and have substantially lower trading volumes. As a result, securities issued in these countries may be more volatile and less liquid, and may be more difficult to value, than securities issued in countries with more developed economies and/or markets. Less certainty with respect to security valuations may lead to additional challenges and risks in calculating the underlying fund’s net asset value. Additionally, there may be increased settlement risks for transactions in local securities.
Investing in derivatives — The use of derivatives involves a variety of risks, which may be different from, or greater than, the risks associated with investing in traditional cash securities, such as stocks and bonds. Changes in the value of a derivative may not correlate perfectly with, and may be more sensitive to market events than, the underlying asset, rate or index, and a derivative instrument may expose the underlying fund to losses in excess of its initial investment. Derivatives may be difficult for the underlying fund to buy or sell at an opportune time or price and may be difficult to terminate or otherwise offset. The underlying fund’s use of derivatives may result in losses to the underlying fund, and investing in derivatives may reduce the underlying fund’s returns and increase the underlying fund’s price volatility. The underlying fund’s counterparty to a derivative transaction (including, if applicable, the underlying fund’s clearing broker, the derivatives exchange or the clearinghouse) may be unable or unwilling to honor its financial obligations in respect of the transaction.
Management — The investment adviser to the fund and to the underlying funds actively manages each underlying fund’s investments. Consequently, the underlying funds are subject to the risk that the methods and analyses employed by the investment adviser in this process may not produce the desired results. This could cause an underlying fund to lose value or its investment results to lag relevant benchmarks or other funds with similar objectives.
| American Funds Retirement Income Portfolio Series | 13 |
5. Taxation and distributions
Federal income taxation — Each fund complies with the requirements under Subchapter M of the Internal Revenue Code applicable to mutual funds and intends to distribute substantially all of its net taxable income and net capital gains each year. The funds are not subject to income taxes to the extent such distributions are made. Therefore, no federal income tax provision is required.
As of and during the period ended April 30, 2018, none of the funds had a liability for any unrecognized tax benefits. Each fund recognizes interest and penalties, if any, related to unrecognized tax benefits as income tax expense in their respective statements of operations. During the period, none of the funds incurred any significant interest or penalties.
Each fund’s tax returns are not subject to examination by federal, state and, if applicable, non-U.S. tax authorities after the expiration of each jurisdiction’s statute of limitations, which is generally three years after the date of filing but can be extended in certain jurisdictions.
Distributions — Distributions paid to shareholders are based on each fund’s net investment income and net realized gains determined on a tax basis, which may differ from net investment income and net realized gains for financial reporting purposes. These differences are due primarily to different treatment for items such as short-term capital gains and losses and capital losses related to sales of certain securities within 30 days of purchase. The fiscal year in which amounts are distributed may differ from the year in which the net investment income and net realized gains are recorded by the funds for financial reporting purposes.
Additional tax basis disclosures for each fund are as follows (dollars in thousands):
| | | Conservative
Portfolio | | | Moderate
Portfolio | | | Enhanced
Portfolio | |
| As of October 31, 2017 | | | | | | | | | | | | |
| Undistributed ordinary income | | $ | 66 | | | $ | 97 | | | $ | 47 | |
| Undistributed long-term capital gains | | | 854 | | | | 1,633 | | | | 1,787 | |
| As of April 30, 2018 | | | | | | | | | | | | |
| Gross unrealized appreciation on investments | | | 10,206 | | | | 21,101 | | | | 25,920 | |
| Gross unrealized depreciation on investments | | | (7,133 | ) | | | (4,939 | ) | | | (282 | ) |
| Net unrealized appreciation on investments | | | 3,073 | | | | 16,162 | | | | 25,638 | |
| Cost of investments | | | 513,439 | | | | 685,001 | | | | 668,619 | |
Distributions paid by each fund were characterized for tax purposes as follows (dollars in thousands):
Conservative Portfolio
| | | Six months ended April 30, 2018 | | | Year ended October 31, 2017 | |
| Share class | | Ordinary
income | | | Long-term
capital gains | | | Total
dividends and
distributions
paid | | | Ordinary
income | | | Long-term
capital gains | | | Total
dividends and
distributions
paid | |
| Class A | | $ | 3,503 | | | $ | 558 | | | $ | 4,061 | | | $ | 4,389 | | | $ | 226 | | | $ | 4,615 | |
| Class B1 | | | | | | | | | | | | | | | 1 | | | | — | 2 | | | 1 | |
| Class C | | | 534 | | | | 121 | | | | 655 | | | | 693 | | | | 53 | | | | 746 | |
| Class T3 | | | — | 2 | | | — | 2 | | | — | 2 | | | — | 2 | | | — | | | | — | 2 |
| Class F-1 | | | 101 | | | | 17 | | | | 118 | | | | 146 | | | | 8 | | | | 154 | |
| Class F-2 | | | 455 | | | | 68 | | | | 523 | | | | 541 | | | | 26 | | | | 567 | |
| Class F-34 | | | 5 | | | | 1 | | | | 6 | | | | 1 | | | | — | | | | 1 | |
| Class R-1 | | | 5 | | | | 1 | | | | 6 | | | | 5 | | | | — | 2 | | | 5 | |
| Class R-2 | | | 5 | | | | 1 | | | | 6 | | | | 9 | | | | 1 | | | | 10 | |
| Class R-2E | | | — | 2 | | | — | 2 | | | — | 2 | | | — | 2 | | | — | 2 | | | — | 2 |
| Class R-3 | | | 15 | | | | 3 | | | | 18 | | | | 23 | | | | 1 | | | | 24 | |
| Class R-4 | | | 416 | | | | 69 | | | | 485 | | | | 184 | | | | — | 2 | | | 184 | |
| Class R-5E | | | 18 | | | | 3 | | | | 21 | | | | 9 | | | | — | 2 | | | 9 | |
| Class R-5 | | | — | 2 | | | — | 2 | | | — | 2 | | | — | 2 | | | — | 2 | | | — | 2 |
| Class R-6 | | | 106 | | | | 14 | | | | 120 | | | | 139 | | | | 8 | | | | 147 | |
| Total | | $ | 5,163 | | | $ | 856 | | | $ | 6,019 | | | $ | 6,140 | | | $ | 323 | | | $ | 6,463 | |
| 14 | American Funds Retirement Income Portfolio Series |
Moderate Portfolio
| | | Six months ended April 30, 2018 | | | Year ended October 31, 2017 | |
| Share class | | Ordinary
income | | | Long-term
capital gains | | | Total
dividends and
distributions
paid | | | Ordinary
income | | | Long-term
capital gains | | | Total
dividends and
distributions
paid | |
| Class A | | $ | 6,499 | | | $ | 1,301 | | | $ | 7,800 | | | $ | 8,183 | | | $ | 660 | | | $ | 8,843 | |
| Class B1 | | | | | | | | | | | | | | | 1 | | | | — | 2 | | | 1 | |
| Class C | | | 670 | | | | 187 | | | | 857 | | | | 876 | | | | 101 | | | | 977 | |
| Class T3 | | | — | 2 | | | — | 2 | | | — | 2 | | | — | 2 | | | — | | | | — | 2 |
| Class F-1 | | | 165 | | | | 33 | | | | 198 | | | | 233 | | | | 18 | | | | 251 | |
| Class F-2 | | | 560 | | | | 105 | | | | 665 | | | | 584 | | | | 35 | | | | 619 | |
| Class F-34 | | | 13 | | | | 2 | | | | 15 | | | | 3 | | | | — | | | | 3 | |
| Class R-1 | | | 1 | | | | — | 2 | | | 1 | | | | 2 | | | | — | 2 | | | 2 | |
| Class R-2 | | | 11 | | | | 3 | | | | 14 | | | | 6 | | | | — | 2 | | | 6 | |
| Class R-2E | | | — | 2 | | | — | 2 | | | — | 2 | | | — | 2 | | | — | 2 | | | — | 2 |
| Class R-3 | | | 6 | | | | 1 | | | | 7 | | | | 4 | | | | — | 2 | | | 4 | |
| Class R-4 | | | 5 | | | | 1 | | | | 6 | | | | 4 | | | | — | 2 | | | 4 | |
| Class R-5E | | | — | 2 | | | — | 2 | | | — | 2 | | | — | 2 | | | — | 2 | | | — | 2 |
| Class R-5 | | | — | 2 | | | — | 2 | | | — | 2 | | | — | 2 | | | — | 2 | | | — | 2 |
| Class R-6 | | | 1 | | | | — | 2 | | | 1 | | | | — | 2 | | | — | 2 | | | — | 2 |
| Total | | $ | 7,931 | | | $ | 1,633 | | | $ | 9,564 | | | $ | 9,896 | | | $ | 814 | | | $ | 10,710 | |
Enhanced Portfolio
| | | Six months ended April 30, 2018 | | | Year ended October 31, 2017 | |
| Share class | | Ordinary
income | | | Long-term
capital gains | | | Total
dividends and
distributions
paid | | | | Ordinary
income | | | Long-term
capital gains | | Total
dividends and
distributions
paid | |
| Class A | | $ | 6,422 | | | $ | 1,321 | | | $ | 7,743 | | | $ | 7,837 | | | $ | 881 | | | $ | 8,718 | |
| Class B1 | | | | | | | | | | | | | | | — | 2 | | | — | 2 | | | — | 2 |
| Class C | | | 628 | | | | 176 | | | | 804 | | | | 813 | | | | 130 | | | | 943 | |
| Class T3 | | | — | 2 | | | — | 2 | | | — | 2 | | | — | 2 | | | — | | | | — | 2 |
| Class F-1 | | | 284 | | | | 59 | | | | 343 | | | | 388 | | | | 51 | | | | 439 | |
| Class F-2 | | | 1,195 | | | | 223 | | | | 1,418 | | | | 1,270 | | | | 122 | | | | 1,392 | |
| Class F-34 | | | 15 | | | | 3 | | | | 18 | | | | 6 | | | | — | | | | 6 | |
| Class R-1 | | | 1 | | | | — | 2 | | | 1 | | | | 1 | | | | — | 2 | | | 1 | |
| Class R-2 | | | 8 | | | | 2 | | | | 10 | | | | 8 | | | | 1 | | | | 9 | |
| Class R-2E | | | — | 2 | | | — | 2 | | | — | 2 | | | — | 2 | | | — | 2 | | | — | 2 |
| Class R-3 | | | 4 | | | | 1 | | | | 5 | | | | 6 | | | | 1 | | | | 7 | |
| Class R-4 | | | 6 | | | | 1 | | | | 7 | | | | 11 | | | | 2 | | | | 13 | |
| Class R-5E | | | — | 2 | | | — | 2 | | | — | 2 | | | — | 2 | | | — | 2 | | | — | 2 |
| Class R-5 | | | — | 2 | | | — | 2 | | | — | 2 | | | — | 2 | | | — | 2 | | | — | 2 |
| Class R-6 | | | 7 | | | | 1 | | | | 8 | | | | 4 | | | | — | 2 | | | 4 | |
| Total | | $ | 8,570 | | | $ | 1,787 | | | $ | 10,357 | | | $ | 10,344 | | | $ | 1,188 | | | $ | 11,532 | |
| 1 | Class B shares were fully liquidated on May 5, 2017. |
| 2 | Amount less than one thousand. |
| 3 | Class T shares began investment operations on April 7, 2017. |
| 4 | Class F-3 shares began investment operations on January 27, 2017. |
| American Funds Retirement Income Portfolio Series | 15 |
6. Fees and transactions with related parties
CRMC, the series’ investment adviser, is the parent company of American Funds Distributors®, Inc. (“AFD”), the principal underwriter of the series’ shares, and American Funds Service Company® (“AFS”), the series’ transfer agent. CRMC, AFD and AFS are considered related parties to the series.
Investment advisory services — The series has an investment advisory and service agreement with CRMC. CRMC receives fees from the underlying funds for investment advisory services. These fees are included in the net effective expense ratios that are provided as supplementary information in the financial highlights tables.
Class-specific fees and expenses — Expenses that are specific to individual share classes are accrued directly to the respective share class. The principal class-specific fees and expenses are further described below:
Distribution services — The series has plans of distribution for all share classes of each fund, except Class F-2, F-3, R-5E, R-5 and R-6 shares. Under the plans, the board of trustees approves certain categories of expenses that are used to finance activities primarily intended to sell fund shares and service existing accounts. The plans provide for payments, based on an annualized percentage of average daily net assets, ranging from 0.30% to 1.00% as noted in this section. In some cases, the board of trustees has limited the amounts that may be paid to less than the maximum allowed by the plans. All share classes with a plan may use up to 0.25% of average daily net assets to pay service fees, or to compensate AFD for paying service fees, to firms that have entered into agreements with AFD to provide certain shareholder services. The remaining amounts available to be paid under each plan are paid to dealers to compensate them for their sales activities.
| Share class | | Currently approved limits | Plan limits |
| Class A | | | 0.30 | % | | | 0.30 | % |
| Classes C and R-1 | | | 1.00 | | | | 1.00 | |
| Class R-2 | | | 0.75 | | | | 1.00 | |
| Class R-2E | | | 0.60 | | | | 0.85 | |
| Class R-3 | | | 0.50 | | | | 0.75 | |
| Classes T, F-1 and R-4 | | | 0.25 | | | | 0.50 | |
For Class A shares, distribution-related expenses include the reimbursement of dealer and wholesaler commissions paid by AFD for certain shares sold without a sales charge. This share class reimburses AFD for amounts billed within the prior 15 months but only to the extent that the overall annual expense limit is not exceeded. As of April 30, 2018, unreimbursed expenses subject to reimbursement for the funds’ Class A shares were as follows (dollars in thousands):
| | Class A | |
| Conservative Portfolio | $ | 55 | |
| Moderate Portfolio | | — | |
| Enhanced Portfolio | | 73 | |
Transfer agent services — The series has a shareholder services agreement with AFS under which the funds compensate AFS for providing transfer agent services to all of the funds’ share classes. These services include recordkeeping, shareholder communications and transaction processing. In addition, the funds reimburse AFS for amounts paid to third parties for performing transfer agent services on behalf of fund shareholders.
Administrative services — The series has an administrative services agreement with CRMC for providing administrative services to all of the funds’ share classes. These services include, but are not limited to, coordinating, monitoring, assisting and overseeing third parties that provide services to fund shareholders. CRMC receives administrative services fees of 0.05% of average daily net assets from the Class R-6 shares of the underlying funds for administrative services provided to the series. These fees are included in the net effective expense ratios that are provided as supplementary information in the financial highlights tables.
| 16 | American Funds Retirement Income Portfolio Series |
Class-specific expenses under the distribution services and transfer agent services agreements for the six months ended April 30, 2018, were as follows:
Conservative Portfolio
| Share class | | | Distribution
services | | | | Transfer agent
services | |
| Class A | | | $469 | | | | $45 | |
| Class C | | | 335 | | | | 10 | |
| Class T | | | — | | | | — | * |
| Class F-1 | | | 12 | | | | 5 | |
| Class F-2 | | | Not applicable | | | | 19 | |
| Class F-3 | | | Not applicable | | | | — | * |
| Class R-1 | | | 3 | | | | — | * |
| Class R-2 | | | 2 | | | | — | * |
| Class R-2E | | | — | | | | — | * |
| Class R-3 | | | 4 | | | | 1 | |
| Class R-4 | | | 46 | | | | 8 | |
| Class R-5E | | | Not applicable | | | | 1 | |
| Class R-5 | | | Not applicable | | | | — | * |
| Class R-6 | | | Not applicable | | | | 1 | |
| Total class-specific expenses | | | $871 | | | | $90 | |
Moderate Portfolio
| Share class | | | Distribution
services | | | | Transfer agent
services | |
| Class A | | | $713 | | | | $73 | |
| Class C | | | 354 | | | | 11 | |
| Class T | | | — | | | | — | * |
| Class F-1 | | | 17 | | | | 7 | |
| Class F-2 | | | Not applicable | | | | 21 | |
| Class F-3 | | | Not applicable | | | | — | * |
| Class R-1 | | | 1 | | | | — | * |
| Class R-2 | | | 4 | | | | 1 | |
| Class R-2E | | | — | | | | — | * |
| Class R-3 | | | 1 | | | | — | * |
| Class R-4 | | | — | * | | | — | * |
| Class R-5E | | | Not applicable | | | | — | * |
| Class R-5 | | | Not applicable | | | | — | * |
| Class R-6 | | | Not applicable | | | | — | * |
| Total class-specific expenses | | | $1,090 | | | | $113 | |
Enhanced Portfolio
| Share class | | | Distribution
services | | | | Transfer agent
services | |
| Class A | | | $707 | | | | $68 | |
| Class C | | | 306 | | | | 9 | |
| Class T | | | — | | | | — | * |
| Class F-1 | | | 26 | | | | 11 | |
| Class F-2 | | | Not applicable | | | | 41 | |
| Class F-3 | | | Not applicable | | | | — | * |
| Class R-1 | | | — | * | | | — | * |
| Class R-2 | | | 3 | | | | 1 | |
| Class R-2E | | | — | | | | — | * |
| Class R-3 | | | 1 | | | | — | * |
| Class R-4 | | | — | * | | | — | * |
| Class R-5E | | | Not applicable | | | | — | * |
| Class R-5 | | | Not applicable | | | | — | * |
| Class R-6 | | | Not applicable | | | | — | * |
| Total class-specific expenses | | | $1,043 | | | | $130 | |
| * | Amount less than one thousand. |
| American Funds Retirement Income Portfolio Series | 17 |
Trustees’ deferred compensation — Trustees who are unaffiliated with CRMC may elect to defer the cash payment of part or all of their compensation. These deferred amounts, which remain as liabilities of the funds, are treated as if invested in one or more of the American Funds. These amounts represent general, unsecured liabilities of the funds and vary according to the total returns of the selected funds.
Affiliated officers and trustees — Officers and certain trustees of the series are or may be considered to be affiliated with CRMC, AFD and AFS. No affiliated officers or trustees received any compensation directly from any of the funds in the series.
7. Investment transactions
The funds made purchases and sales of investment securities during the six months ended April 30, 2018, as follows (dollars in thousands):
| | | Purchases | | | Sales | |
| Conservative Portfolio | | $ | 107,458 | | | $ | 4,145 | |
| Moderate Portfolio | | | 147,596 | | | | 1,985 | |
| Enhanced Portfolio | | | 142,239 | | | | 8,225 | |
| 18 | American Funds Retirement Income Portfolio Series |
8. Capital share transactions
Capital share transactions in the funds were as follows (dollars and shares in thousands):
Conservative Portfolio
| | | Sales1 | | | Reinvestments of
dividends and distributions | | | Repurchases1 | | | Net increase
(decrease) | |
| Share class | | Amount | | | Shares | | | Amount | | | Shares | | | Amount | | | Shares | | | Amount | | | Shares | |
| | | | | | | | | | | | | | | | | | | | | | | | | | | | | | | | | |
| Six months ended April 30, 2018 |
| | | | | | | | | | | | | | | | | | | | | | | | | | | | | | | | | |
| Class A | | $ | 102,367 | | | | 9,318 | | | $ | 4,029 | | | | 369 | | | $ | (36,802 | ) | | | (3,351 | ) | | $ | 69,594 | | | | 6,336 | |
| Class C | | | 20,249 | | | | 1,852 | | | | 649 | | | | 60 | | | | (7,582 | ) | | | (694 | ) | | | 13,316 | | | | 1,218 | |
| Class T | | | — | | | | — | | | | — | | | | — | | | | — | | | | — | | | | — | | | | — | |
| Class F-1 | | | 2,338 | | | | 212 | | | | 118 | | | | 11 | | | | (2,010 | ) | | | (183 | ) | | | 446 | | | | 40 | |
| Class F-2 | | | 13,982 | | | | 1,274 | | | | 517 | | | | 47 | | | | (5,850 | ) | | | (532 | ) | | | 8,649 | | | | 789 | |
| Class F-3 | | | 598 | | | | 55 | | | | 5 | | | | — | 2 | | | (27 | ) | | | (2 | ) | | | 576 | | | | 53 | |
| Class R-1 | | | 243 | | | | 22 | | | | 5 | | | | 1 | | | | — | 2 | | | — | 2 | | | 248 | | | | 23 | |
| Class R-2 | | | 171 | | | | 16 | | | | 7 | | | | 1 | | | | (18 | ) | | | (2 | ) | | | 160 | | | | 15 | |
| Class R-2E | | | — | 2 | | | — | 2 | | | — | | | | — | | | | — | 2 | | | — | 2 | | | — | 2 | | | — | 2 |
| Class R-3 | | | 568 | | | | 52 | | | | 18 | | | | 2 | | | | (532 | ) | | | (49 | ) | | | 54 | | | | 5 | |
| Class R-4 | | | 9,805 | | | | 896 | | | | 486 | | | | 44 | | | | (9,181 | ) | | | (838 | ) | | | 1,110 | | | | 102 | |
| Class R-5E | | | 380 | | | | 34 | | | | 21 | | | | 2 | | | | (240 | ) | | | (22 | ) | | | 161 | | | | 14 | |
| Class R-5 | | | — | | | | — | | | | — | | | | — | | | | — | | | | — | | | | — | | | | — | |
| Class R-6 | | | 4,223 | | | | 384 | | | | 120 | | | | 10 | | | | (341 | ) | | | (31 | ) | | | 4,002 | | | | 363 | |
| Total net increase (decrease) | | $ | 154,924 | | | | 14,115 | | | $ | 5,975 | | | | 547 | | | $ | (62,583 | ) | | | (5,704 | ) | | $ | 98,316 | | | | 8,958 | |
| | | | | | | | | | | | | | | | | | | | | | | | | | | | | | | | | |
| Year ended October 31, 2017 |
| | | | | | | | | | | | | | | | | | | | | | | | | | | | | | | | | |
| Class A | | $ | 157,380 | | | | 14,676 | | | $ | 4,563 | | | | 428 | | | $ | (44,206 | ) | | | (4,145 | ) | | $ | 117,737 | | | | 10,959 | |
| Class B3 | | | 1 | | | | — | 2 | | | 1 | | | | — | 2 | | | (128 | ) | | | (12 | ) | | | (126 | ) | | | (12 | ) |
| Class C | | | 33,615 | | | | 3,153 | | | | 741 | | | | 70 | | | | (10,099 | ) | | | (949 | ) | | | 24,257 | | | | 2,274 | |
| Class T4 | | | 10 | | | | 1 | | | | — | | | | — | | | | — | | | | — | | | | 10 | | | | 1 | |
| Class F-1 | | | 5,990 | | | | 558 | | | | 154 | | | | 15 | | | | (2,381 | ) | | | (223 | ) | | | 3,763 | | | | 350 | |
| Class F-2 | | | 22,394 | | | | 2,092 | | | | 558 | | | | 52 | | | | (6,236 | ) | | | (581 | ) | | | 16,716 | | | | 1,563 | |
| Class F-35 | | | 77 | | | | 7 | | | | — | 2 | | | — | 2 | | | — | | | | — | | | | 77 | | | | 7 | |
| Class R-1 | | | 206 | | | | 20 | | | | 4 | | | | — | | | | (135 | ) | | | (13 | ) | | | 75 | | | | 7 | |
| Class R-2 | | | 159 | | | | 15 | | | | 10 | | | | 1 | | | | (87 | ) | | | (9 | ) | | | 82 | | | | 7 | |
| Class R-2E | | | — | | | | — | | | | — | | | | — | | | | — | | | | — | | | | — | | | | — | |
| Class R-3 | | | 462 | | | | 43 | | | | 24 | | | | 2 | | | | (23 | ) | | | (1 | ) | | | 463 | | | | 44 | |
| Class R-4 | | | 36,234 | | | | 3,343 | | | | 185 | | | | 17 | | | | (1,975 | ) | | | (182 | ) | | | 34,444 | | | | 3,178 | |
| Class R-5E | | | 1,702 | | | | 156 | | | | 9 | | | | 1 | | | | (235 | ) | | | (21 | ) | | | 1,476 | | | | 136 | |
| Class R-5 | | | — | | | | — | | | | — | | | | — | | | | — | | | | — | | | | — | | | | — | |
| Class R-6 | | | 2,867 | | | | 265 | | | | 147 | | | | 14 | | | | (1,303 | ) | | | (123 | ) | | | 1,711 | | | | 156 | |
| Total net increase (decrease) | | $ | 261,097 | | | | 24,329 | | | $ | 6,396 | | | | 600 | | | $ | (66,808 | ) | | | (6,259 | ) | | $ | 200,685 | | | | 18,670 | |
See end of tables for footnotes.
| American Funds Retirement Income Portfolio Series | 19 |
Moderate Portfolio
| | | Sales1 | | | Reinvestments of
dividends and distributions | | | Repurchases1 | | | Net increase
(decrease) | |
| Share class | | Amount | | | Shares | | | Amount | | | Shares | | | Amount | | | Shares | | | Amount | | | Shares | |
| | | | | | | | | | | | | | | | | | | | | | | | | | | | | | | | | |
| Six months ended April 30, 2018 |
| | | | | | | | | | | | | | | | | | | | | | | | | | | | | | | | | |
| Class A | | $ | 145,667 | | | | 12,866 | | | $ | 7,749 | | | | 689 | | | $ | (39,866 | ) | | | (3,529 | ) | | $ | 113,550 | | | | 10,026 | |
| Class C | | | 17,326 | | | | 1,536 | | | | 854 | | | | 76 | | | | (7,472 | ) | | | (664 | ) | | | 10,708 | | | | 948 | |
| Class T | | | — | | | | — | | | | — | | | | — | | | | — | | | | — | | | | — | | | | — | |
| Class F-1 | | | 3,806 | | | | 334 | | | | 199 | | | | 18 | | | | (1,177 | ) | | | (105 | ) | | | 2,828 | | | | 247 | |
| Class F-2 | | | 13,257 | | | | 1,168 | | | | 654 | | | | 58 | | | | (5,687 | ) | | | (502 | ) | | | 8,224 | | | | 724 | |
| Class F-3 | | | 1,250 | | | | 111 | | | | 12 | | | | 1 | | | | (9 | ) | | | (1 | ) | | | 1,253 | | | | 111 | |
| Class R-1 | | | 19 | | | | 2 | | | | 1 | | | | — | 2 | | | (48 | ) | | | (4 | ) | | | (28 | ) | | | (2 | ) |
| Class R-2 | | | 586 | | | | 52 | | | | 13 | | | | 2 | | | | (50 | ) | | | (4 | ) | | | 549 | | | | 50 | |
| Class R-2E | | | — | | | | — | | | | — | | | | — | | | | — | | | | — | | | | — | | | | — | |
| Class R-3 | | | 109 | | | | 9 | | | | 7 | | | | 1 | | | | (1 | ) | | | — | 2 | | | 115 | | | | 10 | |
| Class R-4 | | | 49 | | | | 4 | | | | 5 | | | | — | 2 | | | (3 | ) | | | — | 2 | | | 51 | | | | 4 | |
| Class R-5E | | | — | | | | — | | | | — | | | | — | | | | — | | | | — | | | | — | | | | — | |
| Class R-5 | | | — | 2 | | | — | 2 | | | — | 2 | | | — | 2 | | | — | 2 | | | — | 2 | | | — | 2 | | | — | 2 |
| Class R-6 | | | 205 | | | | 18 | | | | 1 | | | | — | 2 | | | (1 | ) | | | — | 2 | | | 205 | | | | 18 | |
| Total net increase (decrease) | | $ | 182,274 | | | | 16,100 | | | $ | 9,495 | | | | 845 | | | $ | (54,314 | ) | | | (4,809 | ) | | $ | 137,455 | | | | 12,136 | |
| | | | | | | | | | | | | | | | | | | | | | | | | | | | | | | | | |
| Year ended October 31, 2017 |
| | | | | | | | | | | | | | | | | | | | | | | | | | | | | | | | | |
| Class A | | $ | 227,701 | | | | 20,921 | | | $ | 8,766 | | | | 809 | | | $ | (56,371 | ) | | | (5,145 | ) | | $ | 180,096 | | | | 16,585 | |
| Class B3 | | | 6 | | | | 1 | | | | 1 | | | | — | 2 | | | (147 | ) | | | (14 | ) | | | (140 | ) | | | (13 | ) |
| Class C | | | 31,692 | | | | 2,931 | | | | 970 | | | | 90 | | | | (11,089 | ) | | | (1,019 | ) | | | 21,573 | | | | 2,002 | |
| Class T4 | | | 10 | | | | 1 | | | | — | | | | — | | | | — | | | | — | | | | 10 | | | | 1 | |
| Class F-1 | | | 8,953 | | | | 821 | | | | 252 | | | | 23 | | | | (7,657 | ) | | | (704 | ) | | | 1,548 | | | | 140 | |
| Class F-2 | | | 26,232 | | | | 2,395 | | | | 593 | | | | 54 | | | | (4,788 | ) | | | (441 | ) | | | 22,037 | | | | 2,008 | |
| Class F-35 | | | 411 | | | | 37 | | | | 2 | | | | — | 2 | | | (81 | ) | | | (7 | ) | | | 332 | | | | 30 | |
| Class R-1 | | | 100 | | | | 9 | | | | 2 | | | | — | 2 | | | (35 | ) | | | (3 | ) | | | 67 | | | | 6 | |
| Class R-2 | | | 837 | | | | 76 | | | | 6 | | | | — | 2 | | | (51 | ) | | | (5 | ) | | | 792 | | | | 71 | |
| Class R-2E | | | — | | | | — | | | | — | | | | — | | | | — | | | | — | | | | — | | | | — | |
| Class R-3 | | | 469 | | | | 42 | | | | 3 | | | | — | 2 | | | — | 2 | | | — | 2 | | | 472 | | | | 42 | |
| Class R-4 | | | 289 | | | | 27 | | | | 4 | | | | — | 2 | | | (1 | ) | | | — | 2 | | | 292 | | | | 27 | |
| Class R-5E | | | — | | | | — | | | | — | | | | — | | | | — | | | | — | | | | — | | | | — | |
| Class R-5 | | | 2 | | | | — | 2 | | | — | 2 | | | — | 2 | | | — | 2 | | | — | 2 | | | 2 | | | | — | 2 |
| Class R-6 | | | — | 2 | | | — | 2 | | | — | 2 | | | — | 2 | | | — | 2 | | | — | 2 | | | — | 2 | | | — | 2 |
| Total net increase (decrease) | | $ | 296,702 | | | | 27,261 | | | $ | 10,599 | | | | 976 | | | $ | (80,220 | ) | | | (7,338 | ) | | $ | 227,081 | | | | 20,899 | |
| 20 | American Funds Retirement Income Portfolio Series |
Enhanced Portfolio
| | | Sales1 | | | Reinvestments of
dividends and distributions | | | Repurchases1 | | | Net increase
(decrease) | |
| Share class | | Amount | | | Shares | | | Amount | | | Shares | | | Amount | | | Shares | | | Amount | | | Shares | |
| | | | | | | | | | | | | | | | | | | | | | | | | | | | | | | | | |
| Six months ended April 30, 2018 |
| | | | | | | | | | | | | | | | | | | | | | | | | | | | | | | | | |
| Class A | | $ | 120,554 | | | | 10,306 | | | $ | 7,540 | | | | 650 | | | $ | (37,563 | ) | | | (3,212 | ) | | $ | 90,531 | | | | 7,744 | |
| Class C | | | 13,271 | | | | 1,139 | | | | 801 | | | | 69 | | | | (9,980 | ) | | | (857 | ) | | | 4,092 | | | | 351 | |
| Class T | | | — | | | | — | | | | — | | | | — | | | | — | | | | — | | | | — | | | | — | |
| Class F-1 | | | 4,732 | | | | 403 | | | | 342 | | | | 29 | | | | (1,413 | ) | | | (121 | ) | | | 3,661 | | | | 311 | |
| Class F-2 | | | 36,377 | | | | 3,104 | | | | 1,417 | | | | 122 | | | | (13,056 | ) | | | (1,117 | ) | | | 24,738 | | | | 2,109 | |
| Class F-3 | | | 336 | | | | 29 | | | | 19 | | | | 1 | | | | (105 | ) | | | (9 | ) | | | 250 | | | | 21 | |
| Class R-1 | | | 16 | | | | 2 | | | | 1 | | | | — | 2 | | | (9 | ) | | | (1 | ) | | | 8 | | | | 1 | |
| Class R-2 | | | 84 | | | | 7 | | | | 10 | | | | 1 | | | | (10 | ) | | | (1 | ) | | | 84 | | | | 7 | |
| Class R-2E | | | — | | | | — | | | | — | | | | — | | | | — | | | | — | | | | — | | | | — | |
| Class R-3 | | | 87 | | | | 7 | | | | 5 | | | | 1 | | | | (1 | ) | | | — | 2 | | | 91 | | | | 8 | |
| Class R-4 | | | — | 2 | | | — | 2 | | | 7 | | | | — | 2 | | | (1 | ) | | | — | 2 | | | 6 | | | | — | 2 |
| Class R-5E | | | — | | | | — | | | | — | | | | — | | | | — | | | | — | | | | — | | | | — | |
| Class R-5 | | | — | | | | — | | | | — | | | | — | | | | — | | | | — | | | | — | | | | — | |
| Class R-6 | | | 144 | | | | 12 | | | | 7 | | | | 1 | | | | (23 | ) | | | (2 | ) | | | 128 | | | | 11 | |
| Total net increase (decrease) | | $ | 175,601 | | | | 15,009 | | | $ | 10,149 | | | | 874 | | | $ | (62,161 | ) | | | (5,320 | ) | | $ | 123,589 | | | | 10,563 | |
| | | | | | | | | | | | | | | | | | | | | | | | | | | | | | | | | |
| Year ended October 31, 2017 |
| | | | | | | | | | | | | | | | | | | | | | | | | | | | | | | | | |
| Class A | | $ | 216,803 | | | | 19,588 | | | $ | 8,515 | | | | 772 | | | $ | (44,976 | ) | | | (4,045 | ) | | $ | 180,342 | | | | 16,315 | |
| Class B3 | | | 7 | | | | 1 | | | | — | 2 | | | — | 2 | | | (37 | ) | | | (4 | ) | | | (30 | ) | | | (3 | ) |
| Class C | | | 31,359 | | | | 2,850 | | | | 939 | | | | 86 | | | | (8,846 | ) | | | (799 | ) | | | 23,452 | | | | 2,137 | |
| Class T4 | | | 10 | | | | 1 | | | | — | | | | — | | | | — | | | | — | | | | 10 | | | | 1 | |
| Class F-1 | | | 13,483 | | | | 1,235 | | | | 439 | | | | 40 | | | | (12,998 | ) | | | (1,208 | ) | | | 924 | | | | 67 | |
| Class F-2 | | | 45,903 | | | | 4,144 | | | | 1,389 | | | | 125 | | | | (8,239 | ) | | | (741 | ) | | | 39,053 | | | | 3,528 | |
| Class F-35 | | | 861 | | | | 76 | | | | 6 | | | | — | 2 | | | (75 | ) | | | (6 | ) | | | 792 | | | | 70 | |
| Class R-1 | | | 23 | | | | 2 | | | | 1 | | | | — | 2 | | | — | | | | — | | | | 24 | | | | 2 | |
| Class R-2 | | | 423 | | | | 37 | | | | 8 | | | | 2 | | | | (10 | ) | | | (1 | ) | | | 421 | | | | 38 | |
| Class R-2E | | | — | | | | — | | | | — | | | | — | | | | — | | | | — | | | | — | | | | — | |
| Class R-3 | | | 10 | | | | 1 | | | | 7 | | | | — | 2 | | | (35 | ) | | | (3 | ) | | | (18 | ) | | | (2 | ) |
| Class R-4 | | | 209 | | | | 19 | | | | 13 | | | | 1 | | | | (370 | ) | | | (33 | ) | | | (148 | ) | | | (13 | ) |
| Class R-5E | | | — | | | | — | | | | — | | | | — | | | | — | | | | — | | | | — | | | | — | |
| Class R-5 | | | — | | | | — | | | | — | | | | — | | | | — | | | | — | | | | — | | | | — | |
| Class R-6 | | | 471 | | | | 42 | | | | 3 | | | | — | 2 | | | (93 | ) | | | (8 | ) | | | 381 | | | | 34 | |
| Total net increase (decrease) | | $ | 309,562 | | | | 27,996 | | | $ | 11,320 | | | | 1,026 | | | $ | (75,679 | ) | | | (6,848 | ) | | $ | 245,203 | | | | 22,174 | |
| 1 | Includes exchanges between share classes of the fund. |
| 2 | Amount less than one thousand. |
| 3 | Class B shares were fully liquidated on May 5, 2017. |
| 4 | Class T shares began investment operations on April 7, 2017. |
| 5 | Class F-3 shares began investment operations on January 27, 2017. |
| American Funds Retirement Income Portfolio Series | 21 |
Financial highlights
Conservative Portfolio
| | | | | | (Loss) income from
investment operations1 | | | Dividends and distributions | | | | | | | | | | | | Ratio of | | | Ratio of | | | | | | | |
| Period ended | | Net asset
value,
beginning
of period | | | Net
investment
income | | | Net (losses)
gains on
securities
(both
realized and
unrealized) | | | Total from
investment
operations | | | Dividends
(from net
investment
income) | | | Distributions
(from capital
gains) | | | Total
dividends
and
distributions | | | Net asset
value,
end
of period | | | Total
return2,3 | | | Net assets,
end of
period
(in millions) | | | expenses to
average net
assets before
waivers/
reimburse-
ments4 | | | expenses to
average net
assets after
waivers/
reimburse-
ments3,4 | | | Net
effective
expense
ratio3,5 | | | Ratio of
net income
to average
net assets3 | |
| Class A: | | | | | | | | | | | | | | | | | | | | | | | | | | | | | | | | | | | | | | | | | | | | | | | | | | | | | | | | |
| 4/30/186,7 | | $ | 10.99 | | | $ | .13 | | | $ | (.19 | ) | | $ | (.06 | ) | | $ | (.12 | ) | | $ | (.02 | ) | | $ | (.14 | ) | | $ | 10.79 | | | | (.54 | )%8 | | $ | 341 | | | | .39 | %9 | | | .39 | %9 | | | .68 | %9 | | | 2.37 | %9 |
| 10/31/17 | | | 10.43 | | | | .22 | | | | .58 | | | | .80 | | | | (.23 | ) | | | (.01 | ) | | | (.24 | ) | | | 10.99 | | | | 7.83 | | | | 277 | | | | .40 | | | | .36 | | | | .65 | | | | 2.08 | |
| 10/31/16 | | | 10.21 | | | | .21 | | | | .22 | | | | .43 | | | | (.21 | ) | | | — | | | | (.21 | ) | | | 10.43 | | | | 4.23 | | | | 149 | | | | .54 | | | | .38 | | | | .68 | | | | 2.03 | |
| 10/31/156,10 | | | 10.00 | | | | .02 | | | | .19 | | | | .21 | | | | — | | | | — | | | | — | | | | 10.21 | | | | 2.10 | 8 | | | 9 | | | | .14 | 8 | | | .09 | 8 | | | .39 | 8 | | | .17 | 8 |
| Class C: | | | | | | | | | | | | | | | | | | | | | | | | | | | | | | | | | | | | | | | | | | | | | | | | | | | | | | | | |
| 4/30/186,7 | | | 10.94 | | | | .09 | | | | (.17 | ) | | | (.08 | ) | | | (.09 | ) | | | (.02 | ) | | | (.11 | ) | | | 10.75 | | | | (.78 | )8 | | | 72 | | | | 1.09 | 9 | | | 1.09 | 9 | | | 1.38 | 9 | | | 1.68 | 9 |
| 10/31/17 | | | 10.39 | | | | .15 | | | | .57 | | | | .72 | | | | (.16 | ) | | | (.01 | ) | | | (.17 | ) | | | 10.94 | | | | 7.04 | | | | 60 | | | | 1.12 | | | | 1.09 | | | | 1.38 | | | | 1.37 | |
| 10/31/16 | | | 10.20 | | | | .14 | | | | .21 | | | | .35 | | | | (.16 | ) | | | — | | | | (.16 | ) | | | 10.39 | | | | 3.46 | | | | 34 | | | | 1.24 | | | | 1.08 | | | | 1.38 | | | | 1.35 | |
| 10/31/156,10 | | | 10.00 | | | | — | 11 | | | .20 | | | | .20 | | | | — | | | | — | | | | — | | | | 10.20 | | | | 2.00 | 8 | | | 2 | | | | .26 | 8 | | | .21 | 8 | | | .51 | 8 | | | .04 | 8 |
| Class T: | | | | | | | | | | | | | | | | | | | | | | | | | | | | | | | | | | | | | | | | | | | | | | | | | | | | | | | | |
| 4/30/186,7 | | | 10.99 | | | | .15 | | | | (.18 | ) | | | (.03 | ) | | | (.14 | ) | | | (.02 | ) | | | (.16 | ) | | | 10.80 | | | | (.32 | )8,12 | | | — | 13 | | | .09 | 9,12 | | | .09 | 9,12 | | | .38 | 9,12 | | | 2.67 | 9,12 |
| 10/31/176,14 | | | 10.61 | | | | .13 | | | | .37 | | | | .50 | | | | (.12 | ) | | | — | | | | (.12 | ) | | | 10.99 | | | | 4.76 | 8,12 | | | — | 13 | | | .11 | 9,12 | | | .06 | 9,12 | | | .35 | 9,12 | | | 2.09 | 9,12 |
| Class F-1: | | | | | | | | | | | | | | | | | | | | | | | | | | | | | | | | | | | | | | | | | | | | | | | | | | | | | | | | |
| 4/30/186,7 | | | 10.99 | | | | .13 | | | | (.18 | ) | | | (.05 | ) | | | (.12 | ) | | | (.02 | ) | | | (.14 | ) | | | 10.80 | | | | (.48 | )8 | | | 9 | | | | .41 | 9 | | | .41 | 9 | | | .70 | 9 | | | 2.34 | 9 |
| 10/31/17 | | | 10.43 | | | | .22 | | | | .58 | | | | .80 | | | | (.23 | ) | | | (.01 | ) | | | (.24 | ) | | | 10.99 | | | | 7.78 | | | | 9 | | | | .45 | | | | .41 | | | | .70 | | | | 2.03 | |
| 10/31/16 | | | 10.21 | | | | .21 | | | | .22 | | | | .43 | | | | (.21 | ) | | | — | | | | (.21 | ) | | | 10.43 | | | | 4.24 | | | | 5 | | | | .54 | | | | .39 | | | | .69 | | | | 2.05 | |
| 10/31/156,10 | | | 10.00 | | | | .01 | | | | .20 | | | | .21 | | | | — | | | | — | | | | — | | | | 10.21 | | | | 2.10 | 8 | | | — | 13 | | | .18 | 8 | | | .10 | 8 | | | .40 | 8 | | | .11 | 8 |
| Class F-2: | | | | | | | | | | | | | | | | | | | | | | | | | | | | | | | | | | | | | | | | | | | | | | | | | | | | | | | | |
| 4/30/186,7 | | | 11.00 | | | | .14 | | | | (.18 | ) | | | (.04 | ) | | | (.13 | ) | | | (.02 | ) | | | (.15 | ) | | | 10.81 | | | | (.35 | )8 | | | 41 | | | | .16 | 9 | | | .16 | 9 | | | .45 | 9 | | | 2.61 | 9 |
| 10/31/17 | | | 10.44 | | | | .24 | | | | .58 | | | | .82 | | | | (.25 | ) | | | (.01 | ) | | | (.26 | ) | | | 11.00 | | | | 8.02 | | | | 33 | | | | .20 | | | | .17 | | | | .46 | | | | 2.27 | |
| 10/31/16 | | | 10.21 | | | | .22 | | | | .24 | | | | .46 | | | | (.23 | ) | | | — | | | | (.23 | ) | | | 10.44 | | | | 4.53 | | | | 15 | | | | .28 | | | | .15 | | | | .45 | | | | 2.11 | |
| 10/31/156,10 | | | 10.00 | | | | .03 | | | | .18 | | | | .21 | | | | — | | | | — | | | | — | | | | 10.21 | | | | 2.10 | 8 | | | — | 13 | | | .11 | 8 | | | .05 | 8 | | | .35 | 8 | | | .25 | 8 |
| Class F-3: | | | | | | | | | | | | | | | | | | | | | | | | | | | | | | | | | | | | | | | | | | | | | | | | | | | | | | | | |
| 4/30/186,7 | | | 10.99 | | | | .16 | | | | (.19 | ) | | | (.03 | ) | | | (.14 | ) | | | (.02 | ) | | | (.16 | ) | | | 10.80 | | | | (.31 | )8 | | | 1 | | | | .06 | 9 | | | .06 | 9 | | | .35 | 9 | | | 2.89 | 9 |
| 10/31/176,15 | | | 10.49 | | | | .13 | | | | .55 | | | | .68 | | | | (.18 | ) | | | — | | | | (.18 | ) | | | 10.99 | | | | 6.49 | 8 | | | — | 13 | | | .15 | 9 | | | .05 | 9 | | | .34 | 9 | | | 1.58 | 9 |
| Class R-1: | | | | | | | | | | | | | | | | | | | | | | | | | | | | | | | | | | | | | | | | | | | | | | | | | | | | | | | | |
| 4/30/186,7 | | | 10.98 | | | | .09 | | | | (.18 | ) | | | (.09 | ) | | | (.09 | ) | | | (.02 | ) | | | (.11 | ) | | | 10.78 | | | | (.84 | )8 | | | 1 | | | | 1.15 | 9 | | | 1.15 | 9 | | | 1.44 | 9 | | | 1.70 | 9 |
| 10/31/17 | | | 10.42 | | | | .13 | | | | .58 | | | | .71 | | | | (.14 | ) | | | (.01 | ) | | | (.15 | ) | | | 10.98 | | | | 6.96 | | | | — | 13 | | | 1.18 | | | | 1.15 | | | | 1.44 | | | | 1.23 | |
| 10/31/16 | | | 10.21 | | | | .14 | | | | .24 | | | | .38 | | | | (.17 | ) | | | — | | | | (.17 | ) | | | 10.42 | | | | 3.77 | | | | — | 13 | | | 1.21 | | | | 1.08 | | | | 1.38 | | | | 1.38 | |
| 10/31/156,10 | | | 10.00 | | | | .06 | | | | .15 | | | | .21 | | | | — | | | | — | | | | — | | | | 10.21 | | | | 2.10 | 8,12 | | | — | 13 | | | .08 | 8,12 | | | .05 | 8,12 | | | .35 | 8,12 | | | .53 | 8,12 |
| Class R-2: | | | | | | | | | | | | | | | | | | | | | | | | | | | | | | | | | | | | | | | | | | | | | | | | | | | | | | | | |
| 4/30/186,7 | | | 10.98 | | | | .09 | | | | (.18 | ) | | | (.09 | ) | | | (.09 | ) | | | (.02 | ) | | | (.11 | ) | | | 10.78 | | | | (.81 | )8 | | | 1 | | | | .96 | 9 | | | .96 | 9 | | | 1.25 | 9 | | | 1.73 | 9 |
| 10/31/17 | | | 10.42 | | | | .17 | | | | .58 | | | | .75 | | | | (.18 | ) | | | (.01 | ) | | | (.19 | ) | | | 10.98 | | | | 7.27 | | | | 1 | | | | .90 | | | | .87 | | | | 1.16 | | | | 1.59 | |
| 10/31/16 | | | 10.21 | | | | .16 | | | | .24 | | | | .40 | | | | (.19 | ) | | | — | | | | (.19 | ) | | | 10.42 | | | | 3.93 | | | | — | 13 | | | 1.05 | | | | .96 | | | | 1.26 | | | | 1.56 | |
| 10/31/156,10 | | | 10.00 | | | | .05 | | | | .16 | | | | .21 | | | | — | | | | — | | | | — | | | | 10.21 | | | | 2.10 | 8,12 | | | — | 13 | | | .09 | 8,12 | | | .06 | 8,12 | | | .36 | 8,12 | | | .52 | 8,12 |
| Class R-2E: | | | | | | | | | | | | | | | | | | | | | | | | | | | | | | | | | | | | | | | | | | | | | | | | | | | | | | | | |
| 4/30/186,7 | | | 11.01 | | | | .14 | | | | (.18 | ) | | | (.04 | ) | | | (.14 | ) | | | (.02 | ) | | | (.16 | ) | | | 10.81 | | | | (.40 | )8,12 | | | — | 13 | | | .33 | 9,12 | | | .16 | 9,12 | | | .45 | 9,12 | | | 2.61 | 9,12 |
| 10/31/17 | | | 10.44 | | | | .25 | | | | .58 | | | | .83 | | | | (.25 | ) | | | (.01 | ) | | | (.26 | ) | | | 11.01 | | | | 8.09 | 12 | | | — | 13 | | | .38 | 12 | | | .14 | 12 | | | .43 | 12 | | | 2.34 | 12 |
| 10/31/16 | | | 10.21 | | | | .22 | | | | .21 | | | | .43 | | | | (.20 | ) | | | — | | | | (.20 | ) | | | 10.44 | | | | 4.28 | 12 | | | — | 13 | | | .61 | 12 | | | .33 | 12 | | | .63 | 12 | | | 2.16 | 12 |
| 10/31/156,10 | | | 10.00 | | | | .06 | | | | .15 | | | | .21 | | | | — | | | | — | | | | — | | | | 10.21 | | | | 2.10 | 8,12 | | | — | 13 | | | .08 | 8,12 | | | .05 | 8,12 | | | .35 | 8,12 | | | .53 | 8,12 |
| Class R-3: | | | | | | | | | | | | | | | | | | | | | | | | | | | | | | | | | | | | | | | | | | | | | | | | | | | | | | | | |
| 4/30/186,7 | | | 10.99 | | | | .11 | | | | (.18 | ) | | | (.07 | ) | | | (.10 | ) | | | (.02 | ) | | | (.12 | ) | | | 10.80 | | | | (.61 | )8 | | | 1 | | | | .70 | 9 | | | .70 | 9 | | | .99 | 9 | | | 2.05 | 9 |
| 10/31/17 | | | 10.44 | | | | .18 | | | | .58 | | | | .76 | | | | (.20 | ) | | | (.01 | ) | | | (.21 | ) | | | 10.99 | | | | 7.36 | | | | 2 | | | | .73 | | | | .70 | | | | .99 | | | | 1.72 | |
| 10/31/16 | | | 10.21 | | | | .17 | | | | .25 | | | | .42 | | | | (.19 | ) | | | — | | | | (.19 | ) | | | 10.44 | | | | 4.18 | | | | 1 | | | | .76 | | | | .68 | | | | .98 | | | | 1.66 | |
| 10/31/156,10 | | | 10.00 | | | | .06 | | | | .15 | | | | .21 | | | | — | | | | — | | | | — | | | | 10.21 | | | | 2.10 | 8,12 | | | — | 13 | | | .08 | 8,12 | | | .05 | 8,12 | | | .35 | 8,12 | | | .53 | 8,12 |
| Class R-4: | | | | | | | | | | | | | | | | | | | | | | | | | | | | | | | | | | | | | | | | | | | | | | | | | | | | | | | | |
| 4/30/186,7 | | | 10.99 | | | | .13 | | | | (.18 | ) | | | (.05 | ) | | | (.12 | ) | | | (.02 | ) | | | (.14 | ) | | | 10.80 | | | | (.43 | )8 | | | 36 | | | | .35 | 9 | | | .35 | 9 | | | .64 | 9 | | | 2.38 | 9 |
| 10/31/17 | | | 10.44 | | | | .18 | | | | .62 | | | | .80 | | | | (.24 | ) | | | (.01 | ) | | | (.25 | ) | | | 10.99 | | | | 7.77 | | | | 35 | | | | .34 | | | | .28 | | | | .57 | | | | 1.65 | |
| 10/31/16 | | | 10.21 | | | | .23 | | | | .20 | | | | .43 | | | | (.20 | ) | | | — | | | | (.20 | ) | | | 10.44 | | | | 4.30 | | | | — | 13 | | | .48 | | | | .38 | | | | .68 | | | | 2.18 | |
| 10/31/156,10 | | | 10.00 | | | | .06 | | | | .15 | | | | .21 | | | | — | | | | — | | | | — | | | | 10.21 | | | | 2.10 | 8,12 | | | — | 13 | | | .08 | 8,12 | | | .05 | 8,12 | | | .35 | 8,12 | | | .53 | 8,12 |
| 22 | American Funds Retirement Income Portfolio Series |
Conservative Portfolio
| | | | | | (Loss) income from
investment operations1 | | | Dividends and distributions | | | | | | | | | | | | Ratio of | | | Ratio of | | | | | | | |
| Period ended | | Net asset
value,
beginning
of period | | | Net
investment
income | | | Net (losses)
gains on
securities
(both
realized and
unrealized) | | | Total from
investment
operations | | | Dividends
(from net
investment
income) | | | Distributions
(from capital
gains) | | | Total
dividends
and
distributions | | | Net asset
value,
end
of period | | | Total
return2,3 | | | Net assets,
end of
period
(in millions) | | | expenses to
average net
assets before
waivers/
reimburse-
ments4 | | | expenses to
average net
assets after
waivers/
reimburse-
ments3,4 | | | Net
effective
expense
ratio3,5 | | | Ratio of
net income
to average
net assets3 | |
| Class R-5E: | | | | | | | | | | | | | | | | | | | | | | | | | | | | | | | | | | | | | | | | | | | | | | | | | | | | | | | | |
| 4/30/186,7 | | $ | 10.99 | | | $ | .14 | | | $ | (.18 | ) | | $ | (.04 | ) | | $ | (.13 | ) | | $ | (.02 | ) | | $ | (.15 | ) | | $ | 10.80 | | | | (.38 | )%8 | | $ | 2 | | | | .21 | %9 | | | .21 | %9 | | | .50 | %9 | | | 2.53 | %9 |
| 10/31/17 | | | 10.43 | | | | .22 | | | | .60 | | | | .82 | | | | (.25 | ) | | | (.01 | ) | | | (.26 | ) | | | 10.99 | | | | 8.02 | | | | 2 | | | | .21 | | | | .13 | | | | .42 | | | | 2.00 | |
| 10/31/166,16 | | | 10.17 | | | | .23 | | | | .24 | | | | .47 | | | | (.21 | ) | | | — | | | | (.21 | ) | | | 10.43 | | | | 4.72 | 8 | | | — | 13 | | | .50 | 9 | | | .26 | 9 | | | .56 | 9 | | | 2.32 | 9 |
| Class R-5: | | | | | | | | | | | | | | | | | | | | | | | | | | | | | | | | | | | | | | | | | | | | | | | | | | | | | | | | |
| 4/30/186,7 | | | 11.01 | | | | .15 | | | | (.19 | ) | | | (.04 | ) | | | (.14 | ) | | | (.02 | ) | | | (.16 | ) | | | 10.81 | | | | (.41 | )8 | | | — | 13 | | | .34 | 9 | | | .08 | 9 | | | .37 | 9 | | | 2.69 | 9 |
| 10/31/17 | | | 10.44 | | | | .24 | | | | .58 | | | | .82 | | | | (.24 | ) | | | (.01 | ) | | | (.25 | ) | | | 11.01 | | | | 8.05 | | | | — | 13 | | | .44 | | | | .20 | | | | .49 | | | | 2.28 | |
| 10/31/16 | | | 10.21 | | | | .22 | | | | .21 | | | | .43 | | | | (.20 | ) | | | — | | | | (.20 | ) | | | 10.44 | | | | 4.27 | | | | — | 13 | | | .58 | | | | .34 | | | | .64 | | | | 2.15 | |
| 10/31/156,10 | | | 10.00 | | | | .06 | | | | .15 | | | | .21 | | | | — | | | | — | | | | — | | | | 10.21 | | | | 2.10 | 8 | | | — | 13 | | | .08 | 8 | | | .04 | 8 | | | .34 | 8 | | | .53 | 8 |
| Class R-6: | | | | | | | | | | | | | | | | | | | | | | | | | | | | | | | | | | | | | | | | | | | | | | | | | | | | | | | | |
| 4/30/186,7 | | | 11.00 | | | | .14 | | | | (.17 | ) | | | (.03 | ) | | | (.14 | ) | | | (.02 | ) | | | (.16 | ) | | | 10.81 | | | | (.31 | )8 | | | 11 | | | | .07 | 9 | | | .07 | 9 | | | .36 | 9 | | | 2.63 | 9 |
| 10/31/17 | | | 10.44 | | | | .25 | | | | .58 | | | | .83 | | | | (.26 | ) | | | (.01 | ) | | | (.27 | ) | | | 11.00 | | | | 8.11 | | | | 8 | | | | .10 | | | | .07 | | | | .36 | | | | 2.38 | |
| 10/31/16 | | | 10.21 | | | | .25 | | | | .20 | | | | .45 | | | | (.22 | ) | | | — | | | | (.22 | ) | | | 10.44 | | | | 4.43 | | | | 6 | | | | .14 | | | | .06 | | | | .36 | | | | 2.40 | |
| 10/31/156,10 | | | 10.00 | | | | .06 | | | | .15 | | | | .21 | | | | — | | | | — | | | | — | | | | 10.21 | | | | 2.10 | 8 | | | — | 13 | | | .07 | 8 | | | .04 | 8 | | | .34 | 8 | | | .53 | 8 |
See end of tables for footnotes.
| American Funds Retirement Income Portfolio Series | 23 |
Financial highlights (continued)
Moderate Portfolio
| | | | | | Income (loss) from
investment operations1 | | | Dividends and distributions | | | | | | | | | | | | Ratio of | | | Ratio of | | | | | | | |
| Period ended | | Net asset
value,
beginning
of period | | | Net
investment
income | | | Net (losses)
gains on
securities
(both
realized and
unrealized) | | | Total from
investment
operations | | | Dividends
(from net
investment
income) | | | Distributions
(from capital
gains) | | | Total
dividends
and
distributions | | | Net asset
value,
end
of period | | | Total
return2,3 | | | Net assets,
end of
period
(in millions) | | | expenses to
average net
assets before
waivers/
reimburse-
ments4 | | | expenses to
average net
assets after
waivers/
reimburse-
ments3,4 | | | Net
effective
expense
ratio3,5 | | | Ratio of
net income
to average
net assets3 | |
| Class A: | | | | | | | | | | | | | | | | | | | | | | | | | | | | | | | | | | | | | | | | | | | | | | | | | | | | | | | | |
| 4/30/186,7 | | $ | 11.28 | | | $ | .14 | | | $ | (.13 | ) | | $ | .01 | | | $ | (.14 | ) | | $ | (.03 | ) | | $ | (.17 | ) | | $ | 11.12 | | | | .10 | %8 | | $ | 563 | | | | .36 | %9 | | | .36 | %9 | | | .66 | %9 | | | 2.55 | %9 |
| 10/31/17 | | | 10.48 | | | | .25 | | | | .82 | | | | 1.07 | | | | (.25 | ) | | | (.02 | ) | | | (.27 | ) | | | 11.28 | | | | 10.40 | | | | 458 | | | | .40 | | | | .39 | | | | .69 | | | | 2.28 | |
| 10/31/16 | | | 10.26 | | | | .24 | | | | .22 | | | | .46 | | | | (.24 | ) | | | — | | | | (.24 | ) | | | 10.48 | | | | 4.50 | | | | 251 | | | | .47 | | | | .38 | | | | .69 | | | | 2.31 | |
| 10/31/156,10 | | | 10.00 | | | | .01 | | | | .25 | | | | .26 | | | | — | | | | — | | | | — | | | | 10.26 | | | | 2.60 | 8 | | | 15 | | | | .13 | 8 | | | .09 | 8 | | | .40 | 8 | | | .08 | 8 |
| Class C: | | | | | | | | | | | | | | | | | | | | | | | | | | | | | | | | | | | | | | | | | | | | | | | | | | | | | | | | |
| 4/30/186,7 | | | 11.24 | | | | .10 | | | | (.13 | ) | | | (.03 | ) | | | (.11 | ) | | | (.03 | ) | | | (.14 | ) | | | 11.07 | | | | (.32 | )8 | | | 75 | | | | 1.08 | 9 | | | 1.08 | 9 | | | 1.38 | 9 | | | 1.85 | 9 |
| 10/31/17 | | | 10.44 | | | | .17 | | | | .83 | | | | 1.00 | | | | (.18 | ) | | | (.02 | ) | | | (.20 | ) | | | 11.24 | | | | 9.72 | | | | 65 | | | | 1.10 | | | | 1.09 | | | | 1.39 | | | | 1.57 | |
| 10/31/16 | | | 10.25 | | | | .17 | | | | .21 | | | | .38 | | | | (.19 | ) | | | — | | | | (.19 | ) | | | 10.44 | | | | 3.74 | | | | 39 | | | | 1.17 | | | | 1.08 | | | | 1.39 | | | | 1.62 | |
| 10/31/156,10 | | | 10.00 | | | | — | 11 | | | .25 | | | | .25 | | | | — | | | | — | | | | — | | | | 10.25 | | | | 2.50 | 8 | | | 1 | | | | .24 | 8 | | | .20 | 8 | | | .51 | 8 | | | — | 8,17 |
| Class T: | | | | | | | | | | | | | | | | | | | | | | | | | | | | | | | | | | | | | | | | | | | | | | | | | | | | | | | | |
| 4/30/186,7 | | | 11.28 | | | | .16 | | | | (.13 | ) | | | .03 | | | | (.16 | ) | | | (.03 | ) | | | (.19 | ) | | | 11.12 | | | | .23 | 8,12 | | | — | 13 | | | .09 | 9,12 | | | .09 | 9,12 | | | .39 | 9,12 | | | 2.85 | 9,12 |
| 10/31/176,14 | | | 10.79 | | | | .14 | | | | .48 | | | | .62 | | | | (.13 | ) | | | — | | | | (.13 | ) | | | 11.28 | | | | 5.80 | 8,12 | | | — | 13 | | | .09 | 9,12 | | | .08 | 9,12 | | | .38 | 9,12 | | | 2.20 | 9,12 |
| Class F-1: | | | | | | | | | | | | | | | | | | | | | | | | | | | | | | | | | | | | | | | | | | | | | | | | | | | | | | | | |
| 4/30/186,7 | | | 11.28 | | | | .14 | | | | (.13 | ) | | | .01 | | | | (.14 | ) | | | (.03 | ) | | | (.17 | ) | | | 11.12 | | | | .08 | 8 | | | 14 | | | | .40 | 9 | | | .40 | 9 | | | .70 | 9 | | | 2.50 | 9 |
| 10/31/17 | | | 10.47 | | | | .25 | | | | .83 | | | | 1.08 | | | | (.25 | ) | | | (.02 | ) | | | (.27 | ) | | | 11.28 | | | | 10.46 | | | | 12 | | | | .42 | | | | .41 | | | | .71 | | | | 2.26 | |
| 10/31/16 | | | 10.27 | | | | .25 | | | | .19 | | | | .44 | | | | (.24 | ) | | | — | | | | (.24 | ) | | | 10.47 | | | | 4.32 | | | | 9 | | | | .48 | | | | .39 | | | | .70 | | | | 2.37 | |
| 10/31/156,10 | | | 10.00 | | | | .05 | | | | .22 | | | | .27 | | | | — | | | | — | | | | — | | | | 10.27 | | | | 2.70 | 8 | | | — | 13 | | | .12 | 8 | | | .08 | 8 | | | .39 | 8 | | | .46 | 8 |
| Class F-2: | | | | | | | | | | | | | | | | | | | | | | | | | | | | | | | | | | | | | | | | | | | | | | | | | | | | | | | | |
| 4/30/186,7 | | | 11.29 | | | | .15 | | | | (.12 | ) | | | .03 | | | | (.15 | ) | | | (.03 | ) | | | (.18 | ) | | | 11.14 | | | | .29 | 8 | | | 45 | | | | .15 | 9 | | | .15 | 9 | | | .45 | 9 | | | 2.75 | 9 |
| 10/31/17 | | | 10.49 | | | | .27 | | | | .82 | | | | 1.09 | | | | (.27 | ) | | | (.02 | ) | | | (.29 | ) | | | 11.29 | | | | 10.62 | | | | 38 | | | | .17 | | | | .16 | | | | .46 | | | | 2.44 | |
| 10/31/16 | | | 10.27 | | | | .26 | | | | .21 | | | | .47 | | | | (.25 | ) | | | — | | | | (.25 | ) | | | 10.49 | | | | 4.68 | | | | 14 | | | | .24 | | | | .15 | | | | .46 | | | | 2.44 | |
| 10/31/156,10 | | | 10.00 | | | | .01 | | | | .26 | | | | .27 | | | | — | | | | — | | | | — | | | | 10.27 | | | | 2.70 | 8 | | | 1 | | | | .09 | 8 | | | .04 | 8 | | | .35 | 8 | | | .07 | 8 |
| Class F-3: | | | | | | | | | | | | | | | | | | | | | | | | | | | | | | | | | | | | | | | | | | | | | | | | | | | | | | | | |
| 4/30/186,7 | | | 11.28 | | | | .16 | | | | (.13 | ) | | | .03 | | | | (.16 | ) | | | (.03 | ) | | | (.19 | ) | | | 11.12 | | | | .24 | 8 | | | 2 | | | | .06 | 9 | | | .06 | 9 | | | .36 | 9 | | | 2.94 | 9 |
| 10/31/176,15 | | | 10.65 | | | | .20 | | | | .62 | | | | .82 | | | | (.19 | ) | | | — | | | | (.19 | ) | | | 11.28 | | | | 7.80 | 8 | | | — | 13 | | | .09 | 9 | | | .06 | 9 | | | .36 | 9 | | | 2.37 | 9 |
| Class R-1: | | | | | | | | | | | | | | | | | | | | | | | | | | | | | | | | | | | | | | | | | | | | | | | | | | | | | | | | |
| 4/30/186,7 | | | 11.27 | | | | .10 | | | | (.12 | ) | | | (.02 | ) | | | (.10 | ) | | | (.03 | ) | | | (.13 | ) | | | 11.12 | | | | (.21 | )8,12 | | | — | 13 | | | 1.07 | 9,12 | | | 1.07 | 9,12 | | | 1.37 | 9,12 | | | 1.74 | 9,12 |
| 10/31/17 | | | 10.47 | | | | .18 | | | | .82 | | | | 1.00 | | | | (.18 | ) | | | (.02 | ) | | | (.20 | ) | | | 11.27 | | | | 9.69 | 12 | | | — | 13 | | | 1.08 | 12 | | | 1.07 | 12 | | | 1.37 | 12 | | | 1.64 | 12 |
| 10/31/16 | | | 10.27 | | | | .18 | | | | .20 | | | | .38 | | | | (.18 | ) | | | — | | | | (.18 | ) | | | 10.47 | | | | 3.77 | 12 | | | — | 13 | | | 1.08 | 12 | | | .95 | 12 | | | 1.26 | 12 | | | 1.72 | 12 |
| 10/31/156,10 | | | 10.00 | | | | .05 | | | | .22 | | | | .27 | | | | — | | | | — | | | | — | | | | 10.27 | | | | 2.70 | 8,12 | | | — | 13 | | | .14 | 8,12 | | | .09 | 8,12 | | | .40 | 8,12 | | | .45 | 8,12 |
| Class R-2: | | | | | | | | | | | | | | | | | | | | | | | | | | | | | | | | | | | | | | | | | | | | | | | | | | | | | | | | |
| 4/30/186,7 | | | 11.26 | | | | .11 | | | | (.12 | ) | | | (.01 | ) | | | (.12 | ) | | | (.03 | ) | | | (.15 | ) | | | 11.10 | | | | (.12 | )8 | | | 1 | | | | .97 | 9 | | | .97 | 9 | | | 1.27 | 9 | | | 1.88 | 9 |
| 10/31/17 | | | 10.48 | | | | .22 | | | | .80 | | | | 1.02 | | | | (.22 | ) | | | (.02 | ) | | | (.24 | ) | | | 11.26 | | | | 9.91 | | | | 1 | | | | .88 | | | | .87 | | | | 1.17 | | | | 1.97 | |
| 10/31/16 | | | 10.26 | | | | .21 | | | | .24 | | | | .45 | | | | (.23 | ) | | | — | | | | (.23 | ) | | | 10.48 | | | | 4.43 | 12 | | | — | 13 | | | .75 | 12 | | | .64 | 12 | | | .95 | 12 | | | 2.00 | 12 |
| 10/31/156,10 | | | 10.00 | | | | .06 | | | | .20 | | | | .26 | | | | — | | | | — | | | | — | | | | 10.26 | | | | 2.60 | 8,12 | | | — | 13 | | | .09 | 8,12 | | | .06 | 8,12 | | | .37 | 8,12 | | | .59 | 8,12 |
| Class R-2E: | | | | | | | | | | | | | | | | | | | | | | | | | | | | | | | | | | | | | | | | | | | | | | | | | | | | | | | | |
| 4/30/186,7 | | | 11.30 | | | | .16 | | | | (.13 | ) | | | .03 | | | | (.16 | ) | | | (.03 | ) | | | (.19 | ) | | | 11.14 | | | | .24 | 8,12 | | | — | 13 | | | .33 | 9,12 | | | .15 | 9,12 | | | .45 | 9,12 | | | 2.78 | 9,12 |
| 10/31/17 | | | 10.49 | | | | .28 | | | | .82 | | | | 1.10 | | | | (.27 | ) | | | (.02 | ) | | | (.29 | ) | | | 11.30 | | | | 10.68 | 12 | | | — | 13 | | | .36 | 12 | | | .15 | 12 | | | .45 | 12 | | | 2.54 | 12 |
| 10/31/16 | | | 10.27 | | | | .25 | | | | .20 | | | | .45 | | | | (.23 | ) | | | — | | | | (.23 | ) | | | 10.49 | | | | 4.45 | 12 | | | — | 13 | | | .50 | 12 | | | .32 | 12 | | | .63 | 12 | | | 2.42 | 12 |
| 10/31/156,10 | | | 10.00 | | | | .06 | | | | .21 | | | | .27 | | | | — | | | | — | | | | — | | | | 10.27 | | | | 2.70 | 8,12 | | | — | 13 | | | .07 | 8,12 | | | .05 | 8,12 | | | .36 | 8,12 | | | .61 | 8,12 |
| Class R-3: | | | | | | | | | | | | | | | | | | | | | | | | | | | | | | | | | | | | | | | | | | | | | | | | | | | | | | | | |
| 4/30/186,7 | | | 11.27 | | | | .12 | | | | (.12 | ) | | | — | | | | (.13 | ) | | | (.03 | ) | | | (.16 | ) | | | 11.11 | | | | (.04 | )8 | | | 1 | | | | .68 | 9 | | | .68 | 9 | | | .98 | 9 | | | 2.18 | 9 |
| 10/31/17 | | | 10.49 | | | | .21 | | | | .85 | | | | 1.06 | | | | (.26 | ) | | | (.02 | ) | | | (.28 | ) | | | 11.27 | | | | 10.29 | | | | — | 13 | | | .67 | | | | .65 | | | | .95 | | | | 1.91 | |
| 10/31/16 | | | 10.27 | | | | .26 | | | | .20 | | | | .46 | | | | (.24 | ) | | | — | | | | (.24 | ) | | | 10.49 | | | | 4.52 | 12 | | | — | 13 | | | .39 | 12 | | | .25 | 12 | | | .56 | 12 | | | 2.49 | 12 |
| 10/31/156,10 | | | 10.00 | | | | .06 | | | | .21 | | | | .27 | | | | — | | | | — | | | | — | | | | 10.27 | | | | 2.70 | 8,12 | | | — | 13 | | | .07 | 8,12 | | | .04 | 8,12 | | | .35 | 8,12 | | | .61 | 8,12 |
| Class R-4: | | | | | | | | | | | | | | | | | | | | | | | | | | | | | | | | | | | | | | | | | | | | | | | | | | | | | | | | |
| 4/30/186,7 | | | 11.29 | | | | .14 | | | | (.12 | ) | | | .02 | | | | (.15 | ) | | | (.03 | ) | | | (.18 | ) | | | 11.13 | | | | .13 | 8 | | | — | 13 | | | .34 | 9 | | | .34 | 9 | | | .64 | 9 | | | 2.57 | 9 |
| 10/31/17 | | | 10.48 | | | | .25 | | | | .84 | | | | 1.09 | | | | (.26 | ) | | | (.02 | ) | | | (.28 | ) | | | 11.29 | | | | 10.60 | | | | — | 13 | | | .33 | | | | .31 | | | | .61 | | | | 2.27 | |
| 10/31/16 | | | 10.27 | | | | .22 | | | | .22 | | | | .44 | | | | (.23 | ) | | | — | | | | (.23 | ) | | | 10.48 | | | | 4.35 | 12 | | | — | 13 | | | .49 | 12 | | | .38 | 12 | | | .69 | 12 | | | 2.17 | 12 |
| 10/31/156,10 | | | 10.00 | | | | .06 | | | | .21 | | | | .27 | | | | — | | | | — | | | | — | | | | 10.27 | | | | 2.70 | 8,12 | | | — | 13 | | | .07 | 8,12 | | | .04 | 8,12 | | | .35 | 8,12 | | | .61 | 8,12 |
| 24 | American Funds Retirement Income Portfolio Series |
Moderate Portfolio
| | | | | | Income (loss) from
investment operations1 | | | Dividends and distributions | | | | | | | | | | | | Ratio of | | | Ratio of | | | | | | | |
| Period ended | | Net asset
value,
beginning
of period | | | Net
investment
income | | | Net (losses)
gains on
securities
(both
realized and
unrealized) | | | Total from
investment
operations | | | Dividends
(from net
investment
income) | | | Distributions
(from capital
gains) | | | Total
dividends
and
distributions | | | Net asset
value,
end
of period | | | Total
return2,3 | | | Net assets,
end of
period
(in millions) | | | expenses to
average net
assets before
waivers/
reimburse-
ments4 | | | expenses to
average net
assets after
waivers/
reimburse-
ments3,4 | | | Net
effective
expense
ratio3,5 | | | Ratio of
net income
to average
net assets3 | |
| Class R-5E: | | | | | | | | | | | | | | | | | | | | | | | | | | | | | | | | | | | | | | | | | | | | | | | | | | | | | | | | |
| 4/30/186,7 | | $ | 11.29 | | | $ | .16 | | | $ | (.14 | ) | | $ | .02 | | | $ | (.15 | ) | | $ | (.03 | ) | | $ | (.18 | ) | | $ | 11.13 | | | | .20 | %8 | | $ | — | 13 | | | .20 | %9 | | | .16 | %9 | | | .46 | %9 | | | 2.78 | %9 |
| 10/31/17 | | | 10.48 | | | | .28 | | | | .82 | | | | 1.10 | | | | (.27 | ) | | | (.02 | ) | | | (.29 | ) | | | 11.29 | | | | 10.73 | | | | — | 13 | | | .28 | | | | .14 | | | | .44 | | | | 2.54 | |
| 10/31/166,16 | | | 10.23 | | | | .25 | | | | .24 | | | | .49 | | | | (.24 | ) | | | — | | | | (.24 | ) | | | 10.48 | | | | 4.88 | 8 | | | — | 13 | | | .40 | 9 | | | .26 | 9 | | | .57 | 9 | | | 2.61 | 9 |
| Class R-5: | | | | | | | | | | | | | | | | | | | | | | | | | | | | | | | | | | | | | | | | | | | | | | | | | | | | | | | | |
| 4/30/186,7 | | | 11.30 | | | | .16 | | | | (.13 | ) | | | .03 | | | | (.16 | ) | | | (.03 | ) | | | (.19 | ) | | | 11.14 | | | | .22 | 8 | | | — | 13 | | | .34 | 9 | | | .11 | 9 | | | .41 | 9 | | | 2.82 | 9 |
| 10/31/17 | | | 10.49 | | | | .27 | | | | .82 | | | | 1.09 | | | | (.26 | ) | | | (.02 | ) | | | (.28 | ) | | | 11.30 | | | | 10.62 | | | | — | 13 | | | .41 | | | | .21 | | | | .51 | | | | 2.47 | |
| 10/31/16 | | | 10.27 | | | | .25 | | | | .20 | | | | .45 | | | | (.23 | ) | | | — | | | | (.23 | ) | | | 10.49 | | | | 4.44 | | | | — | 13 | | | .48 | | | | .34 | | | | .65 | | | | 2.40 | |
| 10/31/156,10 | | | 10.00 | | | | .06 | | | | .21 | | | | .27 | | | | — | | | | — | | | | — | | | | 10.27 | | | | 2.70 | 8 | | | — | 13 | | | .07 | 8 | | | .04 | 8 | | | .35 | 8 | | | .61 | 8 |
| Class R-6: | | | | | | | | | | | | | | | | | | | | | | | | | | | | | | | | | | | | | | | | | | | | | | | | | | | | | | | | |
| 4/30/186,7 | | | 11.30 | | | | .18 | | | | (.15 | ) | | | .03 | | | | (.16 | ) | | | (.03 | ) | | | (.19 | ) | | | 11.14 | | | | .24 | 8 | | | — | 13 | | | .05 | 9 | | | .05 | 9 | | | .35 | 9 | | | 3.24 | 9 |
| 10/31/17 | | | 10.49 | | | | .28 | | | | .83 | | | | 1.11 | | | | (.28 | ) | | | (.02 | ) | | | (.30 | ) | | | 11.30 | | | | 10.82 | | | | — | 13 | | | .08 | | | | .07 | | | | .37 | | | | 2.61 | |
| 10/31/16 | | | 10.27 | | | | .26 | | | | .20 | | | | .46 | | | | (.24 | ) | | | — | | | | (.24 | ) | | | 10.49 | | | | 4.54 | | | | — | 13 | | | .34 | | | | .21 | | | | .52 | | | | 2.53 | |
| 10/31/156,10 | | | 10.00 | | | | .06 | | | | .21 | | | | .27 | | | | — | | | | — | | | | — | | | | 10.27 | | | | 2.70 | 8 | | | — | 13 | | | .07 | 8 | | | .04 | 8 | | | .35 | 8 | | | .61 | 8 |
See end of tables for footnotes.
| American Funds Retirement Income Portfolio Series | 25 |
Financial highlights (continued)
Enhanced Portfolio
| | | | | | Income (loss) from
investment operations1 | | | Dividends and distributions | | | | | | | | | | | | Ratio of | | | Ratio of | | | | | | | |
| Period ended | | Net asset
value,
beginning
of period | | | Net
investment
income
(loss) | | | Net (losses)
gains on
securities
(both
realized and
unrealized) | | | Total from
investment
operations | | | Dividends
(from net
investment
income) | | | Distributions
(from capital
gains) | | | Total
dividends
and
distributions | | | Net asset
value,
end
of period | | | Total
return2,3 | | | Net assets,
end of
period
(in millions) | | | expenses to
average net
assets before
waivers/
reimburse-
ments4 | | | expenses to
average net
assets after
waivers/
reimburse-
ments3,4 | | | Net
effective
expense
ratio3,5 | | | Ratio of
net income
(loss)
to average
net assets3 | |
| Class A: | | | | | | | | | | | | | | | | | | | | | | | | | | | | | | | | | | | | | | | | | | | | | | | | | | | | | | | | |
| 4/30/186,7 | | $ | 11.59 | | | $ | .16 | | | $ | (.07 | ) | | $ | .09 | | | $ | (.16 | ) | | $ | (.03 | ) | | $ | (.19 | ) | | $ | 11.49 | | | | .78 | %8 | | $ | 511 | | | | .38 | %9 | | | .38 | %9 | | | .69 | %9 | | | 2.69 | %9 |
| 10/31/17 | | | 10.54 | | | | .27 | | | | 1.09 | | | | 1.36 | | | | (.27 | ) | | | (.04 | ) | | | (.31 | ) | | | 11.59 | | | | 13.07 | | | | 426 | | | | .40 | | | | .39 | | | | .71 | | | | 2.43 | |
| 10/31/16 | | | 10.33 | | | | .27 | | | | .19 | | | | .46 | | | | (.25 | ) | | | — | | | | (.25 | ) | | | 10.54 | | | | 4.55 | | | | 215 | | | | .48 | | | | .38 | | | | .70 | | | | 2.54 | |
| 10/31/156,10 | | | 10.00 | | | | — | 11 | | | .33 | | | | .33 | | | | — | | | | — | | | | — | | | | 10.33 | | | | 3.30 | 8 | | | 19 | | | | .11 | 8 | | | .09 | 8 | | | .42 | 8 | | | — | 8,17 |
| Class C: | | | | | | | | | | | | | | | | | | | | | | | | | | | | | | | | | | | | | | | | | | | | | | | | | | | | | | | | |
| 4/30/186,7 | | | 11.55 | | | | .12 | | | | (.07 | ) | | | .05 | | | | (.12 | ) | | | (.03 | ) | | | (.15 | ) | | | 11.45 | | | | .45 | 8 | | | 63 | | | | 1.08 | 9 | | | 1.08 | 9 | | | 1.39 | 9 | | | 2.00 | 9 |
| 10/31/17 | | | 10.51 | | | | .19 | | | | 1.09 | | | | 1.28 | | | | (.20 | ) | | | (.04 | ) | | | (.24 | ) | | | 11.55 | | | | 12.28 | | | | 59 | | | | 1.10 | | | | 1.09 | | | | 1.41 | | | | 1.73 | |
| 10/31/16 | | | 10.32 | | | | .20 | | | | .19 | | | | .39 | | | | (.20 | ) | | | — | | | | (.20 | ) | | | 10.51 | | | | 3.83 | | | | 31 | | | | 1.19 | | | | 1.09 | | | | 1.41 | | | | 1.89 | |
| 10/31/156,10 | | | 10.00 | | | | (.01 | ) | | | .33 | | | | .32 | | | | — | | | | — | | | | — | | | | 10.32 | | | | 3.20 | 8 | | | 3 | | | | .23 | 8 | | | .20 | 8 | | | .53 | 8 | | | (.08 | )8 |
| Class T: | | | | | | | | | | | | | | | | | | | | | | | | | | | | | | | | | | | | | | | | | | | | | | | | | | | | | | | | |
| 4/30/186,7 | | | 11.59 | | | | .17 | | | | (.07 | ) | | | .10 | | | | (.17 | ) | | | (.03 | ) | | | (.20 | ) | | | 11.49 | | | | .92 | 8,12 | | | — | 13 | | | .08 | 9,12 | | | .08 | 9,12 | | | .39 | 9,12 | | | 3.01 | 9,12 |
| 10/31/176,14 | | | 10.98 | | | | .15 | | | | .60 | | | | .75 | | | | (.14 | ) | | | — | | | | (.14 | ) | | | 11.59 | | | | 6.90 | 8,12 | | | — | 13 | | | .09 | 9,12 | | | .08 | 9,12 | | | .40 | 9,12 | | | 2.30 | 9,12 |
| Class F-1: | | | | | | | | | | | | | | | | | | | | | | | | | | | | | | | | | | | | | | | | | | | | | | | | | | | | | | | | |
| 4/30/186,7 | | | 11.59 | | | | .15 | | | | (.06 | ) | | | .09 | | | | (.16 | ) | | | (.03 | ) | | | (.19 | ) | | | 11.49 | | | | .77 | 8 | | | 23 | | | | .40 | 9 | | | .40 | 9 | | | .71 | 9 | | | 2.67 | 9 |
| 10/31/17 | | | 10.54 | | | | .26 | | | | 1.09 | | | | 1.35 | | | | (.26 | ) | | | (.04 | ) | | | (.30 | ) | | | 11.59 | | | | 13.01 | | | | 19 | | | | .43 | | | | .42 | | | | .74 | | | | 2.37 | |
| 10/31/16 | | | 10.33 | | | | .25 | | | | .21 | | | | .46 | | | | (.25 | ) | | | — | | | | (.25 | ) | | | 10.54 | | | | 4.55 | | | | 17 | | | | .48 | | | | .39 | | | | .71 | | | | 2.34 | |
| 10/31/156,10 | | | 10.00 | | | | .03 | | | | .30 | | | | .33 | | | | — | | | | — | | | | — | | | | 10.33 | | | | 3.30 | 8 | | | 1 | | | | .10 | 8 | | | .08 | 8 | | | .41 | 8 | | | .26 | 8 |
| Class F-2: | | | | | | | | | | | | | | | | | | | | | | | | | | | | | | | | | | | | | | | | | | | | | | | | | | | | | | | | |
| 4/30/186,7 | | | 11.60 | | | | .17 | | | | (.06 | ) | | | .11 | | | | (.17 | ) | | | (.03 | ) | | | (.20 | ) | | | 11.51 | | | | .97 | 8 | | | 94 | | | | .15 | 9 | | | .15 | 9 | | | .46 | 9 | | | 2.87 | 9 |
| 10/31/17 | | | 10.55 | | | | .29 | | | | 1.09 | | | | 1.38 | | | | (.29 | ) | | | (.04 | ) | | | (.33 | ) | | | 11.60 | | | | 13.29 | | | | 71 | | | | .18 | | | | .17 | | | | .49 | | | | 2.64 | |
| 10/31/16 | | | 10.33 | | | | .28 | | | | .21 | | | | .49 | | | | (.27 | ) | | | — | | | | (.27 | ) | | | 10.55 | | | | 4.82 | | | | 27 | | | | .25 | | | | .15 | | | | .47 | | | | 2.63 | |
| 10/31/156,10 | | | 10.00 | | | | — | 11 | | | .33 | | | | .33 | | | | — | | | | — | | | | — | | | | 10.33 | | | | 3.30 | 8 | | | 2 | | | | .07 | 8 | | | .04 | 8 | | | .37 | 8 | | | .04 | 8 |
| Class F-3: | | | | | | | | | | | | | | | | | | | | | | | | | | | | | | | | | | | | | | | | | | | | | | | | | | | | | | | | |
| 4/30/186,7 | | | 11.59 | | | | .18 | | | | (.06 | ) | | | .12 | | | | (.18 | ) | | | (.03 | ) | | | (.21 | ) | | | 11.50 | | | | 1.02 | 8 | | | 1 | | | | .06 | 9 | | | .06 | 9 | | | .37 | 9 | | | 3.11 | 9 |
| 10/31/176,15 | | | 10.81 | | | | .22 | | | | .77 | | | | .99 | | | | (.21 | ) | | | — | | | | (.21 | ) | | | 11.59 | | | | 9.22 | 8 | | | 1 | | | | .10 | 9 | | | .07 | 9 | | | .39 | 9 | | | 2.56 | 9 |
| Class R-1: | | | | | | | | | | | | | | | | | | | | | | | | | | | | | | | | | | | | | | | | | | | | | | | | | | | | | | | | |
| 4/30/186,7 | | | 11.59 | | | | .13 | | | | (.07 | ) | | | .06 | | | | (.13 | ) | | | (.03 | ) | | | (.16 | ) | | | 11.49 | | | | .50 | 8,12 | | | — | 13 | | | .97 | 9,12 | | | .96 | 9,12 | | | 1.27 | 9,12 | | | 2.24 | 9,12 |
| 10/31/17 | | | 10.54 | | | | .21 | | | | 1.11 | | | | 1.32 | | | | (.23 | ) | | | (.04 | ) | | | (.27 | ) | | | 11.59 | | | | 12.62 | 12 | | | — | 13 | | | .90 | 12 | | | .84 | 12 | | | 1.16 | 12 | | | 1.92 | 12 |
| 10/31/16 | | | 10.33 | | | | .22 | | | | .25 | | | | .47 | | | | (.26 | ) | | | — | | | | (.26 | ) | | | 10.54 | | | | 4.59 | 12 | | | — | 13 | | | .55 | 12 | | | .43 | 12 | | | .75 | 12 | | | 2.10 | 12 |
| 10/31/156,10 | | | 10.00 | | | | .07 | | | | .26 | | | | .33 | | | | — | | | | — | | | | — | | | | 10.33 | | | | 3.30 | 8,12 | | | — | 13 | | | .06 | 8,12 | | | .04 | 8,12 | | | .37 | 8,12 | | | .67 | 8,12 |
| Class R-2: | | | | | | | | | | | | | | | | | | | | | | | | | | | | | | | | | | | | | | | | | | | | | | | | | | | | | | | | |
| 4/30/186,7 | | | 11.56 | | | | .12 | | | | (.07 | ) | | | .05 | | | | (.13 | ) | | | (.03 | ) | | | (.16 | ) | | | 11.45 | | | | .45 | 8 | | | 1 | | | | .94 | 9 | | | .94 | 9 | | | 1.25 | 9 | | | 2.15 | 9 |
| 10/31/17 | | | 10.52 | | | | .19 | | | | 1.12 | | | | 1.31 | | | | (.23 | ) | | | (.04 | ) | | | (.27 | ) | | | 11.56 | | | | 12.57 | | | | 1 | | | | .88 | | | | .87 | | | | 1.19 | | | | 1.70 | |
| 10/31/16 | | | 10.33 | | | | .21 | | | | .21 | | | | .42 | | | | (.23 | ) | | | — | | | | (.23 | ) | | | 10.52 | | | | 4.08 | | | | — | 13 | | | 1.01 | | | | .93 | | | | 1.25 | | | | 1.94 | |
| 10/31/156,10 | | | 10.00 | | | | .05 | | | | .28 | | | | .33 | | | | — | | | | — | | | | — | | | | 10.33 | | | | 3.30 | 8,12 | | | — | 13 | | | .12 | 8,12 | | | .10 | 8,12 | | | .43 | 8,12 | | | .43 | 8,12 |
| Class R-2E: | | | | | | | | | | | | | | | | | | | | | | | | | | | | | | | | | | | | | | | | | | | | | | | | | | | | | | | | |
| 4/30/186,7 | | | 11.61 | | | | .17 | | | | (.07 | ) | | | .10 | | | | (.17 | ) | | | (.03 | ) | | | (.20 | ) | | | 11.51 | | | | .92 | 8,12 | | | — | 13 | | | .32 | 9,12 | | | .15 | 9,12 | | | .46 | 9,12 | | | 2.94 | 9,12 |
| 10/31/17 | | | 10.55 | | | | .30 | | | | 1.09 | | | | 1.39 | | | | (.29 | ) | | | (.04 | ) | | | (.33 | ) | | | 11.61 | | | | 13.35 | 12 | | | — | 13 | | | .36 | 12 | | | .15 | 12 | | | .47 | 12 | | | 2.70 | 12 |
| 10/31/16 | | | 10.33 | | | | .27 | | | | .20 | | | | .47 | | | | (.25 | ) | | | — | | | | (.25 | ) | | | 10.55 | | | | 4.60 | 12 | | | — | 13 | | | .49 | 12 | | | .33 | 12 | | | .65 | 12 | | | 2.62 | 12 |
| 10/31/156,10 | | | 10.00 | | | | .07 | | | | .26 | | | | .33 | | | | — | | | | — | | | | — | | | | 10.33 | | | | 3.30 | 8,12 | | | — | 13 | | | .07 | 8,12 | | | .05 | 8,12 | | | .38 | 8,12 | | | .67 | 8,12 |
| Class R-3: | | | | | | | | | | | | | | | | | | | | | | | | | | | | | | | | | | | | | | | | | | | | | | | | | | | | | | | | |
| 4/30/186,7 | | | 11.59 | | | | .13 | | | | (.06 | ) | | | .07 | | | | (.14 | ) | | | (.03 | ) | | | (.17 | ) | | | 11.49 | | | | .65 | 8 | | | — | 13 | | | .69 | 9 | | | .69 | 9 | | | 1.00 | 9 | | | 2.33 | 9 |
| 10/31/17 | | | 10.54 | | | | .24 | | | | 1.08 | | | | 1.32 | | | | (.23 | ) | | | (.04 | ) | | | (.27 | ) | | | 11.59 | | | | 12.69 | | | | — | 13 | | | .72 | | | | .71 | | | | 1.03 | | | | 2.16 | |
| 10/31/16 | | | 10.33 | | | | .25 | | | | .19 | | | | .44 | | | | (.23 | ) | | | — | | | | (.23 | ) | | | 10.54 | | | | 4.35 | | | | — | 13 | | | .76 | | | | .67 | | | | .99 | | | | 2.43 | |
| 10/31/156,10 | | | 10.00 | | | | .07 | | | | .26 | | | | .33 | | | | — | | | | — | | | | — | | | | 10.33 | | | | 3.30 | 8,12 | | | — | 13 | | | .06 | 8,12 | | | .04 | 8,12 | | | .37 | 8,12 | | | .67 | 8,12 |
| Class R-4: | | | | | | | | | | | | | | | | | | | | | | | | | | | | | | | | | | | | | | | | | | | | | | | | | | | | | | | | |
| 4/30/186,7 | | | 11.60 | | | | .16 | | | | (.07 | ) | | | .09 | | | | (.16 | ) | | | (.03 | ) | | | (.19 | ) | | | 11.50 | | | | .80 | 8 | | | — | 13 | | | .34 | 9 | | | .34 | 9 | | | .65 | 9 | | | 2.74 | 9 |
| 10/31/17 | | | 10.54 | | | | .28 | | | | 1.09 | | | | 1.37 | | | | (.27 | ) | | | (.04 | ) | | | (.31 | ) | | | 11.60 | | | | 13.17 | | | | — | 13 | | | .37 | | | | .36 | | | | .68 | | | | 2.49 | |
| 10/31/16 | | | 10.33 | | | | .30 | | | | .16 | | | | .46 | | | | (.25 | ) | | | — | | | | (.25 | ) | | | 10.54 | | | | 4.52 | | | | — | 13 | | | .46 | | | | .39 | | | | .71 | | | | 2.81 | |
| 10/31/156,10 | | | 10.00 | | | | .07 | | | | .26 | | | | .33 | | | | — | | | | — | | | | — | | | | 10.33 | | | | 3.30 | 8,12 | | | — | 13 | | | .07 | 8,12 | | | .04 | 8,12 | | | .37 | 8,12 | | | .67 | 8,12 |
| 26 | American Funds Retirement Income Portfolio Series |
Enhanced Portfolio
| | | | | | Income (loss) from
investment operations1 | | | Dividends and distributions | | | | | | | | | | | | Ratio of | | | Ratio of | | | | | | | |
| Period ended | | Net asset
value,
beginning
of period | | | Net
investment
income
(loss) | | | Net (losses)
gains on
securities
(both
realized and
unrealized) | | | Total from
investment
operations | | | Dividends
(from net
investment
income) | | | Distributions
(from capital
gains) | | | Total
dividends
and
distributions | | | Net asset
value,
end
of period | | | Total
return2,3 | | | Net assets,
end of
period
(in millions) | | | expenses to
average net
assets before
waivers/
reimburse-
ments4 | | | expenses to
average net
assets after
waivers/
reimburse-
ments3,4 | | | Net
effective
expense
ratio3,5 | | | Ratio of
net income
(loss)
to average
net assets3 | |
| Class R-5E: | | | | | | | | | | | | | | | | | | | | | | | | | | | | | | | | | | | | | | | | | | | | | | | | | | | | | | | | |
| 4/30/186,7 | | $ | 11.60 | | | $ | .17 | | | $ | (.07 | ) | | $ | .10 | | | $ | (.17 | ) | | $ | (.03 | ) | | $ | (.20 | ) | | $ | 11.50 | | | | .88 | %8 | | $ | — | 13 | | | .20 | %9 | | | .15 | %9 | | | .46 | %9 | | | 2.94 | %9 |
| 10/31/17 | | | 10.54 | | | | .30 | | | | 1.09 | | | | 1.39 | | | | (.29 | ) | | | (.04 | ) | | | (.33 | ) | | | 11.60 | | | | 13.40 | | | | — | 13 | | | .28 | | | | .14 | | | | .46 | | | | 2.71 | |
| 10/31/166,16 | | | 10.30 | | | | .28 | | | | .22 | | | | .50 | | | | (.26 | ) | | | — | | | | (.26 | ) | | | 10.54 | | | | 4.93 | 8 | | | — | 13 | | | .39 | 9 | | | .27 | 9 | | | .59 | 9 | | | 2.85 | 9 |
| Class R-5: | | | | | | | | | | | | | | | | | | | | | | | | | | | | | | | | | | | | | | | | | | | | | | | | | | | | | | | | |
| 4/30/186,7 | | | 11.61 | | | | .18 | | | | (.08 | ) | | | .10 | | | | (.17 | ) | | | (.03 | ) | | | (.20 | ) | | | 11.51 | | | | .93 | 8 | | | — | 13 | | | .33 | 9 | | | .07 | 9 | | | .38 | 9 | | | 3.02 | 9 |
| 10/31/17 | | | 10.55 | | | | .29 | | | | 1.09 | | | | 1.38 | | | | (.28 | ) | | | (.04 | ) | | | (.32 | ) | | | 11.61 | | | | 13.29 | | | | — | 13 | | | .41 | | | | .20 | | | | .52 | | | | 2.65 | |
| 10/31/16 | | | 10.33 | | | | .27 | | | | .20 | | | | .47 | | | | (.25 | ) | | | — | | | | (.25 | ) | | | 10.55 | | | | 4.59 | | | | — | 13 | | | .47 | | | | .34 | | | | .66 | | | | 2.61 | |
| 10/31/156,10 | | | 10.00 | | | | .07 | | | | .26 | | | | .33 | | | | — | | | | — | | | | — | | | | 10.33 | | | | 3.30 | 8 | | | — | 13 | | | .06 | 8 | | | .04 | 8 | | | .37 | 8 | | | .67 | 8 |
| Class R-6: | | | | | | | | | | | | | | | | | | | | | | | | | | | | | | | | | | | | | | | | | | | | | | | | | | | | | | | | |
| 4/30/186,7 | | | 11.61 | | | | .17 | | | | (.06 | ) | | | .11 | | | | (.18 | ) | | | (.03 | ) | | | (.21 | ) | | | 11.51 | | | | .93 | 8 | | | 1 | | | | .06 | 9 | | | .06 | 9 | | | .37 | 9 | | | 2.94 | 9 |
| 10/31/17 | | | 10.55 | | | | .26 | | | | 1.14 | | | | 1.40 | | | | (.30 | ) | | | (.04 | ) | | | (.34 | ) | | | 11.61 | | | | 13.49 | | | | — | 13 | | | .08 | | | | .06 | | | | .38 | | | | 2.24 | |
| 10/31/16 | | | 10.33 | | | | .26 | | | | .22 | | | | .48 | | | | (.26 | ) | | | — | | | | (.26 | ) | | | 10.55 | | | | 4.70 | | | | — | 13 | | | .32 | | | | .20 | | | | .52 | | | | 2.54 | |
| 10/31/156,10 | | | 10.00 | | | | .07 | | | | .26 | | | | .33 | | | | — | | | | — | | | | — | | | | 10.33 | | | | 3.30 | 8 | | | — | 13 | | | .06 | 8 | | | .04 | 8 | | | .37 | 8 | | | .67 | 8 |
See end of tables for footnotes.
| American Funds Retirement Income Portfolio Series | 27 |
Financial highlights (continued)
| | | Six months ended | | Year ended October 31 | | Period ended October 31 |
| Portfolio turnover rate for all share classes | | April 30, 20186,7,8 | | 2017 | | 2016 | | 20156,8,10 |
| Conservative Portfolio | | | 1 | % | | | 2 | % | | | — | %18 | | | — | %18 |
| Moderate Portfolio | | | — | 18 | | | 3 | | | | — | 18 | | | — | 18 |
| Enhanced Portfolio | | | 1 | | | | 1 | | | | 3 | | | | — | 18 |
| 1 | Based on average shares outstanding. |
| 2 | Total returns exclude any applicable sales charges. |
| 3 | This column reflects the impact, if any, of certain waivers/reimbursements from CRMC. During some of the periods shown, CRMC reduced fees for investment advisory services, reimbursed transfer agent services for certain share classes and reimbursed a portion of miscellaneous fees and expenses during the funds’ startup period. |
| 4 | This column does not include expenses of the underlying funds in which each fund invests. |
| 5 | This column reflects the net effective expense ratios for each fund and class, which are unaudited. These ratios include each class’s expense ratio combined with the weighted average net expense ratio of the underlying funds for the periods presented. See Expense Example for further information regarding fees and expenses. |
| 6 | Based on operations for a period that is less than a full year. |
| 7 | Unaudited. |
| 8 | Not annualized. |
| 9 | Annualized. |
| 10 | For the period August 28, 2015, commencement of operations, through October 31, 2015. |
| 11 | Amount less than $.01. |
| 12 | All or a significant portion of assets in this class consisted of seed capital invested by CRMC and/or its affiliates. Fees for distribution services are not charged or accrued on these seed capital assets. If such fees were paid by the fund on seed capital assets, fund expenses would have been higher and net income and total return would have been lower. |
| 13 | Amount less than $1 million. |
| 14 | Class T shares began investment operations on April 7, 2017. |
| 15 | Class F-3 shares began investment operations on January 27, 2017. |
| 16 | Class R-5E shares began investment operations on November 20, 2015. |
| 17 | Amount less than .01%. |
| 18 | Amount is either less than 1% or there is no turnover. |
See Notes to Financial Statements
| 28 | American Funds Retirement Income Portfolio Series |
As a fund shareholder, you incur two types of costs: (1) transaction costs, such as initial sales charges on purchase payments and contingent deferred sales charges on redemptions (loads), and (2) ongoing costs, including management fees, distribution and service (12b-1) fees, and other expenses. This example is intended to help you understand your ongoing costs (in dollars) of investing in the fund so you can compare these costs with the ongoing costs of investing in other mutual funds. The examples are based on an investment of $1,000 invested at the beginning of the period and held for the entire six-month period (November 1, 2017, through April 30, 2018).
Actual expenses:
The first line of each share class in the tables on the following pages provides information about actual account values and actual expenses. You may use the information in this line, together with the amount you invested, to estimate the expenses that you paid over the period. Simply divide your account value by $1,000 (for example, an $8,600 account value divided by $1,000 = 8.6), then multiply the result by the number in the first line under the heading titled “Expenses paid during period” to estimate the expenses you paid on your account during this period.
Hypothetical example for comparison purposes:
The second line of each share class in the tables on the following pages provides information about hypothetical account values and hypothetical expenses based on the actual expense ratio for the share class and an assumed rate of return of 5.00% per year before expenses, which is not the actual return of the share class. The hypothetical account values and expenses may not be used to estimate the actual ending account balance or expenses you paid for the period. You may use this information to compare the ongoing costs of investing in the fund and other funds. To do so, compare this 5.00% hypothetical example with the 5.00% hypothetical examples that appear in the shareholder reports of the other funds.
Notes:
Retirement plan participants may be subject to certain fees charged by the plan sponsor, and Class F-1, F-2 and F-3 shareholders may be subject to fees charged by financial intermediaries, typically ranging from 0.75% to 1.50% of assets annually depending on services offered. You can estimate the impact of these fees by adding the amount of the fees to the total estimated expenses you paid on your account during the period as calculated above. In addition, your ending account value would be lower by the amount of these fees.
Note that the expenses shown in the tables on the following pages are meant to highlight your ongoing costs only and do not reflect any transactional costs, such as sales charges (loads). Therefore, the second line of each share class in the tables is useful in comparing ongoing costs only and will not help you determine the relative total costs of owning different funds. In addition, if these transactional costs were included, your costs would have been higher.
| American Funds Retirement Income Portfolio Series | 29 |
| Conservative Portfolio | | | | | | | | | | | | | | | | |
| | | | | | | | | | | | | | | | | | | |
| | | Beginning
account value
11/1/2017 | | | Ending
account value
4/30/2018 | | | Expenses
paid during
period1,2 | | | Annualized
expense ratio2 | | | Effective
expenses paid
during period3 | | | Effective annualized
expense ratio4 | |
| Class A – actual return | | $ | 1,000.00 | | | $ | 994.57 | | | $ | 1.93 | | | | .39 | % | | $ | 3.36 | | | | .68 | % |
| Class A – assumed 5% return | | | 1,000.00 | | | | 1,022.86 | | | | 1.96 | | | | .39 | | | | 3.41 | | | | .68 | |
| Class C – actual return | | | 1,000.00 | | | | 992.25 | | | | 5.38 | | | | 1.09 | | | | 6.82 | | | | 1.38 | |
| Class C – assumed 5% return | | | 1,000.00 | | | | 1,019.39 | | | | 5.46 | | | | 1.09 | | | | 6.90 | | | | 1.38 | |
| Class T – actual return | | | 1,000.00 | | | | 996.75 | | | | .45 | | | | .09 | | | | 1.88 | | | | .38 | |
| Class T – assumed 5% return | | | 1,000.00 | | | | 1,024.35 | | | | .45 | | | | .09 | | | | 1.91 | | | | .38 | |
| Class F-1 – actual return | | | 1,000.00 | | | | 995.22 | | | | 2.03 | | | | .41 | | | | 3.46 | | | | .70 | |
| Class F-1 – assumed 5% return | | | 1,000.00 | | | | 1,022.76 | | | | 2.06 | | | | .41 | | | | 3.51 | | | | .70 | |
| Class F-2 – actual return | | | 1,000.00 | | | | 996.45 | | | | .79 | | | | .16 | | | | 2.23 | | | | .45 | |
| Class F-2 – assumed 5% return | | | 1,000.00 | | | | 1,024.00 | | | | .80 | | | | .16 | | | | 2.26 | | | | .45 | |
| Class F-3 – actual return | | | 1,000.00 | | | | 996.88 | | | | .30 | | | | .06 | | | | 1.73 | | | | .35 | |
| Class F-3 – assumed 5% return | | | 1,000.00 | | | | 1,024.50 | | | | .30 | | | | .06 | | | | 1.76 | | | | .35 | |
| Class R-1 – actual return | | | 1,000.00 | | | | 991.60 | | | | 5.68 | | | | 1.15 | | | | 7.11 | | | | 1.44 | |
| Class R-1 – assumed 5% return | | | 1,000.00 | | | | 1,019.09 | | | | 5.76 | | | | 1.15 | | | | 7.20 | | | | 1.44 | |
| Class R-2 – actual return | | | 1,000.00 | | | | 991.86 | | | | 4.74 | | | | .96 | | | | 6.17 | | | | 1.25 | |
| Class R-2 – assumed 5% return | | | 1,000.00 | | | | 1,020.03 | | | | 4.81 | | | | .96 | | | | 6.26 | | | | 1.25 | |
| Class R-2E – actual return | | | 1,000.00 | | | | 996.02 | | | | .79 | | | | .16 | | | | 2.23 | | | | .45 | |
| Class R-2E – assumed 5% return | | | 1,000.00 | | | | 1,024.00 | | | | .80 | | | | .16 | | | | 2.26 | | | | .45 | |
| Class R-3 – actual return | | | 1,000.00 | | | | 993.90 | | | | 3.46 | | | | .70 | | | | 4.89 | | | | .99 | |
| Class R-3 – assumed 5% return | | | 1,000.00 | | | | 1,021.32 | | | | 3.51 | | | | .70 | | | | 4.96 | | | | .99 | |
| Class R-4 – actual return | | | 1,000.00 | | | | 995.70 | | | | 1.73 | | | | .35 | | | | 3.17 | | | | .64 | |
| Class R-4 – assumed 5% return | | | 1,000.00 | | | | 1,023.06 | | | | 1.76 | | | | .35 | | | | 3.21 | | | | .64 | |
| Class R-5E – actual return | | | 1,000.00 | | | | 996.22 | | | | 1.04 | | | | .21 | | | | 2.47 | | | | .50 | |
| Class R-5E – assumed 5% return | | | 1,000.00 | | | | 1,023.75 | | | | 1.05 | | | | .21 | | | | 2.51 | | | | .50 | |
| Class R-5 – actual return | | | 1,000.00 | | | | 995.94 | | | | .40 | | | | .08 | | | | 1.83 | | | | .37 | |
| Class R-5 – assumed 5% return | | | 1,000.00 | | | | 1,024.40 | | | | .40 | | | | .08 | | | | 1.86 | | | | .37 | |
| Class R-6 – actual return | | | 1,000.00 | | | | 996.87 | | | | .35 | | | | .07 | | | | 1.78 | | | | .36 | |
| Class R-6 – assumed 5% return | | | 1,000.00 | | | | 1,024.45 | | | | .35 | | | | .07 | | | | 1.81 | | | | .36 | |
| 30 | American Funds Retirement Income Portfolio Series |
| Moderate Portfolio | | | | | | | | | | | | | | | | |
| | | | | | | | | | | | | | | | | |
| | | Beginning
account value
11/1/2017 | | | Ending
account value
4/30/2018 | | | Expenses
paid during
period1,2 | | | Annualized
expense ratio2 | | | Effective
expenses paid
during period3 | | | Effective
annualized
expense ratio4 | |
| Class A – actual return | | $ | 1,000.00 | | | $ | 1,001.04 | | | $ | 1.79 | | | | .36 | % | | $ | 3.27 | | | | .66 | % |
| Class A – assumed 5% return | | | 1,000.00 | | | | 1,023.01 | | | | 1.81 | | | | .36 | | | | 3.31 | | | | .66 | |
| Class C – actual return | | | 1,000.00 | | | | 996.82 | | | | 5.35 | | | | 1.08 | | | | 6.83 | | | | 1.38 | |
| Class C – assumed 5% return | | | 1,000.00 | | | | 1,019.44 | | | | 5.41 | | | | 1.08 | | | | 6.90 | | | | 1.38 | |
| Class T – actual return | | | 1,000.00 | | | | 1,002.30 | | | | .45 | | | | .09 | | | | 1.94 | | | | .39 | |
| Class T – assumed 5% return | | | 1,000.00 | | | | 1,024.35 | | | | .45 | | | | .09 | | | | 1.96 | | | | .39 | |
| Class F-1 – actual return | | | 1,000.00 | | | | 1,000.81 | | | | 1.98 | | | | .40 | | | | 3.47 | | | | .70 | |
| Class F-1 – assumed 5% return | | | 1,000.00 | | | | 1,022.81 | | | | 2.01 | | | | .40 | | | | 3.51 | | | | .70 | |
| Class F-2 – actual return | | | 1,000.00 | | | | 1,002.87 | | | | .74 | | | | .15 | | | | 2.23 | | | | .45 | |
| Class F-2 – assumed 5% return | | | 1,000.00 | | | | 1,024.05 | | | | .75 | | | | .15 | | | | 2.26 | | | | .45 | |
| Class F-3 – actual return | | | 1,000.00 | | | | 1,002.43 | | | | .30 | | | | .06 | | | | 1.79 | | | | .36 | |
| Class F-3 – assumed 5% return | | | 1,000.00 | | | | 1,024.50 | | | | .30 | | | | .06 | | | | 1.81 | | | | .36 | |
| Class R-1 – actual return | | | 1,000.00 | | | | 997.90 | | | | 5.30 | | | | 1.07 | | | | 6.79 | | | | 1.37 | |
| Class R-1 – assumed 5% return | | | 1,000.00 | | | | 1,019.49 | | | | 5.36 | | | | 1.07 | | | | 6.85 | | | | 1.37 | |
| Class R-2 – actual return | | | 1,000.00 | | | | 998.78 | | | | 4.81 | | | | .97 | | | | 6.29 | | | | 1.27 | |
| Class R-2 – assumed 5% return | | | 1,000.00 | | | | 1,019.98 | | | | 4.86 | | | | .97 | | | | 6.36 | | | | 1.27 | |
| Class R-2E – actual return | | | 1,000.00 | | | | 1,002.43 | | | | .74 | | | | .15 | | | | 2.23 | | | | .45 | |
| Class R-2E – assumed 5% return | | | 1,000.00 | | | | 1,024.05 | | | | .75 | | | | .15 | | | | 2.26 | | | | .45 | |
| Class R-3 – actual return | | | 1,000.00 | | | | 999.59 | | | | 3.37 | | | | .68 | | | | 4.86 | | | | .98 | |
| Class R-3 – assumed 5% return | | | 1,000.00 | | | | 1,021.42 | | | | 3.41 | | | | .68 | | | | 4.91 | | | | .98 | |
| Class R-4 – actual return | | | 1,000.00 | | | | 1,001.29 | | | | 1.69 | | | | .34 | | | | 3.18 | | | | .64 | |
| Class R-4 – assumed 5% return | | | 1,000.00 | | | | 1,023.11 | | | | 1.71 | | | | .34 | | | | 3.21 | | | | .64 | |
| Class R-5E – actual return | | | 1,000.00 | | | | 1,001.97 | | | | .79 | | | | .16 | | | | 2.28 | | | | .46 | |
| Class R-5E – assumed 5% return | | | 1,000.00 | | | | 1,024.00 | | | | .80 | | | | .16 | | | | 2.31 | | | | .46 | |
| Class R-5 – actual return | | | 1,000.00 | | | | 1,002.20 | | | | .55 | | | | .11 | | | | 2.04 | | | | .41 | |
| Class R-5 – assumed 5% return | | | 1,000.00 | | | | 1,024.25 | | | | .55 | | | | .11 | | | | 2.06 | | | | .41 | |
| Class R-6 – actual return | | | 1,000.00 | | | | 1,002.42 | | | | .25 | | | | .05 | | | | 1.74 | | | | .35 | |
| Class R-6 – assumed 5% return | | | 1,000.00 | | | | 1,024.55 | | | | .25 | | | | .05 | | | | 1.76 | | | | .35 | |
See end of tables for footnotes.
| American Funds Retirement Income Portfolio Series | 31 |
| Enhanced Portfolio | | | | | | | | | | | | | | | | |
| | | | | | | | | | | | | | | | | |
| | | Beginning
account value
11/1/2017 | | | Ending
account value
4/30/2018 | | | Expenses
paid during period1,2 | | | Annualized
expense ratio2 | | | Effective
expenses paid
during period3 | | | Effective
annualized
expense ratio4 | |
| Class A – actual return | | $ | 1,000.00 | | | $ | 1,007.85 | | | $ | 1.89 | | | | .38 | % | | $ | 3.44 | | | | .69 | % |
| Class A – assumed 5% return | | | 1,000.00 | | | | 1,022.91 | | | | 1.91 | | | | .38 | | | | 3.46 | | | | .69 | |
| Class C – actual return | | | 1,000.00 | | | | 1,004.45 | | | | 5.37 | | | | 1.08 | | | | 6.91 | | | | 1.39 | |
| Class C – assumed 5% return | | | 1,000.00 | | | | 1,019.44 | | | | 5.41 | | | | 1.08 | | | | 6.95 | | | | 1.39 | |
| Class T – actual return | | | 1,000.00 | | | | 1,009.18 | | | | .40 | | | | .08 | | | | 1.94 | | | | .39 | |
| Class T – assumed 5% return | | | 1,000.00 | | | | 1,024.40 | | | | .40 | | | | .08 | | | | 1.96 | | | | .39 | |
| Class F-1 – actual return | | | 1,000.00 | | | | 1,007.67 | | | | 1.99 | | | | .40 | | | | 3.53 | | | | .71 | |
| Class F-1 – assumed 5% return | | | 1,000.00 | | | | 1,022.81 | | | | 2.01 | | | | .40 | | | | 3.56 | | | | .71 | |
| Class F-2 – actual return | | | 1,000.00 | | | | 1,009.73 | | | | .75 | | | | .15 | | | | 2.29 | | | | .46 | |
| Class F-2 – assumed 5% return | | | 1,000.00 | | | | 1,024.05 | | | | .75 | | | | .15 | | | | 2.31 | | | | .46 | |
| Class F-3 – actual return | | | 1,000.00 | | | | 1,010.18 | | | | .30 | | | | .06 | | | | 1.84 | | | | .37 | |
| Class F-3 – assumed 5% return | | | 1,000.00 | | | | 1,024.50 | | | | .30 | | | | .06 | | | | 1.86 | | | | .37 | |
| Class R-1 – actual return | | | 1,000.00 | | | | 1,005.01 | | | | 4.77 | | | | .96 | | | | 6.31 | | | | 1.27 | |
| Class R-1 – assumed 5% return | | | 1,000.00 | | | | 1,020.03 | | | | 4.81 | | | | .96 | | | | 6.36 | | | | 1.27 | |
| Class R-2 – actual return | | | 1,000.00 | | | | 1,004.53 | | | | 4.67 | | | | .94 | | | | 6.21 | | | | 1.25 | |
| Class R-2 – assumed 5% return | | | 1,000.00 | | | | 1,020.13 | | | | 4.71 | | | | .94 | | | | 6.26 | | | | 1.25 | |
| Class R-2E – actual return | | | 1,000.00 | | | | 1,009.24 | | | | .75 | | | | .15 | | | | 2.29 | | | | .46 | |
| Class R-2E – assumed 5% return | | | 1,000.00 | | | | 1,024.05 | | | | .75 | | | | .15 | | | | 2.31 | | | | .46 | |
| Class R-3 – actual return | | | 1,000.00 | | | | 1,006.50 | | | | 3.43 | | | | .69 | | | | 4.98 | | | | 1.00 | |
| Class R-3 – assumed 5% return | | | 1,000.00 | | | | 1,021.37 | | | | 3.46 | | | | .69 | | | | 5.01 | | | | 1.00 | |
| Class R-4 – actual return | | | 1,000.00 | | | | 1,008.04 | | | | 1.69 | | | | .34 | | | | 3.24 | | | | .65 | |
| Class R-4 – assumed 5% return | | | 1,000.00 | | | | 1,023.11 | | | | 1.71 | | | | .34 | | | | 3.26 | | | | .65 | |
| Class R-5E – actual return | | | 1,000.00 | | | | 1,008.84 | | | | .75 | | | | .15 | | | | 2.29 | | | | .46 | |
| Class R-5E – assumed 5% return | | | 1,000.00 | | | | 1,024.05 | | | | .75 | | | | .15 | | | | 2.31 | | | | .46 | |
| Class R-5 – actual return | | | 1,000.00 | | | | 1,009.27 | | | | .35 | | | | .07 | | | | 1.89 | | | | .38 | |
| Class R-5 – assumed 5% return | | | 1,000.00 | | | | 1,024.45 | | | | .35 | | | | .07 | | | | 1.91 | | | | .38 | |
| Class R-6 – actual return | | | 1,000.00 | | | | 1,009.32 | | | | .30 | | | | .06 | | | | 1.84 | | | | .37 | |
| Class R-6 – assumed 5% return | | | 1,000.00 | | | | 1,024.50 | | | | .30 | | | | .06 | | | | 1.86 | | | | .37 | |
| 1 | The “expenses paid during period” are equal to the “annualized expense ratio,” multiplied by the average account value over the period, multiplied by the number of days in the period, and divided by 365 (to reflect the one-half year period). |
| 2 | The “expenses paid during period” and “annualized expense ratio” do not include the expenses of the underlying funds in which each fund invests. |
| 3 | The “effective expenses paid during period” are equal to the “effective annualized expense ratio,” multiplied by the average account value over the period, multiplied by the number of days in the period, and divided by 365 (to reflect the one-half year period). |
| 4 | The “effective annualized expense ratio” reflects the net annualized expense ratio of the class plus the class’s pro-rata share of the weighted average expense ratio of the underlying funds in which it invests. The annualized weighted average expense ratio of the underlying funds for the period reflects the net actual expense ratio of each underlying fund for the period, annualized and weighted for the fund’s relative average investment therein during the period. |
| 32 | American Funds Retirement Income Portfolio Series |
Approval of Investment Advisory and Service Agreement
American Funds Retirement Income Portfolio Series’ board has approved the series’ Investment Advisory and Service Agreement (the “agreement”) with Capital Research and Management Company (“CRMC”) for an additional one-year term through January 31, 2019. The board approved the agreement following the recommendation of the series’ Contracts Committee (the “committee”), which is composed of all of the series’ independent board members. The board and the committee determined in the exercise of their business judgment that each fund’s advisory fee structure was fair and reasonable in relation to the services provided, and that approving the agreement was in the best interests of each fund and its shareholders.
In reaching this decision, the board and the committee took into account information furnished to them throughout the year and otherwise provided to them, as well as information prepared specifically in connection with their review of the agreement, and were advised by their independent counsel. They considered the following factors, among others, but did not identify any single issue or particular piece of information that, in isolation, was the controlling factor, and each board and committee member did not necessarily attribute the same weight to each factor.
1. Nature, extent and quality of services
The board and the committee considered the depth and quality of CRMC’s investment management process, including its global research capabilities; the experience, capability and integrity of its senior management and other personnel; the low turnover rates of its key personnel; the overall financial strength and stability of CRMC and the Capital Group organization; the resources and systems CRMC devotes to investment management, compliance, trading, portfolio accounting and other services; and the ongoing evolution of CRMC’s organizational structure designed to maintain and strengthen these qualities. The board and the committee also considered the nature, extent and quality of administrative, compliance and shareholder services provided by CRMC to the funds under each fund’s agreement and other agreements, as well as the benefits to each fund’s shareholders from investing in a fund that is part of a large family of funds. The board and the committee concluded that the nature, extent and quality of the services provided by CRMC have benefited and should continue to benefit each fund and its shareholders.
2. Investment results
The board and the committee considered the investment results of each fund in light of its objective. They compared each fund’s investment results with those of other funds (including funds that currently form the basis of the Lipper index for the category in which the fund is included), and data such as market indexes and fund averages, over various periods ended June 30, 2017. This report, including the letter to shareholders and related disclosures, contains certain information about each fund’s investment results. The comparisons included the Lipper Retirement Income Funds Average, the Standard & Poor’s Target Date Retirement Income Index, and the Lipper Retirement Income Funds Index.
American Funds Retirement Income Portfolio Series — Conservative seeks to provide current income, long-term growth of capital and conservation of capital, with an emphasis on income and conservation of capital. The board and the committee noted that the fund’s investment results were higher than all of the comparisons for the three-month and six-month periods and the lifetime of the fund since August 28, 2015 except for the Lipper Average for all of the same periods. They also noted that the fund’s investment results were lower than all of the comparisons for the one-year period.
American Funds Retirement Income Portfolio Series — Moderate seeks to provide current income, long-term growth of capital and conservation of capital. The board and the committee noted that the fund’s investment results were higher than all of the comparisons for the three-month and six-month periods and the lifetime of the fund since August 28, 2015. They also noted that the fund’s investment results were higher than the S&P Target Date Retirement Income Index but lower than the Lipper Average and Lipper Index for the one-year period.
American Funds Retirement Income Portfolio Series — Enhanced seeks to provide current income, long-term growth of capital and conservation of capital, with an emphasis on income and growth of capital. The board and the committee noted that the fund’s investment results were higher than all of the comparisons for the three-month, six-month and one-year periods and the lifetime of the fund since August 28, 2015.
| American Funds Retirement Income Portfolio Series | 33 |
The board and the committee concluded that in view of the funds’ short history, each fund’s investment results have been satisfactory for renewal of the agreement, and that CRMC’s record in managing the funds indicated that their continued management should benefit each fund and its shareholders.
3. Advisory fees and total expenses
The board and the committee compared the total expense levels of each fund to those of other relevant funds. They observed that each fund’s expenses were less than the median and average expenses of those of the other funds included in its Lipper category described above.
The board and the committee also reviewed the fee schedule of the funds (including the fees and expenses of the underlying American Funds in which the funds invest) to those of other relevant funds. The board and the committee noted CRMC’s prior elimination of the entire advisory fee payable by the funds under the agreement. The board and committee also considered the breakpoint discounts in each underlying fund’s advisory fee structure that reduce the level of fees charged by CRMC to the underlying fund as its assets increase. In addition, they reviewed information regarding the effective advisory fees charged to other clients by CRMC and its affiliates. They noted that, to the extent there were differences between the advisory fees paid by the underlying American Funds and the advisory fees paid by those clients, the differences appropriately reflected the investment, operational, regulatory and market differences between advising the funds and the other clients. The board and the committee concluded that each fund’s cost structure was fair and reasonable in relation to the services provided, and that each fund’s shareholders receive reasonable value in return for the advisory fees and other amounts paid to CRMC by the fund.
4. Ancillary benefits
The board and the committee considered a variety of other benefits that CRMC and its affiliates receive as a result of CRMC’s relationship with each fund and the underlying American Funds, including fees for administrative services provided to certain share classes; fees paid to CRMC’s affiliated transfer agent; sales charges and distribution fees received and retained by the funds’ principal underwriter, an affiliate of CRMC; and possible ancillary benefits to CRMC and its institutional management affiliates in managing other investment vehicles. The board and the committee reviewed CRMC’s portfolio trading practices, noting the benefits CRMC receives from the research obtained with commissions from portfolio transactions made on behalf of the underlying American Funds. The board and the committee took these ancillary benefits into account in evaluating the reasonableness of the advisory fees and other amounts paid to CRMC by the funds.
| 34 | American Funds Retirement Income Portfolio Series |
5. Adviser financial information
The board and the committee reviewed information regarding CRMC’s costs of providing services to the American Funds, including personnel, systems and resources of investment, compliance, trading, accounting and other administrative operations. They considered CRMC’s costs and related cost allocation methodology as well as its willingness to invest in technology, infrastructure and staff to maintain and expand services and capabilities, respond to industry and regulatory developments, and attract and retain qualified personnel. They also considered CRMC’s sharing of any economies of scale, or efficiencies, through breakpoints and other fee reductions and costs voluntarily absorbed. They noted information regarding the compensation structure for CRMC’s investment professionals. They reviewed information on the profitability of the investment adviser and its affiliates. The board and the committee also compared CRMC’s profitability and compensation data to the reported results and data of several large, publicly held investment management companies. The board and the committee noted the competitiveness and cyclicality of both the mutual fund industry and the capital markets, and the importance in that environment of CRMC’s long-term profitability for maintaining its independence, company culture and management continuity. The board and the committee concluded that each fund’s advisory fee structure reflected a reasonable sharing of benefits between CRMC and the funds’ shareholders.
| American Funds Retirement Income Portfolio Series | 35 |
Office of the series
6455 Irvine Center Drive
Irvine, CA 92618-4518
Investment adviser
Capital Research and Management Company
333 South Hope Street
Los Angeles, CA 90071-1406
Transfer agent for shareholder accounts
American Funds Service Company
(Write to the address near you.)
P.O. Box 6007
Indianapolis, IN 46206-6007
P.O. Box 2280
Norfolk, VA 23501-2280
Custodian of assets
State Street Bank and Trust Company
One Lincoln Street
Boston, MA 02111
Counsel
Morgan, Lewis & Bockius LLP
300 South Grand Avenue, 22nd Floor
Los Angeles, CA 90071-3132
Independent registered public accounting firm
Deloitte & Touche LLP
695 Town Center Drive
Suite 1200
Costa Mesa, CA 92626-7188
Principal underwriter
American Funds Distributors, Inc.
333 South Hope Street
Los Angeles, CA 90071-1406
| 36 | American Funds Retirement Income Portfolio Series |
Investors should carefully consider investment objectives, risks, charges and expenses. This and other important information is contained in the series prospectus and summary prospectuses, which can be obtained from your financial professional and should be read carefully before investing. You may also call American Funds Service Company (AFS) at (800) 421-4225 or visit the American Funds website at americanfunds.com. Fund shares offered through American Funds Distributors, Inc.
“Proxy Voting Guidelines for American Funds Retirement Income Portfolio Series” — which describes how we vote proxies relating to the underlying funds held in the portfolios — is available on the American Funds website or upon request by calling AFS. The series files its proxy voting record with the U.S. Securities and Exchange Commission (SEC) for the 12 months ended June 30 by August 31. The proxy voting record is available free of charge on the SEC website at sec.gov and on the American Funds website.
Visit the American Funds website for more information on the securities held by the underlying funds in the American Funds Retirement Income Portfolio Series portfolios.
American Funds Retirement Income Portfolio Series files a complete list of its portfolio holdings with the SEC for the first and third quarters of each fiscal year on Form N-Q. This filing is available free of charge on the SEC website. You may also review or, for a fee, copy this filing at the SEC’s Public Reference Room in Washington, D.C. Additional information regarding the operation of the Public Reference Room may be obtained by calling the SEC’s Office of Investor Education and Advocacy at (800) SEC-0330. Additionally, the list of portfolio holdings is available by calling AFS.
This report is for the information of shareholders of American Funds Retirement Income Portfolio Series, but it also may be used as sales literature when preceded or accompanied by the current prospectus, which gives details about charges, expenses, investment objectives and operating policies of the series. If used as sales material after June 30, 2018, this report must be accompanied by an American Funds statistical update for the most recently completed calendar quarter.
Bloomberg® is a trademark of Bloomberg Finance L.P. (collectively with its affiliates, “Bloomberg”). Barclays® is a trademark of Barclays Bank Plc (collectively with its affiliates, “Barclays”), used under license. Neither Bloomberg nor Barclays approves or endorses this material, guarantees the accuracy or completeness of any information herein and, to the maximum extent allowed by law, neither shall have any liability or responsibility for injury or damages arising in connection therewith.
MSCI has not approved, reviewed or produced this report, makes no express or implied warranties or representations and is not liable whatsoever for any data in the report. You may not redistribute the MSCI data or use it as a basis for other indices or investment products.
The Standard & Poor’s 500 Composite Index (“Index”) is a product of S&P Dow Jones Indices LLC and/or its affiliates and has been licensed for use by Capital Group. Copyright © 2018 S&P Dow Jones Indices LLC, a division of S&P Global, and/or its affiliates. All rights reserved. Redistribution or reproduction in whole or in part are prohibited without written permission of S&P Dow Jones Indices LLC.
American Funds from Capital Group
The Capital Advantage®
Since 1931, American Funds, part of Capital Group, has helped investors pursue long-term investment success. Our consistent approach — in combination with The Capital SystemSM — has resulted in a superior long-term track record.
| | Aligned with investor success |
| | We base our decisions on a long-term perspective, which we believe aligns our goals with the interests of our clients. Our portfolio managers average 27 years of investment experience, including 22 years at our company, reflecting a career commitment to our long-term approach.1 |
| | |
| | The Capital System |
| | The Capital System combines individual accountability with teamwork. Funds using The Capital System are divided into portions that are managed independently by investment professionals with diverse backgrounds, ages and investment approaches. An extensive global research effort is the backbone of our system. |
| | |
| | American Funds’ superior long-term track record |
| | Equity funds have beaten their Lipper peer indexes in 92% of 10-year periods and 99% of 20-year periods. Fixed income funds have beaten their Lipper indexes in 77% of 10-year periods and 80% of 20-year periods.2 Fund management fees have been among the lowest in the industry.3 |
| | 1 | Portfolio manager experience as of December 31, 2017. |
| | 2 | Based on Class F-2 share results for rolling periods through December 31, 2017. Periods covered are the shorter of the fund’s lifetime or since the comparable Lipper index inception date (except Capital Income Builder and SMALLCAP World Fund, for which the Lipper average was used). Expenses differ for each share class, so results will vary. Class F-2 shares were first offered on August 1, 2008. Class F-2 share results prior to the date of first sale are hypothetical based on Class A share results without a sales charge, adjusted for typical estimated expenses. Results for certain funds with an inception date after August 1, 2008, also include hypothetical returns because those funds’ Class F-2 shares sold after the funds’ date of first offering. Please see americanfunds.com for more information on specific expense adjustments and the actual dates of first sale. |
| | 3 | On average, our management fees were in the lowest quintile 71% of the time, based on the 20-year period ended December 31, 2017, versus comparable Lipper categories, excluding funds of funds. |

ITEM 2 – Code of Ethics
Not applicable for filing of semi-annual reports to shareholders.
ITEM 3 – Audit Committee Financial Expert
Not applicable for filing of semi-annual reports to shareholders.
ITEM 4 – Principal Accountant Fees and Services
Not applicable for filing of semi-annual reports to shareholders.
ITEM 5 – Audit Committee of Listed Registrants
Not applicable to this Registrant, insofar as the Registrant is not a listed issuer as defined in Rule 10A-3 under the Securities Exchange Act of 1934.
ITEM 6 – Schedule of Investments
Not applicable, insofar as the schedule is included as part of the report to shareholders filed under Item 1 of this Form
ITEM 7 – Disclosure of Proxy Voting Policies and Procedures for Closed-End Management Investment Companies
Not applicable to this Registrant, insofar as the Registrant is not a closed-end management investment company.
ITEM 8 – Portfolio Managers of Closed-End Management Investment Companies
Not applicable to this Registrant, insofar as the Registrant is not a closed-end management investment company.
ITEM 9 – Purchases of Equity Securities by Closed-End Management Investment Company and Affiliated Purchasers
Not applicable to this Registrant, insofar as the Registrant is not a closed-end management investment company.
ITEM 10 – Submission of Matters to a Vote of Security Holders
There have been no material changes to the procedures by which shareholders may recommend nominees to the Registrant’s board of trustees since the Registrant last submitted a proxy statement to its shareholders. The procedures are as follows. The Registrant has a nominating and governance committee comprised solely of persons who are not considered ‘‘interested persons’’ of the Registrant within the meaning of the Investment Company Act of 1940, as amended. The committee periodically reviews such issues as the board’s composition, responsibilities, committees, compensation and other relevant issues, and recommends any appropriate changes to the full board of trustees. While the committee normally is able to identify from its own resources an ample number of qualified candidates, it will consider shareholder suggestions of persons to be considered as nominees to fill future vacancies on the board. Such suggestions must be sent in writing to the nominating and governance committee of the Registrant, c/o the Registrant’s Secretary, and must be accompanied by complete biographical and occupational data on the prospective nominee, along with a written consent of the prospective nominee for consideration of his or her name by the nominating and governance committee.
ITEM 11 – Controls and Procedures
| (a) | The Registrant’s Principal Executive Officer and Principal Financial Officer have concluded, based on their evaluation of the Registrant’s disclosure controls and procedures (as such term is defined in Rule 30a-3 under the Investment Company Act of 1940), that such controls and procedures are adequate and reasonably designed to achieve the purposes described in paragraph (c) of such rule. |
| | |
| (b) | There were no changes in the Registrant’s internal controls over financial reporting (as defined in Rule 30a-3(d) under the Investment Company Act of 1940) that occurred during the Registrant’s second fiscal quarter of the period covered by this report that has materially affected, or is reasonably likely to materially affect, the Registrant’s internal control over financial reporting. |
ITEM 12 – Exhibits
| (a)(1) | Not applicable for filing of semi-annual reports to shareholders. |
| | |
| (a)(2) | The certifications required by Rule 30a-2 of the Investment Company Act of 1940 and Sections 302 and 906 of the Sarbanes-Oxley Act of 2002 are attached as exhibits hereto. |
SIGNATURES
Pursuant to the requirements of the Securities Exchange Act of 1934 and the Investment Company Act of 1940, the Registrant has duly caused this report to be signed on its behalf by the undersigned, thereunto duly authorized.
| | AMERICAN FUNDS RETIREMENT INCOME PORTFOLIO SERIES |
| | |
| | By /s/ Walter R. Burkley |
| | Walter R. Burkley, President and Principal Executive Officer |
| | |
| | Date: June 29, 2018 |
Pursuant to the requirements of the Securities Exchange Act of 1934 and the Investment Company Act of 1940, this report has been signed below by the following persons on behalf of the Registrant and in the capacities and on the dates indicated.
| By /s/ Walter R. Burkley |
Walter R. Burkley, President and Principal Executive Officer |
| |
| Date: June 29, 2018 |
| By /s/ Gregory F. Niland |
Gregory F. Niland, Treasurer and Principal Financial Officer |
| |
| Date: June 29, 2018 |