Lender Presentation August 2016 Exhibit 99.3
Disclaimer This presentation and the accompanying oral presentation is solely for informational purposes and is intended to facilitate discussions with representatives of certain institutions regarding a potential debt financing of Amplify Snack Brands, Inc. (“Amplify” or “the Company”). Neither this presentation nor the accompanying oral presentation constitute an offer to purchase or sell, or a solicitation of an offer to purchase or buy, any securities of Amplify by any person in any jurisdiction, including the United States, in which is unlawful for such person to make an offer or solicitation. The recipient of this presentation has stated that it does not wish to receive material non-public information with respect to Amplify and acknowledges that other lenders have received a confidential supplement that contains additional information with respect to Amplify that may be material. Amplify does not take any responsibility for the recipient’s decision to limit the scope of the information it has obtained in connection with its evaluation of Amplify and the facilities described herein. This presentation and the accompanying oral presentation contain forward-looking statements within the meaning of federal securities laws, including statements with regard to the proposed acquisition by Amplify of Crisps Topco Limited and subsidiaries. Such forward-looking statements involve substantial risks and uncertainties. Forward-looking statements generally relate to future events or future financial or operating performance. In some cases, you can identify forward-looking statements because they contain words such as “may,” “will,” “should,” “expects,” “plans,” “anticipates,” “could,” “would,” “intends,” “target,” “projects,” “contemplates,” “believes,” “estimates,” “predicts,” “potential” or “continue” or the negative of these words or other similar terms or expressions that concern opportunities, prospects, future market size, expectations, strategy, plans or intentions. The expectations and beliefs of Amplify regarding these matters may not materialize, including the successful consummation of the proposed acquisition of Crisps Topco Limited and subsidiaries, and actual results in future periods are subject to risks and uncertainties that could cause actual results to differ materially from those expressed in the forward-looking statements, and you should not place undue reliance on our forward-looking statements. The forward-looking statements in this presentation and the accompanying oral presentation are based on information available to Amplify as of the date hereof, and Amplify disclaims any obligation to update any forward-looking statements for any reason, whether as a result of new information, future events or otherwise. This presentation and accompanying oral presentation contain certain information regarding the business, operations and financial results of Crisps Topco Limited and its subsidiaries. This information has been prepared by Crisps Topco Limited and its subsidiaries, and although Amplify believes the information regarding Crisps Topco Limited and its subsidiaries is accurate in all material respects, Amplify does not make any representation or warranty, express or implied, as to the accuracy, completeness or reliability of the information regarding Crisps Topco Limited and subsidiaries contained in this presentation or the accompanying oral presentation. The financial results of Crisps Topco Limited and subsidiaries that are presented in this presentation and accompanying oral presentation have been prepared by Crisps Topco Limited in accordance with generally accepted accounting principles in the United Kingdom (“UK GAAP”) and not generally accepted accounting principles in the United States (“US GAAP”). You should be aware that there are differences between UK GAAP (used by Crisps Topco Limited) and US GAAP (used by Amplify). The financial results of Crisps Topco Limited and subsidiaries have not been audited or reviewed by Amplify’s independent auditors. The historical past practices of Crisps Topco Limited and subsidiaries in the preparation of their historical financial statements may differ from the practices and interpretations applied by Amplify. As such, the historical financial results of Crisps Topco Limited and subsidiaries that are ultimately provided by Amplify or reflected in Amplify’s financial statements in future periods may vary from the information provided herein. Crisps Topco Limited and subsidiaries have historically maintained a fiscal year end on or around March 31 for a 52-week calendar year, as compared to Amplify’s fiscal year end of December 31. To the extent necessary, the historical financial results of Crisps Topco Limited and subsidiaries have been calendarized to match Amplify’s fiscal year end, solely for presentation purposes.
Disclaimer (Cont.) This presentation and accompanying oral presentation also contain certain financial information that is presented as “LTM ended June 30, 2016” and/or “pro forma” for the proposed acquisition by Amplify of Crisps Topco Limited and subsidiaries. “LTM ended June 30, 2016” financial information as used in this presentation represents financial data (i) for Amplify, for the 12 months ended June 30, 2016, calculated by adding the financial data for the six months ended June 30, 2016 to the financial data for the year ended December 31, 2015 and subtracting the financial data for the six months ended June 30, 2015, (ii) for Crisps Topco Limited and subsidiaries, for the four quarters ended July 1, 2016, calculated by adding the financial data for the quarter ended July 1, 2016 to the financial data for the year ended April 1, 2016 and subtracting the financial data for the quarter ended June 26, 2015. The “pro forma” financial information used in this presentation does not represent pro forma financial information prepared in accordance with Article 11 of Regulation S-X. If the proposed acquisition is consummated, Amplify will file with the Securities and Exchange Commission, within 71 calendar days following the date that Amplify is required to file a Current Report on Form 8-K announcing the consummation of the acquisition, the pro forma financial information in respect of the proposed acquisition that is required under Article 11 of Regulation S-X. In addition, the historical financial results of Crisps Topco Limited and subsidiaries have been converted from pounds sterling (£) to USD ($) based on a GBP / USD spot rate of 1.31 as of August 5, 2016, solely for presentation purposes. For more information, see the Appendix to this presentation. This presentation and accompanying oral presentation contain certain non-GAAP financial measures regarding both Amplify and Crisps Topco Limited. These non-GAAP financial measures, which include presentations of EBITDA, Adjusted EBITDA and Adjusted EBITDA margin, have been presented in order to aid understanding in Amplify’s and Crisp Topco Limited’s business performance. Non-GAAP financial measures used in this presentation are not meant to be a substitute for comparable GAAP measures and are not intended to be considered in isolation from, in substitution for, or superior to our GAAP results. EBITDA and Adjusted EBITDA are explained and reconciled to net income, the closest comparable GAAP measure, in the tables in the Appendix to this presentation. This presentation and accompanying oral presentation also contain certain estimates and other information concerning our industries that are based on industry publications, surveys and forecasts. This information involves a number of assumptions and limitations, and we have not independently verified the accuracy or completeness of the information. All historical 2014 financial information for Amplify is based on the 2014 pro forma financial data as described in, and subject to the limitations in, Amplify’s public filings with Securities and Exchange Commission, including without limitation, Amplify’s Annual Report on Form 10-K for the year ended December 31, 2015. Amounts and percentages appearing in this presentation have been rounded to the amounts shown for convenience of presentation. Accordingly, the total of each column of amounts may not be equal to the total of the relevant individual items. All references to Amplify’s business and products (1) prior to April 2015 refer only to SkinnyPop, (2) for the period from April 2015 to April 2016 refer to SkinnyPop and Paqui and (3) after April 29, 2016, refer to SkinnyPop, Paqui and Boundless Nutrition. L52 is the financial data from the latest 52 weeks ending June 26, 2016. L12 is the financial data from the latest 12 weeks ending June 26, 2016.
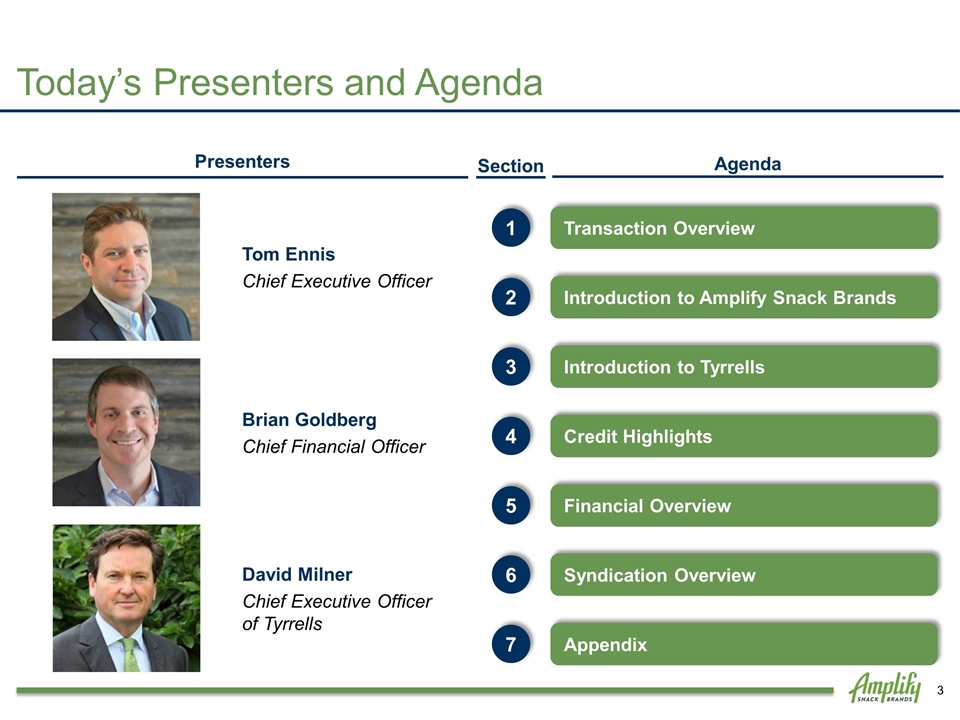
Today’s Presenters and Agenda Tom Ennis Chief Executive Officer Brian Goldberg Chief Financial Officer Presenters Agenda Transaction Overview 1 Introduction to Amplify Snack Brands 2 Financial Overview 5 Syndication Overview 6 Section Credit Highlights 4 Introduction to Tyrrells 3 Appendix 7 David Milner Chief Executive Officer of Tyrrells
Transaction Overview
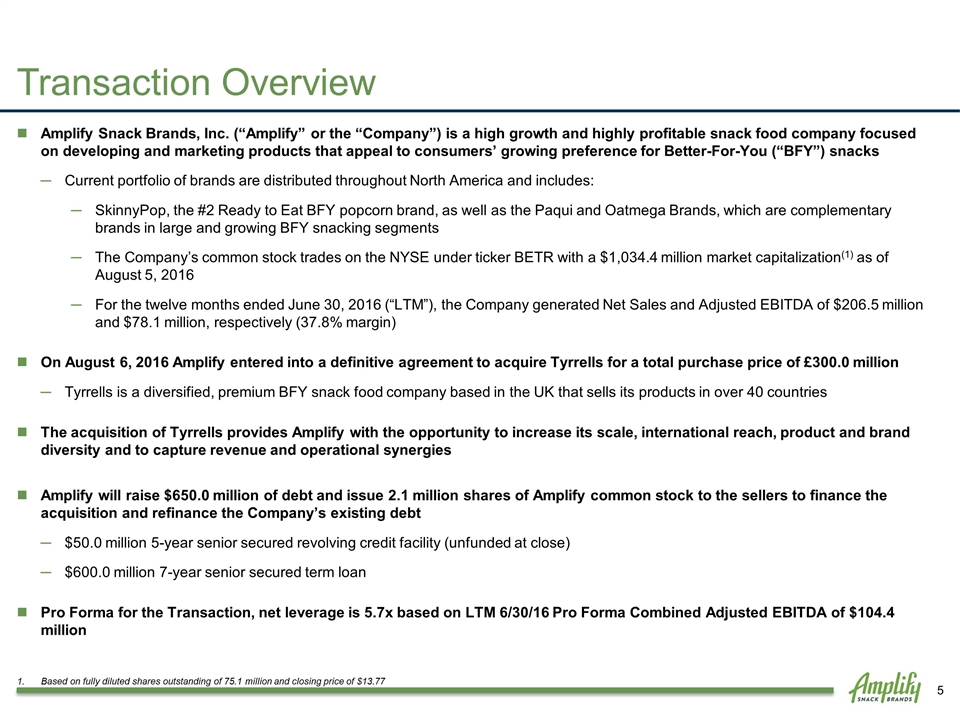
Amplify Snack Brands, Inc. (“Amplify” or the “Company”) is a high growth and highly profitable snack food company focused on developing and marketing products that appeal to consumers’ growing preference for Better-For-You (“BFY”) snacks Current portfolio of brands are distributed throughout North America and includes: SkinnyPop, the #2 Ready to Eat BFY popcorn brand, as well as the Paqui and Oatmega Brands, which are complementary brands in large and growing BFY snacking segments The Company’s common stock trades on the NYSE under ticker BETR with a $1,034.4 million market capitalization(1) as of August 5, 2016 For the twelve months ended June 30, 2016 (“LTM”), the Company generated Net Sales and Adjusted EBITDA of $206.5 million and $78.1 million, respectively (37.8% margin) On August 6, 2016 Amplify entered into a definitive agreement to acquire Tyrrells for a total purchase price of £300.0 million Tyrrells is a diversified, premium BFY snack food company based in the UK that sells its products in over 40 countries The acquisition of Tyrrells provides Amplify with the opportunity to increase its scale, international reach, product and brand diversity and to capture revenue and operational synergies Amplify will raise $650.0 million of debt and issue 2.1 million shares of Amplify common stock to the sellers to finance the acquisition and refinance the Company’s existing debt $50.0 million 5-year senior secured revolving credit facility (unfunded at close) $600.0 million 7-year senior secured term loan Pro Forma for the Transaction, net leverage is 5.7x based on LTM 6/30/16 Pro Forma Combined Adjusted EBITDA of $104.4 million Transaction Overview Based on fully diluted shares outstanding of 75.1 million and closing price of $13.77
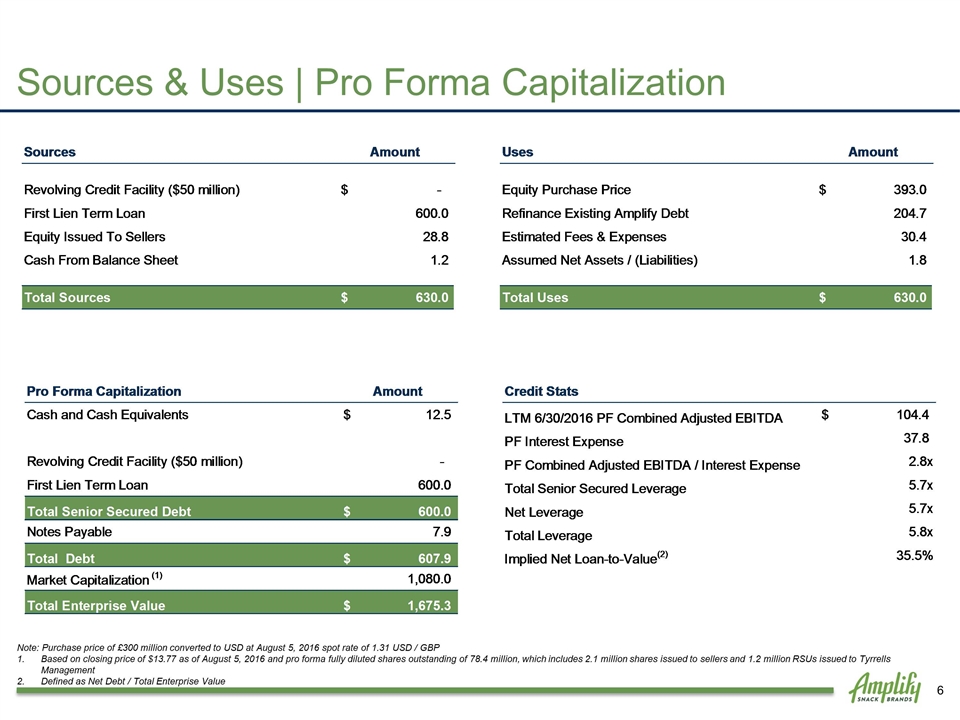
Sources & Uses | Pro Forma Capitalization Note: Purchase price of £300 million converted to USD at August 5, 2016 spot rate of 1.31 USD / GBP Based on closing price of $13.77 as of August 5, 2016 and pro forma fully diluted shares outstanding of 78.4 million, which includes 2.1 million shares issued to sellers and 1.2 million RSUs issued to Tyrrells Management Defined as Net Debt / Total Enterprise Value
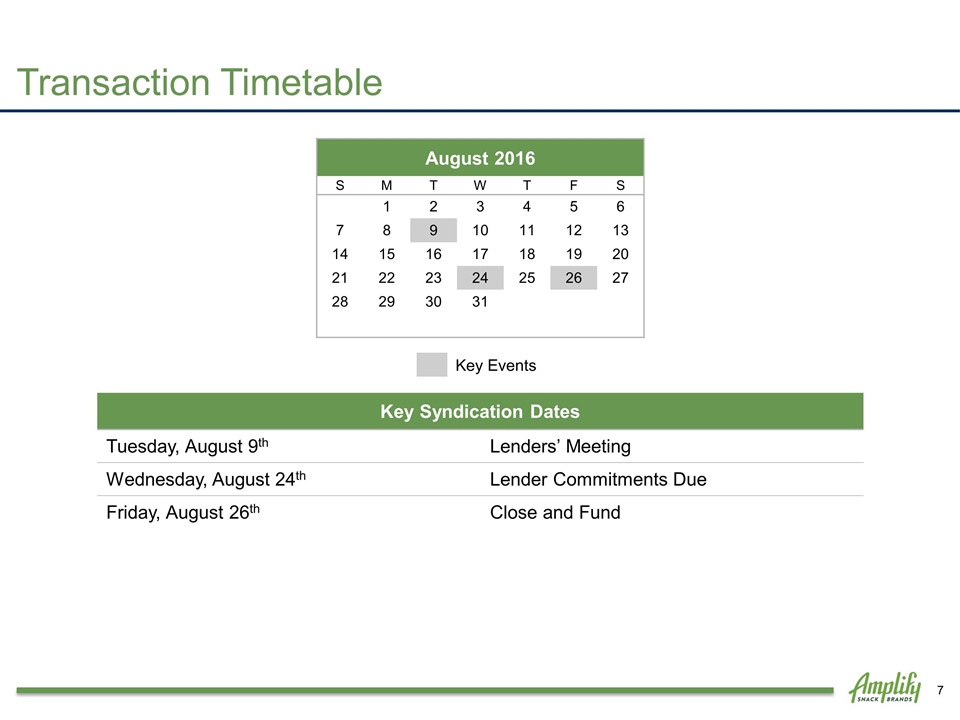
Transaction Timetable Key Events Key Syndication Dates Tuesday, August 9th Lenders’ Meeting Wednesday, August 24th Lender Commitments Due Friday, August 26th Close and Fund August 2016 S M T W T F S 1 2 3 4 5 6 7 8 9 10 11 12 13 14 15 16 17 18 19 20 21 22 23 24 25 26 27 28 29 30 31

Introduction to Amplify Snack Brands
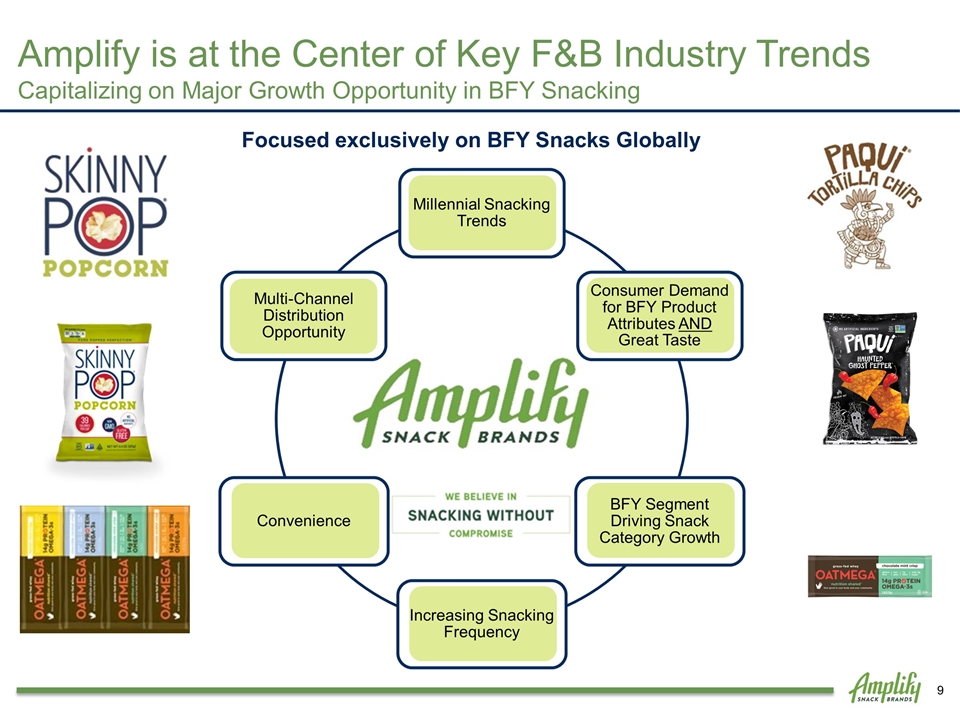
Amplify is at the Center of Key F&B Industry Trends Capitalizing on Major Growth Opportunity in BFY Snacking Focused exclusively on BFY Snacks Globally Millennial Snacking Trends BFY Segment Driving Snack Category Growth Increasing Snacking Frequency Convenience Multi-Channel Distribution Opportunity Consumer Demand for BFY Product Attributes AND Great Taste
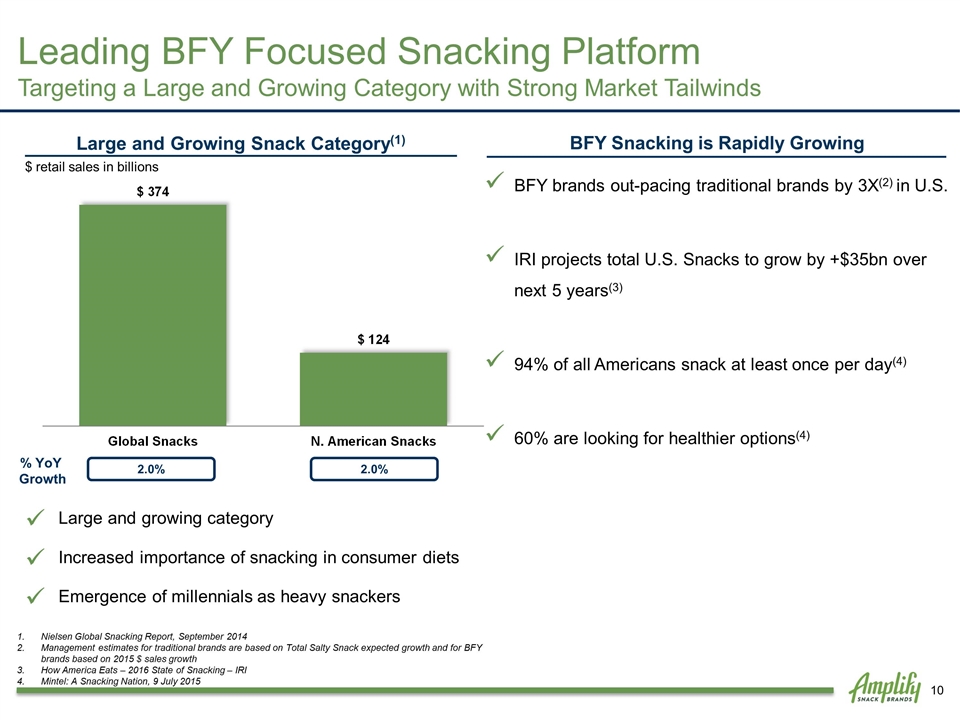
Nielsen Global Snacking Report, September 2014 Management estimates for traditional brands are based on Total Salty Snack expected growth and for BFY brands based on 2015 $ sales growth How America Eats – 2016 State of Snacking – IRI Mintel: A Snacking Nation, 9 July 2015 Large and Growing Snack Category(1) $ retail sales in billions Large and growing category[] Increased importance of snacking in consumer diets[] Emergence of millennials as heavy snackers Leading BFY Focused Snacking Platform Targeting a Large and Growing Category with Strong Market Tailwinds % YoY Growth 2% 2% Flat BFY brands out-pacing traditional brands by 3X(2) in U.S. IRI projects total U.S. Snacks to grow by +$35bn over next 5 years(3) 94% of all Americans snack at least once per day(4) 60% are looking for healthier options(4) BFY Snacking is Rapidly Growing % YoY Growth 2.0% 2.0%
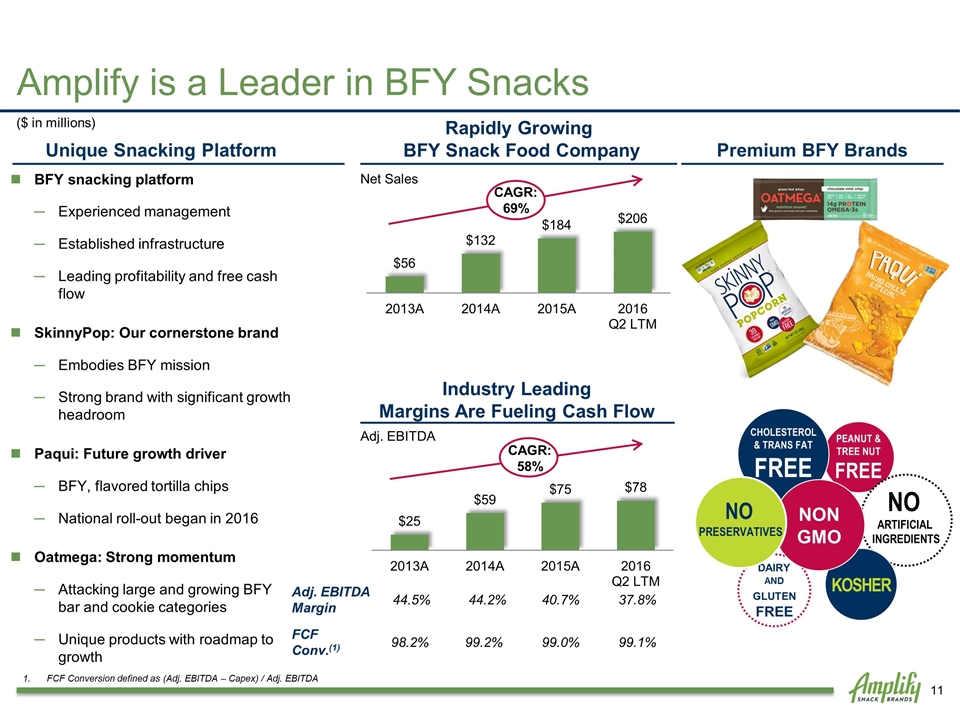
CAGR: 69% PEANUT & TREE NUT FREE CHOLESTEROL & TRANS FAT FREE NO ARTIFICIAL INGREDIENTS DAIRY AND GLUTEN FREE KOSHER BFY snacking platform Experienced management Established infrastructure Leading profitability and free cash flow SkinnyPop: Our cornerstone brand Embodies BFY mission Strong brand with significant growth headroom Paqui: Future growth driver BFY, flavored tortilla chips National roll-out began in 2016 Oatmega: Strong momentum Attacking large and growing BFY bar and cookie categories Unique products with roadmap to growth Rapidly Growing BFY Snack Food Company Unique Snacking Platform Premium BFY Brands Industry Leading Margins Are Fueling Cash Flow NON GMO NO PRESERVATIVES CAGR: 58% Adj. EBITDA Margin 44.5% 44.2% 40.7% 37.8% FCF Conv.(1) 98.2% 99.2% 99.0% 99.1% ($ in millions) Amplify is a Leader in BFY Snacks Net Sales Adj. EBITDA FCF Conversion defined as (Adj. EBITDA – Capex) / Adj. EBITDA
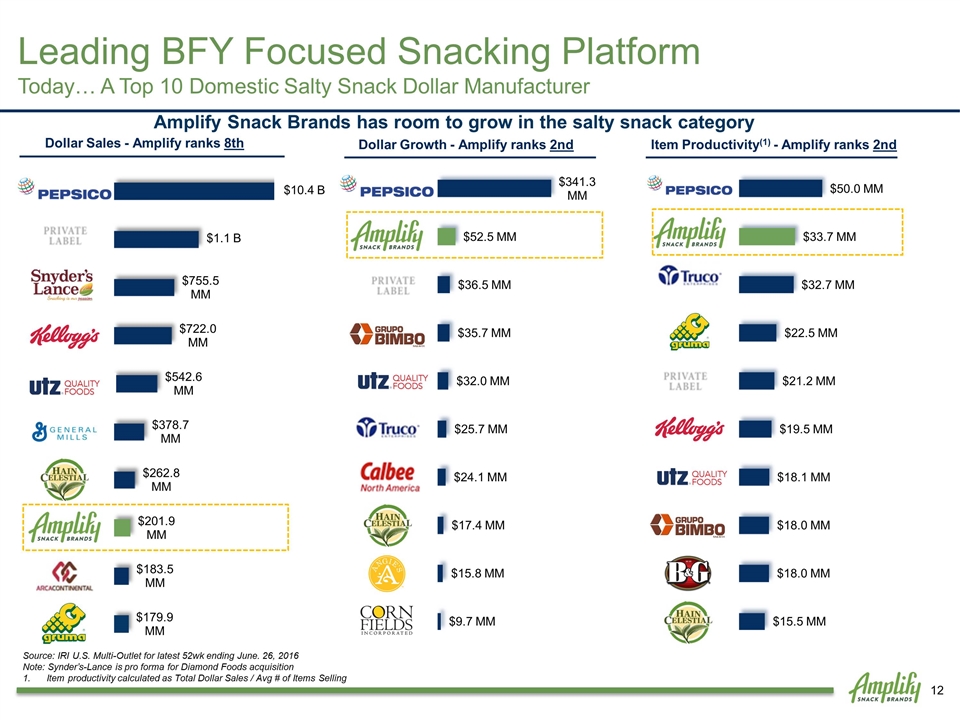
Leading BFY Focused Snacking Platform Today… A Top 10 Domestic Salty Snack Dollar Manufacturer Source: IRI U.S. Multi-Outlet for latest 52wk ending June. 26, 2016 Note: Synder’s-Lance is pro forma for Diamond Foods acquisition Item productivity calculated as Total Dollar Sales / Avg # of Items Selling $10.4 B Amplify Snack Brands has room to grow in the salty snack category Dollar Growth - Amplify ranks 2nd Dollar Sales - Amplify ranks 8th Item Productivity(1) - Amplify ranks 2nd
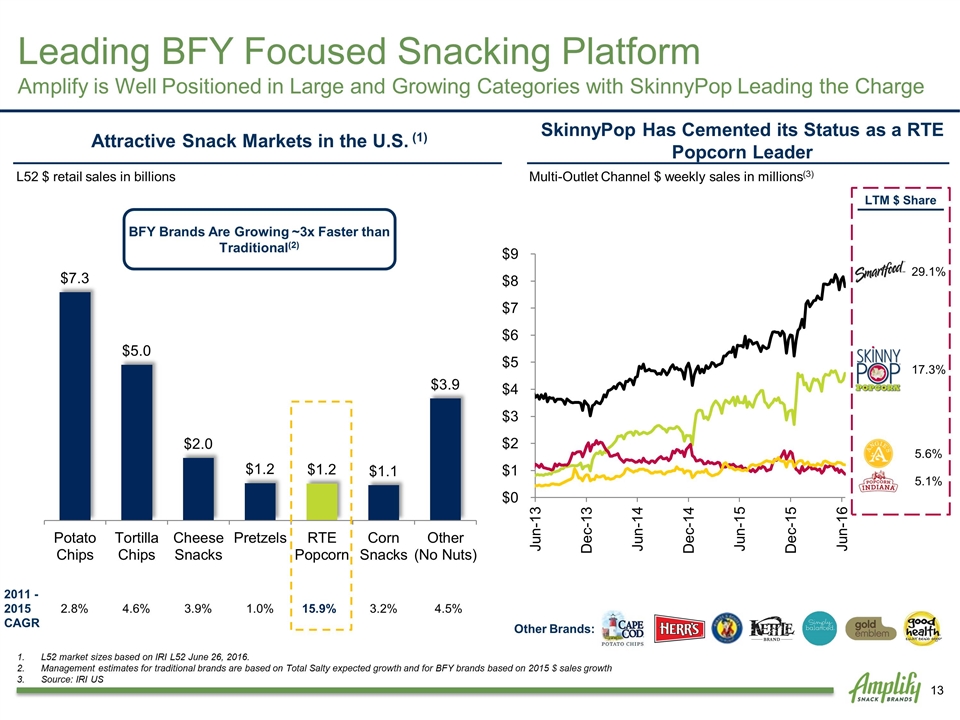
BFY Brands Are Growing ~3x Faster than Traditional(2) Attractive Snack Markets in the U.S. (1) SkinnyPop Has Cemented its Status as a RTE Popcorn Leader L52 market sizes based on IRI L52 June 26, 2016. Management estimates for traditional brands are based on Total Salty expected growth and for BFY brands based on 2015 $ sales growth Source: IRI US 2011 -2015 CAGR 2.8% 4.6% 3.9% 1.0% 15.9% 3.2% 4.5% LTM $ Share L52 $ retail sales in billions Other Brands: Multi-Outlet Channel $ weekly sales in millions(3) Leading BFY Focused Snacking Platform Amplify is Well Positioned in Large and Growing Categories with SkinnyPop Leading the Charge 29.1% 17.3% 5.6% 5.1%
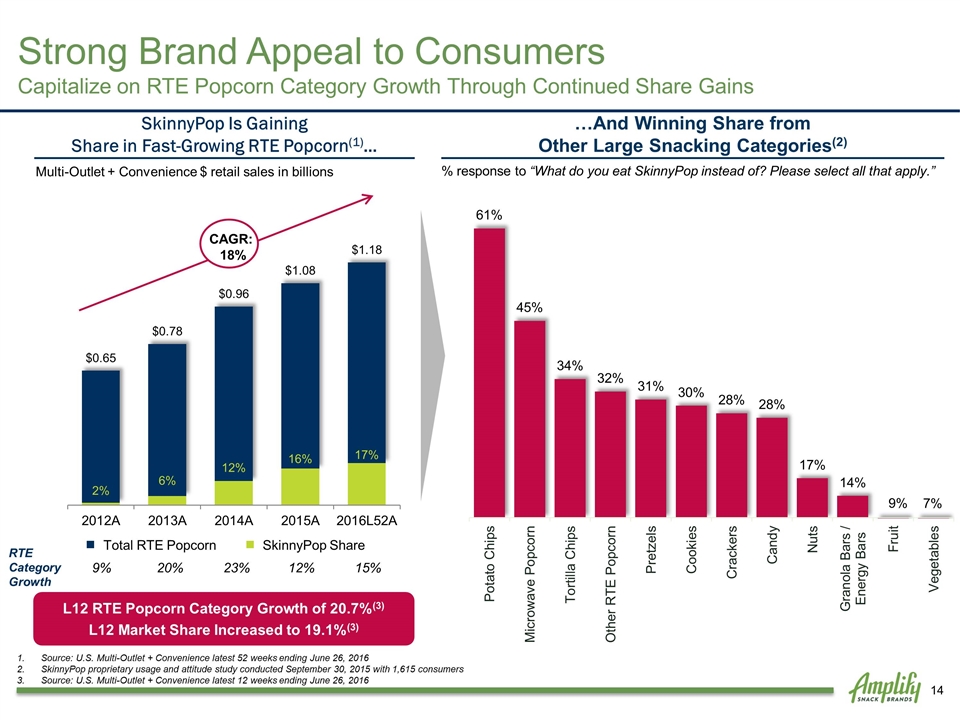
Source: U.S. Multi-Outlet + Convenience latest 52 weeks ending June 26, 2016 SkinnyPop proprietary usage and attitude study conducted September 30, 2015 with 1,615 consumers Source: U.S. Multi-Outlet + Convenience latest 12 weeks ending June 26, 2016 SkinnyPop Is Gaining Share in Fast-Growing RTE Popcorn(1)… …And Winning Share from Other Large Snacking Categories(2) Multi-Outlet + Convenience $ retail sales in billions % response to “What do you eat SkinnyPop instead of? Please select all that apply.” RTE Category Growth 9% 20% 23% 12% 15% SkinnyPop Share Total RTE Popcorn CAGR: 18% 9% 7% L12 RTE Popcorn Category Growth of 20.7%(3) L12 Market Share Increased to 19.1%(3) Strong Brand Appeal to Consumers Capitalize on RTE Popcorn Category Growth Through Continued Share Gains
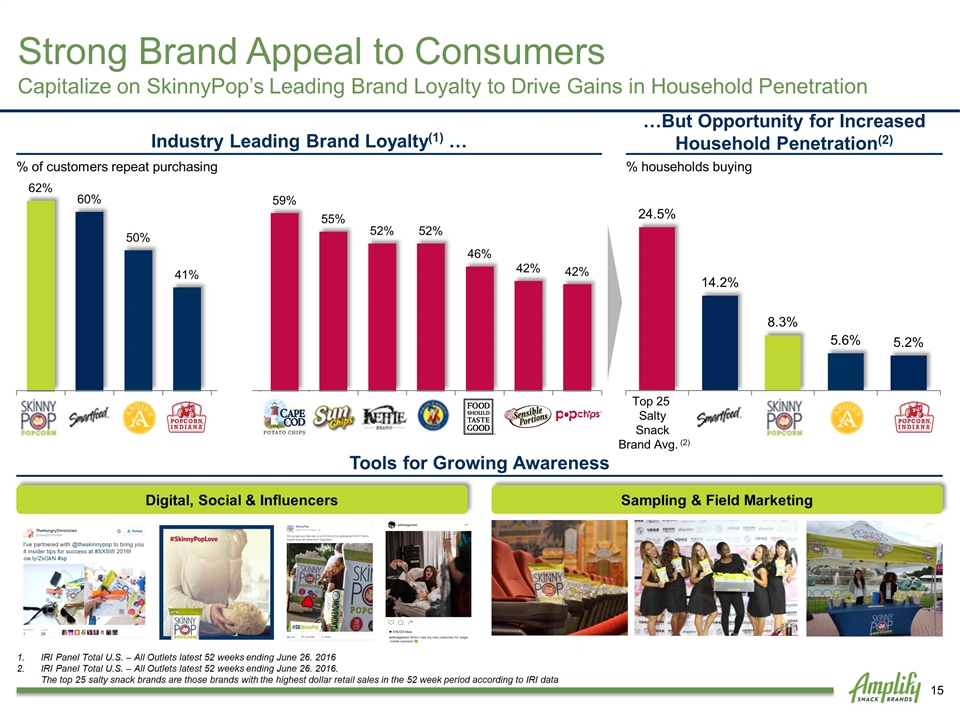
IRI Panel Total U.S. – All Outlets latest 52 weeks ending June 26. 2016 IRI Panel Total U.S. – All Outlets latest 52 weeks ending June 26. 2016. The top 25 salty snack brands are those brands with the highest dollar retail sales in the 52 week period according to IRI data Industry Leading Brand Loyalty(1) … % of customers repeat purchasing % households buying Tools for Growing Awareness Digital, Social & Influencers Sampling & Field Marketing …But Opportunity for Increased Household Penetration(2) Top 25 Salty Snack Brand Avg. (2) Strong Brand Appeal to Consumers Capitalize on SkinnyPop’s Leading Brand Loyalty to Drive Gains in Household Penetration
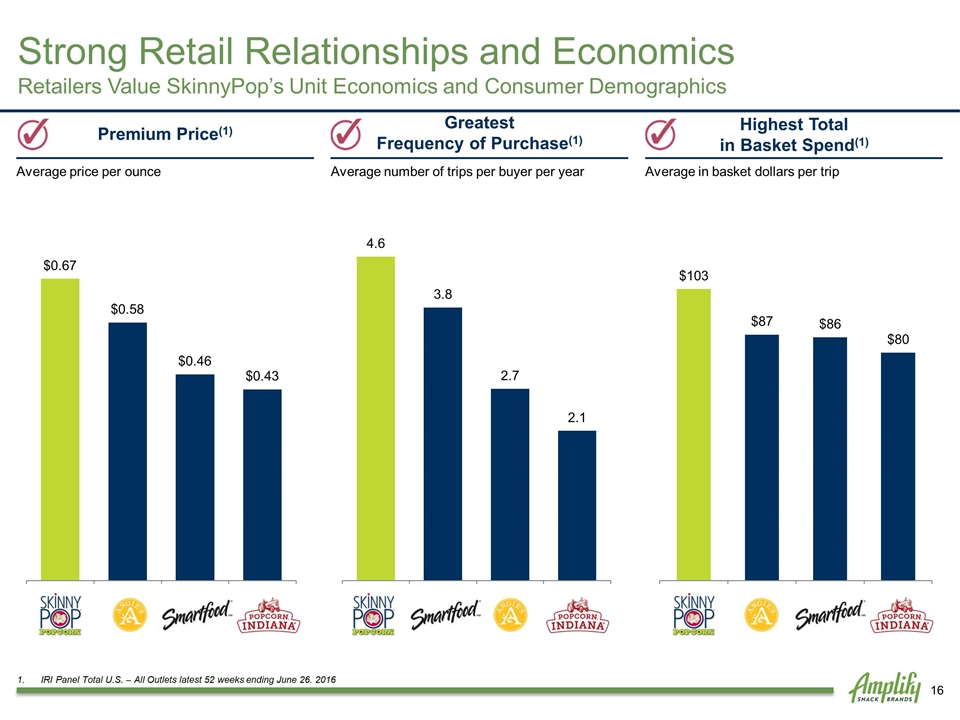
IRI Panel Total U.S. – All Outlets latest 52 weeks ending June 26. 2016 Greatest Frequency of Purchase(1) Premium Price(1) Highest Total in Basket Spend(1) Average price per ounce Average number of trips per buyer per year Average in basket dollars per trip Strong Retail Relationships and Economics Retailers Value SkinnyPop’s Unit Economics and Consumer Demographics

Retail Sales $ IRI L52(1) Customer A – Food(3) Customer C - Club(3) +32% +10% +18% % Change vs. YA 19.5% 54.0% 21.1% $ Retail Sales Market Share Total $ Retail Sales: $203M, +35% vs YA Total $ Retail Sales Market Share: 17.3% (2) 26% 44% 40% +304% 10.8% +106% 1.9% Customer Case Studies Customer B – Food(3) Customer D - Drug(3) 46% Source: IRI U.S. Multi-Outlet + Convenience for latest 52 weeks ending June 26, 2016 Costco is not included in the data set 3. Source: IRI U.S. Multi-Outlet + Convenience for latest 52 weeks ending Dec. 27, 2015 Strong Retail Relationships and Economics SkinnyPop Continues to Achieve Strong Growth Rates Across All Measured Channels
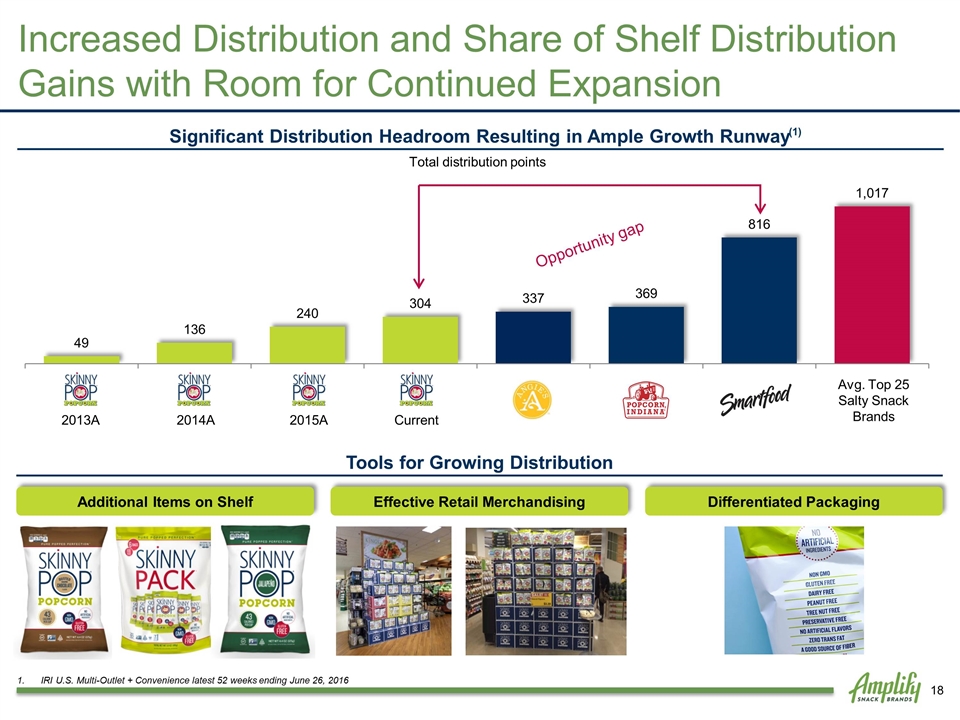
Increased Distribution and Share of Shelf Distribution Gains with Room for Continued Expansion Significant Distribution Headroom Resulting in Ample Growth Runway Tools for Growing Distribution Effective Retail Merchandising Differentiated Packaging Total distribution points Avg. Top 25 Salty Snack Brands CAGR: 108% 2013A 2014A Current 2015A Additional Items on Shelf (1) IRI U.S. Multi-Outlet + Convenience latest 52 weeks ending June 26, 2016 Opportunity gap
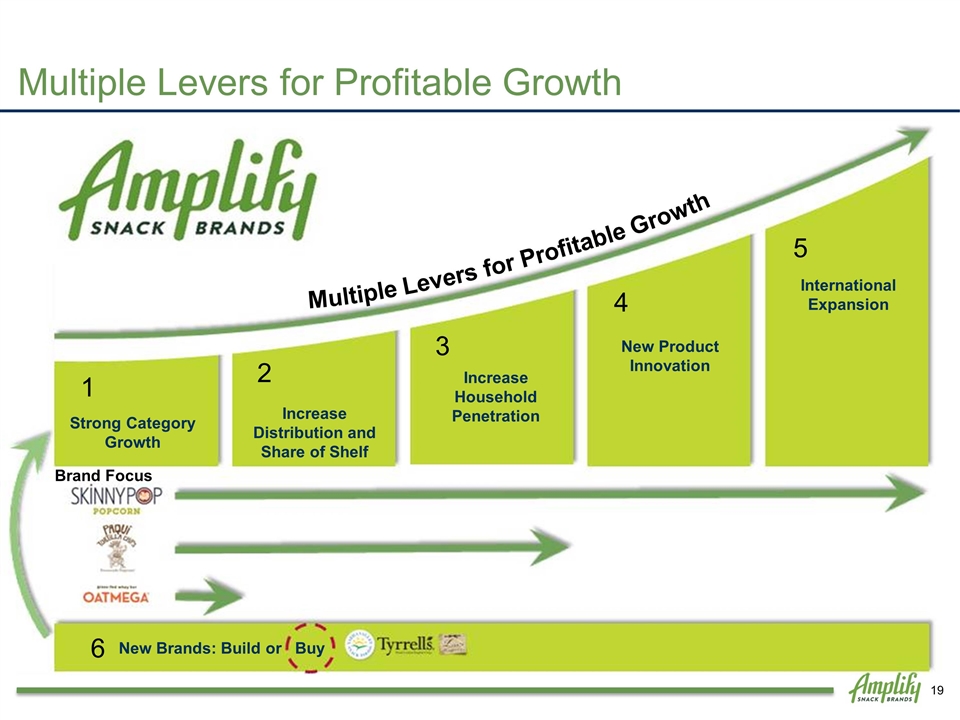
Strong Category Growth 1 Increase Distribution and Share of Shelf 2 Increase Household Penetration 3 New Product Innovation 4 5 International Expansion Multiple Levers for Profitable Growth 6 New Brands: Build or Buy Brand Focus Multiple Levers for Profitable Growth
Introduction to Tyrrells
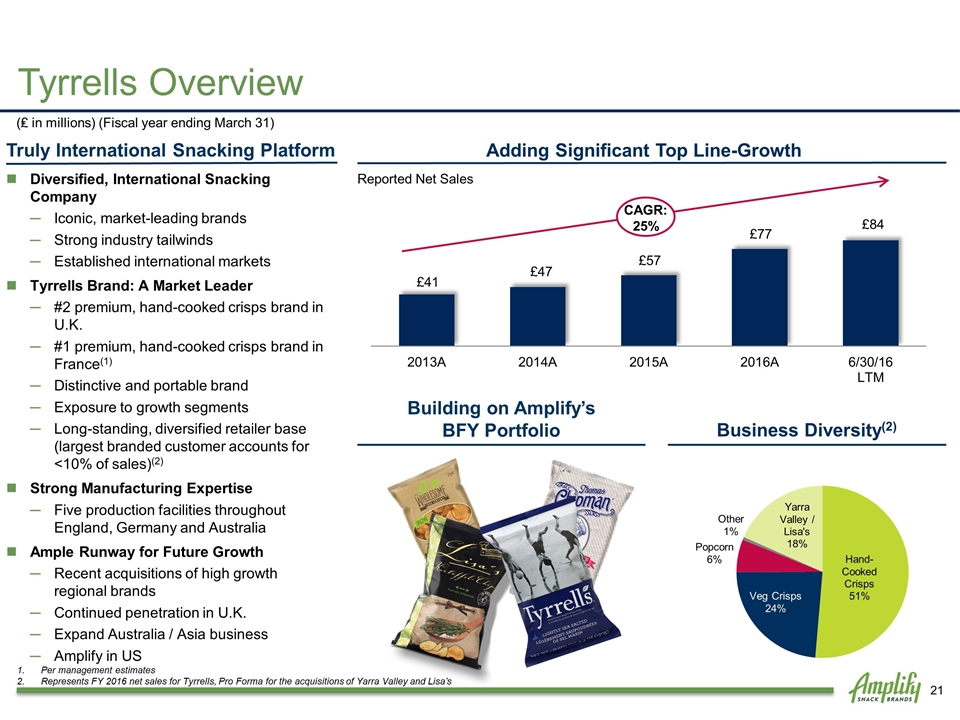
Tyrrells Overview Diversified, International Snacking Company Iconic, market-leading brands Strong industry tailwinds Established international markets Tyrrells Brand: A Market Leader #2 premium, hand-cooked crisps brand in U.K. #1 premium, hand-cooked crisps brand in France(1) Distinctive and portable brand Exposure to growth segments Long-standing, diversified retailer base (largest branded customer accounts for <10% of sales)(2) Strong Manufacturing Expertise Five production facilities throughout England, Germany and Australia Ample Runway for Future Growth Recent acquisitions of high growth regional brands Continued penetration in U.K. Expand Australia / Asia business Amplify in US Adding Significant Top Line-Growth Truly International Snacking Platform (₤ in millions) (Fiscal year ending March 31) Business Diversity(2) Product Breakdown Retailer Breakdown Per management estimates Represents FY 2016 net sales for Tyrrells, Pro Forma for the acquisitions of Yarra Valley and Lisa’s Reported Net Sales CAGR: 25% Building on Amplify’s BFY Portfolio
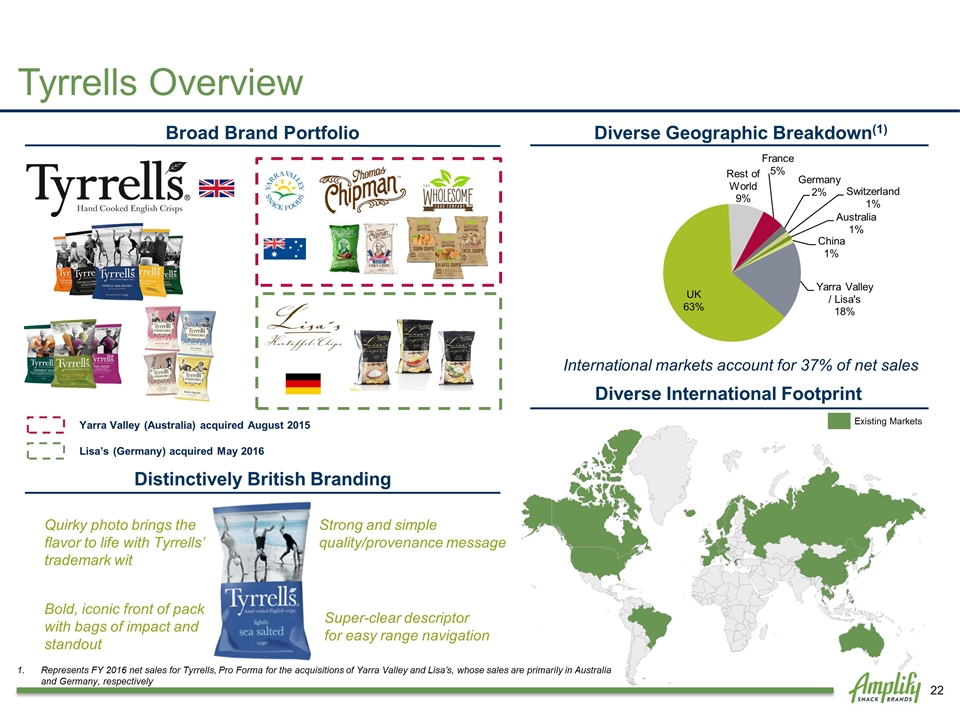
Tyrrells Overview Broad Brand Portfolio Distinctively British Branding Bold, iconic front of pack with bags of impact and standout Quirky photo brings the flavour to life with our trademark wit Strong and simple quality/provenance message Super-clear descriptor for easy range navigation Yarra Valley (Australia) acquired August 2015 Lisa’s (Germany) acquired May 2016 Bold, iconic front of pack with bags of impact and standout Quirky photo brings the flavor to life with Tyrrells’ trademark wit Strong and simple quality/provenance message Super-clear descriptor for easy range navigation Existing Markets Diverse International Footprint Diverse Geographic Breakdown(1) International markets account for 37% of net sales Represents FY 2016 net sales for Tyrrells, Pro Forma for the acquisitions of Yarra Valley and Lisa’s, whose sales are primarily in Australia and Germany, respectively
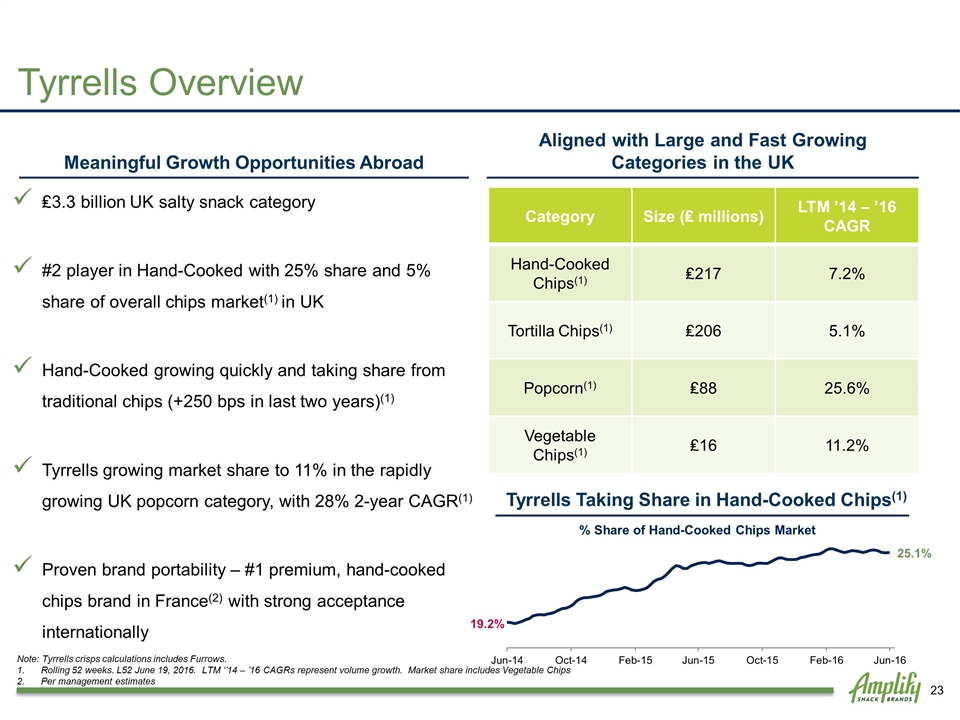
Tyrrells Overview Note: Tyrrells crisps calculations includes Furrows. Rolling 52 weeks. L52 June 19, 2016. LTM ‘’14 – ’16 CAGRs represent volume growth. Market share includes Vegetable Chips Per management estimates Aligned with Large and Fast Growing Categories in the UK ₤3.3 billion UK salty snack category #2 player in Hand-Cooked with 25% share and 5% share of overall chips market(1) in UK Hand-Cooked growing quickly and taking share from traditional chips (+250 bps in last two years)(1) Tyrrells growing market share to 11% in the rapidly growing UK popcorn category, with 28% 2-year CAGR(1) Proven brand portability – #1 premium, hand-cooked chips brand in France(2) with strong acceptance internationally Meaningful Growth Opportunities Abroad Diverse Product Composition Category Size (₤ millions) LTM ’14 – ’16 CAGR Hand-Cooked Chips(1) ₤217 7.2% Tortilla Chips(1) ₤206 5.1% Popcorn(1) ₤88 25.6% Vegetable Chips(1) ₤16 11.2% Tyrrells Taking Share in Hand-Cooked Chips(1) 19.2% 25.1%
Combination of Two Leading BFY Snacking Platforms $200+ million in revenue $100+ million in revenue
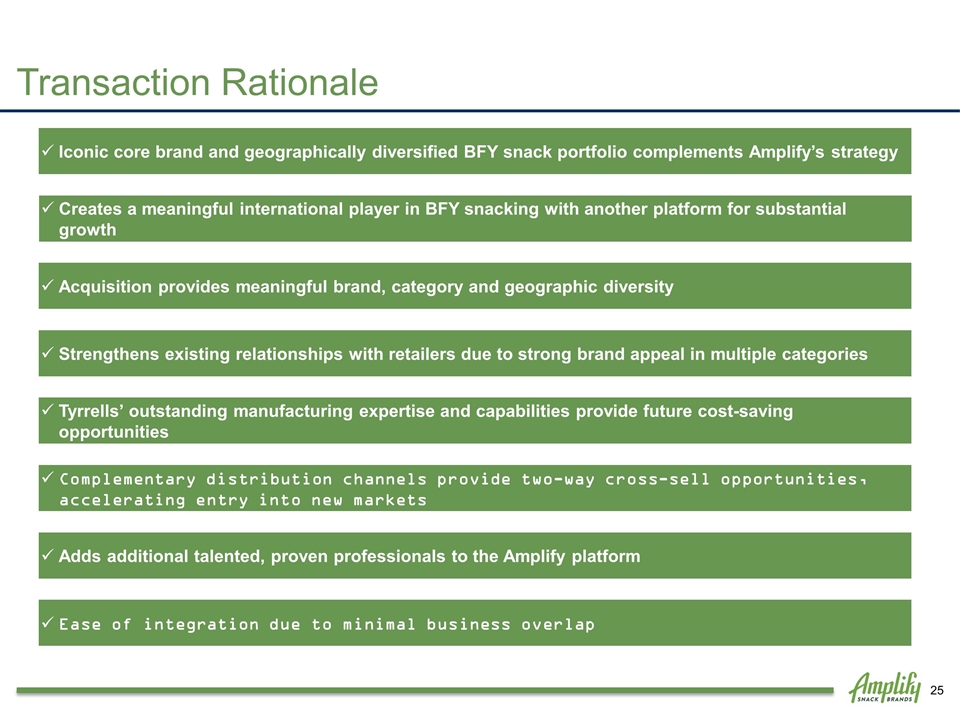
Transaction Rationale Iconic core brand and geographically diversified BFY snack portfolio complements Amplify’s strategy Acquisition provides meaningful brand, category and geographic diversity Creates a meaningful international player in BFY snacking with another platform for substantial growth Complementary distribution channels provide two-way cross-sell opportunities, accelerating entry into new markets Tyrrells’ outstanding manufacturing expertise and capabilities provide future cost-saving opportunities Current Amplify Snack Brands1 62% Ease of integration due to minimal business overlap Adds additional talented, proven professionals to the Amplify platform Strengthens existing relationships with retailers due to strong brand appeal in multiple categories

Credit Highlights
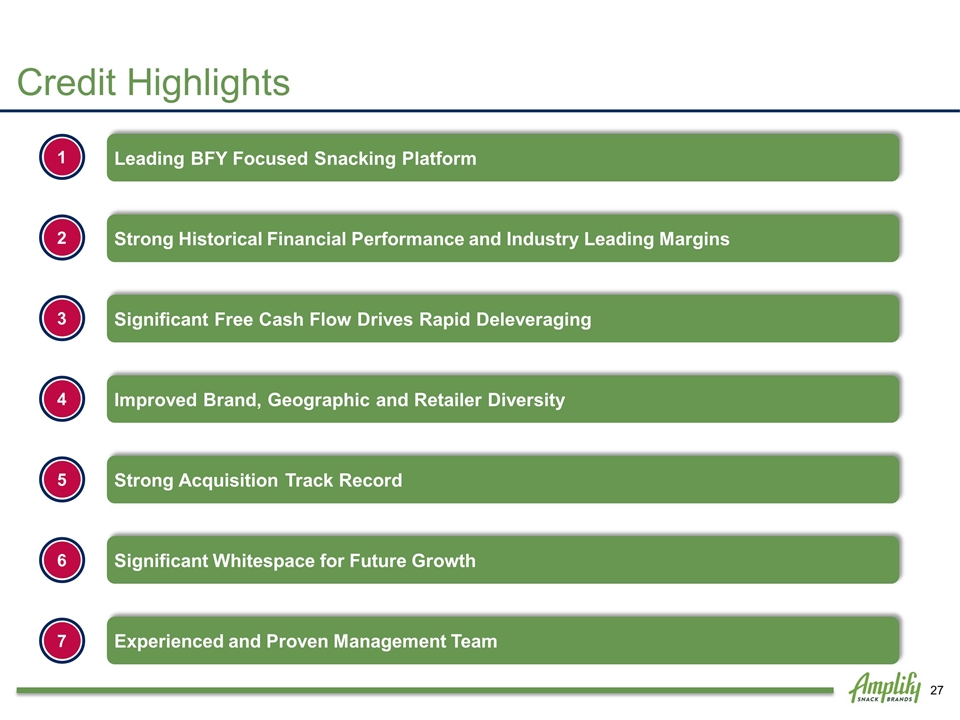
Strong Acquisition Track Record Leading BFY Focused Snacking Platform Improved Brand, Geographic and Retailer Diversity Experienced and Proven Management Team 7 Credit Highlights Strong Historical Financial Performance and Industry Leading Margins Significant Free Cash Flow Drives Rapid Deleveraging Significant Whitespace for Future Growth 1 2 4 5 6 3
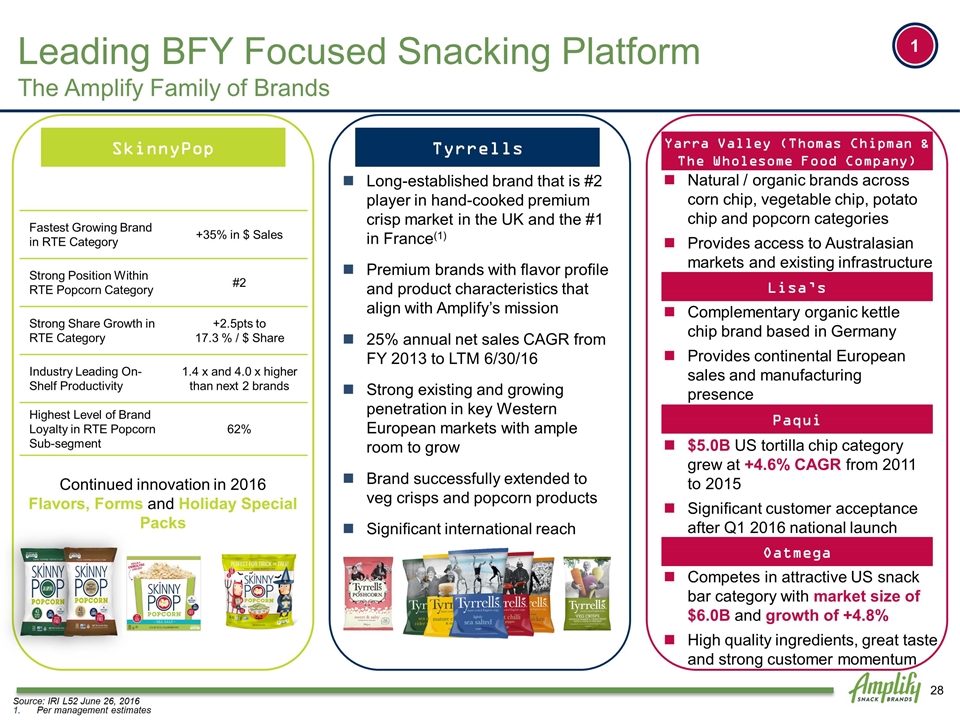
Source: IRI L52 June 26, 2016 Per management estimates ` SkinnyPop Paqui Oatmega & Perfect Cookie Large addressable market of $4.9B, which grew at +4.8% CAGR from 2010 to 2015 No current leader in fragmented BFY tortilla chip market, creating significant opportunity for growth Fastest Growing Brand in RTE Category +35% in $ Sales Strong Position Within RTE Popcorn Category #2 Strong Share Growth in RTE Category +2.5pts to 17.3 % / $ Share Industry Leading On-Shelf Productivity 1.4 x and 4.0 x higher than next 2 brands Highest Level of Brand Loyalty in RTE Popcorn Sub-segment 62% Continued innovation in 2016 Flavors, Forms and Holiday Special Packs Oatmega competes in attractive snack category with a large market size of $5.9B and growth of +4.6% High-quality ingredients aligned with Amplify’s product portfolio Strong national launch in 2016 Strong customer acceptance 26% ACV L52 Continued distribution build Sales and marketing efforts underway to drive consumer trial Entry point into the healthy cookie sub-segment Great taste Strong customer momentum Tyrrells Long-established brand that is #2 player in hand-cooked premium crisp market in the UK and the #1 in France(1) Premium brands with flavor profile and product characteristics that align with Amplify’s mission 25% annual net sales CAGR from FY 2013 to LTM 6/30/16 Strong existing and growing penetration in key Western European markets with ample room to grow Brand successfully extended to veg crisps and popcorn products Significant international reach Yarra Valley (Thomas Chipman & The Wholesome Food Company) Lisa’s Paqui Oatmega Competes in attractive US snack bar category with market size of $6.0B and growth of +4.8% High quality ingredients, great taste and strong customer momentum $5.0B US tortilla chip category grew at +4.6% CAGR from 2011 to 2015 Significant customer acceptance after Q1 2016 national launch Complementary organic kettle chip brand based in Germany Provides continental European sales and manufacturing presence Natural / organic brands across corn chip, vegetable chip, potato chip and popcorn categories Provides access to Australasian markets and existing infrastructure Leading BFY Focused Snacking Platform The Amplify Family of Brands 1
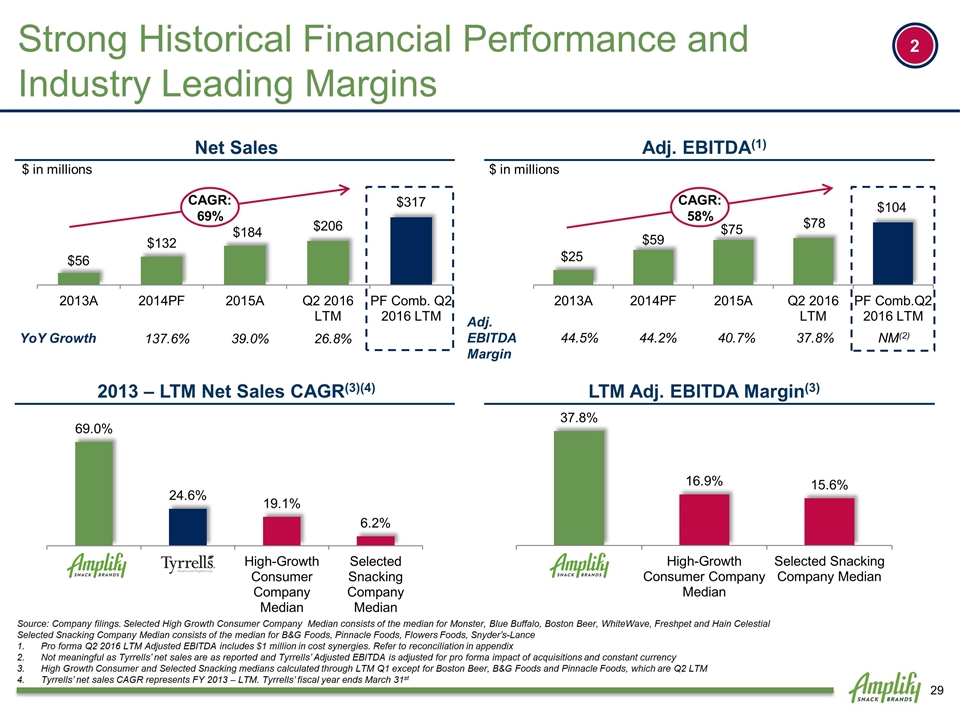
Net Sales Adj. SG&A(2) Adj. EBITDA SG&A % of Net Sales(2) 14.1% 12.3% 15.3% 16.8% 17.3% Adj. EBITDA Margin 44.5% 44.2% 40.7% 37.8% 31.4% $ in millions CAGR: 82% $ in millions $ in millions CAGR: 58% Strong Historical Financial Performance and Industry Leading Margins 2013A 2014PF 2015A 2016 PF 2016 Q2 LTM Q2 LTM 2013A 2014PF 2015A 2016 PF 2016 Q2 LTM Q2 LTM Adj. EBITDA(1) $ in millions 2013 – LTM Net Sales CAGR(3)(4) LTM Adj. EBITDA Margin(3) Source: Company filings. Selected High Growth Consumer Company Median consists of the median for Monster, Blue Buffalo, Boston Beer, WhiteWave, Freshpet and Hain Celestial Selected Snacking Company Median consists of the median for B&G Foods, Pinnacle Foods, Flowers Foods, Snyder’s-Lance Pro forma Q2 2016 LTM Adjusted EBITDA includes $1 million in cost synergies. Refer to reconciliation in appendix Not meaningful as Tyrrells’ net sales are as reported and Tyrrells’ Adjusted EBITDA is adjusted for pro forma impact of acquisitions and constant currency High Growth Consumer and Selected Snacking medians calculated through LTM Q1 except for Boston Beer, B&G Foods and Pinnacle Foods, which are Q2 LTM Tyrrells’ net sales CAGR represents FY 2013 – LTM. Tyrrells’ fiscal year ends March 31st 2 YoY Growth 137.6% 39.0% 26.8% CAGR: 69% Adj. EBITDA Margin 44.5% 44.2% 40.7% 37.8% NM(2) CAGR: 58%
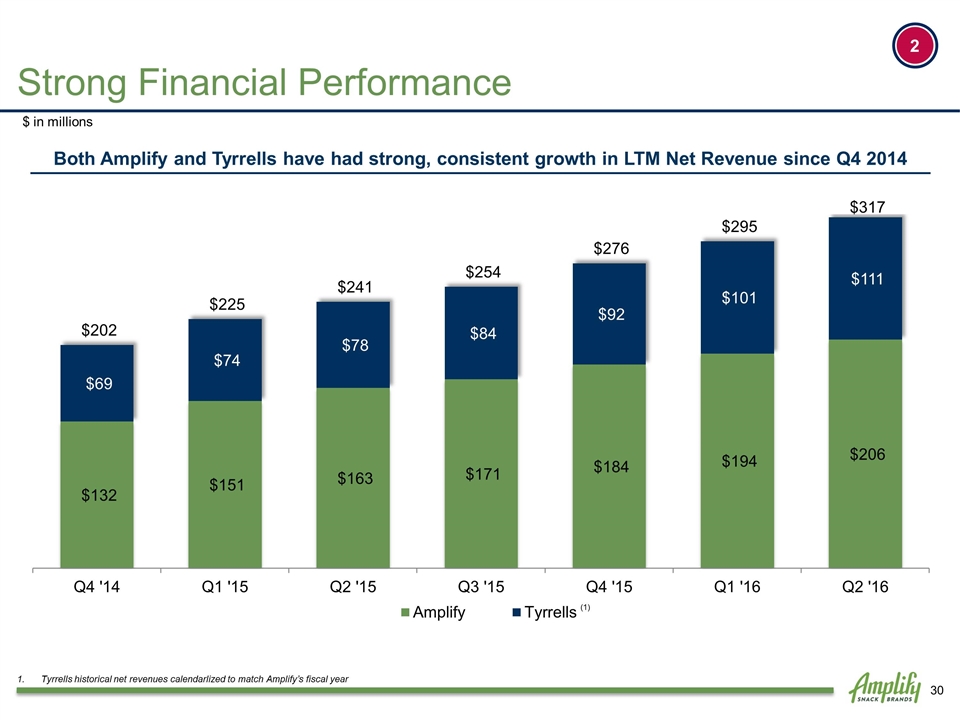
Strong Financial Performance $ in millions (1) Tyrrells historical net revenues calendarlized to match Amplify’s fiscal year 2 Both Amplify and Tyrrells have had strong, consistent growth in LTM Net Revenue since Q4 2014
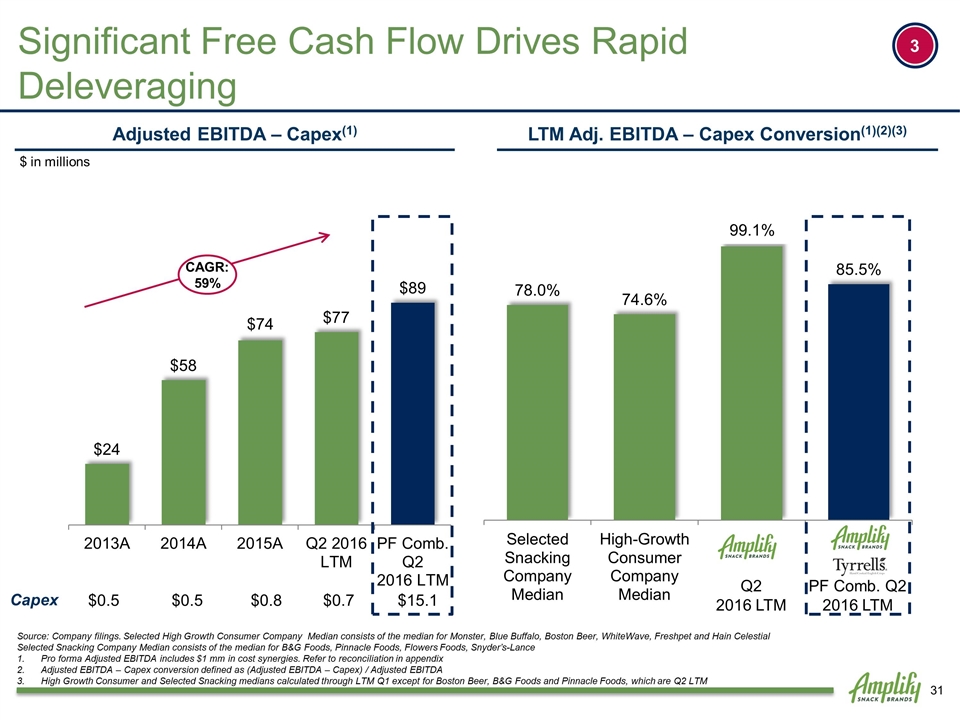
Strong Cash Flow and Liquidity Source: Company filings. Selected High Growth Consumer Company Median consists of the median for Monster, Blue Buffalo, Boston Beer, WhiteWave, Freshpet and Hain Celestial Selected Snacking Company Median consists of the median for B&G Foods, Pinnacle Foods, Flowers Foods, Snyder’s-Lance Pro forma Adjusted EBITDA includes $1 mm in cost synergies. Refer to reconciliation in appendix Adjusted EBITDA – Capex conversion defined as (Adjusted EBITDA – Capex) / Adjusted EBITDA High Growth Consumer and Selected Snacking medians calculated through LTM Q1 except for Boston Beer, B&G Foods and Pinnacle Foods, which are Q2 LTM Significant Free Cash Flow Drives Rapid Deleveraging LTM Adj. EBITDA – Capex Conversion(1)(2)(3) 3 Q2 2016 LTM PF Comb. Q2 2016 LTM Adjusted EBITDA – Capex(1) $ in millions CAGR: 59% Capex $0.5 $0.5 $0.8 $0.7 $15.1
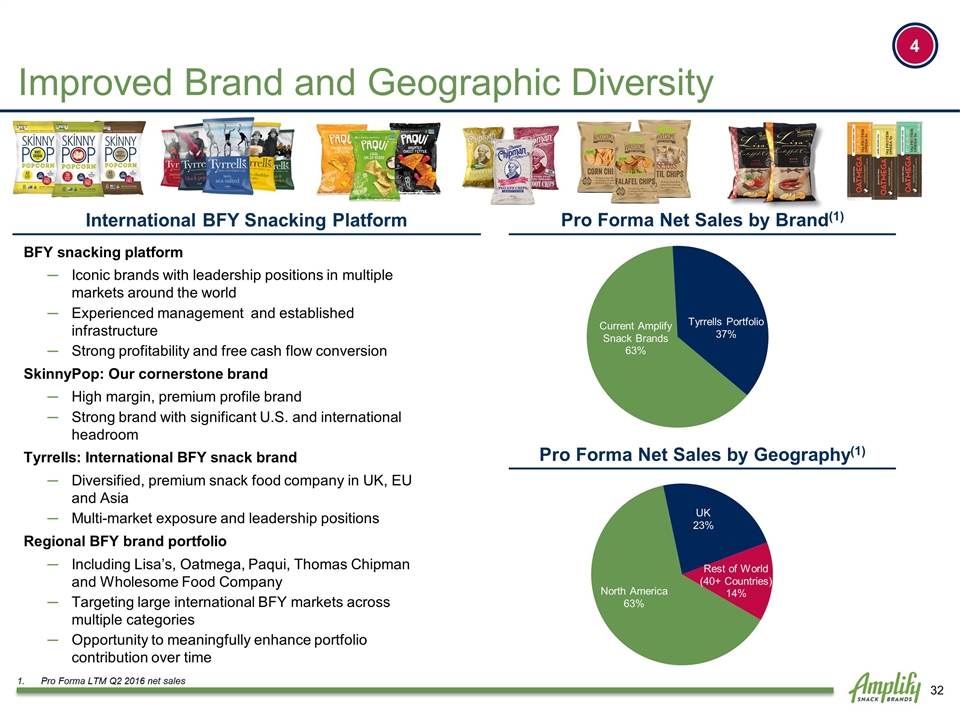
Improved Brand and Geographic Diversity Pro Forma Net Sales by Brand(1) Pro Forma Net Sales by Geography(1) BFY snacking platform Iconic brands with leadership positions in multiple markets around the world Experienced management and established infrastructure Strong profitability and free cash flow conversion SkinnyPop: Our cornerstone brand High margin, premium profile brand Strong brand with significant U.S. and international headroom Tyrrells: International BFY snack brand Diversified, premium snack food company in UK, EU and Asia Multi-market exposure and leadership positions Regional BFY brand portfolio Including Lisa’s, Oatmega, Paqui, Thomas Chipman and Wholesome Food Company Targeting large international BFY markets across multiple categories Opportunity to meaningfully enhance portfolio contribution over time International BFY Snacking Platform 4 Pro Forma LTM Q2 2016 net sales
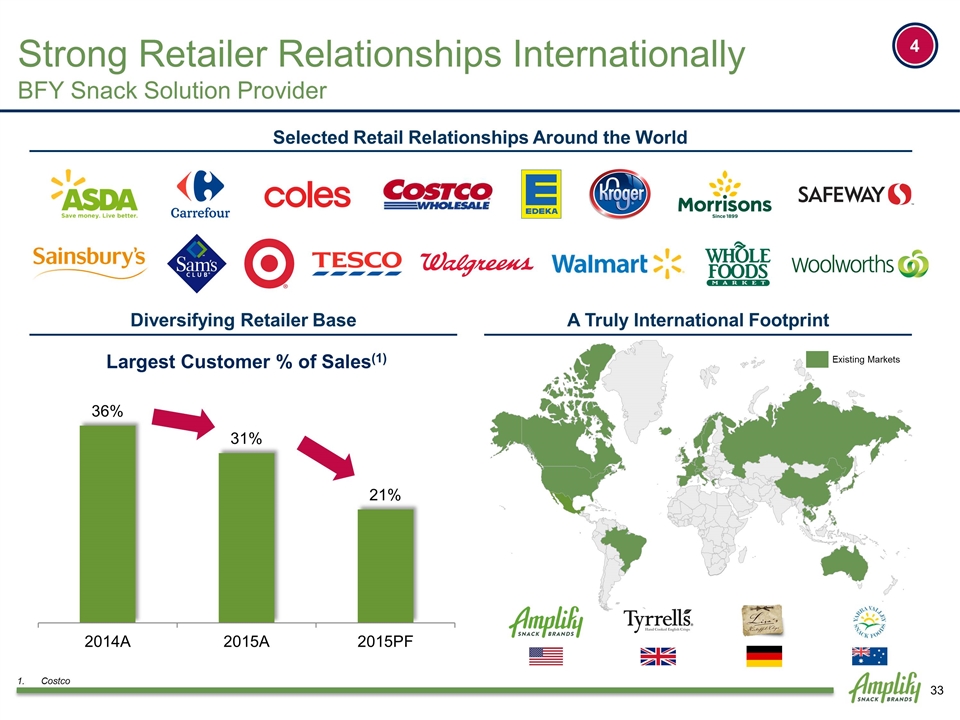
Diversifying Retailer Base Selected Retail Relationships Around the World 4 Strong Retailer Relationships Internationally BFY Snack Solution Provider Existing Markets A Truly International Footprint Costco
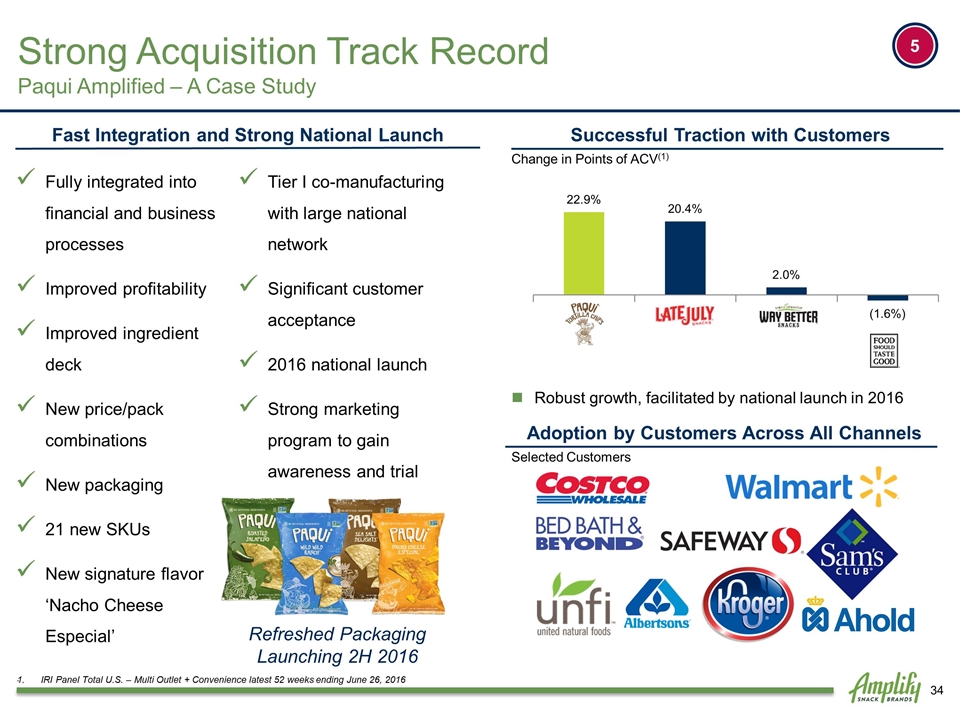
Robust growth, facilitated by national launch in 2016 . Fast Integration and Strong National Launch Fully integrated into financial and business processes Improved profitability Improved ingredient deck New price/pack combinations New packaging 21 new SKUs New signature flavor ‘Nacho Cheese Especial’ Tier I co-manufacturing with large national network Significant customer acceptance 2016 national launch Strong marketing program to gain awareness and trial Successful Traction with Customers Change in Points of ACV(1) IRI Panel Total U.S. – Multi Outlet + Convenience latest 52 weeks ending June 26, 2016 Adoption by Customers Across All Channels Selected Customers Strong Acquisition Track Record Paqui Amplified – A Case Study 5 Refreshed Packaging Launching 2H 2016
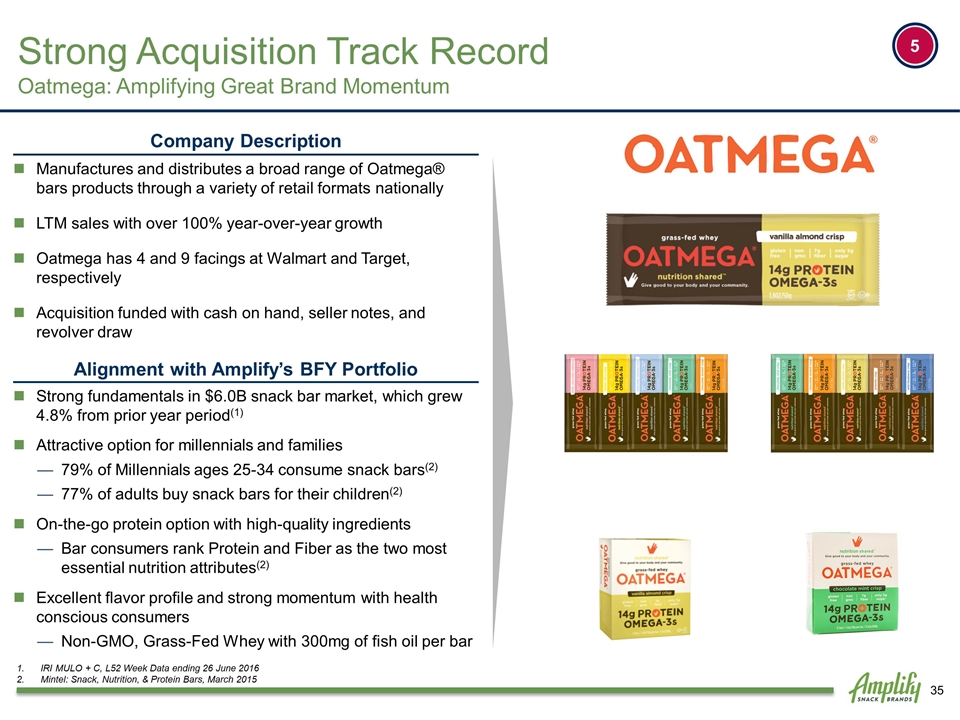
Strong Acquisition Track Record Oatmega: Amplifying Great Brand Momentum Company Description Manufactures and distributes a broad range of Oatmega® bars products through a variety of retail formats nationally LTM sales with over 100% year-over-year growth Oatmega has 4 and 9 facings at Walmart and Target, respectively Acquisition funded with cash on hand, seller notes, and revolver draw Alignment with Amplify’s BFY Portfolio Strong fundamentals in $6.0B snack bar market, which grew 4.8% from prior year period(1) Attractive option for millennials and families 79% of Millennials ages 25-34 consume snack bars(2) 77% of adults buy snack bars for their children(2) On-the-go protein option with high-quality ingredients Bar consumers rank Protein and Fiber as the two most essential nutrition attributes(2) Excellent flavor profile and strong momentum with health conscious consumers Non-GMO, Grass-Fed Whey with 300mg of fish oil per bar IRI MULO + C, L52 Week Data ending 26 June 2016 Mintel: Snack, Nutrition, & Protein Bars, March 2015 5
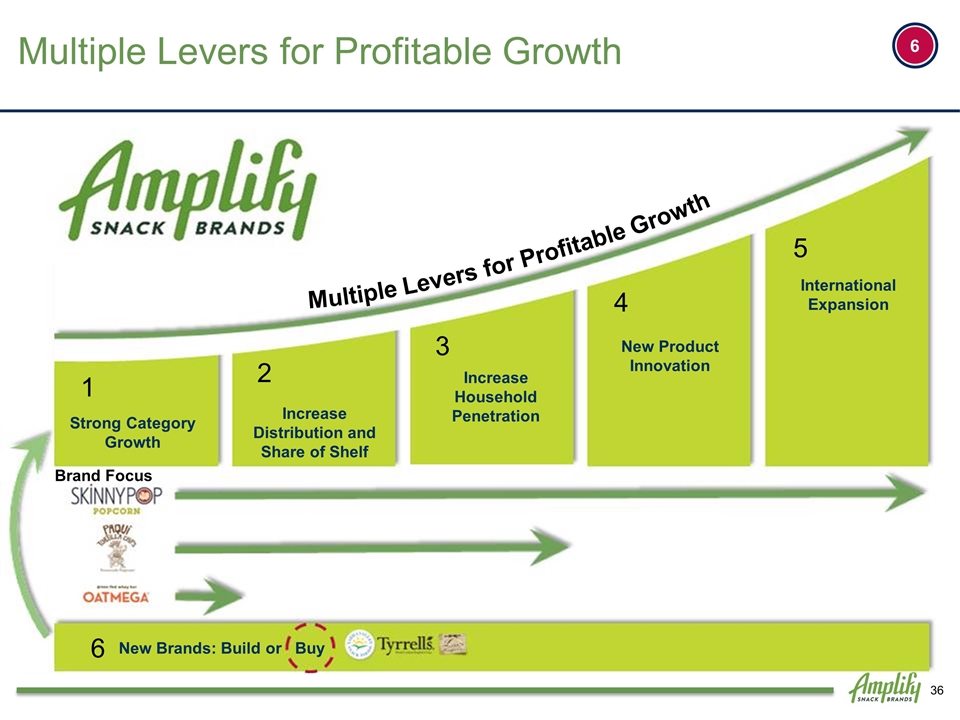
Strong Category Growth 1 Increase Distribution and Share of Shelf 2 Increase Household Penetration 3 New Product Innovation 4 5 International Expansion Multiple Levers for Profitable Growth 6 New Brands: Build or Buy Brand Focus Multiple Levers for Profitable Growth 6
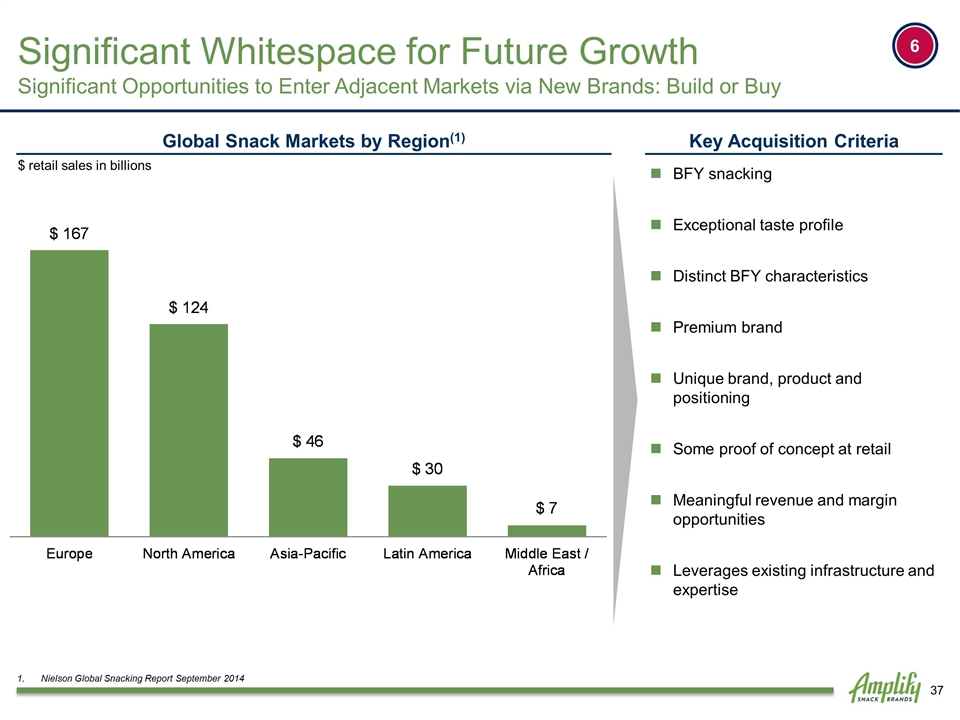
Nielson Global Snacking Report September 2014 Global Snack Markets by Region(1) Key Acquisition Criteria BFY snacking Exceptional taste profile Distinct BFY characteristics Premium brand Unique brand, product and positioning Some proof of concept at retail Meaningful revenue and margin opportunities Leverages existing infrastructure and expertise $ retail sales in billions Significant Whitespace for Future Growth Significant Opportunities to Enter Adjacent Markets via New Brands: Build or Buy 6
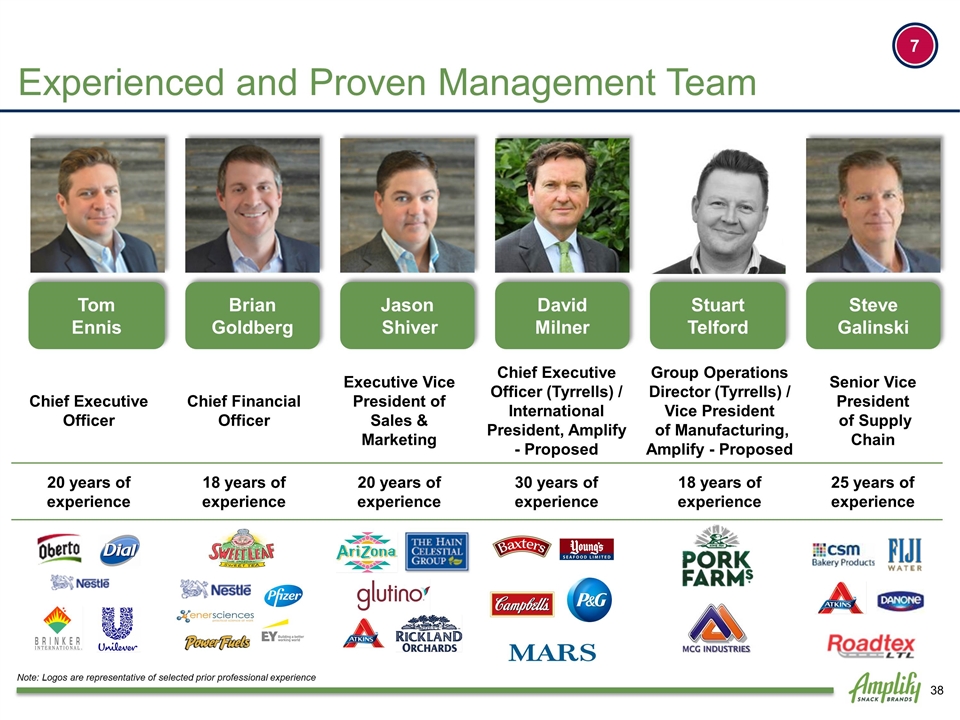
Chief Executive Officer Chief Financial Officer Executive Vice President of Sales & Marketing Chief Executive Officer (Tyrrells) / International President, Amplify - Proposed Group Operations Director (Tyrrells) / Vice President of Manufacturing, Amplify - Proposed Senior Vice President of Supply Chain 20 years of experience 18 years of experience 20 years of experience 30 years of experience 18 years of experience 25 years of experience Note: Logos are representative of selected prior professional experience Tom Ennis Brian Goldberg Jason Shiver Stuart Telford Steve Galinski Experienced and Proven Management Team David Milner 7
Financial Overview
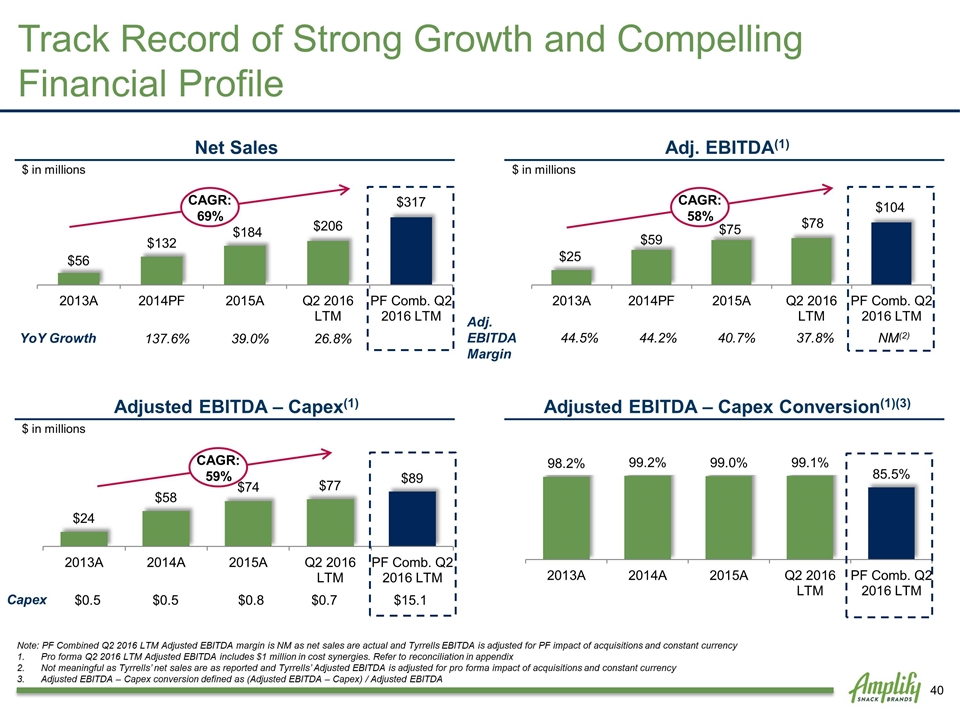
Note: PF Combined Q2 2016 LTM Adjusted EBITDA margin is NM as net sales are actual and Tyrrells EBITDA is adjusted for PF impact of acquisitions and constant currency Pro forma Q2 2016 LTM Adjusted EBITDA includes $1 million in cost synergies. Refer to reconciliation in appendix Not meaningful as Tyrrells’ net sales are as reported and Tyrrells’ Adjusted EBITDA is adjusted for pro forma impact of acquisitions and constant currency Adjusted EBITDA – Capex conversion defined as (Adjusted EBITDA – Capex) / Adjusted EBITDA Adj. Gross Profit Adj. SG&A SG&A % of Net Sales(2) 14.1% 12.3% 15.3% 16.8% 17.3% $ in millions CAGR: 82% $ in millions CAGR: 64% Track Record of Strong Growth and Compelling Financial Profile Adj. Gross Margin 58.6% 56.5% 56.1% 54.6% 50.0% 2013A 2014A 2015A 2016 PF 2016 Q2 LTM Q2 LTM 2013A 2014A 2015A 2016 PF 2016 Q2 LTM Q2 LTM Net Sales YoY Growth 137.6% 39.0% 26.8% $ in millions CAGR: 69% Adj. EBITDA(1) Adj. EBITDA Margin 44.5% 44.2% 40.7% 37.8% NM(2) $ in millions CAGR: 58% (2) (2)(3) Adjusted EBITDA – Capex(1) $ in millions Adjusted EBITDA – Capex Conversion(1)(3) Capex $0.5 $0.5 $0.8 $0.7 $15.1 CAGR: 59%
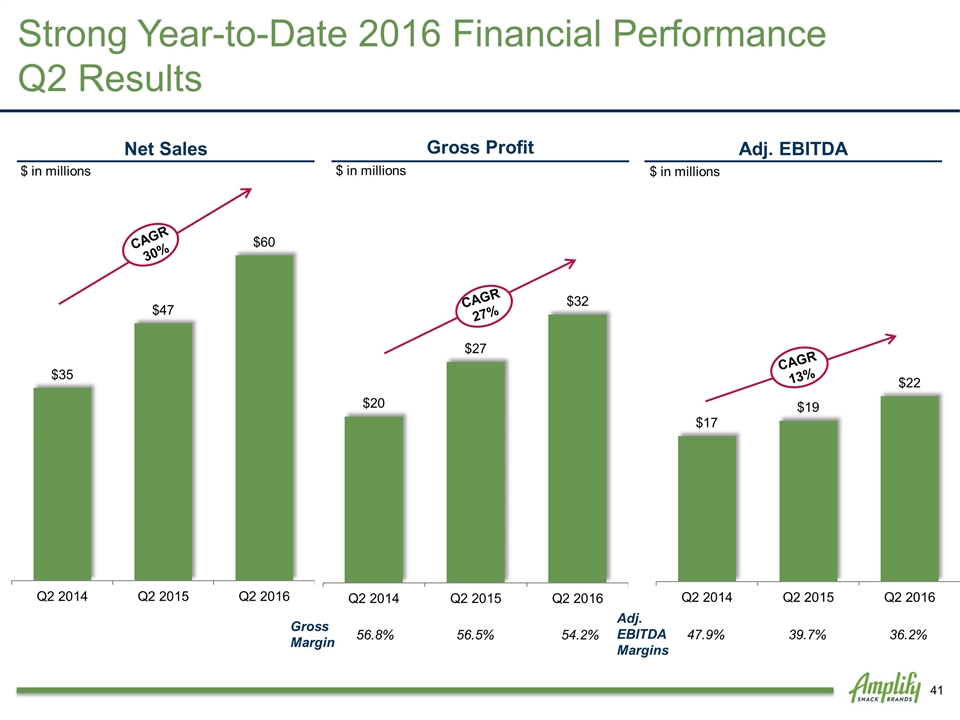
Strong Year-to-Date 2016 Financial Performance Q2 Results Net Sales $ in millions $ in millions Gross Margin 56.8% 56.5% 54.2% Gross Profit Adj. EBITDA $ in millions Adj. EBITDA Margins 47.9% 39.7% 36.2% CAGR 30% CAGR 27% CAGR13%
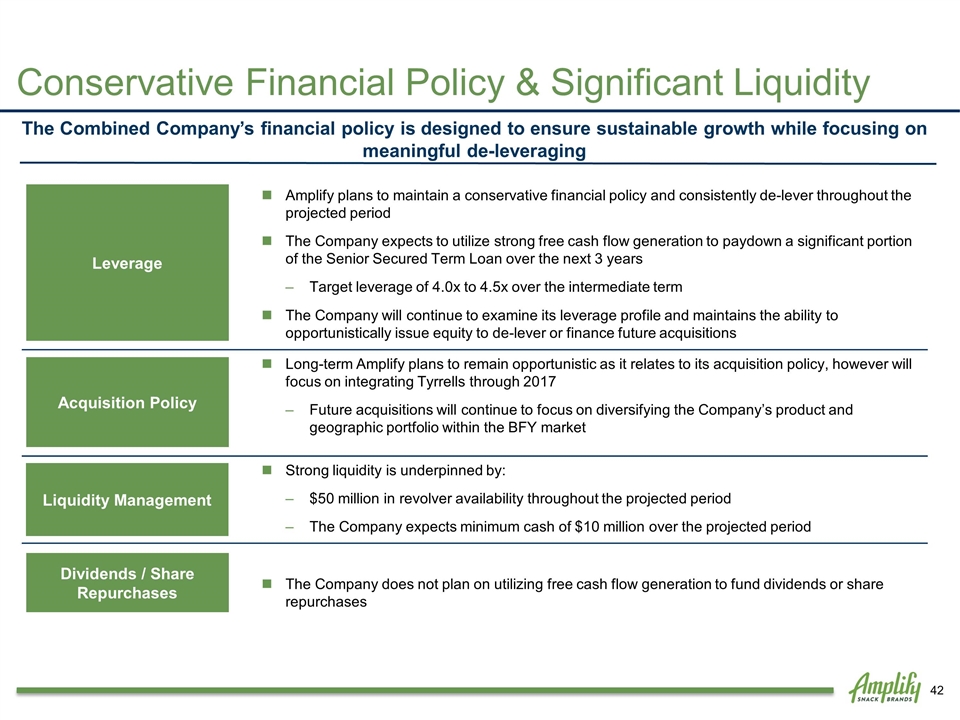
Amplify plans to maintain a conservative financial policy and consistently de-lever throughout the projected period The Company expects to utilize strong free cash flow generation to paydown a significant portion of the Senior Secured Term Loan over the next 3 years Target leverage of 4.0x to 4.5x over the intermediate term The Company will continue to examine its leverage profile and maintains the ability to opportunistically issue equity to de-lever or finance future acquisitions Long-term Amplify plans to remain opportunistic as it relates to its acquisition policy, however will focus on integrating Tyrrells through 2017 Future acquisitions will continue to focus on diversifying the Company’s product and geographic portfolio within the BFY market Strong liquidity is underpinned by: $50 million in revolver availability throughout the projected period The Company expects minimum cash of $10 million over the projected period The Company does not plan on utilizing free cash flow generation to fund dividends or share repurchases The Combined Company’s financial policy is designed to ensure sustainable growth while focusing on meaningful de-leveraging Leverage Acquisition Policy Liquidity Management Dividends / Share Repurchases Conservative Financial Policy & Significant Liquidity
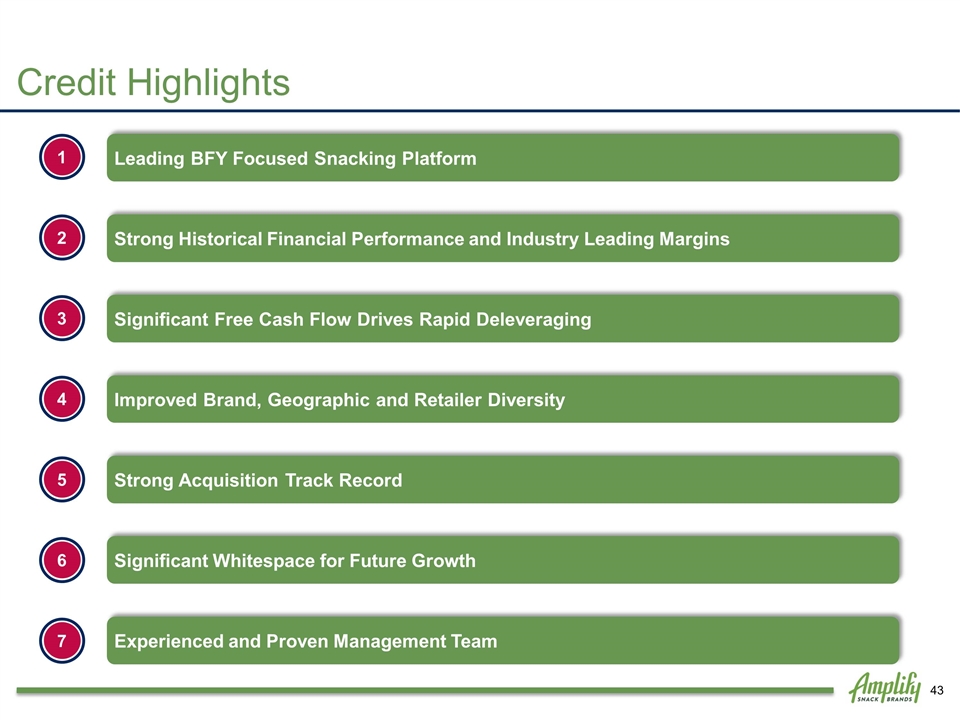
Strong Acquisition Track Record Leading BFY Focused Snacking Platform Improved Brand, Geographic and Retailer Diversity Experienced and Proven Management Team 7 Credit Highlights Strong Historical Financial Performance and Industry Leading Margins Significant Free Cash Flow Drives Rapid Deleveraging Significant Whitespace for Future Growth 1 2 4 5 6 3
Syndication Overview
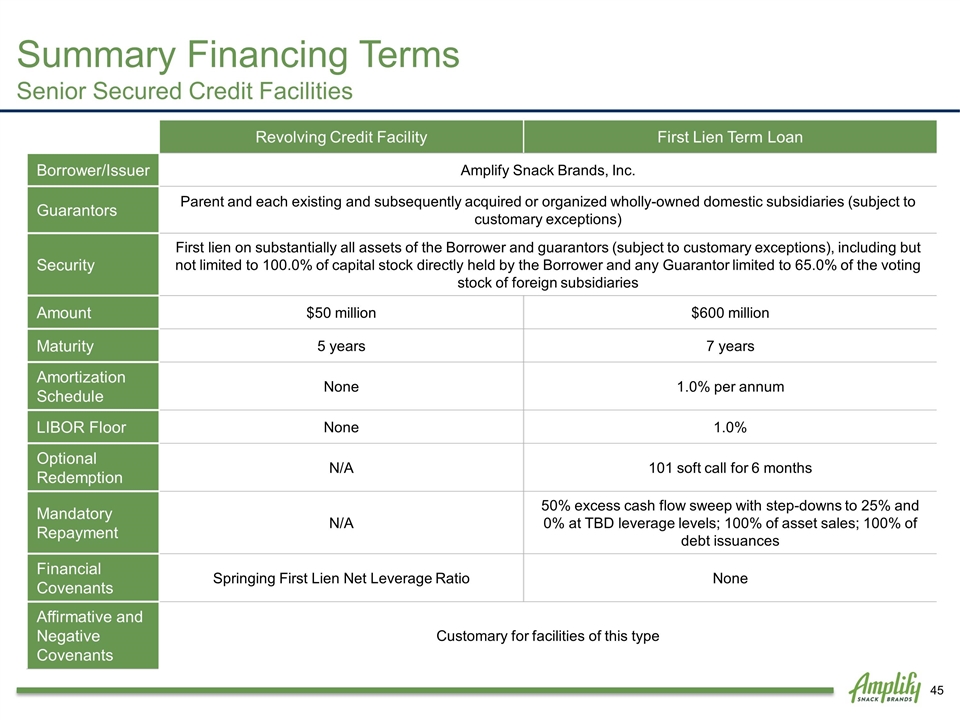
Summary Financing Terms Senior Secured Credit Facilities Revolving Credit Facility First Lien Term Loan Borrower/Issuer Amplify Snack Brands, Inc. Guarantors Parent and each existing and subsequently acquired or organized wholly-owned domestic subsidiaries (subject to customary exceptions) Security First lien on substantially all assets of the Borrower and guarantors (subject to customary exceptions), including but not limited to 100.0% of capital stock directly held by the Borrower and any Guarantor limited to 65.0% of the voting stock of foreign subsidiaries Amount $50 million $600 million Maturity 5 years 7 years Amortization Schedule None 1.0% per annum LIBOR Floor None 1.0% Optional Redemption N/A 101 soft call for 6 months Mandatory Repayment N/A 50% excess cash flow sweep with step-downs to 25% and 0% at TBD leverage levels; 100% of asset sales; 100% of debt issuances Financial Covenants Springing First Lien Net Leverage Ratio None Affirmative and Negative Covenants Customary for facilities of this type
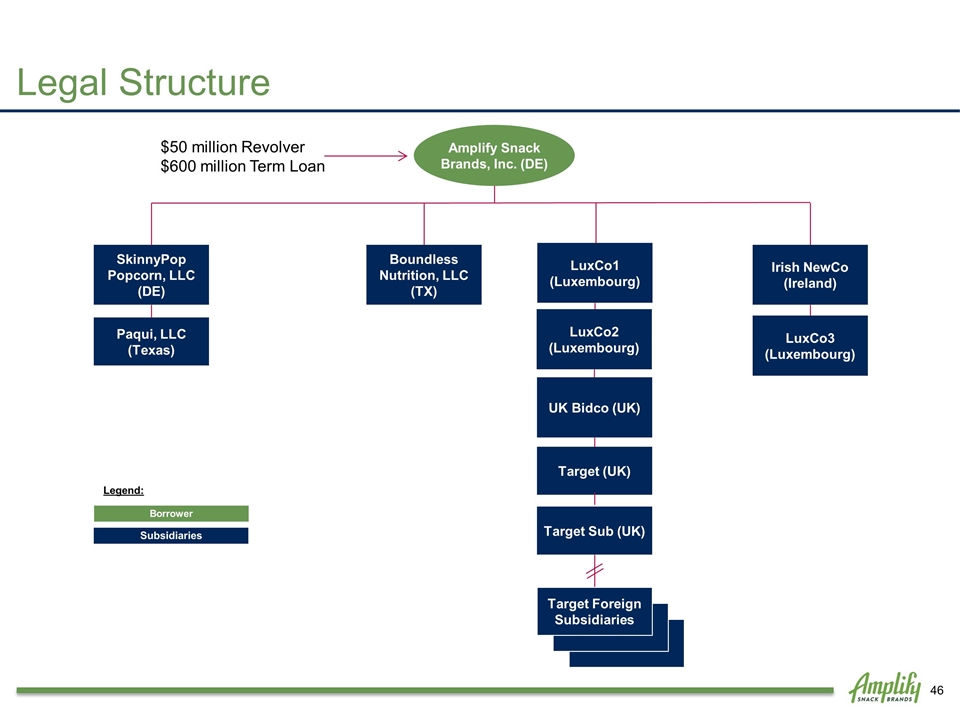
Legal Structure Paqui, LLC (Texas) SkinnyPop Popcorn, LLC (DE) UK Bidco (UK) Target (UK) Boundless Nutrition, LLC (TX) Target Sub (UK) Target Foreign Subsidiaries Borrower Subsidiaries Legend: $50 million Revolver $600 million Term Loan LuxCo1 (Luxembourg) LuxCo2 (Luxembourg) Irish NewCo (Ireland) LuxCo3 (Luxembourg) Amplify Snack Brands, Inc. (DE)
Questions & Answers
Appendix
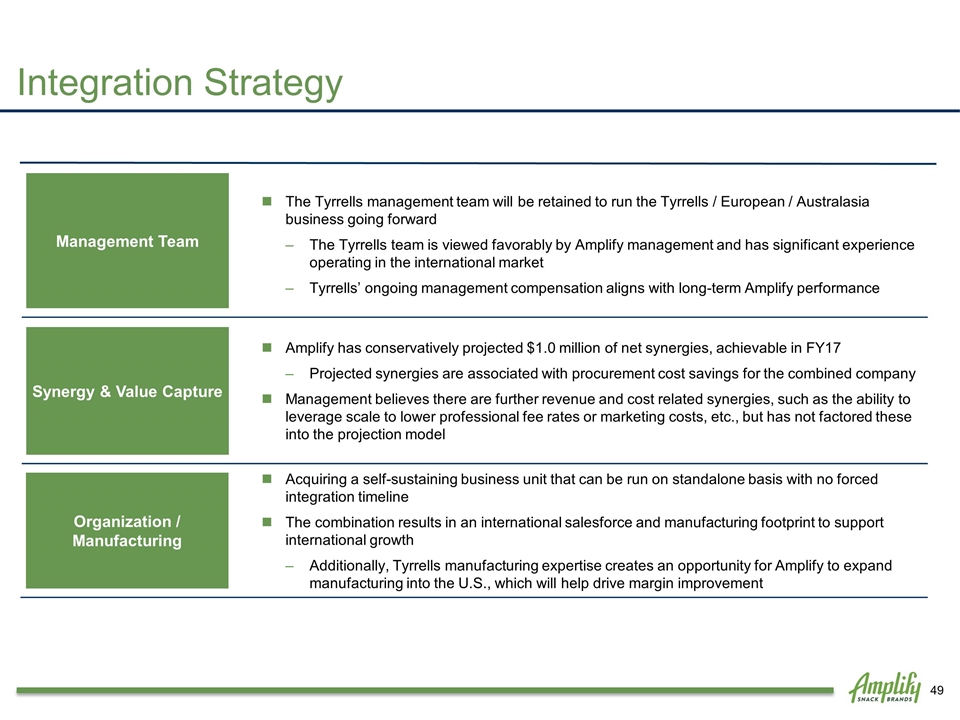
The Tyrrells management team will be retained to run the Tyrrells / European / Australasia business going forward The Tyrrells team is viewed favorably by Amplify management and has significant experience operating in the international market Tyrrells’ ongoing management compensation aligns with long-term Amplify performance Amplify has conservatively projected $1.0 million of net synergies, achievable in FY17 Projected synergies are associated with procurement cost savings for the combined company Management believes there are further revenue and cost related synergies, such as the ability to leverage scale to lower professional fee rates or marketing costs, etc., but has not factored these into the projection model Acquiring a self-sustaining business unit that can be run on standalone basis with no forced integration timeline The combination results in an international salesforce and manufacturing footprint to support international growth Additionally, Tyrrells manufacturing expertise creates an opportunity for Amplify to expand manufacturing into the U.S., which will help drive margin improvement Management Team Synergy & Value Capture Organization / Manufacturing Integration Strategy
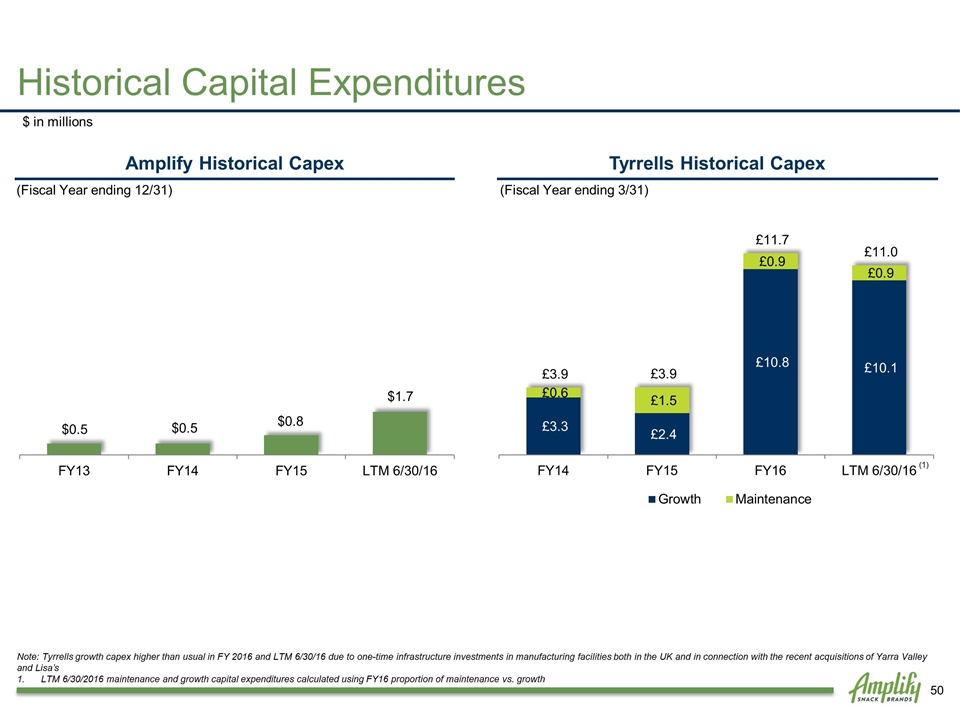
Historical Capital Expenditures $ in millions Note: Tyrrells growth capex higher than usual in FY 2016 and LTM 6/30/16 due to one-time infrastructure investments in manufacturing facilities both in the UK and in connection with the recent acquisitions of Yarra Valley and Lisa’s LTM 6/30/2016 maintenance and growth capital expenditures calculated using FY16 proportion of maintenance vs. growth Tyrrells Historical Capex Amplify Historical Capex (1) (Fiscal Year ending 12/31) (Fiscal Year ending 3/31)
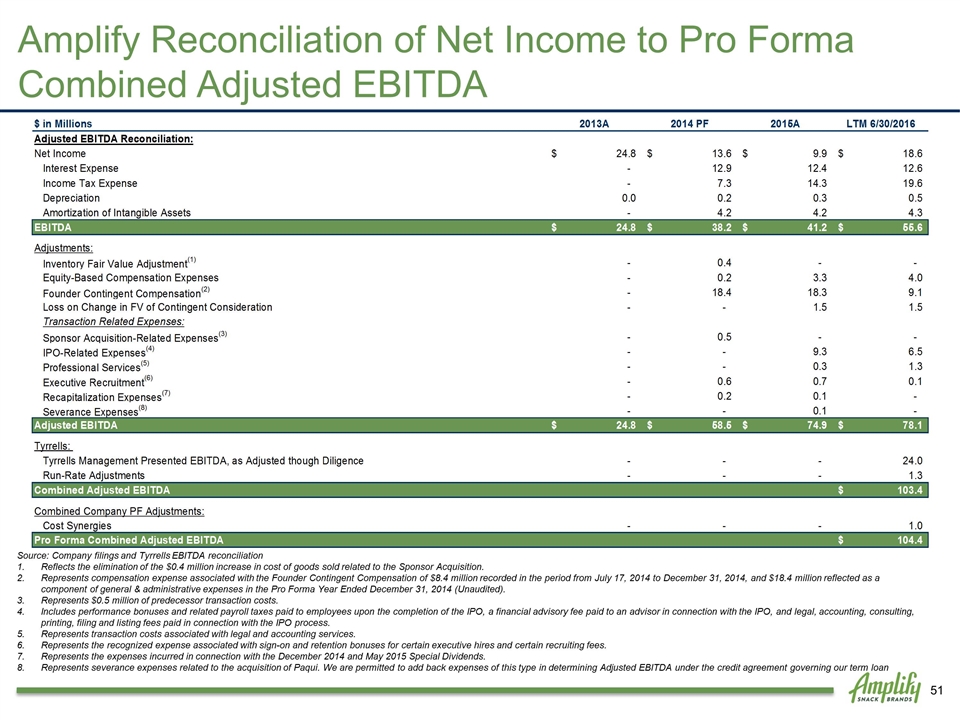
1. Reflects the elimination of the $0.4 million increase in cost of goods sold related to the Sponsor Acquisition. 2. Represents compensation expense associated with the Founder Contingent Compensation of $8.4 million recorded in the period from July 17, 2014 to December 31, 2014, and $18.4 million reflected as a component of general & administrative expenses in the Pro Forma Year Ended December 31, 2014 (Unaudited). 3. Represents $0.5 million of predecessor transaction costs. 4. Represents the expenses incurred in connection with the December 2014 and May 2015 Special Dividends. 5. Represents the recognized expense associated with sign-on and retention bonuses for certain executive hires and certain recruiting fees. 6. Includes performance bonuses and related payroll taxes paid to employees upon the completion of the IPO, a financial advisory fee paid to an advisor in connection with the IPO, and legal, accounting, consulting, printing, filing and listing fees paid in connection with the IPO process. 7. Represents transaction costs associated with legal and accounting services. 8. Represents severance expenses related to the acquisition of Paqui. We are permitted to add back expenses of this type in determining Adjusted EBITDA under the credit agreement governing our term loan $ in millions Amplify Reconciliation of Net Income to Pro Forma Combined Adjusted EBITDA Source: Company filings and Tyrrells EBITDA reconciliation Reflects the elimination of the $0.4 million increase in cost of goods sold related to the Sponsor Acquisition. Represents compensation expense associated with the Founder Contingent Compensation of $8.4 million recorded in the period from July 17, 2014 to December 31, 2014, and $18.4 million reflected as a component of general & administrative expenses in the Pro Forma Year Ended December 31, 2014 (Unaudited). Represents $0.5 million of predecessor transaction costs. Includes performance bonuses and related payroll taxes paid to employees upon the completion of the IPO, a financial advisory fee paid to an advisor in connection with the IPO, and legal, accounting, consulting, printing, filing and listing fees paid in connection with the IPO process. Represents transaction costs associated with legal and accounting services. Represents the recognized expense associated with sign-on and retention bonuses for certain executive hires and certain recruiting fees. Represents the expenses incurred in connection with the December 2014 and May 2015 Special Dividends. Represents severance expenses related to the acquisition of Paqui. We are permitted to add back expenses of this type in determining Adjusted EBITDA under the credit agreement governing our term loan
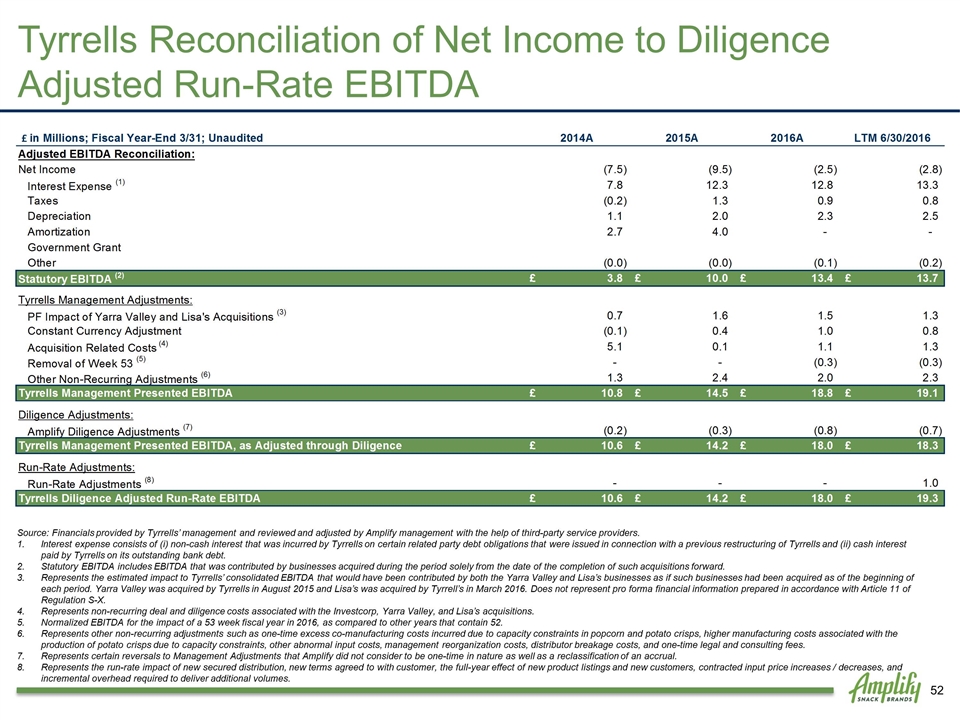
Source: Financials provided by Tyrrells’ management and reviewed and adjusted by Amplify management with the help of third-party service providers. Interest expense consists of (i) non-cash interest that was incurred by Tyrrells on certain related party debt obligations that were issued in connection with a previous restructuring of Tyrrells and (ii) cash interest paid by Tyrrells on its outstanding bank debt. Statutory EBITDA includes EBITDA that was contributed by businesses acquired during the period solely from the date of the completion of such acquisitions forward. Represents the estimated impact to Tyrrells’ consolidated EBITDA that would have been contributed by both the Yarra Valley and Lisa’s businesses as if such businesses had been acquired as of the beginning of each period. Yarra Valley was acquired by Tyrrells in August 2015 and Lisa’s was acquired by Tyrrell’s in March 2016. Does not represent pro forma financial information prepared in accordance with Article 11 of Regulation S-X. Represents non-recurring deal and diligence costs associated with the Investcorp, Yarra Valley, and Lisa’s acquisitions. Normalized EBITDA for the impact of a 53 week fiscal year in 2016, as compared to other years that contain 52. Represents other non-recurring adjustments such as one-time excess co-manufacturing costs incurred due to capacity constraints in popcorn and potato crisps, higher manufacturing costs associated with the production of potato crisps due to capacity constraints, other abnormal input costs, management reorganization costs, distributor breakage costs, and one-time legal and consulting fees. Represents certain reversals to Management Adjustments that Amplify did not consider to be one-time in nature as well as a reclassification of an accrual. Represents the run-rate impact of new secured distribution, new terms agreed to with customer, the full-year effect of new product listings and new customers, contracted input price increases / decreases, and incremental overhead required to deliver additional volumes. Tyrrells Reconciliation of Net Income to Diligence Adjusted Run-Rate EBITDA


