UNITED STATES
SECURITIES AND EXCHANGE COMMISSION
WASHINGTON, D.C. 20549
FORM N-CSR
CERTIFIED SHAREHOLDER REPORT OF REGISTERED MANAGEMENT
INVESTMENT COMPANIES
Investment Company Act file number 811-23052
Oppenheimer Global Multi-Asset Growth Fund
(Exact name of registrant as specified in charter)
6803 South Tucson Way, Centennial, Colorado 80112-3924
(Address of principal executive offices) (Zip code)
Cynthia Lo Bessette
OFI Global Asset Management, Inc.
225 Liberty Street, New York, New York 10281-1008
(Name and address of agent for service)
Registrant’s telephone number, including area code: (303) 768-3200
Date of fiscal year end: October 31
Date of reporting period: 10/31/2016
Item 1. Reports to Stockholders.
Class A Shares
AVERAGE ANNUAL TOTAL RETURNS AT 10/31/16
| Class A Shares of the Fund | ||||||
| Without Sales Charge | With Sales Charge | MSCI All Country World Index | ||||
1-Year | 2.73% | -3.17% | 2.05% | |||
Since Inception (8/27/15) | 4.92 | -0.23 | 4.94 | |||
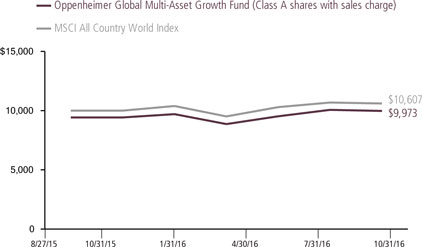
Performance data quoted represents past performance, which does not guarantee future results. The investment return and principal value of an investment in the Fund will fluctuate so that an investor’s shares, when redeemed, may be worth more or less than their original cost. Fund returns include changes in share price, reinvested distributions, and a 5.75% maximum applicable sales charge except where “without sales charge” is indicated. Current performance may be lower or higher than the performance quoted. Returns do not consider capital gains or income taxes on an individual’s investment. For performance data current to the most recent month-end, visit oppenheimerfunds.com or call 1.800.CALL OPP (225.5677). See Fund prospectuses and summary prospectuses for more information on share classes and sales charges.
2 OPPENHEIMER GLOBAL MULTI-ASSET GROWTH FUND
The Fund’s Class A shares (without sales charge) produced a return of 2.73% during the reporting period. In comparison, the MSCI All Country World Index (the “Index”) produced a return of 2.05% over the same period.
MARKET OVERVIEW
Markets were volatile this reporting period. One of the most significant events during the period was the United Kingdom’s (“UK”) vote to leave the European Union (“EU”). Although the UK still has not initiated the formal process to leave the EU, the vote initially raised the level of uncertainty in global markets. Within days of the result, there were sharp moves across all markets. Perhaps the most significant movers were government bonds, where yields fell sharply, despite already being well below historical levels.
Markets staged an impressive rebound in July, as investor fears receded, particularly over the immediate implications of June’s Brexit vote. We saw central bank action remain supportive with the Bank of England and the European Central Bank (“ECB”) making forceful statements outlining intentions to backstop market sentiment. Central bank activity was not just apparent after the Brexit vote, but played a large role throughout the period.
COMPARISON OF CHANGE IN VALUE OF $10,000 HYPOTHETICAL INVESTMENTS IN:
3 OPPENHEIMER GLOBAL MULTI-ASSET GROWTH FUND
In June, the ECB started to purchase European corporate bonds, marking another ‘Rubicon crossed’ in the central bank’s unconventional monetary policy moves. The purchasing program started more aggressively than had been expected, buying at the upper end of the 5-10 billion euro per month range.
Two key policy meetings in the third quarter were closely watched, one with the U.S. Federal Reserve (“Fed”) and the other from the Bank of Japan (“BoJ”). The Fed was not expected to hike rates and they met this expectation. However the details were mixed, with 3 dissenters voting in favor of a hike. The overall message was dovish, though a December hike remains a possibility.
The BoJ’s meeting was perhaps even more eagerly anticipated, with a growing view that the unprecedented monetary policy experiment from the last few years has failed to generate the promised inflation. Expectations varied widely, from a further rate cut (to more deeply negative), to expansion of the quantitative easing program, to no change to policy. In the end, the bank opted for what amounted to a fine-tuning of policy: It left its rates unchanged, but announced a new policy of ‘yield curve control’, where it would keep the 10-year Japanese Government Bond yield anchored around 0%, and target a modestly positively sloping yield curve.
FUND REVIEW
The primary driver of the Fund’s positive performance during the reporting period came from its fixed income components. Our long duration posture was a big contributor during the period. Last year, we anticipated that U.S. Treasuries would be an attractive hedge against renewed market volatility, given their positive yield (relative to option based hedging strategies, where we would typically pay a premium for protection). Given our general concerns about global growth and a lack of discernible inflation, we believed developed market government bonds, particularly long-dated U.S. Treasuries, offered an attractive hedge in an uncertain environment. This duration hedge worked well as volatility picked up in the first part of 2016 and yields on Treasuries fell substantially. With the significant move in yields, we reduced this exposure.
With most developed markets past their cyclical peaks, we have sought to enhance portfolio diversification through investments in income assets. We believe that lower volatility coupled with a dovish Fed make for a favorable environment for income assets. At period end, we maintain broad exposure to income assets with a preference for loans, event-linked bonds, and high yield. During the period, we reduced our high yield exposure in favor of loans because of their attractive valuations, a step-up in credit quality, and less interest rate and sector risk than high yield bonds. Within the U.S., we favor credit over equities given the advanced stage of the business cycle and lower
4 OPPENHEIMER GLOBAL MULTI-ASSET GROWTH FUND
volatility. With sluggish earnings growth, we don’t expect meaningful equity upside. Together, these income generating assets provide attractive sources of return with less severe ups and downs than equities.
Our active currency overlay has been a contributor to performance. We have actively managed currency both to hedge downside risk and take advantage of potential opportunities. To take advantage of the upside, we have a bias to higher-yielding emerging currencies versus lower-yielding developed currencies. This positioning added to performance as emerging currencies outperformed developed currencies. We remain modestly underweight the pound versus the Index, as well as the euro, Swiss franc, and Canadian dollar, neutral the U.S. dollar and Japanese yen, and overweight a basket of higher yielding emerging currencies.
The equity components in aggregate were positive contributors. Top contributors during the period were developed international growth equity and large cap core equity. The top detractors were the global developed equity strategy and the large-cap growth strategy. Our global developed equity strategy had underperformance relative to the Index during the period driven by poor stock selection within the Financials and Technology sectors.
During the reporting period, our allocation to certain alternative strategies detracted from performance but provided more downside protection in periods of volatility. In particular,
Oppenheimer Global Multi Strategies Fund and Oppenheimer Fundamental Alternatives Fund, which we had exposure to through over-the-counter total return swaps, posted slight negative returns for the period, and underperformed the Index. These funds seek to offer the diversification benefits of hedge fund-like strategies and use systematic and fundamental techniques to generate return. Both funds seek to generate attractive risk-adjusted returns that exhibit low correlation to traditional stocks and bonds. We believe having exposure to these funds provides a great diversification strategy in this equity-dominated growth Fund.
STRATEGY & OUTLOOK
The Fund’s investment objective is to seek capital appreciation. The Fund is managed by the Global Multi-Asset Group, which relies on its proprietary research to gauge the impact of changes in the macroeconomic backdrop, overall risk environment and evaluations of prospective risks and returns across asset classes. The Fund invests in a globally diversified set of growth generating assets like traditional equities, fixed income assets, and alternatives. The Fund will dynamically allocate across assets based on the investment team’s views. The Fund seeks to capture the best opportunities for growth with less risk than the broad equity market.
As we look ahead, we expect a continuation in this year’s seesaw behavior, in which global markets alternate between risk-on and risk-off. This muted growth outlook coupled
5 OPPENHEIMER GLOBAL MULTI-ASSET GROWTH FUND
with lack of consistent direction is causing a high degree of financial market uncertainty that may persist for some time. With this type of backdrop, we believe in being somewhat cautious with our risk posture and focusing on higher risk-adjusted return assets and relative value opportunities across assets and currencies instead of large directional positions. Finally, with a choppy market
backdrop, we think a dynamic asset allocation approach is well suited to navigate the short-term market risks. In terms of opportunities, cyclical and policy divergence are leading to some very interesting trends that we expect to exhibit some persistence over time and a flexible mandate is well equipped to capitalize on.
 |
Mark Hamilton Portfolio Manager |  |
Dokyoung Lee, CFA Portfolio Manager | |||||
 |
Benjamin Rockmuller, CFA Portfolio Manager |  |
Alessio de Longis, CFA Portfolio Manager | |||||


6 OPPENHEIMER GLOBAL MULTI-ASSET GROWTH FUND
TOP TEN COMMON STOCK HOLDINGS
| Apple, Inc. | 1.2% | |||
| Alphabet, Inc., Cl. C | 1.0 | |||
| SAP SE | 0.8 | |||
| Alphabet, Inc., Cl. A | 0.8 | |||
| Facebook, Inc., Cl. A | 0.8 | |||
| Citigroup, Inc. | 0.7 | |||
| Comcast Corp., Cl. A | 0.7 | |||
| Airbus Group SE | 0.6 | |||
| S&P Global, Inc. | 0.6 | |||
| LVMH Moet Hennessy Louis Vuitton SE | 0.5 |
Portfolio holdings and allocations are subject to change. Percentages are as of October 31, 2016, and are based on net assets. For more current Fund holdings, please visit oppenheimerfunds. com.
TOP TEN GEOGRAPHICAL HOLDINGS
| United States | 59.3% | |||
| France | 5.0 | |||
| Japan | 4.5 | |||
| United Kingdom | 3.7 | |||
| Germany | 3.1 | |||
| Switzerland | 2.4 | |||
| China | 2.3 | |||
| India | 2.0 | |||
| Brazil | 1.9 | |||
| Canada | 1.9 |
Portfolio holdings and allocation are subject to change. Percentages are as of October 31, 2016, and are based on total market value of investments.
PORTFOLIO ALLOCATION
| Common Stocks | 61.2% | |||
| Investment Companies | ||||
Oppenheimer Fundamental Alternatives Fund | 5.7 | |||
Oppenheimer Global High Yield Fund | 9.6 | |||
Oppenheimer Institutional Government Money Market Fund | 7.2 | |||
Oppenheimer Master Loan Fund, LLC | 1.8 | |||
Oppenheimer Senior Floating Rate Fund | 4.1 | |||
| Foreign Government Obligations | 6.2 | |||
| U.S. Government Obligations | 3.7 | |||
| Preferred Stocks | 0.4 | |||
| Short-Term Notes | 0.1 |
Portfolio holdings and allocations are subject to change. Percentages are as of October 31, 2016, and are based on the total market value of investments.
REGIONAL ALLOCATION
| U.S./Canada | 61.2% | |||
| Europe | 18.5 | |||
| Asia | 13.2 | |||
| Latin America | 3.9 | |||
| Emerging Europe | 2.0 | |||
| Middle East/Africa | 1.2 |
Portfolio holdings and allocation are subject to change. Percentages are as of October 31, 2016, and are based on total market value of investments.
7 OPPENHEIMER GLOBAL MULTI-ASSET GROWTH FUND
Share Class Performance
AVERAGE ANNUAL TOTAL RETURNS WITHOUT SALES CHARGE AS OF 10/31/16
| Inception | Since | |||||||||||
| Date | 1-Year | Inception | ||||||||||
Class A (QMGAX) | 8/27/15 | 2.73% | 4.92 | % | ||||||||
Class C (QMGCX) | 8/27/15 | 1.88 | 4.09 | |||||||||
Class I (QMGIX) | 8/27/15 | 2.91 | 5.16 | |||||||||
Class R (QMGRX) | 8/27/15 | 2.43 | 4.65 | |||||||||
Class Y (QMGYX) | 8/27/15 | 2.86 | 5.11 | |||||||||
AVERAGE ANNUAL TOTAL RETURNS WITH SALES CHARGE AS OF 10/31/16
| Inception | Since | |||||||||||
| Date | 1-Year | Inception | ||||||||||
Class A (QMGAX) | 8/27/15 | -3.17% | -0.23 | % | ||||||||
Class C (QMGCX) | 8/27/15 | 0.88 | 4.09 | |||||||||
Class I (QMGIX) | 8/27/15 | 2.91 | 5.16 | |||||||||
Class R (QMGRX) | 8/27/15 | 2.43 | 4.65 | |||||||||
Class Y (QMGYX) | 8/27/15 | 2.86 | 5.11 | |||||||||
Performance data quoted represents past performance, which does not guarantee future results. The investment return and principal value of an investment in the Fund will fluctuate so that an investor’s shares, when redeemed, may be worth more or less than their original cost. Current performance may be lower or higher than the performance quoted. For performance data current to the most recent month-end, visit oppenheimerfunds.com or call 1.800. CALL OPP (225.5677). Fund returns include changes in share price, reinvested distributions, and the applicable sales charge: for Class A shares, the current maximum initial sales charge of 5.75% and for Class C shares, the contingent deferred sales charge (“CDSC”) of 1% for the 1-year period. There is no sales charge for Class I, Class R and Class Y shares. See Fund prospectuses and summary prospectuses for more information on share classes and sales charges.
The Fund’s performance is compared to the performance of the MSCI All Country World Index, which is a free float-adjusted market capitalization weighted index that is designed to measure the equity market performance of developed and emerging markets. The Index is unmanaged and cannot be purchased directly by investors. While index comparisons may be useful to provide a benchmark for the Fund’s performance, it must be noted that the Fund’s investments are not limited to the investments comprising the Index. Index performance includes reinvestment of income, but does not reflect transaction costs, fees, expenses or taxes. Index performance is shown for illustrative purposes only as a benchmark for the Fund’s performance, and does not predict or depict performance of the Fund. The Fund’s performance reflects the effects of the Fund’s business and operating expenses.
The Fund’s investment strategy and focus can change over time. The mention of specific fund holdings does not constitute a recommendation by OppenheimerFunds, Inc. or its affiliates.
Before investing in any of the Oppenheimer funds, investors should carefully consider a fund’s investment objectives, risks, charges and expenses. Fund
8 OPPENHEIMER GLOBAL MULTI-ASSET GROWTH FUND
prospectuses and summary prospectuses contain this and other information about the funds, and may be obtained by asking your financial advisor, visiting oppenheimerfunds.com, or calling 1.800.CALL OPP (225.5677). Read prospectuses and summary prospectuses carefully before investing.
Shares of Oppenheimer funds are not deposits or obligations of any bank, are not guaranteed by any bank, are not insured by the FDIC or any other agency, and involve investment risks, including the possible loss of the principal amount invested.
9 OPPENHEIMER GLOBAL MULTI-ASSET GROWTH FUND
Fund Expenses. As a shareholder of the Fund, you incur two types of costs: (1) transaction costs, which may include sales charges (loads) on purchase payments and/or contingent deferred sales charges on redemptions; and (2) ongoing costs, including management fees; distribution and service fees; and other Fund expenses. These examples are intended to help you understand your ongoing costs (in dollars) of investing in the Fund and to compare these costs with the ongoing costs of investing in other mutual funds.
The examples are based on an investment of $1,000.00 invested at the beginning of the period and held for the entire 6-month period ended October 31, 2016.
Actual Expenses. The first section of the table provides information about actual account values and actual expenses. You may use the information in this section for the class of shares you hold, together with the amount you invested, to estimate the expense that you paid over the period. Simply divide your account value by $1,000.00 (for example, an $8,600.00 account value divided by $1,000.00 = 8.60), then multiply the result by the number in the first section under the heading entitled “Expenses Paid During 6 Months Ended October 31, 2016” to estimate the expenses you paid on your account during this period.
Hypothetical Example for Comparison Purposes. The second section of the table provides information about hypothetical account values and hypothetical expenses based on the Fund’s actual expense ratio for each class of shares, and an assumed rate of return of 5% per year for each class before expenses, which is not the Fund’s actual return. The hypothetical account values and expenses may not be used to estimate the actual ending account balance or expenses you paid for the period. You may use this information to compare the ongoing costs of investing in the Fund and other funds. To do so, compare this 5% hypothetical example for the class of shares you hold with the 5% hypothetical examples that appear in the shareholder reports of the other funds.
Please note that the expenses shown in the table are meant to highlight your ongoing costs only and do not reflect any transactional costs, such as front-end or contingent deferred sales charges (loads). Therefore, the “hypothetical” section of the table is useful in comparing ongoing costs only, and will not help you determine the relative total costs of owning different funds. In addition, if these transactional costs were included, your costs would have been higher.
10 OPPENHEIMER GLOBAL MULTI-ASSET GROWTH FUND
| Actual | Beginning Account Value May 1, 2016 | Ending Value | Expenses Paid During 6 Months Ended October 31, 2016 | |||||||||
| ||||||||||||
Class A | $ 1,000.00 | $ 1,046.90 | $ 5.68 | |||||||||
| ||||||||||||
Class C | 1,000.00 | 1,043.10 | 9.54 | |||||||||
| ||||||||||||
Class I | 1,000.00 | 1,047.90 | 4.38 | |||||||||
| ||||||||||||
Class R | 1,000.00 | 1,046.00 | 6.86 | |||||||||
| ||||||||||||
Class Y | 1,000.00 | 1,048.90 | 4.80 | |||||||||
Hypothetical | ||||||||||||
(5% return before expenses) | ||||||||||||
| ||||||||||||
Class A | 1,000.00 | 1,019.61 | 5.60 | |||||||||
| ||||||||||||
Class C | 1,000.00 | 1,015.84 | 9.42 | |||||||||
| ||||||||||||
Class I | 1,000.00 | 1,020.86 | 4.33 | |||||||||
| ||||||||||||
Class R | 1,000.00 | 1,018.45 | 6.77 | |||||||||
| ||||||||||||
Class Y | 1,000.00 | 1,020.46 | 4.73 | |||||||||
Expenses are equal to the Fund’s annualized expense ratio for that class, multiplied by the average account value over the period, multiplied by 184/366 (to reflect the one-half year period). Those annualized expense ratios, excluding indirect expenses from affiliated funds, based on the 6-month period ended October 31, 2016 are as follows:
| Class | Expense Ratios | |
| ||
Class A | 1.10% | |
| ||
Class C | 1.85 | |
| ||
Class I | 0.85 | |
| ||
Class R | 1.33 | |
| ||
Class Y | 0.93 | |
The expense ratios reflect voluntary and/or contractual waivers and/or reimbursements of expenses by the Fund’s Manager. Some of these undertakings may be modified or terminated at any time, as indicated in the Fund’s prospectus. The “Financial Highlights” tables in the Fund’s financial statements, included in this report, also show the gross expense ratios, without such waivers or reimbursements and reduction to custodian expenses, if applicable.
11 OPPENHEIMER GLOBAL MULTI-ASSET GROWTH FUND
STATEMENT OF INVESTMENTS October 31, 2016
| Shares | Value | |||||||
| ||||||||
Common Stocks—64.1% | ||||||||
| ||||||||
Consumer Discretionary—11.0% | ||||||||
| ||||||||
Auto Components—0.8% | ||||||||
| ||||||||
Adient plc1 | 399 | $ | 18,158 | |||||
| ||||||||
Bridgestone Corp. | 2,500 | 93,165 | ||||||
| ||||||||
Continental AG | 551 | 105,600 | ||||||
| ||||||||
Delphi Automotive plc | 562 | 36,569 | ||||||
| ||||||||
Koito Manufacturing Co. Ltd. | 200 | 10,428 | ||||||
| ||||||||
Valeo SA | 3,250 | 187,238 | ||||||
|
| |||||||
| 451,158 | ||||||||
| ||||||||
Automobiles—0.6% | ||||||||
| ||||||||
Astra International Tbk PT | 46,500 | 29,244 | ||||||
| ||||||||
Bayerische Motoren Werke AG | 522 | 45,480 | ||||||
| ||||||||
Hero MotoCorp Ltd. | 1,898 | 95,295 | ||||||
| ||||||||
Suzuki Motor Corp. | 2,400 | 85,187 | ||||||
| ||||||||
Tata Motors Ltd., Sponsored ADR | 2,333 | 91,944 | ||||||
|
| |||||||
| 347,150 | ||||||||
| ||||||||
Diversified Consumer Services—0.3% | ||||||||
| ||||||||
Dignity plc | 1,495 | 48,507 | ||||||
| ||||||||
Estacio Participacoes SA | 5,600 | 32,474 | ||||||
| ||||||||
Kroton Educacional SA | 5,200 | 25,902 | ||||||
| ||||||||
New Oriental Education & Technology Group, Inc., Sponsored ADR1 | 940 | 47,122 | ||||||
|
| |||||||
| 154,005 | ||||||||
| ||||||||
Hotels, Restaurants & Leisure—1.9% | ||||||||
| ||||||||
Accor SA | 1,331 | 50,581 | ||||||
| ||||||||
Carnival Corp. | 4,145 | 203,519 | ||||||
| ||||||||
Cedar Fair LP2 | 325 | 18,476 | ||||||
| ||||||||
China Lodging Group Ltd., Sponsored ADR | 593 | 25,505 | ||||||
| ||||||||
Domino’s Pizza Group plc | 15,510 | 64,552 | ||||||
| ||||||||
Galaxy Entertainment Group Ltd. | 10,000 | 41,058 | ||||||
| ||||||||
Genting Bhd | 27,000 | 50,420 | ||||||
| ||||||||
Genting Malaysia Bhd | 16,600 | 18,825 | ||||||
| ||||||||
International Game Technology plc | 2,241 | 64,361 | ||||||
| ||||||||
Jollibee Foods Corp. | 5,270 | 25,902 | ||||||
| ||||||||
Las Vegas Sands Corp. | 670 | 38,780 | ||||||
| ||||||||
McDonald’s Corp. | 1,137 | 127,992 | ||||||
| ||||||||
Melco Crown Entertainment Ltd., ADR | 2,750 | 46,035 | ||||||
| ||||||||
Sands China Ltd. | 30,800 | 133,667 | ||||||
| ||||||||
Starbucks Corp. | 364 | 19,317 | ||||||
| ||||||||
Whitbread plc | 1,091 | 48,265 | ||||||
| ||||||||
William Hill plc | 15,419 | 55,810 | ||||||
|
| |||||||
| 1,033,065 | ||||||||
| ||||||||
Household Durables—0.7% | ||||||||
| ||||||||
Newell Brands, Inc. | 502 | 24,106 | ||||||
| ||||||||
SEB SA | 732 | 107,765 | ||||||
| ||||||||
Sony Corp. | 5,700 | 180,368 | ||||||
| ||||||||
Whirlpool Corp. | 649 | 97,233 | ||||||
|
| |||||||
| 409,472 | ||||||||
12 OPPENHEIMER GLOBAL MULTI-ASSET GROWTH FUND
| Shares | Value | |||||||
| ||||||||
Internet & Direct Marketing Retail—0.7% | ||||||||
| ||||||||
Amazon.com, Inc.1 | 218 | $ | 172,181 | |||||
| ||||||||
Ctrip.com International Ltd., ADR1 | 1,740 | 76,821 | ||||||
| ||||||||
JD.com, Inc., ADR1 | 3,434 | 89,112 | ||||||
| ||||||||
Priceline Group, Inc. (The)1 | 32 | 47,175 | ||||||
| ||||||||
Rakuten, Inc. | 1,400 | 16,168 | ||||||
|
| |||||||
| 401,457 | ||||||||
| ||||||||
Leisure Products—0.3% | ||||||||
| ||||||||
Hasbro, Inc. | 142 | 11,844 | ||||||
| ||||||||
Nintendo Co. Ltd. | 600 | 145,490 | ||||||
|
| |||||||
| 157,334 | ||||||||
| ||||||||
Media—1.8% | ||||||||
| ||||||||
Comcast Corp., Cl. A | 5,833 | 360,596 | ||||||
| ||||||||
DISH Network Corp., Cl. A1 | 457 | 26,762 | ||||||
| ||||||||
Grupo Televisa SAB, Sponsored ADR | 1,857 | 45,552 | ||||||
| ||||||||
ProSiebenSat.1 Media SE | 1,540 | 66,372 | ||||||
| ||||||||
SES SA, Cl. A, FDR | 2,768 | 63,653 | ||||||
| ||||||||
SKY Perfect JSAT Holdings, Inc. | 8,200 | 40,679 | ||||||
| ||||||||
Sky plc | 6,842 | 68,350 | ||||||
| ||||||||
Technicolor SA | 10,532 | 61,544 | ||||||
| ||||||||
Walt Disney Co. (The) | 1,820 | 168,696 | ||||||
| ||||||||
Zee Entertainment Enterprises Ltd. | 15,953 | 123,955 | ||||||
|
| |||||||
| 1,026,159 | ||||||||
| ||||||||
Multiline Retail—0.4% | ||||||||
| ||||||||
Dollarama, Inc. | 1,891 | 141,307 | ||||||
| ||||||||
Hudson’s Bay Co. | 4,665 | 57,317 | ||||||
|
| |||||||
| 198,624 | ||||||||
| ||||||||
Specialty Retail—1.4% | ||||||||
| ||||||||
AutoZone, Inc.1 | 103 | 76,442 | ||||||
| ||||||||
CarMax, Inc.1 | 638 | 31,862 | ||||||
| ||||||||
Dufry AG1 | 369 | 44,865 | ||||||
| ||||||||
Fast Retailing Co. Ltd. | 70 | 23,618 | ||||||
| ||||||||
Home Depot, Inc. (The) | 1,428 | 174,230 | ||||||
| ||||||||
Industria de Diseno Textil SA | 6,138 | 214,525 | ||||||
| ||||||||
Lowe’s Cos., Inc. | 363 | 24,194 | ||||||
| ||||||||
O’Reilly Automotive, Inc.1 | 170 | 44,955 | ||||||
| ||||||||
Tiffany & Co. | 1,481 | 108,735 | ||||||
| ||||||||
TJX Cos., Inc. (The) | 482 | 35,548 | ||||||
|
| |||||||
| 778,974 | ||||||||
| ||||||||
Textiles, Apparel & Luxury Goods—2.1% | ||||||||
| ||||||||
adidas AG | 474 | 77,737 | ||||||
| ||||||||
Brunello Cucinelli SpA | 1,329 | 26,319 | ||||||
| ||||||||
Burberry Group plc | 5,875 | 106,042 | ||||||
| ||||||||
Christian Dior SE | 364 | 70,274 | ||||||
| ||||||||
Cie Financiere Richemont SA | 963 | 61,904 | ||||||
| ||||||||
Hermes International | 185 | 74,998 | ||||||
| ||||||||
Kering | 1,181 | 262,182 | ||||||
| ||||||||
LVMH Moet Hennessy Louis Vuitton SE | 1,622 | 295,038 | ||||||
13 OPPENHEIMER GLOBAL MULTI-ASSET GROWTH FUND
STATEMENT OF INVESTMENTS Continued
| Shares | Value | |||||||
| ||||||||
Textiles, Apparel & Luxury Goods (Continued) | ||||||||
| ||||||||
Pandora AS | 538 | $ | 69,998 | |||||
| ||||||||
Prada SpA | 19,400 | 68,033 | ||||||
| ||||||||
Tod’s SpA | 349 | 20,410 | ||||||
| ||||||||
VF Corp. | 92 | 4,987 | ||||||
|
| |||||||
| 1,137,922 | ||||||||
| ||||||||
Consumer Staples—6.8% | ||||||||
| ||||||||
Beverages—1.8% | ||||||||
| ||||||||
Ambev SA, ADR | 4,990 | 29,441 | ||||||
| ||||||||
Anadolu Efes Biracilik Ve Malt Sanayii AS | 2,833 | 17,315 | ||||||
| ||||||||
Anheuser-Busch InBev SA/NV | 484 | 55,549 | ||||||
| ||||||||
Coca-Cola Amatil Ltd. | 6,063 | 43,993 | ||||||
| ||||||||
Coca-Cola Co. (The) | 806 | 34,174 | ||||||
| ||||||||
Coca-Cola European Partners plc | 2,044 | 78,571 | ||||||
| ||||||||
Constellation Brands, Inc., Cl. A | 291 | 48,632 | ||||||
| ||||||||
Diageo plc | 1,351 | 35,969 | ||||||
| ||||||||
Dr Pepper Snapple Group, Inc. | 332 | 29,146 | ||||||
| ||||||||
Fomento Economico Mexicano SAB de CV | 4,263 | 40,875 | ||||||
| ||||||||
Fomento Economico Mexicano SAB de CV, Sponsored ADR | 150 | 14,351 | ||||||
| ||||||||
Heineken NV | 1,088 | 89,569 | ||||||
| ||||||||
Kweichow Moutai Co. Ltd., Cl. A | 1,100 | 51,568 | ||||||
| ||||||||
Molson Coors Brewing Co., Cl. B | 358 | 37,164 | ||||||
| ||||||||
Nigerian Breweries plc | 26,001 | 12,037 | ||||||
| ||||||||
PepsiCo, Inc. | 1,798 | 192,746 | ||||||
| ||||||||
Pernod Ricard SA | 1,563 | 185,790 | ||||||
|
| |||||||
| 996,890 | ||||||||
| ||||||||
Food & Staples Retailing—1.1% | ||||||||
| ||||||||
Alimentation Couche-Tard, Inc., Cl. B | 1,558 | 78,266 | ||||||
| ||||||||
BIM Birlesik Magazalar AS | 1,198 | 19,467 | ||||||
| ||||||||
Costco Wholesale Corp. | 172 | 25,434 | ||||||
| ||||||||
CP ALL PCL | 57,934 | 100,505 | ||||||
| ||||||||
Magnit PJSC | 720 | 120,846 | ||||||
| ||||||||
Spar Group Ltd. (The) | 4,584 | 64,926 | ||||||
| ||||||||
Walgreens Boots Alliance, Inc. | 829 | 68,583 | ||||||
| ||||||||
Wal-Mart de Mexico SAB de CV | 4,510 | 9,540 | ||||||
| ||||||||
Wal-Mart Stores, Inc. | 1,223 | 85,635 | ||||||
| ||||||||
Whole Foods Market, Inc. | 856 | 24,216 | ||||||
|
| |||||||
| 597,418 | ||||||||
| ||||||||
Food Products—2.4% | ||||||||
| ||||||||
Aryzta AG1 | 1,479 | 64,909 | ||||||
| ||||||||
Barry Callebaut AG1 | 55 | 68,490 | ||||||
| ||||||||
ConAgra Foods, Inc. | 367 | 17,682 | ||||||
| ||||||||
Danone SA | 2,842 | 196,649 | ||||||
| ||||||||
Inner Mongolia Yili Industrial Group Co. Ltd., Cl. A | 5,800 | 15,378 | ||||||
| ||||||||
Kraft Heinz Co. (The) | 1,820 | 161,889 | ||||||
| ||||||||
Mondelez International, Inc., Cl. A | 4,643 | 208,656 | ||||||
| ||||||||
Nestle SA | 3,245 | 235,201 | ||||||
| ||||||||
Saputo, Inc. | 2,747 | 98,714 | ||||||
| ||||||||
Tingyi Cayman Islands Holding Corp. | 22,000 | 23,697 | ||||||
14 OPPENHEIMER GLOBAL MULTI-ASSET GROWTH FUND
| Shares | Value | |||||||
| ||||||||
Food Products (Continued) | ||||||||
| ||||||||
Unilever plc | 4,431 | $ | 185,305 | |||||
| ||||||||
Want Want China Holdings Ltd. | 39,000 | 23,783 | ||||||
|
| |||||||
| 1,300,353 | ||||||||
| ||||||||
Household Products—0.6% | ||||||||
| ||||||||
Colgate-Palmolive Co. | 2,519 | 179,756 | ||||||
| ||||||||
Kimberly-Clark de Mexico SAB de CV, Cl. A | 810 | 1,745 | ||||||
| ||||||||
Procter & Gamble Co. (The) | 817 | 70,916 | ||||||
| ||||||||
Reckitt Benckiser Group plc | 869 | 77,706 | ||||||
|
| |||||||
| 330,123 | ||||||||
| ||||||||
Personal Products—0.0% | ||||||||
| ||||||||
LG Household & Health Care Ltd. | 20 | 14,331 | ||||||
| ||||||||
Tobacco—0.9% | ||||||||
| ||||||||
Japan Tobacco, Inc. | 3,200 | 121,794 | ||||||
| ||||||||
KT&G Corp. | 1,088 | 107,242 | ||||||
| ||||||||
Philip Morris International, Inc. | 1,614 | 155,654 | ||||||
| ||||||||
Swedish Match AB | 3,581 | 124,491 | ||||||
|
| |||||||
| 509,181 | ||||||||
| ||||||||
Energy—2.7% | ||||||||
| ||||||||
Energy Equipment & Services—0.5% | ||||||||
| ||||||||
Halliburton Co. | 208 | 9,568 | ||||||
| ||||||||
Schlumberger Ltd. | 447 | 34,969 | ||||||
| ||||||||
Technip SA | 3,176 | 209,870 | ||||||
|
| |||||||
| 254,407 | ||||||||
| ||||||||
Oil, Gas & Consumable Fuels—2.2% | ||||||||
| ||||||||
Apache Corp. | 730 | 43,420 | ||||||
| ||||||||
Chevron Corp. | 2,558 | 267,951 | ||||||
| ||||||||
CNOOC Ltd. | 34,000 | 42,807 | ||||||
| ||||||||
Concho Resources, Inc.1 | 320 | 40,621 | ||||||
| ||||||||
ConocoPhillips | 677 | 29,416 | ||||||
| ||||||||
Enbridge, Inc. | 1,042 | 44,983 | ||||||
| ||||||||
EOG Resources, Inc. | 105 | 9,494 | ||||||
| ||||||||
Hess Corp. | 751 | 36,025 | ||||||
| ||||||||
HollyFrontier Corp. | 1,358 | 33,882 | ||||||
| ||||||||
Koninklijke Vopak NV | 1,409 | 71,100 | ||||||
| ||||||||
Magellan Midstream Partners LP2 | 1,472 | 98,963 | ||||||
| ||||||||
Newfield Exploration Co.1 | 494 | 20,051 | ||||||
| ||||||||
Noble Energy, Inc. | 1,724 | 59,426 | ||||||
| ||||||||
Novatek OJSC, Sponsored GDR | 855 | 91,204 | ||||||
| ||||||||
Phillips 66 | 339 | 27,510 | ||||||
| ||||||||
Pioneer Natural Resources Co. | 68 | 12,173 | ||||||
| ||||||||
Repsol SA | 2,036 | 28,454 | ||||||
| ||||||||
Suncor Energy, Inc. | 5,184 | 155,624 | ||||||
| ||||||||
Total SA | 2,285 | 109,347 | ||||||
|
| |||||||
| 1,222,451 | ||||||||
15 OPPENHEIMER GLOBAL MULTI-ASSET GROWTH FUND
STATEMENT OF INVESTMENTS Continued
| Shares | Value | |||||||
| ||||||||
Financials—10.3% | ||||||||
| ||||||||
Capital Markets—2.1% | ||||||||
| ||||||||
Bank of New York Mellon Corp. (The) | 3,358 | $ | 145,301 | |||||
| ||||||||
BlackRock, Inc., Cl. A | 38 | 12,967 | ||||||
| ||||||||
Charles Schwab Corp. (The) | 848 | 26,882 | ||||||
| ||||||||
CME Group, Inc., Cl. A | 1,864 | 186,586 | ||||||
| ||||||||
Credit Suisse Group AG1 | 1,913 | 26,663 | ||||||
| ||||||||
Goldman Sachs Group, Inc. (The) | 555 | 98,923 | ||||||
| ||||||||
ICAP plc | 12,176 | 72,137 | ||||||
| ||||||||
Intercontinental Exchange, Inc. | 112 | 30,284 | ||||||
| ||||||||
Nasdaq, Inc. | 884 | 56,549 | ||||||
| ||||||||
S&P Global, Inc. | 2,586 | 315,104 | ||||||
| ||||||||
Tullett Prebon plc | 3,825 | 16,592 | ||||||
| ||||||||
UBS Group AG | 12,257 | 173,284 | ||||||
|
| |||||||
| 1,161,272 | ||||||||
| ||||||||
Commercial Banks—3.3% | ||||||||
| ||||||||
3SBio, Inc.1,3 | 2,500 | 2,498 | ||||||
| ||||||||
Australia & New Zealand Banking Group Ltd. | 2,646 | 55,906 | ||||||
| ||||||||
Banco Bilbao Vizcaya Argentaria SA | 11,733 | 84,560 | ||||||
| ||||||||
Bank Mandiri Persero Tbk PT | 28,800 | 25,281 | ||||||
| ||||||||
Bank of America Corp. | 11,810 | 194,865 | ||||||
| ||||||||
Bank Pekao SA | 972 | 29,985 | ||||||
| ||||||||
BDO Unibank, Inc. | 920 | 2,143 | ||||||
| ||||||||
BOC Hong Kong Holdings Ltd. | 22,000 | 78,565 | ||||||
| ||||||||
Citigroup, Inc. | 7,979 | 392,168 | ||||||
| ||||||||
Credicorp Ltd. | 20 | 2,974 | ||||||
| ||||||||
Grupo Aval Acciones y Valores SA, ADR | 4,060 | 33,251 | ||||||
| ||||||||
Grupo Financiero Banorte SAB de CV | 7,684 | 45,329 | ||||||
| ||||||||
Grupo Financiero Inbursa SAB de CV | 21,591 | 35,183 | ||||||
| ||||||||
ICICI Bank Ltd., Sponsored ADR | 26,251 | 217,621 | ||||||
| ||||||||
JPMorgan Chase & Co. | 2,377 | 164,631 | ||||||
| ||||||||
Kotak Mahindra Bank Ltd. | 3,230 | 39,748 | ||||||
| ||||||||
Lloyds Banking Group plc | 24,962 | 17,457 | ||||||
| ||||||||
Sberbank of Russia PJSC, Sponsored ADR | 4,260 | 40,332 | ||||||
| ||||||||
Societe Generale SA | 1,826 | 71,071 | ||||||
| ||||||||
Sumitomo Mitsui Financial Group, Inc. | 1,500 | 52,140 | ||||||
| ||||||||
Sumitomo Mitsui Trust Holdings, Inc. | 1,900 | 64,191 | ||||||
| ||||||||
SunTrust Banks, Inc. | 1,923 | 86,977 | ||||||
| ||||||||
US Bancorp | 1,881 | 84,193 | ||||||
| ||||||||
Zenith Bank plc | 161,349 | 7,544 | ||||||
|
| |||||||
| 1,828,613 | ||||||||
| ||||||||
Consumer Finance—0.7% | ||||||||
| ||||||||
Ally Financial, Inc. | 6,227 | 112,522 | ||||||
| ||||||||
American Express Co. | 1,377 | 91,460 | ||||||
| ||||||||
Discover Financial Services | 1,709 | 96,268 | ||||||
| ||||||||
Synchrony Financial | 1,737 | 49,661 | ||||||
|
| |||||||
| 349,911 | ||||||||
| ||||||||
Diversified Financial Services—0.9% | ||||||||
| ||||||||
Berkshire Hathaway, Inc., Cl. B1 | 1,328 | 191,631 | ||||||
16 OPPENHEIMER GLOBAL MULTI-ASSET GROWTH FUND
| Shares | Value | |||||||
| ||||||||
Diversified Financial Services (Continued) | ||||||||
| ||||||||
BM&FBovespa SA-Bolsa de Valores Mercadorias e Futuros | 9,800 | $ | 57,719 | |||||
| ||||||||
Grupo de Inversiones Suramericana SA | 2,208 | 28,478 | ||||||
| ||||||||
Hong Kong Exchanges & Clearing Ltd. | 914 | 24,159 | ||||||
| ||||||||
ING Groep NV | 7,826 | 102,888 | ||||||
| ||||||||
Kinnevik AB, Cl. B | 2,132 | 53,861 | ||||||
| ||||||||
Moscow Exchange (The) | 9,972 | 18,376 | ||||||
| ||||||||
ORIX Corp. | 1,800 | 28,635 | ||||||
|
| |||||||
| 505,747 | ||||||||
| ||||||||
Insurance—2.1% | ||||||||
| ||||||||
AIA Group Ltd. | 14,200 | 89,612 | ||||||
| ||||||||
Allianz SE | 788 | 122,811 | ||||||
| ||||||||
American International Group, Inc. | 2,052 | 126,608 | ||||||
| ||||||||
Aon plc | 327 | 36,241 | ||||||
| ||||||||
China Pacific Insurance Group Co. Ltd., Cl. H | 9,200 | 33,269 | ||||||
| ||||||||
Dai-ichi Life Holdings, Inc. | 6,000 | 87,916 | ||||||
| ||||||||
FNF Group | 1,737 | 62,376 | ||||||
| ||||||||
Marsh & McLennan Cos., Inc. | 733 | 46,465 | ||||||
| ||||||||
MetLife, Inc. | 2,920 | 137,123 | ||||||
| ||||||||
Old Mutual plc | 15,746 | 38,605 | ||||||
| ||||||||
Ping An Insurance Group Co. of China Ltd., Cl. H | 10,000 | 52,792 | ||||||
| ||||||||
Progressive Corp. (The) | 2,618 | 82,493 | ||||||
| ||||||||
Prudential plc | 14,671 | 239,201 | ||||||
| ||||||||
Sul America SA | 3,400 | 20,526 | ||||||
|
| |||||||
| 1,176,038 | ||||||||
| ||||||||
Real Estate Investment Trusts (REITs)—0.4% | ||||||||
| ||||||||
Crown Castle International Corp. | 428 | 38,944 | ||||||
| ||||||||
Digital Realty Trust, Inc. | 198 | 18,499 | ||||||
| ||||||||
HCP, Inc. | 1,266 | 43,361 | ||||||
| ||||||||
Mid-America Apartment Communities, Inc. | 647 | 60,009 | ||||||
| ||||||||
Simon Property Group, Inc. | 245 | 45,560 | ||||||
|
| |||||||
| 206,373 | ||||||||
| ||||||||
Real Estate Management & Development—0.5% | ||||||||
| ||||||||
Ayala Land, Inc. | 19,500 | 14,599 | ||||||
| ||||||||
DLF Ltd. | 53,877 | 121,296 | ||||||
| ||||||||
Emaar Properties PJSC | 1,252 | 2,372 | ||||||
| ||||||||
Global Logistic Properties Ltd. | 13,000 | 16,587 | ||||||
| ||||||||
Hang Lung Group Ltd. | 5,000 | 19,169 | ||||||
| ||||||||
SM Prime Holdings, Inc. | 61,000 | 33,889 | ||||||
| ||||||||
SOHO China Ltd. | 24,000 | 12,397 | ||||||
| ||||||||
Vonovia SE | 1,979 | 69,803 | ||||||
|
| |||||||
| 290,112 | ||||||||
| ||||||||
Thrifts & Mortgage Finance—0.3% | ||||||||
| ||||||||
Housing Development Finance Corp. Ltd. | 8,729 | 180,431 | ||||||
| ||||||||
Health Care—6.9% | ||||||||
| ||||||||
Biotechnology—1.4% | ||||||||
| ||||||||
ACADIA Pharmaceuticals, Inc.1 | 1,807 | 42,121 | ||||||
| ||||||||
Amgen, Inc. | 485 | 68,463 | ||||||
17 OPPENHEIMER GLOBAL MULTI-ASSET GROWTH FUND
STATEMENT OF INVESTMENTS Continued
| Shares | Value | |||||||
| ||||||||
Biotechnology (Continued) | ||||||||
| ||||||||
Biocon Ltd. | 159 | $ | 2,211 | |||||
| ||||||||
Biogen, Inc.1 | 434 | 121,598 | ||||||
| ||||||||
BioMarin Pharmaceutical, Inc.1 | 613 | 49,359 | ||||||
| ||||||||
Bluebird Bio, Inc.1 | 392 | 18,718 | ||||||
| ||||||||
Celgene Corp.1 | 1,011 | 103,304 | ||||||
| ||||||||
Circassia Pharmaceuticals plc1 | 13,350 | 13,269 | ||||||
| ||||||||
CSL Ltd. | 1,059 | 80,785 | ||||||
| ||||||||
Gilead Sciences, Inc. | 1,215 | 89,460 | ||||||
| ||||||||
Grifols SA | 3,781 | 74,720 | ||||||
| ||||||||
Ionis Pharmaceuticals, Inc.1 | 1,020 | 26,500 | ||||||
| ||||||||
MacroGenics, Inc.1 | 1,233 | 29,210 | ||||||
| ||||||||
Regeneron Pharmaceuticals, Inc.1 | 39 | 13,456 | ||||||
| ||||||||
Sage Therapeutics, Inc.1 | 721 | 31,392 | ||||||
| ||||||||
Vertex Pharmaceuticals, Inc.1 | 425 | 32,240 | ||||||
|
| |||||||
| 796,806 | ||||||||
| ||||||||
Health Care Equipment & Supplies—1.3% | ||||||||
| ||||||||
Baxter International, Inc. | 906 | 43,117 | ||||||
| ||||||||
Boston Scientific Corp.1 | 3,590 | 78,980 | ||||||
| ||||||||
Coloplast AS, Cl. B | 903 | 62,942 | ||||||
| ||||||||
CR Bard, Inc. | 128 | 27,735 | ||||||
| ||||||||
Danaher Corp. | 1,110 | 87,190 | ||||||
| ||||||||
Essilor International SA | 555 | 62,284 | ||||||
| ||||||||
Intuitive Surgical, Inc.1 | 19 | 12,770 | ||||||
| ||||||||
Medtronic plc | 561 | 46,013 | ||||||
| ||||||||
Sonova Holding AG | 466 | 62,469 | ||||||
| ||||||||
Stryker Corp. | 437 | 50,408 | ||||||
| ||||||||
William Demant Holding AS1 | 2,770 | 51,525 | ||||||
| ||||||||
Zimmer Biomet Holdings, Inc. | 1,449 | 152,725 | ||||||
|
| |||||||
| 738,158 | ||||||||
| ||||||||
Health Care Providers & Services—1.9% | ||||||||
| ||||||||
Aetna, Inc. | 1,783 | 191,405 | ||||||
| ||||||||
Anthem, Inc. | 960 | 116,986 | ||||||
| ||||||||
Apollo Hospitals Enterprise Ltd. | 1,699 | 34,004 | ||||||
| ||||||||
Cardinal Health, Inc. | 517 | 35,513 | ||||||
| ||||||||
Express Scripts Holding Co.1 | 2,042 | 137,631 | ||||||
| ||||||||
Humana, Inc. | 521 | 89,367 | ||||||
| ||||||||
Laboratory Corp. of America Holdings1 | 288 | 36,098 | ||||||
| ||||||||
McKesson Corp. | 437 | 55,573 | ||||||
| ||||||||
Mediclinic International plc | 60 | 665 | ||||||
| ||||||||
Sinopharm Group Co. Ltd., Cl. H | 11,200 | 54,412 | ||||||
| ||||||||
Sonic Healthcare Ltd. | 3,199 | 49,726 | ||||||
| ||||||||
UnitedHealth Group, Inc. | 1,672 | 236,304 | ||||||
|
| |||||||
| 1,037,684 | ||||||||
| ||||||||
Health Care Technology—0.1% | ||||||||
| ||||||||
Cerner Corp.1 | 1,154 | 67,601 | ||||||
| ||||||||
Life Sciences Tools & Services—0.3% | ||||||||
| ||||||||
Agilent Technologies, Inc. | 750 | 32,677 | ||||||
18 OPPENHEIMER GLOBAL MULTI-ASSET GROWTH FUND
| Shares | Value | |||||||
| ||||||||
Life Sciences Tools & Services (Continued) | ||||||||
| ||||||||
Charles River Laboratories International, Inc.1 | 136 | $ | 10,320 | |||||
| ||||||||
Lonza Group AG1 | 421 | 79,377 | ||||||
| ||||||||
Samsung Biologics Co. Ltd.1 | 29 | 3,447 | ||||||
| ||||||||
Thermo Fisher Scientific, Inc. | 152 | 22,349 | ||||||
|
| |||||||
| 148,170 | ||||||||
| ||||||||
Pharmaceuticals—1.9% | ||||||||
| ||||||||
Allergan plc1 | 261 | 54,533 | ||||||
| ||||||||
Bayer AG | 917 | 90,889 | ||||||
| ||||||||
Bristol-Myers Squibb Co. | 227 | 11,557 | ||||||
| ||||||||
Dr. Reddy’s Laboratories Ltd. | 840 | 41,819 | ||||||
| ||||||||
Eli Lilly & Co. | 602 | 44,452 | ||||||
| ||||||||
Galenica AG | 50 | 50,067 | ||||||
| ||||||||
Glenmark Pharmaceuticals Ltd. | 1,087 | 15,221 | ||||||
| ||||||||
Jiangsu Hengrui Medicine Co. Ltd., Cl. A | 4,540 | 30,957 | ||||||
| ||||||||
Johnson & Johnson | 1,169 | 135,592 | ||||||
| ||||||||
Merck & Co., Inc. | 2,147 | 126,072 | ||||||
| ||||||||
Mylan NV1 | 1,281 | 46,757 | ||||||
| ||||||||
Novo Nordisk AS, Cl. B | 1,640 | 58,501 | ||||||
| ||||||||
Pfizer, Inc. | 2,457 | 77,912 | ||||||
| ||||||||
Roche Holding AG | 605 | 138,830 | ||||||
| ||||||||
Shire plc | 735 | 41,505 | ||||||
| ||||||||
Sun Pharmaceutical Industries Ltd. | 1,339 | 14,928 | ||||||
| ||||||||
Teva Pharmaceutical Industries Ltd., Sponsored ADR | 1,523 | 65,093 | ||||||
| ||||||||
Valeant Pharmaceuticals International, Inc.1 | 1,225 | 21,854 | ||||||
|
| |||||||
| 1,066,539 | ||||||||
| ||||||||
Industrials—8.7% | ||||||||
| ||||||||
Aerospace & Defense—1.1% | ||||||||
| ||||||||
Airbus Group SE | 5,828 | 346,050 | ||||||
| ||||||||
Embraer SA, Sponsored ADR | 1,990 | 42,566 | ||||||
| ||||||||
Lockheed Martin Corp. | 481 | 118,509 | ||||||
| ||||||||
Rolls-Royce Holdings plc1 | 5,993 | 53,247 | ||||||
| ||||||||
United Technologies Corp. | 611 | 62,444 | ||||||
|
| |||||||
| 622,816 | ||||||||
| ||||||||
Air Freight & Couriers—0.5% | ||||||||
| ||||||||
FedEx Corp. | 154 | 26,845 | ||||||
| ||||||||
Royal Mail plc | 17,875 | 107,319 | ||||||
| ||||||||
United Parcel Service, Inc., Cl. B | 1,044 | 112,502 | ||||||
| ||||||||
XPO Logistics, Inc.1 | 1,640 | 54,005 | ||||||
|
| |||||||
| 300,671 | ||||||||
| ||||||||
Airlines—0.2% | ||||||||
| ||||||||
Delta Air Lines, Inc. | 1,332 | 55,638 | ||||||
| ||||||||
Japan Airlines Co. Ltd. | 1,200 | 35,371 | ||||||
| ||||||||
Southwest Airlines Co. | 141 | 5,647 | ||||||
|
| |||||||
| 96,656 | ||||||||
| ||||||||
Building Products—0.2% | ||||||||
| ||||||||
A.O. Smith Corp. | 197 | 8,899 | ||||||
| ||||||||
Allegion plc | 250 | 15,960 | ||||||
19 OPPENHEIMER GLOBAL MULTI-ASSET GROWTH FUND
STATEMENT OF INVESTMENTS Continued
| Shares | Value | |||||||
| ||||||||
Building Products (Continued) | ||||||||
| ||||||||
Assa Abloy AB, Cl. B | 5,395 | $ | 98,020 | |||||
|
| |||||||
| 122,879 | ||||||||
| ||||||||
Commercial Services & Supplies—0.9% | ||||||||
| ||||||||
Aggreko plc | 2,460 | 24,112 | ||||||
| ||||||||
Edenred | 3,230 | 74,912 | ||||||
| ||||||||
Johnson Controls International plc | 3,995 | 161,079 | ||||||
| ||||||||
KAR Auction Services, Inc. | 688 | 29,295 | ||||||
| ||||||||
Prosegur Cia de Seguridad SA | 13,515 | 98,150 | ||||||
| ||||||||
Republic Services, Inc., Cl. A | 590 | 31,052 | ||||||
| ||||||||
Waste Connections, Inc. | 572 | 43,020 | ||||||
| ||||||||
Waste Management, Inc. | 320 | 21,011 | ||||||
|
| |||||||
| 482,631 | ||||||||
| ||||||||
Construction & Engineering—0.5% | ||||||||
| ||||||||
Boskalis Westminster | 2,212 | 71,306 | ||||||
| ||||||||
CIMIC Group Ltd. | 1,980 | 44,558 | ||||||
| ||||||||
FLSmidth & Co. AS | 627 | 22,769 | ||||||
| ||||||||
Vinci SA | 1,716 | 124,057 | ||||||
|
| |||||||
| 262,690 | ||||||||
| ||||||||
Electrical Equipment—1.5% | ||||||||
| ||||||||
ABB Ltd.1 | 1,455 | 29,940 | ||||||
| ||||||||
Acuity Brands, Inc. | 61 | 13,638 | ||||||
| ||||||||
Eaton Corp. plc | 1,129 | 71,996 | ||||||
| ||||||||
Emerson Electric Co. | 926 | 46,930 | ||||||
| ||||||||
Legrand SA | 1,119 | 63,188 | ||||||
| ||||||||
Mitsubishi Electric Corp. | 5,000 | 67,671 | ||||||
| ||||||||
Nidec Corp. | 2,800 | 271,454 | ||||||
| ||||||||
Philips Lighting NV1,3 | 2,562 | 60,062 | ||||||
| ||||||||
Prysmian SpA | 1,511 | 37,657 | ||||||
| ||||||||
Rockwell Automation, Inc. | 50 | 5,986 | ||||||
| ||||||||
Schneider Electric SE | 2,244 | 150,763 | ||||||
|
| |||||||
| 819,285 | ||||||||
| ||||||||
Industrial Conglomerates—0.9% | ||||||||
| ||||||||
3M Co. | 647 | 106,949 | ||||||
| ||||||||
General Electric Co. | 8,142 | 236,932 | ||||||
| ||||||||
Jardine Strategic Holdings Ltd. | 1,500 | 52,540 | ||||||
| ||||||||
Siemens AG | 397 | 45,070 | ||||||
| ||||||||
SM Investments Corp. | 3,260 | 45,240 | ||||||
|
| |||||||
| 486,731 | ||||||||
| ||||||||
Machinery—0.9% | ||||||||
| ||||||||
Aalberts Industries NV | 2,777 | 87,640 | ||||||
| ||||||||
Atlas Copco AB, Cl. A | 2,855 | 83,610 | ||||||
| ||||||||
Caterpillar, Inc. | 321 | 26,791 | ||||||
| ||||||||
Deere & Co. | 1,175 | 103,752 | ||||||
| ||||||||
FANUC Corp. | 300 | 56,210 | ||||||
| ||||||||
Fortive Corp. | 93 | 4,748 | ||||||
| ||||||||
Ingersoll-Rand plc | 143 | 9,622 | ||||||
| ||||||||
Kubota Corp. | 800 | 12,896 | ||||||
20 OPPENHEIMER GLOBAL MULTI-ASSET GROWTH FUND
| Shares | Value | |||||||
| ||||||||
Machinery (Continued) | ||||||||
| ||||||||
Parker-Hannifin Corp. | 375 | $ | 46,031 | |||||
| ||||||||
Pentair plc | 620 | 34,181 | ||||||
| ||||||||
Stanley Black & Decker, Inc. | 122 | 13,888 | ||||||
| ||||||||
Wabtec Corp. | 246 | 19,018 | ||||||
| ||||||||
Weir Group plc (The) | 1,235 | 25,636 | ||||||
|
| |||||||
| 524,023 | ||||||||
| ||||||||
Professional Services—0.8% | ||||||||
| ||||||||
Experian plc | 4,697 | 90,193 | ||||||
| ||||||||
Intertek Group plc | 1,520 | 63,522 | ||||||
| ||||||||
Nielsen Holdings plc | 3,025 | 136,185 | ||||||
| ||||||||
Recruit Holdings Co. Ltd. | 3,300 | 132,776 | ||||||
| ||||||||
SGS SA | 22 | 44,579 | ||||||
|
| |||||||
| 467,255 | ||||||||
| ||||||||
Road & Rail—0.3% | ||||||||
| ||||||||
Canadian National Railway Co. | 1,169 | 73,495 | ||||||
| ||||||||
Canadian Pacific Railway Ltd. | 692 | 98,928 | ||||||
|
| |||||||
| 172,423 | ||||||||
| ||||||||
Trading Companies & Distributors—0.7% | ||||||||
| ||||||||
Brenntag AG | 2,724 | 145,722 | ||||||
| ||||||||
Bunzl plc | 3,285 | 88,190 | ||||||
| ||||||||
Travis Perkins plc | 3,569 | 58,126 | ||||||
| ||||||||
Wolseley plc | 1,295 | 67,291 | ||||||
|
| |||||||
| 359,329 | ||||||||
| ||||||||
Transportation Infrastructure—0.2% | ||||||||
| ||||||||
Airports of Thailand PCL | 600 | 6,530 | ||||||
| ||||||||
Beijing Capital International Airport Co. Ltd., Cl. H | 38,000 | 39,833 | ||||||
| ||||||||
DP World Ltd. | 2,707 | 48,581 | ||||||
| ||||||||
Grupo Aeroportuario del Sureste SAB de CV, Cl. B | 1,492 | 23,752 | ||||||
|
| |||||||
| 118,696 | ||||||||
| ||||||||
Information Technology—12.6% | ||||||||
| ||||||||
Communications Equipment—0.3% | ||||||||
| ||||||||
Cisco Systems, Inc. | 2,294 | 70,380 | ||||||
| ||||||||
Nokia OYJ | 13,720 | 61,243 | ||||||
| ||||||||
Telefonaktiebolaget LM Ericsson, Cl. B | 872 | 4,242 | ||||||
|
| |||||||
| 135,865 | ||||||||
| ||||||||
Electronic Equipment, Instruments, & Components—1.3% | ||||||||
| ||||||||
Corning, Inc. | 1,206 | 27,388 | ||||||
| ||||||||
Hoya Corp. | 2,200 | 91,852 | ||||||
| ||||||||
Keyence Corp. | 300 | 220,215 | ||||||
| ||||||||
Kyocera Corp. | 1,800 | 87,562 | ||||||
| ||||||||
Murata Manufacturing Co. Ltd. | 1,700 | 237,094 | ||||||
| ||||||||
Spectris plc | 1,409 | 35,321 | ||||||
| ||||||||
TE Connectivity Ltd. | 707 | 44,449 | ||||||
|
| |||||||
| 743,881 | ||||||||
| ||||||||
Internet Software & Services—4.1% | ||||||||
| ||||||||
Alibaba Group Holding Ltd., Sponsored ADR1 | 2,345 | 238,463 | ||||||
21 OPPENHEIMER GLOBAL MULTI-ASSET GROWTH FUND
STATEMENT OF INVESTMENTS Continued
| Shares | Value | |||||||
| ||||||||
Internet Software & Services (Continued) | ||||||||
| ||||||||
Alphabet, Inc., Cl. A1 | 524 | $ | 424,387 | |||||
| ||||||||
Alphabet, Inc., Cl. C1 | 724 | 568,007 | ||||||
| ||||||||
Baidu, Inc., Sponsored ADR1 | 1,123 | 198,614 | ||||||
| ||||||||
eBay, Inc.1 | 1,095 | 31,218 | ||||||
| ||||||||
Facebook, Inc., Cl. A1 | 3,209 | 420,347 | ||||||
| ||||||||
MercadoLibre, Inc. | 20 | 3,360 | ||||||
| ||||||||
NAVER Corp. | 57 | 42,684 | ||||||
| ||||||||
Tencent Holdings Ltd. | 7,200 | 190,654 | ||||||
| ||||||||
Twitter, Inc.1 | 2,878 | 51,660 | ||||||
| ||||||||
United Internet AG | 1,151 | 47,278 | ||||||
| ||||||||
Yahoo Japan Corp. | 12,100 | 46,456 | ||||||
|
| |||||||
| 2,263,128 | ||||||||
| ||||||||
IT Services—1.4% | ||||||||
| ||||||||
Amadeus IT Group SA, Cl. A | 1,970 | 92,945 | ||||||
| ||||||||
Amdocs Ltd. | 2,045 | 119,530 | ||||||
| ||||||||
Cielo SA | 400 | 4,060 | ||||||
| ||||||||
Cognizant Technology Solutions Corp., Cl. A1 | 620 | 31,837 | ||||||
| ||||||||
Earthport plc1 | 35,740 | 7,545 | ||||||
| ||||||||
First Data Corp., Cl. A1 | 1,880 | 26,301 | ||||||
| ||||||||
Infosys Ltd. | 5,683 | 85,292 | ||||||
| ||||||||
Mastercard, Inc., Cl. A | 845 | 90,432 | ||||||
| ||||||||
PayPal Holdings, Inc.1 | 4,895 | 203,926 | ||||||
| ||||||||
Tata Consultancy Services Ltd. | 1,048 | 37,499 | ||||||
| ||||||||
Visa, Inc., Cl. A | 500 | 41,255 | ||||||
| ||||||||
Xerox Corp. | 5,222 | 51,019 | ||||||
|
| |||||||
| 791,641 | ||||||||
| ||||||||
Semiconductors & Semiconductor Equipment—1.7% | ||||||||
| ||||||||
Applied Materials, Inc. | 2,076 | 60,370 | ||||||
| ||||||||
ASML Holding NV | 681 | 72,051 | ||||||
| ||||||||
Broadcom Ltd. | 799 | 136,054 | ||||||
| ||||||||
Infineon Technologies AG | 11,628 | 208,663 | ||||||
| ||||||||
Maxim Integrated Products, Inc. | 3,843 | 152,298 | ||||||
| ||||||||
Micron Technology, Inc.1 | 606 | 10,399 | ||||||
| ||||||||
NXP Semiconductors NV1 | 343 | 34,300 | ||||||
| ||||||||
SK Hynix, Inc. | 1,757 | 62,614 | ||||||
| ||||||||
Taiwan Semiconductor Manufacturing Co. Ltd. | 25,000 | 149,221 | ||||||
| ||||||||
Texas Instruments, Inc. | 918 | 65,040 | ||||||
|
| |||||||
| 951,010 | ||||||||
| ||||||||
Software—2.5% | ||||||||
| ||||||||
Activision Blizzard, Inc. | 1,274 | 54,998 | ||||||
| ||||||||
Adobe Systems, Inc.1 | 1,139 | 122,454 | ||||||
| ||||||||
AVEVA Group plc | 680 | 15,297 | ||||||
| ||||||||
Dassault Systemes | 961 | 76,155 | ||||||
| ||||||||
Electronic Arts, Inc.1 | 693 | 54,414 | ||||||
| ||||||||
Gemalto NV | 960 | 52,020 | ||||||
| ||||||||
Intuit, Inc. | 1,508 | 163,980 | ||||||
| ||||||||
Microsoft Corp. | 3,146 | 188,508 | ||||||
| ||||||||
Oracle Corp. | 1,459 | 56,055 | ||||||
22 OPPENHEIMER GLOBAL MULTI-ASSET GROWTH FUND
| Shares | Value | |||||||
| ||||||||
Software (Continued) | ||||||||
| ||||||||
SAP SE | 5,086 | $ | 447,983 | |||||
| ||||||||
Synopsys, Inc.1 | 815 | 48,338 | ||||||
| ||||||||
Temenos Group AG1 | 1,536 | 99,059 | ||||||
|
| |||||||
| 1,379,261 | ||||||||
| ||||||||
Technology Hardware, Storage & Peripherals—1.3% | ||||||||
| ||||||||
Apple, Inc. | 5,674 | 644,226 | ||||||
| ||||||||
Western Digital Corp. | 1,659 | 96,952 | ||||||
|
| |||||||
| 741,178 | ||||||||
| ||||||||
Materials—2.2% | ||||||||
| ||||||||
Chemicals—1.3% | ||||||||
| ||||||||
Akzo Nobel NV | 1,251 | 80,783 | ||||||
| ||||||||
Albemarle Corp. | 123 | 10,277 | ||||||
| ||||||||
Asian Paints Ltd. | 582 | 9,377 | ||||||
| ||||||||
Eastman Chemical Co. | 769 | 55,299 | ||||||
| ||||||||
EI du Pont de Nemours & Co. | 687 | 47,259 | ||||||
| ||||||||
Essentra plc | 6,566 | 40,986 | ||||||
| ||||||||
Linde AG | 1,190 | 196,315 | ||||||
| ||||||||
Novozymes AS, Cl. B | 1,668 | 61,936 | ||||||
| ||||||||
PPG Industries, Inc. | 580 | 54,015 | ||||||
| ||||||||
Sherwin-Williams Co. (The) | 50 | 12,243 | ||||||
| ||||||||
Sika AG | 14 | 67,263 | ||||||
| ||||||||
Syngenta AG1 | 162 | 64,507 | ||||||
|
| |||||||
| 700,260 | ||||||||
| ||||||||
Construction Materials—0.3% | ||||||||
| ||||||||
Indocement Tunggal Prakarsa Tbk PT | 13,500 | 17,002 | ||||||
| ||||||||
James Hardie Industries plc | 5,632 | 83,946 | ||||||
| ||||||||
Semen Indonesia Persero Tbk PT | 8,500 | 6,406 | ||||||
| ||||||||
UltraTech Cement Ltd. | 490 | 29,160 | ||||||
| ||||||||
Vulcan Materials Co. | 478 | 54,109 | ||||||
|
| |||||||
| 190,623 | ||||||||
| ||||||||
Containers & Packaging—0.2% | ||||||||
| ||||||||
CCL Industries, Inc., Cl. B | 401 | 71,315 | ||||||
| ||||||||
WestRock Co. | 499 | 23,049 | ||||||
|
| |||||||
| 94,364 | ||||||||
| ||||||||
Metals & Mining—0.4% | ||||||||
| ||||||||
Alrosa PJSC | 24,817 | 34,723 | ||||||
| ||||||||
Glencore plc1 | 9,320 | 28,403 | ||||||
| ||||||||
Goldcorp, Inc. | 5,453 | 82,886 | ||||||
| ||||||||
Newcrest Mining Ltd. | 1,737 | 30,291 | ||||||
| ||||||||
Silver Wheaton Corp. | 1,717 | 41,397 | ||||||
| ||||||||
Zijin Mining Group Co. Ltd., Cl. H | 54,000 | 17,137 | ||||||
|
| |||||||
| 234,837 | ||||||||
| ||||||||
Telecommunication Services—2.3% | ||||||||
| ||||||||
Diversified Telecommunication Services—1.2% | ||||||||
| ||||||||
BT Group plc | 13,002 | 59,753 | ||||||
| ||||||||
Iliad SA | 292 | 61,225 | ||||||
23 OPPENHEIMER GLOBAL MULTI-ASSET GROWTH FUND
STATEMENT OF INVESTMENTS Continued
| Shares | Value | |||||||||
| ||||||||||
Diversified Telecommunication Services (Continued) | ||||||||||
| ||||||||||
Inmarsat plc | 3,566 | $ | 30,566 | |||||||
| ||||||||||
Koninklijke KPN NV | 14,424 | 47,010 | ||||||||
| ||||||||||
Nippon Telegraph & Telephone Corp. | 4,700 | 209,050 | ||||||||
| ||||||||||
Spark New Zealand Ltd. | 32,615 | 85,366 | ||||||||
| ||||||||||
Telstra Corp. Ltd. | 13,340 | 50,456 | ||||||||
| ||||||||||
Verizon Communications, Inc. | 2,823 | 135,786 | ||||||||
|
| |||||||||
| 679,212 | ||||||||||
| ||||||||||
Wireless Telecommunication Services—1.1% | ||||||||||
| ||||||||||
China Mobile Ltd. | 7,500 | 85,911 | ||||||||
| ||||||||||
KDDI Corp. | 5,800 | 176,385 | ||||||||
| ||||||||||
Rogers Communications, Inc., Cl. B | 2,160 | 86,896 | ||||||||
| ||||||||||
SK Telecom Co. Ltd. | 364 | 71,316 | ||||||||
| ||||||||||
T-Mobile US, Inc.1 | 1,131 | 56,245 | ||||||||
| ||||||||||
Vodafone Group plc | 45,153 | 123,977 | ||||||||
|
| |||||||||
| 600,730 | ||||||||||
| ||||||||||
Utilities—0.6% | ||||||||||
| ||||||||||
Electric Utilities—0.5% | ||||||||||
| ||||||||||
Edison International | 1,513 | 111,175 | ||||||||
| ||||||||||
PG&E Corp. | 2,469 | 153,374 | ||||||||
|
| |||||||||
| 264,549 | ||||||||||
| ||||||||||
Gas Utilities—0.1% | ||||||||||
| ||||||||||
AmeriGas Partners LP2 | 1,140 | 54,435 | ||||||||
|
| |||||||||
Total Common Stocks (Cost $33,531,707) | 35,534,988 | |||||||||
| ||||||||||
Preferred Stocks—0.4% | ||||||||||
| ||||||||||
Bayerische Motoren Werke (BMW) AG, Preference | 1,728 | 131,169 | ||||||||
| ||||||||||
Lojas Americanas SA, Preference | 14,760 | 95,718 | ||||||||
| ||||||||||
Zee Entertainment Enterprises Ltd., 6% Cum. Non-Cv. | 56,210 | 8,080 | ||||||||
|
| |||||||||
Total Preferred Stocks (Cost $194,742) | 234,967 | |||||||||
| Principal Amount | ||||||||||
| ||||||||||
U.S. Government Obligation—3.9% | ||||||||||
| ||||||||||
United States Treasury Bonds, 2.875%, 8/15/454 (Cost $2,002,123) | $ | 2,023,000 | 2,147,145 | |||||||
| ||||||||||
Foreign Government Obligations—6.5% | ||||||||||
Argentine Republic Sr. Unsec. Nts., 16%, 10/17/23 | ARS | 265,000 | 17,607 | |||||||
| ||||||||||
Argentine Republic Unsec. Nts., 2.50%, 7/22/215 | ARS | 485,000 | 34,697 | |||||||
| ||||||||||
Federative Republic of Brazil Nota Do Tesouro Nacional Unsec. Nts.: | ||||||||||
9.762%, 1/1/21 | BRL | 1,415,000 | 425,756 | |||||||
10.00%, 1/1/19 | BRL | 665,000 | 209,901 | |||||||
10.00%, 1/1/23 | BRL | 360,000 | 106,571 | |||||||
12.90%, 8/15/22 | BRL | 65,000 | 60,737 | |||||||
| ||||||||||
Hungary Unsec. Bonds: | ||||||||||
Series 20/A, 7.50%, 11/12/20 | HUF | 6,400,000 | 28,048 | |||||||
Series 25/B, 5.50%, 6/24/25 | HUF | 25,100,000 | 107,188 | |||||||
| ||||||||||
Hungary Unsec. Nts., Series 18/A, 5.50%, 12/20/18 | HUF | 17,800,000 | 69,595 | |||||||
| ||||||||||
Malaysia Sr. Unsec. Nts., Series 0315, 3.659%, 10/15/20 | MYR | 630,000 | 151,823 | |||||||
| ||||||||||
Republic of Chile Sr. Unsec. Bonds, 5.50%, 8/5/20 | CLP | 19,000,000 | 30,977 | |||||||
24 OPPENHEIMER GLOBAL MULTI-ASSET GROWTH FUND
| Principal Amount | Value | |||||||||
| ||||||||||
Foreign Government Obligations (Continued) | ||||||||||
| ||||||||||
Republic of Colombia Sr. Unsec. Bonds: | ||||||||||
Series B, 7.00%, 5/4/22 | COP | 110,000,000 | $ | 36,933 | ||||||
Series B, 7.50%, 8/26/26 | COP | 145,000,000 | 48,841 | |||||||
Series B, 7.75%, 9/18/30 | COP | 50,000,000 | 17,087 | |||||||
Series B, 10.00%, 7/24/24 | COP | 130,000,000 | 50,917 | |||||||
| ||||||||||
Republic of Colombia Sr. Unsec. Nts., Series B, 7%, 9/11/19 | COP | 175,000,000 | 59,127 | |||||||
| ||||||||||
Republic of Indonesia Treasury Bonds: | ||||||||||
Series FR59, 7.00%, 5/15/27 | IDR | 1,300,000,000 | 97,078 | |||||||
Series FR61, 7.00%, 5/15/22 | IDR | 2,500,000,000 | 191,299 | |||||||
Series FR72, 8.25%, 5/15/36 | IDR | 1,580,000,000 | 126,413 | |||||||
Series FR73, 8.75%, 5/15/31 | IDR | 1,020,000,000 | 87,456 | |||||||
| ||||||||||
Republic of Peru Sr. Unsec. Bonds: | ||||||||||
6.35%, 8/12/283 | PEN | 455,000 | 139,506 | |||||||
6.95%, 8/12/313 | PEN | 40,000 | 12,956 | |||||||
7.84%, 8/12/203 | PEN | 120,000 | 39,557 | |||||||
8.20%, 8/12/263 | PEN | 125,000 | 44,157 | |||||||
| ||||||||||
Republic of Poland Unsec. Bonds, Series 0726, 2.50%, 7/25/26 | PLN | 380,000 | 92,117 | |||||||
| ||||||||||
Republic of Poland Unsec. Nts., Series 0721, 1.75%, 7/25/21 | PLN | 530,000 | 131,041 | |||||||
| ||||||||||
Republic of South Africa Sr. Unsec. Bonds, Series R208, 6.75%, 3/31/21 | ZAR | 2,300,000 | 162,105 | |||||||
| ||||||||||
Republic of South Africa Unsec. Bonds: | ||||||||||
Series 2023, 7.75%, 2/28/23 | ZAR | 250,000 | 17,968 | |||||||
Series 2030, 8.00%, 1/31/30 | ZAR | 1,220,000 | 82,934 | |||||||
Series 2037, 8.50%, 1/31/37 | ZAR | 900,000 | 61,703 | |||||||
Series R186, 10.50%, 12/21/26 | ZAR | 925,000 | 76,455 | |||||||
| ||||||||||
Republic of Turkey Unsec. Nts.: | ||||||||||
8.50%, 7/10/19 | TRY | 65,000 | 20,716 | |||||||
8.80%, 11/14/18 | TRY | 60,000 | 19,358 | |||||||
10.60%, 2/11/26 | TRY | 75,000 | 25,471 | |||||||
10.70%, 2/17/21 | TRY | 80,000 | 26,936 | |||||||
| ||||||||||
Romania Unsec. Bonds, 5.95%, 6/11/21 | RON | 160,000 | 45,331 | |||||||
| ||||||||||
Romania Unsec. Nts., 5.90%, 7/26/17 | RON | 260,000 | 65,992 | |||||||
| ||||||||||
Russian Federation Unsec. Bonds, Series 6212, 7.05%, 1/19/28 | RUB | 1,000,000 | 14,294 | |||||||
| ||||||||||
Russian Federation Unsec. Nts.: | ||||||||||
Series 6210, 6.80%, 12/11/19 | RUB | 200,000 | 3,006 | |||||||
Series 6216, 6.70%, 5/15/19 | RUB | 18,500,000 | 280,722 | |||||||
| ||||||||||
United Mexican States Sr. Unsec. Bonds: | ||||||||||
Series M, 5.75%, 3/5/26 | MXN | 2,600,000 | 132,919 | |||||||
Series M, 8.00%, 12/7/23 | MXN | 200,000 | 11,743 | |||||||
Series M20, 8.50%, 5/31/29 | MXN | 930,000 | 57,617 | |||||||
Series M20, 10.00%, 12/5/24 | MXN | 1,100,000 | 72,482 | |||||||
Series M30, 8.50%, 11/18/38 | MXN | 320,000 | 20,311 | |||||||
| ||||||||||
United Mexican States Unsec. Bonds, Series M30, 10%, 11/20/36 | MXN | 150,000 | 10,787 | |||||||
|
| |||||||||
Total Foreign Government Obligations (Cost $3,655,113) | 3,626,235 | |||||||||
| ||||||||||
Short-Term Note—0.1% | ||||||||||
| ||||||||||
| Letras del Banco Central de la Republica Argentina, 24.36%, 1/18/176 (Cost $36,281) | ARS | 580,000 | 36,332 | |||||||
25 OPPENHEIMER GLOBAL MULTI-ASSET GROWTH FUND
STATEMENT OF INVESTMENTS Continued
| Shares | Value | |||||||
| ||||||||
Investment Companies—29.8% | ||||||||
| ||||||||
Oppenheimer Fundamental Alternatives Fund, Cl. I7 | 120,464 | $ | 3,324,806 | |||||
| ||||||||
Oppenheimer Global High Yield Fund, Cl. I7 | 599,838 | 5,590,487 | ||||||
| ||||||||
Oppenheimer Institutional Government Money Market Fund, Cl. E, 0.28%7,8 | 4,187,545 | 4,187,545 | ||||||
| ||||||||
Oppenheimer Master Loan Fund, LLC7 | 64,963 | 1,027,621 | ||||||
| ||||||||
Oppenheimer Senior Floating Rate Fund, Cl. I7 | 295,052 | 2,372,217 | ||||||
|
| |||||||
Total Investment Companies (Cost $16,389,475) | 16,502,676 | |||||||
| ||||||||
Total Investments, at Value (Cost $55,809,441) | 104.8% | 58,082,343 | ||||||
| ||||||||
Net Other Assets (Liabilities) | (4.8) | (2,677,316) | ||||||
|
| |||||||
Net Assets | 100.0% | $ | 55,405,027 | |||||
|
| |||||||
Footnotes to Statement of Investments
1. Non-income producing security.
2. Security is a Master Limited Partnership.
3. Represents securities sold under Rule 144A, which are exempt from registration under the Securities Act of 1933, as amended. These securities have been determined to be liquid under guidelines established by the Board of Trustees. These securities amount to $298,736 or 0.54% of the Fund’s net assets at period end.
4. All or a portion of the security position is held in accounts at a futures clearing merchant and pledged to cover margin requirements on open futures contracts and written options on futures, if applicable. The aggregate market value of such securities is $1,336,261. See Note 6 of the accompanying Notes.
5. Denotes an inflation-indexed security: coupon or principal are indexed to a consumer price index.
6. Zero coupon bond reflects effective yield on the original acquisition date.
7. Is or was an affiliate, as defined in the Investment Company Act of 1940, as amended, at or during the reporting period, by virtue of the Fund owning at least 5% of the voting securities of the issuer or as a result of the Fund and the issuer having the same investment adviser. Transactions during the reporting period in which the issuer was an affiliate are as follows:
| Shares | Shares | |||||||||||||||
| October 30, | Gross | Gross | October 31, | |||||||||||||
| 2015a | Additions | Reductions | 2016 | |||||||||||||
| ||||||||||||||||
Oppenheimer Fundamental Alternatives Fund, Cl. I | — | 120,464 | — | 120,464 | ||||||||||||
Oppenheimer Global High Yield Fund, Cl. I | 819,393 | 100,846 | 320,401 | 599,838 | ||||||||||||
Oppenheimer Institutional Government Money Market Fund, Cl. Eb | 318,978 | 26,187,936 | 22,319,369 | 4,187,545 | ||||||||||||
Oppenheimer Master Loan Fund, LLC | — | 64,963 | — | 64,963 | ||||||||||||
Oppenheimer Senior Floating Rate Fund, Cl. I | — | 295,052 | — | 295,052 | ||||||||||||
| Realized Gain | ||||||||||||||||
| Value | Income | (Loss) | ||||||||||||||
| ||||||||||||||||
Oppenheimer Fundamental Alternatives Fund, Cl. I | $ | 3,324,806 | $ | — | $ | — | ||||||||||
Oppenheimer Global High Yield Fund, Cl. I | 5,590,487 | 367,867 | 26,677 | |||||||||||||
Oppenheimer Institutional Government Money Market Fund, Cl. Eb | 4,187,545 | 5,679 | — | |||||||||||||
Oppenheimer Master Loan Fund, LLC | 1,027,621 | 13,731 | c | (3,557)c | ||||||||||||
26 OPPENHEIMER GLOBAL MULTI-ASSET GROWTH FUND
Footnotes to Statement of Investments (Continued)
| Value | Income | Realized | ||||||||||
| ||||||||||||
Oppenheimer Senior Floating Rate Fund, Cl. I | $ | 2,372,217 | $ | 22,931 | $ | — | ||||||
|
| |||||||||||
Total | $ | 16,502,676 | $ | 410,208 | $ | 23,120 | ||||||
|
| |||||||||||
a. Represents the last business day of the Fund’s reporting period.
b. Prior to September 28, 2016, this fund was named Oppenheimer Institutional Money Market Fund.
c. Represents the amount allocated to the Fund from Oppenheimer Master Loan Fund, LLC.
8. Rate shown is the 7-day yield at period end.
Distribution of investments representing geographic holdings, as a percentage of total investments at value, is as follows:
Geographic Holdings (Unaudited) | Value | Percent | ||||||||
United States | $ | 34,463,687 | 59.3% | |||||||
France | 2,904,633 | 5.0 | ||||||||
Japan | 2,594,769 | 4.5 | ||||||||
United Kingdom | 2,158,349 | 3.7 | ||||||||
Germany | 1,800,891 | 3.1 | ||||||||
Switzerland | 1,384,260 | 2.4 | ||||||||
China | 1,352,732 | 2.3 | ||||||||
India | 1,147,879 | 2.0 | ||||||||
Brazil | 1,111,371 | 1.9 | ||||||||
Canada | 1,074,147 | 1.9 | ||||||||
Netherlands | 768,728 | 1.3 | ||||||||
Russia | 603,504 | 1.0 | ||||||||
Spain | 593,353 | 1.0 | ||||||||
Indonesia | 580,179 | 1.0 | ||||||||
Mexico | 522,187 | 0.9 | ||||||||
Hong Kong | 484,805 | 0.8 | ||||||||
South Africa | 466,756 | 0.8 | ||||||||
Sweden | 364,224 | 0.6 | ||||||||
Australia | 355,716 | 0.6 | ||||||||
Denmark | 327,672 | 0.6 | ||||||||
South Korea | 301,633 | 0.5 | ||||||||
Colombia | 274,634 | 0.5 | ||||||||
Poland | 253,142 | 0.4 | ||||||||
Peru | 239,150 | 0.4 | ||||||||
Malaysia | 221,067 | 0.4 | ||||||||
Hungary | 204,831 | 0.4 | ||||||||
Singapore | 152,641 | 0.3 | ||||||||
Italy | 152,419 | 0.3 | ||||||||
Taiwan | 149,221 | 0.3 | ||||||||
Ireland | 143,610 | 0.2 | ||||||||
Turkey | 129,264 | 0.2 | ||||||||
Philippines | 121,773 | 0.2 | ||||||||
Romania | 111,323 | 0.2 | ||||||||
Thailand | 107,035 | 0.2 | ||||||||
Argentina | 91,995 | 0.2 | ||||||||
New Zealand | 85,366 | 0.1 | ||||||||
27 OPPENHEIMER GLOBAL MULTI-ASSET GROWTH FUND
STATEMENT OF INVESTMENTS Continued
| Geographic Holdings (Unaudited) (Continued) | Value | Percent | ||||||||
Israel | $ | 65,093 | 0.1% | |||||||
Finland | 61,243 | 0.1 | ||||||||
Belgium | 55,549 | 0.1 | ||||||||
United Arab Emirates | 50,954 | 0.1 | ||||||||
Chile | 30,977 | 0.1 | ||||||||
Nigeria | 19,581 | 0.0 | ||||||||
|
| |||||||||
Total | $ | 58,082,343 | 100.0% | |||||||
|
| |||||||||
| ||
| Forward Currency Exchange Contracts as of October 31, 2016 | ||
| Currency | ||||||||||||||||||||||||
| Counter | Settlement | Purchased | Currency Sold | Unrealized | Unrealized | |||||||||||||||||||
| -party | Month(s) | (000’s) | (000’s) | Appreciation | Depreciation | |||||||||||||||||||
BAC | 12/2016 | USD | 160 | MYR | 675 | $ | — | $ | 399 | |||||||||||||||
BAC | 12/2016 | USD | 442 | SEK | 3,880 | 11,044 | — | |||||||||||||||||
BAC | 12/2016 | USD | 357 | TRY | 1,120 | — | 1,575 | |||||||||||||||||
BOA | 01/2017 | BRL | 2,590 | USD | 768 | 27,958 | — | |||||||||||||||||
BOA | 12/2016 | CLP | 95,000 | USD | 139 | 5,725 | — | |||||||||||||||||
BOA | 11/2016 | COP | 128,000 | �� | USD | 43 | — | 615 | ||||||||||||||||
BOA | 12/2016 | INR | 13,000 | USD | 194 | 174 | — | |||||||||||||||||
BOA | 12/2016 | JPY | 73,000 | USD | 698 | — | 733 | |||||||||||||||||
BOA | 12/2016 | KRW | 43,000 | USD | 38 | — | 911 | |||||||||||||||||
BOA | 11/2016 | MXN | 800 | USD | 43 | — | 840 | |||||||||||||||||
BOA | 12/2016 | SGD | 340 | USD | 249 | — | 5,010 | |||||||||||||||||
BOA | 12/2016 | THB | 4,000 | USD | 114 | — | 261 | |||||||||||||||||
BOA | 12/2016 | TWD | 14,000 | USD | 444 | 72 | — | |||||||||||||||||
BOA | 01/2017 | USD | 67 | BRL | 220 | — | 415 | |||||||||||||||||
BOA | 12/2016 | USD | 773 | CNH | 5,200 | 8,397 | — | |||||||||||||||||
BOA | 12/2016 | USD | 402 | HKD | 3,120 | 34 | — | |||||||||||||||||
BOA | 12/2016 | USD | 56 | HUF | 16,000 | — | 478 | |||||||||||||||||
BOA | 11/2016 - 12/2016 | USD | 652 | INR | 44,000 | 10 | 3,906 | |||||||||||||||||
BOA | 01/2017 | USD | 512 | JPY | 53,000 | 6,194 | 761 | |||||||||||||||||
BOA | 12/2016 | USD | 340 | KRW | 377,000 | 10,844 | 183 | |||||||||||||||||
BOA | 12/2016 | USD | 621 | MYR | 2,575 | 8,939 | — | |||||||||||||||||
BOA | 12/2016 | USD | 221 | ZAR | 3,100 | — | 7,010 | |||||||||||||||||
CITNA-B | 01/2017 | BRL | 540 | USD | 168 | — | 2,044 | |||||||||||||||||
CITNA-B | 12/2016 | DKK | 930 | USD | 141 | — | 3,536 | |||||||||||||||||
CITNA-B | 12/2016 | EUR | 635 | USD | 698 | 306 | — | |||||||||||||||||
CITNA-B | 12/2016 | JPY | 188,000 | USD | 1,844 | — | 47,248 | |||||||||||||||||
CITNA-B | 12/2016 - 03/2017 | PLN | 1,630 | USD | 418 | 1,478 | 4,603 | |||||||||||||||||
CITNA-B | 11/2016 - 12/2016 | TRY | 770 | USD | 250 | — | 2,443 | |||||||||||||||||
CITNA-B | 12/2016 | USD | 303 | DKK | 2,055 | — | 1,272 | |||||||||||||||||
CITNA-B | 12/2016 | USD | 3,990 | EUR | 3,540 | 95,002 | — | |||||||||||||||||
CITNA-B | 12/2016 | USD | 515 | GBP | 390 | 37,260 | — | |||||||||||||||||
CITNA-B | 11/2016 | USD | 35 | RON | 145 | — | 159 | |||||||||||||||||
CITNA-B | 01/2017 | USD | 57 | RUB | 3,600 | 1,164 | — | |||||||||||||||||
CITNA-B | 12/2016 | ZAR | 16,560 | USD | 1,135 | 80,714 | — | |||||||||||||||||
DEU | 12/2016 | AUD | 1,334 | USD | 994 | 18,993 | — | |||||||||||||||||
DEU | 12/2016 | NOK | 3,670 | USD | 444 | 258 | — | |||||||||||||||||
DEU | 12/2016 | USD | 1,811 | CHF | 1,755 | 32,681 | — | |||||||||||||||||
DEU | 12/2016 | USD | 256 | THB | 9,000 | — | 1,024 | |||||||||||||||||
28 OPPENHEIMER GLOBAL MULTI-ASSET GROWTH FUND
| Forward Currency Exchange Contracts (Continued) | ||||||||||||||||||||||||||
| Currency | ||||||||||||||||||||||||||
| Counter | Settlement | Purchased | Currency Sold | Unrealized | Unrealized | |||||||||||||||||||||
| -party | Month(s) | (000’s) | (000’s) | Appreciation | Depreciation | |||||||||||||||||||||
DEU | 12/2016 | USD | 518 | ZAR | 7,520 | $ | — | $ | 33,800 | |||||||||||||||||
DEU | 12/2016 | ZAR | 11,260 | USD | 785 | 41,370 | — | |||||||||||||||||||
GSCO-OT | 12/2016 | MYR | 700 | USD | 168 | — | 1,741 | |||||||||||||||||||
GSCO-OT | 12/2016 | SEK | 11,530 | USD | 1,363 | — | 83,658 | |||||||||||||||||||
GSCO-OT | 11/2016 | USD | 217 | BRL | 680 | 4,806 | — | |||||||||||||||||||
GSCO-OT | 11/2016 | USD | 124 | PEN | 420 | — | 347 | |||||||||||||||||||
HSBC | 12/2016 | MXN | 3,300 | USD | 167 | 6,910 | — | |||||||||||||||||||
HSBC | 12/2016 | PHP | 2,000 | USD | 41 | — | 257 | |||||||||||||||||||
HSBC | 12/2016 | THB | 9,000 | USD | 258 | — | 832 | |||||||||||||||||||
HSBC | 12/2016 | USD | 322 | CAD | 425 | 5,303 | — | |||||||||||||||||||
HSBC | 12/2016 | USD | 131 | CHF | 130 | — | 357 | |||||||||||||||||||
HSBC | 12/2016 | USD | 227 | CNH | 1,540 | 1,165 | — | |||||||||||||||||||
HSBC | 12/2016 | USD | 903 | EUR | 800 | 22,609 | — | |||||||||||||||||||
HSBC | 12/2016 | USD | 245 | HKD | 1,900 | 15 | — | |||||||||||||||||||
HSBC | 12/2016 | USD | 68 | ILS | 260 | — | 237 | |||||||||||||||||||
HSBC | 12/2016 | USD | 189 | TWD | 6,000 | — | 904 | |||||||||||||||||||
JPM | 12/2016 | CLP | 445,000 | USD | 673 | 5,407 | — | |||||||||||||||||||
JPM | 12/2016 | COP | 934,000 | USD | 315 | — | 7,208 | |||||||||||||||||||
JPM | 12/2016 | IDR | 23,886,000 | USD | 1,783 | 36,403 | — | |||||||||||||||||||
JPM | 11/2016 | INR | 13,000 | USD | 194 | 272 | — | |||||||||||||||||||
JPM | 12/2016 | KRW | 536,000 | USD | 476 | — | 7,555 | |||||||||||||||||||
JPM | 12/2016 | MXN | 13,800 | USD | 723 | 3,353 | 112 | |||||||||||||||||||
JPM | 12/2016 | PHP | 3,000 | USD | 63 | — | 862 | |||||||||||||||||||
JPM | 12/2016 | RUB | 58,000 | USD | 896 | 7,645 | 1,507 | |||||||||||||||||||
JPM | 12/2016 | USD | 822 | CAD | 1,090 | 9,075 | — | |||||||||||||||||||
JPM | 11/2016 | USD | 26 | CLP | 17,000 | — | 40 | |||||||||||||||||||
JPM | 12/2016 | USD | 1,028 | GBP | 830 | 14,560 | 3,277 | |||||||||||||||||||
JPM | 11/2016 | USD | 161 | IDR | 2,105,000 | 32 | — | |||||||||||||||||||
JPM | 12/2016 | USD | 148 | INR | 10,000 | — | 498 | |||||||||||||||||||
JPM | 12/2016 | USD | 122 | KRW | 137,000 | 1,942 | — | |||||||||||||||||||
JPM | 12/2016 | USD | 562 | MXN | 10,900 | — | 11,142 | |||||||||||||||||||
JPM | 12/2016 | USD | 277 | NZD | 380 | 6,123 | — | |||||||||||||||||||
JPM | 12/2016 | USD | 226 | PHP | 11,000 | — | 166 | |||||||||||||||||||
JPM | 12/2016 | USD | 375 | RUB | 25,000 | — | 14,221 | |||||||||||||||||||
JPM | 12/2016 | USD | 258 | SGD | 360 | — | 780 | |||||||||||||||||||
JPM | 12/2016 | USD | 225 | TWD | 7,000 | 3,471 | — | |||||||||||||||||||
JPM | 11/2016 | USD | 148 | ZAR | 2,050 | — | 3,426 | |||||||||||||||||||
MSCO | 12/2016 | NOK | 7,640 | USD | 954 | — | 29,162 | |||||||||||||||||||
TDB | 11/2016 | MXN | 700 | USD | 37 | 177 | — | |||||||||||||||||||
TDB | 12/2016 | USD | 775 | EUR | 690 | 16,180 | — | |||||||||||||||||||
|
|
|
| |||||||||||||||||||||||
Total Unrealized Appreciation and Depreciation |
| $ | 534,065 | $ | 287,515 | |||||||||||||||||||||
|
|
|
| |||||||||||||||||||||||
29 OPPENHEIMER GLOBAL MULTI-ASSET GROWTH FUND
STATEMENT OF INVESTMENTS Continued
| Futures Contracts as of October 31, 2016 | ||||||||||||||||||||||||||||
| Number | Unrealized | |||||||||||||||||||||||||||
| Expiration | of | Appreciation | ||||||||||||||||||||||||||
| Description | Exchange | Buy/Sell | Date | Contracts | Value | (Depreciation) | ||||||||||||||||||||||
| Mini MSCI Emerging Market Index | NYF | Sell | 12/16/16 | 48 | $ | 2,168,400 | $ | (12,874) | ||||||||||||||||||||
| Nikkei 225 Index | TYOE | Buy | 12/8/16 | 5 | 831,506 | 18,095 | ||||||||||||||||||||||
| S&P 500 E-Mini Index | CME | Buy | 12/16/16 | 23 | 2,438,115 | (36,666) | ||||||||||||||||||||||
| STOXX Europe 600 Index | EUX | Sell | 12/16/16 | 304 | 5,646,475 | 4,849 | ||||||||||||||||||||||
| United States Treasury Long Bonds | CBT | Buy | 12/20/16 | 11 | 1,789,906 | (88,878) | ||||||||||||||||||||||
| United States Treasury Nts., 10 yr. | CBT | Buy | 12/20/16 | 52 | 6,740,500 | (84,993) | ||||||||||||||||||||||
|
| |||||||||||||||||||||||||||
| $ | (200,467) | |||||||||||||||||||||||||||
|
| |||||||||||||||||||||||||||
| Over-the-Counter Interest Rate Swaps at October 31, 2016 | ||||||||||||||||||||||||||||
| Pay/Receive | ||||||||||||||||||||||||||||
| Floating | Floating | Fixed | Maturity | |||||||||||||||||||||||||
| Counterparty | Rate | Rate | Rate | Date | Notional Amount (000’s) | Value | ||||||||||||||||||||||
| Three-Month MYR | ||||||||||||||||||||||||||||
BOA | Pay | KLIBOR BNM | 3.470% | 10/27/21 | MYR | 950 | $ | (649) | ||||||||||||||||||||
| Three-Month MYR | ||||||||||||||||||||||||||||
BOA | Pay | KLIBOR BNM | 3.290 | 10/27/18 | MYR | 570 | (159) | |||||||||||||||||||||
CITNA-B | Pay | BZDI | 10.910 | 1/2/23 | BRL | 1,100 | (4,929) | |||||||||||||||||||||
CITNA-B | Pay | BZDI | 10.950 | 1/4/21 | BRL | 335 | (942) | |||||||||||||||||||||
| Three-Month | ||||||||||||||||||||||||||||
| COP IBR OIS | ||||||||||||||||||||||||||||
JPM | Pay | Compound | 6.520 | 10/27/26 | COP | 171,000 | 10 | |||||||||||||||||||||
|
| |||||||||||||||||||||||||||
Total Over-the-Counter Interest Rate Swaps |
| $ | (6,669) | |||||||||||||||||||||||||
|
| |||||||||||||||||||||||||||
| Over-the-Counter Total Return Swaps at October 31, 2016 | ||||||||||||||||||||||||||||
| Pay/Receive | Notional | |||||||||||||||||||||||||||
| Total | Maturity | Amount | ||||||||||||||||||||||||||
| Reference Asset | Counterparty | Return* | Floating Rate | Date | (000’s) | Value | ||||||||||||||||||||||
| iShares iBoxx $ High Yield Corporate Bond Exchange Traded Fund | One-Month USD | |||||||||||||||||||||||||||
| BBA LIBOR minus | ||||||||||||||||||||||||||||
| GSCOI | Receive | 100 basis points | 11/25/16 | USD | 2,994 | $ | (36,354) | |||||||||||||||||||||
| MSCI Daily TR Net Emerging | One-Month USD | |||||||||||||||||||||||||||
| BBA LIBOR plus | ||||||||||||||||||||||||||||
| GSCOI | Receive | 105 basis points | 11/11/16 | USD | 835 | (4,693) | ||||||||||||||||||||||
| MSCI Daily TR Net Emerging Mexico | One-Month USD | |||||||||||||||||||||||||||
| BBA LIBOR plus | ||||||||||||||||||||||||||||
| GSCOI | Receive | 56 basis points | 11/11/16 | USD | 745 | 22,008 | ||||||||||||||||||||||
| MSCI Daily TR Net Malaysia | One-Month USD | |||||||||||||||||||||||||||
| BBA LIBOR plus | ||||||||||||||||||||||||||||
| GSCOI | Receive | 33 basis points | 11/11/16 | USD | 752 | (8,809) | ||||||||||||||||||||||
| MSCI International Net Brazil | One-Month USD | |||||||||||||||||||||||||||
| BBA LIBOR plus | ||||||||||||||||||||||||||||
| GSCOI | Receive | 21 basis points | 11/11/16 | USD | 965 | 83,685 | ||||||||||||||||||||||
| OAIIX Reference Fund** | One-Month USD | |||||||||||||||||||||||||||
| BBA LIBOR plus | ||||||||||||||||||||||||||||
| GSCOI | Receive | 100 basis points | 8/7/17 | USD | 4,018 | (1,646) | ||||||||||||||||||||||
| OAIIX Reference Fund** | One-Month USD | |||||||||||||||||||||||||||
| BBA LIBOR plus | ||||||||||||||||||||||||||||
| t-SGS | Receive | 85 basis points | 9/18/17 | USD | 4,018 | (1,480) | ||||||||||||||||||||||
30 OPPENHEIMER GLOBAL MULTI-ASSET GROWTH FUND
| ||||||||||||||||||||||||
Over-the-Counter Total Return Swaps (Continued) |
| |||||||||||||||||||||||
| Reference Asset | Counterparty | Pay/Receive Total Return* | Floating Rate | Maturity Date | Notional Amount (000’s) | Value | ||||||||||||||||||
| ||||||||||||||||||||||||
| One-Month USD | ||||||||||||||||||||||||
| PowerShares Senior Loan | BBA LIBOR plus | |||||||||||||||||||||||
| Exchange Traded Fund | CITNA-B | Receive | 20 basis points | 8/18/17 | USD 3,282 | $ | 5,631 | |||||||||||||||||
| ||||||||||||||||||||||||
| One-Month USD | ||||||||||||||||||||||||
| BBA LIBOR plus | ||||||||||||||||||||||||
| QOPIX Reference Fund** | GSCOI | Receive | 100 basis points | 8/7/17 | USD 4,887 | 31,960 | ||||||||||||||||||
|
| |||||||||||||||||||||||
| Total Over-the-Counter Total Return Swaps | $ | 90,302 | ||||||||||||||||||||||
|
| |||||||||||||||||||||||
* Fund will pay or receive the total return of the reference asset depending on whether the return is positive or negative. For contracts where the Fund has elected to receive the total return of the reference asset if positive, it will be responsible for paying the floating rate and the total return of the reference asset if negative. If the Fund has elected to pay the total return of the reference asset if positive, it will receive the floating rate and the total return of the reference asset if negative.
** The Reference Asset is an affiliated Fund.
| Reference Asset | Value | Realized Gain/ (Loss) | ||||||
| ||||||||
| OAIIX Reference Fund | $ | (3,126 | ) | $ | (181,371) | |||
| ||||||||
| QOPIX Reference Fund | 31,960 | (70,131) | ||||||
|
| |||||||
| Total | $ | 28,834 | $ | (251,502) | ||||
|
| |||||||
| Glossary: | ||
| Counterparty Abbreviations | ||
| BAC | Barclays Bank plc | |
| BOA | Bank of America NA | |
| CITNA-B | Citibank NA | |
| DEU | Deutsche Bank AG | |
| GSCO-OT | Goldman Sachs Bank USA | |
| GSCOI | Goldman Sachs International | |
| HSBC | HSBC Bank USA NA | |
| JPM | JPMorgan Chase Bank NA | |
| MSCO | Morgan Stanley Capital Services, Inc. | |
| TDB | Toronto Dominion Bank | |
| t-SGS | Societe Generale | |
| Currency abbreviations indicate amounts reporting in currencies | ||
| ARS | Argentine Peso | |
| AUD | Australian Dollar | |
| BRL | Brazilian Real | |
| CAD | Canadian Dollar | |
| CHF | Swiss Franc | |
| CLP | Chilean Peso | |
| CNH | Offshore Chinese Renminbi | |
| COP | Colombian Peso | |
| DKK | Danish Krone | |
| EUR | Euro | |
| GBP | British Pound Sterling | |
| HKD | Hong Kong Dollar | |
| HUF | Hungarian Forint | |
31 OPPENHEIMER GLOBAL MULTI-ASSET GROWTH FUND
STATEMENT OF INVESTMENTS Continued
| Currency abbreviations indicate amounts reporting in currencies (Continued) | ||
| IDR | Indonesian Rupiah | |
| ILS | Israeli Shekel | |
| INR | Indian Rupee | |
| JPY | Japanese Yen | |
| KRW | South Korean Won | |
| MXN | Mexican Nuevo Peso | |
| MYR | Malaysian Ringgit | |
| NOK | Norwegian Krone | |
| NZD | New Zealand Dollar | |
| PEN | Peruvian New Sol | |
| PHP | Philippine Peso | |
| PLN | Polish Zloty | |
| RON | New Romanian Leu | |
| RUB | Russian Ruble | |
| SEK | Swedish Krona | |
| SGD | Singapore Dollar | |
| THB | Thailand Baht | |
| TRY | New Turkish Lira | |
| TWD | New Taiwan Dollar | |
| ZAR | South African Rand | |
| Definitions | ||
| BBA LIBOR | British Bankers’ Association London - Interbank Offered Rate | |
| BNM | Bank Negara Malaysia | |
| BZDI | Brazil Interbank Deposit Rate | |
| IBR | Indicador Bancario de Referencia | |
| KLIBOR | Kuala Lumpur Interbank Offered Rate | |
| MSCI | Morgan Stanley Capital International | |
| OAIIX | Oppenheimer Global Multi Strategies Fund | |
| OIS | Overnight Index Swap | |
| QOPIX | Oppenheimer Fundamental Alternatives Fund | |
| S&P | Standard & Poor’s | |
| TR | Total Return | |
| Exchange Abbreviations | ||
| CBT | Chicago Board of Trade | |
| CME | Chicago Mercantile Exchanges | |
| EUX | European Stock Exchange | |
| NYF | New York Futures Exchange | |
| TYOE | Tokyo Stock Exchange | |
See accompanying Notes to Financial Statements.
32 OPPENHEIMER GLOBAL MULTI-ASSET GROWTH FUND
STATEMENT OF ASSETS AND LIABILITIES October 31, 2016
| ||||
Assets | ||||
| Investments, at value—see accompanying statement of investments: | ||||
| Unaffiliated companies (cost $39,419,966) | $ | 41,579,667 | ||
| Affiliated companies (cost $16,389,475) | 16,502,676 | |||
|
| |||
| 58,082,343 | ||||
| ||||
| Cash | 547,723 | |||
| ||||
| Cash—foreign currencies (cost $135,318) | 135,503 | |||
| ||||
| Unrealized appreciation on forward currency exchange contracts | 534,065 | |||
| ||||
| Swaps, at value | 111,334 | |||
| ||||
| Affilliated swaps, at value | 31,960 | |||
| ||||
| Receivables and other assets: | ||||
| Investments sold | 279,031 | |||
| Interest and dividends | 177,739 | |||
| Variation margin receivable | 33,237 | |||
| Shares of beneficial interest sold | 9,425 | |||
| Other | 40,353 | |||
|
| |||
Total assets
|
| 59,982,713
|
| |
| ||||
Liabilities | ||||
| Unrealized depreciation on forward currency exchange contracts | 287,515 | |||
| ||||
| Swaps, at value | 56,535 | |||
| ||||
| Affilliated swaps, at value | 3,126 | |||
| ||||
| Payables and other liabilities: | ||||
| Investments purchased | 4,129,700 | |||
| Foreign capital gains tax | 18,335 | |||
| Variation margin payable | 16,247 | |||
| Distribution and service plan fees | 11,793 | |||
| Shares of beneficial interest redeemed | 2,600 | |||
| Shareholder communications | 1,280 | |||
| Trustees’ compensation | 309 | |||
| Other | 50,246 | |||
|
| |||
| Total liabilities | 4,577,686 | |||
| ||||
Net Assets | $ | 55,405,027 | ||
|
| |||
| ||||
Composition of Net Assets | ||||
| Par value of shares of beneficial interest | $ | 5,283 | ||
| ||||
| Additional paid-in capital | 52,956,101 | |||
| ||||
| Accumulated net investment income | 1,340,847 | |||
| ||||
| Accumulated net realized loss on investments and foreign currency transactions | (1,291,227) | |||
| ||||
| Net unrealized appreciation on investments and translation of assets and liabilities denominated in foreign currencies | 2,394,023 | |||
|
| |||
| Net Assets | $ | 55,405,027 | ||
|
| |||
33 OPPENHEIMER GLOBAL MULTI-ASSET GROWTH FUND
STATEMENT OF ASSETS AND LIABILITIES Continued
| ||||
Net Asset Value Per Share | ||||
Class A Shares:
| ||||
| Net asset value and redemption price per share (based on net assets of $53,578,657 and | ||||
| 5,108,170 shares of beneficial interest outstanding) | $ | 10.49 | ||
Maximum offering price per share (net asset value plus sales charge of 5.75% of offering price) | $ | 11.13 | ||
| ||||
Class C Shares:
| ||||
| Net asset value, redemption price (excludes applicable contingent deferred sales charge) and offering price per share (based on net assets of $522,031 and 50,128 shares of beneficial interest outstanding) | $ | 10.41 | ||
| ||||
Class I Shares:
| ||||
| Net asset value, redemption price and offering price per share (based on net assets of $10,511 and 1,000 shares of beneficial interest outstanding) | $ | 10.51 | ||
| ||||
Class R Shares:
| ||||
| Net asset value, redemption price (excludes applicable contingent deferred sales charge) and offering price per share (based on net assets of $1,204,418 and 114,983 shares of beneficial interest outstanding) | $ | 10.47 | ||
| ||||
Class Y Shares:
| ||||
| Net asset value, redemption price and offering price per share (based on net assets of $89,410 and 8,511 shares of beneficial interest outstanding) | $ | 10.51 | ||
See accompanying Notes to Financial Statements.
34 OPPENHEIMER GLOBAL MULTI-ASSET GROWTH FUND
STATEMENT OF OPERATIONS For the Year Ended October 31, 2016
| ||||
| Allocation of Income and Expenses from Master Fund1 | ||||
| Net investment income allocated from Oppenheimer Master Loan Fund, LLC: | ||||
| Interest | $ | 13,686 | ||
| Dividends | 45 | |||
| Net expenses | (780) | |||
|
| |||
Net investment income allocated from Oppenheimer Master Loan Fund, LLC
|
| 12,951
|
| |
| ||||
Investment Income | ||||
| Dividends: | ||||
| Unaffiliated companies (net of foreign withholding taxes of $57,690) | 762,018 | |||
| Affiliated companies | 396,477 | |||
| ||||
| Interest (net of foreign withholding taxes of $6,160) | 95,192 | |||
|
| |||
Total investment income
|
| 1,253,687
|
| |
| ||||
Expenses | ||||
| Management fees | 383,138 | |||
| ||||
| Distribution and service plan fees: | ||||
| Class A | 5,401 | |||
| Class C | 3,038 | |||
| Class R | 1,088 | |||
| ||||
| Transfer and shareholder servicing agent fees: | ||||
| Class A | 111,151 | |||
| Class C | 673 | |||
| Class I | 4 | |||
| Class R | 490 | |||
| Class Y | 51 | |||
| ||||
| Shareholder communications: | ||||
| Class A | 3,088 | |||
| Class C | 1,860 | |||
| Class R | 134 | |||
| Class Y | 12 | |||
| ||||
| Legal, auditing and other professional fees | 116,156 | |||
| ||||
| Custodian fees and expenses | 53,118 | |||
| ||||
| Registration fees | 38,928 | |||
| ||||
| Trustees’ compensation | 865 | |||
| ||||
| Other | 9,241 | |||
|
| |||
| Total expenses | 728,436 | |||
| Less waivers and reimbursements of expenses | (162,841) | |||
|
| |||
Net expenses
|
| 565,595
|
| |
| ||||
Net Investment Income | 701,043 | |||
35 OPPENHEIMER GLOBAL MULTI-ASSET GROWTH FUND
STATEMENT OF OPERATIONS Continued
| ||||
| Realized and Unrealized Gain (Loss) | ||||
| Net realized gain (loss) on: | ||||
| Investments from: | ||||
Unaffiliated companies (net of foreign capital gains tax of $96) | $ | (750,990) | ||
Affiliated companies | 26,677 | |||
| Closing and expiration of futures contracts | (695,343) | |||
| Foreign currency transactions | 548,536 | |||
| Swap contracts | 957,503 | |||
| Affiliated swap contracts | (251,502) | |||
| ||||
| Net realized loss allocated from Oppenheimer Master Loan Fund, LLC | (3,557) | |||
|
| |||
| Net realized loss | (168,676) | |||
| ||||
| Net change in unrealized appreciation/depreciation on: | ||||
| Investments (net of foreign capital gains tax of $17,853) | 950,396 | |||
| Translation of assets and liabilities denominated in foreign currencies | 38,371 | |||
| Futures contracts | (190,973) | |||
| Swap contracts | 61,977 | |||
| Affiliated swap contracts | (37,428) | |||
| ||||
| Net change in unrealized appreciation/depreciation allocated from: | ||||
| Oppenheimer Master Loan Fund, LLC | 24,943 | |||
|
| |||
Net change in unrealized appreciation/depreciation
|
| 847,286
|
| |
| ||||
| Net Increase in Net Assets Resulting from Operations | $ | 1,379,653 | ||
|
| |||
1. The Fund invests in a certain affiliated mutual fund that expects to be treated as a partnership for tax purposes.
See Note 4 of the accompanying Notes.
See accompanying Notes to Financial Statements.
36 OPPENHEIMER GLOBAL MULTI-ASSET GROWTH FUND
STATEMENTS OF CHANGES IN NET ASSETS
| Year Ended October 31, 2016 | Year Ended October 30, 20151,2 | |||||||
| ||||||||
Operations | ||||||||
| Net investment income | $ | 701,043 | $ | 94,980 | ||||
| ||||||||
| Net realized loss | (168,676) | (119,102) | ||||||
| ||||||||
| Net change in unrealized appreciation/depreciation | 847,286 | 1,546,737 | ||||||
|
| |||||||
| Net increase in net assets resulting from operations | 1,379,653 | 1,522,615 | ||||||
| ||||||||
Dividends and/or Distributions to Shareholders | ||||||||
| Dividends from net investment income: | ||||||||
| Class A | (430,562) | — | ||||||
| Class C | (1,003) | — | ||||||
| Class I | (94) | — | ||||||
| Class R | (77) | — | ||||||
| Class Y | (89) | — | ||||||
|
| |||||||
| (431,825) | — | |||||||
| ||||||||
| Distributions from net realized gain: | ||||||||
| Class A | (1,201) | — | ||||||
| Class C | (3) | — | ||||||
| Class I | — | — | ||||||
| Class R | — | — | ||||||
| Class Y | — | — | ||||||
|
| |||||||
| (1,204) | — | |||||||
| ||||||||
Beneficial Interest Transactions | ||||||||
| Net increase in net assets resulting from beneficial interest transactions: | ||||||||
| Class A | 1,117,784 | 49,945,032 | ||||||
| Class C | 451,421 | 32,088 | ||||||
| Class I | — | — | ||||||
| Class R | 1,209,357 | — | ||||||
| Class Y | 80,106 | — | ||||||
|
| |||||||
| 2,858,668 | 49,977,120 | |||||||
| ||||||||
Net Assets | ||||||||
| Total increase | 3,805,292 | 51,499,735 | ||||||
| ||||||||
| Beginning of period | 51,599,735 | 100,0003 | ||||||
|
| |||||||
| End of period (including accumulated net investment income of $1,340,847 and $76,763, respectively) | $ | 55,405,027 | $ | 51,599,735 | ||||
|
| |||||||
1. Represents the last business day of the Fund’s reporting period.
2. For the period from August 27, 2015 (commencement of operations) to October 30, 2015.
3. Reflects the value of the Manager’s seed money invested on May 26, 2015.
See accompanying Notes to Financial Statements.
37 OPPENHEIMER GLOBAL MULTI-ASSET GROWTH FUND
| Class A | Year Ended October 31, 2016 | Period Ended October 30, 20151,2 | ||||||
| ||||||||
Per Share Operating Data | ||||||||
| Net asset value, beginning of period | $10.30 | $10.00 | ||||||
| ||||||||
| Income (loss) from investment operations: | ||||||||
| Net investment income3 | 0.14 | 0.02 | ||||||
| Net realized and unrealized gain | 0.14 | 0.28 | ||||||
|
| |||||||
| Total from investment operations | 0.28 | 0.30 | ||||||
| ||||||||
| Dividends and/or distributions to shareholders: | ||||||||
| Dividends from net investment income | (0.09) | 0.00 | ||||||
| Distributions from net realized gain | (0.00)4 | 0.00 | ||||||
|
| |||||||
| Total dividends and/or distributions to shareholders | (0.09) | 0.00 | ||||||
| ||||||||
| Net asset value, end of period | $10.49 | $10.30 | ||||||
|
| |||||||
| ||||||||
Total Return, at Net Asset Value5 | 2.73% | 3.00% | ||||||
| ||||||||
Ratios/Supplemental Data | ||||||||
| Net assets, end of period (in thousands) | $53,579 | $51,525 | ||||||
| ||||||||
| Average net assets (in thousands) | $50,502 | $49,048 | ||||||
| ||||||||
| Ratios to average net assets:6 | ||||||||
| Net investment income | 1.38%7 | 1.07% | ||||||
| Total expenses8 | 1.42%7 | 1.61% | ||||||
Expenses after payments, waivers and/or reimbursements and reduction to custodian expenses | 1.10%7 | 1.05% | ||||||
| ||||||||
| Portfolio turnover rate | 61% | 8% | ||||||
1. Represents the last business day of the Fund’s reporting period.
2. For the period from August 27, 2015 (commencement of operations) to October 30, 2015.
3. Per share amounts calculated based on the average shares outstanding during the period.
4. Less than $0.005 per share.
5. Assumes an initial investment on the business day before the first day of the fiscal period, with all dividends and distributions reinvested in additional shares on the reinvestment date, and redemption at the net asset value calculated on the last business day of the fiscal period. Sales charges are not reflected in the total returns. Total returns are not annualized for periods less than one full year. Returns do not reflect the deduction of taxes that a shareholder would pay on fund distributions or the redemption of fund shares.
6. Annualized for periods less than one full year.
7. Includes the Fund’s share of the allocated expenses and/or net investment income from the master funds.
8. Total expenses including indirect expenses from affiliated fund fees and expenses were as follows:
| Year Ended October 31, 2016 | 1.53% | |||||
| Period Ended October 30, 2015 | 1.72% |
See accompanying Notes to Financial Statements.
38 OPPENHEIMER GLOBAL MULTI-ASSET GROWTH FUND
| Class C | Year Ended October 31, 2016 | Period Ended | ||||||
| ||||||||
Per Share Operating Data | ||||||||
| Net asset value, beginning of period | $10.29 | $10.00 | ||||||
| ||||||||
| Income (loss) from investment operations: | ||||||||
| Net investment income3 | 0.04 | 0.01 | ||||||
| Net realized and unrealized gain | 0.15 | 0.28 | ||||||
|
| |||||||
| Total from investment operations | 0.19 | 0.29 | ||||||
| ||||||||
| Dividends and/or distributions to shareholders: | ||||||||
| Dividends from net investment income | (0.07) | 0.00 | ||||||
| Distributions from net realized gain | (0.00)4 | 0.00 | ||||||
|
| |||||||
| Total dividends and/or distributions to shareholders | (0.07) | 0.00 | ||||||
| ||||||||
| Net asset value, end of period | $10.41 | $10.29 | ||||||
|
| |||||||
| ||||||||
Total Return, at Net Asset Value5 | 1.88% | 2.90% | ||||||
| ||||||||
Ratios/Supplemental Data | ||||||||
| Net assets, end of period (in thousands) | $522 | $45 | ||||||
| ||||||||
| Average net assets (in thousands) | $308 | $28 | ||||||
| ||||||||
| Ratios to average net assets:6 | ||||||||
| Net investment income | 0.36%7 | 0.42% | ||||||
| Total expenses8 | 3.05%7 | 2.34% | ||||||
| Expenses after payments, waivers and/or reimbursements and reduction to custodian expenses | 1.85%7 | 1.81% | ||||||
| ||||||||
| Portfolio turnover rate | 61% | 8% | ||||||
1. Represents the last business day of the Fund’s reporting period.
2. For the period from August 27, 2015 (commencement of operations) to October 30, 2015.
3. Per share amounts calculated based on the average shares outstanding during the period.
4. Less than $0.005 per share.
5. Assumes an initial investment on the business day before the first day of the fiscal period, with all dividends and distributions reinvested in additional shares on the reinvestment date, and redemption at the net asset value calculated on the last business day of the fiscal period. Sales charges are not reflected in the total returns. Total returns are not annualized for periods less than one full year. Returns do not reflect the deduction of taxes that a shareholder would pay on fund distributions or the redemption of fund shares.
6. Annualized for periods less than one full year.
7. Includes the Fund’s share of the allocated expenses and/or net investment income from the master funds.
8. Total expenses including indirect expenses from affiliated fund fees and expenses were as follows:
| Year Ended October 31, 2016 | 3.16% | |||||||
Period Ended October 30, 2015 | 2.45% |
See accompanying Notes to Financial Statements.
39 OPPENHEIMER GLOBAL MULTI-ASSET GROWTH FUND
FINANCIAL HIGHLIGHTS Continued
| Class I | Year Ended October 31, 2016 | Period Ended October 30, 20151,2 | ||||||
| ||||||||
Per Share Operating Data | ||||||||
| Net asset value, beginning of period | $10.31 | $10.00 | ||||||
| ||||||||
| Income (loss) from investment operations: | ||||||||
| Net investment income3 | 0.16 | 0.02 | ||||||
| Net realized and unrealized gain | 0.13 | 0.29 | ||||||
|
| |||||||
| Total from investment operations | 0.29 | 0.31 | ||||||
| ||||||||
| Dividends and/or distributions to shareholders: | ||||||||
| Dividends from net investment income | (0.09) | 0.00 | ||||||
| Distributions from net realized gain | (0.00)4 | 0.00 | ||||||
|
| |||||||
| Total dividends and/or distributions to shareholders | (0.09) | 0.00 | ||||||
| ||||||||
| Net asset value, end of period | $10.51 | $10.31 | ||||||
|
| |||||||
| ||||||||
Total Return, at Net Asset Value5 | 2.91% | 3.10% | ||||||
| ||||||||
Ratios/Supplemental Data | ||||||||
| Net assets, end of period (in thousands) | $11 | $10 | ||||||
| ||||||||
| Average net assets (in thousands) | $10 | $10 | ||||||
| ||||||||
| Ratios to average net assets:6 | ||||||||
| Net investment income | 1.61%7 | 1.27% | ||||||
| Total expenses8 | 1.19%7 | 1.30% | ||||||
| Expenses after payments, waivers and/or reimbursements and reduction to custodian expenses | 0.85%7 | 0.84% | ||||||
| ||||||||
| Portfolio turnover rate | 61% | 8% | ||||||
1. Represents the last business day of the Fund’s reporting period.
2. For the period from August 27, 2015 (commencement of operations) to October 30, 2015.
3. Per share amounts calculated based on the average shares outstanding during the period.
4. Less than $0.005 per share.
5. Assumes an initial investment on the business day before the first day of the fiscal period, with all dividends and distributions reinvested in additional shares on the reinvestment date, and redemption at the net asset value calculated on the last business day of the fiscal period. Sales charges are not reflected in the total returns. Total returns are not annualized for periods less than one full year. Returns do not reflect the deduction of taxes that a shareholder would pay on fund distributions or the redemption of fund shares.
6. Annualized for periods less than one full year.
7. Includes the Fund’s share of the allocated expenses and/or net investment income from the master funds.
8. Total expenses including indirect expenses from affiliated fund fees and expenses were as follows:
| Year Ended October 31, 2016 | 1.30% | |||||||
Period Ended October 30, 2015 | 1.41% |
See accompanying Notes to Financial Statements.
40 OPPENHEIMER GLOBAL MULTI-ASSET GROWTH FUND
Class R | Year Ended October 31, 2016 | Period Ended October 30, 20151,2 | ||||||
| ||||||||
Per Share Operating Data | ||||||||
Net asset value, beginning of period | $10.30 | $10.00 | ||||||
| ||||||||
Income (loss) from investment operations: | ||||||||
Net investment income3 | 0.04 | 0.01 | ||||||
Net realized and unrealized gain | 0.21 | 0.29 | ||||||
|
| |||||||
Total from investment operations | 0.25 | 0.30 | ||||||
| ||||||||
Dividends and/or distributions to shareholders: | ||||||||
Dividends from net investment income | (0.08) | 0.00 | ||||||
Distributions from net realized gain | (0.00)4 | 0.00 | ||||||
|
| |||||||
Total dividends and/or distributions to shareholders | (0.08) | 0.00 | ||||||
| ||||||||
Net asset value, end of period | $10.47 | $10.30 | ||||||
|
| |||||||
| ||||||||
Total Return, at Net Asset Value5 | 2.43% | 3.00% | ||||||
| ||||||||
Ratios/Supplemental Data | ||||||||
Net assets, end of period (in thousands) | $1,204 | $10 | ||||||
| ||||||||
Average net assets (in thousands) | $226 | $10 | ||||||
| ||||||||
Ratios to average net assets:6 | ||||||||
Net investment income | 0.43%7 | 0.77% | ||||||
Total expenses8 | 2.07%7 | 1.48% | ||||||
Expenses after payments, waivers and/or reimbursements and reduction to custodian expenses | 1.33%7 | 1.33% | ||||||
| ||||||||
Portfolio turnover rate | 61% | 8% | ||||||
1. Represents the last business day of the Fund’s reporting period.
2. For the period from August 27, 2015 (commencement of operations) to October 30, 2015.
3. Per share amounts calculated based on the average shares outstanding during the period.
4. Less than $0.005 per share.
5. Assumes an initial investment on the business day before the first day of the fiscal period, with all dividends and distributions reinvested in additional shares on the reinvestment date, and redemption at the net asset value calculated on the last business day of the fiscal period. Sales charges are not reflected in the total returns. Total returns are not annualized for periods less than one full year. Returns do not reflect the deduction of taxes that a shareholder would pay on fund distributions or the redemption of fund shares.
6. Annualized for periods less than one full year.
7. Includes the Fund’s share of the allocated expenses and/or net investment income from the master funds.
8. Total expenses including indirect expenses from affiliated fund fees and expenses were as follows:
| Year Ended October 31, 2016 | 2.18% | |||||||
Period Ended October 30, 2015 | 1.59% |
See accompanying Notes to Financial Statements.
41 OPPENHEIMER GLOBAL MULTI-ASSET GROWTH FUND
FINANCIAL HIGHLIGHTS Continued
| Class Y | Year Ended October 31, 2016 | Period Ended October 30, 20151,2 | ||||||
| ||||||||
Per Share Operating Data | ||||||||
Net asset value, beginning of period | $10.31 | $10.00 | ||||||
| ||||||||
Income (loss) from investment operations: | ||||||||
Net investment income3 | 0.12 | 0.02 | ||||||
Net realized and unrealized gain | 0.17 | 0.29 | ||||||
|
| |||||||
Total from investment operations | 0.29 | 0.31 | ||||||
| ||||||||
Dividends and/or distributions to shareholders: | ||||||||
Dividends from net investment income | (0.09) | 0.00 | ||||||
Distributions from net realized gain | (0.00)4 | 0.00 | ||||||
|
| |||||||
Total dividends and/or distributions to shareholders | (0.09) | 0.00 | ||||||
| ||||||||
Net asset value, end of period | $10.51 | $10.31 | ||||||
|
| |||||||
| ||||||||
Total Return, at Net Asset Value5 | 2.86% | 3.10% | ||||||
| ||||||||
Ratios/Supplemental Data | ||||||||
Net assets, end of period (in thousands) | $89 | $10 | ||||||
| ||||||||
Average net assets (in thousands) | $23 | $10 | ||||||
| ||||||||
Ratios to average net assets:6 | ||||||||
Net investment income | 1.13%7 | 1.17% | ||||||
Total expenses8 | 1.52%7 | 1.48% | ||||||
Expenses after payments, waivers and/or reimbursements and reduction to custodian expenses | 0.94%7 | 0.94% | ||||||
| ||||||||
Portfolio turnover rate | 61% | 8% | ||||||
1. Represents the last business day of the Fund’s reporting period.
2. For the period from August 27, 2015 (commencement of operations) to October 30, 2015.
3. Per share amounts calculated based on the average shares outstanding during the period.
4. Less than $0.005 per share.
5. Assumes an initial investment on the business day before the first day of the fiscal period, with all dividends and distributions reinvested in additional shares on the reinvestment date, and redemption at the net asset value calculated on the last business day of the fiscal period. Sales charges are not reflected in the total returns. Total returns are not annualized for periods less than one full year. Returns do not reflect the deduction of taxes that a shareholder would pay on fund distributions or the redemption of fund shares.
6. Annualized for periods less than one full year.
7. Includes the Fund’s share of the allocated expenses and/or net investment income from the master funds.
8. Total expenses including indirect expenses from affiliated fund fees and expenses were as follows:
| Year Ended October 31, 2016 | 1.63% | |||||||
Period Ended October 30, 2015 | 1.59% |
See accompanying Notes to Financial Statements.
42 OPPENHEIMER GLOBAL MULTI-ASSET GROWTH FUND
NOTES TO STATEMENT OF INVESTMENTS October 31, 2016
1. Organization
Oppenheimer Global Multi-Asset Growth Fund (the “Fund”) is a diversified open-end management investment company registered under the Investment Company Act of 1940 (“1940 Act”), as amended. The Fund’s investment objective is to seek capital appreciation. The Fund’s investment adviser is OFI Global Asset Management, Inc. (“OFI Global” or the “Manager”), a wholly-owned subsidiary of OppenheimerFunds, Inc. (“OFI” or the “Sub-Adviser”). The Manager has entered into a sub-advisory agreement with OFI. The Sub-Adviser has entered into a sub-sub-advisory agreement with Barings Real Estate Advisers LLC, formerly known as Cornerstone Real Estate Advisers LLC, and OFI SteelPath, Inc. (collectively, the “Sub-Sub-Advisers”). The Fund commenced operations on August 27, 2015.
The Fund offers Class A, Class C, Class I, Class R and Class Y shares. Class A shares are sold at their offering price, which is normally net asset value plus a front-end sales charge. Class C and Class R shares are sold without a front-end sales charge but may be subject to a contingent deferred sales charge (“CDSC”). Class R shares are sold only through retirement plans. Retirement plans that offer Class R shares may impose charges on those accounts. Class I and Class Y shares are sold to certain institutional investors or intermediaries without either a front-end sales charge or a CDSC, however, the intermediaries may impose charges on their accountholders who beneficially own Class I and Class Y shares. All classes of shares have identical rights and voting privileges with respect to the Fund in general and exclusive voting rights on matters that affect that class alone. Earnings, net assets and net asset value per share may differ due to each class having its own expenses, such as transfer and shareholder servicing agent fees and shareholder communications, directly attributable to that class. Class A, C and R shares have separate distribution and/or service plans under which they pay fees. Class I and Class Y shares do not pay such fees.
The following is a summary of significant accounting policies followed in the Fund’s preparation of financial statements in accordance with accounting principles generally accepted in the United States (“U.S. GAAP”).
2. Significant Accounting Policies
Security Valuation. All investments in securities are recorded at their estimated fair value, as described in Note 3.
Foreign Currency Translation. The Fund’s accounting records are maintained in U.S. dollars. The values of securities denominated in foreign currencies and amounts related to the purchase and sale of foreign securities and foreign investment income are translated into U.S. dollars as of the close of the New York Stock Exchange (the “Exchange”), normally 4:00 P.M. Eastern time, on each day the Exchange is open for trading. Foreign exchange rates may be valued primarily using a reliable bank, dealer or service authorized by the Board of Trustees.
Reported net realized gains and losses from foreign currency transactions arise from sales of portfolio securities, sales and maturities of short-term securities, sales of foreign currencies, exchange rate fluctuations between the trade and settlement dates on securities transactions, and the difference between the amounts of dividends, interest, and foreign withholding
43 OPPENHEIMER GLOBAL MULTI-ASSET GROWTH FUND
NOTES TO STATEMENT OF INVESTMENTS Continued
2. Significant Accounting Policies (Continued)
taxes recorded on the Fund’s books and the U.S. dollar equivalent of the amounts actually received or paid. Net unrealized appreciation and depreciation on the translation of assets and liabilities denominated in foreign currencies arise from changes in the values of assets and liabilities, including investments in securities at fiscal period end, resulting from changes in exchange rates.
The effect of changes in foreign currency exchange rates on investments is separately identified from the fluctuations arising from changes in market values of securities held and reported with all other foreign currency gains and losses in the Fund’s Statement of Operations.
Allocation of Income, Expenses, Gains and Losses. Income, expenses (other than those attributable to a specific class), gains and losses are allocated on a daily basis to each class of shares based upon the relative proportion of net assets represented by such class. Operating expenses directly attributable to a specific class are charged against the operations of that class.
Dividends and Distributions to Shareholders. Dividends and distributions to shareholders, which are determined in accordance with income tax regulations and may differ from U.S. GAAP, are recorded on the ex-dividend date. Income and capital gain distributions, if any, are declared and paid annually or at other times as deemed necessary by the Manager.
Investment Income. Dividend income is recorded on the ex-dividend date or upon ex-dividend notification in the case of certain foreign dividends where the ex-dividend date may have passed. Non-cash dividends included in dividend income, if any, are recorded at the fair market value of the securities received. Interest income is recognized on an accrual basis. Discount and premium, which are included in interest income on the Statement of Operations, are amortized or accreted daily.
Return of Capital Estimates. Distributions received from the Fund’s investments in Master Limited Partnerships (MLPs) and Real Estate Investments Trusts (REITs), generally are comprised of income and return of capital. The Fund records investment income and return of capital based on estimates. Such estimates are based on historical information available from each MLP, REIT and other industry sources. These estimates may subsequently be revised based on information received from MLPs and REITs after their tax reporting periods are concluded.
Custodian Fees. “Custodian fees and expenses” in the Statement of Operations may include interest expense incurred by the Fund on any cash overdrafts of its custodian account during the period. Such cash overdrafts may result from the effects of failed trades in portfolio securities and from cash outflows resulting from unanticipated shareholder redemption activity. The Fund pays interest to its custodian on such cash overdrafts, to the extent they are not offset by positive cash balances maintained by the Fund, at a rate equal to the Federal
44 OPPENHEIMER GLOBAL MULTI-ASSET GROWTH FUND
2. Significant Accounting Policies (Continued)
Funds Rate plus 0.50%. The “Reduction to custodian expenses” line item, if applicable, represents earnings on cash balances maintained by the Fund during the period. Such interest expense and other custodian fees may be paid with these earnings.
Security Transactions. Security transactions are recorded on the trade date. Realized gains and losses on securities sold are determined on the basis of identified cost.
Indemnifications. The Fund’s organizational documents provide current and former Trustees and officers with a limited indemnification against liabilities arising in connection with the performance of their duties to the Fund. In the normal course of business, the Fund may also enter into contracts that provide general indemnifications. The Fund’s maximum exposure under these arrangements is unknown as this would be dependent on future claims that may be made against the Fund. The risk of material loss from such claims is considered remote.
Federal Taxes. The Fund intends to comply with provisions of the Internal Revenue Code applicable to regulated investment companies and to distribute substantially all of its investment company taxable income, including any net realized gain on investments not offset by capital loss carryforwards, if any, to shareholders. Therefore, no federal income or excise tax provision is required. The Fund files income tax returns in U.S. federal and applicable state jurisdictions. The statute of limitations on the Fund’s tax return filings generally remains open for the three preceding fiscal reporting period ends. The Fund has analyzed its tax positions for the fiscal year ended October 31, 2016, including open tax years, and does not believe there are any uncertain tax positions requiring recognition in the Fund’s financial statements.
The tax components of capital shown in the following table represent distribution requirements the Fund must satisfy under the income tax regulations, losses the Fund may be able to offset against income and gains realized in future years and unrealized appreciation or depreciation of securities and other investments for federal income tax purposes.
Undistributed Net Investment Income | Undistributed Long-Term Gain | Accumulated Loss Carryforward1,2,3 | Net Unrealized Appreciation Based on cost of Securities and Other Investments for Federal Income Tax Purposes | |||||||||
$1,706,479 | $— | $1,282,776 | $2,020,167 | |||||||||
1. At period end, the Fund had $1,282,776 of net capital loss carryforward available to offset future realized capital gains, if any, and thereby reduce future taxable gain distributions. Details of the capital loss carryforwards are included in the table below. Capital loss carryovers with no expiration, if any, must be utilized prior to those with expiration dates.
| Expiring | ||||
No expiration | $ | 1,282,776 | ||
2. During the reporting period, the Fund did not utilize any capital loss carryforward.
45 OPPENHEIMER GLOBAL MULTI-ASSET GROWTH FUND
NOTES TO STATEMENT OF INVESTMENTS Continued
2. Significant Accounting Policies (Continued)
3. During the previous reporting period, the Fund did not utilize any capital loss carryforward.
Net investment income (loss) and net realized gain (loss) may differ for financial statement and tax purposes. The character of dividends and distributions made during the fiscal year from net investment income or net realized gains are determined in accordance with federal income tax requirements, which may differ from the character of net investment income or net realized gains presented in those financial statements in accordance with U.S. GAAP. Also, due to timing of dividends and distributions, the fiscal year in which amounts are distributed may differ from the fiscal year in which the income or net realized gain was recorded by the Fund.
Accordingly, the following amounts have been reclassified for the reporting period. Net assets of the Fund were unaffected by the reclassifications.
Increase to Paid-in Capital | Increase to Accumulated | Increase to Accumulated | ||||
$32,228 | $994,866 | $1,027,094 | ||||
The tax character of distributions paid during the reporting periods:
| Year Ended October 31, 2016 | Period Ended October 31, 2015 | |||||||||||||||
Distributions paid from: | ||||||||||||||||
Ordinary income | $ | 422,290 | $ | — | ||||||||||||
Long-term capital gain | 10,739 | — | ||||||||||||||
|
| |||||||||||||||
Total | $ | 433,029 | $ | — | ||||||||||||
|
| |||||||||||||||
The aggregate cost of securities and other investments and the composition of unrealized appreciation and depreciation of securities and other investments for federal income tax purposes at period end are noted in the following table. The primary difference between book and tax appreciation or depreciation of securities and other investments, if applicable, is attributable to the tax deferral of losses or tax realization of financial statement unrealized gain or loss.
Federal tax cost of securities | $ | 56,038,384 | ||
Federal tax cost of other investments | 4,465,850 | |||
|
| |||
Total federal tax cost | $ | 60,504,234 | ||
|
| |||
Gross unrealized appreciation | $ | 4,137,652 | ||
Gross unrealized depreciation | (2,117,485) | |||
|
| |||
Net unrealized appreciation | $ | 2,020,167 | ||
|
|
Certain foreign countries impose a tax on capital gains which is accrued by the Fund based on unrealized appreciation, if any, on affected securities. The tax is paid when the gain is realized.
Use of Estimates. The preparation of financial statements in conformity with U.S. GAAP
46 OPPENHEIMER GLOBAL MULTI-ASSET GROWTH FUND
2. Significant Accounting Policies (Continued)
requires management to make estimates and assumptions that affect the reported amounts of assets and liabilities and disclosure of contingent assets and liabilities at the date of the financial statements and the reported amounts of increases and decreases in net assets from operations during the reporting period. Actual results could differ from those estimates.
3. Securities Valuation
The Fund calculates the net asset value of its shares as of 4:00 P.M. Eastern time, on each day the New York Stock Exchange (the “Exchange”) is open for trading, except in the case of a scheduled early closing of the Exchange, in which case the Fund will calculate net asset value of the shares as of the scheduled early closing time of the Exchange.
The Fund’s Board has adopted procedures for the valuation of the Fund’s securities and has delegated the day-to-day responsibility for valuation determinations under those procedures to the Manager. The Manager has established a Valuation Committee which is responsible for determining a “fair valuation” for any security for which market quotations are not “readily available.” The Valuation Committee’s fair valuation determinations are subject to review, approval and ratification by the Fund’s Board at its next regularly scheduled meeting covering the calendar quarter in which the fair valuation was determined.
Valuation Methods and Inputs
Securities are valued using unadjusted quoted market prices, when available, as supplied primarily by third party pricing services or dealers.
The following methodologies are used to determine the market value or the fair value of the types of securities described below:
Securities traded on a registered U.S. securities exchange (including exchange-traded derivatives other than futures and futures options) are valued based on the last sale price of the security reported on the principal exchange on which it is traded, prior to the time when the Fund’s assets are valued. In the absence of a sale, the security is valued at the mean between the bid and asked price on the principal exchange or, if not available from the principal exchange, obtained from two dealers. If bid and asked prices are not available from either the exchange or two dealers, the security is valued by using one of the following methodologies (listed in order of priority): (1) a bid from the principal exchange, (2) the mean between the bid and asked price as provided by a single dealer, or (3) a bid from a single dealer. A security of a foreign issuer traded on a foreign exchange, but not listed on a registered U.S. securities exchange, is valued based on the last sale price on the principal exchange on which the security is traded, as identified by the third party pricing service used by the Manager, prior to the time when the Fund’s assets are valued. If the last sale price is unavailable, the security is valued at the most recent official closing price on the principal exchange on which it is traded. If the last sales price or official closing price for a foreign security is not available, the security is valued at the mean between the bid and asked price per the exchange or, if not available from the exchange, obtained from two dealers. If bid and asked prices are not available from either the exchange or two dealers, the security is valued
47 OPPENHEIMER GLOBAL MULTI-ASSET GROWTH FUND
NOTES TO STATEMENT OF INVESTMENTS Continued
3. Securities Valuation (Continued)
by using one of the following methodologies (listed in order of priority): (1) a bid from the exchange, (2) the mean between the bid and asked price as provided by a single dealer, or (3) a bid from a single dealer.
Shares of a registered investment company that are not traded on an exchange are valued at that investment company’s net asset value per share.
Corporate and government debt securities (of U.S. or foreign issuers) and municipal debt securities, event-linked bonds, loans, mortgage-backed securities, collateralized mortgage obligations, and asset-backed securities are valued at the mean between the “bid” and “asked” prices utilizing evaluated prices obtained from third party pricing services or broker-dealers who may use matrix pricing methods to determine the evaluated prices.
Short-term money market type debt securities with a remaining maturity of sixty days or less are valued at cost adjusted by the amortization of discount or premium to maturity (amortized cost), which approximates market value. Short-term debt securities with a remaining maturity in excess of sixty days are valued at the mean between the “bid” and “asked” prices utilizing evaluated prices obtained from third party pricing services or broker-dealers.
Structured securities, swaps, swaptions, and other over-the-counter derivatives are valued utilizing evaluated prices obtained from third party pricing services or broker-dealers.
Forward foreign currency exchange contracts are valued utilizing current and forward currency rates obtained from third party pricing services. When the settlement date of a contract is an interim date for which a quotation is not available, interpolated values are derived using the nearest dated forward currency rate.
Futures contracts and futures options traded on a commodities or futures exchange will be valued at the final settlement price or official closing price on the principal exchange as reported by such principal exchange at its trading session ending at, or most recently prior to, the time when the Fund’s assets are valued.
A description of the standard inputs that may generally be considered by the third party pricing vendors in determining their evaluated prices is provided below.
| Security Type | Standard inputs generally considered by third-party pricing vendors | |
| Corporate debt, government debt, municipal, mortgage- backed and asset-backed securities | Reported trade data, broker-dealer price quotations, benchmark yields, issuer spreads on comparable securities, the credit quality, yield, maturity, and other appropriate factors. | |
| Loans | Information obtained from market participants regarding reported trade data and broker-dealer price quotations. | |
| Event-linked bonds | Information obtained from market participants regarding reported trade data and broker-dealer price quotations. | |
| Structured securities | Relevant market information such as the price of underlying financial instruments, stock market indices, foreign currencies, interest rate spreads, commodities, or the occurrence of other specific events. | |
| Swaps | Relevant market information, including underlying reference assets such as credit spreads, credit event probabilities, index values, individual security values, forward interest rates, variable interest rates, volatility measures, and forward currency rates. |
If a market value or price cannot be determined for a security using the methodologies
48 OPPENHEIMER GLOBAL MULTI-ASSET GROWTH FUND
3. Securities Valuation (Continued)
described above, or if, in the “good faith” opinion of the Manager, the market value or price obtained does not constitute a “readily available market quotation,” or a significant event has occurred that would materially affect the value of the security, the security is fair valued either (i) by a standardized fair valuation methodology applicable to the security type or the significant event as previously approved by the Valuation Committee and the Fund’s Board or (ii) as determined in good faith by the Manager’s Valuation Committee. The Valuation Committee considers all relevant facts that are reasonably available, through either public information or information available to the Manager, when determining the fair value of a security. Fair value determinations by the Manager are subject to review, approval and ratification by the Fund’s Board at its next regularly scheduled meeting covering the calendar quarter in which the fair valuation was determined. Those fair valuation standardized methodologies include, but are not limited to, valuing securities at the last sale price or initially at cost and subsequently adjusting the value based on: changes in company specific fundamentals, changes in an appropriate securities index, or changes in the value of similar securities which may be further adjusted for any discounts related to security-specific resale restrictions. When possible, such methodologies use observable market inputs such as unadjusted quoted prices of similar securities, observable interest rates, currency rates and yield curves. The methodologies used for valuing securities are not necessarily an indication of the risks associated with investing in those securities nor can it be assured that the Fund can obtain the fair value assigned to a security if it were to sell the security.
To assess the continuing appropriateness of security valuations, the Manager, or its third party service provider who is subject to oversight by the Manager, regularly compares prior day prices, prices on comparable securities, and sale prices to the current day prices and challenges those prices exceeding certain tolerance levels with the third party pricing service or broker source. For those securities valued by fair valuations, whether through a standardized fair valuation methodology or a fair valuation determination, the Valuation Committee reviews and affirms the reasonableness of the valuations based on such methodologies and fair valuation determinations on a regular basis after considering all relevant information that is reasonably available.
Classifications
Each investment asset or liability of the Fund is assigned a level at measurement date based on the significance and source of the inputs to its valuation. Various data inputs are used in determining the value of each of the Fund’s investments as of the reporting period end. These data inputs are categorized in the following hierarchy under applicable financial accounting standards:
1) Level 1-unadjusted quoted prices in active markets for identical assets or liabilities (including securities actively traded on a securities exchange)
2) Level 2-inputs other than unadjusted quoted prices that are observable for the asset or liability (such as unadjusted quoted prices for similar assets and market corroborated inputs such as interest rates, prepayment speeds, credit risks, etc.)
3) Level 3-significant unobservable inputs (including the Manager’s own judgments about
49 OPPENHEIMER GLOBAL MULTI-ASSET GROWTH FUND
NOTES TO STATEMENT OF INVESTMENTS Continued
3. Securities Valuation (Continued)
assumptions that market participants would use in pricing the asset or liability).
The inputs used for valuing securities are not necessarily an indication of the risks associated with investing in those securities.
The Fund classifies each of its investments in investment companies which are publicly offered as Level 1. Investment companies that are not publicly offered are measured using net asset value as a practical expedient, and are not classified in the fair value hierarchy.
The table below categorizes amounts that are included in the Fund’s Statement of Assets and Liabilities at period end based on valuation input level:
| Level 1— Unadjusted Quoted Prices | Level 2— Other Significant | Level 3— Significant Unobservable Inputs | Value | |||||||||||||
Assets Table | ||||||||||||||||
Investments, at Value: | ||||||||||||||||
Common Stocks | ||||||||||||||||
Consumer Discretionary | $ | 2,557,433 | $ | 3,537,887 | $ | — | $ | 6,095,320 | ||||||||
Consumer Staples | 1,695,175 | 2,053,121 | — | 3,748,296 | ||||||||||||
Energy | 924,076 | 552,782 | — | 1,476,858 | ||||||||||||
Financials | 3,288,497 | 2,410,000 | — | 5,698,497 | ||||||||||||
Health Care | 2,740,405 | 1,114,553 | — | 3,854,958 | ||||||||||||
Industrials | 1,837,542 | 2,998,543 | — | 4,836,085 | ||||||||||||
Information Technology | 4,530,959 | 2,475,005 | — | 7,005,964 | ||||||||||||
Materials | 451,849 | 768,235 | — | 1,220,084 | ||||||||||||
Telecommunication Services | 278,927 | 1,001,015 | — | 1,279,942 | ||||||||||||
Utilities | 318,984 | — | — | 318,984 | ||||||||||||
Preferred Stocks | 8,080 | 226,887 | — | 234,967 | ||||||||||||
U.S. Government Obligation | — | 2,147,145 | — | 2,147,145 | ||||||||||||
Foreign Government Obligations | — | 3,626,235 | — | 3,626,235 | ||||||||||||
Short-Term Note | — | 36,332 | — | 36,332 | ||||||||||||
Investment Companies | 15,475,055 | — | — | 15,475,055 | ||||||||||||
|
| |||||||||||||||
Total Investments, at Value | 34,106,982 | 22,947,740 | — | 57,054,722 | ||||||||||||
Other Financial Instruments: | ||||||||||||||||
Swaps, at value | — | 111,334 | — | 111,334 | ||||||||||||
Affiliated swaps, at value | — | 31,960 | — | 31,960 | ||||||||||||
Futures contracts | 22,944 | — | — | 22,944 | ||||||||||||
Forward currency exchange contracts | — | 534,065 | — | 534,065 | ||||||||||||
|
| |||||||||||||||
Total Assets excluding investment companies valued using practical expedient | $ | 34,129,926 | $ | 23,625,099 | $ | — | 57,755,025 | |||||||||
|
| |||||||||||||||
Investment company valued using practical expedient | 1,027,621 | |||||||||||||||
|
| |||||||||||||||
Total Assets | $ | 58,782,646 | ||||||||||||||
|
| |||||||||||||||
50 OPPENHEIMER GLOBAL MULTI-ASSET GROWTH FUND
3. Securities Valuation (Continued)
Level 1— Quoted Prices | Level 2— Other Significant | Level 3— Significant Unobservable Inputs | Value | |||||||||||||
| ||||||||||||||||
Liabilities Table | ||||||||||||||||
Other Financial Instruments: | ||||||||||||||||
Swaps, at value | $ | — | $ | (56,535) | $ | — | $ | (56,535) | ||||||||
Affiliated swaps, at value | — | (3,126) | — | (3,126) | ||||||||||||
Futures contracts | (223,411) | — | — | (223,411) | ||||||||||||
Forward currency exchange contracts | — | (287,515) | — | (287,515) | ||||||||||||
|
| |||||||||||||||
Total Liabilities | $ | (223,411) | $ | (347,176) | $ | — | $ | (570,587) | ||||||||
|
| |||||||||||||||
Forward currency exchange contracts and futures contracts, if any, are reported at their unrealized appreciation/depreciation at measurement date, which represents the change in the contract’s value from trade date. All additional assets and liabilities included in the above table are reported at their market value at measurement date.
The table below shows the transfers between Level 1 and Level 2. The Fund’s policy is to recognize transfers in and transfers out as of the beginning of the reporting period.
| Transfers out of Level 1* | Transfers into Level 2* | |||||||
| ||||||||
Assets Table | ||||||||
Investments, at Value: | ||||||||
Common Stocks | ||||||||
Consumer Discretionary | $ | (39,121) | $ | 39,121 | ||||
Consumer Staples | (45,373) | 45,373 | ||||||
Financials | (124,754) | 124,754 | ||||||
Industrials | (10,864) | 10,864 | ||||||
Preferred Stocks | (35,096) | 35,096 | ||||||
|
| |||||||
Total Assets | $ | (255,208) | $ | 255,208 | ||||
|
| |||||||
* Transfers from Level 1 to Level 2 are a result of a change from the use of an exchange traded price to a valuation received from a third-party pricing service or a fair valuation determined based on observable market information other than quoted prices from an active market.
4. Investments and Risks
Risks of Foreign Investing. The Fund may invest in foreign securities which are subject to special risks. Securities traded in foreign markets may be less liquid and more volatile than those traded in U.S. markets. Foreign issuers are usually not subject to the same accounting and disclosure requirements that U.S. companies are subject to, which may make it difficult for the Fund to evaluate a foreign company’s operations or financial condition. A change in the value of a foreign currency against the U.S. dollar will result in a change in the U.S. dollar value of investments denominated in that foreign currency and in the value of any income or distributions the Fund may receive on those investments. The value of foreign investments may be affected by exchange control regulations, foreign taxes, higher transaction and other costs, delays in the settlement of transactions, changes in economic or monetary policy in
51 OPPENHEIMER GLOBAL MULTI-ASSET GROWTH FUND
NOTES TO STATEMENT OF INVESTMENTS Continued
4. Investments and Risks (Continued)
the United States or abroad, expropriation or nationalization of a company’s assets, or other political and economic factors. In addition, due to the inter-relationship of global economies and financial markets, changes in political and economic factors in one country or region could adversely affect conditions in another country or region. Investments in foreign securities may also expose the Fund to time-zone arbitrage risk. Foreign securities may trade on weekends or other days when the Fund does not price its shares. At times, the Fund may emphasize investments in a particular country or region and may be subject to greater risks from adverse events that occur in that country or region. Foreign securities and foreign currencies held in foreign banks and securities depositories may be subject to limited or no regulatory oversight.
Investments in Affiliated Funds. The Fund is permitted to invest in other mutual funds advised by the Manager (“Affiliated Funds”). Affiliated Funds are open-end management investment companies registered under the 1940 Act, as amended. The Manager is the investment adviser of, and the Sub-Adviser provides investment and related advisory services to, the Affiliated Funds. When applicable, the Fund’s investments in Affiliated Funds are included in the Statement of Investments. Shares of Affiliated Funds are valued at their net asset value per share. As a shareholder, the Fund is subject to its proportional share of the Affiliated Funds’ expenses, including their management fee. The Manager will waive fees and/ or reimburse Fund expenses in an amount equal to the indirect management fees incurred through the Fund’s investment in the Affiliated Funds.
Each of the Affiliated Funds in which the Fund invests has its own investment risks, and those risks can affect the value of the Fund’s investments and therefore the value of the Fund’s shares. To the extent that the Fund invests more of its assets in one Affiliated Fund than in another, the Fund will have greater exposure to the risks of that Affiliated Fund.
Investments in Money Market Instruments. The Fund is permitted to invest its free cash balances in money market instruments to provide liquidity or for defensive purposes. The Fund may invest in money market instruments by investing in Class E shares of Oppenheimer Institutional Government Money Market Fund (“IGMMF”), formerly known as Oppenheimer Institutional Money Market Fund, which is an Affiliated Fund. IGMMF is regulated as a money market fund under the 1940 Act, as amended. The Fund may also invest in money market instruments directly or in other affiliated or unaffiliated money market funds.
Investment in Oppenheimer Master Fund. The Fund is permitted to invest in entities sponsored and/or advised by the Manager or an affiliate. Certain of these entities in which the Fund invests are mutual funds registered under the 1940 Act, as amended, that expect to be treated as partnerships for tax purposes, specifically Oppenheimer Master Loan Fund, LLC (the “Master Fund”). The Master Fund has its own investment risks, and those risks can affect the value of the Fund’s investments and therefore the value of the Fund’s shares. To the extent that the Fund invests more of its assets in the Master Fund, the Fund will have greater exposure to the risks of the Master Fund.
The investment objective of the Master Fund is to seek income. The Fund’s investment in
52 OPPENHEIMER GLOBAL MULTI-ASSET GROWTH FUND
4. Investments and Risks (Continued)
the Master Fund is included in the Statement of Investments. The Fund recognizes income and gain/(loss) on its investment in the master fund according to its allocated pro-rata share, based on its relative proportion of total outstanding Master Fund shares held, of the total net income earned and the net gain/(loss) realized on investments sold by the Master Fund. As a shareholder, the Fund is subject to its proportional share of the Master Fund’s expenses, including its management fee. The Manager will waive fees and/or reimburse Fund expenses in an amount equal to the indirect management fees incurred through the Fund’s investment in the Master Fund. The Fund owns 0.1% of the Master Fund at period end.
Master Limited Partnerships (“MLPs”). MLPs issue common units that represent an equity ownership interest in a partnership and provide limited voting rights. MLP common units are registered with the Securities and Exchange Commission (“SEC”), and are freely tradable on securities exchanges such as the NYSE and the NASDAQ Stock Market (“NASDAQ”), or in the over-the-counter (“OTC”) market. An MLP consists of one or more general partners, who conduct the business, and one or more limited partners, who contribute capital. MLP common unit holders have a limited role in the partnership’s operations and management. The Fund, as a limited partner, normally would not be liable for the debts of the MLP beyond the amounts the Fund has contributed, but would not be shielded to the same extent that a shareholder of a corporation would be. In certain circumstances creditors of an MLP would have the right to seek return of capital distributed to a limited partner. This right of an MLP’s creditors would continue after the Fund sold its investment in the MLP.
Equity Security Risk. Stocks and other equity securities fluctuate in price. The value of the Fund’s portfolio may be affected by changes in the equity markets generally. Equity markets may experience significant short-term volatility and may fall sharply at times. Different markets may behave differently from each other and U.S. equity markets may move in the opposite direction from one or more foreign stock markets. Adverse events in any part of the equity or fixed-income markets may have unexpected negative effects on other market segments.
The prices of individual equity securities generally do not all move in the same direction at the same time and a variety of factors can affect the price of a particular company’s securities. These factors may include, but are not limited to, poor earnings reports, a loss of customers, litigation against the company, general unfavorable performance of the company’s sector or industry, or changes in government regulations affecting the company or its industry.
Sovereign Debt Risk. The Fund invests in sovereign debt securities, which are subject to certain special risks. These risks include, but are not limited to, the risk that a governmental entity may delay or refuse, or otherwise be unable, to pay interest or repay the principal on its sovereign debt. There may also be no legal process for collecting sovereign debt that a government does not pay or bankruptcy proceedings through which all or part of such sovereign debt may be collected. In addition, a restructuring or default of sovereign debt may also cause additional impacts to the financial markets, such as downgrades to credit ratings, reduced liquidity and increased volatility, among others.
53 OPPENHEIMER GLOBAL MULTI-ASSET GROWTH FUND
NOTES TO STATEMENT OF INVESTMENTS Continued
4. Investments and Risks (Continued)
Shareholder Concentration. At period end, one shareholder owned 20% or more of the Fund’s total outstanding shares.
The shareholder is a related party of the Fund. Related parties may include, but are not limited to, the investment manager and its affiliates, affiliated broker dealers, fund of funds, and directors or employees. Related parties owned 95% of the Fund’s total outstanding shares at period end.
5. Market Risk Factors
The Fund’s investments in securities and/or financial derivatives may expose the Fund to various market risk factors:
Commodity Risk. Commodity risk relates to the change in value of commodities or commodity indexes as they relate to increases or decreases in the commodities market. Commodities are physical assets that have tangible properties. Examples of these types of assets are crude oil, heating oil, metals, livestock, and agricultural products.
Credit Risk. Credit risk relates to the ability of the issuer of debt to meet interest and principal payments, or both, as they come due. In general, lower-grade, higher-yield debt securities are subject to credit risk to a greater extent than lower-yield, higher-quality securities.
Equity Risk. Equity risk relates to the change in value of equity securities as they relate to increases or decreases in the general market.
Foreign Exchange Rate Risk. Foreign exchange rate risk relates to the change in the U.S. dollar value of a security held that is denominated in a foreign currency. The U.S. dollar value of a foreign currency denominated security will decrease as the dollar appreciates against the currency, while the U.S. dollar value will increase as the dollar depreciates against the currency.
Interest Rate Risk. Interest rate risk refers to the fluctuations in value of fixed-income securities resulting from the inverse relationship between price and yield. For example, an increase in general interest rates will tend to reduce the market value of already issued fixed-income investments, and a decline in general interest rates will tend to increase their value. In addition, debt securities with longer maturities, which tend to have higher yields, are subject to potentially greater fluctuations in value from changes in interest rates than obligations with shorter maturities.
Volatility Risk. Volatility risk refers to the magnitude of the movement, but not the direction of the movement, in a financial instrument’s price over a defined time period. Large increases or decreases in a financial instrument’s price over a relative time period typically indicate greater volatility risk, while small increases or decreases in its price typically indicate lower volatility risk.
6. Use of Derivatives
The Fund’s investment objective not only permits the Fund to purchase investment securities, it also allows the Fund to enter into various types of derivatives contracts, including, but
54 OPPENHEIMER GLOBAL MULTI-ASSET GROWTH FUND
6. Use of Derivatives (Continued)
not limited to, futures contracts, forward currency exchange contracts, credit default swaps, interest rate swaps, total return swaps, variance swaps and purchased and written options. In doing so, the Fund will employ strategies in differing combinations to permit it to increase, decrease, or change the level or types of exposure to market risk factors. These instruments may allow the Fund to pursue its objectives more quickly and efficiently than if it were to make direct purchases or sales of securities capable of effecting a similar response to market factors. Such contracts may be entered into through a bilateral over-the-counter (“OTC”) transaction, or through a securities or futures exchange and cleared through a clearinghouse.
Derivatives may have little or no initial cash investment relative to their market value exposure and therefore can produce significant gains or losses in excess of their cost due to unanticipated changes in the market risk factors and the overall market. This use of embedded leverage allows the Fund to increase its market value exposure relative to its net assets and can substantially increase the volatility of the Fund’s performance. In instances where the Fund is using derivatives to decrease, or hedge, exposures to market risk factors for securities held by the Fund, there are also risks that those derivatives may not perform as expected resulting in losses for the combined or hedged positions. Some derivatives have the potential for unlimited loss, regardless of the size of the Fund’s initial investment.
Additional associated risks from investing in derivatives also exist and potentially could have significant effects on the valuation of the derivative and the Fund. Typically, the associated risks are not the risks that the Fund is attempting to increase or decrease exposure to, per its investment objectives, but are the additional risks from investing in derivatives. Examples of these associated risks are liquidity risk, which is the risk that the Fund will not be able to sell the derivative in the open market in a timely manner, and counterparty credit risk, which is the risk that the counterparty will not fulfill its obligation to the Fund.
The Fund’s actual exposures to these market risk factors and associated risks during the period are discussed in further detail, by derivative type, below.
Forward Currency Exchange Contracts
The Fund may enter into forward currency exchange contracts (“forward contracts”) for the purchase or sale of a foreign currency at a negotiated rate at a future date. Such contracts are traded in the OTC inter-bank currency dealer market.
Forward contracts are reported on a schedule following the Statement of Investments. The unrealized appreciation (depreciation) is reported in the Statement of Assets and Liabilities as a receivable (or payable) and in the Statement of Operations within the change in unrealized appreciation (depreciation). At contract close, the difference between the original cost of the contract and the value at the close date is recorded as a realized gain (loss) in the Statement of Operations.
The Fund has entered into forward contracts with the obligation to purchase specified foreign currencies in the future at a currently negotiated forward rate in order to take a positive investment perspective on the related currency. These forward contracts seek to increase exposure to foreign exchange rate risk.
The Fund has entered into forward contracts with the obligation to purchase specified
55 OPPENHEIMER GLOBAL MULTI-ASSET GROWTH FUND
NOTES TO STATEMENT OF INVESTMENTS Continued
6. Use of Derivatives (Continued)
foreign currencies in the future at a currently negotiated forward rate in order to decrease exposure to foreign exchange rate risk associated with foreign currency denominated securities held by the Fund.
The Fund has entered into forward contracts with the obligation to sell specified foreign currencies in the future at a currently negotiated forward rate in order to take a negative investment perspective on the related currency. These forward contracts seek to increase exposure to foreign exchange rate risk.
The Fund has entered into forward contracts with the obligation to sell specified foreign currencies in the future at a currently negotiated forward rate in order to decrease exposure to foreign exchange rate risk associated with foreign currency denominated securities held by the Fund.
During the reporting period, the Fund had daily average contract amounts on forward contracts to buy and sell of $15,634,942 and $14,301,516, respectively.
Additional associated risk to the Fund includes counterparty credit risk. Counterparty credit risk arises from the possibility that the counterparty to a forward contract will default and fail to perform its obligations to the Fund.
Futures Contracts
A futures contract is a commitment to buy or sell a specific amount of a commodity, financial instrument or currency at a negotiated price on a stipulated future date. The Fund may buy and sell futures contracts and may also buy or write put or call options on these futures contracts. Futures contracts and options thereon are generally entered into on a regulated futures exchange and cleared through a clearinghouse associated with the exchange.
Upon entering into a futures contract, the Fund is required to deposit either cash or securities (initial margin) in an amount equal to a certain percentage of the contract value in an account registered in the futures commission merchant’s name. Subsequent payments (variation margin) are paid to or from the futures commission merchant each day equal to the daily changes in the contract value. Such payments are recorded as unrealized gains and losses. Should the Fund fail to make requested variation margin payments, the futures commission merchant can gain access to the initial margin to satisfy the Fund’s payment obligations.
Futures contracts are reported on a schedule following the Statement of Investments. Securities held by a futures commission merchant to cover initial margin requirements on open futures contracts are noted in the Statement of Investments. Cash held by a futures commission merchant to cover initial margin requirements on open futures contracts and the receivable and/or payable for the daily mark to market for the variation margin are noted in the Statement of Assets and Liabilities. The net change in unrealized appreciation and depreciation is reported in the Statement of Operations. Realized gains (losses) are reported in the Statement of Operations at the closing or expiration of futures contracts.
The Fund has purchased futures contracts on various bonds and notes to increase exposure to interest rate risk.
The Fund has purchased futures contracts on various equity indexes to increase exposure to
56 OPPENHEIMER GLOBAL MULTI-ASSET GROWTH FUND
6. Use of Derivatives (Continued)
equity risk.
The Fund has sold futures contracts on various equity indexes to decrease exposure to equity risk.
During the reporting period, the Fund had an ending monthly average market value of $10,655,732 and $4,830,193 on futures contracts purchased and sold, respectively.
Additional associated risks of entering into futures contracts (and related options) include the possibility that there may be an illiquid market where the Fund is unable to liquidate the contract or enter into an offsetting position and, if used for hedging purposes, the risk that the price of the contract will correlate imperfectly with the prices of the Fund’s securities.
Option Activity
The Fund may buy and sell put and call options, or write put and call options. When an option is written, the Fund receives a premium and becomes obligated to sell or purchase the underlying security, currency or other underlying financial instrument at a fixed price, upon exercise of the option.
Options can be traded through an exchange or through a privately negotiated arrangement with a dealer in an OTC transaction. Options traded through an exchange are generally cleared through a clearinghouse (such as The Options Clearing Corporation). The difference between the premium received or paid, and market value of the option, is recorded as unrealized appreciation or depreciation. The net change in unrealized appreciation or depreciation is reported in the Statement of Operations. When an option is exercised, the cost of the security purchased or the proceeds of the security sale are adjusted by the amount of premium received or paid. Upon the expiration or closing of the option transaction, a gain or loss is reported in the Statement of Operations.
The Fund has purchased call options on individual equity securities and/or equity indexes to increase exposure to equity risk. A purchased call option becomes more valuable as the price of the underlying financial instrument appreciates relative to the strike price.
The Fund has purchased put options on individual equity securities and/or equity indexes to decrease exposure to equity risk. A purchased put option becomes more valuable as the price of the underlying financial instrument depreciates relative to the strike price.
During the reporting period, the Fund had an ending monthly average market value of $42,663 and $1,399 on purchased call options and purchased put options, respectively.
At period end, the Fund had no such purchased options outstanding.
Options written, if any, are reported in a schedule following the Statement of Investments and as a liability in the Statement of Assets and Liabilities. Securities held in collateral accounts to cover potential obligations with respect to outstanding written options are noted in the Statement of Investments.
The risk in writing a call option is that the market price of the security increases and if the option is exercised, the Fund must either purchase the security at a higher price for delivery or, if the Fund owns the underlying security, give up the opportunity for profit. The risk in writing a put option is that the Fund may incur a loss if the market price of the security decreases and the option is exercised. The risk in buying an option is that the Fund pays a premium whether
57 OPPENHEIMER GLOBAL MULTI-ASSET GROWTH FUND
NOTES TO STATEMENT OF INVESTMENTS Continued
6. Use of Derivatives (Continued)
or not the option is exercised. The Fund also has the additional risk that there may be an illiquid market where the Fund is unable to close the contract.
During the reporting period, the Fund had no such written option activity.
Swap Contracts
The Fund may enter into swap contract agreements with a counterparty to exchange a series of cash flows based on either specified reference rates, the price or volatility of asset or non-asset references, or the occurrence of a credit event, over a specified period. Swaps can be executed in a bi-lateral privately negotiated arrangement with a dealer in an OTC transaction (“OTC swaps”) or executed on a regulated market. Certain swaps, regardless of the venue of their execution, are required to be cleared through a clearinghouse (“centrally cleared swaps”). Swap contracts may include interest rate, equity, debt, index, total return, credit default, currency, and volatility swaps.
Swap contracts are reported on a schedule following the Statement of Investments. The values of centrally cleared swap and OTC swap contracts are aggregated by positive and negative values and disclosed separately on the Statement of Assets and Liabilities. The unrealized appreciation (depreciation) related to the change in the valuation of the notional amount of the swap is combined with the accrued interest due to (owed by) the Fund, if any, at termination or settlement.
The net change in this amount during the period is included on the Statement of Operations. The Fund also records any periodic payments received from (paid to) the counterparty, including at termination, under such contracts as realized gain (loss) on the Statement of Operations.
Swap contract agreements are exposed to the market risk factor of the specific underlying reference rate or asset. Swap contracts are typically more attractively priced compared to similar investments in related cash securities because they isolate the risk to one market risk factor and eliminate the other market risk factors. Investments in cash securities (for instance bonds) have exposure to multiple risk factors (credit and interest rate risk). Because swaps have embedded leverage, they can expose the Fund to substantial risk in the isolated market risk factor.
Interest Rate Swap Contracts. An interest rate swap is an agreement between counterparties to exchange periodic payments based on interest rates. One cash flow stream will typically be a floating rate payment based upon a specified floating interest rate while the other is typically a fixed interest rate.
The Fund has entered into interest rate swaps in which it pays a floating interest rate and receives a fixed interest rate in order to increase exposure to interest rate risk. Typically, if relative interest rates rise, payments made by the Fund under a swap agreement will be greater than the payments received by the Fund.
The Fund has entered into interest rate swaps in which it pays a fixed interest rate and receives a floating interest rate in order to decrease exposure to interest rate risk. Typically, if relative interest rates rise, payments received by the Fund under the swap agreement will be greater than the payments made by the Fund.
For the reporting period, the Fund had ending monthly average notional amounts of
58 OPPENHEIMER GLOBAL MULTI-ASSET GROWTH FUND
6. Use of Derivatives (Continued)
$60,769 and $736,828 on interest rate swaps which pay a fixed rate and interest rate swaps which receive a fixed rate, respectively.
Additional associated risks to the Fund include counterparty credit risk and liquidity risk.
Total Return Swap Contracts. A total return swap is an agreement between counterparties to exchange periodic payments based on the value of asset or non-asset references. One cash flow is typically based on a non-asset reference (such as an interest rate) and the other on the total return of a reference asset (such as a security or a basket of securities or securities index). The total return of the reference asset typically includes appreciation or depreciation on the reference asset, plus any interest or dividend payments.
Total return swap contracts are exposed to the market risk factor of the specific underlying financial instrument or index. Total return swaps are less standard in structure than other types of swaps and can isolate and/or include multiple types of market risk factors including equity risk, credit risk, and interest rate risk.
The Fund has entered into total return swaps on various equity securities or indexes to increase exposure to equity risk. These equity risk related total return swaps require the Fund to pay a floating reference interest rate, and an amount equal to the negative price movement of securities or an index (expressed as a percentage) multiplied by the notional amount of the contract. The Fund will receive payments equal to the positive price movement of the same securities or index (expressed as a percentage) multiplied by the notional amount of the contract and, in some cases, dividends paid on the securities.
The Fund has entered into total return swaps to increase exposure to the credit risk of various indexes or basket of securities. These credit risk related total return swaps require the Fund to pay to, or receive payments from, the counterparty based on the movement of credit spreads of the related indexes or securities.
Total Return Swaps on Shares of Affiliated Funds. The Fund has entered into total return swaps on an Affiliated Fund or Funds. This investment technique provides the Fund with synthetic long investment exposure to the performance of the Affiliated Fund through payments made by a swap dealer counterparty to the Fund under the swap that reflect the positive total return (inclusive of dividends and distributions) on those shares. In exchange, the Fund would make periodic payments to the counterparty under the swap based on a fixed or variable interest rate, as well as payments reflecting any negative total return on those shares. The swap provides the Fund with the economic equivalent of ownership of those shares through an entitlement to receive any gains realized, and dividends paid, on the shares, and an obligation to pay any losses realized on the shares. This investment technique provides the Fund effectively with leverage intended to achieve an economic effect similar to the Fund’s purchase of shares of the Affiliated Fund with borrowed money.
For the reporting period, the Fund had ending monthly average notional amounts of $19,641,605 on total return swaps which are long the reference asset.
Additional associated risks to the Fund include counterparty credit risk and liquidity risk.
Counterparty Credit Risk. Derivative positions are subject to the risk that the counterparty will not fulfill its obligation to the Fund. The Fund intends to enter into derivative transactions with counterparties that the Manager believes to be creditworthy at the time of the
59 OPPENHEIMER GLOBAL MULTI-ASSET GROWTH FUND
NOTES TO STATEMENT OF INVESTMENTS Continued
6. Use of Derivatives (Continued)
transaction.
The Fund’s risk of loss from counterparty credit risk on OTC derivatives is generally limited to the aggregate unrealized gain netted against any collateral held by the Fund. For OTC options purchased, the Fund bears the risk of loss of the amount of the premiums paid plus the positive change in market values net of any collateral held by the Fund should the counterparty fail to perform under the contracts. Options written by the Fund do not typically give rise to counterparty credit risk, as options written generally obligate the Fund and not the counterparty to perform.
To reduce counterparty risk with respect to OTC transactions, the Fund has entered into master netting arrangements, established within the Fund’s International Swap and Derivatives Association, Inc. (“ISDA”) master agreements, which allow the Fund to make (or to have an entitlement to receive) a single net payment in the event of default (close-out netting) for outstanding payables and receivables with respect to certain OTC positions in swaps, options, swaptions, and forward currency exchange contracts for each individual counterparty. In addition, the Fund may require that certain counterparties post cash and/or securities in collateral accounts to cover their net payment obligations for those derivative contracts subject to ISDA master agreements. If the counterparty fails to perform under these contracts and agreements, the cash and/or securities will be made available to the Fund.
At period end, the Fund has required certain counterparties to post collateral of $40,494.
ISDA master agreements include credit related contingent features which allow counterparties to OTC derivatives to terminate derivative contracts prior to maturity in the event that, for example, the Fund’s net assets decline by a stated percentage or the Fund fails to meet the terms of its ISDA master agreements, which would cause the Fund to accelerate payment of any net liability owed to the counterparty.
For financial reporting purposes, the Fund does not offset derivative assets and derivative liabilities that are subject to netting arrangements in the Statement of Assets and Liabilities. Bankruptcy or insolvency laws of a particular jurisdiction may impose restrictions on or prohibitions against the right of offset in bankruptcy, insolvency or other events.
The Fund’s risk of loss from counterparty credit risk on exchange-traded derivatives cleared through a clearinghouse and for centrally cleared swaps is generally considered lower than as compared to OTC derivatives. However, counterparty credit risk exists with respect to initial and variation margin deposited/paid by the Fund that is held in futures commission merchant, broker and/or clearinghouse accounts for such exchange-traded derivatives and for centrally cleared swaps.
With respect to centrally cleared swaps, such transactions will be submitted for clearing, and if cleared, will be held in accounts at futures commission merchants or brokers that are members of clearinghouses. While brokers, futures commission merchants and clearinghouses are required to segregate customer margin from their own assets, in the event that a broker, futures commission merchant or clearinghouse becomes insolvent or goes into bankruptcy and at that time there is a shortfall in the aggregate amount of margin held by the broker, futures commission merchant or clearinghouse for all its customers, U.S. bankruptcy laws will typically allocate that shortfall on a pro-rata basis across all the broker’s, futures commission
60 OPPENHEIMER GLOBAL MULTI-ASSET GROWTH FUND
6. Use of Derivatives (Continued)
merchant’s or clearinghouse’s customers, potentially resulting in losses to the Fund.
There is the risk that a broker, futures commission merchant or clearinghouse will decline to clear a transaction on the Fund’s behalf, and the Fund may be required to pay a termination fee to the executing broker with whom the Fund initially enters into the transaction. Clearinghouses may also be permitted to terminate centrally cleared swaps at any time. The Fund is also subject to the risk that the broker or futures commission merchant will improperly use the Fund’s assets deposited/paid as initial or variation margin to satisfy payment obligations of another customer. In the event of a default by another customer of the broker or futures commission merchant, the Fund might not receive its variation margin payments from the clearinghouse, due to the manner in which variation margin payments are aggregated for all customers of the broker/futures commission merchant.
Collateral and margin requirements differ by type of derivative. Margin requirements are established by the broker, futures commission merchant or clearinghouse for exchange-traded and cleared derivatives, including centrally cleared swaps. Brokers, futures commission merchants and clearinghouses can ask for margin in excess of the regulatory minimum, or increase the margin amount, in certain circumstances.
Collateral terms are contract specific for OTC derivatives. For derivatives traded under an ISDA master agreement, the collateral requirements are typically calculated by netting the mark to market amount for each transaction under such agreement and comparing that amount to the value of any collateral currently pledged by the Fund or the counterparty.
For financial reporting purposes, cash collateral that has been pledged to cover obligations of the Fund, if any, is reported separately on the Statement of Assets and Liabilities as cash pledged as collateral. Non-cash collateral pledged by the Fund, if any, is noted in the Statement of Investments. Generally, the amount of collateral due from or to a party must exceed a minimum transfer amount threshold (e.g. $250,000) before a transfer has to be made. To the extent amounts due to the Fund from its counterparties are not fully collateralized, contractually or otherwise, the Fund bears the risk of loss from counterparty nonperformance.
The following table presents by counterparty the Fund’s OTC derivative assets net of the related collateral pledged by the Fund at period end:
| Gross Amounts Not Offset in the Statement of Assets & Liabilities | ||||||||||||||||||||
| Counterparty | Gross Amounts Not Offset in the Statement of Assets & Liabilities* | Financial Instruments Available for Offset | Financial Instruments Collateral Received** | Cash Collateral Received** | Net Amount | |||||||||||||||
| ||||||||||||||||||||
Bank of America NA | $ | 68,347 | $ | (21,931 | ) | $ | – | $ | – | $ | 46,416 | |||||||||
Barclays Bank plc | 11,044 | (1,974 | ) | – | – | 9,070 | ||||||||||||||
Citibank NA | 221,555 | (67,176 | ) | – | – | 154,379 | ||||||||||||||
Deutsche Bank AG | 93,302 | (34,824 | ) | – | – | 58,478 | ||||||||||||||
Goldman Sachs Bank USA | 4,806 | (4,806 | ) | – | – | – | ||||||||||||||
61 OPPENHEIMER GLOBAL MULTI-ASSET GROWTH FUND
NOTES TO STATEMENT OF INVESTMENTS Continued
6. Use of Derivatives (Continued)
| Gross Amounts Not Offset in the Statement of Assets & Liabilities | ||||||||||||||||||||
| Counterparty | Gross Amounts Not Offset in the Statement of Assets & Liabilities* | Financial Instruments Available for Offset | Financial Instruments Collateral Received** | Cash Collateral Received** | Net Amount | |||||||||||||||
| ||||||||||||||||||||
Goldman Sachs | ||||||||||||||||||||
International | $ | 137,653 | $ | (51,502 | ) | $ | – | $ | – | $ | 86,151 | |||||||||
HSBC Bank USA NA | 36,002 | (2,587 | ) | – | – | 33,415 | ||||||||||||||
JPMorgan Chase Bank NA | 88,293 | (50,794 | ) | (37,499 | ) | – | – | |||||||||||||
Toronto Dominion | ||||||||||||||||||||
Bank | 16,357 | – | – | – | 16,357 | |||||||||||||||
|
| |||||||||||||||||||
| $ | 677,359 | $ | (235,594 | ) | $ | (37,499 | ) | $ | – | $ | 404,266 | |||||||||
|
| |||||||||||||||||||
*OTC derivatives are reported gross on the Statement of Assets and Liabilities. Exchange traded options and margin related to centrally cleared swaps and futures, if any, are excluded from these reported amounts. **Reported collateral posted for the benefit of the Fund within this table is limited to the net outstanding amount due from an individual counterparty. The collateral posted for the benefit of the Fund may exceed these amounts.
The following table presents by counterparty the Fund’s OTC derivative liabilities net of the related collateral pledged by the Fund at period end:
|
| |||||||||||||||||||
| Gross Amounts Not Offset in the Statement of Assets & Liabilities | ||||||||||||||||||||
| Counterparty | Gross Amounts Not Offset in the Statement of Assets & Liabilities* | Financial Instruments Available for Offset | Financial Instruments Collateral Pledged** | Cash Collateral Pledged** | Net Amount | |||||||||||||||
| ||||||||||||||||||||
Bank of America NA | $ | (21,931) | $ | 21,931 | $ | – | $ | – | $ | – | ||||||||||
Barclays Bank plc | (1,974) | 1,974 | – | – | – | |||||||||||||||
Citibank NA | (67,176) | 67,176 | – | – | – | |||||||||||||||
Deutsche Bank AG | (34,824) | 34,824 | – | – | – | |||||||||||||||
Goldman Sachs Bank USA | (85,746) | 4,806 | – | – | (80,940) | |||||||||||||||
Goldman Sachs | ||||||||||||||||||||
International | (51,502) | 51,502 | – | – | – | |||||||||||||||
HSBC Bank USA NA | (2,587) | 2,587 | – | – | – | |||||||||||||||
JPMorgan Chase Bank NA | (50,794) | 50,794 | – | – | – | |||||||||||||||
Morgan Stanley Capital | ||||||||||||||||||||
Services, Inc. | (29,162) | – | – | – | (29,162) | |||||||||||||||
Societe Generale | (1,480) | – | – | – | (1,480) | |||||||||||||||
|
| |||||||||||||||||||
| $ | (347,176) | $ | 235,594 | $ | – | $ | – | $ | (111,582) | |||||||||||
|
| |||||||||||||||||||
*OTC derivatives are reported gross on the Statement of Assets and Liabilities. Exchange traded options and margin related to centrally cleared swaps and futures, if any, are excluded from these reported amounts.
**Reported collateral pledged within this table is limited to the net outstanding amount due from the Fund. The securities pledged as collateral by the Fund as reported on the Statements of Investments may exceed these amounts.
62 OPPENHEIMER GLOBAL MULTI-ASSET GROWTH FUND
6. Use of Derivatives (Continued)
The following table presents the valuations of derivative instruments by risk exposure as reported within the Statement of Assets and Liabilities at period end:
Asset Derivatives | Liability Derivatives | |||||||||||
Derivatives Not Accounted for as Hedging Instruments | Statement of Assets and Liabilities Location | Value | Statement of Assets and Liabilities Location | Value | ||||||||
| ||||||||||||
Equity contracts | Affiliated swaps, at value | $ | 31,960 | Affiliated swaps, at value | $ | 3,126 | ||||||
Credit contracts | Swaps, at value | 5,631 | Swaps, at value | 36,354 | ||||||||
Equity contracts | Swaps, at value | 105,693 | Swaps, at value | 13,502 | ||||||||
Interest rate contracts | Swaps, at value | 10 | Swaps, at value | 6,679 | ||||||||
Equity contracts | Variation margin receivable | 23,330* | Variation margin payable | 16,247* | ||||||||
Interest rate contracts | Variation margin receivable | 9,907* | ||||||||||
Unrealized appreciation on | Unrealized depreciation on | |||||||||||
Forward currency | forward currency exchange | forward currency exchange | ||||||||||
exchange contracts | contracts | 534,065 | contracts | 287,515 | ||||||||
|
|
|
| |||||||||
Total | $ | 710,596 | $ | 363,423 | ||||||||
|
|
|
| |||||||||
*Includes only the current day’s variation margin. Prior variation margin movements have been reflected in cash on the Statement of Assets and Liabilities upon receipt or payment.
The effect of derivative instruments on the Statement of Operations is as follows:
| Amount of Realized Gain or (Loss) Recognized on Derivatives | ||||||||||||||||
| ||||||||||||||||
Derivatives Not Accounted for as Hedging Instruments | Investment from companies* | Closing and futures contracts | Foreign currency transactions | Swap contracts | ||||||||||||
| ||||||||||||||||
Credit contracts | $ | — | $ | — | $ | — | $ | 367,630 | ||||||||
Equity contracts | (183,227 | ) | (946,917) | — | 284,825 | |||||||||||
Forward currency exchange contracts | — | — | 546,625 | — | ||||||||||||
Interest rate contracts | — | 251,574 | — | 305,048 | ||||||||||||
|
| |||||||||||||||
Total | $ | (183,227 | ) | $ | (695,343 | ) | $ | 546,625 | $ | 957,503 | ||||||
|
| |||||||||||||||
| Amount of Realized Gain or (Loss) Recognized on Derivatives (Continued) | ||||||||||||||||
| ||||||||||||||||
Derivatives Not Accounted for as Hedging Instruments | Affiliated swap contracts | Total | ||||||||||||||
| ||||||||||||||||
Credit contracts |
| $ | — | $ | 367,630 | |||||||||||
Equity contracts |
| (251,502 | ) | (1,096,821) | ||||||||||||
Forward currency exchange contracts |
| — | 546,625 | |||||||||||||
Interest rate contracts |
| — | 556,622 | |||||||||||||
|
| |||||||||||||||
Total |
| $ | (251,502 | ) | $ | 374,056 | ||||||||||
|
| |||||||||||||||
*Includes purchased option contracts, purchased swaption contracts, written option contracts exercised and written swaption contracts exercised if any.
63 OPPENHEIMER GLOBAL MULTI-ASSET GROWTH FUND
NOTES TO STATEMENT OF INVESTMENTS Continued
6. Use of Derivatives (Continued)
| Amount of Change in Unrealized Gain or (Loss) Recognized on Derivatives | ||||||||||||||||
| ||||||||||||||||
Derivatives Not Accounted for as Hedging Instruments | Investments* | Futures contracts | Translation of assets and liabilities denominated in foreign currencies | Swap contracts | ||||||||||||
| ||||||||||||||||
Credit contracts | $ | — | $ | — | $ | — | $ | (30,723) | ||||||||
Equity contracts | (67,061) | (17,102) | — | 92,191 | ||||||||||||
Forward currency exchange contracts | — | — | 246,550 | — | ||||||||||||
Interest rate contracts | — | (173,871) | — | 509 | ||||||||||||
|
| |||||||||||||||
Total | $ | (67,061) | $ | (190,973) | $ | 246,550 | $ | 61,977 | ||||||||
|
| |||||||||||||||
Amount of Change in Unrealized Gain or (Loss) Recognized on Derivatives (Continued) |
| |||||||||||||||
| ||||||||||||||||
Derivatives Not Accounted for as Hedging Instruments | | Affiliated swap contracts | | Total | ||||||||||||
| ||||||||||||||||
Credit contracts | $ | — | $ | (30,723) | ||||||||||||
Equity contracts | (37,428) | (29,400) | ||||||||||||||
Forward currency exchange contracts | — | 246,550 | ||||||||||||||
Interest rate contracts | — | (173,362) | ||||||||||||||
|
| |||||||||||||||
Total | $ | (37,428) | $ | 13,065 | ||||||||||||
|
| |||||||||||||||
*Includes purchased option contracts and purchased swaption contracts, if any.
7. Shares of Beneficial Interest
The Fund has authorized an unlimited number of $0.001 par value shares of beneficial interest of each class. Transactions in shares of beneficial interest were as follows:
| Year Ended October 31, 2016 | Period Ended October 30, 20151,2,3 | |||||||||||||||
| Shares | Amount | Shares | Amount | |||||||||||||
| ||||||||||||||||
Class A | ||||||||||||||||
Sold | 110,293 | $ | 1,145,240 | 4,994,490 | $ | 49,945,032 | ||||||||||
Dividends and/or distributions reinvested | 51 | 507 | — | — | ||||||||||||
Redeemed | (2,664 | ) | (27,963 | ) | — | — | ||||||||||
|
| |||||||||||||||
Net increase | �� | 107,680 | $ | 1,117,784 | 4,994,490 | $ | 49,945,032 | |||||||||
|
| |||||||||||||||
| ||||||||||||||||
Class C | ||||||||||||||||
Sold | 54,603 | $ | 542,162 | 3,297 | $ | 32,088 | ||||||||||
Dividends and/or distributions reinvested | 95 | 936 | — | — | ||||||||||||
Redeemed | (8,867 | ) | (91,677 | ) | — | — | ||||||||||
|
| |||||||||||||||
Net increase | 45,831 | $ | 451,421 | 3,297 | $ | 32,088 | ||||||||||
|
| |||||||||||||||
64 OPPENHEIMER GLOBAL MULTI-ASSET GROWTH FUND
7. Shares of Beneficial Interest (Continued)
| Year Ended October 31, 2016 | Period Ended October 30, 20151,2,3 | |||||||||||||||
| Shares | Amount | Shares | Amount | |||||||||||||
| ||||||||||||||||
| Class I | ||||||||||||||||
| Sold | — | $ | — | — | $ | — | ||||||||||
| Dividends and/or distributions reinvested | — | — | — | — | ||||||||||||
| Redeemed | — | — | — | — | ||||||||||||
|
| |||||||||||||||
| Net increase | — | $ | — | — | $ | — | ||||||||||
|
| |||||||||||||||
| ||||||||||||||||
| Class R | ||||||||||||||||
| Sold | 114,762 | $ | 1,217,684 | — | $ | — | ||||||||||
| Dividends and/or distributions reinvested | — | 2 | — | — | ||||||||||||
| Redeemed | (779 | ) | (8,329 | ) | — | — | ||||||||||
|
| |||||||||||||||
| Net increase | 113,983 | $ | 1,209,357 | — | $ | — | ||||||||||
|
| |||||||||||||||
| ||||||||||||||||
| Class Y | ||||||||||||||||
| Sold | 7,673 | $ | 81,837 | — | $ | — | ||||||||||
| Dividends and/or distributions reinvested | — | — | — | — | ||||||||||||
| Redeemed | (162 | ) | (1,731 | ) | — | — | ||||||||||
|
| |||||||||||||||
| Net increase | 7,511 | $ | 80,106 | — | $ | — | ||||||||||
|
| |||||||||||||||
1. Represents the last business day of the Fund’s reporting period.
2. The Fund sold 6,000 shares of Class A at a value of $60,000 and 1,000 shares of Class C, Class I, Class R and Class Y at a value of $10,000, respectively, to the Manager upon seeding of the Fund on May 26, 2015. These amounts are not reflected in the table above.
3. For the period from August 27, 2015 (commencement of operations) to October 30, 2015.
8. Purchases and Sales of Securities
The aggregate cost of purchases and proceeds from sales of securities, other than short-term obligations and investments in IGMMF, for the reporting period were as follows:
| Purchases | Sales | |||||||||
| ||||||||||
| Investment securities | $ | 30,088,750 | $ | 24,108,921 | ||||||
| U.S. government and government agency obligations | 3,024,122 | 6,128,183 | ||||||||
9. Fees and Other Transactions with Affiliates
Management Fees. Under the investment advisory agreement, the Fund pays the Manager a management fee based on the daily net assets of the Fund at an annual rate as shown in the following table:
| Fee Schedule | ||||
| ||||
| Up to $500 million | 0.75% | |||
| Next $500 million | 0.70 | |||
| Next $4.0 billion | 0.65 | |||
| Over $5.0 billion | 0.60 | |||
The Fund’s effective management fee for the reporting period was 0.75% of average annual
65 OPPENHEIMER GLOBAL MULTI-ASSET GROWTH FUND
NOTES TO STATEMENT OF INVESTMENTS Continued
9. Fees and Other Transactions with Affiliates (Continued)
net assets before any applicable waivers.
Sub-Adviser Fees. The Manager has retained the Sub-Adviser to provide the day-to-day portfolio management of the Fund. Under the Sub-Advisory Agreement, the Manager pays the Sub-Adviser an annual fee in monthly installments, equal to a percentage of the investment management fee collected by the Manager from the Fund, which shall be calculated after any investment management fee waivers. The fee paid to the Sub-Adviser is paid by the Manager, not by the Fund.
Sub-Sub-Adviser Fees. The Sub-Adviser retains the Sub-Sub-Advisers to provide the day-to-day portfolio management of the Fund. Under the Sub-Sub-Advisory Agreement, the Sub-Adviser pays the Sub-Sub-Advisers an annual fee in monthly installments, based on the average daily net assets of the Fund. The fee paid to the Sub-Sub-Advisers under the Sub-Sub-Advisory agreement is paid by the Sub-Adviser, not by the Fund.
Transfer Agent Fees. OFI Global (the “Transfer Agent”) serves as the transfer and shareholder servicing agent for the Fund. The Fund pays the Transfer Agent a fee based on annual net assets. Fees incurred and average net assets for each class with respect to these services are detailed in the Statement of Operations and Financial Highlights, respectively.
Sub-Transfer Agent Fees. The Transfer Agent has retained Shareholder Services, Inc., a wholly-owned subsidiary of OFI (the “Sub-Transfer Agent”), to provide the day-to-day transfer agent and shareholder servicing of the Fund. Under the Sub-Transfer Agency Agreement, the Transfer Agent pays the Sub-Transfer Agent an annual fee in monthly installments, equal to a percentage of the transfer agent fee collected by the Transfer Agent from the Fund, which shall be calculated after any applicable fee waivers. The fee paid to the Sub-Transfer Agent is paid by the Transfer Agent, not by the Fund.
Offering and Organizational Costs. The Manager paid all initial offering and organizational costs associated with the registration and seeding of the Fund.
Trustees’ Compensation. The Fund’s Board of Trustees (“Board”) has adopted a compensation deferral plan for Independent Trustees that enables Trustees to elect to defer receipt of all or a portion of the annual compensation they are entitled to receive from the Fund. For purposes of determining the amount owed to the Trustees under the plan, deferred amounts are treated as though equal dollar amounts had been invested in shares of the Fund or in other Oppenheimer funds selected by the Trustees. The Fund purchases shares of the funds selected for deferral by the Trustees in amounts equal to his or her deemed investment, resulting in a Fund asset equal to the deferred compensation liability. Such assets are included as a component of “Other” within the asset section of the Statement of Assets and Liabilities. Deferral of Trustees’ fees under the plan will not affect the net assets of the Fund and will not materially affect the Fund’s assets, liabilities or net investment income per share. Amounts will
66 OPPENHEIMER GLOBAL MULTI-ASSET GROWTH FUND
9. Fees and Other Transactions with Affiliates (Continued)
be deferred until distributed in accordance with the compensation deferral plan.
Distribution and Service Plan (12b-1) Fees. Under its General Distributor’s Agreement with the Fund, OppenheimerFunds Distributor, Inc. (the “Distributor”) acts as the Fund’s principal underwriter in the continuous public offering of the Fund’s classes of shares.
Service Plan for Class A Shares. The Fund has adopted a Service Plan (the “Plan”) for Class A shares pursuant to Rule 12b-1 under the 1940 Act. Under the Plan, the Fund reimburses the Distributor for a portion of its costs incurred for services provided to accounts that hold Class A shares. Reimbursement is made periodically at an annual rate of up to
0.25% of the daily net assets of Class A shares of the Fund. The Distributor currently uses all of those fees to pay dealers, brokers, banks and other financial institutions periodically for providing personal service and maintenance of accounts of their customers that hold Class A shares. Any unreimbursed expenses the Distributor incurs with respect to Class A shares in any fiscal year cannot be recovered in subsequent periods. Fees incurred by the Fund under the
Plan are detailed in the Statement of Operations.
Distribution and Service Plans for Class C and Class R Shares. The Fund has adopted Distribution and Service Plans (the “Plans”) for Class C and Class R shares pursuant to Rule 12b-1 under the 1940 Act to compensate the Distributor for distributing those share classes, maintaining accounts and providing shareholder services. Under the Plans, the Fund pays the Distributor an annual asset-based sales charge of 0.75% on Class C shares’ daily net assets and 0.25% on Class R shares’ daily net assets. The Fund also pays a service fee under the Plans at an annual rate of 0.25% of daily net assets. The Plans continue in effect from year to year only if the Fund’s Board of Trustees votes annually to approve their continuance at an in person meeting called for that purpose. Fees incurred by the Fund under the Plans are detailed in the Statement of Operations.
Sales Charges. Front-end sales charges and CDSC do not represent expenses of the Fund. They are deducted from the proceeds of sales of Fund shares prior to investment or from redemption proceeds prior to remittance, as applicable. The sales charges retained by the Distributor from the sale of shares and the CDSC retained by the Distributor on the redemption of shares is shown in the following table for the period indicated.
| Year Ended | Class A Front-End | Class A Contingent Deferred Sales Charges Retained by Distributor | Class C Contingent Deferred Sales Charges Retained by Distributor | Class R Contingent Deferred Sales Charges Retained by Distributor | ||||||||||||
| ||||||||||||||||
| October 31, 2016 | $7,305 | $— | $164 | $— | ||||||||||||
Waivers and Reimbursements of Expenses. The Manager has contractually agreed to limit the “Total expenses” for all share classes so that “Expenses after payments, waivers and/ or reimbursements and reduction to custodian expenses”, as a percentage of average
67 OPPENHEIMER GLOBAL MULTI-ASSET GROWTH FUND
NOTES TO STATEMENT OF INVESTMENTS Continued
9. Fees and Other Transactions with Affiliates (Continued)
annual net assets, will not exceed the following annual rates: 1.10% for Class A shares, 1.85% for Class C shares, 0.85% for Class I shares, 1.35% for Class R shares and 0.95% for Class Y shares, as calculated on the daily net assets of the Fund. The expense limitations do not include extraordinary expenses, interest and fees from borrowing, and other expenses not incurred in the ordinary course of the Fund’s business. During the reporting period, the Manager reimbursed the Fund $99,905, $3,349, $23, $1,409 and $111 for Class A, Class C, Class I, Class R and Class Y shares, respectively.
The Manager will waive fees and/or reimburse Fund expenses in an amount equal to the indirect management fees incurred through the Fund’s investments in Affiliated Funds. During the reporting period, the Manager waived fees and/or reimbursed the Fund $58,044 for these management fees.
Waivers and/or reimbursements may be modified or terminated as set forth according to the terms in the prospectus.
10. Pending Litigation
In 2009, several putative class action lawsuits were filed and later consolidated before the U.S. District Court for the District of Colorado in connection with the investment performance of Oppenheimer Rochester California Municipal Fund (the “California Fund”), a fund advised by OppenheimerFunds, Inc. (“OFI”) and distributed by OppenheimerFunds Distributor, Inc. (“OFDI”). The plaintiffs asserted claims against OFI, OFDI and certain present and former trustees and officers of the California Fund under the federal securities laws, alleging, among other things, that the disclosure documents of the California Fund contained misrepresentations and omissions and the investment policies of the California Fund were not followed. An amended complaint and a motion to dismiss were filed, and in 2011, the court issued an order which granted in part and denied in part the defendants’ motion to dismiss. In October 2015, following a successful appeal by defendants and a subsequent hearing, the court granted plaintiffs’ motion for class certification and appointed class representatives and class counsel.
OFI and OFDI believe the suit is without merit; that it is premature to render any opinion as to the likelihood of an outcome unfavorable to them in the suit; and that no estimate can yet be made as to the amount or range of any potential loss. Furthermore, OFI believes that the suit should not impair the ability of OFI or OFDI to perform their respective duties to the Fund and that the outcome of the suit should not have any material effect on the operations of any of the Oppenheimer funds.
68 OPPENHEIMER GLOBAL MULTI-ASSET GROWTH FUND
REPORT OF INDEPENDENT REGISTERED PUBLIC ACCOUNTING FIRM
The Board of Trustees and Shareholders of Oppenheimer Global Multi-Asset Growth Fund:
We have audited the accompanying statement of assets and liabilities of Oppenheimer Global Multi-Asset Growth Fund, including the statement of investments, as of October 31, 2016, and the related statement of operations for the year then ended, and statements of changes in net assets and the financial highlights for the year then ended and for the period from August 27, 2015 (commencement of operations) to October 31, 2015. These financial statements and financial highlights are the responsibility of the Fund’s management. Our responsibility is to express an opinion on these financial statements and financial highlights based on our audits.
We conducted our audits in accordance with the standards of the Public Company Accounting Oversight Board (United States). Those standards require that we plan and perform the audit to obtain reasonable assurance about whether the financial statements and financial highlights are free of material misstatement. An audit includes examining, on a test basis, evidence supporting the amounts and disclosures in the financial statements. Our procedures included confirmation of securities owned as of October 31, 2016, by correspondence with the custodian, transfer agent and brokers, or by other appropriate auditing procedures where replies from brokers were not received. An audit also includes assessing the accounting principles used and significant estimates made by management, as well as evaluating the overall financial statement presentation. We believe that our audits provide a reasonable basis for our opinion.
In our opinion, the financial statements and financial highlights referred to above present fairly, in all material respects, the financial position of Oppenheimer Global Multi-Asset Growth Fund as of October 31, 2016, the results of its operations for the year then ended, and the changes in its net assets and the financial highlights for the year then ended and for the period from August 27, 2015 (commencement of operations) to October 31, 2015, in conformity with U.S. generally accepted accounting principles.
KPMG LLP
Denver, Colorado
December 22, 2016
69 OPPENHEIMER GLOBAL MULTI-ASSET GROWTH FUND
FEDERAL INCOME TAX INFORMATION Unaudited
In early 2016, if applicable, shareholders of record received information regarding all dividends and distributions paid to them by the Fund during calendar year 2015.
Capital gain distributions of $0.00024 per share were paid to Class A, Class C, Class I, Class R and Class Y shareholders, respectively, on December 15, 2015. Whether received in stock or in cash, the capital gain distribution should be treated by shareholders as a gain from the sale of the capital assets held for more than one year (long-term capital gains).
Dividends, if any, paid by the Fund during the reporting period which are not designated as capital gain distributions should be multiplied by the maximum amount allowable but not less than 14.24% to arrive at the amount eligible for the corporate dividend-received deduction.
A portion, if any, of the dividends paid by the Fund during the reporting period which are not designated as capital gain distributions are eligible for lower individual income tax rates to the extent that the Fund has received qualified dividend income as stipulated by recent tax legislation. The maximum amount allowable but not less than $767,735 of the Fund’s fiscal year taxable income may be eligible for the lower individual income tax rates. In early 2016, shareholders of record received information regarding the percentage of distributions that are eligible for lower individual income tax rates.
Recent tax legislation allows a regulated investment company to designate distributions not designated as capital gain distributions, as either interest related dividends or short-term capital gain dividends, both of which are exempt from the U.S. withholding tax applicable to non U.S. taxpayers. For the reporting period, the maximum amount allowable but not less than $308,625 of the ordinary distributions to be paid by the Fund qualifies as an interest related dividend.
The foregoing information is presented to assist shareholders in reporting distributions received from the Fund to the Internal Revenue Service. Because of the complexity of the federal regulations which may affect your individual tax return and the many variations in state and local tax regulations, we recommend that you consult your tax advisor for specific guidance.
70 OPPENHEIMER GLOBAL MULTI-ASSET GROWTH FUND
BOARD APPROVAL OF THE FUND’S INVESTMENT ADVISORY, SUB-ADVISORY AND SUB-SUB-ADVISORY AGREEMENTS Unaudited
The Fund has entered into an investment advisory agreement with OFI Global Asset Management, Inc. (“OFI Global” or the “Adviser”), a wholly-owned subsidiary of OppenheimerFunds, Inc. (“OFI” or the “Sub-Adviser”). OFI Global has entered into a sub-advisory agreement with OFI whereby OFI provides investment sub-advisory services to the Fund, and OFI has entered into sub-sub-advisory agreements with Barings Real Estate Advisers LLC (“Barings”) and OFI SteelPath, Inc. (“OFI SteelPath”) whereby Barings and OFI SteelPath provide investment sub-sub-advisory services to the Fund (collectively, all the investment advisory agreements are referred to as the “Agreements”, “OFI Global” and “OFI” are referred to as the “Managers” and “OFI SteelPath” and “Barings” are referred to as the “Sub-Sub-Advisers”). Each year, the Board of Trustees (the “Board”), including a majority of the independent Trustees, is required to determine whether to approve the terms of the Agreements and the renewal thereof. The Investment Company Act of 1940, as amended, requires that the Board request and evaluate, and that the Managers and Sub-Sub-Advisers provide, such information as may be reasonably necessary to evaluate the terms of the Agreements. The Board employs an independent consultant to prepare a report that provides information, including comparative information that the Board requests for that purpose. In addition to in-person meetings focused on this evaluation, the Board receives information throughout the year regarding Fund services, fees, expenses and performance.
The Managers and Sub-Sub-Advisers and the independent consultant provided information to the Board on the following factors: (i) the nature, quality and extent of the Managers’ and Sub-Sub-Advisers’ services, (ii) the comparative investment performance of the Fund and the Managers and Sub-Sub-Advisers, (iii) the fees and expenses of the Fund, including comparative fee and expense information, (iv) the profitability of the Managers, Sub-Sub-Advisers and their affiliates, including an analysis of the cost of providing services, (v) whether economies of scale are realized as the Fund grows and whether fee levels reflect these economies of scale for Fund investors and (vi) other benefits to the Managers and Sub-Sub-Advisers from their relationship with the Fund. The Board was aware that there are alternatives to retaining the Managers and Sub-Sub-Advisers.
Outlined below is a summary of the principal information considered by the Board as well as the Board’s conclusions.
Nature, Quality and Extent of Services. The Board considered information about the nature, quality and extent of the services provided to the Fund and information regarding the Managers’ and the Sub-Sub-Advisers’ key personnel who provide such services. The Sub-Adviser and Sub-Sub-Advisers duties may include providing the Fund with research, analysis and other advisory services in regard to the Fund’s investments; and securities trading services. The Managers are responsible for oversight of other third-party service providers; monitoring compliance with applicable Fund policies and procedures and adherence to the Fund’s investment restrictions; and risk management. The Managers are also responsible for providing certain administrative services to the Fund. Those services include providing and supervising all administrative and clerical personnel who are necessary in order to provide effective corporate administration for the Fund; compiling and maintaining records with respect to the Fund’s operations; preparing and filing reports required by the U.S. Securities and Exchange Commission; preparing periodic reports regarding the operations of the Fund
71 OPPENHEIMER GLOBAL MULTI-ASSET GROWTH FUND
BOARD APPROVAL OF THE FUND’S INVESTMENT ADVISORY, SUB-ADVISORY AND SUB-SUB-ADVISORY AGREEMENTS Unaudited / Continued
for its shareholders; preparing proxy materials for shareholder meetings; and preparing the registration statements required by federal and state securities laws for the sale of the Fund’s shares. The Managers also provides the Fund with office space, facilities and equipment.
The Board also considered the quality of the services provided and the quality of the Managers’ and Sub-Sub-Advisers’ resources that are available to the Fund. The Board took account of the fact that the Sub-Adviser has over fifty years of experience as an investment adviser and that its assets under management rank it among the top mutual fund managers in the United States. The Board evaluated the Managers’ advisory, administrative, accounting, legal, compliance and risk management services, and information the Board has received regarding the experience and professional qualifications of the Managers’ key personnel and the size and functions of its staff. In its evaluation of the quality of the portfolio management services provided, the Board considered the experience of Mark Hamilton, Alessio de Longis, Dokyoung Lee and Benjamin Rockmuller, the portfolio managers for the Fund, and the Sub-Sub-Advisers’ investment team and analysts. The Board members also considered the totality of their experiences with the Managers and Sub-Sub-Advisers as directors or trustees of the Fund and other funds advised by the Managers and Sub-Sub-Advisers. The Board considered information regarding the quality of services provided by affiliates of the Managers, which the Board members have become knowledgeable about through their experiences with the Managers and in connection with the renewal of the Fund’s service agreements. The Board concluded, in light of the Managers’ and Sub-Sub-Advisers’ experience, reputation, personnel, operations and resources that the Fund benefits from the services provided under the Agreements.
Investment Performance of the Managers, Sub-Sub-Advisers and the Fund. The Board considered that the Fund has not been in operation for a full calendar year and that its performance could not be a factor in deciding whether to approve the Agreement.
Fees and Expenses of the Fund. The Board reviewed the fees paid to the Managers and Sub-Sub-Advisers and the other expenses borne by the Fund. The Board noted that the Adviser, not the Fund, pays the Sub-Adviser’s fee under the sub-advisory agreement, and the Sub-Adviser pays the Sub-Sub-Advisers’ fees under the sub-sub-advisory agreements. The Board also considered the comparability of the fees charged and the services provided to the Fund to the fees and services for other clients or accounts advised by the Adviser. The independent consultant provided comparative data in regard to the fees and expenses of the Fund and other retail front-end load world allocation funds with comparable asset levels and distribution features. The Board also considered that the Adviser has contractually agreed to waive fees and/or reimburse the Fund so that the total annual fund operating expenses, excluding certain expenses, as a percentage of average daily net assets will not exceed the following annual rates: 1.10% for Class A shares, 1.85% for Class C shares, 0.85% for Class I shares, 1.35% for Class R shares, and 0.95% for Class Y shares, and that the expense limitations may not be amended or withdrawn for one year from the date of the Fund’s prospectus, unless approved by the Board. The Board noted that the Fund’s contractual management fee was higher than its peer group median and equal to its category median. The Board also noted that the Fund’s total expenses, net of waivers, were lower than its peer group median and category median.
72 OPPENHEIMER GLOBAL MULTI-ASSET GROWTH FUND
Economies of Scale and Profits Realized by the Managers and the Sub-Sub-Advisers. The Board considered information regarding the Managers’ and Sub-Sub- Advisers’ costs in serving as the Fund’s investment adviser, sub-adviser and sub-sub-advisers, including the costs associated with the personnel and systems necessary to manage the Fund, and information regarding the Managers’ and Sub-Sub-Advisers’ profitability from their relationship with the Fund. The Board also considered that the Managers and Sub-Sub-Advisers must be able to pay and retain experienced professional personnel at competitive rates to provide quality services to the Fund. The Board reviewed whether the Managers and Sub-Sub-Advisers may realize economies of scale in managing and supporting the Fund. The Board noted that the Fund currently has management fee breakpoints, which are intended to share with Fund shareholders economies of scale that may exist as the Fund’s assets grow.
Other Benefits to the Managers and Sub-Sub-Advisers. In addition to considering the profits realized by the Managers and Sub-Sub-Advisers, the Board considered information that was provided regarding the direct and indirect benefits the Managers and Sub-Sub-Advisers receive as a result of their relationship with the Fund, including compensation paid to the Managers’ affiliates and research provided to the Adviser in connection with permissible brokerage arrangements (soft dollar arrangements).
Conclusions. These factors were also considered by the independent Trustees meeting separately from the full Board, assisted by experienced counsel to the Fund and to the independent Trustees. Fund counsel and the independent Trustees’ counsel are independent of the Managers and Sub-Sub-Advisers within the meaning and intent of the Securities and Exchange Commission Rules.
Based on its review of the information it received and its evaluations described above, the Board, including a majority of the independent Trustees, decided to continue the Agreements through September 30, 2017. In arriving at its decision, the Board did not identify any factor or factors as being more important than others, but considered all of the above information, and considered the terms and conditions of the Agreements, including the management fees, in light of all the surrounding circumstances.
73 OPPENHEIMER GLOBAL MULTI-ASSET GROWTH FUND
PORTFOLIO PROXY VOTING POLICIES AND GUIDELINES; UPDATES TO STATEMENTS OF
INVESTMENTS Unaudited
The Fund has adopted Portfolio Proxy Voting Policies and Guidelines under which the Fund votes proxies relating to securities (“portfolio proxies”) held by the Fund. A description of the Fund’s Portfolio Proxy Voting Policies and Guidelines is available (i) without charge, upon request, by calling the Fund toll-free at 1.800.CALL OPP (225.5677), (ii) on the Fund’s website at www.oppenheimerfunds.com, and (iii) on the SEC’s website at www.sec.gov. In addition, the Fund is required to file Form N-PX, with its complete proxy voting record for the 12 months ended June 30th, no later than August 31st of each year. The Fund’s voting record is available (i) without charge, upon request, by calling the Fund toll-free at 1.800.CALL OPP (225.5677), and (ii) in the Form N-PX filing on the SEC’s website at www.sec.gov.
The Fund files its complete schedule of portfolio holdings with the SEC for the first quarter and the third quarter of each fiscal year on Form N-Q. The Fund’s Form N-Q filings are available on the SEC’s website at www.sec.gov. Those forms may be reviewed and copied at the SEC’s Public Reference Room in Washington, D.C. Information on the operation of the Public Reference Room may be obtained by calling 1-800-SEC-0330.
Householding—Delivery of Shareholder Documents
This is to inform you about OppenheimerFunds’ “householding” policy. If more than one member of your household maintains an account in a particular fund, OppenheimerFunds will mail only one copy of the fund’s prospectus (or, if available, the fund’s summary prospectus), annual and semiannual report and privacy policy. The consolidation of these mailings, called householding, benefits your fund through reduced mailing expense, and benefits you by reducing the volume of mail you receive from OppenheimerFunds. Householding does not affect the delivery of your account statements.
Please note that we will continue to household these mailings for as long as you remain an OppenheimerFunds shareholder, unless you request otherwise. If you prefer to receive multiple copies of these materials, please call us at 1.800.CALL-OPP (225-5677). You may also notify us in writing or via email. We will begin sending you individual copies of the prospectus (or, if available, the summary prospectus), reports and privacy policy within 30 days of receiving your request to stop householding.
74 OPPENHEIMER GLOBAL MULTI-ASSET GROWTH FUND
TRUSTEES AND OFFICERS Unaudited
| Name, Position(s) Held with the Fund, Length of Service, Year of Birth | Principal Occupation(s) During the Past 5 Years; Other Trusteeships/Directorships Held; Number of Portfolios in the Fund Complex Currently Overseen | |
| INDEPENDENT TRUSTEES | The address of each Trustee in the chart below is 6803 S. Tucson Way, Centennial, Colorado 80112-3924. Each Trustee serves for an indefinite term, or until his or her resignation, retirement, death or removal. | |
Brian F. Wruble, Chairman of the Board of Trustees (since 2007) and Trustee (since 2015) Year of Birth: 1943 | Governor and Vice Chairman of Community Foundation of the Florida Keys (non- profit) (since July 2012); Director of TCP Capital, Inc. (since November 2015); Chairman Emeritus and Trustee (since August 2011) of The Jackson Laboratory (non-profit); Member of Zurich Insurance Group’s Investment Management Advisory Council (insurance) (since 2004); Treasurer (since 2007) and Trustee of the Institute for Advanced Study (non-profit educational institute) (since May 1992); Director of Special Value Opportunities Fund, LLC (registered investment company) (affiliate of the Sub-Adviser’s parent company) (September 2004- June 2015); General Partner of Odyssey Partners, L.P. (hedge fund) (September 1995-December 2007); Special Limited Partner of Odyssey Investment Partners, LLC (private equity investment) (January 1999-September 2004). Mr. Wruble has served on the Boards of certain Oppenheimer funds since April 2001, during which time he has become familiar with the Fund’s (and other Oppenheimer funds’) financial, accounting, regulatory and investment matters and has contributed to the Boards’ deliberations. Oversees 55 portfolios in the OppenheimerFunds complex. Mr. Wruble has served on the Boards of certain Oppenheimer funds since April 2001, during which time he has become familiar with the Fund’s (and other Oppenheimer funds’) financial, accounting, regulatory and investment matters and has contributed to the Boards’ deliberations. | |
Beth Ann Brown, Trustee (since 2016) Year of Birth: 1968 | Advisor, Board of Advisors of Caron Engineering Inc. (since December 2014); Independent Consultant (since September 2012); held the following positions at Columbia Management Investment Advisers LLC: Head of Intermediary Distribution (2008-2012), Managing Director, Strategic Relations (2005-2008), Managing Director, Head of National Accounts (2004-2005); Senior Vice President, National Account Manager (2002-2004), Senior Vice President, Key Account Manager (1999-2002) and Vice President, Key Account Manager (1996-1999) of Liberty Funds Distributor, Inc.; President and Director, of Acton Shapleigh Youth Conservation Corps (non-profit) (since 2012); and Vice President and Director of Grahamtastic Connection (non-profit) (since May 2013). Oversees 55 portfolios in the OppenheimerFunds complex. Ms. Brown has served on the Boards of certain Oppenheimer funds since January 2016, during which time she has become familiar with the Fund’s (and other Oppenheimer funds’) financial, accounting, regulatory and investment matters and has contributed to the Boards’ deliberations. | |
Matthew P. Fink, Trustee (since 2015) Year of Birth: 1941 | Trustee of the Committee for Economic Development (policy research foundation) (2005-2011); Director of ICI Education Foundation (education foundation) (October 1991-August 2006); President of the Investment Company Institute (trade association) (October 1991-June 2004); Director of ICI Mutual Insurance Company (insurance company) (October 1991-June 2004); Author of The Rise of Mutual Funds: An Insider’s View published by Oxford University Press (second edition 2011). Oversees 55 portfolios in the OppenheimerFunds complex. Mr. Fink has served on the Boards of certain Oppenheimer funds since January 2005, during which time he has become familiar with the Fund’s (and other Oppenheimer funds’) financial, accounting, regulatory and investment matters and has contributed to the Boards’ deliberations. | |
75 OPPENHEIMER GLOBAL MULTI-ASSET GROWTH FUND
TRUSTEES AND OFFICERS Unaudited / Continued
Edmund P. Giambastiani, Jr., Trustee (since 2015) Year of Birth: 1948 | Advisory Board Member of the Maxwell School of Citizenship and Public Affairs of Syracuse University (since April 2012); Director of Mercury Defense Systems Inc. (information technology) (August 2011-February 2013); Trustee of the U.S. Naval Academy Foundation (since November 2010); Advisory Board Member of the Massachusetts Institute of Technology Lincoln Laboratory (federally-funded research development center) (since May 2010); Director of The Boeing Company (aerospace and defense) (since October 2009); Trustee of MITRE Corporation (federally-funded research development center) (since September 2008); Independent Director of QinetiQ Group Plc (defense technology and security) (February 2008-August 2011); Chairman of Monster Worldwide, Inc. (on-line career services) (since March 2015), Lead Director (June 2011-March 2015); Chairman of Alenia North America, Inc. (military and defense products) (January 2008-October 2009); Director of SRA International, Inc. (information technology and services) (January 2008-July 2011); President of Giambastiani Group LLC (national security and energy consulting) (since October 2007); United States Navy, career nuclear submarine officer (June 1970-October 2007), Vice Chairman of the Joint Chiefs of Staff (2005-October 2007), Supreme Allied Commander of NATO Commander Transformation (2003-2005), Commander, U.S. Joint Forces Command (2002-2005). Since his retirement from the U.S. Navy in October 2007, Admiral Giambastiani has also served on numerous U.S. Government advisory boards, investigations and task forces for the Secretaries of Defense, State and Interior and the Central Intelligence Agency. He currently serves as a federal commissioner on the Military Compensation and Retirement Modernization Commission. Oversees 55 portfolios in the OppenheimerFunds complex. Admiral Giambastiani has served on the Boards of certain Oppenheimer funds since February 2013, including as an Advisory Board Member for certain Oppenheimer funds, during which time he has become familiar with the Fund’s (and other Oppenheimer funds’) financial, accounting, regulatory and investment matters and has contributed to the Boards’ deliberations. For purposes of this report, Admiral Giambastiani is identified as a Trustee. | |
Elizabeth Krentzman, Trustee (since 2015) Year of Birth: 1959 | Advisory Board Member of University of Florida Advisory Board, Washington, DC Alumni Group (since 2015); Advisory Board Member of the Securities and Exchange Commission Historical Society (since 2007); held the following positions at Deloitte & Touche LLP: Principal and Chief Regulatory Advisor for Asset Management Services (2007 - 2014) and U.S. Mutual Fund Leader (2011 - 2014); General Counsel of the Investment Company Institute (trade association) (June 2004 - April 2007); held the following positions at Deloitte & Touche LLP: National Director of the Investment Management Regulatory Consulting Practice (1997 - 2004), Principal (2003 - 2004), Director (1998 - 2003) and Senior Manager (1997 - 1998); Assistant Director of the Division of Investment Management - Office of Disclosure and Investment Adviser Regulation (1996 - 1997) and various positions with the Division of Investment Management – Office of Regulatory Policy (1991 - 1996) of the U.S. Securities and Exchange Commission; Associate at Ropes & Gray (1987 - 1991. Ms. Krentzman has served on the Boards of certain Oppenheimer funds since August 2014, during which time she has become familiar with the Fund’s (and other Oppenheimer funds’) financial, accounting, regulatory and investment matters and has contributed to the Boards’ deliberations. Oversees 55 portfolios in the OppenheimerFunds complex. Ms. Krentzman has served on the Boards of certain Oppenheimer funds since August 2014, during which time she has become familiar with the Fund’s (and other Oppenheimer funds’) financial, accounting, regulatory and investment matters and has contributed to the Boards’ deliberations. | |
76 OPPENHEIMER GLOBAL MULTI-ASSET GROWTH FUND
Mary F. Miller, Trustee (since 2015) Year of Birth: 1942 | Trustee of International House (not-for-profit) (since June 2007); Trustee of the American Symphony Orchestra (not-for-profit) (October 1998-November 2011); and Senior Vice President and General Auditor of American Express Company (financial services company) (July 1998-February 2003). Oversees 55 portfolios in the OppenheimerFunds complex. Ms. Miller has served on the Boards of certain Oppenheimer funds since August 2004, during which time she has become familiar with the Fund’s (and other Oppenheimer funds’) financial, accounting, regulatory and investment matters and has contributed to the Boards’ deliberations. | |
Joel W. Motley, Trustee (since 2015) Year of Birth: 1952 | Director of Greenwall Foundation (since October 2013); Member of Board and Investment Committee of The Greenwall Foundation (since April 2013); Member of the Vestry of Trinity Wall Street (since April 2012); Director of Southern Africa Legal Services Foundation (since March 2012); Board Member of Pulitzer Center for Crisis Reporting (non-profit journalism) (since March 2011); Managing Director of Public Capital Advisors, LLC (privately-held financial advisor) (since January 2006); Managing Director of Carmona Motley, Inc. (privately-held financial advisor) (since January 2002); Director of Columbia Equity Financial Corp. (privately-held financial advisor) (2002-2007); Managing Director of Carmona Motley Hoffman Inc. (privately-held financial advisor) (January 1998-December 2001); Member of the Finance and Budget Committee of the Council on Foreign Relations, Member of the Investment Committee and Board of Human Rights Watch (since July 2000) and Member of the Investment Committee and Board of Historic Hudson Valley (since February 2010). Oversees 55 portfolios in the OppenheimerFunds complex. Mr. Motley has served on the Boards of certain Oppenheimer funds since October 2002, during which time he has become familiar with the Fund’s (and other Oppenheimer funds’) financial, accounting, regulatory and investment matters and has contributed to the Boards’ deliberations. | |
Joanne Pace, Trustee (since 2015) Year of Birth: 1958 | Advisory Board Director of Massey Quick and Company, LLC (since October 2014); Board Director of Horizon Blue Cross Blue Shield of New Jersey (since November 2012); Advisory Board Director of The Alberleen Group LLC (since March, 2012); Board Member (since January 2015), Advisory Council Member (December 2012-December 2014) of 100 Women in Hedge Funds (non-profit) (since December, 2012); Advisory Council Member of Morgan Stanley Children’s Hospital (non-profit) (since May, 2012); Board Director of The Komera Project (non-profit) (since April, 2012); New York Advisory Board Director of Peace First (non-profit) (2010-2015); Senior Advisor of SECOR Asset Management, LP (2010-2011); Managing Director and Chief Operating Officer of Morgan Stanley Investment Management (2006-2010); Partner and Chief Operating Officer of FrontPoint Partners, LLC (hedge fund) (2005-2006); held the following positions at Credit Suisse: Managing Director (2003-2005); Global Head of Human Resources and member of Executive Board and Operating Committee (2004-2005), Global Head of Operations and Product Control (2003-2004); held the following positions at Morgan Stanley: Managing Director (1997-2003), Controller and Principal Accounting Officer (1999-2003); Chief Financial Officer (temporary assignment) for the Oversight Committee, Long Term Capital Management (1998-1999). Lead Independent Director and Chair of the Audit and Nominating Committee of The Global Chartist Fund, LLC of Oppenheimer Asset Management (2011-2012); Board Director of Managed Funds Association (2008-2010); Board Director of Morgan Stanley Foundation (2007-2010) and Investment Committee Chair (2008-2010). | |
77 OPPENHEIMER GLOBAL MULTI-ASSET GROWTH FUND
TRUSTEES AND OFFICERS Unaudited / Continued
Joanne Pace, Continued | Oversees 55 portfolios in the OppenheimerFunds complex. Ms. Pace has served on the Boards of certain Oppenheimer funds since November 2012, including as an Advisory Board Member for certain Oppenheimer funds, during which time she has become familiar with the Fund’s (and other Oppenheimer funds’) financial, accounting, regulatory and investment matters and has contributed to the Board’s deliberations. For purposes of this report, Ms. Pace is identified as a Trustee. | |
Daniel Vandivort, Trustee (since 2015) Year of Birth: 1954 | Chairman and Lead Independent Director/Trustee (March 2010-September 2014), Chairman of the Audit Committee (March 2009-September 2014) and Director/ Trustee (December 2008-September 2014) of the Board of Directors/Trustees of Value Line Funds; Trustee, Board of Trustees of Huntington Disease Foundation of America (since January 2015 and June 2007-December 2013): Trustee, Board of Trustees, RIM Retirement Savings Plan (2005-2007); President and Chief Investment Officer, Robeco Investment Management, formerly known as Weiss Peck and Greer (January 2005-June 2007); Member, Management Committee of Robeco Investment Management (2001-2007); Chairman and Trustee of the Board of Trustees of Weiss, Peck and Greer Funds (2004-2005); Managing Director and Head of Fixed Income, Weiss, Peck and Greer (November 1994-January 2005); Managing Director and Head of Fixed Income, CS First Boston Investment Management (January 1992-November 1994); Director, Global Product Development, First Boston Asset Management (November 1989 to January 1992); Vice President, Fixed Income Sales, First Boston Corp. (May 1984-November 1989). Oversees 55 portfolios in the OppenheimerFunds complex. Mr. Vandivort has served on the Boards of certain Oppenheimer funds since 2014, during which time he has become familiar with the Fund’s (and other Oppenheimer funds’) financial, accounting, regulatory and investment matters and has contributed to the Boards’ deliberations. | |
| ||
| INTERESTED TRUSTEE AND OFFICER | Mr. Steinmetz is an “Interested Trustee” because he is affiliated with the Manager and the Sub-Adviser by virtue of his positions as Chairman of the Sub-Adviser and officer and director of the Manager. Both as a Trustee and as an officer, Mr. Steinmetz serves for an indefinite term, or until his resignation, retirement, death or removal. Mr. Steinmetz’s address is 225 Liberty Street, New York, New York 10281-1008. | |
Arthur P. Steinmetz, Trustee (since 2015), President and Principal Executive Officer (since 2014) Year of Birth: 1958 | Chairman of the Sub-Adviser (since January 2015); CEO and Chairman of the Manager (since July 2014), President of the Manager (since May 2013), a Director of the Manager (since January 2013), Director of the Sub-Adviser (since July 2014), President, Management Director and CEO of Oppenheimer Acquisition Corp. (the Sub-Adviser’s parent holding company) (since July 2014), and President and Director of OFI SteelPath, Inc. (since January 2013). Chief Investment Officer of the OppenheimerFunds advisory entities from (January 2013-December 2013); Executive Vice President of the Manager (January 2013-May 2013); Chief Investment Officer of the Sub-Adviser (October 2010-December 2012); Chief Investment Officer, Fixed-Income, of the Sub-Adviser (April 2009-October 2010); Executive Vice President of the Sub-Adviser (October 2009-December 2012); Director of Fixed Income of the Sub-Adviser (January 2009-April 2009); and a Senior Vice President of the Sub-Adviser (March 1993-September 2009). An officer of 100 portfolios in the OppenheimerFunds complex. | |
| OTHER OFFICERS OF THE FUND | The addresses of the Officers in the chart below are as follows: for Messrs. Hamilton, Lee, Rockmuller, de Longis, Mss. Lo Bessette, Foxson and Picciotto, 225 Liberty Street, New York, New York 10281-1008, for Mr. Petersen, 6803 S. Tucson Way, Centennial, Colorado 80112- 3924. Each Officer serves for an indefinite term or until his or her resignation, retirement, death or removal. | |
78 OPPENHEIMER GLOBAL MULTI-ASSET GROWTH FUND
Mark Hamilton, Vice President (since 2015) Year of Birth: 1965 | Chief Investment Officer, Asset Allocation and Senior Vice President of the Sub-Adviser (since April 2013). Mr. Hamilton served at AllianceBernstein L.P. (from 1994-2013) as an Investment Director of Dynamic Asset Allocation (from 2010-2013), Head of North American Blend Team (from 2009-2010), and Senior Portfolio Manager of Blend Strategies (from 2006-2010). A portfolio manager and officer of other portfolios in the OppenheimerFunds complex. | |
Dokyoung Lee, Vice President (since 2015) Year of Birth: 1965 | Director of Research, Global Multi-Asset Group and a Senior Vice President of the Sub-Adviser (since October 2013). Mr. Lee served at Alliance Bernstein L.P. (1994- 2013): Director of Research for Strategic Asset Allocation (2011-2013), Director of Research for Blend Strategies (2008-2011), Head of Asia Pacific Blend Strategies (2005-2008), Head of Quantitative Research and Senior Portfolio Manager for Japan Value Equities (2001-2005), Portfolio Manager for Emerging Markets Value Equities (1997-2001), and Quantitative Analyst for US Value Equities (1994-1997). A portfolio manager and officer of other portfolios in the OppenheimerFunds complex. | |
Benjamin H. Rockmuller, Vice President (since 2015) Year of Birth: 1979 | Vice President of the Sub-Adviser (since September 2010); Senior Portfolio Manager of the Sub-Adviser (since January 2014); Portfolio Manager of the Sub-Adviser (July 2010-January 2014); Assistant Vice President of the Sub-Adviser (January 2010-August 2010); Senior Analyst of the Sub-Adviser for the Global Debt Team (January 2010-July 2010); Intermediate Analyst of the Sub-Adviser for the Global Debt Team (January 2007-January 2010); Junior Analyst of the Sub-Adviser for the Global Debt Team (April 2004-January 2007) and Junior Analyst of the Sub- Adviser for the High Yield Team (June 2003-April 2004). A portfolio manager and an officer in the OppenheimerFunds complex. | |
Alessio de Longis, Vice President (since 2015) Year of Birth: 1978 | Vice President of the Sub-Adviser (since June 2010); Assistant Vice President of the Sub-Adviser (May 2009-June 2010); Senior Research Analyst of the Sub-Adviser (January 2008-June 2010); Intermediate Research Analyst of the Sub-Adviser (January 2006-January 2008) Junior Analyst of the Sub-Adviser (February 2004-January 2006). A portfolio manager and an officer in the OppenheimerFunds complex. | |
Cynthia Lo Bessette, Secretary and Chief Legal Officer (since 2016) Year of Birth: 1969 | Executive Vice President, General Counsel and Secretary of the Manager (since February 2016); Chief Legal Officer of the Sub-Adviser and the Distributor (since February 2016); Vice President, General Counsel and Secretary of Oppenheimer Acquisition Corp. (since February 2016); General Counsel of OFI SteelPath, Inc., VTL Associates, LLC and Index Management Solutions, LLC (since February 2016); Chief Legal Officer of OFI Global Institutional, Inc., HarbourView Asset Management Corporation, OFI Global Trust Company, Oppenheimer Real Asset Management, Inc., OFI Private Investments Inc., Shareholder Services, Inc. and Trinity Investment Management Corporation (since February 2016); Senior Vice President and Deputy General Counsel (March 2015-February 2016); Vice President, Corporate Counsel (February 2012-March 2015) and Deputy Chief Legal Officer (April 2013-March 2015) of Jennison Associates LLC; Assistant General Counsel (April 2008-September 2009) and Deputy General Counsel (October 2009-February 2012) of Lord Abbett & Co. LLC. An officer of 100 portfolios in the OppenheimerFunds complex. | |
Jennifer Foxson, Vice President and Chief Business Officer (since 2014) Year of Birth: 1969 | Senior Vice President of OppenheimerFunds Distributor, Inc. (since June 2014); Vice President of OppenheimerFunds Distributor, Inc. (April 2006-June 2014); Vice President of the Sub-Adviser (January 1998-March 2006); Assistant Vice President of the Sub-Adviser (October 1991-December 1998). An officer of 100 portfolios in the OppenheimerFunds complex. | |
79 OPPENHEIMER GLOBAL MULTI-ASSET GROWTH FUND
TRUSTEES AND OFFICERS Unaudited / Continued
Mary Ann Picciotto, Chief Compliance Officer and Chief Anti-Money Laundering Officer (since 2014) Year of Birth: 1973 | Senior Vice President and Chief Compliance Officer of the Manager (since March 2014); Chief Compliance Officer of the Sub-Adviser, OFI SteelPath, Inc., OFI Global Trust Company, OFI Global Institutional, Inc., Oppenheimer Real Asset Management, Inc., OFI Private Investments, Inc., Harborview Asset Management Corporation, Trinity Investment Management Corporation, and Shareholder Services, Inc. (since March 2014); Managing Director of Morgan Stanley Investment Management Inc. and certain of its various affiliated entities; Chief Compliance Officer of various Morgan Stanley Funds (May 2010-January 2014); Chief Compliance Officer of Morgan Stanley Investment Management Inc. (April 2007-January 2014). An officer of 100 portfolios in the OppenheimerFunds complex. | |
Brian S. Petersen, Treasurer and Principal Financial & Accounting Officer (since 2016) Year of Birth: 1970 | Vice President of the Manager (since January 2013); Vice President of the Sub-Adviser (February 2007-December 2012); Assistant Vice President of the Sub- Adviser (August 2002-2007). An officer of 100 portfolios in the OppenheimerFunds complex. | |
The Fund’s Statement of Additional Information contains additional information about the Fund’s Trustees and Officers and is available without charge upon request by calling 1.800.CALL OPP (225.5677).
80 OPPENHEIMER GLOBAL MULTI-ASSET GROWTH FUND
OPPENHEIMER GLOBAL MULTI-ASSET GROWTH FUND
| Manager | OFI Global Asset Management, Inc. | |||
| Sub-Adviser | OppenheimerFunds, Inc. | |||
| Distributor | OppenheimerFunds Distributor, Inc. | |||
| Transfer and Shareholder Servicing Agent | OFI Global Asset Management, Inc. | |||
| Sub-Transfer Agent | Shareholder Services, Inc. DBA OppenheimerFunds Services | |||
| Independent Registered Public Accounting Firm | KPMG LLP | |||
| Legal Counsel | Kramer Levin Naftalis & Frankel LLP | |||
© 2016 OppenheimerFunds, Inc. All Rights reserved.
81 OPPENHEIMER GLOBAL MULTI-ASSET GROWTH FUND
As an Oppenheimer fund shareholder, you are entitled to know how we protect your personal information and how we limit its disclosure.
Information Sources
We obtain nonpublic personal information about our shareholders from the following sources:
| ● | Applications or other forms |
| ● | When you create a user ID and password for online account access |
| ● | When you enroll in eDocs Direct, our electronic document delivery service |
| ● | Your transactions with us, our affiliates or others |
| ● | Technologies on our website, including: “cookies” and web beacons, which are used to collect data on the pages you visit and the features you use. |
If you visit oppenheimerfunds.com and do not log on to the secure account information areas, we do not obtain any personal information about you. When you do log on to a secure area, we do obtain your user ID and password to identify you. We also use this information to provide you with products and services you have requested, to inform you about products and services that you may be interested in and assist you in other ways.
We do not collect personal information through our website unless you willingly provide it to us, either directly by email or in those areas of the website that request information. In order to update your personal information (including your mailing address, email address and phone number) you must first log on and visit your user profile.
If you have set your browser to warn you before accepting cookies, you will receive the warning message with each cookie. You can refuse cookies by turning them off in your browser. However, doing so may limit your access to certain sections of our website.
We use cookies to help us improve and manage our website. For example, cookies help us recognize new versus repeat visitors to the site, track the pages visited, and enable some special features on the website. This data helps us provide a better service for our website visitors.
Protection of Information
We do not disclose any non-public personal information (such as names on a customer list) about current or former customers to anyone, except as permitted by law.
Disclosure of Information
Copies of confirmations, account statements and other documents reporting activity in your fund accounts are made available to your financial advisor (as designated by you). We may also use details about you and your investments to help us, our financial service affiliates, or firms that jointly market their financial products and services with ours, to better serve your investment needs or suggest educational material that may be of interest to you. If this requires us to provide you with an opportunity to “opt in” or “opt out” of such information sharing with a firm not affiliated with us, you will receive notification on how to do so, before any such sharing takes place.
Right of Refusal
We will not disclose your personal information to unaffiliated third parties (except as permitted by law), unless we first offer you a reasonable opportunity to refuse or “opt out” of such disclosure.
82 OPPENHEIMER GLOBAL MULTI-ASSET GROWTH FUND
Internet Security and Encryption
In general, the email services provided by our website are encrypted and provide a secure and private means of communication with us. To protect your own privacy, confidential and/or personal information should only be communicated via email when you are advised that you are using a secure website. As a security measure, we do not include personal or account information in non-secure emails, and we advise you not to send such information to us in non-secure emails. Instead, you may take advantage of the secure features of our website to encrypt your email correspondence. To do this, you will need to use a browser that supports Secure Sockets Layer (SSL) protocol.
| ● | All transactions, including redemptions, exchanges and purchases, are secured by SSL and 256-bit encryption. SSL is used to establish a secure connection between your PC and OppenheimerFunds’ server. It transmits information in an encrypted and scrambled format. |
| ● | Encryption is achieved through an electronic scrambling technology that uses a “key” to code and then decode the data. Encryption acts like the cable converter box you may have on your television set. It scrambles data with a secret code so that no one can make sense of it while it is being transmitted. When the data reaches its destination, the same software unscrambles the data. |
| ● | You can exit the secure area by either closing your browser, or for added security, you can use the Log Out button before you close your browser. |
Other Security Measures
We maintain physical, electronic and procedural safeguards to protect your personal account information. Our employees and agents have access to that information only so that they may offer you products or provide services, for example, when responding to your account questions.
How You Can Help
You can also do your part to keep your account information private and to prevent unauthorized transactions. If you obtain a user ID and password for your account, safeguard that information. Also, take special precautions when accessing your account on a computer used by others.
Who We Are
This joint notice describes the privacy policies of the Oppenheimer funds, OppenheimerFunds, Inc., each of its investment adviser subsidiaries, OppenheimerFunds Distributor, Inc. and OFI Global Trust Co. It applies to all Oppenheimer fund accounts you presently have, or may open in the future, using your Social Security number—whether or not you remain a shareholder of our funds. This notice was last updated November 2016. In the event it is updated or changed, we will post an updated notice on our website at oppenheimerfunds.com. If you have any questions about this privacy policy, write to us at P.O. Box 5270, Denver, CO 80217-5270, email us by clicking on the Contact Us section of our website at oppenheimerfunds.com or call us at 1.800.CALL OPP (225.5677).
83 OPPENHEIMER GLOBAL MULTI-ASSET GROWTH FUND
THIS PAGE INTENTIONALLY LEFT BLANK.
84 OPPENHEIMER GLOBAL MULTI-ASSET GROWTH FUND
THIS PAGE INTENTIONALLY LEFT BLANK.
85 OPPENHEIMER GLOBAL MULTI-ASSET GROWTH FUND
THIS PAGE INTENTIONALLY LEFT BLANK.
86 OPPENHEIMER GLOBAL MULTI-ASSET GROWTH FUND
THIS PAGE INTENTIONALLY LEFT BLANK.
87 OPPENHEIMER GLOBAL MULTI-ASSET GROWTH FUND
Visit us at oppenheimerfunds.com for 24-hr access to
| ||||
Visit Us oppenheimerfunds.com | ||||
Call Us 800 225 5677 | ||||
| Follow Us | ||||
 | Oppenheimer funds are distributed by OppenheimerFunds Distributor, Inc. 225 Liberty Street, New York, NY 10281-1008 © 2016 OppenheimerFunds Distributor, Inc. All rights reserved.
RA2015.001.1016 December 22, 2016 | |||

Item 2. Code of Ethics.
The registrant has adopted a code of ethics that applies to the registrant’s principal executive officer, principal financial officer, principal accounting officer or controller or persons performing similar functions.
Item 3. Audit Committee Financial Expert.
The Board of Trustees of the registrant has determined that Joanne Pace, the Board’s Audit Committee Chairwoman, is an audit committee financial expert and that Ms. Pace is “independent” for purposes of this Item 3.
Item 4. Principal Accountant Fees and Services.
| (a) | Audit Fees |
The principal accountant for the audit of the registrant’s annual financial statements billed $44,800 in fiscal 2016 and $42,600 in fiscal 2015.
| (b) | Audit-Related Fees |
The principal accountant for the audit of the registrant’s annual financial statements billed $6,693 in fiscal 2016 and $7,200 in fiscal 2015.
The principal accountant for the audit of the registrant’s annual financial statements billed $598,285 in fiscal 2016 and $185,479 in fiscal 2015 to the registrant’s investment adviser or any entity controlling, controlled by, or under common control with the adviser that provides ongoing services to the registrant.
Such services include: GIPS attestation procedures, system conversion testing, internal controls, custody audits and additional audit services
| (c) | Tax Fees |
The principal accountant for the audit of the registrant’s annual financial statements billed $2,290 in fiscal 2016 and $525 in fiscal 2015.
The principal accountant for the audit of the registrant’s annual financial statements billed $690,716 in fiscal 2016 and $476,233 in fiscal 2015 to the registrant’s investment adviser or any entity controlling, controlled by, or under common control with the adviser that provides ongoing services to the registrant.
Such services include: tax compliance, tax planning and tax advice. Tax compliance generally involves preparation of original and amended tax returns, claims for a refund and tax payment-planning services. Tax planning and tax advice includes assistance with tax audits and appeals, tax advice related to mergers and acquisitions and requests for rulings or technical advice from taxing authorities.
| (d) | All Other Fees |
The principal accountant for the audit of the registrant’s annual financial statements billed no such fees in fiscal 2016 and no such fees in fiscal 2015.
The principal accountant for the audit of the registrant’s annual financial statements billed no such fees in fiscal 2016 and no such fees in fiscal 2015 to the registrant’s investment adviser or any entity controlling, controlled by, or under common control with the adviser that provides ongoing services to the registrant.
Such fees would include the cost to the principal accountant of attending audit committee meetings and consultations regarding the registrant’s retirement plan with respect to its Trustees.
| (e) | (1) During its regularly scheduled periodic meetings, the registrant’s audit committee will pre-approve all audit, audit-related, tax and other services to be provided by the principal accountants of the registrant. |
The audit committee has delegated pre-approval authority to its Chairwoman for any subsequent new engagements that arise between regularly scheduled meeting dates provided that any fees such pre-approved are presented to the audit committee at its next regularly scheduled meeting.
Under applicable laws, pre-approval of non-audit services may be waived provided that: 1) the aggregate amount of all such services provided constitutes no more than five percent of the total amount of fees paid by the registrant to its principal accountant during the fiscal year in which services are provided 2) such services were not recognized by the registrant at the time of engagement as non-audit services and 3) such services are promptly brought to the attention of the audit committee of the registrant and approved prior to the completion of the audit.
(2) 0%
| (f) | Not applicable as less than 50%. |
| (g) | The principal accountant for the audit of the registrant’s annual financial statements billed $1,297,984 in fiscal 2016 and $669,437 in fiscal 2015 to the registrant and the registrant’s investment adviser or any entity controlling, controlled by, or under common control with the adviser that provides ongoing services to the registrant related to non-audit fees. Those billings did not include any prohibited non-audit services as defined by the Securities Exchange Act of 1934. |
| (h) | The registrant’s audit committee of the board of Trustees has considered whether the provision of non-audit services that were rendered to the registrant’s investment adviser, and any entity controlling, controlled by, or under common control with the investment adviser that provides ongoing services to the registrant that were not pre-approved pursuant to paragraph (c)(7)(ii) of Rule 2-01 of Regulation S-X is compatible with maintaining the principal accountant’s independence. No such services were rendered. |
Item 5. Audit Committee of Listed Registrants
Not applicable.
Item 6. Schedule of Investments.
a) Not applicable. The complete schedule of investments is included in Item 1 of this Form N-CSR.
b) Not applicable.
Item 7. Disclosure of Proxy Voting Policies and Procedures for Closed-End Management Investment Companies.
Not applicable.
Item 8. Portfolio Managers of Closed-End Management Investment Companies.
Not applicable.
Item 9. Purchases of Equity Securities by Closed-End Management Investment Company and Affiliated Purchasers.
Not applicable.
Item 10. Submission of Matters to a Vote of Security Holders.
The Fund’s Governance Committee Provisions with Respect to Nominations of Directors/Trustees to the Respective Boards
None
Item 11. Controls and Procedures.
Based on their evaluation of the registrant’s disclosure controls and procedures (as defined in rule 30a-3(c) under the Investment Company Act of 1940 (17 CFR 270.30a-3(c)) as of 10/31/2016, the registrant’s principal executive officer and principal financial officer found the registrant’s disclosure controls and procedures to provide reasonable assurances that information required to be disclosed by the registrant in the reports that it files under the Securities Exchange Act of 1934 (a) is accumulated and communicated to registrant’s management, including its principal executive officer and principal financial officer, to allow timely decisions regarding required disclosure, and (b) is recorded, processed, summarized and reported, within the time periods specified in the rules and forms adopted by the U.S. Securities and Exchange Commission.
There have been no changes in the registrant’s internal controls over financial reporting that occurred during the registrant’s second fiscal quarter of the period covered by this report that have materially affected, or are reasonably likely to materially affect, the registrant’s internal control over financial reporting.
Item 12. Exhibits.
| (a) | (1) Exhibit attached hereto. |
(2) Exhibits attached hereto.
(3) Not applicable.
| (b) | Exhibit attached hereto. |
SIGNATURES
Pursuant to the requirements of the Securities Exchange Act of 1934 and the Investment Company Act of 1940, the registrant has duly caused this report to be signed on its behalf by the undersigned, thereunto duly authorized.
Oppenheimer Global Multi-Asset Growth Fund
| By: | /s/ Arthur P. Steinmetz | |
| Arthur P. Steinmetz | ||
| Principal Executive Officer | ||
| Date: | 12/14/2016 |
Pursuant to the requirements of the Securities Exchange Act of 1934 and the Investment Company Act of 1940, this report has been signed below by the following persons on behalf of the registrant and in the capacities and on the dates indicated.
| By: | /s/ Arthur P. Steinmetz | |
| Arthur P. Steinmetz | ||
| Principal Executive Officer | ||
| Date: | 12/14/2016 |
| By: | /s/ Brian S. Petersen | |
| Brian S. Petersen | ||
| Principal Financial Officer | ||
| Date: | 12/14/2016 |