Exhibit 15.1
Investor Update
Q1 2022 performance update: Continued strong performance despite a volatile market
A summary of Fundrise portfolio performance in Q1
“Risk-adjusted return” is a term that you will often hear used by professional investors when describing how to best optimize portfolio strategy. This foundational tenet of the investment industry says that higher-risk investments should produce higher returns, while lower-risk investments should produce lower returns. Theoretically, by plotting both measures on a graph it is possible to observe a linear relationship between the two that determines the appropriate return for any investment given its relative risk. To be successful — again, theoretically, — all an investor must do then is select those investments that fall above that line (i.e., where the potential return is greater than would be expected given the relative risk).
Of course, this idea assumes that both risk and future returns are easily quantifiable and that the information needed to measure either is actually readily available — a notion that (in our opinion) decades of history has tended to refute.
The reality is that risk is incredibly difficult to quantify. Not only is it somewhat subjective but, unlike returns, risk is arguably not possible to measure even in retrospect. Just because an investment performs well does not mean that it was a low-risk proposition — someone who happens to win the lottery may end up fabulously wealthy, but it would still be foolish to assume that buying the ticket was a sound strategy in the first place.
However, despite these truths, far too often “expert” investors attempt to distill risk down into a few individual metrics, a practice that we are extremely skeptical of. In the public markets, for example, this means relying on proxies such as “beta,” a measure of past volatility, which at best is only loosely correlated, if at all, to any notion of future potential risk or performance.
Rather than attempt to measure or simplify risk into a single numerical metric, we tend to think of sound investing as the process of reducing risks by maximizing future optionality while simultaneously minimizing actions that could create genuine threats to principal.
After all, risk is not merely the likelihood that you may not earn a return but also the potential that you actually take losses, and the relative amount of those losses. To quote one of the most over-quoted Warren Buffet-isms: “The first rule of an investment is don’t lose (money). The second rule is don’t forget the first.”
It’s for this reason we often note that the quality of the Fundrise platform will be most evident not by how well we perform in a hot market, but instead by how resilient our investments are in a down market — the benefits of our investment strategy being as much about providing stability relative to the broader market as they are about maximizing total return.
Q1 2022 returns of client accounts by investment plan objective1
| | Income | Balanced | Growth | Overall |
| Dividends (income return) | 1.03% | 0.74% | 0.59% | 0.73% |
| Appreciation (price return) | 1.99% | 2.85% | 3.01% | 2.76% |
| Total return | 3.02% | 3.59% | 3.60% | 3.49% |
Relative performance
So far 2022 has been volatile for public equities, and while 2021 proved to be a record year for Fundrise in terms of overall returns, the first three months of this year may be an even better measure of our unique value proposition.
Q1 2022 returns of client accounts vs public REITs & public stocks
| | Fundrise1
(all clients) | Public REITs2 (all U.S. REITs) | Public stocks3 (S&P 500) |
| Dividends (income return) | 0.73% | 0.68% | 0.35% |
| Appreciation (price return) | 2.76% | -5.95% | -4.95% |
| Total return | 3.49% | -5.27% | -4.60% |
Once again, performance in the portfolio has been driven by strong fundamentals at the property level, along with the same broad macroeconomic tailwinds that have propelled performance over the past 24 months. (For a reminder on how we are thinking about macro growth trends see the details portion of the Q3 2021 performance update).
Uncertainty ahead, as always
However, while we continue to feel confident in the broad macro trends that make up the core of our investment thesis, the world today is in a very different place than it was six months ago. We started the year discussing our concerns around the level of uncertainty building in the market and in particular our belief that inflation was likely to continue increasing, for longer than most experts were forecasting — a viewpoint that is now much more widely held. And of course, Russia’s invasion of Ukraine has unleashed a ground war in Europe, a sober reminder that we still live in a world where terrible and seemingly unfathomable things do happen.
In just three short months, the risks to the downside have accumulated rapidly, and the market is taking note. Real interest rates are negative, which effectively means that bond buyers would rather lose a small, known amount of money than risk the potential for greater downside in owning stocks.
What makes this period of disturbance different from others in recent memory is that the Federal Reserve is no longer taking a supportive position. Instead, Chairman Powell and his fellow governors have begun their move towards a more hawkish stance, signaling their intent to combat inflation by continuing to raise rates despite the potential that doing so could substantially slow the economy. If there is one lesson from the last several decades of financial history it’s “don’t fight the Fed.”
Of course, while history never repeats itself exactly, it’s hard not to see the many similarities between what we are experiencing today and the inflationary decade of the 1970s. Back then it took raising interest rates to 20% and two separate recessions before things started to normalize. And while most assets struggled during that period of high inflation and high interest rates, one asset class did stand apart… real estate.
In fact, for comparison, if you had invested $100 in the stock market at the beginning of 1970 ten years later in 1980 it would have been worth only $120, not adjusting for inflation — in other words over the course of the entire decade, stock investors made a meager 20% total. And if you were to adjust for inflation, you’d see that 20% gain was actually a 40% loss in today’s dollars, unimaginable to many investors who more recently have become accustomed to year-after-year of historically strong returns.
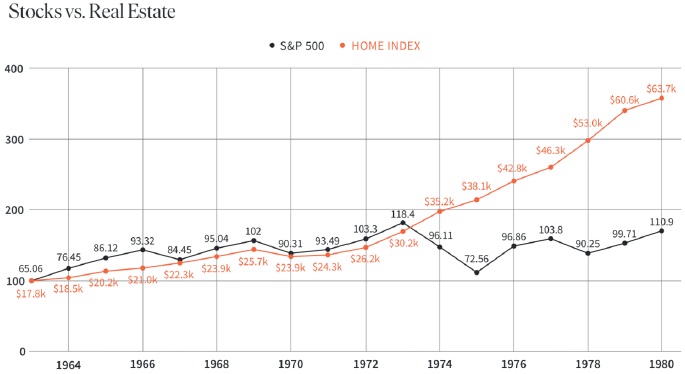
Data for S&P 500 from https://data.nasdaq.com/data/MULTPL/SP500_REAL_PRICE_YEAR-sp-500-real-price-by-year.
Data for Median Sales Price of Houses Sold for the United States from https://data.nasdaq.com/data/FRED/MSPUS-median-sales-price-of-houses-sold-for-the-united-states.
On the other hand, real estate, as measured by the median sales price of homes in the US, tripled in value over that same period. In fact, real estate in the 1970s didn’t just perform well in relation to public assets — it outperformed returns for real estate in every other recent decade since.
It’s not an exaggeration to say that we have been building Fundrise in anticipation of an economic period like this one, ever since we started the company, nearly 10 years ago. While the “everything bubble” of the past decade has rewarded most risk taking, we believe that success in the period ahead will require a much greater level of discernment from investors.
Across all areas, we have strived to create a portfolio that is well built to weather this storm. By asset class (real estate), product type (residential and industrial), and geography (Sunbelt), we have selected for those factors that are both experiencing strong long-term demand today and have historically performed well, both in previous inflationary periods and downturns more broadly. We’ve maintained conservative leverage and focused on maintaining optionality. In sum, we feel as confident in the strength of our portfolio as any other portfolio that we are aware of.
While time may prove that preparation to such a degree was ultimately not necessary, we will, as usual, hope for the best but plan for the worst.
As always, we deeply appreciate the trust you have given us and look forward to continuing to earn it through our performance in the quarters and years ahead. Until then…
Onward,
Ben and the entire Fundrise team
Appendix
Exhibit A: Performance of individual Fundrise sponsored funds, Q1 20224
| Fund name / objective | Average AUM5 | Launch date | Net total return |
| Registered funds | | | |
| Flagship Fund (Balanced) | $851,006,308 | Jan 2021 | 5.11% |
| Growth | | | |
| Growth eREIT | $233,819,618 | Feb 2016 | 4.62% |
| Growth eREIT II | $111,589,270 | Sep 2018 | 4.34% |
| Development eREIT | $116,836,669 | Jun 2019 | 0.10% |
| eFund6 | $94,157,775 | Jun 2017 | 0.00% |
| Growth eREIT III | $61,858,820 | Feb 2019 | 7.17% |
| Growth eREIT VII | $56,516,299 | Jan 2021 | 6.05% |
| Growth eREIT VI | $50,148,963 | Dec 2019 | 1.56% |
| Balanced | | | |
| East Coast eREIT | $170,296,521 | Oct 2016 | 1.23% |
| Heartland eREIT | $115,680,047 | Oct 2016 | 4.59% |
| West Coast eREIT | $98,460,553 | Oct 2016 | 1.48% |
| Balanced eREIT | $52,220,882 | Dec 2019 | 1.72% |
| eREIT XIV7 | $47,793,477 | Dec 2019 | 1.98% |
| Balanced eREIT II | $40,254,695 | Jan 2021 | 5.10% |
| Income | | | |
| Income eREIT7 | $142,408,012 | Dec 2015 | 1.36% |
| Income eREIT II7 | $80,494,952 | Sep 2018 | 1.79% |
| Income eREIT V7 | $65,835,474 | Oct 2019 | 1.29% |
| Income eREIT 20197 | $43,214,112 | Jun 2019 | 1.76% |
| Income eREIT III7 | $36,598,356 | Feb 2019 | 1.84% |
Disclaimers
1. Figures represent the weighted average aggregate performance of all client accounts during the period indicated, including any shares acquired as a result of the reinvestment of dividends, and net of a 0.15% advisory fee, if applicable. Commissions are not considered since clients of Fundrise Advisors are not charged trading commissions or any other transaction-based fees. Returns were calculated using the Modified Dietz method. This information is presented for informational purposes only. Past performance is not indicative of future results, and any investment carries with it the risk of loss.
2. Specifically, the National Association of Real Estate Investment Trusts (NAREIT) All US REITs index total return, which includes both dividends and capital gains / losses, for the period indicated. This index covers all publicly listed US REITs and is designed to present investors with a comprehensive family of REIT performance indexes that spans the commercial real estate space across the US economy, with exposure to all investment and property sectors. As an index, the FTSE NAREIT All REITs index is inherently not investable, and is presented for informational purposes only.
3. Specifically, the S&P 500 index total return, which includes both dividends and capital gains / losses, for the period indicated. The index includes 500 leading companies and covers approximately 80% of available market capitalization of US publicly listed stocks. As an index, the S&P 500 is inherently not investable, and is presented for informational purposes only.
4. “Performance of individual Fundrise sponsored funds” specifically refers to the time weighted return for the calendar year 2021, calculated using the Modified Dietz method. Returns are inclusive of dividends and capital gains / losses, are net of fees, and include shares which were acquired via dividend reinvestment. Past performance is not indicative of future results, and all investments may result in total or partial loss. All prospective investors should consult their personal tax and investment advisors before making any investment on the Fundrise platform. All estimated performance figures presented include both dividends and capital gains / losses, are net of fees, and include shares which were acquired via dividend reinvestment. For more information, please see our full performance disclosure, as well as the offering circulars available at fundrise.com/oc.
5. “Average AUM” is the daily average invested capital in the indicated program during the first quarter of 2022, calculated using the Modified Dietz method. The average capital calculation weights individual cash flows (for example investments or redemptions) by the length of time between those cash flows until the end of the period. Flows which occur towards the beginning of the period have a higher weight than flows occurring towards the end.
6. The eFund did not declare a new NAV at the end of Q1 2022, as it only declares NAV semi-annually at the end of Q2 and Q4.
7. As of April 1, 2022, these funds were merged into the Fundrise Income Real Estate Fund, an SEC registered interval fund. For more information, see the full investor update.