Exhibit 15.1
Mid-Year Letter - 2022
As the public markets faltered, the Fundrise portfolio achieved its best relative performance ever.
In 2021, Fundrise delivered our strongest ever total performance, generating an average net return for investors of 22.99%. Through the first half of 2022 we’ve now produced our strongest ever relative performance, beating the S&P 500 on an absolute basis by nearly 25%. Public stocks (as measured by the index) saw their worst start to the year since 1970, down nearly 20%. In contrast, the average net return for Fundrise investors through the first six months was a resilient 5.52%.
The Fundrise portfolio also produced similar relative performance when compared to public REITs, which have seen their share prices fall in lockstep with the broader stock market since the beginning of the year.
H1 2022 returns of client accounts vs public REITs & public stocks
| | | Fundrise1
(all clients) | | Public REITs2
(all U.S. REITs) | | Public stocks3
(S&P 500) |
| Dividends (income return) | | 1.22% | | 1.37% | | 0.62% |
| Appreciation (price return) | | 4.31% | | -20.68% | | -20.58% |
| Total return | | 5.52% | | -19.31% | | -19.96% |
Anyone who’s been invested with us for more than a few months has heard us state many times that while our long-term goal is to deliver both stronger and more stable returns than the broader market, we believe what makes Fundrise truly unique is our ability to perform well when the market is down.
Again, this should not be misconstrued as overconfidence in our abilities as investors. Instead, this assertion comes from an understanding that a portfolio whose performance is driven by the underlying fundamentals of high-quality real assets combined with a low-fee model is structurally set up to outperform.
In January we were explicit in our warning that “credit markets are wrong we are likely to experience sustained high-levels of inflation through the next year” and “with pricing where it is today, [investing in stocks] comes with meaningful principal risk.” We were fortunate that this healthy dose of paranoia along with diligent preparation (both from the standpoint of the types of assets we’ve invested in, as well as the judicious use of leverage) positioned the portfolio to withstand the mounting headwinds of the past several months.
In truth, the foundation for this preparation can be traced back several years, as evidenced by our concerns in 2019, when we noted our belief that we were very late in the economic cycle and that consensus-driven assets, such as stocks, were mispriced and likely due for a significant correction. Of course, since then we not only witnessed a global pandemic but have also seen soaring stock prices, with stocks today (even after this year’s historic rout) still up nearly 50% from those 2019 highs.
So now the question is, “Where do we stand today?” And the short answer is that, despite everything we’ve experienced over the last six months, we feel that we’re likely still in the early stages of what we expect to be a painful and drawn-out deleveraging as the Fed pursues its mission to stamp out inflation at all costs.
So far, we’ve seen a resetting of values (i.e., a lowering of revenue multiples) primarily in response to rising interest rates. This has been particularly pronounced in the technology sector with the value of some previous industry darlings, like Netflix, falling as much as 70%. There’s also been a popping of the most speculative of all the current bubbles, crypto and SPACs, with more than $1 trillion of market cap evaporating almost overnight.
However, there’s a good argument that much of this resetting is mostly runaway valuations simply starting to fall back to earth (public tech companies on a revenue multiple basis are still higher today than at almost any other point in the last 20 years and, despite the recent historic rout, are up roughly 50% from the highs of 2019 mentioned earlier).
The next phase
The next phase is likely to unfold first through a reforecasting of growth expectations, with companies both big and small adjusting their internal and external projections downward as the impacts of waning consumer sentiment start to materialize (not to mention continued stress from high energy prices and the impacts of the war in Ukraine). This in turn is likely to lead to yet another leg down in asset prices, which may trigger a new wave of liquidity shortfalls and subsequent forced selling. In other words, we see things getting worse still before they get better.
The harsh reality is that the impact of 15 years of near-zero interest rates and accompanying monetary stimulus cannot be undone in just six months. Although rising inflation as measured by CPI has only been at these levels for a few months, the forces driving it have been building for years. As a result, the dramatic steps required to rein in the current inflationary pressures on the broader economy may take much longer to play out and, by definition, necessitate a Fed-induced recession.
In early January, we shared that our outlook on inflation was out of step with the consensus in credit markets. Once again, we are finding our views increasingly divergent with general opinion. The bond market, as reflected by the yield curve, is forecasting that interest rates will start to decline by February because of a recession. In essence, institutional investors expect the Fed to make an about-face as the stock market and economy fall apart from tightening monetary policy.
Treasury Yield Curve Forecast
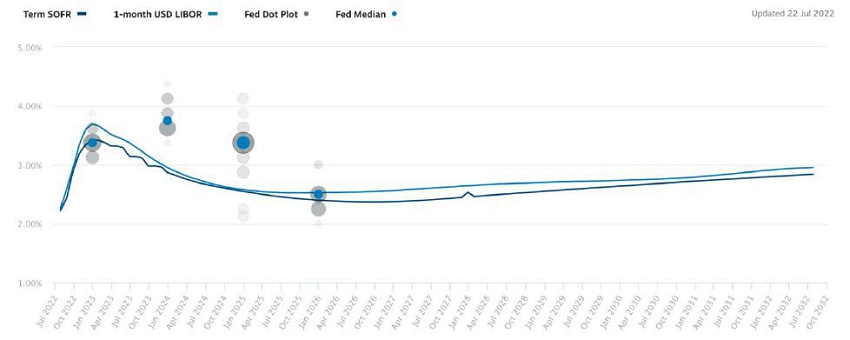
Source: Term SOFR, USD LIBOR, and Treasury Forward Curves, Chatham Financial
This is not all that surprising. Over the past 30 years, investors have been trained to believe that when times get tough the Fed will always bail them out. So, it is understandable that most people expect if things start to get too bad now, the Fed will swoop in again. However, we at Fundrise are far less sanguine about both the Fed’s ability to bring down inflation to their 2% target and their willingness to reverse course should we enter a recession but inflation stays high. Instead, we believe there's a strong possibility that the Fed may keep rates higher for longer, despite a recession, a phenomenon that hasn’t occurred since Paul Volcker in the 1980s.
History has shown that so-called “efficient” markets are actually poor prognosticators of the effects from rare or singular events, as was so clearly evidenced in February 2020 and January 2022, when prices did not reflect the real risks present in the world. Because markets are experienced as a vast amount of numbers on a computer screen, it is easy to misperceive them as a quantitative phenomenon. The truth, of course, is that markets are first and foremost a reflection of mass psychology, with all its attendant bias.
To date, the real economy has continued to clip along healthily, which has buoyed corporate earnings and, as a result, inflation. To bring inflation down from the current market of +9%, we believe the Fed will have to meaningfully slow the economy for an extended period. That would involve doing what so few are currently able to imagine: maintaining high interest rates despite being in a recession.
In closing
As we’ve noted many times over the years, we see little value in being overly optimistic and instead prefer to address whatever harsh realities may exist, as soon as they become apparent. Our hope is that by sharing our unvarnished opinions, investors have a clearer understanding of how we think and therefore how we are likely to operate going forward.
We’ve stated before that we believe the broader Fundrise portfolio, with its primary focus on residential assets in the Sunbelt, is as attractive an asset to hold in this environment as any that we are aware of… and this remains true today. Additionally, we continue to expect to build up a larger cash position in the portfolio as we wait patiently for prices to continue to adjust downward. We also believe that there’s a strong possibility that the paper markets (such as REIT stocks and other financial instruments tied to real estate) will see a further decline over the next several months, in which case we anticipate potentially deploying some portion of the portfolio into certain public REITs or other real estate securities should their prices reflect implied yields better than private markets at that time.
Lastly, as I’ve stated recently, I want to take a moment to thank all our investors for your continued support. At the end of the day, Fundrise is unique because of the direct relationship we have with our investor base which is made up of hundreds of thousands of actual individuals — not institutions. We believe this fundamental difference has been and will continue to be critical to our collective success.
Onward,
Ben and the entire Fundrise team
Appendix
Exhibit A: H1 2022 returns of client accounts by investment plan objective1
| | | Income | | Balanced | | Growth | | Overall |
| Dividends (income return) | | 1.73% | | 1.22% | | 1.00% | | 1.22% |
| Appreciation (price return) | | 3.05% | | 4.16% | | 4.95% | | 4.31% |
| Total return | | 4.78% | | 5.39% | | 5.96% | | 5.52% |
Exhibit B: Performance of individual Fundrise sponsored funds, H1 20224
| Fund name / objective | Average AUM5 | Launch date | Net total return |
| Registered funds | | | |
| Flagship Real Estate Fund | $955,220,122 | Jan 2021 | 5.92% |
| Income Real Estate Fund | $219,812,567 | Apr 2022 | 3.07% |
| Growth | | | |
| Growth eREIT | $235,114,323 | Feb 2016 | 7.43% |
| Growth eREIT II | $111,157,513 | Sep 2018 | 8.86% |
| Development eREIT | $117,286,844 | Jun 2019 | -0.77% |
| eFund | $99,393,827 | Jun 2017 | 1.08% |
| Growth eREIT III | $61,542,851 | Feb 2019 | 12.62% |
| Growth eREIT VII | $67,324,704 | Jan 2021 | 13.44% |
| Growth eREIT VI | $49,890,983 | Dec 2019 | 2.73% |
| Balanced | | | |
| East Coast eREIT | $170,895,584 | Oct 2016 | 9.36% |
| Heartland eREIT | $116,142,631 | Oct 2016 | 5.20% |
| West Coast eREIT | $97,765,975 | Oct 2016 | 2.98% |
| Balanced eREIT | $51,909,456 | Dec 2019 | 2.12% |
| eREIT XIV | $23,764,819 | Dec 2019 | 3.99% |
| Balanced eREIT II | $50,651,026 | Jan 2021 | 5.06% |
| Income | | | |
| Income eREIT6 | $71,201,077 | Dec 2015 | 2.74% |
| Income eREIT II6 | $40,054,028 | Sep 2018 | 3.60% |
| Income eREIT V6 | $32,747,135 | Oct 2019 | 2.60% |
| Income eREIT 20196 | $21,489,970 | Jun 2019 | 3.54% |
| Income eREIT III6 | $18,198,326 | Feb 2019 | 3.69% |
Disclaimers
1. Figures represent the weighted average aggregate performance of all client accounts during the period indicated, including any shares acquired as a result of the reinvestment of dividends, and net of a 0.15% advisory fee, if applicable. Commissions are not considered since clients of Fundrise Advisors are not charged trading commissions or any other transaction-based fees. Returns were calculated using the Modified Dietz method. This information is presented for informational purposes only. Past performance is not indicative of future results, and any investment carries with it the risk of loss.
2. Specifically, the National Association of Real Estate Investment Trusts (NAREIT) All US REITs index total return, which includes both dividends and capital gains / losses, for the period indicated. This index covers all publicly listed US REITs and is designed to present investors with a comprehensive family of REIT performance indexes that spans the commercial real estate space across the US economy, with exposure to all investment and property sectors. As an index, the FTSE NAREIT All REITs index is inherently not investable, and is presented for informational purposes only.
3. Specifically, the S&P 500 index total return, which includes both dividends and capital gains / losses, for the period indicated. The index includes 500 leading companies and covers approximately 80% of available market capitalization of US publicly listed stocks. As an index, the S&P 500 is inherently not investable, and is presented for informational purposes only.
4. “Performance of individual Fundrise sponsored funds” specifically refers to the time weighted return for the first half of calendar year 2022, calculated using the Modified Dietz method. Returns are inclusive of dividends and capital gains / losses, are net of fees, and include shares which were acquired via dividend reinvestment. Past performance is not indicative of future results, and all investments may result in total or partial loss. All prospective investors should consult their personal tax and investment advisors before making any investment on the Fundrise platform. All estimated performance figures presented include both dividends and capital gains / losses, are net of fees, and include shares which were acquired via dividend reinvestment. For more information, please see our full performance disclosure, as well as the offering circulars available at fundrise.com/oc.
5. “Average AUM” is the daily average invested capital in the indicated program during the first half of 2022, calculated using the Modified Dietz method. The average capital calculation weights individual cash flows (for example investments or redemptions) by the length of time between those cash flows until the end of the period. Flows which occur towards the beginning of the period have a higher weight than flows occurring towards the end.
6. As of April 1, 2022, these funds were merged into the Fundrise Income Real Estate Fund, an SEC registered interval fund. For more information, see the full investor update.