Exhibit 15.1
2022 year-end letter to investors
The Fundrise portfolio weathered the headwinds of the past year with fortitude, resulting in our strongest-ever year of outperformance vs. benchmarks, and unlocking a period of potentially unprecedented opportunity.

As was true throughout most of the year, we end 2022 officially delivering our strongest-ever relative performance when compared to the broader stock market and publicly listed REITs.
While such performance is due largely to the strength of the underlying portfolio (something we will dive into further later), it is unfortunately also a result of public markets having delivered one of their worst performing years in the past several decades. In fact, for the first time since 1969 stocks and bonds both saw negative returns on the year1, with US bonds producing their worst ever 12-month returns on record (from October 2021 to October 2022) going all the way back more than two centuries to 17942.
Although each of the past three years have been unprecedented in their own right, 2022 was unquestionably a tectonic shift in financial markets that left nothing and no one untouched.
...we may surprise some of our long-time investors when we state that we are
starting to become more optimistic and believe that we are nearing the bottom
of the market cycle, with the next 12+ months presenting perhaps the most
compelling investment opportunities that we’ve seen in the decade since we
started Fundrise."
Fundrise performance
For 2022, the Fundrise portfolio delivered an average annual return across all client accounts of approximately 1.50%. Meanwhile, the stock market (as measured by the S&P 500) ended the year down -18.11%, with the bond market (as measured by the Bloomberg Aggregate US Bond Index) down -11.99%, and publicly listed REITs (as measured by the NAREIT All US REITs index) down -25.10%. In relative terms, the Fundrise portfolio ended up outperforming stocks by 19.61%, bonds by 13.49%, and public REITs by 26.60%.
| | | Fundrise
(all clients)3 | | | Public REITs
(all US REITs)4 | | | Stocks
(S&P 500)5 | | | Bonds
(Bloomberg Agg.)6 | |
| Dividends (income return) | | | 2.17 | % | | | 2.77 | % | | | 1.33 | % | | | 2.48 | % |
| Appreciation (price return) | | | -0.67 | % | | | -27.87 | % | | | -19.44 | % | | | -14.47 | % |
| Total return | | | 1.50 | % | | | -25.10 | % | | | -18.11 | % | | | -11.99 | % |
As always, it’s important to note that these figures reflect the average performance across all 385,000+ client accounts, and not every investor experienced these same returns. Admittedly, the magnitude of the changes that occurred in financial markets throughout the year also meant that we saw some of the greatest differential in 2022 investment performance between our newest and most tenured clients. Although we believe that the shifts in our investment strategies made over the recent past to respond to the state of the market will take time to fully mature, we continue to see them as extremely well positioned (but more to come on that later).
2022 net returns by investment objective and tenure of account7
| | | Tenure on platform | |
| Plan objective | | < 1 yr
(2022) | | | 1 - 2 yrs
(2021) | | | 2 - 3 yrs
(2020) | | | 3 - 4 yrs
(2019) | | | 4 - 5 yrs
(2018) | | | 5+ yrs
(pre-2018) | |
| Income | | | -4.12 | % | | | 0.38 | % | | | 2.69 | % | | | 3.68 | % | | | 4.08 | % | | | 6.17 | % |
| Balanced | | | -9.72 | % | | | -1.53 | % | | | 1.96 | % | | | 2.93 | % | | | 3.69 | % | | | 4.90 | % |
| Growth | | | -8.51 | % | | | -1.84 | % | | | 1.52 | % | | | 2.51 | % | | | 3.53 | % | | | 4.90 | % |
| Overall | | | -8.54 | % | | | -1.39 | % | | | 1.90 | % | | | 2.92 | % | | | 3.69 | % | | | 5.11 | % |
Also, for the sake of owning the bad along with the good, we want to highlight that Q4 2022 was the first ever quarter of net negative returns for the platform, with a weighted average return across all client accounts of -3.32%. This means that the majority of clients who made their first investment in 2022 will likely see net negative returns for their account to date.
Realistic doesn’t mean pessimistic
As we’ve discussed at length, we began this past year (as we do every year) looking ahead at the various macroeconomic forces at play. In early 2022, we were concerned about what we saw unfolding.
In our 2021 year-end letter, when most market observers were still arguing that inflation would be transitory, we stated:
“To be clear, it's our belief that we are likely to experience sustained high levels of inflation at minimum through the next year, if not longer, putting investors looking to protect themselves from value erosion in a difficult position.”
We even took the risk of stating our belief that:
“The credit market is wrong. But the repricing of $119 trillion of low interest rate debt is too frightening and painful a reversal to acknowledge, and so people are simply unwilling to accept a new reality.”
Then, as now, we were striving to take a hard-nosed view of reality. Being rigorous in our thinking and accepting what the information in front of us was pointing to, regardless of whether or not that conclusion ran counter to our own interests. We are of the belief that it does little good to wear rose-colored glasses into battle.
As a result, we continued to position the portfolio to withstand this new norm. We focused in particular on our residential and industrial strategies in the Sunbelt region, both of which we believed would be more resilient in an inflationary environment (a thesis that has largely been borne out so far).
And as has often been the case when we feel that markets are overpriced or there is impending dislocation, we repositioned more defensively, lowering effective overall leverage, and building up greater cash reserves. (For more details see table in appendix.)
As we’ve stated before, we expect the next several months to be challenging for the broader economy, with most economic conditions getting worse before they get better, and markets potentially seeing another significant leg downward.
Which is also why, as well-known paranoid downsiders, we may surprise some of our long-time investors when we state that we are starting to become more optimistic and believe that we are nearing the bottom of the market cycle, with the next 12+ months presenting perhaps the most compelling investment opportunities that we’ve seen in the decade since we started Fundrise.
However, to understand why we believe this to be true, it’s helpful to take a step back and look at the broader macro forces shaping the world today.
Don’t fight the Fed
Over the past year, to combat record high inflation, the Federal Reserve has conducted its fastest ever period of interest rate hikes, raising the benchmark Fed Funds rate from 0–0.25% in January 2022, up to 4–4.25% today, with all signs indicating that they will reach 4.75–5% by March of this year.
Forecast interest rates8
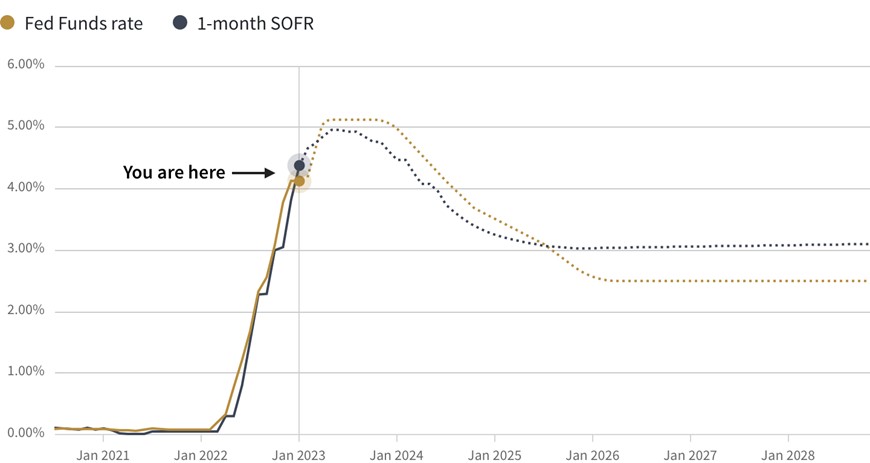
As expected, this plan to methodically slow down the economy and withdraw liquidity from the market through the use of monetary policy has also led to a sharp decline in asset values across nearly all sectors.
This is because, as the Fed raises their benchmark rate, they are effectively increasing the “risk free” rate of return investors are able to receive and, in doing so, are also setting the market’s return expectations higher for nearly all other investment assets as well.
All else being equal, when return expectations increase, prices (aka asset values) decrease. This is why we’ve described the current challenge of trying to retain asset values in such an environment as similar to trying to swim upstream against the current—always difficult and at times near impossible.
Additionally, no asset is immune, thanks to the nature of the two primary tools at the Fed's disposal: raising rates and quantitative tightening, each of which is inherently broad based and lacking precision. So, while the impacts are not uniform, and certain assets such as those that make up the core strategies within the Fundrise portfolio can perform better, even these kinds of high-quality assets are forced to mark down values in response to a much higher risk-free return.
However, while as asset owners the above described dynamics can be challenging, as investors it means that (at least temporarily) new opportunities will emerge as otherwise attractive assets with deep intrinsic value and strong growth potential essentially go on sale.
Opportunity favors the prepared
It seems increasingly likely that inflation broadly peaked mid-year with most of the core drivers now signaling a downward trajectory. Although pundits will debate precisely when and by how much we will see CPI continue to fall over the next 12 months, the key takeaway is that inflation is on the decline. (Our view here is in part driven by on-the-ground metrics we are seeing around materials and labor costs, as well as rents in our own portfolio.)
However, just as the Fed was slower to react and raise rates (CPI in January of 2022 was already above 7%, while the Fed didn’t raise rates from a floor of 0% until March), we expect that they will be similarly slow to bring rates down, preferring instead to err on the side of ensuring inflation is snuffed out rather than risk a second wave like the one experienced in the late 1970s.
This means that individuals, businesses, and investors alike will need to survive what is likely to be a temporary and somewhat defined period where asset values are broadly depressed and borrowing costs are significantly higher (at least when compared to recent history).
Crossing the chasm: inverted yield curve9
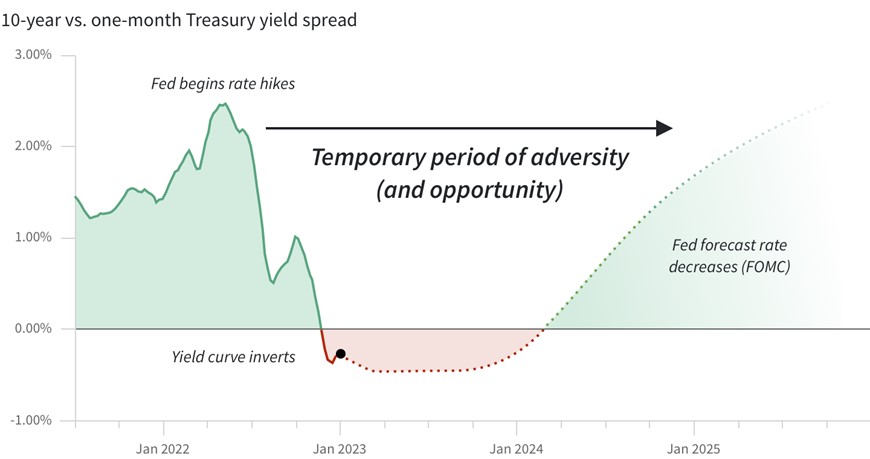
For those who are well prepared, i.e. those with stable underlying cash flow streams, sufficient liquidity, and relatively modest leverage, such a period, while less desirable, is not the end of the world.
However, for those whom the above description is not true, i.e., those with less stable or little cash flow, limited liquidity, and relatively higher leverage, such a period presents a potential existential business threat.
Of course, financial markets are famous for rewarding “risk-on” behavior over the short-term, despite the fact that it is unsustainable over the long-term — and therein lies our opportunity.
Looking ahead
Stability
Although we do anticipate inflation to continue its relative decline over the full course of 2023, we still expect that both inflation and interest rates will remain elevated through the first six months.
Over this period, we once again expect the core of our portfolio, primarily residential and logistics properties located in the Sunbelt region, to remain more resilient and generate positive income growth.
There are many reasons why our Sunbelt strategy has outperformed to date, but a simple shortcut to understand it is simply to look at population growth (as real estate in the long run is arguably mostly a levered bet on growth within a specific geography or asset type). The numbers here tell a clear story: from July 2021 to July 2022 four states — Florida, Texas, North Carolina, and Georgia — grew by a total of more than 1 million people, while the net population growth across the entire United States was only 1.25 million.
July 2021 - July 2022 estimated net population growth10
| State | | Est. net growth | | | Share of net growth | |
| Texas | | | 470,708 | | | | 37.5 | % |
| Florida | | | 416,754 | | | | 33.2 | % |
| North Carolina | | | 133,088 | | | | 10.6 | % |
| Georgia | | | 124,847 | | | | 9.9 | % |
| All others | | | 110,606 | | | | 8.8 | % |
| Total | | | 1,256,003 | | | | 100.0 | % |
That means that more than 80% of all the net population growth in the country occurred in just four states. And within those four states a majority of that growth (close to 65%) occurred in just eight cities, which (not so coincidentally) are eight of the cities in which the Fundrise portfolio is most heavily invested. Approximately 70% of all Fundrise acquisitions from 2021 to 2022 were in these metropolitan areas and more than 90% within the Sunbelt.
We’ve found this 80/20 effect, known as the Pareto principle, to be a near universal law of nature. Though devilishly simple, it’s frequently underappreciated.
Opportunity
While we expect the existing portfolio to continue to provide stability, we also expect the most attractive near-term opportunities to present themselves first in credit markets (i.e., where Fundrise funds are acting as the lender to other owners of real estate, instead of being an owner itself).
In our recent podcast episode titled “The Great Deleveraging,” we go into great detail around the potential impacts of a higher rate environment lasting longer, and the negative reinforcing cycle of “turtles all the way down,” as the liquidity constraints for one borrower will, in turn, create liquidity constraints for their lender, who ironically has the same issue as the borrower themselves (because most lenders borrow the majority of their money to make their loans).
Over the next year or so, some of the best investment opportunities are likely to present themselves merely as a function of a disparity between those with or without liquidity, where even borrowers of strong credit with extremely high-quality assets are forced to borrow at rates 3x higher than they were only 18 months prior.
We are already starting to see this once-in-a-cycle opportunity play out, as evidenced by the growth in the dividend of the Income Fund, which, as of January 1st, is at 9.0% — and we expect that this window of opportunity may only exist for the next 6-12 months.
Temperament
While there is no such thing as perfect timing, it’s also not an exaggeration to say that timing is everything.
Every investor has heard the plethora of famous sayings around timing the market — “buy low, sell high,” “buy when there is blood in the streets,” or “be fearful when others are greedy, and greedy when others are fearful” — most of which focus on the emotional challenge of acting in a contrarian manner.
However, merely having the ability to act is arguably just as important as having the insight or courage to act. This means being in a position to invest when the timing is right, which has more to do with the equally contrarian activity of building up liquidity when times are good.
We often describe ourselves as the tortoise, as opposed to the hare — we’re content to take our time as we play the long game on behalf of our investors.
We started Fundrise in the aftermath of the 2008 Great Financial Crisis, based on the belief that it was possible to do things differently and create a company that worked on behalf of individual investors rather than many institutions that worked at their expense (as was made so egregiously clear with subprime mortgages then, and with most SPACs and crypto now).
So it is not an exaggeration to say that we’d been preparing for a year like 2022 for more than a decade.
As we look ahead now to 2023, we see perhaps the best opportunity yet to validate our core mission and give our investors, who we believe hold a similar temperament and long-term outlook, the opportunity to capitalize on the over-leverage and short-sightedness of too many in the financial markets.
As always, we welcome your feedback and appreciate your continued support.
Onward.
Appendices
Exhibit A: 2022 returns of client accounts by individual Fundrise sponsored fund
| Fund name / objective | | Average AUM | | | Launch date | | Net total return | |
| Registered funds | | | | | | | | | | |
| Flagship Real Estate Fund | | $ | 1,118,638,518 | | | Jan 2021 | | | -4.82 | % |
| Income Real Estate Fund | | $ | 350,088,111 | | | Apr 2022 | | | 6.00 | % |
| Growth eREITs | | | | | | | | | | |
| Growth eREIT | | $ | 253,744,707 | | | Feb 2016 | | | 10.16 | % |
| Growth eREIT II | | $ | 126,524,742 | | | Sep 2018 | | | 9.77 | % |
| Development eREIT | | $ | 122,893,434 | | | Jun 2019 | | | -1.15 | % |
| eFund | | $ | 101,520,695 | | | Jun 2017 | | | -0.22 | % |
| Growth eREIT III | | $ | 60,722,053 | | | Feb 2019 | | | 13.93 | % |
| Growth eREIT VII | | $ | 78,198,302 | | | Jan 2021 | | | -6.37 | % |
| Growth eREIT VI* | | $ | 33,198,605 | | | Dec 2019 | | | 5.10 | % |
| Balanced eREITs | | | | | | | | | | |
| East Coast eREIT | | $ | 169,827,257 | | | Oct 2016 | | | 5.55 | % |
| Heartland eREIT | | $ | 116,042,591 | | | Oct 2016 | | | 11.01 | % |
| West Coast eREIT | | $ | 96,474,154 | | | Oct 2016 | | | 3.89 | % |
| Balanced eREIT‡ | | $ | 34,518,904 | | | Dec 2019 | | | 6.23 | % |
| eREIT XIV† | | $ | 11,791,621 | | | Dec 2019 | | | 8.05 | % |
| Balanced eREIT II | | $ | 56,079,941 | | | Jan 2021 | | | -1.96 | % |
| Income eREITs | | | | | | | | | | |
| Income eREIT† | | $ | 35,636,296 | | | Dec 2015 | | | 5.54 | % |
| Income eREIT II† | | $ | 19,901,054 | | | Sep 2018 | | | 7.25 | % |
| Income eREIT V† | | $ | 16,242,286 | | | Oct 2019 | | | 5.25 | % |
| Income eREIT 2019† | | $ | 10,663,653 | | | Jun 2019 | | | 7.14 | % |
| Income eREIT III† | | $ | 9,038,241 | | | Feb 2019 | | | 7.45 | % |
* Merged into Growth eREIT II on September 1, 2022.
‡ Merged into Growth eREIT on September 1, 2022.
† Merged into the Income Real Estate Fund on April 1, 2022.
Exhibit B: Portfolio breakdown by property type, as of 12/31/2022
| | | Net asset value | | | % of total | |
| Equity ownership of real estate | | | | | | | | |
| Multifamily apartments | | $ | 793,656,112 | | | | 30.09 | % |
| Single-family rental | | $ | 777,450,642 | | | | 29.47 | % |
| Industrial | | $ | 244,112,610 | | | | 9.25 | % |
| Mixed-use/commercial | | $ | 161,706,435 | | | | 6.13 | % |
| Other | | $ | 49,599,630 | | | | 1.88 | % |
| Equity ownership of real estate | | $ | 2,026,525,429 | | | | 76.82 | % |
| | | | | | | | | |
| Real-estate-backed fixed income | | | | | | | | |
| Multifamily finance (pref equity) | | $ | 214,784,236 | | | | 8.14 | % |
| Acquisition and development (A&D) finance | | $ | 248,674,597 | | | | 9.43 | % |
| Senior loans (residential development) | | $ | 91,327,952 | | | | 3.46 | % |
| Residential mortgage backed securities (RMBS) | | $ | 56,600,000 | | | | 2.15 | % |
| Real-estate-backed fixed income | | $ | 611,386,785 | | | | 23.18 | % |
| | | | | | | | | |
| Total | | $ | 2,637,912,214 | | | | 100.00 | % |
Exhibit C: Liquidity reserves of individual Fundrise sponsored funds, as of 1/3/2023
Includes fund’s pro rata share of cash / money market funds and undrawn credit facility capacity in co-investment vehicles, and are reflective of estimates for pending NAV distribution reinvestment.
| Fund/entity | | Cash and money
market funds | | | Undrawn credit
facility capacity | | | Effective
liquidity | |
| Registered funds | | | | | | | | | | | | |
| Flagship Fund | | $ | 202,678,694 | | | $ | 186,759,000 | | | $ | 389,437,694 | |
| Income Fund | | $ | 76,432,180 | | | | | | | $ | 76,432,180 | |
| Innovation Fund | | $ | 43,257,757 | | | | | | | $ | 43,257,757 | |
| Registered funds | | $ | 322,368,631 | | | $ | 186,759,000 | | | $ | 509,127,631 | |
| | | | | | | | | | | | | |
| eREITs | | | | | | | | | | | | |
| Growth eREIT | | $ | 23,896,118 | | | | | | | $ | 23,896,118 | |
| Growth eREIT II | | $ | 4,093,534 | | | | | | | $ | 4,093,534 | |
| Growth eREIT III | | $ | 1,520,370 | | | | | | | $ | 1,520,370 | |
| Growth eREIT VII | | $ | 7,085,285 | | | $ | 20,751,000 | | | $ | 27,836,285 | |
| Balanced eREIT II | | $ | 21,148,158 | | | | | | | $ | 21,148,158 | |
| East Coast eREIT | | $ | 15,812,725 | | | | | | | $ | 15,812,725 | |
| Development eREIT | | $ | 7,880,221 | | | | | | | $ | 7,880,221 | |
| Heartland eREIT | | $ | 13,090,143 | | | | | | | $ | 13,090,143 | |
| West Coast eREIT | | $ | 15,511,677 | | | | | | | $ | 15,511,677 | |
| Fundrise eFund | | $ | 9,003,554 | | | | | | | $ | 9,003,554 | |
| eREITs | | $ | 119,041,786 | | | $ | 20,751,000 | | | $ | 139,792,786 | |
| | | | | | | | | | | | | |
| Other entities | | | | | | | | | | | | |
| Opportunity Fund | | $ | 6,285,907 | | | | | | | $ | 6,285,907 | |
| National Lending | | $ | 18,931,000 | | | | | | | $ | 18,931,000 | |
| Fundrise LP | | $ | 9,573,498 | | | | | | | $ | 9,573,498 | |
| Other entities | | $ | 34,790,405 | | | $ | 0 | | | $ | 34,790,405 | |
| | | | | | | | | | | | | |
| Total | | $ | 476,200,822 | | | $ | 207,510,000 | | | $ | 683,710,822 | |
Disclaimers
1 BlackRock, “Rebuilding resilience in 60/40 portfolios”
https://www.blackrock.com/us/individual/insights/60-40-portfolios-and-alternatives
2 New York Times, “After a Terrible Year for Bonds, the Outlook Is Better”,
https://www.nytimes.com/2022/12/09/business/bond-market-economy-investing.html
3 The time-weighted, weighted-average aggregate returns of Fundrise Advisors client accounts for the calendar year 2022, calculated using the Modified Dietz method. Total returns are inclusive of dividends and capital gains / losses, are net of fees, and include shares which were acquired via dividend reinvestment. “NAV distributions” (specifically, the “Additional December 31, 2022 Distribution” of $3.1881465200 per share declared by Growth eREIT, and the “Additional December 31, 2022 Distribution” of $3.0274538672 per share declared by Heartland eREIT) are considered as part of the appreciation / price return component. Return figures exclude the performance of investments in the Fundrise Opportunity Fund and the Fundrise Innovation Fund.
4 Annual performance of the NAREIT index for the calendar year 2022 specifically refers to the total return of the FTSE NAREIT All REITs index, which includes both dividends and capital gains / losses, and was sourced from reit.com on Jan 3, 2023. This index covers all publicly listed US REITs and is designed to present investors with a comprehensive family of REIT performance indexes that spans the commercial real estate space across the US economy, with exposure to all investment and property sectors. As an index, the FTSE NAREIT All REITs index is inherently not investable, and is presented for informational purposes only.
5 Annual performance of the S&P 500 index for the calendar year 2022 specifically refers to the total return, which includes both dividends and capital gains / losses, and was sourced from spglobal.com on Jan 3, 2023. The index includes 500 leading companies and covers approximately 80% of available market capitalization. As an index, the S&P 500 is inherently not investable, and is presented for informational purposes only.
6 Annual performance of the Bloomberg US Aggregate Total Return Index (LBUSTRUU) for the 12 months ended January 3, 2023, which includes both dividends and capital gains / losses. A broad-based flagship benchmark that measures the investment grade, US dollar-denominated, fixed-rate taxable bond market. The index includes Treasuries, government-related and corporate securities, MBS (agency fixed-rate pass-throughs), ABS and CMBS (agency and non-agency). As an index, LBUSTRUU is inherently not investable, and is presented for informational purposes only.
7 Weighted average returns by age of client account consists of the time-weighted, weighted-average returns of Fundrise Advisors client accounts that were active for any part of the calendar year 2022, and first acquired shares within the indicated time period (e.g., “1-2 years” would include any account which first acquired shares between Jan 1, 2021 and Dec 31, 2021, inclusive of both dates). Accounts are categorized by their most recently selected investment plan objective (e.g. an account which began with a Growth objective but switched to an Income objective would be put in the Income category).
8 Federal Funds Effective Rate (FEDFUNDS) and FOMC Summary of Economic Projections for the Fed Funds Rate, Median (FEDTARMD), both sourced from St. Louis Federal Reserve Economic Data (FRED). SOFR historical rate sourced from New York Federal Reserve, SOFR forward curve sourced from Chatham Financial.
9 Historical Treasury rates sourced from St. Louis Federal Reserve Economic Data (FRED). Forecast based on FOMC projections for the Fed Funds rate and Fundrise internal analysis of Treasury spread behavior from historical yield curve inversion events.
10 Source: U.S. Census Bureau, Population Division. Annual and Cumulative Estimates of Resident Population Change: July 1, 2021 to July 1, 2022 (NST-EST2022-CHG)