UNITED STATES
SECURITIES AND EXCHANGE COMMISSION
Washington, D.C. 20549
FORM 1-SA
SEMIANNUAL REPORT PURSUANT TO REGULATION A OF THE SECURITIES ACT OF 1933
For the Semiannual Period ended June 30, 2023
Rise Companies Corp.
(Exact name of issuer as specified in its charter)
| Delaware | 45-4862460 | |
| (State or other jurisdiction of incorporation or organization) | (I.R.S. Employer Identification No.) | |
| 11 Dupont Circle NW, 9th Floor Washington, DC (Full mailing address of principal executive offices) | 20036 (Zip Code) |
(202) 584-0550
Issuer’s telephone number, including area code
TABLE OF CONTENTS
| MANAGEMENT’S DISCUSSION AND ANALYSIS OF FINANCIAL CONDITION AND RESULTS OF OPERATIONS | 3 |
| OTHER INFORMATION | 19 |
| INDEX TO CONSOLIDATED FINANCIAL STATEMENTS OF RISE COMPANIES CORP. (UNAUDITED) | 20 |
| EXHIBITS | 21 |
2
Item 1: Management’s Discussion and Analysis of Financial Condition and Results of Operations
The following discussion of our financial condition and results of operations should be read in conjunction with our consolidated financial statements and the related notes thereto contained in this Semiannual Report on Form 1-SA. The following discussion contains forward-looking statements that reflect our plans, estimates, and beliefs. Our actual results could differ materially from those discussed in the Statements Regarding Forward Looking Information contained in our latest offering circular (the “Offering Circular”) qualified by the Securities and Exchange Commission (“SEC”) on February 13, 2023 as part of the latest post-qualification amendment to our latest offering statement, which may be accessed here. Except as otherwise required by the U.S. federal securities laws, we disclaim any obligations or undertaking to publicly release any updates or revisions to any forward-looking statement to reflect any change in our expectations with regard thereto or any change in events, conditions or circumstances on which any such statement is based.
Unless otherwise indicated, the latest results discussed below are as of June 30, 2023. The consolidated financial statements included in this filing as of June 30, 2023 and for the six months ended June 30, 2023 and 2022 are unaudited and have not been reviewed, and may not include year-end adjustments necessary to make those financial statements comparable to audited results, although in the opinion of management all necessary adjustments have been included to make interim statements of operations not misleading.
Business
Rise Companies Corp. (“Rise”, “Rise Companies”, “we”, “our”, the “Company” and “us”), together with its affiliate organizations (“Fundrise”), combines modern financial technology and what we believe is best-in-breed investment management to build the next generation of alternative asset management infrastructure. We generate revenue from fees related to a portfolio of approximately $6.5 billion of real estate and technology assets. Our technology platform has allowed us to build a differentiated business with a significant competitive advantage, including approximately 409,000 investors, 2 million users, and what we believe is cutting-edge software infrastructure.
In the pursuit of our mission to democratize investing in private markets, we believe we are now the largest direct-to-investor alternative asset manager in America. With nearly 300 employees, our aim is to build and own the future of private markets.
Technology inevitably disrupts every industry. We’ve seen it over and over again — in commerce, media, advertising, computing, communication, and even work itself. Today, there remain only a few great bastions still resisting this revolution — airlines, automobiles, energy, real estate, and capital formation to name a few. These industries, we believe, have been more resistant to current technology because, as companies like Tesla have shown, they are more capital intensive and therefore require enormous outlays of risk capital to achieve the scale necessary to deliver a truly disruptive product.
From the beginning, the mission of Fundrise has been to build a better financial system — one that we are designing to work on behalf of individuals rather than at their expense. However, the financial system itself is enormous and far too large for us to try to improve all at once. It is complex, full of arcane regulation, and has hardly changed over the past century.
We believe the public markets are where the vast majority of individuals invest and, not coincidentally, where there has been a significant amount of technology penetration and disruption. The raucous trading pit has been replaced by silent machines. The internet and apps drove the cost to trade stocks down to zero. Public company data has never been so transparent and readily available. The promise of an efficient market is truer than ever.
On the other hand, we believe our private markets still resemble the public markets of more than a half century ago. Transactions are performed manually by salespeople. Data is opaque and fragmented. Access is fundamentally barred to individuals. Sophisticated investors capture excess alpha from highly inefficient markets.
In short, we believe the private financial markets have managed to escape true disruption to-date and are ripe for reinvention. So, we first focused on giving our investors access to the real economy by redefining the process of investing in real estate. As of December 31, 2022, based on data from recent PERE rankings, Fundrise (through our Fundrise Investment Products, (as defined below within Other Details, Corporate Structure)) is one of the 50 largest real estate private equity investors in the world by total annual fundraising and total annual deployment, both raising and deploying more than $2 billion of capital over the last two years, 2021 and 2022. This year, we expanded our scope into growth equity, giving investors the chance to build a portfolio of companies that may become tomorrow’s technology giants by investing in high growth, mid-to-late stage private technology companies in sectors like modern data infrastructure, fintech, and artificial intelligence and machine learning. We have spent over ten years building a technology platform (the “Fundrise Platform”) that disrupts those asset classes, democratizing and reimagining private markets altogether.
3
Rise Timeline of Innovation and Growth

4
Where we started
We believe the financial system, at its most basic level, is made up of three component parts to the value chain: 1) distribution, 2) investment (or selection), and 3) production (or operation). And while the glory may lie in investment or selection, we believe the power is actually in the distribution and production.

We started by rebuilding the distribution phase because, at the time, we believed it was the most ripe for disruption. The internet had created a new channel by which to communicate and interact with customers, and through our app and web platform, we unlocked direct private non-traded real estate investment as an asset class that had previously been unavailable for most individual investors. We then paired this customer interface with our own backend infrastructure, leveraging software to drive down the marginal cost of investment to nearly zero. As a result, we were able to bring the minimum investment down from the traditional hundreds of thousands to only $10, and for the first time (in our opinion) truly democratize access to the private real estate market.
This process of opening up private markets to individuals is, on its own, a big business.
We believe distribution (aka fundraising) is power, because ultimately he or she who writes the checks makes the decisions. And unlike most investment managers who distribute their investments through an army of salespeople, we at Fundrise have formed direct relationships with hundreds of thousands of individuals.
And “hundreds of thousands” is just a start. We believe there are tens of millions of investors who will need access to private markets over the next several years and decades. By freeing control of the capital from traditional institutions, we have been able to build a new system without institutional encumbrance from the resistance to change by those who fear career risk.
However, as we’ve said, the mission of Fundrise — and its true, deeper potential — lies in disrupting not only one step of the chain but the entire financial system itself.
Where we are going
We are systematically replacing each step with software. Over time, we have built a new set of rails for the private investment industry.
To paraphrase the saying, how does software eat finance? One byte at a time.
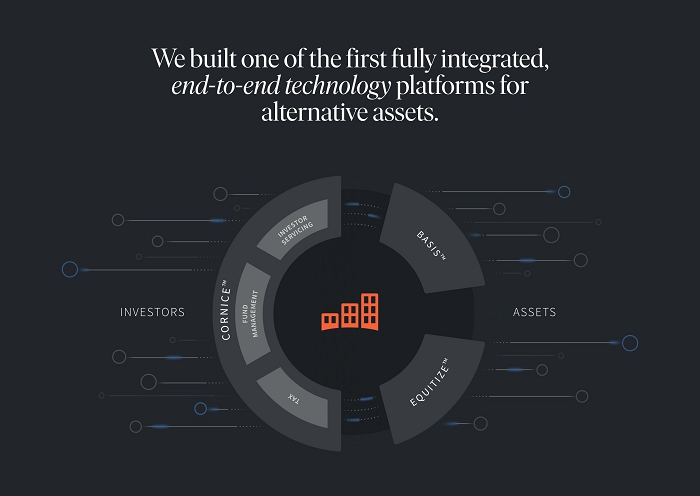
Over the past several years, our energy and attention has increasingly expanded to redesigning and rebuilding both the investment/selection and production/operation components of the value chain. And while we still have a lot left to do, we have at this point created (to our knowledge) the first truly end-to-end software platform connecting the dollars entrusted to us by our investors directly to the assets we are investing in and operating on their behalf.
And while we believe the benefits, both existing and future, are numerous, two simple measures of the value of our system come in the form of (i) greater overall efficiency (or reduced costs) as a result of vertical integration and lower overall fees; and (ii) alignment of the decisions made at each step of the chain, back up to what we perceive is in the best interest of investors in our Fundrise Investment Products.
Over the years, we have come to believe that we are building a much different company than most in the financial industry appreciate (something we think is a good thing). We believe this is probably because most fintech companies to date have been more hype than substance, essentially acting as shiny digital wrappers of the same underlying systems and products.
5
Where we stand today
When an individual invests through the Fundrise Platform, they are investing into private market assets previously outside the reach of the everyday individuals. This is, of course, as opposed to the public markets (such as publicly traded stocks, ETFs, etc.). Increasingly, companies are not entering the public markets until later and later, if at all. The lifecycle of growth companies and assets is increasingly occurring in private markets. See this example(1).
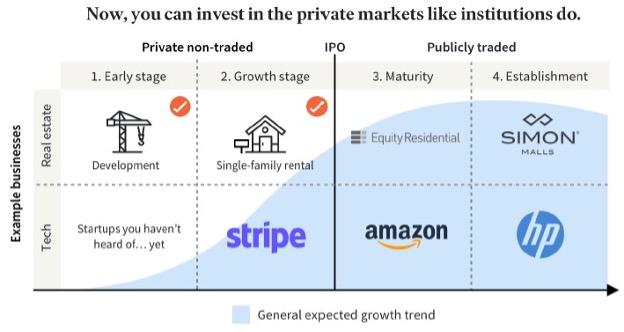
(1) The above general expected growth trend is only to illustrate the general expectations of institutional investors when making their investment analyses and does not reflect actual or expected growth of investments made with our Fundrise Investment Products. All company names, logos and brands are property of their respective owners. All company, product and service names and logos used in this document are general examples used for informational purposes only. Use of these names, logos and brands does not imply endorsement.
And much like trying to invest in Snowflake, Google, or Uber before they went public, access to private market (i.e. “early stage”) investments is restricted -- only available to those who go through a series of institutional channels controlled by intermediaries and gatekeepers, all of whom charge hefty tolls in the form of performance fees, sales commissions, and other transaction costs.
In fact, unless they happen to be old enough to have a pension, we believe most investors simply do not have any feasible way to access private markets and as a result are limited to investing exclusively in publicly traded stocks.
This matters because we believe that a more diversified portfolio generally results in a better risk-adjusted return. Moreover, when they invest in a company (or real estate asset) once it is in the public markets, investors are far more often than not paying a higher price, i.e., a premium, vs. those who have the ability to buy into the asset while it is still private.
This idea of both disrupting and reinventing the “private equity value chain” lies at the very heart of the Fundrise Platform. Our platform today covers the following aspects of the value chain:
| · | Distribution: Fundrise owns and operates the Fundrise Platform, a leading alternative asset investment platform, that: |
| o | allows individuals to invest in what we believe is both a superior and simpler investing experience, including: |
| § | frictionless investment transaction and management that is constantly evolving with the goal of becoming the most simple, transparent, and user-friendly experience in finance; | |
| § | ultra-low costs and zero upfront fees, eliminating high-fee broker-dealers and other expenses of the investment process usually involving many intermediaries; | |
| § | payment processing, including deep validation layers for anti-fraud, non-sufficient funds, and identity; we processed 3.7 million ACH transactions in 2022 and 2.1 million during the period ended June 30, 2023; |
6
| § | real-time reporting of return calculations performed daily for each client account via ETL software layer, currently storing over 36.6 billion data points; and |
| o | enables investors in our Fundrise Investment Products to earn returns from alternative asset classes that have generally been unavailable to many individual investors. |
| · | Selection: Fundrise has created an investment and fund management platform that leverages automated processes and reporting to reap the benefits of a lower cost structure of a back-of-house built with APIs and data stores rather than PDFs and Excel that allows for us to: |
| o | remove the double promote (where alternative fund sponsors receive a share of the profits in the distribution waterfall) common with alternative asset investments; | |
| o | systematize the back-of-house of accounting, tax, operations and fund operations, including software generating over a million 1099s and K-1s at minimal cost to the investor; and | |
| o | maintain 57 million unique shareholding records, including daily automated transfer agent integration. |
| · | Production: Fundrise has developed operating platforms that leverage software to lower the operating cost and improve the selection, management, and performance of investments by: |
| o | building “software-first” solutions to manage deal origination and investment data capture; and | |
| o | developing a systems-based approach to asset management and operations that systematically updates and replaces the data input and analysis with our proprietary software. |
Employees
As of the date of this filing, we had 294 employees (all of which were full-time employees), the majority of whom work remotely.
7
Legal Proceedings
As of the date of the consolidated financial statements, we are not currently named as a defendant in any active or pending material litigation. However, it is possible that the Company could become involved in various litigation matters arising in the ordinary course of our business. Although we are unable to predict with certainty the eventual outcome of any litigation, management is not aware of any litigation likely to occur that we currently assess as being significant to us.
We are encouraged by both the performance of the managed real estate assets held by our Fundrise Investment Products (as defined within the Other Details, Corporate Structure section) and by our own ability to navigate and continue to grow throughout the economic upheaval and public health crisis brought on by the COVID-19 pandemic, coupled with a period of heightened economic uncertainty due to inflation that is not transitory in nature, supply chain problems initially brought on by pandemic disruptions and exacerbated by the Russian invasion of Ukraine, and other factors.
We achieved a 30% growth in Fundrise Platform’s AUM for the eighteen months ended June 30, 2023. It has been our belief that as the broader demographic tailwinds create a new generation full of millions of new investors, the platform that was able to provide consistently strong performance with the best overall experience would be well-positioned to succeed. According to the Deloitte Center for Financial Services, the vast majority of new wealth creation in the United States will come from Generation X and Millennials, who will increase from approximately 28% in 2020 to 47% in 2030 of all wealth in the United States. We believe that Fundrise is well positioned to become the go-to platform for the rising generations to invest in the real estate industry and other alternative asset classes, and to leverage data and technology in its efforts to empower and center the individual as the key stakeholder in the financial services markets.
Since the start of 2022, we continued to build on our products and improve the overall platform, most notably:
| · | The Fundrise Investment Products generated consistently strong returns for investors relative to the broader stock market and publicly listed REITs. Based on our long-term focus and strategy, Fundrise delivered its strongest ever total performance in 2021, generating an average net return for investors in our Fundrise Investment Products of 22.99%. As the public markets faltered in 2022, the average net return for our Fundrise Investment Products’ investors for 2022 was approximately 1.50% and the Fundrise Investment Products achieved their best relative performance ever, beating the S&P 500 on an absolute basis by nearly 20%. As of June 30, 2023, despite headwinds brought on by further interest rate hikes, our income-focused funds continued to achieve an average net total return of 0.65%. | |
| · | We streamlined the Fundrise Investment Products’ investor experience by merging six of the Income eREITs into the new Income Interval Fund (defined below), which is our second real estate fund registered under the Investment Company Act (a “40 Act Fund”). As of June 30, 2023, $2.0 billion of our total $3.19 billion AUM in the Fundrise Investment Products, or approximately 62%, is in a 40 Act Fund. We believe this shift to the 40 Act Fund structure will benefit investors in our Fundrise Investment Products with increased efficiency and diversification due to their larger overall scale, which will allow raising and deploying into strong income return focused assets, with the aim of further driving down fund-level operating costs, ultimately resulting in stronger potential returns for such investors. |
| · | The Fundrise Investment Products secured additional credit facilities on their portfolio of real estate assets for a total committed value of $815 million with major financial institutions as of June 30, 2023 including Goldman Sachs Bank (NYSE: GS), The Hartford (HIG), Metlife (NYSE: MET), KeyBank (NYSE: KEY), Regions Financial Corp (NYSE: RF), Citizens Financial Group (NYSE: CFG), and US Bank (NYSE: USB). |
| · | We have built up the single-family rental home operating platform and portfolio held by certain of the Fundrise Investment Products to a total of more than $1.4 billion of real estate under management, consisting of approximately 4,500 homes across over 80 communities as of June 30, 2023. Our goal is to create a portfolio of homes that can achieve operating economies of scale, generating consistent income, while at the same time positioning the Fundrise Investment Products to capture what we believe will be outsized price appreciation thanks to the confluence of demographic factors driving demand for affordably-priced rental homes. |
| · | We completed the full deployment of our real estate operating platform where we took on the work from former third party vendors which allows us to use “software-first” solutions to manage deal origination and investment data capture and a systems-based approach to asset management and operations (the “Real Estate Operating Platform”). We believe this will better serve investors in our Fundrise Investment Products with lower, less complex, more transparent fees earned by fewer, incentive-aligned, scalable, and sustainable parties without the potential bias or associated marginal costs. Most importantly we are not charging carried interest or a promote (generally 20% of the profits in the distribution waterfall to be paid to other sponsors) in our Fundrise Investment Products that are open to everyday investors. We believe this aligns our incentives to create better outcomes for individuals as we don’t have a disproportionately large share in the upside (a consideration that often leads to short-term thinking and profit motivations). |
8
| · | In July 2022, we launched the Fundrise Innovation Fund (defined below), seeking to raise $1 billion for a first-of-its kind, perpetual growth equity fund aimed at democratizing access to investments in top private technology companies. |
June 30, 2023 year-to-date net returns of all client accounts by investment plan objective:
| Plan objective | Income | Balanced | Growth | Overall | ||||||||||||
| Dividends | 1.96 | % | 0.96 | % | 0.60 | % | 0.99 | % | ||||||||
| Appreciation | -1.30 | % | -1.86 | % | -2.12 | % | -1.87 | % | ||||||||
| Net Total Return(1) | 0.65 | % | -0.90 | % | -1.53 | % | -0.88 | % | ||||||||
| (1) | “Net Total Return” consists of the time-weighted, weighted-average aggregate returns of Fundrise Advisors client accounts that have participated in the indicated investment plan objective during the period indicated, calculated using the Modified Dietz method. Net total returns are inclusive of dividends and capital gains / losses, are net of fees, and include shares that were acquired via dividend reinvestment. “NAV distributions” (if any) are considered as part of the appreciation / price return component. Net total returns do not include investments in the Fundrise Opportunity Fund, Innovation Fund, and Credit Fund. |
As of June 30, 2023, we have yet to generate any profits from our operations and are incurring net losses, and do not expect to generate any profits while we continue to build the business and invest in big ideas and new innovation.
Outlook and Recent Trends
Our optimism about the Company, our continued evolution, and our future success in executing on our mission is rooted in over a decade-long history of innovative ideas, exceptional engineering talent, patience for and focus on long-term growth rather than short-term results, and a commitment to the mission and our customer, the individual. Our annual growth throughout the past three years since the beginning of the COVID-19 pandemic is an achievement we are incredibly proud of and exemplifies an underlying concept we’ve been passionate about at Rise since the beginning: non-linear growth. It is a common misconception that the growth of companies, when observed over long periods of time, is – or even should be – clear and steady. In actuality, we believe nearly all massively successful businesses in today’s environment have experienced punctuated periods of non-linear growth unlocked through true product or market innovations. This phenomenon has certainly held true in Rise’s over ten-year history, as we have always seen a small number of critical initiatives lead to outsized growth that has allowed us to reach milestones that seemed previously unattainable.
It’s important to remember that while Rise is a technology company focused on finance, our performance reflects aspects of investment management, real estate and alternative asset management, and software as a service businesses. As a result, our performance and potential are not fully captured by metrics used by the companies operating in those industries today, given the generally outdated approach taken by businesses in those industries. We believe that, as our business scales, while our growth may increase in absolute terms, our individual performance metrics on a standalone basis may not reflect our total performance or may require looking at new metrics that reflect the evolution of our business model. In short, we believe the metrics that matter the most to us in operating our business and creating new value for our customers, and therefore in creating an effective measurement of our success, will continue to evolve. Accordingly, it may be insufficient to rely solely on any single performance metric as a measurement of our success.
The Metrics That Matter
In our business today, the metrics that drive our success and direct our attention are those that most effectively describe our geometric growth. Of course, revenue and expense on a gross basis as well as by category are key; the mass adoption of our technology platform and the performance of our advised investment vehicles is also clearly relevant. You can see those metrics within our “Results of the Business” and “Results of Operations” sections herein. And while we are proud of the current year growth reflected by those metrics, we have always been and will continue to be focused on the long-term. We believe we are at the beginning of a multi-decade paradigm shift across many macroeconomic trends (the automation of investment management, the wealth accumulation of the millennial generation, increasing allocation to investment alternatives outside of stocks and bonds, and from pensions to self-managed investments) and feel poised to ride an expected tidal wave of change for years to come. We are constantly evaluating our current products and the competitive landscape to ensure we position ourselves in front of that change as opposed to chasing it.
The signal has become clear enough that many in the private investment industry are now starting to pitch the idea(s) of “perpetual capital” and access for retail investors. But the problem is that that is only part of the solution. We believe they’re missing the software-driven flywheel necessary to successfully re-orient their business. You can’t execute the strategy of tomorrow with yesterday’s way of doing business.
9
For example, the way many asset managers talk about the key growth metric of “perpetual” capital (to describe a portion of their investment vehicles that are not constituted of time bound commitments of capital) is directionally accurate but lacks context for significant differences in the underlying distribution model, and therefore growth potential. Clearly, the market recognizes that recurring fee, perpetual capital vehicles for retail investors are more valuable than vintage, term-defined funds made up of institutional, bespoke-needs capital. We agree on “the what.” However, we believe the fundamental key to growth is in “the how” - and that the old school, manual, and intermediated distribution is inferior to an integrated technology platform, and that despite the industry’s pivot towards the right type of capital, they will not dominate the next paradigm of the industry because they are not built to be technology companies. They have held on too tightly and for too long to yesterday’s model – trapped by a classic “Innovator’s Dilemma”. To be sure, some of our competitors may pivot in time, or have the resources to acquire a machine that will allow them to compete, but we believe that the paradigm shifts we’ve discussed make it certain that as the next generation comes of age the majority of market share currently held by old line asset managers is up for grabs and, with our technology and substantial lead, we expect can be ours for the taking.
The combination of macro trends referenced above, our company specific strategies, and where we are in our growth trajectory means that the metrics we track and emphasize within our business will evolve as we grow and the macro trends unfold. The majority of our growth today comes from existing customers increasing their investment size as their investable assets grow and we prove our ability to deliver attractive, uncorrelated returns. With a young investor base and perpetual capital, we believe we have decades to grow with our customers. With this multi-decade opportunity in mind, we focus on optimizing our profit potential over a long-term investor relationship as opposed to a more transactional approach. And so, with respect to metrics not demonstrated by financial results, the portion of our customers who are committed to our product offerings through a direct relationship with us over a long-term basis is the result we are focused on maintaining and continually improving.
Our success today is most accurately managed, and therefore measured, by metrics that relate to our customer level economics and broader strategic differentiation. Some of these metrics include the percentage of our assets under management (“AUM”) that is perpetual, the percentage of our account-holding users with whom we have a direct relationship (i.e. not through an intermediary such as a third party investment adviser), and the percentage of our active users with whom we have a recurring monthly investment, among other time-tried technology business metrics such as active investors in our Fundrise Investment Products, new investor growth in our Fundrise Investment Products, AUM growth from existing investors in our Fundrise Investment Products, and retention at both the Investment Product investor and AUM level. As our business matures, our success will continue to be measured by these metrics, in addition to a heavier weighting towards more traditional, enterprise-level metrics like growth in top line revenue, gross margin expansion, EBITDA, free cash flow, and operating leverage.
Looking back over the last few years - from the COVID-19 pandemic, to the non-transitory inflationary period, to pandemic instigated and war-related global supply chain problems - we believe the combination of the right assets (multifamily residential, single-family rental, and last-mile industrial), owned at reasonable basis (often at or below replacement cost), in the right markets (currently primarily in the Sunbelt), and at relatively conservative leverage (generally less than 50% LTV at a portfolio level) all work together to create what we believe is a remarkably stable foundation (or fortress) able to weather a potentially severe economic storm.
While success is never guaranteed, we believe we continue to be on track to build a world class data and technology-enabled alternative asset investment platform.
10
For the six months ended June 30, 2023 and 2022, our results of operations are as follows:
| Results | 2023 (in thousands) | 2022 (in thousands) | % Change (from 2022) | Explanation |
| Operating Revenue | ||||
| Investment management and platform advisory, net | $15,709 | $12,862 | 22% | As our fee structure remained unchanged, the increase was driven by growth in AUM on the Fundrise Platform between the two periods. The increase was bolstered by platform advisory fees growing period-over-period due to continued investor growth. |
| Real estate portfolio strategy | 4,291 | 12,984 | -67% | The decrease in transactional-based real estate portfolio revenues period-over-period is driven by our strategic decision to hold more cash in response to the market slowdown which has continued throughout the first half of the year relative to the market in the comparative period, resulting in originating fewer deals and closing fewer financings. |
| Real estate operating platform | 9,892 | 4,432 | 123% | This increase is driven by growth in AUM of our affiliates for which we provide real estate asset management services as well as additional development fee revenues collected from our affiliates. Refer to Note 2, Summary of Significant Accounting Policies – Real Estate Revenues for more details. |
| Other operating income | 696 | 1,701 | -59% | The decrease was primarily due to higher expense recoupments in the prior year related to waived expenses of the Flagship Fund and Income Real Estate Fund (defined below) pursuant to certain expense limitation agreements for the recently launched funds in the prior year. |
| Total operating revenue | $30,588 | $31,979 | -4% | |
11
| Operating Expenses | ||||
| Investment management and platform advisory | Investment management and platform advisory expenses consist of salaries and benefits for teams responsible for investor relations and operations (“investor servicing”) for the Fundrise Investment Products.
Certain allocated salaries and benefits in the prior year Consolidated Financial Statements were reclassified from General, administrative and other to Investment management and platform advisory to conform to current year presentation. Refer to Note 2, Summary of Significant Accounting Policies – Basis of Presentation for more details. | |||
| $3,190 | $2,797 | 14% | The increase was driven by an increase in headcount in our investor servicing teams between the two periods. | |
| Real estate strategy and operations | Real estate strategy and operations expenses consist of costs attributable to activities that most directly relate to the acquisition, origination, and operations of real estate investments for real estate operators that are borrowers from, or joint-venture partners with, the Fundrise Investment Products, in addition to the allocated salaries and benefits expense of our real estate team.
Certain allocated salaries and benefits in the prior year Consolidated Financial Statements were reclassified from General, administrative and other to Real estate strategy and operations to conform to current year presentation. Refer to Note 2, Summary of Significant Accounting Policies – Basis of Presentation for more details. | |||
| $6,699 | $5,601 | 20% | The increase was driven by an increase in headcount in our real estate team between the two periods. | |
| Technology and product development | Technology and product development expenses consist primarily of salaries and benefits for teams responsible for software engineering, product management, and technology activities; and amortization of internally developed software. These teams work on the development and maintenance of the software and technology assets of the Fundrise Platform, including CorniceTM, BasisTM, and EquitizeTM. Technology and product development is expensed as incurred, except for development and testing costs related to internally developed software that are capitalized and subsequently amortized over the expected useful life.
Certain allocated salaries and benefits as well as amortization of internally developed software in the prior year Consolidated Financial Statements were reclassified from General, administrative and other to Technology and product development to conform to current year presentation. Refer to Note 2, Summary of Significant Accounting Policies – Basis of Presentation for more details. | |||
| $10,429 | $8,520 | 22% | The increase was driven by an increase in headcount in our software engineering and product management teams and an increase in amortization expense of internal use software between the two periods.
We capitalized approximately $7,226,000 and $5,222,000 for the six months ended June 30, 2023 and 2022, respectively, in software development costs. | |
| Marketing | Marketing expenses consist primarily of the costs associated with engaging and enrolling investors in the Sponsored Programs, including costs attributable to marketing and selling our products. This includes costs of building general brand awareness, and salaries and benefits expenses related to our marketing and design teams.
Certain allocated salaries and benefits in the prior year Consolidated Financial Statements were reclassified from General, administrative and other to Marketing to conform to current year presentation. Refer to Note 2, Summary of Significant Accounting Policies – Basis of Presentation for more details. | |||
| $7,137 | $24,372 | -71% | The decrease was due to a planned pull-back of our marketing spend due to the current economy. | |
12
| General, administrative and other | General, administrative and other expenses consist primarily of software and office expenses, professional fees, and other expenses, which primarily consists of salaries and benefits for our corporate functions (including finance, legal, human resources and IT operations teams), write offs, and other miscellaneous expenses.
Certain allocated salaries and benefits in the prior year Consolidated Financial Statements were reclassified from General, administrative and other to Marketing, Real estate strategy and operations, Technology and product development, and Investment management and platform advisory to conform to current year presentation. In addition, certain allocated salaries and benefits in the prior year Consolidated Financial Statements were reclassified from Technology and product development to General, administrative and other to conform to current year presentation. Refer to Note 2, Summary of Significant Accounting Policies – Basis of Presentation for more details. | |||
| Software and other office expenses | $2,339 | $2,266 | 3% | Software and other office expenses remained consistent period-over-period and are comprised of mainly of software subscription expenses used to maintain and improve operations. |
| Professional fees | 979 | 2,820 | -65% | The decrease was due to a planned pull-back of our spending due to the current economy, particularly in regards to recruiting expenses. Additionally, advisory costs related to regulatory matters decreased in the current period, as certain advisory projects neared conclusion. |
| Other general and administrative | 4,262 | 7,505 | -43% | The decrease was primarily due to a reduction in administrative costs of the Income Interval Fund and Innovation Fund prior to launch incurred in the prior year, as well as a planned pull-back of other discretionary spend. |
| Total operating expenses | $35,035 | $53,881 | -35% | |
13
Key Factors Impacting Our Current Year Performance
Our historical growth rates in facilitating investments through the Fundrise Platform reflect a deliberate strategy that has allowed us to build and develop the various enterprise functions needed to meet the changing demands of our customers and to support our scale, including operations, risk controls, customer support, compliance and technology. Demand from real estate operators, investors, and the modern financial industry will continue to inform our business and investment product decisions, but we have so far failed to see value for investors in our Fundrise Investment Products in compromising our long-term focus to pursue short-term measures that we believe would result in investment performance below our standards. Given this approach and the dynamic path of our experienced and expected future growth, we have focused this year on a number of important developments within our business that we believe reflect the key factors impacting our performance in 2023. Refer to the Key Factors We Expect to Impact Our Future Performance section below for a description of these key factors.
Key Factors We Expect to Impact Our Future Performance
Investment in Long-Term Growth
The core elements of our growth strategy include enrolling new investors in our Fundrise Investment Products, broadening our investment acquisition capabilities, enhancing our technology infrastructure, expanding our product and feature offerings, and extending customer lifetime value. We plan to continue to invest resources needed to accomplish these goals, and we anticipate that certain operating expenses will continue to increase for the foreseeable future, particularly our technology and product development, and real estate strategy and operations expenses. These investments are intended to contribute to our long-term growth, but they may continue to affect our near-term profitability.
Sources of Capital – Fundrise Investment Products
Investors in our Fundrise Investment Products provide the equity capital into the Fundrise Investment Products through the use of the Fundrise Platform. Our model is built specifically to leverage the economies of scale created by the internet to cut fees, while also lowering execution costs and reducing both time and manual resources. Our end-to-end integrated platform transforms the real estate origination, underwriting, operations, investment processing, and servicing, replacing expensive sales and management teams with online applications, implementing data driven decision making, and automating transactions through payment processing and APIs (application programming interfaces).
Sources of Operating Revenues and Cash Flows
We generate revenues from investment management and platform advisory fees, real estate portfolio strategy fees, and real estate operating platform fees. See Note 2, Summary of Significant Accounting Policies - Revenue Recognition in the financial statements for further detail.
Liquidity and Capital Resources
We have incurred operating losses since our inception and have an accumulated deficit of $159.7 million as of June 30, 2023. We have financed our operations primarily through the issuance of equity securities. Our ability to achieve profitability depends on our ability to generate revenue growth in existing product lines, successfully launch new product lines and manage costs. We may continue to incur substantial operating losses while we continue to build the business and invest in new innovation.
As of June 30, 2023 and December 31, 2022, we had $21.8 million and $29.7 million in cash and cash equivalents, respectively. We anticipate that our cash and cash equivalents as of June 30, 2023, and forecasted revenue, will provide sufficient liquidity for more than a twelve-month period from the date of filing these financial statements. The actual amount of cash that we will need to operate is subject to many factors, including, but not limited to our product development and engineering efforts. We are dependent upon significant future financing, including through our Offering described below under Offering Results, to provide the cash necessary to execute our ongoing and future operations, including the continued development of our products.
As of June 30, 2023, and December 31, 2022, our material commitments for capital expenditures consisted of operating leases, as discussed in Note 5, Leases in the Notes to the Consolidated Financial Statements..
In addition, as of December 31, 2022, the Company had a future commitment of approximately $12,069,000 related to a construction mezzanine debt deal with no up front funding from us, as a result of Rise Companies fully consolidating the Fundrise Opportunistic Credit Fund, LLC (“Credit Fund”). Upon the launch of the Credit Fund on February 28, 2023, the fund was deconsolidated and no commitments existed related to the deal.
14
Fundrise LP – Sidecar Investment Fund
As part of the 2014 Series A Preferred financing round, we raised a $10 million sidecar private fund called Fundrise LP, which was formed to support assets originated and facilitated by the Fundrise Platform and to support our overall growth. See Note 14, Non-Controlling Interests in Consolidated Entities for further detail.
Corporate Debt
As of June 30, 2023 and December 31, 2022, we had corporate debt payable of approximately $2.7 million. In April 2020, we entered into a loan agreement with Citizens Bank as the lender (the “Lender”), pursuant to which the Lender provided a loan (the “PPP Loan”) under the Paycheck Protection Program offered by the U.S. Small Business Administration (the “SBA”) in the principal amount of $2,793,800 pursuant to Title 1 of the Coronavirus Aid, Relief and Economic Security Act (the “CARES Act”). We received the full loan amount on April 27, 2020.
As explained more fully in Note 9, Loans Payable – PPP Loans Payable, according to the terms of the Paycheck Protection Program, the subsequent passing of the Paycheck Protection Program Flexibility Act (the “PPPFA Act”), and current guidance from the SBA and U.S. Department of Treasury, all or a portion of loans under the program may be forgiven if certain conditions are met. In July 2021 we applied for such forgiveness. The PPP Loan’s initial maturity date was April 19, 2022 and was subsequently extended to April 19, 2025. As of September 18, 2023, the Company’s PPP loan forgiveness application is currently under review by the SBA. A timeline for SBA’s continued review has not yet been set; accordingly, the Company is uncertain as to when SBA will complete its review, or when SBA will render a final agency decision regarding the timing, amount, and determination of forgiveness.
Other Details
Risk Factors
We face risks and uncertainties that could affect us and our business as well as the real estate industry generally. These risks are outlined under the heading “Risk Factors” contained in our latest Offering Circular filed with the SEC on February 14, 2023, which may be accessed here, as the same may be updated from time to time by our future filings under Regulation A. In addition, new risks may emerge at any time and we cannot predict such risks or estimate the extent to which they may affect our financial performance. These risks could result in a decrease in the value of our common shares.
15
As of June 30, 2023, we are offering up to $75.0 million in shares of our Class B Common Stock in any rolling twelve-month period under Regulation A (the “Offering”). The Offering is being conducted as a continuous offering pursuant to Rule 251(d)(3) of Regulation A, meaning that while the offering of securities is continuous, active sales of securities may occur sporadically over the term of the Offering. As of June 30, 2023 and December 31, 2022, we had raised total gross offering proceeds of approximately $183.5 million and $169.5 million, respectively, from settled subscriptions.
As of June 30, 2023, we sold 19,575,595 shares of our Class B Common Stock at varying prices as set forth below. This does not include 635,555 shares of Class B Common Stock that were sold in a private placement pursuant to Rule 506(c) of Regulation D.
Offering Results
| Effective Date of Price per Share | Price Per Share | Number of Class B Common Shares Sold | Offering Proceeds | |||||||||
| January 31, 2017 | $ | 5.00 | 2,884,129 | $ | 14,420,645 | |||||||
| July 28, 2017 | 5.50 | 699,880 | 3,849,340 | |||||||||
| January 27, 2018 | 6.00 | 649,781 | 3,898,686 | |||||||||
| May 22, 2018 | 6.30 | 240,589 | 1,515,711 | |||||||||
| July 23, 2018 | 6.60 | 522,878 | 3,450,995 | |||||||||
| October 19, 2018 | 6.90 | 814,870 | 5,622,603 | |||||||||
| January 31, 2019 | 7.30 | 1,073,630 | 7,837,499 | |||||||||
| May 3, 2019 | 7.67 | 457,748 | 3,510,927 | |||||||||
| July 26, 2019 | 8.05 | 1,029,649 | 8,288,674 | |||||||||
| October 18, 2019 | 8.45 | 840,831 | 7,105,022 | |||||||||
| January 21, 2020 | 8.87 | 814,948 | 7,228,589 | |||||||||
| July 17, 2020 | 9.09 | 1,738,062 | 15,798,984 | |||||||||
| February 17, 2021 | 9.54 | 1,557,297 | 14,856,613 | |||||||||
| April 28, 2021 | 10.90 | 492,080 | 5,363,672 | |||||||||
| August 16, 2021 | 11.44 | 1,002,310 | 11,466,426 | |||||||||
| January 24, 2022 | 13.08 | 1,495,850 | 19,565,718 | |||||||||
| March 7, 2022 | 15.00 | 1,167,935 | 17,519,025 | |||||||||
| June 3, 2022 | 15.15 | 1,458,226 | 22,092,124 | |||||||||
| May 3, 2023 | 15.90 | 634,902 | 10,094,942 | |||||||||
| Totals | — | 19,575,595 | $ | 183,486,195 | ||||||||
Shares are currently offered and are sold on a continuous basis only to existing investors in the Sponsored Programs. The funds received from the issuance of our Class B Common Stock are a primary source of capital for our operating expenditures.
Off-Balance Sheet Arrangements
As of June 30, 2023 and December 31, 2022, we had no off-balance sheet arrangements.
Related Party Arrangements
For further information regarding “Related Party Arrangements,” please see Note 15, Related Party Transactions, in our financial statements.
16
Critical Accounting Policies
Our accounting policies have been established to conform with U.S. GAAP. The preparation of financial statements in conformity with U.S. GAAP requires us to use judgment in the application of accounting policies, including making estimates and assumptions. These judgments affect the reported amounts of assets and liabilities and disclosure of contingent assets and liabilities at the dates of the financial statements and the reported amounts of revenue and expenses during the reporting periods. Management believes that we have made these estimates and assumptions in an appropriate manner and in a way that accurately reflects our financial condition. We continually test and evaluate these estimates and assumptions using our historical knowledge of the business, as well as other factors, to ensure that they are reasonable for reporting purposes. However, actual results may differ from these estimates and assumptions. If our judgment or interpretation of the facts and circumstances relating to various transactions had been different, it is possible that different accounting policies would have been applied, thus resulting in a different presentation of the financial statements.
We believe the following accounting estimate is the most critical to aid in fully understanding our reported financial results, and it requires our most difficult, subjective or complex judgments, resulting from the need to make estimates about the effect of matters that are inherently uncertain.
Intangible Assets – Internal-Use Software
Internal-use software is capitalized into an intangible asset when preliminary development efforts are successfully completed; it is probable that the project will be completed; and that the software will be used as intended. Capitalized costs for internal-use software primarily consist of payroll-related costs for employees who are directly involved in the development efforts of a specific piece or pieces of software. Costs related to preliminary project activities and post implementation activities, including training and maintenance, are expensed as incurred. Costs incurred for upgrades and enhancements that are considered to be probable to result in additional functionality are capitalized. Capitalized costs of platform and other software applications are included in intangible assets. These costs are amortized over the estimated useful life of the software, generally four years, on a straight-line basis.
Recent Accounting Pronouncements
The Financial Accounting Standards Board has released several Accounting Standards Updates (“ASUs”) that may have an impact on our financial statements. See Note 2, Summary of Significant Accounting Policies – Recent Accounting Pronouncements, in our consolidated financial statements for discussion of the relevant ASUs.
Extended Transition Period
Under Section 107 of the Jumpstart Our Business Startups Act of 2012, we are permitted to use the extended transition period provided in Section 7(a)(2)(B) of the Securities Act for complying with new or revised accounting standards. This permits us to delay the adoption of certain accounting standards until those standards would otherwise apply to private companies. We have elected to use the extended transition period provided in Section 7(a)(2)(B) of the Securities Act for complying with new or revised accounting standards that have different effective dates for public and private companies until the earlier of the date that we (i) are no longer an emerging growth company or (ii) affirmatively and irrevocably opt out of the extended transition period provided in Section 7(a)(2)(B). By electing to extend the transition period for complying with new or revised accounting standards, these consolidated financial statements may not be comparable to companies that adopt accounting standard updates upon the public business entity effective dates.
We operate through the following significant consolidated subsidiaries, with the following activities:
| · | Fundrise, LLC (“Fundrise, LLC”), a wholly-owned subsidiary of Rise Companies, owns and operates the Fundrise Platform that allows investors in our Sponsored Programs to become equity or debt holders in alternative investment opportunities. |
| · | Fundrise Advisors, LLC (“Fundrise Advisors”), a wholly-owned subsidiary of Rise Companies, is a registered investment adviser with the SEC that acts as the non-member manager for the investment funds sponsored by the Company and offered for investment via the Fundrise Platform. |
��
| · | Fundrise, L.P. (“Fundrise LP”), is an affiliate of Rise Companies and was created with the intent to directly benefit the Company by driving its growth and profitability. Rise Companies owns approximately 2% of Fundrise LP and has the ability to direct its assets. |
17
| · | Fundrise Real Estate, LLC, a wholly-owned subsidiary of Rise Companies, is a real estate operating platform through which all of the vertically integrated real estate assets of our Sponsored Programs are managed. |
| · | Certain unlaunched investment programs that, as of June 30, 2023, are not yet being offered to investors. |
The Company has sponsored the following investment programs as of June 30, 2023:
| · | Fundrise Equity REIT, LLC, Fundrise West Coast Opportunistic REIT, LLC, Fundrise East Coast Opportunistic REIT, LLC, Fundrise Midland Opportunistic REIT, LLC, Fundrise Growth eREIT II, LLC, Fundrise Growth eREIT III, LLC, Fundrise Development eREIT, LLC, Fundrise Growth eREIT VII, LLC, and Fundrise Balanced eREIT II, LLC are real estate investment trust programs (the “eREITs”). The Company previously sponsored eight other eREITs: Fundrise Growth eREIT VI, LLC and Fundrise Balanced eREIT, LLC, which merged into Fundrise Growth eREIT II, LLC and Fundrise Equity REIT, LLC, respectively, on September 1, 2022; and Fundrise Real Estate Investment Trust, LLC, Fundrise Income eREIT II, LLC, Fundrise Income eREIT III, LLC, Fundrise Income eREIT 2019, LLC, Fundrise eREIT XIV, LLC, and Fundrise Income eREIT V, LLC, which merged into Fundrise Income Real Estate Fund, LLC on March 31, 2022. |
| · | Fundrise eFund, LLC is a real estate investment fund program (the “eFund”). |
| · | Fundrise Real Estate Interval Fund, LLC (“Flagship Fund”) is a Delaware limited liability company that is registered under the Investment Company Act, as a non-diversified, closed-end management investment company that is operated as an interval fund. |
| · | Fundrise Income Real Estate Fund, LLC (the “Income Interval Fund”) is a Delaware limited liability company, newly organized during 2022, and formed by the merging of Fundrise Real Estate Investment Trust, LLC, Fundrise Income eREIT II, LLC, Fundrise Income eREIT III, LLC, Fundrise Income eREIT 2019, LLC, Fundrise eREIT XIV, LLC, and Fundrise Income eREIT V, LLC, that is registered under the Investment Company Act, as a non-diversified, closed-end management investment company that is operated as an interval fund. |
| · | Fundrise Growth Tech Fund, LLC (the “Innovation Fund”) is Delaware limited liability company, newly organized during 2022, that is registered under the Investment Company Act, as a non-diversified, closed-end management investment company that is operated as a tender offer fund. |
| · | Fundrise Opportunity Fund, LP and Fundrise Opportunity Zone OP, LLC (collectively referred to as the “Opportunity Fund” or the “oFund”), make up a tax-advantaged real estate investment fund program offered under Regulation D (“Regulation D”) of the Securities Act of 1933, as amended (the “Securities Act”). |
| · | Fundrise Opportunistic Credit Fund, LLC (the “Credit Fund”) is a Delaware limited liability company, newly organized during 2022, that is offered under Regulation D of the Securities Act. |
The eREITs, eFund, oFund, Credit Fund, Flagship Fund, Income Interval Fund and Innovation Fund are referred to, individually or collectively as the context requires, as the “Sponsored Programs” or “Fundrise Investment Products.”
Our office is located at 11 Dupont Circle NW, 9th Floor, Washington, D.C. 20036. Our telephone number is (202) 584-0550. Information regarding the Company is also available on our web site at www.fundrise.com.
Recent Developments
As of August 31, 2023, we have more than 409,000 active investor accounts and more than 2,055,000 active users on the Fundrise Platform, and more than $3.29 billion in AUM in the Sponsored Programs.
Refer to Note 17, Subsequent Events, for more details on recent developments.
18
None.
19
Item 3. Financial Statements
INDEX TO CONSOLIDATED FINANCIAL STATEMENTS OF RISE COMPANIES CORP. (UNAUDITED)
20
RISE COMPANIES CORP.
(Amounts in thousands, except share data)
June 30, (Unaudited) | December 31, (*) | |||||||
| ASSETS | ||||||||
| Current assets: | ||||||||
| Cash and cash equivalents | $ | 21,774 | $ | 29,764 | ||||
| Restricted cash | 314 | 61 | ||||||
| Due from affiliates | 6,781 | 7,132 | ||||||
| Note receivable from Sponsored Program | 9,000 | - | ||||||
| Other current assets, net | 2,885 | 4,035 | ||||||
| Total current assets | 40,754 | 40,992 | ||||||
| Investments in Sponsored Programs | 2,761 | 2,796 | ||||||
| Property and equipment, net | 1,706 | 1,854 | ||||||
| Intangible assets, net | 26,780 | 22,420 | ||||||
| Operating lease assets | 3,933 | 4,103 | ||||||
| Other assets | 2,889 | 1,529 | ||||||
| Total assets | $ | 78,823 | $ | 73,694 | ||||
| LIABILITIES | ||||||||
| Current liabilities: | ||||||||
| Accounts payable | $ | 1,285 | $ | 1,029 | ||||
| Accrued expenses | 3,366 | 6,937 | ||||||
| Due to stockholders | 757 | 378 | ||||||
| Operating lease liabilities, current | 986 | 974 | ||||||
| Other current liabilities | 431 | 251 | ||||||
| Total current liabilities | 6,825 | 9,569 | ||||||
| Loan payable, non-current | 2,690 | 2,690 | ||||||
| Operating lease liabilities, non-current | 5,104 | 5,384 | ||||||
| Other liabilities | 290 | 271 | ||||||
| Total liabilities | 14,909 | 17,914 | ||||||
| Commitments and contingencies (Note 16) | ||||||||
| STOCKHOLDERS’ EQUITY | ||||||||
| Series A convertible preferred stock, $0.0001 par value; 15,000,000 shares authorized; 11,865,046 shares issued and outstanding; with an aggregate liquidation preference of $25,951 | 1 | 1 | ||||||
| Class A common stock, $0.0001 par value; 43,000,000 shares authorized; 2,888,859 shares issued and 2,455,894 shares outstanding | - | - | ||||||
| Class B common stock, $0.0001 par value; 38,000,000 shares authorized; 20,211,150 shares issued and 19,531,688 outstanding, 19,322,411 shares issued and 18,758,938 outstanding, respectively | 2 | 2 | ||||||
| Class F common stock, $0.0001 par value; 10,000,000 shares authorized; 10,000,000 shares issued and 10,000,000 shares outstanding | 1 | 1 | ||||||
| Additional paid-in capital | 213,292 | 200,702 | ||||||
| Accumulated deficit | (159,709 | ) | (155,075 | ) | ||||
| Total stockholders’ equity before non-controlling interests | 53,587 | 45,631 | ||||||
| Non-controlling interests in consolidated entity | 10,327 | 10,149 | ||||||
| Total stockholders’ equity | 63,914 | 55,780 | ||||||
| Total liabilities and stockholders’ equity | $ | 78,823 | $ | 73,694 | ||||
| * | Derived from audited financial statements. |
The accompanying notes are an integral part of these consolidated financial statements.
F-1
RISE COMPANIES CORP.
Consolidated Statements of Operations
(Amounts in thousands, except share and per share data)
| Six Months Ended | Six Months Ended | |||||||
June 30, 2023 (Unaudited) | June 30, 2022 (Unaudited) | |||||||
| Operating revenue | ||||||||
| Investment management and platform advisory, net | $ | 15,709 | $ | 12,862 | ||||
| Real estate portfolio strategy | 4,291 | 12,984 | ||||||
| Real estate operating platform | 9,892 | 4,432 | ||||||
| Other operating income | 696 | 1,701 | ||||||
| Total operating revenue | 30,588 | 31,979 | ||||||
| Operating expenses | ||||||||
| Investment management and platform advisory | 3,190 | 2,797 | ||||||
| Real estate strategy and operations | 6,699 | 5,601 | ||||||
| Technology and product development | 10,429 | 8,520 | ||||||
| Marketing | 7,137 | 24,372 | ||||||
| General, administrative and other | 7,580 | 12,591 | ||||||
| Total operating expenses | 35,035 | 53,881 | ||||||
| Net operating (loss) income | (4,447 | ) | (21,902 | ) | ||||
| Other income (loss) | ||||||||
| Equity in earnings (losses) | 37 | 79 | ||||||
| 37 | 79 | |||||||
| Net (loss) income | (4,410 | ) | (21,823 | ) | ||||
| Net income attributable to non-controlling interests | 224 | 70 | ||||||
| Net (loss) income attributable to Rise Companies Corp. | $ | (4,634 | ) | $ | (21,893 | ) | ||
| Net (loss) earnings per share attributable to common stockholders: | ||||||||
| Basic and diluted earnings (loss) per share* | $ | (0.15 | ) | $ | (0.76 | ) | ||
| Weighted average shares of common stock - Basic and diluted | 31,430,025 | 28,783,317 | ||||||
* Basic and diluted earnings (loss) per share amounts pertain to each class of common stock.
The accompanying notes are an integral part of these consolidated financial statements.
In the opinion of management, all adjustments necessary in order to make the interim financial statements not misleading have been included.
F-2
RISE COMPANIES CORP.
Consolidated Statements of Changes in Stockholders’ Equity and Non-Controlling Interest
(Unaudited)
(Amounts in thousands, except share data)
| Preferred Stock Class A | Common Stock Class A | Common Stock Class F | Common Stock Class B | Additional Paid-In | Accumulated | Non- Controlling | Total | |||||||||||||||||||||||||||||||||||||||||
| Shares | Amount | Shares | Amount | Shares | Amount | Shares | Amount | Capital | Deficit | Interests | Equity | |||||||||||||||||||||||||||||||||||||
| Balance at December 31, 2022 | 11,865,046 | $ | 1 | 2,455,894 | $ | - | 10,000,000 | $ | 1 | 18,758,938 | $ | 2 | $ | 200,702 | $ | (155,075 | ) | $ | 10,149 | $ | 55,780 | |||||||||||||||||||||||||||
| Issuance of Class B Common Stock | - | - | - | - | - | - | 888,739 | - | 13,940 | - | - | 13,940 | ||||||||||||||||||||||||||||||||||||
| Redemption of Class B Common Stock | - | - | - | - | - | - | (115,989 | ) | - | (1,287 | ) | - | - | (1,287 | ) | |||||||||||||||||||||||||||||||||
| Offering costs for Class B Common Stock | - | - | - | - | - | - | - | - | (63 | ) | - | - | (63 | ) | ||||||||||||||||||||||||||||||||||
| Distribution of Member’s Equity of NCI | - | - | - | - | - | - | - | - | - | - | (46 | ) | (46 | ) | ||||||||||||||||||||||||||||||||||
| Net income (loss) | - | - | - | - | - | - | - | - | - | (4,634 | ) | 224 | (4,410 | ) | ||||||||||||||||||||||||||||||||||
| Balance at June 30, 2023 | 11,865,046 | $ | 1 | 2,455,894 | $ | - | 10,000,000 | $ | 1 | 19,531,688 | $ | 2 | $ | 213,292 | $ | (159,709 | ) | $ | 10,327 | $ | 63,914 | |||||||||||||||||||||||||||
| Preferred Stock Class A | Common Stock Class A | Common Stock Class F | Common Stock Class B | Additional Paid-In | Accumulated | Non- Controlling | Total | |||||||||||||||||||||||||||||||||||||||||
| Shares | Amount | Shares | Amount | Shares | Amount | Shares | Amount | Capital | Deficit | Interests | Equity | |||||||||||||||||||||||||||||||||||||
| Balance at December 31, 2021 | 11,865,046 | $ | 1 | 2,455,894 | $ | - | 10,000,000 | $ | 1 | 15,008,588 | $ | 1 | $ | 146,541 | $ | (114,457 | ) | $ | 10,031 | $ | 42,118 | |||||||||||||||||||||||||||
| Issuance of Class B Common Stock | - | - | - | - | - | - | 2,935,130 | - | 41,195 | - | - | 41,195 | ||||||||||||||||||||||||||||||||||||
| Redemption of Class B Common Stock | - | - | - | - | - | - | (51,339 | ) | - | (389 | ) | - | - | (389 | ) | |||||||||||||||||||||||||||||||||
| Offering costs for Class B Common Stock | - | - | - | - | - | - | - | - | (102 | ) | - | - | (102 | ) | ||||||||||||||||||||||||||||||||||
| Distribution of Member’s Equity of NCI | - | - | - | - | - | - | - | - | - | - | (132 | ) | (132 | ) | ||||||||||||||||||||||||||||||||||
| Net income (loss) | - | - | - | - | - | - | - | - | - | (21,893 | ) | 70 | (21,823 | ) | ||||||||||||||||||||||||||||||||||
| Balance at June 30, 2022 | 11,865,046 | $ | 1 | 2,455,894 | $ | - | 10,000,000 | $ | 1 | 17,892,379 | $ | 1 | $ | 187,245 | $ | (136,350 | ) | $ | 9,969 | $ | 60,867 | |||||||||||||||||||||||||||
The accompanying notes are an integral part of these consolidated financial statements.
F-3
RISE COMPANIES CORP.
Consolidated Statements of Cash Flows
(Amounts in thousands)
Six Months ended (Unaudited) | Six Months ended (Unaudited) | |||||||
| Cash flows from operating activities | ||||||||
| Net (loss) income | $ | (4,410 | ) | $ | (21,823 | ) | ||
| Adjustments to reconcile net (loss) income to net cash provided (used) by operating activities: | ||||||||
| Depreciation and amortization | 3,456 | 2,024 | ||||||
| (Earnings) from equity method investees | (37 | ) | (79 | ) | ||||
| Return on capital from Sponsored Programs | 158 | 69 | ||||||
| Impairment of intangible assets | 110 | 19 | ||||||
| Amortization of capitalized promotions | 287 | - | ||||||
| Change in assets and liabilities: | ||||||||
| Net (increase) decrease in other assets | (413 | ) | (1,905 | ) | ||||
| Net increase (decrease) in accounts payable and other liabilities | (3,215 | ) | 1,233 | |||||
| Net (increase) decrease in due from affiliates | 351 | (6,110 | ) | |||||
| Net (increase) decrease in interest receivable | (181 | ) | - | |||||
| Net cash (used in) provided by operating activities | (3,894 | ) | (26,572 | ) | ||||
| Cash flows from investing activities | ||||||||
| Additions to intangible assets | (7,744 | ) | (5,209 | ) | ||||
| Purchases of property and equipment | (34 | ) | (553 | ) | ||||
| Note receivable from Sponsored Program | (9,000 | ) | - | |||||
| Distributions of capital from Sponsored Programs | 17 | 12 | ||||||
| Investments in Sponsored Programs | (5 | ) | (100 | ) | ||||
| Net cash (used in) provided by investing activities | (16,766 | ) | (5,850 | ) | ||||
| Cash flows from financing activities | ||||||||
| Distribution of Member’s Equity of NCI | (46 | ) | (132 | ) | ||||
| Proceeds from the issuance of Class B Common Stock, net of offering costs | 13,877 | 41,093 | ||||||
| Redemptions of Class B Common Stock | (908 | ) | (436 | ) | ||||
| Loan payable | - | (104 | ) | |||||
| Proceeds from settling subscriptions | - | 2,091 | ||||||
| Net cash provided by (used in) financing activities | 12,923 | 42,512 | ||||||
| Net increase (decrease) in cash and cash equivalents | (7,737 | ) | 10,090 | |||||
| Cash, restricted cash and cash equivalents, beginning of period | 29,825 | 27,435 | ||||||
| Cash, restricted cash and cash equivalents, end of period | $ | 22,088 | $ | 37,525 | ||||
| Supplemental disclosures of non-cash activity: | ||||||||
| Redemptions payable | $ | 757 | $ | 243 | ||||
| Supplemental disclosures of cash flow information: | ||||||||
| Cash paid for interest | $ | - | $ | 53 | ||||
The accompanying notes are an integral part of these consolidated financial statements.
F-4
Rise Companies Corp.
Notes to Consolidated Financial Statements (unaudited)
| 1. | Formation and Organization |
Rise Companies Corp. (“Rise”, “Rise Companies”, “we”, “our”, the “Company”, and “us”) is a financial technology company, that owns and operates a leading web-based and mobile application direct investment platform, located at www.fundrise.com (the “Fundrise Platform”).
We operate through the following significant consolidated subsidiaries, with the following activities:
| · | Fundrise, LLC (“Fundrise, LLC”), a wholly-owned subsidiary of Rise Companies, owns and operates the Fundrise Platform that allows investors in our Sponsored Programs to become equity or debt holders in alternative investment opportunities. |
| · | Fundrise Advisors, LLC (“Fundrise Advisors”), a wholly-owned subsidiary of Rise Companies, is a registered investment adviser with the SEC that acts as the non-member manager for the investment funds sponsored by the Company and offered for investment via the Fundrise Platform. |
| · | Fundrise, L.P. (“Fundrise LP”), is an affiliate of Rise Companies and was created with the intent to directly benefit the Company by driving its growth and profitability. Rise Companies owns approximately 2% of Fundrise LP and has the ability to direct its assets. |
| · | Fundrise Real Estate, LLC (“Fundrise Real Estate”), a wholly-owned subsidiary of Rise Companies, is a real estate operating platform through which all of the vertically integrated real estate assets of our Sponsored Programs are managed. |
| · | Certain unlaunched investment programs that, as of June 30, 2023, are not yet being offered to investors. |
The Company has sponsored the following investment programs as of June 30, 2023:
| · | Fundrise Equity REIT, LLC, Fundrise West Coast Opportunistic REIT, LLC, Fundrise East Coast Opportunistic REIT, LLC, Fundrise Midland Opportunistic REIT, LLC, Fundrise Growth eREIT II, LLC, Fundrise Growth eREIT III, LLC, Fundrise Development eREIT, LLC, Fundrise Growth eREIT VII, LLC, LLC and Fundrise Balanced eREIT II, LLC are real estate investment trust programs (the “eREITs”). The Company previously sponsored eight other eREITs: Fundrise Growth eREIT VI, LLC and Fundrise Balanced eREIT, LLC, which merged into Fundrise Growth eREIT II, LLC and Fundrise Equity REIT, LLC, respectively, on September 1, 2022; and Fundrise Real Estate Investment Trust, LLC, Fundrise Income eREIT II, LLC, Fundrise Income eREIT III, LLC, Fundrise Income eREIT 2019, LLC, Fundrise eREIT XIV, LLC, and Fundrise Income eREIT V, LLC, which merged into Fundrise Income Real Estate Fund, LLC on March 31, 2022. |
| · | Fundrise eFund, LLC is a real estate investment fund program (the “eFund”). |
| · | Fundrise Real Estate Interval Fund, LLC (“Flagship Fund”) is a Delaware limited liability company that is registered under the Investment Company Act, as a non-diversified, closed-end management investment company that is operated as an interval fund. |
| · | Fundrise Income Real Estate Fund, LLC (the “Income Interval Fund”) is a Delaware limited liability company, newly organized during 2022 and formed by the merging of Fundrise Real Estate Investment Trust, LLC, Fundrise Income eREIT II, LLC, Fundrise Income eREIT III, LLC, Fundrise Income eREIT 2019, LLC, Fundrise eREIT XIV, LLC, and Fundrise Income eREIT V, LLC, that is registered under the Investment Company Act, as a non-diversified, closed-end management investment company that is operated as an interval fund. |
| · | Fundrise Growth Tech Fund, LLC (the “Innovation Fund”) is a Delaware limited liability company, newly organized during 2022, that is registered under the Investment Company Act, as a non-diversified, closed-end management investment company that is operated as a tender offer fund. |
| · | Fundrise Opportunity Fund, LP and Fundrise Opportunity Zone OP, LLC (collectively referred to as the “Opportunity Fund” or the “oFund”), make up a tax-advantaged real estate investment fund program offered under Regulation D (“Regulation D”) of the Securities Act of 1933, as amended (the “Securities Act”). |
| · | Fundrise Opportunistic Credit Fund, LLC (the “Credit Fund”) is a Delaware limited liability company, newly organized during 2022, offered under Regulation D of the Securities Act. |
The eREITs, eFund, oFund, Credit Fund, Flagship Fund, Income Interval Fund and Innovation Fund are referred to, individually or collectively as the context requires, as the “Sponsored Programs” or “Fundrise Investment Products”.
Liquidity and Capital Resources
We have incurred operating losses since our inception and have an accumulated deficit of $159.7 million as of June 30, 2023. We have financed our operations primarily through the issuance of equity securities. Our ability to achieve profitability depends on our ability to generate revenue growth in existing product lines, successfully launch new product lines and manage costs. We may continue to incur substantial operating losses while we continue to build the business and invest in new innovation.
As of June 30, 2023 and December 31, 2022, we had $21.8 million and $29.7 million in cash and cash equivalents, respectively. We anticipate that our cash and cash equivalents as of June 30, 2023, and forecasted revenue, will provide sufficient liquidity for more than a twelve-month period from the date of filing these financial statements. The actual amount of cash that we will need to operate is subject to many factors, including, but not limited to our product development and engineering efforts. We are dependent upon significant future financing, including through our Offering described below, to provide the cash necessary to execute our ongoing and future operations, including the continued development of our products.
As of June 30, 2023, we are offering up to $75.0 million in shares of our Class B Common Stock in any rolling twelve-month period under Regulation A (the “Offering”). The Offering is being conducted as a continuous offering pursuant to Rule 251(d)(3) of Regulation A, meaning that while the offering of securities is continuous, active sales of securities may occur sporadically over the term of the Offering. As of June 30, 2023 and December 31, 2022, we had raised total gross offering proceeds of approximately $183.5 million and $169.5 million, respectively, from settled subscriptions.
F-5
| 2. | Summary of Significant Accounting Policies |
Basis of Presentation
The accompanying consolidated financial statements of the Company are prepared on the accrual basis of accounting and conform to accounting principles generally accepted in the United States of America (“U.S. GAAP”) for interim financial reporting and the instructions to Form 1-SA and Rule 8-03 of Regulation S-X of the rules and regulations of the SEC. Accordingly, certain information and note disclosures normally included in the financial statements prepared under U.S. GAAP have been condensed or omitted.
Certain amounts in the prior year’s Consolidated Financial Statements and Notes to Consolidated Financial Statements have been reclassified to conform to current year presentation. Receivables from Sponsored Programs are presented as Due from affiliates on the current year consolidated balance sheets. Origination and acquisition fees are presented as Real estate portfolio strategy, Investment management fees, net are presented as Investment management and platform advisory, net, Real estate platform fees are presented as Real estate operating platform, and Origination and servicing expenses are presented as Real estate strategy and operations on the current year consolidated statements of operations. Capital markets fees, defined below within Note 2, Summary of Significant Accounting Policies, Revenue Recognition, have been reclassified from Real estate operating platform to Real estate portfolio strategy on the current year consolidated statements of operations. Amortization of internally developed software has been reclassified from General, administrative and other to Technology and product development.
Additionally, certain allocated salaries and benefits in the prior year’s Consolidated Financial Statements have been reclassified to conform to current year presentation. Salaries and benefits for finance personnel supporting real estate operations have been reclassified from General, administrative and other to Real estate strategy and operations. Salaries and benefits for investor servicing personnel have been reclassified from General, administrative and other to Investment management and platform advisory. Salaries and benefits related to IT Operations personnel have been reclassified from Technology and product development to General, administrative and other. Salaries and benefits for certain of our executives have been reclassified from General, administrative and other to Marketing and Technology and product development.
All adjustments considered necessary for a fair presentation of the Company’s financial position, results of operations and cash flows have been included and are of a normal and recurring nature. Interim results are not necessarily indicative of operating results for any other interim period or for the entire year. The December 31, 2022 consolidated balance sheet and certain related disclosures are derived from the Company’s December 31, 2022 audited consolidated financial statements filed on Form 1-K. These consolidated financial statements should be read in conjunction with the Company’s consolidated financial statements and notes thereto included in the Company’s Form 1-K, which was filed with the SEC. The consolidated financial statements as of June 30, 2023 and for the six months ended June 30, 2023 and June 30, 2022, respectively, and certain related disclosures are unaudited and have not been reviewed, and may not include year-end adjustments to make those consolidated financial statements comparable to audited results.
Principles of Consolidation
The Company consolidates entities when we own, directly or indirectly, a majority interest in the entity or are otherwise able to control the entity. We consolidate variable interest entities (“VIEs”) in accordance with the Financial Accounting Standards Board (“FASB”) Accounting Standards Codification (“ASC”) 810, Consolidation, if we are the primary beneficiary of the VIE as determined by our power to direct the VIE’s activities and the obligation to absorb its losses or the right to receive its benefits, which are potentially significant to the VIE. A VIE is broadly defined as an entity with one or more of the following characteristics: (a) the total equity investment at risk is insufficient to finance the entity’s activities without additional subordinated financial support; (b) as a group, the holders of the equity investment at risk lack (i) the ability to make decisions about the entity’s activities through voting or similar rights, (ii) the obligation to absorb the expected losses of the entity, or (iii) the right to receive the expected residual returns of the entity; or (c) the equity investors have voting rights that are not proportional to their economic interests, and substantially all of the entity’s activities either involve, or are conducted on behalf of, an investor that has disproportionately few voting rights.
The Company consolidates Fundrise LP, and other wholly-owned entities as it was determined that Rise, together with its subsidiaries, is the primary beneficiary. All intercompany balances and transactions have been eliminated in consolidation.
Estimates
The preparation of the consolidated financial statements and related disclosures in conformity with U.S. GAAP requires management to make estimates and assumptions that affect reported amounts of assets and liabilities and the disclosures of contingent assets and liabilities at the date of the consolidated financial statements and the reported amounts of revenues and expenses during the reporting period. Actual results could materially differ from those estimates.
Segment Reporting
The Company operates and manages its business as one reportable and operating segment, which has been identified based on how the chief operating decision maker manages the business, makes operating decisions, and evaluates operating performance.
Investments in Sponsored Programs
The Company records its investments in the launched Sponsored Programs using the equity method of accounting as it was determined that the Company has the ability to exercise significant influence, but does not have a controlling interest in the launched Sponsored Programs. Under the equity method, the investment, originally recorded at cost, is adjusted to recognize our share of net earnings or losses of the Sponsored Programs as they occur, with losses limited to the extent of our investment in, advances to, and commitments to the investee. Additionally, the Company adjusts its investment for received dividends and distributions.
Cash and Cash Equivalents
Cash and cash equivalents may consist of money market funds, demand deposits and highly liquid investments with original maturities of three months or less.
Cash may at times exceed the Federal Deposit Insurance Corporation deposit insurance limit of $250,000 per institution. The Company mitigates credit risk by placing cash with major financial institutions. To date, the Company has not experienced any losses with respect to cash.
F-6
Restricted Cash
Restricted cash consists of amounts deposited into accounts related to health savings accounts for employees. These amounts can only be used as provided for qualified health expenses, and therefore are separately presented on our balance sheets.
Due from Affiliates
Receivables due from affiliates consist primarily of investment management fees and real estate fees due to us from the Sponsored Programs and investments of the Sponsored Programs which are paid to the Company on a quarterly or monthly basis, as applicable, from each Sponsored Program that it manages and investments of the Sponsored Programs, as applicable. These receivables are generally short term and settle within 30 days. We evaluate the collectability of the balances based on historical experience, current conditions, and reasonable and supportable forecasts. The Company has not previously experienced a default related to these receivables. Due to the short-term nature of the receivables and lack of historical losses, we do not have an expectation of credit losses related to these receivables.
Property and Equipment, net
Property and equipment consists of computer equipment, leasehold improvements, and furniture and fixtures, which are recorded at historical cost less accumulated depreciation.
Computer equipment and furniture and fixtures are depreciated on a straight-line basis over the asset’s estimated useful life, generally five to seven years. Maintenance and repairs are expensed as incurred. Major renewals and improvements that extend the useful lives of property and equipment are capitalized. Costs associated with construction projects are transferred to the leasehold improvement account upon project completion. Leasehold improvements are amortized over the shorter of the lease term (excluding renewal periods) or estimated useful life.
The Company evaluates potential impairments of its property and equipment whenever events or changes in circumstances indicate that the carrying amount of the assets may not be recoverable.
Intangible Assets, net
Intangible assets are assets that lack physical substance. Intangible assets with finite lives are amortized over their useful lives in a manner that best reflects their economic benefit, which may include straight-line or accelerated methods of amortization. Intangible assets with indefinite lives are not amortized. Since useful life cannot be determined, the Company evaluates these assets for impairment annually and on an interim basis as events and circumstances warrant when the carrying value of the asset may not be recovered. If the carrying value is not determined to be recoverable, the intangible asset will be reduced to fair value.
Substantially all our intangible assets relate to internal-use software, which is capitalized when preliminary development efforts are successfully completed and it is probable that the project will be completed, and that the software will be used as intended. Capitalized costs for internal-use software primarily consist of salaries and payroll-related costs for employees who are directly involved in the development efforts of a specific piece or pieces of software. Costs related to preliminary project activities and post implementation activities, including training and maintenance, are expensed as incurred. Costs incurred for upgrades and enhancements that are considered to be probable to result in additional functionality are capitalized.
Capitalized costs of platform and other software applications are included in intangible assets. These costs are amortized over the estimated useful life of the software, generally four years, on a straight-line basis. The amortization of costs related to the platform applications is included in Technology and product development on the consolidated statements of operations. See Note 8, Intangible Assets, Net, for more detail on internal-use software as of June 30, 2023 and December 31, 2022.
The Company evaluates the recoverability of its identifiable intangible assets whenever events or changes in circumstances indicate that an intangible asset’s carrying amount may not be recoverable. Such circumstances could include, but are not limited to (i) a significant decrease in the market price of an asset, (ii) a significant adverse change in the extent or manner in which an asset is used, or (iii) an accumulation of costs significantly in excess of the amount originally expected for the acquisition of the asset. The evaluation of asset impairment requires the Company to make assumptions about future cash flows over the life of the asset being evaluated. These assumptions require significant judgment and actual results may differ from assumed and estimated amounts. See Note 8, Intangible Assets, Net, for more detail on internal-use software as of June 30, 2023 and December 31, 2022.
Promotional Shares Capitalization
The Company has offered and may in the future offer various one-time (non-recurring) promotions to new investors of certain Sponsored Programs. Customers may receive additional shares (“Promotional Shares”) upon fulfilling a promotional obligation based on the promotion terms. At the time the customer fulfills their obligation, the Company then deposits the promotional consideration, in the form of shares of a particular fund, into the customer’s account.
The Company recognizes the cost of promotional shares as an asset in the same amount as the value of the promotional consideration deposited. Promotional share capitalized costs are included in Other assets on the consolidated balance sheets.
F-7
The new investors in our Sponsored Programs who receive the promotional shares receive advisory and asset management services provided by the Company over several years. The Company’s performance obligation is satisfied over time as the Company provides these services to the customer. Therefore, the promotional costs are amortized over an estimated period of benefit of three years. The period of benefit was determined by taking into consideration the rate of change in the technology underlying the significant features of our product offerings. If there is a significant change in the estimated period of benefit, management will update the amortization period to reflect such change. Amortization is recognized as a reduction to Investment management and platform advisory fees, net within the consolidated statements of operations.
The Company evaluates these capitalized promotions for impairment whenever events or changes in circumstances indicate that the carrying amount of the capitalized promotions may not be recoverable.
Leases
Payments under our lease arrangement are fixed. Lease assets and liabilities are recognized at the present value of the future lease payments. The interest rate used to determine the present value of the future lease payments is our incremental borrowing rate, because the interest rate implicit in our leases is not readily determinable. Our incremental borrowing rate is based on the information available at the date of initial application of ASC 842 and is estimated to approximate the interest rate on a collateralized basis with similar terms and payments, and in economic environments where the leased asset is located. Our lease terms include an option to extend the lease, but it is uncertain if we will exercise that option as of June 30, 2023. We use the base, non-cancelable, lease term when determining the lease assets and liabilities.
Operating lease assets and liabilities are included on our consolidated balance sheets. Lease expense is recognized on a straight-line basis over the lease term and is included in General, administrative and other on the consolidated income statement.
Deferred Costs of Sponsored Programs
Deferred Costs are comprised of certain offering and other deferred costs of the Sponsored Programs initially paid by Fundrise Advisors on behalf of each Sponsored Program as well as certain management fees incurred payable to Fundrise Advisors (collectively, “Deferred Costs”), net of any fee or expense waivers. Pursuant to each of the Sponsored Programs’ operating agreements, in some cases amended and restated (the “Operating Agreements”), each of the Sponsored Programs is obligated to reimburse Fundrise Advisors, or its affiliates, as applicable, for Deferred Costs paid by them on behalf of such Sponsored Program.
Fundrise Advisors has agreements in place with the eREITs, eFund, and oFund that state the aforementioned Sponsored Programs will only reimburse Fundrise Advisors for the Deferred Costs subject to a minimum net asset value (“NAV”) per share of $10.00 (the “Hurdle Rate”). Once the NAV per share of an eREIT, eFund, or oFund exceeds the Hurdle Rate, it will start to reimburse Fundrise Advisors, without interest, for these Deferred Costs, whether incurred before or after the date that the Hurdle Rate was reached, to the extent that such reimbursement does not cause NAV per share to drop below the Hurdle Rate as a result. Further, in addition to the Hurdle Rate, reimbursements from the oFund can never exceed 0.50% of the aggregate gross offering proceeds from the oFund’s offering.
Deferred Costs for launched eREITs and the eFund are included in Other current assets, net on the consolidated balance sheets. Deferred Costs for the oFund and unlaunched Sponsored Programs are included in Other assets on the consolidated balance sheets.
Deferred Costs of the Innovation Fund and the Credit Fund are not subject to the Hurdle Rate. Fundrise Advisors may seek recoupment from the Innovation Fund of any contractual or voluntary fee waivers or expense reimbursements if recoupment by Fundrise Advisors (a) occurs within thirty-six months after the date of the waiver/reimbursement and (b) does not cause the Innovation Fund's operating expenses to exceed the lesser of the contractual expense limitation amount in effect at the time of the waiver/reimbursement or at the time of the recoupment. Certain organizational costs of the Innovation Fund were waived and expensed by Fundrise Advisors in the consolidated statements of operations. As of July 25, 2022 the Innovation Fund was deconsolidated after it launched on the Fundrise Platform. As of June 30, 2023 these Deferred Costs are considered due and receivable to the Company, subject to the contractual expense cap, and are included in Other current assets, net. Fundrise Advisors has determined that the Credit Fund will reimburse Fundrise Advisors for the Deferred Costs in monthly installments up to 0.50% of the aggregate gross offering proceeds from the Credit Fund’s offering. As of June 30, 2023 these Deferred Costs are considered due and receivable to the Company, subject to the offering proceeds limitation, and are included in Other current assets, net.
F-8
Revenue Recognition
Investment Management and Platform Advisory, Net
Investment management and platform advisory fees are comprised of management fees and advisory fees earned by Fundrise Advisors.
Management fees are earned by Fundrise Advisors from the Sponsored Programs for investment management services provided. Fundrise Advisors generally assesses these fees on a quarterly or monthly basis, as applicable, from each Sponsored Program that it manages. The management fees may be waived at any time for any Sponsored Program at Fundrise Advisors’ sole discretion, and depending on the management agreement, once waived, may no longer be collectible or may be recouped pursuant to certain contractual expense limitation agreements between Fundrise Advisors and the respective Sponsored Program.
Platform advisory fees are earned by Fundrise Advisors from individual advisory clients for providing services with respect to the portfolio investment plans, auto-investment plans, and dividend re-investment plans offered on the Fundrise Platform. Fundrise Advisors reserves the right to reduce or waive this fee for certain clients without notice and without reducing or waiving this fee for all individual clients.
Investment management and platform advisory fees are accounted for as contracts with customers. Fundrise Advisors typically satisfies the performance obligations to provide investment management and advisory services over time as the services are rendered, as the benefits of the services are simultaneously received and consumed. The transaction prices are the amount of consideration to which Fundrise Advisors expects to be entitled in exchange for transferring the promised services in each instance. Investment management and platform advisory fees earned represent variable consideration because the consideration Fundrise Advisors is entitled to varies based on fluctuations in the basis for investment management and platform advisory fees, for example fund net assets for management fees and AUM for advisory fees. The amount recorded as revenue in each instance is generally determined at the end of the period because these investment management and platform advisory fees are payable no less frequently than quarterly and the basis is fixed as of period end.
Real Estate Revenues
Real estate revenues refer to the Real estate portfolio strategy and Real estate operating platform income on the consolidated statements of operations. These fees include revenue earned from the management services provided to certain of our affiliates through Fundrise Real Estate. These fees are determined in accordance with the terms specific to each arrangement and may include (i) strategic fee revenue for acquisition and capital markets services provided or (ii) recurring operating fees such as debt servicing, development management, and real estate asset management services provided.
F-9
Acquisition fees are earned from third-party real estate sponsors and the wholly owned assets of Sponsored Programs. Acquisition fees are generally 1.0% of the committed amount of equity provided by the developer or Sponsored Program acquiring the asset. Such fees are recognized upon acquisition of the real estate asset by the developer or Sponsored Program.
Capital markets fees are earned from certain of our affiliates for providing services with respect to the sourcing of debt capital towards the acquisition and development of the assets. Capital markets fees are earned at a fixed percentage of the total committed amount of any such loan used to finance the assets. Such fees are recognized upon the closing of such debt.
Debt servicing fees are earned from certain of our affiliates for providing services with respect to draw requests, reporting and other interactions between the lender and our affiliates with regard to held debt. Debt servicing fees are earned at a fixed percentage of the total amount of indebtedness secured by each property. Fundrise Real Estate generally assesses these fees on a quarterly or monthly basis, as applicable, from each affiliate for which we provide the services. Fundrise Real Estate typically satisfies the performance obligations over time as the services are rendered, as the benefits of the services are simultaneously received and consumed. The transaction prices are the amount of consideration to which Fundrise Real Estate expects to be entitled in exchange for transferring the promised services in each instance.
Development fees are earned from our affiliates for performing development management services in furtherance of the development of a property. Such services include the development and/or rehabilitation of a property or processing applications or approvals required in connection with the work performed. Development management fees are earned at a fixed percentage of the total development costs of the Property. Fundrise Real Estate generally assesses these fees on a quarterly or monthly basis, as applicable, from each affiliate for which we provide the services. Fundrise Real Estate typically satisfies the performance obligations to provide development management services over time as the services are rendered, as the benefits of the services are simultaneously received and consumed. The transaction prices are the amount of consideration to which Fundrise Real Estate expects to be entitled in exchange for transferring the promised services in each instance. Development fees earned represent variable consideration because the consideration Fundrise Real Estate is entitled to varies based on fluctuations in the basis for development fees. The amount recorded as revenue in each instance is generally determined at the end of the period because these development fees are payable no less frequently than quarterly and the basis is fixed as of period end.
Real estate asset management fees are earned from certain of our affiliates for property asset management services provided. Real estate asset management fees are earned at a fixed percentage of the underlying gross property value. Fundrise Real Estate generally assesses these fees on a quarterly or monthly basis, as applicable, from each affiliate for which we provide the services. Fundrise Real Estate typically satisfies the performance obligations to provide real estate asset management services over time as the services are rendered, as the benefits of the services are simultaneously received and consumed. The transaction prices are the amount of consideration to which Fundrise Real Estate expects to be entitled in exchange for transferring the promised services in each instance. Real estate asset management fees earned represent variable consideration because the consideration Fundrise Real Estate is entitled to varies based on fluctuations in the basis for real estate asset management fees. The amount recorded as revenue in each instance is generally determined at the end of the period because these real estate asset management fees are payable no less frequently than quarterly and the basis is fixed as of period end.
Income Taxes
The Company accounts for income taxes under the asset and liability method, which requires the recognition of deferred tax assets and liabilities for the expected future tax consequences of events that have been included in the consolidated financial statements. Under this method, deferred tax assets and liabilities are recognized temporary differences between the consolidated financial statement carrying amounts of existing assets and liabilities and their respective tax bases, as well as net operating loss and tax credit carryforwards. Deferred tax assets and liabilities are measured using enacted tax rates in effect for the year in which the differences are expected to reverse. The effect of a change in tax rates on deferred tax assets and liabilities is recognized in income in the period that includes the enactment date.
The Company accounts for uncertain tax positions using a two-step process whereby (i) it determines whether it is more likely than not that the tax positions will be sustained on the basis of the technical merits of the position (“more-likely-that-not recognition threshold”) and (ii) for those tax positions that meet the more-likely-than-not recognition threshold, it recognizes the largest amount of tax benefit that is more than 50 percent likely to be realized upon ultimate settlement with the related tax authority.
The Company recognizes interest and penalties accrued on any unrecognized tax benefits as a component of provision for income tax in the consolidated statement of operations. As of June 30, 2023 and June 30, 2022, no unrecognized tax benefits have been recorded.
F-10
The Company recognizes a valuation allowance which reduces the deferred tax assets to the amount we believe these assets are more likely than not to be realized. In making such a determination, the Company considers all available positive and negative evidence, including future reversals of existing taxable temporary differences, projected future taxable income, tax-planning strategies, and results of recent operations. If the Company determines that it would be able to realize our deferred tax assets in the future in excess of their net recorded amount, the Company would make an adjustment to the deferred tax asset valuation allowance, which would reduce the provision for income taxes. As of June 30, 2023 and December 31, 2022, respectively, the value of the deferred tax asset, net of the valuation allowance, was $0.
The Company’s effective tax rate for the six months ended June 30, 2023 and 2022 was 0% as a result of our valuation allowance in both years, which fully offsets net deferred tax assets.
Extended Transition Period
Under Section 107 of the Jumpstart Our Business Startups Act of 2012, we are permitted to use the extended transition period provided in Section 7(a)(2)(B) of the Securities Act of 1933, as amended (the “Securities Act”) for complying with new or revised accounting standards. This permits us to delay the adoption of certain accounting standards until those standards would otherwise apply to private companies. We have elected to use the extended transition period provided in Section 7(a)(2)(B) of the Securities Act for complying with new or revised accounting standards that have different effective dates for public and private companies until the earlier of the date that we (i) are no longer an emerging growth company or (ii) affirmatively and irrevocably opt out of the extended transition period provided in Section 7(a)(2)(B). By electing to extend the transition period for complying with new or revised accounting standards, these consolidated financial statements may not be comparable to companies that adopt accounting standard updates upon the public business entity effective dates.
Recent Accounting Pronouncements
In June 2016, the FASB issued ASU 2016-13 (“ASU 2016-13”), Financial Instruments-Credit Losses: Measurement of Credit Losses on Financial Instruments, which requires the measurement and recognition of expected credit losses for financial assets held at amortized cost. ASU 2016-13 replaces the existing incurred loss impairment model with an expected loss methodology, which will result in more timely recognition of credit losses. Under ASU 2016-13, the Company is required to measure all expected credit losses for financial assets held at the reporting date based on historical experience, current conditions, and reasonable and supportable forecasts. The Company adopted ASU 2016-13 effective January 1, 2023. As part of its adoption process, the Company assessed the collection risk of the outstanding amounts due from its sponsored programs, investors, and other affiliates, which have low risk of credit loss based on the Company’s historical experience. Therefore the adoption of ASU 2016-13 did not have a material impact on our consolidated financial statements.
| 3. | Net Loss Per Share and Net Loss Attributable to Common Stockholders |
Basic (loss) earnings per share (“EPS”) is the amount of net loss available to each share of common stock outstanding during the reporting period. Diluted EPS is the amount of net loss available to each share of common stock outstanding during the reporting period, adjusted to include the effect of potentially dilutive common stock. Potentially dilutive common stock includes incremental shares issued for stock awards and convertible preferred stock. For periods of net loss, basic and diluted EPS are the same as the assumed exercise of stock awards and the conversion of preferred stock is anti-dilutive.
We calculate EPS using the two-class method. The two-class method allocates net (loss) income, that otherwise would have been available to common stockholders, to holders of participating securities. We consider all series of our convertible preferred stock to be participating securities due to their non-cumulative dividend rights. In a period with net income, both earnings and dividends (if any) are allocated to participating securities. In a period with a net loss, only declared dividends (if any) are allocated to participating securities. All participating securities are excluded from basic weighted-average share of common stock outstanding. In the periods presented, basic net loss per share is calculated on the basis of weighted-average number of common shares outstanding during the period. Basic net loss per share is computed by dividing income available to members by the weighted-average common shares outstanding during the period. Diluted net loss per common share equals basic net loss per common share as there were no potentially dilutive securities outstanding during the six months ended June 30, 2023 and year ended December 31, 2022.
F-11
| 4. | Fair Value of Financial Instruments |
We are required to disclose an estimate of fair value of our financial instruments for which it is practicable to estimate the value. U.S. GAAP defines the fair value as the price that the Company would receive to sell an asset or pay to transfer a liability in an orderly transaction between market participants at the measurement date. For certain of our financial instruments, fair values are not readily available since there are no active trading markets as characterized by current exchanges by willing parties.
We determine the fair value of certain investments in accordance with the fair value hierarchy that requires an entity to maximize the use of observable inputs. The fair value hierarchy includes the following three levels based on the objectivity of the inputs, which were used for categorizing the assets or liabilities for which fair value is being measured and reported:
Level 1 – Quoted market prices in active markets for identical assets or liabilities.
Level 2 – Significant other observable inputs (e.g., quoted prices for similar items in active markets, quoted prices for identical or similar items in markets that are not active, inputs other than quoted prices that are observable such as interest rate and yield curves, and market-corroborated inputs).
Level 3 – Valuation generated from model-based techniques that use inputs that are significant and unobservable in the market. These unobservable assumptions reflect estimates of inputs that market participants would use in pricing the asset or liability. Valuation techniques include use of option pricing models, discounted cash flow methodologies or similar techniques, which incorporate management’s own estimates of assumptions that market participants would use in pricing the instrument or valuations that require significant management judgment or estimation.
As of June 30, 2023, the Company’s significant financial instruments consist of cash and cash equivalents, loan payable, and note receivable. As of December 31, 2022, the Company’s significant financial instruments consisted of cash and cash equivalents and loan payable. With the exception of the loan payable, the carrying amount of the Company’s financial instruments approximates their fair values due to their short-term nature. As of June 30, 2023 and December 31, 2022, the aggregate principal balance of our loan payable was approximately $2.7 million, and the aggregate fair value approximated its carrying value. The aggregate fair value of the loan payable is based on unobservable Level 3 inputs which management has determined to be its best estimate of current market values. The method utilized included a discounted cash flow method (an income approach). Significant inputs and assumptions include the current market discount rates, and expected repayment and prepayment dates.
| 5. | Leases |
On January 8, 2019, the Company entered into a ten-year non-cancelable operating lease agreement, expiring on August 31, 2030, for office space located at 11 Dupont Circle NW, Washington, DC 20036. The lease includes one option to renew, but the renewal is not deemed to be reasonably assured as of June 30, 2023. Our lease agreement does not contain any material residual value guarantees or material restrictive covenants.
Operating lease expense was $401,000 for the six months ended June 30, 2023 and June 30, 2022.
As of June 30, 2023, our lease had a remaining lease term of 7.2 years and a discount rate of 7.5%. Future lease payments as of June 30, 2023 were as follows (in thousands):
| Operating Leases | ||||
| Remainder of 2023 | $ | 509 | ||
| 2024 | 1,033 | |||
| 2025 | 1,059 | |||
| 2026 | 1,086 | |||
| 2027 | 1,113 | |||
| Thereafter | 3,104 | |||
| Total future lease payments | 7,904 | |||
| Less: Imputed interest | 1,814 | |||
| Present value of lease liabilities | $ | 6,090 | ||
| Lease liabilities, current | 986 | |||
| Lease liabilities, non-current | 5,104 | |||
| Present value of lease liabilities | $ | 6,090 | ||
F-12
Other information related to our leases for the period ended June 30, 2023 and June 30, 2022 is as follows (in thousands):
| June 30, | June 30, | |||||||
| Cash paid for amounts included in the measurement of lease liabilities: | 2023 | 2022 | ||||||
| Operating cash flows | $ | 499 | 487 | |||||
| 6. | Investments in Sponsored Programs |
The Company records its investments in the Sponsored Programs using the equity method of accounting. As of June 30, 2023 and December 31, 2022, the Investments in Sponsored Programs totaled $2,761,000 and $2,796,000 respectively.
The Company has a percentage ownership in each of the Sponsored Programs of less than 1%.
| 7. | Property and Equipment, net |
Property and equipment, net, consist of the following (in thousands):
| June 30, | December 31, | |||||||
| 2023 | 2022 | |||||||
| Computer equipment | $ | 904 | $ | 890 | ||||
| Furniture and fixtures | 246 | 246 | ||||||
| Leasehold Improvements | 1,668 | 1,668 | ||||||
| Total property and equipment | 2,818 | 2,804 | ||||||
| Less: accumulated depreciation | (1,112 | ) | (950 | ) | ||||
| Total property and equipment, net | $ | 1,706 | $ | 1,854 | ||||
Depreciation expense on property and equipment was approximately $182,000 and $174,000 for the six months ended June 30, 2023 and 2022, respectively. The Company wrote off $20,000 and $185,000 of computer equipment and reversed $20,000 and $92,000 accumulated depreciation as a result of the write-off for the periods ended June 30, 2023 and December 31, 2022.
No property or equipment assets were impaired as of June 30, 2023 and December 31, 2022.
| 8. | Intangible Assets, net |
Intangible assets, net, consist of the following (in thousands):
| June 30, | December 31, | |||||||
| 2023 | 2022 | |||||||
| Internal-use software | $ | 40,535 | $ | 32,904 | ||||
| Patents, trademarks, and domain | 352 | 349 | ||||||
| Total intangible assets | 40,887 | 33,253 | ||||||
| Less: accumulated amortization | (14,107 | ) | (10,833 | ) | ||||
| Total intangible assets, net | $ | 26,780 | $ | 22,420 | ||||
Amortization expense of intangible assets for the six months ended June 30, 2023 and 2022, respectively, was approximately $3,274,000 and $1,850,000.
For the period ended June 30, 2023, the Company identified impaired software assets resulting in losses of $110,000. No intangible assets were impaired as of December 31, 2022.
F-13
The expected future amortization expense for intangible assets subject to amortization as of June 30, 2023 is as follows (in thousands):
| Future Amortization Expense | ||||
| Remainder of 2023 | $ | 3,515 | ||
| 2024 | 6,379 | |||
| 2025 | 5,449 | |||
| 2026 | 4,030 | |||
| 2027 | 588 | |||
| Thereafter | 20 | |||
| Total | $ | 19,981 | ||
Certain intangible assets are not amortized either due to the nature of the asset or due to legal rights not yet issued. The carrying value of these assets not subject to amortization is as follows (in thousands):
| June 30, 2023 | December 31, 2022 | |||||||
| Internal-use software in process | $ | 6,610 | $ | 7,247 | ||||
| Patents and domain | 189 | 186 | ||||||
| Total carrying value not subject to amortization | $ | 6,799 | $ | 7,433 | ||||
| 9. | Loan Payable |
PPP Loan Payable
On April 20, 2020, we entered into a loan agreement with Citizens Bank as the lender (the “Lender”), pursuant to which the Lender provided a loan under the Paycheck Protection Program (the “PPP Loan”) offered by the U.S. Small Business Administration (the “SBA”) in a principal amount of $2,793,800 pursuant to Title 1 of the Coronavirus Aid, Relief and Economic Security Act (the “CARES Act”).
The interest rate on the PPP Loan is a fixed rate of 1% per annum. To the extent that the amounts owed under the PPP Loan, or a portion of them, are not forgiven, we will be required to make principal and interest payments in monthly installments. In July 2021, the Company applied for forgiveness of the PPP Loan with our Lender. As of June 30, 2023, the Company’s PPP loan forgiveness application is under review before the SBA. The PPP Loan’s initial maturity date was April 19, 2022 and was subsequently extended to April 19, 2025.
According to the terms of the Paycheck Protection Program, the subsequent passing of the Paycheck Protection Program Flexibility Act (the “PPPFA Act”), and current guidance from the SBA and U.S. Department of Treasury, all or a portion of loans under the program may be forgiven if the PPP Loan proceeds are used for permitted expenses, as outlined in the CARES Act and related regulations. Under the terms of the loan agreement as written, until such time as the SBA issues a determination on the forgiveness, future annual minimum loan payments are anticipated to be approximately $2.7 million through 2025.
The PPP Loan includes events of default. Upon the occurrence of an event of default, the Lender will have the right to exercise remedies against us, including the right to require immediate payment of all amounts due under the PPP Note.
As of June 30, 2023 and December 31, 2022, remaining outstanding principal of the PPP Loan was $2,690,000. As of June 30, 2023 and December 31, 2022, the PPP Loan has accrued interest of $34,000 and $21,000, respectively.
F-14
| 10. | Supplemental Financial Statement Information |
Accrued expenses consist of the following (in thousands):
| June 30, | December 31, | |||||||
| 2023 | 2022 | |||||||
| Accrued compensation and employee benefits | $ | 2,731 | $ | 5,482 | ||||
| Accrued deferred costs of Sponsored Programs | 16 | 539 | ||||||
| Accrued marketing expenses | 60 | 357 | ||||||
| Accrued legal expenses | 12 | - | ||||||
| Accrued audit and tax expenses | 151 | 165 | ||||||
| Other accrued expenses | 396 | 394 | ||||||
| Total accrued expenses | $ | 3,366 | $ | 6,937 | ||||
| 11. | Stock-Based Compensation and Other Employee Benefits |
Stock-Based Compensation
Under our 2014 Stock Option and Grant Plan, we may grant unrestricted stock grants, restricted stock grants (“RSGs”), restricted stock units (“RSUs”), or restricted stock options (“RSOs”) to purchase shares of common stock to employees, executives, directors, and consultants. A total of 10,100,000 shares of Class A Common Stock have been authorized for issuance under the 2014 Stock Option and Grant Plan as of June 30, 2023 and December 31, 2022. The Company has issued RSGs, RSUs, and RSOs as of June 30, 2023.
The RSGs issued and outstanding generally followed a vesting schedule whereby 25% of the award vests twelve months from the vesting commencement date, and 6.25% vest quarterly thereafter, provided the grantee remained continuously employed by the Company through each vesting date; however, the Board of Directors retains the authority to grant future shares with different terms. The Company recognized $0 of stock-based compensation expense related to RSGs issued in prior years during the six months ended June 30, 2023 and 2022. As of June 30, 2023 and December 31, 2022, there were no remaining unvested shares and no unrecognized stock-based compensation expense.
The Company issued RSOs in 2017 only. These options generally follow a vesting schedule whereby 25% of the award vests twelve months from the vesting commencement date, and 1/36 vest monthly thereafter, provided the grantee remains continuously employed by the Company through each vesting date; however, the Board of Directors retains the authority to grant future options with different terms. The Company issued no stock options and no shares were forfeited for the periods ended June 30, 2023 and 2022. The Company recognized $0 of stock-based compensation expense related to RSOs issued in prior years during the six months ended June 30, 2023 and 2022. As of June 30, 2023 and December 31, 2022, there were no remaining unvested shares and no unrecognized stock-based compensation expense.
F-15
RSUs issued through June 30, 2023 and December 31, 2022 generally follow a time-based vesting schedule whereby 25% of the award vests twelve months from the vesting commencement date, and 6.25% vest quarterly thereafter, provided the grantee remains continuously employed by the Company through each vesting date; however, the Board of Directors retains the authority to grant future shares with different terms. The RSUs are also subject to performance-based vesting, and will only satisfy this requirement on the first of the following to occur: (i) immediately prior to a Company sale event or (ii) the Company’s Initial Public Offering.
The Company issued 1,684,246 and 1,626,054 RSUs for the periods ended June 30, 2023 and 2022, respectively. There were 307,879 and 104,266 RSUs forfeited for the periods ended June 30, 2023 and 2022, respectively. During the periods ending June 30, 2023 and 2022, respectively, there were 823,367 and 627,279 RSUs that met the time-based criteria for vesting.
A summary of RSUs at June 30, 2023 and December 31, 2022, is as follows:
| June 30, | December 31, | |||||||
| 2023 | 2022 | |||||||
| Issued | 8,607,281 | 6,923,035 | ||||||
| Outstanding | 7,510,744 | 6,134,377 | ||||||
| Forfeited | 1,096,537 | 788,658 | ||||||
There was no net income tax benefit recognized relating to stock-based compensation expense and no tax benefits have been realized from RSGs or RSOs due to the full valuation allowance during the periods ended June 30, 2023 and 2022.
Employee Retirement Plan
Effective January 1, 2020, the Company established an employer-sponsored employee retirement 401(k) plan. All of our employees qualify to participate under the plan criteria. Participants may elect to contribute any portion of their annual compensation up to the maximum limit imposed by federal tax law. For the periods ended June 30, 2023 and 2022, the Company made non-elective contributions to each employee equal to 3% of their compensation, which totaled approximately $765,000 and $689,000 respectively.
| 12. | Restructuring Costs |
In December 2022, we initiated a company-wide involuntary workforce reduction as part of our efforts to further drive efficiency, increase focus on our strategic priorities, and improve operating costs (the “Restructuring”). As a result of the Restructuring, we incurred severance, benefits, and related employee costs. Additionally, we incurred additional expense for computer equipment disposed in connection with the Restructuring. As of June 30, 2023, we do not expect to incur any material additional expense in future periods related to the Restructuring.
The following table presents the total restructuring costs as recorded in the consolidated statements of operations as of December 31, 2022 (in thousands):
| Employee Costs | Equipment | Total Costs | ||||||||||
| Marketing | $ | 490 | $ | - | $ | 490 | ||||||
| Real estate strategy and operations | 708 | - | 708 | |||||||||
| Technology and product development | 1,104 | - | 1,104 | |||||||||
| General, administrative and other | 798 | 73 | 871 | |||||||||
| Total restructuring costs | $ | 3,100 | $ | 73 | $ | 3,173 | ||||||
F-16
The Company did not incur any restructuring costs during the six months ended June 30, 2023.
The following table displays a roll forward of the accrual for restructuring costs recorded in Accrued expenses on the consolidated balance sheets (in thousands):
| Restructuring activity: | ||||
| Restructuring liability as of January 1, 2022 | $ | - | ||
| Expense incurred | 3,173 | |||
| Payments | (2,905 | ) | ||
| Restructuring liability as of December 31, 2022 | $ | 268 | ||
| Payments | (268 | ) | ||
| Restructuring liability as of June 30, 2023 | $ | - | ||
| 13. | Stockholders’ Equity |
Preferred Stock
The outstanding shares of Series A convertible preferred stock are not mandatorily or otherwise redeemable. The sale of all, or substantially all, of the Company’s assets, a consolidation or merger with another company, or a transfer of voting control in excess of fifty percent (50%) of the Company’s voting power are all events which are deemed to be a liquidation and would trigger the payment of liquidation preferences under the Company’s Certificate of Incorporation. All such events require approval of the Board; however, in such events, all holders of equal or more subordinate equity instruments would also be entitled to receive the same form of consideration after any liquidation preferences. The significant terms of outstanding Series A are as follows:
Conversion – Each share of Series A is convertible, at the option of the holder, initially, into one share of Class A Common Stock (subject to adjustments for events of dilution). Each share of convertible preferred stock will automatically be converted upon: (i) the election of a majority of the outstanding shares of such series of preferred stock; or (ii) the consummation of an underwritten registered public offering with aggregate proceeds in excess of $35 million (a “Qualified Public Offering”). The Company’s Certificate of Incorporation contains certain anti-dilution provisions, whereby if the Company issues additional shares of capital stock for an effective price lower than the conversion price for a series of preferred stock immediately prior to such issue, then the existing conversion price of such series of preferred stock will be reduced. The Company determined that while its convertible preferred stock contains certain anti-dilution features, the conversion feature embedded within its convertible preferred stock does not require bifurcation under the guidance of ASC 815, Derivatives and Hedging Activities.
Liquidation preference – Upon any liquidation, winding up or dissolution of the Company, whether voluntary or involuntary (a “Liquidation Event”), before any distribution or payment will be made to the holders of any common stock, the holders of convertible preferred stock will be entitled to receive, by reason of their ownership of such stock, an amount per share of Series A equal to $2.1872 (as adjusted for stock splits, recapitalizations and other similar events) plus all declared and unpaid dividends (the “Series A Preferred Liquidation Preference”). However, if upon any such Liquidation Event, our assets are insufficient to make payment in full to all holders of convertible preferred stock of their respective liquidation preferences, then the entire balance of the Company’s assets legally available for distribution will be distributed with equal priority between the preferred holders based upon the amount of each such holders’ Series A Preferred Liquidation Preference. Any excess assets, after payment in full of the liquidation preferences to the convertible preferred stockholders, are then allocated to the holders of the common stock, pro-rata.
Dividends – If and when declared by the Board, the holders of Series A and common stock, on a pari passu basis, will be entitled to receive dividends. As of June 30, 2023 and December 31, 2022 we have not declared any dividends on preferred stock or common stock.
Voting rights – Generally, preferred stockholders have one vote for each share of common stock that would be issuable upon conversion of preferred stock. Voting as a separate class, the Series A stockholders are entitled to elect one member of the Board. The holders of common stock, voting as a separate class, are entitled to elect two members of the Board. The remaining two members are elected by the preferred stockholders and common stockholders voting together as a single class on an as-if-converted to common stock basis. The Company has adopted a dual-class common stock structure, pursuant to which each share of Class A Common Stock will have one vote per share and each share of Class F Common Stock will have ten votes per share.
F-17
Common Stock
Class A Common Stock
As of June 30, 2023 and December 31, 2022, there were 2,888,859 shares issued and 2,455,894 shares outstanding. Holders of our Class A Common Stock are entitled to one (1) vote for each share held of record on all matters submitted to a vote of stockholders.
Class F Common Stock
In April of 2014, the Company issued 10,000,000 shares of Class F Common Stock to Daniel Miller and to Benjamin Miller, with a par value of $0.0001 per share. Each share of the Class F Common Stock is entitled to ten (10) votes per share. As of June 30, 2023 and December 31, 2022 respectively, there were 10,000,000 shares of Class F Common Stock issued and outstanding.
F-18
Class M Common Stock
On July 5, 2016, the Company issued 18,000,000 shares of Class M Common Stock, at $0.0001 per share, to certain executive officers of the Company (excluding Benjamin Miller, who did not participate) for aggregate cash consideration of $1,800. Each share of the Class M Common Stock is entitled to nine votes per share. The shares are callable by the Company at any time, including upon a vote of a majority of the outstanding Series A converted preferred stockholders. On December 10, 2016, the Company exercised its right to redeem all 18,000,000 outstanding shares of Class M Common Stock for an aggregate cash consideration of $1,800 upon unanimous consent by the Board of Directors. On June 8, 2022, the Company removed all existing authorized Class M shares. As of June 30, 2023 and December 31, 2022, there were 0 shares of Class M Common Stock authorized but unissued.
Class B Common Stock
On January 19, 2017, the Board of Directors of the Company created a new class of Common Stock, to be designated as Class B Common Stock, with a par value of $0.0001 per share. On June 8, 2022 the Company increased the authorized number of its shares of common stock designated as Class B Common Stock by 18,000,000. As of June 30, 2023 and December 31, 2022, 38,000,000 shares have been authorized as Class B Common Stock. As of June 30, 2023 and December 31, 2022 respectively, there were 20,211,150 and 19,322,411 shares of Class B Common Stock issued and 19,531,688 and 18,758,938 shares outstanding. Except as required by applicable law, the holders of our Class B Common Stock are not entitled to vote on any matters submitted to a vote of stockholders.
Investors’ Rights Agreement
In 2014 we entered into an Investors’ Rights Agreement (the “IRA”) with certain holders of our Class F Common Stock and Series A Preferred Stock, including persons who held more than 10% of any class of our outstanding capital stock, certain of our executive officers and directors and entities with which certain of our directors are affiliated. Pursuant to the IRA, the holders of certain shares of our common stock and preferred stock are entitled to certain registration rights, information rights and preemptive rights.
Right of First Refusal and Co-Sale Agreement
In 2014, we entered into a Right of First Refusal and Co-Sale Agreement (the “Co-Sale Agreement”) with certain holders of our common stock and preferred stock, including persons who hold more than 10% of our outstanding capital stock, certain of our executive officers and directors, and entities with which certain of our directors are affiliated. Pursuant to the Co-Sale Agreement, the holders of our preferred stock have rights of first refusal and co-sale with respect to certain transfers made by certain holders of our common stock.
Voting Agreement
In 2014 we entered into a Voting Agreement (the “Voting Agreement”) with certain holders of our Class F Common Stock and Series A Preferred Stock, including persons who held more than 10% of any class of our outstanding capital stock, our executive officers and directors, and entities with which certain of our directors are affiliated. Pursuant to the Voting Agreement, the holders of certain shares of our common stock and preferred stock have agreed to vote their shares on certain matters, including with respect to the election of directors.
| 14. | Non-Controlling Interests in Consolidated Entities |
The non-controlling interests (“NCI”) are related to the limited partner holdings in Fundrise LP that we have a controlling financial interest. NCI for the periods ended June 30, 2023 and December 31, 2022, respectively, were $10,327,000 and $10,149,000. As of June 30, 2023, the assets in the limited partnership were primarily cash and cash equivalents and notes receivable. As of December 31, 2022, the assets in the limited partnership were primarily held as cash and cash equivalents.
| 15. | Related Party Transactions |
In addition to those disclosed elsewhere in the Notes to the Consolidated Financial Statements, the following related party transactions are disclosed:
Investments in Sponsored Programs by Company’s Executives
Many of the Company’s executive officers and directors (including immediate family members) have opened investor accounts on the Fundrise Platform. All investments (and redemptions, where applicable) were made in the ordinary course of business and transacted on terms and conditions that were not more favorable than those obtained by third-party investors.
Series A Preferred Stock Financing
The following table summarizes the Series A stock purchased between April 14, 2014 and October 10, 2014 that continues to be held by our executive officers, directors, holders of more than 10% of a given class of our outstanding capital stock or any immediate family member as of June 30, 2023.
F-19
| Name of Stockholder | Shares of Series A Preferred Stock | Total Purchase Price | ||||||
| Benjamin Miller | 433,897 | $ | 949,008 | |||||
| Herbert Miller, Patrice Miller, David Miller and Caroline Miller (1) | 374,757 | $ | 449,713 | |||||
| Daniel Miller | 125,391 | $ | 274,251 | |||||
| (1) | Each of these individuals are immediate family members of Benjamin Miller. Consists of 131,643 shares of Series A Preferred purchased by Herbert Miller, 109,348 shares of Series A Preferred purchased by Patrice Miller, 66,883 shares of Series A stock purchased by David Miller and 66,883 shares of Series A stock purchased by Caroline Miller, each upon the conversion of outstanding convertible promissory notes and at a price per share of approximately $1.20. |
Fundrise LP Promissory Note
On January 20, 2023, Fundrise LP as the lender entered into a promissory note agreement with the Fundrise Opportunistic Credit Fund, LLC as the borrower to meet short-term obligations to purchase investments. The principal of the note was $9,000,000 with a maturity date of November 30, 2023 and an effective interest rate of 4.5%. The principal is included in Note Receivable from Sponsored Program on the consolidated balance sheet. Interest revenue is recognized on an accrual basis and the accrued interest on the note is included in Other current assets, net on the consolidated balance sheet as of June 30, 2023.
| 16. | Commitments and Contingencies |
Liquidation Support Agreement – Fundrise Equity REIT, LLC
To mitigate the effect of one of our initial Sponsored Programs, Fundrise Equity REIT, LLC’s, lack of assets, revenue, and operating history, Fundrise Advisors agreed to make a payment to the eREIT, LLC of up to $500,000 if the distributions paid upon liquidation (together with any distributions made prior to liquidation) are less than a 20% average annual non-compounded return. This is a contingent liability and is not accrued for at June 30, 2023 or December 31, 2022. The following table details the amount of payment at varying levels of return (in thousands):
| Average Annual Non-Compounded Return | Liquidation Support Payment | |||
| 17.0% or less | $ | 500 | ||
| 17.1% to 18.0% | $ | 400 | ||
| 18.1% to 19.0% | $ | 300 | ||
| 19.1% to 19.9% | $ | 200 | ||
| 20.0% or greater | $ | 0 | ||
Legal Proceedings
As of the date of these consolidated financial statements, we are not currently named as a defendant in any active or pending material litigation. However, it is possible that the Company could become involved in various litigation matters arising in the ordinary course of our business. Although we are unable to predict with certainty the eventual outcome of any litigation, management is not aware of any litigation likely to occur that we currently assess as being significant to us.
| 17. | Subsequent Events |
Management has evaluated subsequent events for potential recognition or disclosure in these consolidated financial statements through September 18, 2023, which was the date the consolidated financial statements were available to be issued.
iPO Proceeds
Effective February 13, 2023, the Company’s latest offering statement was qualified by the SEC. Since the report date through the date of this filing, we have raised approximately $4.2 million from settled subscriptions.
F-20
Index to Exhibits
* Previously filed
21
SIGNATURES
Pursuant to the requirements of Regulation A, the issuer has duly caused this semiannual report on Form 1-SA to be signed on its behalf by the undersigned, thereunto duly authorized, in Washington, D.C., on September 18, 2023.
| Rise Companies Corp. | |||
| By: | /s/ Benjamin S. Miller | ||
| Name: | Benjamin S. Miller | ||
| Title: | Chief Executive Officer | ||
Pursuant to the requirements of Regulation A, this report has been signed below by the following persons on behalf of the issuer in the capacities and on the dates indicated.
| Signature | Title | Date | ||
| /s/ Benjamin S. Miller | Chief Executive Officer | September 18, 2023 | ||
| Benjamin S. Miller | (Principal Executive Officer) | |||
| /s/ Alison A. Staloch | Chief Financial Officer | September 18, 2023 | ||
| Alison A. Staloch | (Principal Financial Officer and Principal Accounting Officer) |
22