UNITED STATES
SECURITIES AND EXCHANGE COMMISSION
Washington, D.C. 20549
FORM 1-K
ANNUAL REPORT PURSUANT TO REGULATION A OF THE SECURITIES ACT OF 1933
For the fiscal year ended December 31, 2023
Rise Companies Corp.
(Exact name of issuer as specified in its charter)
| Delaware | 45-4862460 | |
| (State or other jurisdiction of incorporation or organization) | (I.R.S. Employer Identification No.) | |
| 11 Dupont Circle NW, 9th Floor Washington, DC (Address of principal executive offices) | 20036 (Zip Code) |
(202) 584-0550
Issuer’s telephone number, including area code
Class B Common Stock
(Title of each class of securities issued pursuant to Regulation A)
TABLE OF CONTENTS
Part II.
STATEMENT REGARDING FORWARD-LOOKING INFORMATION
Rise Companies Corp. (“Rise,” “Rise Companies,” “we,” “our,” the “Company,” and “us”) makes statements in this Annual Report on Form 1-K (“Annual Report”) that are forward-looking statements. The words “outlook,” “believe,” “estimate,” “potential,” “projected,” “expect,” “anticipate,” “intend,” “plan,” “seek,” “may,” “could” and similar expressions or statements regarding future periods are intended to identify forward-looking statements. These forward-looking statements involve known and unknown risks, uncertainties and other important factors that could cause our actual results, performance or achievements, or industry results, to differ materially from any predictions of future results, performance or achievements that we express or imply in this Annual Report or in the information incorporated by reference into this Annual Report.
The forward-looking statements included in this Annual Report are based upon our current expectations, plans, estimates, assumptions and beliefs that involve numerous risks and uncertainties. Assumptions relating to the foregoing involve judgments with respect to, among other things, future economic, competitive and market conditions and future business decisions, all of which are difficult or impossible to predict accurately and many of which are beyond our control. Although we believe that the expectations reflected in such forward-looking statements are based on reasonable assumptions, our actual results and performance could differ materially from those set forth in the forward-looking statements. Factors that could have a material adverse effect on our and our Sponsored Programs’ (as defined within the Other Details, Corporate Structure section) operations and future prospects include, but are not limited to:
| · | our dependence on fee income generated from our Sponsored Programs to support our continued growth and expansion; |
| · | the ability of our Sponsored Programs to effectively deploy the proceeds raised in their initial and subsequent offerings; |
| · | our ability to attract and retain shareholders to the online investment platform located at www.fundrise.com (the “Fundrise Platform”); |
| · | risks associated with breaches of our data security; |
| · | public health crises, pandemics and epidemics, such as the COVID-19 pandemic; |
| · | climate change and natural disasters that could adversely affect properties held by the Sponsored Programs and our business; |
| · | changes in geopolitical and economic conditions generally and the real estate and securities markets specifically; |
| · | limited ability of our Sponsored Programs to dispose of assets because of the relative illiquidity of real estate investments; |
| · | intense competition in the real estate market that may limit the ability of our Sponsored Programs to attract or retain tenants or re-lease space; |
| · | defaults on or non-renewal of leases by tenants of our Sponsored Programs; |
| · | increased inflation and related impacts, increased interest rates and operating costs; |
| · | our failure and the failure of our Sponsored Programs to obtain necessary outside financing; |
3
| · | decreased rental rates or increased vacancy rates; |
| · | difficulties of our Sponsored Programs in identifying properties to complete, and in consummating real estate acquisitions, developments, joint ventures and dispositions; |
| · | failure of our Sponsored Programs to successfully operate acquired properties and operations; |
| · | exposure to liability relating to environmental and health and safety matters; |
| · | changes in real estate and zoning laws and increases in real property tax rates; |
| · | failure of acquisitions to yield anticipated results; |
| · | our and our Sponsored Programs’ level of debt and the terms and limitations imposed on us by our debt agreements; |
| · | the need of our Sponsored Programs to invest additional equity in connection with debt refinancing as a result of reduced asset values; |
| · | our ability to retain our executive officers and other key personnel of our advisor and our other affiliates; |
| · | expected rates of return provided to investors and investors in our Sponsored Programs; |
| · | our ability to source, originate and service our loans and other assets, and the quality and performance of these assets; |
| · | our ability to retain and hire competent employees and appropriately staff our operations; |
| · | legislative or regulatory changes impacting our business or our assets and Securities and Exchange Commission (“SEC”) guidance related to Regulation A (“Regulation A”) of the Securities Act of 1933, as amended (the “Securities Act”), or the Jumpstart Our Business Startups Act of 2012; | |
| · | changes in business conditions and the market value of our and our Sponsored Programs’ assets, including changes in interest rates, prepayment risk, operator or borrower defaults or bankruptcy, and generally the increased risk of loss if our investments fail to perform as expected; |
| · | our ability to implement effective conflicts of interest policies and procedures among the various real estate investment opportunities sponsored by us; |
| · | the ability of our Sponsored Programs to access sources of liquidity when they have the need to fund redemptions of common shares in excess of the proceeds from the sales of their common shares in our offerings and the consequential risk that we may not have the resources to satisfy redemption requests; |
| · | our compliance with applicable local, state and federal laws, including the Investment Advisers Act of 1940 (the “Advisers Act”), the Investment Company Act of 1940, as amended (the “Investment Company Act”) and other laws; and |
| · | changes to accounting principles generally accepted in the United States of America (“U.S. GAAP”). |
4
Any of the assumptions underlying forward-looking statements could be inaccurate. You are cautioned not to place undue reliance on any forward-looking statements included in this Annual Report. All forward-looking statements are made as of the date of this Annual Report and the risk that actual results will differ materially from the expectations expressed in this Annual Report will increase with the passage of time. We undertake no obligation to publicly update or revise any forward-looking statements after the date of this Annual Report, whether as a result of new information, future events, changed circumstances or any other reason. In light of the significant uncertainties inherent in the forward-looking statements included in this Annual Report, including, without limitation, the risks described under “Risk Factors,” the inclusion of such forward-looking statements should not be regarded as a representation by us or any other person that the objectives and plans set forth in this Annual Report will be achieved.
Rise Companies Corp. (“Rise”, “Rise Companies”, “we”, “our”, the “Company” and “us”), together with its affiliate organizations (“Fundrise”), combines modern financial technology and investment management to build the next generation of alternative asset management infrastructure. We generate revenue from fees related to asset management and other services performed for a portfolio of real estate and technology assets. Our technology platform has allowed us to build a differentiated business with what we believe is a significant competitive advantage and a robust, proprietary software infrastructure.
In the pursuit of our mission to democratize investing in private markets, we believe we are now the largest direct-to-investor alternative asset manager in America. With over 250 employees, our aim is to build and own the future of private markets.
For more information, see “Offering Circular Summary—Rise Companies Corp.” in our latest Offering Circular filed with the SEC on October 3, 2023, which may be accessed here.
Our Business
We believe that the direct-to-consumer investment platform has been the untapped future of private markets. Our core innovation is a willingness to redesign everything using technology – from leveraging web and mobile apps for distribution to building data infrastructure for operations and management. The result has lowered the marginal cost per investor to nearly zero and expanded access to alternatives for millions of individual investors. Our technology platform (the “Fundrise Platform”) provides more access to alternatives, more transparently to more people, anywhere, all the time.
We believe traditional private markets resemble the public markets of more than a half century ago. Transactions are performed manually by salespeople. Data is fragmented and markets are opaque. Access is fundamentally preferential to the largest financial institutions. Sophisticated investors capture excess alpha from highly inefficient markets.
We seek to disrupt and reinvent the “private market value chain”.
5
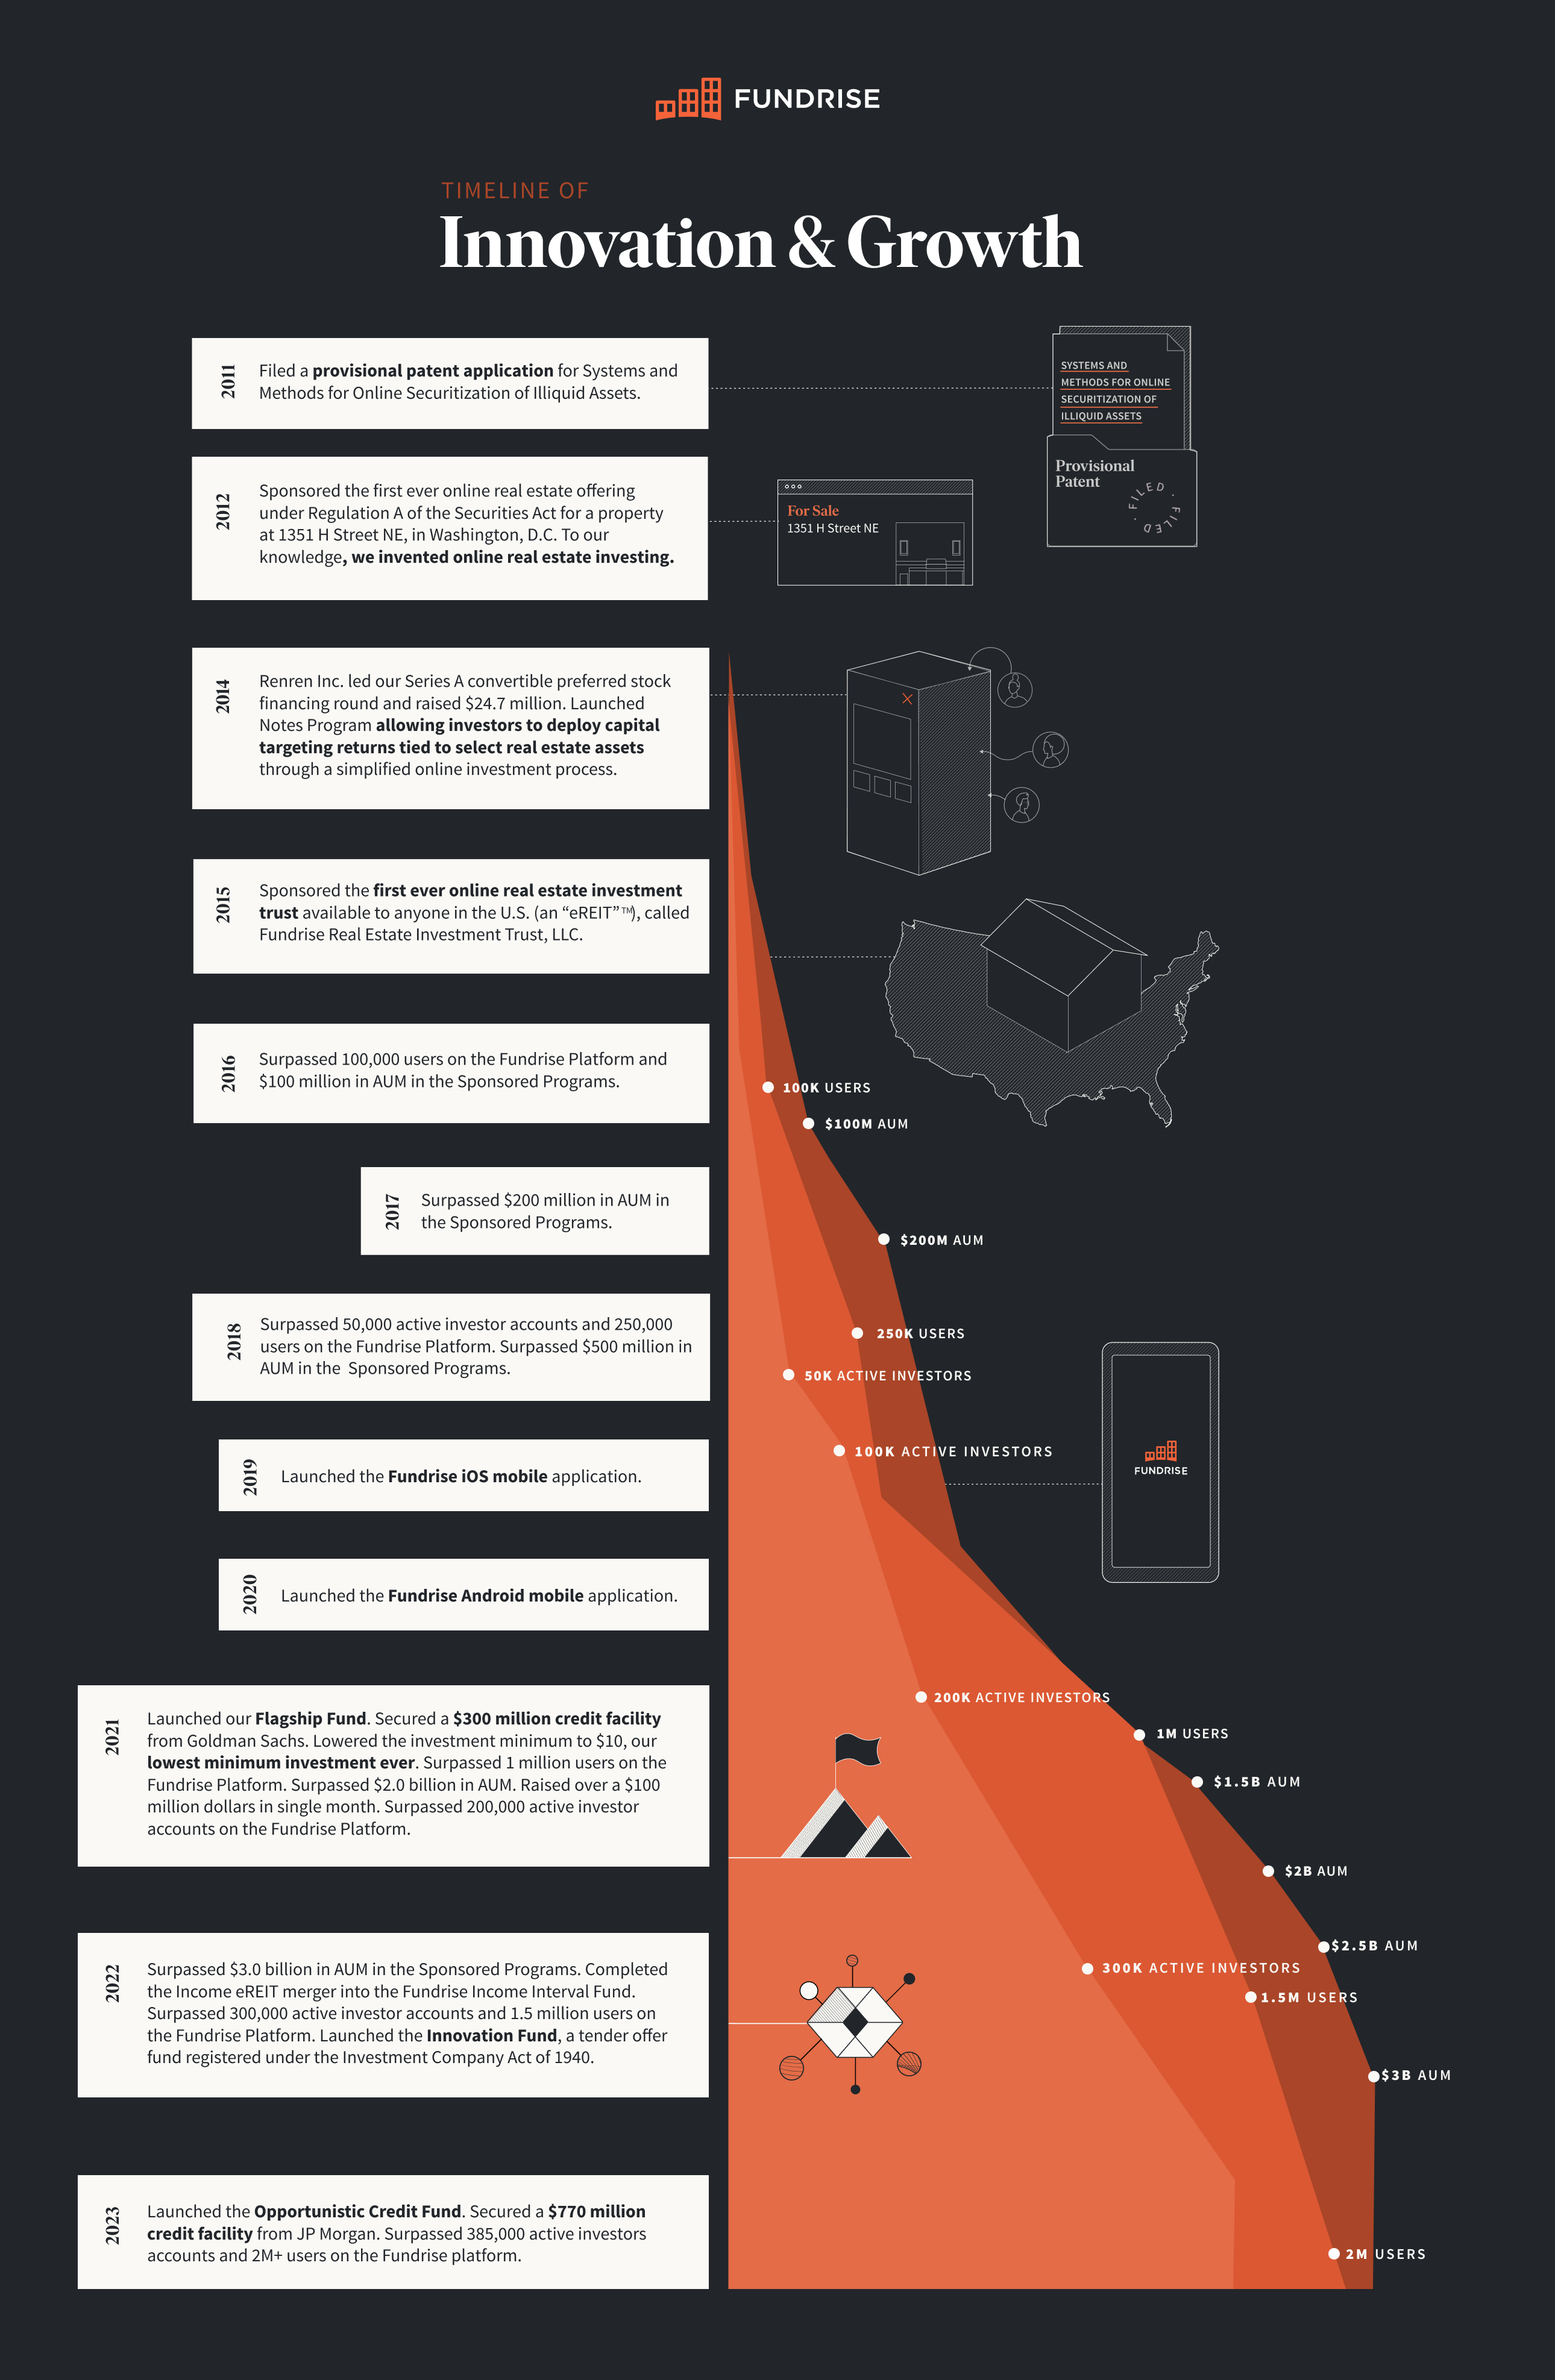
Rise Timeline of Innovation and Growth
6
Employees
As of the date of this filing, we had 266 employees (all of which were full-time employees), the majority of whom work remotely.
Legal Proceedings
As of the date of the consolidated financial statements, we are not currently named as a defendant in any active or pending material litigation. However, it is possible that the Company could become involved in various litigation matters arising in the ordinary course of our business. Although we are unable to predict with certainty the eventual outcome of any litigation, management is not aware of any litigation likely to occur that we currently assess as being significant to us.
Item 2. Management’s Discussion and Analysis of Financial Condition and Results of Operations
The following discussion of our financial condition and results of operations should be read in conjunction with our consolidated financial statements and the related notes. The following discussion contains forward-looking statements that reflect our plans, estimates, and beliefs. Our actual results could differ materially from those discussed in the forward-looking statements. For further information regarding forward-looking statements, see Statement Regarding Forward Looking Information. Unless otherwise indicated, the latest results discussed below are as of December 31, 2023.
7
We are encouraged by both the performance of the managed real estate assets held by our Fundrise Investment Products (as defined within the Other Details, Corporate Structure section) and by our own ability to navigate and continue to grow throughout the economic upheaval and public health crisis brought on by the COVID-19 pandemic, coupled with a period of heightened economic uncertainty due to inflation that is not transitory in nature, rising interest rates putting downward pressure on real estate values, and other factors.
As of December 31, 2023, and 2022, there was approximately $2.87 billion and $3.2 billion in equity assets under management in the Fundrise Platform, respectively. The past twelve months have proven to be one of the single most challenging years for real estate returns since the 2008 Great Financial Crisis, with higher borrowing costs due to increasing interest rates driving real estate valuation decreases across the platform. Although rising interest rates dragged down real estate returns throughout the year, we believe we have reached a turning point with inflation now easing and the Federal Reserve signaling an end to rate hikes. Looking ahead, we believe that just as rising interest rates pulled real estate values down, falling interest rates will act as a strong tailwind, likely pushing real estate values higher and in turn producing potentially positive results for investors going forward. We believe that Fundrise is well positioned to become the go-to platform for the rising generations to invest in the real estate industry and other alternative asset classes, and to leverage data and technology in its efforts to empower and center the individual as the key stakeholder in the financial services markets.
As of December 31, 2023, we have yet to generate any profits from our operations and are incurring net losses while we have invested in the development and expansion of our business through new innovation. For the year ended December 31, 2023 we focused on increasing efficiency while reducing operating expenses as part of our drive towards future profitability.
For further discussion of our performance throughout 2023 and potential impact of current macroeconomic conditions, see the most recent investor letter, originally published December 30, 2023. The contents of the investor letter are not incorporated by reference in or otherwise a part of this Annual Report.
Outlook and Recent Trends
Our optimism about the Company, our continued evolution, and our future success in executing on our mission is rooted in over a decade-long history of innovative ideas, exceptional engineering talent, patience for and focus on long-term growth rather than short-term results, and a commitment to the mission and our customer, the individual. Our annual growth throughout the past four years since the beginning of the COVID-19 pandemic is an achievement we are incredibly proud of and exemplifies an underlying concept we’ve been passionate about at Rise since the beginning: non-linear growth. It is a common misconception that the growth of companies, when observed over long periods of time, is – or even should be – clear and steady. In actuality, we believe nearly all massively successful businesses in today’s environment have experienced punctuated periods of non-linear growth unlocked through true product or market innovations. This phenomenon has certainly held true in Rise’s over ten-year history, as we have always seen a small number of critical initiatives lead to outsized growth that has allowed us to reach milestones that seemed previously unattainable.
8
It’s important to remember that while Rise is a technology company focused on finance, our performance reflects aspects of investment management, real estate and alternative asset management, and software as a service businesses. As a result, our performance and potential are not fully captured by metrics used by the companies operating in those industries today, given the generally outdated approach taken by businesses in those industries. We believe that, as our business scales, while our growth may increase in absolute terms, our individual performance metrics on a standalone basis may not reflect our total performance or may require looking at new metrics that reflect the evolution of our business model. In short, we believe the metrics that matter the most to us in operating our business and creating new value for our customers, and therefore in creating an effective measurement of our success, will continue to evolve. Accordingly, it may be insufficient to rely solely on any single performance metric as a measurement of our success.
The Metrics That Matter
In our business today, the metrics that drive our success and direct our attention are those that most effectively describe our geometric growth. Of course, revenue and expense on a gross basis as well as by category are key; the mass adoption of our technology platform and the performance of our advised investment vehicles is also clearly relevant. You can see those metrics within our “Results of the Business” and “Results of Operations” sections herein. And while we are proud of the current year growth reflected by those metrics, we have always been and will continue to be focused on the long-term. We believe we are at the beginning of a multi-decade paradigm shift across many macroeconomic trends (the automation of investment management, the wealth accumulation of the millennial generation, increasing allocation to investment alternatives outside of stocks and bonds, and from pensions to self-managed investments) and feel poised to ride an expected tidal wave of change for years to come. We are constantly evaluating our current products and the competitive landscape to ensure we position ourselves in front of that change as opposed to chasing it.
The signal has become clear enough that many in the private investment industry are now starting to pitch the idea(s) of “perpetual capital” and access for retail investors. But the problem is that that is only part of the solution. We believe they’re missing the software-driven flywheel necessary to successfully re-orient their business. You can’t execute the strategy of tomorrow with yesterday’s way of doing business.
The combination of macro trends referenced above, our company specific strategies, and where we are in our growth trajectory means that the metrics we track and emphasize within our business will evolve as we grow and the macro trends unfold. The majority of our growth today comes from existing customers increasing their investment size as their investable assets grow and we prove our ability to deliver attractive returns uncorrelated to the public markets. With a young investor base and perpetual capital, we believe we have decades to grow with our customers. With this multi-decade opportunity in mind, we focus on optimizing our profit potential over a long-term investor relationship as opposed to a more transactional approach. And so, with respect to metrics not demonstrated by financial results, the portion of our customers who are committed to our product offerings through a direct relationship with us over a long-term basis is the result we are focused on maintaining and continually improving.
9
Our success today is most accurately managed, and therefore measured, by metrics that relate to our customer level economics and broader strategic differentiation. As our business matures, our success will be measured by a heavier weighting towards more traditional, enterprise-level metrics like growth in top line revenue, gross margin expansion, EBITDA, free cash flow, and operating leverage.
Looking back over the last few years – from the COVID-19 pandemic, to the non-transitory inflationary period, to pandemic instigated and war-related global supply chain problems – we believe the combination of the right assets (multifamily residential, single-family rental, and last-mile industrial), owned at reasonable basis (often at or below replacement cost), in the right markets (currently primarily in the Sunbelt), and at relatively conservative leverage (generally about 50% LTV at the portfolio level) all work together to create what we believe is a remarkably stable foundation able to weather a potentially severe economic storm.
10
For the years ended December 31, 2023 and 2022, our results of operations are as follows:
| Results | 2023 (in thousands) | 2022 (in thousands) | % Change (from 2022) | Explanation |
| Operating Revenue | ||||
| Investment management and platform advisory, net | $31,698 | $28,079 | 13% | As our fee structure remained unchanged, the increase was caused by growth in average annual AUM on the Fundrise Platform throughout the year. The increase was bolstered by additional investment management fees earned related to the Innovation Fund. |
| Real estate portfolio strategy | 9,515 | 17,650 | -46% | The decrease in real estate portfolio revenues period-over-period is driven by our strategic decision to hold more cash in response to the market slowdown which continued throughout the year relative to the market in the comparative period, resulting in fewer deals and fewer financings. |
| Real estate operating platform | 22,394 | 10,929 | 105% | This increase is driven by growth in average annual AUM of our affiliates for which we provide real estate asset management services on our proprietary proptech platform, BasisTM, as well as additional development revenues and real estate asset management revenues collected from our affiliates. Refer to Note 2, Summary of Significant Accounting Policies – Revenue Recognition for more details. |
| Other operating income | 1,815 | 1,958 | -7% | Other operating income remained relatively consistent, with a slight decrease year over year due to increased other investment income offset by fewer expense recoupments in the current year related to waived expenses of the Income Interval Fund and Innovation Fund pursuant to certain expense limitation agreements for the recently launched funds. |
| Total operating revenue | $65,422 | $58,616 | 12% | |
11
| Operating Expenses | ||||
| Investment management and platform advisory | Investment management and platform advisory expenses consist of salaries and benefits for teams responsible for investor relations and operations (“investor servicing”) for the Fundrise Investment Products.
Certain allocated salaries and benefits in the prior year Consolidated Financial Statements were reclassified from General, administrative and other to Investment management and platform advisory to conform to current year presentation. Refer to Note 2, Summary of Significant Accounting Policies – Basis of Presentation for more details. | |||
| $7,056 | $6,586 | 7% | Investment management and platform advisory expenses remained relatively consistent, with a slight increase year-over-year due to employee turnover resulting in an increase in average salaries in our investor servicing team. | |
| Real estate strategy and operations | Real estate strategy and operations expenses consist of costs attributable to activities that most directly relate to the acquisition, origination, and operations of real estate investments for real estate operators that are borrowers from, or joint-venture partners with, the Fundrise Investment Products, in addition to the allocated salaries and benefits expense of our real estate team.
Certain allocated salaries and benefits in the prior year Consolidated Financial Statements were reclassified from General, administrative and other to Real estate strategy and operations to conform to current year presentation. Refer to Note 2, Summary of Significant Accounting Policies – Basis of Presentation for more details | |||
| $13,650 | $13,611 | 0% | Real estate strategy and operations expenses remained consistent year-over-year. | |
| Technology and product development | Technology and product development expenses consist primarily of salaries and benefits for teams responsible for software engineering, product management, technology activities, allocated analytics salaries and benefits; and amortization of internally developed software. These teams work on the development and maintenance of the software and technology assets of the Fundrise Platform, including CorniceTM, BasisTM, and EquitizeTM. Technology and product development is expensed as incurred, except for development and testing costs related to internally developed software that are capitalized and subsequently amortized over the expected useful life.
Certain allocated salaries and benefits as well as amortization of internally developed software in the prior year Consolidated Financial Statements were reclassified from General, administrative and other to Technology and product development to conform to current year presentation. Refer to Note 2, Summary of Significant Accounting Policies – Basis of Presentation for more details. | |||
| $22,945 | $19,227 | 19% | The increase was driven by an increase in amortization expense for internal use software.
We capitalized approximately $15,144,000 and $12,520,000 for the years ended December 31, 2023 and 2022, respectively, in software development costs. | |
| Marketing | Marketing expenses consist primarily of the costs associated with engaging and enrolling investors in the Sponsored Programs, including costs attributable to marketing and selling our products. This includes costs of building general brand awareness, and salaries and benefits expenses related to our marketing and design teams as well as allocated analytics salaries and benefits.
Certain allocated salaries and benefits in the prior year Consolidated Financial Statements were reclassified from General, administrative and other to Marketing to conform to current year presentation. Refer to Note 2, Summary of Significant Accounting Policies – Basis of Presentation for more details. | |||
| $12,312 | $37,700 | -67% | The decrease was due to a strategic decision to reduce corporate marketing spend in light of changing market conditions. | |
12
| General, administrative and other | General, administrative and other expenses consist primarily of software and office expenses, professional fees, and other expenses, which primarily consists of salaries and benefits for our corporate functions (including finance, legal, human resources, and IT operations), long-lived asset write offs, and other miscellaneous expenses.
Certain allocated salaries and benefits in the prior year Consolidated Financial Statements were reclassified from General, administrative and other to Marketing, Real estate strategy and operations, Technology and product development, and Investment management and platform advisory to conform to current year presentation. In addition, certain allocated salaries and benefits in the prior year Consolidated Financial Statements were reclassified from Technology and product development to General, administrative and other to conform to current year presentation. Refer to Note 2, Summary of Significant Accounting Policies – Basis of Presentation for more details. | |||
| Software and other office expenses | $4,722 | $4,535 | 4% | Software and other office expenses remained consistent year-over-year and are comprised of mainly software subscription expenses used to maintain and improve operations. |
| Professional fees | 1,353 | 4,034 | -66% | The decrease was due to a planned pull-back of our spending as part of the Company’s drive towards profitability, particularly in regard to recruiting expenses. Additionally, advisory costs related to regulatory matters decreased in the current period as certain advisory projects neared conclusion. |
| Other general and administrative | 8,708 | 13,458 | -35% | The decrease was primarily due to a reduction in administrative costs of the Income Interval Fund and Innovation Fund prior to launch incurred in the prior year, as well as a planned pull-back of other discretionary spend. |
| Total operating expenses | $70,746 | $99,151 | -29% | |
13
Key Factors Impacting Our Current Year Performance
Our historical growth rates of the Fundrise Platform reflect a deliberate strategy that has allowed us to build and develop the various enterprise functions needed to meet the changing demands of our customers and to support our scale, including operations, risk controls, customer support, compliance and technology. Demand from real estate operators, investors, and the modern financial industry will continue to inform our business and investment product decisions. Given this approach and the dynamic path of our experienced and expected future growth, we have focused this year on a number of important developments within our business that we believe reflect the key factors impacting our performance in 2023. Refer to the Key Factors We Expect to Impact Our Future Performance section below for a description of these key factors.
Key Factors We Expect to Impact Our Future Performance
Investment in Long-Term Growth
The core elements of our growth strategy include enhancing our technology infrastructure, expanding our product and feature offerings, enrolling new investors in our Fundrise Investment Products, broadening our investment acquisition capabilities, and extending customer lifetime value. We plan to continue to invest resources needed to accomplish these goals, and we anticipate that certain operating expenses will continue to increase for the foreseeable future, particularly our technology and product development expenses. These investments are intended to contribute to our long-term growth, but they may continue to affect our near-term profitability.
Sources of Operating Revenues and Cash Flows
We generate revenues from investment management and platform advisory fees, real estate portfolio strategy fees, and real estate operating platform fees. See Note 2, Summary of Significant Accounting Policies - Revenue Recognition in the Notes to the Consolidated Financial Statements for further detail.
14
Liquidity and Capital Resources
We have incurred operating losses since our inception and have an accumulated deficit of $160.8 million as of December 31, 2023. We have financed our operations primarily through the issuance of equity securities. Our ability to achieve profitability depends on our ability to generate revenue growth in existing product lines, successfully launch new product lines and manage costs. We may continue to incur substantial operating losses while we continue to build the business and invest in new innovation.
As of December 31, 2023 and 2022, we had $41.0 million and $29.7 million in cash and cash equivalents, respectively. We anticipate that our cash and cash equivalents as of December 31, 2023, and forecasted revenue, will provide sufficient liquidity for more than a twelve-month period from the date of filing these financial statements. The actual amount of cash that we will need to operate is subject to many factors, including, but not limited to our product development and engineering efforts. We are dependent upon significant future financing, including through our Offering described below under Offering Results, to provide the cash necessary to execute our ongoing and future operations, including the continued development of our products.
As of December 31, 2023 and 2022, our material commitments for capital expenditures consisted of operating leases, as discussed in Note 5, Leases in the Notes to the Consolidated Financial Statements.
In addition, as of December 31, 2022, the Company had a future commitment of approximately $12,069,000 related to a construction mezzanine debt deal with no up-front funding from us, as a result of Rise Companies fully consolidating the Fundrise Opportunistic Credit Fund, LLC (“Credit Fund”). Upon the launch of the Credit Fund on February 28, 2023, the fund was deconsolidated and no commitments existed related to the deal as of December 31, 2023.
Fundrise LP – Sidecar Investment Fund
As part of the 2014 Series A Preferred financing round, we raised a $10 million sidecar private fund called Fundrise LP, which was formed to support assets originated and facilitated by the Fundrise Platform and to support our overall growth.
Corporate Debt
As of December 31, 2023 and 2022, we had corporate debt payable of approximately $2.7 million. In April 2020, we entered into a loan agreement with Citizens Bank as the lender (the “Lender”), pursuant to which the Lender provided a loan (the “PPP Loan”) under the Paycheck Protection Program offered by the U.S. Small Business Administration (the “SBA”) in the principal amount of $2.8 million pursuant to Title 1 of the Coronavirus Aid, Relief and Economic Security Act (the “CARES Act”). We received the full loan amount on April 27, 2020.
As explained more fully in Note 9, Loan Payable – PPP Loan Payable, according to the terms of the Paycheck Protection Program, the subsequent passing of the Paycheck Protection Program Flexibility Act (the “PPPFA Act”), and current guidance from the SBA and U.S. Department of Treasury, all or a portion of loans under the program may be forgiven if certain conditions are met. In July 2021 we applied for such forgiveness. The PPP Loan’s initial maturity date was April 19, 2022 and was subsequently extended to April 19, 2025. As of April 5, 2024, the Company’s PPP loan forgiveness application is currently under review by the SBA. A timeline for SBA’s continued review has not yet been set; accordingly, the Company is uncertain as to when SBA will complete its review, or when SBA will render a final agency decision regarding the timing, amount, and determination of forgiveness.
Other Details
We face risks and uncertainties that could affect us and our business as well as the real estate industry generally. These risks are outlined under the heading “Risk Factors” contained in our latest Offering Circular filed with the SEC on October 3, 2023, which may be accessed here, as the same may be updated from time to time by our future filings under Regulation A. In addition, new risks may emerge at any time and we cannot predict such risks or estimate the extent to which they may affect our financial performance. These risks could result in a decrease in the value of our common shares.
15
As of December 31, 2023, we are offering up to $75.0 million in shares of our Class B Common Stock in any rolling twelve-month period under Regulation A (the “Offering”). The Offering is being conducted as a continuous offering pursuant to Rule 251(d)(3) of Regulation A, meaning that while the offering of securities is continuous, active sales of securities may occur sporadically over the term of the Offering. As of December 31, 2023 and 2022, we had raised total gross offering proceeds of approximately $204.6 million and $169.5 million, respectively, from settled subscriptions.
As of December 31, 2023, we sold 20,902,458 shares of our Class B Common Stock at varying prices as set forth below. This does not include 635,555 shares of Class B Common Stock that were sold in a private placement pursuant to Rule 506(c) of Regulation D.
Offering Results
| Effective Date of Price per Share | Price Per Share | Number of Class B Common Shares Sold | Offering Proceeds | |||||||||
| January 31, 2017 | $ | 5.00 | 2,884,129 | $ | 14,420,645 | |||||||
| July 28, 2017 | 5.50 | 699,880 | 3,849,340 | |||||||||
| January 27, 2018 | 6.00 | 649,781 | 3,898,686 | |||||||||
| May 22, 2018 | 6.30 | 240,589 | 1,515,711 | |||||||||
| July 23, 2018 | 6.60 | 522,878 | 3,450,995 | |||||||||
| October 19, 2018 | 6.90 | 814,870 | 5,622,603 | |||||||||
| January 31, 2019 | 7.30 | 1,073,630 | 7,837,499 | |||||||||
| May 3, 2019 | 7.67 | 457,748 | 3,510,927 | |||||||||
| July 26, 2019 | 8.05 | 1,029,649 | 8,288,674 | |||||||||
| October 18, 2019 | 8.45 | 840,831 | 7,105,022 | |||||||||
| January 21, 2020 | 8.87 | 814,948 | 7,228,589 | |||||||||
| July 17, 2020 | 9.09 | 1,738,062 | 15,798,984 | |||||||||
| February 17, 2021 | 9.54 | 1,557,297 | 14,856,613 | |||||||||
| April 28, 2021 | 10.90 | 492,080 | 5,363,672 | |||||||||
| August 16, 2021 | 11.44 | 1,002,310 | 11,466,426 | |||||||||
| January 24, 2022 | 13.08 | 1,495,850 | 19,565,718 | |||||||||
| March 7, 2022 | 15.00 | 1,167,935 | 17,519,025 | |||||||||
| June 3, 2022 | 15.15 | 1,458,226 | 22,092,124 | |||||||||
| May 3, 2023 | 15.90 | 1,961,765 | 31,192,064 | |||||||||
| Totals | — | 20,902,458 | $ | 204,583,317 | ||||||||
Shares are currently offered and are sold on a continuous basis only to existing investors in the Sponsored Programs. The funds received from the issuance of our Class B Common Stock are a primary source of capital for our operating expenditures.
Off-Balance Sheet Arrangements
As of December 31, 2023 and 2022, we had no off-balance sheet arrangements.
Related Party Arrangements
For further information regarding “Related Party Arrangements,” please see Note 16, Related Party Transactions, in our consolidated financial statements.
Recent Accounting Pronouncements
The Financial Accounting Standards Board has released several Accounting Standards Updates (“ASUs”) that may have an impact on our financial statements. See Note 2, Summary of Significant Accounting Policies – Recent Accounting Pronouncements, in our consolidated financial statements for discussion of the relevant ASUs. We are currently evaluating the impact of the ASUs not yet adopted on our consolidated financial statements and determining our plan for adoption.
16
Extended Transition Period
Under Section 107 of the Jumpstart Our Business Startups Act of 2012, we are permitted to use the extended transition period provided in Section 7(a)(2)(B) of the Securities Act for complying with new or revised accounting standards. This permits us to delay the adoption of certain accounting standards until those standards would otherwise apply to private companies. We have elected to use the extended transition period provided in Section 7(a)(2)(B) of the Securities Act for complying with new or revised accounting standards that have different effective dates for public and private companies until the earlier of the date that we (i) are no longer an emerging growth company or (ii) affirmatively and irrevocably opt out of the extended transition period provided in Section 7(a)(2)(B). By electing to extend the transition period for complying with new or revised accounting standards, these consolidated financial statements may not be comparable to companies that adopt accounting standard updates upon the public business entity effective dates.
We operate through the following significant consolidated subsidiaries, with the following activities:
| · | Fundrise, LLC (“Fundrise, LLC”), a wholly-owned subsidiary of Rise Companies, owns and operates the Fundrise Platform that allows investors in our Sponsored Programs to become equity or debt holders in alternative investment opportunities. |
| · | Fundrise Advisors, LLC (“Fundrise Advisors”), a wholly-owned subsidiary of Rise Companies, is a registered investment adviser with the SEC that acts as the non-member manager for the investment funds sponsored by the Company and offered for investment via the Fundrise Platform. |
| · | Fundrise, L.P. (“Fundrise LP”), is an affiliate of Rise Companies and was created with the intent to directly benefit the Company by driving its growth and profitability. Rise Companies owns approximately 2% of Fundrise LP and has the ability to direct its assets. |
| · | Fundrise Real Estate, LLC (“Fundrise Real Estate”), a wholly-owned subsidiary of Rise Companies, is a real estate operating platform through which all of the vertically integrated real estate assets of our Sponsored Programs are managed. |
The Company has sponsored the following investment programs as of December 31, 2023:
| · | Fundrise Equity REIT, LLC, Fundrise West Coast Opportunistic REIT, LLC, Fundrise East Coast Opportunistic REIT, LLC, Fundrise Midland Opportunistic REIT, LLC, Fundrise Growth eREIT II, LLC, Fundrise Growth eREIT III, LLC, Fundrise Development eREIT, LLC, Fundrise Growth eREIT VII, LLC, and Fundrise Balanced eREIT II, LLC are real estate investment trust programs (the “eREITs”). The Company previously sponsored eight other eREITs: Fundrise Growth eREIT VI, LLC and Fundrise Balanced eREIT, LLC, which merged into Fundrise Growth eREIT II, LLC and Fundrise Equity REIT, LLC, respectively, on September 1, 2022; and Fundrise Real Estate Investment Trust, LLC, Fundrise Income eREIT II, LLC, Fundrise Income eREIT III, LLC, Fundrise Income eREIT 2019, LLC, Fundrise eREIT XIV, LLC, and Fundrise Income eREIT V, LLC, which merged into Fundrise Income Real Estate Fund, LLC on March 31, 2022. |
17
| · | Fundrise eFund, LLC, is a real estate investment fund program (the “eFund”). |
| · | Fundrise Real Estate Interval Fund, LLC (the “Flagship Fund”) is a Delaware limited liability company that is registered under the Investment Company Act, as a non-diversified, closed-end management investment company that is operated as an interval fund. |
| · | Fundrise Income Real Estate Fund, LLC (the “Income Interval Fund”) is a Delaware limited liability company, newly organized during 2022, and formed by the merging of Fundrise Real Estate Investment Trust, LLC, Fundrise Income eREIT II, LLC, Fundrise Income eREIT III, LLC, Fundrise Income eREIT 2019, LLC, Fundrise eREIT XIV, LLC, and Fundrise Income eREIT V, LLC, that is registered under the Investment Company Act, as a non-diversified, closed-end management investment company that is operated as an interval fund. |
| · | Fundrise Growth Tech Fund, LLC (the “Innovation Fund”) is Delaware limited liability company, newly organized during 2022, that is registered under the Investment Company Act, as a non-diversified, closed-end management investment company that is operated as a tender offer fund. |
| · | Fundrise Opportunity Fund, LP and Fundrise Opportunity Zone OP, LLC (collectively referred to as the “Opportunity Fund” or the “oFund”), make up a tax-advantaged real estate investment fund program offered under Regulation D (“Regulation D”) of the Securities Act. | |
| · | Fundrise Opportunistic Credit Fund, LLC (the “Credit Fund”) is a Delaware limited liability company, organized during 2022, that is offered under Regulation D of the Securities Act. |
18
The eREITs, eFund, oFund, Credit Fund, Flagship Fund, Income Interval Fund and Innovation Fund are referred to, individually or collectively as the context requires, as the “Sponsored Programs” or “Fundrise Investment Products.”
Our office is located at 11 Dupont Circle NW, 9th Floor, Washington, D.C. 20036. Our telephone number is (202) 584-0550. Information regarding the Company is also available on our web site at www.fundrise.com.
Recent Developments
As of the date of filing, we have more than 396,000 active investor accounts and more than 2,157,000 active users on the Fundrise Platform, and more than $2.8 billion in AUM in the Sponsored Programs.
Refer to Note 18, Subsequent Events, for more details on recent developments.
| Item 3. | Directors and Officers |
As of the date of this filing our directors and executive officers are as follows:
| Name | Age | Position | Term of Office | |||
| Directors and Executive Officers | ||||||
| Benjamin S. Miller | 47 | Director, Chief Executive Officer | March 2012 | |||
| Brandon T. Jenkins | 38 | Director, Chief Operating Officer | March 2012 | |||
| Alison A. Staloch | 43 | Chief Financial Officer | June 2021 | |||
| Charlotte Liu | 50 | Independent Director | July 2022 | |||
| Tal Kerret | 53 | Independent Director | April 2014 | |||
| Haniel Lynn | 54 | Independent Director | March 2017 | |||
| Kenneth J. Shin | 44 | Chief Technology Officer | March 2012 | |||
| Bjorn J. Hall | 43 | General Counsel, Chief Compliance Officer, and Corporate Secretary | February 2014 | |||
| Chris Brauckmuller | 37 | Chief Strategy Officer | January 2022 | |||
| Jonathan Carden | 35 | Chief Marketing Officer | April 2021 | |||
| Luke Ruth | 33 | Chief Product Officer | January 2022 | |||
| Significant Employees | ||||||
| Kendall Davis | 35 | Senior Vice President of Investor Relations and Investor Operations | June 2014 |
All of our executive officers and significant employees work full-time for us. There are no family relationships between any director, executive officer or significant employee. During the past five years, none of the persons identified above has been involved in any bankruptcy or insolvency proceeding or convicted in a criminal proceeding, excluding traffic violations and other minor offenses.
19
Benjamin S. Miller has served as our Chief Executive Officer and Director since our inception on March 14, 2012. Prior to serving as our Chief Executive Officer, Mr. Miller had been a Managing Partner of the real estate company WestMill Capital Partners, and before that, was President of Western Development Corporation, one of the largest mixed-use real estate companies in the Washington, DC metro area, after joining the Company as its Chief Operating Officer. Prior, Mr. Miller was an Associate and part of the founding team of Democracy Alliance, a progressive investment collaborative. In 2001, Mr. Miller co-founded and was a Managing Partner of US Nordic Ventures, a private equity and operating company that works with Scandinavian green building firms to penetrate the U.S. market. In 1999, Mr. Miller joined LYTE, a technology start-up building a bricks-and-clicks e-commerce and content platform. From 1997 to 1999, Mr. Miller worked as an analyst for Lubert-Adler Partners, a real estate private equity fund. Mr. Miller has a Bachelor of Arts from the University of Pennsylvania.
Brandon T. Jenkins has served as our Chief Operating Officer since February of 2014, prior to which time he served as our Head of Product Development and Director of Real Estate. Previously, Mr. Jenkins has served as Director of Real Estate for WestMill Capital Partners and spent two and a half years as an investment advisor at Marcus & Millichap. Mr. Jenkins earned his Bachelor of Arts from Duke University.
Alison A. Staloch has served as our Chief Financial Officer since June 2021. Prior to becoming the Chief Financial Officer, Ms. Staloch served as the Chief Accountant of the Division of Investment Management at the U.S. Securities and Exchange Commission from December 2017 to April 2021, and before that, served as Assistant Chief Accountant from November 2015 to November 2017. From 2005 to 2015, Ms. Staloch was with KPMG LLP in the Asset Management practice. Ms. Staloch has a Bachelor of Arts in Psychology from Miami University and received a Master of Accounting from the Ohio State University.
Charlotte Liu has served as a Director since July 2022. Ms. Liu most recently served as Chief Commercial Officer of Springer Nature, a scientific and professional publishing and media company with leading brands such as Nature, Macmillan, Springer, and Scientific American. A member of the company’s management board, she led global sales and marketing organizations responsible for over 1 billion euro in annual revenue. Before that Ms. Liu was Global Managing Director of Asian & World Art at Christie’s, a leading global art auction house, with global divisional P&L and leadership responsibility. Born and raised in Shanghai, she started her career at the Boston Consulting Group, advising multinational companies on their Asia strategy. She also worked with McGraw-Hill in product development and corporate strategy roles for the U.S. market. Ms. Liu has developed unique strategic and operational skills from her global experience, having worked in Shanghai, Hong Kong, Toronto, and New York, with both regional market development experience and global leadership responsibilities. She is currently taking a career sabbatical, while working with Netflix as a consultant and moderator for its in house leadership program. Ms. Liu has an undergraduate degree from Fudan University in Shanghai, and an MBA from the Tuck School of Business at Dartmouth College. Ms. Liu is a Fellow of the Aspen Institute China Fellowship Program.
Tal Kerret has served as a Director since April 2014. Mr. Kerret is President of Silverstein Properties, Inc. (“SPI”), where he is responsible for managing and monitoring the company’s portfolio of assets, devising strategies for growth and acting as a liaison with investors. Mr. Kerret also oversees some of the day-to-day operations of the company. Mr. Kerret joined SPI in 2011 as Executive Vice President. He launched Silver Suites Offices at 7 World Trade Center, and oversees Silver Suites Residences at Silver Towers. In January 2013, Mr. Kerret was promoted to Chief Investment Officer of SPI. Prior to joining SPI, Mr. Kerret was Chairman and Co-Founder of Oberon Media, Inc., the leading casual games platform and solution provider established in 2003. Prior to co-founding Oberon Media, Inc., Mr. Kerret was CEO and co-founder of RichFX, an e-commerce technology infrastructure company, for seven years. Prior to RichFX, Mr. Kerret served as an officer in the Israeli Defense Forces for six years. Mr. Kerret holds degrees in Mathematics and Computer Science from the Tel Aviv University.
Haniel Lynn has served as a Director since March 2017. Mr. Lynn is the Chief Executive Officer of Kastle Systems International, the industry leader in managed security solutions. Mr. Lynn was formerly group president of CEB, now Gartner, a global best practices insights and technology company from 2014 until August 2017 and was a member of CEB’s executive leadership team from 2005. Mr. Lynn had global responsibility for CEB’s best practices and decision support business. From 2005 until 2014, Mr. Lynn led the CEB Sales, Marketing, and Communications and Financial Services practices and the Digital Products and Innovation team. Mr. Lynn joined CEB in 2001 as a managing director in the new product development group, and he later added responsibility for leading CEB’s solutions business. Prior to joining CEB, Mr. Lynn was vice president of business development and strategy at LYTE, Inc., where he developed the business and operating model, led partnership development activities, and raised capital to support the growth of the early-stage company. Prior to LYTE, Mr. Lynn was a consultant with McKinsey & Company, providing counsel on marketing, strategy, operations, and organization design issues. Mr. Lynn holds a BSE from the University of Pennsylvania and an M.B.A. from the Wharton School of the University of Pennsylvania.
20
Kenneth J. Shin has served as our Chief Technology Officer since our inception in March 2012. Previously, Mr. Shin consulted for Fortune 500 clients in financial services and technology, including Fannie Mae, Oracle, Lockheed Martin and Computer Science Corporation. Mr. Shin has also consulted for government clients including the Federal Bureau of Investigation, Department of Defense and NATO. Mr. Shin earned his Bachelor of Science in Computer Science Engineering from the University of Pennsylvania.
Bjorn J. Hall has served as our General Counsel, Chief Compliance Officer and Corporate Secretary since February 2014. Prior to becoming our General Counsel, from February 2008 to February 2014, Mr. Hall served as a counsel at the law firm of O’Melveny & Myers LLP, where he was a member of the Corporate Finance and Securities Group. Mr. Hall has a Bachelor of Arts from the University of North Dakota and received a J.D. from Georgetown University Law Center.
Chris Brauckmuller has served as our Chief Strategy Officer since January 2022, and prior to that served as our Chief Product Officer beginning in September 2018 and our Director of Design and Creative beginning in December 2012. From March 2010 to December 2012, Mr. Brauckmuller ran his own independent interactive design studio. Previously, Mr. Brauckmuller was employed as an interactive designer at 352 Media Group (now 352 Inc.), based in Gainesville, Florida, where he led creative efforts on accounts ranging from startups to Fortune 500 technology companies, including Microsoft and BAE Systems. Mr. Brauckmuller received a Bachelor of Arts degree from the University of Florida.
Jonathan Carden has served as our Chief Marketing Officer since April 2021, and was previously the Senior Vice President of Marketing since October 2017. Prior to joining Fundrise, Mr. Carden worked for Uber, where he filled a number of marketing roles before leaving as the head of digital content for the Southeastern U.S. region. Before Uber, Mr. Carden worked in major gift fundraising, serving as the Director of Major Gifts for his alma mater, Patrick Henry College. Mr. Carden received a Bachelor of Arts degree from Patrick Henry College.
Luke Ruth has served as our Chief Product Officer since January 2022, and was previously the Senior Vice President of Product since January 2020. Mr. Ruth joined Fundrise in April 2014 as a Front-End Software Engineer and was promoted to Vice President of Product in February 2018. Prior to joining Fundrise, Mr. Ruth worked for a small semantic web startup as a member of the engineering team. Mr. Ruth received a Bachelor of Science degree from the University of Mary Washington.
Kendall Davis has served as our Senior Vice President of Investor Relations and Investor Operations and has led our investments team since June 2014. Previously, Ms. Davis worked at Citigroup within the Institutional Clients Group and the Citi Private Bank. Ms. Davis is a graduate of the University of Virginia.
Election of Directors
Our board of directors is comprised of five (5) members. The holders of outstanding Class A Common Stock and Class F Common Stock are entitled to elect two directors at any election of directors. So long as at least 2,500,000 shares of Series A Preferred Stock remain outstanding, the holders of such shares of Series A Preferred Stock are entitled to elect one director at any election of directors. The remaining director is elected by holders of Series A Preferred Stock (voting on an as-converted basis) and Class A Common Stock and Class F Common Stock, voting as a single class.
21
Director Independence
Our board of directors has undertaken a review of the independence of Messrs. Kerret, Lynn, Miller, Jenkins, and Ms. Liu. Based on information provided by each director concerning his or her background, employment and affiliations, our board of directors has determined that Messrs. Kerret, Lynn, and Ms. Liu do not have a relationship that would interfere with the exercise of independent judgment in carrying out the responsibilities of a director and that each of these directors would qualify as “independent” as that term is defined under the applicable rules and regulations of the SEC and the listing standards of the NASDAQ Stock Market LLC, if such rules applied to us. In making these determinations, our board of directors considered the current and prior relationships that these non-employee directors have with our company and all other facts and circumstances our board of directors deemed relevant in determining their independence, including the beneficial ownership of our capital stock by each non-employee director, and the transactions involving them described in “Interest of Management and Others in Certain Transactions.”
Compensation of Our Directors and Executive Officers
The following table sets forth information about the annual compensation of each of the three highest paid persons who were executive officers or directors during 2023, which was our last completed fiscal year.
| Name | Capacities in which compensation was received | Cash Compensation | Other Compensation(1) | Total Compensation | ||||||||||
| Bjorn J. Hall | General Counsel, Chief Compliance Officer, and Corporate Secretary | $ | 520,000 | 9,897 | $ | 529,897 | ||||||||
| Alison A. Staloch | Chief Financial Officer | $ | 455,000 | 9,896 | $ | 464,896 | ||||||||
| Kenneth J. Shin | Chief Technology Officer | $ | 455,000 | 9,896 | $ | 464,896 | ||||||||
| (1) | Other compensation consists of 401(k) matching contributions by the Company. |
The aggregate annual compensation of our directors as a group (which consists of 5 persons) during 2023 was approximately $800,000.
Other than the 2014 Stock Option and Grant Plan, of which Mr. Hall, Ms. Staloch, and Mr. Shin (each Officers), and Mr. Miller, Mr. Jenkins, Ms. Liu, Mr. Kerret, and Mr. Lynn (each Directors) have been recipients in previous years and for which RSU’s may be paid in the future, we do not have any other ongoing plans or arrangements whereby equity compensation may be paid in the future.
The average annual total compensation of our officers as a group (which consists of 8 persons) during 2023 was approximately $444,000.
Average compensation to be paid to our officers for 2024 is expected to be at similar levels as 2023.
22
| Item 4. | Security Ownership of Management and Certain Securityholders |
The following table sets forth certain information regarding the beneficial ownership of our outstanding capital stock as of December 31, 2023 for the following: (i) each of our directors and executive officers, (ii) all persons who are our directors and executive officers as a group and (iii) any person who is known by us to be the beneficial owner of more than 10% of any class of our outstanding capital stock.
We calculated percentage ownership based on 44,974,273 shares of our capital stock outstanding as of December 31, 2023, which consisted of 2,455,894 shares of Class A Common Stock, 20,653,333 shares of Class B Common Stock, 10,000,000 shares of Class F Common Stock, and 11,865,046 shares of Series A Preferred Stock outstanding. In computing the beneficial ownership of outstanding shares of Class A Common Stock, we deemed a person to be the beneficial owner of all restricted shares of Class A Common Stock that were issued to such person under our 2014 Stock Option and Grant Plan regardless of whether such shares have vested, as our 2014 Stock Option and Grant Plan provides that, unless we provide otherwise, a grantee of restricted shares of Class A Common Stock will be entitled to vote such shares regardless of whether such shares have vested.
To our knowledge, except as set forth in the footnotes below, each stockholder identified in the table possesses sole voting and investment power with respect to all shares of our common stock or Series A Preferred Stock shown as beneficially owned by that stockholder. Unless otherwise indicated, the address for each person named in the table below is c/o Rise Companies Corp., 11 Dupont Circle NW, Suite 900, Washington, DC 20036.
| Class A | Class B | Class F | Series A Preferred(1) | Voting Power | ||||||||||||||||||||||||||||||||||||
| Name of Beneficial Owner | No. of Shares | % of Class | No. of Shares | % of Class | No. of Shares | % of Class | No. of Shares | % of Class | % of Common Stock (2) | % of All Capital Stock (3) | ||||||||||||||||||||||||||||||
| 10% Stockholders | ||||||||||||||||||||||||||||||||||||||||
| Oak Pacific Investment(1) | — | — | — | — | — | — | 11,865,046 | 100 | % | — | 6.9 | % | ||||||||||||||||||||||||||||
| Daniel S. Miller | — | — | — | — | 5,000,000 | 50 | % | 125,391 | 1.1 | % | 48.8 | % | 43.8 | % | ||||||||||||||||||||||||||
| Beneficial Ownership Group Created by Voting Agreement(5) | 122,900 | 5 | % | — | — | 10,000,000 | 100 | % | 11,865,046 | 100 | % | 97.7 | % | 94.5 | % | |||||||||||||||||||||||||
| Executive Officers and Directors | ||||||||||||||||||||||||||||||||||||||||
| Benjamin S. Miller | — | — | 1,200 | * | 5,000,000 | 50 | % | 433,897 | 3.7 | % | 48.8 | % | 44.1 | % | ||||||||||||||||||||||||||
| Brandon T. Jenkins(4) | 450,000 | 18.3 | % | — | — | — | — | — | — | * | * | |||||||||||||||||||||||||||||
| Jonathan Carden | — | — | — | — | — | — | — | — | — | — | ||||||||||||||||||||||||||||||
| Alison A. Staloch | — | — | — | — | — | — | — | — | — | — | ||||||||||||||||||||||||||||||
| Kenneth J. Shin(4) | 650,000 | 26.5 | % | 202 | * | — | — | — | — | * | * | |||||||||||||||||||||||||||||
| Bjorn J. Hall(4) | 250,000 | 10.2 | % | 32 | — | — | — | — | — | * | * | |||||||||||||||||||||||||||||
| Chris Brauckmuller(4) | 250,000 | 10.2 | % | — | — | — | — | — | — | * | * | |||||||||||||||||||||||||||||
| Luke Ruth(4) | 50,000 | 2.0 | % | — | — | — | — | — | — | * | * | |||||||||||||||||||||||||||||
| Charlotte Liu | — | — | — | — | — | — | — | — | — | — | ||||||||||||||||||||||||||||||
| Tal Kerret(4) | 122,900 | 5 | % | — | — | — | — | 84,931 | * | * | * | |||||||||||||||||||||||||||||
| Haniel Lynn | — | — | — | — | — | — | 22,860 | * | — | * | ||||||||||||||||||||||||||||||
| Executive officers and directors as a group (11 persons) | 1,772,900 | 72.2 | % | 1,434 | * | 5,000,000 | 50 | % | 541,688 | 4.6 | % | 50.5 | % | 45.8 | % | |||||||||||||||||||||||||
* Represents beneficial ownership of less than 1%.
23
| (1) | Oak Pacific Investment (“OPI”) is a record owner of 7,856,395 shares of Series A Preferred Stock (which amounts to 66.2% of the outstanding shares of Series A Preferred Stock), and certain other holders, some of which are listed in the table above, are record owners of the remaining outstanding shares of Series A Preferred Stock. However, pursuant to the Voting Agreement described in footnote 5 below, OPI is deemed to be the beneficial owner of 100.0% of the outstanding shares of Series A Preferred Stock because, as a majority owner of the outstanding shares of Series A Preferred Stock, (i) OPI is entitled to nominate the one director allocated to the Series A Preferred Stock and (ii) the remaining holders of the Series A Preferred Stock have effectively agreed to vote in accordance with OPI with respect to such director. |
| (2) | Voting power with respect to common stock is calculated by taking into account the votes of Class A Common Stock and Class F Common Stock all voting together as a single class, with Class A Common Stock carrying one (1) vote per share and Class F Common Stock carrying ten (10) votes per share. |
| (3) | Voting power with respect to capital stock is calculated by taking into account the votes of Class A Common Stock, Class F Common Stock and Series A Preferred Stock all voting together as a single class (with Series A Preferred Stock voting on an as-converted basis), with Class A Common Stock carrying one (1) vote per share, Class F Common Stock carrying ten (10) votes per share and Series A Preferred Stock carrying one (1) vote per share. |
| (4) | The holder’s shares of Class A Common Stock are restricted shares issued under our 2014 Stock Option and Grant Plan. As of December 31, 2020 all shares have vested. |
| (5) | On April 14, 2014, in connection with the Series A Preferred Stock financing described in “Interest of Management and Others in Certain Transactions”, we entered into a Voting Agreement (the “Voting Agreement”) with certain Class A and Class F holders of our common stock and Series A holders of our preferred stock, including persons who held more than 10% of any class of our outstanding capital stock, our executive officers and directors, entities with which certain of our officers and directors are affiliated, and family members of certain of our officers and directors. Pursuant to the Voting Agreement, the holders of certain shares of our common stock and preferred stock have agreed to vote their shares on certain matters, including with respect to the election of directors, in accordance with the vote of a majority of the outstanding shares eligible to vote on such matter. The Voting Agreement creates a beneficial ownership group under Section 13(d)(3) of the Securities Exchange Act of 1934, as amended, which group is comprised of certain holders of our Class A Common Stock, all holders of our Class F Common Stock and all holders of our Series A Preferred Stock. |
| Item 5. | Interest of Management and Others in Certain Transactions |
Stock Issuances
In April 2014, in exchange for contributing to us the intellectual property and other assets used by us, Benjamin Miller and Daniel Miller each received 5,000,000 shares of Class F Common Stock.
Additionally, we have granted restricted shares of Class A Common Stock under our 2014 Stock Option and Grant Plan to our executive officers, directors and certain holders of more than 10% of a given class of our outstanding capital stock, in their capacities as our employees.
Series A Preferred Stock Financing
From April 14, 2014 through October 10, 2014, we sold an aggregate of 11,865,046 shares of our Series A Preferred Stock at a cash purchase price of $2.1872 per share or pursuant to the automatic conversion of certain convertible promissory notes, for an aggregate purchase price of approximately $24.7 million (including the purchase price paid for the convertible promissory notes).
24
The following table summarizes the Series A Preferred Stock purchased between April 14, 2014 and October 10, 2014 that continues to be held by our executive officers, directors, holders of more than 10% of a given class of our outstanding capital stock or any immediate family member as of December 31, 2023.
| Name of Stockholder | Shares of Series A Preferred Stock | Total Purchase Price | ||||||
| Benjamin Miller | 433,897 | $ | 949,008 | |||||
| Herbert Miller, Patrice Miller, David Miller and Caroline Miller (1) | 374,757 | $ | 449,713 | |||||
| Daniel Miller | 125,391 | $ | 274,251 | |||||
| (1) | Each of these individuals are immediate family members of Benjamin Miller. Consists of 131,643 shares of Series A Preferred purchased by Herbert Miller, 109,348 shares of Series A Preferred purchased by Patrice Miller, 66,883 shares of Series A stock purchased by David Miller and 66,883 shares of Series A stock purchased by Caroline Miller, each upon the conversion of outstanding convertible promissory notes and at a price per share of approximately $1.20. |
Investors’ Rights Agreement
On April 14, 2014, in connection with the Series A Preferred Stock financing described above, we entered into an Investors’ Rights Agreement (the “IRA”) with certain holders of our Class F Common Stock and Series A Preferred Stock, including persons who held more than 10% of any class of our outstanding capital stock, certain of our executive officers and directors, entities with which certain of our officers and directors are affiliated, and family members of certain of our officers and directors. Pursuant to the IRA, the holders of certain shares of our common stock and preferred stock are entitled to certain registration rights, information rights and preemptive rights. The related parties who are signatories to the IRA include Benjamin Miller, Daniel Miller, Herbert Miller, Patrice Miller, Renren Lianhe Holdings (whose investment is now held by Oak Pacific Investment), David Miller, Caroline Miller, and Tal Kerret. Certain other individuals who are not related parties are also signatories to the IRA.
Right of First Refusal and Co-Sale Agreement
On April 14, 2014, in connection with the Series A Preferred Stock financing described above, we entered into a First Refusal and Co-Sale Agreement (“Co-Sale Agreement”) with certain holders of our common stock and preferred stock, including persons who hold more than 10% of our outstanding capital stock, certain of our executive officers and directors, entities with which certain of our officers and directors are affiliated, and family members of certain of our officers and directors. Pursuant to the Co-Sale Agreement, the holders of our preferred stock have rights of first refusal and Co-Sale with respect to certain transfers made by certain holders of our common stock. The related parties who are signatories to the Co-Sale Agreement include Benjamin Miller, Daniel Miller, Herbert Miller, Patrice Miller, Renren Lianhe Holdings (whose investment is now held by Oak Pacific Investment), David Miller, Caroline Miller, and Tal Kerret. Certain other individuals who are not related parties are also signatories to the Co-Sale Agreement.
Voting Agreement
On April 14, 2014, in connection with the Series A Preferred Stock financing described above, we entered into a Voting Agreement (the “Voting Agreement”) with certain holders of our common stock and preferred stock, including persons who held more than 10% of any class of our outstanding capital stock, our executive officers and directors, entities with which certain of our officers and directors are affiliated, and family members of certain of our officers and directors. Pursuant to the Voting Agreement, the holders of certain shares of our common stock and preferred stock have agreed to vote their shares on certain matters, including with respect to the election of directors, in accordance with the vote of a majority of the outstanding shares eligible to vote on such matter. The related parties who are signatories to the Voting Agreement include Benjamin Miller, Daniel Miller, Herbert Miller, Patrice Miller, Renren Lianhe Holdings (whose investment is now held by Oak Pacific Investment), David Miller, Caroline Miller, and Tal Kerret. Certain other individuals who are not related parties are also signatories to the Voting Agreement.
25
Real Estate Transactions
The initial three real estate properties we used to assess the effectiveness of the Fundrise Platform were managed and owned by Benjamin Miller and Daniel Miller. Specifically, from 2011 to 2014, each of 1351 H Street NE, LLC, 906 H Street NE, LLC, and 1539 7th Street NW, LLC, all of which invested in properties located in Washington, DC, utilized the Fundrise Platform to conduct three separate Regulation A offerings to raise $325,000, $350,000, and $350,000, respectively. We received no transaction-based compensation from these deals and, at the time, we were wholly-owned by Benjamin Miller and Daniel Miller. 1351 H Street NE, LLC currently continues to use the Fundrise Platform solely for online investor relations and dividend distributions.
Investments in Company Convertible Notes
Through April 2014, we raised $3,359,041 in convertible notes from a number of parties, including related parties. Convertible notes of $545,825 from Benjamin Miller, $545,825 from Daniel Miller, and $806,365 from WestMill Capital Partners LLC, a private limited liability company jointly and equally owned in its entirety by Benjamin Miller and Daniel Miller, were converted into a total of 867,793 shares of our Series A Preferred Stock. Additional related party investments in the convertible notes included Herbert Miller (Messrs. Millers’ father), Patrice Miller (Messrs. Millers’ stepmother and mother, respectively), David Miller (Messrs. Millers’ brother), and Caroline Miller (Messrs. Millers’ sister), which investment amounts totaled $157,193, $131,219, $80,260, and $80,260 respectively. These related party investments were made under the same terms as other investors in the convertible notes.
Investments in Sponsored Programs
Many of the Company’s executive officers and directors (including immediate family members) have opened investor accounts on the Fundrise Platform. All investments (and redemptions, where applicable) were made in the ordinary course of business and transacted on terms and conditions that were not more favorable than those obtained by third-party investors.
Future Transactions
We intend that all future affiliated transactions be made or entered into on terms that are no less favorable to us than those that can be obtained from any unaffiliated third party. We previously implemented a conflicts of interest policy, which requires a majority of the independent, disinterested members of our board of directors to approve affiliated transactions.
| Item 6. | Other Information |
None.
26
| Item 7. | Financial Statements |
INDEX TO CONSOLIDATED FINANCIAL STATEMENTS OF RISE COMPANIES CORP.
27
Board of Directors and Stockholders
Rise Companies Corp.:
Opinion
We have audited the consolidated financial statements of Rise Companies Corp. and its subsidiaries (the Company), which comprise the consolidated balance sheets as of December 31, 2023 and 2022, and the related consolidated statements of operations, changes in stockholders’ equity and non-controlling interest, and cash flows for the years then ended, and the related notes to the consolidated financial statements.
In our opinion, the accompanying consolidated financial statements present fairly, in all material respects, the financial position of the Company as of December 31, 2023 and 2022, and the results of its operations and its cash flows for the years then ended in accordance with U.S. generally accepted accounting principles.
Basis for Opinion
We conducted our audits in accordance with auditing standards generally accepted in the United States of America (GAAS). Our responsibilities under those standards are further described in the Auditors’ Responsibilities for the Audit of the Consolidated Financial Statements section of our report. We are required to be independent of the Company and to meet our other ethical responsibilities, in accordance with the relevant ethical requirements relating to our audits. We believe that the audit evidence we have obtained is sufficient and appropriate to provide a basis for our audit opinion.
Responsibilities of Management for the Consolidated Financial Statements
Management is responsible for the preparation and fair presentation of the consolidated financial statements in accordance with U.S. generally accepted accounting principles, and for the design, implementation, and maintenance of internal control relevant to the preparation and fair presentation of consolidated financial statements that are free from material misstatement, whether due to fraud or error.
In preparing the consolidated financial statements, management is required to evaluate whether there are conditions or events, considered in the aggregate, that raise substantial doubt about the Company’s ability to continue as a going concern for one year after the date that the consolidated financial statements are available to be issued.
Auditors’ Responsibilities for the Audit of the Consolidated Financial Statements
Our objectives are to obtain reasonable assurance about whether the consolidated financial statements as a whole are free from material misstatement, whether due to fraud or error, and to issue an auditors’ report that includes our opinion. Reasonable assurance is a high level of assurance but is not absolute assurance and therefore is not a guarantee that an audit conducted in accordance with GAAS will always detect a material misstatement when it exists. The risk of not detecting a material misstatement resulting from fraud is higher than for one resulting from error, as fraud may involve collusion, forgery, intentional omissions, misrepresentations, or the override of internal control. Misstatements are considered material if there is a substantial likelihood that, individually or in the aggregate, they would influence the judgment made by a reasonable user based on the consolidated financial statements.
F-1
In performing an audit in accordance with GAAS, we:
| ● | Exercise professional judgment and maintain professional skepticism throughout the audit. |
| ● | Identify and assess the risks of material misstatement of the consolidated financial statements, whether due to fraud or error, and design and perform audit procedures responsive to those risks. Such procedures include examining, on a test basis, evidence regarding the amounts and disclosures in the consolidated financial statements. |
| ● | Obtain an understanding of internal control relevant to the audit in order to design audit procedures that are appropriate in the circumstances, but not for the purpose of expressing an opinion on the effectiveness of the Company’s internal control. Accordingly, no such opinion is expressed. |
| ● | Evaluate the appropriateness of accounting policies used and the reasonableness of significant accounting estimates made by management, as well as evaluate the overall presentation of the consolidated financial statements. |
| ● | Conclude whether, in our judgment, there are conditions or events, considered in the aggregate, that raise substantial doubt about the Company’s ability to continue as a going concern for a reasonable period of time. |
We are required to communicate with those charged with governance regarding, among other matters, the planned scope and timing of the audit, significant audit findings, and certain internal control related matters that we identified during the audit.

Philadelphia, Pennsylvania
April 5, 2024
F-2
RISE COMPANIES CORP.
(Amounts in thousands, except share data)
| December 31, 2023 | December 31, 2022 | |||||||
| ASSETS | ||||||||
| Current assets: | ||||||||
| Cash and cash equivalents | $ | 40,966 | $ | 29,764 | ||||
| Restricted cash | 99 | 61 | ||||||
| Due from affiliates | 7,941 | 7,132 | ||||||
| Note receivable from Sponsored Program | 9,000 | - | ||||||
| Other current assets, net | 2,590 | 4,035 | ||||||
| Total current assets | 60,596 | 40,992 | ||||||
| Investments in Sponsored Programs | 2,756 | 2,796 | ||||||
| Property, software and equipment, net | 31,263 | 24,021 | ||||||
| Operating lease assets | 3,753 | 4,103 | ||||||
| Other assets, net | 3,183 | 1,782 | ||||||
| Total assets | $ | 101,551 | $ | 73,694 | ||||
| LIABILITIES | ||||||||
| Current liabilities: | ||||||||
| Accounts payable | $ | 657 | $ | 1,029 | ||||
| Accrued expenses | 7,895 | 6,937 | ||||||
| Due to stockholders | 1,385 | 378 | ||||||
| Operating lease liabilities, current | 998 | 974 | ||||||
| Other current liabilities | 983 | 251 | ||||||
| Total current liabilities | 11,918 | 9,569 | ||||||
| Loan payable, non-current | 2,690 | 2,690 | ||||||
| Operating lease liabilities, non-current | 4,803 | 5,384 | ||||||
| Other liabilities | 308 | 271 | ||||||
| Total liabilities | 19,719 | 17,914 | ||||||
| Commitments and contingencies (Note 17) | ||||||||
| STOCKHOLDERS’ EQUITY | ||||||||
| Series A convertible preferred stock, $0.0001 par value; 15,000,000 shares authorized; 11,865,046 shares issued and outstanding; with an aggregate liquidation preference of $25,951 | 1 | 1 | ||||||
| Class A common stock, $0.0001 par value; 43,000,000 shares authorized; 2,888,859 shares issued and 2,455,894 shares outstanding | - | - | ||||||
| Class B common stock, $0.0001 par value; 38,000,000 shares authorized, 21,538,013 shares issued and 20,653,333 outstanding, 19,322,411 shares issued and 18,758,938 outstanding, respectively | 2 | 2 | ||||||
| Class F common stock, $0.0001 par value; 10,000,000 shares authorized; 10,000,000 shares issued and outstanding | 1 | 1 | ||||||
| Additional paid-in capital | 232,122 | 200,702 | ||||||
| Accumulated deficit | (160,828 | ) | (155,075 | ) | ||||
| Total stockholders’ equity before non-controlling interests | 71,298 | 45,631 | ||||||
| Non-controlling interests in consolidated entity | 10,534 | 10,149 | ||||||
| Total stockholders’ equity | 81,832 | 55,780 | ||||||
| Total liabilities and stockholders’ equity | $ | 101,551 | $ | 73,694 | ||||
The accompanying notes are an integral part of these consolidated financial statements.
F-3
RISE COMPANIES CORP.
Consolidated Statements of Operations
(Amounts in thousands, except share and per share data)
| For the Year Ended | For the Year Ended | |||||||
| December 31, 2023 | December 31, 2022 | |||||||
| Operating revenue | ||||||||
| Investment management and platform advisory, net | $ | 31,698 | $ | 28,079 | ||||
| Real estate portfolio strategy | 9,515 | 17,650 | ||||||
| Real estate operating platform | 22,394 | 10,929 | ||||||
| Other operating income | 1,815 | 1,958 | ||||||
| Total operating revenue | 65,422 | 58,616 | ||||||
| Operating expenses | ||||||||
| Investment management and platform advisory | 7,056 | 6,586 | ||||||
| Real estate strategy and operations | 13,650 | 13,611 | ||||||
| Technology and product development | 22,945 | 19,227 | ||||||
| Marketing | 12,312 | 37,700 | ||||||
| General, administrative and other | 14,783 | 22,027 | ||||||
| Total operating expenses | 70,746 | 99,151 | ||||||
| Net operating loss | (5,324 | ) | (40,535 | ) | ||||
| Equity in earnings | 106 | 168 | ||||||
| Income tax expense | (46 | ) | (1 | ) | ||||
| Net other income (loss) | 60 | 167 | ||||||
| Net loss | (5,264 | ) | (40,368 | ) | ||||
| Net income attributable to non-controlling interests | 489 | 250 | ||||||
| Net loss attributable to Rise Companies Corp. | $ | (5,753 | ) | $ | (40,618 | ) | ||
| Net loss per share attributable to common stockholders: | ||||||||
| Basic (in dollars per share)* | $ | (0.18 | ) | $ | (1.36 | ) | ||
| Diluted (in dollars per share)* | (0.18 | ) | (1.36 | ) | ||||
| Weighted average shares used to compute net loss per share attributable to common stockholders: | ||||||||
| Basic (in shares)* | 31,972,371 | 29,846,943 | ||||||
| Diluted (in shares)* | 31,972,371 | 29,846,943 | ||||||
* Basic and diluted (loss) per share amounts pertain to each class of common stock.
The accompanying notes are an integral part of these consolidated financial statements.
F-4
RISE COMPANIES CORP.
Consolidated Statements of Changes in Stockholders’ Equity and Non-Controlling Interest
(Amounts in thousands, except share data)
| Preferred Stock Series A | Common Stock Class A | Common Stock Class F | Common Stock Class B | Additional Paid-In | Accumulated | Non- Controlling | Total | ||||||||||||||||||||||||||||||||||
| Shares | Amount | Shares | Amount | Shares | Amount | Shares | Amount | Capital | Deficit | Interests | Equity | ||||||||||||||||||||||||||||||
| Balance at January 1, 2022 | 11,865,046 | $ | 1 | 2,455,894 | $ | - | 10,000,000 | $ | 1 | 15,008,588 | $ | 1 | $ | 146,541 | $ | (114,457 | ) | $ | 10,031 | $ | 42,118 | ||||||||||||||||||||
| Issuance of Class B common stock | - | - | - | - | - | - | 3,868,174 | 1 | 55,332 | - | - | 55,333 | |||||||||||||||||||||||||||||
| Redemption of Class B common stock | - | - | - | - | - | - | (117,824 | ) | - | (998 | ) | - | - | (998 | ) | ||||||||||||||||||||||||||
| Offering costs for Class B common stock | - | - | - | - | - | - | - | - | (173 | ) | - | - | (173 | ) | |||||||||||||||||||||||||||
| Distribution of Member’s Equity of NCI | - | - | - | - | - | - | - | - | - | - | (132 | ) | (132 | ) | |||||||||||||||||||||||||||
| Net (loss) income | - | - | - | - | - | - | - | - | - | (40,618 | ) | 250 | (40,368 | ) | |||||||||||||||||||||||||||
| Balance at December 31, 2022 | 11,865,046 | $ | 1 | 2,455,894 | $ | - | 10,000,000 | $ | 1 | 18,758,938 | $ | 2 | $ | 200,702 | $ | (155,075 | ) | $ | 10,149 | $ | 55,780 | ||||||||||||||||||||
| Issuance of Class B common stock | - | - | - | - | - | - | 2,215,602 | - | 35,038 | - | - | 35,038 | |||||||||||||||||||||||||||||
| Redemption of Class B common stock | - | - | - | - | - | - | (321,207 | ) | - | (3,448 | ) | - | - | (3,448 | ) | ||||||||||||||||||||||||||
| Offering costs for Class B common stock | - | - | - | - | - | - | - | - | (170 | ) | - | - | (170 | ) | |||||||||||||||||||||||||||
| Distribution of Member’s Equity of NCI | - | - | - | - | - | - | - | - | - | - | (104 | ) | (104 | ) | |||||||||||||||||||||||||||
| Net (loss) income | - | - | - | - | - | - | - | - | - | (5,753 | ) | 489 | (5,264 | ) | |||||||||||||||||||||||||||
| Balance at December 31, 2023 | 11,865,046 | $ | 1 | 2,455,894 | $ | - | 10,000,000 | $ | 1 | 20,653,333 | $ | 2 | $ | 232,122 | $ | (160,828 | ) | $ | 10,534 | $ | 81,832 | ||||||||||||||||||||
The accompanying notes are an integral part of these consolidated financial statements.
F-5
RISE COMPANIES CORP.
Consolidated Statements of Cash Flows
(Amounts in thousands)
| Year ended December 31, 2023 | Year ended December 31, 2022 | |||||||
| Cash flows from operating activities | ||||||||
| Net loss | $ | (5,264 | ) | $ | (40,368 | ) | ||
| Adjustments to reconcile net loss to net cash provided (used) by operating activities: | ||||||||
| Depreciation and amortization | 7,630 | 3,912 | ||||||
| (Earnings) from equity method investees | (106 | ) | (168 | ) | ||||
| Return on capital from Sponsored Programs | 228 | 123 | ||||||
| Loss on disposition of property and equipment | 14 | 93 | ||||||
| Impairment of long-lived assets | 336 | - | ||||||
| Amortization of capitalized promotions | 596 | 244 | ||||||
| Change in assets and liabilities: | ||||||||
| Net (increase) decrease in other assets | (611 | ) | (2,680) | |||||
| Net increase (decrease) in accounts payable and accrued expenses | 586 | 3,968 | ||||||
| Net increase (decrease) in other liabilities | 562 | (720 | ) | |||||
| Net (increase) decrease in due from affiliates | (809 | ) | (2,710 | ) | ||||
| Net (increase) decrease in interest receivable | (39 | ) | - | |||||
| Net cash provided by (used in) operating activities | 3,123 | (38,306 | ) | |||||
| Cash flows from investing activities | ||||||||
| Capitalized internal-use software development costs | (15,144 | ) | (12,520 | ) | ||||
| Proceeds from sale of property and equipment | 2 | - | ||||||
| Purchases of property and equipment | (63 | ) | (609 | ) | ||||
| Purchases of intangible assets | (17 | ) | (7 | ) | ||||
| Note receivable from Sponsored Program | (9,000 | ) | - | |||||
| Distributions of capital from Sponsored Programs | 21 | 18 | ||||||
| Investments in Sponsored Programs | (5 | ) | (200 | ) | ||||
| Net cash used in investing activities | (24,206 | ) | (13,318 | ) | ||||
| Cash flows from financing activities | ||||||||
| Distribution of Member’s Equity of NCI | (104 | ) | (132 | ) | ||||
| Proceeds from the issuance of Class B Common Stock, net of offering costs | 34,868 | 55,160 | ||||||
| Redemptions of Class B Common Stock | (2,441 | ) | (910 | ) | ||||
| Loan payable | - | (104 | ) | |||||
| Net cash provided by financing activities | 32,323 | 54,014 | ||||||
| Net increase in cash and cash equivalents | 11,240 | 2,390 | ||||||
| Cash, restricted cash and cash equivalents, beginning of period | 29,825 | 27,435 | ||||||
| Cash, restricted cash and cash equivalents, end of period | $ | 41,065 | $ | 29,825 | ||||
The accompanying notes are an integral part of these consolidated financial statements.
F-6
Rise Companies Corp.
Notes to Consolidated Financial Statements
| 1. | Formation and Organization |
Rise Companies Corp. (“Rise”, “Rise Companies”, “we”, “our”, the “Company”, and “us”) is a financial technology company, that owns and operates a leading web-based and mobile application direct investment platform, located at www.fundrise.com (the “Fundrise Platform”).
We operate through the following significant consolidated subsidiaries, with the following activities:
| · | Fundrise, LLC (“Fundrise, LLC”), a wholly-owned subsidiary of Rise Companies, owns and operates the Fundrise Platform that allows investors in our Sponsored Programs to become equity or debt holders in alternative investment opportunities. |
| · | Fundrise Advisors, LLC (“Fundrise Advisors”), a wholly-owned subsidiary of Rise Companies, is a registered investment adviser with the SEC that acts as the non-member manager for the investment funds sponsored by the Company and offered for investment via the Fundrise Platform. |
| · | Fundrise, L.P. (“Fundrise LP”), is an affiliate of Rise Companies and was created with the intent to directly benefit the Company by driving its growth and profitability. Rise Companies owns approximately 2% of Fundrise LP and has the ability to direct its assets. |
| · | Fundrise Real Estate, LLC (“Fundrise Real Estate”), a wholly-owned subsidiary of Rise Companies, is a real estate operating platform through which all of the vertically integrated real estate assets of our Sponsored Programs are managed. |
The Company has sponsored the following investment programs as of December 31, 2023:
| · | Fundrise Equity REIT, LLC, Fundrise West Coast Opportunistic REIT, LLC, Fundrise East Coast Opportunistic REIT, LLC, Fundrise Midland Opportunistic REIT, LLC, Fundrise Growth eREIT II, LLC, Fundrise Growth eREIT III, LLC, Fundrise Development eREIT, LLC, Fundrise Growth eREIT VII, LLC and Fundrise Balanced eREIT II, LLC are real estate investment trust programs (the “eREITs”). The Company previously sponsored eight other eREITs: Fundrise Growth eREIT VI, LLC and Fundrise Balanced eREIT, LLC, which merged into Fundrise Growth eREIT II, LLC and Fundrise Equity REIT, LLC, respectively, on September 1, 2022; and Fundrise Real Estate Investment Trust, LLC, Fundrise Income eREIT II, LLC, Fundrise Income eREIT III, LLC, Fundrise Income eREIT 2019, LLC, Fundrise eREIT XIV, LLC, and Fundrise Income eREIT V, LLC, which merged into Fundrise Income Real Estate Fund, LLC on March 31, 2022. |
| · | Fundrise eFund, LLC, is a real estate investment fund program (the “eFund”). |
| · | Fundrise Real Estate Interval Fund, LLC (“Flagship Fund”) is a Delaware limited liability company that is registered under the Investment Company Act, as a non-diversified, closed-end management investment company that is operated as an interval fund. |
| · | Fundrise Income Real Estate Fund, LLC (the “Income Interval Fund”) is a Delaware limited liability company, newly organized during 2022 and formed by the merging of Fundrise Real Estate Investment Trust, LLC, Fundrise Income eREIT II, LLC, Fundrise Income eREIT III, LLC, Fundrise Income eREIT 2019, LLC, Fundrise eREIT XIV, LLC, and Fundrise Income eREIT V, LLC, that is registered under the Investment Company Act, as a non-diversified, closed-end management investment company that is operated as an interval fund. |
| · | Fundrise Growth Tech Fund, LLC (the “Innovation Fund”) is a Delaware limited liability company, newly organized during 2022, that is registered under the Investment Company Act, as a non-diversified, closed-end management investment company that is operated as a tender offer fund. |
| · | Fundrise Opportunity Fund, LP and Fundrise Opportunity Zone OP, LLC (collectively referred to as the “Opportunity Fund” or the “oFund”), make up a tax-advantaged real estate investment fund program offered under Regulation D (“Regulation D”) of the Securities Act. |
| · | Fundrise Opportunistic Credit Fund, LLC (the “Credit Fund”) is a Delaware limited liability company, organized during 2022, that is offered under Regulation D of the Securities Act. |
The eREITs, eFund, oFund, Credit Fund, Flagship Fund, Income Interval Fund and Innovation Fund are referred to, individually or collectively as the context requires, as the “Sponsored Programs,” or “Fundrise Investment Products”.
Liquidity and Capital Resources
We have incurred operating losses since our inception and have an accumulated deficit of $160.8 million as of December 31, 2023. We have financed our operations primarily through the issuance of equity securities. Our ability to achieve profitability depends on our ability to generate revenue growth in existing product lines, successfully launch new product lines and manage costs. We may continue to incur substantial operating losses while we continue to build the business and invest in new innovation.
As of December 31, 2023 and 2022, we had $41.0 million and $29.7 million in cash and cash equivalents, respectively. We anticipate that our cash and cash equivalents as of December 31, 2023, and forecasted revenue, will provide sufficient liquidity for more than a twelve-month period from the date of filing these financial statements. The actual amount of cash that we will need to operate is subject to many factors, including, but not limited to our product development and engineering efforts. We are dependent upon significant future financing, including through our Offering described below, to provide the cash necessary to execute our ongoing and future operations, including the continued development of our products.
As of December 31, 2023, we are offering up to $75.0 million in shares of our Class B Common Stock in any rolling twelve-month period under Regulation A (the “Offering”). The Offering is being conducted as a continuous offering pursuant to Rule 251(d)(3) of Regulation A, meaning that while the offering of securities is continuous, active sales of securities may occur sporadically over the term of the Offering. As of December 31, 2023 and 2022, we had raised total gross offering proceeds of approximately $204.6 million and $169.5 million, respectively, from settled subscriptions.
F-7
| 2. | Summary of Significant Accounting Policies |
Basis of Presentation
The accompanying consolidated financial statements of the Company are prepared on the accrual basis of accounting and conform to accounting principles generally accepted in the United States of America (“U.S. GAAP”) and Article 8 of Regulation S-X of the rules and regulations of the SEC.
Certain amounts in the prior year’s Consolidated Financial Statements and Notes to Consolidated Financial Statements have been reclassified to conform to current year presentation. Receivables from Sponsored Programs are presented as Due from affiliates on the current year consolidated balance sheets. Engineering and product development expenses are presented as Technology and product development on the current year consolidated statements of operations. Amortization of internally developed software has been reclassified from Depreciation and amortization to Technology and product development. Depreciation and amortization of property, plant and equipment and other intangible assets has been reclassified from Depreciation and amortization to General, administrative and other. Capitalized internally developed software costs have been reclassified from Intangible assets, net, to Property, software and equipment, net. Other intangible assets have been reclassified to Other assets, net.
Additionally, certain allocated salaries and benefits in the prior year’s Consolidated Financial Statements have been reclassified to conform to current year presentation. Salaries and benefits for finance personnel supporting real estate operations have been reclassified from General, administrative and other to Real estate strategy and operations. Salaries and benefits for investor servicing personnel have been reclassified from General, administrative and other to Investment management and platform advisory. Salaries and benefits related to IT Operations personnel have been reclassified from Technology and product development to General, administrative and other. Allocated salaries and benefits for analytics personnel have been reclassified from exclusively Marketing to Marketing, Technology and product development, and Investment management and platform advisory. Salaries and benefits for certain of our executives have been reclassified from General, administrative and other to Marketing and Technology and product development.
Principles of Consolidation
The Company consolidates entities when we own, directly or indirectly, a majority interest in the entity or are otherwise able to control the entity. We consolidate variable interest entities (“VIEs”) in accordance with the Financial Accounting Standards Board (“FASB”) Accounting Standards Codification (“ASC”) 810, Consolidation, if we are the primary beneficiary of the VIE as determined by our power to direct the VIE’s activities and the obligation to absorb its losses or the right to receive its benefits, which are potentially significant to the VIE. A VIE is broadly defined as an entity with one or more of the following characteristics: (a) the total equity investment at risk is insufficient to finance the entity’s activities without additional subordinated financial support; (b) as a group, the holders of the equity investment at risk lack (i) the ability to make decisions about the entity’s activities through voting or similar rights, (ii) the obligation to absorb the expected losses of the entity, or (iii) the right to receive the expected residual returns of the entity; or (c) the equity investors have voting rights that are not proportional to their economic interests, and substantially all of the entity’s activities either involve, or are conducted on behalf of, an investor that has disproportionately few voting rights.
The Company consolidates Fundrise LP, and other wholly-owned entities as it was determined that Rise, together with its subsidiaries, is the primary beneficiary. All intercompany balances and transactions have been eliminated in consolidation. The Company’s other disclosures regarding VIEs are discussed in Note 15, Variable Interest Entities.
Estimates
The preparation of the consolidated financial statements and related disclosures in conformity with U.S. GAAP requires management to make estimates and assumptions that affect reported amounts of assets and liabilities and the disclosures of contingent assets and liabilities at the date of the consolidated financial statements and the reported amounts of revenues and expenses during the reporting period. Actual results could materially differ from those estimates.
Segment Reporting
The Company operates and manages its business as one reportable and operating segment, which has been identified based on how the chief operating decision maker manages the business, makes operating decisions, and evaluates operating performance.
Investments in Sponsored Programs
The Company records its investments in the launched Sponsored Programs using the equity method of accounting as it was determined that the Company has the ability to exercise significant influence, but does not have a controlling interest in the launched Sponsored Programs. Under the equity method, the investment, originally recorded at cost, is adjusted to recognize our share of net earnings or losses of the Sponsored Programs as they occur, with losses limited to the extent of our investment in, advances to, and commitments to the investee. Additionally, the Company adjusts its investment for received dividends and distributions.
Cash and Cash Equivalents
Cash and cash equivalents may consist of money market funds, demand deposits and highly liquid investments with original maturities of three months or less.
Cash may at times exceed the Federal Deposit Insurance Corporation deposit insurance limit of $250,000 per institution. The Company mitigates credit risk by placing cash with major financial institutions. To date, the Company has not experienced any losses with respect to cash.
F-8
Restricted Cash
Restricted cash consists of amounts deposited into accounts related to health savings accounts for employees. These amounts can only be used as provided for qualified health expenses, and therefore are separately presented on our consolidated balance sheets.
Due from Affiliates
Receivables due from affiliates consist primarily of investment management fees and real estate fees due to us from the Sponsored Programs and investments of the Sponsored Programs which are paid to the Company on a quarterly or monthly basis, as applicable, from each Sponsored Program that it manages and investments of the Sponsored Programs, as applicable. These receivables are generally short term and settle within 30 days. We evaluate the collectability of the balances based on historical experience, current conditions, and reasonable and supportable forecasts. The Company has not previously experienced a default related to these receivables. Due to the short-term nature of the receivables and lack of historical losses, we do not have an expectation of credit losses related to these receivables.
Property, Software and Equipment, net
Property, software and equipment consists of computer equipment, leasehold improvements, furniture and fixtures, and internal-use software, which are recorded at historical cost less accumulated depreciation and amortization.
Computer equipment and furniture and fixtures are depreciated on a straight-line basis over the asset’s estimated useful life, generally five to seven years. Maintenance and repairs are expensed as incurred. Major renewals and improvements that extend the useful lives of property and equipment are capitalized. Costs associated with construction projects are transferred to the leasehold improvement account upon project completion. Leasehold improvements are amortized over the shorter of the lease term (excluding renewal periods) or estimated useful life.
The Company capitalizes qualifying internal-use software development costs. Internal-use software is capitalized when preliminary development efforts are successfully completed and it is probable that the project will be completed, and that the software will be used as intended. Capitalized costs for internal-use software primarily consist of salaries and payroll-related costs for employees who are directly involved in the development efforts of a specific piece or pieces of software. Costs related to preliminary project activities and post implementation activities, including training and maintenance, are expensed as incurred. Costs incurred for upgrades and enhancements that are considered to be probable to result in additional functionality are capitalized.
Capitalized software costs are included in Property, software and equipment, net on the consolidated balance sheets. These costs are amortized over the estimated useful life of the software, generally four years, on a straight-line basis. The amortization of costs related to internal-use software is included in Technology and product development on the consolidated statements of operations.
The Company evaluates potential impairments of its property, software and equipment whenever events or changes in circumstances indicate that the carrying amount of the assets may not be recoverable. See Note 7, Property, Software and Equipment, net, for more detail on property, software and equipment as of December 31, 2023 and 2022.
Intangible Assets, net
Intangible assets are assets that lack physical substance and include patents, trademarks, and domain. Intangible assets with finite lives are amortized over their useful lives in a manner that best reflects their economic benefit, which may include straight-line or accelerated methods of amortization. Intangible assets with indefinite lives are not amortized. Since useful life cannot be determined, the Company evaluates these assets for impairment whenever events or changes in circumstances indicate that the carrying amount of the intangible asset may not be recoverable. If the carrying value is not determined to be recoverable, the intangible asset will be reduced to fair value. Intangible assets are included in Other assets, net, on the consolidated balance sheets. See Note 8, Intangible Assets, net, for more detail on internal-use software as of December 31, 2023 and 2022.
Promotional Shares Capitalization
The Company has offered and may in the future offer various one-time (non-recurring) promotions to new investors of certain Sponsored Programs. Customers may receive additional shares (“Promotional Shares”) upon fulfilling a promotional obligation based on the promotion terms. At the time the customer fulfills their obligation, the Company then deposits the promotional consideration, in the form of shares of a particular fund, into the customer’s account.
The Company recognizes the cost of promotional shares as an asset in the same amount as the value of the promotional consideration deposited. Promotional share capitalized costs are included in Other assets on the consolidated balance sheets.
F-9
The new investors in our Sponsored Programs who receive the promotional shares receive advisory and asset management services provided by the Company over several years. The Company’s performance obligation is satisfied over time as the Company provides these services to the customer. Therefore, the promotional costs are amortized over an estimated period of benefit of three years. The period of benefit was determined by taking into consideration the rate of change in the technology underlying the significant features of our product offerings. If there is a significant change in the estimated period of benefit, management will update the amortization period to reflect such change. Amortization is recognized as a reduction to Investment management and platform advisory fees, net within the consolidated statements of operations.
The Company evaluates these capitalized promotions for impairment whenever events or changes in circumstances indicate that the carrying amount of the capitalized promotions may not be recoverable.
Leases
Payments under our lease arrangement are fixed. Lease assets and liabilities are recognized at the present value of the future lease payments. The interest rate used to determine the present value of the future lease payments is our incremental borrowing rate, because the interest rate implicit in our leases is not readily determinable. Our incremental borrowing rate is based on the information available at the date of initial application of ASC 842 and is estimated to approximate the interest rate on a collateralized basis with similar terms and payments, and in economic environments where the leased asset is located. Our lease terms include an option to extend the lease, but it is uncertain if we will exercise that option as of December 31, 2023. We use the base, non-cancelable, lease term when determining the lease assets and liabilities. Our lease agreements contain lease components and non-lease components, both of which we have elected to account for as a single lease component.
Operating lease assets and liabilities are included on our consolidated balance sheets. Lease expense is recognized on a straight-line basis over the lease term and is included in General, administrative and other on the consolidated statements of operations.
Deferred Costs of Sponsored Programs
Deferred Costs are comprised of certain offering and other deferred costs of the Sponsored Programs initially paid by Fundrise Advisors on behalf of each Sponsored Program as well as certain management fees incurred payable to Fundrise Advisors (collectively, “Deferred Costs”), net of any fee or expense waivers. Pursuant to each of the Sponsored Programs’ operating agreements, in some cases amended and restated (the “Operating Agreements”), each of the Sponsored Programs is obligated to reimburse Fundrise Advisors, or its affiliates, as applicable, for Deferred Costs paid by them on behalf of such Sponsored Program.
Fundrise Advisors has agreements in place with the eREITs, eFund, and oFund that state the aforementioned Sponsored Programs will only reimburse Fundrise Advisors for the Deferred Costs subject to a minimum net asset value (“NAV”) per share of $10.00 (the “Hurdle Rate”). Once the NAV per share of an eREIT, eFund, or oFund exceeds the Hurdle Rate, it will start to reimburse Fundrise Advisors, without interest, for these Deferred Costs, whether incurred before or after the date that the Hurdle Rate was reached, to the extent that such reimbursement does not cause NAV per share to drop below the Hurdle Rate as a result. Further, in addition to the Hurdle Rate, reimbursements from the oFund can never exceed 0.50% of the aggregate gross offering proceeds from the oFund’s offering.
Deferred Costs for launched eREITs and the eFund are included in Other current assets, net on the consolidated balance sheets. Deferred Costs for the oFund and unlaunched Sponsored Programs are included in Other assets, net, on the consolidated balance sheets.
Deferred Costs of the Credit Fund are not subject to the Hurdle Rate. Fundrise Advisors has determined that the Credit Fund will reimburse Fundrise Advisors for the Deferred Costs in monthly installments up to 0.50% of the aggregate gross offering proceeds from the Credit Fund’s offering. As of December 31, 2023 these Deferred Costs have been fully reimbursed to the Company.
Deferred Costs of the Innovation Fund are not subject to the Hurdle Rate. Fundrise Advisors and the Innovation Fund have entered into an Expense Limitation Agreement pursuant to which Fundrise Advisors has contractually agreed to waive its Management fee and/or pay or reimburse the ordinary annual operating expenses of the Fund (including organizational and offering costs) to the extent necessary to limit the Innovation Fund’s operating expenses to 3.00% of the Innovation Fund’s daily net assets. Fundrise Advisors may seek recoupment from the Innovation Fund of fees waived or expenses paid or reimbursed to the Innovation Fund for a period ending three years after the date of the waiver, payment or reimbursement, subject to the limitation that a reimbursement will not cause the Innovation Fund’s operating, organizational, and offering expenses to exceed the lesser of (a) the expense limitation amount in effect at the time such fees were waived or expenses paid or reimbursed, or (b) the expense limitation amount in effect at the time of the reimbursement. The Expense Limitation Agreement will remain in effect at least through July 31, 2024, unless and until the Board approves its modification or termination. Certain organizational costs of the Innovation Fund were waived and expensed by Fundrise Advisors in the consolidated statements of operations. As of December 31, 2023 these Deferred Costs are considered due and receivable to the Company, subject to the contractual expense cap. To the extent said costs are not waived in line with Expense Limitation Agreement, the costs are included in Due from affiliates on the consolidated balance sheets.
F-10
Revenue Recognition
Investment Management and Platform Advisory, Net
Investment management and platform advisory fees are comprised of management fees and advisory fees earned by Fundrise Advisors.
Management fees are earned by Fundrise Advisors from the Sponsored Programs for investment management services provided. Fundrise Advisors generally assesses these fees on a quarterly or monthly basis, as applicable, from each Sponsored Program that it manages. The management fees may be waived at any time for any Sponsored Program at Fundrise Advisors’ sole discretion, and depending on the management agreement, once waived, may no longer be collectible or may be recouped pursuant to certain contractual expense limitation agreements between Fundrise Advisors and the respective Sponsored Program.
Platform advisory fees are earned by Fundrise Advisors from individual advisory clients for providing services with respect to the portfolio investment plans, auto-investment plans, and dividend re-investment plans offered on the Fundrise Platform. Fundrise Advisors reserves the right to reduce or waive this fee for certain clients without notice and without reducing or waiving this fee for all individual clients.
Investment management and platform advisory fees are accounted for as contracts with customers. Fundrise Advisors typically satisfies the performance obligations to provide investment management and advisory services over time as the services are rendered, as the benefits of the services are simultaneously received and consumed. The transaction prices are the amount of consideration to which Fundrise Advisors expects to be entitled in exchange for transferring the promised services in each instance. Fee waivers are viewed as a reduction of the transaction price and therefore reduce investment management and platform advisory fees from such customers. Investment management and platform advisory fees earned represent a form of variable consideration because the consideration Fundrise Advisors is entitled to varies based on fluctuations in the basis for investment management and platform advisory fees, for example fund net assets for management fees and AUM for advisory fees. The amount recorded as revenue in each instance is generally determined at the end of the period because these investment management and platform advisory fees are payable no less frequently than quarterly and the basis is fixed as of period end.
Real Estate Portfolio Strategy
Real estate portfolio strategy revenue consists of acquisition fees, disposition fees, origination fees, capital markets fees, and leasing commission fees earned from the services provided to certain of our affiliates through Fundrise Real Estate, LLC, a subsidiary of the Company (“Fundrise Real Estate”).
Real estate portfolio strategy revenues are generally earned as a fixed percentage of a calculation base which is typically property sales price, committed capital, debt origination amount, or total base rent. Portfolio strategy revenues are recorded at the point in time when the performance obligation is satisfied, which is generally upon transaction closing for acquisition, disposition, and origination fees, funding of debt proceeds for capital markets fees, and lease execution for leasing fees.
Acquisition fees, disposition fees, origination fees and capital markets fees are typically payable once the performance obligation is satisfied. Terms and conditions of a leasing commission fee agreement may include, but are not limited to, execution of a signed lease agreement and future contingencies, including tenant’s occupancy, payment of a deposit or payment of first month’s rent (or a combination thereof). For revenues related to leasing services, the Company’s performance obligation will typically be satisfied upon execution of a lease and the portion of the commission that is contingent on a future event will likely be recognized if deemed not subject to significant reversal, based on the Company’s estimates and judgments.
Real Estate Operating Platform
Real estate operating platform revenue consists of real estate asset management fees, debt servicing fees, development fees, and loan servicing fees earned from the services provided to certain of our affiliates through Fundrise Real Estate.
Real estate asset management fees, debt servicing fees, and development fees are accounted for as contracts with customers, and the fees earned are recognized over time as the services are rendered, as the benefits of the services are simultaneously received and consumed. Fees for these services are generally earned at a fixed percentage of a calculation base, which may be based on underlying gross property value, total indebtedness secured by a property, or total development and construction costs incurred. The transaction price is the amount of consideration to which Fundrise Real Estate expects to be entitled in exchange for transferring the promised services in each instance. These fees represent a form of variable consideration because the consideration to which Fundrise Real Estate is entitled varies based on fluctuations in the basis for the associated fee. The amount recorded as revenue in each instance is generally determined at the end of the period because these fees are payable no less frequently than quarterly and the basis is fixed as of period end.
F-11
Loan servicing fees are earned at a fixed percentage of the total amount of any proceeds used to secure the property. Fundrise Real Estate generally assesses these fees on a quarterly or monthly basis, as applicable, from each affiliate for which we provide the services. Fundrise Real Estate recognizes consideration received related to the contractually specified loan servicing fees as revenue as the services are performed. The amount recorded as revenue in each instance is generally determined at the end of the period because these loan servicing fees are payable no less frequently than quarterly and the basis is fixed as of period end.
Total revenue recognized in the current year from performance obligations satisfied in the prior year relate to development fees associated with development properties owned by our affiliates. The total revenue recognized in the current year from performance obligations satisfied in the prior year is $2.0 million, and is included within Real estate operating platform revenue on the consolidated statement of operations.
Other Operating Income
Other operating income primarily consists of money market dividends earned in connection with cash sweep accounts recognized in the month earned.
Advertising Costs
Advertising costs are expensed as incurred and are included in Marketing in the consolidated statements of operations. These costs were $6.8 million and $30.3 million for the years ended December 31, 2023 and 2022, respectively.
Income Taxes
The Company accounts for income taxes under the asset and liability method, which requires the recognition of deferred tax assets and liabilities for the expected future tax consequences of events that have been included in the consolidated financial statements. Under this method, deferred tax assets and liabilities are recognized temporary differences between the consolidated financial statement carrying amounts of existing assets and liabilities and their respective tax bases, as well as net operating loss and tax credit carryforwards. Deferred tax assets and liabilities are measured using enacted tax rates in effect for the year in which the differences are expected to reverse. The effect of a change in tax rates on deferred tax assets and liabilities is recognized in income in the period that includes the enactment date.
The Company accounts for uncertain tax positions using a two-step process whereby (i) it determines whether it is more likely than not that the tax positions will be sustained on the basis of the technical merits of the position (“more-likely-that-not recognition threshold”) and (ii) for those tax positions that meet the more-likely-than-not recognition threshold, it recognizes the largest amount of tax benefit that is more than 50 percent likely to be realized upon ultimate settlement with the related tax authority.
The Company recognizes interest and penalties accrued on any unrecognized tax benefits as a component of provision for income tax in the consolidated statement of operations. As of December 31, 2023 and 2022, no unrecognized tax benefits have been recorded.
F-12
The Company recognizes a valuation allowance which reduces the deferred tax assets to the amount we believe these assets are more likely than not to be realized. In making such a determination, the Company considers all available positive and negative evidence, including future reversals of existing taxable temporary differences, projected future taxable income, tax-planning strategies, and results of recent operations. If the Company determines that it would be able to realize our deferred tax assets in the future in excess of their net recorded amount, the Company would make an adjustment to the deferred tax asset valuation allowance, which would reduce the provision for income taxes. As of December 31, 2023 and 2022, respectively, the value of the deferred tax asset, net of the valuation allowance, was $0.
Extended Transition Period
Under Section 107 of the Jumpstart Our Business Startups Act of 2012, we are permitted to use the extended transition period provided in Section 7(a)(2)(B) of the Securities Act for complying with new or revised accounting standards. This permits us to delay the adoption of certain accounting standards until those standards would otherwise apply to private companies. We have elected to use the extended transition period provided in Section 7(a)(2)(B) of the Securities Act for complying with new or revised accounting standards that have different effective dates for public and private companies until the earlier of the date that we (i) are no longer an emerging growth company or (ii) affirmatively and irrevocably opt out of the extended transition period provided in Section 7(a)(2)(B). By electing to extend the transition period for complying with new or revised accounting standards, these consolidated financial statements may not be comparable to companies that adopt accounting standard updates upon the public business entity effective dates.
Recent Accounting Pronouncements
In February 2016, the FASB issued ASU No. 2016-02, Leases (Topic 842), which sets forth principles for the recognition, measurement, presentation and disclosure of leases for both parties to a contract (i.e., lessors and lessees). The Company has adopted the new standard effective January 1, 2022 and took the transition approach to not restate comparative periods. The Company elected to use the practical expedients under the transition provisions under which the Company would not need to reassess whether an arrangement is or contains a lease, lease classification and the accounting for initial direct costs. The Company also elected the practical expedient permitted in ASU 2018-11 by combining lease and non-lease components for our leases and by applying the new guidance. The Company is the lessee under one corporate office lease, which has been recognized as a right-of-use asset and related lease liability on the consolidated balance sheets. Based on its election of the practical expedients, the Company was not required to reassess the classification of the corporate office lease, and therefore, the lease continues to be accounted for as an operating lease. The adoption of this standard resulted in the recognition of a right-of-use asset of approximately $4.4 million and a lease liability of approximately $6.9 million at the beginning of 2022. The net operating lease right-of-use asset includes the effect of reclassifying deferred rent and lease incentives as an offset in accordance with the transition guidance.
In June 2016, the FASB issued ASU 2016-13 (“ASU 2016-13”), Financial Instruments-Credit Losses: Measurement of Credit Losses on Financial Instruments, which requires the measurement and recognition of expected credit losses for financial assets held at amortized cost. ASU 2016-13 replaces the existing incurred loss impairment model with an expected loss methodology, which will result in more timely recognition of credit losses. Under ASU 2016-13, the Company is required to measure all expected credit losses for financial assets held at the reporting date based on historical experience, current conditions, and reasonable and supportable forecasts. The Company adopted ASU 2016-13 effective January 1, 2023. As part of its adoption process, the Company assessed the collection risk of the outstanding amounts due from its sponsored programs, investors, and other affiliates, which have low risk of credit loss based on the Company’s historical experience. Therefore the adoption of ASU 2016-13 did not have a material impact on our consolidated financial statements.
In August 2020, the FASB issued ASU No. 2020-06, Debt - Debt with Conversion and Other Options (Subtopic 470-20) and Derivatives and Hedging - Contracts in Entity’s Own Equity (Subtopic 815-40), which simplifies the accounting for convertible debt instruments and convertible preferred stock by reducing the number of accounting models and limiting the number of embedded conversion features separately recognized from the primary contract. The guidance also includes targeted improvements to the disclosures for convertible instruments and earnings per share. The ASU is effective for fiscal years beginning after December 15, 2023, with early adoption permitted. The Company is currently evaluating the extent of the impact of this ASU on our consolidated financial statements.
F-13
3. Net Loss Per Share and Net Loss Attributable to Common Stockholders
Basic (loss) earnings per share (“EPS”) is the amount of net loss available to each share of common stock outstanding during the reporting period. Diluted EPS is the amount of net loss available to each share of common stock outstanding during the reporting period, adjusted to include the effect of potentially dilutive common stock. Potentially dilutive common stock includes incremental shares issued for stock awards and convertible preferred stock. For periods of net loss, basic and diluted EPS are the same as the assumed exercise of stock awards and the conversion of preferred stock is anti-dilutive.
We calculate EPS using the two-class method. The two-class method allocates net (loss) income, that otherwise would have been available to common stockholders, to holders of participating securities. We consider all series of our convertible preferred stock to be participating securities due to their non-cumulative dividend rights. In a period with net income, both earnings and dividends (if any) are allocated to participating securities. In a period with a net loss, only declared dividends (if any) are allocated to participating securities. All participating securities are excluded from basic weighted-average share of common stock outstanding.
The following table presents the calculation of basic and diluted net loss per share attributable to Rise Companies Corp. Class A, Class B, and Class F common stockholders (in thousands, except share and per share data):
| Year Ended December 31, | ||||||||
| 2023 | 2022 | |||||||
| Numerator: | ||||||||
| Net loss | (5,264 | ) | (40,368 | ) | ||||
| Less: net income attributable to noncontrolling interest | 489 | 250 | ||||||
| Net loss attributable to common stockholders | $ | (5,753 | ) | $ | (40,618 | ) | ||
| Denominator: | ||||||||
| Weighted-average common shares outstanding – basic and diluted | 31,972,371 | 29,846,943 | ||||||
| Net loss per share attributable to common stockholders - basic and diluted | $ | (0.18 | ) | $ | (1.36 | ) | ||
The following potential common shares were excluded from the calculation of diluted net loss per share attributable to Rise Companies Corp. Class A, Class B, and Class F common stockholders because their effect would have been anti-dilutive or issuance of such shares is contingent upon the satisfaction of certain conditions which were not satisfied by the end of the period:
| Year Ended December 31, | ||||||||
| 2023 | 2022 | |||||||
| Redeemable convertible preferred stock | 11,865,046 | 11,865,046 | ||||||
| Restricted stock options | 11,500 | 11,500 | ||||||
| Restricted stock units | 7,551,170 | 6,136,523 | ||||||
| Total anti-dilutive securities | 19,427,716 | 18,013,069 | ||||||
F-14
| 4. | Fair Value of Financial Instruments |
We are required to disclose an estimate of fair value of our financial instruments for which it is practicable to estimate the value. U.S. GAAP defines the fair value as the price that the Company would receive to sell an asset or pay to transfer a liability in an orderly transaction between market participants at the measurement date. For certain of our financial instruments, fair values are not readily available since there are no active trading markets as characterized by current exchanges by willing parties.
We determine the fair value of certain investments in accordance with the fair value hierarchy that requires an entity to maximize the use of observable inputs. The fair value hierarchy includes the following three levels based on the objectivity of the inputs, which were used for categorizing the assets or liabilities for which fair value is being measured and reported:
Level 1 – Quoted market prices in active markets for identical assets or liabilities.
Level 2 – Significant other observable inputs (e.g., quoted prices for similar items in active markets, quoted prices for identical or similar items in markets that are not active, inputs other than quoted prices that are observable such as interest rate and yield curves, and market-corroborated inputs).
Level 3 – Valuation generated from model-based techniques that use inputs that are significant and unobservable in the market. These unobservable assumptions reflect estimates of inputs that market participants would use in pricing the asset or liability. Valuation techniques include use of option pricing models, discounted cash flow methodologies or similar techniques, which incorporate management’s own estimates of assumptions that market participants would use in pricing the instrument or valuations that require significant management judgment or estimation.
As of December 31, 2023, the Company’s significant financial instruments consist of cash and cash equivalents, loan payable, and note receivable. As of December 31, 2022, the Company’s significant financial instruments consisted of cash and cash equivalents and loan payable. The carrying amount of the Company’s financial instruments approximates their fair values due to their short-term nature, with the exception of the loan payable. As of December 31, 2023 and 2022, the aggregate principal balance of our loan payable was approximately $2.7 million, and the aggregate fair value approximated its carrying value. The aggregate fair value of the loan payable is based on unobservable Level 3 inputs which management has determined to be its best estimate of current market values. The method utilized included a discounted cash flow method (an income approach). Significant inputs and assumptions include the current market discount rates, and expected repayment and prepayment dates.
On January 8, 2019, the Company entered into a ten-year non-cancelable operating lease agreement, expiring on August 31, 2030, for office space located at 11 Dupont Circle NW, Washington, DC 20036. The lease includes one option to renew, but the renewal is not deemed to be reasonably assured as of December 31, 2023. Our lease agreement does not contain any material residual value guarantees or material restrictive covenants.
Operating lease expense was $802,000 for the years ended December 31, 2023 and December 31, 2022.
As of December 31, 2023, our lease had a remaining lease term of 6.7 years and a discount rate of 7.5%. Future lease payments as of December 31, 2023 were as follows (in thousands):
| Operating Leases | ||||
| 2024 | $ | 1,033 | ||
| 2025 | 1,059 | |||
| 2026 | 1,086 | |||
| 2027 | 1,113 | |||
| 2028 | 1,140 | |||
| Thereafter | 1,963 | |||
| Total future lease payments | 7,394 | |||
| Less: Imputed interest | 1,593 | |||
| Present value of lease liabilities | $ | 5,801 | ||
| Lease liabilities, current | 998 | |||
| Lease liabilities, non-current | 4,803 | |||
| Present value of lease liabilities | $ | 5,801 | ||
F-15
Other information related to our lease for the years ended December 31, 2023 and 2022 is as follows (in thousands):
| December 31, | December 31, | |||||||
| 2023 | 2022 | |||||||
| Cash paid for amounts included in the measurement of lease liabilities: | ||||||||
| Operating cash flows | $ | 1,008 | 983 | |||||
| Right-of-use assets obtained in exchange for new operating lease liabilities | $ | - | 4,414 | |||||
| New operating lease liabilities recognized | $ | - | 6,850 | |||||
6. Investments in Sponsored Programs
The Company records its investments in the Sponsored Programs using the equity method of accounting. As of December 31, 2023 and 2022, the Investments in Sponsored Programs totaled $2,756,000 and $2,796,000 respectively.
The Company has a percentage ownership in each of the Sponsored Programs of less than 1%.
7. Property, Software and Equipment, net
Property, software and equipment, net, consist of the following (in thousands):
| December 31, | December 31, | |||||||
| 2023 | 2022 | |||||||
| Internal-use software | $ | 47,641 | $ | 32,904 | ||||
| Computer equipment | 875 | 890 | ||||||
| Furniture and fixtures | 236 | 246 | ||||||
| Leasehold Improvements | 1,668 | 1,668 | ||||||
| Total property, software and equipment | 50,420 | 35,708 | ||||||
| Less: accumulated amortization and depreciation | (19,157 | ) | (11,687 | ) | ||||
| Total property, software and equipment, net | $ | 31,263 | $ | 24,021 | ||||
Amortization and depreciation expense on property, software and equipment was approximately $7,616,000 and $3,897,000 for the years ended December 31, 2023 and 2022, respectively. Included in these amounts were the amortization of capitalized internal-use software costs of $7,253,000 and $3,531,000, for the fiscal years ended December 31, 2023 and December 31, 2022, respectively.
The Company wrote off $407,000 and $0 of internal-use software and reversed $74,000 and $0 of accumulated amortization as a result of the write-offs for the years ended December 31, 2023 and 2022, respectively. The resulting impairment loss of $333,000 for the year ended December 31, 2023 is included in Technology and product development on the consolidated statement of operations. The Company wrote off $88,000 and $185,000 of computer equipment and furniture and fixtures and reversed $72,000 and $92,000 of accumulated depreciation as a result of the write-offs for the years ended December 31, 2023 and 2022, respectively. The resulting losses on disposition of assets of $14,000 and $87,000 for the years ended December 31, 2023 and 2022, respectively, are included in General, administrative and other expenses on the consolidated statements of operations.
Intangible assets, net, consist of the following and are included in Other assets, net, in the consolidated balance sheets (in thousands):
| December 31, | December 31, | |||||||
| 2023 | 2022 | |||||||
| Patents, trademarks, and domain | 360 | 349 | ||||||
| Total intangible assets | 360 | 349 | ||||||
| Less: accumulated amortization | (107 | ) | (96 | ) | ||||
| Total intangible assets, net | $ | 253 | $ | 253 | ||||
Amortization expense of trademarks was approximately $14,000 for the years ended December 31, 2023 and 2022.
For the year ended December 31, 2023, the Company recognized losses of $3,000 related to trademarks no longer being maintained. No intangible assets were impaired as of December 31, 2022.
F-16
The expected future amortization expense for intangible assets subject to amortization as of December 31, 2023 is as follows (in thousands):
| Year ending December 31, | Future Amortization Expense | |||
| 2024 | $ | 8 | ||
| 2025 | 8 | |||
| 2026 | 7 | |||
| 2027 | 7 | |||
| 2028 | 7 | |||
| Thereafter | 14 | |||
| Total | $ | 51 | ||
Certain intangible assets are not amortized either due to the nature of the asset or due to legal rights not yet issued. The carrying value of these assets not subject to amortization is as follows (in thousands):
| December 31, 2023 | December 31, 2022 | |||||||
| Patents and domain | 202 | 186 | ||||||
| Total carrying value not subject to amortization | $ | 202 | $ | 186 | ||||
PPP Loan Payable
On April 20, 2020, we entered into a loan agreement with Citizens Bank as the lender (the “Lender”), pursuant to which the Lender provided a loan under the Paycheck Protection Program (the “PPP Loan”) offered by the U.S. Small Business Administration (the “SBA”) in a principal amount of $2,793,800 pursuant to Title 1 of the Coronavirus Aid, Relief and Economic Security Act (the “CARES Act”).
The interest rate on the PPP Loan is a fixed rate of 1% per annum. To the extent that the amounts owed under the PPP Loan, or a portion of them, are not forgiven, we will be required to make principal and interest payments in monthly installments. In July 2021, the Company applied for forgiveness of the PPP Loan with our Lender. As of December 31, 2023, the Company’s PPP loan forgiveness application is under review before the SBA. The PPP Loan’s initial maturity date was April 19, 2022 and was subsequently extended to April 19, 2025.
According to the terms of the Paycheck Protection Program, the subsequent passing of the Paycheck Protection Program Flexibility Act (the “PPPFA Act”), and current guidance from the SBA and U.S. Department of Treasury, all or a portion of loans under the program may be forgiven if the PPP Loan proceeds are used for permitted expenses, as outlined in the CARES Act and related regulations. Under the terms of the loan agreement as written, until such time as the SBA issues a determination on the forgiveness, future annual minimum loan payments are anticipated to be approximately $2.7 million through 2025.
The PPP Loan includes events of default. Upon the occurrence of an event of default, the Lender will have the right to exercise remedies against us, including the right to require immediate payment of all amounts due under the PPP Note.
As of December 31, 2023 and 2022, remaining outstanding principal of the PPP Loan was $2,690,000. As of December 31, 2023 and 2022, the PPP Loan has accrued interest of $48,000 and $21,000, respectively.
F-17
| 10. | Supplemental Financial Statement Information |
Accrued expenses consist of the following (in thousands):
| December 31, | December 31, | |||||||
| 2023 | 2022 | |||||||
| Accrued compensation and employee benefits | $ | 7,600 | $ | 5,482 | ||||
| Accrued deferred costs of Sponsored Programs | - | 539 | ||||||
| Accrued marketing expenses | - | 357 | ||||||
| Accrued audit and tax expenses | 218 | 165 | ||||||
| Other accrued expenses | 77 | 394 | ||||||
| Total accrued expenses | $ | 7,895 | $ | 6,937 | ||||
| 11. | Stock-Based Compensation and Other Employee Benefits |
Stock-Based Compensation
Under our 2014 Stock Option and Grant Plan, we may grant unrestricted stock grants, restricted stock grants (“RSGs”), restricted stock units (“RSUs”), or restricted stock options (“RSOs”) to purchase shares of common stock to employees, executives, directors, and consultants. A total of 20,100,000 shares and 10,100,000 shares of Class A Common Stock have been authorized for issuance under the 2014 Stock Option and Grant Plan (the “Plan”) as of December 31, 2023 and 2022, respectively. On December 5, 2023, the Company received the requisite consent of its stockholders to the amendment of the Plan to increase the number of shares of Class A Common Stock eligible for grant under the Plan by 10,000,000 shares of Class A Common Stock, from 10,100,000 shares to 20,100,000 shares. The Company has issued RSGs, RSUs, and RSOs as of December 31, 2023.
The RSGs issued and outstanding generally followed a vesting schedule whereby 25% of the award vests twelve months from the vesting commencement date, and 6.25% vest quarterly thereafter, provided the grantee remained continuously employed by the Company through each vesting date. The Board of Directors retains the authority to grant future shares with different terms. The Company issued no RSGs and no shares were forfeited for the years ended December 31, 2023 and 2022. The Company recognized $0 of stock-based compensation expense related to RSGs issued in prior years during the years ended December 31, 2023 and 2022. As of December 31, 2023 and 2022, there were no remaining unvested shares and no unrecognized stock-based compensation expense.
The Company issued RSOs in 2017 only. These options generally follow a vesting schedule whereby 25% of the award vests twelve months from the vesting commencement date, and 1/36 vest monthly thereafter, provided the grantee remains continuously employed by the Company through each vesting date. Generally, RSOs granted are exercisable for up to ten years from the date of the grant. The Board of Directors retains the authority to grant future options with different terms. The Company issued no stock options and no shares were forfeited for the years ended December 31, 2023 and 2022. The Company recognized $0 of stock-based compensation expense related to RSOs during the years ended December 31, 2023 and 2022, respectively. As of both December 31, 2023 and 2022, there were no remaining unvested shares and no unrecognized stock-based compensation expense.
F-18
RSUs issued through December 31, 2023 and 2022 generally follow a time-based vesting schedule whereby 25% of the award vests twelve months from the vesting commencement date, and 6.25% vest quarterly thereafter, provided the grantee remains continuously employed by the Company through each vesting date; however, the Board of Directors retains the authority to grant future shares with different terms. The RSUs are also subject to performance-based vesting, and will only satisfy this requirement on the first of the following to occur: (i) immediately prior to a Company sale event or (ii) the Company’s Initial Public Offering. RSUs granted but not vested expire seven years after the grant date.
The grant-date fair value of RSUs is estimated based on the fair value of our common stock on the date of grant. The Company considers numerous objective and subjective factors to determine the fair value of our common stock including: sales of our common stock to third-party investors in arms-length transactions, our operating and financial performance, the valuation of comparable companies, the lack of marketability, and general and industry specific economic outlook, amongst other factors.
The Company recognizes stock-based compensation expense for RSUs on an accelerated attribution method over the requisite service period, and only if performance-based conditions are considered probable to be satisfied. As of December 31, 2023 and 2022, we had not recognized stock-based compensation for the RSUs because the performance requirement had not occurred, and therefore, could not be considered probable. In the period in which our qualifying event is probable, we will record a cumulative one-time stock-based compensation expense determined using the grant-date fair values. Stock-based compensation related to remaining time-based service after the qualifying event will be recorded over the remaining requisite service period. The total unrecognized share-based compensation expense related to these awards was $88.1 million as of December 31, 2023. Of this amount, $40.2 million relates to awards for which the time-based vesting condition has been satisfied or partially satisfied, while $47.9 million relates to awards for which the time-based vesting condition had not yet been satisfied.
The following table summarizes the activity related to our RSUs for the year ended December 31, 2023:
| Number of RSUs | Weighted-average grant date fair value | |||||||
| Unvested restricted stock at December 31, 2022 | 6,136,523 | $ | 10.55 | |||||
| Granted | 1,885,337 | 15.24 | ||||||
| Forfeited | (470,690 | ) | 13.28 | |||||
| Unvested restricted stock at December 31, 2023 | 7,551,170 | $ | 11.67 | |||||
There was no net income tax benefit recognized relating to stock-based compensation expense and no tax benefits have been realized from RSGs or RSOs due to the full valuation allowance during the years ended December 31, 2023 and 2022.
Employee Retirement Plan
Effective January 1, 2020, the Company established an employer-sponsored employee retirement 401(k) plan. All of our employees qualify to participate under the plan criteria. Participants may elect to contribute any portion of their annual compensation up to the maximum limit imposed by federal tax law. For the years ended December 31, 2023 and 2022, the Company made non-elective contributions to each employee equal to 3% of their compensation, which totaled approximately $1,658,000 and $1,537,000 respectively.
| 12. | Income Tax |
Our income tax benefit (expense) consisted of the following for the years ended December 31, 2023 (in thousands):
| December 31, | December 31, | |||||||
| 2023 | 2022 | |||||||
| Current: | ||||||||
| Federal | $ | - | $ | - | ||||
| State | (46 | ) | (1 | ) | ||||
| Foreign | - | - | ||||||
| Total current | (46 | ) | (1 | ) | ||||
| Deferred: | ||||||||
| Federal | $ | - | $ | - | ||||
| State | - | - | ||||||
| Foreign | - | - | ||||||
| Total deferred | - | - | ||||||
| Total income tax benefit (expense): | (46 | ) | (1 | ) | ||||
F-19
The Tax Cuts and Jobs Act imposed a limitation on a corporation’s ability to utilize federal net operating losses generated in taxable years beginning on or after January 1, 2018 to 80% of taxable income in a given year. Although net operating losses generated in taxable years beginning on or after January 1, 2018 are subject to this limitation, any net operating losses generated prior to such date may be utilized to offset 100% of federal tax income.
The Company’s effective tax rate for both 2023 and 2022 was 0% as a result of our valuation allowance in both years, which fully offsets net deferred tax assets.
Loss before provision for income taxes for the years ended December 31, 2023 and 2022 was as follows (in thousands):
| Loss before taxes | 2023 | 2022 | ||||||
| Domestic | $ | (5,707 | ) | $ | (40,617 | ) | ||
| Foreign | - | - | ||||||
F-20
The following table presents the significant components of the Company’s deferred tax assets and liabilities (in thousands):
| December 31, | December 31, | |||||||
| 2023 | 2022 | |||||||
| Deferred tax assets: | ||||||||
| Net operating loss carryforwards | $ | 37,425 | $ | 39,621 | ||||
| Stock-based compensation | 1,126 | 1,011 | ||||||
| Right-of-Use Liability/Pre-ASC 842 Deferred Rent | 1,577 | 1,552 | ||||||
| Section 163(j) Limitation | - | 335 | ||||||
| Section 174 R&E Expenses | 4,724 | 1,035 | ||||||
| Accrued compensation | 296 | 22 | ||||||
| Other deferred tax assets | 159 | 140 | ||||||
| Gross deferred tax assets | 45,307 | 43,716 | ||||||
| Valuation allowance | (41,799 | ) | (39,551 | ) | ||||
| Deferred tax assets, net of valuation allowance | 3,508 | 4,165 | ||||||
| Deferred tax liabilities: | ||||||||
| Internal-use software | (1,885 | ) | (2,488 | ) | ||||
| Right-of-Use Asset | (1,020 | ) | (1,002 | ) | ||||
| Prepaid expenses | (315 | ) | (296 | ) | ||||
| Fixed Assets | (274 | ) | (363 | ) | ||||
| Other deferred tax liabilities | (14 | ) | (16) | |||||
| Total deferred tax liabilities | (3,508 | ) | (4,165 | ) | ||||
| Net deferred tax assets: | $ | - | $ | - | ||||
Management assesses all available positive and negative evidence to estimate if sufficient future taxable income will be generated to utilize the existing deferred tax assets. On the basis of this evaluation, as of December 31, 2023, a valuation allowance of $41.8 million has been recorded to recognize only deferred tax assets that are more likely than not to be realized.
At December 31, 2023, the Company had federal and state net operating loss (NOL) carryforwards of approximately $144 million and $128 million, respectively, to offset future taxable income. The Company’s federal and state net operating loss carryforwards will begin expiring in 2034 and 2035, respectively.
As of December 31, 2023, the Company did not record any cumulative unrecognized tax benefits on its consolidated balance sheets.
The Company identifies the U.S. and District of Columbia as its major tax jurisdictions. The tax period for the taxable year ending December 31, 2020 and all tax periods following remain open to examination by the major taxing authorities in all jurisdictions where we are subject to taxation.
| 13. | Restructuring Costs |
In December 2022, we initiated a company-wide involuntary workforce reduction as part of our efforts to further drive efficiency, increase focus on our strategic priorities, and improve operating costs (the “Restructuring”). As a result of the Restructuring, we incurred severance, benefits, and related employee costs. Additionally, we incurred additional expense for computer equipment disposed in connection with the Restructuring. As of December 31, 2023, we do not expect to incur any material additional expense in future periods related to the Restructuring.
F-21
The following table presents the total restructuring costs as recorded in the consolidated statements of operations as of December 31, 2022 (in thousands):
| Employee Costs | Equipment | Total Costs | ||||||||||
| Marketing | $ | 490 | $ | - | $ | 490 | ||||||
| Real estate strategy and operations | 708 | - | 708 | |||||||||
| Technology and product development | 1,104 | - | 1,104 | |||||||||
| General, administrative and other | 798 | 73 | 871 | |||||||||
| Total restructuring costs | $ | 3,100 | $ | 73 | $ | 3,173 | ||||||
The Company did not incur any restructuring costs during the year ended December 31, 2023.
The following table displays a roll forward of the accrual for restructuring costs recorded in Accrued expenses on the consolidated balance sheets (in thousands):
| Restructuring activity: | ||||
| Restructuring liability as of January 1, 2022 | $ | - | ||
| Expense incurred | 3,173 | |||
| Payments | (2,905 | ) | ||
| Restructuring liability as of December 31, 2022 | $ | 268 | ||
| Payments | (268 | ) | ||
| Restructuring liability as of December 31, 2023 | $ | - |
| 14. | Stockholders’ Equity |
Preferred Stock
The outstanding shares of Series A convertible preferred stock are not mandatorily or otherwise redeemable. The sale of all, or substantially all, of the Company’s assets, a consolidation or merger with another company, or a transfer of voting control in excess of fifty percent (50%) of the Company’s voting power are all events which are deemed to be a liquidation and would trigger the payment of liquidation preferences under the Company’s Certificate of Incorporation. All such events require approval of the Board; however, in such events, all holders of equal or more subordinate equity instruments would also be entitled to receive the same form of consideration after any liquidation preferences. The significant terms of outstanding Series A are as follows:
Conversion – Each share of Series A is convertible, at the option of the holder, initially, into one share of Class A Common Stock (subject to adjustments for events of dilution). Each share of convertible preferred stock will automatically be converted upon: (i) the election of a majority of the outstanding shares of such series of preferred stock; or (ii) the consummation of an underwritten registered public offering with aggregate proceeds in excess of $35 million (a “Qualified Public Offering”). The Company’s Certificate of Incorporation contains certain anti-dilution provisions, whereby if the Company issues additional shares of capital stock for an effective price lower than the conversion price for a series of preferred stock immediately prior to such issue, then the existing conversion price of such series of preferred stock will be reduced. The Company determined that while its convertible preferred stock contains certain anti-dilution features, the conversion feature embedded within its convertible preferred stock does not require bifurcation under the guidance of ASC 815, Derivatives and Hedging Activities.
Liquidation preference – Upon any liquidation, winding up or dissolution of the Company, whether voluntary or involuntary (a “Liquidation Event”), before any distribution or payment will be made to the holders of any common stock, the holders of convertible preferred stock will be entitled to receive, by reason of their ownership of such stock, an amount per share of Series A equal to $2.1872 (as adjusted for stock splits, recapitalizations and other similar events) plus all declared and unpaid dividends (the “Series A Preferred Liquidation Preference”). However, if upon any such Liquidation Event, our assets are insufficient to make payment in full to all holders of convertible preferred stock of their respective liquidation preferences, then the entire balance of the Company’s assets legally available for distribution will be distributed with equal priority between the preferred holders based upon the amount of each such holders’ Series A Preferred Liquidation Preference. Any excess assets, after payment in full of the liquidation preferences to the convertible preferred stockholders, are then allocated to the holders of the common stock, pro-rata.
Dividends – If and when declared by the Board, the holders of Series A and common stock, on a pari passu basis, will be entitled to receive dividends. As of December 31, 2023 and 2022 we have not declared any dividends on preferred stock or common stock.
Voting rights – Generally, preferred stockholders have one vote for each share of common stock that would be issuable upon conversion of preferred stock. Voting as a separate class, the Series A stockholders are entitled to elect one member of the Board. The holders of common stock, voting as a separate class, are entitled to elect two members of the Board. The remaining two members are elected by the preferred stockholders and common stockholders voting together as a single class on an as-if-converted to common stock basis. The Company has adopted a dual-class common stock structure, pursuant to which each share of Class A Common Stock will have one vote per share and each share of Class F Common Stock will have ten votes per share.
F-22
Common Stock
Class A Common Stock
As of December 31, 2023 and 2022, there were 2,888,859 shares issued and 2,455,894 shares outstanding. Holders of our Class A Common Stock are entitled to one (1) vote for each share held of record on all matters submitted to a vote of stockholders.
Class F Common Stock
In April of 2014, the Company issued 10,000,000 shares of Class F Common Stock to Daniel Miller and to Benjamin Miller, with a par value of $0.0001 per share. Each share of the Class F Common Stock is entitled to ten (10) votes per share. As of December 31, 2023 and 2022 respectively, there were 10,000,000 shares of Class F Common Stock issued and outstanding.
Class B Common Stock
On January 19, 2017, the Board of Directors of the Company created a new class of Common Stock, to be designated as Class B Common Stock, with a par value of $0.0001 per share. As of December 31, 2023 and 2022, 38,000,000 shares have been authorized as Class B Common Stock. As of December 31, 2023 and 2022 respectively, there were 21,538,013 and 19,322,411 shares of Class B Common Stock issued and 20,653,333 and 18,758,938 shares outstanding. Except as required by applicable law, the holders of our Class B Common Stock are not entitled to vote on any matters submitted to a vote of stockholders.
Investors’ Rights Agreement
In 2014 we entered into an Investors’ Rights Agreement (the “IRA”) with certain holders of our Class F Common Stock and Series A Preferred Stock, including persons who held more than 10% of any class of our outstanding capital stock, certain of our executive officers and directors and entities with which certain of our directors are affiliated. Pursuant to the IRA, the holders of certain shares of our common stock and preferred stock are entitled to certain registration rights, information rights and preemptive rights.
Right of First Refusal and Co-Sale Agreement
In 2014, we entered into a Right of First Refusal and Co-Sale Agreement (the “Co-Sale Agreement”) with certain holders of our common stock and preferred stock, including persons who hold more than 10% of our outstanding capital stock, certain of our executive officers and directors, and entities with which certain of our directors are affiliated. Pursuant to the Co-Sale Agreement, the holders of our preferred stock have rights of first refusal and co-sale with respect to certain transfers made by certain holders of our common stock.
Voting Agreement
In 2014 we entered into a Voting Agreement (the “Voting Agreement”) with certain holders of our Class F Common Stock and Series A Preferred Stock, including persons who held more than 10% of any class of our outstanding capital stock, our executive officers and directors, and entities with which certain of our directors are affiliated. Pursuant to the Voting Agreement, the holders of certain shares of our common stock and preferred stock have agreed to vote their shares on certain matters, including with respect to the election of directors.
| 15. | Variable Interest Entities |
Pursuant to GAAP consolidation guidance, the Company consolidates certain VIEs for which it is the primary beneficiary. As of December 31, 2023 and 2022 the Company consolidated Fundrise LP, a sidecar fund which was formed to support assets originated and facilitated by the Fundrise Platform, and the Company’s overall growth and profitability. Rise Companies acts as the General Partner of Fundrise LP through a wholly-owned subsidiary, holds a 2% ownership interest in Fundrise LP and has the ability to manage its assets. The Company does not provide performance guarantees and has no other financial obligation to provide funding to Fundrise LP. The assets of Fundrise LP may only be used to settle obligations of Fundrise LP. In addition, there is no recourse to the Company for Fundrise LP’s liabilities. As of December 31, 2022 the Company consolidated the Fundrise Opportunistic Credit Fund, LLC one of the Company’s Sponsored Programs, prior to its launch on February 28, 2023. Upon the launch of the Credit Fund to third-party investors the fund was deconsolidated as the Company was no longer the primary beneficiary. Refer to Note 2, Summary of Significant Accounting Policies - Deferred Costs of the Sponsored Programs for further detail of financial obligations related to the Credit Fund.
F-23
The non-controlling interests (“NCI”) are related to the limited partner holdings in Fundrise LP in which we have a controlling financial interest. NCI for the years ended December 31, 2023 and 2022, respectively, were $10,534,000 and $10,149,000. As of December 31, 2023, the assets in the limited partnership were primarily cash and cash equivalents, note receivable from the Sponsored Programs, and investments in the Sponsored Programs. As of December 31, 2022, the assets in the limited partnership were primarily held as cash and cash equivalents and investments in the Sponsored Programs.
The Company holds variable interests in certain VIEs which are not consolidated as it is determined that the Company is not the primary beneficiary, including its investments in the eREITs, eFund, oFund and the Credit Fund as of December 31, 2023, and the eREITs, eFund, and the oFund as of December 31, 2022. The Company’s involvement with such entities is in the form of direct equity interests, fee arrangements, and a note receivable. The maximum exposure to loss represents the loss of assets recognized by the Company relating to non-consolidated VIEs. The Company’s maximum exposure to loss relating to non-consolidated VIEs were as follows (in thousands):
| December 31, | December 31, | |||||||
| 2023 | 2022 | |||||||
| Investment in Sponsored Programs | $ | 923 | $ | 948 | ||||
| Due from affiliates | 3,076 | 2,971 | ||||||
| Other assets, net | 1,575 | 1,033 | ||||||
| Note receivable from Sponsored Program | 9,000 | - | ||||||
| Maximum Exposure to Loss | $ | 14,574 | $ | 4,952 | ||||
| Amounts Due to Non-Consolidated VIEs | $ | 60 | $ | - | ||||
| 16. | Related Party Transactions |
In addition to those disclosed elsewhere in the Notes to the Consolidated Financial Statements, the following related party transactions are disclosed:
Affiliate Receivables and Payables
Due from affiliate receivables consist of the following (in thousands):
| December 31, | December 31, | |||||||
| 2023 | 2022 | |||||||
| Investment management and platform advisory receivables | $ | 4,011 | $ | 4,093 | ||||
| Real estate portfolio strategy receivables | 457 | 600 | ||||||
| Real estate operating platform receivables | 2,369 | 1,079 | ||||||
| Other receivables from affiliates | 1,104 | 1,360 | ||||||
| Total due from affiliate | $ | 7,941 | $ | 7,132 | ||||
Deferred costs of the Sponsored Programs are approximately $1,575,000 and $1,033,000 and are included in Other assets, net on the consolidated balance sheets as of December 31, 2023 and 2022, respectively. Amounts due to affiliates are approximately $517,000 and $4,000 and are included in Other current liabilities on the consolidated balance sheets as of December 31, 2023 and 2022, respectively.
Investments in Sponsored Programs by Company’s Executives
Many of the Company’s executive officers and directors (including immediate family members) have opened investor accounts on the Fundrise Platform. All investments (and redemptions, where applicable) were made in the ordinary course of business and transacted on terms and conditions that were not more favorable than those obtained by third-party investors.
Fundrise LP Promissory Note
On January 20, 2023, Fundrise LP as the lender entered into a promissory note agreement with the Fundrise Opportunistic Credit Fund, LLC as the borrower to meet short-term obligations to purchase investments. The principal of the note was $9,000,000 with a maturity date of November 30, 2023 and an effective interest rate of 4.5%. The loan agreement was extended prior to the loan maturing, with the new agreement having a maturity date of November 30, 2024 and an effective interest rate of 5.25%. The principal is included in Note Receivable from Sponsored Program on the consolidated balance sheets. Interest revenue is recognized on an accrual basis and the accrued interest on the note is included in Other current assets, net on the consolidated balance sheets as of December 31, 2023.
F-24
| 17. | Commitments and Contingencies |
Liquidation Support Agreement – Fundrise Equity REIT, LLC
To mitigate the effect of one of our initial Sponsored Programs, Fundrise Equity REIT, LLC’s, lack of assets, revenue, and operating history, Fundrise Advisors agreed to make a payment to the eREIT, LLC of up to $500,000 if the distributions paid upon liquidation (together with any distributions made prior to liquidation) are less than a 20% average annual non-compounded return. This is a contingent liability and is not accrued for at December 31, 2023 or 2022. The following table details the amount of payment at varying levels of return (in thousands):
| Average Annual Non-Compounded Return | Liquidation Support Payment | |||
| 17.0% or less | $ | 500 | ||
| 17.1% to 18.0% | $ | 400 | ||
| 18.1% to 19.0% | $ | 300 | ||
| 19.1% to 19.9% | $ | 200 | ||
| 20.0% or greater | $ | 0 | ||
Legal Proceedings
As of the date of these consolidated financial statements, we are not currently named as a defendant in any active or pending material litigation. However, it is possible that the Company could become involved in various litigation matters arising in the ordinary course of our business. Although we are unable to predict with certainty the eventual outcome of any litigation, management is not aware of any litigation likely to occur that we currently assess as being significant to us.
| 18. | Subsequent Events |
Management has evaluated subsequent events for potential recognition or disclosure in these consolidated financial statements through April 5, 2024, which was the date the consolidated financial statements were available to be issued. No subsequent events were identified as requiring recognition or disclosure.
F-25
Index to Exhibits
* Previously filed
28
SIGNATURES
Pursuant to the requirements of Regulation A, the issuer has duly caused this report to be signed on its behalf by the undersigned, thereunto duly authorized.
| Rise Companies Corp. | |||
| By: | /s/ Benjamin S. Miller | ||
| Name: | Benjamin S. Miller | ||
| Title: | Chief Executive Officer | ||
| Date: April 5, 2024 | |||
Pursuant to the requirements of Regulation A, this report has been signed below by the following persons on behalf of the issuer and in the capacities and on the dates indicated.
| Signature | Title | Date | ||
| /s/ Benjamin S. Miller | Chief Executive Officer | April 5, 2024 | ||
| Benjamin S. Miller | (Principal Executive Officer) | |||
| /s/ Alison A. Staloch | Chief Financial Officer | April 5, 2024 | ||
| Alison A. Staloch | (Principal Financial Officer and Principal Accounting Officer) | |||
| /s/ Benjamin S. Miller | Director | April 5, 2024 | ||
| Benjamin S. Miller | ||||
| /s/ Brandon T. Jenkins | Director | April 5, 2024 | ||
| Brandon T. Jenkins | ||||
| /s/ Charlotte Liu | Director | April 5, 2024 | ||
| Charlotte Liu | ||||
| /s/ Tal Kerret | Director | April 5, 2024 | ||
| Tal Kerret | ||||
| /s/ Haniel Lynn | Director | April 5, 2024 | ||
| Haniel Lynn |
29