UNITED STATES
SECURITIES AND EXCHANGE COMMISSION
Washington, D.C. 20549
FORM 1-SA
SEMIANNUAL REPORT
ANNUAL REPORT PURSUANT TO REGULATION A OF THE SECURITIES ACT OF 1933
For the Semiannual Period Ended June 30, 2017
RISE COMPANIES CORP.
(Exact name of registrant as specified in its charter)
Commission File Number: 024-10659
| Delaware | 45-4862460 | |
| (State or other jurisdiction of incorporation or organization) | (I.R.S. Employer Identification No.) | |
| 1601 Connecticut Ave. NW, Suite 300 Washington, DC (Address of principal executive offices) | 20009 (Zip Code) |
(202) 584-0550
Registrant’s telephone number, including area code
Common Shares
(Title of each class of securities issued pursuant to Regulation A)
ITEM 1: MANAGEMENT’S DISCUSSION AND ANALYSIS OF FINANCIAL CONDITION AND RESULTS OF OPERATIONS
The following discussion and analysis of our financial condition and results of operations should be read in conjunction with the unaudited consolidated financial statements and related notes that appear in this semi-annual report. In addition to historical consolidated financial information, the following discussion contains forward-looking statements that reflect our plans, estimates and beliefs. Our actual results could differ materially from those discussed in the forward-looking statements.
Overview
We own and operate the Fundrise Platform, a leading online, direct investment platform located at www.fundrise.com. We believe real estate investment powered by technology is more efficient than conventional financial system mechanisms used to invest in real estate and other alternative assets. Enabled by our proprietary technology, we aggregate thousands of individuals from across the country to create the scale of an institutional investor, without the high fees and overhead typical of the old-fashioned investment business. Individuals can invest through the Fundrise Platform at ultra-low costs for what we believe is a better, more transparent web-based experience. Investors use the Fundrise Platform to potentially earn attractive risk-adjusted returns from asset classes that have generally been closed to many investors and only available to high net worth investors and institutions.
We believe that, as our business scales, while our growth may increase in absolute terms, our individual performance metrics on a standalone basis may not reflect our total performance. Accordingly, it may be insufficient to rely solely on any single performance metric as a measurement of our success.
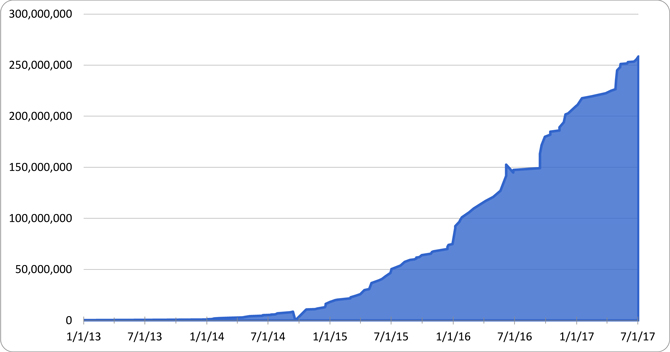
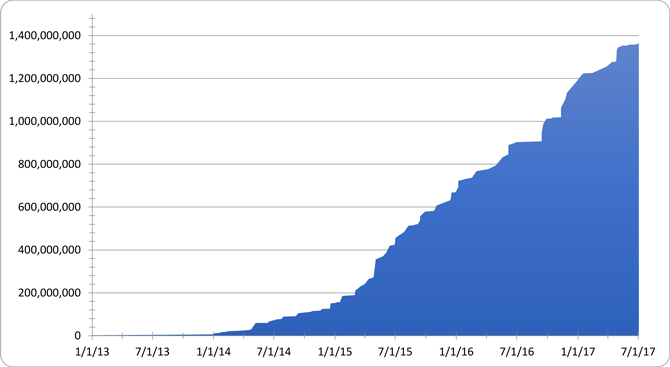
Since inception, we have originated approximately $252.5 million in both equity and debt investments deployed across more than approximately $1.4 billion of real estate property, while collecting and processing more than 230,000 investor dividends, distributions, investments and principal re-payments since we sponsored our first online investment in 2012. As our business has grown and changed, from offering a platform to facilitate the sponsor of investment, to an active sponsor of specific real estate projects, to the creation and offering of the eREITTM programs, and now the eFundsTM, our real estate debt and equity originations over the same period have changed as well. Our originations have increased over the period starting January 1, 2013 and ending June 30, 2017 from $0.9 million to $252.5 million, an impressive 400% compound annual growth rate, but as we have seen our product lineup change through the first six months of 2017, we have seen our rate of originations change with it.
As of June 30, 2017, none of our sponsored Programs (as described below) have suffered any loss of principal or projected interest; however, there can be no assurance that such performance will continue in the future.
Consolidation of Variable Interest Entities
We consolidate all entities that we control either through a majority voting interest or as the primary beneficiary of variable interest entities. On January 1, 2017, we adopted ASU 2015-2, Consolidation (Topic 810): Amendments to the Consolidation Analysis, which provides a revised consolidation model for all reporting entities to use in evaluating whether to consolidate certain types of legal entities. As a result, we consolidated Fundrise, LP, Fundrise Real Estate Investment Trust, LLC, Fundrise Equity REIT, LLC, Fundrise West Coast Opportunistic REIT, LLC, Fundrise East Coast Opportunistic REIT, LLC, Fundrise Midland Opportunistic REIT, LLC, Fundrise For-Sale Housing eFund – Los Angeles CA, LLC, and Fundrise For-Sale Housing eFund – Washington DC, LLC (“the non-controlling consolidated entities”), under this guidance as variable interest entities.
For years ended December 31, 2016 and December 31, 2015, under previous accounting standards, we had determined the non-controlling consolidated entities to be voting interest entities (“VOEs”) and consolidated them based upon the presumption of a controlling interest in each entity. For further information on our adoption of this consolidation guidance, see Note 3 to the unaudited consolidated financial statements included in this Semi-Annual Report on Form 1-SA.
| 2 |
As of June 30, 2017, the non-controlling consolidated entities held approximately $175.1 million of total assets including $32.1 million of cash, $69.0 million of real estate debt investment, $61.3 million of investments in equity method investees, and $12.7 million in other assets. The assets and liabilities of the non-controlling consolidated entities are generally held within separate legal entities and, as a result, the liabilities of the non-controlling consolidated entities are non-recourse to us. For further information on consolidation of certain entities, see Note 3 to the unaudited consolidated financial statements included in this Semi-Annual Report on Form 1-SA.
Generally, the consolidation of the non-controlling consolidated entities has a gross-up effect on our assets, liabilities and cash flows and has a gross-down effect on the net income attributable to Rise, due to asset management fee and acquisition fee revenue earned by the Company and its wholly owned subsidiaries, but eliminated on consolidation. The net economic ownership interests of the non-controlling consolidated entities are reflected as non-controlling interests in consolidated entities in the accompanying unaudited consolidated financial statements.
Timeline and Milestones
In November 2015, we expanded our product offerings by launching the first ever eREITTM investment, an intended diversified real estate investment trust, available directly to investors online. In May 2017, we expanded our product offerings again by launching our first and second eFundTM investments, both intended diversified real estate investment funds, available directly to investors online. As of June 30, 2017, we had a total of five sponsored eREITsTM and two sponsored eFundsTM qualified under Regulation A. Through the Fundrise Platform, we reduced upfront fees and costs by up to 90% when compared to public non-traded REITs, by eliminating high-fee broker-dealers and investment bankers, while removing the double promote (where sponsors receive returns in more than one place in the distribution waterfall) common with real estate private equity. Our direct online investment model allows us, through our sponsored Programs, to more efficiently raise capital than through conventional institutional capital. The average size of the real estate assets originated by us and our affiliates have decreased from approximately $5.1 million during the six months ended June 30, 2016 to $3.0 million during the six months ended June 30, 2017, respectively. The decrease was mainly due to the Company’s increase in acquisition of single-family residential properties for the eFundsTMwhich drove down the average size of investments for the Company overall.
Other than our co-investments as the sponsor in the various eREITsTMand eFundsTM, we typically do not assume the long-term credit risk of the investments facilitated through the Fundrise Platform. However, from time to time, we or our affiliates, may bridge or warehouse investments for the eREITsTM and eFundsTM or other sponsored Programs. See “Management’s Discussion and Analysis Of Financial Condition And Results Of Operations – Liquidity and Capital Resources – Fundrise, L.P. – Sidecar Investment Fund.” As a result, a portion of our revenue comes from (i) interest earned from real estate assets we hold in this warehousing capacity and (ii) distributions from investments we make in our Programs.
Program investors can invest in eREITTM and eFundTM programs that are offered through the Fundrise Platform, which we refer to in this semi-annual report as our eDIRECTTM program:
| • | eREITsTM. As of June 30, 2017, we have sponsored five (5) separate eREITsTM, all of which had qualified offerings under Regulation A, allowing any U.S. investor—not just high net worth individuals and other accredited investors—to invest directly in a diversified portfolio of commercial real estate investments. | |
| • | eFundsTM As of June 30, 2017, we have sponsored two (2) separate eFundsTM, both of which had qualified offerings under Regulation A, allowing any U.S. investor—not just high net worth individuals and other accredited investors—to invest directly in a diversified portfolio of for-sale housing investments. |
| 3 |
The Company voluntarily suspended issuance of the Project Dependent Notes indefinitely in September 2016:
| • | Project Dependent Notes Accredited investors interested in the Project Dependent Notes program could invest in promissory notes tied to the performance of specific real estate assets, in offerings exempt from registration pursuant to Section 4(a)(2) and Rule 506 of Regulation D. The Project Dependent Notes are typically issued by the National Commercial Real Estate Trust or a separate limited liability entity, each of which is ultimately under our control. The Project Dependent Notes are settled with cash flows from the underlying real estate assets selected by each investor through the Fundrise Platform. Since the introduction of our eREITTM programs, we have not sponsored any additional series of Project Dependent Notes, and, beginning in September 2016, we suspended, indefinitely, our Project Dependent Notes program. While, as of June 30, 2017, approximately $25.1 million of securities remain outstanding under the Project Dependent Notes program, we have no plans to sponsor the offering of any additional series of Project Dependent Notes in the immediate future. |
Our historical measured growth rates in facilitating investments through the Fundrise Platform reflect a deliberate strategy that allowed us to build and develop the various enterprise functions to support our scale, including operations, risk controls, customer support, compliance and technology. Demand from real estate operators and investors will continue to inform our business and investment product decisions, but we have so far refused to compromise the long-term quality of our underwriting to pursue excessive near-term growth rates that we believe would result in investment performance below our standards.
We have achieved the following significant milestones since our founding:
| • | In February 2011, we filed a provisional patent application for Systems and Methods for Online Securitization of Illiquid Assets -i.e., real estate crowdfunding. This patent is currently pending. |
| • | In June 2012, we invented online real estate investing (what some refer to as “real estate crowdfunding”), when our founders sponsored the first ever online real estate offering under Regulation A (available to all residents of the District of Columbia and the Commonwealth of Virginia) for a property at 1351 H Street NE, in Washington, DC. |
| • | In April 2013, we continued to lead the evolution of online real estate investing, when our founders sponsored the second ever online real estate offering under Regulation A (available to all residents of the District of Columbia and the Commonwealth of Virginia) for a property located at 906 H Street NE, in Washington, DC. |
| 4 |
| • | In March 2014, we continued to lead the evolution of online real estate investing, when our founders sponsored the third ever online real estate offering under Regulation A (available to all residents of the District of Columbia, the Commonwealth of Virginia and the State of Maryland) for a property located at 1539 7th Street NW, in Washington, DC. |
| • | In April 2014, Renren Inc. led our approximately $24.7 million Series A Preferred Stock financing round. |
| • | In June 2014, we introduced Project Dependent Notes that allowed investors to deploy capital targeting returns tied to select specific real estate assets through a standardized and simplified online investment process. |
| • | In November 2014, we introduced the first generation of the Fundrise Rating, which analyzed 25 key data variables relevant to real estate asset creditworthiness. |
| • | In February 2015, we sponsored an offering of limited liability company interests in Fundrise 3 World Trade Center, LLC, which owned approximately $2 million worth of Revenue Bonds, Series 2014 (backed by the 3 World Trade Center Project), Class 1, which had been issued by the New York Liberty Development Corporation. |
| • | In November 2015, we sponsored the first ever online real estate investment trust available to anyone in the U.S. (an eREITTM), called Fundrise Real Estate Investment Trust, LLC (the Income eREITTM). |
| • | For the fiscal year ended December 31, 2015, we had earned a cumulative 13% gross annual return for the entirety of the Project Dependent Notes program, which totaled 43 separate underlying real estate assets. |
| • | In January 2016, we surpassed $100 million in cumulative originations of debt and equity investments across our Programs. |
| • | In February 2016, we sponsored the second ever eREITTM, called Fundrise Equity REIT, LLC (the Growth eREITTM). |
| • | In July 2016, we surpassed 100,000 members on the Fundrise Platform. |
| • | In September 2016, we suspended, indefinitely, our Project Dependent Notes program. |
| • | In September 2016, we sponsored three additional eREITsTM, which vary based on geographic focus— Fundrise West Coast Opportunistic REIT, LLC (the West Coast eREITTM), Fundrise Midland Opportunistic REIT, LLC (the Heartland eREITTM), and Fundrise East Coast Opportunistic REIT, LLC (the East Coast eREITTM), each of which is available to anyone in the U.S., allowing investors to make their investment decisions through a custom product application. |
| • | In October 2016, we surpassed $100 million in assets under management under the eREITTM program. |
| • | In December 2016, we surpassed $200 million in cumulative originations of debt and equity investments across our Programs. |
| • | In December 2016, to our knowledge, the Income eREITTMbecame the first ever issuer to raise $50 million, the maximum amount allowed, pursuant to Regulation A. |
| • | In December 2016, to our knowledge, the Growth eREITTMbecame the second ever issuer to raise $50 million pursuant to Regulation A. |
| • | In February 2017, we initiated our first internet Public Offering (iPO) of Class B common shares to investors through the Fundrise Platform. By February 28, 2017, we had raised over $14 million in total gross proceeds and sold approximately 2.9 million shares of Class B common stock. |
| 5 |
| • | In May 2017, we sponsored our first and second ever online real estate investment funds available to anyone in the U.S. (eFundsTM), called Fundrise For-Sale Housing eFund - Los Angeles CA, LLC (the LA eFundTM) and Fundrise For-Sale Housing eFund – Washington DC, LLC (the DC eFundTM). |
| • | In July 2017, we were qualified to offer additional shares of Class B common stock to investors through the Fundrise Platform. |
| • | In September 2017, we surpassed $200 million in cumulative Regulation A+ offerings across our Programs. |
| • | In September 2017, we partnered with Millennium Trust Company to allow investors to invest IRA funds in our diversified commercial real estate investments through the eDIRECTTM programs. |
| A. | Operating Results |
For the six months ended June 30, 2017 and June 30, 2016, our total revenue was $6.8 million and $6.2 million, respectively, representing a year-over-year increase of 10%. For the six months ended June 30, 2017 and 2016, we incurred a net loss attributable to Rise Companies Corp. of $3.2 million and $1.4 million, respectively. As of June 30, 2017, we have forty-two (42) full time employees, primarily based in Washington, DC.
Sources of Operating Revenues and Cash Flows
We generate the majority of our revenue from (i) origination fees from debt and equity investments paid by the real estate operators with which we partner, (ii) asset management fees paid quarterly by our Programs, and (iii) interest income. For the years ended December 31, 2014 and December 31, 2015, a significant portion of our revenue was generated from interest income we earned as a result of warehousing investments for the Project Dependent Note program. We have, as of September 2016, suspended the Project Dependent Note program indefinitely, and thus interest income related warehousing investments for the Project Dependent Note program, is not expected to be a material part of our future revenue. The suspension of this program resulted in an overall decrease in notes payable of approximately $6.0 million and $5.6 million for the six months ended June 30, 2017 and June 30, 2016, respectively.
Originations and Acquisitions
The origination fees we receive from originating debt and equity investments range from 0% to 2% of the initial principal amount of the investment. For the six months ended June 30, 2017 and June 30, 2016, our net origination and acquisition fee revenue was $1.0 million and $1.3 million, respectively, representing a year-over-year decrease of approximately 23%. The actual gross origination and acquisition fee revenue for the six months ended June 30, 2017 and June 30, 2016 was $0.9 million and $1.1 million, respectively, which excludes amortization of net origination fees and costs that were previously deferred. The decrease was mainly due to the Company’s increase in acquisition of single-family houses for the eFundsTMwhich are smaller investments on average than those of the eREITSTM; this was to be expected when we expanded our products. We believe that as our eFundsTM continue to grow, the volume of investments in single family residential properties will be a robust source of origination revenues going forward.
With respect to real estate debt and joint venture equity investments in which we originate and perform underwriting services, but which are ultimately acquired by an entity sponsored by us, such as one of the eDIRECTTM programs, we recognize such fees upon acquisition directly by or transfer to the eDIRECTTM programs. Origination and acquisition fees recognized from the eDIRECTTM programs for the six months ended June 30, 2017 and June 30, 2016, but eliminated upon consolidation, total approximately $17,000 and $0, respectively.
| 6 |
Our revenues have grown since 2013 primarily as a result of growth in originations for our Programs. Growth in originations has been driven by the addition of new assets under management, increasing investment from our existing and new investors, and increasing average investment size generally. For the six months ending June 30, 2017 and June 30, 2016, our real estate debt and equity investments totaled $45.7 million and $71.2 million, respectively, a 36% period over period decrease. However, total originated real estate debt and equity investments have increased 22% on a cumulative basis from December 31, 2016 to June 30, 2017. In general, we believe that it is in the best interest of the Company to maintain a high standard for the quality of our investments. We maintain a long-term view. As a result, there may be periods when the rate of growth of assets under management vary. We anticipate that our future growth will continue to depend in part on attracting new investors and real estate operators to our Programs. We plan to increase our sales and marketing spending to attract these customers as well as continuing to increase our origination efforts to better attract potential real estate operators. As we have invested more funds in our digital marketing efforts and focused on developing relationships with real estate operators, we expect to increase our Programs’ investments at a faster rate than in the past.
The following graph represents the total, cumulative dollar amount of debt and equity investments that we (or our affiliates) have originated from third-party sources for our Programs since January 2013 through June 30, 2017:
| 7 |
The following graph represents the total cumulative dollar amount of real estate property that we (or our affiliates) have originated from third-party sources for our Programs since January 2013 through June 30, 2017:
Asset Management Fees
Generally, each of the eREITs or eFunds pay us an annual asset management fee that is currently equal to 0.85% annually of the net offering proceeds as of the end of each quarter or the net asset value (“NAV”) at the end of each prior quarter as set forth in the filings of each respective eREITTM. Asset management fees earned by Fundrise Advisors for the six months ending June 30, 2017 and June 30, 2016, respectively, were approximately $433,000 and $60,000, a period-over-period increase of 622%. This increase has been driven by strong growth in our eREITTM program in particular. This is notable because Fundrise Advisors, LLC, our wholly-owned subsidiary and the Manager of the eDIRECTTM programs, agreed to waive asset management fees for the Income eREITTM, the oldest and most mature eREITTM, until December 2017. In addition, Fundrise Advisors agreed to waive asset management fees for each of the eFundsTM through June 2017. The growth in fees, therefore, does not include fees that the Manager could otherwise have collected from the largest and most mature eREITTM or any of the eFundsTM. However, these asset management fee amounts were eliminated upon consolidation and therefore are not reflected in the consolidated financial statements.
| 8 |
Expenses
Our operating expenses consist of sales and marketing, origination and servicing, engineering and product development, and other general and administrative expenses.
Sales and Marketing
Sales and marketing expenses consist primarily of engagement and enrollment of investors in our Programs, including costs attributable to marketing and selling our products. This includes costs of building general brand awareness, and salaries and benefits expenses related to our investments and marketing teams.
Sales and marketing expenses were $0.9 million and $0.4 million respectively, for the six months ended June 30, 2017 and June 30, 2016, an increase of 125%. The increase was primarily due to an increase in marketing headcount and enrollment of investors as we debuted our first and second eFundsTM.
Origination and Servicing
Origination and servicing expenses consist of costs attributable to activities that most directly relate to origination and servicing loans for real estate operators that are borrowers under our eDIRECTTM programs and investors in our eDIRECTTM programs, in addition to the salaries and benefits of our real estate team.
Origination and servicing expenses were $1.0 million and $0.5 million, respectively, for the six months ended June 30, 2017, and June 30, 2016, an increase of 100%. The increase was primarily due an increase in headcount in our real estate underwriting and origination teams.
Engineering and Product Development
Engineering and product development expenses consist primarily of salaries and benefits for our engineering and product management teams that are not capitalized as Internal-use software. These teams work on the development and maintenance of the Fundrise Platform. Engineering and product development expenses also include amortization expense of Internal-use software that has been put in use.
Engineering and product development expenses were $0.8 million and $0.4 million, respectively, for the six months ended June 30, 2017, and June 30, 2016, an increase of 100%. The increase was driven by investment in the Fundrise Platform and product development, which included an increase in personnel-related expenses resulting from increased headcount on our product team.
We capitalized $0.7 million and $0.4 million for the six months ended June 30, 2017 and June 30, 2016, respectively in software development costs.
Other General and Administrative
Other general and administrative expenses consist primarily of salaries and benefits for our accounting, legal, and operations teams, stock-based compensation for all eligible employees, and professional services fees. Other general and administrative expenses also include facilities and depreciation and amortization expenses.
Other general and administrative expenses were for the six months ended June 30, 2017, and June 30, 2016, $2.4 million and $2.0 million, respectively, an increase of 20%. The increase was primarily due to an increase of amortization expenses resulting from the launch of internal-use software.
| 9 |
Key Operating and Financial Metrics
We regularly review a number of metrics to evaluate our business, measure our performance, identify trends, formulate financial projections and make strategic decisions. (Tabular amounts in thousands, except percentages, or as noted.)
| June 30, 2017 | June 30, 2016 | Period over Period Change | ||||||||||
| Total Operating Revenue(1) | $ | 1,161 | $ | 1,408 | -18 | % | ||||||
| Total Revenue | 6,815 | 6,204 | 10 | % | ||||||||
| Total Operating Expenses | 4,982 | 3,282 | 52 | % | ||||||||
| Net Operating Income (Loss) | -3,235 | -1,442 | -124 | % | ||||||||
| Cash and Cash Equivalents | 48,274 | 26,820 | 80 | % | ||||||||
| Distributions Paid by eREITsTMDuring the Six Months Ended | 4,455 | 227 | 1863 | % | ||||||||
| Total Fundrise Platform Distributions Related to the Six Months Ended | 16,277 | 3,648 | 346 | % | ||||||||
(1) Asset management fee revenue is eliminated in consolidation, and not included in this figure or shown on the accompanying consolidated financial statements. Asset management fees earned by Fundrise Advisors for the six months ending June 30, 2017 and June 30, 2016, respectively, were approximately $433,000 and $60,000, a period-over-period increase of 622%.
Key Factors Affecting Our Performance
Investment in Long-Term Growth
The core elements of our growth strategy include enrolling new investors, broadening our origination capabilities, enhancing our technology infrastructure, expanding our product offerings, and extending customer lifetime value. We plan to continue to invest significant resources to accomplish these goals, and we anticipate that our operating expenses will continue to increase for the foreseeable future, particularly our sales and marketing, technology, and origination expenses. These investments are intended to contribute to our long-term growth, but they may affect our near-term profitability.
| 10 |
Real Estate Originations
We originate our Programs’ real estate investments with the Fundrise Platform and through our in-house real estate team, RSE Capital Partners. We generate revenue from origination fees paid by real estate operators and joint-ventures in connection with debt and equity investment originations. We believe originations are a key indicator of the growth rate of our marketplace, credibility of our brand, scale of our business, strength of our network effect, and economic competitiveness of our products and future growth. Real estate originations have increased significantly over time due to the increased awareness of our brand, our high real estate operator and investor satisfaction rates, the effectiveness of our acquisition channels, a strong track record of investment performance and the expansion of our capital base. Factors that could affect debt and equity investment originations include the interest rate and economic environment, the competitiveness of our cost of capital, the success of our operational efforts to balance demands from investors and real estate operators, our ability to develop new products or enhance existing products for real estate operators and investors, the success of our sales and marketing initiatives and the success of developing relationships with real estate operator and acquiring and retaining investors.
The equity capital our Programs invest in the real estate assets enabled through the Fundrise Platform comes directly from investors. Our model is built specifically to leverage the economies of scale created by the Internet to cut out excessive fees, while also lowering execution costs and reducing both time and manual resources. Our end-to-end integrated web-platform transforms the real estate origination, underwriting, funding, and servicing processes, replacing expensive sales and management teams with online applications, implementing data driven decision making, and automating transactions through payment processing APIs (application programming interfaces).
Liquidity and Capital Resources
Since inception through June 30, 2017, we have financed our operations primarily through private offerings of our equity securities.
We believe that our current capital position is sufficient to meet our current liquidity needs for at least the next 24 months, however, there can be no assurance that our current capital position will meet our liquidity needs for such period.
As of June 30, 2017, and December 31, 2016, respectively, we do not have any material commitments for capital expenditures, nor did we enter into any in the interim period between June 30, 2017 and the time of the filing of this Semi-Annual Report on Form 1-SA.
| 11 |
Equity Financings
On January 19, 2017, the Board of Directors of the Company increased the number of authorized shares of Common Stock to 96,000,000 authorized shares and created a new class of Common Stock, to be designated as Class B Common Stock, consisting of 10,000,000 authorized shares by filing an Amended and Restated Certificate of Incorporation with the State of Delaware. Except as required by applicable law, the holders of our Class B Common Stock are not entitled to vote on any matters submitted to a vote of stockholders. On January 31, 2017, the Company was qualified by the SEC for a Tier 2 offering pursuant to Regulation A to offer up to 2,000,000 shares of our Class B Common Stock to the public at $5.00 per share, with par value of $0.0001. On February 3, 2017, the Company offered an additional 1,000,000 shares of our Class B Common Stock to the public at $5.00 per share, thereby increasing the total offering of Class B Common Stock to 3,000,000 shares. As of February 28, 2017, 2,884,129 Class B common shares were sold for total proceeds of $14.4 million. On June 30, 2017, 3,800 shares were redeemed for $19,000.
On July 28, 2017, the Company was qualified by the SEC to offer up to 2,000,000 additional shares of Class B Common Stock to the public at $5.50 per share, with par value of $0.0001. This continuation of the offering has no minimum investment. As of September 12, 2017, 458,794 shares have been sold under this offering for total proceeds of $2.5 million. Shares are currently offered and are sold on a continuous basis only to existing investors in programs sponsored by the Company on a select basis.
The funds received from the issuance of our Class B common stock are a primary source of capital for our operating expenditures.
Fundrise, L.P. – Sidecar Investment Fund
As part of the 2014 Series A Preferred Stock financing, we raised a $10 million sidecar private fund called Fundrise, L.P., which was formed to provide warehousing and financing support to assets originated and facilitated by the Fundrise Platform. Fundrise, L.P., is managed by Fundrise GP I, LLC, our indirect, wholly-owned subsidiary.
Fundrise, L.P. has issued a $10 million promissory grid note to the Company as a means to provide liquidity during capital raising periods for the Company and its affiliates. For further information on this promissory grid note, please see Note 15 to the unaudited consolidated financial statements included in this Semi-Annual Report on Form 1-SA.
Corporate Debt
As of June 30, 2017, we had no material corporate debt.
| C. | Outlook and Recent Trends |
We believe that the intermediate and long-term growth prospects for the Company are compelling. Given the continued potential of finance technology to improve the efficiencies of real estate origination, operations, and investment, we expect to maintain, if not increase, our growth rate. However, we are wary of the long-sustained bull stock market, as the current economic cycle has been in expansion for more than eight years. The Federal Reserve monetary policy has begun to tighten, which historically has occurred in the later stages of US economic cyclical growth. The resiliency of our direct-to-investor online investment model is likely to be tested during the next financial downturn. We believe our investment model will prove out for our customers, providing good risk-adjusted returns for our investors. Our track record in a recession will be one of the most important aspects of the long-term success of the Company.
We favor an investment strategy for our managed products weighted toward maintaining a margin of safety for each investment, such as targeting senior loans in urban locations, senior preferred or mezzanine investments in new construction apartments, and equity investments in stabilized or value-add multifamily assets. We seek to invest below-the-radar of institutional-sized investors. We believe that our investment strategy, combined with our technology infrastructure and the expertise of our Manager’s management team, will provide opportunities to originate investments with attractive returns, thereby taking advantage of the changing market conditions to seek the best risk-return dynamic for our shareholders.
| 12 |
ITEM 2: OTHER INFORMATION
None.
| 13 |
INDEX TO FINANCIAL STATEMENTS OF RISE COMPANIES CORP.
| F-1 |
Consolidated Balance Sheets
(in thousands, except share and per share amounts)
June 30, 2017 (Unaudited) | December 31, 2016 (Audited) | |||||||
| ASSETS | ||||||||
| Current assets: | ||||||||
| Cash and cash equivalents | $ | 48,274 | $ | 25,055 | ||||
| Restricted cash | - | 500 | ||||||
| Investments in single-family residential properties, net | 475 | - | ||||||
| Real estate available for sale | 659 | - | ||||||
| Real estate debt investments, net | 37,919 | 30,611 | ||||||
| Accrued interest receivable | 1,660 | 1,625 | ||||||
| Accounts receivable, net | 52 | 6 | ||||||
| Other current assets | 1,906 | 1,651 | ||||||
| Total current assets | 90,945 | 59,448 | ||||||
| Real estate debt investments, net (non-current) | 56,423 | 56,744 | ||||||
| Investments in equity method investees | 61,259 | 49,155 | ||||||
| Accrued interest receivable (non-current) | 3,726 | 4,049 | ||||||
| Intangible assets, net | 2,387 | 1,915 | ||||||
| Property and equipment, net | 404 | 429 | ||||||
| Total assets | $ | 215,144 | $ | 171,740 | ||||
| LIABILITIES | ||||||||
| Current liabilities: | ||||||||
| Notes payable | $ | 12,704 | $ | 8,631 | ||||
| Accrued interest payable | 2,677 | 3,085 | ||||||
| Settling subscriptions & investments | 3,697 | 1,188 | ||||||
| Due to investors | 7,547 | 5,126 | ||||||
| Accounts payable | 730 | 653 | ||||||
| Accrued compensation and benefits | 16 | 243 | ||||||
| Accrued expenses | 341 | 639 | ||||||
| Other current liabilities | 310 | 117 | ||||||
| Total current liabilities | 28,022 | 19,682 | ||||||
| Notes payable (non-current) | 12,356 | 22,444 | ||||||
| Total liabilities | 40,378 | 42,126 | ||||||
| Commitments and contingencies (see Note 18) | ||||||||
| STOCKHOLDERS’ EQUITY | ||||||||
| Series A convertible preferred stock, $0.0001 par value; 15,000,000 shares authorized at June 30, 2017 and December 31, 2016; 11,865,046 shares issued and outstanding at June 30, 2017 and December 31, 2016; with an aggregate liquidation preference of $25,951 at both June 30, 2017 and December 31, 2016 | 1 | 1 | ||||||
| Class A common stock, $0.0001 par value; 43,000,000 shares authorized at June 30, 2017 and December 31, 2016; 2,540,962 and 2,640,775 shares issued and outstanding at June 30, 2017 and December 31, 2016, respectively | - | - | ||||||
| Class B common stock, $0.0001 par value; 96,000,000 and 0 shares authorized at June 30, 2017 and December 31, 2016; 2,880,329 and 0 shares issued and outstanding at June 30, 2017 and December 31, 2016, respectively | - | - | ||||||
| Class F common stock, $0.0001 par value; 10,000,000 shares authorized at June 30, 2017 and December 31, 2016; 10,000,000 shares issued and outstanding at June 30, 2017 and December 31, 2016 | 1 | 1 | ||||||
| Class M common stock, $0.0001 par value; 18,000,000 shares authorized at June 30, 2017 and December 31, 2016; 0 shares issued and outstanding at June 30, 2017 and December 31, 2016 | - | - | ||||||
| Additional paid-in capital | 39,811 | 25,364 | ||||||
| Accumulated deficit | (17,361 | ) | (14,126 | ) | ||||
| Total stockholders’ equity before non-controlling interests | 22,452 | 11,240 | ||||||
| Non-controlling interests in consolidated entities | 152,314 | 118,374 | ||||||
| Total stockholders’ equity | 174,766 | 129,614 | ||||||
| Total liabilities and stockholders’ equity | $ | 215,144 | $ | 171,740 | ||||
The accompanying notes are an integral part of these consolidated financial statements.
| F-2 |
Consolidated Statements of Operations
(in thousands, except share and per share amounts)
| Six months ended | Six months ended | |||||||
| June 30, | June 30, | |||||||
2017 (Unaudited) | 2016 (Unaudited) | |||||||
| Operating revenue | ||||||||
| Origination/Acquisition fees, net | $ | 1,002 | $ | 1,280 | ||||
| Management fees | 57 | 104 | ||||||
| Other revenue | 102 | 24 | ||||||
| Total operating revenue | 1,161 | 1,408 | ||||||
| Interest income | ||||||||
| Interest income | 5,654 | 4,796 | ||||||
| Total interest income | 5,654 | 4,796 | ||||||
| Total revenue | 6,815 | 6,204 | ||||||
| Operating expenses | ||||||||
| Sales and marketing | 876 | 397 | ||||||
| Origination and servicing | 980 | 516 | ||||||
| Engineering and product development | 759 | 409 | ||||||
| Other general and administrative | 2,367 | 1,960 | ||||||
| Total operating expenses | 4,982 | 3,282 | ||||||
| Interest expense | ||||||||
| Interest expense | 2,145 | 2,928 | ||||||
| Total interest expense | 2,145 | 2,928 | ||||||
| Total expenses | 7,127 | 6,210 | ||||||
| Other income | ||||||||
| Income from equity method investees | 343 | 94 | ||||||
| Realized gain on available for sale securities | - | 114 | ||||||
| Total other income | 343 | 208 | ||||||
| Net Income | 31 | 202 | ||||||
| Less: Net income from non-controlling interests | 3,266 | 1,644 | ||||||
| Net loss attributable to Rise Companies Corporation | $ | (3,235 | ) | $ | (1,442 | ) | ||
| Net loss per share attributable to common stockholders: | ||||||||
| Basic | $ | (0.26 | ) | $ | (0.13 | ) | ||
| Weighted average shares of common stock – Basic | 12,248,282 | 10,914,425 | ||||||
The accompanying notes are an integral part of these consolidated financial statements.
In the opinion of management, all adjustments necessary in order to make the interim financial statements not misleading have been included.
| F-3 |
Consolidated Statements of Comprehensive Loss
(in thousands)
| Six months ended | Six months ended | |||||||
| June 30, | June 30, | |||||||
2017 (Unaudited) | 2016 (Unaudited) | |||||||
| Net income | $ | 31 | $ | 202 | ||||
| Less: Comprehensive income attributable to non-controlling interests | 3,266 | 1,644 | ||||||
| Comprehensive loss attributable to Rise Companies Corporation | $ | (3,235 | ) | $ | (1,442 | ) | ||
The accompanying notes are an integral part of these consolidated financial statements.
| F-4 |
Consolidated Statements of Changes in Stockholders’ Equity
(Unaudited)
(in thousands, except share data)
| Accumulated | ||||||||||||||||||||||||||||||||||||||||||||||||||||||||||||
| Preferred Stock | Common Stock | Common Stock | Common Stock | Common Stock | Additional | Other | Non- | Total | ||||||||||||||||||||||||||||||||||||||||||||||||||||
| Series A | Class A | Class F | Class M | Class B | Paid-In | Accumulated | Comprehensive | Controlling | Stockholders’ | |||||||||||||||||||||||||||||||||||||||||||||||||||
| Shares | Amount | Shares | Amount | Shares | Amount | Shares | Amount | Shares | Amount | Capital | Deficit | Income | Interests | Equity | ||||||||||||||||||||||||||||||||||||||||||||||
| Balance at December 31, 2015 | 11,865,046 | $ | 1 | 1,749,150 | $ | - | 10,000,000 | $ | 1 | - | $ | - | - | $ | - | $ | 24,833 | $ | (10,495 | ) | $ | 48 | $ | 22,557 | $ | 36,945 | ||||||||||||||||||||||||||||||||||
| Recognition of previously unrecognized gains | - | - | - | - | - | - | - | - | - | - | - | - | (48 | ) | - | (48 | ) | |||||||||||||||||||||||||||||||||||||||||||
| Stock-based compensation | - | - | 891,925 | - | - | - | - | - | - | - | 531 | - | - | - | 531 | |||||||||||||||||||||||||||||||||||||||||||||
| Issuance of Class M Common Stock | - | - | - | - | - | - | 18,000,000 | 2 | - | - | - | - | - | - | 2 | |||||||||||||||||||||||||||||||||||||||||||||
| Redemption of Class M Common Stock | - | - | - | - | - | - | (18,000,000 | ) | (2 | ) | - | - | - | - | - | - | (2 | ) | ||||||||||||||||||||||||||||||||||||||||||
| Non-controlling interests acquired | - | - | - | - | - | - | - | - | - | - | - | - | - | 108,150 | 108,150 | |||||||||||||||||||||||||||||||||||||||||||||
| Derecognition of non-controlling interests | - | - | - | - | - | - | - | - | - | - | - | - | - | (2,000 | ) | (2,000 | ) | |||||||||||||||||||||||||||||||||||||||||||
| Accumulated amortization of deferred offering costs for non-controlling interests | - | - | - | - | - | - | - | - | - | - | - | - | - | (2,023 | ) | (2,023 | ) | |||||||||||||||||||||||||||||||||||||||||||
| Distributions declared on common shares for non-controlling interest | - | - | - | - | - | - | - | - | - | - | - | - | - | (7,263 | ) | (7,263 | ) | |||||||||||||||||||||||||||||||||||||||||||
| Redemptions on common shares for non-controlling interests | - | - | - | - | - | - | - | - | - | - | - | - | - | (2,123 | ) | (2,123 | ) | |||||||||||||||||||||||||||||||||||||||||||
| Net income/(loss) | - | - | - | - | - | - | - | - | - | - | - | (3,631 | ) | - | 1,076 | (2,555 | ) | |||||||||||||||||||||||||||||||||||||||||||
| Balance at December 31, 2016 | 11,865,046 | $ | 1 | 2,640,775 | $ | - | 10,000,000 | $ | 1 | - | $ | - | - | $ | - | $ | 25,364 | $ | (14,126 | ) | $ | - | $ | 118,374 | $ | 129,614 | ||||||||||||||||||||||||||||||||||
| Stock-based compensation | - | - | (99,813 | ) | - | - | - | - | - | - | - | 570 | - | - | - | 570 | ||||||||||||||||||||||||||||||||||||||||||||
| Issuance of Class B Common Stock | - | - | - | - | - | - | - | - | 2,884,129 | - | 14,421 | - | - | - | 14,421 | |||||||||||||||||||||||||||||||||||||||||||||
| Redemption of Class B Common Stock | - | - | - | - | - | - | - | - | (3,800 | ) | - | (19 | ) | — | — | — | (19 | ) | ||||||||||||||||||||||||||||||||||||||||||
| Offering costs for Class B Common Stock | - | - | - | - | - | - | - | - | - | - | (525 | ) | - | - | - | (525 | ) | |||||||||||||||||||||||||||||||||||||||||||
| Non-controlling interests acquired | - | - | - | - | - | - | - | - | - | - | - | - | - | 40,511 | 40,511 | |||||||||||||||||||||||||||||||||||||||||||||
| Redemptions on common shares for non-controlling interests | - | - | - | - | - | - | - | - | - | - | - | - | - | (1,916 | ) | (1,916 | ) | |||||||||||||||||||||||||||||||||||||||||||
| Distributions declared on common shares for non-controlling interests | - | - | - | - | - | - | - | - | - | - | - | - | - | (7,197 | ) | (7,197 | ) | |||||||||||||||||||||||||||||||||||||||||||
| Accumulated amortization of deferred offering costs for non-controlling interests | - | - | - | - | - | - | - | - | - | - | - | - | - | (724 | ) | (724 | ) | |||||||||||||||||||||||||||||||||||||||||||
| Net income/(loss) | - | - | - | - | - | - | - | - | - | - | - | (3,235 | ) | - | 3,266 | 31 | ||||||||||||||||||||||||||||||||||||||||||||
| Balance at June 30, 2017 | 11,865,046 | $ | 1 | 2,540,962 | $ | - | 10,000,000 | $ | 1 | - | $ | - | 2,880,329 | $ | - | $ | 39,811 | $ | (17,353 | ) | $ | - | $ | 152,314 | $ | 174,766 | ||||||||||||||||||||||||||||||||||
The accompanying notes are an integral part of these consolidated financial statements.
| F-5 |
Consolidated Statements of Cash Flows
(in thousands)
| Six months ended | Six months ended | |||||||
| June 30, | June 30, | |||||||
2017 (Unaudited) | 2016 (Unaudited) | |||||||
| OPERATING ACTIVITIES: | ||||||||
| Net income | $ | 31 | $ | 202 | ||||
| Adjustments to reconcile net income to net cash used by operating activities: | ||||||||
| Accretion of deferred loan fees and costs | (106 | ) | (188 | ) | ||||
| Earnings from equity method investees | (343 | ) | (95 | ) | ||||
| Stock-based compensation | 570 | 25 | ||||||
| Depreciation and amortization | 337 | 146 | ||||||
| Loss (gain) on sale of securities available for sale | - | (232 | ) | |||||
| Net change in operating assets and liabilities: | ||||||||
| Accrued interest receivable | 288 | (1,855 | ) | |||||
| Accounts receivable | (46 | ) | (16 | ) | ||||
| Other current assets | (15 | ) | (269 | ) | ||||
| Accrued interest payable | (408 | ) | 1,086 | |||||
| Accounts payable | 77 | 387 | ||||||
| Accrued expenses and other current liabilities | (332 | ) | (1,163 | ) | ||||
| Net cash provided by (used in) operating activities | 53 | (1,972 | ) | |||||
| INVESTING ACTIVITIES: | ||||||||
| Purchase of real estate debt investments | (26,295 | ) | (34,115 | ) | ||||
| Investments in single family residential properties | (475 | ) | - | |||||
| Investments in real estate available for sale | (659 | ) | - | |||||
| Deposits for real estate assets | (16 | ) | - | |||||
| Principal payments from real estate debt investments | 19,414 | 8,459 | ||||||
| Investments in equity method investees | (15,658 | ) | (17,894 | ) | ||||
| Dividends received from equity method investees | 3,897 | - | ||||||
| Change in restricted cash | 500 | 1,444 | ||||||
| Purchase of intangible assets | (749 | ) | (404 | ) | ||||
| Proceeds from sales of securities available for sale | - | 2,246 | ||||||
| Purchases of property and equipment | (35 | ) | (5 | ) | ||||
| Net cash used in investing activities | (20,076 | ) | (40,269 | ) | ||||
| FINANCING ACTIVITIES: | ||||||||
| Change in payable to investors | - | 2,981 | ||||||
| Proceeds from issuance of notes payable | - | 3,542 | ||||||
| Principal payments on notes payable | (6,015 | ) | (9,190 | ) | ||||
| Proceeds (settlement) from subscriptions not settled by year end | 2,509 | 1,421 | ||||||
| Proceeds from sale of interests in consolidated non-controlling entities, net of offering costs | 39,298 | 45,961 | ||||||
| Proceeds from the issuance of Class B common stock, net of offering costs | 14,161 | - | ||||||
| Redemptions of Class B common stock | (19 | ) | - | |||||
| Distributions to non-controlling interest holders | (4,465 | ) | - | |||||
| Redemptions by non-controlling interest holders | (2,227 | ) | - | |||||
| Net cash provided by financing activities | 43,242 | 44,715 | ||||||
| Net increase in cash and cash equivalents | 23,219 | 2,474 | ||||||
| Cash and cash equivalents, beginning of period | 25,055 | 24,346 | ||||||
| Cash and cash equivalents, end of period | $ | 48,274 | $ | 26,820 | ||||
| Supplemental cash flow information: | ||||||||
| Cash paid for interest | $ | 2,553 | $ | 1,985 | ||||
The accompanying notes are an integral part of these consolidated financial statements.
| F-6 |
Notes to Consolidated Financial Statements
(Unaudited)
(Tabular amounts in thousands, except share and per share amounts, ratios, or as noted)
1. Formation and Organization
Rise Companies Corporation (“Rise”, “Rise Companies Corp”, “we”, “our”, the “Company”, and “us”) is the parent company of Fundrise, LLC (“Fundrise”), a wholly-owned subsidiary. Fundrise, LLC owns and operates an online investment platform, www.fundrise.com, (the “Fundrise Platform”) that allows investors to become equity or debt holders in alternative investment opportunities. Fundrise Lending, LLC (“Fundrise Lending”) is a wholly-owned subsidiary of Rise and a licensed finance lender in the State of California that facilitates real estate loans (“Loans”). National Commercial Real Estate Trust (the “Trust”) is a Delaware statutory trust that is a wholly-owned subsidiary of Rise and that has historically acquired loans from Fundrise Lending, LLC and held them for the sole benefit of certain investors that have purchased Project-Dependent Notes (“Notes”) issued by the Trust and that are related to specific underlying loans for the benefit of the investor. Fundrise Advisors, LLC (“Fundrise Advisors”) is a registered investment advisor with the Securities and Exchange Commission (SEC) and a wholly-owned subsidiary of Rise that acts as the non-member manager for the real estate investment trusts sponsored by the Company and offered for investment via the Fundrise Platform. Fundrise Real Estate Investment Trust, LLC, Fundrise Equity REIT, LLC, Fundrise West Coast Opportunistic REIT, LLC, Fundrise East Coast Opportunistic REIT, LLC, and Fundrise Midland Opportunistic REIT, LLC are the real estate investment trust sponsored programs (the “eREITs”). Fundrise For-Sale Housing eFund – Los Angeles CA, LLC and Fundrise For-Sale Housing eFund – Washington DC, LLC are the real estate investment fund sponsored programs (the “eFunds”). Fundrise LP, a Delaware limited partnership (“Fundrise LP”), is an affiliate of Rise and was created with the intent to directly benefit Rise by driving its growth and profitability. Additionally, Rise owns 1.96% of Fundrise LP and has the ability to direct its assets. As discussed further inNote 3 – Summary of Significant Accounting Policies, the Company has determined the eREITs, the eFunds, and Fundrise LP to be Variable Interest Entities (“VIEs”), and consolidates such entities given the Company’s control.
The Company was conceived of by Benjamin Miller, and founded by Benjamin Miller and Daniel Miller (together, the “Founders”) in 2012.
The Company publicly filed an offering statement on Form 1-A with the SEC with respect to an offering (the “Offering”) of Class B common shares in January 2017 and the SEC qualified this offering on January 31, 2017.
2. Basis of Presentation
The accompanying consolidated financial statements include Rise, its wholly-owned subsidiaries, affiliated entities where Rise is the primary beneficiary of variable interest entities (VIEs), and entities that it controls through a majority voting interest or otherwise. All intercompany transactions have been eliminated.
The accompanying balance sheets, statements of operations, statements of comprehensive loss, statements of stockholders’ equity, statements of cash flows and related notes to the financial statements of the Company are prepared on the accrual basis of accounting and conform to accounting principles generally accepted in the United States of America (“GAAP”) for interim financial reporting and the instructions to Form 1-SA and Rule 8-03(b) of Regulation S-X of the rules and regulations of the SEC. Accordingly, certain information and note disclosures normally included in the financial statements prepared under U.S. GAAP have been condensed or omitted.
In the opinion of management, all adjustments considered necessary for a fair presentation of the Company’s financial position, results of operations and cash flows have been included and are of a normal and recurring nature. Interim results are not necessarily indicative of operating results for any other interim period or for the entire year. The December 31, 2016 balance sheet and certain related disclosures are derived from the Company’s December 31, 2016 audited financial statements filed on Form 1-K. These financial statements should be read in conjunction with the Company’s financial statements and notes thereto included in the Company’s form 1-K, which was filed with the SEC.
The Company adopted the calendar year as its basis of reporting.
The preparation of our consolidated financial statements and related disclosures in conformity with GAAP requires management to make estimates and assumptions that affect reported amounts of assets and liabilities and the disclosures of contingent assets and liabilities at the date of the consolidated financial statements and the reported amounts of revenues and expenses during the reporting period. Actual results could materially differ from those estimates.
| F-7 |
We base our estimates on historical experience and on various other factors we believe to be reasonable under the circumstances; the results of which form the basis for making judgments about the carrying values of certain assets and liabilities. These judgments, assumptions, and estimates include but are not limited to the following: (i) impairment/allowance determinations for loans; (ii) fair value determinations for certain equity method investments, investments in single family residential properties, and real estate available for sale; and (iii) stock-based compensation. These judgments, estimates, and assumptions are inherently subjective in nature and actual results may differ from these estimates and assumptions, and the differences could be material.
3. Summary of Significant Accounting Policies
Revenue Recognition
Origination and Acquisition Fees
Deal origination fees are paid by borrowers and are determined by the term and credit grade of the loan. Origination fees generally range from 0.0% to 2.0% of the aggregate loan amount. Origination fees are included in the annual percentage rate calculation provided to the borrower and are subtracted from the gross loan proceeds prior to disbursement of the loan funds to the borrower. A loan is considered issued when upon completion of a wire transaction, initiated by us, to transfer funds from our bank account to the borrower’s settlement agent or borrower’s bank account.
Acquisition fees are typically fixed at 1.5% to 2.0% based on the committed amount of equity provided by an affiliate of the Company, such as the eREITs and eFunds, to acquire a real estate asset. Such fees are recognized upon acquisition of the real estate asset by the affiliate.
In the instances of real estate loans held by one of the wholly-owned subsidiaries of Rise Companies Corp typically for the purpose of offering investment derived from the performance of the assets via the Project-Dependent Notes Program, origination fee revenue is reduced by the deferral of net origination fees less origination costs in accordance with Accounting Standards Codification (“ASC”) 310. The net amount of origination fees less origination costs is amortized over the expected life of the loan as non-interest operating revenue beginning at loan issuance. The net deferred amount, less amortization, is included in the carrying value of the real estate debt investments on the consolidated balance sheets.
With respect to real estate debt and joint venture equity investments in which the Company originates and performs underwriting services, but which are ultimately acquired by an entity sponsored by the Company, such as one of the eREITs or eFunds, the Company recognizes such origination or acquisition fees upon acquisition directly by or transfer to the eREITs or eFunds. Such fees are paid to the Company at closing of an acquisition, generally from the unrelated borrower entity or joint-venture.
With respect to direct equity investments, such as investments in single-family residential properties, in which the Company originates and performs underwriting services, but which are ultimately acquired by an entity sponsored by the Company, such as one of the eFunds, the Company recognizes such origination or acquisition fees upon acquisition directly by or transfer to the eFunds. Such fees are paid to the Company at closing of an acquisition by the eFund to the Company in the event of equity investments. This revenue is eliminated upon consolidation, and is therefore not reflected on the statement of operations.
Real estate assets originated during the six months ended June 30, 2017 were acquired directly by or transferred to the eREITs and eFunds. Thus, the Company recognized such origination and acquisition fees as revenues once all significant services have been rendered with respect to such acquisition, which generally occurs concurrently with the closing of the acquisition.
Due Diligence Fees
Due diligence fees are included in origination fees in the operating revenue section of the consolidated statements of operations. These fees are paid by borrowers and are assessed to commensurate with the time required to perform diligence when underwriting a loan. Due diligence fees are assessed prior to the loan origination and are recognized either: 1) over the life of the loan beginning once origination of the loan has concluded if originated by one of the wholly-owned subsidiaries of the Company, or 2) upon acquisition directly by or transfer to the eREITs or eFunds. In the event Rise elects not to underwrite the underlying loan, due diligence revenue is recognized upon communication of that decision to the prospective borrower.
Servicing Fees
Servicing fees are included in management fees in the operating revenue section of the consolidated statements of operations. Servicing fees are paid by Note investors and based on the principal and interest payments serviced on the related loan. The servicing fee compensates the Company for managing payments from borrowers and to investors and maintaining investors’ account portfolios. The Company records servicing fees as a component of non-interest operating revenue when earned. Servicing fees can be, and have been, modified or waived at the discretion of the management of the Company.
| F-8 |
Asset Management Fees
Asset management fees are paid by investors via wholly-owned, affiliated, or managed entities based on various agreements with those entities. Management fees are a component of non-interest operating revenue and are recorded as earned. Management fees can be, and have been, modified or waived at the discretion of management.
Fundrise Advisors, LLC is entitled to a quarterly asset management fee for the qualified eREITs and eFunds in which it manages. At its sole discretion, Fundrise Advisors can choose to waive its asset management fee in whole or in part due from each or any of the programs that it manages and will, as a result, forfeit any portion of the asset management fee that is waived. Fundrise Advisors has agreed to waive its asset management fee due from Fundrise Real Estate Investment Trust, LLC, until December 31, 2017.
The asset management fee paid/payable by the eREITs and eFunds to Fundrise Advisors is an intercompany transaction, and thus eliminated upon consolidation. For the six months ended June 30, 2017 and June 30, 2016, respectively, asset management fees earned by Fundrise Advisors but eliminated in consolidation were approximately $433,000 and $60,000.
Other Revenue
Other revenue consists primarily of a 0.2% trust custody fee paid to National Commercial Real Estate Trust, a wholly-owned subsidiary of Rise Companies, by Note investors, and fees paid by real estate borrowers at the initial maturity date to extend the maturity date for a real estate debt investment.
Principles of Consolidation
The Company consolidates all entities that it controls either through a majority voting interest or as the primary beneficiary of variable interest entities (“VIEs”). On January 1, 2017, the Company adopted ASU 2015-2, Consolidation (Topic 810): Amendments to the Consolidation Analysis, which provides a revised consolidation model for all reporting entities to use in evaluating whether to consolidate certain types of legal entities. Accordingly, the consolidation of the eREITs, eFunds, and Fundrise LP remains appropriate.
The Company evaluates (1) whether it holds a variable interest in an entity, (2) whether the entity is a VIE, and (3) whether the Company's involvement would make it the primary beneficiary. In evaluating whether the Company holds a variable interest, fees (including management fees) that are customary and commensurate with the level of services provided, and where the Company does not hold other economic interests in the entity that would absorb more than an insignificant amount of the expected losses or returns of the entity, are not considered variable interests. The Company considers all economic interests, including indirect interests, to determine if a fee is considered a variable interest.
For those entities where the Company holds a variable interest, the Company determines whether each of these entities qualifies as a VIE and, if so, whether or not the Company is the primary beneficiary. The assessment of whether the entity is a VIE is generally performed qualitatively, which requires judgment. These judgments include: (a) determining whether the equity investment at risk is sufficient to permit the entity to finance its activities without additional subordinated financial support, (b) evaluating whether the equity holders, as a group, can make decisions that have a significant effect on the economic performance of the entity, (c) determining whether two or more parties' equity interests should be aggregated, and (d) determining whether the equity investors have proportionate voting rights to their obligations to absorb losses or rights to receive returns from an entity.
For entities that are determined to be VIEs, the Company consolidates those entities where it has concluded it is the primary beneficiary. The primary beneficiary is defined as the variable interest holder with (a) the power to direct the activities of a VIE that most significantly impact the entity’s economic performance and (b) the obligation to absorb losses of the entity or the right to receive benefits from the entity that could potentially be significant to the VIE. In evaluating whether the Company is the primary beneficiary, the Company evaluates its economic interests in the entity held either directly or indirectly by the Company. Entities that do not qualify as VIEs are generally assessed for consolidation as voting interest entities. Under the voting interest entity model, the Company consolidates those entities it controls through a majority voting interest.
As of June 30, 2017, the total assets of Fundrise LP, the eREITs, and the eFunds reflected on the consolidated balance sheets were $175.1 million, which includes $32.1 million of cash, $69.0 million of real estate debt investments and $61.3 million of investments in equity method investees, and $12.7 million other assets, respectively. As of December 31, 2016, total assets and liabilities of Fundrise LP and the eREITs, reflected in the consolidated balance sheets was $125.5 million, which includes $20.4 million of cash, $52.6 million of real estate debt investments and $49.2 million of investments in equity method investees, and $6.6 million of other assets, respectively. Additionally, total interest income of Fundrise LP, the eREITs, and the eFunds on the consolidated statements of operations was $3.4 million, and $1.6 million for six months ended June 30, 2017, and June 30, 2016, respectively.
| F-9 |
Cash and Cash Equivalents
Cash and cash equivalents include unrestricted deposits with financial institutions in checking, money market and short-term certificate of deposit accounts. The Company considers all highly liquid investments with stated maturity dates of three months or less from the date of purchase to be cash equivalents.
As of June 30, 2017 and December 31, 2016, custodial escrow accounts relating to loans serviced by the Company totaled $1.9 million and $2.7 million, respectively. These amounts are not included in the accompanying consolidated balance sheets as such amounts are not Company assets.
Restricted Cash
Restricted cash consisted primarily of checking, money market, and certificate of deposit accounts that are escrow deposits held by 3rd parties, relating to real estate investments not yet closed.
At June 30, 2017 and December 31, 2016, restricted cash balances are as follows:
| June 30, | December 31, | |||||||
| 2017 | 2016 | |||||||
| Escrow deposit | - | 500 | ||||||
| Total restricted cash | $ | - | $ | 500 | ||||
Real Estate Debt Investments
The Company, by way of its affiliates and wholly-owned subsidiaries, is engaged in real estate lending. In general, these real estate debt investments are either real estate loans made by Fundrise Lending and held by the Trust related to corresponding Project-Dependent Notes (“Notes”), or real estate debt investments held by a consolidated entity. To maximize the value of the real estate debt investment, the Company intends to hold all real estate debt investments until the stated maturity date. Since management has the positive intent and ability to hold the real estate debt investments to maturity, they are classified and valued as held to maturity. Accordingly, these assets are carried at cost, net of deferred loan origination fee revenue, repayments, and unfunded commitments, if applicable, unless such loans are deemed to be impaired.
The Loans are generally secured, unsecuritized debt securities. The Notes are unsecured debt securities not subsequently securitized. The Trust is contractually obligated to pay proceeds from a certain loan to the note holder. Due to the regulatory uncertainty surrounding the ability of an online platform to sponsor both public offerings under Regulation A and private offerings under Rule 506(b), in September 2016, the Company voluntarily suspended its Rule 506(b) programs indefinitely which, in turn, suspended the issuance of new Project-Dependent Notes related to the economics and performance of the underlying real estate debt investment. As such, real estate assets originated during the six months ended June 30, 2017 were acquired directly by or transferred to the eREITs, thus not offered for investment via the Project-Dependent Notes Program.
Held-to-maturity securities are recorded as either short term (current) or long term (non-current) on the consolidated balance sheets, based on the contractual maturity date and are stated at amortized cost. Actual maturities may differ from contractual maturities as some borrowers have the right to prepay obligations with or without prepayment penalties.
Amortization of Loan Origination Fees and Costs
For loans held by wholly-owned subsidiaries of the Company, typically the Trust or Fundrise Lending, where it is the intent of management to hold the loan until the stated maturity date, loan origination fees and related incremental direct loan origination costs are deferred and amortized to income using the interest method over the contractual life of the loans, adjusted for actual prepayments. The amortization of deferred fees and costs is discontinued on loans that are contractually 120 days past due or when collection of interest appears doubtful. Any remaining deferred fees or costs associated with loans that pay off prior to contractual maturity are included within income in the period of payoff.
| F-10 |
Allowance for Loan Impairment
The Company’s real estate debt investments and preferred equity investments, and those of its consolidated entities, that earn interest based on debt-like terms are typically secured by senior liens on real estate properties, mortgage payments, mortgage loans, or interests in entities that have interests in real estate similar to the interests just described. The Company considered investments for which it expects to receive full payment of contractual principal and interest payments as “performing.”
The allowance for loan impairment is maintained at an amount management deems adequate to cover inherent loan losses at the balance sheet date. The Company has implemented and adheres to an internal review system and impairment allowance methodology designed to provide for the detection of problem receivables and an adequate allowance to cover loan losses.
In determining the allowance for loan impairment, the Company evaluates the loans on an individual basis, including an analysis of the borrower’s credit worthiness, cash flows and financial status, and the condition and estimated value of the collateral. Those amounts may be adjusted based on an analysis of macro-economic and other trends that are likely to affect the borrower’s ability to repay the loan according to the loan terms. Given these evaluations, the amount of the allowance is based on the summation of general valuation allowances and allocated allowances.
General loan impairment allowances relate to loans with no well-defined deficiency or weakness and are determined by applying against such receivable balances loss factors for each major loan type that consider past loss experience and loan duration. Allocated allowances relate to loans with well-defined deficiencies or weaknesses and are generally determined by loss factors based on loss statistics or are determined by the excess of the recorded investment in the loan over the fair value of the collateral, where appropriate.
The Company considers a loan to be impaired when, based on current information and events, it believes it is probable that the Company will be unable to collect all amounts due according to the contractual terms of the loan agreement. Impairment losses are included in the allowance for loan impairment through a charge to allowance for loan impairment. Adjustments to impairment losses due to changes in the fair value of collateral of impaired loans are included in the allowance for loan impairment. Upon disposition of an impaired loan, loss of principal, if any, is recorded through a charge-off to the allowance for loan impairment.
As of June 30, 2017 and December 31, 2016, management did not deem any loans impaired. Additionally, the Company did not have any historical trend of loan losses off which to base an estimate for allowance for loan impairment.
Deferred Offering Costs and Related Costs of eREITs and eFunds
Organizational and offering costs of the Company sponsored programs (i.e. eREITS and eFunds) are initially being paid by Fundrise Advisors, manager of the sponsored programs, on behalf of such sponsored programs. Offering costs include all expenses incurred by sponsored programs in connection with the qualification of the offering, and the marketing and distribution of shares, including, without limitation, expenses for printing, and amending offering statements or supplementing offering circulars, mailing and distributing costs, telephones, Internet and other telecommunications costs, all advertising and marketing expenses, charges of experts and fees, expenses and taxes related to the filing, registration and qualification of the sale of shares under federal and state laws, including taxes and fees and accountants’ and attorneys’ fees.
Offering costs are amortized ratably as a reduction to equity based on the proportion of gross proceeds raised to the total gross proceeds expected to be raised when the sponsored offering is complete. Total offering costs incurred for the eREIT programs that were qualified by the SEC as of the date of these financial statements were $4.5 million and $3.3 million as of June 30, 2017 and December 31, 2016, respectively. The deferred offering costs balance of $1.7 million and $1.2 million as of June 30, 2017 and December 31, 2016, respectively, are net of $2.8 million and $2.1 million in accumulated amortization and are included in other current assets on the accompanying consolidated balance sheets
The Company intends to establish and sponsor a number of programs as real estate investment trusts that will be similar in structure to the SEC qualified eREITs. Accordingly, the Company, via Fundrise Advisors, has agreed to allocate legal fees incurred in establishing the first ten eREIT programs (including the five (5) eREITs qualified with the SEC as of June 30, 2017 and as of December 31, 2016) that exceed the estimated legal fees of $312,500 per program, to other programs sponsored by the Company. As a result, each of these ten eREIT sponsored programs will be required to reimburse Fundrise Advisors for up to $312,500 in legal fees incurred in preparing such offerings. The Company believes that this allocation of legal fees to future similar programs is the most equitable way to ensure that all of the first ten programs bear the burden of establishing a working framework for similar offerings under the newly revised rules of Regulation A. If the Company is not successful in organizing an offering for each of the other five programs, the Company will bear the legal costs that exceed the portion allocated to the existing eREITs.
| F-11 |
The Company anticipates that, pursuant to the operating agreements of the eREITs, the eREITs will be obligated to reimburse Fundrise Advisors for organizational and offering costs that have been paid by Fundrise Advisors, the Company, or one of our affiliates. When Fundrise Advisors requires such reimbursements, payments will be made in monthly installments; however, the aggregate monthly amount reimbursed can never exceed 0.50% of the aggregate gross offering proceeds from a particular offering for the eREITS. If the sum of the total unreimbursed amount of such organizational and offering costs for any particular offering, plus new costs incurred since the last reimbursement payment, exceed the reimbursement limit described above for the applicable monthly installment, the excess will be eligible for reimbursement in subsequent months (subject to the 0.50% limit), calculated on an accumulated basis, until Fundrise Advisors has been reimbursed in full.
During the six months ended June 30, 2017 and six months ended June 30, 2016, the eREITs have made reimbursement payments to Fundrise Advisors in the amount of $1.3 million and $0, respectively.
The Company anticipates that, pursuant to the operating agreements of the eFunds, the eFunds will be obligated to reimburse Fundrise Advisors for organizational and offering costs that have been paid by Fundrise Advisors, the Company, or one of our affiliates. When Fundrise Advisors requires such reimbursements, payments will be made in monthly installments; however, the aggregate monthly amount reimbursed can never exceed 0.50% of the aggregate gross offering proceeds from a particular offering for the eFunds. If the sum of the total unreimbursed amount of such organizational and offering costs for any particular offering, plus new costs incurred since the last reimbursement payment, exceed the reimbursement limit described above for the applicable monthly installment, the excess will be eligible for reimbursement in subsequent months (subject to the 0.50% limit for the eFunds), calculated on an accumulated basis, until Fundrise Advisors has been reimbursed in full.
As of June 30, 2017 and December 31 2016, eFunds had not yet been required to make reimbursement payments to Fundrise Advisors.
Investments in Equity Method Investees
Non-controlling, unconsolidated ownership interests in an entity may be accounted for using the equity method, at fair value or the cost method.
Under the equity method, the investment is adjusted each period for capital contributions and distributions and its share of the entity’s net income (loss). Capital contributions, distributions and net income (loss) of such entities are recorded in accordance with the terms of the governing documents. An allocation of net income (loss) may differ from the stated ownership percentage interest in such entity as a result of preferred returns and allocation formulas, if any, as described in such governing documents. Equity method investments are recognized using a cost accumulated model in which the investment is recognized based on the cost to the investor, which includes acquisition fees. Acquisition fees incurred directly in connection with the investments in a joint venture are capitalized and amortized using the straight-line method over the estimated useful life of the underlying joint venture assets. No amortization of acquisition fees is currently reflected on the consolidated financial statements.
The Company may account for an investment in an unconsolidated entity at fair value by electing the fair value option. In general, if the fair value election is made, the Company’s share of changes in fair value from one period to another are recorded in the consolidated statement of operations. Any change in fair value attributable to market related assumptions is considered unrealized gain or loss.
The Company may account for an investment that does not qualify for the equity method, or for which the fair value option has not been elected, by using the cost method. Under the cost method, equity in earnings is recorded as dividends are received to the extent they are not considered a return of capital, which is recorded as a reduction of cost of the investment.
The Company, by way of its consolidated eREITS, evaluates its investments in equity method investees for impairment annually or whenever events or changes in circumstances indicate that there may be an other-than-temporary decline in value. To do so, the eREIT calculates the estimated fair value of the investment using various valuation techniques, including, but not limited to, discounted cash flow models, the eREIT’s intent and ability to retain its investment in the entity, the financial condition and long-term prospects of the entity, and the expected term of the investment. If the eREIT determined any decline in value is other-than-temporary, the eREIT would recognize an impairment charge to reduce the carrying value of its investment to fair value. No impairment losses were recorded related to equity method investees for the six months ended June 30, 2017 or six months ended June 30, 2016.
During the six months ended June 30, 2017 and June 30, 2016, the eREITs had funded approximately $15.7 million and $17.9 million in capital to equity method investees, respectively. During the six months ended June 30, 2017 and June 30, 2016, the eREITS have recognized $0.3 million and $0.0 million of gain for related equity in earnings, respectively, and $3.9 million and $0.0 million of cash distributions from such investments.
| F-12 |
As of June 30, 2017 and December 31, 2016, respectively, the eREITs have not elected the fair value option with respect to any investments.
Investments in Single-Family Residential Properties
Upon acquisition of the Company’s investments in single-family residential properties by way of its consolidated eFunds, for which the eFund intends to hold as rental properties, allocates the purchase price of the asset between land and building/improvements. The purchase price for purposes of this allocation is inclusive of acquisition costs which typically include legal fees, bidding service and title fees, payments made to cure tax, utility, as well as other closing costs. However, the acquisition fees paid from the eFund to the Company at closing are intercompany transactions, and thus are eliminated upon consolidation. As of June 30, 2017 and December 31, 2016, investments in single-family residential properties totaled $0.5 million and $0.0 million, respectively.
The Company, by way of its consolidated eFunds, will capitalize and depreciate expenditures that improve or extend the life of an acquired investment in a single-family residential property. Costs for ordinary repairs and maintenance on these properties are expensed as incurred.
Real estate available for sale consists of land/property held by the eFunds and by the Company that is under development and is stated at the lower of accumulated cost or fair value, less costs to sell. This includes all direct costs of land, land development and construction including field construction supervision and related direct overhead. Interest, real estate taxes and other carrying costs incurred, are capitalized only during the development period. Administrative costs are expensed as incurred. As of June 30, 2017 and December 31, 2016, investments in real estate available for sale totaled $0.7 million and $0.0 million, respectively.
Accrued Interest
Interest income on loans is recognized on an accrual basis. Accrued interest on loans, including impaired loans, that are 120 days or more past due or when collection of interest appears doubtful is generally written off against interest income. Income is subsequently recognized only to the extent cash payments are received and the principal balance is expected to be recovered. Such loans are restored to an accrual status only if the loan is brought contractually current and the borrower has demonstrated the ability to make future payments of principal and interest.
Property and Equipment, net
Property and equipment consists of computer equipment, leasehold improvements, and furniture and fixtures, which are recorded at cost, less accumulated depreciation and amortization.
Computer equipment and furniture and fixtures are depreciated on a straight-line basis over the asset’s estimated useful life, generally two to five years. Maintenance and repairs are expensed as incurred. Major renewals and improvements that extend the useful lives of property and equipment are capitalized. Costs associated with construction projects are transferred to the leasehold improvement account upon project completion. Leasehold improvements are amortized over the shorter of the lease term excluding renewal periods or estimated useful life.
The Company evaluates potential impairments of its property and equipment whenever events or changes in circumstances indicate that the carrying amount of the assets may not be recoverable. Events or changes in circumstances that could result in impairment include, but are not limited to, underperformance relative to historical or projected future operating results, significant changes in the manner of use of the assets or the strategy for the Company’s overall business and significant negative industry or economic trends. The determination of recoverability of these assets is based on whether an estimate of undiscounted future cash flows resulting from the use of the asset and its eventual disposition exceeds the net book value of the asset. If the asset is not recoverable, measurement of an impairment loss is based on the fair value of the asset. When an impairment loss is recognized, the carrying amount of the asset is reduced to its estimated fair value. As of June 30, 2017, and December 31, 2016, there was no impairment of property and equipment assets.
Intangible Assets
Intangible assets are assets that lack physical substance. Intangible assets with finite lives are amortized over their useful lives in a manner that best reflects their economic benefit, which may include straight-line or accelerated methods of amortization. Intangible assets with indefinite lives are not amortized. Since useful life cannot be determined, the Company evaluates these assets for impairment annually and on an interim basis as events and circumstances warrant when the carrying value of the asset may not be recovered. If the carrying value is not determined to be recoverable, the intangible asset will be reduced to fair value.
| F-13 |
The Company evaluates the recoverability of identifiable intangible assets whenever events or changes in circumstances indicate that an intangible asset’s carrying amount may not be recoverable. Such circumstances could include, but are not limited to (i) a significant decrease in the market value of an asset, (ii) a significant adverse change in the extent or manner in which an asset is used, or (iii) an accumulation of costs significantly in excess of the amount originally expected for the acquisition of the asset. The evaluation of asset impairment requires the Company to make assumption about future cash flows over the life of the asset being evaluated. These assumptions require significant judgment and actual results may differ from assumed and estimated amounts. As of June 30, 2017, and December 31, 2016, there was no impairment of intangible assets.
Internal-use Software
Internal-use software is capitalized when preliminary development efforts are successfully completed and it is probable that the project will be completed and that the software will be used as intended. Capitalized costs for internal-use software primarily consist of salaries and payroll-related costs for employees who are directly involved in the development efforts of a specific piece or pieces of software. Costs related to preliminary project activities and post implementation activities, including training and maintenance, are expensed as incurred. Costs incurred for upgrades and enhancements that are considered to be probable to result in additional functionality are capitalized.
Capitalized costs of platform and other software applications are included in intangible assets. These costs are amortized over the estimated useful life of the software, generally four years, on a straight-line basis. Management evaluates the useful life of these assets on an annual basis and tests for impairment whenever events or changes in circumstances occur that could impact the recoverability of these assets. The amortization of costs related to the platform applications is included in other general and administrative on the consolidated statements of operations. As of June 30, 2017 and December 31, 2016, internal-use software net of accumulated amortization totaled $2.1 million and $1.7 million, respectively.
Trademarks
Trademarks are amortized on a straight-line basis over a period of two to fifteen years and are stated at cost net of accumulated amortization of approximately $102,000 and $106,000, at June 30, 2017 and December 31, 2016, respectively.
Patents
Patents are amortized on a straight-line basis over a period of ten to twenty-five years and are stated at cost, net of accumulated amortization. The patent balances of approximately $58,000 and $49,000 at June 30, 2017 and December 31, 2016, respectively, represent costs incurred during the patent application process. Costs, such as legal fees, associated with patent applications are capitalized, but are not currently amortized as the useful life is not yet determinable. Upon issuance of a patent, its respective cost will be amortized over the patent’s estimated remaining useful life. Costs associated with abandoned applications will be charged to operations.
Domain
Costs to obtain and register an Internet domain are capitalized. Domain costs are not amortized as the Company considers the useful life to be indefinite as only a nominal fee is charged for renewal. As the useful life cannot be determined, the Company evaluates the fair market value of the domain names on an annual basis. The domain costs capitalized as of June 30, 2017 and at December 31, 2016, are approximately $80,000 and $35,000, respectively.
Due to Investors
Share Redemptions of Sponsored Programs (eREITs and eFunds)
The Company’s consolidated eREITs and eFunds have adopted a redemption plan whereby on a quarterly basis, shareholders of the sponsored program may request redemption of their shares. Fundrise Advisors, acting as the manager of the eREITs and eFunds, has the authority, in its sole discretion, to limit redemptions. Fundrise Advisors, may amend, suspend, or terminate the redemption plan at any time in its sole discretion, without notice, including if it believes that such action is in the best interest of the shareholders of the eREITs or the eFunds as a whole.
Affiliates of Fundrise Advisors, including the Company and Fundrise LP, are prohibited from requesting redemption of their interests under the redemption plan.
As of June 30, 2017, $4.0 million of shares in the Company sponsored programs have been redeemed which includes a redemption amount payable totaling approximately $0.9 million. As of December 31, 2016, $2.1 million of shares in the Company sponsored programs had been redeemed which included a redemption amount payable totaling approximately $1.2 million.
| F-14 |
Distributions of Sponsored Programs (eREITs and eFunds)
The following Sponsored Programs declared daily distributions for each day during the six months ended June 30, 2017 and June 30, 2016:
| Declared Between | Paid Between | Declared Between | Paid Between | |||||||||||||
| Distributions of Sponsored Program: | 1/1/2017 and 3/31/2017 | 1/1/2017 and 3/31/2017 | 4/1/2017 and 6/30/2017 | 4/1/2017 and 6/30/2017 | ||||||||||||
| Fundrise Real Estate Investment Trust, LLC | $ | 1,284 | $ | 1,283 | $ | 1,294 | $ | 1,284 | ||||||||
| Fundrise Equity REIT, LLC | 978 | 317 | 982 | 978 | ||||||||||||
| Fundrise West Coast Opportunistic REIT, LLC | 192 | 30 | 324 | 192 | ||||||||||||
| Fundrise East Coast Opportunistic REIT, LLC | 178 | 34 | 327 | 178 | ||||||||||||
| Fundrise Midland Opportunistic REIT, LLC | 159 | - | 286 | 159 | ||||||||||||
| Total | $ | 2,791 | $ | 1,664 | $ | 3,213 | $ | 2,791 | ||||||||
| Declared Between | Paid Between | Declared Between | Paid Between | |||||||||||||
| Distributions of Sponsored Program: | 1/1/2016 and 3/31/2016 | 1/1/2016 and 3/31/2016 | 4/1/2016 and 6/30/2016 | 4/1/2016 and 6/30/2016 | ||||||||||||
| Fundrise Real Estate Investment Trust, LLC | $ | 227 | $ | - | $ | 990 | $ | 227 | ||||||||
| Fundrise Equity REIT, LLC | - | - | 292 | - | ||||||||||||
| Fundrise West Coast Opportunistic REIT, LLC | - | - | - | - | ||||||||||||
| Fundrise East Coast Opportunistic REIT, LLC | - | - | - | - | ||||||||||||
| Fundrise Midland Opportunistic REIT, LLC | - | - | - | - | ||||||||||||
| Total | $ | 227 | $ | - | $ | 1,282 | $ | 227 | ||||||||
Fundrise For-Sale Housing eFund – Los Angeles CA, LLC did not declare or pay distributions during the six months ended June 30, 2017 or the six months ended June 30, 2016.
Fundrise For-Sale Housing eFund – Washington DC, LLC did not declare or pay distributions during the six months ended June 30, 2017 or the six months ended June 30, 2016.
Settling Subscriptions and Investments
Settling subscriptions presented on the consolidated balance sheets represent equity subscriptions in sponsored programs for which funds have been received but common shares have not yet been issued. Under the terms of the Offering Circulars for the eREITs and the eFunds, subscriptions will be accepted or rejected within thirty days of receipt. Once a subscription agreement is accepted, settlement of the shares may occur up to fifteen days later, depending on the volume of subscriptions received; however, shares are generally issued the later of five business days from the date that an investor’s subscription is approved by our affiliate or when the funds settle. As of June 30, 2017, and December 31, 2016, the total amount of settling subscriptions was $3.7 million and $1.2 million, respectively, based on a $10 per share price.
Income Taxes
The Company accounts for income taxes under the asset and liability method, which requires the recognition of deferred tax assets and liabilities for the expected future tax consequences of events that have been included in the financial statements. Under this method, deferred tax assets and liabilities are recognized temporary differences between the financial statement carrying amounts of existing assets and liabilities and their respective tax bases, as well as net operating loss and tax credit carryforwards. Deferred tax assets and liabilities are measured using enacted tax rates in effect for the year in which the differences are expected to reverse. The effect of a change in tax rates on deferred tax assets and liabilities is recognized in income in the period that includes the enactment date.
The Company accounts for uncertain tax positions using a two-step process whereby (i) it determines whether it is more likely than not that the tax positions will be sustained on the basis of the technical merits of the position (“more-likely-that-not recognition threshold”) and (ii) for those tax positions that meet the more-likely-than-not recognition threshold, it recognizes the largest amount of tax benefit that is more than 50 percent likely to be realized upon ultimate settlement with the related tax authority.
| F-15 |
The Company recognizes interest and penalties accrued on any unrecognized tax benefits as a component of provision for income tax in the consolidated statement of operations. As of June 30, 2017 and December 31, 2016, no unrecognized tax benefits have been recorded.
The Company recognizes a valuation allowance which reduces the deferred tax assets to the amount we believe these assets are more likely than not to be realized. In making such a determination, the Company considers all available positive and negative evidence, including future reversals of existing taxable temporary differences, projected future taxable income, tax-planning strategies, and results of recent operations. If the Company determines that it would be able to realize our deferred tax assets in the future in excess of their net recorded amount, the Company would make an adjustment to the deferred tax asset valuation allowance, which would reduce the provision for income taxes.
The Company’s consolidated eREIT subsidiaries operate in a manner intended to qualify as real estate investment trusts (“REITs”) under the Internal Revenue Code of 1986, as amended. To qualify as REITs, each of the eREITs must meet certain organization and operational requirements, including a requirement to distribute at least 90% of the Company’s annual REIT taxable income to its shareholders (which is computed without regard to the dividends paid deduction or net capital gain and which does not necessarily equal net income as calculated in accordance with generally accepted accounting principles). As REITs, the eREITs will generally not be subject to U.S. federal income tax to the extent that they distribute qualifying dividends to their shareholders. Even if the eREITs qualify as REITs, they may be subject to certain state and local taxes on their income and property, and federal income and excise taxes on their undistributed income. No material provisions have been made for federal income taxes on these financial statements related to the eREITs, and no gross deferred tax assets or liabilities have been recorded related to the eREITs as of June 30, 2017 or December 31, 2016.
The Company’s consolidated eFund subsidiaries operate in a manner intended to qualify as pass-through entities for federal income tax purposes and, as such, are not subject to income taxes at the entity level. Rather, the distributive share of all items of income, gain, loss, deduction, or credit are passed through to the members and reported on their respective tax returns. The eFunds’ federal tax status as pass-through entities are based on their default classification as limited liability companies with more than one member. As of the date of these financial statements, the eFunds do not have any subsidiaries who pay tax at the entity level. Accordingly, these financial statements do not reflect a provision for income taxes for the eFunds and the eFunds have not taken any other tax positions which require disclosure. The eFunds are required to file and will file income tax returns with the Internal Revenue Service and other taxing authorities, though no such returns have been filed at this point. Income tax returns filed by the eFunds are subject to examination by the Internal Revenue Service for a period of three years.
Stock-based Compensation
Stock-based compensation includes the expense related to restricted Class A Common Stock grants made to employees of the Company. All stock-based awards made to employees are recognized in the consolidated financial statements based on their estimated fair value on the date of grant.
As of December 31, 2015, the fair value of the shares granted had been established by the Board of Directors primarily based upon a Section 409A valuation provided by an independent third-party valuation firm or prepared by management and this Section 409A valuation is used to record stock compensation expense where appropriate.
The Company determined that all Class A Common Stock grants within twelve months prior to the offering of Class B Common Stock to be most accurately valued at the sales price of the Class B Common Stock offered during February 2017. The fair value expense of the shares granted during the fiscal year ended December 31, 2016 was based upon the offering price of Class B Common Stock sold in February 2017. No new Class A Common Stock grants were issued during the six months ended June 30, 2017, but in the event that Class A Common Stock grants are issued subsequent to this filing, the fair value expense of the shares granted will be based upon the most recent 409A valuation or the fair market value known at the time of the grant.
Stock-based compensation expense is recognized on a straight-line basis over the requisite service period of the awards, which is generally the vesting term of 4 years.
Share awards issued to non-employees are recorded at their fair value on the awards’ grant date, which is estimated using the same methodology described above.
Stock-based compensation expense is recorded net of estimated forfeitures, such that expense is recorded only for those stock-based awards that are expected to vest. Forfeitures of awards are estimated at the time of grant and revised, as necessary, in subsequent periods if actual forfeitures differ from initial estimates or if future forfeitures are expected to differ from recent actual or previously expected forfeitures. The Company’s management has used an estimated forfeiture rate of 4% to modify the fair value of stock based compensation expense as of date of grant. The assumed forfeiture rate is the annual percentage of unvested stock options that are assumed to be forfeited or cancelled due to grantees discontinuing employment with us. Because service-based share awards normally vest over a four-year period, the forfeiture assumption is used to estimate the number of shares that are expected to vest in future periods, which affects the estimate of the forfeiture-adjusted aggregate stock-based compensation expense related to the shares. The forfeiture assumption was developed considering the Company’s actual annual forfeiture rates for unvested stock awards over the past four years and analyzing the distribution of unvested stock awards held by directors, executive officers, and other employees as of June 30, 2017 and as of December 31, 2016. Holding other assumptions constant, a higher forfeiture rate reduces the number of shares expected to vest in future periods, which lowers the estimated forfeiture-adjusted aggregate stock-based compensation expense related to any affected stock awards.
| F-16 |
The Company has not paid cash dividends and does not anticipate paying any cash dividends in the foreseeable future and therefore used an expected dividend yield of 0.0% for price adjustments.
Concentrations of Credit Risk
Financial instruments that potentially subject us to significant concentrations of credit risk consist principally of cash and cash equivalents, restricted cash, loans financed directly by the Company and the related accrued interest receivable, and deposits with service providers. Cash and cash equivalents may, at times, exceed the Federal Deposit Insurance Corporation deposit insurance limit of $250,000 per institution. The Company mitigates credit risk by placing cash with major financial institutions. To date, the Company has not experienced any losses on the above-mentioned financial instruments.
New Accounting Standards Not Yet Adopted
Under Section 107 of the JOBS Act, we are permitted to use the extended transition period provided in Section 7(a)(2)(B) of the Securities Act for complying with new or revised accounting standards. This permits us to delay the adoption of certain accounting standards until those standards would otherwise apply to private companies. We have elected to use the extended transition period provided in Section 7(a)(2)(B) of the Securities Act for complying with new or revised accounting standards that have difference effective dates for public and private companies until the earlier of the date that we (i) are no longer an emerging growth company or (ii) affirmatively and irrevocably opt out of the extended transition period provided in Section 7(a)(2)(B). By electing to extend the transition period for complying with new or revised accounting standards, these consolidated financial statements may not be comparable to companies that adopt accounting standard updates upon the public business entity effective dates.
In May 2017, the Financial Accounting Standards Board (“FASB”) issued Accounting Standards Update (“ASU”) 2017-09 (“ASU 2017-09”), the amendments in this Update provide guidance about which changes to the terms or conditions of a share-based payment award require an entity to apply modification accounting in Topic 718. The amendments in this Update are effective for all entities for annual periods, and interim periods within those annual periods, beginning after December 15, 2017. Early adoption is permitted, including adoption in any interim period, for (1) public business entities for reporting periods for which financial statements have not yet been issued and (2) all other entities for reporting periods for which financial statements have not yet been made available for issuance. The Company is currently assessing the impact of this update on the presentation of these financial statements.
In January 2017, the Financial Accounting Standards Board (“FASB”) issued Accounting Standards Update (“ASU”) 2017-01 (“ASU 2017-01”), Business Combinations, which clarifies the definition of a business, particularly when evaluating whether transactions should be accounted for as acquisitions or dispositions of assets or businesses. The first part of the guidance provides a screen to determine when a set is not a business; the second part of the guidance provides a framework to evaluate whether both an input and a substantive process are present. The guidance will be effective after December 15, 2018, and interim periods within annual periods beginning after December 15, 2019. Early adoption is permitted for transactions that have not been reported in issued financial statements. The Company is currently assessing the impact of this update on the presentation of these financial statements.
In November 2016, the FASB issued ASU 2016-18, Statement of Cash Flows: Restricted Cash, which clarifies the presentation requirements of restricted cash within the statement of cash flows. The changes in restricted cash and restricted cash equivalents during the period should be included in the beginning and ending cash and cash equivalents balance reconciliation on the statement of cash flows. When cash, cash equivalents, restricted cash or restricted cash equivalents are presented in more than one line item within the statement of financial position, an entity shall calculate a total cash amount in a narrative or tabular format that agrees to the amount shown on the statement of cash flows. Details on the nature and amounts of restricted cash should also be disclosed. This standard is effective for fiscal years beginning after December 15, 2018, and interim periods within fiscal years beginning after December 15, 2019. The Company is currently in the process of evaluating the impact of the adoption of this standard on our financial statements.
| F-17 |
In August 2016, the FASB issued ASU 2016-15, Statement of Cash Flows: Classification of Certain Cash Receipts and Cash Payments, which provides guidance on the presentation and classification in the statement of cash flows for specific cash receipt and payment transactions, including debt prepayment or extinguishment costs, contingent consideration payments made after a business combination, proceeds from the settlement of insurance claims and corporate-owned life insurance policies, and distributions received from equity method investees. This standard is effective for fiscal years beginning after December 15, 2018, and interim periods within fiscal years beginning after December 15, 2019. The Company is currently in the process of evaluating the impact of the adoption of this standard on our consolidated financial statements.
In June 2016, the FASB issued ASU 2016-13, introducing an approach based on expected losses to estimate credit losses on certain types of financial instruments, which modifies the impairment method for available-for-sale securities debt securities and provides for a simplified account model for purchased financial assets with credit deterioration since their origination. The guidance will be effective for annual reporting periods (including interim periods within those periods) beginning after December 15, 2020, and interim periods within fiscal years beginning after December 15, 2021. All entities may adopt the amendments in this Update earlier as of the fiscal years beginning after December 15, 2018, including interim periods within those fiscal years. The Company is currently evaluating the impact of this new guidance on its consolidated financial statements.
In March 2016, the FASB issued ASU 2016-09, providing multiple provisions intended to simplify and improve various aspects of the accounting for share-based payments. The guidance simplifies several aspects of the accounting for share-based payment award transactions, including: income tax consequences, classification of awards as either equity or liabilities, and classification on the statement of cash flows. The guidance will be effective for annual reporting periods (including interim periods within those periods) beginning after December 15, 2017, and interim periods within annual periods beginning after December 15, 2018. Early adoption is permitted for any entity in any interim or annual period. The Company is currently evaluating the impact of this new guidance on its consolidated financial statements.
In February 2016, the FASB issued ASU 2016-02, Leases (Topic 842) that amended the accounting guidance related to lease accounting. The new standard is effective for fiscal years beginning after December 15, 2019, and interim periods within fiscal years beginning after December 15, 2020. Early application of the amendments in this Update is permitted for all entities. The guidance requires lessees, at lease inception, to record on their balance sheets a lease liability for the obligation to make lease payments and a right-of-use (ROU) asset for the right to use the underlying asset for the lease term. Lessees may elect to not recognize lease liabilities and ROU assets for leases with terms of 12 months or less. The lease liability is measured at the present value of the lease payments over the lease term. The ROU asset will be based on the liability, adjusted for lease prepayments, lease incentives, and the lessee's initial direct costs. For operating leases, lease expense will generally be recognized on a straight-line basis over the lease term. The amended lessor accounting model is similar to the current model, updated to align with certain changes to the lessee model and the new revenue standard. The Company is evaluating the impact that ASU 2016-02 will have on its financial position, results of operations or cash flows.
In January 2016, the FASB issued ASU 2016-01, changing the accounting for equity investments, financial liabilities under the fair value option, and the presentation and disclosure requirements for financial instruments. The FASB also clarifies the guidance related to the valuation allowance assessment when recognizing deferred tax assets resulting from unrealized losses on available-for-sale debt securities. The guidance will be effective for fiscal years beginning after December 15, 2018, and interim periods within fiscal years beginning after December 15, 2019. The guidance should be applied prospectively from that date. Early adoption is permitted regarding the guidance on the presentation of the change in fair value of financial liabilities under the fair value option for financial statements that have not been issued. The Company is currently assessing the impact of this update on the presentation of these consolidated financial statements.
In May 2014, the FASB issued ASU 2014-09 Revenue from Contracts with Customers (Topic 606), which will be effective for annual reporting periods beginning after December 15, 2017. The guidance clarifies that revenue from contracts with customers should be recognized in a manner that depicts both the likelihood of payment and the timing of the related transfer of goods or performance of services. In March 2016, the FASB issued an amendment (ASU 2016-08) to the new revenue recognition guidance clarifying how to determine if an entity is a principal or agent in a transaction. In April (ASU 2016-10) and May (ASU 2016-12) of 2016, the FASB further amended the guidance to include performance obligation identification, licensing implementation, collectability assessment and other presentation and transition clarifications. The effective date and transition requirements for the amendments is the same as for ASU 2014-09.
4. Net Loss Per Share and Net Loss Attributable to Common Stockholders
Basic earnings (loss) per share (EPS) is the amount of net loss available to each share of common stock outstanding during the reporting period. Diluted EPS is the amount of net loss available to each share of common stock outstanding during the reporting period, adjusted to include the effect of potentially dilutive common shares. Potentially dilutive common shares include incremental shares issued for stock awards and convertible preferred stock. Potentially dilutive common shares are excluded from the computation of dilutive EPS in periods in which the effect would be antidilutive.
| F-18 |
We calculate EPS using the two-class method. The two-class method allocates net income (loss), that otherwise would have been available to common stockholders, to holders of participating securities. We consider all series of our convertible preferred stock to be participating securities due to their non-cumulative dividend rights. In a period with net income, both earnings and dividends (if any) are allocated to participating securities. In a period with a net loss, only declared dividends (if any) are allocated to participating securities. All participating securities are excluded from basic weighted-average common shares outstanding.
5. Real Estate Debt Investments
In general, the Company’s real estate debt investments include both real estate loans made by Fundrise Lending and held by the Trust for the sole benefit of certain investors that have purchased Project-Dependent Notes payable (“Notes”) issued by the Trust and that are related to the specific underlying real estate debt investment (“Loans”) for the benefit of the investor, and real estate debt investments held by an eREIT or an eFund. The Company also invests in certain unconsolidated joint venture equity investments with rights to receive preferred economic returns (referred to in these notes as “Unconsolidated JV Investments”) where the investee is contractually obligated to redeem our interest at a specified date. We account for these Unconsolidated JV Investments as debt for financial reporting purposes, and report the preferred returns we receive therefrom as interest income.
The following table presents the Company’s investments in real estate related assets and those of the eREITs and eFunds, as of June 30, 2017 and December 31, 2016 (dollars in thousands):
| Allocation | ||||||||||||||||||||
| Principal | Future | By | ||||||||||||||||||
| Amount | Funding | Carrying | Investment | |||||||||||||||||
| Number | or Cost(1) | Commitment | Value | Type(2) | ||||||||||||||||
| December 31, 2016 | ||||||||||||||||||||
| Senior Debt | 13 | $ | 29,952 | $ | 7,069 | $ | 29,952 | 34.2 | % | |||||||||||
| Unconsolidated JV Investments | 31 | 57,753 | 10,025 | 57,403 | 65.8 | % | ||||||||||||||
| Balance | 44 | $ | 87,705 | $ | 17,094 | $ | 87,355 | 100 | % | |||||||||||
| June 30, 2017 | ||||||||||||||||||||
| Senior Debt | 16 | $ | 35,681 | $ | 14,630 | $ | 35,681 | 37.72 | % | |||||||||||
| Unconsolidated JV Investments | 30 | 58,905 | 8,831 | 58,661 | 62.28 | % | ||||||||||||||
| Balance | 46 | $ | 94,586 | $ | 23,461 | $ | 94,342 | 100 | % | |||||||||||
| (1) | For debt investments, this only includes the stated amount of funds disbursed to date. |
| (2) | This allocation is based on the principal amount of debt actually disbursed and unconsolidated JV investments at cost. It does not include future funding commitments that are not yet drawn. |
As of June 30, 2017, and December 31, 2016, none of the Company’s real estate debt investments were considered impaired, and no impairment charges have been recorded in these financial statements for the six months ended June 30, 2017 and June 30, 2016.
The following table describes our real estate debt investment activity for the periods ending June 30, 2017 and December 31, 2016 (in thousands):
| As of | As of | |||||||
| June 30, | December 31, | |||||||
| 2017 | 2016 | |||||||
| Investments in Debt –Project-Dependent Notes Program | ||||||||
| Balance at the beginning of the year | $ | 32,293 | $ | 48,990 | ||||
| Project-dependent note investments | - | - | ||||||
| Principal repayments | (7,293 | ) | (17,038 | ) | ||||
| Amortization of deferred net origination fee revenue | 106 | 341 | ||||||
| Project-dependent-note debt investment balance | 25,106 | 32,293 | ||||||
| Investments in Debt –eREITs and eFunds | ||||||||
| Balance at the beginning of the year | 55,062 | 5,887 | ||||||
| eREIT and eFund debt-related investments | 26,020 | 49,152 | ||||||
| Principal repayments | (12,121 | ) | (2,437 | ) | ||||
| Amortization of deferred net origination fee revenue | - | - | ||||||
| eREIT and eFund debt-related investment balance | 68,961 | 52,602 | ||||||
| Other real estate debt investments | 275 | 2,460 | ||||||
| Total real estate debt investment balance | $ | 94,342 | $ | 87,355 | ||||
| F-19 |
As of June 30, 2017 and December 31, 2016, we have invested in forty-three and forty-three debt investments, respectively, via the Company’s Project Dependent Notes Program, of which twenty-six and twenty-two real estate debt investments repaid the full amount of principal and any accrued interest.
As of June 30, 2017 and December 31, 2016, we have invested in thirty-six and twenty-five debt investments, respectively, via the eREITs and eFunds, of which seven and two real estate debt investments repaid the full amount of principal and any accrued interest.
Project-Dependent Notes and Real Estate Loans
Generally, the Trust acquires loans from Fundrise Lending and holds them for the sole benefit of certain investors that have purchased project-dependent notes issued by the Trust and that are related to specific underlying loans for the benefit of the investor. As mentioned inNote 3 – Summary of Significant Accounting Policies, due to the regulatory uncertainty surrounding the ability of an online platform to sponsor both public offerings under Regulation A and private offerings under Rule 506(b), in September 2016, the Company voluntarily suspended its Rule 506(b) programs indefinitely which, in turn, suspended the issuance of new Project-Dependent Notes related to the economics and performance of the underlying real estate debt investment.
At June 30, 2017 and December 31, 2016, loans and notes were as follows (in thousands):
| Real Estate Loans | Project-Dependent Notes | |||||||||||||||
| June 30, 2017 | December 31, 2016 | June 30, 2017 | December 31, 2016 | |||||||||||||
| Aggregate principal balance | $ | 25,351 | $ | 32,644 | $ | 25,060 | $ | 31,075 | ||||||||
| Deferred net loan origination fees | (245 | ) | (351 | ) | - | - | ||||||||||
| Carrying value | $ | 25,106 | $ | 32,293 | $ | 25,060 | $ | 31,075 | ||||||||
| Average original term (years)(1) | 5.51 | 4.82 | 3.92 | 3.30 | ||||||||||||
| Maturity dates | 2017-2025 | 2017-2025 | 2017-2025 | 2017-2025 | ||||||||||||
| (1) | Average original term is based on all loans outstanding on June 30, 2017 and December 31, 2016. |
| F-20 |
The scheduled maturities, as of June 30, 2017, for the aggregate principal balance of the Loans and Notes are shown below for the corresponding calendar years (in thousands):
| Project- | ||||||||
| Real Estate | Dependent | |||||||
| Loans | Notes | |||||||
| 2017 | $ | 4,447 | $ | 6,666 | ||||
| 2018 | 2,750 | 10,938 | ||||||
| 2019 | - | - | ||||||
| 2020 | 14,724 | 6,546 | ||||||
| 2021 | - | - | ||||||
| Thereafter | 3,430 | 910 | ||||||
| Total | $ | 25,351 | $ | 25,060 | ||||
Note Redemptions
A holder of the Notes (“Noteholder”) may request a redemption of Notes if: (i) the Noteholder holds Notes of at least 10 separate Note series; (ii) the redemption request applies to at least 10 separate Note series; (iii) each of the 10 separate Note series have been held for at least 3 months; and (iv) each of the 10 separate Note series continue to be performing. The redemption price of each Note will be 98.5% of the outstanding principal amount of such Note on the redemption date. The redemption request cannot exceed 2.5% of the total principal of all performing Note series prior to the redemption request.
Real Estate Debt Investments Held by eREITs and eFunds
The real estate debt investments of the eREITs and eFunds are considered to be classified as held-to-maturity; however, since the eREIT or eFund was not the recipient of the origination fee revenue or responsible for the origination costs of the related investments, upon consolidation, these investments are carried at cost, discounts, repayments and unfunded commitments, if applicable, unless such loans or investments are deemed to be impaired.
The Company has certain investments that are legally structured as equity investments with rights to receive preferred economic returns. The Company reports these investments as real estate debt investments as the borrowers or common equity holders of the borrowers have a contractual obligation to redeem our preferred equity interest at a specified date.
6. Investments in Equity Method Investees
The table below presents the activity of the eREIT investments in non-consolidating equity method investees as of, and for, the periods presented (in thousands):
| June 30, 2017 | December 31, 2016 | |||||||
| Beginning balance | $ | 49,155 | $ | - | ||||
| New investments in equity method investees | 15,658 | 52,196 | ||||||
| Equity in gain (losses)(1) | 343 | (2,487 | ) | |||||
| Distributions received | (3,897 | ) | (554 | ) | ||||
| Ending balance | $ | 61,259 | $ | 49,155 | ||||
| (1) | The non-consolidating investments in equity method investees and the related equity in earnings are held by Fundrise Equity REIT, LLC and Fundrise East Coast Opportunistic REIT, LLC. The equity in earnings by the non-controlling interests are only attributable to the Company based on ownership percentage of Fundrise Equity REIT, LLC and Fundrise East Coast Opportunistic REIT, LLC. |
As of June 30, 2017, the eREITs’ investments in companies that are accounted for on the equity method of accounting consist of the following:
| 1) | A 70% non-controlling member interest in Jax2 JV LLC, whose activities are carried out through the following wholly-owned assets: Reserve at Mandarin LLC, a rental property in Jacksonville, FL, built in 1983; and Beacon Point LLC, a rental property in Jacksonville, FL, built in 1986. |
| F-21 |
| 2) | A 95% non-controlling member interest in Fundrise Insight One LLC, whose activities are carried out through the following wholly-owned assets: Canterbury Square, a low-rise apartment complex in Fort Belvoir, VA; Sacramento Square, a garden-style apartment complex in Alexandria, VA; and Lancaster Mill, a garden-style apartment in Woodbridge, VA. Fundrise Insight One LLC included a year one (2016) transaction cost of $908,000 related to the purchase of a business, which is included in total expenses of $3,924,000 in the table below. |
| 3) | A 90% non-controlling member interest in Fundrise Peak I, LLC, whose activities are carried out through The Villas at Meadow Springs, an apartment complex located in Richland, WA. |
| 4) | A 75% non-controlling member interest in Enclave at Lake Ellenor JV LLC, whose activities are carried out through Enclave at Lake Ellenor, a rental property located in Orlando, FL, built in 1973. |
| 5) | A 50% non-controlling member interest in Grand Reserve at Pavilions LP, whose activities are carried out through the following wholly-owned assets: Pavilion Crossings Apartments, a rental property in Charlotte, NC, built between 2000 and 2003. |
| 6) | A 95% non-controlling member interest in Fundrise Insight Two, LLC, whose activities are carried out through the following wholly-owned assets: Tyroll Hills Apartments, a garden-style multifamily property in Arlington, VA. |
The combined condensed results of operations and financial position of the eREITs’ equity method investees are summarized below (in thousands):
| June 30, 2017 | December 31, 2016 | |||||||
| Combined condensed balance sheet information: | ||||||||
| Real estate assets, net | $ | 257,272 | $ | 182,420 | ||||
| Other assets | 11,986 | 13,398 | ||||||
| Total assets | $ | 269,258 | $ | 195,818 | ||||
| Mortgage notes payable | $ | 185,459 | $ | 133,716 | ||||
| Other liabilities | 3,604 | 2,310 | ||||||
| Equity | 80,195 | 59,792 | ||||||
| Total liabilities and equity | $ | 269,258 | $ | 195,818 | ||||
| eREITs’ equity investment | $ | 61,259 | $ | 49,155 | ||||
| Combined condensed statement of operations information: | ||||||||
| Total revenue | $ | 12,259 | $ | 7,338 | ||||
| Total expenses | 11,755 | 9,399 | ||||||
| Net income (loss) | $ | 504 | $ | (2,061 | ) | |||
| eREITs’ equity in net income (loss) of investee | $ | 343 | $ | (1,995 | ) | |||
| eREITs’ share of offering costs within equity | $ | - | $ | (492 | ) | |||
As of June 30, 2017 and December 31, 2016, none of the eFunds held any investments that are accounted for using the equity method of accounting.
| F-22 |
7. Fair Value of Financial Instruments
The Company is required to disclose an estimate of fair value of our financial instruments for which it is practicable to estimate the fair value. The fair value of a financial instrument is the amount at which such financial instrument could be exchanged in a current transaction between willing parties, other than in a forced sale or liquidation. For certain of our financial instruments, fair values are not readily available since there are no active trading markets as characterized by current exchanges by willing parties.
We determine the fair value of certain instruments in accordance with the fair value hierarchy that requires an entity to maximize the use of observable inputs. The fair value hierarchy includes the following three levels based on the objectivity of the inputs, which were used for categorizing the assets or liabilities for which fair value is being measured and reported:
Level 1 – Quoted market prices in active markets for identical assets or liabilities.
Level 2 – Significant other observable inputs (e.g., quoted prices for similar items in active markets, quoted prices for identical or similar items in markets that are not active, inputs other than quoted prices that are observable such as interest rate and yield curves, and market-corroborated inputs).
Level 3 – Valuation generated from model-based techniques that use inputs that are significant and unobservable in the market. These unobservable assumptions reflect estimates of inputs that market participants would use in pricing the asset or liability. Valuation techniques include use of option pricing models, discounted cash flow methodologies or similar techniques, which incorporate management’s own estimates of assumptions that market participants would use in pricing the instrument or valuations that require significant management judgment or estimation.
The Company’s financial instruments consist of cash and cash equivalents, restricted cash, accrued interest receivable, real estate debt investments held to maturity, investments in single family properties, real estate assets available for sale, investments in equity method investees, notes payable, accrued interest payable, accounts payable, and other payables. The carrying values of all financial instruments, by way of the consolidated eREITs, are reasonable estimates of their fair value, except where noted below.
The aggregate fair value of the investments in equity method investees is based on unobservable Level 3 inputs which management has determined to be its best estimate of current market values.
| June 30, 2017 | December 31, 2016 | |||||||||||||||
| Sponsored Program | # of Equity Method Investees | Fair Value (in thousands) | # of Equity Method Investees | Fair Value (in thousands) | ||||||||||||
| Fundrise Equity REIT, LLC | 4 | $ | 56,232 | 3 | $ | 44,546 | ||||||||||
Additionally, as of June 30, 2017 and December 31, 2016, Fundrise East Coast Opportunistic REIT, LLC estimated the carrying value of its investment(s) in equity method investees to be a reasonable estimate of its fair value.
8. Property and Equipment, net
Property and equipment, net, consist of the following (in thousands):
| June 30, | December 31, | |||||||
| 2017 | 2016 | |||||||
| Computer equipment | $ | 119 | $ | 103 | ||||
| Furniture and fixtures | 7 | 7 | ||||||
| Leasehold Improvements | 398 | 379 | ||||||
| Total property and equipment | 524 | 489 | ||||||
| Less: accumulated depreciation | (120 | ) | (60 | ) | ||||
| Total property and equipment, net | $ | 404 | $ | 429 | ||||
Depreciation expense on property and equipment was approximately $60,000 and $7,000 for six months ended June 30, 2017 and June 30, 2016, respectively. The Company did not record an impairment expense for the six months ended June 30, 2017 or six months ended June 30, 2016.
| F-23 |
9. Intangible Assets, net
Intangible assets, net, consist of the following (in thousands):
| June 30, | December 31, | |||||||
| 2017 | 2016 | |||||||
| Internal-use software | $ | 2,960 | $ | 2,267 | ||||
| Trademarks | 119 | 117 | ||||||
| Patents | 58 | 49 | ||||||
| Domain | 80 | 35 | ||||||
| Total intangible assets | 3,217 | 2,468 | ||||||
| Less: accumulated amortization | (830 | ) | (553 | ) | ||||
| Total intangible assets, net | $ | 2,387 | $ | 1,915 | ||||
Amortization expense of intangible assets for six months ended June 30, 2017 and June 30, 2016 was approximately $277,000 and $139,000, respectively.
As mentioned inNote 3 – Summary of Significant Accounting Policies, some of our intangible assets are not amortized either due to the nature of the asset or due to legal rights not yet issued. The carrying value of these assets not subject to amortization as of June 30, 2017 and December 31, 2016 is as follows:
| June 30, | December 31, | |||||||
| 2017 | 2016 | |||||||
| Internal-use software in progress | $ | 613 | $ | 1,176 | ||||
| Trademarks | 26 | 76 | ||||||
| Patents in progress | 58 | 49 | ||||||
| Domain | 80 | 35 | ||||||
| Total carrying value of intangible assets not subject to amortization | $ | 777 | $ | 1,336 | ||||
10. Other Current Assets
Other current assets consist of the following (in thousands):
| June 30, | December 31, | |||||||
| 2017 | 2016 | |||||||
| Deferred offering costs of eREITs | $ | 1,661 | $ | 1,172 | ||||
| Deferred offering costs of Class B Common Stock | - | 265 | ||||||
| Prepaid expenses | 160 | 140 | ||||||
| Deposits for real estate assets | 16 | - | ||||||
| Retainer | 24 | 20 | ||||||
| Security deposit | 45 | 54 | ||||||
| Total other current assets | $ | 1,906 | $ | 1,651 | ||||
11. Stock-based Compensation and Other Employee Benefits
Stock-based Compensation
Under our Stock Option and Grant Plan, we may grant unrestricted and restricted stock awards, restricted stock units, or options to purchase shares of common stock to employees, executives, directors, and consultants. An aggregate of 4,600,000 shares of Class A common stock have been authorized for issuance under the Stock Option and Grant Plan as of June 30, 2017 and as of December 31, 2016. The restricted stock granted through June 30, 2017 generally follows a vesting schedule whereby 25% of the award vests twelve months from the vesting commencement date, and 6.25% vest quarterly thereafter, provided the grantee remains continuously employed by the Company through each vesting date; however, the Board of Directors retains the authority to grant shares or options with different terms.
| F-24 |
A summary of shares granted, unvested shares, and share forfeitures at June 30, 2017 and December 31, 2016 is as follows:
| Stock Awards Issued & Outstanding | Weighted Average Fair Value | Aggregate Intrinsic Value | ||||||||||
| Restricted at, December 31, 2015 | 883,066 | $ | 0.19 | $ | 168 | |||||||
| Shares granted | 971,500 | |||||||||||
| Vested and converted to unrestricted shares | (377,538 | ) | ||||||||||
| Forfeited shares | (79,375 | ) | ||||||||||
| Restricted at, December 31, 2016 | 1,397,653 | $ | 3.32 | $ | 4,643 | |||||||
| Shares granted | - | |||||||||||
| Vested and converted to unrestricted shares | (163,018 | ) | ||||||||||
| Forfeited shares | (99,813 | ) | ||||||||||
| Restricted at, June 30, 2017 | 1,134,822 | $ | 3.50 | $ | 3,973 | |||||||
During the six months ended June 30, 2017, 163,018 shares with a total fair value of approximately $251,000 vested. During the six months ended June 30, 2016, 243,613 shares with a total fair value of approximately $46,000 vested. There is no exercise price associated with these shares.
The Company recognized approximately $570,000 and $25,000 of stock-based compensation expense related to stock awards during the six-month periods ending June 30, 2017 and June 30, 2016, respectively. As of June 30, 2017 and December 31, 2016, total unrecognized compensation cost was approximately $3.3 million and $4.4 million, respectively, and these costs are expected to be recognized over the next 4 years.
Simple IRA Plan
The Company maintains an employer-sponsored simple IRA plan that covers all of our employees. Participants may elect to contribute any portion of their annual compensation up to the maximum limit imposed by federal tax law. The Company makes matching contributions equal to 100% of an eligible employee’s elective deferral up to 3% of that employee’s compensation. During the six months ended June 30, 2017 and June 30, 2016, the Company made matching contributions of approximately $64,000 and $32,000, respectively.
12. Stockholders’ Equity
In March 2014, the Company declared a 1:1,000,000 stock split of the original common shares, then issued and outstanding. All information related to common stock has been retroactively adjusted to give effect to the stock split in the accompanying consolidated statements of changes in stockholders’ equity.
Preferred Stock
The outstanding shares of convertible preferred stock are not mandatorily or otherwise redeemable. The sale of all, or substantially all, of the Company’s assets, a consolidation or merger with another company, or a transfer of voting control in excess of fifty percent (50%) of the Company’s voting power are all events which are deemed to be a liquidation and would trigger the payment of liquidation preferences under the Company’s Certificate of Incorporation. All such events require approval of the Board; however, in such events, all holders of equal or more subordinate equity instruments would also be entitled to receive the same form of consideration after any liquidation preferences. Therefore, based on the guidance of ASC 480-10-S99 –Distinguishing Liabilities from Equity, the non-redeemable convertible preferred stock has been classified within stockholders’ equity on the consolidated balance sheet. The significant terms of outstanding Series A are as follows:
Conversion – Each share of Series A is convertible, at the option of the holder, initially, into one share of Class A common stock (subject to adjustments for events of dilution). Each share of convertible preferred stock will automatically be converted upon: (i) the election of a majority of the outstanding shares of such series of preferred stock; or (ii) the consummation of an underwritten registered public offering with aggregate proceeds in excess of $35,000,000 (a “Qualified Public Offering”). The Company’s Certificate of Incorporation contain certain anti-dilution provisions, whereby if the Company issues additional shares of capital stock for an effective price lower than the conversion price for a series of preferred stock immediately prior to such issue, then the existing conversion price of such series of preferred stock will be reduced. The Company determined that while its convertible preferred stock contains certain anti-dilution features, the conversion feature embedded within its convertible preferred stock does not require bifurcation under the guidance of ASC 815,Derivatives and Hedging Activities.
| F-25 |
Liquidation preference – Upon any liquidation, winding up or dissolution of the Company, whether voluntary or involuntary (a “Liquidation Event”), before any distribution or payment shall be made to the holders of any common stock, the holders of convertible preferred stock shall be entitled to receive, by reason of their ownership of such stock, an amount per share of Series A equal to $2.1872 (as adjusted for stock splits, recapitalizations and other similar events) plus all declared and unpaid dividends (the “Series A Preferred Liquidation Preference”). However, if upon any such Liquidation Event, our assets are insufficient to make payment in full to all holders of convertible preferred stock of their respective liquidation preferences, then the entire balance of the Company’s assets legally available for distribution shall be distributed with equal priority between the preferred holders based upon the amount of each such holders’ Series A Preferred Liquidation Preference. Any excess assets, after payment in full of the liquidation preferences to the convertible preferred stockholders, are then allocated to the holders of the common stock, pro-rata.
Dividends – If and when declared by the Board, the holders of Series A and common stock, on a pari passu basis, will be entitled to receive dividends. As of June 30, 2017 and December 31, 2016 we have not declared any dividends on preferred stock.
Voting rights – Generally, preferred stockholders have one vote for each share of common stock that would be issuable upon conversion of preferred stock. Voting as a separate class, the Series A stockholders are entitled to elect one member of the Board. The holders of common stock, voting as a separate class, are entitled to elect two members of the Board. The remaining two members are elected by the preferred stockholders and common stockholders voting together as a single class on an as-if-converted to common stock basis. The Company has adopted a dual-class common stock structure, pursuant to which each share of Class A common stock will have one vote per share and each share of Class F common stock will have ten votes per share.
Common Stock
The Company has also granted restricted shares of Class A Common Stock under our 2014 Stock Option and Grant Plan to our executive officers, directors and certain holders of more than 10% of a given class of our outstanding capital stock, in their capacities as our employees.
On July 5, 2016, the Company issued, via private placement, 18 million shares of Class M Common Stock, at $0.0001 per share, to certain executive officers of the Company (excluding Benjamin Miller, who did not participate) for aggregate cash consideration of $1,800. Each share of the Class M Common Stock is entitled to nine votes per share. The shares are callable by the Company at any time, including upon a vote of a majority of the then outstanding Series A converted preferred stock. On December 10, 2016, the Company exercised its right to redeem all 18 million outstanding shares of Class M Common Stock for an aggregate cash consideration of $1,800 upon unanimous consent by the Board of Directors. As of June 30, 2017, there were 18 million shares of Class M Common Stock authorized but unissued.
On January 19, 2017, the Board of Directors of the Company increased the number of authorized shares of Common Stock to 96,000,000 authorized shares and created a new class of Common Stock, to be designated as Class B Common Stock, consisting of 10,000,000 authorized shares by filing an Amended and Restated Certificate of Incorporation with the State of Delaware. Except as required by applicable law, the holders of our Class B Common Stock are not entitled to vote on any matters submitted to a vote of stockholders. On January 31, 2017, the Company was qualified by the SEC for a Tier 2 offering pursuant to Regulation A to offer up to 2,000,000 shares of our Class B Common Stock to the public at $5.00 per share, with par value of $0.0001. On February 3, 2017, the Company offered an additional 1,000,000 shares of our Class B Common Stock to the public at $5.00 per share, thereby increasing the total offering of Class B Common Stock to 3,000,000 shares. The minimum investment in our Class B Common Stock for initial purchase was 200 shares, or $1,000 based on the per share price. As of February 28, 2017, 2,884,129 shares were sold for total proceeds of $14.4 million. On June 30, 2017, 3,800 shares were redeemed for $19,000.
Investors’ Rights Agreement
We entered into an Investors’ Rights Agreement (the “IRA”) with certain holders of our common stock and preferred stock, including persons who held more than 10% of any class of our outstanding capital stock, certain of our executive officers and directors and entities with which certain of our directors are affiliated. Pursuant to the IRA, the holders of certain shares of our common stock and preferred stock are entitled to certain registration rights, information rights and preemptive rights.
| F-26 |
Right of First Refusal and Co-Sale Agreement
We entered into a Right of First Refusal and Co-Sale Agreement (the “Co-Sale Agreement”) with certain holders of our common stock and preferred stock, including persons who hold more than 10% of our outstanding capital stock, certain of our executive officers and directors, and entities with which certain of our directors are affiliated. Pursuant to the Co-Sale Agreement, the holders of our preferred stock have rights of first refusal and co-sale with respect to certain transfers made by certain holders of our common stock.
Voting Agreement
We entered into a Voting Agreement (the “Voting Agreement”) with certain holders of our common stock and preferred stock, including persons who held more than 10% of any class of our outstanding capital stock, our executive officers and directors, and entities with which certain of our directors are affiliated. Pursuant to the Voting Agreement, the holders of certain shares of our common stock and preferred stock have agreed to vote their shares on certain matters, including with respect to the election of directors.
13. Accumulated Deficit
During the six months ended June 30, 2017, we had net losses attributable to the Company of $3.2 million. During the six months ended June 30, 2016, we had net losses attributable to the Company of $1.4 million. We have an accumulated deficit of $17.4 million and stockholders’ equity of $174.9 million, including $152 million of interest in non-controlling entities, at June 30, 2017. We had an accumulated deficit of $14.1 million and stockholders’ equity of $129.6 million, including $118.4 million of interest in non-controlling entities, at December 31, 2016.
14. Non-Controlling Interests in Consolidated Entities
The non-controlling interests (“NCI”) balance as of June 30, 2017 is detailed below (not in thousands):
| Change in NCI through the six months ended June 30, 2017 | ||||||||||||||||||||||||
| Consolidated entity | Member’s equity of NCI as of December 31, 2016 | Acquisition or (disposal) of Member’s equity of NCI(1) | Related party interest eliminations (2) | Net income (loss) from NCI | Non-controlling interests balance as of June 30, 2017 | Net Income (loss) attributable to Rise Companies from NCI | ||||||||||||||||||
| Fundrise LP | $ | 10,931,558 | $ | 193,111 | $ | (118,522 | ) | $ | (3,611 | ) | $ | 11,114,122 | $ | (72 | ) | |||||||||
| Fundrise Real Estate Investment Trust, LLC | 46,407,127 | (1,666,352 | ) | (142,842 | ) | 2,384,337 | 46,982,551 | 281 | ||||||||||||||||
| Fundrise Equity REIT, LLC | 43,650,048 | (2,245,534 | ) | (5,481 | ) | 174,728 | 41,313,511 | 12 | ||||||||||||||||
| Fundrise West Coast Opportunistic REIT, LLC | 6,477,150 | 11,328,320 | (3,236 | ) | 350,271 | 18,078,804 | 109 | |||||||||||||||||
| Fundrise East Coast Opportunistic REIT, LLC | 5,897,533 | 10,656,319 | (2,986 | ) | 292,060 | 16,674,423 | 97 | |||||||||||||||||
| Fundrise Midland Opportunistic REIT, LLC | 5,011,182 | 11,077,805 | (3,048 | ) | 98,153 | 16,119,840 | 34 | |||||||||||||||||
| Fundrise For-Sale Housing eFund Los Angeles CA, LLC | - | 741,360 | (5,000 | ) | (22,114 | ) | 712,535 | (150 | ) | |||||||||||||||
| Fundrise For-Sale Housing eFund Washington DC, LLC | - | 874,807 | (5,000 | ) | (7,889 | ) | 861,510 | (45 | ) | |||||||||||||||
| Total | $ | 118,374,598 | $ | 30,959,836 | $ | (286,115 | ) | $ | 3,265,935 | $ | 152,314,254 | $ | 266 | |||||||||||
| (1) | Total contributed equity to consolidated entities during the six months ended June 30, 2017, less any amortized offering costs, share redemptions, or distributions. |
| (2) | Elimination of interests acquired during the six months ended June 30, 2017 by the Company and Fundrise LP in the non-controlling entities. |
| F-27 |
15. Related Party Arrangements
eREITS
Fundrise Real Estate Investment Trust, LLC
The Company formed Fundrise Real Estate Investment Trust, LLC in 2015 to primarily focus on real estate loans and other real estate related investments for the purpose of earning income. The original Offering of up to $50 million in common shares was declared qualified by the SEC on November 24, 2015, and in December 2015, the initial offering for Fundrise Real Estate Investment Trust, LLC began via the Fundrise Platform. On May 10, 2017, Fundrise Real Estate Investment Trust, LLC qualified an additional $41.2 million in common shares to be sold via the Fundrise Platform. As of June 30, 2017 and December 31, 2016, Fundrise Real Estate Investment Trust, LLC has raised $51 million and $50 million, respectively, at $10 per share. The Company is entitled to receive reimbursements for costs associated with the formation and operating expenses of Fundrise Real Estate Investment Trust, LLC. As of June 30, 2017 and December 31, 2016, the Company had been fully reimbursed by Fundrise Real Estate Investment Trust, LLC in the amount of approximately $1.0 million for such costs.
The Company is a member of Fundrise Real Estate Investment Trust, LLC and held 600 and 100 shares, respectively, as of June 30, 2017, and December 31, 2016.
Fundrise LP, a non-controlling consolidated entity of the Company, is a member of Fundrise Real Estate Investment Trust, LLC and held 119,900 and 100,117 shares, respectively, as of June 30, 2017 and December 31, 2016.
Fundrise Equity REIT, LLC
The Company formed Fundrise Equity REIT, LLC in 2015 to originate, invest in, and manage a diversified portfolio of commercial real estate properties. In January 2016, the initial offering for Fundrise Equity REIT, LLC began via the Fundrise Platform. As of June 30, 2017 and December 31, 2016, Fundrise Equity REIT, LLC has raised $50 million and $50 million, respectively, at $10 per share. The Company is entitled to receive reimbursements for costs associated with the formation and operating expenses of Fundrise Equity REIT, LLC. As of June 30, 2017, the Company has been fully reimbursed by Fundrise Equity REIT, LLC in the amount of approximately $1.0 million for such costs. As of December 31, 2016, the receivable outstanding from Fundrise Equity REIT, LLC was $0.4 million, was has been eliminated upon consolidation.
The Company is a member of Fundrise Equity REIT, LLC and held 350 and 100 shares, respectively, as of June 30, 2017, and December 31, 2016.
Fundrise LP, a non-controlling consolidated entity of the Company, is a member of Fundrise Equity REIT, LLC and held 19,900 shares as of June 30, 2017 and December 31, 2016.
Fundrise West Coast Opportunistic REIT, LLC
The Company formed Fundrise West Coast Opportunistic REIT, LLC in 2015 as a Delaware limited liability company to invest in a diversified portfolio of commercial real estate assets and securities. In October 2016, the initial offering for Fundrise West Coast Opportunistic REIT, LLC began via the Fundrise Platform. As of June 30, 2017 and December 31, 2016, Fundrise West Coast Opportunistic REIT, LLC has raised approximately $19 million and $7 million, respectively, at $10 per share. The Company is entitled to receive reimbursements for costs associated with the formation and operating expenses of Fundrise West Coast Opportunistic REIT, LLC. As of June 30, 2017 and December 31, 2016, the receivable outstanding from Fundrise West Coast Opportunistic REIT, LLC was $0.3 million and $0.4 million, respectively, which has been eliminated upon consolidation.
| F-28 |
The Company is a member of Fundrise West Coast Opportunistic REIT, LLC and held 600 and 500 shares, respectively, as of June 30, 2017 and December 31, 2016.
Fundrise LP, a non-controlling consolidated entity of the Company, is a member of Fundrise West Coast Opportunistic REIT, LLC and held 9,500 shares as of June 30, 2017 and December 31, 2016.
Fundrise East Coast Opportunistic REIT, LLC
The Company formed Fundrise East Coast Opportunistic REIT, LLC in 2015 as a Delaware limited liability company to invest in a diversified portfolio of commercial real estate assets and securities. In October 2016, the initial offering for Fundrise East Coast Opportunistic REIT, LLC began via the Fundrise Platform. As of June 30, 2017 and December 31, 2016, Fundrise East Coast Opportunistic REIT, LLC has raised approximately $18 million and $6 million, respectively, at $10 per share. The Company is entitled to receive reimbursements for costs associated with the formation and operating expenses of Fundrise East Coast Opportunistic REIT, LLC. As of June 30, 2017 and December 31, 2016, the receivable outstanding from Fundrise East Coast Opportunistic REIT, LLC was $0.3 million and $0.4 million, respectively, which has been eliminated upon consolidation.
The Company is a member of Fundrise East Coast Opportunistic REIT, LLC and held 600 and 500 shares, respectively, as of June 30, 2017 and December 31, 2016.
Fundrise LP, a non-controlling consolidated entity of the Company, is a member of Fundrise East Coast Opportunistic REIT, LLC and held 9,500 shares as of June 30, 2017 and December 31, 2016.
Fundrise Midland Opportunistic REIT, LLC
The Company formed Fundrise Midland Opportunistic REIT, LLC in 2015 as a Delaware limited liability company to invest in a diversified portfolio of commercial real estate assets and securities. In October 2016, the initial offering for Fundrise Midland Opportunistic REIT, LLC began via the Fundrise Platform. As of June 30, 2017 and December 31, 2016, Fundrise Midland Opportunistic REIT, LLC has raised approximately $17 million and $5 million, respectively, at $10 per share. The Company is entitled to receive reimbursements for costs associated with the formation and operating expenses of Fundrise Midland Opportunistic REIT, LLC. As of June 30, 2017 and December 31, 2016, the receivable outstanding from Fundrise Midland Opportunistic REIT, LLC was $0.4 million and $0.4 million, respectively, which has been eliminated upon consolidation.
The Company is a member of Fundrise Midland Opportunistic REIT, LLC and holds 600 and 500 shares, respectively, as of June 30, 2017, and December 31, 2016.
Fundrise LP, a non-controlling consolidated entity of the Company, is a member of Fundrise Midland Coast Opportunistic REIT, LLC and held 9,500 shares as of June 30, 2017 and December 31, 2016.
eFunds
Fundrise For-Sale Housing eFund - Los Angeles CA, LLC
The Company formed Fundrise For-Sale Housing eFund - Los Angeles CA, LLC on November 19, 2015, as a Delaware Limited Liability Company to invest in the acquisition of land for and development of single-family attached and detached homes, townhomes and condominiums targeted to first-time, move-up and active adult homebuyers and other commercial real estate investments. Operations commenced May 26, 2017. As of June 30, 2017 and December 31, 2016, Fundrise For-Sale Housing eFund - Los Angeles CA, LLC has issued 74,136 and 0 shares, respectively, including shares to the Company. In addition, Fundrise, L.P., a non-controlling consolidated entity of the Company, has committed to purchase an aggregate of 9,500 common shares at $10.00 per share in a private placement for an aggregate purchase price of $95,000 due on a date no later than the date on which the Fundrise For-Sale Housing eFund - Los Angeles CA, LLC raises and accepts at least $1,000,000 in their Offering. The Company is entitled to receive reimbursements for costs associated with the formation and operating expenses of Fundrise For-Sale Housing eFund - Los Angeles CA, LLC, but not until Fundrise For-Sale Housing eFund - Los Angeles CA, LLC raises at least $1,000,000 in their Offering. As of June 30, 2017 and December 31, 2016, the Company had no receivable from Fundrise For-Sale Housing eFund - Los Angeles CA, LLC, as Fundrise For-Sale Housing eFund - Los Angeles CA, LLC had not raised and accepted $1,000,000 from its Offering at those times.
The Company is a member of Fundrise For-Sale Housing eFund - Los Angeles CA, LLC and held 500 shares as of June 30, 2017 and December 31, 2016.
Fundrise LP, a non-controlling consolidated entity of the Company, has committed to purchase an aggregate of 9,500 common shares at $10.00 per share in a private placement for an aggregate purchase price of $95,000 due on a date no later than the date on which Fundrise For-Sale Housing eFund - Los Angeles CA, LLC raises and accepts at least $1,000,000 in their offering.
| F-29 |
Fundrise For-Sale Housing eFund – Washington DC, LLC
The Company formed Fundrise For-Sale Housing eFund – Washington DC, LLC on November 19, 2015, as a Delaware Limited Liability Company to invest in the acquisition of land for and development of single-family attached and detached homes, townhomes and condominiums targeted to first-time, move-up and active adult homebuyers and other commercial real estate investments. Operations commenced May 26, 2017. As of June 30, 2017 and December 31, 2016, Fundrise For-Sale Housing eFund – Washington DC, LLC has issued 87,481 and 0 shares, respectively, including shares to the Company. In addition, Fundrise, L.P., a non-controlling consolidated entity of the Company, has committed to purchase an aggregate of 9,500 common shares at $10.00 per share in a private placement for an aggregate purchase price of $95,000 due on a date no later than the date on which Fundrise For-Sale Housing eFund – Washington DC, LLC raises and accepts at least $1,000,000 in their Offering. The Company is entitled to receive reimbursements for costs associated with the formation and operating expenses of Fundrise For-Sale Housing eFund – Washington DC, LLC, but not until Fundrise For-Sale Housing eFund – Washington DC, LLC raises at least $1,000,000 in their Offering. As of June 30, 2017 and December 31, 2016, the Company had no receivable from Fundrise For-Sale Housing eFund – Washington DC, LLC, as Fundrise For-Sale Housing eFund – Washington DC, LLC had not yet raised and accepted $1,000,000 from its Offering at those times.
The Company is a member of Fundrise For-Sale Housing eFund – Washington DC, LLC and held 500 shares as of June 30, 2017 and December 31, 2016.
Fundrise LP, a non-controlling consolidated entity of the Company, has committed to purchase an aggregate of 9,500 common shares at $10.00 per share in a private placement for an aggregate purchase price of $95,000 due on a date no later than the date on which Fundrise For-Sale Housing eFund – Washington DC, LLC raises and accepts at least $1,000,000 in their offering.
Promissory Grid Notes with eREITs and eFunds
As a means to provide liquidity during capital raising periods, the Company issued a promissory grid note to Fundrise Real Estate Investment Trust, LLC in the amount of $5.0 million on December 10, 2015. The loan bears a 2% interest rate and was initially set to expire on March 31, 2016. On March 28, 2016, the promissory grid note was amended and restated with a new maturity date of July 31, 2016. The grid note was amended to include Fundrise Equity REIT, LLC as a noteholder, increase the interest rate from 2% to 2.5%, and increase the available credit from $5.0 million to $10.0 million. On July 29, 2016, the grid note was amended and restated to extend the maturity date to October 31, 2016. On October 25, 2016, the grid note was amended and restated to extend the maturity date to January 31, 2017, and to include Fundrise West Coast Opportunistic REIT, LLC, Fundrise East Coast Opportunistic REIT, LLC, and Fundrise Midland Opportunistic REIT, LLC as noteholders. On January 31, 2017, the grid note was amended and restated to increase the interest rate from 2.5% to 3.0% and to extend the maturity date until April 30, 2017, and on April 30, 2017, the grid note was amended and restated to extend the maturity date until July 30, 2017. On May 26, 2017, the grid note was amended and restated to include Fundrise For-Sale Housing eFund – Los Angeles CA, LLC as a noteholder. On June 26, 2017, the grid note was amended and restated to include Fundrise For-Sale Housing eFund – Washington DC, LLC as a note holder.
A summary of the grid note activity for the semi-annual reporting period is as follows (amounts in thousands):
| Principal outstanding balance at | Principal outstanding balance at | Accrued Interest Balance at | Accrued Interest Balance at | Interest income earned during the six months ended | Interest income earned during the six months ended | |||||||||||||||||||
| 6/30/17 | 12/31/16 | 6/30/17 | 12/31/16 | 6/30/17 | 6/30/16 | |||||||||||||||||||
| Fundrise Real Estate Investment Trust, LLC | $ | - | $ | - | $ | - | $ | - | $ | - | $ | - | ||||||||||||
| Fundrise Equity REIT, LLC | 4,710 | 1,500 | 25 | - | 25 | - | ||||||||||||||||||
| Fundrise West Coast Opportunistic REIT, LLC | - | 1,500 | - | 7 | - | - | ||||||||||||||||||
| Fundrise East Coast Opportunistic REIT, LLC | 1,090 | 7,000 | 116 | 17 | 99 | - | ||||||||||||||||||
| Fundrise Midland Opportunistic REIT, LLC | - | - | - | - | - | - | ||||||||||||||||||
| Fundrise For-Sale Housing eFund – Los Angeles CA, LLC | 907 | - | 2 | - | 2 | - | ||||||||||||||||||
| Fundrise For-Sale Housing eFund – Washington DC, LLC | 1,090 | - | - | - | - | - | ||||||||||||||||||
| Total | $ | 7,797 | $ | 10,000 | $ | 143 | $ | 24 | $ | 126 | $ | 0 | ||||||||||||
| F-30 |
The promissory grid note principal, interest receivable, and any interest income earned by the Company from the eREITs and eFunds are considered intercompany transactions, and have been eliminated upon consolidation.
One-Off Promissory Note with Fundrise Equity REIT, LLC
As a means to provide liquidity during capital raising periods, the Company issued a one-off promissory note in the amount of $2.1 million to Fundrise Equity REIT, LLC on April 28, 2017. This note expires on December 31, 2017 and bears a 3% interest rate.
As of June 30, 2017, Fundrise Equity REIT, LLC has drawn against the one-off promissory note in the amount of $1.5 million and repaid principal in the amount of $1.3 million. Approximately $8,000 of interest has been incurred and remains payable to the Company.
The one-off promissory note receivable and any accrued interest receivable by Fundrise Equity REIT, LLC to the Company are considered intercompany transactions and have been eliminated upon consolidation.
One-Off Promissory Note with Fundrise East Coast Opportunistic REIT, LLC
As a means to provide liquidity during capital raising periods, the Company issued a one-off promissory note in the amount of $2.3 million to Fundrise East Coast Opportunistic REIT, LLC. This note bore a 2.5% interest rate and had a stated expiration date of April 30, 2017.
In the first quarter of 2017, Fundrise East Coast Opportunistic REIT, LLC had drawn against the one-off promissory note in the amount of $2.3 million and repaid the one-off note in full.
The one-off promissory note receivable and any accrued interest receivable by Fundrise East Coast Opportunistic REIT, LLC to the Company were considered intercompany transactions and were eliminated upon consolidation.
Promissory Grid Note with Fundrise LP
On April 1, 2016, the Company became the holder of a $10 million promissory grid note from Fundrise LP as a means to provide liquidity during capital raising periods. This note was extended on March 7, 2017. The amended and restated promissory grid note increased the interest rate from 2.5% to 3% and matures on April 30, 2018. During the year ended December 31, 2016, the Company drew $7.4 million against the promissory grid note and repaid $0.7 million in principal and interest to Fundrise LP. During the six months ended June 30, 2017, the Company drew $7.4 million against the promissory grid note and repaid $7.9 million in principal and interest to Fundrise LP. As of June 30, 2017 and December 31, 2016, the outstanding principal balance on the grid note from Fundrise LP was $6.4 million and $6.3 million, respectively, which has been eliminated upon consolidation.
Executive Officers of Our Company
As of the date of these consolidated financial statements, the executive officers of the Company and their positions and offices are as follows:
| Name | Position | |
| Benjamin S. Miller | Co-Founder, Chief Executive Officer, and Interim Chief Financial Officer | |
| Brandon T. Jenkins | Chief Operating Officer | |
| Kenneth Shin | Chief Technology Officer | |
| Bjorn J. Hall | General Counsel, Chief Compliance Officer, and Corporate Secretary |
Benjamin S. Miller currently serves as Chief Executive Officer of the Company and has served as Chief Executive Officer and Director of the Company since its inception in March 2012; additionally, he has served as Interim Chief Financial Officer since October 2015.
Brandon T. Jenkins currently serves as Chief Operating Officer of the Company and has served in the same role for the Company since February 2014, prior to which time he served as Head of Product Development and Director of Real Estate.
| F-31 |
Kenneth Shin currently serves as Chief Technology Officer of the Company and has served in the same role for the Company since its inception in March 2012.
Bjorn J. Hall currently serves as the General Counsel, Chief Compliance Officer, and Corporate Secretary of the Company and has served in such capacities for the Company since February 2014.
16. Related Party Transactions
Several of the Company’s executive officers and directors (including immediate family members) have opened investor accounts on the Fundrise Platform and have purchased notes and shares of sponsored programs and received related redemptions. All project-dependent note and sponsored-program equity share subscriptions and redemptions were made in the ordinary course of business and were transacted on terms and conditions that were not more favorable than those obtained by third-party investors.
On June 25, 2014, the Company amended the limited partnership agreement of Fundrise LP to admit Tal Kerret, a member of the Company’s Board of Directors as a means of board compensation. As a result of this amendment, Tal Kerret obtained the profits interest related to the portion of capital that the Company had contributed to Fundrise LP upon its initial subscription. The Company retains the right to its initial capital contribution, but will cease to earn profits thereon.
Investments in Project-Dependent Notes
Benjamin Miller, Daniel Miller, Herbert Miller (Messrs. Millers’ father), Haniel Lynn, and Joe Chen, the latter two members of the Board of Directors, have each invested in Project Dependent Notes issued by our sponsored Programs. In aggregate, the total investment outstanding as of June 30, 2017 and as of December 31, 2016 of these related parties is approximately $0.6 million and $0.8 million, respectively. In all cases, these Project Dependent Notes were purchased under the same terms as any other investor on the Fundrise Platform and the parties received no special benefits not shared on a pro-rata basis by all holders of the notes.
Series A Preferred Stock Financing
The following table summarizes the Series A stock purchased by our executive officers, directors, holders of more than 10% of a given class of our outstanding capital stock or any immediate family member.
| Shares of | Total | |||||||
| Series A | Purchase | |||||||
| Stock | Price | |||||||
| WestMill Capital Partners, LLC(1) | 368,679 | $ | 806,365 | |||||
| Benjamin Miller | 249,557 | 545,825 | ||||||
| Daniel Miller | 249,557 | 545,825 | ||||||
| Herbert Miller, Patrice Miller, David Miller, Caroline Miller(2) | 374,757 | 448,932 | ||||||
| (1) | WestMill Capital Partners LLC is a private limited liability company jointly and equally owned in its entirety by Benjamin Miller and Daniel Miller. |
| (2) | Each of these individuals are immediate family members of Benjamin Miller and Daniel Miller. Consists of 131,643 shares of Series A Preferred purchased by Herbert Miller, 109,348 shares of Series A Preferred purchased by Patrice Miller, 66,883 shares of Series A stock purchased by David Miller and 66,883 shares of Series A stock purchased by Caroline Miller, each upon the conversion of outstanding convertible promissory notes and at a price per share of approximately $1.20. |
17. Segment Reporting
The Company reports segment information using the “management approach.” Under this approach, operating segments are identified in substantially the same manner as they are reported internally and used by us for purposes of evaluating performance and allocating resources. Based on this approach, we have one reportable segment. The Company’s management reporting process is based on our internal operating structure, which is subject to change and is not necessarily similar to that of other comparable companies.
| F-32 |
18. Commitments and Contingencies
Construction Draws
We have committed $23.5 million in construction draws for certain debt investments to be drawn down within the next 12 months. The draws are expected to be made until the funds are fully drawn down.
Operating Leases
On September 2, 2016, the Company entered into a four-year lease, expiring November 30, 2020, for new office space in Washington, DC. The Company entered into the new office space lease in order to meet the demand of employee headcount growth. The Corporate Headquarters have been relocated to this new space.
The Company also maintains one satellite office in Los Angeles, CA contracted on a month-to-month basis.
Facilities rental expense for the six months ended June 30, 2017 and June 30, 2016 was approximately $104,000 and $61,000, respectively. As part of these lease agreements, we currently have pledged approximately $45,000 as security deposits.
Our future minimum lease payments are as follows for the corresponding calendar years:
| Year-Ended | Future Minimum Lease (in thousands) | |||
| 2017 | $ | 49 | ||
| 2018 | 146 | |||
| 2019 | 198 | |||
| 2020 | 213 | |||
| 2021 | - | |||
| Thereafter | - | |||
| Total | $ | 606 | ||
Distribution Support Commitment – Fundrise Real Estate Investment Trust, LLC
Pursuant to a Distribution Support Agreement, Fundrise LP, an affiliate of the Company and a member of Fundrise Real Estate Investment Trust, LLC, has agreed to purchase up to an aggregate of $1,000,000 in additional common shares of Fundrise Real Estate Investment Trust, LLC to support the sponsored program’s quarterly distribution payments to shareholders. If adjusted funds from operations (“AFFO”) in any calendar quarter during the distribution support period is less than the amount that would produce a 15% annualized return, then Fundrise LP will purchase shares following the end of such quarter at the net asset value per share then in effect for an aggregate purchase price equal to the amount by which AFFO for such quarter is less than the 15% annualized amount. This arrangement provides liquidity to the sponsored affiliate for distributions, but does not in any way require that the sponsored affiliate distribute an amount that would represent a 15% annualized return. The distribution support commitment will only be provided until the earlier of (i) the purchase by Fundrise LP of an aggregate of $1,000,000 in common shares or (ii) December 31, 2017.
On February 16, 2017, Fundrise LP purchased 19,783 shares of Fundrise Real Estate Investment Trust, LLC common shares for $197,830, which fulfilled Fundrise LP’s total commitment under the Distribution Support Agreement and its obligation thereunder was thereby extinguished.
Legal Proceedings
As of the date of the consolidated financial statements, we are not currently named as a defendant in any active or pending litigation. However, it is possible that the company could become involved in various litigation matters arising in the ordinary course of our business. Although we are unable to predict with certainty the eventual outcome of any litigation, management is not aware of any litigation likely to occur that we currently assess as being significant to us.
19. Subsequent Events
Management has evaluated subsequent events for disclosure in these consolidated financial statements through September 12, 2017, which was the date the consolidated financial statements were available to be issued.
| F-33 |
Issuance of Class B Common Stock
On July 28, 2017, the Company was qualified by the SEC to offer up to 2,000,000 additional shares of Class B Common Stock to the public at $5.50 per share, with par value of $0.0001. This offering has no minimum investment. As of September 12, 2017, 458,794 shares have been sold under this offering for total proceeds of $2.5 million.
Sponsored Regulation A+ Filings
As of September 12, 2017, the Company’s sponsored affiliates, Fundrise Real Estate Investment Trust, LLC, Fundrise West Coast Opportunistic REIT, LLC, Fundrise East Coast Opportunistic REIT, LLC, Fundrise Midland Opportunistic, LLC, Fundrise For-Sale Housing eFund – Los Angeles CA, LLC, and Fundrise For-Sale Housing eFund – Washington DC, LLC continue to raise additional offering proceeds pursuant to each respective qualified Regulation A+ offering.
Promissory Grid Notes with eREITs and eFunds
On July 31, 2017, the expiration date of the amended and restated promissory grid note between the Company as lender and Fundrise Real Estate Investment Trust, LLC, Fundrise Equity REIT, LLC, Fundrise West Coast Opportunistic REIT, LLC, Fundrise East Coast Opportunistic REIT, LLC, Fundrise Midland Opportunistic REIT, LLC, Fundrise For-Sale Housing eFund - Washington DC, LLC, and Fundrise For-Sale Housing eFund – Los Angeles CA as borrowers was extended to October 31, 2017. None of the eREITs or eFunds paid any extension or other fees related to the amendment of this note.
A summary of the grid note principal balance outstanding at September 12, 2017 is as follows (amounts in thousands):
Principal Outstanding Balance at | ||||
| 9/12/17 | ||||
| Fundrise Real Estate Investment Trust, LLC | $ | - | ||
| Fundrise Equity REIT, LLC | - | |||
| Fundrise West Coast Opportunistic REIT, LLC | - | |||
| Fundrise East Coast Opportunistic REIT, LLC | - | |||
| Fundrise Midland Opportunistic REIT, LLC | - | |||
| Fundrise For-Sale Housing eFund – Los Angeles CA, LLC | 1,270 | |||
| Fundrise For-Sale Housing eFund – Washington DC, LLC | - | |||
| Total | $ | 1,270 | ||
Promissory Grid Note with Fundrise LP
Between June 30, 2017 and September 12, 2017, The Company made draws totaling $1.2 million and made $7.1 million in principal and accrued interest payments on the amended and restated promissory grid note issued to the Company from Fundrise LP. As of September 12, 2017, the principal and accrued interest outstanding for this grid note was approximately $375,000.
Reimbursement of organizational, offering and related costs from the eREITs
Fundrise Real Estate Investment Trust, LLC, Fundrise Equity REIT, LLC, Fundrise West Coast Opportunistic REIT, LLC, Fundrise East Coast Opportunistic REIT, LLC, and Fundrise Midland Opportunistic REIT, LLC made approximate reimbursement payments of $3,000, $8,000, $107,000, $101,000, and $98,000, respectively, to Fundrise Advisors between June 30, 2017 and September 12, 2017. These amounts were accrued for as of June 30, 2017. However, they were intercompany transactions and eliminated upon consolidation.
Asset Management Fees from eREITS
On July 25, 2017, Fundrise Equity REIT, LLC, Fundrise West Coast Opportunistic REIT, LLC, Fundrise East Coast Opportunistic REIT, LLC, and Fundrise Midland Opportunistic REIT, LLC paid asset management fees of approximately $110,000, $43,000, $40,000, and $39,000, respectively, to their manager, Fundrise Advisors, for the second quarter of 2017. These amounts were accrued for as of June 30, 2017. However, they were intercompany transactions and eliminated upon consolidation.
| F-34 |
Item 4. Exhibits
Index to Exhibits
| Exhibit No. | Description | |
| 2.1* | Amended and Restated Certificate of Incorporation | |
| 2.2* | Bylaws | |
| 3.1* | Investors’ Rights Agreement, by and among Rise Companies Corp. and certain investors, dated April 14, 2014 | |
| 3.2* | First Refusal and Co-Sale Agreement, by and among Rise Companies Corp. and certain investors, dated April 14, 2014 | |
| 4.1* | Form of Subscription Package (included in the Offering Circular as Appendix A and incorporated herein by reference) | |
| 5.1* | Voting Agreement, by and among Rise Companies Corp. and certain stockholders, dated April 14, 2014 | |
| 6.1* | Special Indemnity Letter Agreement, by and between Rise Companies Corp. and Renren Lianhe Holdings, dated April 14, 2014 | |
| 6.2* | 2014 Stock Option and Grant Plan | |
| 10.1 | Power of Attorney (included on signature page) | |
| 15.1* | Draft offering statement previously submitted pursuant to Rule 252(d) (incorporated by reference to the copy thereof previously made public pursuant to Rule 301 of Regulation S-T) | |
| 15.2* | Draft amended offering statement previously submitted pursuant to Rule 252(d) (incorporated by reference to the copy thereof previously made public pursuant to Rule 301 of Regulation S-T) | |
| 15.3* | Draft amended offering statement previously submitted pursuant to Rule 252(d) (incorporated by reference to the copy thereof previously made public pursuant to Rule 301 of Regulation S-T) | |
| 15.4* | Draft amended offering statement previously submitted pursuant to Rule 252(d) (incorporated by reference to the copy thereof previously made public pursuant to Rule 301 of Regulation S-T) | |
| 15.5* | Draft amended offering statement previously submitted pursuant to Rule 252(d) (incorporated by reference to the copy thereof previously made public pursuant to Rule 301 of Regulation S-T) | |
| 15.6* | Correspondence by or on behalf of the issuer previously submitted pursuant to Rule 252(d) |
| * | Previously filed |
14
SIGNATURES
Pursuant to the requirements of Regulation A, the issuer has duly caused this special financial report on Form 1-SA to be signed on its behalf by the undersigned, thereunto duly authorized, in Washington, D.C., on September 28, 2017.
Rise Companies Corp.
| By: | /s/ Benjamin S. Miller | ||
| Name: | Benjamin S. Miller | ||
| Title: | Chief Executive Officer | ||
POWER OF ATTORNEY
KNOW ALL MEN BY THESE PRESENTS, that each of the undersigned constitutes and appoints Benjamin S. Miller his true and lawful attorney-in-fact and agent, with full power of substitution and resubstitution, for such person and in his name, place and stead, in any and all capacities, to sign this special financial report on Form 1-SA, and to file the same, with all exhibits thereto, and other documents in connection therewith, with the Securities and Exchange Commission, granting unto said attorney-in-fact and agent full power and authority to do and perform each and every act and thing requisite and necessary to be done in and about the premises, as fully to all intents and purposes as he might or could do in person, hereby ratifying and confirming all that such attorney-in-fact and agent, or his substitute or substitutes, may lawfully do or cause to be done by virtue hereof.
This offering statement has been signed by the following persons in the capacities and on the dates indicated.
| Signature | Title | Date | |||
| /s/ Benjamin S. Miller | Chief Executive Officer | September 28, 2017 | |||
| Benjamin S. Miller | (Principal Executive Officer) | ||||
| /s/ Benjamin S. Miller | Interim Chief Financial Officer and Treasurer | September 28, 2017 | |||
| Benjamin S. Miller | (Principal Financial Officer and Principal Accounting Officer) | ||||
| /s/ Benjamin S. Miller | Director | September 28, 2017 | |||
| Benjamin S. Miller | |||||
| * | Director | September 28, 2017 | |||
| Brandon T. Jenkins | |||||
| * | Director | September 28, 2017 | |||
| Joseph Chen | |||||
| * | Director | September 28, 2017 | |||
| Tal Kerret | |||||
| *By: | /s/ Benjamin S. Miller | ||||
| Attorney-in-Fact | |||||
15