2017 |
| |
January |
| |
• | We announced the filing of an amended technical report for the Pitt Gold Project entitled “NI 43-101 Technical Report and Review of the Preliminary Resource Estimate for the Pitt Gold Project, Duparquet Township, Abitibi Region, Québec, Canada”, and dated January 5, 2017. |
| |
• | We announced the release of an initial mineral resource estimate for our Goldlund Gold Project located near the town of Sioux Lookout in northwestern Ontario. |
| |
• | We announced the commencement of a 27,000 m drilling campaign at our Goldlund Gold Project, focused on in-fill and resource expansion of Zone Seven, and the signing of definitive asset purchase agreements to purchase certain mineral claims located in Ontario and Québec. |
| |
February |
| |
• | We announced the completion of our Fall 2016 drilling |
| 2017 |
| | |
| February(continued) |
| | |
| | program at our Pickle Crow Project, which consisted of nine holes comprising approximately 1,300 m of drilling, and the completion of a metallurgical diamond drill program at our Springpole Gold Project located in northwestern Ontario. |
| | |
| • | We announced the filing of a technical report outlining the initial resource estimate for our Goldlund Gold Project entitled Technical Report and Resource Estimation Update on the Goldlund Project”, and dated January 23, 2017. |
| | |
| • | We announced the completion of the acquisition of certain mineral claims located in Ontario and Québec, and the grant of 10,630,000 stock options to directors, officers, employees and consultants of First Mining, with an exercise price of $0.85 and exercisable for five years. Certain of these options are subject to vesting provisions in accordance with the rules and policies of the TSX-V. |
2016 Annual Information Form – Page 20
Recent developments(continued)
March
| • | We announced the release of an updated mineral resource estimate for our Cameron Gold Project located near the town of Sioux Narrows in northwestern Ontario. |
Significant acquisitions
We have not completed any significant acquisitions during our most recently completed financial year.
How First Mining was formed
We were incorporated on April 4, 2005 in the Province of Alberta, Canada pursuant to theBusiness Corporations Act(Alberta) under the name “Parkdale Petroleum Ltd.” and changed our name on May 3, 2005 to “Albion Petroleum Ltd.” (“Albion”). Albion was initially listed as a “capital pool company” (“CPC”) on the TSX-V on September 30, 2005 under the policies of the TSX-V. As a CPC, Albion’s only business had been to identify and evaluate businesses or assets with a view to completing a “Qualifying Transaction” (as that term is defined in TSX-V Policy 2.4).
On July 1, 2014, Albion and Sundance entered into an arrangement agreement whereby Albion agreed to acquire all of the issued and outstanding shares of Sundance in exchange for shares of the resulting entity. On March 11, 2015, Sundance was renamed as KCP Minerals Inc. (“KCP”), and on March 30, 2015, Albion consolidated all of its issued and outstanding shares on a four-for-one basis. Subsequently, Albion acquired all of the issued and outstanding shares of KCP on a one-for-one basis, constituting its Qualifying Transaction.
Immediately following the completion of the transaction, Albion was renamed as “First Mining Finance Corp.” On March 30, 2015, First Mining was continued under the laws of the Province of British Columbia, Canada pursuant to the BCBCA, and as a result, First Mining is now governed by the laws of the Province of British Columbia.
We are a reporting issuer in the province of British Columbia (our principal reporting jurisdiction) and in each of the other provinces of Canada.
| We currently have the following material wholly-owned subsidiaries: | For more information
You can find more information about First Mining on SEDAR
(www.sedar.com), and on our website
(www.firstminingfinance.com).
See our most recent management proxy circular dated May 9, 2016 for additional information, including how our directors and officers are compensated, principal holders of our securities, and securities authorized for issuance under our equity compensation plans.
See our audited consolidated annual financial statements and management’s discussion and analysis for the financial year ended December 31, 2016 for additional financial information.
|
| |
| • | Gold Canyon Resources Inc., a company incorporated under the BCBCA. |
| | |
| • | Tamaka Gold Corporation, a company incorporated under theBusiness Corporations Act(Ontario) ("OBCA"). |
| | |
| • | PC Gold Inc., a company incorporated under the OBCA |
| | . |
| • | Cameron Gold Operations Ltd., a company incorporated under the OBCA. |
| | |
| • | Coastal Gold Corp., a company incorporated under the OBCA. |
| | |
Our other subsidiaries, which each have total assets and revenues less than 10%, and in the aggregate less than 20%, of our total consolidated assets or our total consolidated revenue, are excluded from the above list.
2016 Annual Information Form – Page 21
Corporate organization chart
The following diagram shows our current corporate structure and material subsidiaries, including the properties held by the various subsidiaries:

Note:
| | • | Our other subsidiaries, which each have total assets and revenues less than 10%, and in the aggregate less than 20%, of our total consolidated assets or our total consolidated revenue, are excluded from the above chart. |
Our projects
We have interests in mineral properties located in Canada, Mexico and the United States. As at December 31, 2016, these properties were carried on our balance sheet as assets with a total book value of approximately $228 million. The book value consists of acquisition costs plus cumulative expenditures on properties for which the Company has future exploration plans. The current book value is not necessarily the same as the total expenditures on each property by the Company, as part of the expenditures on some properties have been written down. The book value is also not necessarily the fair market value of the properties.
Our material and non-material projects are set out below.
Material projects
| | • | Springpole Property (Ontario)................................................. | p. 23 |
| | • | Goldlund Property (Ontario).................................................... | p. 33 |
| | • | Cameron Property (Ontario).................................................... | p. 42 |
| | • | Pickle Crow Property (Ontario)............................................... | p. 52 |
| | • | Hope Brook Property (Newfoundland & Labrador)................ | p. 63 |
Non-material projects
| | • | Canada...............................… | p. 70 |
| | • | Mexico..............................…. | p. 70 |
| | • | United States…..................... | p. 74 |
2016 Annual Information Form – Page 22
Springpole
Technical report
The Springpole Property project (the “Springpole Project”) description is based on the project’s technical report:Preliminary Economic Assessment for the Springpole Project, Ontario, Canada(effective date March 24, 2013, as amended October 7, 2016) (the “Springpole Technical Report”). The report was prepared for us in accordance with NI 43-101, by or under the supervision of Dr. Gilles Arseneau, Ph.D., P.Geo.; Dr. Adrian Dance, Ph.D., P.Eng.; John Duncan, P.Eng.; Christopher Elliot, FAusIMM; Mark Liskowich, P.Geo.; Bruce Murphy, FSAIMM; Michael Royle, P.Geo.; Dr. Maritz Rykaart, Ph.D., P.Eng.; and Dino Pilotto, P.Eng.; all qualified persons within the meaning of NI 43-101. The following description has been prepared under the supervision of Chris Osterman, P.Geo. who is a qualified person within the meaning of NI 43-101, but is not independent of us.
The conclusions, projections and estimates included in this description are subject to the qualifications, assumptions and exclusions set out in the Springpole Technical Report, except as such qualifications, assumptions and exclusions may be modified in this AIF. We recommend you read the Springpole Technical Report in its entirety to fully understand the project. You can download a copy from our SEDAR profile (www.sedar.com), or from our website (www.firstminingfinance.com).
Project description, location and access
The Springpole Project lies approximately 110 km northeast of the Municipality of Red Lake in northwest Ontario, Canada. The latitude and longitude coordinates for the project are:
| | • | Latitude N51° 23′ 44.3″ |
| | | |
| | • | Longitude W92° 17′ 37.4″ |
The Universal Transverse Mercator map projection based on the World Geodetic System 1984 (WGS84) zone 15N is:
| | • | Easting 549,183 |
| | | |
| | • | Northing 5,693,578 |
| | | |
| | • | Average Elevation 395 m |
During late spring, summer, and early fall, the Springpole Project is accessible by floatplane direct to Springpole Lake or Birch Lake. All fuel, food, and material supplies are flown in from Red Lake or Pickle Lake, Ontario, or from Winnipeg, Manitoba, with flight distances of 110 km, 167 km, and 370 km, respectively. The closest road access at present is the landing at the old South Bay Mine on Confederation Lake, approximately 50 km away by air. During winter, an ice road approximately 85 km long is constructed from the South Bay landing point on Confederation Lake to a point about 1 km from Springpole Lake camp. During breakup in spring and freeze-up in fall, access to the Springpole Property is by helicopter.
Gold Canyon acquired ownership of five patented claims in 1993 and six unpatented mining claims and related Crown leases for surface rights in 2011. The five patented claims are fee simple parcels with mining and surface rights attached to all five claims registered with the Land Registry Office, Kenora, Ontario. A total of 300 contiguous unpatented mining claims make up the greater area of the Springpole Project and have been staked directly by Gold Canyon.
Through Gold Canyon, we lease 10 patented claims which are fee simple parcels with mining and surface rights attached to registered, together with the notices of lease, with the Land Registry Office in Kenora, Ontario. The lease is for a term of 21 years less one day and terminates on April 14, 2031. Under the lease, we are obligated to pay all applicable property taxes related to the 10 patented claims during the lease term together with advance royalty payments on a sliding scale of $50,000 per year (2011-2016), $60,000 (2016-2021), and $80,000 (2021-2031). These payments are to be credited to future NSR payables, if any. We have an option to acquire these 10 patented claims and would be required to do so upon the commencement of commercial production on these or certain adjoining patented claims. This option term is renewable for a further period of five years by providing notice and a $25,000 payment. The consideration payable is, at our option on exercise or at the option of the leaseholder upon commencement of commercial production, either (a) $5 million with the leaseholder retaining a 1% NSR or (b) $4 million with the leaseholder retaining a 2% NSR. We have a right of first refusal on any sale of the remaining royalty interest on certain terms and conditions.
2016 Annual Information Form – Page 23
Through Gold Canyon, we also have an option and lease to a further 15 patented claims which are fee simple parcels with mining and surface rights attached and registered, together with the notice of option and lease, with the Land Registry Office, Kenora, Ontario. The option can be exercised by us before expiry of the earlier option period by confirmation of good standing of the agreement and payment of a $50,000 renewal fee. We are required to make option payments in the aggregate amount of $35,000 per year and to expend an aggregate of $300,000 on mining operations in each option term as a condition of any renewal and to pay all property taxes related to these patented claims. We have an option to acquire the 15 claims and would be required to do so upon the commencement of commercial production at any time during the option period by payment of an aggregate of $2 million. Upon exercise of the purchase option, we must also acquire the cabin on the property for the lesser of fair market value or $20,000.
Underlying royalties which affect the Springpole Property are:
| • | 3% NSR on five patented claims payable to Jubilee Gold Exploration Ltd. (“Jubilee Gold”) upon commencement of commercial production with advance royalty payments of $70,000 per year, adjusted using the yearly Consumer Price Index. We have an option to acquire 1% of the NSR for $1,000,000 at any time, and a right of first refusal on any sale of the NSR. We can terminate the royalty obligations at any time by transferring the five patented claims back to Jubilee Gold; |
| | | |
| • | 3% NSR on 10 leased patented claims payable to a leaseholder upon commencement of commercial production with advance royalty payments on a sliding scale of $50,000 per year (2011-2016), $60,000 per year (2016-2021), and $80,000 per year (2021-2031). We have a right to acquire up to 2% of the NSR for $1,000,000 per 1% at any time; |
| | | |
| • | 3% NSR on 15 patented claims (held by us pursuant to an option and lease) is payable to an optionor and leaseholder during the option term upon commencement of commercial production or a 1% NSR if the purchase option is exercised prior to commercial production. We have a right to acquire the remaining 1% NSR by a payment of $500,000; and |
| | | |
| • | 3% NSR on six unpatented mining claims payable to an individual vendor upon commencement of commercial production with advance royalty payments of $50,000 per year. We have an option to acquire all or a portion of the NSR at a rate of $500,000 per 1% of the NSR. |
We are required to purchase a vacation home owned by a vendor that is located on the Springpole Property upon commencement of commercial production.
Subsequent to their acquisition, the Crown leases were to expire. Gold Canyon subsequently received the lease renewal from the Crown Lands Office.
To keep an unpatented mining claim current, the mining claim holder must perform $400 per mining claim unit worth of approved assessment work per year, immediately following the initial staking date. The claim holder has two years to file one year worth of assessment work.
Surface rights are separate from mining rights. Should any method of mining be appropriate, other than those claims for which Crown leases were issued, the surface rights would need to be secured.
2016 Annual Information Form – Page 24
History
Gold exploration on the property was carried out during two main periods, one during the 1920s to 1940s, and a second period from 1985 to the present.
Between 1933 and 1936, extensive trenching and prospecting was conducted on the Springpole Property, including 10 short holes totalling 458.5 m. Limited trenching and prospecting was competed in 1945.
The area remained dormant until 1985. On the 30 patented claims line cutting was done at both 30.5 m centres and 61 m centres. Subsequently, geological mapping, humus geochemistry, and ground geophysics were conducted over the grids.
From 1986 through 1989, 118 diamond drill holes were completed in seven drill phases totalling 38,349 m. In addition, during 1986 and 1987, approximately 116,119 m2of mechanical stripping was carried out and four petrographic reports were produced.
From 1989 through 1992, an induced polarization survey over the central portion of the Portage zone under Springpole Lake was conducted and the Springpole Property was tested with eighteen core holes totalling 6,195 m. The majority of the drilling was conducted on the Portage zone. At the same time, a seven core hole drill program was completed around the east margins of Springpole Lake and lake-bottom sediment sampling of Springpole Lake east of Johnson Island was completed.
During 1995, an exploration program consisting of remapping of the main area, of some of the existing drill core, and a reinterpretation of the geology was carried. During the 1995 and 1996 programs, an additional 69 hole were drilled totalling 15,085 m on the Springpole Project proper and two drill holes on Johnson Island. By late 1996, Gold Canyon acquired 100% of the Springpole Property. Gold Canyon continued exploration in 1997 and 1998 with another 51 core holes totalling 5,642 m.
In the summer of 1998 a lake bottom sediment sampling program was conducted in several areas of the Springpole Property.
During 2004, 2005, and 2006, diamond drilling programs were conducted on the property by Gold Canyon.
In the fall of 2007, Gold Canyon embarked on a limited exploration program to further investigate the Fluorite zone that was previously identified.
From early August through to the end of October 2009, Gold Canyon re-logged and re-sampled a portion of the historic drill core stored at Gold Canyon’s project site and temporary tent camp.
During the spring and summer of 2010, a total of 8,664.2 m of HQ core drilling was completed in 23 drill holes.
In the winter of 2010, a total of six diamond drill holes were drilled for a total of 1,774.5 m of HQ drilling.
In 2011, Gold Canyon carried out a drill program which totaled 28,750 m in 80 diamond core holes.
A 2012 drill program began in-filling the Portage zone based upon results of the 2011 drill program. The 2012 drill program totaled 38,069 m in 87 diamond core holes.
In 2013, Gold Canyon commissioned SRK Consulting (Canada) Inc. to complete a preliminary economic assessment on the Springpole Property.
Geological setting, mineralization and deposit types
The Springpole Gold Property is within the Archean-aged Birch-Uchi Greenstone Belt. Studies of the southern part of the Birch-Uchi greenstone belt have revealed a long, multistage history of crustal development. Based on mapping, lithogeochemistry, and radiometric dating, the supracrustal rocks of the greenstone belt were subdivided into three stratigraphic group-scale units (listed in decreasing age): the Balmer, Woman and Confederation assemblages. This three-part subdivision was applied to most of the Uchi Subprovince. The Confederation assemblage is thought to be a continental margin (Andean-type) arc succession, versus the less certain tectono-stratigraphic context of the other assemblages. Some relatively small conglomeratic units likely form a synorogenic, discontinuously distributed, post-Confederation assemblage in the Birch-Uchi greenstone belt.
2016 Annual Information Form – Page 25
The northern margin of the Birch-Uchi greenstone belt forms a pattern of sub-regional scale cusps of supracrustal strata alternating with batholiths. Basaltic units are prominent around the periphery of the greenstone belt and may be part of the Woman assemblage but the accuracy of this stratigraphic assignment is unknown. It is suggested that Confederation assemblage age rocks make up the bulk of the greenstone belt.
The Springpole Property is underlain by a polyphase alkali, trachyte intrusive displaying autolithic breccia. The intrusive is comprised of a system of multiple phases of trachyte that is believed to be part of the roof zone of a larger syenite intrusive; fragments displaying phaneritic textures were observed from deeper drill cores in the southeast portion of the Portage zone. Early intrusive phases consist of megacrystic feldspar phenocrysts of albite and orthoclase feldspar in an aphanitic groundmass. Successive phases show progressively finer grained porphyritic texture while the final intrusive phases are aphanitic. Within the country rocks to the north and east are trachyte and lamprophyre dikes and sills that source from the trachyte- or syenite-porphyry intrusive system.
The main intrusive complex appears to contain many of the characteristics of alkaline, porphyry style mineralization associated with diatreme breccias (e.g. Cripple Creek, Colorado). This style of mineralization is characterized by the Portage zone and portions of the East Extension zone where mineralization is hosted by diatreme breccia in aphanitic trachyte. It is suspected that the ductile shearing and brittle faulting have played a significant role in redistributing structurally controlled blocks of the mineralized rock. Diamond drilling in the winter of 2010 revealed a more complex alteration with broader, intense zones of potassic alteration replacing the original rock mass with biotite and pyrite. In the core area of the deposit where fine grained disseminated gold mineralization occurs with biotite, the primary potassic alteration mineral, gold displays a good correlation with potassium/rubidium.
Exploration
No exploration activity is currently underway at the Springpole Project, however, we did drill four representative holes in 2016 to provide material for additional metallurgical testing.
Drilling
During the winters of 2007 and 2008 Gold Canyon conducted drill programs that completed 21 holes totalling 3,159 m, 11 holes totalling 2,122 m, and 7 holes totalling 2,452 m of diamond core drilling, respectively.
During the winter of 2010, a total of six diamond drill holes were drilled for a total of 1,774.5 m of HQ drilling. Two drill holes were not completed and both holes ended in altered and mineralized rock. The drill program revealed a more complex alteration with broader, intense zones of potassic alteration replacing the original rock mass with biotite and pyrite. During the spring and summer of 2010, a total of 8,664.2 m of HQ core drilling was completed in 23 drill holes, averaging 44.23 m of drilling per 24-hour shift, including time for moving the drill between drill sites.
The 2011 drill program totaled 28,750 m in 80 diamond core holes. Five of the diamond core holes were drilled for the purpose of metallurgical testing. All these holes were twins of previously drilled holes.
The 2012 drill program began in-filling the Portage zone based upon results of the 2011 drill program. The goal was to in-fill areas where inferred mineral resource had been defined in the February 2012 mineral resource update and to expand the mineral resource area to the southeast. The 2012 drill program totaled 38,069 m in 87 diamond core holes.
2016 Annual Information Form – Page 26
Sampling, analysis and data verification
Detailed descriptions of the drill core were carried out under the supervision of a senior geologist, a member in good standing of the Association of Professional Geologists of Ontario and American Institute of Professional Geologists. The core logging was carried out on-site in a dedicated core logging facility. Drill log data were recorded onto paper logs that were later scanned and digitized.
Core was laid out 30 to 40 boxes at a time. First, the core was photographed in 15 m batches prior to logging or sampling. This is followed by a geotechnical log that records quantitative and qualitative engineering data including detailed recovery data and rock quality designation. Any discrepancies between marker blocks and measured core length were addressed and resolved at this stage. The core was then marked up for sampling.
For the 2010 and 2011 drill programs, all the drill core intervals were sampled using sample intervals of 1 m. During the 2012 drilling program, Gold Canyon changed its standard sample length from 1 to 2 m lengths. However, in zones of poor recovery, 1.5 m or 3 m samples were sometimes collected. Samples over the standard sample length were typically half core samples and whole core was generally only taken in intervals of poor core recovery across the sampled interval. Sampling marks were made on the core and sample tickets were stapled into the core boxes at the beginning of each sample interval. Quality control samples were inserted into the sample stream.
Inserting quality control samples involved the addition of certified blanks, certified gold standards, and field and laboratory duplicates. Field duplicates were collected by quartering the core in the sampling facility on-site. Laboratory duplicates were collected by splitting the first coarse reject and crushing and then generating a second analytical pulp. Blank, standards and duplicates made up 10% of the total sample stream. Sample tickets were marked blank, field or laboratory duplicate, or standard, and a sample tag was stapled into the core box within the sample stream.
Geological descriptions were recorded for all core recovered. Separate columns in the log allow description of the lithology, alteration style, intensity of alteration, relative degree of alteration, sulphide percentage, rock colour, vein type, and veining density. A separate column was reserved for written notes on lithology, mineralization, structure, vein orientations/relations etc. The header page listed the hole number, collar coordinates, final depth, start/end dates, and the name of the core logging geologist.
Following the logging and core marking procedures described above, the core was passed to the sampling facility. Core sampling was performed by experienced sampling technicians from Ackewance Exploration & Services (“Ackewance”) of Red Lake, Ontario, and quality control was maintained through regular verification by on-site geologists. Core was broken, as necessary, into manageable lengths. Pieces were removed from the box without disturbing the sample tags, were cut in half lengthwise with a diamond saw, and then both halves were carefully repositioned in the box. When a complete hole was processed in this manner, one half was collected for assay while the other half remained in the core box as a witness. The remaining core in the boxes was then photographed at 51 cm (20 inch) intervals. All logs and photographs were then submitted to the senior geologist/project manager for review and were archived. Data were backed up.
The sampling technician packed one half of the split core sample intervals into transparent vinyl sample bags that were sequentially numbered to match the sample number sequences in the sample tag booklets used by the core-logging geologists. The numbered, blank portion of the triplicate sample tag was placed in the bag with the sample; the portion was marked with the sample interval remained stapled into the bottom of the core box at the point where the sample interval begins. Sample bags were then sealed with plastic tags. Sealed sample bags were packed into rice sacks five samples at a time. All sacks were individually labeled with the name of the company, number of samples contained therein, and the number sequence of the samples therein. Sacks were assigned sequential numbers on a per shipment basis. A project geologist then checked the sample shipment and creates a shipping manifest for the sample batch. A copy was given to the project manager and a copy was sent along with the sample shipment. A copy of the sample shipment form was also sent via e-mail to the analytical laboratory.
2016 Annual Information Form – Page 27
The project geologist prepared the sample submission form for the assay laboratory. This form identifies the number of sample sacks as well as the sequence of sample numbers to be submitted. Due to the remote location, the shipment was then loaded on to a plane or helicopter and flown direct to Red Lake where representatives of the commercial analytical laboratory met the incoming flight and took the samples to the laboratory by pickup truck.
Once at the laboratory, a manager checked the rice sacks and sample numbers on the submission form. The laboratory then split the received sample manifest into batches for analysis, assigned a work order to the batch, and sent a copy of the mineral analysis acknowledgement form to the project manager.
Aluminum tags embossed with the hole number, box number, and box interval (from/to) were prepared and stapled onto the ends of each core box. Core boxes were cross-stacked on pallets and then moved to on-site storage.
Core samples collected at the drill site were held in closed core boxes sealed with fiber tape; at various times of day, camp staff collected the core boxes that were then delivered to the core logging facility. All core logging, sampling and storage took place at the Springpole Project site. Following the logging and marking of core, all core preparation and sampling was performed by technicians from Ackewance of Red Lake, Ontario, under the supervision of the project manager. All on-site sampling activities were directly supervised by the project manager.
All primary assay work since the 2010 drill program has been performed by SGS Laboratories in Red Lake (gold), Ontario and Don Mills (silver and multi-element) in Toronto, Ontario. The SGS Red Lake and Don Mills facilities are certified and conform to requirements CAN-P-1579 and CAN-P-4E (ISO/IEC 17025:2005). Certification is accredited for precious metals including gold and silver and 52 element geochemical analyses.
All samples received by SGS Red Lake were processed through a sample tracking system that is an integral part of our laboratory information management system. This system utilizes bar coding and scanning technology that provides complete chain of custody records for every stage in the sample preparation and analytical process.
Samples were dried, and then crushed to 70% of the sample passing 2 mm (-70 mesh). A 250 g sample was split off the crushed material, and pulverized to 85% passing 75 micron (-200 mesh). A 30 g split of the pulp was used for gold fire assay and a 2 g split was used for silver analysis. Crushing and pulverizing equipment was cleaned with barren wash material between sample preparation batches and, where necessary, between highly mineralized samples. Sample preparation stations were also equipped with dust extraction systems to reduce the risk of sample contamination. Once the gold assay was complete, a pulp was sent to the SGS Toronto facility for silver and possibly for multi-element geochemical analysis.
As part of the standard internal quality control procedures used by the laboratory, each batch of 75 Springpole Project core samples included four blanks, four internal standards, and eight duplicate samples. In the event that any reference material or duplicate result would fall outside the established control limits, the sample batches would be re-assayed.
Pulps and rejects of the samples were stored by SGS at its Red Lake facility at the request of Gold Canyon.
Prepared samples were analyzed for gold by fire assay with atomic absorption finish. Samples returning assays in excess of 10g/t gold are re-analyzed with a gravimetric finish.
Prepared pulp samples shipped from SGS Red Lake to SGS Toronto were analyzed for silver by three-acid digestion with atomic absorption finish.
During the winter 2010 program, prepared samples were analyzed for 52 elements by acid digestion (3:1 HCl: HNO3).
2016 Annual Information Form – Page 28
Of the 18 drill holes completed in 2007 and 2008, comprising a total of 1,374 assay intervals analyzed for gold, SRK Consulting (Canada) Inc. (“SRK”), who prepared the Springpole Technical Report, checked a total of 137 samples representing 10% of the total against the original certificates. No errors were found.
A total of 3,135 assay values for gold and 3,161 assay values for silver in the database were compared against the original protected PDF assay certificates submitted by SGS Red Lake. These totals represent 10.1% and 10.4% of the total number of assays for gold and silver, respectively.
Of the original assay values checked against certificates, the focus was on values material to any resource estimate, either higher-grade intervals or very low grade intervals in proximity to higher-grade intervals. The average grade of gold samples verified was 2.05 g/t Au. The average grade of silver samples checked was 8.27 g/t Ag.
Only two errors were found for gold:
| • | The gold value of sample interval SP10-028 from 433 m to 436 m (sample number 8287) found to have an entered value of 5.96 g/t gold against a value on the assay certificate of 9.00 g/t gold. |
| | | |
| • | The gold value of sample interval SP11-076 from 69 to 70 m (sample number 14583) having the value of 0.45 oz./t incorrectly placed in the parts per billion column. |
No errors were found with respect to silver assays.
This represents an error rate of 0.064% in gold assays and an error rate of 0.0% in silver assays. This error rate is well within acceptable industry standards.
As part of the mineral resource estimation process, the author of the Springpole Technical Report reviewed the QA/QC data collected by Gold Canyon, reviewed the procedures in place to assure assay data quality, and verified the assay database against original assay certificates provided directly to the author by SGS Red Lake, the assay laboratory. A total of 53,431 gold assays, 46% of the assay data, were checked against original assay certificates. No significant database errors were identified. About 143 minor rounding errors were observed. None of the rounding errors are deemed material or of any significance to the mineral resource estimate presented in this report.
Mineral processing and metallurgical testing
Three metallurgical testwork programs have been completed on Springpole Property material since 1989, with the majority of work undertaken in the past three years:
| • | Lakefield Research, Lakefield, Ontario (1989)—a preliminary program of whole feed leaching on two samples. |
| | | |
| • | SGS Mineral Services, Vancouver, British Columbia (2011)—a follow up program of leaching on eight samples. |
| | | |
| • | SGS Lakefield, Lakefield, Ontario (2012/2013)—comminution, whole feed leaching, flotation/leaching on six samples. |
Based on the test work results reported to date and the range of process flowsheet options considered in the 2012/2013 work, a likely flowsheet configuration is a moderately fine grind size followed by whole feed leaching. Removal of gravity gold prior to leaching appears to only benefit high grade (>5 g/t gold) feed and should be considered an option for the flowsheet.
The Springpole Technical Report is based on a design plant capacity of 20,000 t/d. Cyanide leach extractions of 80% for gold and 85% for silver are expected at this grind size. Product from the process plant will be doré bullion.
2016 Annual Information Form – Page 29
While considerable metallurgical test work has been completed, additional testing is warranted to better define the plant design criteria and more confidently predict expected performance.
Future test work can consider concentrating the sulphides via flotation or classification into a smaller mass so that it can be stored separately from the remainder of the tailings. For example, dry stack or subaqueous deposition in the tailings pond to minimise the potential for acid generation.
Mineral resource estimates
The mineral resource model for the Springpole Project considers 512 core boreholes drilled by Gold Canyon and previous owners of the property during the period of 2003 to 2012.
The revised mineral resource estimate (October 17, 2012) was based on a gold price of $1,400/oz. and a silver price of $15/oz., both considered reasonable economic assumptions by the author of the Springpole Technical Report. To establish a reasonable prospect of economic extraction in an open pit context, the resources were defined within an optimized pit shell with pit walls set at 45°. Assumed recoveries of 80% for gold and 60% for silver were used (Note: A silver recovery assumption of 85% was used for mine design and evaluation based on more recent data). Mining costs were estimated at $2/t of total material, processing costs estimated at $12/t and general and administrative (“G&A”) costs estimated at $2/t. A cut-off grade (“COG”) of 0.4 g/t gold was calculated, and is considered to be an economically reasonable value corresponding with breakeven mining costs. Approximately 90% of the revenue for the proposed project is derived from gold and 10% from silver.
Note: For the mine development (Whittle™ optimization) and economic analysis in the Springpole Technical Report, updated input parameters were used.
Mineral resources were estimated by ordinary kriging using Gemcom block modelling software in 10 m x 10 m x 6 m blocks. Grade estimates were based on capped, 3 m composited assay data.
Capping levels were set at 25 g/t for gold and 200 g/t for silver. Blocks were classified as indicated mineral resources if at least two drill holes and six composites were found within a 60 m x 60 m x 40 m search ellipse. All other interpolated blocks were classified as inferred mineral resource. Mineral resources were then validated using Gemcom GEMS (6.4) software.
This resource model includes mineralized material in the Main, East Extension and Portage zones spanning from geologic sections 0-1, 500 m in the northwest to 0-250 m in the southeast. Along the axis of the Portage zone, resource modelling includes mineralized material generally ranging from the surface to a depth of 340-440 m below surface.
Mineral resources that are not mineral reserves do not have demonstrated economic viability. There is no certainty that all or any part of the mineral resources would be converted into mineral reserves. The estimate of mineral resources may be materially affected by environmental, permitting, legal, title, taxation, sociopolitical, marketing, or other relevant issues. The quantity and grade of reported inferred resources in this estimation are uncertain in nature. There has been insufficient exploration to define these inferred resources as an indicated or measured mineral resource. It is uncertain if further exploration will result in upgrading them to an indicated or measured mineral resource category.
2016 Annual Information Form – Page 30
The updated resource estimate is summarized in the table below.
Category
|
Quantity
| Grade | Metal |
| Au | Ag | Au | Ag |
| (Mt) | (g/t) | (g/t) | (Moz.) | (Moz.) |
| Open Pit** |
| Indicated | 128.2 | 1.07 | 5.7 | 4.41 | 23.8 |
| Inferred | 25.7 | 0.83 | 3.2 | 0.69 | 2.7 |
Source: Springpole Project, Northwestern Ontario, SRK Consulting, October 17, 2012
* Mineral resources are reported in relation to a conceptual pit shell. Mineral resources are not mineral reserves and do not have demonstrated economic viability. All figures are rounded to reflect the relative accuracy of the estimate. All composites have been capped where appropriate.
**Open pit mineral resources are reported at a cut-off grade of 0.4 g/t gold. Cut-off grades are based on a gold price of $1,400/oz. and a gold processing recovery of 80% and a silver price of $15/oz. and a silver processing recovery of 60%.
Inferred resources were used in the life of mine plan with inferred resources representing 10% of the material planned for processing. Mineral resources that are not mineral reserves do not have demonstrated economic viability. The estimate of mineral resources may be materially affected by environmental, permitting, legal, title, taxation, sociopolitical, marketing, or other relevant issues. The quantity and grade of reported inferred resources in this estimation are uncertain in nature and there has been insufficient exploration to define these inferred resources as an indicated or measured mineral resource, and it is uncertain if further exploration will result in upgrading them to an indicated or measured mineral resource category.
Recent activities
In October 2016 we commenced a drilling program at the Springpole Project to acquire material for metallurgical testing. In February 2017, we announced the results of the drilling program. A total of four holes comprising approximately 1,200 m were drilled, with hole locations specifically chosen to recover sample material that is representative of the Springpole deposit.
The drill program was specifically designed to provide material for metallurgical testing. Material from the drill holes has been subjected to both assay testing and metallurgical testing – we received and announced the assay results, and are currently waiting on the metallurgical test work to be completed. The intent of the metallurgical testing program is to determine the optimal grind size and processing flow sheet so as to maximize metallurgical recoveries at the Springpole Project. Once we receive the results of the metallurgical test work, we expect to incorporate the results in a new PEA for Springpole which is expected to be released around mid-2017.
Highlights of Assay Results from Fall 2016 Drilling at Springpole:
| • | Hole PM-DH-01 intersected 1.22 g/t over 354.5 m including 1.65 g/t over 177.0 m. |
| |
| • | Hole PM-DH-02 intersected 1.51 g/t over 341.0 m including 2.81 g/t over 87.0 m. |
| |
| • | Hole PM-DH-03 intersected 1.25 g/t over 359.0 m including 2.75 g/t over 44.0 m. |
| |
| • | Hole PM-DH-04 intersected 2.15 g/t over 146.7 m including 2.54 g/t over 108.7 m. |
2016 Annual Information Form – Page 31
Drill Hole Intercepts
| Hole ID | | From (m) | To (m) | Interval (m) | Au g/t |
| PM-DH-01 | | 16.5 | 371.0 | 354.5 | 1.22 |
| PM-DH-01 | including | 18.0 | 60.0 | 42.0 | 1.61 |
| PM-DH-01 | and including | 96.0 | 273.0 | 177.0 | 1.65 |
| |
| PM-DH-02 | | 74.0 | 415.0 | 341.0 | 1.51 |
| PM-DH-02 | including | 143.0 | 182.0 | 39.0 | 2.93 |
| PM-DH-02 | and including | 170.0 | 182.0 | 12.0 | 7.43 |
| PM-DH-02 | and including | 189.0 | 276.0 | 87.0 | 2.81 |
| PM-DH-02 | and including | 283.0 | 302.0 | 19.0 | 2.22 |
| |
| PM-DH-03 | | 50.0 | 409.0 | 359.0 | 1.25 |
| PM-DH-03 | including | 312.0 | 356.0 | 44.0 | 2.75 |
| |
| PM-DH-04 | | 186.3 | 333 | 146.7 | 2.15 |
| PM-DH-04 | including | 186.3 | 295.0 | 108.7 | 2.54 |
| PM-DH-04 | and including | 196.9 | 208.0 | 11.2 | 6.41 |
All assays were performed by SGS Laboratories of Red Lake, Ontario, who are independent of First Mining and have no relationship with First Mining. Samples were analyzed by using 30 g fire assay with an atomic absorption finish (protocol GE FAA313). Samples greater than 10 g/t or with visible gold were analyzed by 30 g fire assay with a gravimetric finish (protocol GO FAG303). All assays reported are uncut. Reported widths are drilled core lengths, and do not indicate true widths.
QA/QC Procedures
Assaying for the Springpole 2016 drilling program was done by SGS at their laboratories in Red Lake, Ontario, and Burnaby, British Columbia. Prepared samples were analyzed for gold by lead fusion fire assay with an atomic absorption spectrometry (AAS) finish. Samples returning assays in excess of 10 g/t gold were re-analyzed by fire assay with a gravimetric finish. As per past practices, fire assay analysis was done on 30 g splits of the pulp for gold, and a further 50 g split was sent to the SGS Burnaby lab for multi-element analysis by two-acid aqua regia digestion with ICP-MS and AES finish.
The QA/QC program for the drilling program consisted of the submission of coarse duplicates from bulk rejects at a frequency of one for every 20 samples submitted (5% of total). Pulp duplicate submissions were done at the same frequency. Because the drilling was intended for metallurgical test work, no rig duplicates from quartered core were submitted to preserve the core against loss or damage. Commercially obtained certified blank reference materials and standards were inserted on a frequency of one each per 40 samples submitted: 2.5% standards; 2.5% blanks for a total of 5%. Standards consisted of 5 different gold grades ranging from 0.5 to 9.5 g/t, and were sourced from CDN Resource Laboratories in Langley, British Columbia, along with the blank CRM materials.
SGS also undertook their own internal coarse and pulp duplicates analysis to ensure proper sample preparation and equipment calibration. These were randomly inserted at a frequency of 12%, as per laboratory protocol.
2016 Annual Information Form – Page 32
Goldlund
Technical report
The Goldlund Property project (the “Goldlund Project”) description is based on the project’s technical report:Technical Report and Resource Estimation Update on the Goldlund Project, Patricia and Kenora Mining Division, Ontario(issue date February 7, 2017, effective date September 20, 2016) (the “Goldlund Technical Report”). The report was prepared for us in accordance with NI 43-101, by or under the supervision of Todd McCracken, P.Geo.; a qualified person within the meaning of NI 43-101. The following description has been prepared under the supervision of Chris Osterman, P.Geo. who is a qualified person within the meaning of NI 43-101, but is not independent of us.
The conclusions, projections and estimates included in this description are subject to the qualifications, assumptions and exclusions set out in the Goldlund Technical Report, except as such qualifications, assumptions and exclusions may be modified in this AIF. We recommend you read the Goldlund Technical Report in its entirety to fully understand the project. You can download a copy from our SEDAR profile (www.sedar.com), or from our website (www.firstminingfinance.com).
Project description, location and access
The Goldlund Project is located in northwestern Ontario, approximately 30 km northeast from Dryden and stretches over several townships of the Patricia Mining and Kenora Mining Divisions of northwestern Ontario. The Goldlund Project is centered at 49.900203 north latitude and 92.341103 west longitude (545800E, 5527400N NAD 83 Zone 15) NTS 52F/16.
Access to the Goldlund Project is by Ontario Provincial Highway 72, approximately 60 km from Dryden, or approximately 45 km southwest of Sioux Lookout. A private all-weather gravel road leads from this point to the Goldlund Property. The road into the Goldlund Property would require upgrading to sustain any form of mining operations, but is accessible by two-wheel drive vehicle for exploration. Regularly scheduled passenger air service and charter flights are available to the towns of Dryden and Sioux Lookout.
We have full surface rights on the 27 patents and 1 mining lease (the “Mining Lease”). Surface rights to the remaining claim on the Goldlund Project currently remain with the Crown. TheOntario Mining Act(2010) grants surface access to a mineral claim without owning the surface rights, with proper consultation with stakeholders in the area. All claims and patents are registered to our wholly-owned subsidiary Goldlund.
Underlying royalties which affect the Goldlund Property are:
| | • | 1% NSR payable to an arm’s length vendor for 36 claims totalling 576 ha; |
| | | |
| • | 1% NSR payable to Goldlund Mines Limited on any ore mined above 50 m below the existing shaft collar for 6 patented claims and 3 patented claim covered by the Mining Lease. We have a right of first refusal in the event the holder wishes to dispose of its interest in the NSR; |
| | | |
| • | 2.5% NSR payable to Rio Algom Limited for 21 patented claims. We have the right to purchase the NSR in its entirety for $2,500,000 and a right of first of refusal in the event that Rio wishes to sell the NSR. |
| | | |
| • | 2% NSR payable to 1074127 Ontario Limited in accordance with industry practice on the sale of all minerals from the property for 13 mining claims. We have right to purchase 100% of the NSR at any time for $1,500,000 and a right of first refusal in the event that the holder wishes to sell the NSR. |
The Goldlund Project has two historic shafts that have been capped, an underground portal that has been blocked, a small open pit that is partially flooded, a waste rock stockpile, a mineralized material stockpile, a building housing the original mill on the Goldlund Property, and small tailing containment facility. All have been overgrown with vegetation.
2016 Annual Information Form – Page 33
All permits and licenses to conduct exploration work in the Goldlund Project are in place.
History
Exploration of the Goldlund Property dates back to the 1940s. From the late 1940s up until 1988, intermittent exploration was carried out by various companies mainly on five gold bearing zones. Past work included shaft sinking, driving a ramp, and underground development, including drifting and crosscuts on four levels.
There was a major period of exploration in the area from 1946 to 1952, in response to the discovery of gold mineralization in the southeastern part of Echo Township. The historic Newlund and Windward gold deposits were discovered during this period.
The Newlund prospect saw extensive underground exploration (4,570 m of drifts and crosscuts, 6,220 m of diamond drilling) through five levels, via a 255 m deep shaft. The first level (200 ft.) of the Newlund/Goldlund workings extends for over 3.2 km, connecting on the west with the 68 m shaft of the Windward prospect, crossing the entire Windward claim block.
Virtually no work was carried out on the Echo Township gold prospects from 1952 to 1973. In 1974, most of the surface facilities were rehabilitated and re-sampled portions of the first and second levels. In total, some 151,000 ft. (approximately 46,000 m) of surface drilling has been completed in 506 holes, and more than 60,000 ft. (approximately 18,300 m) of underground drilling has been completed in 466 holes.
From mid-1982 to early 1985, an underground mine and an open pit mine was operated on the Goldlund Property and processed material through the mill at the site. Production records have been compiled that show underground mine production of approximately 100,000 tons (approximately 90,700 t) at an estimated grade of 0.15 oz./ st (approximately 4.23 g/t) gold together with open pit production of approximately 43,000 st (approximately 39,000 t), at an estimated grade of 0.17 oz./ st (approximately 4.80 g/t) gold. Plant records show that some 132,000 st (approximately 119,750 t) were processed, with 18,000 oz. of recovered gold.
Geological setting, mineralization and deposit types
The Goldlund Project is situated within a northeasterly-projecting arm of the Wabigoon Sub-province extending from Wabigoon Lake to Sioux Lookout. The area is underlain by sedimentary and volcanic rocks, numerous intermediate to mafic sub-volcanic intrusive sheets, and intruded by several granitoid stocks. The stratigraphic assemblage has been subdivided into five principal rock groups:
| | • | Northern Volcanic Belt; |
| | | |
| | • | Northern Sedimentary Group; |
| | | |
| | • | Central Volcanic Belt; |
| | | |
| | • | Southern Sedimentary Group; and |
| | | |
| | • | Southern Volcanic Belt. |
The area has been affected by multiple deformational events resulting in a predominately northeasterly structural fabric. Gold exploration dates back to at least the 1940s with the majority of occurrences located in the Central and Southern Volcanic Belts.
The area is comprised of meta-volcanic and meta-sedimentary rocks intruded by several granitoid stocks and many smaller porphyritic and non-porphyritic bodies. The area has been subjected to at least four phases of deformation resulting in a predominantly northeasterly-striking structural grain. Regional and more important local alteration occurred in two pulses; one preceding the earliest deformation and one coinciding with the late deformation. Quartz veining, gold mineralization, and related alteration are related to the later alteration event.
2016 Annual Information Form – Page 34
A 3 km wide belt of Precambrian basaltic volcanic rocks strikes northeast across the Goldlund Project. This basaltic formation is bound by Precambrian sediments to the north and to the south, with a wedge of felsic volcanics that occurs between the basalt and sediments to the south of the basalt.
A suite of Leucotonolite to diorite sills (“granodiorite” in mine terminology) have intruded near the contact between the tuffs to the south and the spherulitic lavas to the north. These strata-parallel sills dip from vertical to -80° southward and range from 14 meter to 60 meter in thickness. A subsidiary suite of sills intrude narrow tuff beds in spherulitic basalt lavas. These strata-parallel intrusions are known to extend northeastward well beyond the Goldlund Project and south-westward beyond Cross Echo Lake where they re-appear just south of Troutfly Lake. It has been postulated that this series of intrusions may occur intermittently over a strike-length of 15 km.
The gold mineralization occurs concentrated in quartz filled cross fractures that strike 010° to 015° and dip northwest at -40° to -75°. Historically it is reported that these gold bearing fractures occur concentrated in zones that extend intermittently at intervals of 200 m to 300 m along the 1.6 km length of the underground workings that has been explored to a vertical depth of 150 m to 200 m on the former Windfall and Goldlund Property.
Gold mineralization occurs in essentially two types of deposits in the area of the Goldlund Project with the most important gold mineralization being associated with quartz vein and stock-work structures.
Gold mineralization at the Goldlund Project is hosted by zones of northeast-trending and gently to moderately northwest-dipping quartz stockworks (comprised of numerous quartz veinlets less than 1 cm to 20 cm thick). The stockwork zones form bands within the dikes that intrude the east-northeast-trending mafic volcanic country rocks. The quartz veins and veinlets contain occasional fine-grained to coarse-grained pyrite. The intervening areas between the quartz veinlets exhibit strong to moderate feldspathic alteration associated with common fine to medium-grained pyrite and magnetite.
The mineralized sills strike generally northeast (065°) and dip steeply to the southeast. The quartz stockwork veins generally strike 010° to 015° and dip northwest at -40° to -75°. This results in a shallow rake within the various zones.
The identified mineralization fits an Archean shear zone-hosted quartz vein model (“Archean Lode gold”).
The dominant, and economically most significant type, of the shear zone hosted occurrences are transverse vein arrays within competent rocks and particularly the intermediate to mafic sub-volcanic intrusive sheets. Vein systems occupy tensional fractures related to internal deformation of the competent units as folds tightened during stage three deformation. Vein arrays could be expected to develop near fold hinges, within fold limbs, and along axial planar foliations. The orientations of individual veins within the arrays are affected by their locations within folds.
Exploration
We have not conducted any surface exploration on the Goldlund Project.
Drilling
We have not conducted any diamond drilling on the Goldlund Project. All reported diamond drilling completed by Tamaka was done prior to our amalgamation with Tamaka by us. Tamaka conducted three drilling programmes: 2007 – 2008, 2011 and 2013 – 2014.
The drilling conducted by Tamaka was designed to extend and expand the potential resource of the Goldlund Project by targeting strike and down dip potential of the various mineralized zones as well as increase the confidence level in the continuity of resource of the Goldlund Project by targeting the known mineralized zones on the Goldlund Project with infill drilling.
2016 Annual Information Form – Page 35
The drilling was completed by C3 Drilling of Ithaca, New York and North Star Drilling Ltd. of Thunder Bay. The drilling program was managed independently by geologists employed by Fladgate Exploration Consulting Corporation (“Fladgate”) based in Thunder Bay and monitored by the Tamaka employees. A total of 24 drillholes were completed during the 2013 and 2014 drill program. All holes were drilled NQ (47.6 mm) and all drilling runs were in 10 ft. intervals (3 m).
Sampling, analysis and data verification
The following is a description of the sampling methodology for the Tamaka 2007 – 2008 drilling program:
| | • | Drillers deliver the four-row NQ or NQ2 core boxes to the core logging facility. |
| | | |
| | • | Core lids are removed and the boxes placed on the core logging table in order. |
| | | |
| | • | A technician measures run lengths to confirm block markers. |
| | | |
| | • | The technician records the rock quality designation (“RQD”) of the core on a computer form. |
| | | |
| | • | Magnetic susceptibility is recorded over the entire hole length at 0.5 m intervals. |
| | | |
| | • | Core is photographed (both wet and dry). |
| | | |
| • | Logging is completed by the geologist directly into a Microsoft Excel spreadsheet template form. Each drill log is a separate file: |
| | ο | logs record lithology, structures, alteration and sulphide content; |
| | | |
| | ο | all geology related marking on the core use a yellow lumber crayon. |
| | • | Sample intervals marked with a red lumber crayon on the core. |
| | | |
| | • | Sample lengths are variable, 20 cm minimum sample length, 1.5 m maximum sample length. |
| | | |
| | • | The samples do not cross lithological boundaries: |
| | ο | quartz veins are isolated if possible as well as zones in increased sulphides or alteration; |
| | | |
| | ο | shoulder sample of 1 m are collected on both sides of the mineralized sections; |
| | | |
| ο | due to the nature of the mineralization, and from the onset of drilling, the decision was made by Tamaka staff to collect samples continuously from collar to toe of hole. |
| | • | Three dedicated technicians were trained on sampling: |
| | ο | top-mounted core saw with a four-compartment settling tanks to recycle the water; |
| | | |
| ο | a sample interval sheet was generated by the geologist logging the core; the sheet contained the Borehole ID, From, To intervals, and sample number; |
| | | |
| ο | the technician verifies the sample number from the sample sheet with the sample number from pre-printed sample books provided by the laboratory; |
| | | |
| ο | the technician cuts the core and places one half in a plastic sample bag and returns the other half to the core box; |
| | | |
| ο | one sample tag is placed in the sample bag, one sample tag is stapled into the core box at the beginning of the sample interval; |
| | | |
| | ο | sample bags with sample and sample tag are sealed with fibre tape. |
2016 Annual Information Form – Page 36
| • | Quality assurance and quality control samples are inserted into the sample stream. Standards, blanks, field, and crush duplicates were inserted into the sample series using the same number sequence as the samples themselves. A QA/QC sample was inserted every 30 samples and were alternate between crush duplicates, field duplicates, standards, and blanks. Pulp duplicates performed by Accurassay were also incorporated in the program. |
| | | |
| | • | Samples are placed in rice bags and stored in the core logging facility until shipment. |
| | | |
| • | A Tamaka employee delivers the samples to Manitoulin Transport in Dryden for delivery to Accurassay Laboratories (“Accurassay”) in Thunder Bay. Accurassay is an accredited facility, conforming to requirements of CAN P-4E ISO/IEC 17025, and CAN-P-1579. |
| | | |
| | • | The laboratory returned all course rejects and pulps to Tamaka for storage at the Goldlund Project. |
The following is a description of the sampling methodology for the Tamaka 2011 drilling program:
| • | Drill core was delivered by C3 Drilling to the Tamaka core logging facility located on site at the end of every shift. |
| | | |
| | • | Core was put on the core logging tables for logging by the geologist or geological technician. |
| | | |
| • | A geologist technician checked the block measurements and measures recorded the RQD. Errors in block measurements were reported to the geologists. |
| | | |
| • | A technician recorded the magnetic susceptibility using a hand-held instrument for each 3 m length of core. |
| | | |
| • | Certain initial holes were logged into Microsoft Excel spreadsheets and the remainder were logged into a Gemcom© Gemslogger (“Gemslogger”) Microsoft Access database. |
| | | |
| | • | A geologist entered the header information from a planned drillhole spreadsheet. |
| | | |
| • | A geologist logged the core, recording lithology, alteration, structure, and mineralization in Gemslogger or the spreadsheet and marking the intervals with a grease pen. |
| | | |
| • | A geologist inserted sample tags for intervals to be sampled, recording these intervals in Gemslogger or the spreadsheet. |
| | | |
| | • | Sample lengths range between 0.2 and 2.6 m in length with an average sampling length of around 0.7 m. |
| | | |
| | • | No samples crossed lithological boundaries. |
| | | |
| | • | At least two shoulder samples are taken on either side of the mineralization. |
| | | |
| • | Sample tags marked with Standard Reference Material (“SRM”), blanks and duplicates were inserted at set intervals by the geologist. |
| | | |
| | • | Core was photographed after logging and sampling was completed; both wet and dry photos were taken. |
| | | |
| | • | Core was then relocated to the core splitting facility. |
| | | |
| • | A technician then double checked the intervals given in the sample booklet with printed logs from Gemslogger. |
| | | |
| | • | Core was split using a top-mounted diamond saw blade. |
| | | |
| | • | Half of the core was placed in a sample bag while the other half was replaced in the core box. |
| | | |
| • | Blanks and SRMs were inserted as specified in the sample booklet. Standards, blanks, field, and crush duplicates were inserted into the sample series using the same number sequence as the samples themselves. A QA/QC sample was inserted every 30 samples and were alternate between crush duplicates, field duplicates, standards, and blanks. Pulp duplicates performed by Accurassay were also incorporated in the program. |
2016 Annual Information Form – Page 37
| | • | For field duplicates, the remaining half of the core was quarter split and placed in a sample bag. |
| | | |
| | • | For coarse duplicates, a sample tag was placed in an empty sample bag. |
| | | |
| | • | The sample tag was stapled to the inside of the sample bag and the sample bag is stapled closed. |
| | | |
| | • | Sample tags were placed in rice bags and stored in crates awaiting shipment. |
| | | |
| | • | Crates were shipped every week to Accurassay Laboratories in Thunder Bay by Manitoulin Transport. |
| | |
| • | Downhole surveys were conducted using a Maxibor instrument while the drill rig was still setup on the drill pad. |
| | | |
| | • | Once the drill rig was moved, collar locations were verified using a hand-held GPS. |
| | |
| • | Once all the data is finalized in the field, the field databases/spreadsheets were transferred to the office in Thunder Bay where the master database is stored. |
The following is a description of the sampling methodology for the Tamaka 2013-2014 drilling program:
| | • | Drillers deliver the four-row NQ or NQ2 core boxes to the core logging facility. |
| | | |
| | • | Core lids are removed and the boxes placed on the core logging table in order. |
| | | |
| | • | A technician measures run lengths to confirm block markers. |
| | | |
| | • | The technician records the rock quality designation (“RQD”) of the core on a computer form. |
| | | |
| | • | Magnetic susceptibility is recorded over the entire hole length at 0.5 m intervals. |
| | | |
| | • | Core is photographed (both wet and dry). |
| | | |
| | • | Logging is completed by the geologist directly into a Microsoft Excel spreadsheet template form. |
| | | |
| | • | Each drill log is a separate file: |
| | ο | logs record lithology, structures, alteration and sulphide content; |
| | | |
| | ο | all geology related markings on the core use a yellow lumber crayon. |
| | • | Sample intervals marked with a red lumber crayon on the core. |
| | | |
| | • | Sample lengths are variable; 20 cm minimum sample length, 1.5 m maximum sample length. |
| | | |
| | • | The samples do not cross lithological boundaries: |
| | ο | quartz veins are isolated if possible as well as zones in increased sulphides or alteration; |
| | | |
| | ο | shoulder sample of 1 m are collected on both sides of the mineralized sections; |
| | | |
| ο | due to the nature of the mineralization, and from the onset of drilling, the decision was made by Tamaka staff to collect samples continuously from collar to toe of hole. |
| | • | Three dedicated technicians were trained on sampling: |
| | ο | top-mounted core saw with a four-compartment settling tanks to recycle the water; |
| | | |
| ο | a sample interval sheet was generated by the geologist logging the core; the sheet contained the Borehole ID, From, To intervals, and sample number; |
| | | |
| ο | the technician verifies the sample number from the sample sheet with the sample number from pre-printed sample books provided by the laboratory; |
2016 Annual Information Form – Page 38
| ο | the technician cuts the core and places one half in a plastic sample bag and returns the other half to the core box; |
| | | |
| ο | one sample tag is placed in the sample bag, one sample tag is stapled into the core box at the beginning of the sample interval; |
| | | |
| | ο | sample bags with sample and sample tag are sealed with fibre tape; |
| | | |
| ο | quality assurance and quality control samples are inserted into the sample stream. Standards, blanks, field, and crush duplicates were inserted into the sample series using the same number sequence as the samples themselves. A QA/QC sample was inserted every 30 samples and were alternate between crush duplicates, field duplicates, standards, and blanks. Pulp duplicates performed by Accurassay were also incorporated in the program. A second aliquot of pulp (from the pulps remaining after Accurassay analysis) from samples (predetermined by Fladgate) by Accurassay to be shipped to a separate lab for analysis. |
| | • | Samples are placed in rice bags and stored in the core logging facility until shipment. |
| | | |
| • | A Tamaka employee delivers the samples to Manitoulin Transport in Dryden for delivery to Accurassay in Thunder Bay. |
| | | |
| | • | The laboratory returned all course rejects and pulps to Tamaka for storage at the Goldlund Project. |
All samples for each of the Tamaka drill programs are processed using both jaw crushers and ring mill pulverizers. Samples received by the lab were processed using the following sample preparation packages:
| | • | Dry, crush (less than 5 kg) 90% -8 mesh (2 mm); |
| | | |
| | • | Split (1,000 g); and |
| | | |
| | • | Pulverize to 90% -150 mesh (106 μ). |
The 2007 – 2008 samples were analyzed for gold and silver using a four acid digestion followed by a 50 g fire assay (FA) with inductively coupled plasma (“ICP”) finish.
Certain of the 2011 samples were analyzed using a conventional 30 g Fire Assay with an Atomic Absorption finish (“FA/AA”) for gold and a 0.25 aqua regia digestion with an AA finish for silver. For the remaining 2011 samples, a 50 g conventional fire assay with an AA finish and a 0.25 aqua regia digestion with an AA finish for silver was performed from the 500 g pulp. A second 500 g pulp was analyzed using a gravimetric finish for samples in excess of 10 ppm gold. In total, during the 2011 drill program, 10,914 core samples were sent to the laboratory for analysis.
All 2012 and 2013-2014 samples were analyzed by a 50 g conventional fire assay with an AA finish and a 0.25 aqua regia digestion with an AA finish for silver was performed from the 500 g pulp. A second 500 g pulp was analyzed using a gravimetric finish for samples in excess of 10 ppm gold.
Tamaka’s QA/QC for each of its drilling programs was generally consistent. The QA/QC programs consisted of the insertion of blanks, Standard Reference Manual (“SRM”) samples, field duplicates, and crush duplicates into the sample stream at set intervals. SRMs were inserted every 20th sample while blanks were inserted every 27th to 30th sample. Field and crush duplicates were inserted into the sample stream only for the latter portion of the 2011 drilling campaign with a frequency of one field duplicate every 30th sample and one crush duplicate every 32ndsample. In addition to the field-inserted QA/QC program, the laboratories operate their own laboratory QA/QC system. The labs insert quality control materials, blanks and duplicates on each analytical run.
The Tamaka database has gone through several validations. The original data files received prior to the 2010 resource estimate were validated using 103 (10%) of the 1,065 drillholes in the total database. The validation was completed by the author of the Goldlund Technical Report, while he was employed by Tetra Tech. Data verification was completed on collar co-ordinates, end-of-hole depth, down-the-hole survey measurements,“From” and “To” intervals, measurements of assay sampling intervals, and gold grades that were compiled from hand written drill logs into Microsoft Excel spreadsheets. The error rate of the initial dataset exceeded the acceptable limit of 1% of errors. Most errors were insignificant and related to mistakes in transcription. Tamaka retrieved the dataset from Tetra Tech and corrected the entire dataset before returning the files to Tetra Tech. The second round of validation of the dataset returned no errors.
2016 Annual Information Form – Page 39
2011 and 2012 round of validation– All data is now recorded and received digitally, so it is possible to check 100% of the assay data for Tamaka surface holes against the digital assay certificates. There is 100% agreement between the assay certificates and the assay data in the database. The same is true of collar coordinates, survey data, and lithology intervals.
2013 and 2014 round of validation– All data is now recorded and received digitally, so it is possible to check 100% of the assay data for Tamaka surface holes against the digital assay certificates. There is 100% agreement between the assay certificates and the assay data in the database. The same is true of collar coordinates, survey data, and lithology intervals.
The drillhole data was imported into Surpac 6.6, which has a routine that checks for duplicate intervals, overlapping intervals, and intervals beyond the end of hole. The errors identified in the routine were checked against the original logs and corrected.
Mineral processing and metallurgical testing
Tamaka received completed results of three metallurgical studies on the Goldlund Property; a gold deportment study, a scoping study including comminution testing, and a review of the acid-base accounting completed as part of the scoping study.
Reported overall gold extraction for the high-grade samples by gravity separation, flotation of the gravity tailing, and cyanidation of the flotation concentrate ranged from 55% to 74%. Reported overall gold extraction for bulk testing and composites by gravity separation and cyanidation of the entire gravity tailing ranged from 85% to 96%.
The majority of samples were determined to be not Potential Acid Generating (“PAG”), however two samples did have neutralization potential ratios of less than 1 and sulphide-sulphur greater than 12%, indicating that they are PAG. Due to the limited number of samples, these results should be considered preliminary, and further sampling and testing is required to accurately determine whether the tailings would be PAG.
Mineral resource estimates
We compiled all the data used in completing the mineral resource from original source drillhole documents and from plan and section originals and copies. The Goldlund Project has been drilled by 1,816 drillholes. However, only drillholes within the areas of interest and with exploration potential were included in the database. In addition to the drillhole database, a dataset containing underground wall sampling intervals was included. Wall sampling was conducted as continuous samples on both walls and at times at chest and back heights. The wall sampling data was converted into drillhole format to supplement the dataset. All resource estimations were conducted using Surpac version 6.6.
A pit shell analysis using a base case of US$1,350 gold price and a cut-off grade of 0.4 g/t Au, provided a pit constrained Indicated gold resource estimate of 9.3 Mt with an average grade of 1.87 g/t and additional pit constrained Inferred resource of 40.9 Mt with an average grade of 1.33 g/t for the Goldlund Property. Table A summarizes the Whittle pit constrained resource.
2016 Annual Information Form – Page 40
The Goldlund deposit remains open along strike and to depth.
| Classification | Zone | Tonnage | Au g/t | Ounces |
Measured
| 1 | - | - | - |
| 2 | - | - | - |
| 3 | - | - | - |
| 4 | - | - | - |
| 5 | - | - | - |
| 7 | - | - | - |
| 8 | - | - | - |
| Subtotal | - | - | - |
Indicated
| 1 | 5,508,000 | 1.65 | 292,197 |
| 2 | 1,642,900 | 1.76 | 93,000 |
| 3 | - | - | - |
| 4 | 1,664,600 | 2.73 | 146,100 |
| 5 | - | - | - |
| 7 | - | - | - |
| 8 | 508,600 | 2 | 29,200 |
| Subtotal | 9,324,100 | 1.87 | 560,497 |
| M&I | Subtotal | 9,324,100 | 1.87 | 560,497 |
Inferred
|
| 1 | 17,802,000 | 1.36 | 778,422 |
| 2 | 1,028,000 | 1.22 | 40,000 |
| 3 | 1,385,000 | 1.61 | 71,666 |
| 4 | 734,000 | 2.40 | 57,000 |
| 5 | 1,284,000 | 1.19 | 49,000 |
| 7 | 17,947,000 | 1.28 | 737,004 |
| 8 | 715,000 | 0.90 | 21,000 |
| Subtotal | 40,895,000 | 1.33 | 1,754,092 |
2016 Annual Information Form – Page 41
Cameron
Technical report
The Cameron Property project (the “Cameron Project”) description is based on the project’s technical report:Technical Report on the Cameron Gold Deposit, Ontario, Canada(effective date January 17, 2017) (the “Cameron Gold Technical Report”). The report was prepared for us in accordance with NI 43-101, by or under the supervision of Mark Drabble, B. App. Sci. (Geology), MAIG, MAusIMM; and Kahan Cervoi, B. App. Sci (Geology), MAIG, MAusIMM; each qualified persons within the meaning of NI 43-101. The following description has been prepared under the supervision of Chris Osterman, P.Geo. who is a qualified person within the meaning of NI 43-101, but is not independent of us.
The conclusions, projections and estimates included in this description are subject to the qualifications, assumptions and exclusions set out in the Cameron Gold Technical Report, except as such qualifications, assumptions and exclusions may be modified in this AIF. We recommend you read the Cameron Gold Technical Report in its entirety to fully understand the project. You can download a copy from our SEDAR profile (www.sedar.com), or from our website (www.firstminingfinance.com).
Project description, location and access
The Cameron Gold Project is wholly-owned by us through our wholly-owned subsidiary, Cameron Gold. The Cameron Gold Project comprises 226 unpatented claims, 24 patented claims (mineral rights only), seven mining licences of occupation (“MLO”) and four mining leases. All of the claims are located within unsurveyed crown lands, mainly within the Rowan Lake area, though some claims are situated in the Tadpole Lake, Brooks Lake and Lawrence Lake areas.
The total area of the project is approximately 448.53 km2(44,853.2 ha).
The Cameron Gold Project currently consists of two project areas; namely Cameron (which includes the Cameron deposit) (the “Cameron Deposit”) and West Cedartree (which includes the Dubenski and Dogpaw deposits). The Cameron Gold Technical Report covers only the Cameron Deposit and Mineral Resource Estimate within the broader Cameron Project. The property comprising the Cameron Project consists of 128 unpatented claims, four patented claims, six MLOs and two mining leases. The West Cedartree property comprises nine unpatented claims, 20 patented claims, one MLO and two mining leases.
The Cameron Gold Project is located in the southern part of western Ontario, Canada approximately 80 km southeast of Kenora and 80 km northwest of Fort Frances. The nearest towns are Sioux Narrows and Nestor Falls, 30 km and 25 km away respectively. The Cameron Gold Project is on unsurveyed crown lands accessed by sealed and all weather gravel roads. From Kenora via Highway 17, Hwy 71 and the Cameron Lake road the distance is around 123 km. From Fort Frances via Hwy 11, Hwy 71 and the Cameron Lake road the distance is 168 km.
Underlying royalties which affect the Cameron Deposit are:
| • | 1.5% NSR payable to Rubicon Minerals Corp. for 47 unpatented claims. We have the option to repurchase 0.75% of the NSR for $750,000; |
| | | |
| • | 1% NSR payable to Orion Resource Partners for 20 unpatented claims, 4 patented claims, 6 MLOs and 2 mining leases; |
| | | |
| | • | 2% NSR payable to Mr. Sherridon Johnson and Mr. Edward Antony Barkaus for one unpatented claim; |
| | | |
| • | $0.30 per short ton of ore mined payable to the estate of W. Moorhouse and D. Petrunka for one mining lease; |
2016 Annual Information Form – Page 42
| • | 3% NSR payable to Lasir Gold Inc. We have the right to reduce the NSR to 1.5% by payment of $1,500,000; and |
| | | |
| • | 1% NSR payable to Chalice on 133 unpatented mining claims, all of which are not encumbered by pre- existing royalties. We have the right to repurchase 0.5% of the NSR for $1,000,000. |
Additional royalties pertain to the West Cedartree project, and are not applicable to the Cameron Deposit.
In order to maintain the title to an unpatented mining claim indefinitely, the recorded holder of the claim is required to undertake approved work expenditure in excess of $400 per claim within two years of the granting of the claim. Work programmes and expenditure commitments can be grouped across a contiguous series of unpatented mining claims. To maintain the unpatented claims comprising the Cameron Project in good standing, we are required to incur an aggregate expenditure of $750,800 per year and to file annual assessment reports of the work that has been undertaken. A total of $522,213 is available for distribution across the Cameron Gold Project. All MLOs are subject to an annual flat rental fee of $5.00 per hectare.
The duration of a mining lease is 21 years from the date of grant. The mining leases within the Cameron Project were initially granted in 1988 and were subsequently renewed for a further 21 years in July 2009, except one mining lease which was renewed in May 2006.
History
Exploration in the area commenced in the 1940s and numerous companies have carried out prospecting, line cutting, geological mapping, trenching, soil and outcrop sampling and ground magnetic and electromagnetic geophysical surveys.
On the Cameron Gold Project there have been numerous exploration and drilling programmes. On the Cameron Deposit itself, the first drilling was undertaken in July 1960. Prior to 2010, there were 836 holes comprising in excess of 90 km of diamond drill core drilled by six companies.
In 1987 at the Cameron Gold Deposit, underground development for an extensive sampling programme was undertaken. Some 65,000 m3of material was excavated with some bulk sampling, diamond drilling and rock chip sampling completed. The excavated material was placed on surface at site in three separate stockpiles: one for unmineralised access development material, one for “low-grade” mineralized material; and one for “mineralized” material. The unmineralised stockpile has been used from time to time for access road maintenance. The mineralized material stockpiles have been surveyed and sampled for the purpose of reconciliation against depletion calculations but no estimate has been prepared that would permit inclusion of the material in a disclosure of resources.
Between 2010 and 2012, 242 surface diamond holes were drilled totalling 36,000 m, the majority on the Cameron Deposit.
Since 2010, the following exploration work has been carried out throughout the Cameron Gold Project consisting of:
| | • | Airborne magnetic gradiometers survey of the project area in 2010. |
| | | |
| | • | 250 km of line cutting over the property |
| | | |
| | • | 142 line km of Pole-Dipole Induced Polarisation surveys (July 2010 to February 2011) |
| | | |
| • | Orientation geochemical sampling programme of surface pits around the Cameron deposit in late 2011. A total of 19 samples of around 12 kg were collected from the base of till over an area of about 900 m x 600 m. |
| | | |
| | • | Excavation of 94 pits in 2013 on gold-in-till anomalies. |
2016 Annual Information Form – Page 43
| | • | Outcrop mapping and prospecting |
| | | |
| • | Heli-borne magnetics and Versatile Time-domain Electromagnetic (VTEM) over the western portion of the project in 2014. A total of 1457 line km of VTEM was flown at 200 m spacings. |
| | | |
| | • | Several historical mineral resource estimates have been done for the Cameron Deposit. |
In May 2014, 15 holes for 2,599.5 m were diamond drilled at the Jupiter, Ajax, Juno and Hermione prospects that are proximal to the Cameron Deposit.
Geological setting, mineralization and deposit type
The mineralisation at the Cameron Gold Project is mainly hosted in mafic volcanic rocks within a northwest trending shear zone (“Cameron Lake Shear Zone” or “CLSZ”) which dips steeply to the northeast. In the southeastern part of the deposit where the greatest amount of gold has been delineated, the shear zone forms the contact between the mafic volcanic rocks and diabase/dolerite rocks of the footwall.
Gold mineralisation occurs within quartz breccia veins, associated with intense silica-sericite-carbonate-pyrite alteration in a series of zones that dip moderately to steeply to the northeast within and adjacent to the shear zone. Gold is associated with disseminated pyrite with high sulphide concentration generally corresponding with higher gold grade. Visible gold is rare. The mineralisation is open at depth and along strike to the northwest with potential to expand the Mineral Resource in these directions.
The Cameron Deposit is a greenstone-hosted gold deposit. While the deposit can generally be considered to be part of the orogenic family of gold deposits, it bears many characteristics atypical of the largest gold deposits of this style. These features include:
| • | mineralisation dominated by disseminated sulphide replacement and quartz-sulphide stockwork and quartz breccia veins; |
| | | |
| • | spatial and temporal association of mineralisation with porphyry intrusive bodies that have similar alteration assemblages (taking into account primary lithological variations); |
| | | |
| • | relatively minor amounts of auriferous quartz-carbonate vein material comprising the mineralisation, which is likely temporally-late compared to the disseminated sulphide replacement and quartz breccia veins; |
| | | |
| • | high-grade mineralisation is largely deformed and the disseminated sulphide replacement zones that constitute the bulk of the mineralisation are commonly foliated; and |
| | | |
| | • | the alteration assemblage of the mineralisation (sericite-albite-carbonate-pyrite) is atypical. |
Exploration
Exploration at the Cameron Gold Project commenced in 1960 and has been conducted intermittently until the present day.
Drilling
A number of diamond drillhole programmes have been carried out across the Cameron Gold Project area by a number of explorers: Noranda Exploration Company Limited (“Noranda”) from 1960 to 1971; Zahevy Mines Limited and Noranda from 1972 to 1974; Nuinsco from 1979 to 1983; Nuinsco and Lockwood Petroleum Inc. 1983 to 1985; Nuinsco and Echo Bay Mines Limited from 1985 to 1988; Nuinsco and Deak International Resources Holding Limited from 1988 to 1990; Cambior Inc. from 1995 to 1996; Nuinsco from 1997 to 2009; and Coventry Resources Inc. (“Coventry”) from 2010 to 2012. In addition, an RC drilling programme was completed by Nuinsco from 1987 to 1989 to sample the overlying glacial till and the bottom of hole in bedrock to test for geochemical anomalism associated with gold mineralisation.
2016 Annual Information Form – Page 44
From 1960 through to 2012, 981 diamond drillholes were drilled for a total of 120,813 m. An additional 83 RC holes were drilled during the mid-1980s for a total of 862 m.
Underground exploration of the Cameron Deposit commenced in October 1986 and was undertaken in two phases until July 1988 to verify the surface drilling results. Overall, 457 underground diamond drillholes were completed for a total of more than 21,707 m. An additional 55 diamond drillholes were drilled from underground for a total of 4,887 m between 1989 and 1990.
Sampling, analysis and data verification
Documentation regarding historic field procedures applied by previous explorers at the Cameron Gold Deposit, including details regarding sample collection, preparation, transportation and security, and analytical techniques, is poor or non-existent. Prior to 1988, core was manually split, with half-core sent for analysis. Post 1988, drill core was cut using a masonry saw. The inclusion of control samples is assumed and is sometimes referenced in documentation but details regarding this are not documented.
For the 2010 to 2012 drill programmes, drill core was cut on site with wet masonry core saws by geotechnical personnel who are supervised by Coventry site-based geologists. The selection of intervals for cutting and the length of these intervals was based on lithological, alteration or mineralisation boundaries as defined by the supervising geologist with 1 m intervals used in zones of similar lithology. Within mineralisation the sampling intervals vary from 0.06 m to 2 m.
Samples were received at the laboratory and checked against accompanying sample dispatch sheets to ensure all samples are delivered. Any discrepancies were noted and Coventry notified that resolution was required before the samples advanced through the preparation process.
Sample preparation comprised standard laboratory techniques of (i) drying for a minimum of 8 hours, (ii) mill crushing to greater than 70% passing 2 mm, (iii) riffle splitting (using a Jones Splitter) to approximately 250 gm and (iv) disk pulverising to 85% passing 75 microns. The sample was then split to 30 g for analysis with the remainder retained as a pulp residue. The coarse remainder was put aside as a bulk residue (reject).
Overweight samples (>2.5 kg) were crushed and split into two samples, treating each as above and recombining after pulverising.
All samples were analysed for gold by accredited and independent Activation Laboratories Ltd. (“ActLabs”) at their Thunder Bay facility using method ‘1A3-Tbay Au – Fire Assay Gravimetric’. The 30 g assay sample was combined with fire assay fluxes (borax, soda ash, silica and a lead oxide litharge) and silver added as a collector. The mixture was placed in a fire clay crucible, preheated at 850°C, intermediate at 950°C and finished at 1060°C over approximately 60 minutes. The crucibles were then removed from the assay furnace and the molten slag (lighter material) is carefully poured from the crucible into a mould, leaving a lead button at the base of the mould. The lead button is then placed in a preheated cupel which absorbs the lead when cupelled at 950°C to recover the silver and gold doré bead.
The gold was separated from the silver in the doré bead by parting with nitric acid. The resulting gold flake is annealed using a torch. The gold flake remaining is weighed gravimetrically on a microbalance. The detection limits are 0.03 ppm Au (lower) and 10,000 ppm Au (upper).
All drillcore from the 2010 and 2011 drilling programs is stored in covered steel core racks at the Cameron Gold Project. Every core box is labelled with Dymo tags, recording hole ID, box number and ‘from’ and ‘to’ depths.
2016 Annual Information Form – Page 45
All samples were individually bagged and labelled with unique sample numbers. Corresponding laboratory specific assay tags were included in each sample bag, which were then sealed with plastic zip-ties and batched in woven nylon bags. Samples were transported via commercial road transport on a weekly basis during drilling programmes. The samples were taken to ActLabs in Thunder Bay or to the ActLabs sample preparation facility in Dryden before being transferred to Thunder Bay for analysis.
Drill core was logged in the exploration camp at Cameron Lake. The core was logged for geology, alteration, mineralisation, structure and other geological features such as veining. The core was photographed in wet and dry condition and stored in racks prior to sampling by core cutting. The drill core was marked up with the sample intervals and the core was cut using a diamond blade saw. Sample tickets were stapled into the wooden core trays and the other half put into the sample bag. The sample number was also written on the outside of the calico sample bag for identification and sorting purposes. The core is stored in the exploration facility at the Cameron Property. This has dedicated covered racks for storing drill core, wooden crates for sample residues, and sea containers for sample pulps.
All samples were individually bagged and labelled with unique sample numbers. Corresponding laboratory specific assay tags were included in each sample bag, which were then sealed with plastic zip-ties and batched in woven nylon bags. Samples were transported via Gardewine North commercial road transport of Kenora. The samples were taken to ActLabs in Thunder Bay. Confirmation was sent to Chalice that the security tags were intact, and that the numbers match the sample despatch request.
As part of its QA/QC review, Optiro Pty Ltd. (“Optiro”) was provided a Microsoft access database containing two QA/QC tables. One table comprised standards and blanks and one table comprised duplicates assay results. Optiro exported these tables into CSV format and imported the QA/QC results into data analysis spread sheets to review the Cameron QA/QC results.
The underground drilling data collected between 1987 and 1989 was considered critical to the quantity and quality of the 2014 Mineral Resource Estimate, and as no QA/QC information was available, Coventry undertook a re-sampling program in order to establish confidence in the assay results. The Coventry re-sampling programme targeted mineralisation in and around the underground development. Remaining core was quartered either using a core saw or manually (depending on core condition) over the same sample intervals as currently recorded in the database. The re-samples were prepared and assayed in exactly the same manner that samples from Coventry’s diamond drilling programme were processed with sample preparation and analysis carried out at ActLabs in Thunder Bay. This re-sample programme provided 816 directly comparable assay results, from a total of 1,904.6 m of drill core. The comparison is between half core (original sample) and quarter core (resample).
Optiro only managed to identify 101 samples recorded in the QA/QC database to be duplicate samples and that were submitted by Coventry in 2010 and 2011. Optiro’s analysis of the 101 identified quarter core duplicate samples indicates a poor repeatability of grades between paired samples with a correlation coefficient of 0.24. The results suggest that the duplicate samples are under reporting compared to the original grades at gold grades of less than 1 g/t Au, and over reporting compared to the original grades at gold grades of greater than 2 g/t Au.
Results from the scatter plot, precision plot and relative difference plots highlight a moderate to poor precision and poor repeatability of duplicates from this resample programme. In Optiro’s opinion the repeatability and precision of these duplicates does not demonstrate a high level of confidence. However, the small number of samples does not in Optiro’s opinion provide definitive evidence of issues with the duplicate repeatability. Optiro notes that consideration for differing sample volumes i.e. manually split half core (versus) sawn quarter core needs to be taken into account when reviewing duplicate analysis results. As such, whilst Optiro recommends that First Mining needs to review the performance of the Coventry resample programme further, Optiro considers these results to be adequate for resource estimation.
Optiro has identified 249 blanks submitted by Coventry as part of its resample programmes in 2010 and 2011. Of the 249 blanks submitted four returned grades above 0.03 g /t Au. This represents a failure rate of less than 2%. Optiro considers these results to be adequate for resource estimation.
2016 Annual Information Form – Page 46
Optiro identified 236 standards submitted by Coventry as part of its resample programmes in 2010 and 2011. Of the 236 standards submitted, 10 different Certified Reference Material (“CRM”) standards with gold grades ranging from 0.38 g/t to 7.97 g/t Au were used during the Coventry resample programme. A total of 55 gold standards fall outside three standard deviations which represents a failure rate of approximately 23%. When graphed, it is evident that a large number of the standard failures are potential sample swaps (i.e. incorrect standard labelling or blanks labelled as a standard). However, due to the close gold grades of a number of standards, it is not possible to determine with 100% accuracy what the actual standard ID might be.
Optiro does not know whether Coventry resubmitted all failed batches for re-analysis.
Optiro considers that the sample swaps should be rectified in the database so that the QA/QC performance is representative of the performance of the standards. In taking these into account, Optiro considers that the CRM assay performance is adequate for estimation.
As part of their 2010 to 2012 drilling programmes, Coventry submitted standards, duplicates and blanks as part of their quality control program.
The blank material was obtained from a granite quarry and whilst not certified, was considered by Coventry to be sufficiently homogenous and unmineralised to act as barren material. Of the 921 blanks submitted eight (8) returned grades above 0.03 g /t Au. This represents a failure rate of less than 2%. These failures were reviewed at the time by Coventry and were considered to be potential laboratory contamination issues. Optiro considers these results adequate for resource estimation.
Of the 921 standards submitted, six were recorded as have grades of -99. Optiro removed these standards from the database prior to any further analysis. A total of 12 different CRM standards with gold grades ranging from 0.69 g/t Au to 7.97 g/t Au were used during the Coventry drill programs.
The provided database contained 901 quarter core duplicate samples collected by Coventry during the 2010 to 2012 drilling programmes. The duplicates demonstrate a moderate correlation coefficient (0.83) indicating moderate repeatability of grades between paired samples.
The relative precision of a field duplicate dataset is determined by calculating the absolute difference between the two sample’s grades divided by the mean of the sample pairs. Good or high precision suggests that the paired samples are consistent with each other, both samples have been well homogenised and that sample size (weight) is adequate to be representative of the material collected from the drillhole. Poor or low precision suggests that the samples have been poorly prepared, have a high inherent nugget, poor assaying, or are not large enough to be representative. Of the duplicates submitted to Actlabs, 74% of assays were within 5% precision, 76% within 10% precision, and 78% within 15% precision.
Results from the scatter plot, precision plot, and relative difference plots highlight a moderate to poor precision and moderate to poor repeatability of duplicates from these phases of drilling. Part of this could be due to the use of chisel vs. saw splitting, or the use of quarter vs. half core samples, which Optiro does not consider to be a true representative duplicate sample when dealing with gold mineralisation. As previously stated, taking into account consideration for differing sample volumes (i.e. half core versus quarter core), Optiro considers these results to be adequate for resource estimation.
In 2014, Chalice undertook a resampling program to provide additional confidence in the underlying drillhole sample assays results used for Mineral Resource estimation. The samples selected were considered to be spatially representative of the majority of the Cameron Gold Deposit with an emphasis on near surface locations. A total of 492 pulps and 325 coarse rejects were selected from the existing drillholes within the following series:
| | • | Historical holes – resample of pulp samples only |
| | | |
| | • | Coventry 2010 holes – pulps and rejects |
| | | |
| | • | Coventry 2011 holes – pulps and rejects. |
2016 Annual Information Form – Page 47
| The following is an overview of the pulp sampling program taken from the Chalice 2014 Report. |
| | | |
| | • | Selected pulp samples were sent to AGAT Laboratories of Mississauga, Ontario – the Umpire Laboratory |
| | | |
| | • | The samples were not re-numbered given the sample sequence had never been seen by this laboratory |
| | | |
| • | The laboratory was requested to place an “A” prefix to the start of the sample number to distinguish these results from the original results. |
| | | |
| • | Standards and Blanks were included with these samples positioned in the same location sequence as in the original submission; a new Standard was placed in the position of the original Standard (the original Standard sample being exhausted by the analytical process) whilst the Blanks were retained from the original submissions. |
The selected samples were renumbered (for disguise) and re-submitted to ActLabs to preparation and analysis by the method adopted by Coventry and described in previous reports.
Standards and Blanks were included with these samples positioned in the same location sequence as in the original submission; a new Standard was placed in the position of the original Standard (the original Standard sample being exhausted by the analytical process) whilst the Blanks were retained from the original submissions.
Results from the pulp duplicate analysis indicates a good repeatability of pulps, while results from the coarse reject analysis illustrates that the average grade of the rejects is 4% lower than the original sample. Optiro was not provided with this data and as such has not been able to replicate these results.
Optiro considers the assay performance of the pulp and reject samples to provide good support for the representivity of the analytical results and for mineral resource estimation.
In 2015, Chalice undertook two resampling programs of unsampled intervals within the CSZ. Optiro has based the following analysis of standards, duplicates and blanks submitted as part of the 2015 resampling programs based on the coding in the provided database.
Of 1,608 blanks submitted during the 2015 resample program, 10 returned grades above 0.03 g/t Au. This represents a failure rate of less than 1%. Optiro considers these results to be a good measure of the sample preparation process and acceptable for resource estimation.
Of 1,644 standards submitted, 10 were recorded as ‘sample consumed’. Optiro removed these standards from the database prior to any further analysis. A total of 9 different CRM standards with gold grades ranging from 0.34 g/t Au to 7.97 g/t Au were used during the Chalice resample programmes.
A total of 144 gold standards fell outside of three standard deviations, which represents a failure rate of approximately 9%. The majority (but not all) of the failures appear to be sample swaps (i.e. incorrect standard labelling or blanks labelled as a standard). In this program, Chalice did not resubmit failed batches for re-analysis but Optiro recommends implementation of this protocol for future programs. In addition, Optiro notes the presence of what appears to be cyclic trends in the standard results. Further investigation into these trends is recommended.
Of 1,629 quarter core duplicates submitted, one was recorded as having a grade of -99. Optiro removed this sample from the database prior to any further analysis. The duplicates demonstrate a moderate correlation coefficient (0.79) indicating a moderate repeatability of grades between paired samples. Optiro notes there are number of original samples (43) with barren grade (<0.03 g/t Au) where the duplicate has returned gold grades ranging from 0.1 g/t Au to 2.42 g/t Au. Furthermore, there a number of duplicate samples (47) of barren grade with an original grade ranging from 0.1 g/t Au to 3.1 g/t Au, suggesting that there are potentially sample swaps.
The relative precision of a field duplicate dataset is determined by calculating the absolute difference between the two sample’s grades divided by the mean of the sample pairs. Good or high precision suggests that the paired samples are consistent with each other, both samples have been well homogenised and that sample size (weight) is adequate to be representative of the material collected from the drillhole. Poor or low precision suggests that the samples have been poorly prepared, have a high inherent nugget, poor assaying, or are not large enough to be representative. Of the duplicates submitted to Actlabs 86% of assays were within 5% precision, 87% within 10% precision, and 88% within 15% precision.
2016 Annual Information Form – Page 48
Results from the scatter plot, precision plot, and relative difference plots highlight a moderate precision and a moderate repeatability of duplicates from these resampling programs.
Based on the good correlation coefficient and moderate repeatability performance of the duplicate samples Optiro considers the results from the Chalice 2015 resampling program to be acceptable for use in a mineral resource estimate.
Aside from the pulp resample programme undertaken by Chalice in 2014, Optiro is unaware of any additional umpire duplicate sampling that has taken place at Cameron Gold Project.
Data verification has been carried out by the author to verify the following elements:
| • | Deposit location and geology confirmed by site visit to view outcrop exposures, drill core samples and photographs of drillcore |
| | | |
| • | Drill collar locations and grid co-ordinates verified by GPS check of randomly selected drill hole co- ordinates |
| | | |
| | • | Downhole survey deviation compared on an random selection of drill holes |
| | | |
| | • | Quantum of stated mineralisation supported by independent sampling of mineralisation |
| | | |
| | • | Assay integrity verified by sample QA/QC analysis, no significant bias identified |
Primary source data (surveys, downhole survey information, assay certificates) checked against database for errors and no material issues identified.
The results of the data validation process have verified the accuracy and integrity of the information provided by Chalice. It is Optiro’s opinion that the Cameron database is acceptable for the purpose of mineral resource estimation.
Mineral processing and metallurgical testing
A number of preliminary metallurgical studies have been carried out on samples from the Cameron Property from 1985 to the present. Multi-element geochemical assays of the samples from the drillholes drilled between 2010 and 2012 have indicated that concentrations of deleterious elements (such as sulphur) are not significant.
Metallurgical test work carried out on samples representative of the style of mineralization at the Cameron Gold deposit showed that recoveries of 92% to 93% were returned from direct cyanidation of samples ground to 75 μm. The results also showed that the recoveries were grind sensitive with maximum recoveries at a P80 grind size in the range 53 to 75 μm. An alternative processing regime of sulphide flotation (mainly pyrite), regrind of flotation concentrate followed by intensive cyanidation of flotation concentrate and flotation tailings provided gold recoveries marginally higher than direct cyanidation. At a grind size of 75 μm the optimum leach time was approximately 24 hours.
Test work completed in 2013 by the Vancouver branch of SGS used a composite sample taken from 17 drillhole intersections from 14 separate drillholes at the Cameron Project. Comminution tests indicated that:
| | • | rod and ball mill bond work indices are low; |
| | | |
| | • | moderate abrasion index within typical ranges for dolerite-basalt material; and |
| | | |
| | • | JK breakage parameters indicating the material is highly competent. |
2016 Annual Information Form – Page 49
Gravity recoverable gold is typically around 25% with no improvement in overall recovery after gravity recovery with cyanidation of the gravity tails. Test work carried out in 2014 showed that cyanide in leach processing at a P80 of 75 μm would recover 92.5% of gold with a cyanide usage of 0.2 kg/t and lime usage of 1.2 kg/t. This result was an improvement on direct cyanidation in terms of reagent usage with a lower recovery (92.5% vs. <95% cyanidation). No processing issues or deleterious element have been identified that could have a significant effect on potential mineral extraction in metallurgical test work completed to date.
Mineral resource estimates
The mineral resource estimates for the Cameron Deposit have been generated from drillhole sample assay results. The interpretations are based on an integrated 3D geological model that defines the relationships of the geological elements at the Cameron Property. The interpreted mineralisation wireframes (using a nominal 0.4 g/t Au and 0.25 g/t Au cut-off grade for low grade domains) have been used to constrain gold grade estimates. There are eight mineralisation domains that are split into two global areas –‘northern’ and ‘southern’, with the separation defined by a set of northwest (grid) striking quartz feldspar porphyry (“QFP”) dykes. The southern domain is the most strongly mineralised. The stronger mineralisation is attributed to being dominantly mafic hosted with an inflection point in the Cameron Lake Shear Zone and resultant dilation zone defined by north-south striking hangingwall and footwall QFP dykes.
Block grade estimation parameters have been defined on the basis of geology, drillhole spacing and through geostatistical analysis of the data. Block grade estimation is by ordinary kriging (“OK”) into a panel size of 5 mE by 10 mN and 5 mRL, which is considered appropriate for the distribution of sample data and the deposit type. Sub-celling of the parent cells to 0.625 mE by 2.5 mN and 1.25 mRL was enabled to ensure good volumetric correlation with the mineralisation wireframes.
The mineral resource estimates have been classified by the geological understanding, data spacing, block proximity to sample locations, underground development and confidence in the block model grade estimate. The mineral resource estimate has been reported in accordance with the Standards on Mineral Resources and Reserves of the Canadian Institute of Mining, Metallurgy and Petroleum 2014 Definition Standards.
The mineral resources have been reported using updated constraints and cut-off grades. The mineral resource is tabulated in the Table A below for Measured and Indicated Mineral Resources and in Table B for Inferred Mineral Resources.
2016 Annual Information Form – Page 50
Table A - Measured & Indicated Mineral Resource statement as at January 17, 2017
| Mineral Resource Classification | Open-Pit Constraint | Gold cut-off
(Au g/t) | Tonnes | Gold
g/t | Gold (Ounces) |
| Measured Mineral Resource | Within US$1,350 open-pit shell | 0.55 | 2,670,000 | 2.66 | 228,000 |
| Indicated Mineral Resource | Within US$1,350 open-pit shell | 0.55 | 820,000 | 1.74 | 46,000 |
| Measured + Indicated | | | 3,490,000 | 2.45 | 274,000 |
Mineral Resource Classification | Underground Constraint | Gold cut-off
(Au g/t) | Tonnes | Gold
g/t | Gold (Ounces) |
| Measured Mineral Resource | Below US$1,350 open-pit shell | 2.00 | 690,000 | 3.09 | 69,000 |
| Indicated Mineral Resource | Below US$1,350 open-pit shell | 2.00 | 1,350,000 | 2.80 | 121,000 |
| Measured + Indicated | | | 2,040,000 | 2.90 | 190,000 |
| TOTAL MEASURED + INDICATED | | | 5,530,000 | 2.61 | 464,000 |
Table B - Inferred Mineral Resource statement as at January 17, 2017
| Mineral Resource Classification | Open-Pit Constraint | Gold cut-off
(Au g/t) | Tonnes | Gold
g/t | Gold (Ounces) |
| Inferred Mineral Resource | Within US$1,350 open-pit shell | 0.55 | 35,000 | 2.45 | 3,000 |
| Mineral Resource Classification | Underground Constraint | Gold cut-off
(Au g/t) | Tonnes | Gold
g/t | Gold (Ounces) |
| Inferred Mineral Resource | Below US$1,350 open-pit shell | 2.00 | 6,500,000 | 2.54 | 530,000 |
| TOTAL INFERRED | | | 6,535,000 | 2.54 | 533,000 |
The Measured and Indicated Mineral Resources are defined in the areas of the deposit that have the highest drilling density along with underground development that has exposed and sampled the deposit on three levels of drift development.
2016 Annual Information Form – Page 51
Pickle Crow
Technical report
The Pickle Crow Property project (the “Pickle Crow Project”) description is based on the project’s technical report:A Mineral Resource Estimate for the Pickle Crow Property, Patricia Division, Northwestern Ontario, Canada(dated June 2, 2011) (the “Pickle Crow Technical Report”). The report was prepared for us in accordance with NI 43-101, by or under the supervision of B. Terrence Hennessey, P.Geo.; Alan J. San Martin, MAusIMM(CP); and Sam J. Shoemaker, B.Sc. MAuIMM, Reg. Mem. SME; all qualified persons within the meaning of NI 43-101. The following description has been prepared under the supervision of Chris Osterman, P.Geo. who is a qualified person within the meaning of NI 43-101, but is not independent of us.
The conclusions, projections and estimates included in this description are subject to the qualifications, assumptions and exclusions set out in the Pickle Crow Technical Report, except as such qualifications, assumptions and exclusions may be modified in this AIF. We recommend you read the Pickle Crow Technical Report in its entirety to fully understand the project. You can download a copy from our SEDAR profile (www.sedar.com), or from our website (www.firstminingfinance.com).
Project description, location and access
The Pickle Crow Property is located in northwestern Ontario about 400 km north of Thunder Bay and approximately 11 km east of the town of Pickle Lake. The Pickle Crow Property is centred at approximately 51º 31’ North latitude and 90º West longitude in NTS map area 52O/11.
The Pickle Crow Property can be reached from the city of Thunder Bay by proceeding westerly on the paved TransCanada Highway (Highway 17) for approximately 245 km to the town of Ignace and then northward on paved Provincial Highway 599 approximately 290 km to the town of Pickle Lake. From Pickle Lake, access to the Pickle Crow Property is along a good gravel road that connects to Highway 599 near the village of Central Patricia. The western boundary of the Pickle Crow Property is 6.5 km from the turn off at Highway 599. The total road distance to the Pickle Crow Property from Thunder Bay is approximately 545 km.
The Pickle Crow Property consists of 98 contiguous patented mining claims covering a surveyed area of 1,582.9 ha and 19 unpatented mining claims comprised of 166 units covering an unsurveyed area of approximately 2,656 ha for a total of 117 claims comprised of 264 units totalling approximately 4,239 ha.
Through our wholly-owned subsidiary, PC Gold, we are party to a 99 year mining lease (the “Mining Lease”) with Teck Resources Limited (“Teck”) which expires July 31, 2067. The Mining Lease requires payment of $1.00 per year which has been prepaid in full in advance. Registered ownership of mineral rights and surface rights for the Pickle Crow patented claims is held by Teck as ‘fee simple, absolute’, the highest level possible.
Our leasehold interest in the patented claims is additionally subject to two NSRs totalling 1.25%. These royalties would be payable only upon commencement of commercial production. We have the option of purchasing these royalties. There are no other royalties, back-in rights or encumbrances on the Pickle Crow Property.
The unpatented portion of the Pickle Crow Property is subject to assessment work requirements.
All phases of our exploration activities on the Pickle Crow Property are subject to environmental regulation. These regulations mandate, among other things, the maintenance of air and water quality standards and land reclamation and provide for restrictions and prohibitions on spills, releases or emissions of various substances produced in association with certain exploration and mining industry activities and operations. They also set forth limitations on the generation, transportation, storage and disposal of hazardous waste. A breach of such regulations may result in the imposition of fines and penalties. In addition, certain types of exploration and mining activities require the submission and approval of environmental impact assessments.
2016 Annual Information Form – Page 52
The Pickle Crow Property has, over the course of the past two decades, been subject to several environmental studies which examined, among other things, water quality and its impact, if any, on the health of aquatic populations in the watershed encompassing it. These preliminary studies indicate that in spite of the history of mining on the Pickle Crow Property, including a significant volume of historical tailings sitting in four tailings basins on surface and extensive areas of flooded mine workings, water quality samples generally meet provincial water quality standards. This appears to be due in part to the generally low sulphide content and natural buffering effect of the carbonate minerals found in the vein ore historically mined.
History
The Pickle Crow deposit was originally discovered in the early 1930s and commercial production at the mine began in 1935. The Pickle Crow mine operated until 1966 during which time it produced 1,446,214 troy ounces of gold and 168,757 troy ounces of silver from 3,070,475 tons of ore milled (at an average grade of 0.47 oz./t or 16.14 g/t). The Pickle Crow Property sat dormant from 1966 to the late 1970s.
In 1979, a VLF-EM (very low frequency-electromagnetic) geophysical survey of the Pickle Crow Property was performed and 47 surface diamond drill holes for 7,356 m were drilled. The only known soil geochemical survey done on the Pickle Crow Property was completed in 1983. The samples were collected along the same cut grid lines as used for the VLF-EM survey. Soil values ranged from 10 to 12,000 ppb, with the high values attributed to the mine tailings and thought to be cultural anomalies.
Between 1985 and 1987, the most extensive exploration program on the Pickle Crow Property since its closure and up to that time was completed. The program consisted of line-cutting, magnetometer and induced polarization geophysical surveying, geological mapping, surface trenching, diamond drilling and environmental baseline studies. In total, 286 surface diamond drill holes drilled for 46,189 m and 79 underground diamond drill holes for 9,341 m which were completed between 1985 and 1988. Following completion of the program, all shafts, ventilation raises and other surface openings were capped with concrete in 1989 after an estimated $9.2 million was spent on the Pickle Crow Property. Two historic (non-NI 43-101 compliant) resource estimates were commissioned, one in April of 1988 and a second in December of 1988.
A total of four surface diamond drill holes for 2,287 m were drilled in the fall of 1998. An additional 18 surface diamond drill holes were completed in 1999 for 2,173.5 m.
Between 1999 and 2001, two bulk samples were taken from the No. 5 Vein and No. 1 Vein crown pillars respectively.
In 2002, the building of a 225 t/d extreme gravity mill was commenced on the site, a partially complete production closure plan was submitted to the then MNDM and construction of a tailings management facility within the historic Pickle Crow tailings area began. Stockpiling of material mined from the historic No. 1 Vein shaft and crown pillar area in the summer of 2002 also commenced.
On May 13, 2008 PC Gold acquired its interests in the Pickle Crow Property. It then launched the current exploration program in conjunction with the staking of surrounding unpatented claims which now define the boundaries of the current Pickle Crow Property.
Geological setting, mineralization and deposit types
The Pickle Crow Property lies within the Pickle Lake greenstone belt, part of the Uchi Subprovince, which is within the Superior Province of the Canadian Shield. The Pickle Lake greenstone belt comprises an approximately 70-km long by 25-km wide area of supracrustal rocks and internal granitoid plutons surrounded by large granitoid batholiths.
2016 Annual Information Form – Page 53
The supracrustal rocks have been deformed and metamorphosed to greenschist facies with amphibolite facies occurring in the thermal aureoles of younger plutonic bodies. The Pickle Lake greenstone belt is subdivided into four tectono-stratigraphic assemblages including:
| | • | The Pickle Crow assemblage. |
| | | |
| | • | The Kaminiskag assemblage (not present on the Pickle Crow Property). |
| | | |
| | • | Unnamed Temiskaming-like assemblage. |
| | | |
| | • | The Confederation assemblage. |
On the Pickle Crow Property, the Pickle Crow assemblage is dominated by tholeiitic basalts with intercalated sediments (primarily banded iron-formation, sometimes referred to as BIF), and rare calc-alkaline volcanic and volcaniclastic units. The assemblage occupies the northwestern part of the greenstone belt and is interpreted to be unconformably overlain by the Confederation assemblage.
Gold mineralization on the Pickle Crow Property is orogenic in nature and occurs in complexly folded and sheared, mainly tholeiitic, volcanic rocks of the Pickle Crow assemblage near its contact with calc-alkaline volcanic/volcaniclastic rocks of the Confederation assemblage. Host rocks for the mineralization include tholeiitic lavas, banded iron formation, intermediate volcanic/volcaniclastic rocks and quartz feldspar porphyry. Gold occurrences on the Pickle Crow Property are associated with four styles of mineralization:
| • | Narrow, high-grade gold-scheelite-bearing quartz veins, which were the main source of gold produced at the Pickle Crow mine from 1935 to 1966. |
| | | |
| • | Iron formation-hosted gold mineralization adjacent to vein structures. The iron formation contains stringers and discontinuous lenses of quartz and the iron-bearing minerals have been replaced by sulphides. Both quartz and sulphides are gold- mineralized. Only a limited amount of this type of material was processed at the Pickle Crow mine. However, iron formation-hosted gold was the main ore type at the adjacent Central Patricia mine to the southwest. |
| | | |
| • | Shear zone-hosted gold mineralization consisting of complex wide zones of intense shearing and alteration which are intimately associated with the intrusion of the Albany porphyry and characterized by disseminated pyrite, discontinuous quartz veining and sulphidation of interflow iron formation. |
| | | |
| • | Arsenopyrite-associated gold mineralization which typically occurs as disseminated to semi-massive arsenopyrite and quartz-arsenopyrite stockworks hosted by iron formation but can be also found, to a lesser extent, in shear zones and/or quartz veins in volcanic rocks. Similar arsenopyrite-rich iron formation-hosted gold was the main ore type at the adjacent Central Patricia mine. |
We consider the gold occurrences in the Pickle Lake mining camp to be classical examples of deposits grouped under the descriptive model of Archean low-sulphide gold- quartz veins. This deposit type is also known as shear- zone-hosted gold, Archean quartz-carbonate vein gold deposits, Archean lode gold, Archean mesothermal gold or orogenic gold.
Exploration
In 2007, sourcing and compilation of available historical data was started.
In October 2007, a total of nine samples from the Pickle Crow Property. Two types of samples were obtained on a spontaneous and random basis : eight field duplicate split core samples from a series of drill holes that are stored at two locations on the Pickle Crow Property and one composite chip channel sample taken from the outcropping one vein in its bulk sample pit.
Starting in the spring of 2008 PC Gold commenced an extensive exploration program consisting of locating historical drill collars with a differential GPS; surveying historical shafts; reconnaissance geological mapping and relocating historical trenches; limited channel sampling and mapping of historical trenches and diamond drilling of 33 holes with up to 2 rigs totalling 8,638 m in the core mine trend to confirm historical holes. This program confirmed the results of historical drill holes and provided confidence in the digital database.
2016 Annual Information Form – Page 54
Field exploration was renewed in the spring of 2009 with a focus continuing on the core mine trend. This exploration program consisted of diamond drilling of 34 holes with up to 3 rigs totalling 14,308 m; shallow drilling targeting; U-Pb age dating of detrital zircons from two samples; line cutting (114.9 km) on the core mine and Cohen-MacArthur trends; a Titan IP (71.45 line-km, 80.25 km with current extensions) and ground magnetometer survey (110 line-km); and prospecting with a focus on the Cohen-MacArthur trend. The most significant results of the 2009 program were the discovery of Conduit Zone 1, the discovery of Pickle Crow type high-grade veins hosted in intermediate volcanic rocks and gabbro of the Confederation assemblage (Confederation veins), possibly representing surface expression of a vein, the identification of Temiskaming-like sediments in the core mine trend, and the identification of the Cohen-MacArthur trend by geophysics.
In 2010, exploration continued with the focus remaining on the core mine trend but expanding to include the Cohen-MacArthur trend. The exploration program consisted of diamond drilling of 106 holes with up to 4 rigs totalling 35,545 m, including helicopter supported drilling; and trenching program consisting of 9 trenches totalling approximately 32,000 m2including 1,707 channel samples. The most significant results of the 2010 program were the discovery of the no. 19 vein, the Kawinogans Zone and the Central Pat East Zone and the extension of the No. 1 Vein 700 m below the historical workings. The No. 20 and 21 Veins were also discovered.
As of March 12, 2011, the exploration program continued with drill testing of the core mine but with a focus on regional targets along the Cohen-MacArthur trend. The exploration program consisted of diamond drilling of 11 holes with up to 3 rigs, totalling 4,476 m; 881.4 line-km of 50-m spaced helicopter borne AeroTEM and magnetometer surveys; and completion of baseline water sampling and sampling of stockpiled high and low grade ore for finalizing the closure plan. Significant results of the 2011 exploration program to date include the expansion of the Central Pat East Zone as a possible near surface, bulk tonnage target and the continued expansion of the No. 19 Vein.
On April 18, 2011, PC Gold announced a 1.26 million ounce NI 43-101-compliant inferred mineral resource, audited by Micon International Limited (“Micon”), which triggered the preparation of the Pickle Crow Technical Report.
Drilling
Since acquiring the Pickle Crow Property in early May 2008, PC Gold has conducted an aggressive diamond drill program designed to confirm and expand the historic resources and make new discoveries. The most prominent of these new discoveries was the No. 19 Vein with 15.95 g/t Au over 0.70 m. Follow-up intercepts of the zone included 43.28 g/t Au over 13.13 m and are considered by PC Gold to represent the most significant discovery since the closure of the mine in 1966. Other discoveries include the Conduit Zones in the Albany Shaft area and the Central Pat East Zone along the Cohen-MacArthur trend.
A total of 184 holes totalling 62,968 m have been drilling on the Pickle Crow Property between June 2008 and March 12, 2011. Drilling was completed in three phases as described above.
All holes were drilled with NQ-sized core (47.6 mm) with the exception of 9 BQ Thin Wall holes (40.7 mm) drilled.
The bulk of the PC Gold holes were drilled in the core mine trend with the second largest concentration along the Cohen-MacArthur trend. Several new mineralized zones were intersected. Other newly discovered zones include the No. 20 and 21 Veins, the Confederation Veins, and the Kawinogans Zone. Significant extensions to known zones include extending the No. 1 Vein at Shaft 1 to 1,500 m depth and the intersection of abundant quartz veining beneath the workings of Shaft 3 which is interpreted to be the extension of the No. 6 and 7 Veins.
2016 Annual Information Form – Page 55
The drilling program has extended several known zones and outlined new discoveries. These include high grade, narrow vein targets and more disseminated bulk tonnage targets which may be amenable to open pit or underground bulk mining.
Sampling, analysis and data verification
Two types of sample collected by PC Gold during exploration of the Pickle Crow Property were used in the preparation of the mineral resource estimate presented in the Pickle Crow Technical Report, channel samples from trenches and diamond drill core.
Channel Samples -Collection of the trench channel samples was completed after the trenches were excavated, washed and mapped. Channel sampling was performed utilizing a Stihl ‘quick-cut’ rock saw. Two continuous parallel cuts were sawn approximately 5 cm apart and approximately 5 cm deep, with the rock in between then chipped out using a chisel. Sample lengths varied between 0.3 and 2.0 m averaging 0.90 m. Each sample was placed in a thick plastic bag with the sample number clearly written on the outside of the bag with permanent marker and with one portion of a three part sampling ticket placed inside. Each sample was sealed with a cable strap. The location of the samples was noted in the sample book and on the trench map. Aluminum tags with etched sample numbers were hammered into the cross cuts, using cement nails, at the beginning of each sample interval for a permanent record on the trench. Once collected, the samples were bagged and shipped as per the sample shipment procedures described below, with the exception that all channel samples were shipped to AGAT Laboratories Ltd. (“AGAT”) of Mississauga, Ontario.
Diamond Core Logging and Sampling– NQ diameter (47.6 mm) drill core was logged, then sawn in half using diamond bladed saws at the secure logging/core-cutting buildings onsite, under the overall supervision of the logging geologists. The core was sawn in half following a sample cutting line determined by the geologists during logging. After cutting, one half of the core was bagged, labelled and sealed with a zip tie or staples after one part of the three part sample tag was placed inside. The second part of the sample tag was stapled into the core box at the beginning of each sample. The third part of the tag was kept in the sample tag book as a permanent record. The remaining half core was placed in core boxes to serve as a permanent record and stored in a secure onsite facility. All samples were shipped from the site in a locked wooden crate with security tags. The samples were transported via Manitoulin Transport to laboratory preparation facilities in Thunder Bay, Ontario for crushing, pulverization and pulp preparation. In 2008, samples were shipped to ALS Chemex’s (“ALS”) facility in Thunder Bay. In 2009 and 2010, samples were sent to Accurassay in Thunder Bay.
Once the core/channel samples were cut, bagged and sealed with zip ties or staples, ten samples were put into a larger rice bag, which was then sealed with a secure, numbered security tag. The security tag numbers were recorded along with the corresponding samples within the bag, and then shipped in the locked wooden crates to the laboratory. Once they arrived at the laboratory, the security tags and corresponding samples were recorded again by the laboratory and emailed back to the PC Gold field site for confirmation. Prior to shipment the sample bags were stored in a locked building onsite. The site is always occupied. No samples were left at the project site during field breaks.
A total of 5,797 drill samples, which include QA/QC samples (i.e. duplicates, standards and blanks) were submitted to ALS in 2008 for analysis. A total of 42,392 drill samples, including QA/QC samples, were submitted to Accurassay in 2009 and 2010 for analysis. A total of 1,577 channel samples, including QA/QC samples, were submitted to AGAT in 2010 for analyses.
For the analysis of Pickle Crow Property drill core samples, ALS was chosen as the primary laboratory in 2008. Accurassay was chosen as the primary laboratory for drill core samples in 2009 and going forward.
In 2008, samples were crushed and prepared at ALS’ facilities in Thunder Bay, Ontario and sample pulps were shipped to its North Vancouver, British Columbia laboratory for analysis. ALS’ facilities in Thunder Bay are certified to ISO 9001. The laboratory in North Vancouver is accredited to ISO 17025 for gold fire assay by atomic absorption and gravimetric finish as well as four-acid multi-element analysis by ICP and MS. In 2009 and 2010, samples were crushed, prepared and analyzed at the Accurassay facility in Thunder Bay, Ontario. Accurassay is accredited to ISO 17025 for gold by fire assay with atomic absorption finish. The trench channel samples were assayed at AGAT in Mississauga, Ontario. AGAT is accredited to ISO 17025.
2016 Annual Information Form – Page 56
All samples sent to ALS for analysis were prepared using a jaw crusher, which was cleaned with compressed air between samples, resulting in 70% of the sample passing through a 10 mesh screen. A 1,000 g split of the crushed sample was then pulverized to 85% passing a 200 mesh screen. All samples sent to Accurassay for analyses were prepared using a jaw crusher, which was cleaned with a silica abrasive between samples, resulting in 90% of the sample passing through an 8 mesh screen. A split of the crushed sample weighing 1,000 g was then pulverized to 90% passing a 150 mesh screen. AGAT’s sample preparation procedures include crushing to 75% passing 2 mm and pulverizing to 85% passing 75 µm.
For all three laboratories, the prepared sample pulps were analyzed for gold by fire assay using 50-g sample charge with AAS finish. If the returned assay result was equal to or greater than 5 g/t then the sample was reassayed by fire assay with gravimetric finish. All samples greater than 10 g/t, and any samples suspected of nugget gold (quartz veins) were additionally sent for pulp metallics analysis using the remainder of the pulp (~950 g of sample).
PC Gold has completed bulk density measurements on 2,602 samples of mineralized and unmineralized diamond drill core, and select grab samples from “ore” stockpiles onsite from the Pickle Crow mine. Of these, 1,918 measurements were used in the calculation of average specific gravity for the Pickle Crow Property. During a review of the data, 684 measurements were discarded due to laboratory errors that produced unrealistic specific gravity values.
Diamond drill hole data and trench data in stored in Excel spreadsheets. These can easily be imported into Microsoft Access database software and used in many resource estimation/mine planning software packages. We also use Gemcom software to evaluate drill results and has the finalized data stored in Microsoft Access. Excel is used to manage the data and QA/QC program.
The Pickle Crow Project QA/QC program includes the use of crush duplicates, ¼-split drill core (field duplicates), the insertion of certified reference materials including low, medium and high grade standards and coarse blanks. This is accomplished by inserting the QA/QC samples sequentially in the drill core sample numbering system. One set of the four QA/QC types were inserted every 30 samples, consisting of 1 crush duplicate, 1 quarter-split field duplicate, 1 standard (alternating between a low, medium and high standard), and 1 blank. This resulted in approximately every seventh sample being a QA/QC sample.
Sample assay results are evaluated through control charts, log sheets, sample logbook and signed assay certificates to determine the nature of any anomaly or failure. Identified failures are re-assayed by the laboratory at which the failure occurred until a cause of the failure and correct analysis is obtained. Check assaying is also conducted on approximately 1 in every 20 samples. The pulps are re-numbered with new, sequentially-inserted QA/QC samples and sent to a second ISO certified laboratory (Actlabs of Ancaster, Ontario).
Approximately 1 out of every 20 samples for the Pickle Crow Project were submitted to a second laboratory, Actlabs, an ISO 17025 certified laboratory with a sample preparation and analytical facility in Ancaster, Ontario. The assaying protocol used is similar to ALS and Accurassay’s using fire assaying with a 50-g charge and AAS finish. Samples above 3 g/t Au are re-assayed using a gravimetric finish, and above 10 g/t by pulp metallic methods. A total of 2,117 check samples were sent to Actlabs. Check assays generally matched the value obtained by the original laboratory and the overall variation between laboratories was well within the natural variation of the sample material as indicated by the field and crush duplicates.
During the October, 2011 site visit, Micon did not complete any check sampling. Micon did examine surface exposures and stockpiles of mineralization from the No. 1 Vein and No. 5 Vein. Visible gold was noted in the samples on the No. 1 Vein stockpile.
2016 Annual Information Form – Page 57
The final database was sent to Micon in early March, 2011 for validation. Micon performed a thorough validation of the database and specifically performed a cross-check validation of the assay table against assay results received directly from the laboratories in electronic form. The cross-check validation of the assay table described above was possible only for the newer PC Gold-generated data which contained laboratory sample identification numbers.
Several minor problems were found and corrected, most of them located out of the modelled zones. The problems were related to the fact that the majority of the database was collected from historical data digitized from old paper logs.
It is Micon’s opinion that PC Gold is running an industry standard QA/QC program for its database and insertion of control samples into the stream of core and channel samples for the Pickle Crow project exploration program.
While certain minor discrepancies in survey data of old workings have been noted it has been determined they will only affect the precise location in space of the workings and are not likely to materially affect the estimate of remaining volumes of mineralization. As such they are suitable for use in an inferred resource estimate. Determination of measured and indicated resources or reserves in the future will require resolution of these minor discrepancies, likely by dewatering and reaccessing the workings.
The historic drill data have been shown to be acceptable for use in a mineral resource estimate with appropriate application of assay top cuts as discussed above.
Mineral processing and metallurgical testing
The historic ore produced at the Pickle Crow mine presented no major milling problems.
Pickle Crow Mill, 1935-1966: The long since removed process plant for the Pickle Crow mine ran from 1935 to 1966. The 400 ton/day (360 t/d) mill recovered gold by a combination of gravity/amalgamation and cyanidation. Overall gold recovery averaged slightly over 98%. When the mine closed in 1966 efficiency in the gravity section had been improved to achieve as much as 60% of the total recovery.
1999-2002: In October 1999, prior to mining the first of two bulk samples, grab samples were collected from the surface exposures of the No. 5 Vein. These samples were sent to ORTECH Inc. of Mississauga, Ontario for bottle roll leach tests. The bottle roll tests were conducted on minus 8 material assaying 53.2 g/t Au, and minus 100 mesh material assaying 40.04 g/t Au. After 48 hours, 53.5% and 95.4% recoveries were achieved for the minus 8 and minus 100 mesh fractions respectively.
No. 5 Vein Crown Pillar Bulk Sample: In December 1999, a bulk sample from the No. 5 Vein crown pillar was mined and sampled, estimated to contain 9,500 tons (8,600 tonnes) averaging 0.38 oz./t Au (13.02 g/t Au) assuming a 3.0 ft. (0.91 metre) minimum mining width; cut to 1 oz./t and 25% diluted. The average grade of the resource block was determined using a weighted average 9 drill hole and channel samples located inside the block. The bulk sample was carefully mined from a small open pit, with vein material comprising an estimated 95% and wall rock dilution only 5% of the sample. The bulk sample was shipped to the St. Andrews Goldfields Ltd. 1,300 t/day CIP (carbon-in-pulp) gold process plant located at Stock Township near Timmins, Ontario for custom milling. The shipment was processed on December 21, 1999. The commercial settlement was agreed upon at a recovered grade of 16.72 g/t Au (0.49 oz./t Au).
No. 1 Vein Crown Pillar Bulk Sample: A second phase of bulk sampling was initiated in 2000. 4,427 tonnes of material (over 90% from the No. 1 Vein) were trucked to the Golden Giant mill near Hemlo, Ontario for custom milling. The custom milling flowsheet included secondary crushing, grinding, gravity concentration, leaching, CIP, stripping, electrowinning and refining. The shipment was processed between December 4 and 10, 2000. The commercial settlement was agreed upon at a recovered grade of 16.72 g/t Au (0.49 oz./t Au). Prior to accepting the Pickle Crow Property bulk sample, laboratory metallurgical tests were completed to determine if the material could be treated at the mill and if the tailings produced would have a negative environmental impact on the tailings basin. No environmental problems were noted. The test work indicated that about 40% of the gold was recoverable with a single pass gravity Knelson concentrator. The remaining gold could be easily leached with cyanidation with an optimum grind of 75% passing 200 mesh. Test work indicated that higher grinds could result in lower gold recoveries. Leach retention times of greater than 48 hours might be required. An overall recovery of 98.4% was achieved in the tests.
2016 Annual Information Form – Page 58
No. 1 Vein Crown Pillar Bench Scale GRG & Leaching Test work: A set of five approximately 20 kg samples from the No. 1 Vein Crown Pillar bulk sample were submitted to the Knelson Research and Testing Centre (“KRTC”) in Langley, British Columbia for gravity-recoverable-gold (“GRG”) and leaching testwork. These samples were sent from the Golden Giant mine. The samples were received at the KRTC facility on July 3, 2001. The samples were weighed and logged prior to any processing. The primary objective of this test work was to quantify the gravity recoverable gold content of the ore using a standard test. The secondary objectives were to determine the average head grade of the sample and to perform cyanide leach tests on sub-samples of the final tails. A KC-MD3 laboratory scale Knelson Concentrator was utilized for the GRG test work.
The procedure used for the KC-MD3 stage test was as follows:
| | • | The samples were sorted by time and date into lots of approximately 20 kg. |
| | | |
| • | Each sample was screened at 10 mesh prior to the first pass through the KC-MD3 in order to prevent plugging. The oversize was saved and subsequently added into the first grind. |
| | | |
| • | The ~20 kg test samples were processed through a 3” Laboratory Knelson Concentrator at a fluidization water flow rate of ~3.5 litres/min and at 60Gs. |
| | | |
| | • | During the test, sub-samples of the tailings stream were collected for assays. |
| | | |
| | • | At the end of the concentration stage, the concentrate was washed from the inner cone of the KC-MD3. |
| | | |
| | • | The concentrate was panned to produce a pan concentrate and pan tailings (middlings) sample. |
| | | |
| • | The concentrate and tailings samples were labelled, dried, weighed and sent to an independent local lab for assaying. |
| | | |
| | • | The tailings were re-ground two more times and steps 3 to 6 were repeated after each grind. |
| | | |
| • | During the final stage, an additional 2 kg sample of the tails was sub-sampled, dried and sent for cyanide leach test work. |
| | | |
| | • | The remaining tails samples are being stored at the test facility. |
This testing scheme is based on the philosophy that progressive size reduction allows the determination of gold liberated at finer grinds without over-grinding and smearing coarse gold present in the initial sample.
Results indicate that the No. 1 Vein crown pillar samples have a very high gravity-recoverable gold content of 91.2% with a back-calculated head grade of 20.0 g/t Au. The overall mass pull to the concentrate was 1.4% . The results indicate that the gold is fairly liberated in this particular material and is readily recoverable. Visible gold was observed in all final concentrate samples.
Cyanide leaching was performed on sub-samples of the final GRG test tails.
The gold recoveries from leaching ranged from 93.5% to 95.4% . When the leach recoveries are combined with the gravity stage recoveries, the overall recoveries exceed 99% for all samples. The final tailings assays were very low ranging from 0.09 to 0.11 g/t Au. Based on the encouraging bench scale GRG test results on the No. 1 Vein crown pillar it was decided to commission the construction of a 225 tonne per day (~250 t/d) extreme gravity gold mill at Pickle Crow.
2016 Annual Information Form – Page 59
The concept of “extreme gravity” is a series of innovations that have resulted in a reintroduction of gravity recovery systems into the milling operations of most gold mines. Traditionally, most gold milling circuits are designed around flotation and cyanidation requirements, with the gravity circuit being fit in where possible. Extreme gravity takes the approach of optimizing the circuit in order to maximize recovery by gravity. In some cases gravity systems can achieve high enough recoveries to eliminate the need for chemical systems such as cyanidation and flotation.
The benefits of extreme gravity include relatively low capital costs compared to conventional gold mills, reduced permitting, short project lead time, and much reduced environmental issues with no use of cyanide or other chemicals. In addition small plants can be modular and easily moved between locations.
Pickle Crow Tailings Bench Scale GRG & Leaching Test work: In September 2001, a composite sample from Tailings Area 1 was submitted to Lakefield Research of Lakefield, Ontario for cyanide leach test work. The sample, a blend of oxidized (10%) and unoxidized (90%) tailings, was leached for 48 hours. In May-June, 2002, a set of two approximately 8 kg composite samples from Tailings Area 3 were subjected to ‘gravity recoverable gold’ and cyanide leach test work. Composite A was made up of auger drill hole sample material assaying >0.3 g/t Au and composite B material assaying <0.3 g/t Au. The GRG test work was performed by the Knelson Research and Testing Centre in Langley, British Columbia and leach tests were conducted at Accurassay of Thunder Bay, Ontario.
We have completed no additional metallurgical test work as of this date.
Mineral resource estimates
The resource estimate in the Pickle Crow Technical Report represents the first mineral resource estimate on the Pickle Crow Property that was completed in accordance with NI 43-101. The Pickle Crow project resource estimate is divided into three distinct areas within the core mine trend comprising three mineralization styles, high grade narrow veins, iron formation-hosted and alteration-shear zone-hosted gold mineralisation.
The mineral resources were estimated using kriging, where variograms could be modelled, and inverse distance cubed interpolation elsewhere. Based on the use of historic drilling and the somewhat imprecise modelling of the underground workings, the resources have been classified as inferred under the CIM guidelines. The resources were reported using a Whittle optimized pit shell or at underground cut-off grades.
The resulting estimate of inferred mineral resources for the Pickle Crow project is presented in Table A below.
Table A - Estimated Inferred Mineral Resources for the Pickle Crow Project
Pickle Crow
Mine | Category | Grade (g/t Au) | Tonnes | Contained
Ounces | Cut-off Grade
(g/t Au) | Percentage of
Total Ounces |
| Total | Underground | 5.4 | 6,522,000 | 1,136,000 | 2.25* | 90 |
| Total | Open Pit | 1.1 | 3,628,000 | 126,000 | 0.35 | 10 |
| Grand Total | | 3.9 | 10,150,000 | 1,262,000 | | |
* Represents a combination of potentially bulk mineable underground resources (2.0 g/t Au cut-off) and cut-and-fill underground resources (2.8 g/t Au cut-off, with vein intersections diluted to a minimum of 1 m).
Notes:
| | 1. | The mineral resource estimate is entirely classified as inferred mineral resources. |
| | | |
| | 2. | CIM Definition Standards were followed for mineral resources. |
| | | |
| | 3. | The cut-and-fill (high-grade vein) underground component of the mineral resource has been estimated at a cut-off grade of 2.8 g/t Au over a minimum width of 1 m. Vein widths less than 1 m were diluted to 1 m prior to application of the 2.8 g/t Au cut-off grade. Grade and tonnes for the cut-and-fill component of the mineral resource are reported as diluted grade and tonnes. |
| | | |
| | 4. | The long-hole bulk underground (moderate-grade) component of the mineral resource has been estimated at a cut-off grade of 2.0 g/t Au. |
| | | |
| | 5. | The open pit (low-grade) component of the mineral resource has been estimated at a pit discard cut-off grade of approximately 0.35 g/t Au, using a preliminary Whittle pit shell to constrain the resource estimate and other assumed pit parameters. |
| | | |
| | 6. | The open pittable mineral resource extends to a depth of approximately 150 m below surface. Only mineralization located within the pit shell has been reported at open pit cut-off grades. |
2016 Annual Information Form – Page 60
| | 7. | The mineral resource has been estimated using a gold price of US$1,100/oz. |
| | | |
| | 8. | High-grade assays have been capped. Each domain was capped with respect to their unique geology and statistics. Caps for cut and fill (high-grade vein) underground resources range from 35 g/t to 145 g/t Au. |
| | | |
| | 9. | Specific Gravity (bulk density) of 3.14 t/m3was used for BIF and 2.70 t/m3was used for veins. |
| | | |
| | 10. | The mineral resource was calculated via block model. Three dimensional wireframes were generated using geological information. A combination of kriging and inverse distance estimation methods were used to interpolate grades into blocks of varying dimensions depending on geology and spatial distribution of sampling. |
| | | |
| | 11. | Mineral resources that are not mineral reserves do not have demonstrated economic viability. There is currently insufficient exploration to define these inferred resources as an indicated or measured resources and it is uncertain if further exploration will result in upgrading them to an indicated or measured resource category. |
| | | |
| | 12. | Mineral resources have been adjusted for mined out areas. Small rib and sill pillars around old stopes have not been considered. |
| | | |
| | 13. | Numbers may not add due to rounding. |
Considering that a combination of current drilling, historic drilling and underground chip samples were used in the resource estimation, no particular common sample grid exists. There also exists a known minor error in terms of sample location and the accuracy of the digitized underground workings. However, even though these known inaccuracies exist, the grade and tonnage discrepancy caused by this margin of error is within reasonable doubt for an inferred resource and the estimate is reported as such.
Recent activities
In November 2016 we commenced a diamond drilling program at our Pickle Crow Project with a focus on identifying new high-grade vein gold mineralization. In February 2017, we announced the results of this exploration drilling program. A total of nine holes comprising approximately 1,300 m were drilled.
The drill program targeted several shallow, high-grade vein and banded iron formation hosted targets in the core mine trend. The objective of the program was to test extensions of known vein zones and discover new high-grade gold mineralization.
Highlights of Fall 2016 Drilling at Pickle Crow:
| • | Hole PC-16-306 intersected 1.28 g/t over 12.70 m including 15.14 g/t over 0.70 m in the middle vein zone of the No. 15 Vein. |
| | | |
| | • | Visible gold was intersected in Hole PC-16-306 in the lower vein zone of the No. 15 Vein. |
Gold mineralization was encountered in seven of the nine drill holes and visible gold was intercepted in the lower most vein zone of the No. 15 Vein structure. A 0.30 m section of drill core from the lower vein zone which included the visible gold was not assayed as it was retained for display purposes, hence the reported intercept of 1.15 g/t gold over 8.19 m excludes this interval and the 0.30 m section was included at zero grade.
2016 Annual Information Form – Page 61
Drill Hole Intercepts from Fall 2016 Drilling at Pickle Crow:
| Hole ID | Area | Description | From (m) | To (m) | Interval (m) | Au g/t |
| PC-16-302 | Shaft 3 (No. 19 Vein up dip) | No Significant Assays | | | | |
| PC-16-303 | Shaft 3 (PC-103-083 Vein up dip) | No Significant Assays | | | | |
| PC-16-304 | Albany (PC-09-051 Vein) | Shear zone | 106.5 | 107.0 | 0.5 | 1.57 |
| PC-16-304 | | Zone, QFP | 129.0 | 135.7 | 6.7 | 0.36 |
| PC-16-304 | | Including | 133.5 | 134.7 | 1.2 | 1.18 |
| PC-16-305 | Albany (PC-09-051 Vein) | Zone, Vein | 53.3 | 53.8 | 0.5 | 1.62 |
| PC-16-305 | | Zone, QFP & MV | 125.6 | 149.4 | 23.8 | 0.53 |
| PC-16-305 | | Including | 137.1 | 140.1 | 3.0 | 2.53 |
| PC-16-305 | | Zone, QFP | 160.9 | 162.0 | 1.1 | 0.71 |
| PC-16-306 | No. 15 Vein | Upper No. 15 Vein | 71.3 | 78.0 | 6.7 | 0.59 |
| PC-16-306 | | Including | 74.3 | 75.0 | 0.7 | 3.53 |
| PC-16-306 | | Middle No. 15 Vein | 82.0 | 94.7 | 12.7 | 1.28 |
| PC-16-306 | | Including | 83.2 | 84.4 | 1.3 | 1.20 |
| PC-16-306 | | Including | 88.8 | 89.5 | 0.7 | 15.14 |
| PC-16-306 | | Including | 92.0 | 93.0 | 1.0 | 1.72 |
| PC-16-306 | | Lower No. 15 Vein | 110.4 | 118.6 | 8.2 | 1.15 |
| PC-16-306 | | Including | 113.0 | 114.0 | 1.0 | 2.66 |
| PC-16-306 | | Including | 116.0 | 117.8 | 1.8 | 2.63 |
| PC-16-307 | Crowshore | Zone, BIF | 34.7 | 37.2 | 2.5 | 0.34 |
| PC-16-307 | | Shear zone | 96.4 | 98.0 | 1.6 | 0.51 |
| PC-16-307 | | Shear zone | 101.9 | 103.3 | 1.4 | 0.70 |
| PC-16-308 | Crowshore | Zone, BIF | 20.1 | 21.4 | 1.3 | 0.28 |
| PC-16-309 | No. 15 Vein | Upper No. 15 Vein | 86.6 | 90.1 | 3.5 | 0.14 |
| PC-16-309 | | Shear zone | 106.1 | 108.6 | 2.5 | 0.58 |
| PC-16-309 | | Shear zone | 115.0 | 121.4 | 6.4 | 0.12 |
| PC-16-310 | Sawmill Vein | Zone, BIF | 37.5 | 42.0 | 4.5 | 1.34 |
| PC-16-310 | | Zone, BIF | 49.0 | 52.5 | 3.5 | 0.34 |
All assays were performed by Accurassay Laboratories of Thunder Bay, Ontario. Samples were analyzed by using 50 g fire assay with an atomic absorption finish. Samples greater than 10 g/t or with visible gold were analyzed by 1,000 metallic analysis with a gravimetric finish. All assays reported are uncut. Reported widths are drilled core lengths, and true widths are unknown at this time. Accurassay Laboratories is independent of First Mining and has no relationship with First Mining.
QA/QC Procedures
NQ diameter (47.6 mm) drill core was logged then sawn in half on-site, with one half bagged and labelled and the other half placed in core boxes to serve as a permanent record and stored in a secure on-site facility. All samples were shipped from the site via Manitoulin Transport to the Accurassay Laboratories facility in Thunder Bay, Ontario, for crushing, pulverization and pulp preparation. Accurassay Laboratories is independent of First Mining and has no relationship with First Mining.
All samples sent for analyses were prepared using a jaw crusher, which is cleaned with compressed air between samples, resulting in 70% of the sample passing through a 10 mesh screen. A 1,000 g split of the crushed sample was then pulverized with 85% passing through a 200 mesh screen. Fire assays were performed using 50 g of sample with assays equal to or greater than 5 g/t calculated gravimetrically, and lower grade samples measured by atomic absorption (AA). All samples greater than 10 g/t were additionally sent for screen metallics analysis using the remainder of the pulp (~950 grams of sample). Blanks, standards (one high-grade, one mid-grade, and one low-grade), field duplicates (1/4 split cores), and crush duplicates were inserted into the drill core samples sequentially, at least every 8th sample, before shipment. Standards consisted of a high-grade (~13 g/t Au), a mid-grade (~5 g/t Au), and a low-grade (~1 g/t Au) gold standard from Geostats Pty. Ltd. of Fremantle, Western Australia, as well as blanks from Nelson Granite of Kenora, Ontario.
2016 Annual Information Form – Page 62
Hope Brook
Technical report
This description of the Hope Brook Property project (the “Hope Brook Project”) is based on the project’s technical report:2015 Mineral Resource Estimate Technical Report for the Hope Brook Gold Project, Newfoundland and Labrador, Canada(effective date January 12, 2015, report date November 20, 2015) (the “Hope Brook Technical Report”). The report was prepared for us in accordance with NI 43-101, by or under the supervision of Michael P Cullen, P.Geo.; a qualified person within the meaning of NI 43-101. The following description has been prepared under the supervision of Chris Osterman, P.Geo. who is a qualified person within the meaning of NI 43-101, but is not independent of us.
The conclusions, projections and estimates included in this description are subject to the qualifications, assumptions and exclusions set out in the Hope Brook Technical Report, except as such qualifications, assumptions and exclusions may be modified in this AIF. We recommend you read the Hope Brook Technical Report in its entirety to fully understand the project. You can download a copy from our SEDAR profile (www.sedar.com), or from our website (www.firstminingfinance.com).
Property description, location and access
The Hope Brook Project is located on the southwest coast of the island of Newfoundland, in the province of Newfoundland and Labrador, Canada. It is comprised of a core holding of 993 contiguous exploration claims acquired through map staking and issued in 2003 and 2008. This main property covers 24,825 ha of surface area and measures approximately 32 km by 12 km in maximum east-west and north-south dimensions, respectively. Constituent claims are held under 7 separate licenses and the property is approximately centered on the past-producing Hope Brook gold mine, located at Latitude 47.738° north and Longitude 58.095° west. An additional 63 claims (1575 ha) are held by us in the Peter Snout area, approximately 25 km northeast of the Hope Brook deposit and 10 claims (250 ha) in the Cross Gulch area, approximately 6 km north of the deposit. These were staked in late 2013 and early 2015, respectively, to cover areas of exploration potential defined through review of government assessment reporting records.
The Hope Brook Project is located approximately 85 km by water east of the community of Port aux Basques and is not accessible by any form of highway transportation at this time. Direct site access to the Hope Brook Project can be gained by chartered boat from either the Burgeo or Port aux Basques areas and could also be gained through small boat charter from La Poile, after travel to that community on the coastal service vessel. The most efficient means of current access to the property is by charter fixed wing aircraft or helicopter from commercial bases in the Deer Lake- Pasadena area, approximately 120 km to the north.
Coastal Gold earned a 100% interest in 993 claims of the original Hope Brook Project property by fulfilling requirements of an option to purchase agreement dated January 25, 2010.
As of the date of the Hope Brook Technical Report, two exploration permits by the government of Newfoundland and Labrador were required for bedrock core drilling and vibracore tailings drilling programs as well as geochemical and geophysical surveys, valid until April 15, 2015 and June 17, 2015, respectively. It is anticipated that new permits will be required if we chose to initiate certain site-based aspects of the Phase I or Phase II work programs recommended in the Hope Brook Technical Report. In addition, the License to Occupy for the Hope Brook exploration camp was being reviewed by government at the effective date of the Hope Brook Technical Report, with timely issuance expected. No substantive difficulties have been encountered to date with respect to procurement of required Exploration Permits and camp occupancy permissions.
A 2% net smelter returns royalty payable applies under terms of a royalty pre-payment schedule of $20,000 per year. All royalty pre-payment funds provided under the agreement are to be accounted for against future production. We retain a right during the term of the agreement to purchase one half of the 2% NSR royalty for $1,000,000.
Annual work requirements for each claim are set out under the province’s Mineral Act and range from $200 per claim in year one to $1,200 per claim in years 16 through 20. In addition, a renewal fee of $25 – $100 is payable for each claim on a five year basis.
2016 Annual Information Form – Page 63
As part of the 2011 work program a screening level assessment of baseline environmental conditions was carried out at the Hope Brook Property. Results of this study showed that a number of chemical impacts that are residual to the former mining operation are present locally. These include elevated metal levels in soil, sediment and water as well as elevated petroleum hydrocarbon levels in soil. The most significant liabilities were deemed to be associated with subsurface conditions where impairment to both soil and groundwater had occurred around existing landfill sites, the heap leach pad, and within the underground mine workings. All of these conditions pre-date Coastal Gold site activities and therefore we are excluded from associated liability. However, if a new mining venture is established at this site it will be necessary to fully quantify the potential impacts of such conditions on site development, mining and site decommissioning and reclamation plans for the new operation. All such issues would be dealt with under the mine permitting and associated environmental approval processes.
History
Documentation of Hope Brook Project area’s history of exploration and mining spans the period between 1923 and the present day, but modern programs directed toward assessment of gold potential and related mining have only occurred since discovery of the Hope Brook gold deposit in 1983.
Programs of deposit definition drilling, resource estimation, metallurgical assessment and feasibility assessment were completed for the Hope Brook deposit between 1984 and 1986 and a production decision was announced in 1986. The deposit was subsequently developed and mined during the period of 1987 through 1991. The production decision appears to have been supported by initial resources of 11.2 million tonnes grading 4.54 g/t Au above a 2.5 g/t Au cutoff (~1.6 million troy ounces) that were reported. Additionally, the same tonnage and gold grade was separately reported for the deposit but additionally specified a 0.3% copper parameter.
Mining from both open pit and underground operations was ultimately carried out between 1987 and 1997. Provincial government records document production of 304,732 ounces of gold during the 1987-1991 period from all operations. Difficulties with elevated cyanide and copper levels were encountered in processing plant effluent during the operating period and this may have contributed to cessation of mining and milling in early 1991.
During the 1987-1991 mining period, detailed exploration focus was largely restricted to the mine area and adjoining advanced argillic alteration zone (“AAZ”) areas to the southwest, with particular attention paid to assessment of possible strike and dip extensions of the main deposit.
From 1991 to mid-1997, underground mining at the site was carried out. Operations ceased in mid-1997. Production of 447,431 ounces of gold was recorded during the 1992-1997 period. Re-assessments of past exploration programs was carried out in both the mine area and surrounding district and follow-up exploration on several promising areas not associated with the AAZ and the Hope Brook deposit trend was completed. No substantial new discoveries were made during this period.
During the period 2002 through 2007 the provincial government carried out environmental assessment and reclamation programs at the Hope Brook mine site. No mining activities have been carried out subsequent to those of carried out from 1991 to 1997.
No drilling-based exploration programs were completed on the Hope Brook Project through the period 1997 through 2007. However, in 2003 mine area exploration holdings were staked by related entities.
Beginning in 2008, an airborne magnetometer and electromagnetic survey of the entire property was carried out, past drilling results were compiled, prospecting was carried out and an extensive bedrock sampling program was completed. Sampling was substantially focused in an area immediately northwest of the Hope Brook open pit where alteration zone and silicified zone units occurring structurally below the mined Hope Brook deposit had been exposed during removal of acid generating waste rock during the site reclamation program. No substantial new discoveries resulted from any of this work.
Since the start of exploration work in 2010, Coastal Gold carried out programs of drill core physical properties investigation, ground geophysics, environmental screening, data compilation, data validation, core drilling, vibracore tailings drilling, bedrock and tailings mineral resource estimation, metallurgical assessment and general property evaluation.
2016 Annual Information Form – Page 64
From April 2010 through December 2014, Coastal Gold completed systematic gold exploration programs, primarily focused in the area surrounding the past producing Hope Brook mine.
Geological setting, mineralization and deposit types
The Hope Brook Property occurs within a tectonically complex zone that has been interpreted by some to occur within the Avalon Zone of the Appalachian Orogen (or a related Avalon Composite Terrane), near its generally east-west trending tectonic contact with adjacent rocks of the Dunnage Zone. The Avalon Zone represents a late Neo-Proterozoic assemblage of active plate margin sequences that accumulated prior to development and closure of the Lower Paleozoic Iapetan Oceanic system. Sequences of Avalonian affinity occur throughout much of the Appalachian Orogen, and extend from the Avalon Peninsula and southwest coast areas of Newfoundland, through Nova Scotia, New Brunswick and northern New England. From that point southward, more discontinuously distributed outcropping segments occur as far as northern Georgia and subsurface extensions are interpreted to be present in Florida. Onshore exposures of confirmed Avalon Zone affinity are limited in comparison with its interpreted width of at least 600 km in the eastern offshore area of Newfoundland and Labrador.
The geological aspects of the Avalon Zone, particularly in context of magmatic history represented in the Newfoundland, consist of four major tectono- stratigraphic events. Most significant of these from the perspective of magmatic activity is the period when substantial volumes of volcanic and plutonic rocks evolved under back-arc or continental arc settings, sometimes in broad association with terrestrial or marine siliciclastic sequences. These are related in time with development of auriferous, high level hydrothermal alteration systems along the entire length of the Avalon Zone and the Hope Brook gold deposit may be an example of this metallogenic association.
The Hope Brook gold deposit and associated AAZ are of primary importance with respect to the Hope Brook Project. However, several other bedrock gold occurrences are present within the Hope Brook Project that differ from Hope Brook. The most prominent examples of such are those in the Old Mans Pond, Phillips Brook and Cross Gulch areas. Each of these areas has been investigated through historic exploration programs that typically included geological, geophysical and geochemical surveys, surface trenching and limited amounts of core drilling. Drilling has locally confirmed subsurface gold-bearing intervals in each area but mineralized zones of economically significant proportions have not been defined to date. The Hope Brook style of mineralization is considered to be most important. The Hope Brook gold deposit is a large, disseminated gold-chalcopyrite-pyrite deposit hosted by highly altered sedimentary and volcano-sedimentary rocks of the late Proterozoic Whittle Hill Sandstone and Third Pond Tuff successions, similarly altered felsic porphyry dikes and sills related to the Roti Intrusive Suite and variably altered later mafic dikes and sills. Zones hosting gold mineralization of economic interest typically bear evidence of intense silicification and occur within the AAZ, a broad envelope of advanced argillic alteration that can be traced for up to 8 km southwest of the deposit.
The Hope Brook gold deposit is currently one of the largest gold deposits in the Canadian Appalachians, based on historic resources and production. As noted earlier, it occurs within a zone of extensive AAZ hosted by late Proterozoic sedimentary, volcanic and intrusive rocks. Recent work by Coastal Gold has added to the technical documentation of alteration and mineralization that characterize the deposit. Intense hydrothermal alteration and spatially associated silicification have been identified as key components of the mineralizing system that gave rise to the deposit. However, differences exist with respect to interpreted placement of the Hope Brook mineralizing system in the time/space context of the orogeny and some of these bear directly on deposit classification.
In addition to the Hope Brook deposit, several gold occurrences associated with Silurian or younger sericitic alteration, quartz veining and silicification have also been documented within the Hope Brook Project area. None of these is substantial in size or gold grade as presently defined, but spatial association with the large Bay d’Est Fault or its secondary splays, and possibly with Silurian magmatic activity, indicates that potential for more significant mineralization is present.
Exploration
No new exploration work has been undertaken to date by us on the Hope Brook property. The Hope Brook Technical Report and associated mineral resource estimate review reflect the first NI 43-101 technical reporting by us for the Hope Brook property.
2016 Annual Information Form – Page 65
Drilling
Between September 2010 and October 2013, Coastal Gold completed in five separate drilling programs 139 diamond drill holes and drill hole extensions on the Hope Brook Property that total 39,320.4 m of drilling.
Coastal Gold completed 10 surface diamond holes totalling 3,421.9 m in length between September 2010 and January 2011 which successfully confirmed the presence of disseminated gold-chalcopyrite-pyrite mineralization hosted by highly silicified sedimentary and volcano-sedimentary rocks both at depth, below the 4800 level of historic mining, and at surface to the southwest of the historic open-pit. An exploratory drill hole targeting mineralization along the northeast extension of the mine at depth returned no significant results and an exploratory drill hole targeting the 240 Zone caved short of the target.
Another surface drilling campaign was completed between February 2011 and December 2011 that consisted of 67 holes totalling 21,350.5 m. The program was successful in demonstrating continuity of disseminated gold-chalcopyrite-pyrite mineralization hosted by highly silicified volcano-sedimentary rocks in all three targeted areas of drilling and provided the drill hole density required for resource estimation.
Between February 2012 and May 2012 Coastal Gold completed a surface drill program that consisted of 15 holes, re-drills and hole extensions totalling 4,549 m in length. This program focused on confirming the locations of workings and major pillars in the mine area, further testing of the Southwest Extension target area and preliminary testing of the Northeast target area.
The fourth Hope Brook drilling program by Coastal Gold began on November 3, 2012 and was completed on December 21, 2012. A total of 5,923.9 m of drilling in twenty-one drill holes were completed. Six separate targets areas, along a 3.4 km long mineralized trend, were drilled during the program including the Stope 4960-150, the 240 Zone – Mine Zone Connector Target, the Chetwynd Prospect and the Chetwynd South Prospects, the Chetwynd to 240 Connector Target and the NW Target Area. The drilling was completed in these areas in order to continue to expend on the area of known gold mineralization outside of the current Hope Brook Deposit area.
The fifth drill program at the Hope Brook Property began on August 9, 2013 and was completed on October 10, 2013. A total of 4,075.2 m of drilling in twenty-six drill holes were completed. The drill program was designed to test two major target areas; the Footwall Target and SW Pit Extension Target.
A systematic vibracore tailings drilling program on two tailing ponds at the Hope Brook site was carried out during the September through October period of 2013 and a total of 73 vibracore drill holes totalling 155 m were completed on an approximate 100 m square grid over the two tailings ponds. The purpose of the program was to evaluate the thickness and gold grade of the tailings and to provide sufficient data to support a NI 43-101 compliant mineral resource estimate of the contained gold and copper. Of the holes completed, 51 successfully sampled tailings, with thicknesses of the tailings sections ranging from 0.3 to 6.0 m. Average thickness of cored tailings was 3.0 m.
Sampling, analyses and data verification
Coastal Gold staff members were responsible for arranging transport of core boxes from the drilling sites to the company’s secure core storage and logging facility located at the Hope Brook camp. The core was initially examined by core technicians and all measurements are confirmed. Core was then aligned and repositioned in the core box where possible and individual depth marks are recorded to facilitate logging. Core technicians photographed all core, measured core recovery between core meterage blocks, carried out water immersion specific gravity measurements as required and recorded information on hard copy data record sheets that were then entered into the project drilling database.
All paper copy and digital information for each hole, including quick logs, sample record sheets and assay certificates were maintained in a secure filing system at the site to provide a complete archival record for each drill hole. Digital information was stored on a local server as well as on the company’s secure off-site server that was accessible by satellite link from the camp facility. Subsequent to logging and processing, down hole lithocoded intervals, sample intervals and drill hole collar and survey information that were entered into the digital database were checked for completeness before being uploaded to the project database upon which drilling section generation and three dimension deposit modeling were based.
2016 Annual Information Form – Page 66
The secured plastic sample bags were grouped in batches 40 to which QA/QC program samples were added prior to final packing for shipment to the ALS preparation laboratory in Sudbury, ON. Samples were transported from the site by aircraft or chartered boat and then delivered to a commercial transport service for final delivery to the laboratory. Sample shipment change of custody forms were used to list all samples in each shipment and laboratory personnel crosschecked samples received against this list and reported any irregularities by fax or email to Coastal Gold.
Primary project analytical work was completed by ALS with preparation taking place at ALS’ Sudbury, ON facility and subsequent analysis at the facility in Vancouver, BC. ALS is an internationally accredited laboratory with National Association of Testing Authorities certification and also complies with standards of ISO 9001:2000 and ISO 17025:1999. The laboratory utilizes industry standard analytical methodologies and rigorous internal Quality Assurance and Quality Control (“QA/QC”) procedures for self-testing.
All Hope Brook Project core samples were weighed upon receipt at the ALS preparation laboratory and prepared using ALS preparation procedure PREP-31B that consists of crushing the entire sample to >70% -2 mm, then splitting off 1 kg and pulverizing it to better than 85% passing 75 microns size. The coarse reject materials from this processing were stored for future use.
Gold concentrations for submitted core and rock samples were determined by ALS using a 50 g sample split and fire assay pre-concentration methods followed by atomic absorption spectroscopy finish (FA-AAS). This is reflected in ALS code Au-AA24. A 33 element analysis was also completed on selected samples by method code ME-ICP61 which denotes four acid digestion followed by inductively coupled plasma – atomic emission spectroscopy (ICP-AES) analysis.
Drill core sampling carried out by Coastal Gold during the September 2010 through July 2012 period on the Hope Brook Property was subject to a QA/QC program administered by Coastal Gold. This included submissions of blank samples, use of certified reference materials and analysis of pulp and coarse reject check sample splits at a third party commercial laboratory.
The 2012 piston sampling program and 2013 vibracore drilling program of historic Hope Brook Property mine tailings deposits were also subject to a systematic QA/QC program carried out by Coastal Gold.
All of the drill core programs for the period from October 2012 through to November 2013 were subject to essentially the same QA/QC protocols as had been applied to the earlier core drilling campaigns referred to above. This included systematic submission of blank samples, use of certified reference materials and analysis of pulp and, for core, coarse reject check sample splits at a third party commercial laboratory. Results of both the in-house and laboratory quality control and assurance analyses were monitored by Coastal Gold on an on-going basis and were also made available for review by Mercator Geological Services Limited (“Mercator”). A QA/QC protocol was also established for the vibracore drilling program and this included systematic analysis of certified reference materials, duplicate sample splits, blank sample materials and analysis of third party pulp split check samples.
The drill core samples were packaged in batches of 40 samples, which included one blank sample (10th sample), one pulp duplicate (20th sample), one certified reference material sample (30th sample) and one coarse reject duplicate sample (40th sample). ALS provided primary analytical services for the project while pulp duplicate (20th sample) and coarse reject duplicate (40th sample) splits were analyzed at SGS to provide independent laboratory check sample data sets. SGS is a commercial, ISO certified laboratory independent of Coastal Gold.
After standard crushing and pulverization of bedrock core samples, gold analysis was by atomic absorption methods after fire assay pre-concentration and multi-element determinations were by inductively couple plasma - optical emission spectroscopy methods after four acid total digestion. One certified reference material sample and one blank sample were included in the core sample shipment. The tailings samples were separately processed from the core samples and were also accompanied by one certified reference material sample and a blank sample. Results of the QA/QC program for these samples were acceptable.
Core sample records, lithologic logs, laboratory reports and associated drill hole information for all drill programs completed were digitally compiled by Coastal Gold staff and made available for previous resource estimation purposes. Information pertaining to the exploration history in the property area had already been compiled by Mercator and was reviewed in conjunction with newly generated records to assess completeness, consistency and validity of compiled results. This progressively compiled and validated information is acceptable for resource estimation purposes.
2016 Annual Information Form – Page 67
Database records for previously validated historic drill holes were modified by Coastal during 2013 through addition of copper analytical data recovered from archival records. All such amendments were checked against source documents by Mercator and through spot checks by AGP prior to use in the current resource estimation program and no errors were noted.
In addition to the above, records for 47 new diamond drill holes completed by Coastal Gold during 2012 and 2013 were reviewed and validated by Mercator for addition to the project database and used in the previous and current resource estimation programs. Digital records were checked against original source documents provided by Coastal Gold and both consistency and accuracy of such records were assessed. Parameters reviewed in detail include collar coordinates, down hole survey values, hole depths, sample intervals, assay values and lithocodes. All 47 of the 2012 and 2013 holes completed by Coastal Gold were checked for correlation of sample interval, assay value and lithocode information against source documents. This review showed consistently good agreement between original records and digital database values for all data sets.
In 2013, Coastal added 152 historical short core holes (“OP” series holes) to the project database. These holes have not been validated by Mercator and were excluded from use in the previous and current resource estimates. After completion of manual checking procedures, all drill hole database records were further assessed through digital error identification methods available through the Gemcom-Surpac Version 6.2.1® software. This provided a check on items such as sample record duplications, end of hole errors, survey and collar file inconsistencies and some potential lithocode file errors. The digital review and import of the manually checked datasets provided a validated drill hole database to support the resource estimation program described in the Hope Brook Technical Report.
Coastal Gold completed several core drilling holes during the 2010-2011 drilling programs to serve as twins to historic holes. These were typically planned to provide more complete lithological and assay information for associated historic holes and to provide a basis for comparison of the historic datasets with Coastal Gold data. For the purposes of the Hope Brook Technical Report, 12 Coastal Gold holes that were completed in sufficiently close proximity to historic holes to provide such assessment were selected for comparison with the Coastal Gold data.
For assessment purposes, Mercator reviewed drill log lithocodes and gold assay entries for hole pairs to determine the level of consistency between the two datasets. Assessment of lithocodes focused primarily on identification of important silicified zone intervals associated with gold mineralization and secondarily on logged intervals of mafic dike material. Comparison of the assay data on a sample by sample basis was not typically possible due to either spatial separation of hole traces, differing sample lengths or presence of non-sampled intervals in some holes. Comparison of lithocoded intervals between hole pairs showed that good correlation between data sets exists. However, greater detail in silicic lithocoding characterises the historic dataset prior to re-coding by Coastal Gold.
As noted above, comparison of assay values between hole pairs was affected in some instances by presence of un-sampled intervals within the historic holes that contrast to continuously sampled Coastal Gold intervals, by differing mafic material percentages and by differing interpreted assay zone widths. Mercator focused on gold assay data within the gold-bearing silicified zone lithologic units and created weighted average intervals to support comparison. Results of this program for the 12 holes considered showed that spatial definition of the gold zones based on assay boundaries is typically consistent between hole pairs and this is reflected in generally comparable intercept lengths selected.
The weighted average Coastal Gold data set results are typically higher than equivalent intervals in historic holes but the reverse is also seen in some cases. Mercator believes that several factors contribute to this result, including changes in mafic dike dilution between holes, higher overall core quality of the NQ and BQTK size Coastal Gold core relative to the historic BQ core, and higher overall core recovery for Coastal Gold holes in fractured intervals of the mineralized zone. Heterogeneity of primary gold distribution is also a potential contributor.
Based on results of the twin hole comparison originally carried out in support of earlier resource estimates, at the effective date of the Hope Brook Technical Report Mercator remains of the opinion that acceptable consistency exists between these hole pairs with respect to gold assay value and lithocode data sets.
2016 Annual Information Form – Page 68
Mineral processing and metallurgical testing
Scoping level metallurgical test work on mineralized samples was first carried out for Coastal by G&T Metallurgical Services Ltd. (“G&T”) in Kamloops, BC in 2012. The objectives of that program were to evaluate potential processing routes for maximizing gold recovery and to identify operating parameters for the preliminary circuit design. Flotation test work was successful at generating a concentrate grading 28% Cu from flotation of cyanidation residue in a process similar to the historical flowsheet at Hope Brook. Gravity concentration tests indicated that between 16 and 41% of the contained gold was recoverable to concentrate by this method. Combined gold recoveries of ~86% were achieved using a flowsheet consisting of gravity concentration followed by cyanidation of the gravity tailings. Direct cyanidation of tailings resulted in up to 49% extraction of contained gold.
Additional metallurgical testing was carried out by G&T in the fall of 2013 to further advance the understanding of the metallurgy of the Hope Brook deposit. This included batch flotation test work focused on the opportunity to recover a saleable grade copper concentrate after the grinding and gravity recovery step. Scoping level test work was also carried out at Tomra Sorting Solutions in Surrey, BC to evaluate the potential of rejecting dilution material before the grinding area using sensor-based sorting. Sorting program results indicated that the mafic dyke dilution was readily distinguished from the mineralized rock using four separate detector systems, indicating that this material is highly amenable to rejection by sorting.
Mineral resource estimates
The mineral resource estimate for the Hope Brook Project is based on a three dimensional block model developed using Geovia – Surpac Version 6.1.1® deposit modeling software and a matrix size of 10 m (X) by 5 m (Z) by 3 m (Y). Grade interpolation utilized multiple pass ordinary kriging methodology with an inverse distance squared check model used for validation. Classification of the resource followed the approach used in the 2014 NI 43-101 mineral resource estimate and was based primarily on interpolation pass number, distance to the closest informing assay composite and kriged variance. The 3 g/t Au cut-off value used is substantially higher than cut off values of Coastal Gold’s previous mineral resource estimates that were focused on optimization of open pit mining scenarios. Current mineral resources are considered to have reasonable potential for economic viability based on application of underground mining methods, historic gold recovery levels that range between 80% and 91% percent for past production (86% for Coastal Gold testing) and a long term gold price of US$1,200 per ounce. This estimate of mineral resources may be materially affected by environmental, permitting, legal, title, taxation, socio-political, metal pricing, marketing, or other relevant issues.
Hope Brook Deposit Mineral Resource Estimate – Effective January 12, 2015
| Gold Grade Cut-off(g/t) | Resource Category | Round Tonnes (Rounded) | Gold Grade(g/t) | Gold Ounces (Rounded) |
3.00 g/t
| Indicated | 5,500,000 | 4.77 | 844,000 |
| Inferred | 836,000 | 4.11 | 110,000 |
Notes:
| | 1. | Includes only Mine Zone and 240 Zone areas. |
| | 2. | The above mineral resource estimate is based on a partial percentage block model with dike material removed. Dike percent is estimated at 18% for the Mine Zone and 0 % for the 240 Zone. |
| | 3. | Gold grades reflect application of domain-specific raw assay capping factors that range between 55 g/t Au and 3 g/t Au. |
| | 4. | Rounding of tonnes as may result in apparent differences between tonnes, grade and contained ounces. |
| | 5. | Mineral resources that are not mineral reserves do not have demonstrated economic viability. The estimate of mineral resources may be materially affected by environmental permitting, legal, title, taxation, sociopolitical, metal pricing, marketing, or other relevant issues. |
| | 6. | The gold cut-off value of 3.00 g/t reflects a reasonable expectation of economic viability based on application of underground mining methods, historic gold recovery levels that range between 80% and 91% percent for past production (86% for Coastal Gold testing) and a long term gold price of US$1,200 per oz. |
2016 Annual Information Form – Page 69
Non-material properties
We also hold a number of non-material mineral properties as part of our mineral bank portfolio. Some of these properties are resource-stage assets which have NI 43-101 technical reports that support resources of less than one million ounces of attributable gold. Others are grassroots exploration projects that host mineralization but have not had sufficient drilling on them to classify resources under the CIM definition standards. A brief summary of these properties is set out in this section.
Canada
Duquesne Gold Project, Québec
We acquired a 100% interest in the Duquesne Gold project located in the Abitibi Region of Québec (the “Duquesne Project”) through our acquisition of Clifton Star in April 2016. The Abitibi Region of Québec is one of the most prospective and productive mineral regions in Canada with more than 100 years of continuous mining history and hosts a number of major Canadian mines.
The property, which comprises 55 contiguous mining claims and one mining concession, covers an area of 936 hectares and is situated along the Destor-Porcupine Break, which boasts historical production of 192 million oz. Au. It is approximately 30 km northwest of the city of Rouyn-Noranda, and approximately 16 km east of the town of Duparquet, so it has excellent access to infrastructure and a skilled labour pool.
The Duquesne Project hosts an NI 43-101 Indicated Resource of 1.9 Mt grading 3.33 g/t Au, containing 199,000 oz. Au, and an Inferred Resource of 1.6 Mt grading 5.58 g/t Au, containing 281,000 oz. Au. The technical report in support of these resources, entitled “43-101 Technical Report Resource Estimate of the Duquesne Gold Property”, was prepared in accordance with NI 43-101 and was filed on SEDAR by Clifton Star on October 28, 2011 under its SEDAR profile.
Pitt Gold Project, Québec
We purchased a 100% interest in the Pitt Gold project located in the Abitibi Region of Québec (the “Pitt Project”) from Brionor in April 2016. The property, which comprises 24 contiguous mineral claims, covers an area of 384 hectares.
The Pitt Project is close to our Duquesne Project, and to the Duparquet Gold Project located in the Abitibi Region of Québec (in which we hold an indirect 10% interest). It is approximately 35 km north of the city of Rouyn-Noranda, and approximately 7 km east of the town of Duparquet, so it has excellent access to infrastructure and a skilled labour pool.
The Pitt Project hosts an NI 43-101 Inferred Resource of 1,076,000 tonnes grading 7.42 g/t Au (at a cut-off grade of 3.0 g/t Au), containing 257,000 oz. Au. The technical report in support of these resources, entitled “NI 43-101 Technical Report and Audit of the Preliminary Mineral Resource Estimate for the Pitt Gold Project Duparquet Township Abitibi Region, Quebec, Canada”, was prepared in accordance with NI 43-101 and was filed by us on SEDAR on January 6, 2017 under our SEDAR profile.
Duparquet Gold Project, Québec
We have a 10% interest in the Duparquet Gold Project which has a large open-pittable resource.
2016 Annual Information Form – Page 70
Lac Virot Iron Ore Project, Newfoundland
Acquired through our acquisition of Coastal Gold, the Lac Virot Property is located near the town of Labrador City in western Labrador. We own a 100% interest in 4 map-staked licenses with a combined 225 claims covering a total area of 5,625 ha. The Lake Superior-type iron formation (“LSTIF”) occurrences of the Lac Virot area lie in the Labrador-Quebec Fold Belt or Labrador Trough, within the Sokoman Formation of the Lower Proterozoic (Aphebian) Knob Lake Group. The project is in a strategic location surrounded by four iron ore mines in the Southern Labrador Trough, and is close in proximity to power, a multi-use railway and a deep sea port. A total of 11,713 m was drilled in 42 holes during 2012 which focused on high priority targets previously outlined by a 882 km gravity survey.
Horseshoe Island Gold Project, Ontario
Acquired through our acquisition of Gold Canyon, we hold a 100% interest in the Horseshoe Island Gold Project, situated in the Archean Birch-Uchi greenstone belt, and within the prolific Red Lake Mining District of northwestern Ontario. The project is comprised of 14 claims covering 2,088 hectares. Gold Canyon previously completed an extensive MMI survey which displayed that elongate, shear-related gold anomalies are widespread and may be scattered along the entire 7 km length of the property. The surveys also produced copper and zinc anomalies in VMS favorable environments. Historic drilling has indicated the presence of nickel, platinum, and palladium in a layered gabbro intrusive. The project has a long exploration history during which time 24,138 m of drilling has been completed.
Mexico
Miranda, Sonora
The Miranda gold property consists of three claims; Miranda, Miranda 1 and La Arena covering 16,035 hectares in the Sonoran Desert within a structural corridor called the Sonora- Mojave megashear (“SMM trend”).
The SMM trend hosts several operating gold mines and deposits, some of which exceed 10 million ounces of gold such as Herradura-Dipolos in western Sonora, Mexico, and other smaller deposits; Mesquite (7 Moz. Au) and Picacho in Arizona, and Chanate, San Francisco, and La Choya in Sonora, Mexico. The Miranda property lies in the south-central part of the SMM trend, adjacent to the San Felix and El Antimonio mining districts on the south and east respectively. Miranda covers multiple prospects and gold occurrences including the inactive mines La Fortuna and El Gigio (internal claims which do not belong to First Mining). Additionally, the property exhibits structures and lithologies favorable for the development of large orogenic (mesothermal) ore deposits similar to those occurring along the SMM trend. During 2015, 151 rock chip samples were taken and analyzed with values ranging between nil and 7.29 g/t Au. Additionally, 3,486 soil samples were collected and analyzed.
Socorro, Sonora
The Socorro property was reduced and separated into fractions in 2015 subject to government approval and now consists of four claims: El Socorro Frac 1, El Socorro Frac 2, El Socorro Frac 3 and Tizoc R1 covering 35,654 hectares. It is a regional gold exploration play with dozens of pits and placer deposits with excellent potential to host both bulk open-pit, heap-leachable deposits as well as high-grade gold in high-angle structures. The southern part of the concession covers the northern extension of the El Chanate mine, while the central and northern portion cover mesothermal gold veins within a regional structure over 10 km long.
Work to date on the property includes interpretation of ASTER images mapping and initial surface reconnaissance.
During 2015, we took 53 rock chip samples on the property with values ranging from nil to 41.0 g/t Au. Additionally, 7,737 soil samples were taken and analyzed.
2016 Annual Information Form – Page 71
San Ricardo, Sonora
The San Ricardo property consists of nine claims, two of which, San Ricardo and San Ricardo 2, cover 50 hectares and an existing small mine that was acquired by KCP through an option agreement in 2013. The remaining seven claims: Teocuitla, Teocuitla 2, Teocuitla 4, Angel, Tlaloc, Tlaloc 2 and Aztlan cover 37,350 hectares, and were staked by us between 2009 and 2011. Mineralization on the property is epithermal in nature and has not been constrained along strike or depth by drilling.
All underground workings on the San Ricardo vein system were opened up and saw sampled, and several hundred metres of trenches were excavated and sampled. Subsequently, 14 diamond drill-holes were drilled on the property to test two veins, the Santa Cruz and Mina Antigua, at shallow levels. Drill results in the Santa Cruz vein varied from minor precious metal mineralization to 2.3 m at 23.1 g/t Au, whereas the Mina Antigua vein contained 4.5 m at 100.4 g/t Ag.
During 2015, the Company took 59 reconnaissance rock samples with values ranging from nil to 33.7 g/t Au and completed a 4,993 soil samples geochemical survey.
Puertecitos, Sonora
The Puertecitos property consists of two claims, Puertecitos and Puertecitos 2, covering 9,060 hectares staked by the Company in 2009. Located 32 km southwest of the Sasabe border crossing between the US and Mexico, Puertecitos is 40 km west of our Los Tamales property and 32 km northeast of the Peñoles Los Humos deposit, a 625 Mt porphyry copper system grading 0.32% Cu. Widespread copper oxides outcrop at Puertecitos and the presence of sericite and secondary biotite in breccia fragments from dikes and pipes suggest that a porphyry system may exist under the extensive rhyolite flows on the property. In 2015, First Mining entered into an option agreement with Peñoles under which the Puertecitos property may be acquired. On August 8, 2016, Peñoles notified us of its decision to discontinue exploration on the project and consequently the option agreement was terminated.
Los Tamales, Sonora
The Los Tamales property consists of two claims, Teocuitla 5 and Teocuitla 8, which cover 3,851 hectares staked by us in 2010. Los Tamales is a porphyry copper-molybdenum system located 125 km southwest of Tucson, Arizona and 28 km south of the US-Mexican border. The property was discovered by a water well sampling program during a joint United States Geological Survey and Servicio Geologico Mexicano reconnaissance effort in the 1970s, and was the subject of two USGS open-file reports 94-685 and 84-289. Five diamond drill holes tested copper and molybdenum soil geochemical anomalies in 2013 along a five km strike length with all holes showing low grade chalcopyrite and molybdenite mineralization. The deposit as currently interpreted suggests it is the deep level of a large system dissected by low angle faulting. In 2015, we entered into an option agreement with Peñoles under which the Los Tamales property may be acquired. On August 8, 2016, Peñoles notified us of its decision to discontinue exploration on the project and consequently the option agreement was terminated.
El Apache, Sonora
The El Apache property contains 11,417 ha in two claims; El Apache and Tlahuac, both staked by us in 2011.
El Apache is largely covered by wind-blown sand of the western Sonoran Desert and lies in a highly prospective area within the prolific Sonora-Mojave megashear gold belt. The property lies 10 km east of the largest gold-only mine in Mexico, Fresnillo’s Herradura complex and 10 km south of La Choya mine.
2016 Annual Information Form – Page 72
Work to date includes partial surface reconnaissance, interpretation of the government’s magnetic data and limited surface sampling in two small outcropping hills. Future work will entail ZTEM, detailed magnetometry, bleg sampling, and enzyme leach-type geochemical surveys to identify drill targets under sand cover.
Batacosa, Sonora
The Batacosa property consists of one claim covering 3,600 ha staked by us in 2011. Batacosa is a porphyry copper-molybdenum system located 55 km northeast of Ciudad Obregon and 220 km southeast of Hermosillo, capital of the state. Batacosa was discovered by Cominco in the 1970s and subsequently drilled by them and other companies between 1970 and 2000. A total of 8,000 m was drilled in 47 drill holes. First Mining has delineated two untested targets within the property.
Montana Negra, Sonora
The Montana Negra property consists of one claim, Montana Negra, covering 852 ha. The property covers Proterozoic rocks that we believe may be favourable for gold mineralization and is located in North Central Sonora, 20 km southeast of Cananea. The Orogenic gold system, similar to La Choya and San Francisco mines, targets are open-pit leachable mineralization in granitic and metamorphic rocks. Additional field work is required to fully evaluate the property following preliminary surface samples that reported from nil to 9.5 g/t Au.
Las Margaritas, Durango
The Las Margaritas property is 500 ha consisting of two mining concessions approximately 150 km from Durango City. The property was acquired through an Assignments of Rights Agreement signed July 6, 2011 and is subject to a 1% NSR royalty payable to the vendor which may be purchased at any time before July 6, 2016 for US$500,000. The project is located in the Barrancas subprovince of the Sierra Madre Occidental. Some limited gold mining by artisanal prospectors is known to have taken place on the project in the early 20th century and the project contains a known vein with quartz, argillic alteration striking for at least 1.8 km. In 2016, a two-year extension was negotiated with the vendor which granted First Mining the option to purchase the royalty by November 2018 in consideration for an additional US$100,000, payable over two years.
Geranio, Oaxaca
The Geranio property consists of six claims: La Ramita, Geranio, Violeta, Azucena, El Jilguero and La Orquidea, which combined, cover 540 ha. Additionally, we have also staked a much larger block of ground to the north, east and south of the Natividad system.
The Geranio project lies adjacent and directly north of the historic Natividad Mining District, 70 km north of the city of Oaxaca in southern Mexico. Natividad is a series of five bonanza grade gold and silver veins in a black shale host rock which over the last 70 years has produced 1.5 million ounces of gold equivalent. The property covers approximately 1,200 m of strike length of the northern extension of the Natividad vein system.
Two ASARCO exploration diamond drill holes were drilled on the Geranio property in 1992; hole N-20 intersected 0.6 m at 36 g/t Au and 315 g/t Ag, whereas hole N-24 intersected 0.7 m at 45 g/t Au and 120 g/t Ag. Our objective is to delineate another Natividad mineralized system with comparable precious metal contents.
El Roble, Oaxaca
The El Roble property, located in the Natividad mining district consists of two claims staked by us: El Roble and El Roble 2, which were recently reduced to 9,666 hectares. The property covers the northern extension of Natividad veins and other historic bonanza producers such as El Banco mine. Relevant exploration features include a 15 km strike length of a large magnetic high representing an intrusive body at depth believed to be associated with high-grade gold mineralization in veins. Work to date includes regional geology, airborne magnetics and reconnaissance sampling of selected areas.
2016 Annual Information Form – Page 73
Lachatao, Oaxaca
The Lachatao property, located in Oaxaca Mexico, consists of three claims known as Lizi 1, Lizi 1 Fraccion 2, and Lizi 1 Fraccion 3 covering 5,126 ha and staked by us. Targets in the property include high-grade gold bonanza veins in black shales as well as stockworks and disseminated gold in volcanic rocks.
United States
Turquoise Canyon, Nevada
The Turquoise Canyon property (formerly the Bald Mountain property) located in Nevada is wholly-owned by First Mining. The property consists of 188 unpatented claims totaling 3,872 acres located along the Battle Mountain-Eureka Trend, 16 km south of Barrick Gold Corp.'s Cortez Mine Complex (23 Moz. Au), and 9 km west of its newly discovered Gold Rush deposit (7 Moz. Au) and 1.5 km east of the Toiyabe Mine, a Carlin type gold deposit that produced 89,000 oz. of gold in the 1990s.
Results of an airborne ZTEM survey commissioned by the Company show an antiformal structure in the underlying Roberts Mountain Thrust which will be the focus of future exploration. A gravity high and anomalous conductive/polarizable anomalies at the southwest corner of the property are high priority drill targets. Six other potential drill targets were interpreted from two induced polarization/resistivity lines run over the property.
Risks that can affect our business
There are risks in every business.
The nature of our business means we face many kinds of risks and hazards – some that relate to the mineral exploration industry in general, and others that apply to specific properties, operations or planned operations. These risks could have a significant impact on our business, earnings, cash flows, financial condition, results of operations or prospects.
The following section describes the risks that are most material to our business. This is not, however, a complete list of the potential risks we face – there may be others we are not aware of, or risks we believe are not material today that could become material in the future. We have in place systems and procedures appropriate for a company at our stage of development to manage these risks, but there is no assurance that we will be successful in preventing the harm that any of these risks could cause.
Types of risk
| • | Exploration, development, production and operational risks......................... | p. 75 |
| | | |
| • | Financial risks................................................................................................. | p. 79 |
| | | |
| • | Political risks.................................................................................................. | p. 82 |
| | | |
| • | Regulatory risks.............................................................................................. | p. 83 |
| | | |
| • | Environmental risks........................................................................................ | p. 84 |
| | | |
| • | Industry risks.................................................................................................. | p. 85 |
| | | |
| • | Other risks...................................................................................................... | p. 86 |
2016 Annual Information Form – Page 74
Exploration, development, production and operational risks
Exploration and development risks
The exploration for and development of minerals involves significant risks, which even a combination of careful evaluation, experience and knowledge may not eliminate. These risks include:
| | • | few properties that are explored are ultimately developed into producing mines; |
| | | |
| • | there can be no guarantee that the estimates of quantities and qualities of minerals disclosed will be economically recoverable; |
| | | |
| • | with all mining operations there is uncertainty and, therefore, risk associated with operating parameters and costs resulting from the scaling up of extraction methods tested in pilot conditions; and |
| | | |
| • | mineral exploration is speculative in nature and there can be no assurance that any minerals discovered will result in an increase in our resource base. |
Unsuccessful exploration or development programs could have a material adverse impact on our operations and financial condition.
Operational hazards and risks
Our operations will be subject to all of the hazards and risks normally encountered in the exploration and development of minerals. To the extent that we or any third party with whom we may partner may take a property to production, we will also be subject (directly or indirectly) to all of the hazards and risks associated with the production of minerals. These risks include:
| | • | unusual and unexpected geological formations; |
| | | |
| | • | rock falls; |
| | | |
| | • | seismic activity; |
| | | |
| • | flooding and other conditions involved in the extraction of material, any of which could result in damage to, or destruction of, mines and other producing facilities, damage to life or property, environmental damage and possible legal liability; |
| | | |
| • | environmental pollution, and consequent liability that could have a material adverse impact on our business, operations and financial performance; |
| | | |
| | • | mechanical equipment and facility performance problems; and |
| | | |
| | • | periodic disruptions due to inclement or hazardous weather conditions. |
Substantial expenditures
Substantial expenditures are required to establish resources and reserves through drilling, to develop metallurgical processes to extract the metal from the ore and, in certain cases, to develop infrastructure at any site chosen for exploration. Although substantial benefits may be derived from the discovery of a major mineralized deposit, no assurance can be given that minerals will be discovered in sufficient quantities to justify commercial operations or that funds required for development can be obtained on a timely basis.
The economics of developing mineral properties is affected by many factors including:
| | • | the cost of operations; |
| | | |
| | • | variations in the grade of mineralized material mined; |
| | | |
| | • | fluctuations in metal markets; and |
| | | |
| • | such other factors as government regulations, including regulations relating to royalties, allowable production, importing and exporting of minerals and environmental protection. |
2016 Annual Information Form – Page 75
The remoteness and restrictions on access of properties in which we have an interest will have an adverse effect on expenditures as a result of higher infrastructure costs. There are also physical risks to the exploration personnel working in the terrain in which our properties are located, occasionally in poor climate conditions.
Long-term commercial success
Our long-term success depends on our ability to find, acquire and develop with our partners gold projects in the Americas. No assurance can be given that we will be able to locate satisfactory properties for acquisition or participation. Moreover, if such acquisitions or participations are identified, we may determine that current markets, terms of acquisition and participation or pricing conditions make such acquisitions or participations uneconomic.
No history of mineral production
First Mining has no history of commercially producing metals from its mineral exploration properties. Our current business model does not contemplate that we will establish mining operations ourselves on any property, however, our business plan anticipates that we may retain interests in properties which we have transferred to other parties and who may choose to establish mining operations. As a result, our business may (indirectly) by subject to risks with respect to mineral production. There can be no assurance that any party will successfully establish mining operations or profitably produce gold or other precious metals on any property in which we maintain an interest. The development of mineral properties involves a high degree of risk and few properties that are explored are ultimately developed into producing mines. The commercial viability of a mineral deposit is dependent upon a number of factors which are beyond our control, including the attributes of the deposit, commodity prices, government policies and regulation and environmental protection. Fluctuations in the market prices of minerals may render reserves and deposits containing relatively lower grades of mineralization uneconomic.
None of our properties are currently under development or production. The future development of any properties found to be economically feasible will require the operator to obtain licenses and permits and will require the construction and operation of mines, processing plants and related infrastructure. As a result, the development of any property will be subject to all of the risks associated with establishing new mining operations and business enterprises, including, but not limited to:
| | • | the timing and cost of the construction of mining and processing facilities; |
| | | |
| | • | the availability and costs of skilled labour and mining equipment; |
| | | |
| | • | the availability and cost of appropriate smelting and/or refining arrangements; |
| | | |
| • | the need to obtain necessary environmental and other governmental approvals and permits and the timing of those approvals and permits; and |
| | | |
| | • | the availability of funds to finance construction and development activities. |
It is common in new mining operations to experience unexpected problems and delays during development, construction and mine start-up. In addition, delays in the commencement of mineral production often occur. Accordingly, there are no assurances that our activities and those of our business partners will result in profitable mining operations or that mining operations will be established at any of our properties.
Title risks
Title to mineral properties, as well as the location of boundaries on the grounds may be disputed. Moreover, additional amounts may be required to be paid to surface right owners in connection with any mineral exploration or development activities. At all properties where we have current or planned exploration activities, we believe that we have either contractual, statutory, or common law rights to make such use of the surface as is reasonably necessary in connection with those activities.
2016 Annual Information Form – Page 76
Title insurance generally is not available for mining claims in Canada, and our ability to ensure that we have obtained secure claims to individual mineral properties or mining concessions may be severely constrained. We have not conducted surveys of all our claims; therefore, the precise area and location of such claims may be in doubt. In addition, all of our mineral properties have had previous owners, and third parties may have valid claims (known or unknown) underlying our interests therein. Accordingly, our properties may be subject to prior unregistered liens, agreements, royalties, transfers or claims, including First Nations land claims, and title may be affected by, among other things, undetected defects. In addition, we may be unable to explore our properties as permitted or to enforce our rights with respect to our properties. An impairment to or defect in our title to our properties could have a material adverse effect on our business, financial condition or results of operation.
Joint ventures
Our business plan anticipates that we may retain interest in properties which we have transferred to other parties who may choose to establish mining operations and that interest may be in the form of a joint venture. The existence or occurrence of one or more of the following circumstances and events could have a material adverse impact on our profitability or the viability of our interests that may be held through joint ventures, which could have a material adverse impact on our future cash flows, earnings, results of operations and financial condition:
| | • | disagreements with joint venture partners on how to develop and operate mines efficiently; |
| | | |
| | • | inability to exert influence over certain strategic decisions made in respect of joint venture properties; |
| | | |
| | • | inability of joint venture partners to meet their obligations to the joint venture or third parties; and |
| | | |
| | • | litigation between joint venture partners regarding joint venture matters. |
We do not intend to be the operator on any property and therefore the success of any operations will be dependent on the operators for the timing of activities related to these properties and we would be largely unable to direct or control the activities of the operators. We would be subject to the decisions made by the operator in the operation of the property, and will have to rely on the operators for accurate information about the properties.
Acquisition or business arrangements
As part of our business strategy, we have sought and will continue to seek new mining and exploration opportunities in the mining industry. In pursuit of such opportunities, we may fail to select appropriate acquisition targets or negotiate acceptable arrangements, including arrangements to finance acquisitions or integrate the acquired businesses and their workforce into us. Ultimately, any acquisitions would be accompanied by risks, which could include:
| • | a significant change in commodity prices after we have committed to complete the transaction and established the purchase price or exchange ratio; |
| | | |
| | • | a material ore body could prove to be below expectations; |
| | | |
| | • | difficulty in integrating and assimilating the operations and workforce of any acquired companies; |
| | | |
| • | realizing anticipated synergies and maximizing the financial and strategic position of the combined enterprise; |
| | | |
| | • | the bankruptcy of parties with whom we have arrangements; |
| | | |
| | • | maintaining uniform standards, policies and controls across the organization; |
2016 Annual Information Form – Page 77
| • | disruption of our ongoing business and its relationships with employees, suppliers, contractors and other stakeholders as we integrate the acquired business or assets; |
| | | |
| | • | the acquired business or assets may have unknown liabilities which may be significant; |
| | | |
| | • | delays as a result of regulatory approvals; and |
| | | |
| | • | exposure to litigation (including actions commenced by shareholders) in connection with the transaction. |
Any material issues that we encounter in connection with an acquisition could have a material adverse effect on our business, results of operations and financial position.
Mineral reserves/mineral resources
The properties in which we hold an interest are currently considered to be in the early exploration stage only and do not contain a known body of commercial minerals. Mineral resources and mineral reserves are, in the large part, estimates and no assurance can be given that the anticipated tonnages and grades will be achieved or that the indicated level of recovery will be realized.
Mineral resourceson our properties have been determined based upon assumed metal prices and operating costs. Future production could differ dramatically from resource and reserve estimates because, among other reasons:
| • | mineralization or formations could be different from those predicted by drilling, sampling and similar examinations; |
| | | |
| | • | calculation errors could be made in estimating mineral resources and mineral reserves; |
| | | |
| • | increases in operating mining costs and processing costs could adversely affect mineral resources and mineral reserves; |
| | | |
| • | the grade of the mineral resources and mineral reserves may vary significantly from time to time and there is no assurance that any particular level of metals may be recovered from the ore; and |
| | | |
| • | declines in the market price of the metals may render the mining of some or all of the mineral reserves uneconomic. |
Estimated mineral resources may require downward revisions based on changes in metal prices, further exploration or development activity, increased production costs or actual production experience. This could materially and adversely affect estimates of the tonnage or grade of mineralization, estimated recovery rates or other important factors that influence mineral resource and mineral reserve estimates.
Any reduction in estimated mineral resources as a result could require material write downs in investment in the affected mining property and increased amortization, reclamation and closure charges, which could have a material and adverse effect on future cash flows for the property and on our earnings, results of operations and financial condition.
Because we do not currently have any producing properties, mineralization estimates for our properties may require adjustments or downward revisions based upon further exploration or development work or actual future production experience. In addition, the grade of mineralized material ultimately mined, if any, may differ from that indicated by drilling results. There can be no assurance that minerals recovered in small-scale tests will be duplicated in large-scale tests under on- site conditions or in production scale.
The mineral resource estimates contained in this AIF have been determined and valued based on assumed future prices, cut-off grades and operating costs that may prove to be inaccurate. Extended declines in market prices for gold or other metals may render portions of our mineralization uneconomic and result in reduced reported mineralization. Any material reductions in mineralization estimates, or of the ability to extract mineralized material from our properties, could (directly or indirectly) have a material adverse effect on our results of operations or financial condition.
2016 Annual Information Form – Page 78
Capital costs, operating costs, production and economic returns
Although our current business model does not contemplate that we will establish mining operations ourselves on any property, our business plan anticipates that we may retain interests in properties that we have transferred to other parties who may choose to establish mining operations.
Actual capital costs, operating costs, production and economic returns with respect to our properties may differ significantly from those we have anticipated and there are no assurances that any future development activities will result in profitable mining operations. The capital costs required to develop or take our projects into production may be significantly higher than anticipated. To the extent that such risks impact upon any such properties, there may be a material adverse effect on results of operations on such properties which may in turn have a material adverse effect on our financial condition.
None of our mineral properties have sufficient operating history upon which we can base estimates of future operating costs. Decisions about the development of these and other mineral properties will ultimately be based upon feasibility studies. Feasibility studies derive estimates of cash operating costs based upon, among other things:
| • | anticipated tonnage, grades and metallurgical characteristics of the mineralized material to be mined and processed; |
| | | |
| | • | anticipated recovery rates metals from the mineralized material; |
| | | |
| | • | cash operating costs of comparable facilities and equipment; and |
| | | |
| | • | anticipated climatic conditions. |
Cash operating costs, production and economic returns, and other estimates contained in studies or estimates prepared by or for us, may differ significantly from those anticipated by our current studies and estimates, and there can be no assurance that our actual operating costs will not be higher than currently anticipated.
Property interests
The agreements pursuant to which we hold rights to certain of our properties provide that we must make a series of cash payments over certain time periods or make minimum exploration expenditures. If we fail to make such payments or expenditures in a timely manner, we may lose interest in those projects.
Availability of supplies
As with other mineral exploration companies, certain raw materials, supplies and other critical resources used in connection with our operations are obtained from a sole or limited group of suppliers. Due to an increase in activity in the global mining sector, there has been an increase in global demand for such resources. A decrease in the supplier’s inventory could cause unanticipated cost increases, an inability to obtain adequate supplies and delays in delivery times, thereby impacting operating costs, and timing of exploration and development programs.
Lack of infrastructure
The completion of the development of our development projects is subject to various requirements, including the availability and timing of acceptable arrangements for electricity or other sources of power, water and transportation facilities. The lack of availability on acceptable terms or the delay in the availability of any one or more of these items could prevent or delay the development of our exploration projects. If adequate infrastructure is not available in a timely manner, there can be no assurance that: the development of our projects will be completed on a timely basis, if at all; any resulting operations will achieve the anticipated production volume; or the ongoing operating costs associated with the development of our projects will not be higher than anticipated.
2016 Annual Information Form – Page 79
Personnel recruitment and retention
The success of our operations and development projects depend in part on our ability to attract and retain geologists, engineers, metallurgists and other personnel with specialized skill and knowledge about the mining industry in the geographic areas in which we operate. The number of persons skilled in acquisition, exploration and development of mining properties is limited and competition for such persons is intense. As our business grows, we may require additional key financial, administrative, and mining personnel as well as additional operations staff. There can be no assurance that we will be successful in attracting, training, and retaining qualified personnel as competition for persons with these skill sets increases. If we are unable to attract and retain sufficiently trained, skilled or experienced personnel, our business may suffer and we may experience significantly higher staff or contractor costs, which could have a material adverse effect on our operations and financial condition.
Uninsured losses
Despite efforts to attract and retain qualified personnel, as well as the retention of qualified consultants, to manage our interests, even when those efforts are successful, people are fallible and human error and mistakes could result in significant uninsured losses to us. These could include, but are not limited to, loss or forfeiture of mineral claims or other assets for non]payment of fees or taxes, erroneous or incomplete filings or non fulfillment of other obligations, significant tax liabilities in connection with any tax planning effort we might undertake or mistakes in interpretation and implementation of tax laws and practices, and legal claims for errors or mistakes by our personnel.
Financial risks
Substantial capital requirements
Our management team anticipates that we may make substantial capital expenditures for the acquisition, exploration and development of our properties, in the future. As we are in the exploration stage with no revenue being generated from the exploration activities on our mineral properties, we have limited ability to raise the capital necessary to undertake or complete future exploration work, including drilling programs. There can be no assurance that debt or equity financing will be available or sufficient to meet these requirements or for other corporate purposes or, if debt or equity financing is available, that it will be on terms acceptable to us and any such financing may result in substantial dilution to existing shareholders. Moreover, future activities may require us to alter our capitalization significantly. Our inability to access sufficient capital for our operations could have a material adverse effect on our financial condition, results of operations or prospects. In particular, failure to obtain such financing on a timely basis could cause us to forfeit our interest in certain properties, miss certain acquisition opportunities and reduce or terminate our operations.
History of net losses
We have received no revenue to date from the exploration activities on our properties, and there is no assurance that any of the properties that we have or will acquire pursuant to acquisitions or otherwise will generate earnings, operate profitably or provide a return on investment in the future. We have not determined that production activity is warranted on any of our mineral properties. Even if we (alone or in conjunction with a third party) undertake development and production activities on any of our mineral properties, there is no certainty that we will produce revenue, operate profitably or provide a return on investment in the future.
We are subject to all of the risks associated with new mining operations and business enterprises including, but not limited to:
| • | the timing and cost, which can be considerable, for the further construction of mining and processing facilities; |
2016 Annual Information Form – Page 80
| | • | the availability and costs of skilled labour, consultants, mining equipment and supplies; |
| | | |
| | • | the availability and cost of appropriate smelting and/or refining arrangements; |
| | | |
| • | the need to obtain necessary environmental and other governmental approvals, licenses and permits, and the timing of those approvals, licenses and permits; and |
| | | |
| | • | the availability of funds to finance construction and development activities. |
It is common in new mining operations to experience unexpected problems and delays during construction, development, and mine start-up. In addition, delays in mineral production often occur. Accordingly, there are no assurances that our activities will result in sustainable profitable mining operations or that we will successfully establish mining operations or profitably produce metals at any of our other properties.
Potential volatility of share price
In recent years, the securities markets in Canada have experienced a high level of price and volume volatility, and the market price of securities of many junior companies have experienced wide fluctuations in price. The market price of our shares may be volatile and could be subject to wide fluctuations due to a number of factors, including but not limited to: actual or anticipated fluctuations in the results of our operations; changes in estimates of our future results of operations by management or securities analysts; and general industry changes. In addition, the financial markets have in the recent past experienced significant price and value fluctuations that have particularly affected the market prices of equity securities of many venture issuers and that sometimes have been unrelated to the operating performance of these companies. Broad market fluctuations, as well as economic conditions generally and in the mining industry specifically, may adversely affect the market price of our shares.
Non-Canadian investors
We are a public Canadian corporation, with our principal place of business in Canada. A majority of our directors and officers are residents of Canada and a significant portion of our assets and the assets of a majority of our directors and officers are located outside the United States. Consequently, it may be difficult for US or foreign investors to effect service of process within their local jurisdiction upon First Mining or its directors or officers or such experts who are residents of Canada, or to realize in their local jurisdiction upon judgments of local courts (including, but not limited to, judgments predicated upon civil liabilities under the United States Securities Act of 1933, as amended). Investors should not assume that Canadian courts: (i) would enforce judgments of foreign courts obtained in actions against First Mining or such directors, officers or experts (including, but not limited to, judgments predicated upon the civil liability provisions of the US federal securities laws or the securities or “blue sky” laws of any state within the United States); or (ii) would enforce, in original actions, liabilities against First Mining or such directors, officers or experts predicated upon foreign securities laws (including, but not limited to, the US federal securities laws or any state securities or “blue sky” laws). In addition, the protections afforded by Canadian securities laws may not be available to foreign investors.
Currency fluctuations
We maintain our accounts in Canadian dollars. Our operations in Mexico and the United States make us subject to foreign currency fluctuations and such fluctuations may affect our financial position and results. We do not plan to engage in currency hedging activities.
Volatility of mineral prices
Metal prices are affected by numerous factors beyond our control, such as industrial demand, inflation and expectations with respect to the rate of inflation, the strength of the US dollar and of other currencies, interest rates, forward sales by producers, production and cost levels, changes in investment trends, global and regional levels of supply and demand, metal stock levels maintained by producers, inventory carrying costs, availability, demand and costs of metal substitutes, international economic and political conditions, reduced demand resulting from obsolescence of technologies and processes utilizing silver and other metals and increased production due to new mine developments and improved mining and production levels. Gold prices are sometimes subject to rapid short-term changes because of speculative activities, and the market price of gold and other metals may not remain at current levels. If these prices were to decline significantly or for an extended period of time, we might be unable to continue our operations, develop our properties or fulfill our obligations under agreements with our partners or under our permits and licenses. As a result, we might lose our interest in, or be forced to sell, some of our properties. In the event of a sustained, significant drop in gold prices, we may be required to re-evaluate our assets, resulting in reduced estimates of mineral resources and mineral reserves and in material write-downs of our investment in mining properties. Furthermore, since gold prices are established in US dollars, a significant decrease in the value of the Canadian dollar relative to the US dollar coupled with stable or declining gold prices could adversely affect our results with respect to development of and eventual sale of gold.
2016 Annual Information Form – Page 81
Global financial conditions
Global financial conditions continue to be characterized by volatility. Many industries, including the mining industry, are impacted by volatile market conditions. Global financial conditions remain subject to sudden and rapid destabilizations in response to economic shocks. A slowdown in the financial markets or other economic conditions, including but not limited to consumer spending, employment rates, business conditions, inflation, fluctuations in fuel and energy costs, consumer debt levels, lack of available credit, the state of the financial markets, interest rates and tax rates, may adversely affect our growth and financial condition. Future economic shocks may be precipitated by a number of causes, including the government debt levels, fluctuations in the price of oil and other commodities, the volatility of metal prices, geopolitical instability, terrorism, the volatility of currency exchanges, the devaluation and volatility of global stock markets and natural disasters. Any sudden or rapid destabilization of global economic conditions could impact our ability to obtain equity or debt financing in the future on terms favourable to us or at all. In such an event, our operations and financial condition could be adversely impacted.
Dividends
To date, we have not paid any dividends on our outstanding common shares and we have no plans to declare or pay dividends in the near future. Any decision to pay dividends on our shares will be made by our Board on the basis of our earnings, financial requirements and other conditions.
Dilution
The number of common shares we are authorized to issue is unlimited. We may, in our sole discretion, issue additional common shares from time to time, and the interests of the shareholders may be diluted thereby.
Political risks
Foreign operations
While our principal exploration properties are located in Canada, we continue to hold properties in Mexico. Our operations in Mexico or in other countries we determine to operate in may be exposed to various levels of political, economic, and other risks and uncertainties depending on the country or countries in which we operate. These risks and uncertainties include, but are not limited to, terrorism; hostage taking; military repression; fluctuations in currency exchange rates; high rates of inflation; labour unrest; the risks of civil unrest; expropriation and nationalization; renegotiation or nullification of existing concessions, licenses, permits and contracts; illegal mining; changes in taxation policies; restrictions on foreign exchange and repatriation; and changing political conditions, currency controls, and governmental regulations that favour or require the awarding of contracts to local contractors, or require foreign contractors to employ citizens of, or purchase supplies from, a particular jurisdiction.
2016 Annual Information Form – Page 82
Future political and economic conditions may result in a government adopting different policies with respect to foreign development and ownership of mineral resources. Any changes in policy may result in changes in laws affecting ownership of assets, foreign investment, taxation, rates of exchange, resource sales, environmental protection, labour relations, price controls, repatriation of income, and return of capital, which may affect both the ability to undertake exploration and development activities in respect of future properties in the manner currently contemplated, as well as our ability to continue to explore, develop, and operate those properties to which we have rights relating to exploration, development, and operations.
Indigenous peoples
Various international and national laws, codes, resolutions, conventions, guidelines, and other materials relate to the rights of indigenous peoples including the First Nations of Canada. We operate in some areas presently or previously inhabited or used by indigenous peoples including areas covered by treaties among the First Nations, the federal and provincial governments. Many of these materials impose obligations on government to respect the rights of indigenous people. Some mandate that government consult with indigenous people regarding government actions which may affect indigenous people, including actions to approve or grant mining rights or permits. The obligations of government and private parties under the various international and national materials pertaining to indigenous people continue to evolve and be defined. Our current and future exploration program may be subject to a risk that one or more groups of indigenous people may oppose development on any of our properties or on properties in which we hold a direct or indirect interest. Such opposition may be directed through legal or administrative proceedings or expressed in manifestations such as protests, roadblocks or other forms of public expression against the our activities or other parties to whom we have transferred properties. Opposition by indigenous people to our operations may require modification of or preclude development of our projects or projects on properties in which we hold a direct or indirect interest or may require us or a third party to enter into agreements with indigenous people with respect to projects on such properties. Such agreements may have a material adverse effect on our business, financial condition and results of operations.
Regulatory risks
Government approvals
Our activities are subject to government approvals, various laws governing prospecting, development, land resumptions, production taxes, labour standards and occupational health, mine safety, toxic substances and other matters, including issues affecting local First Nations populations. The costs associated with compliance with these laws and regulations can be substantial. Although we believe our activities are carried out in accordance with all applicable rules and regulations, no assurance can be given that new rules and regulations will not be enacted or that existing rules and regulations will not be applied in a manner which could limit or curtail production or development, or cause additional expense, capital expenditures, restrictions or delays in the development of our properties. Amendments to current laws and regulations governing operations and activities of exploration and mining, or more stringent implementation thereof, could have a material adverse impact on our business, operations and financial performance. Further, the mining licenses and permits issued in respect of our projects may be subject to conditions which, if not satisfied, may lead to the revocation of such licenses. In the event of revocation, the value of our investments in such projects may decline.
Mineral claims, licenses and permitting
Our mineral claims, licenses and permits are subject to periodic renewal and may only be renewed a limited number of times for a limited period of time. While we anticipate that renewals will be given as and when sought, there is no assurance that such renewals will be given as a matter of course and there is no assurance that new conditions will not be imposed in connection therewith. Our business objectives may also be impeded by the costs of holding and/or renewing the mineral claims, licenses and permits. In addition, the duration and success of efforts to obtain and renew mineral claims, licenses and permits are contingent upon many variables not within our control.
2016 Annual Information Form – Page 83
Our current and anticipated future operations, including further exploration, development activities and commencement of production on our properties, require licenses and permits from various governmental authorities. We cannot be certain that all licenses and permits that we may require for our operations will be obtainable on reasonable terms or at all. Delays or a failure to obtain such licenses and permits, or a failure to comply with the terms of any such licenses and permits that we have obtained, could have a material adverse impact on First Mining.
Anti-bribery legislation
Our activities are subject to a number of laws that prohibit various forms of corruption, including domestic laws, that prohibit both commercial and official bribery and anti-bribery laws that have a global reach such as theCorruption of Foreign Public Officials Act. The increasing number and severity of enforcement actions in recent years present particular risks with respect to our business activities, to the degree that any employee or other person acting on our behalf might offer, authorize, or make an improper payment to a government official, party official, candidate for political office, or political party, an employee of a state-owned or state-controlled enterprise, or an employee of a public international organization.
Transparency in the extractive industry
In its 2014-2015 Budget, the Federal Government of Canada had announced it would be putting new standards in place to require companies in the extractive sector to disclose their payments to local and foreign governments.
TheCanadian Extractive Sector Transparency Measures Actcame into force on June 1, 2015 and applies to fiscal periods which commenced after that date. As a result, as a Canadian publicly listed corporation we must report annually on payments of $100,000 or more made to any level of government in Canada or abroad related to a single project. The reporting applies to taxes, licences, fees, royalties, production entitlements, bonuses, dividends, fines and infrastructure payments. We will be required to file its initial report by May 30, 2017. Other than amounts paid in Mexico for annual mineral property concession taxes, First Mining has minimal eligible payments that are over the reporting threshold.
The reporting for payments made to an Aboriginal government in Canada will not apply until after June 1, 2017.
The Québec government has also proposed a disclosure regime which is similar to the federal requirements subject to size limits related to assets in Québec and the number of employees. On October 21, 2015, the National Assembly of Québec adopted Bill 55 an Act Respecting Transparency Measures in The Mining, Oil and Gas Industries, which came into force on that date. The provincial and federal regimes will require separate reporting at this time. We believe that the impact will not be significant at this time.
Environmental risks
Environmental laws and regulations
All phases of the mining business present environmental risks and hazards and are subject to environmental regulation pursuant to a variety of international conventions and state and municipal laws and regulations. Environmental legislation provides for, among other things, restrictions and prohibitions on spills, releases or emissions of various substances produced in association with mining operations. The legislation also requires that wells and facility sites be operated, maintained, abandoned and reclaimed to the satisfaction of applicable regulatory authorities. Compliance with such legislation can require significant expenditures and a breach may result in the imposition of fines and penalties, some of which may be material. Environmental legislation is evolving in a manner expected to result in stricter standards and enforcement, larger fines and liability and potentially increased capital expenditures and operating costs. Environmental assessments of proposed projects carry a heightened degree of responsibility for companies and directors, officers and employees. The cost of compliance with changes in governmental regulations has a potential to reduce the profitability of operations.
2016 Annual Information Form – Page 84
We believe we are in substantial compliance with all material laws and regulations which currently apply to our activities. We cannot give any assurance that, notwithstanding our precautions and limited history of activities, breaches of environmental laws (whether inadvertent or not) or environmental pollution will not result in additional costs or curtailment of planned activities and investments, which could have a material and adverse effect on our future cash flows, earnings, results of operations and financial condition. Failure to comply with applicable laws, regulations, and permitting requirements may result in enforcement actions thereunder, including orders issued by regulatory or judicial authorities causing operations to cease or be curtailed, and may include corrective measures requiring capital expenditures, installation of additional equipment, or remedial actions. Companies engaged in mining operations may be required to compensate those suffering loss or damage by reason of the mining activities and may have civil or criminal fines or penalties imposed for violations of applicable laws or regulations and, in particular, environmental laws.
Amendments to current laws, regulations and permits governing operations and activities of mining companies, or more stringent implementation thereof, could have a material adverse impact on us and cause increases in capital expenditures or any future production costs or require abandonment or delays in the development of new mining properties.
Companies engaged exploration and development of mineral properties may from time to time experience increased costs and delays in exploration and production as a result of the need to comply with applicable laws, regulations and permits. We believe we are in substantial compliance with all material laws and regulations which currently apply to our activities. We cannot give any assurance that, notwithstanding our precautions and limited history of activities, breaches of environmental laws (whether inadvertent or not) or environmental pollution will not result in additional costs or curtailment of planned activities and investments, which could have a material and adverse effect on our future cash flows, earnings, results of operations and financial condition.
Compliance with emerging climate change regulations
Governments at all levels may be moving towards enacting legislation to address climate change concerns, such as requirements to reduce emission levels and increase energy efficiency, and political and economic events may significantly affect the scope and timing of climate change measures that are ultimately put in place. Where legislation has already been enacted, such regulations may become more stringent, which may result in increased costs of compliance. There is no assurance that compliance with such regulations will not have an adverse effect on our results of operations and financial condition. Furthermore, given the evolving nature of the debate related to climate change and resulting requirements, it is not possible to predict the impact on our results of operations and financial condition.
Climate change may result in an increasing frequency of extreme weather events (such as increased periods of snow and increased frequency and intensity of storms) which have the potential to disrupt our exploration and development plans. Our emergency plans for managing extreme weather conditions may not be sufficient and extended disruptions could have adverse effects on our results of operations and financial condition.
Industry risks
Speculative nature of mineral development activities
Resource exploration and development is a speculative business, characterized by a number of significant risks including, among other things, unprofitable efforts resulting not only from the failure to discover mineral deposits but from finding mineral deposits which, though present, may, for a variety of factors not be economic to produce.
2016 Annual Information Form – Page 85
The marketability of minerals acquired or discovered by us may be affected by numerous factors which are beyond our control and which cannot be accurately predicted, such as:
| | • | market fluctuations; |
| | | |
| | • | the proximity and capacity of milling facilities; |
| | | |
| | • | mineral markets; |
| | | |
| | • | processing equipment; and |
| | | |
| • | government regulations, including regulations relating to royalties, allowable production, importing and exporting of minerals and environmental protection. |
Estimates of mineral resources, mineral reserves, mineral deposits and production costs can also be affected by such factors as:
| | • | environmental permitting regulations and requirements; |
| | | |
| | • | weather; |
| | | |
| | • | environmental factors; |
| | | |
| | • | unforeseen technical difficulties; |
| | | |
| | • | unusual or unexpected geological formations; and |
| | | |
| | • | work interruptions. |
In addition, the grade of mineralized material ultimately mined may differ from that indicated by drilling results.
Short term factors relating to mineral reserves, such as the need for orderly development of mineralized bodies or the processing of new or different grades, may also have an adverse effect on mining operations and on the results of operations. Material changes in mineralized material reserves, grades, stripping ratios or recovery rates may affect the economic viability of any project.
Our mineral properties are all in the exploration stage only and are without known bodies of commercial mineralized material. Few properties which are explored are ultimately developed into producing mines. Major expenses may be required to establish mineral reserves, develop metallurgical processes and construct mining and processing facilities at a particular site. There is no assurance that our mineral exploration activities will result in any discoveries of new commercial bodies of mineralized material. There are no reassurances that commercial production activities will commence on any of our properties.
Competition
The mining industry is highly competitive. We compete with companies for the acquisition, exploration and development of gold and other precious and base metals, and for capital to finance such activities, and such companies may have similar or greater financial, technical and personnel resources available to them.
Other risks
Reliance on key employees
We manage our business with a number of key personnel, including key contractors, the loss of a number of whom could have a material adverse effect on us. In addition, as our business develops and expands, we believe that our future success will depend greatly on our continued ability to attract and retain highly-skilled and qualified personnel and contractors. In assessing the risk of an investment in our shares, potential investors should realize that they are relying on the experience, judgment, discretion, integrity and good faith of our management team and board of directors. We cannot be certain that key personnel will continue to be employed by us or that we will be able to attract and retain qualified personnel and contractors in the future. Failure to retain or attract key personnel could have a material adverse effect on us. We do not maintain “key person” insurance policies in respect of our key personnel.
2016 Annual Information Form – Page 86
Conflicts of interest
Certain directors and officers will be engaged in, and will continue to engage in, other business activities on their own behalf and on behalf of other companies (including mineral companies) and, as a result of these and other activities, such directors and officers may become subject to conflicts of interest. The BCBCA provides that if a director has a material interest in a contract or proposed contract or agreement that is material to the issuer, the director must disclose his interest in such contract or agreement and must refrain from voting on any matter in respect of such contract or agreement, subject to and in accordance with the BCBCA. To the extent that conflicts of interest arise, such conflicts will be resolved in accordance with the provisions of the BCBCA and in accordance with our Code of Business Conduct and Ethics.
Uninsured risks
Our business is subject to a number of risks and hazards, including adverse environmental conditions, industrial accidents, labour disputes, unusual or unexpected geological conditions, ground or slope failures, cave-ins, changes in the regulatory environment and natural phenomena, such as inclement weather conditions, floods and earthquakes. Such occurrences could result in damage to our properties, personal injury or death, delays in program development, monetary losses and possible legal liability.
Although we maintain insurance to protect against certain risks in amounts that we consider reasonable, our insurance will not cover all the potential risks associated with our operations. We may also be unable to maintain insurance to cover these risks at economically feasible premiums. Insurance coverage may not continue to be available or may not be adequate to cover any resulting liability. Moreover, insurance against certain risks, such as environmental pollution or other hazards as a result of exploration and production, is not generally available to us or to other companies in the mining industry on acceptable terms. We may also become subject to liability for pollution or other hazards which may not be insured against or which we may elect not to insure against because of premium costs or other reasons. Losses from these events may cause us to incur significant costs that could have a material adverse effect upon our financial performance, results of operations and business outlook.
Litigation and regulatory proceedings
We may be subject to civil claims (including class action claims) based on allegations of negligence, breach of statutory duty, public nuisance or private nuisance or otherwise in connection with our operations, or investigations relating thereto. While we are presently unable to quantify any potential liability under any of the above heads of damage, such liability may be material to us and may materially adversely affect our ability to continue operations. In addition, we may be subject to actions or related investigations by governmental or regulatory authorities in connection with our business activities, including, but not limited to, current and historic activities at our mineral properties. Such actions may include prosecution for breach of relevant legislation or failure to comply with the terms of our licenses and permits and may result in liability for pollution, other fines or penalties, revocations of consents, permits, approvals or licenses or similar actions, which could be material and may impact the results of our operations. Our current insurance coverage may not be adequate to cover any or all the potential losses, liabilities and damages that could result from the civil and/or regulatory actions referred to above.
Growth strategy
We evaluate growth opportunities and continue to consider the acquisition and disposition of exploration and development properties and mineral assets to achieve our strategy. From time to time, we engage in discussions in respect of both acquisitions and dispositions, and other business opportunities, but there can be no assurance that any such discussions will result in a successfully completed transaction.
2016 Annual Information Form – Page 87
Future Sales of Shares
Sales of a substantial number of our shares in the public market could occur at any time following, or in connection with, the completion of any offering. These sales, or the market perception that the holders of a large number of our shareholders intend to sell our shares, could reduce the market price of our shares. A decline in the market price of the shares could impair our ability to raise additional capital through the sale of securities should we desire to do so.
The issuance of shares to shareholders whose investment profile may not be consistent with the our business may lead to significant sales of our shares or a perception that such sales may occur, either of which could have a material adverse effect on the market for and market price of our shares. We are unable to predict the effect that sales may have on the then prevailing market price of our shares.
Shares Owned by a Single Shareholder
A significant percentage of our outstanding shares are owned by an exchange traded fund (an “ETF”). As such, the ETF is in a position to exercise influence over matters requiring shareholder approval, including the determination of significant corporate actions that could otherwise be beneficial to our other shareholders, including the election and removal of directors, amendments to our corporate governing documents and business combinations. Our interests and those of the ETF’s may at times conflict, and this conflict might be resolved against our interests. The concentration of control by a single shareholder may practically preclude an unsolicited take-over bid for our shares, and this may adversely impact the value and trading price of our shares.
Other risks
Our business and operations are subject to a number of risks and hazards including:
| | • | environmental hazards; |
| | | |
| | • | discharge of pollutants or hazardous chemicals; |
| | | |
| | • | industrial accidents; |
| | | |
| | • | failure of processing and mining equipment; |
| | | |
| | • | labour disputes; |
| | | |
| | • | supply problems and delays; |
| | | |
| | • | changes in regulatory environment; |
| | | |
| | • | encountering unusual or unexpected geologic formations or other geological or grade problems; |
| | | |
| | • | encountering unanticipated ground or water conditions; |
| | | |
| | • | cave-ins, pit-wall failures, flooding, rock bursts and fire; |
| | | |
| | • | periodic interruptions due to inclement or hazardous weather conditions; |
| | | |
| | • | uncertainties relating to the interpretation of drill results; |
| | | |
| • | inherent uncertainty of production and cost estimates and the potential for unexpected costs and expenses; |
| | | |
| • | results of initial feasibility, pre-feasibility and feasibility studies, and the possibility that future exploration or development results will not be consistent with our expectations; |
2016 Annual Information Form – Page 88
| | • | the potential for delays in exploration or the completion of feasibility studies; and |
| | | |
| | • | other acts of God or unfavourable operating conditions. |
Such risks could result in damage to, or destruction of, properties or equipment, personal injury or death, loss of key employees, environmental damage, delays in development programs, monetary losses and possible legal liability. Satisfying such liabilities may be very costly and could have a material adverse effect on future cash flow, results of operations and financial condition.
Legal proceedings
On June 16, 2016, First Mining assumed control of the business and assets of Tamaka as a result of the amalgamation between Tamaka and a wholly owned subsidiary of First Mining. Tamaka was a party to three debentures with an aggregate principal amount of approximately $2.1 million (collectively, the “Debentures”), payable to Kesselrun Resources Ltd. (“Kesselrun”). Kesselrun has commenced an action before the Ontario Superior Court alleging that the Debentures were required to be converted into common shares of First Mining as a result of the amalgamation transaction with Tamaka, and is seeking an order for, among other things, the issuance to Kesselrun of shares of First Mining or, in the alternative, damages. First Mining disagrees with this position, and we take the position that the Debentures have not been converted and remain outstanding.
We have engaged legal counsel in relation to this contractual dispute and at this time we cannot definitively predict the outcome of this dispute. In the event Kesselrun prevails, Kesselrun would convert approximately $2.1 million of the principal amount of the Debentures into approximately 5.6 million shares of First Mining, which had a fair market value of approximately $4.8 million as at December 31, 2016.
For further information about this, see note 27 to our audited consolidated annual financial statements for the year ended December 31, 2016.
Investor information
Share capital
Our authorized share capital consists of:
| | • | an unlimited number of common shares; and |
| | | |
| | • | an unlimited number of preferred shares, issuable in series. |
Common shares
We can issue an unlimited number of common shares with no nominal or par value. As of December 31, 2016, we had 539,439,736 common shares outstanding (543,468,233 outstanding as of the date of this AIF). All of our outstanding common shares are fully paid and non-assessable.
The following is a summary of the principal attributes of our common shares:
Voting rights
Holders of our common shares are entitled to vote on all matters that are to be voted on at any shareholder meeting, other than meetings that are only for holders of another class or series of shares. Each common share you own represents one vote. There are no cumulative voting rights, and directors do not stand for re-election at staggered intervals.
2016 Annual Information Form – Page 89
Dividends
Holders of our common shares are entitled to sharepro ratain any profits of First Mining to the extent that such profits are distributed either through the declaration of dividends by our Board or otherwise distributed to shareholders. There are no indentures or agreements limiting the payment of dividends.
Rights on dissolution
In the event of the liquidation, dissolution or winding up of First Mining, the holders of our common shares will be entitled to receive, on apro ratabasis, all of our assets remaining after payment of all of our liabilities.
Pre-emptive, conversion and other rights
Holders of our common shares have no pre-emptive, redemption, purchase or conversion rights attaching to their shares, and our common shares, when fully paid, will not be liable to further call or assessment. No other class of shares may be created without the approval of the holders of our common shares. There are no provisions discriminating against any existing or prospective holder of our common shares as a result of such shareholder owning a substantial number of common shares. In addition, non-residents of Canada who hold our common shares have the same rights as shareholders who are residents of Canada.
Preferred shares
We can issue an unlimited number of preferred shares with no nominal or par value. As of the date of this AIF, we did not have any preferred shares outstanding.
The preferred shares are issuable in series. The preferred shares of each series rank in parity with the preferred shares of every other series with respect to dividends and return of capital and are entitled to a preference over the common shares and any other shares ranking junior to the preferred shares with respect to priority in the payment of dividends and the distribution of assets in the event of the liquidation, dissolution or winding-up of First Mining.
Our Board of Directors is empowered to fix the number of shares and the rights to be attached to the preferred shares of each series, including the amount of dividends and any conversion, voting and redemption rights. Subject to our articles of incorporation and to applicable law, the preferred shares as a class are not entitled to receive notice of or attend or vote at meetings of the Company’s shareholders.
Security-based compensation and convertible securitiesStock options
Our shareholders most recently approved the Company’s existing stock option plan (the “Option Plan”) on June 16, 2016. The Option Plan allows for the issuance of up to 10% of our issued and outstanding shares as incentive share options (“Options”) to our directors, officers, employees and consultants of the Company.
Options granted under the Option Plan may be subject to vesting provisions as determined by our Board of Directors. All of our outstanding Options are fully vested and exercisable, with the exception of Options that have been granted to employees who carry out investor relations functions, as their Options are subject to certain vesting periods required under the rules and policies of the TSX-V.
As of December 31, 2016 and as of the date of this AIF, there were 24,440,617 Options and 34,837,383 Options, respectively, outstanding with exercise prices ranging from $0.15 to $2.50, and expiry dates ranging from June 16, 2017 to March 13, 2022.
2016 Annual Information Form – Page 90
Warrants
In addition to the outstanding Options noted above, as of December 31, 2016 and as of the date of this AIF, there were 50,938,673 share purchase warrants and 50,093,409 share purchase warrants, respectively, outstanding to acquire common shares of First Mining at exercise prices ranging from $0.17 to $1.10, and with expiry dates ranging from February 15, 2018 to June 16, 2021.
Escrowed securities
The following table shows the number and percentage of common shares held, to First Mining’s knowledge, in escrow or subject to a contractual restriction on transfer as at December 31, 2016:
| Designation of class | | Number of securities held in escrow or that | | Percentage of class |
| Common Shares | | 51,741,089(1)(2)(3)(4) | | 9.5% |
Notes:
| 1. | Of this number, as of December 31, 2016, 3,299,524 common shares of First Mining were being held in escrow by Computershare Investor Services Inc. pursuant to an Escrow Value Security Agreement dated March 30, 2015 that was entered into in connection with the Sundance Acquisition. 15% of these shares will be released on March 30 and September 30 of each year, until the final release of shares on March 30, 2018. |
| | |
| 2. | Of this number, as of December 31, 2016, 583,275 common shares of First Mining were being held in escrow by Computershare Investor Services Inc. pursuant to a CPC Escrow Agreement dated August 2, 2005. 15% of these shares will be released on March 30 and September 30 of each year, until the final release of shares on March 30, 2018. |
| | |
| 3. | Of this number, as of December 31, 2016, 29,658,290 common shares of First Mining were being held in escrow by Computershare Trust Company of Canada pursuant to an escrow agreement dated June 16, 2016 that was entered into in connection with our acquisition of Tamaka. 5,931,658 of these escrowed shares will be released from escrow on June 17, 2017, and thereafter 5,931,658 shares will be released on December 17 and June 17 of each year, until the final 5,931,658 shares are released on June 17, 2019. |
| | |
| 4. | Of this number, as of December 31, 2016, 18,200,000 common shares of First Mining were subject to a contractual restriction on transfer pursuant to the share purchase agreement dated May 2, 2016 that First Mining entered into with Chalice and Chalice Gold Mines (Ontario) Inc. (the “Chalice Agreement”). Pursuant to the Chalice agreement, Chalice is not permitted to sell more than 4,032,605 shares of First Mining in any month following October 10, 2016, unless otherwise agreed to by First Mining. This resale restriction applies to Chalice until June 9, 2017. |
Material contracts
Other than contracts made in the ordinary course of business, as of the date of this AIF, we have no material contracts.
Market for our securities
Our common shares are listed and traded on the TSX-V under the symbol “FF”, on the OTC-QX under the symbol “FFMGF”, and on the Frankfurt Stock Exchange under the symbol “FMG”.
We have a registrar and transfer agent for our common shares:
Computershare Investor Services Inc.
510 Burrard Street, 2ndFloor, Vancouver, British Columbia V6C 3B9.
2016 Annual Information Form – Page 91
Trading activity
The table below shows the high and low closing prices and trading volumes of our common shares on the TSX-V for each month of our most recently completed financial year.
| 2016 | High ($) | Low ($) | Volume |
| January | 0.43 | 0.36 | 19,502,040 |
| February | 0.43 | 0.37 | 27,438,585 |
| March | 0.42 | 0.38 | 18,667,371 |
| April | 0.76 | 0.39 | 50,675,003 |
| May | 0.81 | 0.62 | 26,015,935 |
| June | 0.80 | 0.67 | 35,821,936 |
| July | 1.18 | 0.83 | 61,625,049 |
| August | 1.20 | 0.88 | 33,657,804 |
| September | 0.99 | 0.83 | 24,996,628 |
| October | 0.82 | 0.71 | 17,992,696 |
| November | 0.84 | 0.69 | 22,783,860 |
| December | 0.91 | 0.75 | 79,391,664 |
| | TOTAL | | 418,568,571 |
2016 Trading Activity: TSX-V
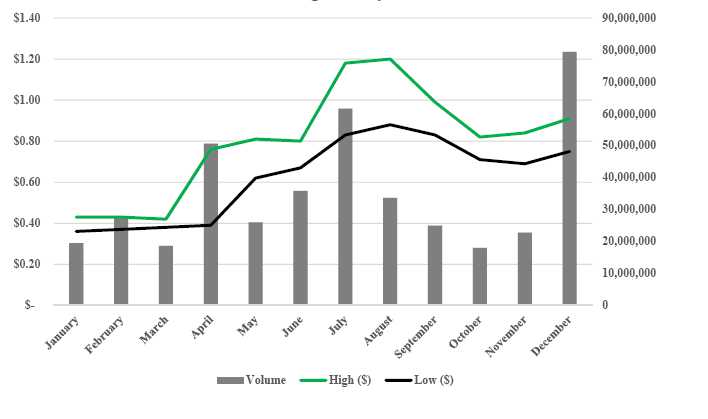
2016 Annual Information Form – Page 92
Our team
Directors
All our directors are elected for a one year term, and hold office until our next annual shareholder meeting, unless he or she resigns before that time or steps down, as required by corporate law. The directors of First Mining as of the date of this AIF are as follows:
| | | Principal occupation or employment |
| Director | Board committees | for past five years |
| | | |
 | Chairman of the Board | Director and Chairman of First Mining since |
| | March 2015 |
| Audit Committee | |
| | November 2001 to present – Founder, |
| Compensation Committee | President and Chief Executive Officer, First |
| | |
| Corporate Governance | Majestic Silver Corp. (mining company) |
| Committee | |
| | December 1998 to present – Director, First |
| | Majestic Silver Corp. (mining company) |
| | |
| | | |
| Keith Neumeyer | | |
| Zug, Switzerland | | |
| | | |
| Director since | | |
| March 30, 2015 | | |
| Ownership of Securities: | 10,305,313 shares | 356,129 warrants | 5,190,000 options |
| Director | Board committees | Principal occupation or employment |
| | | for past fiveyears |
| | | |

| Compensation Committee | Director of First Mining since April 2016 |
| (chair) | |
| September 2016 to present – Director, SIRIOS |
| | Resources Inc. (mining company) |
| | |
| | July 2016 to present – Chairman, Monarques |
| | Gold Corp. (mining company) |
| | |
| | May 2013 to present – Director, Cartier |
| | Resources Inc. (mining company) |
| | |
| | November 2011 to April 2016 – President, |
| | | Chief Executive Officer and a Director of |
| Michel Bouchard | | Clifton Star Resources Inc. (mining company) |
| Québec, Canada | | May 2009 to November 2011 – Vice- |
| | | President, Exploration and Development at |
| Director since | | North American Palladium Ltd. (mining company) |
| April 8, 2016 | | |
| Ownership of Securities: | 304,000 shares | 15,000 warrants | 1,664,000 options |
| | | | |
2016 Annual Information Form – Page 93
| Director | Board committees | Principal occupation or employment |
| | | for past five years |
| | | |

| None | Director and Chief Executive Officer of First |
| | Mining since March 2015 |
| | |
| | September 2011 to March 2015 – Chief |
| | Executive Officer, Sundance Minerals Ltd. |
| | (private mining company) |
| | |
| | April 2007 to March 2015 – President, |
| | Sundance Minerals Ltd. (private mining company) |
| | |
| | |
| | | |
| Chris Osterman, Ph.D. | | |
| Tucson, Arizona | | |
| USA | | |
| | | |
| Director since | | |
| March 30, 2015 | | |
| Ownership of Securities: | 1,760,084 shares | 8,500 warrants | 5,265,000 options |
| | | Principal occupation or employment |
| Director | Board committees | for past five years |
| | | |

| Audit Committee | Director of First Mining since March 2015 |
| (chair) | |
| | February 2007 to present – Chief Financial |
| Compensation Committee | Officer of First Majestic Silver Corp. (mining company) |
| | |
| | |
| Corporate Governance Committee | |
| | |
| | |
| | |
| | | |
| Raymond L. Polman, CPA, CA | | |
| Vancouver, British | | |
| Columbia, Canada | | |
| | | |
| Director since | | |
| March 30, 2015 | | |
| Ownership of Securities: | 333,333 shares | NIL warrants | 1,125,000 options |
| | | | |
2016 Annual Information Form – Page 94
| Director | Board committees | Principal occupation or employment |
| | | for past five years |
| | | |

| Audit Committee | Director of First Mining since March 2015 |
| | |
| Compensation Committee | June 2014 to present – Director of Medallion |
| | Resources Ltd. (mining company) |
| Corporate Governance | |
| Committee | December 2010 to present – Director of |
| (chair) | Great Quest Fertilizer Ltd. (mining company) |
| | |
| | January 2005 to present – Director, First |
| | Majestic Silver Corp. (mining company) |
| | | |
| David Shaw, Ph.D. | | |
| Vancouver, British | | June 2000 to present – President of |
| Columbia, Canada | | Duckmanton Partners Ltd. (consulting business) |
| | | |
| Director since | | November 2013 to July 2014 – Director of |
| March 30, 2015 | | Global Strategic Metals NL (capital pool company) |
| (Director of the predecessor | | |
| company, | | September 2010 to March 2013 – Director of |
| Albion Petroleum Ltd., | | Talison Lithium Inc. (mining company) |
| since April 5, 2005) | | |
| | | April 2005 to March 2015 - President and |
| | | Director of Albion Petroleum Ltd. (capital pool company) |
| | | |
| Ownership of Securities: | 713,250 shares | 50,000 warrants | 1,025,000 options |
| | | | |
2016 Annual Information Form – Page 95
Officers
The officers of our Company as of the date of this AIF are as follows:
| Officer | Principal occupation or employment for past five years |
| | |

| President of First Mining since January 2015 |
| |
| August 2012 to August 2014 – Vice President, Corporate Communications, NovaCopper Inc. (mining company) |
| |
| July 2010 to August 2012 – Vice President, Corporate Development, Hana Mining Ltd. (mining company) |
| |
| |
| |
| | |
| Patrick Donnelly | |
| President | |
| Vancouver, British | |
| Columbia | |
| Ownership of Securities: | 50,000 shares | 25,000 warrants | 5,265,000 options |
| Officer | Principal occupation or employment for past five years |
| | |

| Director and Chief Executive Officer of First Mining since March 2015 |
| |
| September 2011 to March 2015 – Chief Executive Officer, Sundance Minerals Ltd. (private mining company) |
| |
| April 2007 to March 2015 – President, Sundance Minerals Ltd. (private mining company) |
| |
| |
| |
| | |
| Chris Osterman, Ph.D. | |
| Chief Executive Officer | |
| Tucson, Arizona | |
| USA | |
| Ownership of Securities: | 1,760,084 shares | 8,500 warrants | 5,265,000 options |
2016 Annual Information Form – Page 96
| Officer | Principal occupation or employment for past five years |
| | |

| Chief Financial Officer of First Mining since September 2016 |
| |
| June 2015 to September 2016 – Controller of First Mining |
| |
| June 2013 to June 2015 – Director of Finance, Great Panther Silver Ltd. (mining company) |
| |
| October 2011 to June 2013 – Controller, Alexco Resource Corp. (mining company) |
| | |
| Andrew Marshall | |
| Chief Financial Officer | |
| | |
| Vancouver, British Columbia | |
| Canada | |
| Ownership of Securities: | 128,745 shares | 18,750 warrants | 1,100,000 options |
| Officer | Principal occupation or employment for past five years |

| |
| Vice President, Investor Relations of First Mining since July 2015 |
| |
| |
| February 2010 to July 2015 – Manager, Investor Relations, Uranerz Energy Corp. (resource company) |
| |
| |
| |
| |
| | |
| Derek Iwanaka | |
| Vice President, | |
| Investor Relations | |
| | |
| Coquitlam, British Columbia | |
| Canada | |
| Ownership of Securities: | 125,000 shares | 62,500 warrants | 1,200,000 options |
| | | | |
2016 Annual Information Form – Page 97
| Officer | Principal occupation or employment for past five years |
| | |
 | Corporate Counsel and Corporate Secretary of First Mining since June 2016 |
| |
| November 2012 to May 2016 – Corporate Counsel and Corporate Secretary of Wellgreen Platinum Ltd. (mining company) |
| |
| November 2012 to February 2013 – Corporate Counsel and Corporate Secretary, Prophecy Coal Corp. (mining company) |
| |
| September 2009 to November 2012 – Associate, Securities & Capital Markets group, Borden Ladner Gervais LLP (law firm) |
| | |
| Samir Patel, LL.B. (Hons) | |
| Corporate Counsel and | |
| Corporate Secretary | |
| | |
| Vancouver, British Columbia, | |
| Canada | |
| Ownership of Securities: | 100,000 shares | 37,700 warrants | 700,000 options |
| | | | |
To our knowledge, the total number of common shares that the directors and officers as a group either: (i) beneficially owned; or (ii) exercised direction or control over, directly or indirectly, as at the date of this AIF was 13,819,725 common shares. This represents approximately 2.5% of our outstanding common shares as at the date of this AIF (on an undiluted basis).
Interest of management and others in material transactions
To the best of our knowledge, none of the directors, executive officers or shareholders that either: (i) beneficially own; or (ii) control or direct, directly or indirectly, over 10% of any class of our outstanding securities, nor their associates or affiliates, have or have had within the three most recently completed financial years, any material interests, direct or indirect, in transactions which have materially affected, or are reasonably expected to materially affect, our Company.
Other information about our directors and officers
None of our directors or officers, or a shareholder holding a sufficient number of securities of First Mining to affect materially the control of our Company, is or was a director or executive officer of another company (including our Company) in the past 10 years that:
| • | was subject to a cease trade or similar order, or an order denying that company any exemption under securities legislation that was in effect for more than 30 consecutive days, while the director or executive officer held that role with the company; |
| | | |
| • | was involved in an event while the director or executive officer was acting in that capacity that resulted in the company being subject to one of the above orders after the director or executive officer no longer held that role with the company; or |
| | | |
| • | while acting in that capacity, or within a year of acting in that capacity, became bankrupt, made a proposal under any legislation relating to bankruptcy or insolvency or was subject to or instituted any proceedings, arrangement or compromise with creditors or had a receiver, receiver manager or trustee appointed to hold the assets of that company. |
2016 Annual Information Form – Page 98
None of them in the past 10 years:
| | • | became bankrupt; |
| | | |
| | • | made a proposal under any legislation relating to bankruptcy or insolvency; |
| | | |
| | • | has been subject to or launched any proceedings, arrangement or compromise with any creditors; or |
| | | |
| | • | had a receiver, receiver manager or trustee appointed to hold any of their assets. |
None of them has ever been subject to:
| • | penalties or sanctions imposed by a court relating to securities legislation or by a securities regulatory authority or has entered into a settlement agreement with a securities regulatory authority; or |
| | | |
| • | any other penalties or sanctions imposed by a court or regulatory body that would likely be considered important to a reasonable investor in making an investmentdecision. |
Interests of experts
Auditor
Our auditor is BDO Canada LLP, independent chartered accountants, who have audited our 2016 annual financial statements. BDO Canada LLP is independent within the meaning of the Code of Professional Conduct of the Chartered Professional Accountants of British Columbia. They are located at Suite 600, 925 West Georgia Street, Vancouver, British Columbia V6C 3L2.
Qualified persons
All technical and scientific information discussed in this AIF, including mineral resource estimates for our material properties, and all technical and scientific information for our other non-material projects, has been reviewed and approved by our Chief Executive Officer and Director, Chris Osterman, P.Geo., who is a qualified person for the purposes of NI 43-101.
The following individuals prepared the Springpole Technical Report with reference to the requirements of NI 43-101:
| | • | Dr. Gilles Arseneau, Ph.D., P.Geo., Associate Consultant (Geology), of SRK Consulting (Canada) Inc.; |
| | | |
| | • | Dr. Adrian Dance, Ph.D., P.Eng., Principal Consultant (Metallurgy), of SRK Consulting (Canada) Inc.; |
| | | |
| • | John F. Duncan, P.Eng., Principal Consultant (Water Resources Engineering), of SRK Consulting (Canada) Inc.; |
| | | |
| | • | Christopher Elliot, FAusIMM, Principal Consultant (Mining), of SRK Consulting (Canada) Inc.; |
| | | |
| | • | Mark Liskowich, P.Geo., Principal Consultant (Environmental), of SRK Consulting (Canada) Inc.; |
| | | |
| • | Bruce Murphy, FSAIMM, Principal Consultant (Geotechnical) and Practice Leader, of SRK Consulting (Canada) Inc.; |
| | | |
| | • | Michael Royle, M.App.Sci., P.Geo., Principal Consultant (Hydrogeology), of SRK Consulting (Canada) Inc.; |
2016 Annual Information Form – Page 99
| • | Dr. Ewoud Maritz Rykaart, Ph.D., P.Eng., Principal Consultant (Geotechnical Engineering), of SRK Consulting (Canada) Inc.; and |
| | | |
| | • | Dino Pilotto, P.Eng., Senior Engineer of JDS Energy & Mining Inc. |
Todd McCracken, P.Geo., Manger – Mining of WSP Canada Inc., prepared the Goldlund Technical Report with reference to the requirements of NI 43-101.
Mark Drabble, B.App.Sci (Geology), MAIG, MAusIMM, and Kahan Cervoj, B.App.Sci (Geology), MAIG, MAusIMM, Principal Consultants of Optiro Pty Limited, prepared the Cameron Gold Technical Report with reference to the requirements of NI 43-101.
B. Terrence Hennessey, P.Geo., Alan J. San Martin, MAusIMM(CP), and Sam J. Shoemaker, Jr., B.Sc., Reg’d Mem SME, of Micon International Limited, prepared the Pickle Crow Technical Report with reference to the requirements of NI 43-101.
Michael P. Cullen, M.Sc., P.Geo., of Mercator Geological Services Limited, prepared the Hope Brook Technical Report with reference to the requirements of NI 43-101.
Each of the abovementioned firms or persons hold, as either a registered or beneficial holder, less than one percent of the outstanding securities of First Mining or of any associate or affiliate of First Mining. None of the aforementioned firms or persons received any direct or indirect interest in any securities of First Mining or of any associate or affiliate of First Mining in connection with the preparation and review of any technical report or this AIF. None of the aforementioned firms or persons, nor any directors, officers or employees of such firms or persons, are currently expected to be elected, appointed or employed as a director, officer or employee of the Company or of any associate or affiliate of the Company, other than Chris Osterman, our Chief Executive Officer and a Director of First Mining.
Legal counsel
Our external legal counsel is McCullough O’Connor Irwin LLP, and they are located at Suite 2600, Oceanic Plaza, 1066 West Hastings Street, Vancouver, British Columbia V6E 3X1.
Additional information
You can find more information about First Mining under our SEDAR profile atwww.sedar.comand on our website atwww.firstminingfinance.com.
Our most recent management proxy circular dated May 9, 2016 contains additional information on how our directors and officers are compensated, the principal holders of our securities, and the securities that are authorized for issuance under our equity compensation plans, and is available on SEDAR.
For additional financial information about First Mining, see our audited consolidated annual financial statements and management’s discussion and analysis for the financial year ended December 31, 2016, which are also available on SEDAR.
Copies of the above documents may be obtained from First Mining by contacting us at Suite 1805 – 925 West Georgia Street, Vancouver, British Columbia V6C 3L2, telephone: 1.844.306.8827.
2016 Annual Information Form – Page 100