Exhibit 99.7
MANAGEMENT’S DISCUSSION AND ANALYSIS
MARCH 23, 2016

MD&A Table of Contents
| | | | |
Forward-looking Statements | | | 1 | |
| |
Executive Summary | | | 5 | |
| |
Company Overview and Business Segments | | | 6 | |
| |
Recent Events | | | 8 | |
| |
Results of Operations | | | 12 | |
| |
Segment Reserve and Gross Profit | | | 13 | |
| |
Corporate and Other Costs | | | 16 | |
| |
Balance Sheet Changes | | | 19 | |
| |
Selected Quarterly Financial Information | | | 20 | |
| |
Liquidity and Capital Resources | | | 21 | |
| |
Lending Arrangements and Debt | | | 23 | |
| |
Contractual Obligations and Purchase Consideration | | | 25 | |
| |
Related Party Transactions | | | 26 | |
| |
Non IFRS Financial Measures | | | 27 | |
| |
Critical Accounting Estimates | | | 30 | |
| |
Contingencies | | | 33 | |
| |
Off Balance Sheet Arrangements | | | 34 | |
| |
Outstanding Share Data | | | 34 | |
| |
Disclosure Controls and Procedures and Internal Control over Financial Reporting | | | 35 | |
The following Management’s Discussion and Analysis (“MD&A”) was prepared as of March 23, 2016 and should be read in conjunction with the audited consolidated financial statements and related notes for the years ended December 31, 2015 and 2014 of Concordia Healthcare Corp. (“Concordia” or the “Company”, or “we” or “us” or “our”), which were prepared in accordance with International Financial Reporting Standards (“IFRS”) as issued by the International Accounting Standards Board (“IASB”). Amounts are stated in thousands of U.S. Dollars, which is the reporting currency of the Company, unless otherwise noted. Certain prior period financial information has been presented to conform to the current period presentation.
Some of the statements contained in this MD&A constitute forward-looking information and forward-looking statements within the meaning of applicable Canadian securities legislation and forward-looking statements within the meaning of the United States Private Securities Litigation Reform Act of 1995 (collectively, “forward-looking information”). See “Forward-Looking Statements” for a discussion of certain risks, uncertainties, and assumptions relating to forward-looking information. Additional information relating to the Company, including the Company’s Annual Information Form, is available on SEDAR atwww.sedar.com and on EDGAR atwww.sec.gov. The results of operations, business prospects and financial condition of Concordia will be affected by, among other things, the “Risk Factors” set out in Concordia’s Annual Information Form dated March 23, 2016 available on SEDAR atwww.sedar.com, Concordia’s Registration Statement on form 40-F and other documents filed with the United States Securities and Exchange Commission (“SEC”), available on EDGAR atwww.sec.gov.
Certain measures used in this MD&A do not have any standardized meaning under IFRS. When used, these measures are defined in such terms as to allow the reconciliation to the closest IFRS measure. See “Selected Quarterly Financial Information”, “Results of Operations” and “Non-IFRS Financial Measures”.
Forward-looking Statements
Certain statements contained in this MD&A constitute “forward looking statements” within the meaning of the United States Private Securities Litigation Reform Act of 1995 and “forward-looking information” within the meaning of applicable Canadian securities laws (collectively, “forward-looking statements”), which are based upon the current internal expectations, estimates, projections, assumptions and beliefs of the Company’s management (“Management”). Statements concerning the Company’s objectives, goals, strategies, intentions, plans, beliefs, assumptions, projections, predictions, expectations and estimates, and the business, operations, future financial performance and condition of the Company are forward-looking statements. This MD&A uses words such as “believe”, “expect”, “anticipate”, “estimate”, “intend”, “may”, “will”, “would”, “could”, “plan”, “create”, “designed”, “predict”, “project”, “seek”, “ongoing”, “increase”, “upside” and similar expressions and the negative and grammatical variations of such expressions are intended to identify forward-looking statements, although not all forward-looking statements contain these identifying words. Such forward-looking statements reflect the current beliefs of Management based on information currently available to them, and are based on assumptions and subject to risks and uncertainties. These statements are not guarantees of future performance and involve known and unknown risks, uncertainties and other factors that may cause actual results or events to differ materially from those anticipated in the forward-looking statements. In addition, this MD&A may contain forward-looking statements attributed to third-party industry sources.
By their nature, forward-looking statements involve numerous assumptions, known and unknown risks and uncertainties, both general and specific, that contribute to the possibility that the predictions, forecasts, projections or other characterizations of future events or circumstances that constitute forward-looking statements will not occur. Such forward-looking statements in this MD&A speak only as of the date of this MD&A. Forward-looking statements in this MD&A include, but are not limited to, statements with respect to:
| | |
| Concordia 2015 Management Discussion and Analysis | | Page 1 |
| | • | | the ability of the Company to compete against companies that are larger and have greater financial, technical and human resources than that of the Company, as well as other competitive factors, such as technological advances achieved, patents obtained and new products introduced by competitors; |
| | • | | the performance of the Company’s business and operations; |
| | • | | the Company’s capital expenditure programs; |
| | • | | the future development of the Company, its growth strategy and the timing thereof; |
| | • | | the acquisition strategy of the Company; |
| | • | | the Company’s ability to achieve all of the estimated synergies from its acquisitions as a result of cost reductions and/or integration initiatives; |
| | • | | the estimated future contractual obligations of the Company; |
| | • | | the Company’s future liquidity and financial capacity; |
| | • | | the supply and market changes in demand for pharmaceutical products within the Company’s portfolio of pharmaceutical products; |
| | • | | cost and reimbursement of the Company’s products; |
| | • | | expectations regarding the Company’s ability to raise capital; |
| | • | | the availability and extent to which the Company’s products are reimbursed by government authorities and other third party payors, as well as the impact of obtaining or maintaining such reimbursement on the price of the Company’s products; |
| | • | | changes in regulatory rules or practices in the U.S. or in other jurisdictions in which the Company sells products; |
| | • | | the inclusion of the Company’s products on formularies or the Company’s ability to achieve favourable formulary status, as well as the impact on the price of the Company’s products in connection therewith; and |
| | • | | the acquisition and/or launch of new products including, but not limited to, the acceptance and demand for new pharmaceutical products, and the impact of competitive products and prices. |
With respect to the forward-looking statements contained in this MD&A, the Company has made assumptions regarding, among other things:
| | • | | the ability of the Company to comply with its contractual obligations, including, without limitation, its obligations under debt arrangements; |
| | • | | the successful licensing of products to third parties to market and distribute such products on terms favourable to the Company; |
| | • | | the ability of the Company to maintain key strategic alliances, and licensing and partnering arrangements, now and in the future; |
| | • | | the ability of the Company to maintain its distribution networks and distribute its products effectively despite significant geographical expansion; |
| | • | | the general regulatory environment in which the Company operates, including the areas of taxation, environmental protection, consumer safety and health regulation; |
| | • | | the tax treatment of the Company and its subsidiaries and the materiality of legal proceedings; |
| | • | | the timely receipt of any required regulatory approvals; |
| | • | | the general economic, financial, market and political conditions impacting the industry and countries in which the Company operates; |
| | • | | the ability of the Company to sustain or increase profitability, fund its operations with existing capital, and/or raise additional capital to fund future acquisitions; |
| | • | | the ability of the Company to acquire any necessary technology, products or businesses and effectively integrate such acquisitions; |
| | • | | the development and clinical testing of products under development; |
| | |
| Concordia 2015 Management Discussion and Analysis | | Page 2 |
| | • | | the ability of the Company to obtain necessary approvals for commercialization of the Company’s products from the U.S. Food and Drug Administration (“FDA”) or other regulatory authorities; |
| | • | | future currency exchange and interest rates; |
| | • | | reliance on third party contract manufacturers to manufacture the Company’s products on favourable terms; |
| | • | | the ability of the Company to generate sufficient cash flow from operations and to access existing and proposed credit facilities and the capital markets to meet its future obligations on acceptable terms; |
| | • | | potential generic competition to the Company’s branded pharmaceutical products; |
| | • | | the availability of raw materials and finished products necessary for the Company’s products; |
| | • | | the impact of increasing competition; |
| | • | | the ability of the Company to obtain and retain qualified staff, equipment and services in a timely and efficient manner; |
| | • | | the ability of the Company to maintain and enforce the protection afforded by any patents or other intellectual property rights; |
| | • | | the ability of the Company to conduct operations in a safe, efficient and effective manner; |
| | • | | the results of continuing and future safety and efficacy studies by industry and government agencies related to the Company’s products; and |
| | • | | the ability of the Company to successfully market its products and services. |
Forward-looking statements contained in this MD&A are based on the key assumptions described herein. Readers are cautioned that such assumptions, although considered reasonable by the Company, may prove to be incorrect. Actual results achieved during the forecast period will vary from the information provided in this MD&A as a result of numerous known and unknown risks and uncertainties and other factors. The Company cannot guarantee future results.
Risks related to forward-looking statements include those risks referenced in the Company’s filings with the Canadian Securities Regulators and the U.S. Securities and Exchange Commission. Some of the risks and other factors which could cause actual results to differ materially from those expressed in the forward-looking statements contained in this MD&A include, but are not limited to, the risk factors included under the heading“Risk Factors” in the Company’s Annual Information Form dated March 23, 2016, which is available on SEDAR, online atwww.sedar.com and on EDGAR, online at www.sec.gov.
Forward-looking statements contained in this MD&A are based on management’s current plans, expectations, estimates, projections, beliefs and opinions and the assumptions relating to those plans, expectations, estimates, projections, beliefs and opinions may change. Management of the Company has included the above summary of assumptions and risks related to forward-looking statements included in this MD&A for the purpose of assisting the reader in understanding Management’s current views regarding those future outcomes.Readers are cautioned that this information may not be appropriate for other purposes. Readers are cautioned that the lists of assumptions and risk factors contained herein are not exhaustive. Neither the Company nor any other person assumes responsibility for the accuracy or completeness of the forward-looking statements contained herein.
Such forward-looking statements are made as of the date of this MD&A and the Company disclaims any intention or obligation to update publicly any such forward-looking statements, whether as a result of new information, future events or results or otherwise, other than as required by applicable securities laws.
All of the forward-looking statements made in this MD&A are expressly qualified by these cautionary statements and other cautionary statements or factors contained herein, and there can be no assurance that the actual results or developments will be realized or, even if substantially realized, that they will have the expected consequences to, or effects on, the Company.
| | |
| Concordia 2015 Management Discussion and Analysis | | Page 3 |
Actual results, performance or achievement could differ materially from that expressed in, or implied by, any forward-looking statement in this MD&A, and, accordingly, investors should not place undue reliance on any such forward-looking statement. New factors emerge from time to time and the importance of current factors may change from time to time and it is not possible for Management to predict all of such factors, or changes in such factors, or to assess in advance the impact of each such factors on the business of Concordia or the extent to which any factor, or combination of factors, may cause actual results to differ materially from those contained in any forward-looking statement contained in this MD&A.
Trademarks
This MD&A includes trademarks that are protected under applicable intellectual property laws and are the property of Concordia or its affiliates or its licensors. Solely for convenience, the trademarks of Concordia, its affiliates and/or its licensors referred to in this MD&A may appear with or without the® or TM symbol, but such references or the absence thereof are not intended to indicate, in any way, that the Company or its affiliates or licensors will not assert, to the fullest extent under applicable law, their respective rights to these trademarks. Any other trademarks used in this MD&A are the property of their respective owners.
| | |
| Concordia 2015 Management Discussion and Analysis | | Page 4 |
Executive Summary
During 2015, we experienced tremendous growth. Our product portfolio expanded from six products at the end of 2014 to over two hundred products by the end of 2015 primarily as a result of strategic acquisitions completed during the year. We have focused on building a business platform that is expected to have the following strategic and financial benefits:
| | • | | Strong Financial Returns |
Financial results that have increases in revenue, adjusted EBITDA, adjusted earnings per share and cash flow metrics
| | • | | Product Diversification |
With over 200 products, our business is not expected to be unduly dependent on any individual product. No single product in our portfolio currently accounts for more than 10% of consolidated group revenue on a pro forma basis.
| | • | | Platform for International Expansion |
Ability to expand international sales through the combination of the complementary legacy Concordia North America and Concordia International businesses.
Sales in over 100 countries either through direct sales efforts or distribution agreements to maximize growth opportunities.
| | • | | Opportunities for Organic Growth |
Growth opportunities with a pipeline of approximately 60 expected product launches/line extensions anticipated to be launched over the next 3 years
Growth experienced in 2015 has positioned us to focus on the planned integration and business optimization of our newly combined enterprise in 2016. Our ability to generate strong earnings and cash flows from operations is expected to provide us the opportunity to de-lever the business by repaying our lending commitments.
| | |
| Concordia 2015 Management Discussion and Analysis | | Page 5 |
Company Overview and Business Segments
On December 20, 2013 the Company entered into an amalgamation agreement (the “Amalgamation Agreement”) and completed its qualifying transaction pursuant to the policies of the TSX Venture Exchange (the “Qualifying Transaction”). The Qualifying Transaction proceeded by way of a “three-cornered” amalgamation among Mercari Acquisition Corp. (“Mercari”), a capital pool company listed on the NEX board of the TSX Venture Exchange, Mercari Subco Inc., a wholly-owned subsidiary of Mercari, and Concordia Healthcare Inc. (“CHI”), a private Ontario corporation incorporated on December 5, 2012. On December 18, 2013, and prior to the completion of the Qualifying Transaction, Mercari changed its name to “Concordia Healthcare Corp.” and completed a consolidation of its share capital on a basis of one post-consolidation common share for every 48.08 common shares existing immediately before the consolidation. The Qualifying Transaction resulted in a reverse takeover of Mercari by the shareholders of CHI.
Immediately upon completion of the Qualifying Transaction, the shareholders of CHI held 98.5% of the shares of the amalgamated corporation, and for accounting purposes CHI was deemed the acquirer. The Qualifying Transaction constituted a reverse takeover but did not meet the definition of a business combination under IFRS 3; accordingly, the Company has accounted for the transaction in accordance with IFRS 2. The assets and liabilities of Mercari have been included in the Company’s consolidated balance sheet at fair value, which approximate their pre-combination carrying values. Mercari’s shares were delisted from the NEX board of the TSX Venture Exchange.
The Company’s shares were listed for trading on the Toronto Stock Exchange (the “TSX”) under the symbol “CXR” on December 24, 2013 and listed for trading on the NASDAQ Global Select Market® (“NASDAQ”) under the symbol “CXRX” on June 29, 2015. On January 1, 2016, by way of a short form vertical amalgamation, CHI amalgamated with the Company. The name of the amalgamated entity remained “Concordia Healthcare Corp.”
The registered and head office of the Company is located at 277 Lakeshore Rd. East, Suite 302, Oakville, Ontario, L6J 1H9. The Company’s records office is located at 333 Bay St., Suite 2400, Toronto, Ontario, M56 2T6.
With the October 21, 2015 acquisition of AMCo and the Company’s evolving corporate strategy, management re-evaluated its business segments and the manner in which operating results would be reported and their performance assessed. The Company previously had three business segments: Legacy Pharmaceuticals Division, Orphan Drug Division and the Specialty Healthcare Distribution Division. In December 2015, the Company resolved to dissolve and discontinue the Specialty Healthcare Distribution Division which operated through Complete Medical Homecare, Inc. as it was no longer a key segment to the Company’s future business plans. The following three business segments were applicable on a go forward basis in assessing performance of the business: Concordia North America, Concordia International, Orphan Drugs, plus a Corporate cost center.
Concordia North America
Formerly the Legacy Pharmaceuticals Division, the Concordia North America segment has a diversified product portfolio that focuses primarily on the United States pharmaceutical market. These products include, but are not limited to, Donnatal® for the treatment of irritable bowel syndrome; Zonegran® for the treatment of partial seizures in adults with epilepsy; Nilandron® for the treatment of metastatic prostate cancer; Lanoxin® for the treatment of mild to moderate heart failure and atrial fibrillation; and Plaquenil® for the treatment of lupus and rheumatoid arthritis. Concordia North America’s product portfolio consists of branded and authorized generic products. The segment’s products are manufactured and sold through an out-sourced production and distribution network.
| | |
| Concordia 2015 Management Discussion and Analysis | | Page 6 |
Concordia International
Concordia International is comprised of the AMCo group of companies acquired by Concordia on October 21, 2015, which consists of a diversified portfolio of branded and generic products that are sold to wholesalers, hospitals and pharmacies in over 100 countries. Concordia International specializes in the acquisition, licensing and development of off-patent prescription medicines, which may be niche, hard to make products. The segment’s over 190 molecules are manufactured and sold through an out-sourced manufacturing network and marketed internationally through a combination of direct sales and local distribution relationships. Concordia International mainly operates outside of the North American marketplace.
Orphan Drugs
The Company’s Orphan Drugs segment is intended to provide growth opportunities through the expansion into new indications and new markets for existing or acquired orphan drugs. In its initial execution of its orphan drug strategy, CHI, through its subsidiaries, acquired the orphan drug, Photofrin® through the acquisition of Pinnacle Biologics Inc. (“Pinnacle”) in 2013. Today, Photofrin® is owned by Concordia Laboratories Inc. S.à r.l (“CLI”) and is the primary focus of the Orphan Drugs segment. Photofrin® is FDA approved and has orphan drug status in respect of esophageal cancer and high-grade dysplasia in Barrett’s esophagus. In addition, Photofrin® is FDA approved for the treatment of non-small cell lung cancer. Global sales (outside United States) are through the Barbados branch of CLI. All distribution in the United States is through Pinnacle.
Corporate
Represents certain centralized costs including costs associated with Concordia’s head office in Canada and costs associated with being a public reporting entity.

| | |
| Concordia 2015 Management Discussion and Analysis | | Page 7 |
Recent Events
The Amdipharm Mercury Limited Acquisition
On October 21, 2015 (the “AMCo Closing Date”), the Company, through a wholly owned subsidiary, completed the acquisition (the “AMCo Acquisition”) of 100% of the outstanding shares of AMCo from Cinven, a European private equity firm, and certain other sellers (collectively the “Vendors”). For a description of AMCo, please see“Company Overview and Business Segments – Concordia International”.
The AMCo Acquisition provided Concordia with a diversified portfolio of more than 190 off-patent molecules, entry into new therapeutic areas such as endocrinology, ophthalmology and urology, and an international platform with access to over 100 countries.
Concordia, through its wholly-owned subsidiary, acquired AMCo for total consideration of $3.11 billion including cash consideration of approximately £800 million (with a value at closing of $1.24 billion), 8.49 million common shares of the Company (with a value at closing of $230.8 million) and daily interest of £272,801 (with a value at closing of $47.7 million) that accrued from June 30, 2015 to October 21, 2015. In addition, the Company will pay to the Vendors a maximum cash earn-out of £144 million (fair value $206.5 million) based on AMCo’s future gross profit over a period of 12 months from October 1, 2015.
As part of the purchase commitment, the Company repaid on the AMCo Closing Date, AMCo’s existing senior secured facilities in the respective principal amounts of £581 million and €440 million plus accrued interest and related cross-currency swaps. The total value of all these items as at the AMCo Closing Date was $1.4 billion. Concurrent with the closing of the AMCo Acquisition, the Company also repaid, in full, the outstanding principal balance of its then existing RBC Term Facility of $573.6 million.
The cash portion of the purchase price for the AMCo Acquisition in the amount of $1.24 billion plus the funds required to repay AMCo’s existing debt in the amount of $1.4 billion and to repay the Company’s existing RBC Term Facility was funded by a combination of cash on hand and debt and equity financings. In that respect the Company: (i) completed an equity offering whereby it issued 8,000,000 common shares of the Company at a price of US$65.00 per share for gross proceeds to Concordia of $520 million (the “AMCo Offering”) which closed on September 30, 2015; (ii) entered into a credit agreement (the “Credit Facility”) with a syndicate of lenders for senior secured term loans of $1.1 billion and £500 million; (iii) entered into two bridge loans for an aggregate amount of $180 million; and (iv) issued senior notes in the principal amount of $790 million. The AMCo Offering was completed pursuant to an underwriting agreement with a syndicate of underwriters.
Concordia entered into the Credit Facility on October 21, 2015 pursuant to which a syndicate of lenders made secured term loans in the aggregate amounts of $1.1 billion in one tranche (the “USD Term Loan”) and £500 million in a separate tranche (the “GBP Term Loan” and together with the USD Term Loan, the “Term Loans”) and made available to Concordia a secured revolving loan in the aggregate outstanding principal amount of up to $200 million (the “Revolving Credit Facility”). The Revolving Credit Facility is currently not drawn upon and remains undrawn to date. All obligations of the Company under the Credit Facility are guaranteed by all material subsidiaries of the Company and secured by first priority security interests in the assets of the Company and the assets of and equity interests in its material subsidiaries. The Term Loans mature on October 21, 2021, have variable interest rates and require fixed payments over the term to maturity as well as mandatory repayments
| | |
| Concordia 2015 Management Discussion and Analysis | | Page 8 |
based on excess cash flow generated by the Company, calculated annually commencing in 2016. Interest rates on the Term Loans are calculated based on LIBOR plus applicable margins, with a LIBOR floor of 1%.
In addition, on the AMCo Closing Date, a syndicate of lenders provided the Company with: (i) a senior unsecured equity bridge term loan facility in an aggregate principal amount of $135 million (the “Extended Bridge Loans”); and (ii) a senior unsecured equity bridge term loan facility in an aggregate principal amount of $45 million (the “Equity Bridge Loans” and together with the Extended Bridge Loans, the “Bridge Facilities”). All obligations of the Company under the Bridge Facilities, subject to certain customary exceptions, are guaranteed by all material subsidiaries of the Company. The Extended Bridge Loans carry a maturity of seven years and an interest rate of 9.5% for two years. If the Extended Bridge Loans are not repaid on or prior to October 21, 2017, the interest rate will increase to 11.5% and the lenders holding the Extended Bridge Loans will have the right to convert the Extended Bridge Loans into a five-year bond. The Equity Bridge Loans carry a maturity of two years and an interest rate of 9.5%. On December 18, 2015, the Company repaid $11.25 million of the Equity Bridge Loans and $33.75 million of the Extended Bridge Loans.
On the AMCo Closing Date the Company also issued $790 million in aggregate principal amount of 9.5% senior notes due 2022 (the “October 2015 Notes”). The October 2015 Notes bear interest at a rate of 9.5%, which will be paid on June 15 and December 15 of each year, beginning on June 15, 2016 and will mature on October 21, 2022. Prior to December 15, 2018, the Company may redeem up to 35% of the October 2015 Notes with the net proceeds of certain equity offerings at a premium plus accrued and unpaid interest to the date of redemption. Prior to December 15, 2018, the Company may also redeem the October 2015 Notes in whole or in part upon payment of a make-whole premium plus accrued and unpaid interest to the date of redemption. On and after December 15, 2018, the Company may redeem the October 2015 Notes in whole or in part at certain specified redemption prices. If certain assets are sold or in the event of a change of control, the Company may be required to repurchase some or all of the October 2015 Notes. The October 2015 Notes are guaranteed, jointly and severally, on a senior unsecured basis by certain existing and future direct and indirect subsidiaries of the Company (the “Guarantors”). The October 2015 Notes and the guarantees rank senior in right of payment to all of Concordia’s subordinated indebtedness, as well as the subordinated indebtedness of the Guarantors, and equal in right of payment with all of Concordia’s and the Guarantors’ existing and future senior indebtedness, including indebtedness under the Term Loans. The October 2015 Notes effectively are subordinated to all of Concordia’s existing and future secured indebtedness, as well as the secured indebtedness of the Guarantors, to the extent of the value of the assets securing such indebtedness. The October 2015 Notes and guarantees also are structurally subordinated to all existing and future obligations, including indebtedness and trade payables, of any of Concordia’s subsidiaries that do not guarantee the October 2015 Notes.
The Covis Acquisition
On April 21, 2015, the Company completed the acquisition of substantially all of the commercial assets of privately held Covis Pharma S.à.r.l and Covis Injectables, S.à.r.l (together “Covis”) for $1.2 billion in cash (the “Covis Acquisition”). The drug portfolio acquired from Covis (the “Covis Portfolio”) included branded pharmaceuticals, injectables and authorized generics that address medical conditions in various therapeutic areas including cardiovascular, central nervous system, oncology and acute care markets. On October 5, 2015, the Company sold three of the injectable products acquired from Covis; Fortaz®, Zantac® and Zinacef®®, for $10 million and $1 million for purchased inventory.
| | |
| Concordia 2015 Management Discussion and Analysis | | Page 9 |
The Covis Acquisition was structured as an all-cash transaction with a purchase price of $1.2 billion for the Covis Portfolio. The Company paid for the acquisition through a mix of term loans, bonds and equity as further described below.
Concurrent with the closing of the Covis Acquisition, the Company entered into a credit agreement (the “RBC Credit Agreement”) dated April 21, 2015, by and among the Company, certain of the Company’s subsidiaries, the Royal Bank of Canada, Morgan Stanley Senior Funding, Inc., TD Securities (USA) LLC, GE Capital Markets, Inc., Fifth Third Bank and certain lenders party thereto (collectively, the “Lenders”). Pursuant to the terms of the RBC Credit Agreement, the Lenders agreed to provide senior secured credit facilities in an aggregate principal amount of up to $700 million comprising: (i) a senior secured revolving credit facility (the “RBC Revolving Facility”) in an aggregate principal amount of up to $125 million; and (ii) a senior secured term loan facility (the “RBC Term Facility”) in an aggregate principal amount of $575 million (together, the “RBC Bank Facilities”). The RBC Bank Facilities were secured by the assets of the Company and the assets of the Company’s material subsidiaries. The Company did not draw on the RBC Revolving Facility. The RBC Term Facility was repaid concurrent with the closing of the AMCo Acquisition and the related financings and all security interests in the assets of the Company and the assets of the Company’s material subsidiaries were discharged and released.
The funds made available to the Company under the RBC Term Facility were used to partially fund (i) the purchase price for the Covis Acquisition; (ii) the fees and expenses incurred in connection with the Covis Acquisition; and (iii) the repayment and retirement of the Company’s existing outstanding debt at the time issued pursuant to the terms and provisions of an amended and restated credit facility with GE Capital Canada Finance Inc. (the “Amended and Restated GE Credit Facility”).
In connection with the Covis Acquisition, Concordia also closed a private offering of $735 million of its 7.00% Senior Notes due 2023 (the “Senior Notes”). The Senior Notes were priced at an issue price of 100.00% of their face amount to yield 7.00%. Interest on the Senior Notes is payable semi-annually on April 15th and October 15th of each year. The Company is not required to make mandatory redemption or sinking fund payments with respect to the Senior Notes.
The net proceeds of the offering of the Senior Notes were used to partially fund (i) the purchase price for the Covis Acquisition; and (ii) the fees and expenses incurred in connection with the Covis Acquisition.
On April 8, 2015, Concordia closed a short form prospectus offering, on a “bought deal” basis, of 4,329,428 subscription receipts (the “Covis Subscription Receipts”) of the Company, which included the exercise by the Underwriters (as defined below) of an over-allotment option of 15%, for aggregate gross proceeds to Concordia of CAD $368,001,380 (the “Covis Offering”).
The Covis Offering was completed at a price per Covis Subscription Receipt of CAD $85.00 by a syndicate of underwriters led by RBC Capital Markets, as sole bookrunner and co-lead manager, and including GMP Securities L.P., as co-lead manager, and TD Securities Inc. (collectively, the “Underwriters”). Upon closing of the Covis Offering, the Underwriters received payment for their expenses and 50% of their commission under the Covis Offering.
Upon closing of the Covis Acquisition each holder of Covis Subscription Receipts automatically received, without payment of additional consideration or further action, one Concordia common share in exchange for each Covis Subscription Receipt held.
The net proceeds of the Covis Offering were used to partially fund: (1) the purchase price for the Covis Acquisition; and (ii) the fees and expenses incurred in connection with the Covis Acquisition. Sufficient funds to pay a dividend
| | |
| Concordia 2015 Management Discussion and Analysis | | Page 10 |
equivalent amount equal to $0.075 per Covis Subscription Receipt (less applicable withholding taxes, if any), as a result of the dividends declared on each common share by Concordia with a record date of April 15, 2015, were held in escrow and released from escrow and paid concurrent with the payment of the Company’s dividend to all holders of common shares on April 30, 2015. The funds in excess of the amount required to satisfy the dividend equivalent amount were remitted to the Company.
| | |
| Concordia 2015 Management Discussion and Analysis | | Page 11 |
Results of Operations
| | | | | | | | | | | | | | | | |
For the years ended (in 000’s) | | 2015 | | | 2014 | | | Change | | | % | |
Revenue | | $ | 394,224 | | | $ | 104,941 | | | $ | 289,283 | | | | 276 | % |
Adjusted Gross Profit(1) | | | 333,862 | | | | 90,300 | | | $ | 243,562 | | | | 270 | % |
Adjusted Gross Profit % | | | 85 | % | | | 86 | % | | | | | | | | |
Total operating expenses | | | 219,479 | | | | 61,949 | | | $ | 157,530 | | | | 254 | % |
Operating income, continuing operations | | | 80,451 | | | | 28,351 | | | $ | 52,100 | | | | 184 | % |
Income taxes | | | (22,011 | ) | | | 7,316 | | | $ | (29,327 | ) | | | -401 | % |
Net income (loss), continuing operations | | $ | (29,425 | ) | | $ | 8,895 | | | $ | (38,320 | ) | | | -431 | % |
EBITDA(1) | | $ | 152,682 | | | $ | 38,119 | | | $ | 114,563 | | | | 301 | % |
Adjusted EBITDA(1) | | $ | 265,687 | | | $ | 59,502 | | | $ | 206,185 | | | | 347 | % |
Adjusted EPS(1) | | $ | 4.38 | | | $ | 1.75 | | | $ | 2.63 | | | | 150 | % |
Earnings (loss) per share, from continuing operations | | | | | | | | | | | | | | | | |
Basic | | | $(0.81 | ) | | | $0.34 | | | | $(1.15 | ) | | | -338 | % |
Diluted | | | $(0.81 | ) | | | $0.33 | | | | $(1.14 | ) | | | -345 | % |
Earnings (loss) per share, including discontinuing operations | | | | | | | | | | | | | | | | |
Basic | | | $(0.87 | ) | | | $0.45 | | | | $(1.32 | ) | | | -293 | % |
Diluted | | | $(0.87 | ) | | | $0.43 | | | | $(1.30 | ) | | | -302 | % |
Amounts shown above are results from continuing operations, excluding discontinued operations, unless otherwise noted.
Notes:
| (1) | Represents a non-IFRS measure. For the relevant definitions and reconciliation to reported results, see “Non-IFRS Financial Measures”. |
Revenues of $394,224 increased by $289,283 or 276% primarily due to $115,721 of revenues from the Concordia International segment acquired on October 21, 2015 and $127,413 from the Covis Portfolio acquired on April 21, 2015.
Adjusted gross profit of $333,862 increased by $243,562 or 270%. Total adjusted gross profit includes $244,572 from the Concordia North America segment, $81,006 from the Concordia International segment and $8,284 from the Orphan Drug segment, which are further discussed in the segment performance section of this MD&A.
The change in adjusted gross profit percentage of 100 bps reflects the impact of higher margins associated with the acquisition of the Covis Portfolio, offset by lower margins related to the Concordia International business segment, which was included in consolidated results beginning on October 21, 2015.
Our 2015 net loss of $29,425 was primarily due to acquisition related and restructuring expenses incurred by Corporate (refer to Corporate section) of $57,207 and accelerated amortization of debt issue costs of $26,323, offset by higher revenues, gross profit and operating income earned during 2015. Acquisition related expenses related to the acquisitions of the Covis Portfolio and AMCo during 2015.
Total 2015 Adjusted EBITDA of $265,687 grew $206,185 or 347% during 2015. Contribution of Adjusted EBITDA by segment was $217,321 from Concordia North America, $64,263 from Concordia International, ($2,419) from Orphan Drugs. In addition the Company incurred ($13,478) of Corporate costs.
| | |
| Concordia 2015 Management Discussion and Analysis | | Page 12 |
Segment Revenue and Gross Profit
Concordia North America
| | | | | | | | | | | | | | | | |
For the years ended (in 000’s) | | 2015 | | | 2014 | | | Change | | | % | |
Revenue | | | 268,299 | | | | 94,277 | | | | 174,022 | | | | 185 | % |
Cost of sales(1) | | | 23,727 | | | | 12,784 | | | | 10,943 | | | | 86 | % |
Adjusted Gross Profit(2) | | $ | 244,572 | | | $ | 81,493 | | | $ | 163,079 | | | | 200 | % |
Adjusted Gross Profit % | | | 91 | % | | | 86 | % | | | | | | | | |
Notes:
| (1) | Cost of Sales excluding non-cash fair value adjustments to inventory acquired in a business combination. |
| (2) | Represents a non-IFRS measure. For the relevant definitions and reconciliation to reported results, see “Non-IFRS Financial Measures”. |
Revenue grew during 2015 primarily by the following factors:
| | • | | $127,413 revenue from the Covis Portfolio acquired on April 21, 2015; and |
| | • | | A full year impact of revenue from Donnatal® and Zonegran® acquired in May and September 2014 respectively offset by declines in other legacy revenue. The Company began to expand its salesforce with respect to Donnatal® toward the end of 2015 and continuing into 2016 through an out-sourced sales contract provider. |
Cost of sales during the years ended 2015 and 2014 were $23,727 and $12,784, respectively, and reflect costs of active pharmaceutical ingredients, excipients, manufacturing, packaging, freight costs and royalties.
Adjusted gross profit was positively impacted during 2015 by the following factors:
| | • | | $115,492 additional gross margin from the Covis Portfolio acquired on April 21, 2015; and |
| | • | | $46,526 of gross margin increases in 2015 compared to 2014 relating primarily to a full year impact of the 2014 acquisitions of Donnatal® and Zonegran® |
Adjusted gross profit % increased by 500 bps in 2015 as a result of the Covis Portfolio acquired during the year. Adjusted gross margin % was also positively impacted by a full year of Donnatal® in 2015 offset by decreases including the impact of generic competition within the portfolio.
| | |
| Concordia 2015 Management Discussion and Analysis | | Page 13 |
Concordia International
| | | | | | | | | | | | | | | | |
For the years ended (in 000’s) | | 2015 | | | 2014 | | | Change | | | % | |
Revenue | | | 115,721 | | | | — | | | | 115,721 | | | | 100 | % |
Cost of sales(1) | | | 34,715 | | | | — | | | | 34,715 | | | | 100 | % |
Adjusted Gross Profit(2) | | $ | 81,006 | | | | — | | | $ | 81,006 | | | | 100 | % |
Adjusted Gross Profit % | | | 70 | % | | | — | | | | | | | | | |
Notes:
| (1) | Cost of Sales excluding non-cash fair value adjustments to inventory acquired in a business combination. |
| (2) | Represents a non-IFRS measure. For the relevant definitions and reconciliation to reported results, see “Non-IFRS Financial Measures”. |
Revenues for Concordia International represent sales for the 72 day period from the acquisition of AMCo on October 21, 2015 to December 31, 2015. Concordia International’s sales comprise of the sale of over 190 molecules in over 100 countries.
Cost of sales of $34,715 reflect costs of active pharmaceutical ingredients, excipients, manufacturing, packaging and freight and distribution costs.
Adjusted gross profit was $81,006, or 70%, during the 72 day period of results since the date of acquisition.
| | |
| Concordia 2015 Management Discussion and Analysis | | Page 14 |
Orphan Drugs
| | | | | | | | | | | | | | | | |
For the years ended (in 000’s) | | 2015 | | | 2014 | | | Change | | | % | |
Revenue | | | 10,204 | | | | 10,664 | | | | (460 | ) | | | -4 | % |
Cost of sales | | | 1,920 | | | | 1,857 | | | | 63 | | | | 3 | % |
Gross Profit | | $ | 8,284 | | | $ | 8,807 | | | $ | (523 | ) | | | -6 | % |
Gross Profit % | | | 81 | % | | | 83 | % | | | | | | | | |
Orphan Drugs revenue declined modestly compared to the prior year. Revenues of the segment primarily relate to sales of Photofrin®. In order to seek additional use indications for Photofrin®, the Company is currently in Phase III of clinical trials to expand the product use in the treatment of Cholangiocarcinoma cancer.
Cost of sales were consistent between 2015 and 2014 and adjusted gross profit was impacted by a modest decline in revenues over the period. Adjusted gross profit and cost of sales were mainly consistent year over year.
Gross Profit in 2015 of $8,284, or 81%, resulting in a 200 bps decline of $523 which is substantially consistent with the decline in sales.
| | |
| Concordia 2015 Management Discussion and Analysis | | Page 15 |
Corporate and other costs
The following table details expenses from our Corporate costs and other operating costs from our business segments:
| | | | | | | | | | | | | | | | |
For the years ended (in 000’s) | | 2015 | | | 2014 | | | Change | | | % | |
General and administrative | | | 29,697 | | | | 12,848 | | | | 16,849 | | | | 131 | % |
Selling and marketing | | | 23,486 | | | | 8,649 | | | | 14,837 | | | | 172 | % |
Research and development | | | 14,992 | | | | 9,301 | | | | 5,691 | | | | 61 | % |
Share based compensation | | | 16,198 | | | | 4,484 | | | | 11,714 | | | | 261 | % |
Acquisition related, restructuring and other non-recurring | | | 57,207 | | | | 13,521 | | | | 43,686 | | | | 323 | % |
Exchange listing cost | | | 1,051 | | | | — | | | | 1,051 | | | | 100 | % |
Interest and accretion | | | 127,831 | | | | 11,471 | | | | 116,360 | | | | 1014 | % |
Change in fair value of purchase consideration | | | 561 | | | | 2,709 | | | | (2,148 | ) | | | -79 | % |
Amortization of intangible assets | | | 75,810 | | | | 10,360 | | | | 65,450 | | | | 632 | % |
Depreciation | | | 477 | | | | 77 | | | | 400 | | | | 519 | % |
Foreign exchange losses | | | 4,056 | | | | 696 | | | | 3,360 | | | | 483 | % |
| | | | | | | | | | | | | | | | |
Total | | $ | 351,366 | | | $ | 74,116 | | | $ | 277,250 | | | | 374 | % |
| | | | | | | | | | | | | | | | |
Notes: Amounts shown above are expenses from continuing operations, excluding discontinued operations.
General and Administrative Expenses
General and administrative expenses reflect the costs related to salaries and benefits, professional and consulting fees, ongoing public company costs, travel, facility leases and other administrative expenditures. The increase of $16.8 million compared to the prior period reflects an increase in general and administrative expenses, which is reflective of the increased size and scale of the Company’s business. General and administrative expenses were 12.2% as a percentage of revenue in 2014 and 7.6% as a percentage of revenues in 2015, representing a declining trend as the business continues to grow.
Selling and Marketing Expenses
Selling and marketing expenses reflect costs incurred by the Company for the marketing, promotion and sale of the Company’s broad portfolio of products across the North America, International and Orphan Drugs divisions. These costs have increased due to the expansion of Concordia’s product portfolio to over 200 products and the related selling and marketing efforts of the Concordia North America and International segments.
Research and Development Expenses
Research and development expenses reflect non-capitalized costs for clinical trial activities, product development, professional and consulting fees and services associated with the activities of the medical, clinical and scientific affairs in addition to quality assurance costs and regulatory compliance and drug safety costs (Pharmacovigilence) of the Company. The research and development cost increase of $5.7 million, or 61%, is due to costs incurred at Concordia International for product expansion efforts and the costs associated with Concordia’s expansion of legacy products in its Concordia North America segment.
| | |
| Concordia 2015 Management Discussion and Analysis | | Page 16 |
Share Based Compensation
Share based compensation increased by $11.7 million compared with the prior year. The share based compensation expense relates to the fair value of share-based option and restricted share unit (“RSU”) awards to employees, management and directors of the Company. The increases in expense over the prior year are reflective of additional share based option and RSU grants to employees with the growth in our employee base and the share price at the date of grant.
The fair value of stock options and RSUs is derived using the Black-Scholes option-pricing model, and a Monte Carlo simulation model is used for calculating the fair value of certain performance based RSUs with market based vesting conditions. Assumptions that affect the application of the fair value model include the determination of volatility of the Company’s common shares, risk-free interest rate, expected life of options, share price on the date of grant and estimates of financial results for certain Performance Based RSUs.
Acquisition related, Restructuring and Other Costs
Acquisition related, restructuring and other costs were $57.2 million in the year ended December 31, 2015. Included in this amount was $41.6 million of transaction, advisory and professional costs incurred in relation to the AMCo and Covis Portfolio acquisitions, approximately $5.6 million related to acquisition related bonuses paid to certain employees in connection with the 2015 acquisitions and $10.0 million in severance, restructuring and other related costs.
Exchange Listing Expenses
Exchange listing expenses of $1.0 million were incurred in the year ended December 31, 2015, and included legal and listing fees associated with the Company’s listing on NASDAQ and the filing of a base shelf prospectus in Canada and a shelf registration statement in the U.S.
Interest Expense
Interest expense for the year ended December 31, 2015 was $127.8 million and comprised of the following amounts:
| | • | | $91.2 million of cash paid and accrued interest expense related to the long-term debt facilities in place during the year. Of this amount, $53.4 million of accrued interest expense was incurred in the fourth quarter of 2015. The Company’s debt facilities were refinanced on April 21, 2015 with the acquisition of the Covis Portfolio and once again on October 21, 2015 with the acquisition of AMCo. |
| | • | | $34.4 million of total non-cash accretion and amortization of deferred financing costs recorded during the year. This expense represents our amortization of debt issuance costs with respect to the Company’s debt facilities. Of this amount, $26.3 million relates to accelerated amortization on the retired credit facilities during the year and $8.1 million of regular amortization of debt issuance costs over the term of the debt facilities. Accelerated amortization was recorded due to refinancing certain debt facilities over the course of 2015. |
| | • | | $2.2 million of other interest expense recorded with respect to discounting of certain liabilities including purchase consideration and other minor credit facility fees. |
| | |
| Concordia 2015 Management Discussion and Analysis | | Page 17 |
Changes in Fair Value Adjustments
The change in the fair value of purchase consideration recorded during the year ended December 31, 2015 was a loss of $0.6 million due to movements in the fair value of the purchase consideration due to discounting and change in estimates and expected payouts.
Amortization of Intangible Assets
Amortization of intangible assets during the year ended December 31, 2015 was $75.8 million and comprised of the following amounts:
| | • | | Amortization related to acquired product rights and manufacturing processes was $67.6 million for the year ended December 31, 2015. The Company amortizes acquired product rights on a straight-line basis over their estimated useful lives, which range from fifteen to thirty years. Amortization of acquired product rights and manufacturing processes increased due to increased intangible assets related to the acquisitions of the Covis Portfolio and AMCo by $3.2 billion over the prior year. |
| | • | | Amortization related to intellectual property was $1.6 million for the year ended December 31, 2015, consistent with $1.6 million in 2014. Intellectual property is amortized on a straight-line basis over an estimated useful life of 20 years. |
| | • | | Amortization related to distribution and supplier contracts was $6.5 million for the year ended December 31, 2015. Distribution and supplier contracts are amortized on a straight-line basis over 5 years. |
| | • | | Amortization of $0.1 million related to other software amortization was recorded in the year ended December 31, 2015. |
Foreign Exchange and Realized Losses
Foreign exchange loss for the year ended December 31, 2015 was $4.1 million arising primarily from losses related to hedges associated with financing the acquisition of the Covis Portfolio. There were no foreign currency hedges in place as at December 31, 2015
| | |
| Concordia 2015 Management Discussion and Analysis | | Page 18 |
Balance Sheet Changes
2015 highlights compared with 2014
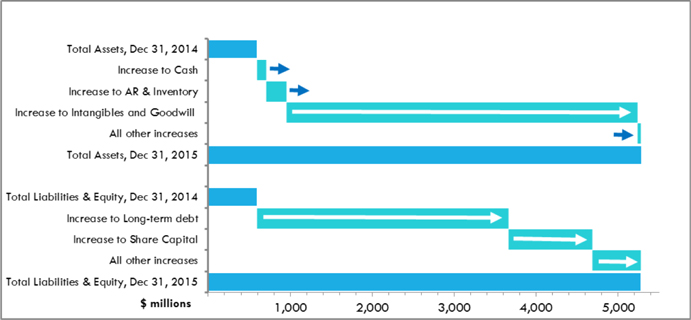
Key Highlights of 2015 changes in the Company’s balance sheet:
| | • | | Cash and equivalents on hand increased $112.7 million |
| | • | | Increases in accounts receivable of $157.6 million and inventory of $93.9 million, both driven primarily by the acquisition of AMCo and the Covis Portfolio during 2015; |
| | • | | Intangible assets of $3.5 billion acquired and resulting goodwill of $784.4 million arising from the acquisitions of the Covis Portfolio effective April 21, 2015 and AMCo effective October 21, 2015. The increases are shown net of $75.8 million of amortization recorded during the year. |
| | • | | Net increases to long-term debt of $3.1 billion related to debt raised in connection with the acquisitions of the Covis Portfolio and AMCo during the year. The“Lending Arrangement and Debt” section below details each of the debt facilities in place as at December 31, 2015; and |
| | • | | Common share issuances of $1.0 billion made during the year, consisting of net proceeds of $284.5 million raised in April 2015 by way of a short form prospectus offering related to the acquisition of the Covis Portfolio, net proceeds of $499.4 million raised in September 2015 in connection with the AMCo Offering and $230.8 million common shares issued to the Vendors of AMCo on the AMCo Closing Date. |
| | |
| Concordia 2015 Management Discussion and Analysis | | Page 19 |
Selected Quarterly Financial Information
Amounts shown above are results from continuing operations, excluding discontinued operations, except for total assets and liabilities amounts.
| | | | | | | | | | | | | | | | | | | | | | | | | | | | | | | | |
| | | Q4-2015 | | | Q3-2015 | | | Q2-2015 | | | Q1-2015 | | | Q4-2014 | | | Q3-2014 | | | Q2-2014 | | | Q1-2014 | |
Revenue | | | 191,908 | | | | 93,005 | | | | 75,198 | | | | 34,113 | | | | 39,487 | | | | 32,251 | | | | 20,324 | | | | 12,879 | |
Adjusted Gross profit(1) | | | 149,659 | | | | 84,953 | | | | 68,966 | | | | 30,284 | | | | 35,124 | | | | 28,480 | | | | 16,726 | | | | 9,970 | |
Operating income | | | 1,852 | | | | 44,520 | | | | 24,274 | | | | 9,805 | | | | 13,454 | | | | 12,842 | | | | (1,410 | ) | | | 3,465 | |
Net income (loss), continuing operations | | | (31,455 | ) | | | 1,496 | | | | (3,252 | ) | | | 3,786 | | | | 2,320 | | | | 10,872 | | | | (2,317 | ) | | | (1,980 | ) |
Cash | | | 155,448 | | | | 670,548 | | | | 137,250 | | | | 32,639 | | | | 42,770 | | | | 30,945 | | | | 32,708 | | | | 77,973 | |
Total assets | | | 5,276,062 | | | | 2,460,116 | | | | 1,938,452 | | | | 582,927 | | | | 592,700 | | | | 587,323 | | | | 490,135 | | | | 194,146 | |
Total liabilities | | | 4,119,854 | | | | 1,430,919 | | | | 1,378,661 | | | | 321,232 | | | | 335,150 | | | | 332,314 | | | | 246,010 | | | | 76,045 | |
EBITDA(1) | | | 50,087 | | | | 53,368 | | | | 31,387 | | | | 17,840 | | | | 22,853 | | | | 13,221 | | | | (981 | ) | | | 3,026 | |
Adjusted EBITDA(1) | | | 120,121 | | | | 71,376 | | | | 54,924 | | | | 19,266 | | | | 25,222 | | | | 19,208 | | | | 9,689 | | | | 5,383 | |
Earnings (Loss) per share | | | | | | | | | | | | | | | | | | | | | | | | | | | | | | | | |
Basic | | | (0.64 | ) | | | 0.04 | | | | (0.10 | ) | | | 0.13 | | | | 0.08 | | | | 0.38 | | | | (0.09 | ) | | | (0.10 | ) |
Diluted | | | (0.64 | ) | | | 0.04 | | | | (0.10 | ) | | | 0.12 | | | | 0.08 | | | | 0.36 | | | | (0.09 | ) | | | (0.10 | ) |
Adjusted(1) | | | 1.24 | | | | 1.37 | | | | 1.11 | | | | 0.53 | | | | 0.68 | | | | 0.57 | | | | 0.31 | | | | 0.04 | |
Notes:
| (1) | Represents a non-IFRS measure. For the relevant definitions and reconciliation to reported results, see “Non-IFRS Financial Measures.” |
Revenues in the fourth quarter of 2015 were $191.9 million and consisted of $74.2 million related to Concordia North America, $115.7 million related to Concordia International and $2.0 million related to Orphan Drugs. In the third quarter of 2015, revenues from Concordia North America were $90.6 million representing a $16.4 million or 18% decrease between the third and fourth quarter of 2015. The decrease was mainly due to the third quarter 2015 market entry of a generic for Dibenzyline® impacting a full quarter results in the fourth quarter of 2015. The remaining decrease was due to lower demand for certain products included in the Concordia North America segment, as well as higher Medicaid utilization in the fourth quarter of 2015.
Adjusted gross profit in the fourth quarter of 2015 of $149.7 million consisted of $67.1 million related to Concordia North America, $81.0 million related to Concordia International and $1.6 million related to Orphan Drugs. In the third quarter of 2015, adjusted gross profit from Concordia North America was $83.1 million representing a $16.0 million or 19% decrease over the prior quarter. The decrease is in line with lower revenue and was mainly due to the market entry of a generic for Dibenzyline® late in the third quarter of 2015 and impacted a full quarter results in the fourth quarter of 2015.
Adjusted EBITDA in the fourth quarter of 2015 of $120.1 million consisted of $60.2 million related to Concordia North America, $64.3 million related to Concordia International, ($0.5 million) related to Orphan Drugs and ($3.9 million) related to Corporate expenses.
| | |
| Concordia 2015 Management Discussion and Analysis | | Page 20 |
Liquidity and Capital Resources
Sources and uses of Cash
| | | | | | | | |
For the years ended (in 000’s) | | 2015 | | | 2014 | |
Cash from Operating Activities | | | 122,005 | | | | 14,190 | |
Cash from Investing Activities | | | (3,799,208 | ) | | | (292,049 | ) |
Cash from Financing Activities | | | 3,799,310 | | | | 277,686 | |
| | | | | | | | |
Total | | | 122,107 | | | | (173 | ) |
| | | | | | | | |
Our business continues to generate sustained cash flows from operating activities. Cash flows from operations represent net income adjusted for changes in working capital and non-cash items.
Cash used in investing activities represents the cash consideration of $1.2 billion paid in connection with the acquisition of the Covis Portfolio and $2.6 billion paid in connection with the acquisition of AMCo (net of AMCo cash acquired). These investments in 2015 position the Company to earn further cash flows from operations in future periods. Our business now has a diversified portfolio mix not dependent on individual products and a global sales footprint in over 100 countries.
Cash resources obtained from financing activities of $3.8 billion relates to long-term debt facilities and equity issuances. The“Lending Arrangement and Debt” section below details each of the debt facilities in place as at December 31, 2015. The lending facilities provided net proceeds of $3.1 billion in order to finance the AMCo and Covis Portfolio acquisitions. Additionally, $0.8 billion of common stock issuances were issued as described in the“Balance Sheet Changes” section above. During 2015 the Company paid $42.9 million of interest payments during the year. The Company made dividend payments on a quarterly basis totaling $10.1 million during 2015, representing a $0.075 per common share distribution each quarter.
| | |
| Concordia 2015 Management Discussion and Analysis | | Page 21 |
Cash Management
Management believes that cash flows from ongoing operations provide sufficient liquidity to support Concordia’s business operations for at least the next 12 months.
As at December 31, 2015, the Company held cash of $155.4 million and up to $200.0 million, subject to compliance with certain debt covenants, available from an undrawn secured Revolving Credit Facility which provided further flexibility to meet any unanticipated cash requirements.
Liquidity risk is the risk that the Company may encounter difficulty meeting obligations associated with financial liabilities. The Company manages liquidity risk through the management of its capital structure.
In managing the Company’s capital, Management estimates future cash requirements by preparing a budget and a multi-year plan for review and approval by the Company’s board of directors (the “Board of Directors”). The budget establishes the approved activities for the upcoming year and estimates the costs associated with those activities. The multi-year plan estimates future activity along with the potential cash requirements and is based upon Management’s assessment of current progress along with the expected results from the coming years’ activity. Budget to actual variances are prepared and reviewed by Management and are presented quarterly to the Board of Directors.
The purpose of liquidity management is to ensure that there is sufficient cash to meet all the financial commitments and obligations of Concordia as they come due. Since inception, Concordia has financed its cash requirements primarily through the issuances of securities, short-term borrowings, long-term debt as well as income from operations.
| | |
| Concordia 2015 Management Discussion and Analysis | | Page 22 |
Lending Arrangements and Debt
| | | | | | | | |
For the years ended (in 000’s) | | 2015 | | | 2014 | |
Term Loan | | | | | | | | |
USD term loan | | | 1,026,977 | | | | — | |
GBP term loan | | | 703,214 | | | | — | |
Bridge Facilities | | | 117,035 | | | | — | |
October 2015 Notes (9.5%) | | | 764,342 | | | | — | |
7% Senior Notes | | | 709,758 | | | | — | |
Amended and Restated GE Credit Facility | | | — | | | | 253,481 | |
| | | | | | | | |
Total carrying value | | | 3,321,326 | | | | 253,481 | |
| | | | | | | | |
Long Term Debt / Equity Ratio | | | 2.90/ 1 | | | | 0.98 / 1 | |
| | | | | | | | |
Amounts shown above represent long term debt principal net of financing fees deferred and amortized over the debt term.
During 2015, the Company refinanced its debt structure in connection with the acquisition of the Covis Portfolio in April 2015 and subsequently in October 2015 with the acquisition of AMCo.
The Term Loans were provided by a syndicate of lenders. The Term Loans provided funding for the AMCo Acquisition in two tranches, one tranche of $1.1 billion and the second of £500 million both of which formed part of the consideration paid to the Vendors of AMCo. The Term Loans mature on October 21, 2021, have variable interest rate terms based on LIBOR, plus applicable margins with a LIBOR floor of 1%, and have fixed repayment terms. There are also mandatory repayment terms based on excess cash flow generated by the Company, calculated annually.
On October 21, 2015, concurrent with the closing of the AMCo Acquisition, the Company entered into the Bridge Facilities, by and among the Company, certain of the Company’s subsidiaries, and certain lenders. Pursuant to the terms of the Bridge Facilities, certain lenders agreed to provide the Extended Bridge Loans and the Equity Bridge Loans. All obligations of the Company under the Bridge Facilities, subject to certain customary exceptions, are guaranteed by all material subsidiaries of the Company. The Extended Bridge Loans carry a maturity of seven years and an interest rate of 9.5% for two years from the date of issuance. If the Extended Bridge Loans are not paid off by the Company within two years from the date of issuance then the interest rate will increase to 11.5% and the lenders who hold such Extended Bridge Loans will have the right to convert the Extended Bridge Loans into a five-year bond with an interest rate of 11.5%. The Equity Bridge Loans carry a maturity of two years from the date of issuance and an interest rate of 9.5%. On December 18, 2015, the Company repaid $11.25 million of the Equity Bridge Loans and $33.75 million of the Extended Bridge Loans.
On October 21, 2015, concurrent with the closing of the AMCo Acquisition, the Company closed a private offering of $790 million of October 2015 Notes, issued pursuant to a note indenture between the Company, certain of its subsidiaries and the U.S. Bank National Association. Pursuant to the terms and provisions of a note purchase agreement by and among the Company, certain of its subsidiaries and certain underwriters, the October 2015 Notes bear interest at a rate of 9.5%, which will be paid on June 15 and December 15 of each year, beginning on June 15, 2016 and will mature on October 21, 2022. Prior to December 15, 2018, the Company may redeem up to 35% of the October 2015 Notes with the net proceeds of certain equity offerings at a premium plus accrued and unpaid interest to the date of redemption. Prior to December 15, 2018, the Company may also redeem the October 2015 Notes in whole or in part upon payment of a make-whole premium plus accrued and unpaid interest to the date of redemption. On and after December 15, 2018, the Company may redeem the October 2015 Notes in whole or in part at certain specified redemption prices. If certain assets are sold or in the event of a change of control, the Company may be required to repurchase some or all of the October 2015 Notes. The October 2015 Notes are
| | |
| Concordia 2015 Management Discussion and Analysis | | Page 23 |
guaranteed, jointly and severally, on a senior unsecured basis by the Guarantors. The October 2015 Notes and the guarantees rank senior in right of payment to all of the Company’s subordinated indebtedness, as well as the subordinated indebtedness of the Guarantors, and equal in right of payment with all of the Company’s and the Guarantors’ existing and future senior indebtedness, including indebtedness under the Term Loans. The October 2015 Notes effectively are subordinated to all of the Company’s existing and future secured indebtedness, as well as the secured indebtedness of the Guarantors, to the extent of the value of the assets securing such indebtedness. The October 2015 Notes and guarantees also are structurally subordinated to all existing and future obligations, including indebtedness and trade payables, of any of Company’s subsidiaries that do not guarantee the October 2015 Notes.
On April 21, 2015, in connection with the acquisition of the Covis Portfolio, the Company closed a private offering of $735 million of 7% Senior Notes, issued pursuant to a note indenture between the Company, certain of its subsidiaries and the U.S. Bank National Association. Pursuant to the terms and provisions of a note purchase agreement dated April 13, 2015 by and among the Company, certain of its subsidiaries and certain underwriters, the 7% Senior Notes were priced at an issue price of 100.00% of their face amount to yield 7.00%. Interest on the 7% Senior Notes is payable semi-annually on April 15th and October 15th of each year. The Company is not required to make mandatory redemption or sinking fund payments with respect to the 7% Senior Notes. The net proceeds of the offering of the 7% Senior Notes were used to partially fund: (i) the purchase price for the acquisition of the Covis Portfolio; and (ii) the fees and expenses incurred in connection with the acquisition of the Covis Portfolio.
The following table presents repayments of long-term debt principal and purchase consideration on an undiscounted basis:
| | | | | | | | | | | | | | | | | | | | | | | | | | | | |
| | | < 3
months | | | 3 to 6
months | | | 6 months
to 1 year | | | 1 to 2
years | | | 2 to 5
years | | | Thereafter | | | Total | |
Long-term debt | | | 4,686 | | | | 4,686 | | | | 9,373 | | | | 46,862 | | | | 767,111 | | | | 2,701,782 | | | | 3,534,500 | |
Purchase consideration | | | 28,015 | | | | 11,650 | | | | 231,506 | | | | 12,417 | | | | 20,074 | | | | 28,267 | | | | 331,929 | |
| | | | | | | | | | | | | | | | | | | | | | | | | | | | |
Total | | | 32,701 | | | | 16,336 | | | | 240,879 | | | | 59,279 | | | | 787,185 | | | | 2,730,049 | | | | 3,866,429 | |
| | | | | | | | | | | | | | | | | | | | | | | | | | | | |
| | |
| Concordia 2015 Management Discussion and Analysis | | Page 24 |
Contractual Obligations and Purchase Consideration
Contractual Obligations
The Company had the following commitments under operating leases, relating to rental commitments for its international office locations, aircraft lease and computer and electronic equipment leases:
| | | | |
(in 000’s) | | $ | |
2016 | | | 3,251 | |
2017 | | | 3,238 | |
2018 | | | 3,147 | |
2019 | | | 2,568 | |
2020 | | | 176 | |
Thereafter | | | 37 | |
Total | | | 12,417 | |
All directors and officers of the Company, and each of the Company’s various subsidiaries, are indemnified by the Company for various items including, but not limited to, all costs to defend lawsuits or actions due to their association with the Company, subject to certain restrictions. The Company has purchased directors’ and officers’ liability insurance to mitigate the cost of any potential future lawsuits or actions.
In the normal course of business, the Company has entered into agreements that include indemnities in favour of third parties, such as purchase and sale agreements, confidentiality agreements, engagement letters with advisors and consultants, leasing contracts, license agreements, information technology agreements and various product, service, data hosting and network access agreements. These indemnification arrangements may require the applicable Company entity to compensate counterparties for losses incurred by the counterparties as a result of breaches in representations, covenants and warranties provided by the particular Company entity or as a result of litigation or other third party claims or statutory sanctions that may be suffered by the counterparties as a consequence of the relevant transaction.
In connection with the acquisition of Zonegran®, the Company guaranteed the payment, performance and discharge of CPI’s (as defined below) payment and indemnification obligations under the asset purchase agreement and each ancillary agreement entered into by CPI in connection therewith that contained payment or indemnification obligations. Pursuant to the terms of the Covis Acquisition purchase agreement the Company guaranteed the payments due by CPI of CPI’s obligations under the such purchase agreement. Pursuant to the share purchase agreement entered into by the Company in connection with the AMCo Acquisition, the Company guaranteed the obligations of the purchaser under the agreement and related transaction documents.
| | |
| Concordia 2015 Management Discussion and Analysis | | Page 25 |
Purchase Consideration
| | | | | | | | |
For the years ended (in 000’s) | | 2015 | | | 2014 | |
Due to former owners of AMCo | | | 199,661 | | | | — | |
Concordia International purchase consideration | | | 63,353 | | | | — | |
Concordia North America purchase consideration | | | 29,928 | | | | 25,108 | |
| | | | | | | | |
Total | | | 292,942 | | | | 25,108 | |
| | | | | | | | |
The purchase consideration due to the former owners of AMCo was part of the consideration paid for the acquisition of AMCo. The Company is obligated to pay the Vendors of AMCo a maximum cash earn-out of £144 million based on AMCo’s future gross profit over a period of 12 months from October 1, 2015 to September 30, 2016. Management has estimated the full amount of this earn-out will be paid in the fourth quarter of 2016 and has recorded the discounted value of $199.7 million as at December 31, 2015.
Prior to the AMCo Acquisition, both the legacy businesses of Concordia and AMCo had certain purchase consideration liabilities associated with prior acquisitions. These arrangements are described in note 20 of the financial statements by each type of arrangement. Management makes estimates and uses key assumptions in arriving at the fair value of purchase consideration at each reporting period and records changes in fair value in the statement of income in the period the changes occur.
Related Party Transactions
The Company paid legal fees, including professional services for advice relating to intellectual property matters, to a firm affiliated with a director of the Company in the amount of $53 thousand during the year ended December 31, 2015 and $61 thousand during the year ended December 31, 2014. As at February 9, 2016, the firm affiliated with the director ceased providing legal services to the Company, apart from clerical and administrative work related to the transfer of files.
| | |
| Concordia 2015 Management Discussion and Analysis | | Page 26 |
Non IFRS Financial Measures
This MD&A makes reference to certain non-IFRS measures. These non-IFRS measures are not recognized measures under IFRS and do not have a standardized meaning prescribed by IFRS, and are therefore unlikely to be comparable to similar measures presented by other companies. When used, these measures are defined in such terms as to allow the reconciliation to the closest IFRS measure. These measures are provided as additional information to complement those IFRS measures by providing further understanding of the Company’s results of operations from Management’s perspective. Accordingly, they should not be considered in isolation nor as a substitute for analyses of the Company’s financial information reported under IFRS. Management uses non-IFRS measures such as EBITDA, Adjusted EBITDA, Adjusted Gross Profit, Adjusted Net Income and Adjusted EPS to provide investors with a supplemental measure of the Company’s operating performance and thus highlight trends in the Company’s core business that may not otherwise be apparent when relying solely on IFRS financial measures. Management also believes that securities analysts, investors and other interested parties frequently use non-IFRS measures in the evaluation of issuers. Management also uses non-IFRS measures in order to facilitate operating performance comparisons from period to period, prepare annual operating budgets, and to assess its ability to meet future debt service, capital expenditure, and working capital requirements.
The definition and reconciliation of Adjusted Gross Profit, EBITDA, Adjusted EBITDA, Adjusted Net Income and Adjusted EPS used and presented by the Company to the most directly comparable IFRS measures follows below.
Adjusted Gross Profit
Adjusted Gross Profit is defined as gross profit adjusted for non-cash fair value increases to cost of acquired inventory from a business combination. Under IFRS, acquired inventory is required to be written-up to fair value at the date of acquisition. As this inventory is sold the fair value adjustment represents a non-cash cost of sale amount that has been excluded in adjusted gross profit in order to normalize gross profit for this non-cash component
| | | | | | | | |
For the years ended (in 000’s) | | 2015 | | | 2014 | |
Gross profit per financial statements | | | 299,930 | | | | 90,300 | |
Add back: Fair value adjustment to acquired inventory | | | 33,932 | | | | — | |
| | | | | | | | |
Adjusted Gross profit | | | 333,862 | | | | 90,300 | |
| | | | | | | | |
EBITDA
EBITDA is defined as net income adjusted for net interest and accretion expense, income tax expense, depreciation and amortization. Management uses EBITDA to assess the Company’s operating performance.
| | |
| Concordia 2015 Management Discussion and Analysis | | Page 27 |
Adjusted EBITDA
Adjusted EBITDA is defined as EBITDA adjusted for one-time charges including costs associated with acquisitions, restructuring, and other related costs, one time initial exchange listing expenses on the NASDAQ, non-recurring gains/losses, non-cash items such as realized / unrealized gains / losses on derivative instruments, share based compensation, change in fair value of purchase consideration, impairment loss, fair value increases to inventory arising from purchased inventory from a business combination, gains / losses from the sale of assets, other income expenses and realized / unrealized gains / losses related to foreign exchange. Management uses Adjusted EBITDA as the key metric in assessing business performance when comparing actual results to budgets and forecasts. Management believes Adjusted EBITDA is an important measure of operating performance and cash flow, and provides useful information to investors because it highlights trends in the underlying business that may not otherwise be apparent when relying solely on IFRS measures.
| | | | | | | | |
For the years ended (in 000’s) | | 2015 | | | 2014 | |
Net Income from continuing operations | | | (29,425 | ) | | | 8,895 | |
Interest and accretion | | | 127,831 | | | | 11,471 | |
Income taxes | | | (22,011 | ) | | | 7,316 | |
Depreciation | | | 477 | | | | 77 | |
Amortization of intangible assets | | | 75,810 | | | | 10,360 | |
| | | | | | | | |
EBITDA | | | 152,682 | | | | 38,119 | |
| | | | | | | | |
Fair value adjustment to acquired inventory | | | 33,932 | | | | — | |
Acquisition related, restructuring and other | | | 57,207 | | | | 13,521 | |
Share-based compensation | | | 16,198 | | | | 4,484 | |
Change in fair value of purchase consideration | | | 561 | | | | 2,709 | |
Exchange listing costs | | | 1,051 | | | | — | |
Foreign exchange losses | | | 4,056 | | | | 696 | |
Other income | | | — | | | | (27 | ) |
| | | | | | | | |
Adjusted EBITDA | | | 265,687 | | | | 59,502 | |
| | | | | | | | |
| | |
| Concordia 2015 Management Discussion and Analysis | | Page 28 |
Adjusted Net Income and EPS
Adjusted EPS is defined as adjusted net income divided by the weighted average number of fully diluted shares outstanding. Adjusted net income is defined as net income (loss) adjusted for one-time charges including costs associated with acquisitions, restructuring and related costs, one time initial exchange listing expenses on the NASDAQ, non-recurring gains / losses, non-cash items such as realized / unrealized gains / losses on derivative instruments, share based compensation, change in fair value of purchase consideration, impairment loss, fair value increases to inventory arising from purchased inventory from a business combination, gains / losses from the sale of assets, realized / unrealized gains / losses related to foreign exchange, non-cash accretion expense, the tax impact of the above and other non-recurring items. Management believes Adjusted EPS is an important measure of operating performance and cash flow, and provides useful information to investors.
| | | | | | | | | | | | | | | | | | | | | | | | | | | | | | | | | | | | | | | | |
| | | FY2015 | | | Q4-2015 | | | Q3-2015 | | | Q2-2015 | | | Q1-2015 | | | FY2014 | | | Q4-2014 | | | Q3-2014 | | | Q2-2014 | | | Q1-2014 | |
Weighted average number of fully diluted shares | | | 37,457,561 | | | | 49,752,148 | (1) | | | 35,248,353 | | | | 33,950,472 | | | | 30,584,951 | | | | 27,209,904 | | | | 30,439,316 | | | | 30,127,443 | | | | 27,826,313 | | | | 21,588,635 | |
Net income (loss), continuing operations | | | (29,425 | ) | | | (31,455 | ) | | | 1,496 | | | | (3,252 | ) | | | 3,786 | | | | 8,895 | | | | 2,320 | | | | 10,872 | | | | (2,317 | ) | | | (1,980 | ) |
Adjustments | | | | | | | | | | | | | | | | | | | | | | | | | | | | | | | | | | | | | | | | |
Fair value adjustment to acquired inventory | | | 33,932 | | | | 33,932 | | | | — | | | | — | | | | — | | | | — | | | | — | | | | — | | | | — | | | | — | |
Share-based compensation | | | 16,198 | | | | 5,917 | | | | 5,264 | | | | 4,120 | | | | 897 | | | | 4,484 | | | | 1,090 | | | | 1,258 | | | | 1,380 | | | | 756 | |
Exchange listing costs | | | 1,051 | | | | 151 | | | | 326 | | | | 574 | | | | — | | | | — | | | | — | | | | — | | | | — | | | | — | |
Acquisition, restructuring and other | | | 57,207 | | | | 37,960 | | | | 6,691 | | | | 10,118 | | | | 2,438 | | | | 13,521 | | | | 940 | | | | 4,093 | | | | 8,314 | | | | 174 | |
Depreciation | | | 477 | | | | 372 | | | | 33 | | | | 30 | | | | 42 | | | | 77 | | | | 29 | | | | 26 | | | | 12 | | | | 10 | |
Amortization of intangible assets | | | 75,810 | | | | 41,630 | | | | 14,260 | | | | 14,885 | | | | 5,035 | | | | 10,360 | | | | 9,130 | | | | 410 | | | | 410 | | | | 410 | |
Change in fair value of purchase consideration | | | 561 | | | | (1,343 | ) | | | 287 | | | | 984 | | | | 633 | | | | 2,709 | | | | 580 | | | | 579 | | | | 983 | | | | 567 | |
Foreign exchange losses (gains) | | | 4,056 | | | | (6,233 | ) | | | 5,445 | | | | 7,802 | | | | (2,958 | ) | | | 696 | | | | (242 | ) | | | 73 | | | | — | | | | 865 | |
Interest accretion | | | 34,409 | | | | 9,802 | | | | 16,251 | | | | 2,541 | | | | 5,815 | | | | — | | | | — | | | | | | | | | | | | | |
Tax adjustments (2) | | | (30,341 | ) | | | (28,877 | ) | | | (1,885 | ) | | | (39 | ) | | | 460 | | | | 6,876 | | | | 6,998 | | | | (48 | ) | | | (66 | ) | | | (8 | ) |
Adjusted net income, continuing operations | | | 163,935 | | | | 61,856 | | | | 48,168 | | | | 37,763 | | | | 16,148 | | | | 47,618 | | | | 20,844 | | | | 17,263 | | | | 8,716 | | | | 794 | |
Adjusted EPS diluted, continuing operations | | | $4.38 | | | | $1.24 | | | | $1.37 | | | | $1.11 | | | | $0.53 | | | | $1.75 | | | | $ 0.68 | | | | $0.57 | | | | $0.31 | | | | $0.04 | |
Amounts shown above are results from continuing operations, excluding discontinued operations.
Notes:
| (1) | Weighted average number of fully diluted share calculation includes 8,000,000 shares issued on September 30, 2015 related to the AMCo share prospectus offering. Net income from AMCo has been included since the date of acquisition on October 21, 2015. The impact to adjusted EPS if the share offering had occurred on October 21, 2015, the date of acquisition, would be an additional $0.05 cents per share. |
| (2) | The Company has included in tax adjustments: (i) the current and deferred income taxes presented in the consolidated statements of income (loss) to the extent that these relate to adjustments made to net income (loss) from continuing operations; and (ii) income taxes for the period resulting from non-recurring, non-cash items. The income taxes presented in the consolidated statements of income (loss), after including the tax adjustments, represents the Company’s estimate of the income taxes in respect of adjusted net income. |
| | |
| Concordia 2015 Management Discussion and Analysis | | Page 29 |
Critical Accounting Estimates
In preparing the Company’s consolidated financial statements, Management is required to make estimates and assumptions that affect the reported amounts of assets and liabilities, the disclosure of contingent liabilities at the date of the consolidated financial statements and the reported amounts of expenses during the reporting periods.
Significant estimates made by Management include: gross to net deductions; allowance for doubtful accounts; inventory reserves; useful lives of amortizable tangible and intangible assets; recoverability of long lived assets and related impairments; fair value of assets acquired in a business combination; fair value of contingent consideration; fair value of foreign currency financial instruments; weighted average cost of capital; determining the fair value of share-based payments and the provision for income taxes and the ability to realize deferred tax assets. On an ongoing basis, Management reviews its estimates to ensure that these estimates appropriately reflect changes in the Company’s business and new information as it becomes available. If historical experience and other factors used by Management to make these estimates do not reasonably reflect future activity, the Company’s consolidated financial statements could be materially impacted.
Chargebacks
The provision for chargebacks is an estimate used in the recognition of revenue. The Concordia North America segment sells mainly in the United States whereby these sales are directly to wholesale distributors. The wholesale distributors sell directly to independent pharmacies, managed care organizations, hospitals and group purchasing organizations (“indirect customers”). The difference between the price that Concordia sells to wholesalers and the price the wholesaler sells to indirect customers is referred to as a chargeback. The provision for chargebacks is calculated based upon historical experience. As sales are made to large wholesale customers, Concordia continually monitors the provision for chargebacks and makes adjustments when actual chargebacks differ from estimated provision amounts.
Returns
The provision for returns is an estimate used in the recognition of revenue. Concordia has a returns policy that allows wholesalers to return the product within a specified period prior to and subsequent to the expiration date. Provisions for returns are recognized in the period in which the underlying sales are recognized, as a reduction of sales revenue. Concordia estimates provisions for returns by using historical experience and other factors, in order to determine Management’s best estimate of potential future returns. Concordia continually monitors provisions for returns and makes adjustments when actual product returns differ from established reserves.
Rebates
The provision for rebates is an estimate used in the recognition of revenue. Rebates are granted to healthcare authorities and under contractual arrangements with certain customers. Products sold in the United States are covered by various programs (such as Medicaid and Medicare) under which products are sold at a discount. Concordia estimates its provisions for rebates based on current contractual terms and conditions as well as the historical experience, changes to business practices and credit terms. Concordia continually monitors the
| | |
| Concordia 2015 Management Discussion and Analysis | | Page 30 |
provision for rebates and makes adjustments when it believes that actual rebates may differ from established provisions. All rebates are recognized in the period in which the underlying sales are recognized as a reduction of sales revenue.
Other Price Adjustments
The provision for other price adjustments is a significant and complex estimate used in the recognition of revenue. Other price adjustments are credits issued by the wholesaler to reflect various decreases in the selling price. The price that Concordia sells to the wholesaler is known as the Wholesale Acquisition Cost (“WAC”). Decreases to WAC are discretionary decisions made by the wholesalers to reflect competitive market conditions. Amounts recorded for other price adjustments are based upon estimated declines in market prices. Concordia regularly monitors these and other factors and re-evaluates the provision as additional information becomes available.
Share-based compensation
IFRS 2 requires that each installment of options and RSUs be treated as a separate grant with graded-vesting features. Forfeitures are estimated at the time of grant and revised if actual forfeitures are likely to differ from previous estimates. Options granted to parties other than employees are measured at their fair values. Share-based compensation for options is recognized as compensation in the statement of income (loss) and comprehensive income (loss) based on the fair values of the underlying options at the time of the grant, with the compensation expense amortized over the vesting period for the grantee. Share based compensation for RSUs is recognized as compensation in the statement of income (loss) and comprehensive income (loss) based on changes in Management’s estimate of the number of RSUs that are expected to vest and changes in the market value of Concordia’s common shares. The Company has also issued certain performance based RSUs subject to market based and Company specific performance vesting conditions. Concordia uses the Black-Scholes option pricing model to price its options and uses Black-Scholes and Monte Carlo option pricing models to price its RSUs in computing share based compensation, which requires certain assumptions on variables including, but not limited to, the stock price volatility rate for a publicly held corporation and estimates of future earnings. Due to the absence of a company specific volatility rate given the limited trading history of the Company’s stock, Concordia uses comparable rates to other companies in the pharmaceutical industry. The selection of different option pricing models and different assumptions of volatility and future earnings could produce different values for share based compensation, which could impact results.
Impairment of non-financial assets
The Company reviews amortized non-financial assets for impairment whenever events or changes in circumstances indicate that the carrying amount of the assets may be impaired. The Company also reviews, on an annual basis, non-financial assets with indefinite life for impairment. If the recoverable amount of the respective non-financial assets is less than its carrying amount, it is considered to be impaired. In the process of measuring the recoverable amount, Management makes assumptions about future events and circumstances. The actual results may vary and may cause significant adjustments.
| | |
| Concordia 2015 Management Discussion and Analysis | | Page 31 |
Income taxes
Concordia is subject to income taxes in different jurisdictions and therefore uses judgment to determine the provision for income taxes. There are transactions and calculations for which the ultimate tax determination is uncertain. Provisions for uncertain tax positions are recorded based on Management’s estimate of the most likely outcome. Where the final tax outcome of these matters is different from the amounts that were initially recorded, such differences will impact the current and deferred income tax assets and liabilities in the period that such determination is made.
Acquisition-Related Purchase Consideration
Certain acquisitions completed by Concordia, or its subsidiaries, include purchase consideration that may be paid based on the occurrence of certain future events, such as sales performance and the achievement of certain future developments, regulatory and sales milestones.
Acquisition-related purchase consideration associated with an acquisition is initially recognized at fair value and then re-measured each reporting period, with changes in fair value recorded in the consolidated statements of income (loss) and comprehensive income (loss). The estimates of fair value contain uncertainties as they involve assumptions about the likelihood of achieving specified milestone criteria, projections of future financial performance, and assumed discount rates. Changes in the fair value of the acquisition-related purchase consideration obligations result from several factors including changes in discount periods and rates, changes in the timing and amount of revenue estimates and changes in probability assumptions with respect to the likelihood of achieving specified milestone criteria. A change in any of these assumptions could produce a different fair value, which could impact results.
| | |
| Concordia 2015 Management Discussion and Analysis | | Page 32 |
Current and Future Accounting Pronouncements
Note 2 of the consolidated financial statements as at and for the year ended December 31, 2015 includes current and future significant accounting policies applicable to the Company.
Contingencies
Royalties
The Company has a commitment to pay royalties on certain products acquired from Shionogi in May 2013 at certain prescribed rates. These royalties are payable on a quarterly basis.
Litigation and Arbitration
In the normal course of business the Company may be the subject of litigation claims. The following are items either resolved or outstanding impacting the Company:
On February 9, 2015, the Company and its subsidiary, Concordia Pharmaceuticals Inc.,S.à.r.l (“CPI”) received a civil investigative demand (“CID”) from the United States Federal Trade Commission (the “FTC”) regarding its attention deficit hyperactivity disorder product Kapvay®. The CID was a request for documents and information relating to CPI’s agreements with Par Pharmaceutical, Inc. (“Par”) with respect to Kapvay® (the “Par Agreements”). While the Company maintains that the Par Agreements were lawful, the Company and CPI have entered into a settlement agreement with the FTC. The settlement agreement with the FTC does not constitute an admission by CPI or the Company that they have violated the law. Under the terms of the settlement agreement, CPI will be prohibited from enforcing the provision of the Par Agreements which entitle it to a royalty payment corresponding to Par’s sales of generic Kapvay® (for any period on or after June 25, 2015) and both CPI and the Company from entering any future agreement with a generic company that would prevent the marketing of an authorized generic version of a branded drug after all patents have expired on the drug. The Company and CPI will also be subject to standard antitrust compliance and reporting requirements. On October 20, 2015, the FTC accorded final approval to the settlement agreement.
On July 13, 2015, a former financial advisor to the Company commenced an arbitration with the American Arbitration Association against the Company in respect of amounts that the financial advisor believes are owing to it in connection with the acquisition of the Covis Portfolio under the terms of a previous engagement letter with the financial advisor. The amount claimed is $12.3 million. On October 23, 2015, the Company received an invoice from this former financial advisor for approximately $26 million, with respect to the Company’s acquisition of AMCo on October 21, 2015. On November 2, 2015, the financial advisor amended its statement of claim, claiming that it is entitled to the invoiced amount in respect of the Company’s acquisition of AMCo. The Company disputes that these amounts are owing and intends to vigorously defend this matter.
| | |
| Concordia 2015 Management Discussion and Analysis | | Page 33 |
Off Balance Sheet Arrangements
The Company leases facilities under operating leases for its office locations internationally. The Company also has certain operating leases for office equipment. On February 19, 2015, the Company entered into an aircraft lease agreement to use and operate an aircraft for business travel purposes. The term of the lease is 5 years and the annual lease payment is $1.02 million. In addition, on the same day, the Company entered into an aircraft management and operating agreement for a term of one year (with the term being extended automatically for additional one-year periods in the event neither party gives the other party notice of termination at any point 60 days prior to the expiry of the current term), which includes fixed and variable payments. The fixed portion of the aircraft management and operating agreement is $0.62 million per annum. There are no other off balance sheet arrangements as at December 31, 2015.
Outstanding Share Data
The authorized capital of the Company consists of an unlimited number of common shares. As at December 31, 2015 and March 23, 2016, the Company had, respectively, 50,994,397 and 51,015,872 common shares issued and outstanding. As at December 31, 2015 and March 23, 2016, there were, respectively, 2,403,985 and 2,360,235 options outstanding that entitle the holders thereof to purchase one common share per option of the Company.
As at December 31, 2015 and March 23, 2016, the Company had, respectively, 220,162 and 213,184 unvested RSUs outstanding. Each RSU can be settled either in cash or shares issued from treasury or a combination of cash and shares issued from treasury at the sole discretion of the Company.
| | |
| Concordia 2015 Management Discussion and Analysis | | Page 34 |
Disclosure Controls and Procedures and Internal Control over Financial Reporting
Disclosure Controls and Procedures
The Company is required to review and report on the effectiveness of its disclosure controls and procedures (“DC&P”) in accordance with National Instrument 52-109, “Certification of Disclosure in Issuers’ Annual and Interim Filings” (“NI 52-109”), issued by the Canadian Securities Administrators. NI 52-109 requires a Chief Executive Officer (“CEO”) and Chief Financial Officer (“CFO”) to certify that they are responsible for establishing and maintaining DC&P for the Company, that DC&P have been designed and are effective in providing reasonable assurance that material information relating to the Company is made known to them, that they have evaluated the effectiveness of the Company’s DC&P and that their conclusions about the effectiveness of those DC&P at the end of the period covered by the relevant annual filings have been disclosed by the Company.
A control system, no matter how well designed and operated, can provide only reasonable, not absolute, assurance that its objectives are met. Due to inherent limitations in a control system, no evaluation of controls can provide absolute assurance that all control issues within a company have been detected. In addition, the design of any system of control is based upon certain assumptions about the likelihood of future events and there can be no assurance that any design will succeed in achieving its stated goals under all future events, no matter how remote, or that the degree of compliance with the policies or procedures may not deteriorate. Accordingly, the Company’s DC&P are effective in providing reasonable, not absolute, assurance that the objectives of its disclosure control system have been met.
Internal Controls over Financial Reporting
Management is responsible for establishing and maintaining adequate Internal Control over Financial Reporting (“ICFR”), which is a process designed by, or designed under the supervision of the CEO and CFO, and effected by the Board, Management and other personnel, to provide reasonable assurance regarding the reliability of financial reporting and the preparation of financial statements for external purposes in accordance with IFRS.
Under their supervision and with the participation of Management, including the CEO and CFO, an evaluation of the effectiveness of the Company’s internal control over financial reporting was conducted at December 31, 2015. Based on this evaluation, Management has concluded that the Company’s internal control over financial reporting was effectively designed and operating effectively as at that date.
Given Management is in the process of evaluating controls associated with business combinations, in accordance with Section 3.3(1) of NI 52-109, Management has limited the scope and design and subsequent evaluation of internal controls over financial reporting to exclude the controls, policies and procedures of AMCo, the Company’s Concordia International segment, acquired through a business combination on October 21, 2015. Financial information related to AMCo has been presented in the MD&A under the Concordia International segment. Additional information related to AMCo as at December 31, 2015 includes: current assets of $303,144, non-current assets of $2,986,746, current liabilities of $146,134 and non-current liabilities of $208,934.
| | |
| Concordia 2015 Management Discussion and Analysis | | Page 35 |
Except for changes relating to the continuing integration of AMCo, the Company’s Concordia International segment, as discussed above, there have been no changes in the Company’s internal control over financial reporting during the year ended December 31, 2015 that have materially affected, or are reasonably likely to materially affect, the effectiveness of the internal control over financial reporting.
Assessment of DC&P and ICFR
Based on the evaluation of the Company’s DC&P and ICFR as at December 31, 2015, and considering exceptions noted above, the CEO and CFO concluded that the Company’s DC&P and ICFR were effective.
| | |
| Concordia 2015 Management Discussion and Analysis | | Page 36 |