Exhibit 99.1

1 Investor Presentation April 2016

Disclaimers The information in this presentation (this “Presentation”) is being provided by Hennessy Capital Acquisition Corp. II (“HCAC”) to you (“Recipient”, “you” or “your”) in connection with HCAC’s proposed acquisition of USI Senior Holdings, Inc. and its subsidiaries, including United Subcontractors, Inc. (collectively, “USI”). The proposed acquisition of USI is referred to herein as the “Proposed Transaction.” This Presentation is for informational purposes only and does not constitute an offer to sell, a solicitation of an offer to buy, or a recommendation to purchase any equity, debt or other instruments of HCAC or USI or any of their respective affiliates . This Presentation has been prepared to assist interested parties in making their own evaluation with respect to the Proposed Transaction and for no other purpose . The information contained herein is not, and should not be assumed to be, complete . No securities commission or securities regulatory authority or other regulatory or other authority in the United Sates or any other jurisdiction has in any way passed upon the merits of, or the accuracy and adequacy of, this Presentation . The data contained herein is derived from various internal and external sources. No representation is made as to the reasonableness of the assumptions made within or the accuracy or completeness of any projections or any other information contained herein. Any data on past performance is no indication as to future performance. Neither HCAC nor USI assume any obligation to update the information included in this Presentation, including the financial projections referred to below, except as may be required by applicable law. Use of Pro Forma and Non - GAAP Financial Measures References in this Presentation to “Pro Forma” or “PF” data give effect to USI’s three acquisitions in 2015 (Cardalls Insulation Co., Smith Insulation and Silver State Specialties) as if each had been consummated on January 1, 2015. HCAC and USI management believe that such Pro Forma data provide a meaningful view of USI’s operating results because they reflect a full - year contribution of each of the acquired businesses and, in the case of Pro Forma Adjusted EBITDA, removing expenses and income that are not reflective of the underlying business performance. This Presentation includes non - GAAP financial measures, including EBITDA, Adjusted EBITDA and Pro Forma Adjusted EBITDA. EBITDA, Adjusted EBITDA and Pro Forma Adjusted EBITDA as presented in this Presentation are supplemental measures of performance that are neither required by, nor presented in accordance with, U.S. generally accepted accounting principles (“GAAP”). EBITDA is defined as net income before interest expense, provision for income taxes, and depreciation and amortization. Adjusted EBITDA is defined as EBITDA, excluding the impact of certain items that USI management does not consider representative of its ongoing operating performance. A reconciliation of net income (loss) to Adjusted EBITDA for 2013, 2014 and 2015 is set forth in the Appendix hereto. Pro Forma Adjusted EBITDA is Adjusted EBITDA including acquisitions at the beginning of the fiscal year in which the acquisition was consummated. HCAC believes that these non - GAAP measures of financial results provide useful information to management and investors regarding certain financial and business trends relating to USI’s financial condition and results of operations. HCAC believes that the use of these non - GAAP financial measures provides an additional tool for investors to use in evaluating ongoing operating results and trends and in comparing USI’s financial measures with other companies in the construction services business, many of which present similar non - GAAP financial measures to investors. Management of HCAC and USI do not consider these non - GAAP measures in isolation or as an alternative to financial measures determined in accordance with GAAP. We have not reconciled the non - GAAP forward - looking information to their corresponding GAAP measures. You should review the financial statements of HCAC and USI, which will be presented in HCAC’s proxy statement to be filed with the Securities and Exchange Commission (the “SEC”), and you should not rely on any single financial measure to evaluate the business of HCAC and USI. Other companies may calculate EBITDA, Adjusted EBITDA and Pro Forma Adjusted EBITDA and other non - GAAP measures differently, and therefore our EBITDA, Adjusted EBITDA and Pro Forma Adjusted EBITDA and other non - GAAP measures and that of USI may not be directly comparable to similarly titled measures of other companies. Financial Projections This Presentation contains financial projections, which are forward - looking statements, with respect to USI’s projected 2016 net sales and Adjusted EBITDA. In connection with an evaluation of a potential transaction with USI, certain projections of USI were made available to HCAC, which were then used to develop the projections. The projections are subjective in many respects and reflect numerous judgments, estimates and assumptions that are inherently uncertain in prospective financial information of any kind. The projections were prepared on the basis of USI as a stand - alone entity, assuming only organic growth, and, therefore, do not reflect the effects of any potential acquisitions or financings that USI may undertake in the future, which would likely cause actual results to differ materially. In addition, the projections do not include any estimated public company costs. As a result, there can be no assurance that the prospective results will be realized or that actual results will not be significantly higher or lower than estimated. The projections were not prepared with a view toward public disclosure, nor were they prepared with a view toward compliance with published guidelines of the SEC, the guidelines established by the American Institute of Certified Public Accountants for preparation and presentation of prospective financial information or GAAP. You are cautioned not to place undue reliance on the projections contained in this Presentation. The inclusion of the projections in this Presentation should not be regarded as an indication that HCAC, USI or their respective officers, directors and other affiliates consider such information to be an accurate prediction of future results or necessarily achievable. There can be no assurance that the underlying assumptions will prove to be accurate or that the projected results will be realized, and actual results likely will differ, and may differ materially, from those reflected in the projections. In addition, the projections involve a number of business risks and uncertainties, any of which could cause actual results to differ materially from those expressed or implied by the projections. None of HCAC, USI or their respective officers, directors and other affiliates has made any express or implied representations or warranties regarding the performance of USI compared to the information included in the projections. In preparing the projections, USI’s management and HCAC made a number of assumptions and estimates. USI’s management and HCAC believed these assumptions and estimates were reasonable at the time the projections were prepared, but these assumptions and estimates may not be realized and are inherently subject to significant business, economic, competitive and regulatory uncertainties and contingencies. 2
Disclaimers 3 Forward - Looking Statements This Presentation includes “forward - looking statements” within the meaning of the “safe harbor” provisions of the United States Private Securities Litigation Reform Act of 1995 . Forward - looking statements may be identified by the use of words such as “estimate,” “plan,” “project,” “forecast,” “intend,” “expect,” “anticipate,” “believe,” “seek,” “target” or similar expressions other similar expressions that predict or indicate future events or trends or that are not statements of historical matters . Such forward - looking statements with respect to the benefits of the Proposed Transaction, the future financial performance of HCAC following the Proposed Transaction, changes in the market for USI’s services, and expansion plans and opportunities, including future acquisition or additional business combinations are based on current information and expectations, forecasts and assumptions, and involve a number of judgments, risks and uncertainties . Accordingly, forward - looking statements should not be relied upon as representing HCAC’s views as of any subsequent date, and HCAC does not undertake any obligation to update forward - looking statements to reflect events or circumstances after the date they were made, whether as a result of new information, future events or otherwise, except as may be required under applicable securities laws . You should not place undue reliance on these forward - looking statements . As a result of a number of known and unknown risks and uncertainties, actual results or performance may be materially different from those expressed or implied by these forward - looking statements . Some factors that could cause actual results to differ include, but are not limited to : ( 1 ) the occurrence of any event, change or other circumstances that could give rise to the termination of the Agreement and Plan of Merger, dated April 1 , 2016 , by and among USI Senior Holdings, Inc . , HCAC, HCAC II, Inc . and North American Direct Investment Holdings, LLC, solely in its capacity as the Stockholder Representative (“Merger Agreement”) ; ( 2 ) the outcome of any legal proceedings that may be instituted against USI or HCAC following announcement of the Proposed Transaction and related transactions ; ( 3 ) the inability to complete the transactions contemplated by the Merger Agreement due to the failure to obtain approval of the stockholders of HCAC, consummate the anticipated debt financing or satisfy other conditions to the closing of the Proposed Transaction ; ( 4 ) the ability to obtain or maintain the listing of HCAC’s common stock on the NASDAQ Capital Market following the Proposed Transaction ; ( 5 ) the risk that the Proposed Transaction disrupts the parties’ current plans and operations as a result of the announcement and consummation of the transactions described herein ; ( 6 ) the ability to recognize the anticipated benefits of the Proposed Transaction, which may be affected by, among other things, competition and the ability of the combined business to grow and manage growth profitably ; ( 7 ) costs related to the Proposed Transaction ; ( 8 ) changes in applicable laws or regulations ; ( 9 ) the possibility that USI or HCAC may be adversely affected by other economic, business, and/or competitive factors ; and ( 10 ) other risks and uncertainties indicated from time to time in the proxy statement to be filed by HCAC in connection with the Proposed Transaction, including those under “Risk Factors” therein, and other factors identified in HCAC’s prior and future filings with the SEC, available at www . sec . gov . Additional Information About the Proposed Transaction The Proposed Transaction will be submitted to stockholders of HCAC for their consideration. HCAC intends to file with the SEC preliminary and definitive proxy statements in connection with the Proposed Transaction and other matters and will mail a definitive proxy statement and other relevant documents to its stockholders as of the record date established for voting on the Proposed Transaction. HCAC’s stockholders and other interested persons are advised to read, once available, the preliminary proxy statement and any amendments thereto and, once available, the definitive proxy statement, in connection with HCAC’s solicitation of proxies for its stockholders’ meeting to be held to approve, among other things, the Proposed Transaction, because these documents will contain important information about HCAC, USI and the Proposed Transaction. Stockholders may also obtain a copy of the preliminary or definitive proxy statement, once available, as well as other documents filed with the SEC that will be incorporated by reference in the proxy statement, without charge, at the SEC’s website located at www.sec.gov or by directing a request to Nicholas A. Petruska, Executive Vice President, Chief Financial Officer and Secretary, 700 Louisiana Street, Suite 900, Houston, Texas, 77002, or by telephone at 713 - 300 - 8242. Participants in the Solicitation HCAC and its directors and executive officers and other persons may be deemed to be participants in the solicitations of proxies from HCAC’s stockholders in respect of the Proposed Transaction. Information regarding HCAC’s directors and executive officers is available in HCAC’s Annual Report on Form 10 - K/A, filed by HCAC with the SEC on February 22, 2016. Additional information regarding the participants in the proxy solicitation and a description of their direct and indirect interests will be contained in the proxy statement when it becomes available and which can be obtained free of charge from the sources indicated above.
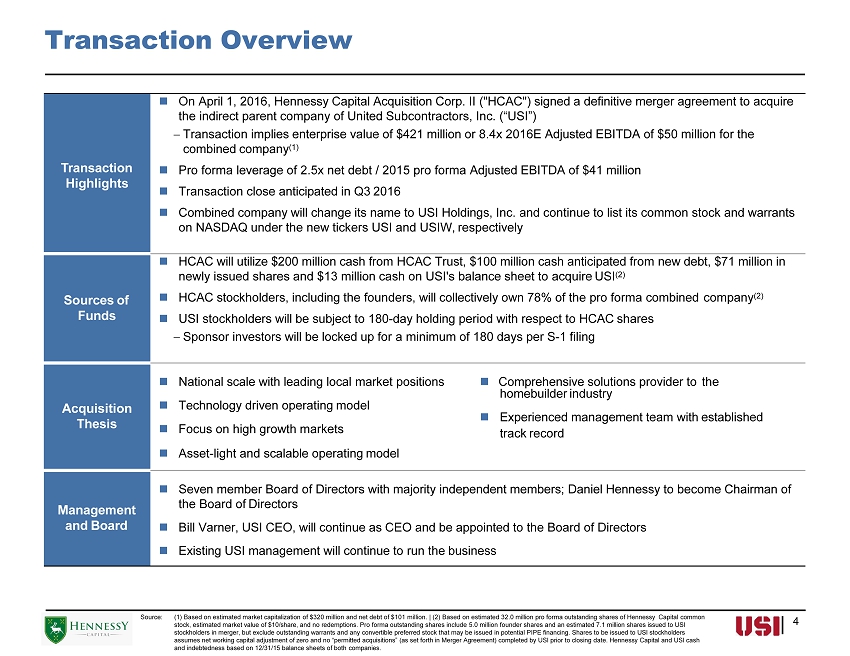
Transaction Overview 4 T r ansaction Highlights On April 1, 2016, Hennessy Capital Acquisition Corp. II ("HCAC") signed a definitive merger agreement to acquire the indirect parent company of United Subcontractors, Inc. (“USI”) Transaction implies enterprise value of $421 million or 8.4x 2016E Adjusted EBITDA of $50 million for the combined company (1) Pro forma leverage of 2.5x net debt / 2015 pro forma Adjusted EBITDA of $41 million Transaction close anticipated in Q3 2016 Combined company will change its name to USI Holdings, Inc. and continue to list its common stock and warrants on NASDAQ under the new tickers USI and USIW, respectively Sources of Funds HCAC will utilize $200 million cash from HCAC Trust, $100 million cash anticipated from new debt, $71 million in newly issued shares and $13 million cash on USI's balance sheet to acquire USI (2) HCAC stockholders, including the founders, will collectively own 78% of the pro forma combined company (2) USI stockholders will be subject to 180 - day holding period with respect to HCAC shares Sponsor investors will be locked up for a minimum of 180 days per S - 1 filing Acquisition Thesis National scale with leading local market positions Comprehensive solutions provider to the homebuilder industry Technology driven operating model Experienced management team with established Focus on high growth markets track record Asset - light and scalable operating model Management and Board Seven member Board of Directors with majority independent members; Daniel Hennessy to become Chairman of the Board of Directors Bill Varner, USI CEO, will continue as CEO and be appointed to the Board of Directors Existing USI management will continue to run the business Source: (1) Based on estimated market capitalization of $320 million and net debt of $101 million. | (2) Based on estimated 32.0 million pro forma outstanding shares of Hennessy Capital common stock, estimated market value of $10/share, and no redemptions. Pro forma outstanding shares include 5.0 million founder shares and an estimated 7.1 million shares issued to USI stockholders in merger, but exclude outstanding warrants and any convertible preferred stock that may be issued in potential PIPE financing. Shares to be issued to USI stockholders assumes net working capital adjustment of zero and no “permitted acquisitions” (as set forth in Merger Agreement) completed by USI prior to closing date. Hennessy Capital and USI cash and indebtedness based on 12/31/15 balance sheets of both companies.
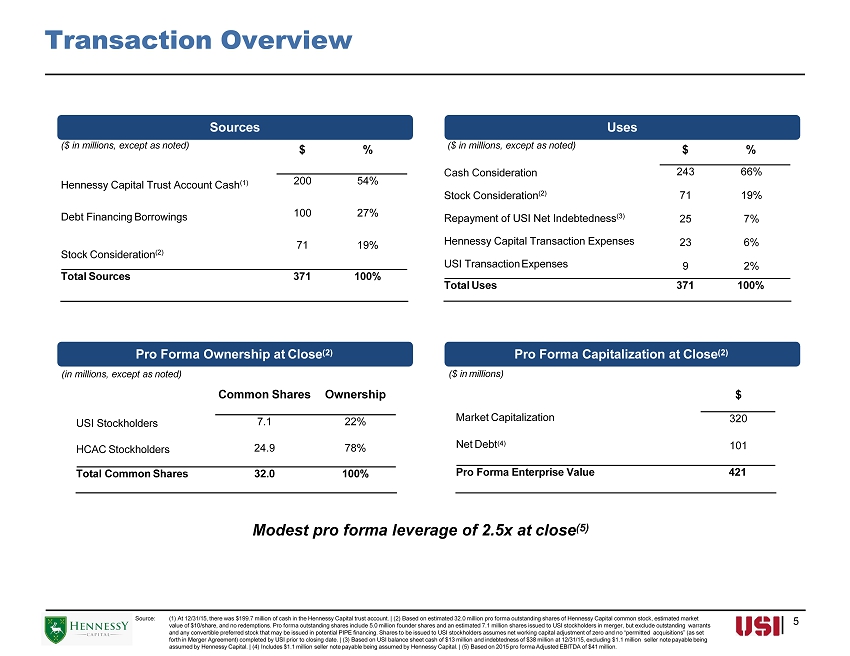
Transaction Overview 5 Sources USI Stockholders HCAC Stockholders Common Shares Ownership 7.1 24.9 22% 78% Total Common Shares 32.0 100% Uses ($ in millions, except as noted) Hennessy Capital Trust Account Cash (1) Debt Financing Borrowings Stock Consideration (2) $ % 200 100 71 54% 27% 19% Total Sources 371 100% Sou r ce: (1) At 12/31/15, there was $199.7 million of cash in the Hennessy Capital trust account. | (2) Based on estimated 32.0 million pro forma outstanding shares of Hennessy Capital common stock, estimated market value of $10/share, and no redemptions. Pro forma outstanding shares include 5.0 million founder shares and an estimated 7.1 million shares issued to USI stockholders in merger, but exclude outstanding warrants and any convertible preferred stock that may be issued in potential PIPE financing. Shares to be issued to USI stockholders assumes net working capital adjustment of zero and no “permitted acquisitions” (as set forth in Merger Agreement) completed by USI prior to closing date. | (3) Based on USI balance sheet cash of $13 million and indebtedness of $38 million at 12/31/15, excluding $1.1 million seller note payable being assumed by Hennessy Capital. | (4) Includes $1.1 million seller note payable being assumed by Hennessy Capital. | (5) Based on 2015 pro forma Adjusted EBITDA of $41 million. Modest pro forma leverage of 2.5x at close (5) Pro Forma Ownership at Close (2) (in millions, except as noted) ($ in millions) Pro Forma Capitalization at Close (2) ($ in millions, except as noted) Cash Consideration Stock Consideration (2) Repayment of USI Net Indebtedness (3) Hennessy Capital Transaction Expenses USI Transaction Expenses $ % 243 71 25 23 9 66% 19% 7% 6% 2% Total Uses 371 100% Market Capitalization Net Debt (4) $ 320 101 Pro Forma Enterprise Value 421
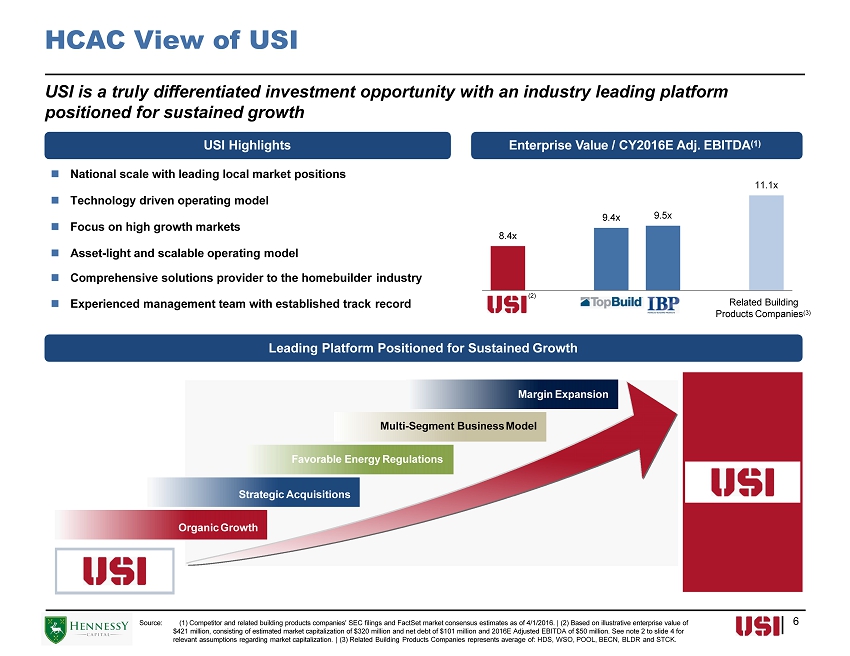
8.4x 9.4x 9.5x 11.1x USI BLD IBP Other HCAC View of USI 6 National scale with leading local market positions Technology driven operating model Focus on high growth markets Asset - light and scalable operating model Comprehensive solutions provider to the homebuilder industry Experienced management team with established track record USI is a truly differentiated investment opportunity with an industry leading platform positioned for sustained growth USI Highlights Enterprise Value / CY2016E Adj. EBITDA (1) Related Building Products Companies (3) ( 2) Leading Platform Positioned for Sustained Growth Source: (1) Competitor and related building products companies' SEC filings and FactSet market consensus estimates as of 4/1/2016. | (2) Based on illustrative enterprise value of $421 million, consisting of estimated market capitalization of $320 million and net debt of $101 million and 2016E Adjusted EBITDA of $50 million. See note 2 to slide 4 for relevant assumptions regarding market capitalization. | (3) Related Building Products Companies represents average of: HDS, WSO, POOL, BECN, BLDR and STCK. Margin Expansion Multi - Segment Business Model Favorable Energy Regulations Strategic Acquisitions Organic Growth

Industry Dynamics Support USI Growth Trajectory Leading Platform in a Fragmented Industry Positive U.S. Residential Housing Outlook (2) Increasingly Stringent Energy Regulation (3) Value Proposition TopBuild 33% IBP 20% USI 10% Other 37% Opportunity for growth through acquisition and greenfield locations in new markets Ability to achieve synergies from acquisitions due to integrated operations, technology platform, vendor relationships and back - office consolidation strategy Identified pipeline of attractive and synergistic acquisition opportunities IECC 2012 IECC 2009 IECC 2006 IECC 2004 IECC 2015 Energy code changes expected to have positive, long - term impact on insulation demand 2015 IECC estimated to drive 25 - 30 % increase in insulation spending per unit, equal to an additional $ 1 , 000 per home ( 4 ) 30 % Energy Efficie n cy Impro v ement Serves as a critical link between a concentrated manufacturer base and a highly fragmented customer base Building Products M a nuf ac tur e r Purchasing Logistics Distribution Installation Source: (1) Based on USI management estimates of competitor revenues for insulation installation services. | (2) Blue Chip Economic Indicators, U.S. Census Bureau. | (3) International Codes Council. | (4) Based on USI management estimates. 1,848 1,956 2,068 1,801 1,355 906 554 609 609 781 925 1,003 1,111 1,250 1,370 Long Term Average: 1,586 Housing starts are expected to grow by 12.5% in 2016 and by 9.6% in 2017 2003 2004 2005 2006 2007 2008 2009 2010 2011 2012 2013 2014 2015 2016 2017 Single Family Multi - Family Forecasted Total Starts LT Average Starts (1968 - 2006) Finished Home Estimated Market Share (1) 7
8 Bill Varner – Chief Executive Officer ▪ Joined USI in July 2012 as President, CEO and a member of the Board of Directors ▪ Prior to joining USI, Bill was President, CEO and a member of the Board of Directors of Aquilex Corp., a maintenance, repair and industrial cleaning services provider, from 2004 to 2012 ▪ Bill also served as CEO and a member of the board of directors of Union Metal Corp., an outdoor lighting and traffic structures manufacturer, from 2000 to 2003 ▪ Prior to this Bill served as President of various divisions of Invensys, a global technology company, from 1997 to 2000 ▪ Bill graduated from The Citadel with a Bachelor of Arts in Modern Languages USI Management Curt Petersen – Chief Financial Officer ▪ Joined USI in September 2011 as CFO, Treasurer and Secretary ▪ Prior to joining USI, Curt was a Principal at Magnify Consulting from April 2009 to September 2011, focusing on evaluating, negotiating and executing business acquisitions and divestitures, financial management of companies in distress, company - wide performance assessments, and productivity improvements ▪ Curt also served as Senior Vice President and CFO of CSM Corp. from December 2004 to April 2009, and was responsible for integrating the financial operations of the acquiror, developer and renovator of commercial, lodging and residential real estate properties ▪ Prior to joining CSM, Curt held various Senior Vice President and CFO positions at BMC Inc., Target Direct Inc., Rosemount, Inc., and Diversified Energies, Inc. ▪ Curt graduated from the University of Minnesota with a Bachelor of Science in Accounting

Table of Contents I. Company Overview II. Investment Highlights III. Financial Summary IV. Appendix 10 14 24 27 9

I. Company Overview
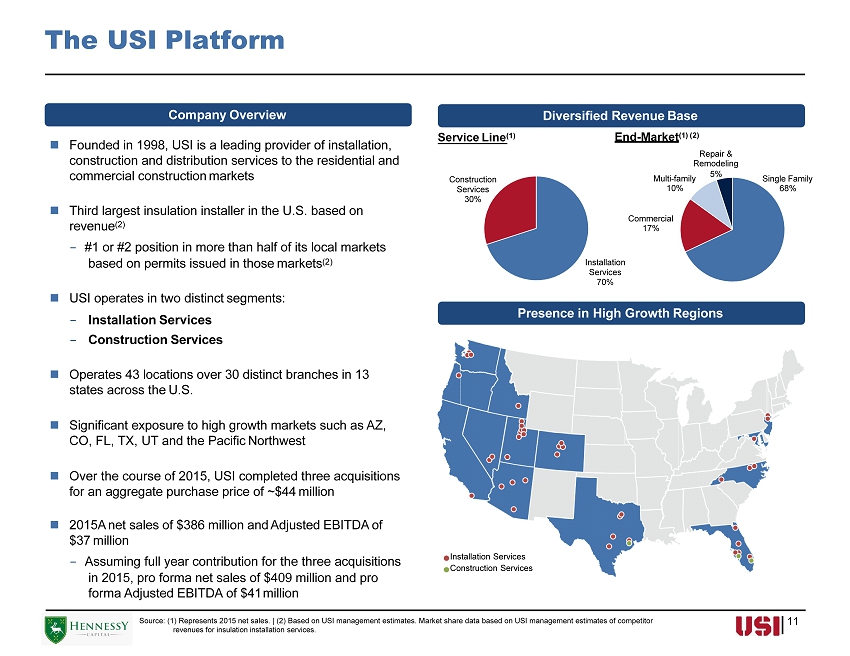
The USI Platform Company Overview Founded in 1998, USI is a leading provider of installation, construction and distribution services to the residential and commercial construction markets Third largest insulation installer in the U.S. based on revenue (2) - #1 or #2 position in more than half of its local markets based on permits issued in those markets (2) USI operates in two distinct segments: - Installation Services - Construction Services Operates 43 locations over 30 distinct branches in 13 states across the U.S. Significant exposure to high growth markets such as AZ, CO, FL, TX, UT and the Pacific Northwest Over the course of 2015, USI completed three acquisitions for an aggregate purchase price of ~$44 million 2015A net sales of $386 million and Adjusted EBITDA of $37 million - Assuming full year contribution for the three acquisitions in 2015, pro forma net sales of $409 million and pro forma Adjusted EBITDA of $41 million Source: (1) Represents 2015 net sales. | (2) Based on USI management estimates. Market share data based on USI management estimates of competitor revenues for insulation installation services. Service Line (1) Presence in High Growth Regions Installation Services 70% Construction Services 30% Installation Services Construction Services Single Family 68% Commercial 17% Multi - family 10% Diversified Revenue Base End - Market (1) (2) Repair & Remodeling 5% 11
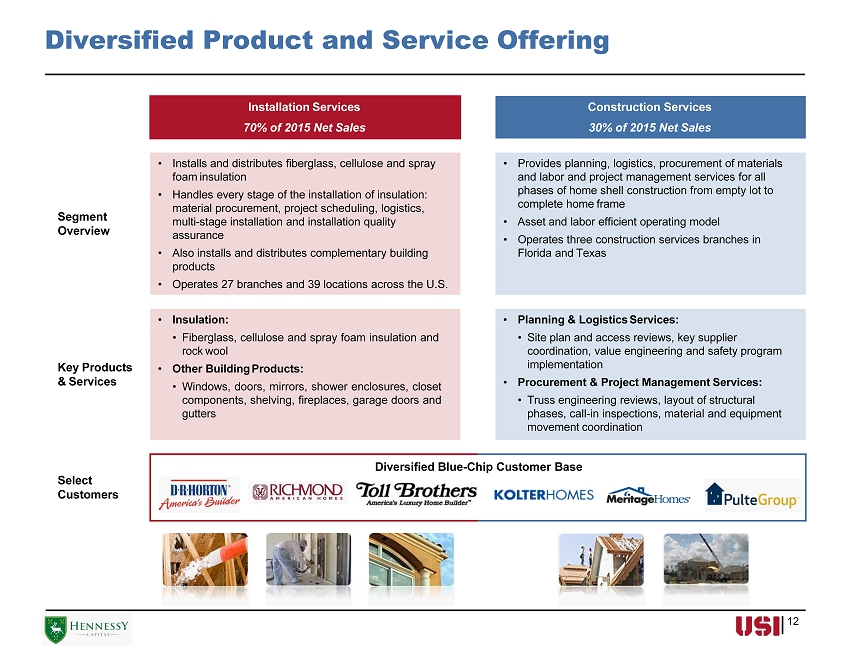
Diversified Product and Service Offering Installation Services 70% of 2015 Net Sales Construction Services 30% of 2015 Net Sales Segment Overview • Installs and distributes fiberglass, cellulose and spray foam insulation • Handles every stage of the installation of insulation: material procurement, project scheduling, logistics, multi - stage installation and installation quality assurance • Also installs and distributes complementary building products • Operates 27 branches and 39 locations across the U.S. • Provides planning, logistics, procurement of materials and labor and project management services for all phases of home shell construction from empty lot to complete home frame • Asset and labor efficient operating model • Operates three construction services branches in Florida and Texas Key Products & Services • Insulation: • Fiberglass, cellulose and spray foam insulation and rock wool • Other Building Products: • Windows, doors, mirrors, shower enclosures, closet components, shelving, fireplaces, garage doors and gutters • Planning & Logistics Services: • Site plan and access reviews, key supplier coordination, value engineering and safety program implementation • Procurement & Project Management Services: • Truss engineering reviews, layout of structural phases, call - in inspections, material and equipment movement coordination Select Customers Diversified Blue - Chip Customer Base 12
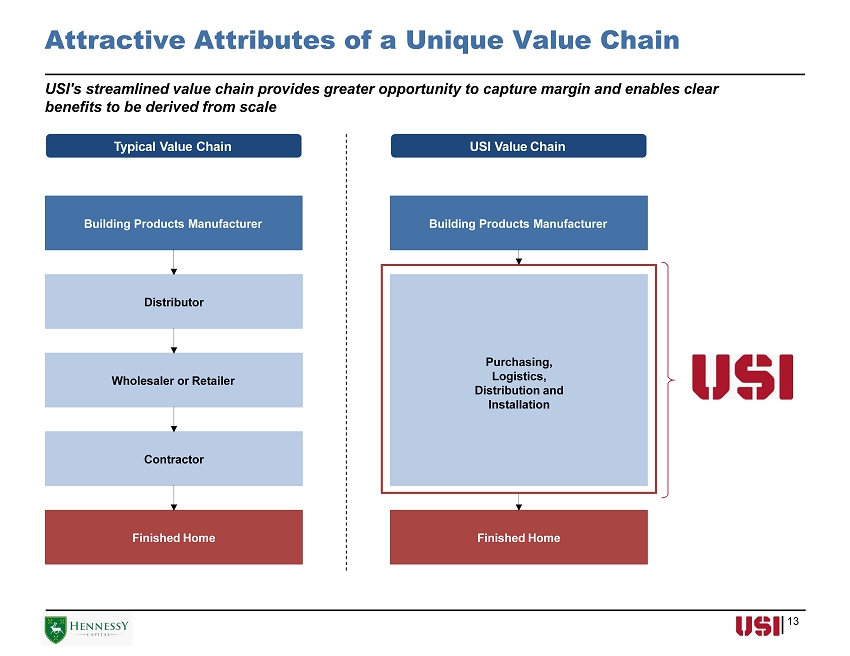
Attractive Attributes of a Unique Value Chain 13 USI's streamlined value chain provides greater opportunity to capture margin and enables clear benefits to be derived from scale Typical Value Chain USI Value Chain Building Products Manufacturer Distributor Wholesaler or Retailer Contractor Finished Home Building Products Manufacturer Finished Home Purchasing, Logistics, Distribution and Installation

II. Investment Highlights
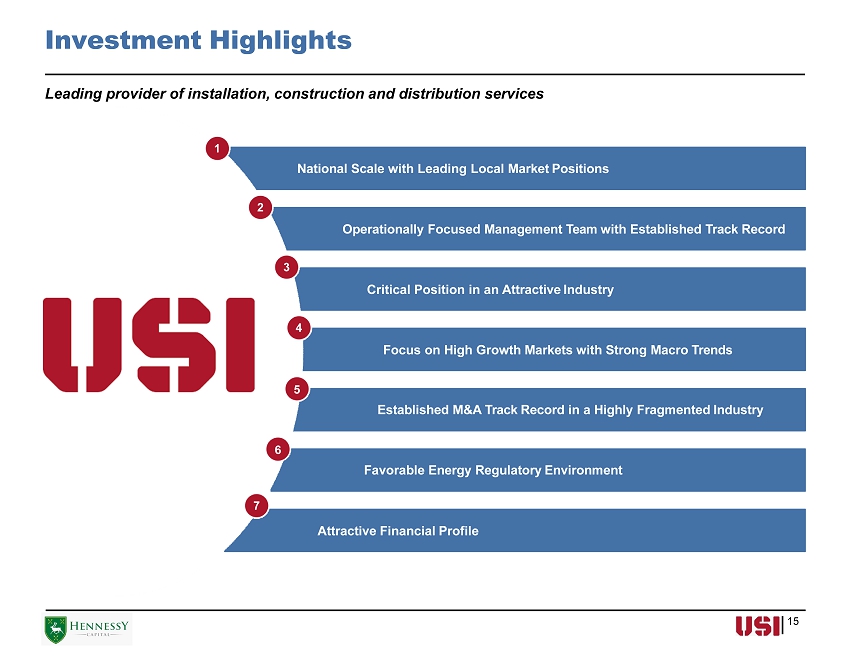
Investment Highlights Operationally Focused Management Team with Established Track Record Critical Position in an Attractive Industry Focus on High Growth Markets with Strong Macro Trends Attractive Financial Profile 1 National Scale with Leading Local Market Positions 2 3 4 5 Established M&A Track Record in a Highly Fragmented Industry 6 Favorable Energy Regulatory Environment 7 Leading provider of installation, construction and distribution services 15

1 National Scale with Leading Local Market Positions Best New Home Markets Index Market Market Pos i t i on Ft. Lauderdale / West Palm, FL #2 Salt Lake City, UT #1 Tampa / Fort Myers, FL #1 Denver / Colorado Springs, CO #1 / #2 Phoenix / Mesa, AZ #1 Dallas / Ft. Worth, TX #2 Portland / Sherwood, OR #2 Tucson, AZ #1 San Antonio, TX #2 Leader in Local Markets Served (1) Best Markets for Homebuilding (2) Source: (1) U.S. Census Bureau, McGraw - Hill. Market position based on USI management estimates of permits issued in each market. 2014 – 2016E single family housing permits for USI markets as a proxy for housing starts per McGraw - Hill. Market includes counties defined by USI management. | (2) Hanley Wood 2015 Metrostudy. Index indicates new home sales forecast on a localized level. 16 Worst 0 - 20 Below Average 21 - 40 Average 41 - 60 Above Average 61 - 80 Best 81 - 100 USI Markets
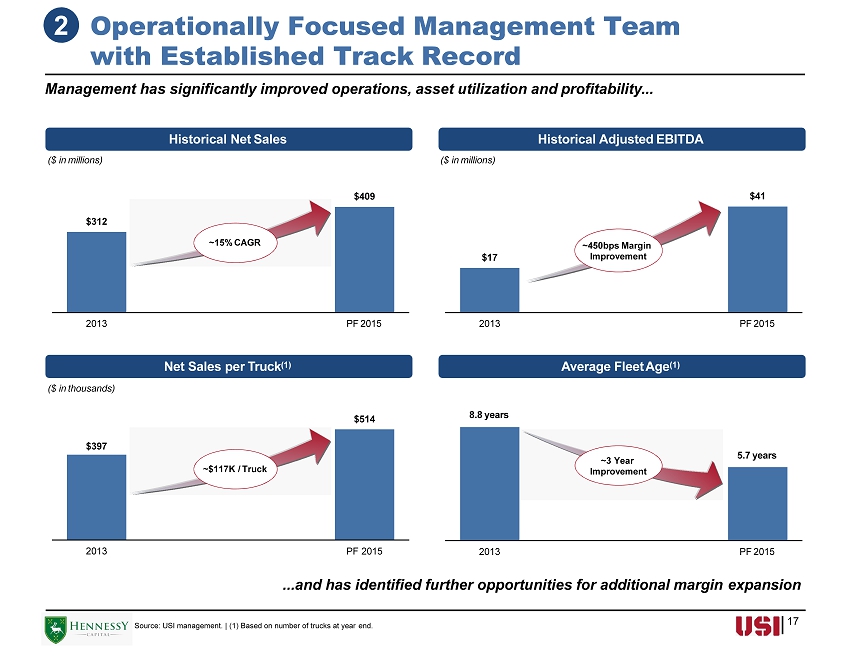
Historical Net Sales Historical Adjusted EBITDA ($ in millions) ($ in millions) Source: USI management. | (1) Based on number of trucks at year end. Net Sales per Truck (1) Average Fleet Age (1) ($ in thousands) 2 Operationally Focused Management Team with Established Track Record Management has significantly improved operations, asset utilization and profitability... ~15% CAGR ~$117K / Truck ~3 Year Impro v ement $17 $41 2 0 13 PF 2015 $312 $409 2 0 13 PF 2015 ~450bps Margin Improvement 17 $397 $514 2 0 13 8.8 years 5.7 years PF 2015 2013 PF 2015 ...and has identified further opportunities for additional margin expansion
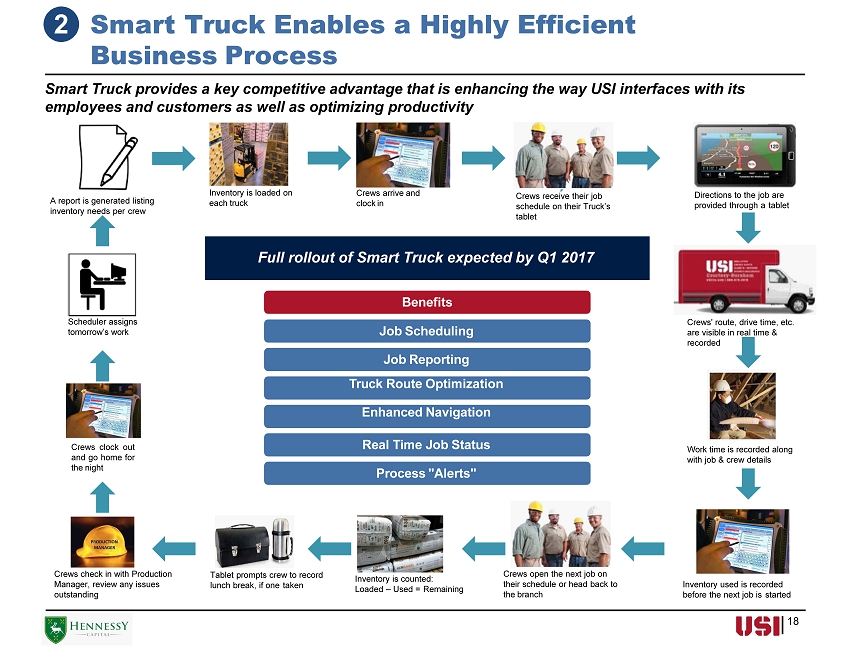
18 Smart Truck provides a key competitive advantage that is enhancing the way USI interfaces with its employees and customers as well as optimizing productivity Scheduler assigns tomorrow’s work A report is generated listing inventory needs per crew Inventory is loaded on each truck Crews arrive and clock in Crews receive their job schedule on their Truck’s tablet Directions to the job are provided through a tablet Crews' route, drive time, etc. are visible in real time & recorded Work time is recorded along with job & crew details Inventory used is recorded before the next job is started Crews open the next job on their schedule or head back to the branch Inventory is counted: Loaded – Used = Remaining Tablet prompts crew to record lunch break, if one taken Crews check in with Production Manager, review any issues outstanding Crews clock out and go home for the night Benefits Job Scheduling Job Reporting Truck Route Optimization Enhanced Navigation Real Time Job Status Process "Alerts" Full rollout of Smart Truck expected by Q1 2017 2 Smart Truck Enables a Highly Efficient Business Process
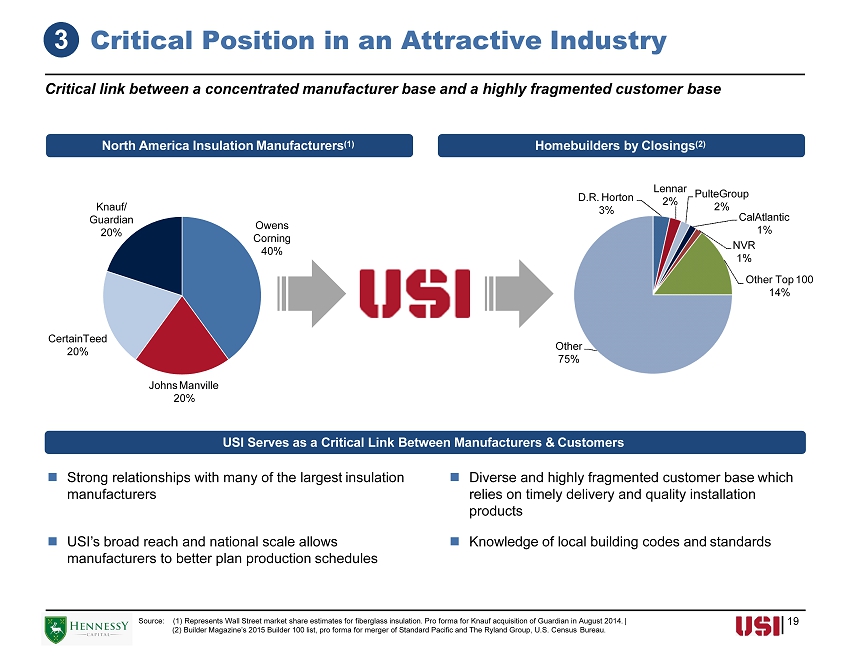
Critical link between a concentrated manufacturer base and a highly fragmented customer base North America Insulation Manufacturers (1) Homebuilders by Closings (2) USI Serves as a Critical Link Between Manufacturers & Customers Strong relationships with many of the largest insulation manufacturers Diverse and highly fragmented customer base which relies on timely delivery and quality installation products Owens Corning 40% Johns Manville 20% CertainTeed 20% Knauf/ Guardian 20% Source: (1) Represents Wall Street market share estimates for fiberglass insulation. Pro forma for Knauf acquisition of Guardian in August 2014. | (2) Builder Magazine’s 2015 Builder 100 list, pro forma for merger of Standard Pacific and The Ryland Group, U.S. Census Bureau. 3 Critical Position in an Attractive Industry USI’s broad reach and national scale allows manufacturers to better plan production schedules Knowledge of local building codes and standards 19 D.R. Horton 3% Lennar 2% PulteGroup 2% CalAtlantic 1% NVR 1% Other Top 100 14% Other 75%
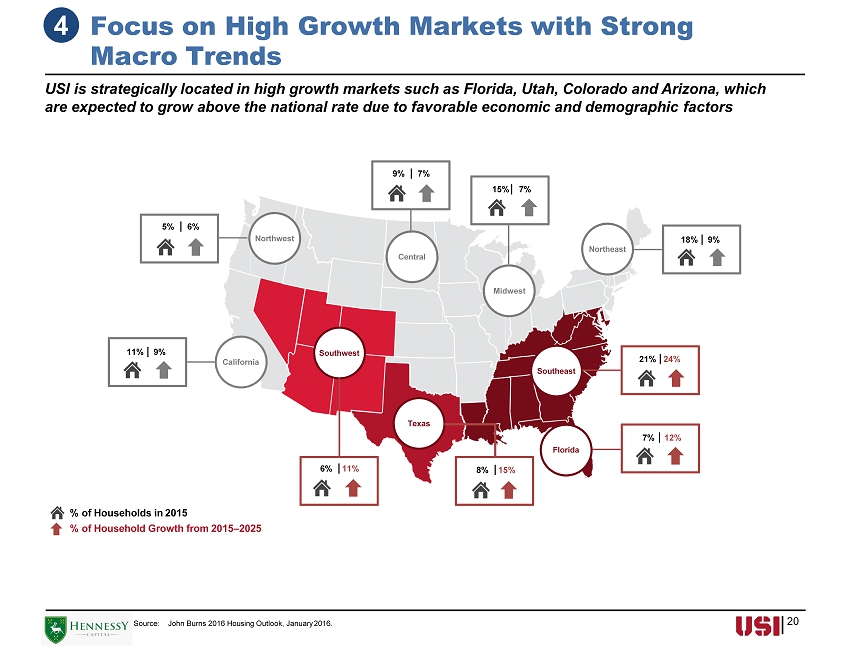
20 4 Focus on High Growth Markets with Strong Macro Trends Source: John Burns 2016 Housing Outlook, January 2016. % of Households in 2015 % of Household Growth from 2015 – 2025 California Northeast Northwest Central Mid w est Southwest Southeast 5% 6% 9% 7% 15% 7% 18% 9% 11% 9% 6% 11% 8% 15% Texas 7% 12% Florida 21% 24% USI is strategically located in high growth markets such as Florida, Utah, Colorado and Arizona, which are expected to grow above the national rate due to favorable economic and demographic factors
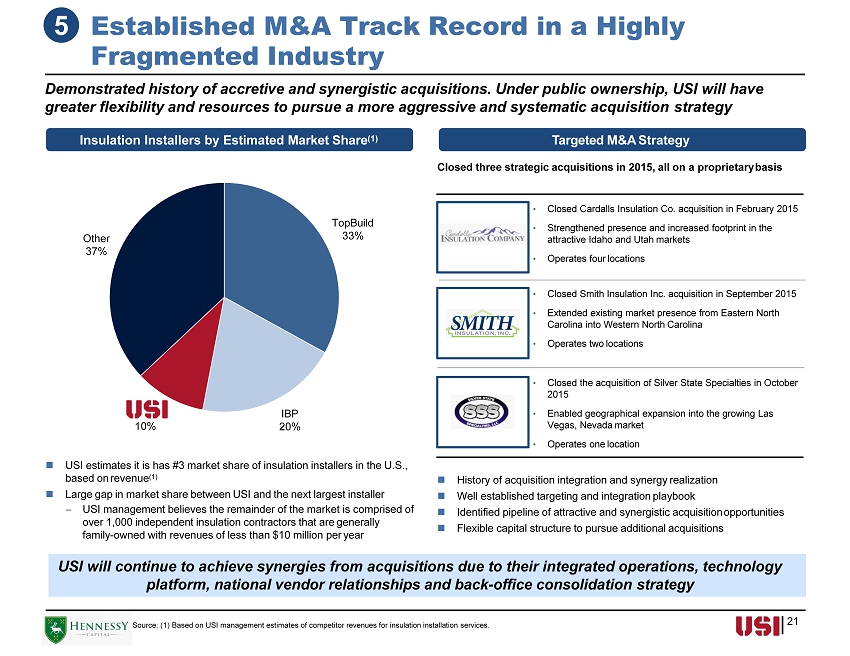
TopBuild 33% IBP 20% USI 10% Other 37% 21 History of acquisition integration and synergy realization Well established targeting and integration playbook Identified pipeline of attractive and synergistic acquisition opportunities Flexible capital structure to pursue additional acquisitions • Closed Cardalls Insulation Co. acquisition in February 2015 • Strengthened presence and increased footprint in the attractive Idaho and Utah markets • Operates four locations • Closed Smith Insulation Inc. acquisition in September 2015 • Extended existing market presence from Eastern North Carolina into Western North Carolina • Operates two locations • Closed the acquisition of Silver State Specialties in October 2015 • Enabled geographical expansion into the growing Las Vegas, Nevada market • Operates one location Source: (1) Based on USI management estimates of competitor revenues for insulation installation services. USI estimates it is has #3 market share of insulation installers in the U.S., based on revenue (1) Large gap in market share between USI and the next largest installer USI management believes the remainder of the market is comprised of over 1,000 independent insulation contractors that are generally family - owned with revenues of less than $10 million per year Demonstrated history of accretive and synergistic acquisitions. Under public ownership, USI will have greater flexibility and resources to pursue a more aggressive and systematic acquisition strategy Insulation Installers by Estimated Market Share (1) Targeted M&A Strategy Closed three strategic acquisitions in 2015, all on a proprietary basis USI will continue to achieve synergies from acquisitions due to their integrated operations, technology platform, national vendor relationships and back - office consolidation strategy 5 Established M&A Track Record in a Highly Fragmented Industry

Strategic initiatives include geographical expansion through opening of satellite locations in contiguous markets on the West Coast and entering into attractive new markets on the East Coast Installation Services Construction Services 5 Attractive New Market Expansion Opportunities 22
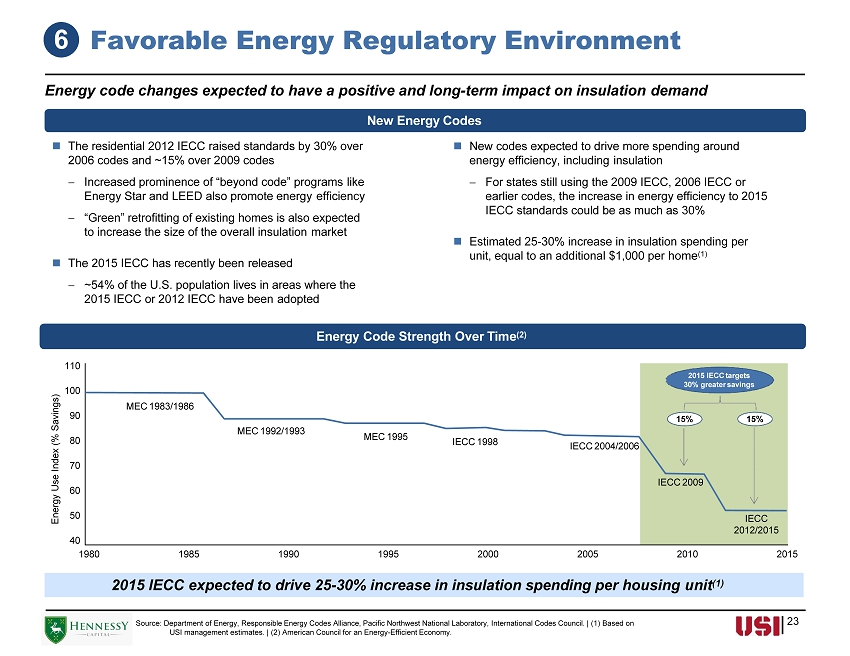
Energy code changes expected to have a positive and long - term impact on insulation demand Source: Department of Energy, Responsible Energy Codes Alliance, Pacific Northwest National Laboratory, International Codes Council. | (1) Based on USI management estimates. | (2) American Council for an Energy - Efficient Economy. The residential 2012 IECC raised standards by 30% over 2006 codes and ~15% over 2009 codes Increased prominence of “beyond code” programs like Energy Star and LEED also promote energy efficiency “Green” retrofitting of existing homes is also expected to increase the size of the overall insulation market The 2015 IECC has recently been released ~54% of the U.S. population lives in areas where the 2015 IECC or 2012 IECC have been adopted 6 Favorable Energy Regulatory Environment New Energy Codes New codes expected to drive more spending around energy efficiency, including insulation For states still using the 2009 IECC, 2006 IECC or earlier codes, the increase in energy efficiency to 2015 IECC standards could be as much as 30% Estimated 25 - 30% increase in insulation spending per unit, equal to an additional $1,000 per home (1) Energ y Us e Inde x ( % Savings) 40 198 0 198 5 199 0 199 5 200 0 200 5 201 0 2015 50 60 70 80 90 100 Energy Code Strength Over Time (2) 110 IECC 2012/2015 IECC 2009 IECC 2004/2006 IECC 1998 MEC 1995 MEC 1992/1993 MEC 1983/1986 1 5 % 1 5 % 2015 IECC targets 30% greater savings 2015 IECC expected to drive 25 - 30% increase in insulation spending per housing unit (1) 23
III. Financial Summary
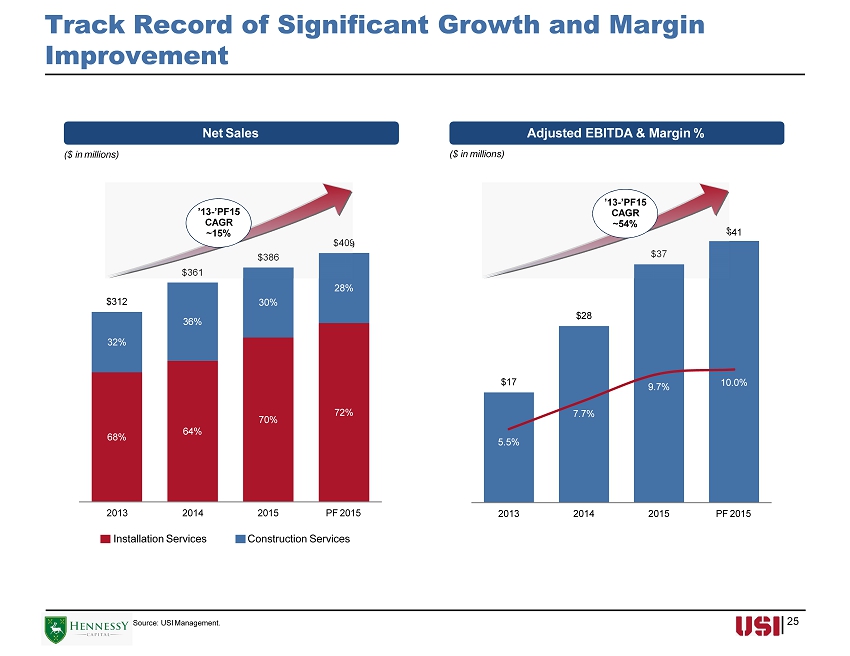
$17 $28 $41 $37 5.5% 7.7% 9.7% 10.0% 2 0 13 2 0 14 2 0 15 PF 2015 68% 64% 70% 72% 32% 36% 30% 28% $312 $409 $386 $361 Track Record of Significant Growth and Margin Improvement Net Sales Source: USI Management. Adjusted EBITDA & Margin % ($ in millions) ($ in millions) 2 0 1 3 2 0 14 Installation Services 2015 PF 2015 Construction Services 25 ’13 - ’PF 1 5 CAGR ~15% ’13 - ’PF 1 5 CAGR ~54%

2016 Guidance 26 Source: USI Management. | (1) 2016E does not include any additional acquisitions. See "Disclaimers – Financial Projections" for more information regarding 2016 estimated net sales and Adjusted EBITDA. | (2) Adjustments to 2016E EBITDA include estimated stock compensation expenses and acquisition - related expenses. Strong growth expected to continue in 2016 Net Sales (1) ($ in millions) $488 $409 PF Net Sales Growth ~19% PF 2015 2 0 1 6E PF 2015 2 0 1 6E Adjusted EBITDA (2) ($ in millions) $50 $41 PF Adj. EBITDA Growth ~22%
IV. Appendix

28 Financial Summary and Non - GAAP Reconciliations ($ in millions) 20 1 3 20 1 4 20 1 5 CAGR '13 - '15 Net Sales Installation Services $2 12. 9 $2 31. 9 $2 70. 2 12. 6 % Construction Services 99.3 12 8 .8 11 5 .4 7.8% Total Net Sales 31 2 .2 36 0 .7 38 5 .5 11.1 % % Growth - 15. 5 % 6.9% Cost of Sales 25 0 .7 28 5 .5 29 7 .0 Total Gross Profit 61.5 75.2 88.6 20. 0 % % of Net Sales 19.7 % 20. 8 % 23. 0 % SG&A Expenses 49.1 52.4 57.1 Operating Income 12.3 22.8 30.2 56.2 % % of Net Sales 4 .0% 6 .3% 7 .8% Net Income 13.7 13.2 17.8 14.1 % D&A 2.5 2 .7 5.2 EBITDA 14.6 25.7 34.7 54.4 % Adjustments (1) 2.7 2 .0 2.7 Adjusted EBITDA $1 7 .3 $2 7 .7 $3 7 .4 47.0 % % of Net Sales 5 .5% 7 .7% 9 .7% Capital Expenditures 4 .8 10 . 4 10 . 9 Net Sales Contribution from Acquisitions - - 23.8 EBITDA Contribution from Acquisitions - - 3.6 Pro Forma Net Sales (2) - - 40 9 .3 14.5 % Pro Forma Adjusted EBITDA (2) - - $4 1 .0 54.0 % % of Net Sales - - 10. 0 % Source: (1) Represents one - time, non - recurring expenses. See next slide for additional information regarding adjustments. | (2) Pro forma net sales and pro forma Adjusted EBITDA measures performance by combining the historical consolidated statements of income of USI with Cardalls, Smith and Silver States Specialties, giving effect to these acquisitions as if they had been consummated on January 1, 2015.
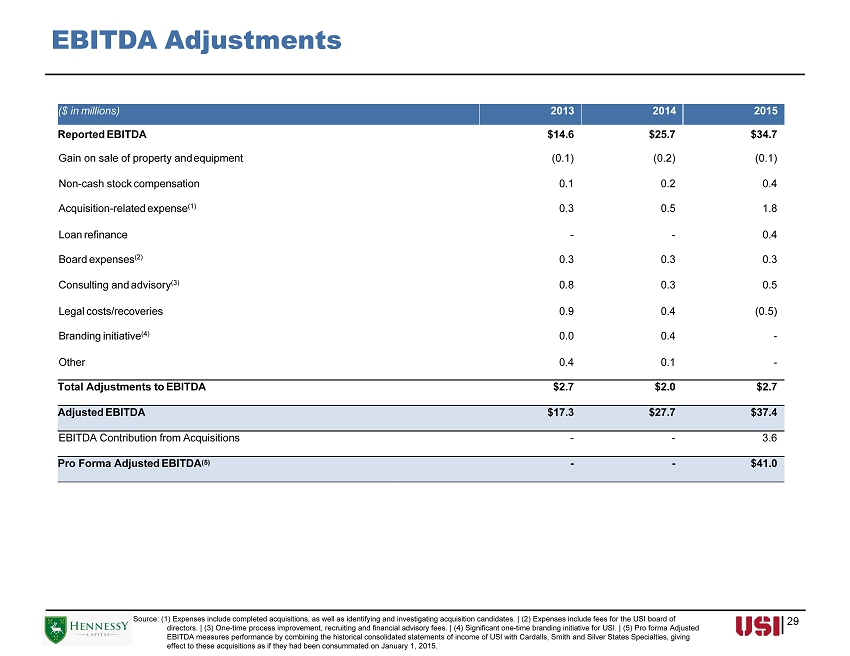
EBITDA Adjustments 29 ($ in millions) 20 1 3 20 1 4 20 1 5 Reported EBITDA $1 4 .6 $2 5 .7 $3 4 .7 Gain on sale of property and equipment (0.1) (0.2) (0.1) Non - cash stock compensation 0.1 0.2 0.4 Acquisition - related expense (1) 0.3 0.5 1.8 Loan refinance - - 0.4 Board expenses (2) 0.3 0.3 0.3 Consulting and advisory (3) 0.8 0.3 0.5 Legal costs/recoveries 0.9 0.4 (0.5) Branding initiative (4) 0.0 0.4 - Other 0.4 0.1 - Total Adjustments to EBITDA $2.7 $2.0 $2.7 Adjusted EBITDA $1 7 .3 $2 7 .7 $3 7 .4 EBITDA Contribution from Acquisitions - - 3 . 6 Pro Forma Adjusted EBITDA (5) - - $4 1 .0 Source: (1) Expenses include completed acquisitions, as well as identifying and investigating acquisition candidates. | (2) Expenses include fees for the USI board of directors. | (3) One - time process improvement, recruiting and financial advisory fees. | (4) Significant one - time branding initiative for USI. | (5) Pro forma Adjusted EBITDA measures performance by combining the historical consolidated statements of income of USI with Cardalls, Smith and Silver States Specialties, giving effect to these acquisitions as if they had been consummated on January 1, 2015.
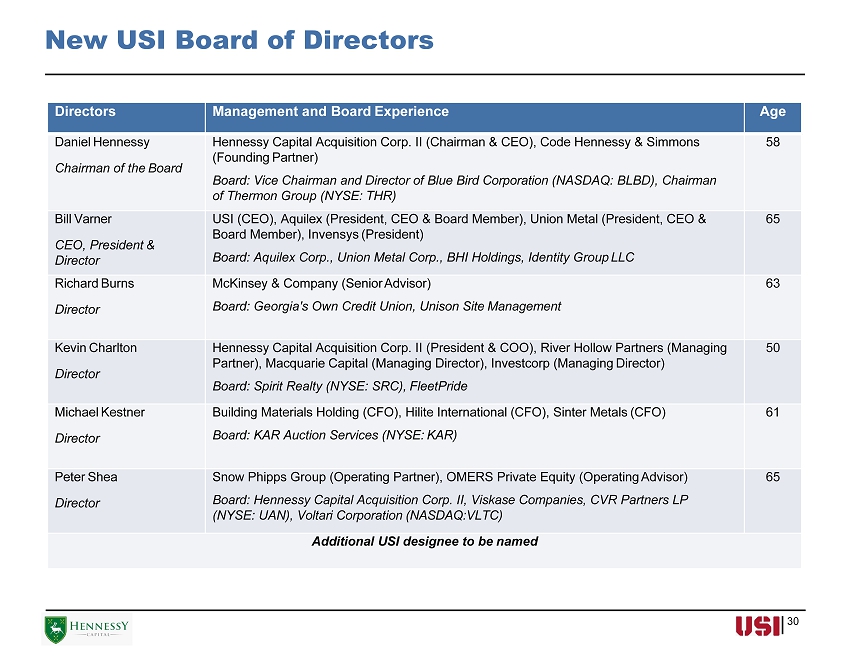
30 Directors Management and Board Experience Age Daniel Hennessy Chairman of the Board Hennessy Capital Acquisition Corp. II (Chairman & CEO), Code Hennessy & Simmons (Founding Partner) Board: Vice Chairman and Director of Blue Bird Corporation (NASDAQ: BLBD), Chairman of Thermon Group (NYSE: THR) 58 Bill Varner CEO, President & Director USI (CEO), Aquilex (President, CEO & Board Member), Union Metal (President, CEO & Board Member), Invensys (President) Board: Aquilex Corp., Union Metal Corp., BHI Holdings, Identity Group LLC 65 Richard Burns Director McKinsey & Company (Senior Advisor) Board: Georgia's Own Credit Union, Unison Site Management 63 Kevin Charlton Director Hennessy Capital Acquisition Corp. II (President & COO), River Hollow Partners (Managing Partner), Macquarie Capital (Managing Director), Investcorp (Managing Director) Board: Spirit Realty (NYSE: SRC), FleetPride 50 Michael Kestner Director Building Materials Holding (CFO), Hilite International (CFO), Sinter Metals (CFO) Board: KAR Auction Services (NYSE: KAR) 61 Peter Shea Director Snow Phipps Group (Operating Partner), OMERS Private Equity (Operating Advisor) Board: Hennessy Capital Acquisition Corp. II, Viskase Companies, CVR Partners LP (NYSE: UAN), Voltari Corporation (NASDAQ:VLTC) 65 Additional USI designee to be named New USI Board of Directors
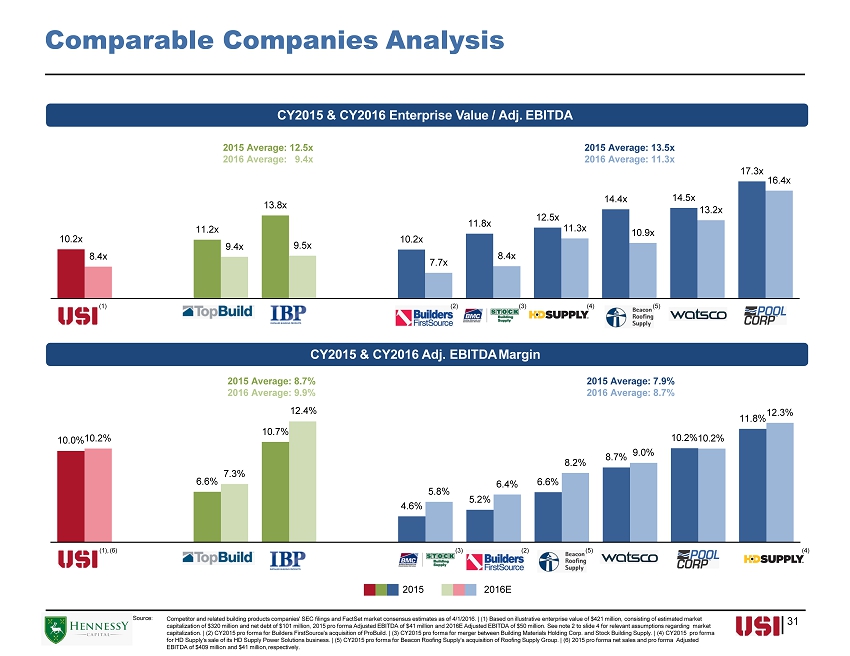
6.6% 10.7% 4.6% 5.2% 6.6% 8.7% 11.8% 10.0% 10.2% 7.3% 5.8% 6.4% 8.2% 9.0% 10.2% 10.2% 12.3% USI TopBuild IBP BMC Stock Builders Beacon Watsco Pool HDS FirstSource Roofing 10.2x 11.2x 13.8x 10.2x 11.8x 12.5x 14.4x 14.5x 17.3x 8.4x 9.4x 9.5x 7.7x 8.4x 11.3x 10.9x 13.2x 16.4x USI TopBuild IBP Builders BMC Stock HDS Beacon Watsco Pool FirstSource Roofing Comparable Companies Analysis 31 CY2015 & CY2016 Enterprise Value / Adj. EBITDA CY2015 & CY2016 Adj. EBITDA Margin Sou r ce: 2015 2016E Competitor and related building products companies' SEC filings and FactSet market consensus estimates as of 4/1/2016. | (1) Based on illustrative enterprise value of $421 million, consisting of estimated market capitalization of $320 million and net debt of $101 million, 2015 pro forma Adjusted EBITDA of $41 million and 2016E Adjusted EBITDA of $50 million. See note 2 to slide 4 for relevant assumptions regarding market capitalization. | (2) CY2015 pro forma for Builders FirstSource's acquisition of ProBuild. | (3) CY2015 pro forma for merger between Building Materials Holding Corp. and Stock Building Supply. | (4) CY2015 pro forma for HD Supply's sale of its HD Supply Power Solutions business. | (5) CY2015 pro forma for Beacon Roofing Supply's acquisition of Roofing Supply Group. | (6) 2015 pro forma net sales and pro forma Adjusted EBITDA of $409 million and $41 million, respectively. 2015 Average: 8.7% 2016 Average: 9.9% 12.4% 2015 Average: 7.9% 2016 Average: 8.7% 2015 Average: 12.5x 2016 Average: 9.4x 2015 Average: 13.5x 2016 Average: 11.3x (1), (6) ( 5) ( 3) ( 2) ( 4) ( 1) ( 5) ( 3) ( 2) ( 4)