Investor Presentation Hennessy Capital Acquisition Corp. II Anticipated Merger with Daseke, Inc. December 2016
1 Confidentiality The information in this presentation is highly confidential . The distribution of this presentation by an authorized recipient to any other person is unauthorized . Any photocopying, disclosure, reproduction or alteration of the contents of this presentation and any forwarding of a copy of this presentation or any portion of this presentation to any person is prohibited . The recipient of this presentation shall keep this presentation and its contents confidential, shall not use this presentation and its contents for any purpose other than as expressly authorized by Hennessy Capital Acquisition Corp . II (“HCAC”) and Daseke, Inc . (“Daseke”) and shall be required to return or destroy all copies of this presentation or portions thereof in its possession promptly following request for the return or destruction of such copies . By accepting delivery of this presentation, the recipient is deemed to agree to the foregoing confidentiality requirements . Use of Projections This presentation contains, and the proxy statement referred to below will contain, financial forecasts with respect to Daseke’s projected revenues, Adjusted EBITDA, and net capital expenditures for Daseke’s fiscal 2016 and 2017 . Neither HCAC’s independent auditors, nor the independent registered public accounting firm of Daseke, audited, reviewed, compiled, or performed any procedures with respect to the projections for the purpose of their inclusion in this presentation and their anticipated inclusion in the proxy statement referred to below, and accordingly, neither of them expressed an opinion or provided any other form of assurance with respect thereto for the purpose of this presentation or the proxy statement . These projections should not be relied upon as being necessarily indicative of future results . The proxy statement referred to below will contain a full description of the limitations associated with these forecasts . In this presentation, certain of the above - mentioned projected information has been repeated (in each case, with an indication that the information is an estimate and is subject to the qualifications presented herein), for purposes of providing comparisons with historical data . The assumptions and estimates underlying the prospective financial information are inherently uncertain and are subject to a wide variety of significant business, economic and competitive risks and uncertainties that could cause actual results to differ materially from those contained in the prospective financial information . Accordingly, there can be no assurance that the prospective results are indicative of the future performance of HCAC, Daseke, or the combined company after completion of the proposed business combination, or that actual results will not differ materially from those presented in the prospective financial information . Inclusion of the prospective financial information in this presentation should not be regarded as a representation by any person that the results contained in the prospective financial information will be achieved . Forward Looking Statements This presentation includes “forward looking statements” within the meaning of the “safe harbor” provisions of the United States Private Securities Litigation Reform Act of 1995 . Forward looking statements may be identified by the use of words such as "forecast," "intend," "seek," "target," “anticipate,” “believe,” “expect,” “estimate,” “plan,” “outlook,” and “project” and other similar expressions that predict or indicate future events or trends or that are not statements of historical matters . Such forward looking statements include projected financial information . Such forward looking statements with respect to revenues, earnings, performance, strategies, prospects and other aspects of the businesses of HCAC, Daseke and the combined company after completion of the proposed business combination are based on current expectations that are subject to risks and uncertainties . A number of factors could cause actual results or outcomes to differ materially from those indicated by such forward looking statements . These factors include, but are not limited to : ( 1 ) the failure of the parties to consummate the transactions contemplated by the merger agreement relating to the proposed business combination (the “Merger Agreement”), including as a result of the occurrence of any event, change or other circumstances that could give rise to the termination of the Merger Agreement ; ( 2 ) the outcome of any legal proceedings that may be instituted against Daseke or HCAC arising from the announcement of the proposed business combination and transactions contemplated thereby ; ( 3 ) the inability to complete the transactions contemplated by the proposed business combination due to the failure to obtain approval of the stockholders of HCAC, or the failure to satisfy other conditions to closing in the Merger Agreement ; ( 4 ) the ability of the combined company to meet the Nasdaq Capital Market’s listing standards, including having the requisite number of stockholders ; ( 5 ) the risk that the proposed business combination disrupts current plans and operations as a result of the announcement and consummation of the transactions described herein ; ( 6 ) the inability to recognize the anticipated benefits of the business combination, which may be affected by, among other things, competition, and the ability of the combined business to grow and manage growth profitably ; ( 7 ) costs related to the business combination ; ( 8 ) changes in applicable laws or regulations ; ( 9 ) the possibility that Daseke or HCAC may be adversely affected by other economic, business, and/or competitive factors ; and ( 10 ) other risks and uncertainties that will be indicated from time to time in the proxy statement referred to below, including those under “Risk Factors” therein, and other documents filed or to be filed with the Securities and Exchange Commission (“SEC”) and delivered to HCAC's stockholders . You are cautioned not to place undue reliance upon any forward - looking statements, which speak only as of the date made . HCAC and Daseke undertake no commitment to update or revise the forward - looking statements, whether as a result of new information, future events or otherwise . In most instances, where third party sources are identified in this presentation, the information has been derived by Daseke management from the source data . Use of Non - GAAP Financial Measures This presentation includes non - GAAP financial measures, including Adjusted EBITDA, Adjusted EBITDA Margin, and Free Cash Flow . Daseke defines Adjusted EBITDA as net income (loss) plus (i) depreciation and amortization, (ii) interest expense, including other fees and charges associated with indebtedness, net of interest income, (iii) income taxes, (iv) acquisition - related transaction expenses (including due diligence costs, legal, accounting and other advisory fees and costs, retention and severance payments and financing fees and expenses), (v) non - cash impairments, (vi) losses (gains) on sales of defective revenue equipment out of the normal replacement cycle, (vii) impairments related to defective revenue equipment sold out of the normal replacement cycle, (viii) initial public offering - related expenses (which offering Daseke is no longer pursuing as a result of the proposed business combination), and (ix) expenses related to the business combination and related transactions . Adjusted EBITDA Margin is defined as Adjusted EBITDA divided by total revenues . Free Cash Flow is defined as Adjusted EBITDA less net capital expenditures (capital expenditures less proceeds from equipment sales) . You can find the reconciliation of these measures to the nearest comparable GAAP measures elsewhere in this presentation . Except as otherwise noted, all references herein to full - year periods refer to Daseke’s fiscal year, which ends on December 31 . Daseke believes that these non - GAAP measures of financial results provide useful information to management and investors regarding certain financial and business trends relating to Daseke’s financial condition and results of operations . Daseke’s management uses these non - GAAP measures to compare Daseke’s performance to that of prior periods for trend analyses and for budgeting and planning purposes . Daseke believes that the use of these non - GAAP financial measures provides an additional tool for investors to use in evaluating ongoing operating results and trends . Management of Daseke does not consider these non - GAAP measures in isolation or as an alternative to financial measures determined in accordance with GAAP . We have not reconciled the non - GAAP forward looking information to their corresponding GAAP measures because we do not provide guidance for the various reconciling items such as provision for income taxes and depreciation and amortization, as certain items that impact these measures are out of our control or cannot be reasonably predicted without unreasonable efforts . You should review Daseke’s audited financial statements, which will be included in HCAC’s filings with the SEC, including the proxy statement to be delivered to HCAC’s stockholders, and not rely on any single financial measure to evaluate Daseke’s business . Other companies may calculate Adjusted EBITDA, Adjusted EBITDA Margin, Free Cash Flow and other non - GAAP measures differently, and therefore Daseke’s Adjusted EBITDA, Adjusted EBITDA Margin, and Free Cash Flow and other non - GAAP measures may not be directly comparable to similarly titled measures of other companies . Additional Information The proposed business combination will be submitted to stockholders of HCAC for their consideration . Stockholders are urged to read the proxy statement and any other relevant documents that will be filed with the SEC by HCAC when they become available because they will contain important information about HCAC, Daseke and the proposed business combination . Stockholders will be able to obtain a free copy of the proxy statement (when filed), as well as other filings containing information about HCAC, Daseke and the proposed business combination, without charge, at the SEC’s website located at www . sec . gov or by directing a request to Nicholas Petruska, Chief Financial Officer, 700 Louisiana Street, Suite 900 , Houston, Texas 77002 , ( 713 ) 300 - 8242 . Participants in the Solicitation HCAC and its directors and executive officers and other persons may be deemed to be participants in the solicitations of proxies from HCAC’s stockholders in respect of the proposed business combination and the other matters set forth in the definitive proxy statement . Information regarding HCAC’s directors and executive officers is available under the heading “Directors, Executive Officers and Corporate Governance” in its definitive proxy statement for its 2016 Annual Meeting of Stockholders dated November 22 , 2016 filed with the SEC on November 22 , 2016 . Additional information regarding the participants in the proxy solicitation and a description of their direct and indirect interests, by security holdings or otherwise, will be contained in the proxy statement relating to the proposed business combination when it becomes available . Important Disclaimers
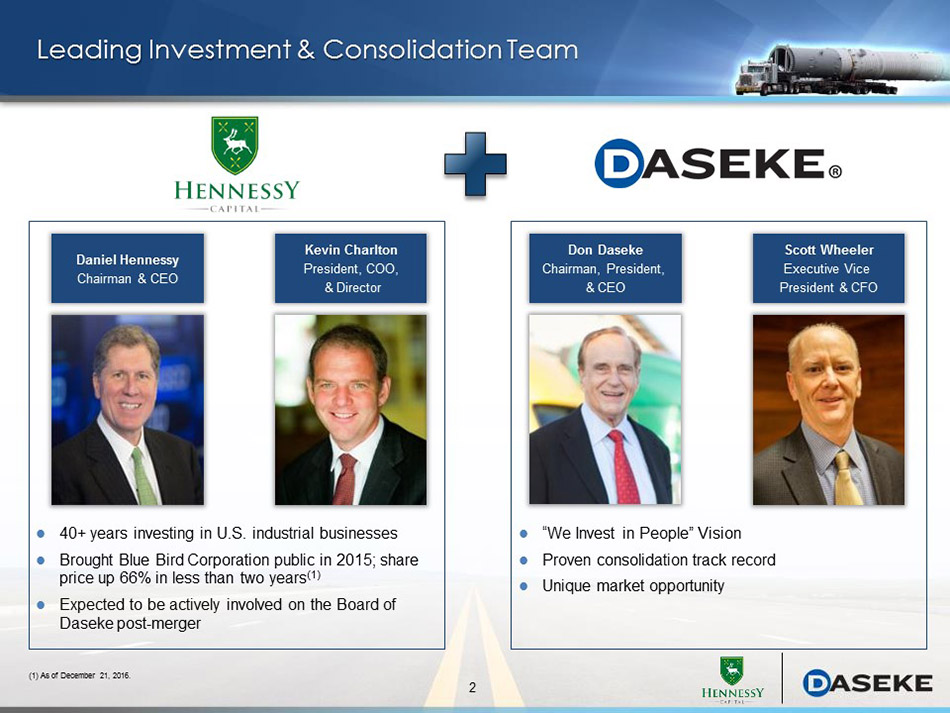
2 Daniel Hennessy Chairman & CEO Kevin Charlton President, COO, & Director 40 + years investing in U.S. industrial businesses Brought Blue Bird Corporation public in 2015; share price up 66% in less than two years (1) Expected to be actively involved on the Board of Daseke post - merger Leading Investment & Consolidation Team Don Daseke Chairman, President, & CEO Scott Wheeler Executive Vice President & CFO “We Invest in People” Vision Proven consolidation track record Unique market opportunity (1) As of December 21, 2016.
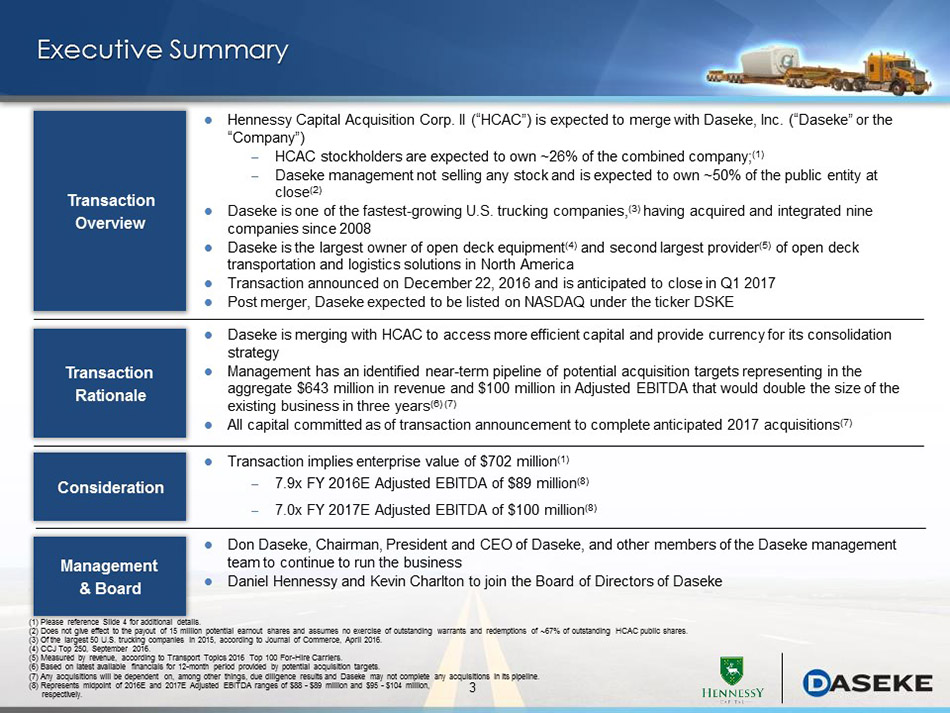
3 Executive Summary Transaction Overview Hennessy Capital Acquisition Corp. II (“HCAC”) is expected to merge with Daseke, Inc. (“Daseke” or the “Company”) – HCAC stockholders are expected to own ~26% of the combined company; (1) – Daseke management not selling any stock and is expected to own ~50% of the public entity at close (2) Daseke is one of the fastest - growing U.S. trucking companies, (3) having acquired and integrated nine companies since 2008 Daseke is the largest owner of open deck equipment (4) and second largest provider (5) of open deck transportation and logistics solutions in North America Transaction announced o n December 22, 2016 and is anticipated to close in Q1 2017 Post merger, Daseke expected to be listed on NASDAQ under the ticker DSKE Consideration Transaction implies enterprise value of $702 million (1) – 7.9x FY 2016E Adjusted EBITDA of $89 million (8) – 7.0x FY 2017E Adjusted EBITDA of $100 million (8) Management & Board Don Daseke, Chairman, President and CEO of Daseke, and other members of the Daseke management team to continue to run the business Daniel Hennessy and Kevin Charlton to join the Board of Directors of Daseke Transaction Rationale Daseke is merging with HCAC to access more efficient capital and provide currency for its consolidation strategy Management has an identified near - term pipeline of potential acquisition targets representing in the aggregate $643 million in revenue and $100 million in Adjusted EBITDA that would double the size of the existing business in three years (6) (7) All capital committed as of transaction announcement to complete anticipated 2017 acquisitions (7) (1) Please reference Slide 4 for additional details . (2) Does not give effect to the payout of 15 million potential earnout shares and assumes no exercise of outstanding warrants and redemptions of ~67% of outstanding HCAC public shares. (3) Of the largest 50 U.S. trucking companies in 2015, according to Journal of Commerce, April 2016. (4) CCJ Top 250, September 2016. (5) Measured by revenue, according to Transport Topics 2016 Top 100 For - Hire Carriers. (6) Based on latest available financials for 12 - month period provided by potential acquisition targets. (7) Any acquisitions will be dependent on, among other things, due diligence results and Daseke may not complete any acquisitions in its pipeline . (8) Represents midpoint of 2016E and 2017E Adjusted EBITDA ranges of $88 - $89 million and $95 - $ 104 million, respectively.

4 Transaction Overview Estimated Uses Estimated Sources ($ in millions) ($ in millions) Pro Forma Ownership Pro Forma Capitalization (Shares in millions) ($ in millions) (3) (3) Shares % Existing Daseke Stockholders (4) 25.9 74% HCAC Public Stockholders 6.5 18% HCAC Founders 2.7 8% Pro Forma Outstanding Shares 35.1 100% Cash from HCAC Trust (1) 65$ Convertible Preferred 65 New Term Loan 250 Stock Consideration (2) 236 Assumed Daseke Equipment Loans and Real Estate Debt 45 $70 Million ABL Revolver (Undrawn at Close) - Existing Daseke Balance Sheet Cash 5 Total Estimated Sources 666$ Stock Consideration (2) 236$ Assumed Daseke Equipment Loans and Real Estate Debt 45 Refinance Existing Daseke Debt 311 Transaction Fees & Expenses (HCAC and Daseke) 30 Cash to Balance Sheet 9 Repurchase of Main Street and Prudential Shares 35 Total Estimated Uses 666$ (1) Based on cash in trust account at September 30, 2016 less $0.1 million withdrawn in October 2016 for taxes and working capita l p urposes and assumes ~67 % redemptions. (2) Estimated based on Daseke debt and cash as of September 2016. Final amount will be based on Daseke's balance sheet as of the closing date. ( 3) Based on estimated 35.1 million pro forma outstanding shares of HCAC common stock, estimated market value of $10.00/share and ~67% redemptions. Pro forma outstanding shares does not give effect to the payout of 15 million potential earnout shares and assumes no exercise of outstanding warrants (35 million warrants to purchase half a share of HCAC common stock at $5.75 or 17.5 million at $11.50 on a share equivalent basis). (4) Includes approximately 2.3 million founder shares being transferred from the Sponsor to the existing Daseke stockholders at close. (5) Net Debt is defined as Total Debt less cash. x 2016E $ Adj. EBITDA Balance Sheet Cash 9 New Term Loan 250 2.8x Assumed Equipment Loans & Real Estate Debt 45 0.5x Total Debt 295 3.3x Net Debt (5) 286 3.2x Market Capitalization 351$ Net Debt 286 Convertible Preferred (If Not Converted) 65 Pro Forma Enterprise Value 702$ 7.9x

5 Regulations : ELDs expected to reduce industry capacity by a net equivalent of ~110k trucks (1) 3 Scale : Scaled carriers offer significant advantages over the competition 2 5 Track Record of Organic Growth : ~20% organic Adjusted EBITDA growth post acquisition (3) 6 Acquisition Pipeline : $ 100 million in Adjusted EBITDA, which would double the size of Daseke within 3 years 4 Proven Track Record : Revenue grew from $ 30 million in 2009 to $ 655 million in 2016E (2) Significant Opportunity Investment Highlights Fragmentation : A highly fragmented $ 133 billion market expected in 2016 (1) 1 Compelling Opportunity Exceptional Growth Daseke is merging with HCAC to access more efficient capital and provide currency for its consolidation strategy (1) Source: FTR Associates, Inc. (“FTR”). ( 2) Represents midpoint of 2016E revenue range of $650 - $660 million. ( 3) Represents simple average of Adjusted EBITDA growth achieved at the companies acquired by Daseke (other than Smokey Point, for which Adj ust ed EBITDA with a sufficient level of reliability is not available for the year prior to its acquisition by Daseke) based on the companies’ Adjusted EBITDA for the year prior to Daseke’s acquisition as compared to the companies’ Adjusted EBITDA for the second year following Daseke’s acquisition. Growth achieved at Hornady Transportation and Bulldog Hiway Express, which were acquired in 2015, were calculated based on projected Adjusted EBITDA for 2016. I ncluding Smokey Point’s Adjusted EBITDA growth from the first year after its acquisition by Daseke to the second year, the growth rate of the acquired companies ’ Adjusted EBITDA would have been 21.5%.
BUILDING NORTH AMERICA’S PREMIER Open Deck Transportation & Logistics Provider 6 6
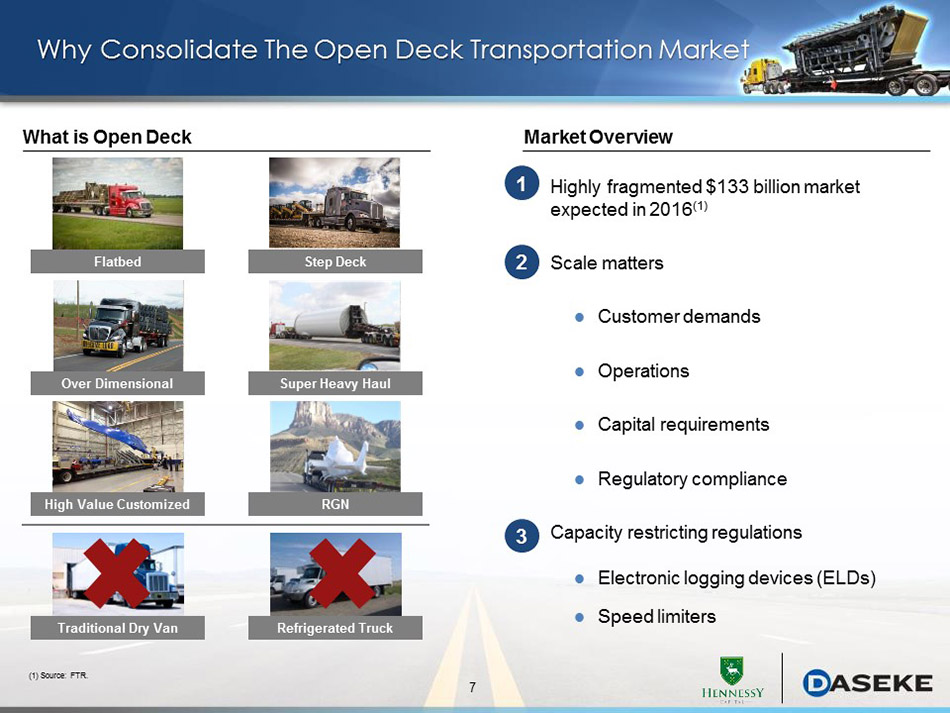
7 Why Consolidate The Open Deck Transportation Market Market Overview Highly fragmented $ 133 b illion market expected in 2016 (1) Scale matters Customer demands Operations Capital requirements Regulatory compliance Capacity restricting r egulations Electronic logging devices (ELDs) Speed limiters 1 2 3 What is Open Deck Flatbed Step Deck Over Dimensional Super Heavy Haul RGN High Value Customized Traditional Dry Van Refrigerated Truck (1) Source: FTR.
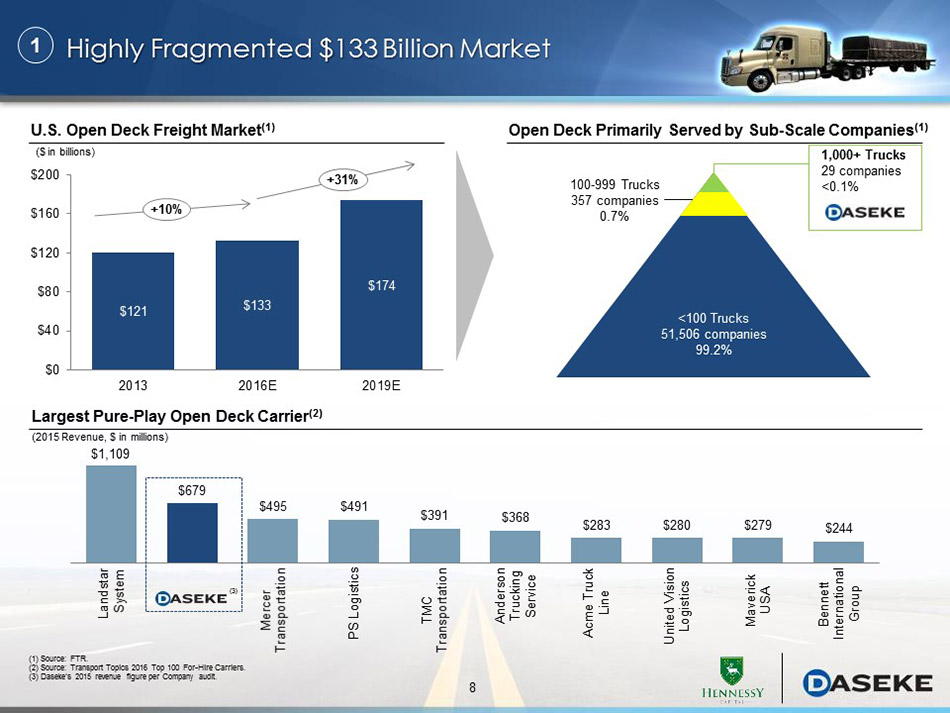
8 $1,109 $679 $495 $491 $391 $368 $283 $280 $279 $244 Landstar System Mercer Transportation PS Logistics TMC Transportation Anderson Trucking Service Acme Truck Line United Vision Logistics Maverick USA Bennett International Group Highly Fragmented $ 133 Billion Market Largest Pure - Play Open Deck Carrier (2) (1) Source: FTR. (2) Source: Transport Topics 2016 Top 100 For - Hire Carriers. ( 3 ) Daseke’s 2015 revenue figure per Company audit . (2015 Revenue, $ in millions) U.S. Open Deck Freight Market (1) ($ in billions) 1 <100 Trucks 51,506 companies 99.2% Open Deck Primarily Served by Sub - Scale Companies (1) 1,000+ Trucks 29 companies <0.1% $121 $133 $174 $0 $40 $80 $120 $160 $200 2013 2016E 2019E + 31% + 10% 100 - 999 Trucks 357 companies 0.7% (3)

9 Scale Matters Operations Capital Requirements Regulatory Compliance Customer Demands ● National customers want to work with national carriers (vendor consolidation ) ● Large insurance liability coverage (unavailable to smaller carriers) ● Customers expect carriers to have sophisticated technology systems ● National sales presence ● More attractive acquirer ● Greater capacity and higher service levels ● Stronger purchasing power ● Small carriers are challenged by personal guarantees and heavy customer concentrations ● More favorable terms for capital ● Access to public markets Scaled carriers are well - positioned to meet the evolving market demands Daseke’s ability to leverage its scale provides significant advantages over the competition Advantages of Scale 2 ● Daseke already has strong compliance practices; challenging for those who do not ● Better prepared with capital, people and processes to deal with increasing safety and environmental regulations Operations Regulatory Compliance Capital Requirements Customer Demands
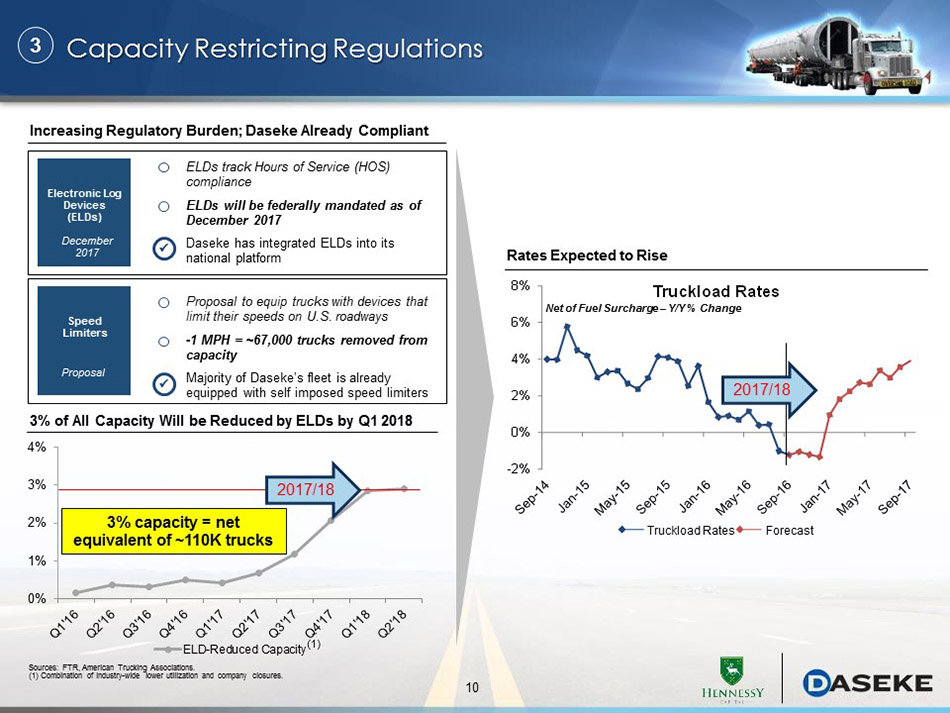
10 ELDs track Hours of Service (HOS) compliance ELDs will be federally mandated as of December 2017 Daseke has integrated ELDs into its national platform Electronic Log Devices (ELDs) December 2017 x 0% 1% 2% 3% 4% ELD-Reduced Capacity Capacity Restricting Regulations 3 Increasing Regulatory Burden; Daseke Already Compliant Speed Limiters Proposal Proposal to equip trucks with devices that limit their speeds on U.S. roadways - 1 MPH = ~67,000 trucks removed from capacity Majority of Daseke’s fleet is already equipped with self imposed speed limiters x 3% of All Capacity Will be Reduced by ELDs by Q1 2018 2017/18 3% capacity = net equivalent of ~110K trucks Sources: FTR, American Trucking Associations. (1) Combination of industry - wide lower utilization and company closures. -2% 0% 2% 4% 6% 8% Truckload Rates Rates Expected to Rise 2017/18 Net of Fuel Surcharge – Y/Y % Change Truckload Rates Forecast (1)

11 Why Daseke Is the Right Consolidator Why Daseke High growth , proven t rack r ecord of acquisition & integration Highly accretive acquisition pipeline Track record of organic g rowth p ost a cquisition Blue chip c ustomer b ase Well - diversified end - markets Comprehensive North American terminal footprint “Asset Right” o perating m odel 1 2 3 4 5 6 One of the fastest - growing U.S. trucking companies, (1) having acquired and integrated 9 companies since 2008 L argest owner of open deck equipment (2) and second largest provider (3) of open deck transportation and logistics solutions in North America Open deck fleet of ~3,000 tractors and ~6,000 trailers Offers services across the U.S., Canada, and Mexico ~3,000 non - union employees ~247 million miles driven in 2015 (4) 4 0 + terminals $100 million liability insurance coverage 7 ( 1) Of the largest 50 U.S. trucking companies in 2015, according to Journal of Commerce, April 2016. (2) CCJ Top 250, September 2016. (3) Measured by revenue, according to Transport Topics 2016 Top 100 For - Hire Carriers. (4) Reflects miles driven by company and owner - operator drivers and is pro forma for the acquisition of Bulldog Hiway Express and Hornady Transportation.

12 Scott Wheeler Executive Vice President and CFO Joined Daseke in 2012 Former CFO for OneSource Virtual, Inc. Former Managing Director of VCFO Former CFO of Malibu Entertainment Worldwide, a publicly - traded location - based entertainment company (AMEX) Don Daseke Chairman, President, and CEO Founded Daseke in 2008 Founder and Former Chairman and CEO of Walden Residential Properties, a publicly - traded (NYSE) Real Estate Investment Trust Certified Public Accountant for the Southwest Region Operating Division Presidents have an average of 28 years of experience at their companies 1 High Growth, Pr oven Track Record of Acquisition & Integration Experienced Board of Directors Name Daseke Role Executive Experience Years of Business Experience Don Daseke Chairman Chairman, President and CEO, Daseke Inc. 52 Ron Gafford Independent Director Former CEO, Austin Industries 40 Brian Bonner Independent Director Former CIO, Texas Instruments 35 Scott Wheeler Director EVP and CFO, Daseke Inc. 32 Mark Sinclair (1) Independent Director Partner, Whitley Penn, CPA, CMA 46 Daniel Hennessy (2) Vice Chairman Chairman and CEO, HCAC 35 Kevin Charlton (2) Independent Director President and COO, HCAC 21 ( 1) Joining the Board effective as of 1/1/2017. (2) Joining the Board at closing of the business combination.

13 $6 $89 2009 2016E High Growth, Pr oven Track Record of Acquisition & Integration (cont.) 1 Revenue Adjusted EBITDA (1) $30 $655 2009 2016E ($ in millions) ($ in millions) Acquired in 2013 Est. 1935 J.Grady Randolph Acquired in 2011 Est. 1938 E.W. Wylie Acquired in 2013 Est. 1992 Central Oregon Acquired in 2008 Est. 1979 Smokey Point Bulldog Acquired in 2015 Est. 1959 Lone Star Acquired in 2014 Est. 1988 Hornady Acquired in 2015 Est. 1928 Boyd Bros. & WTI Acquired in 2013 Est. 1956/1989 (1) See Appendix for a reconciliation of Adjusted EBITDA to net income (loss). (2) Daseke’s operations commenced January 1, 2009. (3) Represents midpoint of 2016E revenue and Adjusted EBITDA ranges of $650 - $660 million and $88 - $89 million, respectively. (2) (2) (3) (3)
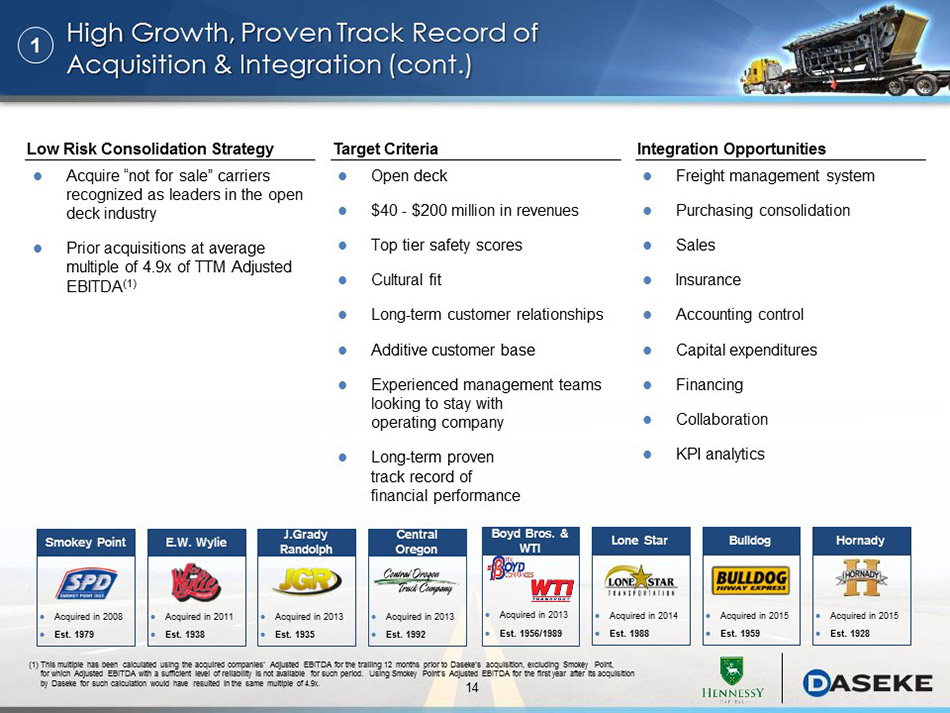
14 Acquire “not for sale” carriers recognized as leaders in the open deck industry Prior acquisitions at average multiple of 4.9x of TTM Adjusted EBITDA (1) Freight management s ystem Purchasing consolidation Sales Insurance Accounting control Capital expenditures Financing Collaboration KPI a nalytics Open deck $40 - $200 million in revenues Top tier safety scores Cultural fit Long - term customer relationships Additive customer base Experienced management teams looking to stay with operating company Long - term proven track record of financial performance 1 Low Risk Consolidation Strategy Target Criteria Integration Opportunities High Growth, Pr oven Track Record of Acquisition & Integration (cont.) Acquired in 2013 Est. 1935 J.Grady Randolph Acquired in 2011 Est. 1938 E.W. Wylie Acquired in 2013 Est. 1992 Central Oregon Acquired in 2008 Est. 1979 Smokey Point Bulldog Acquired in 2015 Est. 1959 Lone Star Acquired in 2014 Est. 1988 Hornady Acquired in 2015 Est. 1928 Boyd Bros. & WTI Acquired in 2013 Est. 1956/1989 (1) This multiple has been calculated using the acquired companies’ Adjusted EBITDA for the trailing 12 months prior to Daseke’s acqui sit ion, excluding Smokey Point, for which Adjusted EBITDA with a sufficient level of reliability is not available for such period. Using Smokey Point’s Adju ste d EBITDA for the first year after its acquisition by Daseke for such calculation would have resulted in the same multiple of 4.9x.

15 Highly Accretive A cquisition Pipeline 2 $100 million Adjusted EBITDA would double the size of Daseke within 3 years Total acquisition pipeline includes 24 companies under NDA ($ in millions) Actionable Acquisition Pipeline (1) New to Daseke Geography ● Midwest ● Northeast ● Canada / Northern U.S. End - Market ● Defense Unique Capabilities ● Industrial Warehousing ● Short Haul ● Lightweight Operations (1) Any acquisitions will be dependent on, among other things, due diligence results and Daseke may not complete any acquisitions in its pipeline. (2) Based on latest available financials for 12 - month period provided by potential acquisition targets. Target Revenue (2) Adjusted EBITDA (2) A $80 $11 B 60 5 C 38 2 D 75 18 E 95 13 F 75 7 G 80 20 H 50 7 I 90 17 Total $643 $100
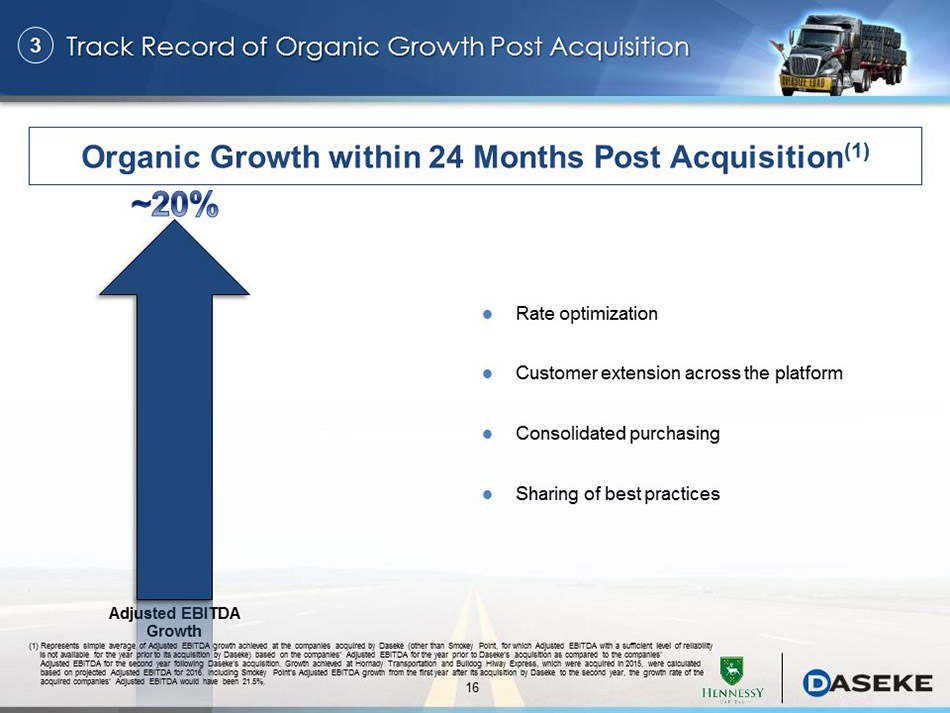
16 Track Record of Organic G rowth P ost A cquisition Organic Growth within 24 M onths P ost Acquisition (1) 3 Adjusted EBITDA Growth (1) Represents simple average of Adjusted EBITDA growth achieved at the companies acquired by Daseke (other than Smokey Point, for which Adj ust ed EBITDA with a sufficient level of reliability is not available for the year prior to its acquisition by Daseke) based on the companies’ Adjusted EBITDA for the year prior to Daseke’s acquisiti on as compared to the companies’ Adjusted EBITDA for the second year following Daseke’s acquisition. Growth achieved at Hornady Transportation and Bulldog Hiway Express, which were acquired in 2015, were calculated based on projected Adjusted EBITDA for 2016. I ncluding Smokey Point’s Adjusted EBITDA growth from the first year after its acquisition by Daseke to the second year, the growth rate of the acquired companies’ Adjusted EBITDA would have been 21.5 %. Rate optimization Customer extension across the platform Consolidated purchasing Sharing of best practices
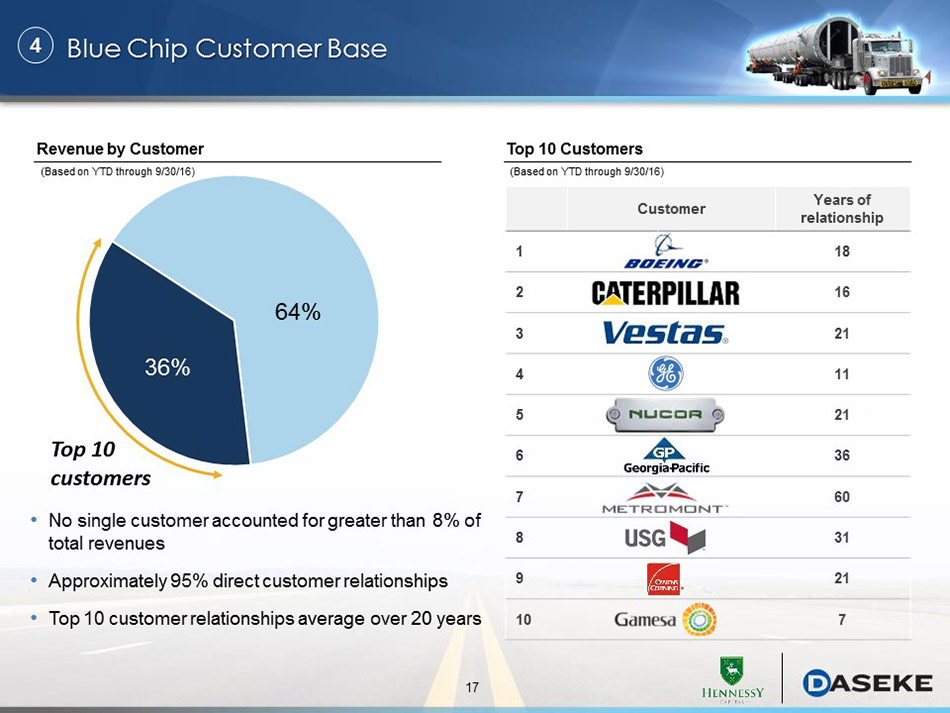
17 64% 36% Revenue by Customer Top 10 customers • No single customer accounted for greater than 8% of total revenues • Approximately 95 % direct customer relationships • Top 10 customer relationships average over 20 years Blue Chip Customer Base 4 Top 10 Customers Customer Years of relationship 1 18 2 16 3 21 4 11 5 21 6 36 7 60 8 31 9 21 10 7 (Based on YTD through 9/30/16) (Based on YTD through 9/30/16)
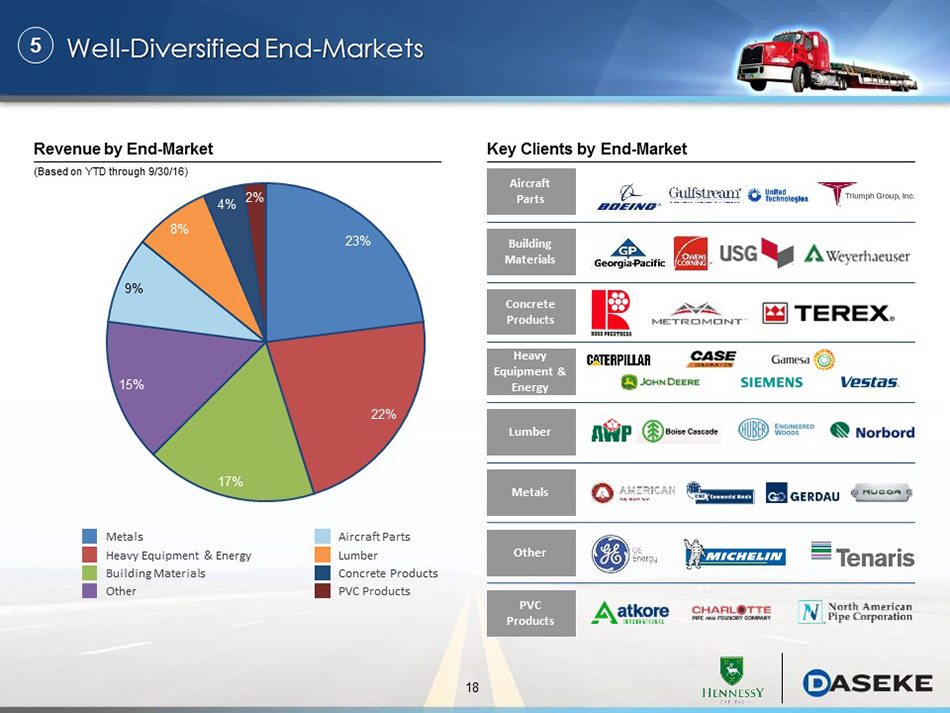
18 Metals Heavy Equipment & Energy Building Materials Aircraft Parts Lumber Concrete Products Lumber Metals Heavy Equipment & Energy Other 23% 22% 17% 15% 9% 8% 4% 2% Well - Diversified End - Markets 5 PVC Products Other PVC Products Key Clients by End - Market Concrete Products Building Materials Aircraft Parts Revenue by End - Market (Based on YTD through 9/30/16)
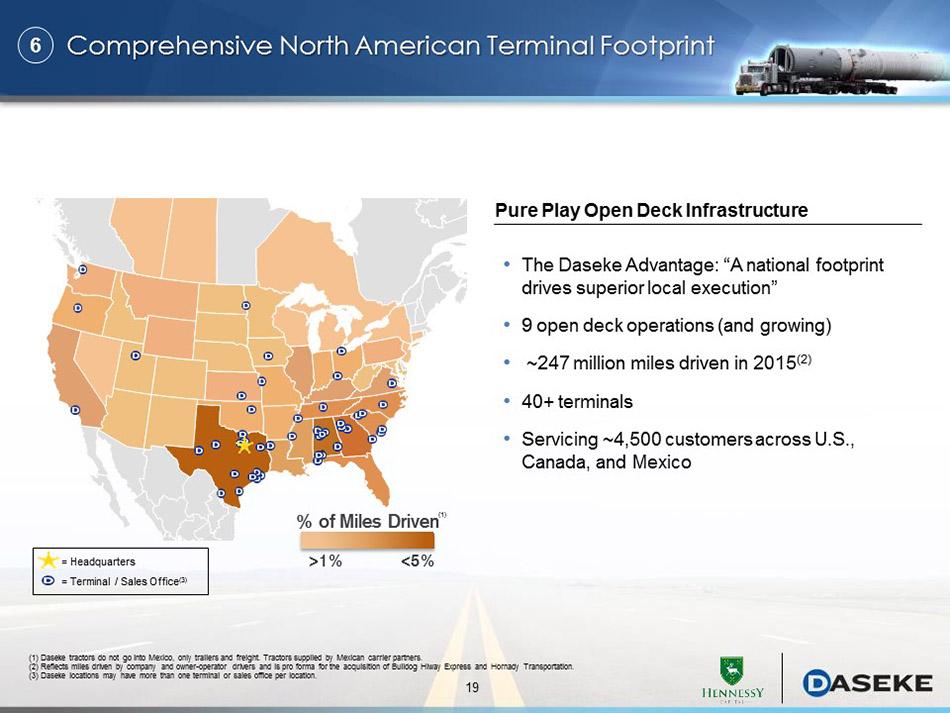
19 Comprehensive North American Terminal Footprint • The Daseke Advantage: “A national footprint drives superior local execution” • 9 open deck operations (and growing) • ~247 million miles driven in 2015 (2) • 4 0+ terminals • Servicing ~4,500 customers across U.S., Canada, and Mexico 6 Pure Play Open Deck Infrastructure >1% <5% % of Miles Driven (1) Daseke tractors do not go into Mexico, only trailers and freight. Tractors supplied by Mexican carrier partners. (2) Reflects miles driven by company and owner - operator drivers and is pro forma for the acquisition of Bulldog Hiway Express and Hornady Transportation. ( 3 ) Daseke locations may have more than one terminal or sales office per location. (1) = Headquarters = Terminal / Sales Office (3)

20 34% 66% “Asset Right” Operating Model Consistency in service levels Control over equipment quality and availability Higher margin business Asset – Light Advantages 7 Ability to expand capacity with minimal incremental investment Lowers fixed costs and increases returns on invested capital Increased flexibility in managing demand fluctuations Ability to extend services to non - core lanes and geographies Current Mix Asset – Based Advantages Asset – Based Asset – Light Maximizes scale, growth, flexibility, and profitability Advantages of Daseke’s “Asset Right” Model (Based on YTD freight and brokerage revenue through 9/30/16) Company Equipment Brokerage Owner Operator
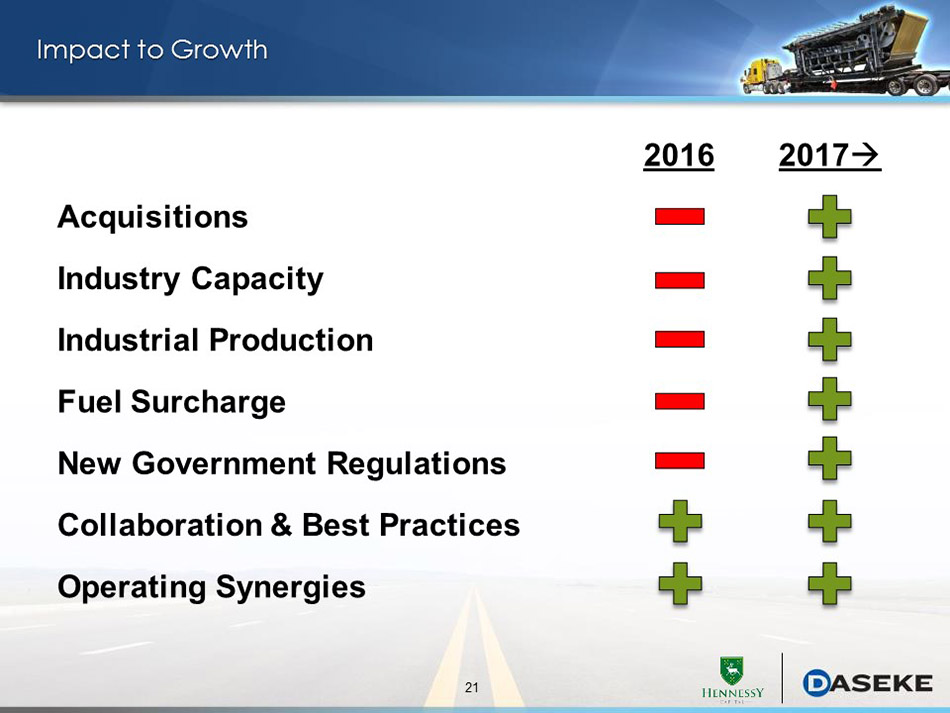
21 Impact to Growth 2016 2017 Acquisitions Industry Capacity Industrial Production Fuel Surcharge New Government Regulations Collaboration & Best Practices Operating Synergies
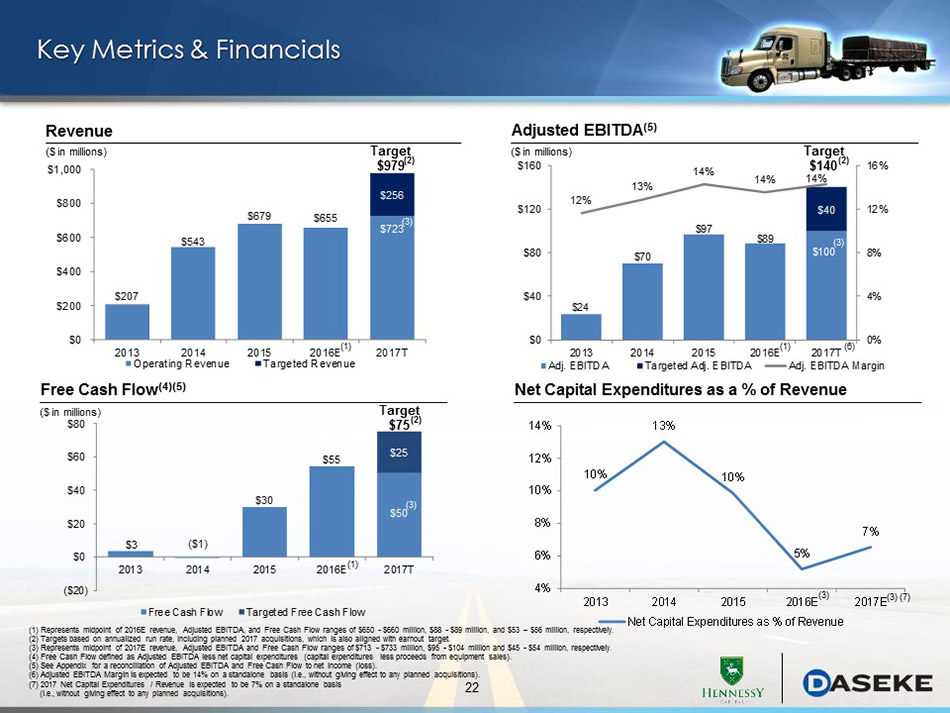
22 10% 13% 10% 5% 7% 4% 6% 8% 10% 12% 14% 2013 2014 2015 2016E 2017E Net Capital Expenditures as % of Revenue $3 ($1) $30 $55 $50 $25 ($20) $0 $20 $40 $60 $80 2013 2014 2015 2016E 2017T Free Cash Flow Targeted Free Cash Flow $24 $70 $97 $89 $100 $40 12% 13% 14% 14% 14% 0% 4% 8% 12% 16% $0 $40 $80 $120 $160 2013 2014 2015 2016E 2017T Adj. EBITDA Targeted Adj. EBITDA Adj. EBITDA Margin $207 $543 $679 $655 $723 $256 $0 $200 $400 $600 $800 $1,000 2013 2014 2015 2016E 2017T Operating Revenue Targeted Revenue Adjusted EBITDA (5) Free Cash Flow (4)(5) Net Capital Expenditures as a % of Revenue Revenue Key Metrics & Financials Target $979 Target $140 ($ in millions) ($ in millions) ($ in millions) Target $75 (2) (1) Represents midpoint of 2016E revenue, Adjusted EBITDA, and Free Cash Flow ranges of $650 - $660 million, $88 - $89 million, and $53 – $56 million, respectively. (2) Targets based on annualized run rate, including planned 2017 acquisitions, which is also aligned with earnout target. (3) Represents midpoint of 2017E revenue, Adjusted EBITDA and Free Cash Flow ranges of $713 - $733 million, $95 - $104 million a nd $45 - $54 million, respectively. (4) Free Cash Flow defined as Adjusted EBITDA less net capital expenditures (capital expenditures less proceeds from equipment sales). (5) See Appendix for a reconciliation of Adjusted EBITDA and Free Cash Flow to net income (loss ). (6) Adjusted EBITDA Margin is expected to be 14% on a standalone basis (i.e., without giving effect to any planned acquisitions). (7) 2017 Net Capital Expenditures / Revenue is expected to be 7% on a standalone basis ( i.e., without giving effect to any planned acquisitions ). (3) (7) (6) (1) (1) (1) (3) (2) (3) (2) (3) (3)

23 Alignment of Management & Investors Daseke management expected to own ~50% of the combined company (1) Daseke management is not selling stock as a part of the transaction Daseke’s management team has been incentivized with an earnout structure to further align interests with stockholders Don Daseke has agreed to a 3 year lockup (2) (1) Does not give effect to the payout of 15 million potential earnout shares and assumes no exercise of outstanding warrants and redemptions of ~67% of outstanding HCAC public shares. (2) Mr. Daseke intends to donate shares to certain educational institutions or charitable organizations and accordingly 10% of Mr . D aseke’s shares will not be subject to the three - year lock - up but will instead be subject to a trailing 180 - day lock - up in the event of such donation.

24 Earnout Structure Annualized Stock Adjusted EBITDA Stock Price Year Award Target Target 2017 Up to 5 million shares $140 million $12.00 2018 Up to 5 million shares $170 million $14.00 2019 Up to 5 million shares $200 million $16.00 Earnout Details Existing Daseke stockholders, including Daseke’s management team, will be eligible to receive up to 15 million shares of common stock based on the achievement of both (i) established Adjusted EBITDA targets and (ii) future share price targets Daseke and public stockholders will be fully aligned through a unique earnout structure focused on Adjusted EBITDA growth and share price performance (1) (1) Earnout begins at >90 % of target and increases pro rata up to the full 5 million shares at the target. For example, if $133 million annualized Adjusted EBITDA (giving effect to acquisitions during 2017) is achieved for fiscal year 2017, and the Stock Price Target is achieved during the year, 2.5 million shares would be issued in the earnout for 2017 . For purposes of the earnout , “ Annualized Adjusted EBITDA (giving effect to acquisitions)” is defined as consolidated net income (loss) of Daseke for the applicable year, plus consolidated net income of any business acquired by Daseke during such year for the period beginning on January 1 of such year and ending on the date of such acquisition, plus, in each c ase: ( i ) depreciation and amortization, ( ii) interest expense, including other fees and charges associated with indebtedness, net of interest income, (iii) income tax es, (iv) acquisition - related transaction expenses, (v) non - cash impairments , (vi) losses (gains) on sales of defective revenue equipment out of the normal replacement cycle, (vii) impairments related to defective revenue equipment sold out of the normal replacement cycle, (viii) expenses related to the merger and related transaction, (ix) non - cash stock and equity compensation ex pense, and (x ) costs paid or incurred in connection with being a public company. In addition, as a one - time only adjustment for purposes of calculating 2017 Adjusted EBITDA, up to $4.2 million of the 2017 equipment rental exp enses of one of the businesses acquired during 2017 will be added to net income (loss). (2) For any 20 trading days within any consecutive 30 trading day period during such fiscal year. (2)
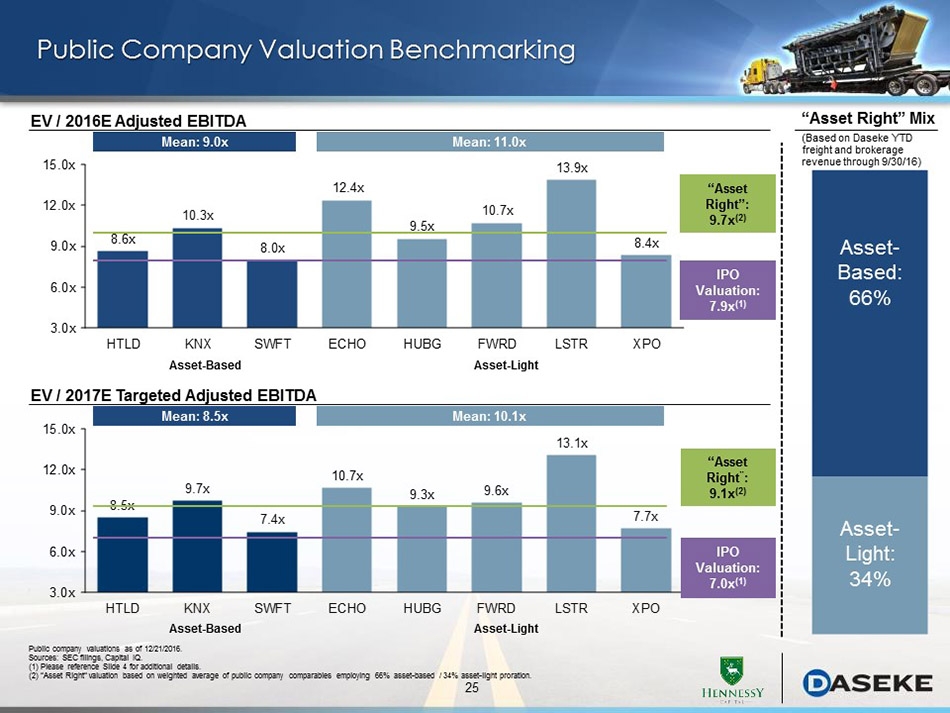
25 8.5x 9.7x 7.4x 10.7x 9.3x 9.6x 13.1x 7.7x 3.0x 6.0x 9.0x 12.0x 15.0x HTLD KNX SWFT ECHO HUBG FWRD LSTR XPO 8.6x 10.3x 8.0x 12.4x 9.5x 10.7x 13.9x 8.4x 3.0x 6.0x 9.0x 12.0x 15.0x HTLD KNX SWFT ECHO HUBG FWRD LSTR XPO Public Company Valuation Benchmarking Mean: 10.1x Asset - Light: 34% Asset - Based: 66% “Asset Right” Mix Asset - Based Asset - Light EV / 2016E Adjusted EBITDA Mean: 9.0x Mean: 11.0x “Asset Right”: 9.7x (2 ) IPO Valuation: 7.9x (1 ) EV / 2017E Targeted Adjusted EBITDA Mean: 8.5x “Asset Right ” : 9.1x (2 ) IPO Valuation: 7.0x (1 ) Asset - Based Asset - Light (Based on Daseke YTD freight and brokerage revenue through 9/30/16) Public company valuations as of 12/21/2016 . Sources : SEC filings, Capital IQ. (1) Please reference Slide 4 for additional details. (2) “Asset Right” valuation based on weighted average of public company comparables employing 66% asset - based / 34 % asset - light proration.

26 2009 2013 2014 2015 Net income (loss) $ (381) $ (2,976) $ 1,300 $ 3,263 Depreciation and amortization 4,132 18,666 48,575 63,573 Interest income - (101) (73) (69) Interest expense 2,751 6,402 15,978 20,602 Provision for income taxes (47) 99 1,784 7,463 Acquisition-related transaction expenses - 1,815 944 1,192 Impairment of intermodal equipment - - 1,838 - Withdrawn initial public offering-related expenses - - - 1,280 Adjusted EBITDA $ 6,455 $ 23,905 $ 70,346 $ 97,304 Net capital expenditures 20,725 70,678 66,969 Free Cash Flow $ 3,180 $ (332) $ 30,335 Year Ended December 31, Adjusted EBITDA & Free Cash Flow Reconciliation Appendix: Reconciliation of Net Income to Adjusted EBITDA and Free Cash Flow ($ in thousands)
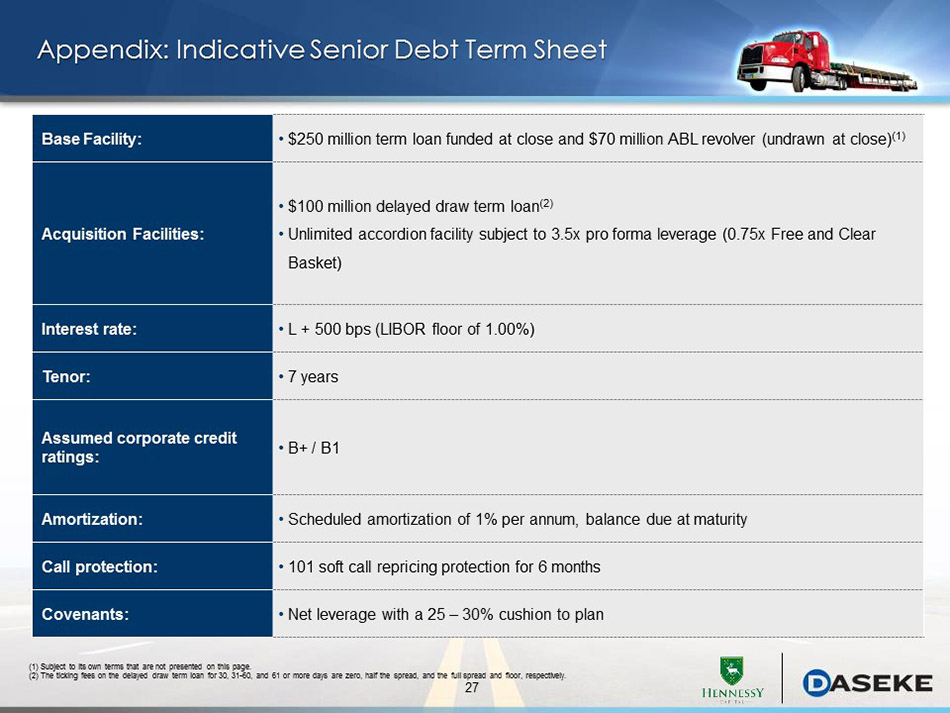
27 Appendix: Indicative Senior Debt Term Sheet Base Facility: • $250 million term loan funded at close and $70 million ABL revolver (undrawn at close) (1) Acquisition Facilities: • $100 million delayed draw term loan (2) • Unlimited accordion facility subject to 3.5x pro forma leverage (0.75x Free and Clear Basket) Interest rate: • L + 500 bps (LIBOR floor of 1.00%) Tenor: • 7 years Assumed corporate credit ratings: • B+ / B1 Amortization: • Scheduled amortization of 1% per annum, balance due at maturity Call protection: • 101 soft call repricing protection for 6 months Covenants: • Net leverage with a 25 – 30% cushion to plan (1) Subject to its own terms that are not presented on this page. (2) The ticking fees on the delayed draw term loan for 30, 31 - 60, and 61 or more days are zero, half the spread, and the full sp read and floor, respectively.