| FREE WRITING PROSPECTUS | ||
| FILED PURSUANT TO RULE 433 | ||
| REGISTRATION FILE NO.: 333-193376-19 | ||
June 3, 2015 | |||
FREE WRITING PROSPECTUS STRUCTURAL AND COLLATERAL TERM SHEET $1,321,890,997 (Approximate Total Mortgage Pool Balance) $1,221,096,000 (Approximate Offered Certificates) | |||
| COMM 2015-LC21 | |||
Deutsche Mortgage & Asset Receiving Corporation Depositor German American Capital Corporation Cantor Commercial Real Estate Lending, L.P. Ladder Capital Finance LLC KeyBank National Association Sponsors and Mortgage Loan Sellers | |||
| Deutsche Bank Securities | Cantor Fitzgerald & Co. | ||
| Joint Bookrunning Managers and Co-Lead Managers | |||
| KeyBanc Capital Markets | Goldman, Sachs & Co. | ||
| Co-Managers | |||
| The depositor has filed a registration statement (including the prospectus) with the Securities and Exchange Commission (File No. 333-193376) for the offering to which this communication relates. Before you invest, you should read the prospectus in the registration statement and other documents the depositor has filed with the Securities and Exchange Commission for more complete information about the depositor, the issuing entity and this offering. You may get these documents for free by visiting EDGAR on the SEC website at www.sec.gov. Alternatively, the depositor or Deutsche Bank Securities Inc., any other underwriter, or any dealer participating in this offering will arrange to send you the prospectus if you request it by calling toll-free 1-800-503-4611 or by email to the following address: prospectus.cpdg@db.com. The offered certificates referred to in these materials, and the asset pool backing them, are subject to modification or revision (including the possibility that one or more classes of certificates may be split, combined or eliminated at any time prior to issuance or availability of a final prospectus) and are offered on a “when, as and if issued” basis. You understand that, when you are considering the purchase of these certificates, a contract of sale will come into being no sooner than the date on which the relevant class has been priced and we have verified the allocation of certificates to be made to you; any “indications of interest” expressed by you, and any “soft circles” generated by us, will not create binding contractual obligations for you or us. | |||
COMM 2015-LC21 Mortgage Trust Capitalized terms used but not defined herein have the meanings assigned to them in the other Free Writing Prospectus expected to be dated June 4, 2015, relating to the offered certificates (hereinafter referred to as the “Free Writing Prospectus”). |
| KEY FEATURES OF SECURITIZATION |
| Offering Terms: | ||
| Joint Bookrunners & Co-Lead Managers: | Deutsche Bank Securities Inc. Cantor Fitzgerald & Co. | |
| Co-Managers: | KeyBanc Capital Markets Inc. and Goldman, Sachs & Co. | |
| Mortgage Loan Sellers: | German American Capital Corporation* (“GACC”) (39.0%), Cantor Commercial Real Estate Lending, L.P. (“CCRE”) (25.1%), Ladder Capital Finance LLC (“LCF”) (21.4%) and KeyBank National Association (“KeyBank”) (14.6%). *An indirect wholly owned subsidiary of Deutsche Bank AG. | |
| Master Servicer: | Midland Loan Services, a Division of PNC Bank, National Association | |
| Operating Advisor: | Park Bridge Lender Services LLC | |
| Special Servicer: | Midland Loan Services, a Division of PNC Bank, National Association | |
| Trustee: | Wilmington Trust, National Association | |
| Certificate Administrator: | Deutsche Bank Trust Company Americas | |
| Rating Agencies: | Moody’s Investors Service, Inc., DBRS, Inc. and Kroll Bond Rating Agency, Inc. | |
| Determination Date: | The 6th day of each month, or if such 6th day is not a business day, the following business day, commencing in July 2015. | |
| Distribution Date: | 4th business day following the Determination Date in each month, commencing in July 2015. | |
| Cut-off Date: | Payment Date in June 2015 (or related origination date, if later). Unless otherwise noted, all Mortgage Loan statistics are based on balances as of the Cut-off Date. | |
| Settlement Date: | On or about June 18, 2015 | |
| Settlement Terms: | DTC, Euroclear and Clearstream, same day funds, with accrued interest. | |
| ERISA Eligible: | All of the Offered Certificates are expected to be ERISA eligible. | |
| SMMEA Eligible: | None of the Offered Certificates will be SMMEA eligible. | |
| Day Count: | 30/360 | |
| Tax Treatment: | REMIC | |
| Rated Final Distribution Date: | July 2048 | |
| Minimum Denominations: | $10,000 (or $100,000 with respect to Class X-A) and in each case in multiples of $1 thereafter. | |
| Clean-up Call: | 1% | |
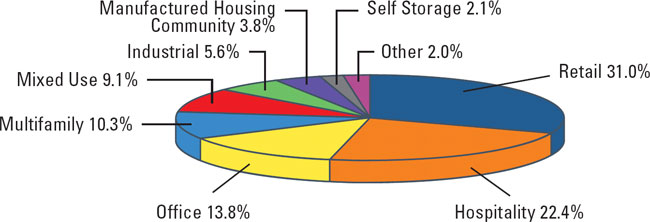
| Distribution of Collateral by Property Type |
THE INFORMATION IN THIS STRUCTURAL AND COLLATERAL TERM SHEET IS NOT COMPLETE AND MAY BE AMENDED PRIOR TO THE TIME OF SALE. THIS TERM SHEET IS NOT AN OFFER TO SELL THESE SECURITIES AND IT IS NOT A SOLICITATION OF AN OFFER TO BUY THESE SECURITIES IN ANY JURISDICTION WHERE THE OFFER OR SALE IS NOT PERMITTED.
| 3 |
COMM 2015-LC21 Mortgage Trust
TRANSACTION HIGHLIGHTS |
| Mortgage Loan Sellers | Number of Mortgage Loans | Number of Mortgaged Properties | Aggregate Cut-off Date Balance | % of Outstanding Pool Balance |
| German American Capital Corporation | 22 | 88 | $515,860,000 | 39.0% |
| Cantor Commercial Real Estate Lending, L.P. | 34 | 48 | $331,175,118 | 25.1% |
| Ladder Capital Finance LLC | 27 | 27 | $282,345,116 | 21.4% |
| KeyBank National Association | 20 | 35 | $192,510,764 | 14.6% |
| Total: | 103 | 198 | $1,321,890,997 | 100.0% |
| Pooled Collateral Facts: | ||
| Initial Outstanding Pool Balance: | $1,321,890,997 | |
| Number of Mortgage Loans: | 103 | |
| Number of Mortgaged Properties: | 198 | |
| Average Mortgage Loan Cut-off Date Balance: | $12,833,893 | |
| Average Mortgaged Property Cut-off Date Balance: | $6,676,217 | |
| Weighted Average Mortgage Rate: | 4.3323% | |
| Weighted Average Mortgage Loan Original Term to Maturity Date or ARD (months): | 112 | |
| Weighted Average Mortgage Loan Remaining Term to Maturity Date or ARD (months): | 111 | |
| Weighted Average Mortgage Loan Seasoning (months): | 1 | |
| % of Mortgaged Properties Leased to a Single Tenant: | 12.5% | |
Credit Statistics(1): | ||
| Weighted Average Mortgage Loan U/W NCF DSCR: | 2.01x | |
Weighted Average Mortgage Loan Cut-off Date LTV(2): | 65.5% | |
Weighted Average Mortgage Loan Maturity Date or ARD LTV(2): | 56.9% | |
| Weighted Average U/W NOI Debt Yield: | 11.5% | |
Amortization Overview: | ||
| % Mortgage Loans with Amortization through Maturity Date or ARD: | 40.4% | |
| % Mortgage Loans which pay Interest Only through Maturity Date or ARD: | 36.5% | |
| % Mortgage Loans which pay Interest Only followed by Amortization through Maturity Date or ARD: | 21.9% | |
Weighted Average Remaining Amortization Term (months)(3): | 354 | |
Loan Structural Features: | ||
| % Mortgage Loans with Upfront or Ongoing Tax Reserves: | 88.4% | |
% Mortgage Loans with Upfront or Ongoing Replacement Reserves(4): | 85.1% | |
| % Mortgage Loans with Upfront or Ongoing Insurance Reserves: | 53.5% | |
% Mortgage Loans with Upfront or Ongoing TI/LC Reserves(5): | 80.5% | |
| % Mortgage Loans with Upfront Engineering Reserves: | 50.1% | |
| % Mortgage Loans with Upfront or Ongoing Other Reserves: | 50.8% | |
| % Mortgage Loans with In Place Hard Lockboxes: | 55.8% | |
| % Mortgage Loans with Cash Traps Triggered at DSCR Levels ≥ 1.10x: | 83.6% | |
| % Mortgage Loans with Cash Traps Triggered only based on Loan Specific Debt Yield: | 7.3% | |
| % Mortgage Loans with Defeasance Only After a Lockout Period and Prior to an Open Period: | 89.4% | |
| % Mortgage Loans with Prepayment with a Yield Maintenance Charge Only After a Lockout Period and Prior to an Open Period: | 8.7% | |
| % Mortgage Loans Freely Prepayable Only After a Lockout Period: | 1.5% | |
| % Mortgage Loans with Prepayment with a Yield Maintenance Charge or Defeasance Only After a Lockout Period and Prior to an Open Period: | 0.2% | |
| % Mortgage Loans with Prepayment with a Yield Maintenance Charge Prior to an Open Period and also Defeasance Only After a Yield Maintenance Period and Prior to an Open Period: | 0.1% | |
| (1) | With respect to the Courtyard by Marriott Portfolio Loan, the La Gran Plaza Loan and the Renaissance New Orleans Portfolio Loan, LTV, DSCR and debt yield calculations include the related pari passu companion loan(s). With respect to the one group of three cross-collateralized and cross-defaulted loans, LTV, DSCR and debt yield calculations are calculated on an aggregate basis unless otherwise specifically indicated. |
| (2) | With respect to seven mortgage loans, representing 7.1% of the initial outstanding principal balance, the Cut-off Date LTV and Maturity Date or ARD LTV have in certain cases been calculated based on the “as complete”, “as renovated” or “hypothetical as is” value. For additional information, see the Footnotes to Annex A-1 in the Free Writing Prospectus. |
| (3) | Excludes loans which are interest only for the full loan term or through a related anticipated repayment date. |
| (4) | Includes FF&E Reserves. |
| (5) | Represents the percent of the allocated initial outstanding principal balance of retail, office, industrial and mixed use properties only. |
THE INFORMATION IN THIS STRUCTURAL AND COLLATERAL TERM SHEET IS NOT COMPLETE AND MAY BE AMENDED PRIOR TO THE TIME OF SALE. THIS TERM SHEET IS NOT AN OFFER TO SELL THESE SECURITIES AND IT IS NOT A SOLICITATION OF AN OFFER TO BUY THESE SECURITIES IN ANY JURISDICTION WHERE THE OFFER OR SALE IS NOT PERMITTED.
| 4 |
COMM 2015-LC21 Mortgage Trust
SUMMARY OF THE CERTIFICATES |
OFFERED CERTIFICATES
Class(1) | Ratings (Moody’s/DBRS/KBRA) | Initial Certificate Balance or Notional Amount(2) | Initial Subordination Levels | Weighted Average Life (years)(3) | Principal Window (months)(3) | Certificate Principal to Value Ratio(4) | Underwritten NOI Debt Yield(5) |
| Class A-1 | Aaa(sf)/AAA(sf)/AAA(sf) | $57,900,000 | 30.000%(6) | 2.65 | 1 - 55 | 45.8% | 16.4% |
| Class A-2 | Aaa(sf)/AAA(sf)/AAA(sf) | $181,050,000 | 30.000%(6) | 4.83 | 55 - 60 | 45.8% | 16.4% |
| Class A-SB | Aaa(sf)/AAA(sf)/AAA(sf) | $90,150,000 | 30.000%(6) | 7.38 | 60 - 115 | 45.8% | 16.4% |
| Class A-3 | Aaa(sf)/AAA(sf)/AAA(sf) | $225,000,000 | 30.000%(6) | 9.80 | 115 - 119 | 45.8% | 16.4% |
| Class A-4 | Aaa(sf)/AAA(sf)/AAA(sf) | $371,223,000 | 30.000%(6) | 9.89 | 119 - 119 | 45.8% | 16.4% |
Class X-A(7) | Aa1(sf)/AAA(sf)/AAA(sf) | $1,042,641,000(8) | N/A | N/A | N/A | N/A | N/A |
| Class A-M | Aa2(sf)/AAA(sf)/AAA(sf) | $117,318,000 | 21.125% | 9.97 | 119 - 120 | 51.7% | 14.6% |
| Class B | NR/AA(low)(sf)/AA-(sf) | $67,747,000 | 16.000% | 9.98 | 120 - 120 | 55.0% | 13.7% |
| Class C | NR/A(low)(sf)/A-(sf) | $51,223,000 | 12.125% | 9.98 | 120 - 120 | 57.6% | 13.1% |
| Class D | NR/BBB(low)(sf)/BBB-(sf) | $59,485,000 | 7.625% | 9.98 | 120 - 120 | 60.5% | 12.4% |
NON-OFFERED CERTIFICATES
Class(1) | Ratings (Moody’s/DBRS/KBRA) | Initial Certificate Balance or Notional Amount(2) | Initial Subordination Levels | Weighted Average Life (years)(3) | Principal Window (months)(3) | Certificate Principal to Value Ratio(4) | Underwritten NOI Debt Yield(5) |
Class X-B(7) | NR/AAA(sf)/AAA(sf) | $118,970,000(8) | N/A | N/A | N/A | N/A | N/A |
Class X-C(7) | NR/AAA(sf)/BBB-(sf) | $59,485,000(8) | N/A | N/A | N/A | N/A | N/A |
Class X-D(7) | NR/AAA(sf)/NR | $34,700,000(8) | N/A | N/A | N/A | N/A | N/A |
Class X-E(7) | NR/AAA(sf)/NR | $24,785,000(8) | N/A | N/A | N/A | N/A | N/A |
Class X-F(7) | NR/AAA(sf)/NR | $41,309,997(8) | N/A | N/A | N/A | N/A | N/A |
| Class E | NR/BB(low)(sf)/BB-(sf) | $34,700,000 | 5.000% | 9.98 | 120 - 120 | 62.2% | 12.1% |
| Class F | NR/B(low)(sf)/B-(sf) | $24,785,000 | 3.125% | 9.98 | 120 - 120 | 63.5% | 11.9% |
| Class G | NR/NR/NR | $41,309,997 | 0.000% | 10.49 | 120 - 127 | 65.5% | 11.5% |
| (1) | The pass-through rates applicable to the Class A-1, Class A-2, Class A-SB, Class A-3, Class A-4, Class A-M, Class B, Class C, Class D, Class E, Class F and Class G Certificates will equal one of: (i) a fixed per annum rate, (ii) the weighted average of the net mortgage rates on the mortgage loans (in each case, adjusted, if necessary, to accrue on the basis of a 360-day year consisting of twelve 30-day months) as of their respective due dates in the month preceding the month in which such distribution date occurs, (iii) a rate equal to the lesser of a specified pass-through rate and the weighted average of the net mortgage rates on the mortgage loans (in each case, adjusted, if necessary, to accrue on the basis of a 360-day year consisting of twelve 30-day months) as of their respective due dates in the month preceding the month in which such distribution date occurs, or (iv) the weighted average of the net mortgage rates on the mortgage loans) (in each case, adjusted, if necessary, to accrue on the basis of a 360-day year consisting of twelve 30-day months) as of their respective due dates in the month preceding the month in which such distribution date occurs, less a specified rate. |
| (2) | Approximate; subject to a permitted variance of plus or minus 5%. In addition, the notional amounts of the Class X-A, Class X-B, Class X-C, Class X-D, Class X-E and Class X-F Certificates may vary depending upon the final pricing of the classes of certificates and whose Certificate Balances comprise such notional amounts and, if as a result of such pricing the pass-through rate of the Class X-A, Class X-B, Class X-C, Class X-D, Class X-E or Class X-F Certificates, as applicable, would be equal to zero, such class of certificates will not be issued on the settlement date of this securitization. |
| (3) | The weighted average life and principal window during which distributions of principal would be received as set forth in the table with respect to each class of certificates with a Certificate Balance is based on (i) modeling assumptions described in the Free Writing Prospectus, (ii) assumptions that there are no prepayments, delinquencies or losses on the mortgage loans and (iii) assumptions that there are no extensions of maturity dates and mortgage loans with anticipated repayment dates are repaid on the respective anticipated repayment dates. |
| (4) | “Certificate Principal to Value Ratio” for any class with a Certificate Balance is calculated as the product of (a) the weighted average Mortgage Loan Cut-off Date LTV of the mortgage pool, multiplied by (b) a fraction, the numerator of which is the total initial Certificate Balance of the related class of Certificates and all other classes, if any, that are senior to such class, and the denominator of which is the total initial Certificate Balance of all Certificates. The Certificate Principal to Value Ratios of the Class A-1, Class A-2, Class A-SB, Class A-3 and Class A-4 Certificates are calculated in the aggregate for those classes as if they were a single class. |
| (5) | “Underwritten NOI Debt Yield” for any class with a Certificate Balance is calculated as the product of (a) the weighted average U/W NOI Debt Yield for the mortgage pool, multiplied by (b) a fraction, the numerator of which is the total initial Certificate Balance of all Certificates and the denominator of which is the total initial Certificate Balance of the related class of Certificates and all other classes, if any, that are senior to such class. The Underwritten NOI Debt Yields of the Class A-1, Class A-2, Class A-SB, Class A-3 and Class A-4 Certificates are calculated in the aggregate for those classes as if they were a single class. |
| (6) | The initial subordination levels for the Class A-1, Class A-2, Class A-SB, Class A-3 and Class A-4 Certificates are represented in the aggregate. |
| (7) | As further described in the Free Writing Prospectus, the pass-through rate applicable to the Class X-A, Class X-B, Class X-C, Class X-D, Class X-E and Class X-F Certificates for each Distribution Date will generally be equal to the excess of (i) the weighted average of the net mortgage rates on the mortgage loans (in each case, adjusted, if necessary to accrue on the basis of a 360 day year consisting of twelve 30-day months), over (ii)(A) with respect to the Class X-A Certificates, the weighted average of the pass-through rates of the Class A-1, Class A-2, Class A-SB, Class A-3, Class A-4 and Class A-M Certificates (based on their Certificate Balances), (B) with respect to the Class X-B Certificates, the weighted average of the pass-through rates of the Class B and Class C Certificates (based on their Certificate Balances), (C) with respect to the Class X-C Certificates, the pass-through rate of the Class D Certificates, (D) with respect to the Class X-D Certificates, the pass-through rate of the Class E Certificates, (E) with respect to the Class X-E Certificates, the pass-through rate of the Class F Certificates and (F) with respect to the Class X-F Certificates, the pass-through rate of the Class G Certificates. |
| (8) | The Class X-A, Class X-B, Class X-C, Class X-D, Class X-E and Class X-F Certificates (the “Class X Certificates”) will not have Certificate Balances. None of the Class X Certificates will be entitled to distributions of principal. The interest accrual amounts on the Class X-A Certificates will be calculated by reference to a notional amount equal to the sum of the total Certificate Balances of each of the Class A-1, Class A-2, Class A-SB, Class A-3, Class A-4 and Class A-M Certificates. The interest accrual amounts on the Class X-B Certificates will be calculated by reference to a notional amount equal to the sum of the total Certificate Balances of each of the Class B and Class C Certificates. The interest accrual amounts on the Class X-C Certificates will be calculated by reference to a notional amount equal to the Certificate Balance of the Class D Certificates. The interest accrual amounts on the Class X-D Certificates will be calculated by reference to a notional amount equal to the Certificate Balance of the Class E Certificates. The interest accrual amounts on the Class X-E Certificates will be calculated by reference to a notional amount equal to the Certificate |
THE INFORMATION IN THIS STRUCTURAL AND COLLATERAL TERM SHEET IS NOT COMPLETE AND MAY BE AMENDED PRIOR TO THE TIME OF SALE. THIS TERM SHEET IS NOT AN OFFER TO SELL THESE SECURITIES AND IT IS NOT A SOLICITATION OF AN OFFER TO BUY THESE SECURITIES IN ANY JURISDICTION WHERE THE OFFER OR SALE IS NOT PERMITTED.
| 5 |
COMM 2015-LC21 Mortgage Trust
SUMMARY OF THE CERTIFICATES |
Balance of the Class F Certificates. The interest accrual amounts on the Class X-F Certificates will be calculated by reference to a notional amount equal to the Certificate Balance of the Class G Certificates.
Short-Term Certificate Principal Paydown Summary(1) |
| Class | Mortgage Loan Seller | Mortgage Loan | Property Type | Cut-off Date Balance | Remaining Term to Maturity (Mos.) | Cut-off Date LTV Ratio | U/W NCF DSCR | U/W NOI Debt Yield | |
| A-1 | KeyBank | Renaissance New Orleans Portfolio(2) | Hospitality | $19,458,449 | 55 | 60.6% | 1.54x | 12.9% | |
| A-1/A-2 | GACC | Courtyard by Marriott Portfolio(2) | Hospitality | $97,050,000 | 58 | 28.2% | 7.40x | 32.7% | |
| A-2 | CCRE | 24 Hour Fitness West Covina | Retail | $10,738,548 | 59 | 64.1% | 1.58x | 10.4% | |
| A-2 | GACC | North Stadium Business Center | Industrial | $10,360,000 | 59 | 59.9% | 1.97x | 9.0% | |
| A-2 | LCF | Value Place | Hospitality | $4,738,703 | 59 | 64.3% | 1.56x | 13.8% | |
| A-2/A-SB | KeyBank | Parkdale Shopping Center | Retail | $12,170,000 | 60 | 73.8% | 1.30x | 9.2% | |
| A-2/A-SB | CCRE | Centre Creek Plaza & Wells Fargo Building | Office | $10,650,000 | 60 | 76.3% | 1.35x | 9.5% | |
| A-2/A-SB | CCRE | McDowell Business Park | Industrial | $7,100,000 | 60 | 67.6% | 1.40x | 9.6% | |
| A-2/A-SB | KeyBank | Parkcrest Apartments | Multifamily | $6,150,000 | 60 | 72.4% | 1.39x | 9.9% | |
| (1) | This table identifies loans with balloon payments due during the principal paydown window assuming 0% CPR and no losses or extensions for the indicated Certificates. See “Yield and Maturity Considerations—Yield Considerations” in the Free Writing Prospectus. |
| (2) | With respect to the Courtyard by Marriott Portfolio Loan and Renaissance New Orleans Portfolio Loan LTV, DSCR and debt yield calculations include the related pari passu companion loans. |
THE INFORMATION IN THIS STRUCTURAL AND COLLATERAL TERM SHEET IS NOT COMPLETE AND MAY BE AMENDED PRIOR TO THE TIME OF SALE. THIS TERM SHEET IS NOT AN OFFER TO SELL THESE SECURITIES AND IT IS NOT A SOLICITATION OF AN OFFER TO BUY THESE SECURITIES IN ANY JURISDICTION WHERE THE OFFER OR SALE IS NOT PERMITTED.
| 6 |
COMM 2015-LC21 Mortgage Trust |
| STRUCTURE OVERVIEW |
| Principal Payments: | Payments in respect of principal of the Certificates will be distributed, first, to the Class A-SB Certificates, until the Certificate Balance of such Class is reduced to the planned principal balance for the related Distribution Date set forth on Annex A-3 to the Free Writing Prospectus, then, to the Class A-1, Class A-2, Class A-3, Class A-4, Class A-SB, Class A-M, Class B, Class C, Class D, Class E, Class F and Class G Certificates, in that order, until the Certificate Balance of each such Class is reduced to zero. Notwithstanding the foregoing, if the total principal balance of the Class A-M, Class B, Class C, Class D, Class E, Class F and Class G Certificates have been reduced to zero as a result of loss allocation, payments in respect of principal of the Certificates will be distributed, first, to the Class A-1, Class A-2, Class A-SB, Class A-3 and Class A-4 Certificates, on a pro rata basis, based on the Certificate Balance of each such Class, then, to the extent of any recoveries on realized losses, to the Class A-M, Class B, Class C, Class D, Class E, Class F and Class G Certificates, in that order, in each case until the Certificate Balance of each such Class is reduced to zero (or previously allocated realized losses have been fully reimbursed). Each Class of Class X Certificates will not be entitled to receive distributions of principal; however, (i) the notional amount of the Class X-A Certificates will be reduced by the aggregate amount of principal distributions and realized losses allocated to the Class A-1, Class A-2, Class A-SB, Class A-3, Class A-4 and Class A-M Certificates; (ii) the notional amount of the Class X-B Certificates will be reduced by the aggregate amount of principal distributions and realized losses allocated to the Class B and Class C Certificates; (iii) the notional amount of the Class X-C Certificates will be reduced by the principal distributions and realized losses allocated to the Class D Certificates; (iv) the notional amount of the Class X-D Certificates will be reduced by the principal distributions and realized losses allocated to the Class E Certificates; (v) the notional amount of the Class X-E Certificates will be reduced by the principal distributions and realized losses allocated to the Class F Certificates; and (vi) the notional amount of the Class X-F Certificates will be reduced by the principal distributions and realized losses allocated to the Class G Certificates. | |
| Interest Payments: | On each Distribution Date, interest accrued for each Class of the Certificates at the applicable pass-through rate will be distributed in the following order of priority, to the extent of available funds: first, to the Class A-1, Class A-2, Class A-SB, Class A-3, Class A-4, Class X-A, Class X-B, Class X-C, Class X-D, Class X-E and Class X-F Certificates, on a pro rata basis, based on the accrued and unpaid interest on each such Class and then, to the Class A-M, Class B, Class C, Class D, Class E, Class F and Class G Certificates, in that order, in each case until the interest payable to each such Class is paid in full. The pass-through rates applicable to the Class A-1, Class A-2, Class A-SB, Class A-3, Class A-4, Class A-M, Class B, Class C, Class D, Class E, Class F and Class G Certificates for each Distribution Date will equal one of: (i) a fixed per annum rate, (ii) the weighted average of the net mortgage rates on the mortgage loans (in each case, adjusted, if necessary, to accrue on the basis of a 360-day year consisting of twelve 30-day months) as of their respective due dates in the month preceding the month in which such distribution date occurs, (iii) a rate equal to the lesser of a specified pass-through rate and the weighted average of the net mortgage rates on the mortgage loans (in each case, adjusted, if necessary, to accrue on the basis of a 360-day year consisting of twelve 30-day months) as of their respective due dates in the month preceding the month in which such distribution date occurs, or (iv) the weighted average of the net mortgage rates on the mortgage loans (in each case, adjusted, if necessary, to accrue on the basis of a 360-day year consisting of twelve 30-day months) as of their respective due dates in the month preceding the month in which such distribution date occurs, less a specified rate. As further described in the Free Writing Prospectus, the pass-through rate applicable to the Class X-A, Class X-B, Class X-C, Class X-D, Class X-E and Class X-F Certificates for each Distribution Date will generally be equal to the excess of (i) the weighted average of the net mortgage rates on the mortgage loans (in each case, adjusted, if necessary, to accrue on the basis of a 360-day year consisting of twelve 30-day months), over (ii) (A) with respect to the Class X-A Certificates, the weighted average of the pass-through rates of the Class A-1, Class A-2, Class A-SB, Class A-3, Class A-4 and Class A-M Certificates (based on their Certificate Balances), (B) with respect to the Class X-B Certificates, the weighted average of the pass-through rates of the Class B and Class C Certificates (based on their Certificate Balances), (C) with respect to the Class X-C Certificates, the pass-through rate of the Class D Certificates, (D) with respect to the Class X-D Certificates, the pass-through rate of the Class E Certificates, |
THE INFORMATION IN THIS STRUCTURAL AND COLLATERAL TERM SHEET IS NOT COMPLETE AND MAY BE AMENDED PRIOR TO THE TIME OF SALE. THIS TERM SHEET IS NOT AN OFFER TO SELL THESE SECURITIES AND IT IS NOT A SOLICITATION OF AN OFFER TO BUY THESE SECURITIES IN ANY JURISDICTION WHERE THE OFFER OR SALE IS NOT PERMITTED.
| 7 |
COMM 2015-LC21 Mortgage Trust |
| STRUCTURE OVERVIEW |
| (E) with respect to the Class X-E Certificates, the pass-through rate of the Class F Certificates and (F) with respect to the Class X-F Certificates, the pass-through rate of the Class G Certificates. | ||
| Prepayment Interest Shortfalls: | Prepayment interest shortfalls will be allocated pro rata based on interest entitlements, in reduction of the interest otherwise payable with respect to each of the interest-bearing certificate classes. | |
| Loss Allocation: | Losses will be allocated to each Class of Certificates entitled to principal in reverse alphabetical order starting with Class G through and including Class A-M and then to Class A-1, Class A-2, Class A-SB, Class A-3 and Class A-4 Certificates on a pro rata basis based on the Certificate Balance of each such class. The notional amount of any Class of Class X Certificates will be reduced by the aggregate amount of realized losses allocated to Certificates that are components of the notional amount of such Class of Class X Certificates. | |
| Prepayment Premiums: | A percentage of all prepayment premiums (either fixed prepayment premiums or yield maintenance amounts) collected on the Mortgage Loans will be allocated to each of the Class A-1, Class A-2, Class A-SB, Class A-3, Class A-4, Class A-M, Class B, Class C and Class D Certificates (the “YM P&I Certificates”) then entitled to principal distributions, which percentage will be equal to the product of (a) a fraction, not greater than one, the numerator of which is the amount of principal distributed to such Class on such Distribution Date and the denominator of which is the total amount of principal distributed to the holders of the Class A-1, Class A-2, Class A-SB, Class A-3, Class A-4, Class A-M, Class B, Class C and Class D Certificates on such Distribution Date, and (b) a fraction (expressed as a percentage which can be no greater than 100% nor less than 0%), the numerator of which is the excess of the pass-through rate of each such Class of Certificates currently receiving principal over the relevant Discount Rate, and the denominator of which is the excess of the Mortgage Rate of the related Mortgage Loan over the relevant Discount Rate. |
Prepayment Premium Allocation Percentage for all YM P&I Certificates = |
| (Pass-Through Rate - Discount Rate) | X | The percentage of the principal distribution amount to such Class or trust component as described in (a) above | |||
(Mortgage Rate - Discount Rate) |
| The remaining percentage of the prepayment premiums will be allocated to the Class X-A, Class X-B, Class X-C, Class X-D, Class X-E and Class X-F Certificates in the manner described in the Free Writing Prospectus. In general, this formula provides for an increase in the percentage of prepayment premiums allocated to the YM P&I Certificates then entitled to principal distributions relative to the Class X-A, Class X-B, Class X-C, Class X-D, Class X-E and Class X-F Certificates as Discount Rates decrease and a decrease in the percentage allocated to such Classes as Discount Rates rise. | ||
| Loan Combinations: | The portfolio of Mortgaged Properties identified on Annex A–1 to the Free Writing Prospectus as Courtyard by Marriott Portfolio secures a Mortgage Loan with an outstanding principal balance as of the Cut–off Date of $97,050,000, evidenced by Note A-2B (the “Courtyard by Marriott Portfolio Loan”), representing approximately 7.3% of the Initial Outstanding Pool Balance, and also secures (i) three promissory notes (collectively referred to as the “Courtyard by Marriott Portfolio Pari Passu Companion Loans”), which are generally pari passu in right of payment with the Courtyard by Marriott Portfolio Loan, consisting of: (a) one promissory note designated as Note A-1 with an outstanding principal balance as of the Cut-off Date of $33,500,000, which was included in the COMM 2015-CCRE23 Mortgage Trust as a non-pooled mortgage loan, (b) one promissory note designated as Note A-2A with an outstanding principal balance as of the Cut-off Date of $100,000,000, which was included in the COMM 2015-CCRE23 Mortgage Trust and (c) one promissory note designated as Note A-2C with an outstanding principal balance as of the Cut-off Date of $84,450,000, which was included in the GSMS 2015-GC30 Mortgage Trust as a pooled mortgage loan; and (ii) one promissory note designated as Note B (the “Courtyard by Marriott Portfolio Subordinate Companion Loan”) with an outstanding principal balance as of the Cut-off Date of $355,000,000 which is subordinate in right of payment in respect of each of the Courtyard by Marriott Portfolio Loan and the Courtyard by Marriott Portfolio Pari Passu Companion Loans and was included in the COMM 2015-CCRE23 Mortgage Trust as a non-pooled mortgage loan. The Courtyard by Marriott Portfolio Loan, the Courtyard by Marriott Portfolio Pari Passu Companion Loans and |
THE INFORMATION IN THIS STRUCTURAL AND COLLATERAL TERM SHEET IS NOT COMPLETE AND MAY BE AMENDED PRIOR TO THE TIME OF SALE. THIS TERM SHEET IS NOT AN OFFER TO SELL THESE SECURITIES AND IT IS NOT A SOLICITATION OF AN OFFER TO BUY THESE SECURITIES IN ANY JURISDICTION WHERE THE OFFER OR SALE IS NOT PERMITTED.
| 8 |
COMM 2015-LC21 Mortgage Trust |
| STRUCTURE OVERVIEW |
| the Courtyard by Marriott Portfolio Subordinate Companion Loan are collectively referred to herein as the “Courtyard by Marriott Portfolio Loan Combination”). The Courtyard by Marriott Portfolio Loan Combination is being serviced pursuant to the COMM 2015-CCRE23 pooling and servicing agreement and the related intercreditor agreement. For additional information regarding the Courtyard by Marriott Portfolio Loan Combination, see “Description of the Mortgage Pool—Loan Combinations—Courtyard by Marriott Portfolio Loan Combination” in the Free Writing Prospectus. The Mortgaged Property identified on Annex A–1 to the Free Writing Prospectus as La Gran Plaza secures a Mortgage Loan with an outstanding principal balance as of the Cut–off Date of $23,969,702, evidenced by Note A-2 (the “La Gran Plaza Loan”), representing approximately 1.8% of the outstanding principal balance, and also secures on a pari passu basis two companion loans that have an aggregate outstanding principal balance as of the Cut-off Date of $51,934,353, evidenced by Note A-1 (the “La Gran Plaza Note A-1 Companion Loan”), which is currently held by LCF, and which may be sold or further divided at any time (subject to compliance with the terms of the related co-lender agreement) and the Note A-3 (together with the La Gran Plaza Note A-1 Companion Loan, the “La Gran Plaza Pari Passu Companion Loans”), which was included in the COMM 2015-CCRE23 Mortgage Trust. The La Gran Plaza Loan and the La Gran Plaza Pari Passu Companion Loans are pari passu in right of payment and are collectively referred to herein as the “La Gran Plaza Loan Combination.” The La Gran Plaza Loan Combination is initially being serviced pursuant to the COMM 2015-CCRE23 pooling and servicing agreement and the related intercreditor agreement. On and after the securitization date of the La Gran Plaza Note A-1 Companion Loan (the “La Gran Plaza Note A-1 Securitization Date”), the servicing of the La Gran Plaza Loan Combination will transfer to the pooling and servicing agreement for that securitization. For additional information regarding the La Gran Plaza Loan Combination, see “Description of the Mortgage Pool—Loan Combinations—La Gran Plaza Loan Combination” in the Free Writing Prospectus. In addition, prior to the La Gran Plaza Note A-1 Securitization Date, CWCapital Asset Management LLC, if necessary, is expected to be the special servicer for the La Gran Plaza Loan Combination. On and after the La Gran Plaza Note A-1 Securitization Date, the special servicer under the pooling and servicing related to such securitization will be the special servicer. The portfolio of Mortgaged Properties identified on Annex A–1 to the Free Writing Prospectus as Renaissance New Orleans Portfolio secures a Mortgage Loan with an outstanding principal balance as of the Cut–off Date of $19,458,449, evidenced by Note A-2 (the “Renaissance New Orleans Portfolio Loan”), representing approximately 1.5% of the Initial Outstanding Pool Balance, and also secures on a pari passu basis one companion loan that has an outstanding principal balance as of the Cut-off Date of $23,782,549, evidenced by Note A-1 (the “Renaissance New Orleans Portfolio Pari Passu Companion Loan”), which was included in the JPMBB 2015-C28 Mortgage Trust. The Renaissance New Orleans Portfolio Loan and the Renaissance New Orleans Portfolio Pari Passu Companion Loan are pari passu in right of payment and are collectively referred to herein as the “Renaissance New Orleans Portfolio Loan Combination.” The Renaissance New Orleans Portfolio Loan Combination is being serviced pursuant to the JPMBB 2015-C28 pooling and servicing agreement and the related intercreditor agreement. For additional information regarding the Renaissance New Orleans Portfolio Loan Combination, see “Description of the Mortgage Pool—Loan Combinations—Renaissance New Orleans Portfolio Loan Combination” in the Free Writing Prospectus. |
THE INFORMATION IN THIS STRUCTURAL AND COLLATERAL TERM SHEET IS NOT COMPLETE AND MAY BE AMENDED PRIOR TO THE TIME OF SALE. THIS TERM SHEET IS NOT AN OFFER TO SELL THESE SECURITIES AND IT IS NOT A SOLICITATION OF AN OFFER TO BUY THESE SECURITIES IN ANY JURISDICTION WHERE THE OFFER OR SALE IS NOT PERMITTED.
| 9 |
COMM 2015-LC21 Mortgage Trust |
| STRUCTURE OVERVIEW |
| Control Rights and Directing Holder: | Certain Classes of Certificates (the “Control Eligible Certificates”) will have certain control rights over servicing matters with respect to each Mortgage Loan (other than the Courtyard by Marriott Portfolio Loan, the La Gran Plaza Loan and the Renaissance New Orleans Portfolio Loan and any Excluded Mortgage Loan). The majority owner or appointed representative of the Class of Control Eligible Certificates that is the Controlling Class (such owner or representative, the “Directing Holder”), will be entitled to direct the Special Servicer to take, or refrain from taking certain actions with respect to a Mortgage Loan (other than the Courtyard by Marriott Portfolio Loan, the La Gran Plaza Loan and the Renaissance New Orleans Portfolio Loan and any Excluded Mortgage Loan). Furthermore, the Directing Holder will also have the right to receive notice and consent to certain material actions that the Master Servicer and the Special Servicer proposes to take with respect to such Mortgage Loan (other than the Courtyard by Marriott Portfolio Loan, the La Gran Plaza Loan and the Renaissance New Orleans Portfolio Loan and any Excluded Mortgage Loan). It is expected that KKR Securities Holdings LLC or its affiliate will be the initial Directing Holder with respect to each Mortgage Loan (other than the Courtyard by Marriott Portfolio Loan, the La Gran Plaza Loan and the Renaissance New Orleans Portfolio Loan and any Excluded Mortgage Loan). An “Excluded Mortgage Loan” is a mortgage loan or loan combination with respect to which the Controlling Class Representative or any Controlling Class Certificateholder is a “Borrower Party”. A “Borrower Party” is a borrower, a manager of a mortgaged property or an affiliate, principal, partner, member, joint venturer, limited partner, employee, representative, director, advisor or investor in any of the foregoing or an agent of any of the foregoing. For a description of the directing holder for the Courtyard by Marriott Portfolio Loan Combination, the Gateway Business Center Phase II Loan Combination and the Renaissance New Orleans Portfolio Loan Combination see “Description of the Mortgage Pool—Loan Combinations” and “Description of the Pooling and Servicing Agreement—The Directing Holder” in the Free Writing Prospectus. Notwithstanding the foregoing, there will be no Directing Holder with respect to any Excluded Mortgage Loan. | |
| Control Eligible Certificates: | Class E, Class F and Class G Certificates. | |
| Controlling Class: | The Controlling Class will be the most subordinate Class of Control Eligible Certificates then outstanding that has an aggregate Certificate Balance, as notionally reduced by any Appraisal Reduction Amounts allocable to such Class, equal to no less than 25% of the initial Certificate Balance of such Class. The Controlling Class as of the Settlement Date will be the Class G Certificates. | |
| Appraised-Out Class: | Any Class of Control Eligible Certificates that has been determined, as a result of Appraisal Reductions Amounts allocable to such Class, to no longer be the Controlling Class. | |
Remedies Available to Holders of an Appraised-Out Class: | Holders of the majority of any Class of Control Eligible Certificates that is determined at any time of determination to no longer be the Controlling Class as a result of an allocation of an Appraisal Reduction Amounts in respect of such Class will have the right, at their sole expense, to require the Special Servicer to order a second appraisal for any Mortgage Loan (other than Non-Serviced Loans) for which an Appraisal Reduction Event has occurred. Upon receipt of the second appraisal, the Special Servicer will be required to determine, in accordance with the Servicing Standard, whether, based on its assessment of the second appraisal, a recalculation of the Appraisal Reduction Amount is warranted. If warranted, the Special Servicer will direct the Master Servicer to recalculate the Appraisal Reduction Amount based on the second appraisal, and if required by such recalculation, the Special Servicer will reinstate the Appraised-Out Class as the Controlling Class. The Holders of an Appraised-Out Class requesting a second appraisal will not be entitled to exercise any rights of the Controlling Class until such time, if any, as the Class is reinstated as the Controlling Class. | |
| Control Termination Event: | Will occur when no Class of Control Eligible Certificates has an aggregate Certificate Balance (as notionally or actually reduced by any Appraisal Reduction Amounts and Realized Losses) equal to or greater than 25% of the initial Certificate Balance of such Class. | |
| Upon the occurrence and the continuance of a Control Termination Event, the Directing Holder |
THE INFORMATION IN THIS STRUCTURAL AND COLLATERAL TERM SHEET IS NOT COMPLETE AND MAY BE AMENDED PRIOR TO THE TIME OF SALE. THIS TERM SHEET IS NOT AN OFFER TO SELL THESE SECURITIES AND IT IS NOT A SOLICITATION OF AN OFFER TO BUY THESE SECURITIES IN ANY JURISDICTION WHERE THE OFFER OR SALE IS NOT PERMITTED.
| 10 |
COMM 2015-LC21 Mortgage Trust |
| STRUCTURE OVERVIEW |
will no longer have any Control Rights. The Directing Holder will no longer have the right to direct certain actions of the Special Servicer and will no longer have consent rights with respect to certain material actions that the Master Servicer or Special Servicer proposes to take with respect to a Mortgage Loan. Upon the occurrence and continuation of a Control Termination Event, the Directing Holder will retain non-binding consultation rights with respect to certain material actions that the Special Servicer proposes to take with respect to a Mortgage Loan. Such consultation rights will continue until the occurrence of a Consultation Termination Event. Notwithstanding the foregoing, a Control Termination Event is deemed to exist with respect to any Excluded Mortgage Loan. | ||
| Consultation Termination Event: | Will occur when, without giving regard to the application of any Appraisal Reduction Amounts (i.e., giving effect to principal reduction through Realized Losses only), there is no Class of Control Eligible Certificates that has an aggregate Certificate Balance equal to 25% or more of the initial Certificate Balance of such Class. Upon the occurrence and continuance of a Consultation Termination Event the Directing Holder will have no rights under the pooling and servicing for this securitization (the “Pooling and Servicing Agreement”) other than those rights that all Certificateholders have. Notwithstanding the foregoing, a Consultation Termination Event is deemed to exist with respect to any Excluded Mortgage Loan. | |
Appointment and Replacement of Special Servicer: | The Directing Holder will appoint the initial Special Servicer as of the Settlement Date. Prior to the occurrence and continuance of a Control Termination Event, the Special Servicer (other than with respect to the Courtyard by Marriott Portfolio Loan Combination, the La Gran Plaza Loan Combination and the Renaissance New Orleans Portfolio Loan Combination and any Excluded Mortgage Loan) may generally be replaced at any time by the Directing Holder. Upon the occurrence and during the continuance of a Control Termination Event, the Directing Holder will no longer have the right to replace the Special Servicer and such replacement (other than with respect to the Courtyard by Marriott Portfolio Loan, the La Gran Plaza Loan and the Renaissance New Orleans Portfolio Loan) will occur based on a vote of holders of all voting eligible Classes of Certificates as described below. See “Description of the Mortgage Pool—Loan Combinations” and “Description of the Pooling and Servicing Agreement” in the Free Writing Prospectus for a description of the special servicer appointment and replacement rights with respect to the Courtyard by Marriott Portfolio Loan Combination, the La Gran Plaza Loan Combination and the Renaissance New Orleans Portfolio Loan Combination. With respect to any Excluded Mortgage Loan, the replacement of the Special Servicer will only occur based on a vote of holders of all voting eligible Classes of Certificates as described below. | |
Replacement of Special Servicer by Vote of Certificateholders: | Other than with respect to the Courtyard by Marriott Portfolio Loan, the La Gran Plaza Loan and the Renaissance New Orleans Portfolio Loan, if a Control Termination Event has occurred and is continuing, upon (i) the written direction of holders of Certificates evidencing not less than 25% of the voting rights of all Classes of Certificates entitled to principal (taking into account the application of Appraisal Reduction Amounts to notionally reduce the Certificate Balances of Classes to which such Appraisal Reduction Amounts are allocable) requesting a vote to replace the Special Servicer with a replacement Special Servicer, (ii) payment by such requesting holders to the Certificate Administrator of all reasonable fees and expenses to be incurred by the Certificate Administrator in connection with administering such vote and (iii) delivery by such holders to the Certificate Administrator of written confirmations from each Rating Agency that the appointment of the replacement Special Servicer will not result in a downgrade of the Certificates, the Certificate Administrator will be required to promptly provide written notice to all certificateholders of such request and conduct the solicitation of votes of all Certificates in such regard. Upon the written direction (within 180 days) of (i) Holders of at least 75% of a Certificateholder Quorum or (ii) the Holders of more than 50% of the voting rights of each Class of Non-Reduced Certificates, the Trustee will immediately replace the Special Servicer with the replacement Special Servicer (other than with respect to the Courtyard by Marriott Portfolio Loan, the La Gran Plaza Loan and the Renaissance New Orleans Portfolio Loan). |
THE INFORMATION IN THIS STRUCTURAL AND COLLATERAL TERM SHEET IS NOT COMPLETE AND MAY BE AMENDED PRIOR TO THE TIME OF SALE. THIS TERM SHEET IS NOT AN OFFER TO SELL THESE SECURITIES AND IT IS NOT A SOLICITATION OF AN OFFER TO BUY THESE SECURITIES IN ANY JURISDICTION WHERE THE OFFER OR SALE IS NOT PERMITTED.
| 11 |
COMM 2015-LC21 Mortgage Trust |
| STRUCTURE OVERVIEW |
| “Certificateholder Quorum” means, in connection with any solicitation of votes in connection with the replacement of the Special Servicer as described above, the holders of Certificates evidencing at least 75% of the aggregate voting rights (taking into account Realized Losses and the application of any Appraisal Reduction Amounts to notionally reduce the Certificate Balance of the Certificates) of all classes of Certificates entitled to principal, on an aggregate basis. | ||
| In addition, other than with respect to the Courtyard by Marriott Portfolio Loan, the La Gran Plaza Loan and the Renaissance New Orleans Portfolio Loan, after the occurrence of a Consultation Termination Event, if the Operating Advisor determines that the Special Servicer is not performing its duties in accordance with the Servicing Standard, the Operating Advisor will have the right to recommend the replacement of the Special Servicer (other than with respect to the Courtyard by Marriott Portfolio Loan, the La Gran Plaza Loan and the Renaissance New Orleans Portfolio Loan). The Operating Advisor’s recommendation to replace the Special Servicer (other than with respect to the Courtyard by Marriott Portfolio Loan, the La Gran Plaza Loan and the Renaissance New Orleans Portfolio Loan) must be confirmed by a majority of the voting rights of all Classes of Certificates entitled to principal (taking into account the application of Appraisal Reduction Amounts to notionally reduce the Certificate Balances of Classes to which such Appraisal Reduction Amounts are allocable) within 180 days from the time such recommendation is posted to the Certificate Administrator website and is subject to the receipt of written confirmations from each Rating Agency that the appointment of the replacement Special Servicer will not result in a downgrade of the Certificates. | ||
See“Description of the Mortgage Pool—Loan Combinations”and “Description of the Pooling and Servicing Agreement” in the Free Writing Prospectus for a description of the special servicer appointment and replacement rights with respect to the Courtyard by Marriott Portfolio Loan Combination, the La Gran Plaza Loan Combination and the Renaissance New Orleans Portfolio Loan Combination. | ||
Cap on Workout and Liquidation Fees: | The workout fees and liquidation fees payable to a Special Servicer under the Pooling and Servicing Agreement will be an amount equal to the lesser of: (1) 1.0% of each collection of interest and principal following a workout or liquidation and (2) $1,000,000 per workout or liquidation. All Modification Fees actually paid to the Special Servicer in connection with a workout or liquidation or in connection with any prior workout or partial liquidation that occurred within the prior 18 months will be deducted from the total workout and/or liquidation fees payable (other than Modification Fees earned while the Mortgage Loan was not in special servicing). In addition, the total amount of workout and liquidation fees actually payable by the Trust under the Pooling and Servicing Agreement will be capped in the aggregate at $1,000,000 for each related Mortgage Loan. If a new special servicer begins servicing the related Mortgage Loan, all amounts paid to the prior special servicer will be disregarded for purposes of calculating the cap. | |
| Special Servicer Compensation: | The special servicing fee will equal 0.25% per annum of the stated principal balance of the related specially serviced loan or REO property. The Special Servicer and its affiliates will be prohibited from receiving or retaining any compensation or any other remuneration under the Pooling and Servicing Agreement (including in the form of commissions, brokerage fees, rebates, or as a result of any other fee-sharing arrangement) from any person (including the issuing entity, any borrower, any manager, any guarantor or indemnitor in respect of a Mortgage Loan or Serviced Loan Combination, if any, and any purchaser of any Mortgage Loan, Serviced Companion Loan or REO Property) in connection with the disposition, workout or foreclosure of any Mortgage Loan or Serviced Loan Combination, the management or disposition of any REO Property, or the performance of any other special servicing duties under the Pooling and Servicing Agreement, other than as expressly permitted in the Pooling and Servicing Agreement and other than commercially reasonable treasury management fees, banking fees and insurance commissions or fees received or retained by the Special Servicer or any of its Affiliates in connection with any services performed by such party with respect to any mortgage loan. Subject to certain limited exceptions, the Special Servicer will also be required to report any compensation or other remuneration the Special Servicer or its affiliates have received from any person and such information will be disclosed in the Certificateholders’ monthly distribution date statement. |
THE INFORMATION IN THIS STRUCTURAL AND COLLATERAL TERM SHEET IS NOT COMPLETE AND MAY BE AMENDED PRIOR TO THE TIME OF SALE. THIS TERM SHEET IS NOT AN OFFER TO SELL THESE SECURITIES AND IT IS NOT A SOLICITATION OF AN OFFER TO BUY THESE SECURITIES IN ANY JURISDICTION WHERE THE OFFER OR SALE IS NOT PERMITTED.
| 12 |
COMM 2015-LC21 Mortgage Trust |
| STRUCTURE OVERVIEW |
Operating Advisor: | With respect to the Mortgage Loans (other than with respect to the Courtyard by Marriott Portfolio Loan Combination, the La Gran Plaza Loan Combination and the Renaissance New Orleans Portfolio Loan Combination) and prior to the occurrence of a Control Termination Event, the Operating Advisor will have access to any final asset status report and all information available with respect to the transaction on the Certificate Administrator’s website but will not have any approval or consultation rights. After the occurrence and during the continuance of a Control Termination Event, the Operating Advisor will have consultation rights with respect to certain major decisions and will have additional monitoring responsibilities on behalf of the entire trust. The Operating Advisor will be subject to termination if holders of at least 15% of the aggregate voting rights of the Certificates (in connection with termination and replacement relating to the Mortgage Loans) vote to terminate and replace the Operating Advisor and such vote is approved by holders of more than 50% of the applicable voting rights that exercise their right to vote, provided that holders of at least 50% of the applicable voting rights have exercised their right to vote. The holders initiating such vote will be responsible for the fees and expenses in connection with the vote and replacement. The Operating Advisor will not have consultation rights in respect of the Courtyard by Marriott Portfolio Loan Combination, the La Gran Plaza Loan Combination and the Renaissance New Orleans Portfolio Loan Combination. | |
| Liquidated Loan Waterfall: | On liquidation of any Mortgage Loan, all net liquidation proceeds will be applied so that amounts allocated as a recovery of accrued and unpaid interest will not, in the first instance, include any amount by which the interest portion of P&I Advances previously made was reduced as a result of Appraisal Reduction Amounts. After the adjusted interest amount is so allocated, any remaining net liquidation proceeds will be allocated to pay principal on the Mortgage Loan until the unpaid principal amount of the Mortgage Loan has been reduced to zero. Any remaining liquidation proceeds would then be allocated as a recovery of accrued and unpaid interest corresponding to the amount by which the interest portion of P&I Advances previously made was reduced as a result of Appraisal Reduction Amounts. |
THE INFORMATION IN THIS STRUCTURAL AND COLLATERAL TERM SHEET IS NOT COMPLETE AND MAY BE AMENDED PRIOR TO THE TIME OF SALE. THIS TERM SHEET IS NOT AN OFFER TO SELL THESE SECURITIES AND IT IS NOT A SOLICITATION OF AN OFFER TO BUY THESE SECURITIES IN ANY JURISDICTION WHERE THE OFFER OR SALE IS NOT PERMITTED.
| 13 |
COMM 2015-LC21 Mortgage Trust |
| OVERVIEW OF MORTGAGE POOL CHARACTERISTICS |
Distribution of Cut-off Date Balances(1) |
Weighted Averages | |||||||||||||||||||||
| Range of Cut-off Date Balances | Number of Mortgage Loans | Aggregate Cut-off Date Balance | % of Initial Outstanding Pool Balance | Mortgage Rate | Stated Remaining Term (Mos.)(2) | U/W NCF DSCR | Cut-off Date LTV Ratio(3) | Maturity Date or ARD LTV(3) | |||||||||||||
| $747,500 | - | $7,499,999 | 47 | $214,401,604 | 16.2% | 4.5292% | 115 | 1.51x | 69.2% | 57.2% | |||||||||||
| $7,500,000 | - | $14,999,999 | 25 | $265,091,996 | 20.1% | 4.3208% | 109 | 1.59x | 68.3% | 59.2% | |||||||||||
| $15,000,000 | - | $24,999,999 | 21 | $414,083,722 | 31.3% | 4.4412% | 116 | 1.57x | 68.6% | 58.6% | |||||||||||
| $25,000,000 | - | $49,999,999 | 8 | $257,513,675 | 19.5% | 4.1904% | 120 | 1.63x | 67.0% | 62.5% | |||||||||||
| $50,000,000 | - | $74,999,999 | 1 | $73,750,000 | 5.6% | 4.5300% | 120 | 1.70x | 70.9% | 57.4% | |||||||||||
| $75,000,000 | - | $97,050,000 | 1 | $97,050,000 | 7.3% | 3.6900% | 58 | 7.40x | 28.2% | 28.2% | |||||||||||
| Total/Weighted Average | 103 | $1,321,890,997 | 100.0% | 4.3323% | 111 | 2.01x | 65.5% | 56.9% | |||||||||||||
Distribution of Mortgage Rates(1) |
Weighted Averages | ||||||||||||||||||||||
| Range of Mortgage Rates | Number of Mortgage Loans | Aggregate Cut-off Date Balance | % of Initial Outstanding Pool Balance | Mortgage Rate | Stated Remaining Term (Mos.)(2) | U/W NCF DSCR | Cut-off Date LTV Ratio(3) | Maturity Date or ARD LTV(3) | ||||||||||||||
| 3.6900% | - | 3.9999% | 8 | $218,350,000 | 16.5% | 3.8137% | 92 | 4.15x | 52.4% | 47.1% | ||||||||||||
| 4.0000% | - | 4.4999% | 58 | $737,196,787 | 55.8% | 4.2785% | 118 | 1.60x | 68.0% | 59.8% | ||||||||||||
| 4.5000% | - | 4.7499% | 17 | $208,567,816 | 15.8% | 4.5793% | 118 | 1.57x | 69.7% | 57.7% | ||||||||||||
| 4.7500% | - | 5.4640% | 20 | $157,776,394 | 11.9% | 4.9747% | 99 | 1.55x | 66.2% | 56.3% | ||||||||||||
| Total/Weighted Average | 103 | $1,321,890,997 | 100.0% | 4.3323% | 111 | 2.01x | 65.5% | 56.9% | ||||||||||||||
Property Type Distribution(1)(4) |
| Weighted Averages | ||||||||||||||||||||||||
| Property Type | Number of Mortgaged Properties | Aggregate Cut-off Date Balance | % of Initial Outstanding Pool Balance | Number of Units/Rooms/Pads/ NRA/Beds | Cut-off Date Balance per Unit/Room/Pad/ NRA/Bed | Mortgage Rate | Stated Remaining Term (Mos.)(2) | Occupancy | U/W NCF DSCR | Cut-off Date LTV Ratio(3) | Maturity Date or ARD LTV(3) | |||||||||||||
| Retail | 65 | $409,635,830 | 31.0% | 2,674,484 | $484 | 4.4032% | 116 | 97.4% | 1.57x | 68.6% | 60.8% | |||||||||||||
Anchored(5) | 52 | $334,995,477 | 25.3% | 2,237,211 | $508 | 4.4131% | 115 | 97.7% | 1.58x | 68.1% | 61.0% | |||||||||||||
| Unanchored | 13 | $74,640,353 | 5.6% | 437,273 | $372 | 4.3588% | 119 | 95.9% | 1.55x | 70.7% | 60.1% | |||||||||||||
| Hospitality | 77 | $296,340,398 | 22.4% | 11,530 | $116,073 | 4.3641% | 94 | 79.9% | 3.58x | 54.4% | 46.5% | |||||||||||||
| Limited Service | 7 | $134,114,368 | 10.1% | 1,025 | $170,189 | 4.6977% | 120 | 84.9% | 1.72x | 67.4% | 54.8% | |||||||||||||
| Select Service | 65 | $97,050,000 | 7.3% | 9,590 | $42,408 | 3.6900% | 58 | 72.3% | 7.40x | 28.2% | 28.2% | |||||||||||||
| Full Service | 4 | $60,437,327 | 4.6% | 794 | $120,310 | 4.6778% | 99 | 80.5% | 1.73x | 67.1% | 56.7% | |||||||||||||
| Extended Stay | 1 | $4,738,703 | 0.4% | 121 | $39,163 | 4.7300% | 59 | 88.3% | 1.56x | 64.3% | 53.8% | |||||||||||||
| Office | 11 | $182,220,804 | 13.8% | 1,257,460 | $187 | 4.2536% | 116 | 93.1% | 1.65x | 65.6% | 59.3% | |||||||||||||
| Suburban | 7 | $77,650,000 | 5.9% | 583,019 | $144 | 4.1453% | 111 | 94.7% | 1.55x | 69.7% | 61.1% | |||||||||||||
| CBD | 3 | $69,870,804 | 5.3% | 388,054 | $268 | 4.4253% | 119 | 94.8% | 1.63x | 63.0% | 56.1% | |||||||||||||
| Suburban/Flex | 1 | $34,700,000 | 2.6% | 286,387 | $121 | 4.1500% | 119 | 86.3% | 1.91x | 61.5% | 61.5% | |||||||||||||
| Multifamily | 13 | $135,511,880 | 10.3% | 22,453 | $60,927 | 4.3125% | 116 | 95.1% | 1.42x | 72.3% | 63.9% | |||||||||||||
| Mixed Use | 8 | $119,655,853 | 9.1% | 1,496,601 | $22,000 | 4.2351% | 122 | 93.1% | 1.50x | 67.6% | 55.0% | |||||||||||||
| Office/Retail | 4 | $96,305,853 | 7.3% | 1,496,353 | $160 | 4.2338% | 123 | 91.7% | 1.52x | 67.3% | 54.8% | |||||||||||||
| Multifamily/Retail | 4 | $23,350,000 | 1.8% | 248 | $112,080 | 4.2402% | 119 | 98.8% | 1.42x | 68.4% | 55.6% | |||||||||||||
| Industrial | 7 | $74,321,004 | 5.6% | 1,982,231 | $60 | 4.4875% | 106 | 95.3% | 1.66x | 66.1% | 54.4% | |||||||||||||
| Manufactured Housing Community | 7 | $50,245,000 | 3.8% | 1,518 | $35,427 | 4.1640% | 119 | 84.0% | 1.60x | 73.6% | 64.1% | |||||||||||||
| Self Storage | 7 | $27,807,316 | 2.1% | 593,923 | $49 | 4.2468% | 119 | 84.5% | 1.45x | 72.3% | 59.8% | |||||||||||||
| Leased Fee | 3 | $26,152,913 | 2.0% | 423,428 | NAP | 3.9285% | 119 | NAP | 1.43x | 71.3% | 61.7% | |||||||||||||
| Total/Weighted Average | 198 | $1,321,890,997 | 100.0% | 4.3323% | 111 | 91.2% | 2.01x | 65.5% | 56.9% | |||||||||||||||
THE INFORMATION IN THIS STRUCTURAL AND COLLATERAL TERM SHEET IS NOT COMPLETE AND MAY BE AMENDED PRIOR TO THE TIME OF SALE. THIS TERM SHEET IS NOT AN OFFER TO SELL THESE SECURITIES AND IT IS NOT A SOLICITATION OF AN OFFER TO BUY THESE SECURITIES IN ANY JURISDICTION WHERE THE OFFER OR SALE IS NOT PERMITTED.
| 14 |
COMM 2015-LC21 Mortgage Trust |
| OVERVIEW OF MORTGAGE POOL CHARACTERISTICS |
Geographic Distribution(1)(4) |
Weighted Averages | ||||||||||||||||||||
| State/Location | Number of Mortgaged Properties | Aggregate Cut-off Date Balance | % of Initial Outstanding Pool Balance | Mortgage Rate | Stated Remaining Term (Mos.)(2) | U/W NCF DSCR | Cut-off Date LTV Ratio(3) | Maturity Date or ARD LTV(3) | ||||||||||||
| California | 23 | $290,372,363 | 22.0% | 4.2832% | 111 | 2.02x | 63.9% | 55.9% | ||||||||||||
Southern(6) | 18 | $267,682,907 | 20.2% | 4.3121% | 113 | 1.79x | 65.7% | 57.3% | ||||||||||||
Northern(6) | 5 | $22,689,455 | 1.7% | 3.9421% | 88 | 4.71x | 42.5% | 38.8% | ||||||||||||
| Texas | 28 | $180,999,348 | 13.7% | 4.3942% | 110 | 1.64x | 69.5% | 59.8% | ||||||||||||
| Illinois | 14 | $81,165,739 | 6.1% | 4.2269% | 112 | 2.21x | 63.4% | 59.1% | ||||||||||||
| New York | 6 | $80,293,379 | 6.1% | 4.3836% | 117 | 1.86x | 61.7% | 58.3% | ||||||||||||
| New York City | 2 | $58,300,000 | 4.4% | 4.4647% | 119 | 1.70x | 62.7% | 62.7% | ||||||||||||
| Remaining New York State | 4 | $21,993,379 | 1.7% | 4.1685% | 112 | 2.30x | 59.2% | 46.6% | ||||||||||||
| Pennsylvania | 6 | $70,650,000 | 5.3% | 4.2595% | 120 | 1.60x | 69.4% | 54.4% | ||||||||||||
| Other | 121 | $618,410,169 | 46.8% | 4.3527% | 110 | 2.16x | 65.3% | 56.4% | ||||||||||||
| Total/Weighted Average | 198 | $1,321,890,997 | 100.0% | 4.3323% | 111 | 2.01x | 65.5% | 56.9% | ||||||||||||
Distribution of Cut-off Date LTV Ratios(1)(3) |
Weighted Averages | ||||||||||||||||||||||
| Range of Cut-off Date LTV Ratios | Number of Mortgage Loans | Aggregate Cut-off Date Balance | % of Initial Outstanding Pool Balance | Mortgage Rate | Stated Remaining Term (Mos.)(2) | U/W NCF DSCR | Cut-off Date LTV Ratio | Maturity Date or ARD LTV | ||||||||||||||
| 28.2% | - | 54.9% | 8 | $174,593,932 | 13.2% | 3.9655% | 85 | 4.94x | 39.3% | 35.2% | ||||||||||||
| 55.0% | - | 59.9% | 6 | $37,053,801 | 2.8% | 4.4187% | 103 | 1.81x | 58.0% | 49.4% | ||||||||||||
| 60.0% | - | 64.9% | 11 | $188,727,985 | 14.3% | 4.4911% | 108 | 1.70x | 62.6% | 58.2% | ||||||||||||
| 65.0% | - | 69.9% | 30 | $306,246,196 | 23.2% | 4.4710% | 118 | 1.63x | 67.3% | 59.6% | ||||||||||||
| 70.0% | - | 74.9% | 32 | $448,244,083 | 33.9% | 4.3005% | 117 | 1.48x | 72.7% | 61.0% | ||||||||||||
| 75.0% | - | 76.3% | 16 | $167,025,000 | 12.6% | 4.3481% | 116 | 1.49x | 75.1% | 64.2% | ||||||||||||
| Total/Weighted Average | 103 | $1,321,890,997 | 100.0% | 4.3323% | 111 | 2.01x | 65.5% | 56.9% | ||||||||||||||
Distribution of Maturity Date or ARD LTV Ratios(1)(3) |
Weighted Averages | ||||||||||||||||||||||
Range of LTV Ratios at Maturity or ARD | Number of Mortgage Loans | Aggregate Cut-off Date Balance | % of Initial Outstanding Pool Balance | Mortgage Rate | Stated Remaining Term (Mos.)(2) | U/W NCF DSCR | Cut-off Date LTV Ratio | Maturity Date or ARD LTV | ||||||||||||||
| 7.6% | - | 49.9% | 10 | $155,687,733 | 11.8% | 3.9903% | 81 | 5.27x | 37.7% | 31.6% | ||||||||||||
| 50.0% | - | 54.9% | 16 | $187,862,132 | 14.2% | 4.4090% | 118 | 1.72x | 62.5% | 53.1% | ||||||||||||
| 55.0% | - | 59.9% | 32 | $342,485,978 | 25.9% | 4.4710% | 112 | 1.60x | 69.6% | 57.9% | ||||||||||||
| 60.0% | - | 64.9% | 30 | $426,658,979 | 32.3% | 4.3190% | 119 | 1.50x | 70.6% | 61.8% | ||||||||||||
| 65.0% | - | 69.9% | 13 | $186,376,175 | 14.1% | 4.2811% | 116 | 1.59x | 71.2% | 67.4% | ||||||||||||
| 70.0% | - | 74.1% | 2 | $22,820,000 | 1.7% | 4.6173% | 60 | 1.32x | 75.0% | 72.0% | ||||||||||||
| Total/Weighted Average | 103 | $1,321,890,997 | 100.0% | 4.3323% | 111 | 2.01x | 65.5% | 56.9% | ||||||||||||||
Distribution of Underwritten NCF Debt Service Coverage Ratios(1) |
Weighted Averages | ||||||||||||||||||||||
| Range of Underwritten NCF Debt Service Coverage Ratios | Number of Mortgage Loans | Aggregate Cut-off Date Balance | % of Initial Outstanding Pool Balance | Mortgage Rate | Stated Remaining Term (Mos.)(2) | U/W NCF DSCR | Cut-off Date LTV Ratio(3) | Maturity Date or ARD LTV(3) | ||||||||||||||
| 1.25x | - | 1.39x | 27 | $298,674,665 | 22.6% | 4.3397% | 113 | 1.33x | 72.6% | 62.2% | ||||||||||||
| 1.40x | - | 1.44x | 15 | $182,071,578 | 13.8% | 4.3090% | 119 | 1.42x | 71.9% | 60.2% | ||||||||||||
| 1.45x | - | 1.54x | 12 | $73,032,179 | 5.5% | 4.5555% | 102 | 1.49x | 67.4% | 56.5% | ||||||||||||
| 1.55x | - | 1.74x | 26 | $381,619,809 | 28.9% | 4.4968% | 117 | 1.65x | 67.6% | 58.7% | ||||||||||||
| 1.75x | - | 1.99x | 18 | $251,317,767 | 19.0% | 4.2915% | 116 | 1.84x | 63.9% | 57.0% | ||||||||||||
| 2.00x | - | 2.49x | 4 | $38,125,000 | 2.9% | 4.2144% | 119 | 2.15x | 59.0% | 55.2% | ||||||||||||
| 2.50x | - | 7.40x | 1 | $97,050,000 | 7.3% | 3.6900% | 58 | 7.40x | 28.2% | 28.2% | ||||||||||||
| Total/Weighted Average | 103 | $1,321,890,997 | 100.0% | 4.3323% | 111 | 2.01x | 65.5% | 56.9% | ||||||||||||||
THE INFORMATION IN THIS STRUCTURAL AND COLLATERAL TERM SHEET IS NOT COMPLETE AND MAY BE AMENDED PRIOR TO THE TIME OF SALE. THIS TERM SHEET IS NOT AN OFFER TO SELL THESE SECURITIES AND IT IS NOT A SOLICITATION OF AN OFFER TO BUY THESE SECURITIES IN ANY JURISDICTION WHERE THE OFFER OR SALE IS NOT PERMITTED.
| 15 |
COMM 2015-LC21 Mortgage Trust |
| OVERVIEW OF MORTGAGE POOL CHARACTERISTICS |
Original Terms to Maturity or ARD(1)(2) |
Weighted Averages | ||||||||||||||||||||
Original Terms to Maturity or ARD | Number of Mortgage Loans | Aggregate Cut-off Date Balance | % of Initial Outstanding Pool Balance | Mortgage Rate | Stated Remaining Term (Mos.) | U/W NCF DSCR | Cut-off Date LTV Ratio(3) | Maturity Date or ARD LTV(3) | ||||||||||||
| 60 | 9 | $178,415,701 | 13.5% | 4.1686% | 58 | 4.72x | 45.8% | 44.0% | ||||||||||||
| 120 | 93 | $1,101,175,297 | 83.3% | 4.3620% | 119 | 1.60x | 68.4% | 58.9% | ||||||||||||
| 129 | 1 | $42,300,000 | 3.2% | 4.2500% | 127 | 1.42x | 73.2% | 61.7% | ||||||||||||
| Total/Weighted Average | 103 | $1,321,890,997 | 100.0% | 4.3323% | 111 | 2.01x | 65.5% | 56.9% | ||||||||||||
Distribution of Remaining Terms to Maturity or ARD(1)(2) |
Weighted Averages | ||||||||||||||||||||||
Range of Remaining Terms to Maturity or ARD | Number of Mortgage Loans | Aggregate Cut-off Date Balance | % of Initial Outstanding Pool Balance | Mortgage Rate | Stated Remaining Term (Mos.) | U/W NCF DSCR | Cut-off Date LTV Ratio(3) | Maturity Date or ARD LTV(3) | ||||||||||||||
| 55 | - | 60 | 9 | $178,415,701 | 13.5% | 4.1686% | 58 | 4.72x | 45.8% | 44.0% | ||||||||||||
| 115 | - | 120 | 93 | $1,101,175,297 | 83.3% | 4.3620% | 119 | 1.60x | 68.4% | 58.9% | ||||||||||||
| 127 | - | 127 | 1 | $42,300,000 | 3.2% | 4.2500% | 127 | 1.42x | 73.2% | 61.7% | ||||||||||||
| Total/Weighted Average | 103 | $1,321,890,997 | 100.0% | 4.3323% | 111 | 2.01x | 65.5% | 56.9% | ||||||||||||||
Distribution of Underwritten NOI Debt Yields(1) |
Weighted Averages | ||||||||||||||||||||||
| Range of Underwritten NOI Debt Yields | Number of Mortgage Loans | Aggregate Cut-off Date Balance | % of Initial Outstanding Pool Balance | Mortgage Rate | Stated Remaining Term (Mos.)(2) | U/W NCF DSCR | Cut-off Date LTV Ratio(3) | Maturity Date or ARD LTV(3) | ||||||||||||||
| 7.3% | - | 7.9% | 9 | $205,163,675 | 15.5% | 4.3176% | 119 | 1.53x | 68.2% | 64.5% | ||||||||||||
| 8.0% | - | 8.9% | 25 | $283,402,408 | 21.4% | 4.2262% | 119 | 1.48x | 69.9% | 61.0% | ||||||||||||
| 9.0% | - | 9.9% | 20 | $238,992,564 | 18.1% | 4.3648% | 109 | 1.48x | 71.0% | 62.0% | ||||||||||||
| 10.0% | - | 12.4% | 35 | $383,098,645 | 29.0% | 4.4549% | 118 | 1.70x | 67.7% | 56.1% | ||||||||||||
| 12.5% | - | 14.9% | 12 | $99,183,705 | 7.5% | 4.6767% | 104 | 1.78x | 63.5% | 52.2% | ||||||||||||
| 15.0% | - | 32.7% | 2 | $112,050,000 | 8.5% | 3.8338% | 66 | 6.64x | 31.7% | 29.0% | ||||||||||||
| Total/Weighted Average | 103 | $1,321,890,997 | 100.0% | 4.3323% | 111 | 2.01x | 65.5% | 56.9% | ||||||||||||||
Amortization Types(1) |
Weighted Averages | ||||||||||||||||||||
| Amortization Type | Number of Mortgage Loans | Aggregate Cut-off Date Balance | % of Initial Outstanding Pool Balance | Mortgage Rate | Stated Remaining Term (Mos.)(2) | U/W NCF DSCR | Cut-off Date LTV Ratio(3) | Maturity Date or ARD LTV(3) | ||||||||||||
| Amortizing Balloon | 48 | $497,681,274 | 37.6% | 4.5060% | 116 | 1.58x | 68.4% | 55.0% | ||||||||||||
| Interest Only, then Amortizing | 39 | $461,170,000 | 34.9% | 4.2896% | 116 | 1.50x | 71.2% | 62.1% | ||||||||||||
| Interest Only | 10 | $289,310,000 | 21.9% | 4.1276% | 97 | 3.66x | 50.5% | 50.5% | ||||||||||||
| Interest Only, ARD | 3 | $35,491,175 | 2.7% | 4.2635% | 115 | 1.81x | 69.7% | 69.7% | ||||||||||||
| Interest Only, then Amortizing, ARD | 1 | $21,500,000 | 1.6% | 3.8100% | 119 | 1.38x | 72.6% | 60.9% | ||||||||||||
| Amortizing Balloon, ARD | 2 | $16,738,548 | 1.3% | 4.6983% | 81 | 1.57x | 61.3% | 50.3% | ||||||||||||
| Total/Weighted Average | 103 | $1,321,890,997 | 100.0% | 4.3323% | 111 | 2.01x | 65.5% | 56.9% | ||||||||||||
Footnotes:
| (1) | With respect to the Courtyard by Marriott Portfolio Loan, the La Gran Plaza Loan and the Renaissance New Orleans Portfolio Loan, LTV, DSCR, debt yield, and cut-off date balance per Unit/Room/Pad/NRA/Bed calculations include the related pari passu companion loan(s). With respect to one group of three cross-collateralized and cross-defaulted mortgage loans, LTV, DSCR and debt yield calculations for such group of mortgage loans have been calculated on an aggregate basis. |
| (2) | In the case of the six mortgage loans with anticipated repayment dates, Original Terms to Maturity or ARD and Remaining Terms to Maturity or ARD is through the related anticipated repayment date. |
| (3) | With respect to seven mortgage loans, representing approximately 7.1% of the initial outstanding principal balance, the Cut-off Date LTV Ratio and Maturity Date or ARD LTV have in certain cases been calculated based on the “as complete”, “as renovated” or “hypothetical as is” value. For additional information, see the Footnotes to Annex A-1 in the Free Writing Prospectus. |
| (4) | Reflects allocated loan amount for properties securing multi-property mortgage loans. |
| (5) | Anchored retail includes anchored, single tenant, shadow anchored and other properties. |
| (6) | Northern California properties have a zip code greater than 93600. Southern California properties have a zip code less than or equal to 93600. |
THE INFORMATION IN THIS STRUCTURAL AND COLLATERAL TERM SHEET IS NOT COMPLETE AND MAY BE AMENDED PRIOR TO THE TIME OF SALE. THIS TERM SHEET IS NOT AN OFFER TO SELL THESE SECURITIES AND IT IS NOT A SOLICITATION OF AN OFFER TO BUY THESE SECURITIES IN ANY JURISDICTION WHERE THE OFFER OR SALE IS NOT PERMITTED.
| 16 |
COMM 2015-LC21 Mortgage Trust |
| OVERVIEW OF MORTGAGE POOL CHARACTERISTICS |
Ten Largest Mortgage Loans |
Mortgage Loan | Mortgage Loan Seller | City, State | Property Type | Cut-off Date Balance | % of Initial Outstanding Pool Balance | Cut-off Date Balance per Room/NRA/Bed(1) | Cut-off Date LTV Ratio(1)(2) | U/W NCF DSCR(1) | U/W NOI Debt Yield(1) | ||||||||||
| Courtyard by Marriott Portfolio | GACC | Various, Various | Hospitality | $97,050,000 | 7.3% | $32,847 | 28.2% | 7.40x | 32.7% | ||||||||||
| Courtyard by Marriott Pasadena | GACC | Pasadena, CA | Hospitality | 73,750,000 | 5.6% | $234,873 | 70.9% | 1.70x | 11.4% | ||||||||||
| Meridian at Brentwood | GACC | Brentwood, MO | Mixed Use | 42,300,000 | 3.2% | $175 | 73.2% | 1.42x | 9.2% | ||||||||||
| 155 Mercer Street | CCRE | New York, NY | Retail | 41,000,000 | 3.1% | $2,810 | 63.1% | 1.57x | 7.3% | ||||||||||
| Capistrano Business Center I & II | GACC | San Juan Capistrano, CA | Office | 34,700,000 | 2.6% | $121 | 61.5% | 1.91x | 8.9% | ||||||||||
| Walgreens Net Lease Portfolio V | KeyBank | Various, Various | Retail | 33,963,675 | 2.6% | $287 | 69.9% | 1.81x | 7.8% | ||||||||||
| University Fountains at Lubbock | KeyBank | Lubbock, TX | Multifamily | 27,400,000 | 2.1% | $40,117 | 75.1% | 1.38x | 8.3% | ||||||||||
| Santa Monica Clock Tower | GACC | Santa Monica, CA | Office | 26,700,000 | 2.0% | $490 | 54.5% | 1.80x | 8.2% | ||||||||||
| Delaware Corporate Center I & II | LCF | Wilmington, DE | Office | 26,450,000 | 2.0% | $132 | 67.3% | 1.75x | 10.9% | ||||||||||
| Ortega Ranch | GACC | San Juan Capistrano, CA | Office | 25,000,000 | 1.9% | $174 | 70.4% | 1.42x | 8.6% | ||||||||||
| Total/Weighted Average | $428,313,675 | 32.4% | 58.9% | 2.95x | 14.5% | ||||||||||||||
| (1) | With respect to the Courtyard by Marriott Portfolio Loan, the numerical and statistical information related to the LTV, DSCR, debt yield and cut-off date balances per Room includes the Courtyard by Marriott Portfolio Pari Passu Companion Loans, but does not include the Courtyard by Marriott Portfolio Subordinate Companion Loan unless otherwise specified. |
| (2) | With respect to the University Fountains at Lubbock Loan, the Cut-off Date LTV Ratio has been calculated using the “as renovated” value. The “as renovated” appraised value takes into account capital expenditures at the property, for which $1.8 million was reserved at closing. The “as is” appraised value Cut-off Date LTV Ratio is 79.4%. |
| Pari Passu Companion Loan Summary |
| Mortgage Loan | Mortgage Loan Cut-off Date Balance | Companion Loans Cut-off Date Balance | Loan Combination Cut-off Date Balance | Pooling & Servicing Agreement | Master Servicer | Special Servicer | Voting Rights | ||||||||
| Courtyard by Marriott Portfolio | $97,050,000 | $572,950,000(1) | $670,000,000 | (1) | COMM 2015-CCRE23 | Midland Loan Services | CWCapital Asset Management, LLC | COMM 2015-CCRE23 | |||||||
| La Gran Plaza | $23,969,702 | $51,934,353 | $75,904,055 | See (2) below | See (2) below | See (2) below | See (2) below | ||||||||
| Renaissance New Orleans Portfolio | $19,458,449 | $23,782,549 | $43,240,998 | JPMBB 2015-C28 | Wells Fargo Bank, National Association | Torchlight Loan Services, LLC | JPMBB 2015-C28 | ||||||||
| (1) | The Courtyard by Marriott Portfolio Companion Loans Cut-off Date Balance and Loan Combination Cut-off Date Balance is comprised of the three pari passu companion loans and a B-Note in the amount of $355,000,000. |
| (2) | Prior to the securitization of the La Gran Plaza pari passu companion loan designated as Note A-1, the La Gran Plaza Loan Combination will be serviced under the COMM 2015-CCRE23 pooling and servicing agreement and the related intercreditor agreement, and the directing holder will be the holder of such Note A-1, which initially is expected to be LCF or an affiliate thereof. After the securitization of the La Gran Plaza pari passu companion loan designated as Note A-1, it is expected that the La Gran Plaza Loan Combination will be serviced under the pooling and servicing agreement entered into in connection with that securitization and the related intercreditor agreement, and it is expected that the directing holder of the La Gran Plaza Loan Combination will be the directing holder or its equivalent under that securitization. See “Description of the Mortgage Pool—Loan Combinations—The La Gran Plaza Loan Combination” in the Free Writing Prospectus. |
| Existing Mezzanine Debt Summary |
| Mortgage Loan | Mortgage Loan Cut-off Date Balance | Mezzanine Debt Cut-off Date Balance | Trust U/W NCF DSCR | Total Debt U/W NCF DSCR | Trust Cut-off Date LTV Ratio | Total Debt Cut-off Date LTV Ratio | Trust U/W NOI Debt Yield | Total Debt U/W NOI Debt Yield | ||||||||||||
Walgreens Net Lease Portfolio V(1) | $33,963,675 | $9,694,360 | 1.81x | 1.55x | 69.9% | 89.9% | 7.8% | 6.1% | ||||||||||||
| Komar Desert Center | $17,055,000 | $1,221,427 | 1.38x | 1.19x | 71.1% | 76.2% | 9.0% | 8.4% | ||||||||||||
| aLoft Hotel Minneapolis | $16,000,000 | $1,750,000 | 1.58x | 1.33x | 65.3% | 72.4% | 12.0% | 10.8% | ||||||||||||
| Hilton Garden Inn – Phoenix Airport North | $15,900,000 | $2,639,200 | 1.70x | 1.30x | 67.4% | 78.6% | 13.1% | 11.2% | ||||||||||||
| 24 Hour Fitness West Covina | $10,738,548 | $1,833,894 | 1.58x | 1.15x | 64.1% | 75.1% | 10.4% | 8.9% | ||||||||||||
| Golfsmith Richmond | $3,900,000 | $700,000 | 1.56x | 1.09x | 66.1% | 78.0% | 9.8% | 8.3% | ||||||||||||
| (1) | With respect to the Walgreens Net Lease Portfolio V Loan, the lender allocated $9,694,360 of mezzanine proceeds for illustration of combined debt metrics. See Collateral Asset Summary – Loan No. 6, herein. |
THE INFORMATION IN THIS STRUCTURAL AND COLLATERAL TERM SHEET IS NOT COMPLETE AND MAY BE AMENDED PRIOR TO THE TIME OF SALE. THIS TERM SHEET IS NOT AN OFFER TO SELL THESE SECURITIES AND IT IS NOT A SOLICITATION OF AN OFFER TO BUY THESE SECURITIES IN ANY JURISDICTION WHERE THE OFFER OR SALE IS NOT PERMITTED.
| 17 |
COMM 2015-LC21 Mortgage Trust |
| OVERVIEW OF MORTGAGE POOL CHARACTERISTICS |
Previous Securitization History(1) |
| Mortgage Loan | Mortgage Loan Seller | City, State | Property Type | Cut-off Date Balance | % of Initial Outstanding Pool Balance | Previous Securitization | |||||||
| Courtyard by Marriott Portfolio | GACC | Various, Various | Hospitality | $97,050,000 | 7.3% | Various(2) | |||||||
| Courtyard by Marriott Pasadena | GACC | Pasadena, CA | Hospitality | $73,750,000 | 5.6% | CGCMT 2007-C6 | |||||||
| Capistrano Business Center I & II | GACC | San Juan Capistrano, CA | Office | $34,700,000 | 2.6% | Various(3) | |||||||
| Santa Monica Clock Tower | GACC | Santa Monica, CA | Office | $26,700,000 | 2.0% | MSC 2006-HQ10 | |||||||
| 26-34 South State Street | GACC | Chicago, IL | Retail | $24,000,000 | 1.8% | MLCFC 2006-3 | |||||||
| Sierra Vista Shopping Center | CCRE | Albuquerque, NM | Retail | $22,125,000 | 1.7% | JPMCC 2005-CB11 | |||||||
| Giant Foods | GACC | Willow Grove, PA | Other | $21,500,000 | 1.6% | MSC 2007-IQ13 | |||||||
| The Shops at 505 | KeyBank | Lahaina, HI | Mixed Use | $18,825,890 | 1.4% | LMRET 2007-1A | |||||||
| Trop Plaza | CCRE | Las Vegas, NV | Retail | $16,850,000 | 1.3% | BACM 2005-2 | |||||||
| 36 South State Street | GACC | Chicago, IL | Retail | $16,800,000 | 1.3% | MLCFC 2006-3 | |||||||
| Shoppes of Beavercreek | CCRE | Beavercreek, OH | Retail | $14,980,417 | 1.1% | LBUBS 2002-C7 | |||||||
| Keller Oaks | LCF | Carrollton, TX | Multifamily | $14,300,000 | 1.1% | ARBOR 2013-1 | |||||||
| The Malulani Portfolio | CCRE | Various, Various | Various | $13,500,000 | 1.0% | DBUBS 2011-LC3A | |||||||
| Parkview Place Apartments | GACC | Georgetown, TX | Multifamily | $13,500,000 | 1.0% | FREMF 2011-K10 | |||||||
| Samsondale Plaza | LCF | West Haverstraw, NY | Mixed Use | $11,210,261 | 0.8% | MLMT 2005-MKB2 | |||||||
| Inn @ Northrup Station | CCRE | Portland, OR | Hospitality | $9,250,000 | 0.7% | LBUBS 2005-C5 | |||||||
| StaxUp Self Storage - San Ysidro | KeyBank | San Ysidro, CA | Self Storage | $9,174,960 | 0.7% | JPMCC 2005-LDP3 | |||||||
| Avenue Mentry Industrial | GACC | Valencia, CA | Industrial | $8,600,000 | 0.7% | CSFB 2005-C4 | |||||||
| Cole Village | LCF | Boise, ID | Retail | $7,350,000 | 0.6% | JPMCC 2005-LDP3 | |||||||
| Corbin Office Center | CCRE | Tarzana, CA | Office | $7,250,000 | 0.5% | MLMT 2005-MCP1 | |||||||
| West Union Village | LCF | Portland, OR | Retail | $6,500,000 | 0.5% | GCCFC 2005-GG5 | |||||||
| Nyberg Retail Center | CCRE | Tualatin, OR | Retail | $5,900,000 | 0.4% | MSC 2005-HQ7 | |||||||
| Dollar General Texas Portfolio I | CCRE | Various, TX | Retail | $5,000,000 | 0.4% | Various(4) | |||||||
| Summit Retail | LCF | Shelby Township, MI | Retail | $3,996,199 | 0.3% | FDIC 2011-C1 | |||||||
| Spencer Springs Shopping Center | CCRE | Las Vegas, NV | Retail | $3,750,000 | 0.3% | MSC 2005-HQ6 | |||||||
| Bear Creek Office | CCRE | Houston, TX | Office | $3,200,000 | 0.2% | MSC 2007-XLFA | |||||||
| Kress Building | LCF | Columbia, SC | Mixed Use | $2,850,000 | 0.2% | FNA 2013-M11 | |||||||
| Storage Etc. San Bernadino | LCF | San Bernardino, CA | Self Storage | $2,500,000 | 0.2% | LBUBS 2005-C3 | |||||||
| Total | $495,112,728 | 37.5% | |||||||||||
| (1) | Includes mortgaged properties securing mortgage loans for which the most recent prior financing of all or a significant portion of such property was included in a securitization. The table above is based on information provided by the related borrower or obtained through searches of a third-party database. The information has not otherwise been confirmed by the depositor, the mortgage loan sellers or any other underwriter. |
| (2) | The most recent financing of the Courtyard by Marriott Portfolio Loan was previously securitized in the LBUBS 2005-C3, LBUBS 2005-C5, LBUBS 2005-C7 and LBUBS 2006-C1 transactions. |
| (3) | With respect to the Capistrano Business Center I & II Loan, the most recent financing of Center I was previously securitized in the BACM 2005-4 transaction and the most recent financing of Center II was included in the BACM 2005-2 transaction. |
| (4) | With respect to the Dollar General Texas Portfolio I Loan, the most recent financing of six of the properties was previously securitized in the MSCI 2005-HQ6 securitized in and three of the properties were previously securitized in BSCMS 2005-TOP20 transaction. |
THE INFORMATION IN THIS STRUCTURAL AND COLLATERAL TERM SHEET IS NOT COMPLETE AND MAY BE AMENDED PRIOR TO THE TIME OF SALE. THIS TERM SHEET IS NOT AN OFFER TO SELL THESE SECURITIES AND IT IS NOT A SOLICITATION OF AN OFFER TO BUY THESE SECURITIES IN ANY JURISDICTION WHERE THE OFFER OR SALE IS NOT PERMITTED.
| 18 |
(THIS PAGE INTENTIONALLY LEFT BLANK)
| 19 |
| Various | Collateral Asset Summary – Loan No. 1 Courtyard by Marriott Portfolio | Cut-off Date Balance: Cut-off Date LTV: U/W NCF DSCR: U/W NOI Debt Yield: | $97,050,000 28.2% 7.40x 32.7% |

THE INFORMATION IN THIS STRUCTURAL AND COLLATERAL TERM SHEET IS NOT COMPLETE AND MAY BE AMENDED PRIOR TO THE TIME OF SALE. THIS TERM SHEET IS NOT AN OFFER TO SELL THESE SECURITIES AND IT IS NOT A SOLICITATION OF AN OFFER TO BUY THESE SECURITIES IN ANY JURISDICTION WHERE THE OFFER OR SALE IS NOT PERMITTED.
| 20 |
| Various | Collateral Asset Summary – Loan No. 1 Courtyard by Marriott Portfolio | Cut-off Date Balance: Cut-off Date LTV: U/W NCF DSCR: U/W NOI Debt Yield: | $97,050,000 28.2% 7.40x 32.7% |
| Mortgage Loan Information | |
| Loan Seller: | GACC |
Credit Assessment (Moody’s/DBRS/Morningstar): | Aa2/AAA/AA+ |
| Loan Purpose: | Refinance |
| Sponsor: | CBM Joint Venture Limited Partnership |
| Borrower: | CBM Two Hotels LP; C2 Land, L.P. |
Original Balance(1): | $97,050,000 |
Cut-off Date Balance(1): | $97,050,000 |
| % by Initial UPB: | 7.3% |
| Interest Rate: | 3.6900% |
| Payment Date: | 6th of each month |
| First Payment Date: | May 6, 2015 |
| Maturity Date: | April 6, 2020 |
| Amortization: | Interest Only |
Additional Debt(1): | $217,950,000 Pari Passu Debt; $355,000,000 Subordinate Secured Debt |
| Call Protection: | L(26), D(29), O(5) |
| Lockbox / Cash Management: | Soft Springing Hard / In Place |
Reserves(2) | ||
| Initial | Monthly | |
| Taxes: | $0 | $985,000 |
| Insurance: | $0 | Springing |
| Required Repairs: | $409,063 | NAP |
FF&E(3): | $0 | Springing |
| Ground Rent: | $0 | Springing |
Financial Information(4) | ||
| Senior Tranche | Total Debt | |
| Cut-off Date Balance / Room: | $32,847 | $69,864 |
| Balloon Balance / Room: | $32,847 | $69,864 |
Cut-off Date LTV(5): | 28.2% | 60.0% |
Balloon LTV(5): | 28.2% | 60.0% |
| Underwritten NOI DSCR: | 8.73x | 4.10x |
| Underwritten NCF DSCR: | 7.40x | 3.48x |
| Underwritten NOI Debt Yield: | 32.7% | 15.4% |
| Underwritten NCF Debt Yield: | 27.7% | 13.0% |
| Underwritten NOI Debt Yield at Balloon: | 32.7% | 15.4% |
| Underwritten NCF Debt Yield at Balloon: | 27.7% | 13.0% |
| Property Information | ||
| Single Asset / Portfolio: | Portfolio of 65 properties | |
| Property Type: | Select Service Hospitality | |
Collateral(6): | Fee Simple / Leasehold | |
| Location: | Various | |
| Year Built / Renovated: | Various | |
| Total Rooms: | 9,590 | |
| Property Management: | Courtyard Management Corporation | |
| Underwritten NOI: | $102,858,635 | |
| Underwritten NCF: | $87,204,717 | |
Appraised Value(5): | $1,116,000,000 | |
| Appraisal Date: | March 1, 2015 | |
| Historical NOI | ||
| Most Recent NOI: | $103,803,403 (T-12 February 28, 2015) | |
| 2014 NOI: | $101,146,386 (December 31, 2014) | |
| 2013 NOI: | $84,699,708 (December 31, 2013) | |
| 2012 NOI: | $76,100,616 (December 31, 2012) | |
| Historical Occupancy | ||
| Most Recent Occupancy: | 70.0% (February 28, 2015) | |
| 2014 Occupancy: | 69.5% (December 31, 2014) | |
| 2013 Occupancy: | 66.0% (December 31, 2013) | |
| 2012 Occupancy: | 65.8% (December 31, 2012) | |
| (1) | The Original Balance and Cut-off Date Balance of $97.05 million represent the Note A-2B of a $670.0 million whole loan evidenced by four pari passu notes with an aggregate original principal balance of $315.0 million and one subordinate note with an original principal balance of $355.0 million. For additional information regarding the pari passu companion loans and subordinate note see “The Loan” and “Current Mezzanine or Subordinate Indebtedness” herein. |
| (2) | See “Initial Reserves” and “Ongoing Reserves” herein. |
| (3) | Borrower will deposit on each monthly payment date an amount equal to the greater of (i) 5% of rents (or in the case of the Courtyard Managed Properties, 5% of the gross revenues) and (ii) the amount required by the manager or any franchisor into an FF&E reserve. With respect to any Courtyard Managed Property (as defined herein), so long as the manager is depositing an amount no less than the monthly amount borrower is otherwise required to deposit into a separate FF&E reserve account owned by borrower, pledged to the lender and directly accessible by the manager, borrower’s obligation to make monthly deposits into the FF&E reserve will be suspended. |
| (4) | DSCR, LTV, Debt Yield, and Balance / Room calculations are based on the aggregate $315.0 million Courtyard by Marriott Portfolio Senior Tranche. |
| (5) | The Appraised Value of $1.116 billion reflects a premium attributed to the aggregate value of the Courtyard by Marriott Portfolio as a whole. The sum of the value of each of the properties on an individual basis is $1.041 billion, which represents a Cut-off Date LTV of 30.3% and 64.4% for the Senior Tranche and Total Debt, respectively. |
| (6) | The Courtyard by Marriott Portfolio is secured by the fee simple interest in nine hotels, leasehold interest in seven hotels under third-party ground leases and the fee and leasehold interest in 49 hotels. For additional information regarding ownership interest, see “The Properties” herein. |
Historical Occupancy, ADR, RevPAR(1) | |||||||||
| Year | Courtyard by Marriott Portfolio | Competitive Set | Penetration Factor | ||||||
Occupancy(2) | ADR(2) | RevPAR(2) | Occupancy | ADR | RevPAR | Occupancy | ADR | RevPAR | |
| 2012 | 65.6% | $102.76 | $68.16 | 64.2% | $92.95 | $60.12 | 103.7% | 111.2% | 116.0% |
| 2013 | 66.2% | $107.49 | $71.92 | 65.1% | $94.83 | $62.33 | 103.2% | 114.2% | 118.6% |
| 2014 | 69.5% | $113.91 | $80.01 | 67.7% | $98.95 | $67.64 | 103.6% | 116.0% | 120.7% |
| T-12 Feb 2015 | 70.0% | $115.14 | $81.40 | 68.1% | $99.90 | $68.65 | 103.7% | 116.1% | 120.9% |
| (1) | Source: Hospitality Research Report. |
| (2) | The minor variances between the underwriting, the hospitality research report and the above table with respect to Occupancy, ADR and RevPAR at the Courtyard by Marriott Portfolio are attributable to variances in reporting methodologies and/or timing differences. |
THE INFORMATION IN THIS STRUCTURAL AND COLLATERAL TERM SHEET IS NOT COMPLETE AND MAY BE AMENDED PRIOR TO THE TIME OF SALE. THIS TERM SHEET IS NOT AN OFFER TO SELL THESE SECURITIES AND IT IS NOT A SOLICITATION OF AN OFFER TO BUY THESE SECURITIES IN ANY JURISDICTION WHERE THE OFFER OR SALE IS NOT PERMITTED.
| 21 |
| Various | Collateral Asset Summary – Loan No. 1 Courtyard by Marriott Portfolio | Cut-off Date Balance: Cut-off Date LTV: U/W NCF DSCR: U/W NOI Debt Yield: | $97,050,000 28.2% 7.40x 32.7% |
The Loan. The Courtyard by Marriott Portfolio loan (the “Courtyard by Marriott Portfolio Loan”) is a fixed rate loan secured by the borrowers’ fee simple and leasehold interests in a portfolio of 65 Courtyard by Marriott hotel properties located across 29 states, totaling 9,590 rooms (the “Courtyard by Marriott Portfolio” or the “Courtyard by Marriott Portfolio Properties”). The Courtyard by Marriott Portfolio Loan has an original principal balance of $670.0 million, consisting of a senior tranche in the amount of $315.0 million (the “Courtyard by Marriott Portfolio Senior Tranche”) and a junior tranche in the amount of $355.0 million (the “Courtyard by Marriott Portfolio Junior Tranche”). The Courtyard by Marriott Portfolio Senior Tranche is evidenced by four pari passu notes. Only the non-controlling Note A-2B with an original principal balance of $97.05 million will be included in the COMM 2015-LC21 trust. The non-controlling Note A-2A, with an original principal balance of $100.0 million, was included in the COMM 2015-CCRE23 trust. The non-controlling Note A-1, with an original principal balance of $33.5 million, was included in the COMM 2015-CCRE23 trust as a non-pooled component. The remaining Note A-2C, with an original balance of $84.45 million was included in the GSMS 2015-GC30 trust. The Courtyard by Marriott Portfolio Junior Tranche is evidenced by the controlling Note B with an original principle balance of $355.0 million which was included in the COMM 2015-CCRE23 trust as a non-pooled component.
The relationship between the holders of the Note A-1, Note A-2A, Note A-2B, Note A-2C and Note B will be governed by a co-lender agreement as described under “Description of the Mortgage Pool – Loan Combinations – Courtyard by Marriott Portfolio” in the accompanying Free Writing Prospectus.
| Loan Combination Summary | ||||||||
| Original Balance | Cut-off Date Balance | Note Holder | Controlling Piece | |||||
Note A-1(1) | $33,500,000 | $33,500,000 | COMM 2015-CCRE23 | No | ||||
| Note A-2A | $100,000,000 | $100,000,000 | COMM 2015-CCRE23 | No | ||||
| Note A-2B | $97,050,000 | $97,050,000 | COMM 2015-LC21 | No | ||||
| Note A-2C | $84,450,000 | $84,450,000 | GSMS 2015-GC30 | No | ||||
| Total – Senior Tranche | $315,000,000 | $315,000,000 | ||||||
Note B – Junior Tranche(1) | $355,000,000 | $355,000,000 | COMM 2015-CCRE23 | Yes | ||||
| Total Debt | $670,000,000 | $670,000,000 | ||||||
| (1) | Note A-1 and Note B were included in the COMM 2015-CCRE23 Mortgage Trust as non-pooled components. |
The Courtyard by Marriott Portfolio Loan has a five-year interest only term and accrues interest at 3.6900%. Loan proceeds were used to retire existing debt of approximately $566.8 million, fund reserves of approximately $0.9 million, pay closing costs of approximately $9.0 million and return approximately $93.2 million of equity to the borrowers. Based on the portfolio appraised value of $1.116 billion the cut-off date LTV is 28.2%. The most recent prior financing of the Courtyard by Marriott Portfolio Properties were included in the LBUBS 2005-C3, LBUBS 2005-C5, LBUBS 2005-C7 and LBUBS 2006-C1 securitizations.
| Sources and Uses | |||||||
| Sources | Proceeds | % of Total | Uses | Proceeds | % of Total | ||
| Mortgage Loan Amount | $315,000,000 | 47.0% | Loan Payoff | $566,832,998 | 84.6% | ||
| B Note Loan Amount | $355,000,000 | 53.0% | Reserves | $913,163 | 0.1% | ||
| Closing Costs | $9,023,807 | 1.3% | |||||
| Return of Equity | $93,230,032 | 13.9% | |||||
| Total Sources | $670,000,000 | 100.0% | Total Uses | $670,000,000 | 100.0% | ||
The Borrower / Sponsor. The borrowers, CBM Two Hotels LP and C2 Land, L.P., are each a single purpose Delaware limited partnership, structured to be bankruptcy remote, each with two independent directors in its organizational structure. The sponsor of the borrowers and non-recourse carve out guarantor is CBM Joint Venture Limited Partnership.
CBM Joint Venture Limited Partnership is a joint venture between Clarion Partners, LLC and the State of Michigan Retirement Systems. Clarion Partners, LLC, established in 1982, is a U.S. based real estate investment firm. Clarion Partners, LLC is based in New York, New York with additional offices across North America, Europe and South America. Clarion Partners, LLC invests in properties throughout the United States, United Kingdom, Middle East, Euro zone and Mexico. The State of Michigan Retirement Systems is a domestic pension fund that administers retirement programs for Michigan’s state employees, public school employees, judges, state police and National Guard members.
The Properties. The Courtyard by Marriott Portfolio Loan is secured by the fee simple interest in nine hotels (the “Fee Simple Properties”), leasehold interest in seven hotels under third-party ground leases (the “Third Party Ground Lease Properties”) and the fee and leasehold interest in 49 hotels (the “Affiliated Ground Lease Properties”). CBM Two Hotels LP owns the leasehold interest in the Affiliated Ground Lease Properties and C2 Land, L.P. owns the fee interest. Both the fee and leasehold interest in the 49 Affiliated Ground Lease Properties serve as collateral for the loan. As such, for disclosure purposes, the Affiliated Ground Lease Properties are considered fee owned. All 65 hotels are operated under the Courtyard by Marriott brand. Courtyard by Marriott is one of the first hotel brands to focus on the upscale select service category, catering primarily to business travelers.
THE INFORMATION IN THIS STRUCTURAL AND COLLATERAL TERM SHEET IS NOT COMPLETE AND MAY BE AMENDED PRIOR TO THE TIME OF SALE. THIS TERM SHEET IS NOT AN OFFER TO SELL THESE SECURITIES AND IT IS NOT A SOLICITATION OF AN OFFER TO BUY THESE SECURITIES IN ANY JURISDICTION WHERE THE OFFER OR SALE IS NOT PERMITTED.
| 22 |
| Various | Collateral Asset Summary – Loan No. 1 Courtyard by Marriott Portfolio | Cut-off Date Balance: Cut-off Date LTV: U/W NCF DSCR: U/W NOI Debt Yield: | $97,050,000 28.2% 7.40x 32.7% |
| Portfolio Summary | |||||||||||||||||
| Property Name | City | State | Rooms | Year Built | Ownership Interest(1) | “As-is” Value(2) | Allocated Loan Amt.(3) | ||||||||||
| Courtyard Larkspur Landing Marin County | Larkspur | CA | 146 | 1987 | Affiliated Ground Lease | $41,000,000 | $28,200,000 | ||||||||||
| Courtyard San Mateo Foster City | Foster City | CA | 147 | 1987 | Affiliated Ground Lease | $40,500,000 | $28,200,000 | ||||||||||
| Courtyard San Jose Cupertino | Cupertino | CA | 149 | 1988 | 3rd Party Ground Lease | $36,000,000 | $24,300,000 | ||||||||||
| Courtyard Boulder | Boulder | CO | 149 | 1988 | Affiliated Ground Lease | $35,000,000 | $24,300,000 | ||||||||||
| Courtyard Los Angeles Hacienda Heights | Hacienda Heights | CA | 150 | 1990 | Affiliated Ground Lease | $27,500,000 | $18,500,000 | ||||||||||
| Courtyard Seattle South Center | Tukwila | WA | 149 | 1989 | Affiliated Ground Lease | $27,000,000 | $17,970,000 | ||||||||||
| Courtyard Rye | Rye | NY | 145 | 1988 | Affiliated Ground Lease | $25,500,000 | $16,970,000 | ||||||||||
| Courtyard Nashville Airport | Nashville | TN | 145 | 1988 | Affiliated Ground Lease | $23,000,000 | $16,000,000 | ||||||||||
| Courtyard Los Angeles Torrance Palos Verdes | Torrance | CA | 149 | 1988 | Affiliated Ground Lease | $21,000,000 | $14,300,000 | ||||||||||
| Courtyard St. Louis Creve Coeur | Creve Coeur | MO | 154 | 1987 | Affiliated Ground Lease | $20,500,000 | $13,650,000 | ||||||||||
| Courtyard Portland Beaverton | Beaverton | OR | 149 | 1989 | Affiliated Ground Lease | $20,500,000 | $13,650,000 | ||||||||||
| Courtyard Palm Springs | Palm Springs | CA | 149 | 1988 | Affiliated Ground Lease | $19,500,000 | $13,500,000 | ||||||||||
| Courtyard Charlotte South Park | Charlotte | NC | 149 | 1989 | 3rd Party Ground Lease | $19,000,000 | $13,200,000 | ||||||||||
| Courtyard Norwalk | Norwalk | CT | 145 | 1988 | 3rd Party Ground Lease | $18,000,000 | $12,500,000 | ||||||||||
| Courtyard Detroit Metro Airport | Romulus | MI | 146 | 1987 | Affiliated Ground Lease | $18,500,000 | $12,310,000 | ||||||||||
| Courtyard Chicago Waukegan Gurnee | Waukegan | IL | 149 | 1988 | Affiliated Ground Lease | $17,500,000 | $12,000,000 | ||||||||||
| Courtyard Atlanta Perimeter Center | Atlanta | GA | 145 | 1987 | Affiliated Ground Lease | $17,000,000 | $11,700,000 | ||||||||||
| Courtyard Denver Tech Center | Greenwood Village | CO | 155 | 1987 | Affiliated Ground Lease | $17,500,000 | $11,650,000 | ||||||||||
| Courtyard Ft. Lauderdale Plantation | Plantation | FL | 149 | 1988 | Affiliated Ground Lease | $17,000,000 | $11,320,000 | ||||||||||
| Courtyard Lincroft Red Bank | Red Bank | NJ | 146 | 1988 | Affiliated Ground Lease | $17,000,000 | $11,320,000 | ||||||||||
| Courtyard Chicago Highland Park | Highland Park | IL | 149 | 1988 | Affiliated Ground Lease | $16,500,000 | $10,980,000 | ||||||||||
| Courtyard Charlottesville North | Charlottesville | VA | 150 | 1989 | Affiliated Ground Lease | $16,500,000 | $10,980,000 | ||||||||||
| Courtyard Raleigh Cary | Cary | NC | 149 | 1987 | Affiliated Ground Lease | $16,500,000 | $10,980,000 | ||||||||||
| Courtyard Detroit Livonia | Livonia | MI | 149 | 1988 | Affiliated Ground Lease | $15,500,000 | $10,800,000 | ||||||||||
| Courtyard Birmingham Homewood | Homewood | AL | 140 | 1985 | Fee Simple | $16,000,000 | $10,650,000 | ||||||||||
| Courtyard West Palm Beach | West Palm Beach | FL | 149 | 1988 | Affiliated Ground Lease | $16,000,000 | $10,650,000 | ||||||||||
| Courtyard New Haven Wallingford | Wallingford | CT | 149 | 1990 | Affiliated Ground Lease | $15,500,000 | $10,320,000 | ||||||||||
| Courtyard Dallas Plano Parkway | Plano | TX | 149 | 1988 | Fee Simple | $15,000,000 | $9,990,000 | ||||||||||
| Courtyard Chicago Oakbrook Terrace | Oakbrook Terrace | IL | 147 | 1986 | Fee Simple | $15,000,000 | $9,990,000 | ||||||||||
| Courtyard Boston Andover | Andover | MA | 146 | 1988 | Affiliated Ground Lease | $15,000,000 | $9,990,000 | ||||||||||
| Courtyard Kansas City Overland Park Metcalf | Overland Park | KS | 149 | 1988 | Affiliated Ground Lease | $15,000,000 | $9,990,000 | ||||||||||
| Courtyard Minneapolis St Paul Airport | Mendota Heights | MN | 146 | 1987 | Affiliated Ground Lease | $15,000,000 | $9,990,000 | ||||||||||
| Courtyard Bakersfield | Bakersfield | CA | 146 | 1988 | Affiliated Ground Lease | $14,500,000 | $9,650,000 | ||||||||||
| Courtyard Denver Stapleton | Denver | CO | 146 | 1987 | Fee Simple | $14,500,000 | $9,650,000 | ||||||||||
| Courtyard Rockford | Rockford | IL | 147 | 1986 | Fee Simple | $14,500,000 | $9,650,000 | ||||||||||
| Courtyard Greenville Haywood Mall | Greenville | SC | 146 | 1988 | Affiliated Ground Lease | $13,500,000 | $9,400,000 | ||||||||||
| Courtyard St. Louis Westport Plaza | St. Louis | MO | 149 | 1988 | Affiliated Ground Lease | $14,000,000 | $9,320,000 | ||||||||||
| Courtyard Chicago Lincolnshire | Lincolnshire | IL | 146 | 1987 | Fee Simple | $14,000,000 | $9,320,000 | ||||||||||
| Courtyard San Antonio Downtown Market Square | San Antonio | TX | 149 | 1990 | Affiliated Ground Lease | $14,000,000 | $9,320,000 | ||||||||||
| Courtyard Indianapolis Castleton | Indianapolis | IN | 146 | 1987 | Affiliated Ground Lease | $14,000,000 | $9,320,000 | ||||||||||
| Courtyard Silver Spring North | Silver Spring | MD | 146 | 1988 | Affiliated Ground Lease | $14,500,000 | $9,100,000 | ||||||||||
| Courtyard Lexington North | Lexington | KY | 146 | 1987 | Affiliated Ground Lease | $13,500,000 | $8,990,000 | ||||||||||
| Courtyard Tampa Westshore | Tampa | FL | 145 | 1986 | 3rd Party Ground Lease | $13,000,000 | $8,650,000 | ||||||||||
| Courtyard Chicago Deerfield | Deerfield | IL | 131 | 1986 | Fee Simple | $12,500,000 | $8,320,000 | ||||||||||
| Courtyard St. Petersburg Clearwater | Clearwater | FL | 149 | 1989 | Affiliated Ground Lease | $12,000,000 | $7,990,000 | ||||||||||
| Courtyard Toledo Airport Holland | Holland | OH | 149 | 1988 | Affiliated Ground Lease | $12,000,000 | $7,990,000 | ||||||||||
| Courtyard Phoenix Mesa | Mesa | AZ | 149 | 1988 | Affiliated Ground Lease | $11,000,000 | $7,320,000 | ||||||||||
| Courtyard Atlanta Airport South | College Park | GA | 144 | 1986 | Fee Simple | $11,000,000 | $7,320,000 | ||||||||||
| Courtyard Memphis Airport | Memphis | TN | 145 | 1987 | Affiliated Ground Lease | $11,000,000 | $7,320,000 | ||||||||||
| Courtyard Oklahoma City Airport | Oklahoma City | OK | 149 | 1988 | Affiliated Ground Lease | $11,000,000 | $7,320,000 | ||||||||||
| Courtyard Annapolis | Annapolis | MD | 149 | 1989 | Affiliated Ground Lease | $13,000,000 | $7,220,000 | ||||||||||
| Courtyard Manassas | Manassas | VA | 149 | 1989 | Affiliated Ground Lease | $11,000,000 | $6,820,000 | ||||||||||
| Courtyard Little Rock | Little Rock | AR | 149 | 1988 | Affiliated Ground Lease | $10,500,000 | $6,530,000 | ||||||||||
| Courtyard Ft. Myers | Ft. Myers | FL | 149 | 1988 | Affiliated Ground Lease | $9,000,000 | $5,680,000 | ||||||||||
| Courtyard Atlanta Gwinnett Mall | Duluth | GA | 146 | 1987 | Affiliated Ground Lease | $9,500,000 | $5,540,000 | ||||||||||
| Courtyard Chicago Arlington Heights South | Arlington Heights | IL | 147 | 1985 | Fee Simple | $8,000,000 | $5,330,000 | ||||||||||
| Courtyard Dallas Richardson at Spring Valley | Richardson | TX | 149 | 1988 | Affiliated Ground Lease | $8,000,000 | $5,330,000 | ||||||||||
| Courtyard Huntsville | Huntsville | AL | 149 | 1987 | Affiliated Ground Lease | $10,500,000 | $5,140,000 | ||||||||||
| Courtyard Birmingham Hoover | Hoover | AL | 153 | 1987 | Affiliated Ground Lease | $7,000,000 | $4,470,000 | ||||||||||
| Courtyard Phoenix North Metrocenter | Phoenix | AZ | 146 | 1987 | Affiliated Ground Lease | $6,500,000 | $4,330,000 | ||||||||||
| Courtyard Tucson Airport | Tucson | AZ | 149 | 1988 | Affiliated Ground Lease | $6,000,000 | $3,990,000 | ||||||||||
| Courtyard Dayton South Mall | Miamisburg | OH | 146 | 1987 | Affiliated Ground Lease | $7,000,000 | $2,820,000 | ||||||||||
| Courtyard Philadelphia Devon | Wayne | PA | 149 | 1988 | 3rd Party Ground Lease | $18,500,000 | $0 | ||||||||||
| Courtyard Fresno | Fresno | CA | 146 | 1986 | 3rd Party Ground Lease | $8,000,000 | $0 | ||||||||||
| Courtyard Poughkeepsie | Poughkeepsie | NY | 149 | 1988 | 3rd Party Ground Lease | $8,000,000 | $0 | ||||||||||
| Total | 9,590 | $1,041,000,000 | $670,000,000 | ||||||||||||||
| Total w/ Portfolio Premium | $1,116,000,000 | ||||||||||||||||
| (1) | With respect to the ownership interest identified as “affiliated ground lease,” the fee owner and the leasehold owner are each borrowers under the Courtyard by Marriott Portfolio Loan. As such, for disclosure purposes these properties are considered fee interests. |
| (2) | The Portfolio “As-Is” Value of $1.116 billion reflects a premium attributed to the aggregate value of the Courtyard by Marriott Portfolio as a whole. The sum of the value of each of the properties on an individual basis is $1.041 billion. |
| (3) | For the purposes of calculating the release price of the properties, no debt was allocated to three of the 3rd Party Ground Lease Properties (the “Short Term Ground Lease Properties”). The Short Term Ground Lease Properties are subject to ground leases with remaining terms of less than 30 years as of the closing date of the Courtyard by Marriott Portfolio Loan. For purposes of calculating the release price for the Short Term Ground Lease Properties, the allocated loan amount for each property will be 62.5% of the “As-is” appraised value at closing. |
THE INFORMATION IN THIS STRUCTURAL AND COLLATERAL TERM SHEET IS NOT COMPLETE AND MAY BE AMENDED PRIOR TO THE TIME OF SALE. THIS TERM SHEET IS NOT AN OFFER TO SELL THESE SECURITIES AND IT IS NOT A SOLICITATION OF AN OFFER TO BUY THESE SECURITIES IN ANY JURISDICTION WHERE THE OFFER OR SALE IS NOT PERMITTED.
| 23 |
| Various | Collateral Asset Summary – Loan No. 1 Courtyard by Marriott Portfolio | Cut-off Date Balance: Cut-off Date LTV: U/W NCF DSCR: U/W NOI Debt Yield: | $97,050,000 28.2% 7.40x 32.7% |
All 65 hotels in the Courtyard by Marriott Portfolio are operated under a master management agreement with Courtyard Management Corporation, a wholly owned subsidiary of Marriott International, Inc. The hotels range in age from 25 to 30 years old with an average room count of 148. Approximately $318.7 million ($33,231 per room) of capital expenditures have been made since 2005 in order to update the portfolio and to maintain competitiveness within each asset’s market. All of the hotels have undergone guestroom case good renovations from 2003 to 2006 and have completed public area renovations and guestroom soft good upgrades from 2009 to 2015. The hotels are typically renovated every six to seven years and each of the hotels has completed an average of $4.9 million in capital expenditures since 2005.
Historical Capital Expenditures(1) | ||||||
| 2005-2010 | 2011 | 2012 | 2013 | 2014 | Total | |
| Total | $173,248,162 | $28,953,904 | $40,036,525 | $45,554,925 | $30,893,045 | $318,686,561 |
| Per Room | $18,066 | $3,019 | $4,175 | $4,750 | $3,221 | $33,231 |
| (1) | Source: Borrower. |
The Courtyard by Marriott Portfolio is located across 29 states and no one region accounts for more than 26.1% of the portfolio’s total rooms or 27.4% of underwritten net cash flow. California represents the largest exposure to a single state, with eight assets totaling 12.3% of the portfolio’s total room count and 22.9% of underwritten net cash flow. No other state accounts for more than 8.9% of total underwritten net cash flow; which is represented by the seven properties in Illinois.
| Regional Breakdown | |||||||||||||||||||
| Region | # Hotels | Rooms | % Rooms | Occupancy(1) | ADR(1) | RevPAR(1) | RevPAR Penetration (1) | Individual UW NCF(2) | % UW NCF | ||||||||||
| Pacific West | 10 | 1,480 | 15.4% | 77.1% | $144.77 | $112.27 | 134.2% | $24,250,200 | 27.4% | ||||||||||
| Midwest | 17 | 2,496 | 26.0% | 67.2% | $107.46 | $72.32 | 118.1% | $19,268,431 | 21.7% | ||||||||||
| Southeast | 17 | 2,501 | 26.1% | 71.0% | $105.22 | $75.13 | 115.8% | $19,091,268 | 21.5% | ||||||||||
| Northeast | 5 | 734 | 7.7% | 70.8% | $132.61 | $94.31 | 118.9% | $7,317,918 | 8.3% | ||||||||||
| Mid-Atlantic | 6 | 889 | 9.3% | 66.4% | $118.44 | $79.00 | 117.9% | $7,031,949 | 7.9% | ||||||||||
| Mountain West | 3 | 450 | 4.7% | 70.8% | $126.51 | $90.85 | 129.4% | $5,954,053 | 6.7% | ||||||||||
| Southwest | 7 | 1,040 | 10.8% | 66.4% | $95.16 | $63.26 | 121.3% | $5,707,226 | 6.4% | ||||||||||
| Total / Wtd. Avg. | 65 | 9,590 | 100.0% | 70.0% | $115.14 | $81.40 | 120.9% | $88,621,045 | 100.0% | ||||||||||
| (1) | Occupancy, ADR, RevPAR and RevPAR Penetration are based on a February 2015 Hospitality Research Report. The minor variances between the underwriting, the hospitality research report and the above table with respect to Occupancy, ADR and RevPAR at the Courtyard by Marriott Portfolio are attributable to variances in reporting methodologies and/or timing differences. |
| (2) | UW NCF is exclusive of an approximately $1.4 million incentive management fee, which is calculated on a portfolio basis. |
Additionally, no hotel contributes more than 4.7% of total underwritten net cash flow and the top ten assets account for only 15.5% of the portfolio by room count and 30.9% of underwritten net cash flow. A breakout of the top ten Courtyard by Marriott Portfolio Properties by underwritten net cash flow is shown below.
| Top Ten Properties by UW NCF | ||||||||
| Hotel Name | Rooms | % of Total Room | Individual UW NCF(1) | % of Total UW NCF | “As-is” Value(2) | Per Room | ||
| Courtyard San Mateo Foster City | 147 | 1.5% | $4,164,236 | 4.7% | $40,500,000 | $275,510 | ||
| Courtyard Larkspur Landing Marin County | 146 | 1.5% | $3,709,578 | 4.2% | $41,000,000 | $280,822 | ||
| Courtyard Boulder | 149 | 1.6% | $3,254,133 | 3.7% | $35,000,000 | $234,899 | ||
| Courtyard San Jose Cupertino | 149 | 1.6% | $3,202,254 | 3.6% | $36,000,000 | $241,611 | ||
| Courtyard Los Angeles Hacienda Heights | 150 | 1.6% | $2,318,551 | 2.6% | $27,500,000 | $183,333 | ||
| Courtyard Nashville Airport | 145 | 1.5% | $2,316,930 | 2.6% | $23,000,000 | $158,621 | ||
| Courtyard Seattle South Center | 149 | 1.6% | $2,264,027 | 2.6% | $27,000,000 | $181,208 | ||
| Courtyard Philadelphia Devon | 149 | 1.6% | $2,140,790 | 2.4% | $18,500,000 | $124,161 | ||
| Courtyard Charlotte South Park | 149 | 1.6% | $2,049,150 | 2.3% | $19,000,000 | $127,517 | ||
| Courtyard Los Angeles Torrance Palos Verdes | 149 | 1.6% | $1,977,240 | 2.2% | $21,000,000 | $140,940 | ||
| Subtotal | 1,482 | 15.5% | $27,396,888 | 30.9% | $288,500,000 | $194,669 | ||
| Remaining Hotels | 8,108 | 84.5% | $61,224,158 | 69.1% | $752,500,000 | $92,810 | ||
| Total | 9,590 | 100.0% | $88,621,045 | 100.0% | $1,041,000,000 | $108,551 | ||
| Total w/ Portfolio Premium | $1,116,000,000 | $116,371 | ||||||
| (1) | UW NCF is exclusive of an approximately $1.4 million incentive management fee, which is calculated on a portfolio basis. |
| (2) | The Portfolio “As-Is” Value of $1.116 billion reflects a premium attributed to the aggregate value of the Courtyard by Marriott Portfolio as a whole. The sum of the value of each of the properties on an individual basis is $1.041 billion. |
THE INFORMATION IN THIS STRUCTURAL AND COLLATERAL TERM SHEET IS NOT COMPLETE AND MAY BE AMENDED PRIOR TO THE TIME OF SALE. THIS TERM SHEET IS NOT AN OFFER TO SELL THESE SECURITIES AND IT IS NOT A SOLICITATION OF AN OFFER TO BUY THESE SECURITIES IN ANY JURISDICTION WHERE THE OFFER OR SALE IS NOT PERMITTED.
| 24 |
| Various | Collateral Asset Summary – Loan No. 1 Courtyard by Marriott Portfolio | Cut-off Date Balance: Cut-off Date LTV: U/W NCF DSCR: U/W NOI Debt Yield: | $97,050,000 28.2% 7.40x 32.7% |
Environmental Matters. The Phase I environmental reports dated March 30, 2015 (and April 10, 2015 in the case of the Courtyard Norwalk property) recommended further action at two of the Courtyard by Marriott Portfolio properties: Courtyard Norwalk and the Courtyard Lincroft Red Bank. At the Courtyard Norwalk property, a Phase II subsurface investigation was recommended to investigate the historical usage of underground storage tanks related to a gas station that was previously located at the property. The Phase II investigation was completed on April 7, 2015 and no further action is recommended at the property. At the Courtyard Lincroft Red Bank property, three groundwater monitoring wells were found and the Phase I environmental report recommended further documentation regarding the wells be obtained and a well abandonment be undertaken. As of April 15, 2015 the groundwater monitoring wells were removed and no further action or investigation is recommended at the property. Accordingly, the $504,100 initially held in the remediation reserve has been released to the borrowers.
The Market. The Courtyard by Marriott Portfolio has broad exposure to the hospitality industry across the United States with properties located in 29 different states covering each major region of the country. Over the past several years, the U.S. hotel industry has continued its recovery from the downturn of 2008-2009. In 2014, the U.S. hotel industry enjoyed its greatest growth in RevPAR since 2005. According to a hospitality research report, RevPAR increased 8.3% for the year, the result of a 3.6% gain in occupancy and a 4.6% increase in ADR. Furthermore, demand growth outpaced supply with a 4.4% increase over the course of the year compared to a below average 0.9% increase in supply.
The Courtyard by Marriott brand is classified as an upscale select service brand. From 2010 to 2014, ADR and RevPAR for the select service segment increased at compounded average annual growth rates of 4.2% and 6.9% respectively. Over that same time period, demand increased at a compound average annual growth rate of 5.4%. The pace of RevPAR growth is expected to slow as peak occupancy levels are realized in certain markets both this year and the next. Supply growth is expected to begin to outpace demand increases in late 2016 and early 2017. According to the appraisal, 113,000 new rooms are under construction as of October 2014, compared to 91,000 rooms as of December 2013 and 86,000 rooms as of October 2013.
In line with the larger U.S. hotel industry, the Courtyard by Marriott Portfolio has rebounded from declines in 2009 and 2010. RevPAR and net cash flow are up 39.0% and 73.5%, respectively, over the portfolio’s 2009 trough. RevPAR has consistently improved since 2009 with annual increases of 3.1%, 7.5%, 5.0%, 5.5% and 11.2% from 2010-2014, respectively.
The appraiser identified several recent sales of hotel portfolios it considered to be comparable to the Courtyard by Marriott Portfolio which are summarized in the chart below.
Sales Comparison(1) | ||||||||||||||
| Portfolio Name | Date of Sale | Price(2) | # of Hotels | # of Rooms | Price/Room | Cap Rate | Buyer / Seller | |||||||
| Courtyard by Marriott Portfolio | NAP | $1,116,000,000 | 65 | 9,590 | $116,371 | 7.8% | NAP | |||||||
| Apple REIT Six, Inc. Portfolio | May-13 | $1,077,067,068 | 66 | 7,658 | $140,646 | 7.6% | Blackstone / Apple REIT Six, Inc. | |||||||
| Inland American Real Estate Trust, Inc | Nov-14 | $1,032,000,000 | 48 | 6,401 | $161,225 | 6.9% | Chatham Lodging Trust/NorthStar / Inland American REIT, Inc. | |||||||
| CBM One Hotels Portfolio | Sep-14 | $656,000,000 | 40 | 5,832 | $112,483 | NAV | NorthStar Realty Finance / Clarion Partners | |||||||
| Hyatt Hotels Portfolio | Nov-14 | $590,000,000 | 38 | 4,959 | $118,976 | 6.3% | Lone Star Funds / Hyatt Hotels | |||||||
| MCR Texas Western Portfolio | Oct-13 | $430,000,000 | 26 | 3,348 | $128,435 | NAV | MCR Development, LLC / Texas Western Hospitality | |||||||
| (1) | Source: Appraisal. |
| (2) | Price for the Courtyard by Marriott Portfolio reflects the “As-is” appraised value inclusive of the portfolio premium attributed aggregate value of the Courtyard by Marriott Portfolio as a whole. The sum of the value of each of the properties on an individual basis is $1.041 billion. |
THE INFORMATION IN THIS STRUCTURAL AND COLLATERAL TERM SHEET IS NOT COMPLETE AND MAY BE AMENDED PRIOR TO THE TIME OF SALE. THIS TERM SHEET IS NOT AN OFFER TO SELL THESE SECURITIES AND IT IS NOT A SOLICITATION OF AN OFFER TO BUY THESE SECURITIES IN ANY JURISDICTION WHERE THE OFFER OR SALE IS NOT PERMITTED.
| 25 |
| Various | Collateral Asset Summary – Loan No. 1 Courtyard by Marriott Portfolio | Cut-off Date Balance: Cut-off Date LTV: U/W NCF DSCR: U/W NOI Debt Yield: | $97,050,000 28.2% 7.40x 32.7% |
Cash Flow Analysis.
| Cash Flow Analysis | ||||||||
| 2012 | 2013 | 2014 | T-12 2/28/2015 | U/W | U/W per Room(1) | |||
Occupancy(2) | 65.8% | 66.0% | 69.5% | 70.0% | 70.0% | |||
ADR(2) | $104.21 | $108.68 | $115.08 | $116.31 | $116.31 | |||
RevPAR(2) | $68.58 | $71.74 | $80.02 | $81.42 | $81.42 | |||
| Room Revenue | $239,391,188 | $253,184,871 | $280,101,273 | $284,991,726 | $284,991,726 | $29,718 | ||
| F&B Revenue | 18,530,388 | 20,913,301 | 22,580,700 | 22,708,342 | 22,708,342 | 2,368 | ||
| Other Revenue | 4,361,274 | 4,317,533 | 5,206,313 | 5,378,285 | 5,378,285 | 561 | ||
| Total Revenue | $262,282,851 | $278,415,705 | $307,888,286 | $313,078,352 | $313,078,352 | $32,646 | ||
| Operating Expenses | 77,974,425 | 80,163,388 | 84,356,326 | 84,916,737 | 84,916,737 | 8,855 | ||
| Undistributed Expenses | 71,514,979 | 74,869,533 | 79,945,869 | 80,970,799 | 80,970,799 | 8,443 | ||
| Gross Operating Profit | $112,793,447 | $123,382,784 | $143,586,092 | $147,190,815 | $147,190,815 | $15,348 | ||
| Management Fee | 21,612,107 | 22,579,514 | 24,877,374 | 25,266,908 | 25,266,908 | 2,635 | ||
Incentive Management Fee(3) | 0 | 0 | 961,267 | 1,416,328 | 1,416,328 | 148 | ||
| Total Fixed Charges | 26,829,721 | 28,316,616 | 29,425,460 | 29,580,660 | 30,891,214 | 3,221 | ||
Affiliate Ground Lease Add Back(4) | 11,748,997 | 12,213,053 | 12,824,395 | 12,876,484 | 13,242,269 | 1,381 | ||
| Net Operating Income | $76,100,616 | $84,699,708 | $101,146,386 | $103,803,403 | $102,858,635 | $10,726 | ||
| FF&E | 13,114,142 | 13,920,785 | 15,394,415 | 15,653,918 | 15,653,918 | 1,632 | ||
| Net Cash Flow | $62,986,473 | $70,778,922 | $85,751,972 | $88,149,485 | $87,204,717 | $9,093 | ||
| (1) | U/W per Room is based on a total of 9,590 rooms. |
| (2) | The minor variances between the underwriting, the hospitality research report and the above table with respect to Occupancy, ADR and RevPAR at the Courtyard by Marriott Portfolio are attributable to variances in reporting methodologies and/or timing differences. |
| (3) | The Incentive Management Fee, which is calculated at a portfolio level only, is equal to 15% of operating profit in excess of the tier 1 owner’s priority plus 5% of operating profit in excess of the tier 2 owner’s priority. Tier 1 and tier 2 owner’s priority are each 9.5% of the tier 1 and tier 2 owner’s investment, initially $599,924,000 and $663,073,895 respectively. |
| (4) | The Affiliated Ground Lease Add Back accounts for the ground lease payments on the Affiliated Ground Lease Properties. |
Property Management. The Courtyard by Marriott Portfolio is subject to a master management agreement with Courtyard Management Corporation, a wholly owned subsidiary of Marriott International, Inc. The agreement expires December 31, 2025 with automatic renewals for all properties for two successive 10-year periods each unless the manager gives at least 300 days notice prior to each expiration.
Lockbox / Cash Management. The Courtyard by Marriott Portfolio is structured with a soft springing hard lockbox and in place cash management. So long as the properties in the Courtyard by Marriott Portfolio continue to be Courtyard Managed Properties (as defined herein), all amounts payable by the manager to the borrowers under the courtyard management agreement, including, but not limited to, operating profit payable under the Courtyard by Marriott Portfolio management agreement, related party ground rent and tax remittances, will be transmitted by the manager into a clearing account established and maintained by the borrowers and controlled by the lender. In the event that any property becomes a Non-Courtyard Managed Property (as defined herein), the borrowers will direct all rents and other payments to be deposited directly into the clearing account controlled by the lender. All funds in the clearing account are swept daily to a lender controlled deposit account and disbursed in accordance with the Courtyard by Marriott Portfolio Loan documents. Provided no Trigger Period (as defined herein) is continuing, excess cash in the deposit account will be disbursed to the manager and the borrowers in accordance with the Courtyard by Marriott Portfolio Loan documents.
The “Courtyard Managed Properties” means at any time, all individual properties with respect to which the Courtyard by Marriott Portfolio management agreement is in full force and effect and has not been terminated, cancelled, surrendered of rejected.
The “Non-Courtyard Managed Properties” means any individual property that is not a Courtyard Managed Property.
A “Trigger Period” will exist (i) during the continuance of an event of default or (ii) if the debt yield falls below 9.50%, and will end if the debt yield is at least 9.75% for two consecutive calculation dates.
Initial Reserves. At closing, the borrowers deposited (i) $409,063 into a required reserve account and (ii) $504,100 into an environmental reserve account for remediation of environmental issues identified at the Courtyard Norwalk and Courtyard Lincroft Red Bank properties. As of April 15, 2014, the environmental issues at the Courtyard by Marriott Portfolio properties have been remediated and the environmental reserve was released to the borrowers.
THE INFORMATION IN THIS STRUCTURAL AND COLLATERAL TERM SHEET IS NOT COMPLETE AND MAY BE AMENDED PRIOR TO THE TIME OF SALE. THIS TERM SHEET IS NOT AN OFFER TO SELL THESE SECURITIES AND IT IS NOT A SOLICITATION OF AN OFFER TO BUY THESE SECURITIES IN ANY JURISDICTION WHERE THE OFFER OR SALE IS NOT PERMITTED.
| 26 |
| Various | Collateral Asset Summary – Loan No. 1 Courtyard by Marriott Portfolio | Cut-off Date Balance: Cut-off Date LTV: U/W NCF DSCR: U/W NOI Debt Yield: | $97,050,000 28.2% 7.40x 32.7% |
Ongoing Reserves. On a monthly basis, the borrowers are required to make deposits of (i) 1/12 of the required annual taxes, which currently equates to $985,000 into a tax reserve account, (ii) 1/12 of the required annual insurance premiums into an insurance reserve account, (iii) an amount equal to the greater of (a) 5.0% of the gross rents for the prior month and (b) the amount required by the manager or any franchisor under the courtyard management agreement into an FF&E reserve account and (iv) an amount equal to the monthly third party ground rents payable into a ground rent reserve account. Deposits into the ongoing reserve accounts will be waived (i) with respect to the insurance reserve, so long as the manager maintains the insurance required under the courtyard management agreement, (ii) with respect to the FF&E reserve account, so long as the manager deposits the amount the borrowers are otherwise required to deposit with respect to the Courtyard Managed Properties into a separate FF&E reserve account owned by the borrowers and pledged to the lender and (iii) with respect to the ground rent reserve, so long as any Third Party Ground Leased Properties continue to be Courtyard Managed Properties and the manager is paying the third party ground rent due under the third party ground leases.
Current Mezzanine or Subordinate Indebtedness. The Courtyard by Marriott Portfolio Loan is split into the Courtyard by Marriott Portfolio Senior Tranche and the Courtyard by Marriott Portfolio Junior Tranche. The Courtyard by Marriott Portfolio Junior Tranche is evidenced by the controlling Note B with an original principle balance of $355.0 million. The Note B is co-terminus with pari passu Notes A-1, A-2A, A-2B and A-2C and has an interest rate of 3.6900%.
Future Mezzanine or Subordinate Indebtedness Permitted. None.
Partial Release. Any time after the expiration of the defeasance lockout period (or after May 6, 2016 with respect to the first $33,500,000 of release prices), the borrowers may obtain the release of an individual property upon a bona fide third-party sale provided, among other things, (i) the DSCR for the remaining properties is not less than the greater of the DSCR immediately preceding the partial release and the closing date DSCR, (ii) the debt yield for the remaining properties is not less than the greater of the debt yield immediately preceding the partial release and the closing date debt yield, (iii) borrowers prepay or partially defease (as applicable) 115.0% of the allocated loan amount for the released property (or for the three properties that have no allocated loan amount, 62.5% of the appraised value of such properties) and (iv) such release will comply with REMIC requirements. After May 6, 2016, the borrowers may prepay a portion of the outstanding principal balance in connection with a property release, not to exceed aggregate release prices of $33,500,000, without payment of a prepayment premium, penalty or fee. All prepayments are applied entirely to Note A-1, and all defeasances are applied pro rata and pari passu among Note A-2A, Note A-2B, Note A-2C and Note B.
Substitution. None.
Ground Leases. Seven of the Courtyard by Marriott Portfolio Properties, representing 14.8% of underwritten net cash flow, are subject to ground leases held by a third party entity as described below.
Courtyard San Jose Cupertino: The property is subject to a ground lease that has an initial maturity date of December 30, 2033. The ground lease is subject to rent increases every five years equal to the greater of (i) 75% of the CPI percentage increase over that five year period and (ii) 6% of annual gross revenue at the property. The ground lease has three 10-year extension options.
Courtyard Charlotte South Park: The property is subject to a ground lease that has an initial maturity date of December 31, 2019. The ground lease has an annual rent of the greater of (i) $352,051 and (ii) 6% of annual gross revenue at the property. The ground lease has three 10-year extension options.
Courtyard Norwalk: The property is subject to a ground lease that has an initial maturity date of December 29, 2023. The ground lease is subject to rent increases every five years equal to the greater of (i) the prevailing rental rate increased by 15% and (ii) the prevailing rental rate increased by 60% of the percentage increase in CPI since the opening date of the hotel. The ground lease has eight 5-year extension options.
Courtyard Tampa Westshore: The property is subject to a ground lease that has an initial maturity date of June 30, 2068. The ground lease is subject to rent increases of 5% every ten years. There are no extension options for this lease.
Courtyard Philadelphia Devon: The property is subject to a ground lease that has an initial maturity date of January 1, 2018. The ground lease has an annual rent of the greater of (i) $240,000 and (ii) 4.25% of annual gross revenue at the property. The ground lease has two 10-year extension options.
Courtyard Fresno: The property is subject to a ground lease that has a maturity date of June 30, 2024. The ground lease is subject to annual rent increases of the greater of (i) 3% over the previous year’s minimum rent and (ii) 6% of annual gross revenue. There are no extension options for this lease.
Courtyard Poughkeepsie: The property is subject to a ground lease with an initial maturity date of December 29, 2018. The ground lease has an annual rent of the greater of (i) $110,000 and (ii) 3.5% of annual gross revenue. The ground lease has three 5-year extension options.
THE INFORMATION IN THIS STRUCTURAL AND COLLATERAL TERM SHEET IS NOT COMPLETE AND MAY BE AMENDED PRIOR TO THE TIME OF SALE. THIS TERM SHEET IS NOT AN OFFER TO SELL THESE SECURITIES AND IT IS NOT A SOLICITATION OF AN OFFER TO BUY THESE SECURITIES IN ANY JURISDICTION WHERE THE OFFER OR SALE IS NOT PERMITTED.
| 27 |
| Various | Collateral Asset Summary – Loan No. 1 Courtyard by Marriott Portfolio | Cut-off Date Balance: Cut-off Date LTV: U/W NCF DSCR: U/W NOI Debt Yield: | $97,050,000 28.2% 7.40x 32.7% |
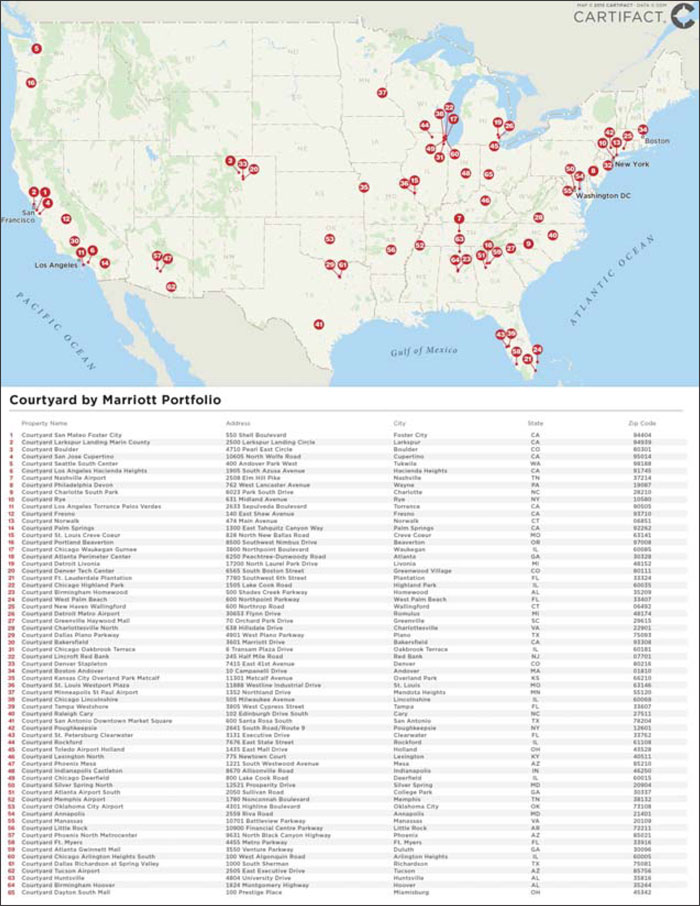
THE INFORMATION IN THIS STRUCTURAL AND COLLATERAL TERM SHEET IS NOT COMPLETE AND MAY BE AMENDED PRIOR TO THE TIME OF SALE. THIS TERM SHEET IS NOT AN OFFER TO SELL THESE SECURITIES AND IT IS NOT A SOLICITATION OF AN OFFER TO BUY THESE SECURITIES IN ANY JURISDICTION WHERE THE OFFER OR SALE IS NOT PERMITTED.
| 28 |
(THIS PAGE INTENTIONALLY LEFT BLANK)
| 29 |
180 North Fair Oaks Avenue Pasadena, CA 91103 | Collateral Asset Summary – Loan No. 2 Courtyard by Marriott Pasadena | Cut-off Date Balance: Cut-off Date LTV: U/W NCF DSCR: U/W NOI Debt Yield: | $73,750,000 70.9% 1.70x 11.4% |
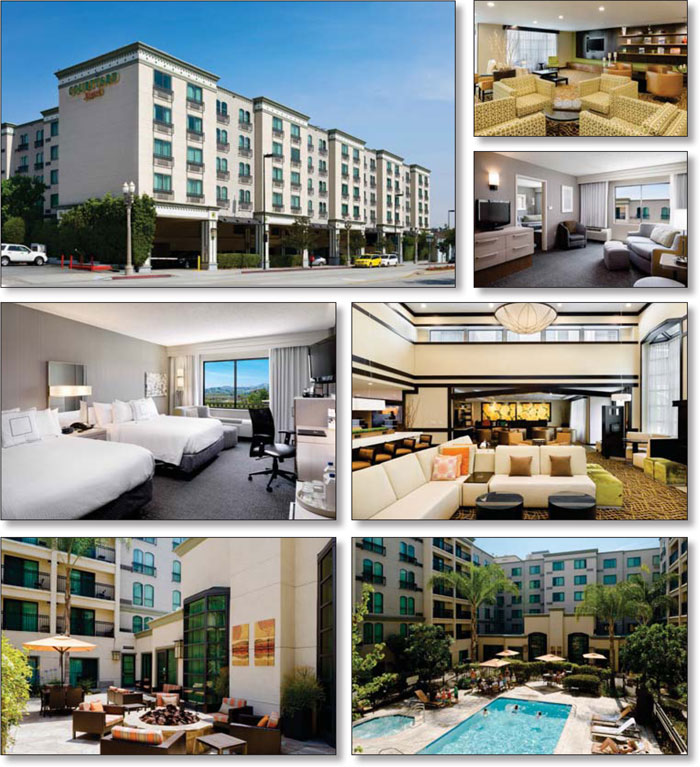
THE INFORMATION IN THIS STRUCTURAL AND COLLATERAL TERM SHEET IS NOT COMPLETE AND MAY BE AMENDED PRIOR TO THE TIME OF SALE. THIS TERM SHEET IS NOT AN OFFER TO SELL THESE SECURITIES AND IT IS NOT A SOLICITATION OF AN OFFER TO BUY THESE SECURITIES IN ANY JURISDICTION WHERE THE OFFER OR SALE IS NOT PERMITTED.
| 30 |
180 North Fair Oaks Avenue Pasadena, CA 91103 | Collateral Asset Summary – Loan No. 2 Courtyard by Marriott Pasadena | Cut-off Date Balance: Cut-off Date LTV: U/W NCF DSCR: U/W NOI Debt Yield: | $73,750,000 70.9% 1.70x 11.4% |
| Mortgage Loan Information | |
| Loan Seller: | GACC |
| Loan Purpose: | Refinance |
| Sponsor: | Allan V. Rose |
| Borrower: | RT Pasad LLC |
| Original Balance: | $73,750,000 |
| Cut-off Date Balance: | $73,750,000 |
| % by Initial UPB: | 5.6% |
| Interest Rate: | 4.5300% |
| Payment Date: | 1st of each month |
| First Payment Date: | July 1, 2015 |
| Maturity Date: | June 1, 2025 |
| Amortization: | 360 months |
| Additional Debt: | None |
| Call Protection: | L(24), D(92), O(4) |
| Lockbox / Cash Management: | Hard / Springing |
Reserves(1) | ||
| Initial | Monthly | |
| Taxes: | $172,459 | $57,486 |
| Insurance: | $0 | Springing |
| FF&E: | $0 | At least 4% of prior month’s gross revenues |
| Comfort Letter Transfer: | $2,500 | $0 |
| Financial Information | ||
| Cut-off Date Balance / Room: | $234,873 | |
| Balloon Balance / Room: | $190,115 | |
| Cut-off Date LTV: | 70.9% | |
| Balloon LTV: | 57.4% | |
| Underwritten NOI DSCR: | 1.88x | |
| Underwritten NCF DSCR: | 1.70x | |
| Underwritten NOI Debt Yield: | 11.4% | |
| Underwritten NCF Debt Yield: | 10.4% | |
| Underwritten NOI Debt Yield at Balloon: | 14.1% | |
| Underwritten NCF Debt Yield at Balloon: | 12.8% | |
| Property Information | |
| Single Asset / Portfolio: | Single Asset |
| Property Type: | Limited Service Hospitality |
| Collateral: | Fee Simple |
| Location: | Pasadena, CA |
| Year Built / Renovated: | 2000 / 2013 |
| Total Rooms: | 314 |
| Property Management: | Dimension Development Two, LLC |
| Underwritten NOI: | $8,444,365 |
| Underwritten NCF: | $7,664,659 |
| Appraised Value: | $104,000,000 |
| Appraisal Date: | March 23, 2015 |
| Historical NOI | |
| Most Recent NOI: | $8,434,989 (T-12 April 30, 2015) |
| 2014 NOI: | $8,031,193 (December 31, 2014) |
| 2013 NOI: | $7,107,152 (December 31, 2013) |
| 2012 NOI: | $6,976,610 (December 31, 2012) |
| Historical Occupancy | |
| Most Recent Occupancy: | 90.6% (April 30, 2015) |
| 2014 Occupancy: | 88.8% (December 31, 2014) |
| 2013 Occupancy: | 90.2% (December 31, 2013) |
| 2012 Occupancy: | 87.6% (December 31, 2012) |
| (1) | See “Initial Reserves” and “Ongoing Reserves” herein. |
THE INFORMATION IN THIS STRUCTURAL AND COLLATERAL TERM SHEET IS NOT COMPLETE AND MAY BE AMENDED PRIOR TO THE TIME OF SALE. THIS TERM SHEET IS NOT AN OFFER TO SELL THESE SECURITIES AND IT IS NOT A SOLICITATION OF AN OFFER TO BUY THESE SECURITIES IN ANY JURISDICTION WHERE THE OFFER OR SALE IS NOT PERMITTED.
| 31 |
180 North Fair Oaks Avenue Pasadena, CA 91103 | Collateral Asset Summary – Loan No. 2 Courtyard by Marriott Pasadena | Cut-off Date Balance: Cut-off Date LTV: U/W NCF DSCR: U/W NOI Debt Yield: | $73,750,000 70.9% 1.70x 11.4% |
Historical Occupancy, ADR, RevPAR(1)(2) | |||||||||
| Courtyard by Marriott Pasadena Property | Competitive Set | Penetration Factor | |||||||
| Year | Occupancy | ADR | RevPAR | Occupancy | ADR | RevPAR | Occupancy | ADR | RevPAR |
| 2012 | 87.2% | $146.03 | $127.38 | 81.3% | $123.55 | $100.39 | 107.4% | 118.2% | 126.9% |
| 2013 | 89.8% | $148.84 | $133.65 | 81.5% | $127.55 | $103.95 | 110.2% | 116.7% | 128.6% |
| 2014 | 87.5% | $165.83 | $145.09 | 82.9% | $141.23 | $117.07 | 105.6% | 117.4% | 123.9% |
| T-12 Feb 2015 | 88.3% | $164.88 | $145.60 | 82.4% | $142.03 | $117.04 | 107.2% | 116.1% | 124.4% |
| (1) | Source: Hospitality research report. |
| (2) | Occupancy, ADR and RevPAR represent estimates from the hospitality research report. The minor variances between the underwriting, the appraisal and the above table with respect to Occupancy, ADR and RevPAR at the Courtyard by Marriott Pasadena Property are attributable to variances in reporting methodologies and/or timing differences. |
The Loan. The Courtyard by Marriott Pasadena loan (the “Courtyard by Marriott Pasadena Loan”) is a $73.75 million fixed rate loan secured by the borrower’s fee simple interest in a 314-room limited service hotel located at 180 North Fair Oaks Avenue in Pasadena, California (the “Courtyard by Marriott Pasadena Property”). The Courtyard by Marriott Pasadena Loan has a 10-year term and amortizes on a 30-year schedule. The Courtyard by Marriott Pasadena Loan accrues interest at a fixed rate equal to 4.5300%. Loan proceeds, along with approximately $5.2 million in sponsor equity, were used to retire existing debt of approximately $78.6 million, fund reserves of approximately $0.2 million, and pay closing costs of approximately $0.2 million. Based on the appraised value of $104.0 million as of March 23, 2015, the cut-off date LTV is 70.9%. The most recent prior financing of the Courtyard by Marriott Pasadena Property was included in the CGCMT 2007-C6 securitizations.
Sources and Uses | |||||||
Sources | Proceeds | % of Total | Uses | Proceeds | % of Total | ||
Loan Amount | $73,750,000 | 93.4% | Loan Payoff | $78,550,652 | 99.5% | ||
Sponsor Equity | $5,182,641 | 6.6% | Reserves | $174,959 | 0.2% | ||
Closing Costs | $207,029 | 0.3% | |||||
Total Sources | $78,932,641 | 100.0% | Total Uses | $78,932,641 | 100.0% | ||
The Borrower / Sponsor. The borrower, RT Pasad LLC, is a single purpose Delaware limited liability company structured to be bankruptcy-remote, with two independent directors in its organizational structure. The sponsor of the borrower and nonrecourse carve-out guarantor is Allan V. Rose.
Allan V. Rose is the owner and Chief Executive Officer of AVR Realty, a privately held real estate development and management company. Mr. Rose founded AVR Realty over 45 years ago and has since built, acquired and developed more than 30 million square feet of commercial and residential space. AVR Realty’s portfolio currently includes office complexes, shopping centers, corporate and industrial parks, apartment complexes, residential communities and hotels.
The Property. The Courtyard by Marriott Pasadena Property is a 314-room limited service hotel located in Pasadena, California. The Courtyard by Marriott Pasadena Property, built in 2000 and renovated most recently in 2013, consists of a six-story building and an adjacent eight-level parking garage structure. The parking garage structure has 432 spaces which equates to 1.38 spaces per room. The Courtyard by Marriott Pasadena Property has undergone approximately $7.5 million in renovations since 2010, including an approximately $5.3 million PIP renovation completed in 2013. The PIP renovation included an approximately $4.1 million guestroom and guest bathroom renovation and an approximately $1.2 million renovation of the common areas and amenity space. The subsequent table provides a detailed summary of the historical capital expenditures.
Historical Capital Expenditure Summary(1) | ||||||
| 2010 | 2011 | 2012 | 2013 | 2014 | ||
| Total Paid | $1,207,656 | $545,510 | $143,270 | $5,261,266 | $375,549 | |
| Paid Per Room | $3,846 | $1,737 | $456 | $16,756 | $1,196 | |
| (1) | Source: sponsor |
The Courtyard by Marriott Pasadena Property features 5,317 sq. ft. of meeting space, an outdoor pool and whirlpool, a business center, guest laundry facilities and the Bistro restaurant and bar. The Courtyard by Marriott Pasadena Property features 314 guestrooms, including 112 king guestrooms, 192 double queen guestrooms and 10 suites. Each of the guestrooms features a television, work space, dresser, nightstands and a lounge chair. The Courtyard by Marriott Pasadena Property is operated under a franchise agreement with Marriott International, Inc., which expires in January 2034.
Environmental Matters. The Phase I environmental report dated April 2, 2015 recommended no further action at the Courtyard by Marriott Pasadena Property.
THE INFORMATION IN THIS STRUCTURAL AND COLLATERAL TERM SHEET IS NOT COMPLETE AND MAY BE AMENDED PRIOR TO THE TIME OF SALE. THIS TERM SHEET IS NOT AN OFFER TO SELL THESE SECURITIES AND IT IS NOT A SOLICITATION OF AN OFFER TO BUY THESE SECURITIES IN ANY JURISDICTION WHERE THE OFFER OR SALE IS NOT PERMITTED.
| 32 |
180 North Fair Oaks Avenue Pasadena, CA 91103 | Collateral Asset Summary – Loan No. 2 Courtyard by Marriott Pasadena | Cut-off Date Balance: Cut-off Date LTV: U/W NCF DSCR: U/W NOI Debt Yield: | $73,750,000 70.9% 1.70x 11.4% |
The Market. The Courtyard by Marriott Pasadena Property is located in Pasadena, California within Los Angeles County, approximately 10 miles northeast of downtown Los Angeles and approximately 25 miles inland from the Pacific Ocean. Pasadena is widely recognized as the home of the Rose Bowl, the Jet Propulsion Laboratory, California Institute of Technology (“Caltech”) and host of the annual Tournament of Roses’ parade since January 1, 1890. The property is situated on Fair Oaks Avenue, which connects to three major Freeways in Pasadena, including the Pasadena Freeway (I-101), the Venture Freeway (US 134), and the Interstate 210 (I-210). I-110 originates at the southern border of Pasadena and provides access to downtown Los Angeles and continues in a southwesterly direction to the Ports of Los Angeles and Long Beach. The Courtyard by Marriott Pasadena Property is located 16.1 miles east of the Burbank-Glendale-Pasadena Airport. Los Angeles International Airport (LAX) is approximately 27.7 miles southwest of the property, which offers domestic and international air service as one of the five largest airports in the world in terms of passenger volume. Finally, the Metropolitan Transportation Authority (MTA) operates 16 public bus lines in Pasadena that provide access throughout the San Gabriel Valley and Los Angeles areas. These bus lines link Pasadena to downtown Los Angeles and other adjacent communities. The Courtyard by Marriott Pasadena Property is located less than one mile from the nearest MTA station.
The Courtyard by Marriott Pasadena Property has several demand drivers. The property derives the majority of its revenues from the commercial sector (65%), followed by the leisure sector (20%) and meeting and group business (15%). The property is approximately 1.8 miles from Caltech, which is also the largest employer in the City of Pasadena. Caltech is a private research university that is ranked 1st globally in engineering and technology and physical sciences. The Courtyard by Marriott Pasadena Property is located in the heart of the Old Pasadena Historic District. The Old Town Pasadena district is an area of approximately 20 square blocks providing a diverse blend of retail, dining and entertainment opportunities. The Old Town Pasadena area is listed on the National Register of Historic Places and is a redevelopment project of the City of Pasadena. The most widely recognized Pasadena landmark is the Rose Bowl. The Rose Bowl, just 1.7 miles northwest of the property, is located in the northwestern portion of Pasadena and is home to the UCLA football team during the fall season, and is the site of the annual Rose Bowl Game on New Year’s Day.
The subsequent chart presents the primary competitive set to the Courtyard by Marriott Pasadena Property:
Primary Competitive Set(1) | ||||||||||||||||
| Property | Rooms | Year Opened | Approximate Distance | 2014 Occupancy(2) | 2014 ADR(2) | 2014 RevPAR(2) | ||||||||||
| Courtyard by Marriott Pasadena Property | 314 | 2000 | NAP | 88.8% | $162.78 | $144.51 | ||||||||||
| Hilton Pasadena | 296 | 1991 | 1.0 miles | 84.0% | $163.00 | $136.92 | ||||||||||
| The Westin Pasadena | 350 | 1990 | 0.5 miles | 91.0% | $181.00 | $164.71 | ||||||||||
| Sheraton Pasadena | 311 | 1975 | 0.9 miles | 84.0% | $132.00 | $110.88 | ||||||||||
| dusitD2 Constance Pasadena | 130 | 2014 | 1.4 miles | 20.0% | $200.00 | $40.00 | ||||||||||
| Total / Wtd. Avg. | 1,401 | 80.9% | $164.00 | $130.79 | ||||||||||||
| (1) | Source: Appraisal. |
| (2) | 2014 Occupancy, 2014 ADR and 2014 RevPAR represent estimates from the appraisal. The minor variances between the underwriting, the hospitality research report and the above table with respect to 2014 Occupancy, 2014 ADR and 2014 RevPAR at the Courtyard by Marriott Pasadena Property are attributable to variances in reporting methodologies and/or timing differences. |
The appraiser determined demand segmentation of 65% commercial, 15% meeting and group and 20% leisure travel for the Courtyard by Marriott Pasadena Property, compared to an average of 65% commercial, 18% meeting and group and 17% leisure travel for the primary competitive set. The market demand mix is presented in the table below:
Demand Segmentation(1) | |||||||||
| Property | Rooms | Commercial | Meeting and Group | Leisure | |||||
| Courtyard by Marriott Pasadena Property | 314 | 65% | 15% | 20% | |||||
| Hilton Pasadena | 296 | 65% | 20% | 15% | |||||
| The Westin Pasadena | 350 | 60% | 20% | 20% | |||||
| Sheraton Pasadena | 311 | 70% | 20% | 10% | |||||
| dusitD2 Constance Pasadena | 130 | 70% | 10% | 20% | |||||
| Total / Wtd. Avg. | 1,401 | 65% | 18% | 17% | |||||
| (1) | Source: Appraisal. |
THE INFORMATION IN THIS STRUCTURAL AND COLLATERAL TERM SHEET IS NOT COMPLETE AND MAY BE AMENDED PRIOR TO THE TIME OF SALE. THIS TERM SHEET IS NOT AN OFFER TO SELL THESE SECURITIES AND IT IS NOT A SOLICITATION OF AN OFFER TO BUY THESE SECURITIES IN ANY JURISDICTION WHERE THE OFFER OR SALE IS NOT PERMITTED.
| 33 |
180 North Fair Oaks Avenue Pasadena, CA 91103 | Collateral Asset Summary – Loan No. 2 Courtyard by Marriott Pasadena | Cut-off Date Balance: Cut-off Date LTV: U/W NCF DSCR: U/W NOI Debt Yield: | $73,750,000 70.9% 1.70x 11.4% |
Cash Flow Analysis.
| Cash Flow Analysis | |||||||||||||||
| 2011 | 2012 | 2013 | 2014 | T-12 4/30/2015 | U/W | U/W per Room | |||||||||
| Occupancy | 80.8% | 87.6% | 90.2% | 88.8% | 90.6% | 90.6% | |||||||||
| ADR | $143.57 | $147.85 | $150.00 | $162.78 | $165.81 | $165.81 | |||||||||
| RevPAR | $116.01 | $129.51 | $135.31 | $144.51 | $150.14 | $150.14 | |||||||||
| Room Revenue | $13,296,235 | $14,883,269 | $15,508,096 | $16,561,749 | $17,207,389 | $17,207,389 | $54,801 | ||||||||
| F&B Revenue | 1,424,729 | 1,636,845 | 1,680,920 | 1,708,923 | 1,765,865 | 1,765,865 | 5,624 | ||||||||
| Other Revenue | 454,767 | 567,868 | 544,790 | 535,394 | 519,396 | 519,396 | 1,654 | ||||||||
| Total Revenue | $15,175,731 | $17,087,982 | $17,733,806 | $18,806,065 | $19,492,650 | $19,492,650 | $62,079 | ||||||||
| Operating Expenses | 3,511,512 | 3,859,894 | 4,016,890 | 4,129,537 | 4,160,978 | 4,160,978 | 13,252 | ||||||||
| Undistributed Expenses | 3,898,297 | 4,284,634 | 4,631,321 | 5,047,400 | 5,355,543 | 5,355,543 | 17,056 | ||||||||
| Gross Operating Profit | $7,765,922 | $8,943,454 | $9,085,595 | $9,629,128 | $9,976,129 | $9,976,129 | $31,771 | ||||||||
Management Fee(1) | 857,060 | 959,355 | 997,257 | 609,039 | 584,779 | 584,779 | 1,862 | ||||||||
| Total Fixed Charges | 930,650 | 1,007,489 | 981,186 | 988,896 | 956,361 | 946,985 | 3,016 | ||||||||
| Net Operating Income | $5,978,212 | $6,976,610 | $7,107,152 | $8,031,193 | $8,434,989 | $8,444,365 | $26,893 | ||||||||
FF&E(2) | 0 | 0 | 0 | 0 | 0 | 779,706 | 2,483 | ||||||||
| Net Cash Flow | $5,978,212 | $6,976,610 | $7,107,152 | $8,031,193 | $8,434,989 | $7,664,659 | $24,410 | ||||||||
| (1) | U/W Management Fee is 3.0% of gross revenues. |
| (2) | U/W FF&E represents 4.0% of gross revenues. |
Property Management. The Courtyard by Marriott Pasadena Property is managed by Dimension Development Two, LLC.
Lockbox / Cash Management. The Courtyard by Marriott Pasadena Loan is structured with a hard lockbox and springing cash management. All rents and other payments are required to be deposited directly into a clearing account controlled by lender, except to the extent borrower receives any rents in which case borrower shall deposit such rents into the clearing account within 2 days of receipt. Unless a Trigger Period (as defined herein) is ongoing, all amounts on deposit in the clearing account will be swept daily into the borrower’s account. During a Trigger Period, all amounts on deposit in the clearing account will be swept daily into an account controlled by the lender.
A “Trigger Period” will commence (i) upon an event of default or (ii) during a Low Debt Service Period (as defined herein).
A “Low Debt Service Period” will occur if the debt service coverage ratio for the trailing 12-month period is less than 1.15x on the last day of any calendar quarter and will end if the debt service coverage ratio is at least 1.20x for two consecutive quarters.
Initial Reserves. At closing, the borrower deposited (i) $172,459 into a tax reserve account and (ii) $2,500 into a comfort letter transfer reserve account.
Ongoing Reserves. On a monthly basis, the borrower is required to deposit monthly reserves of (i) 1/12 of the estimated annual real estate taxes, which currently equates to $57,486, into a tax reserve account and (ii) the greater of (a) 4.0% of the property’s prior months gross revenues, (b) any amount required under the management agreement and (c) any amount required under the franchise agreement for FF&E work. In addition, the borrower is required to deposit 1/12 of the estimated annual insurance premiums into an insurance reserve account if an acceptable blanket policy is no longer in place.
Current Mezzanine or Subordinate Indebtedness. None.
Future Mezzanine or Subordinate Indebtedness Permitted. None.
THE INFORMATION IN THIS STRUCTURAL AND COLLATERAL TERM SHEET IS NOT COMPLETE AND MAY BE AMENDED PRIOR TO THE TIME OF SALE. THIS TERM SHEET IS NOT AN OFFER TO SELL THESE SECURITIES AND IT IS NOT A SOLICITATION OF AN OFFER TO BUY THESE SECURITIES IN ANY JURISDICTION WHERE THE OFFER OR SALE IS NOT PERMITTED.
| 34 |
180 North Fair Oaks Avenue Pasadena, CA 91103 | Collateral Asset Summary – Loan No. 2 Courtyard by Marriott Pasadena | Cut-off Date Balance: Cut-off Date LTV: U/W NCF DSCR: U/W NOI Debt Yield: | $73,750,000 70.9% 1.70x 11.4% |
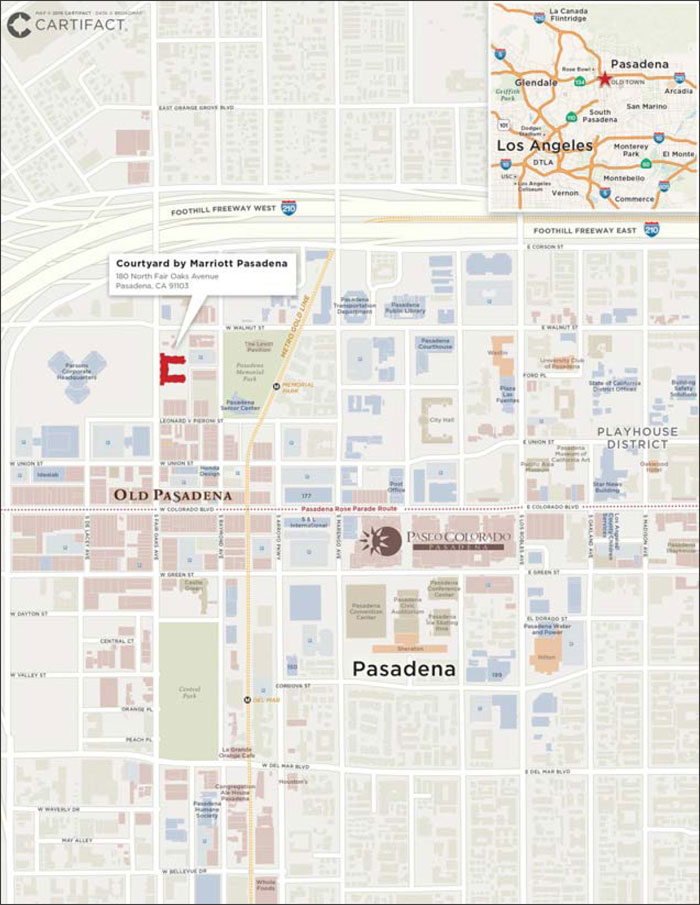
THE INFORMATION IN THIS STRUCTURAL AND COLLATERAL TERM SHEET IS NOT COMPLETE AND MAY BE AMENDED PRIOR TO THE TIME OF SALE. THIS TERM SHEET IS NOT AN OFFER TO SELL THESE SECURITIES AND IT IS NOT A SOLICITATION OF AN OFFER TO BUY THESE SECURITIES IN ANY JURISDICTION WHERE THE OFFER OR SALE IS NOT PERMITTED.
| 35 |
1401-1405 South Hanley Road & 8532 Musick Memorial Drive Brentwood, MO 63144 | Collateral Asset Summary – Loan No. 3 Meridian at Brentwood | Cut-off Date Balance: Cut-off Date LTV: U/W NCF DSCR: U/W NOI Debt Yield: | $42,300,000 73.2% 1.42x 9.2% |
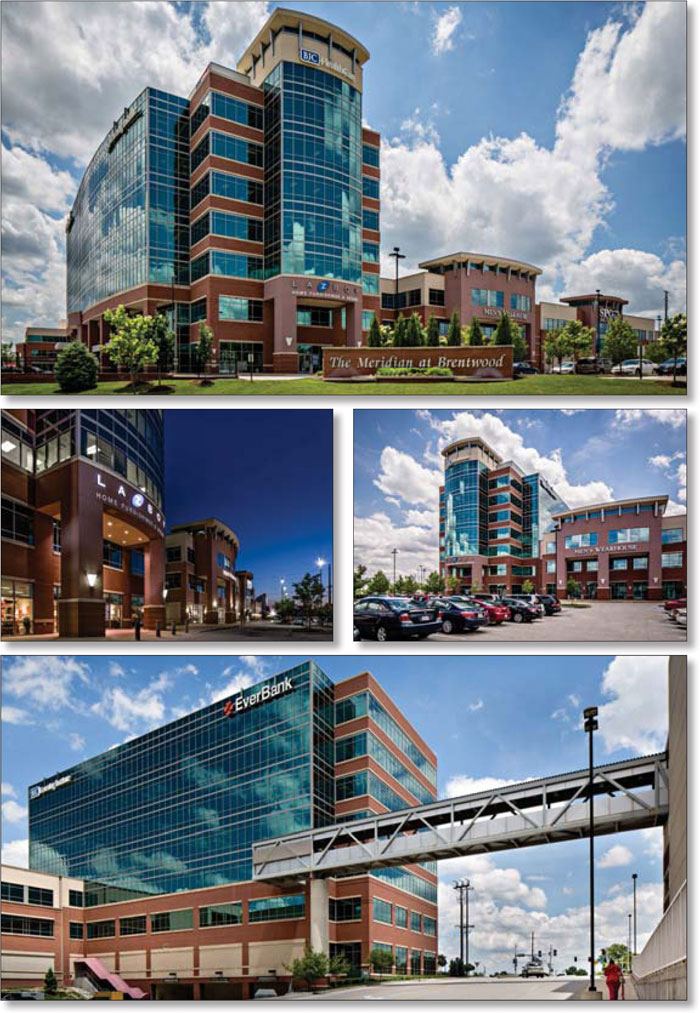
THE INFORMATION IN THIS STRUCTURAL AND COLLATERAL TERM SHEET IS NOT COMPLETE AND MAY BE AMENDED PRIOR TO THE TIME OF SALE. THIS TERM SHEET IS NOT AN OFFER TO SELL THESE SECURITIES AND IT IS NOT A SOLICITATION OF AN OFFER TO BUY THESE SECURITIES IN ANY JURISDICTION WHERE THE OFFER OR SALE IS NOT PERMITTED.
| 36 |
1401-1405 South Hanley Road & 8532 Musick Memorial Drive Brentwood, MO 63144 | Collateral Asset Summary – Loan No. 3 Meridian at Brentwood | Cut-off Date Balance: Cut-off Date LTV: U/W NCF DSCR: U/W NOI Debt Yield: | $42,300,000 73.2% 1.42x 9.2% |
| Mortgage Loan Information | |
| Loan Seller: | GACC |
| Loan Purpose: | Refinance |
| Sponsor: | Adolphus A. Busch IV; Don C. Musick III; Alan R. Skop |
| Borrower: | Eager Road Associates Northeast II, L.L.C. |
| Original Balance: | $42,300,000 |
| Cut-off Date Balance: | $42,300,000 |
| % by Initial UPB: | 3.2% |
| Interest Rate: | 4.2500% |
| Payment Date: | 6th of each month |
| First Payment Date: | May 6, 2015 |
| Maturity Date: | January 6, 2026 |
| Amortization: | Interest only for first 30 months; 360 months thereafter |
| Additional Debt: | None |
| Call Protection: | L(26), D(96), O(7) |
| Lockbox / Cash Management: | Hard / Springing |
Reserves(1) | ||
| Initial | Monthly | |
| Taxes: | $307,895 | $76,974 |
| Insurance: | $37,541 | $9,385 |
| Replacement: | $0 | $3,028 |
| TI/LC: | $0 | $28,418 |
| Lease Sweep: | $0 | Springing |
| Financial Information | ||
| Cut-off Date Balance / Sq. Ft.: | $175 | |
| Balloon Balance / Sq. Ft.: | $147 | |
| Cut-off Date LTV: | 73.2% | |
| Balloon LTV: | 61.7% | |
Underwritten NOI DSCR(2): | 1.57x | |
Underwritten NCF DSCR(2): | 1.42x | |
| Underwritten NOI Debt Yield: | 9.2% | |
| Underwritten NCF Debt Yield: | 8.4% | |
| Underwritten NOI Debt Yield at Balloon: | 11.0% | |
| Underwritten NCF Debt Yield at Balloon: | 9.9% | |
| Property Information | |
| Single Asset / Portfolio: | Single Asset |
| Property Type: | Office / Retail |
| Collateral: | Fee Simple |
| Location: | Brentwood, MO |
| Year Built / Renovated: | 2008 / NAP |
| Total Sq. Ft.: | 242,235 |
| Property Management: | DCM Group |
| Underwritten NOI: | $3,910,909 |
| Underwritten NCF: | $3,533,558 |
| Appraised Value: | $57,800,000 |
| Appraisal Date: | October 14, 2014 |
| Historical NOI | |
| 2014 NOI: | $4,116,170 (December 31, 2014) |
| 2013 NOI: | $4,062,682 (December 31, 2013) |
| 2012 NOI: | $3,727,021 (December 31, 2012) |
| Historical Occupancy | |
| 2014 Occupancy: | 100.0% (December 31, 2014) |
| 2013 Occupancy: | 99.0% (December 31, 2013) |
| 2012 Occupancy: | 99.0% (December 31, 2012) |
| (1) | See “Initial Reserves” and “Ongoing Reserves” herein. |
| (2) | Based on amortizing payments. Based on the current interest only debt service payments, the Underwritten NOI DSCR and Underwritten NCF DSCR are 2.15x and 1.94x, respectively. |
THE INFORMATION IN THIS STRUCTURAL AND COLLATERAL TERM SHEET IS NOT COMPLETE AND MAY BE AMENDED PRIOR TO THE TIME OF SALE. THIS TERM SHEET IS NOT AN OFFER TO SELL THESE SECURITIES AND IT IS NOT A SOLICITATION OF AN OFFER TO BUY THESE SECURITIES IN ANY JURISDICTION WHERE THE OFFER OR SALE IS NOT PERMITTED.
| 37 |
1401-1405 South Hanley Road & 8532 Musick Memorial Drive Brentwood, MO 63144 | Collateral Asset Summary – Loan No. 3 Meridian at Brentwood | Cut-off Date Balance: Cut-off Date LTV: U/W NCF DSCR: U/W NOI Debt Yield: | $42,300,000 73.2% 1.42x 9.2% |
| Tenant Summary | |||||||
Tenant | Ratings (Fitch/Moody’s/S&P)(1) | Net Rentable Area (Sq. Ft.) | % of Net Rentable Area | U/W Base Rent PSF | % of Total U/W Base Rent | Lease Expiration | |
| Office Tenants | |||||||
BJC Health System(2) | NR/Aa2/NR | 138,144 | 57.0% | $23.17 | 57.0% | 12/31/2025 | |
Missouri College(3) | NR/NR/NR | 39,161 | 16.2% | $21.81 | 15.2% | 12/31/2018 | |
EverBank(4) | NR/NR/NR | 19,647 | 8.1% | $29.00 | 10.2% | 9/30/2017 | |
| Labarge Coatings | NR/NR/NR | 6,974 | 2.9% | $27.00 | 3.4% | 1/31/2016 | |
| DCM Group | NR/NR/NR | 3,073 | 1.3% | $27.00 | 1.5% | 2/28/2019 | |
| Subtotal / Wtd. Avg. | 206,999 | 85.5% | $23.65 | 87.2% | |||
| Retail Tenants | |||||||
La-Z-Boy(5) | NR/NR/NR | 13,439 | 5.5% | $22.00 | 5.3% | 11/30/2022 | |
Club Fitness(6) | NR/NR/NR | 8,650 | 3.6% | $11.00 | 1.7% | 10/31/2021 | |
AAA(7) | NR/NR/NR | 8,471 | 3.5% | $23.02 | 3.5% | 3/31/2021 | |
| Massage Luxe | NR/NR/NR | 2,914 | 1.2% | $30.50 | 1.6% | 1/31/2020 | |
| Royal Smoothie | NR/NR/NR | 1,762 | 0.7% | $24.00 | 0.8% | 3/17/2020 | |
| Subtotal / Wtd. Avg. | 35,236 | 14.5% | $20.35 | 12.8% | |||
| Total Occupied Collateral | 242,235 | 100.0% | $23.17 | 100.0% | |||
| Vacant | 0 | 0.0% | |||||
| Total | 242,235 | 100.0% | |||||
| (1) | Certain ratings are those of the parent company whether or not the parent company guarantees the lease. |
| (2) | BJC Health System has one ten-year renewal option upon written notice no later than nine months prior to the lease expiration date of December 31, 2025. The tenant has no termination options. |
| (3) | Missouri College has two five-year renewal options upon written notice no later than six months prior to the lease expiration date of December 31, 2018. Missouri College has the ongoing right to terminate 3,173 sq. ft. upon 90 days written notice and payment of a termination fee equivalent to 50% of the sum of the unamortized portion of the tenant’s TI/LC allowance relating to the 3,173 sq. ft. expansion space and all unamortized brokerage commissions paid by the landlord in connection with the 3,173 sq. ft. expansion space. |
| (4) | EverBank has two five-year extension options upon written notice no later than six months prior to the lease expiration date of September 30, 2017. The tenant has no termination options. |
| (5) | La-Z-Boy has two five-year extension options upon written notice no later than six months prior to the lease expiration date of November 30, 2022. The tenant has no termination options. |
| (6) | Club Fitness has two five-year extension options upon written notice no later than six months prior to the lease expiration date of October 31, 2021. The tenant has no termination options. |
| (7) | AAA has two five-year extension options upon written notice no later than four months prior to the lease expiration date of March 31, 2021. The tenant has no termination options. |
THE INFORMATION IN THIS STRUCTURAL AND COLLATERAL TERM SHEET IS NOT COMPLETE AND MAY BE AMENDED PRIOR TO THE TIME OF SALE. THIS TERM SHEET IS NOT AN OFFER TO SELL THESE SECURITIES AND IT IS NOT A SOLICITATION OF AN OFFER TO BUY THESE SECURITIES IN ANY JURISDICTION WHERE THE OFFER OR SALE IS NOT PERMITTED.
| 38 |
1401-1405 South Hanley Road & 8532 Musick Memorial Drive Brentwood, MO 63144 | Collateral Asset Summary – Loan No. 3 Meridian at Brentwood | Cut-off Date Balance: Cut-off Date LTV: U/W NCF DSCR: U/W NOI Debt Yield: | $42,300,000 73.2% 1.42x 9.2% |
Lease Rollover Schedule(1) | ||||||||
| Year | # of Leases Expiring | Total Expiring Sq. Ft. | % of Total Sq. Ft. Expiring | Cumulative Sq. Ft. Expiring | Cumulative % of Sq. Ft. Expiring | Annual U/W Base Rent PSF | % U/W Base Rent Rolling | Cumulative % of U/W Base Rent |
| MTM | 0 | 0 | 0.0% | 0 | 0.0% | $0.00 | 0.0% | 0.0% |
| 2015 | 0 | 0 | 0.0% | 0 | 0.0% | $0.00 | 0.0% | 0.0% |
| 2016 | 1 | 6,974 | 2.9% | 6,974 | 2.9% | $27.00 | 3.4% | 3.4% |
| 2017 | 1 | 19,647 | 8.1% | 26,621 | 11.0% | $29.00 | 10.2% | 13.5% |
| 2018 | 1 | 39,161 | 16.2% | 65,782 | 27.2% | $21.81 | 15.2% | 28.7% |
| 2019 | 1 | 3,073 | 1.3% | 68,855 | 28.4% | $27.00 | 1.5% | 30.2% |
| 2020 | 2 | 4,676 | 1.9% | 73,531 | 30.4% | $28.05 | 2.3% | 32.5% |
| 2021 | 2 | 17,121 | 7.1% | 90,652 | 37.4% | $16.95 | 5.2% | 37.7% |
| 2022 | 1 | 13,439 | 5.5% | 104,091 | 43.0% | $22.00 | 5.3% | 43.0% |
| 2023 | 0 | 0 | 0.0% | 104,091 | 43.0% | $0.00 | 0.0% | 43.0% |
| 2024 | 0 | 0 | 0.0% | 104,091 | 43.0% | $0.00 | 0.0% | 43.0% |
| 2025 | 1 | 138,144 | 57.0% | 242,235 | 100.0% | $23.17 | 57.0% | 100.0% |
| 2026 | 0 | 0 | 0.0% | 242,235 | 100.0% | $0.00 | 0.0% | 100.0% |
| Thereafter | 0 | 0 | 0.0% | 242,235 | 100.0% | $0.00 | 0.0% | 100.0% |
| Vacant | NAP | 0 | 0.0% | 242,235 | 100.0% | NAP | NAP | |
| Total / Wtd. Avg. | 10 | 242,235 | 100.0% | $23.17 | 100.0% | |||
| (1) | Certain tenants have lease termination options that may become exercisable prior to the originally stated expiration date of the tenant lease and that are not considered in the lease rollover schedule or the stacking plan. |
The Loan. The Meridian at Brentwood loan (the “Meridian at Brentwood Loan”) is a fixed rate loan secured by the borrower’s fee simple interest in two Class A, mixed use buildings and a parking garage totaling 242,235 sq. ft. with office and retail tenants located at 1401-1405 South Hanley Road and 8532 Musick Memorial Drive in Brentwood, Missouri (the “Meridian at Brentwood Property”) with an original principal balance of $42.3 million. The Meridian at Brentwood Loan has a 10-year and 9-month term and is interest only for the first 30 months of the term and amortizes on a 30-year schedule thereafter. The Meridian at Brentwood Loan accrues interest at a fixed rate equal to 4.2500% and has a cut-off date balance of $42.3 million. Loan proceeds were used to pay off existing debt of approximately of $39.7 million, fund upfront reserves of approximately $0.3 million, pay closing costs of approximately $1.4 million and return approximately $0.8 million of equity to the borrower. Based on the appraised value of $57.8 million as of October 14, 2014, the cut-off date LTV is 73.2%. The most recent financing of the Meridian at Brentwood Property was not included in a securitization.
| Sources and Uses | ||||||
| Sources | Proceeds | % of Total | Uses | Proceeds | % of Total | |
| Loan Amount | $42,300,000 | 100.0% | Existing Debt | $39,698,761 | 93.9% | |
| Closing Costs | $1,411,086 | 3.3% | ||||
| Return of Equity | $844,717 | 2.0% | ||||
| Reserves | $345,436 | 0.8% | ||||
| Total Sources | $42,300,000 | 100.0% | Total Uses | $42,300,000 | 100.0% | |
The Borrower / Sponsor. The borrower, Eager Road Associates Northeast II, L.L.C., is a single purpose Delaware limited liability company structured to be bankruptcy-remote, with two independent directors in its organizational structure. The sponsors of the borrower and the nonrecourse carve-out guarantors are Adolphus A. Busch IV, Don C. Musick III and Alan R. Skop, on a joint and several basis.
Don C. Musick III is the Chairman and CEO of Musick Construction Company, a St. Louis based general contractor and construction manager. Don C. Musick III has over 30 years of experience providing construction services to clients such as St. Louis University, Candlewood Hotels, Regions Bank, Anheuser Busch Inc., United Auto Workers and Archdiocese of St. Louis, among others.
Adolphus A. Busch is an owner of Silver Eagle Distributors in Houston, Texas. Silver Eagle Distributors is the nation’s largest distributor of Anheuser-Busch products and the second largest beer distributor in the United States.
Alan R. Skop has over 30 years of experience in the commercial real estate industry, including 18 years as an executive at Equitable Real Estate. During his time at Equitable Real Estate, Alan R. Skop managed over 13 million square feet of commercial real estate across all asset types. Since 2012, Alan R. Skop has worked with Don Musick and Adolphus Busch on the management of the Meridian at Brentwood Property.
THE INFORMATION IN THIS STRUCTURAL AND COLLATERAL TERM SHEET IS NOT COMPLETE AND MAY BE AMENDED PRIOR TO THE TIME OF SALE. THIS TERM SHEET IS NOT AN OFFER TO SELL THESE SECURITIES AND IT IS NOT A SOLICITATION OF AN OFFER TO BUY THESE SECURITIES IN ANY JURISDICTION WHERE THE OFFER OR SALE IS NOT PERMITTED.
| 39 |
1401-1405 South Hanley Road & 8532 Musick Memorial Drive Brentwood, MO 63144 | Collateral Asset Summary – Loan No. 3 Meridian at Brentwood | Cut-off Date Balance: Cut-off Date LTV: U/W NCF DSCR: U/W NOI Debt Yield: | $42,300,000 73.2% 1.42x 9.2% |
The Property. The Meridian at Brentwood Property consists of two Class A, mixed use office and retail buildings and a parking garage located in Brentwood, Missouri approximately 15 miles west of the St. Louis central business district. The sponsors developed the Meridian at Brentwood Property at a total cost of approximately $54.4 million in 2008 adjacent to the Meridian at Brentwood Phase I development that was also developed by the sponsor. The Meridian at Brentwood Phase I development is anchored by Men’s Warehouse, Sports Authority and Best Buy and is not part of the collateral.
The Meridian at Brentwood Property is 100.0% occupied by ten tenants as of December 31, 2014, anchored by BJC Healthcare System, the largest employer in the St. Louis metropolitan statistical area (“St. Louis MSA”). The Meridian at Brentwood Property features 619 covered parking spaces and 95 additional surface parking spaces which equates to a ratio of 2.95 spaces per 1000 sq. ft. The Meridian at Brentwood Property is located in the southwest quadrant of South Hanley Road and Interstate 64, a suburban area with numerous nearby shopping, lifestyle and entertainment amenities. The Meridian at Brentwood Property benefits from frontage on South Hanley Road, one of the most prominent thoroughfares in the St. Louis MSA, which also provides access to the Clayton central business district and Interstate 64.
The Meridian at Brentwood Property is located within the Hanley/Eager redevelopment area. The area is subject to a redevelopment agreement which obligates the Meridian at Brentwood Property owner to, among other things, (i) include in each lease, a provision requiring the tenant to disclose sales tax returns for retail sales in the redevelopment area to the city of Brentwood and (ii) cooperate with the city of Brentwood to correct sales tax returns not properly coded for the redevelopment area. The redevelopment agreement was created in relation to certain tax increment financing (“TIF”) bonds which were issued by the city of Brentwood in December 2014. The TIF bonds are currently held by AAB-DCM, LLC an entity owned by the guarantors of the Meridian at Brentwood Loan. The borrower is not liable for amounts due with respect to the TIF bonds.
Environmental Matters. The Phase I environmental report dated September 23, 2014 recommended no further action at the Meridian at Brentwood Property.
Major Tenants.
BJC Health System (138,144 sq. ft., 57.0% of NRA, 57.0% of U/W Base Rent, rated Aa2 by Moody’s) BJC Health System (“BJC”) is one of the largest non-profit healthcare organizations in the United States and the largest employer in the St. Louis MSA. BJC provides health care services in urban, suburban and rural communities in the greater St. Louis area, southern Illinois and mid-Missouri region with 12 hospitals and multiple community health locations. The Meridian at Brentwood Property houses physician offices, meeting space and seminar facilities and data centers for the BJC network. All of the BJC hospital locations are located within 30 miles, including the headquarters at the Barnes Jewish Hospital campus located approximately five miles to the east. BJC has been a tenant at the Meridian at Brentwood Property since 2009 and the tenant’s lease grants the right to have first refusal to any office/classroom space that becomes available at the Meridian at Brentwood Property. BJC’s lease expires December 31, 2025 and has one ten-year extension option upon nine months written notice. The tenant does not have any termination options.
Missouri College (39,161 sq. ft., 16.2% of NRA, 15.2% of U/W Base Rent) Missouri College is a for-profit college offering Bachelor and Associate degrees in business management, healthcare management, business administration and dental hygiene, among others. Missouri College was founded in 1963 and was acquired by Career Education Corporation (NYSE: CECO) in 2002. Missouri College has been a tenant at the Meridian at Brentwood Property since 2009 and the tenant’s lease expires on December 31, 2018 and has two five-year extension options each upon six months written notice. Missouri College has the ongoing right to terminate 3,173 sq. ft. upon 90 days written notice and payment of a termination fee equivalent to 50% of the sum of the unamortized portion of the tenant’s TI/LC allowance relating to the 3,173 sq. ft. expansion space and all unamortized brokerage commissions paid by the landlord in connection with the 3,173 sq. ft. expansion space.
EverBank (19,647 sq. ft., 8.1% of NRA, 10.2% of U/W Base Rent) EverBank (NYSE: EVER), originally established as First Alliance Bank in 1999, is a diversified financial services company headquartered in Jacksonville, Florida. EverBank offers nationwide lending services across a number of major metropolitan areas in the US. As of December 2014, EverBank had 3,100 full time employees and approximately $21.6 billion of total assets. EverBank’s lease expires on September 30, 2017 and has two five-year extension options each upon six months written notice. The tenant does not have any termination options.
The Market. The Meridian at Brentwood Property is located in the Clayton office submarket approximately 15 miles west of the St. Louis central business district. St. Louis is the 19th largest MSA in the United States with an estimated 2.8 million residents and is home to a diverse employment base with no industry controlling more than 20% of its total employment base. The area is home to nine Fortune 500 corporations, including Express Scripts Holdings Company, Emerson Electric and Monsanto Company, among others. The St. Louis MSA unemployment rate was 6.5% and the median household income for the MSA was $52,482 in 2014.
Brentwood is a suburb of the St. Louis MSA with a 2013 population of 8,032 and a median household income of $68,581. The city of Brentwood has undergone significant redevelopment in recent years, highlighted by the addition of several retail improvements. Notable tenants within a one-mile radius of the Meridian at Brentwood Property include, Nordstrom, Crate & Barrel, REI, Whole Foods, Target, Home Depot and Wal-Mart.
THE INFORMATION IN THIS STRUCTURAL AND COLLATERAL TERM SHEET IS NOT COMPLETE AND MAY BE AMENDED PRIOR TO THE TIME OF SALE. THIS TERM SHEET IS NOT AN OFFER TO SELL THESE SECURITIES AND IT IS NOT A SOLICITATION OF AN OFFER TO BUY THESE SECURITIES IN ANY JURISDICTION WHERE THE OFFER OR SALE IS NOT PERMITTED.
| 40 |
1401-1405 South Hanley Road & 8532 Musick Memorial Drive Brentwood, MO 63144 | Collateral Asset Summary – Loan No. 3 Meridian at Brentwood | Cut-off Date Balance: Cut-off Date LTV: U/W NCF DSCR: U/W NOI Debt Yield: | $42,300,000 73.2% 1.42x 9.2% |
The Meridian at Brentwood Property is located in the Clayton office submarket of the St. Louis MSA. As of year-end 2014, the Clayton office submarket consisted of 32 Class A buildings totaling approximately 5.7 million sq. ft. The Clayton office submarket vacancy across Class A properties was 8.5% with gross rents estimated by CoStar at $25.21 PSF. The appraisal identified eight comparable office properties in the nearby office marketplace, including three with classroom-oriented office space reflective of the Missouri College space. Using both the market comparables and recent leasing, the appraiser identified an office market rent of $21.50 PSF for the BJC office space, $27.00 PSF for the remaining office space and $22.00 PSF for the Missouri College office space. The chart below summarizes the comparable office and flex set as determined by the appraiser.
Summary of Comparable Office Rentals(1) | ||||||
| Name | Year Built | Net Rentable Area (Sq. Ft.) | Comparable Lease (Sq. Ft.) | Comparable Lease Term (Yrs.) | Comparable Lease Base Rent PSF | Comparable Lease Date |
| Meridian at Brentwood Property | 2008 | 242,235 | NAP | NAP | NAP | NAP |
| Interco Corporate Tower | 1986 | 346,451 | 5,700 | 10.3 | $24.10 | 11/2014 |
| Pierre Laclede Center II | 1970 | 360,129 | 30,380 | 10.9 | $26.00 | 10/2014 |
| Bemiston Tower | 1982 | 173,893 | 1,550 | 4.2 | $24.74 | 3/2013 |
| Fifth Third Center | 1983 | 195,772 | 3,280 | 7.4 | $25.00 | 2/2013 |
Total / Wtd. Avg.(2): | 1,076,245 | $25.00 | ||||
| (1) | Source: Appraisal. |
| (2) | Total / Wtd. Avg. excludes the Meridian at Brentwood Property. |
The Meridian at Brentwood Property is located in the Mid County retail submarket in the St. Louis MSA. As of year-end 2014, the Mid County retail submarket consisted of 913 buildings totaling approximately 15.6 million sq. ft. The Mid County retail submarket vacancy was 3.8% with gross rents estimated by CoStar at $17.53 PSF. The appraiser also identified recent retail leases within the immediate submarket of the Meridian at Brentwood Property. The comparable retail rents ranged from $36.00 PSF to $42.00 PSF, with an average of $39.19 PSF. The appraiser concluded market rents of $30.00 PSF for the East Retail space due to superior visibility from South Hanley Road, $23.00 PSF for the North Retail space and $10.00 PSF for the Club Fitness space located on the first floor of the parking garage. The chart below summarizes the comparable retail set as determined by the appraiser.
Cash Flow Analysis.
| Cash Flow Analysis | ||||||
| 2011 | 2012 | 2013 | 2014 | U/W | U/W PSF | |
Base Rent(1) | $4,100,010 | $5,151,685 | $5,269,831 | $5,297,532 | $5,619,245 | $23.20 |
| Value of Vacant Space | 0 | 0 | 0 | 0 | 0 | 0.00 |
| Gross Potential Rent | $4,100,010 | $5,151,685 | $5,269,831 | $5,297,532 | $5,619,245 | $23.20 |
| Total Recoveries | 741,302 | 734,244 | 973,307 | 1,058,100 | 1,020,647 | 4.21 |
| Total Other Income | 0 | 0 | 0 | 0 | 0 | 0.00 |
Less: Vacancy(2) | 0 | 0 | 0 | 0 | (405,752) | (1.68) |
| Effective Gross Income | $4,841,312 | $5,885,929 | $6,243,138 | $6,355,632 | $6,234,140 | $25.74 |
| Total Operating Expenses | 2,077,602 | 2,158,908 | 2,180,456 | 2,239,462 | 2,323,232 | 9.59 |
| Net Operating Income | $2,763,710 | $3,727,021 | $4,062,682 | $4,116,170 | $3,910,909 | $16.15 |
| TI/LC | 0 | 0 | 0 | 0 | 341,015 | 1.41 |
| Capital Expenditures | 0 | 0 | 0 | 0 | 36,335 | 0.15 |
| Net Cash Flow | $2,763,710 | $3,727,021 | $4,062,682 | $4,116,170 | $3,533,558 | $14.59 |
| (1) | U/W Base Rent includes $5,828 in contractual step rents through December 2015. |
| (2) | U/W Vacancy represents 6.1% of total gross income. The Meridian at Brentwood Property is 100.0% leased as of December 31, 2014. |
Property Management. The Meridian at Brentwood Property is managed by DCM Group, a borrower affiliate.
Lockbox / Cash Management. The Meridian at Brentwood Loan is structured with a hard lockbox and springing cash management. All rents and other payments are required to be deposited directly into a clearing account controlled by lender. Unless a Trigger Period (as defined herein) is ongoing, all amounts on deposit in the clearing account will be swept daily into the borrower’s account. During a Trigger Period, all amounts on deposit in the clearing account will be swept daily into the deposit account controlled by the lender and disbursed in accordance with the Meridian at Brentwood Loan documents.
A “Trigger Period” will commence (i) upon an event of default, (ii) if the DSCR is less than 1.20x on the last day of any calendar quarter, or (iii) during a Lease Sweep Period (as defined herein). A Trigger Period will cease to exist when (a) with respect to clause (i) of the definition of “Trigger Period”, such event of default has been cured, (b) with respect to clause (ii) of the definition of “Trigger Period” the
THE INFORMATION IN THIS STRUCTURAL AND COLLATERAL TERM SHEET IS NOT COMPLETE AND MAY BE AMENDED PRIOR TO THE TIME OF SALE. THIS TERM SHEET IS NOT AN OFFER TO SELL THESE SECURITIES AND IT IS NOT A SOLICITATION OF AN OFFER TO BUY THESE SECURITIES IN ANY JURISDICTION WHERE THE OFFER OR SALE IS NOT PERMITTED.
| 41 |
1401-1405 South Hanley Road & 8532 Musick Memorial Drive Brentwood, MO 63144 | Collateral Asset Summary – Loan No. 3 Meridian at Brentwood | Cut-off Date Balance: Cut-off Date LTV: U/W NCF DSCR: U/W NOI Debt Yield: | $42,300,000 73.2% 1.42x 9.2% |
DSCR is at least 1.25x for two consecutive quarters and (c) with respect to clause (iii) of the definition of “Trigger Period”, such Lease Sweep Period has ended.
A “Lease Sweep Period” will commence on the first monthly payment date following (i) January 6, 2025 provided, however, that if, prior to January 6, 2025, the tenant under the BJC Health System lease either exercises its renewal option under the BJC Health System lease (for 10 years and otherwise on the terms set forth in the BJC Health System lease) or extends the term of its lease (on the same terms as are currently set forth in the BJC Health System lease) for at least 24 months beyond the end of the term, then a Lease Sweep Period will not have commenced pursuant to this clause (i), (ii) with respect to each Lease Sweep Lease (as defined herein), (a) the date that is six months prior to the earliest stated expiration (including the stated expiration of any renewal term) of such Lease Sweep Lease, or (b) the date immediately following the date on which the tenant under such Lease Sweep Lease is required to give notice of its exercise of a renewal option there under (and if such renewal has not been so exercised), (iii) the receipt by borrower or property manager of notice from any tenant under a Lease Sweep Lease exercising its right to terminate its Lease Sweep Lease, (iv) the date that a Lease Sweep Lease (or any material portion thereof) is surrendered, cancelled or terminated prior to its then current expiration date or the receipt by borrower or property manager of notice from any tenant under a Lease Sweep Lease of its intent to surrender, cancel or terminate the Lease Sweep Lease (or any material portion thereof prior to its then current expiration date), (v) the date that any tenant under a Lease Sweep Lease discontinues its business (i.e., “goes dark”) or gives notice that it intends to discontinue its business at the Meridian at Brentwood Property, (vi) upon the occurrence of a monetary or material non-monetary default by a tenant under a Lease Sweep Lease that continues (under such tenant’s lease) beyond any applicable notice and cure period or (vii) the occurrence of a lease sweep tenant party insolvency proceeding (as defined in the loan agreement).
A “Lease Sweep Lease” means (i) the Missouri College lease, (ii) the BJC Health System lease and (iii) any replacement lease or leases that, either individually or when taken together with any other lease with the same tenant or its affiliates, and assuming the exercise of all expansion rights, covers 35,000 or more rentable square feet.
Initial Reserves. At closing, the borrower deposited (i) $307,895 into a tax reserve account and (ii) $37,541 into an insurance reserve account.
Ongoing Reserves. On a monthly basis, the borrower is required to deposit reserves of (i) 1/12 of the estimated annual real estate taxes, currently estimated at approximately to $76,974, into a tax reserve account, (ii) 1/12 of the estimated annual insurance premiums, currently estimated at approximately $9,385, into an insurance reserve account, (iii) $28,418 into a TI/LC reserve account, subject to an initial TI/LC reserve cap equal to $630,000 and (iv) $3,028 into a replacement reserve account. On each monthly payment date during a Lease Sweep Period, the borrower is required to deposit all excess cash into a lease sweep reserve account. From and after the date which the Missouri College lease is renewed, the TI/LC reserve account cap is required to be reduced to $315,000.
Current Mezzanine or Subordinate Indebtedness. None.
Future Mezzanine or Subordinate Indebtedness Permitted. None.
THE INFORMATION IN THIS STRUCTURAL AND COLLATERAL TERM SHEET IS NOT COMPLETE AND MAY BE AMENDED PRIOR TO THE TIME OF SALE. THIS TERM SHEET IS NOT AN OFFER TO SELL THESE SECURITIES AND IT IS NOT A SOLICITATION OF AN OFFER TO BUY THESE SECURITIES IN ANY JURISDICTION WHERE THE OFFER OR SALE IS NOT PERMITTED.
| 42 |
1401-1405 South Hanley Road & 8532 Musick Memorial Drive Brentwood, MO 63144 | Collateral Asset Summary – Loan No. 3 Meridian at Brentwood | Cut-off Date Balance: Cut-off Date LTV: U/W NCF DSCR: U/W NOI Debt Yield: | $42,300,000 73.2% 1.42x 9.2% |
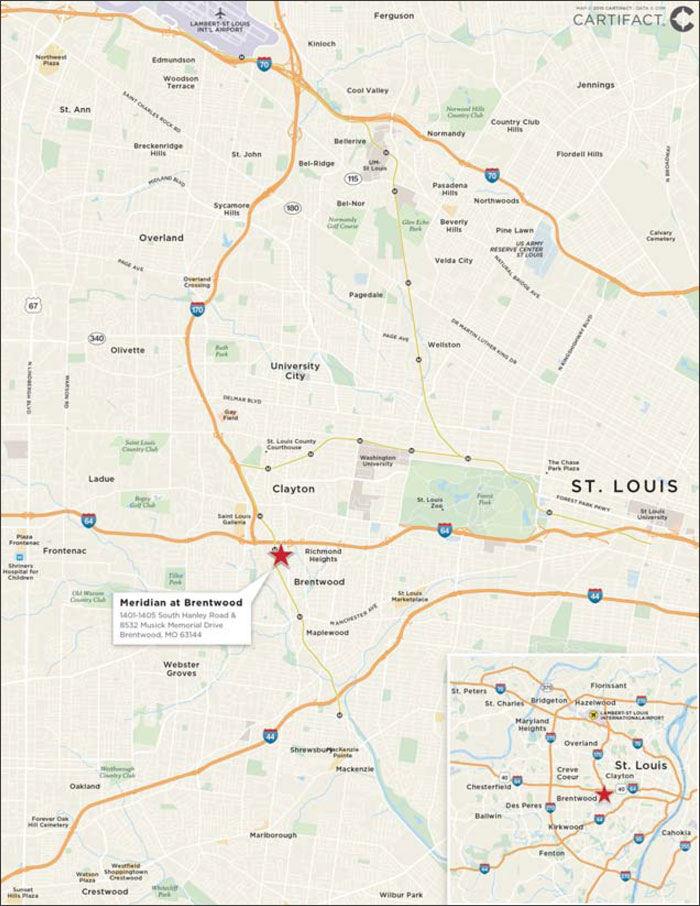
THE INFORMATION IN THIS STRUCTURAL AND COLLATERAL TERM SHEET IS NOT COMPLETE AND MAY BE AMENDED PRIOR TO THE TIME OF SALE. THIS TERM SHEET IS NOT AN OFFER TO SELL THESE SECURITIES AND IT IS NOT A SOLICITATION OF AN OFFER TO BUY THESE SECURITIES IN ANY JURISDICTION WHERE THE OFFER OR SALE IS NOT PERMITTED.
| 43 |
155 Mercer Street New York, NY 10012 | Collateral Asset Summary – Loan No. 4 155 Mercer Street | Cut-off Date Balance: Cut-off Date LTV: U/W NCF DSCR: U/W NOI Debt Yield: | $41,000,000 63.1% 1.57x 7.3% |
| Mortgage Loan Information | |
| Loan Seller: | CCRE |
| Loan Purpose: | Refinance |
Sponsor(1): | Joseph J. Sitt |
| Borrower: | RVART Owner LLC; Jensen 155 Mercer Owner LLC |
| Original Balance: | $41,000,000 |
| Cut-off Date Balance: | $41,000,000 |
| % by Initial UPB: | 3.1% |
| Interest Rate: | 4.4920% |
| Payment Date: | 6th of each month |
| First Payment Date: | June 6, 2015 |
| Maturity Date: | May 6, 2025 |
| Amortization: | Interest Only |
| Additional Debt: | None |
| Call Protection: | L(25), D(90), O(5) |
| Lockbox / Cash Management: | Hard / In Place |
Reserves(2) | ||
| Initial | Monthly | |
| Taxes: | $0 | Springing |
| Insurance: | $0 | Springing |
| Replacement: | $0 | $182 |
| Required Repairs: | $35,200 | NAP |
Work Permit(3): | $2,000,000 | $0 |
Rent Abatement(4): | $1,691,667 | $0 |
| Tenant Allowance: | $250,000 | $0 |
| DG Rollover: | $0 | Springing |
| Financial Information | ||
| Cut-off Date Balance / Sq. Ft.: | $2,810 | |
| Balloon Balance / Sq. Ft.: | $2,810 | |
| Cut-off Date LTV: | 63.1% | |
| Balloon LTV: | 63.1% | |
| Underwritten NOI DSCR: | 1.61x | |
| Underwritten NCF DSCR: | 1.57x | |
| Underwritten NOI Debt Yield: | 7.3% | |
| Underwritten NCF Debt Yield: | 7.2% | |
| Underwritten NOI Debt Yield at Balloon: | 7.3% | |
| Underwritten NCF Debt Yield at Balloon: | 7.2% | |
| Property Information | |
| Single Asset / Portfolio: | Single Asset |
| Property Type: | Single Tenant Retail |
| Collateral: | Fee Simple |
| Location: | New York, NY |
| Year Built / Renovated: | 1854 / 2015 |
| Total Sq. Ft.: | 14,589 |
| Property Management: | Thor Management Company LLC |
| Underwritten NOI: | $3,011,713 |
| Underwritten NCF: | $2,936,580 |
Appraised Value(5): | $65,000,000 |
| Appraisal Date: | March 1, 2015 |
Historical NOI(6) | |
| 2014 NOI: | NAP |
| 2013 NOI: | NAP |
| 2012 NOI: | NAP |
Historical Occupancy(6) | |
| Most Recent Occupancy: | 100.0% (June 6, 2015) |
| 2014 Occupancy | NAP |
| 2013 Occupancy: | NAP |
| 2012 Occupancy: | NAP |
| (1) | The sponsor is also the sponsor under the mortgage loans identified on Annex A-1 to this Free Writing Prospectus as 26-34 South State Street, which has a Cut-off Date Balance of $24,000,000 and 36 South State Street, which has a Cut-off Date Balance of $16,800,000. |
| (2) | See “Initial Reserves” and “Ongoing Reserves” herein. |
| (3) | The borrowers deposited $2.0 million into a work permit reserve, which amount represents the allowance borrowers are obligated to pay tenant upon tenant’s completion of special permit work required to convert and re-zone the 155 Mercer Street Property to full retail as described in “The Property” herein. |
| (4) | The borrowers deposited $1,691,667 into a rent abatement reserve, which amount will be held by lender in full until Dolce & Gabbana commences paying rent and conducting normal business operations at the entire 155 Mercer Street Property. |
| (5) | The appraiser also concluded a hypothetical “Go Dark” appraised value of $60.0 million and land value of $50.0 million, which results in a cut-off date loan-to-dark value ratio of 68.3% and cut-off date loan-to-land value ratio of 82.0%. |
| (6) | The borrowers acquired the 155 Mercer Street Property in July 2012 and subsequently executed a lease with Dolce & Gabbana in December 2012, which lease expires November 30, 2022. Under the lease, Dolce & Gabbana is obligated to commence rent payments by December 1, 2015. Dolce & Gabbana is not yet in occupancy and is currently in the process of converting the 155 Mercer Street Property to full retail. As a result, Historical NOI and Historical Occupancy are not applicable. |
THE INFORMATION IN THIS STRUCTURAL AND COLLATERAL TERM SHEET IS NOT COMPLETE AND MAY BE AMENDED PRIOR TO THE TIME OF SALE. THIS TERM SHEET IS NOT AN OFFER TO SELL THESE SECURITIES AND IT IS NOT A SOLICITATION OF AN OFFER TO BUY THESE SECURITIES IN ANY JURISDICTION WHERE THE OFFER OR SALE IS NOT PERMITTED.
| 44 |
155 Mercer Street New York, NY 10012 | Collateral Asset Summary – Loan No. 4 155 Mercer Street | Cut-off Date Balance: Cut-off Date LTV: U/W NCF DSCR: U/W NOI Debt Yield: | $41,000,000 63.1% 1.57x 7.3% |
| Tenant Summary | |||||||
Tenant | Ratings (Fitch/Moody’s/S&P) | Net Rentable Area (Sq. Ft.) | % of Net Rentable Area | U/W Base Rent PSF(1) | % of Total U/W Base Rent | Lease Expiration(2) | |
| Dolce & Gabbana | NR/NR/NR | 14,589 | 100.0% | $217.59 | 100.0% | 11/30/2022 | |
| Total Occupied Collateral | 14,589 | 100.0% | $217.59 | 100.0% | |||
| Vacant | 0 | 0.0% | |||||
| Total | 14,589 | 100.0% | |||||
| (1) | U/W Base Rent PSF represents Dolce & Gabbana’s average triple-net base rent over the seven-year lease term. The current annual rent at the 155 Mercer Street Property due during the first year following rent commencement is $198.78 PSF with 3.0% contractual annual increases. The appraiser concluded a market rent of $236.58 PSF |
| (2) | The 155 Mercer Street Loan is structured with a cash flow sweep related to the lease expiration. See “Ongoing Reserves” herein. Dolce & Gabanna does not have any renewal or termination options. |
| Lease Rollover Schedule | |||||||||||||||||
| Year | # of Leases Expiring | Total Expiring Sq. Ft. | % of Total Sq. Ft. Expiring | Cumulative Sq. Ft. Expiring | Cumulative % of Sq. Ft. Expiring | Annual U/W Base Rent PSF(1) | % U/W Base Rent Rolling | Cumulative % of U/W Base Rent | |||||||||
| MTM | 0 | 0 | 0.0% | 0 | 0.0% | $0.00 | 0.0% | 0.0% | |||||||||
| 2015 | 0 | 0 | 0.0% | 0 | 0.0% | $0.00 | 0.0% | 0.0% | |||||||||
| 2016 | 0 | 0 | 0.0% | 0 | 0.0% | $0.00 | 0.0% | 0.0% | |||||||||
| 2017 | 0 | 0 | 0.0% | 0 | 0.0% | $0.00 | 0.0% | 0.0% | |||||||||
| 2018 | 0 | 0 | 0.0% | 0 | 0.0% | $0.00 | 0.0% | 0.0% | |||||||||
| 2019 | 0 | 0 | 0.0% | 0 | 0.0% | $0.00 | 0.0% | 0.0% | |||||||||
| 2020 | 0 | 0 | 0.0% | 0 | 0.0% | $0.00 | 0.0% | 0.0% | |||||||||
| 2021 | 0 | 0 | 0.0% | 0 | 0.0% | $0.00 | 0.0% | 0.0% | |||||||||
2022(2) | 1 | 14,589 | 100.0% | 14,589 | 100.0% | $217.59 | 100.0% | 100.0% | |||||||||
| 2023 | 0 | 0 | 0.0% | 14,589 | 100.0% | $0.00 | 0.0% | 100.0% | |||||||||
| 2024 | 0 | 0 | 0.0% | 14,589 | 100.0% | $0.00 | 0.0% | 100.0% | |||||||||
| 2025 | 0 | 0 | 0.0% | 14,589 | 100.0% | $0.00 | 0.0% | 100.0% | |||||||||
| Thereafter | 0 | 0 | 0.0% | 14,589 | 100.0% | $0.00 | 0.0% | 100.0% | |||||||||
| Vacant | NAP | 0 | 0.0% | 14,589 | 100.0% | NAP | NAP | ||||||||||
| Total / Wtd. Avg. | 1 | 14,589 | 100.0% | $217.59 | 100.0% | ||||||||||||
| (1) | Annual U/W Base Rent PSF represents Dolce & Gabbana’s average triple-net base rent over the seven-year lease term. The current annual rent at the 155 Mercer Street Property due during the first year following rent commencement is $198.78 PSF with 3.0% contractual annual increases. The appraiser concluded a market rent of $236.58 PSF |
| (2) | Dolce & Gabbana’s lease expires in November 2022. The 155 Mercer Street Loan is structured with a cash flow sweep related to the lease expiration. See “Ongoing Reserves” herein. |
The Loan. The 155 Mercer Street loan (the “155 Mercer Street Loan”) is a $41.0 million fixed rate loan secured by the borrower’s fee simple interest in a three-story retail building totaling 14,589 sq. ft. of net rentable area located in New York, New York (the “155 Mercer Street Property”). The 155 Mercer Street Loan has a 10-year interest only term and accrues interest at a fixed rate equal to 4.4920%. Loan proceeds were used to retire existing debt of approximately $27.2 million, fund reserves of approximately $4.0 million, pay closing costs of approximately $1.1 million and return approximately $8.8 million of equity to the sponsor. Based on the appraised value of $65.0 million as of March 1, 2015, the cut-off date LTV ratio is 63.1% with an implied equity of $24.0 million. The appraiser also concluded a hypothetical “Go Dark” appraised value of $60.0 million and land value of $50.0 million, which results in a cut-off date loan-to-dark value ratio of 68.3% and cut-off date loan-to-land value ratio of 82.0%. The most recent financing of the 155 Mercer Street Loan was not included in a securitization.
THE INFORMATION IN THIS STRUCTURAL AND COLLATERAL TERM SHEET IS NOT COMPLETE AND MAY BE AMENDED PRIOR TO THE TIME OF SALE. THIS TERM SHEET IS NOT AN OFFER TO SELL THESE SECURITIES AND IT IS NOT A SOLICITATION OF AN OFFER TO BUY THESE SECURITIES IN ANY JURISDICTION WHERE THE OFFER OR SALE IS NOT PERMITTED.
| 45 |
155 Mercer Street New York, NY 10012 | Collateral Asset Summary – Loan No. 4 155 Mercer Street | Cut-off Date Balance: Cut-off Date LTV: U/W NCF DSCR: U/W NOI Debt Yield: | $41,000,000 63.1% 1.57x 7.3% |
| Sources and Uses | ||||||
| Sources | Proceeds | % of Total | Uses | Proceeds | % of Total | |
| Loan Amount | $41,000,000 | 100.0% | Loan Payoff | $27,187,883 | 66.3% | |
| Reserves | $3,976,867 | 9.7% | ||||
| Closing Costs | $1,064,121 | 2.6% | ||||
| Return of Equity | $8,771,130 | 21.4% | ||||
| Total Sources | $41,000,000 | 100.0% | Total Uses | $41,000,000 | 100.0% | |
The Borrowers / Sponsor. The borrowers, RVART Owner LLC and Jensen 155 Mercer Owner LLC, are tenants-in-common, each of which is a single purpose Delaware limited liability companies structured to be bankruptcy-remote, and each of which have two independent directors in its organizational structure. The sponsor of the borrowers and non-recourse carve-out guarantor is Joseph J. Sitt, the Chief Executive Officer of Thor Equities (“Thor”).
Founded in New York in 1986, Thor is a real estate investment firm specializing in acquisition and development, focusing on retail, office, hotel and mixed use properties. Thor’s portfolio, totaling more than 15.0 million sq. ft., is valued at more than $5.0 billion and includes approximately 75 retail properties and 13 office properties in New York City.
The Property. The 155 Mercer Street Property is a three-story, 14,589 sq. ft., Class A flagship retail building located in New York, New York. Previously owned and occupied by Joyce SoHo Dance Studio, the 155 Mercer Street Property features 45 feet of retail window frontage along Mercer Street with ceiling floor heights ranging from nine feet in the below-grade space to 21 feet on the third floor. In December 2012, Dolce & Gabbana executed a lease for the entire 155 Mercer Street Property and subsequently took possession of the 155 Mercer Street Property in December 2014.
Per the terms of its lease, Dolce & Gabbana is responsible for the conversion and re-zoning of the 155 Mercer Street Property to full retail. Renovations include removing the mezzanine level and a portion of the third floor, restoring the architectural features and original brownstone color of the building to resemble the original 1854 façade, reframing the floor structure, and installing new stairs, elevators and restrooms. In addition to the conversion, according to the sponsor, Dolce & Gabbana is planning to invest approximately $8.0 million to $10.0 million in order to create a flagship store. Upon completion of the renovation, the 155 Mercer Street Property will be one of the only multilevel retail buildings in the SoHo submarket and the only one on Mercer Street.
Environmental Matters. The Phase I environmental report dated April 15, 2015 recommended the continued implementation of an asbestos operation and maintenance plan and a lead-based paint operation and maintenance plan at the 155 Mercer Street Property, which are currently in place.
Tenancy.
Dolce & Gabbana (14,589 sq. ft.; 100.0% of NRA; 100.0% of U/W Base Rent) Founded in 1985, Dolce & Gabbana is an Italian luxury industry fashion house focused on high-end clothing, leather goods, footwear and accessories for men, women and children. In addition, Dolce & Gabbana licenses out its brand for the production of beauty, eyewear and various lifestyle endeavors. As of March 31, 2014, the brand is present in 40 counties worldwide with a network of 287 mono-brand stores and main corporate offices in Milan, New York, Tokyo and Hong Kong. The 155 Mercer Street Property will serve as Dolce & Gabbana’s third location and downtown flagship store in New York City. Additional locations include its uptown flagship store located on East 55th Street and Fifth Avenue as well as a women’s only boutique located on East 69th Street and Madison Avenue.
The Dolce & Gabbana lease at the 155 Mercer Street Property, which expires November 30, 2022, obligates the tenant to commence paying base rent on the earlier of (i) the date that Dolce & Gabbana opens for business and (ii) December 1, 2015. Annual base rent is $2.9 million ($198.78 PSF) with contractual annual increases of 3.0%. The lease is structured with no renewal options and no termination options. Additionally, the lease is guaranteed by Dolce & Gabbana’s parent company, Dolce & Gabbana S.R.L. As of March 31, 2014, the company reported total revenues of approximately $1.1 billion.
The Market. The 155 Mercer Street Property is located on the west side of Mercer Street between Prince Street and West Houston Street within the SoHo neighborhood of Manhattan. SoHo is bounded by Houston Street to the north, West Broadway to the west, Canal Street to the south and Broadway to the east. SoHo is primarily an improved commercial and residential location with properties that are generally similar in age and structure, ranging from five-story to 15-story loft buildings, many of which have undergone conversion. The 155 Mercer Street Property benefits from its close proximity to the heavily trafficked avenues and streets of Broadway, Houston and Canal. The immediate area surrounding the 155 Mercer Street Property is home to downtown flagship locations for comparable brands including Prada, Chanel, Tiffany & Co., Balenciaga, Versace, Saint Laurent, Vera Wang, Christian Dior, Louis Vuitton and Ralph Lauren, among others.
THE INFORMATION IN THIS STRUCTURAL AND COLLATERAL TERM SHEET IS NOT COMPLETE AND MAY BE AMENDED PRIOR TO THE TIME OF SALE. THIS TERM SHEET IS NOT AN OFFER TO SELL THESE SECURITIES AND IT IS NOT A SOLICITATION OF AN OFFER TO BUY THESE SECURITIES IN ANY JURISDICTION WHERE THE OFFER OR SALE IS NOT PERMITTED.
| 46 |
155 Mercer Street New York, NY 10012 | Collateral Asset Summary – Loan No. 4 155 Mercer Street | Cut-off Date Balance: Cut-off Date LTV: U/W NCF DSCR: U/W NOI Debt Yield: | $41,000,000 63.1% 1.57x 7.3% |
The 155 Mercer Street Property is located within walking distance of various forms of public transportation. The A, C, E, N, Q, R subway lines travel to Canal Street and the 1, 2, 3 subway lines travel to Houston and Canal Streets. Additionally, the M21 bus travels cross-town on Houston Street while the M1 and M6 bus run north and south on Broadway.
New York City retail vacancy ended Q4 2014 at 3.5% with average retail rental rates at $93.51 PSF per year. SoHo retail rental rates have increased 8.5% over the past five years due to the influx of high end retail tenants, while vacancy remained low. According to the appraisal, the average ground floor retail asking rent as of Q4 2014 was $517 PSF, which is an increase of 7.7% PSF from the same time last year. As of Q4 2014, the SoHo retail market reported an inventory of approximately 5.2 million sq. ft. with a vacancy rate of 2.7%. The prime SoHo corridors of Broadway, Prince Street and Spring Street averaged approximately $867 PSF for retail rents.
The appraiser analyzed a set of eight comparable leases with an average rent of $598.34 PSF after adjustments. The SoHo retail market has continued to remain a destination of national and international retailers with flagship stores. The tables below include market rent conclusions and lease comparables.
Market Rent Conclusions(1) | |||||
| Lease Assumptions | Below Grade | Ground Floor | 2nd Floor | 3rd Floor | Total / Wtd. Avg. |
| Total Tenant Sq. Ft. | 4,452 | 3,857 | 3,506 | 2,774 | 14,589 |
| Market Rent (PSF) | $75.00 | $600.00 | $150.00 | $100.00 | $236.58 |
| Concessions (Free Rent) | 6 months (new) / 3 months (renewals) | 6 months (new) / 3 months (renewals) | 6 months (new) / 3 months (renewals) | 6 months (new) / 3 months (renewals) | 6 months (new) / 3 months (renewals) |
| Annual Escalation | 3% | 3% | 3% | 3% | 3% |
| Tenant Improvements (New) | None | None | None | None | None |
| Tenant Improvements (Renewals) | None | None | None | None | None |
| Average Lease Term | 10 years | 10 years | 10 years | 10 years | 10 years |
| (1) | Source: Appraisal |
Lease Comparables(1) | ||||||
| Property | Tenant | Frontage | Sq. Ft. | Base Rent (PSF)(2) | Lease Term (yrs.) | Reimbursements |
| 155 Mercer Street | Dolce & Gabbana | Mercer Street | 14,589 | $217.59(3) | 7 | Net |
| 111 Greene Street | Jimmy Choo | Greene Street | 1,800 | $525.00 | 10 | Gross |
| 136 Greene Street | Brunello Cucinelli | Greene Street | 7,400 | $385.00 | 10 | Gross |
| 115 Mercer Street | The Kooples | Mercer Street | 3,400 | $650.00 | 10 | Gross |
| 87 Mercer Street | Italia Independent | Mercer Street | 1,350 | $367.00 | 10 | Gross |
| 115 Mercer Street | Derek Lam | Mercer Street | 4,100 | $590.00 | 10 | Gross |
| 65 Mercer Street | Daniel Cremieux | Mercer Street | 400 | $420.00 | 10 | Gross |
| 76 Greene Street | Joseph | Greene Street | 7,350 | $353.00 | 10 | Gross |
| 129 Greene Street | ISIS | Greene Street | 8,200 | $325.00 | 10 | Gross |
| (1) | Source: Appraisal |
| (2) | Represents grade level base rent. |
| (3) | U/W Base Rent is $217.59 PSF, which reflects Dolce & Gabbana’s average rent over the term of the lease. The appraiser concluded a market rent of $236.58 PSF. |
THE INFORMATION IN THIS STRUCTURAL AND COLLATERAL TERM SHEET IS NOT COMPLETE AND MAY BE AMENDED PRIOR TO THE TIME OF SALE. THIS TERM SHEET IS NOT AN OFFER TO SELL THESE SECURITIES AND IT IS NOT A SOLICITATION OF AN OFFER TO BUY THESE SECURITIES IN ANY JURISDICTION WHERE THE OFFER OR SALE IS NOT PERMITTED.
| 47 |
155 Mercer Street New York, NY 10012 | Collateral Asset Summary – Loan No. 4 155 Mercer Street | Cut-off Date Balance: Cut-off Date LTV: U/W NCF DSCR: U/W NOI Debt Yield: | $41,000,000 63.1% 1.57x 7.3% |
Cash Flow Analysis.
Cash Flow Analysis(1) | ||
| U/W | U/W PSF | |
Base Rent(2) | $3,174,449 | $217.59 |
| Value of Vacant Space | 0 | 0.00 |
| Gross Potential Rent | $3,174,449 | $217.59 |
| Total Recoveries | 119,789 | 8.21 |
| Total Other Income | 0 | 0.00 |
Less: Vacancy(3) | (98,827) | (6.77) |
| Effective Gross Income | $3,195,410 | $219.03 |
| Total Operating Expenses | 183,697 | 12.59 |
| Net Operating Income | $3,011,713 | $206.44 |
| TI/LC | 72,945 | 5.00 |
| Capital Expenditures | 2,188 | 0.15 |
| Net Cash Flow | $2,936,580 | $201.29 |
| (1) | The borrowers acquired the 155 Mercer Street Property in July 2012 and subsequently executed a lease with Dolce & Gabbana in December 2012. Dolce & Gabbana is currently in the process of converting the 155 Mercer Street Property to full retail. As a result, historical cash flows are not applicable. |
| (2) | Annual U/W Base Rent PSF represents Dolce & Gabbana’s average triple-net base rent from December 1, 2015 through lease expiration. The current annual rent at the 155 Mercer Street Property due during the first year following rent commencement is $198.78 PSF with 3.0% contractual annual increases. The appraiser concluded a market rent of $236.58 PSF |
| (3) | U/W Vacancy represents 3.0% of Gross Potential Rent and Total Recoveries, which is greater than the appraiser’s concluded vacancy of 1.0%. The 155 Mercer Street Property is currently 100.0% occupied by Dolce & Gabbana under a lease that expires in November 2022. As of Q4 2014, the SoHo retail market reported a vacancy rate of 2.7% |
Property Management. The 155 Mercer Street Property is managed by Thor Management Company LLC, an affiliate of the borrowers.
Lockbox / Cash Management. The 155 Mercer Street Loan is structured with a hard lockbox and in place cash management. A full excess cash flow sweep will occur upon (i) any event of default, (ii) any bankruptcy action of borrower, principal, manager or Dolce & Gabbana (or its parent guarantor), (iii) from and after December 2016, the failure by the borrowers to maintain a debt service coverage ratio of at least 1.10x for two consecutive calendar quarters, until the debt service coverage ratio is at least 1.15x for four consecutive calendar quarters and (iv) commencement of a DG Rollover Period (as defined below).
Initial Reserves. At loan closing, the borrowers deposited (i) $35,200 into required repairs reserve account, (ii) $2,000,000 into a work permit reserve (which amount represents the allowance that the borrowers are obligated to pay Dolce & Gabbana upon Dolce & Gabbana’s completion of special permit work required to convert and re-zone the 155 Mercer Street Property to full retail), (iii) $1,691,667 into a reserve that will be released to the borrowers when Dolce & Gabbana is paying rent and conducting normal business operations in all of the 155 Mercer Street Property space and (iv) $250,000 into a tenant allowance reserve account equal to the portion of the tenant allowance to be paid for by the borrowers as specified in the Dolce & Gabbana lease.
Ongoing Reserves. The borrowers are required to deposit $182 monthly ($0.15 PSF annually) into the replacement reserve account, subject to a cap of $10,942. The borrowers are also required to deposit 1/12 of the estimated annual taxes and 1/12 of the estimated annual insurance premiums if, among other things, (i) an event of default has occurred and is continuing, (ii) with respect to the taxes, the borrowers fail to provide evidence of timely payment and (iii) with respect to the insurance premiums, an acceptable blanket insurance policy is no longer in place.
In addition, the 155 Mercer Street Loan includes a full excess cash flow sweep following the occurrence of any of the following: (i) twelve months prior to the scheduled expiration date of the Dolce & Gabbana lease and (ii) Dolce & Gabbana vacates, ceases to conduct normal business operations, “goes dark” or otherwise notifies the borrowers of its intention to take any of the foregoing actions, in each case until such time that Dolce & Gabbana or one or more acceptable replacement tenants sign leases for all or substantially all of the net rentable area at the 155 Mercer Street Property and such leases or leases have an initial term extending beyond the maturity date of the 155 Mercer Street Loan and such tenant is in occupancy and is paying full unabated rent with respect thereto (such period, the “DG Rollover Period”). Excess cash trapped pursuant to this provision will be held by lender in a rollover reserve to be used for approved leasing expenses in connection with future leases at the 155 Mercer Street Property.
Current Mezzanine or Subordinate Indebtedness. None.
Future Mezzanine or Subordinate Indebtedness Permitted. None.
THE INFORMATION IN THIS STRUCTURAL AND COLLATERAL TERM SHEET IS NOT COMPLETE AND MAY BE AMENDED PRIOR TO THE TIME OF SALE. THIS TERM SHEET IS NOT AN OFFER TO SELL THESE SECURITIES AND IT IS NOT A SOLICITATION OF AN OFFER TO BUY THESE SECURITIES IN ANY JURISDICTION WHERE THE OFFER OR SALE IS NOT PERMITTED.
| 48 |
155 Mercer Street New York, NY 10012 | Collateral Asset Summary – Loan No. 4 155 Mercer Street | Cut-off Date Balance: Cut-off Date LTV: U/W NCF DSCR: U/W NOI Debt Yield: | $41,000,000 63.1% 1.57x 7.3% |
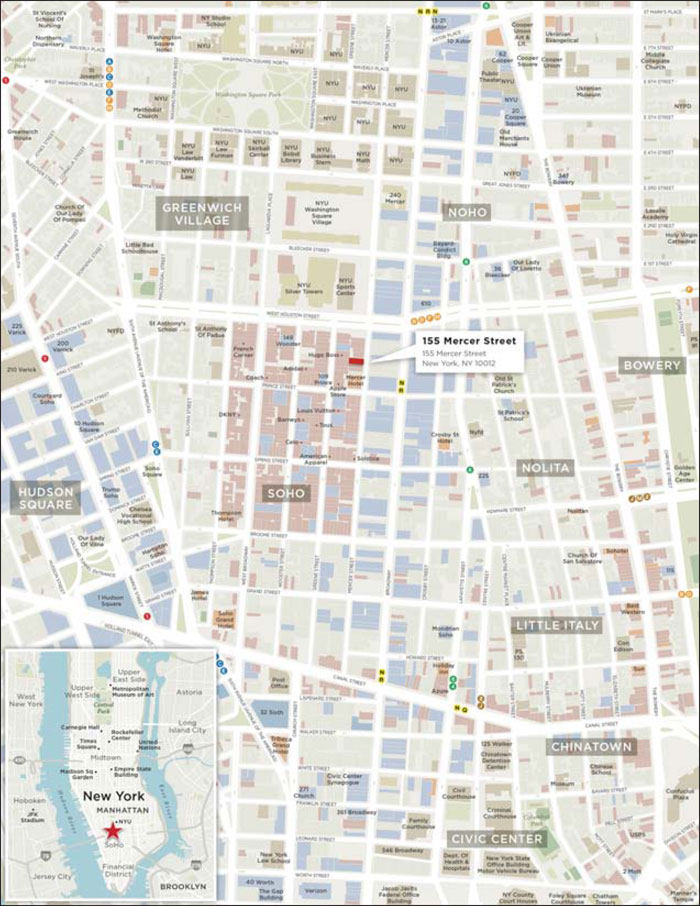
THE INFORMATION IN THIS STRUCTURAL AND COLLATERAL TERM SHEET IS NOT COMPLETE AND MAY BE AMENDED PRIOR TO THE TIME OF SALE. THIS TERM SHEET IS NOT AN OFFER TO SELL THESE SECURITIES AND IT IS NOT A SOLICITATION OF AN OFFER TO BUY THESE SECURITIES IN ANY JURISDICTION WHERE THE OFFER OR SALE IS NOT PERMITTED.
| 49 |
27122 – 27136 Paseo Espada & 27121 – 27131 Calle Arroyo San Juan Capistrano, CA 92675 | Collateral Asset Summary – Loan No. 5 Capistrano Business Center I & II | Cut-off Date Balance: Cut-off Date LTV: U/W NCF DSCR: U/W NOI Debt Yield: | $34,700,000 61.5% 1.91x 8.9% |
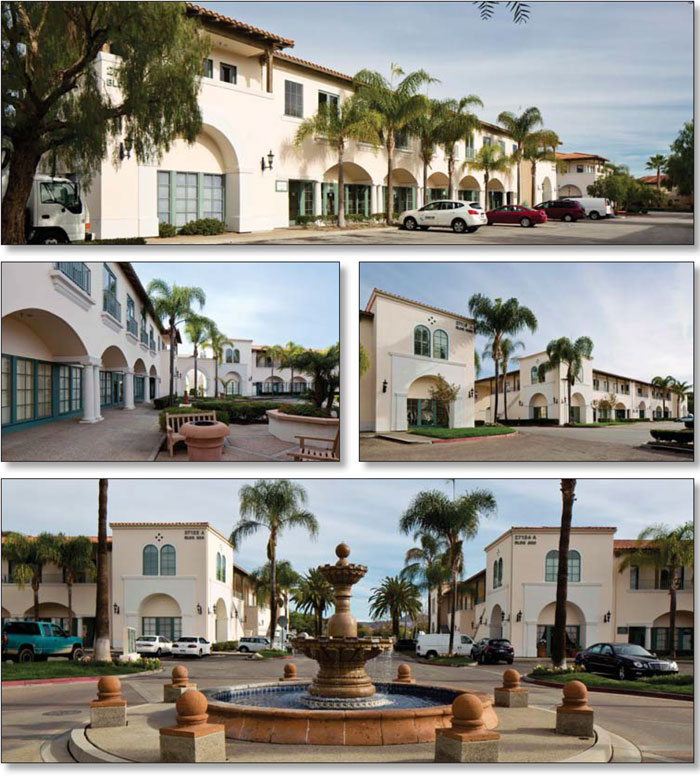
THE INFORMATION IN THIS STRUCTURAL AND COLLATERAL TERM SHEET IS NOT COMPLETE AND MAY BE AMENDED PRIOR TO THE TIME OF SALE. THIS TERM SHEET IS NOT AN OFFER TO SELL THESE SECURITIES AND IT IS NOT A SOLICITATION OF AN OFFER TO BUY THESE SECURITIES IN ANY JURISDICTION WHERE THE OFFER OR SALE IS NOT PERMITTED.
| 50 |
27122 – 27136 Paseo Espada & 27121 – 27131 Calle Arroyo San Juan Capistrano, CA 92675 | Collateral Asset Summary – Loan No. 5 Capistrano Business Center I & II | Cut-off Date Balance: Cut-off Date LTV: U/W NCF DSCR: U/W NOI Debt Yield: | $34,700,000 61.5% 1.91x 8.9% |
| Mortgage Loan Information | |
| Loan Seller: | GACC |
| Loan Purpose: | Refinance |
Sponsor(1): | Scott J. Seligman |
| Borrower: | Capistrano Enterprises I, LLC; South Capistrano Enterprises, LLC |
| Original Balance: | $34,700,000 |
| Cut-off Date Balance: | $34,700,000 |
| % by Initial UPB: | 2.6% |
| Interest Rate: | 4.1500% |
| Payment Date: | 6th of each month |
| First Payment Date: | June 6, 2015 |
| Maturity Date: | May 6, 2025 |
| Amortization: | Interest Only |
Additional Debt(2): | Future Mezzanine Debt Permitted |
| Call Protection: | L(25), D(90), O(5) |
| Lockbox / Cash Management: | Hard / Springing |
Reserves(3) | ||
| Initial | Monthly | |
| Taxes: | $110,529 | $32,369 |
| Insurance: | $0 | Springing |
| Replacement: | $0 | $4,773 |
| TI/LC: | $300,000 | $23,150 |
| Required Repairs: | $68,202 | NAP |
| Financial Information | ||
| Cut-off Date Balance / Sq. Ft.: | $121 | |
| Balloon Balance / Sq. Ft.: | $121 | |
| Cut-off Date LTV: | 61.5% | |
| Balloon LTV: | 61.5% | |
Underwritten NOI DSCR(4): | 2.10x | |
Underwritten NCF DSCR(4): | 1.91x | |
| Underwritten NOI Debt Yield: | 8.9% | |
| Underwritten NCF Debt Yield: | 8.0% | |
| Underwritten NOI Debt Yield at Balloon: | 8.9% | |
| Underwritten NCF Debt Yield at Balloon: | 8.0% | |
| Property Information | ||
| Single Asset / Portfolio: | Single Asset | |
| Property Type: | Suburban/Flex Office | |
| Collateral: | Fee Simple | |
| Location: | San Juan Capistrano, CA | |
| Year Built / Renovated: | 1989 / 2014 | |
| Total Sq. Ft.: | 286,387 | |
| Property Management: | S.M. Farthington Ltd., LLC, dba Seligman Western Enterprises, Ltd. II | |
| Underwritten NOI: | $3,072,074 | |
| Underwritten NCF: | $2,786,636 | |
| “As-is” Appraised Value: | $56,400,000 | |
| “As-is” Appraisal Date: | March 5, 2015 | |
“As Stabilized” Appraised Value(5): | $61,200,000 | |
“As Stabilized” Appraisal Date(5): | March 5, 2017 | |
| Historical NOI | ||
| 2014 NOI: | $2,293,749 (December 31, 2014) | |
| 2013 NOI: | $2,338,758 (December 31, 2013) | |
| 2012 NOI: | $2,494,861 (December 31, 2012) | |
| Historical Occupancy | ||
| Most Recent Occupancy: | 86.3% (April 20, 2015) | |
2014 Occupancy(6): | 76.7% (December 31, 2014) | |
| 2013 Occupancy: | 77.7% (December 31, 2013) | |
| 2012 Occupancy: | 72.3% (December 31, 2012) | |
| (1) | The sponsor is also the sponsor under the mortgage loans identified on Annex A-1 to this Free Writing Prospectus as Ortega Ranch, which has a Cut-off Date Balance of $25,000,000 and North Stadium Business Center, which has a Cut-off Date Balance of $10,360,000. |
| (2) | See “Future Mezzanine or Subordinate Indebtedness Permitted” herein. |
| (3) | See “Initial Reserves” and “Ongoing Reserves” herein. |
| (4) | Underwritten NOI DSCR and Underwritten NCF DSCR are based on the interest only debt service payment. Based on a hypothetical 30-year amortization schedule, the Underwritten NOI DSCR and Underwritten NCF DSCR are 1.52x and 1.38x, respectively. |
| (5) | The “As Stabilized” appraised value is based on the Capistrano Business Center I & II Property achieving a stabilized occupancy of 91.0%. The LTV based on the stabilized value is 56.7%. The Capistrano Business Center I &II Property is currently 86.3% occupied as of April 20, 2015. |
| (6) | 2014 Historical Occupancy represents the average occupancy for the year as the historical occupancies for the months of November and December were not available. |
THE INFORMATION IN THIS STRUCTURAL AND COLLATERAL TERM SHEET IS NOT COMPLETE AND MAY BE AMENDED PRIOR TO THE TIME OF SALE. THIS TERM SHEET IS NOT AN OFFER TO SELL THESE SECURITIES AND IT IS NOT A SOLICITATION OF AN OFFER TO BUY THESE SECURITIES IN ANY JURISDICTION WHERE THE OFFER OR SALE IS NOT PERMITTED.
| 51 |
27122 – 27136 Paseo Espada & 27121 – 27131 Calle Arroyo San Juan Capistrano, CA 92675 | Collateral Asset Summary – Loan No. 5 Capistrano Business Center I & II | Cut-off Date Balance: Cut-off Date LTV: U/W NCF DSCR: U/W NOI Debt Yield: | $34,700,000 61.5% 1.91x 8.9% |
| Tenant Summary | |||||||||||||
Tenant | Ratings (Fitch/Moody’s/S&P)(1) | Net Rentable Area (Sq. Ft.) | % of Net Rentable Area | U/W Base Rent PSF | % of Total U/W Base Rent | Lease Expiration | |||||||
24 Hour Fitness Inc.(2) | NR/NR/B | 24,998 | 8.7% | $21.13 | 13.5% | 12/31/2020 | |||||||
Joe Verde Sales & Management Training(3) | NR/NR/NR | 14,537 | 5.1% | $16.45 | 6.1% | 2/29/2016 | |||||||
The Effect(4) | NR/NR/NR | 8,505 | 3.0% | $14.52 | 3.2% | 12/31/2015 | |||||||
Development Planning & Financial Group(5) | NR/NR/NR | 8,361 | 2.9% | $19.26 | 4.1% | 3/31/2016 | |||||||
Greek Orthodox Mission(6) | NR/NR/NR | 7,214 | 2.5% | $12.84 | 2.4% | 12/31/2017 | |||||||
| Total Major Tenants | 63,615 | 22.2% | $17.99 | 29.3% | |||||||||
| Remaining Tenants | 183,529 | 64.1% | $15.07 | 70.7% | |||||||||
| Total Occupied Tenants | 247,144 | 86.3% | $15.82 | 100.0% | |||||||||
| Vacant | 39,243 | 13.7% | |||||||||||
| Total | 286,387 | 100.0% | |||||||||||
| (1) | Certain ratings are those of the parent company whether or not the parent company guarantees the lease. |
| (2) | 24 Hour Fitness Inc. has an ongoing right to terminate its lease beginning on December 31, 2016 through the end of the lease term on December 31, 2020. |
| (3) | Joe Verde Sales & Management Training has no renewal or termination options. |
| (4) | The Effect has no renewal or termination options. |
| (5) | Development Planning & Financial Group has no renewal or termination options. |
| (6) | Greek Orthodox Mission has no renewal or termination options. |
Lease Rollover Schedule(1) | ||||||||
| Year | # of Leases Expiring | Total Expiring Sq. Ft. | % of Total Sq. Ft. Expiring | Cumulative Sq. Ft. Expiring | Cumulative % of Sq. Ft. Expiring | Annual U/W Base Rent PSF | % U/W Base Rent Rolling | Cumulative % of U/W Base Rent |
| MTM | 1 | 1,550 | 0.5% | 1,550 | 0.5% | $16.08 | 0.6% | 0.6% |
| 2015 | 42 | 66,648 | 23.3% | 68,198 | 23.8% | $14.50 | 24.7% | 25.3% |
| 2016 | 43 | 67,744 | 23.7% | 135,942 | 47.5% | $15.48 | 26.8% | 52.2% |
| 2017 | 33 | 51,426 | 18.0% | 187,368 | 65.4% | $13.88 | 18.3% | 70.4% |
| 2018 | 10 | 15,693 | 5.5% | 203,061 | 70.9% | $19.21 | 7.7% | 78.1% |
| 2019 | 4 | 12,219 | 4.3% | 215,280 | 75.2% | $19.89 | 6.2% | 84.3% |
| 2020 | 2 | 29,014 | 10.1% | 244,294 | 85.3% | $21.12 | 15.7% | 100.0% |
| 2021 | 0 | 0 | 0.0% | 244,294 | 85.3% | $0.00 | 0.0% | 100.0% |
| 2022 | 0 | 0 | 0.0% | 244,294 | 85.3% | $0.00 | 0.0% | 100.0% |
| 2023 | 0 | 0 | 0.0% | 244,294 | 85.3% | $0.00 | 0.0% | 100.0% |
| 2024 | 0 | 0 | 0.0% | 244,294 | 85.3% | $0.00 | 0.0% | 100.0% |
| 2025 | 0 | 0 | 0.0% | 244,294 | 85.3% | $0.00 | 0.0% | 100.0% |
| Thereafter | 2 | 2,850 | 1.0% | 247,144 | 86.3% | $0.00 | 0.0% | 100.0% |
| Vacant | NAP | 39,243 | 13.7% | 286,387 | 100.0% | NAP | NAP | |
| Total / Wtd. Avg. | 137 | 286,387 | 100.0% | $15.82 | 100.0% | |||
| (1) | Certain tenants have lease termination options that may become exercisable prior to the originally stated expiration date of the tenant lease that are not considered in the lease rollover schedule. |
The Loan. The Capistrano Business Center I & II loan (the “Capistrano Business Center I & II Loan”) is a $34.7 million fixed rate loan secured by the borrowers’ fee simple interest in a 286,387 sq. ft., Class A office property located at 27122-27136 Paseo Espada and 27121-27131 Calle Arroyo in San Juan Capistrano, California (the “Capistrano Business Center I & II Property”). The Capistrano Business Center I & II Loan has a 10-year term and is interest only for the entire term. The Capistrano Business Center I & II Loan accrues interest at a fixed rate equal to 4.1500%. Loan proceeds, along with approximately $9.0 million of sponsor equity, were used to retire existing debt of approximately $43.0 million, fund upfront reserves of approximately $0.5 million and pay closing costs of approximately $0.2 million. Based on the “As-is” appraised value of $56.4 million as of March 5, 2015 and the “As Stabilized” appraised value of $61.2 million, the cut-off date LTV ratio is 61.5% and 56.7%, respectively. The most recent prior financings of the Capistrano Business Center I & II Property was included in the BACM 2005-4 and the BACM 2005-2 securitizations.
THE INFORMATION IN THIS STRUCTURAL AND COLLATERAL TERM SHEET IS NOT COMPLETE AND MAY BE AMENDED PRIOR TO THE TIME OF SALE. THIS TERM SHEET IS NOT AN OFFER TO SELL THESE SECURITIES AND IT IS NOT A SOLICITATION OF AN OFFER TO BUY THESE SECURITIES IN ANY JURISDICTION WHERE THE OFFER OR SALE IS NOT PERMITTED.
| 52 |
27122 – 27136 Paseo Espada & 27121 – 27131 Calle Arroyo San Juan Capistrano, CA 92675 | Collateral Asset Summary – Loan No. 5 Capistrano Business Center I & II | Cut-off Date Balance: Cut-off Date LTV: U/W NCF DSCR: U/W NOI Debt Yield: | $34,700,000 61.5% 1.91x 8.9% |
| Sources and Uses | ||||||
| Sources | Proceeds | % of Total | Uses | Proceeds | % of Total | |
| Loan Amount | $34,700,000 | 79.4% | Loan Payoff | $42,982,538 | 98.4% | |
| Sponsor Equity | $9,000,687 | 20.6% | Reserves | $478,731 | 1.1% | |
| Closing Costs | $239,418 | 0.5% | ||||
| Total Sources | $43,700,687 | 100.0% | Total Uses | $43,700,687 | 100.0% | |
The Borrower / Sponsor. The borrowers, Capistrano Enterprises I, LLC and South Capistrano Enterprises, LLC, are each a single purpose Delaware limited liability company structured to be bankruptcy-remote with two independent directors in their organizational structure. The sponsor of the borrowers and the non-recourse carveout guarantor is Scott J. Seligman.
Scott J. Seligman is CEO of Seligman & Associates, Inc. Founded in 1954, Seligman & Associates, Inc. is a Michigan-based developer, investor and manager of commercial and residential properties. Seligman & Associates, Inc. owns in excess of 1.0 million sq. ft. of retail space, 1.97 million of office space and 816 multifamily units throughout the western United States, including nine office and flex properties in Southern California. In addition to acting as CEO of Seligman & Associates, Inc., Scott J. Seligman also owns Sterling Bank & Trust, a regional bank in San Francisco.
The Property. The Capistrano Business Center I & II Property consists of two adjacent business parks, Capistrano Business Center I and Capistrano Business Center II, totaling 286,387 sq. ft. located in San Juan Capistrano, California. The Capistrano Business Center I & II Property was developed by the sponsor in 1989 and most recently renovated in 2014. The Capistrano Business Center I & II Property includes 157,414 sq. ft. of office space, 101,125 sq. ft. of flex-office space and 24,998 sq. ft. of retail space and 1,004 parking spaces, which equates to a parking ratio of approximately 3.51 spaces per 1,000 sq. ft. The flex-office space is comprised of approximately 65% office space and 35% warehouse space, with grade level roll up doors.
The Capistrano Business Center I & II Property features a diversified rent roll leased to more than 100 local businesses. The average tenant space at the Capistrano Business Center I & II Property is approximately 1,700 sq. ft. and on a weighted average basis, the current tenants have been at the property for 10.6 years. The Capistrano Business Center I & II Property has an average occupancy of 85.6% since 2005 but experienced a significant drop in occupancy in 2013 due to an ongoing road construction project at the nearby Interstate 5 Ortega Highway interchange. The construction project began its completion phase in 2014 which reduced traffic in the nearby area. The Capistrano Business Center I & II Property has experienced positive leasing momentum in the past 12 months with 51,067 sq. ft. of leases with an average initial lease term of 3.2 years.
The Capistrano Business Center I & II Property is located off of Interstate 5 at the intersection of Rancho Viejo Road and Ortega Highway. Public transportation is also located in close proximity via the San Juan Capistrano Amtrak station, located approximately 0.8 miles from the Capistrano Business Center I & II Property and the Camino-Capistrano/Ortega Highway bus stop, which is located adjacent to the Amtrak station.
Environmental Matters. The Phase I environmental report dated March 13, 2015 recommended no further action at the Capistrano Business Center I & II Property.
Major Tenants.
24 Hour Fitness Inc. (24,998 sq. ft.; 8.7% of NRA; 13.5% of U/W Base Rent; B by S&P) 24 Hour Fitness Inc. (“24 Hour Fitness”) is the world’s largest privately owned and operated fitness center chain, by memberships, with more than 400 clubs and 20,000 employees in the U.S. 24 Hour Fitness has been at the Capistrano Business Center I & II Property since opening in 1990 and has renewed its lease several times. 24 Hour Fitness’s lease expires on December 31, 2020 and includes an ongoing termination option that is exercisable with 12 months prior notice beginning on December 31, 2016. 24 Hour Fitness does not have any renewal options.
Joe Verde Sales & Management Training (14,537 sq. ft.; 5.1% of NRA; 6.1% of U/W Base Rent) Joe Verde Sales & Management Training offers in-person and on-line sales and management training programs, products and services for the automobile industry. Joe Verde, founder and President of Joe Verde Sales & Management Training, has extensive experience in the automobile industry and has been a featured speaker at the National Automobile Dealers Association convention more than 25 times over his career. Joe Verde Sales & Management Training has been a tenant at the Capistrano Business Center I & II Property since 1996, originally occupying 9,937 sq. ft. and expanding on three separate occasions to its current 14,537 sq. ft. space. The Joe Verde Sales & Management Training’s lease runs through February 29, 2016 with no early termination options or renewal options.
The Effect (8,505 sq. ft.; 3.0% of NRA; 3.2% of U/W Base Rent) The Effect is a community ministry, founded in 2005, that offers counseling, substance abuse recovery and worship gatherings. The Effect has been a tenant at the Capistrano Business Center I & II Property since 2008 and has expanded on three separate occasions to its current space of 8,505 sq. ft. The Effect’s lease expires on December 31, 2015. The Effect has no renewal or termination options.
THE INFORMATION IN THIS STRUCTURAL AND COLLATERAL TERM SHEET IS NOT COMPLETE AND MAY BE AMENDED PRIOR TO THE TIME OF SALE. THIS TERM SHEET IS NOT AN OFFER TO SELL THESE SECURITIES AND IT IS NOT A SOLICITATION OF AN OFFER TO BUY THESE SECURITIES IN ANY JURISDICTION WHERE THE OFFER OR SALE IS NOT PERMITTED.
| 53 |
27122 – 27136 Paseo Espada & 27121 – 27131 Calle Arroyo San Juan Capistrano, CA 92675 | Collateral Asset Summary – Loan No. 5 Capistrano Business Center I & II | Cut-off Date Balance: Cut-off Date LTV: U/W NCF DSCR: U/W NOI Debt Yield: | $34,700,000 61.5% 1.91x 8.9% |
The Market. The Capistrano Business Center I & II Property is located within the San Juan Capistrano neighborhood of South Orange Country, California which is considered to be a suburban location of the Santa Ana-Anaheim-Irvine metropolitan division. The Capistrano Business Center I & II Property is located directly off of Interstate 5 in an infill area characterized by office, retail and residential uses. The immediate area around the Capistrano Business Center I & II Property features low rise business park developments to the east and north with a number of commercial developments and residential developments to the west.
The South Orange County office submarket consists of 662 properties totaling 22.7 million sq. ft. and featured a vacancy rate of 8.0% in 2014, the lowest of all Orange County office submarkets. Rental rates in the South Orange County office submarket have recovered from the recent trough of $23.16 PSF in 4Q 2012 to $26.28 PSF as of 4Q 2014. The submarket has experienced no new construction since 2009 and experienced positive absorption for the second consecutive year in 2014.
The South Orange County industrial submarket consists of 950 buildings totaling 33.2 million sq. ft. and featured a vacancy rate of 7.1% in 2014. The South Orange County industrial submarket featured the highest average asking lease rate of all Orange County submarkets at $10.08 PSF as of 4Q 2014, approximately 24% higher than the Orange County average. The submarket has also experienced very little new construction since 2008, with only 36,000 sq. ft. being added to the inventory in 2012 and 2013.
The appraiser identified seven comparable office and flex properties in the Orange County submarket with an average base rent range of $10.80 PSF to $25.80 PSF and nine fitness centers in the greater Southern California area with an average base rent range of $11.40 to $25.20 PSF. Using both the market comparables and recent leasing at the Capistrano Business Center I & II Property, the appraiser determined a market rent of $18.00 PSF for office space, $15.00 PSF for industrial/office space and $21.00 PSF for the 24 Hour Fitness space. The chart below summaries the comparable office and flex-office set as determined by the appraiser:
Summary of Comparable Rentals(1) | |||||||||
| Name | Year Built | Net Rentable Area (Sq. Ft.) | Occupancy | Comparable Lease Sq. Ft. | Comparable Lease Term (Yrs.) | Comparable Lease Base Rent PSF | |||
| Capistrano Business Center I & II Property | 1989 | 286,387 | 86.3%(2) | NAP | NAP | NAP | |||
| Marbella Commerce Center | 2001 | 46,415 | 96.0% | 3,222 | 3.0 | $24.48 | |||
| Two Multi-tenant Office Buildings | 2006 | 115,517 | 85.0% | 600 | 3.0 | $21.00 | |||
| San Juan Clock Tower | 1980 | 16,000 | 100.0% | 1,000 | 2.0 | $18.60 | |||
| San Juan Corporate Plaza | 1989 | 32,173 | 83.0% | 5,299 | 4.0 | $25.80 | |||
| Ortega Business Center | 1982 | 32,873 | 90.0% | 962 – 1,506 | 2.0 | $21.00 - $23.40 | |||
| 211 Calle Pintoresco | 2000 | 17,633 | 100.0% | 9,094 | 5.0 | $10.80 | |||
| John Deere Landscape | 1975 | 14,810 | 100.0% | 4,800 | 3.0 | $11.40 | |||
Total / Wtd. Avg.(3): | 275,421 | 89.9% | |||||||
| (1) | Source: Appraisal. |
| (2) | Based on rent roll dated April 20, 2015. |
| (3) | Total / Wtd. Avg. excludes the Capistrano Business Center I & II Property. |
Cash Flow Analysis.
| Cash Flow Analysis | ||||||
| 2011 | 2012 | 2013 | 2014 | U/W | U/W PSF | |
Base Rent(1) | $3,452,728 | $3,343,898 | $3,252,606 | $3,223,203 | $4,013,078 | $14.01 |
| Value of Vacant Space | 0 | 0 | 0 | 0 | 763,843 | 2.67 |
| Gross Potential Rent | $3,452,728 | $3,343,898 | $3,252,606 | $3,223,203 | $4,776,921 | $16.68 |
| Total Recoveries | 334,177 | 357,755 | 344,451 | 358,817 | 431,863 | 1.51 |
| Total Other Income | 16,281 | 5,247 | 5,639 | 5,519 | 6,540 | 0.02 |
Less: Vacancy (2) | 0 | 0 | 0 | 0 | (763,843) | (2.67) |
| Effective Gross Income | $3,803,186 | $3,706,900 | $3,602,696 | $3,587,539 | $4,451,481 | $15.54 |
| Total Operating Expenses | 1,201,305 | 1,212,039 | 1,263,938 | 1,293,790 | 1,379,408 | 4.82 |
| Net Operating Income | $2,601,881 | $2,494,861 | $2,338,758 | $2,293,749 | $3,072,074 | $10.73 |
| TI/LC | 0 | 0 | 0 | 0 | 228,160 | 0.80 |
| Capital Expenditures | 0 | 0 | 0 | 0 | 57,277 | 0.20 |
| Net Cash Flow | $2,601,881 | $2,494,861 | $2,338,758 | $2,293,749 | $2,786,636 | $9.73 |
| (1) | U/W Base Rent includes $102,088 of contractual rent increases through May 2016. |
| (2) | U/W Vacancy is based on the in-place vacancy and represents 14.6% of total gross income. |
THE INFORMATION IN THIS STRUCTURAL AND COLLATERAL TERM SHEET IS NOT COMPLETE AND MAY BE AMENDED PRIOR TO THE TIME OF SALE. THIS TERM SHEET IS NOT AN OFFER TO SELL THESE SECURITIES AND IT IS NOT A SOLICITATION OF AN OFFER TO BUY THESE SECURITIES IN ANY JURISDICTION WHERE THE OFFER OR SALE IS NOT PERMITTED.
| 54 |
27122 – 27136 Paseo Espada & 27121 – 27131 Calle Arroyo San Juan Capistrano, CA 92675 | Collateral Asset Summary – Loan No. 5 Capistrano Business Center I & II | Cut-off Date Balance: Cut-off Date LTV: U/W NCF DSCR: U/W NOI Debt Yield: | $34,700,000 61.5% 1.91x 8.9% |
Property Management. The Capistrano Business Center I & II Property is managed by S.M. Farthington Ltd., LLC, dba Seligman Western Enterprises, Ltd. II, a borrower affiliate.
Lockbox / Cash Management. The Capistrano Business Center I & II Loan is structured with a hard lockbox and springing cash management. The borrowers are required to direct all tenants to deposit all rents and other payments in to the lockbox account controlled by the lender that was established by the borrowers at closing. Provided no Trigger Period (as defined below) is continuing, all funds in the cash management account are swept daily to the borrower’s operating account. Upon the occurrence and during the continuance of a Trigger Period, all transfers to borrowers’ operating account will cease and all funds in the lockbox account will be swept on each business day to a cash management account under the control of the lender and disbursed in accordance with the Capistrano Business Center I & II Loan documents, with any excess funds being held by lender as additional collateral for the Capistrano Business Center I & II Loan.
A “Trigger Period” will occur upon (i) an event of default, (ii) the debt service coverage ratio falls below 1.15x as of the last day of any calendar quarter or (iii) the period that any mezzanine loan is outstanding, until such time as (a) with respect to clause (i), the event of default has been cured and (b) with respect to clause (ii), the debt service coverage ratio is at least 1.20x for two consecutive quarters and (c) with respect to clause (iii), the mezzanine loan is no longer outstanding.
Initial Reserves. At closing, the borrowers deposited (i) $110,529 into a tax reserve account, (ii) $300,000 into a TI/LC reserve account and (iii) $68,202 into a required repairs reserve, which represents 110% of the amount recommended by the property condition report.
Ongoing Reserves. On a monthly basis, the borrowers are required to deposit reserves of (i) 1/12 of the estimated annual real estate taxes, which currently equates to $32,369, into a tax reserve account, (ii) $4,773 into a replacement reserve account and (iii) $23,150 into a TI/LC reserve account, subject to a cap of $400,000. In addition, 1/12 of the annual insurance premium will be required to be deposited into an insurance reserve account if an acceptable blanket insurance policy is no longer in place.
Current Mezzanine or Subordinate Indebtedness. None.
Future Mezzanine or Subordinate Indebtedness Permitted. The borrowers are permitted to obtain future mezzanine financing provided that, among other conditions, the principal amount of such mezzanine loan when combined with the principal amount of the Capistrano Business Center I & II Loan will result in a (i) combined LTV of no more than 61.5%, (ii) combined debt service coverage ratio of no less than 1.38x and (iii) debt yield of no less than 8.16%.
THE INFORMATION IN THIS STRUCTURAL AND COLLATERAL TERM SHEET IS NOT COMPLETE AND MAY BE AMENDED PRIOR TO THE TIME OF SALE. THIS TERM SHEET IS NOT AN OFFER TO SELL THESE SECURITIES AND IT IS NOT A SOLICITATION OF AN OFFER TO BUY THESE SECURITIES IN ANY JURISDICTION WHERE THE OFFER OR SALE IS NOT PERMITTED.
| 55 |
27122 – 27136 Paseo Espada & 27121 – 27131 Calle Arroyo San Juan Capistrano, CA 92675 | Collateral Asset Summary – Loan No. 5 Capistrano Business Center I & II | Cut-off Date Balance: Cut-off Date LTV: U/W NCF DSCR: U/W NOI Debt Yield: | $34,700,000 61.5% 1.91x 8.9% |
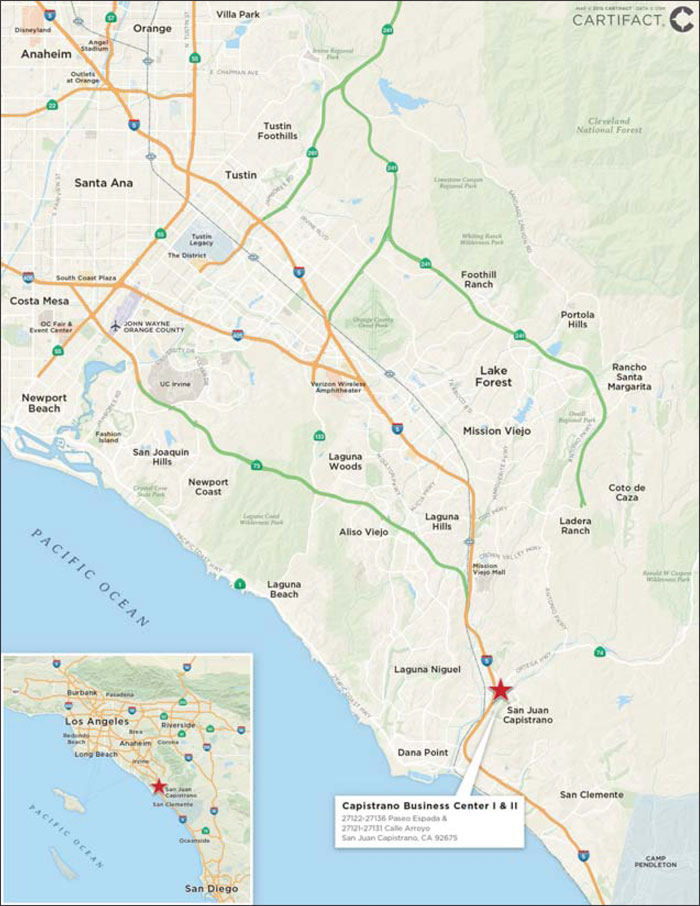
THE INFORMATION IN THIS STRUCTURAL AND COLLATERAL TERM SHEET IS NOT COMPLETE AND MAY BE AMENDED PRIOR TO THE TIME OF SALE. THIS TERM SHEET IS NOT AN OFFER TO SELL THESE SECURITIES AND IT IS NOT A SOLICITATION OF AN OFFER TO BUY THESE SECURITIES IN ANY JURISDICTION WHERE THE OFFER OR SALE IS NOT PERMITTED.
| 56 |
(THIS PAGE INTENTIONALLY LEFT BLANK)
| 57 |
| Various | Collateral Asset Summary – Loan No. 6 Walgreens Net Lease Portfolio V | Cut-off Date Balance: Cut-off Date LTV: U/W NCF DSCR: U/W NOI Debt Yield: | $33,963,675 69.9% 1.81x 7.8% |
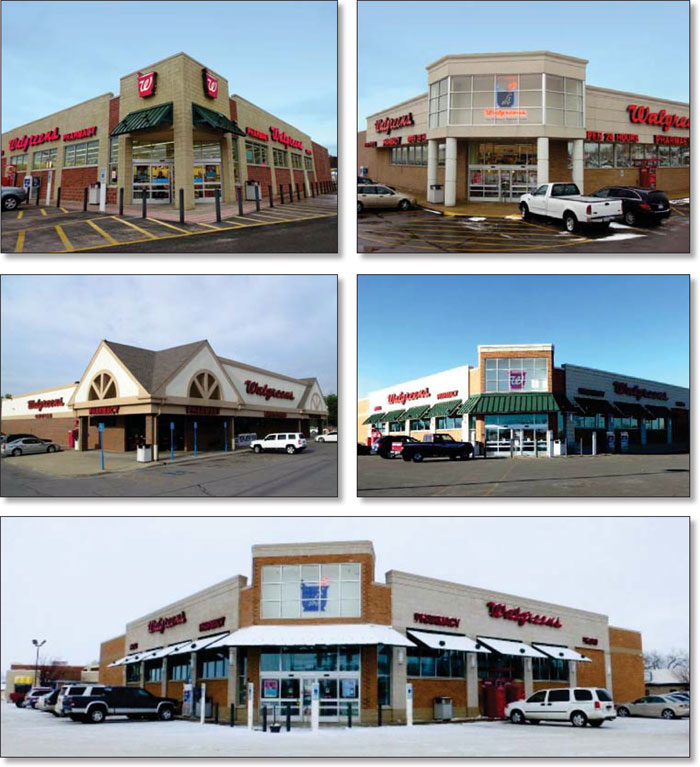
THE INFORMATION IN THIS STRUCTURAL AND COLLATERAL TERM SHEET IS NOT COMPLETE AND MAY BE AMENDED PRIOR TO THE TIME OF SALE. THIS TERM SHEET IS NOT AN OFFER TO SELL THESE SECURITIES AND IT IS NOT A SOLICITATION OF AN OFFER TO BUY THESE SECURITIES IN ANY JURISDICTION WHERE THE OFFER OR SALE IS NOT PERMITTED.
| 58 |
| Various | Collateral Asset Summary – Loan No. 6 Walgreens Net Lease Portfolio V | Cut-off Date Balance: Cut-off Date LTV: U/W NCF DSCR: U/W NOI Debt Yield: | $33,963,675 69.9% 1.81x 7.8% |
| Mortgage Loan Information | |
| Loan Seller: | KeyBank |
| Loan Purpose: | Acquisition |
| Sponsor: | DFB Holdings, LLC; Douglas F. Blough |
| Borrower: | WG DST 5 |
| Original Balance: | $33,963,675 |
| Cut-off Date Balance: | $33,963,675 |
| % by Initial UPB: | 2.6% |
Interest Rate(1): | 4.2200% |
| Payment Date: | 1st of each month |
| First Payment Date: | February 1, 2015 |
Anticipated Repayment Date(1): | January 1, 2025 |
| Maturity Date: | January 1, 2030 |
Amortization(2): | Interest Only, ARD |
Additional Debt(3): | $9,694,360 Mezzanine Debt |
| Call Protection: | L(29), D(88), O(3) |
| Lockbox / Cash Management: | Hard / In Place |
Reserves(4) | ||
| Initial | Monthly | |
| Taxes: | $0 | Springing |
| Insurance: | $0 | Springing |
| Financial Information | ||
| Mortgage Loan | Total Debt(5) | |
| Cut-off Date Balance / Sq. Ft.: | $287 | $369 |
| ARD Balance / Sq. Ft.: | $287 | $369 |
| Cut-off Date LTV: | 69.9% | 89.9% |
| ARD LTV: | 69.9% | 89.9% |
Underwritten NOI DSCR: | 1.83x | 1.56x |
Underwritten NCF DSCR: | 1.81x | 1.55x |
| Underwritten NOI Debt Yield: | 7.8% | 6.1% |
| Underwritten NCF Debt Yield: | 7.8% | 6.0% |
| Underwritten NOI Debt Yield at Balloon: | 7.8% | 6.1% |
| Underwritten NCF Debt Yield at Balloon: | 7.8% | 6.0% |
| Property Information | |
| Single Asset / Portfolio: | Portfolio of eight properties |
| Property Type: | Single Tenant Retail |
| Collateral: | Fee Simple |
| Location: | Various |
| Year Built / Renovated: | Various / NAP |
| Total Sq. Ft.: | 118,155 |
| Property Management: | Self-managed |
| Underwritten NOI: | $2,655,867 |
| Underwritten NCF: | $2,632,236 |
| Appraised Value: | $48,580,000 |
| Appraisal Date: | November 2014 |
Historical NOI(6) | |
| 2014 NOI: | NAV |
| 2013 NOI: | NAV |
| 2012 NOI: | NAV |
Historical Occupancy(6) | |
| 2014 Occupancy: | 100.0% (December 19, 2014) |
| 2013 Occupancy: | NAV |
| 2012 Occupancy: | NAV |
| (1) | If the mortgage loan is not paid in full by the Anticipated Repayment Date (“ARD”), the interest rate will increase to 2.0000% per annum plus the greater of (i) 4.2200%, or (ii) the 10-year treasury yield as of the first business day after the ARD. The additional interest will accrue, but the payment of said interest will be deferred until the maturity date. |
| (2) | The Walgreens Net Lease Portfolio V Loan is interest only through the ARD. |
| (3) | See “Current Mezzanine or Subordinate Indebtedness” herein. |
| (4) | See “Initial Reserves” and “Ongoing Reserves” herein. |
| (5) | The Total Debt metrics are calculated using the current interest rate of 5.0000% on 50.0% of the mezzanine debt. See “Current Mezzanine or Subordinate Indebtedness” herein. |
| (6) | The properties were part of a sale-leaseback, therefore, Historical NOI and Historical Occupancy are not available. |
THE INFORMATION IN THIS STRUCTURAL AND COLLATERAL TERM SHEET IS NOT COMPLETE AND MAY BE AMENDED PRIOR TO THE TIME OF SALE. THIS TERM SHEET IS NOT AN OFFER TO SELL THESE SECURITIES AND IT IS NOT A SOLICITATION OF AN OFFER TO BUY THESE SECURITIES IN ANY JURISDICTION WHERE THE OFFER OR SALE IS NOT PERMITTED.
| 59 |
| Various | Collateral Asset Summary – Loan No. 6 Walgreens Net Lease Portfolio V | Cut-off Date Balance: Cut-off Date LTV: U/W NCF DSCR: U/W NOI Debt Yield: | $33,963,675 69.9% 1.81x 7.8% |
| Property Summary | ||||||
Property Name | Location | Sq. Ft. | Year Built | Allocated Loan Amount | Appraised Value | Occupancy(1) |
| Walgreens #10652 | Billings, MT | 14,820 | 2007 | $5,219,142 | $7,510,000 | 100.0% |
| Walgreens #4536 | Saint Joseph, MI | 16,380 | 1998 | $4,956,211 | $7,120,000 | 100.0% |
| Walgreens #4066 | Yukon, OK | 13,905 | 1997 | $4,228,646 | $6,080,000 | 100.0% |
| Walgreens #9402 | Vicksburg, MS | 14,820 | 2005 | $4,215,090 | $5,800,000 | 100.0% |
| Walgreens #3018 | Tulsa, OK | 14,740 | 1994 | $4,027,342 | $5,790,000 | 100.0% |
| Walgreens #10007 | Watertown, SD | 15,020 | 2006 | $3,934,114 | $5,660,000 | 100.0% |
| Walgreens #10347 | Mitchell, SD | 14,820 | 2007 | $3,915,928 | $5,630,000 | 100.0% |
| Walgreens #11981 | Summersville, WV | 13,650 | 2008 | $3,467,202 | $4,990,000 | 100.0% |
| Total / Wtd. Avg. | 118,155 | $33,963,675 | $48,580,000 | 100.0% | ||
| (1) | Based on rent roll dated December 19, 2014. |
| Tenant Summary | ||||||||
Tenant | Ratings (Fitch/Moody’s/S&P)(1) | Net Rentable Area (Sq. Ft.) | % of Net Rentable Area | U/W Base Rent PSF | % of Total U/W Base Rent | Lease Expiration | ||
| Walgreens | NR/Baa2/BBB | 118,155 | 100.0% | $23.30 | 100.0% | 12/31/2029(2) | ||
| Total Occupied Collateral | 118,155 | 100.0% | $23.30 | 100.0% | ||||
| Vacant | 0 | 0.0% | ||||||
| Total | 118,155 | 100.0% | ||||||
| (1) | Certain ratings may be those of the parent company whether or not the parent company guarantees the lease. |
| (2) | The Walgreens Net Lease Portfolio V Properties each have 12, five-year renewal options. |
| Lease Rollover Schedule | |||||||||||||||
| Year | # of Leases Expiring | Total Expiring Sq. Ft. | % of Total Sq. Ft. Expiring | Cumulative Sq. Ft. Expiring | Cumulative % of Sq. Ft. Expiring | Annual U/W Base Rent PSF | % U/W Base Rent Rolling | Cumulative % of U/W Base Rent | |||||||
| MTM | 0 | 0 | 0.0% | 0 | 0.0% | 0.0% | |||||||||
| 2015 | 0 | 0 | 0.0% | 0 | 0.0% | $0.00 | 0.0% | 0.0% | |||||||
| 2016 | 0 | 0 | 0.0% | 0 | 0.0% | $0.00 | 0.0% | 0.0% | |||||||
| 2017 | 0 | 0 | 0.0% | 0 | 0.0% | $0.00 | 0.0% | 0.0% | |||||||
| 2018 | 0 | 0 | 0.0% | 0 | 0.0% | $0.00 | 0.0% | 0.0% | |||||||
| 2019 | 0 | 0 | 0.0% | 0 | 0.0% | $0.00 | 0.0% | 0.0% | |||||||
| 2020 | 0 | 0 | 0.0% | 0 | 0.0% | $0.00 | 0.0% | 0.0% | |||||||
| 2021 | 0 | 0 | 0.0% | 0 | 0.0% | $0.00 | 0.0% | 0.0% | |||||||
| 2022 | 0 | 0 | 0.0% | 0 | 0.0% | $0.00 | 0.0% | 0.0% | |||||||
| 2023 | 0 | 0 | 0.0% | 0 | 0.0% | $0.00 | 0.0% | 0.0% | |||||||
| 2024 | 0 | 0 | 0.0% | 0 | 0.0% | $0.00 | 0.0% | 0.0% | |||||||
| 2025 | 0 | 0 | 0.0% | 0 | $0.00 | 0.0% | 0.0% | ||||||||
| Thereafter | 8 | 118,155 | 100.0% | ||||||||||||
| Vacant | NAP | 0 | 118,155 | NAP | NAP | ||||||||||
| Total / Wtd. Avg. | 8 | 100.0% | 100.0% | ||||||||||||
The Loan. The Walgreens Net Lease Portfolio V loan (the “Walgreens Net Lease Portfolio V Loan”) is a fixed rate loan secured by the borrower’s fee simple interest in a 118,155 sq. ft., single tenant retail portfolio of eight properties located in Montana, Michigan, Oklahoma, Mississippi, South Dakota, and West Virginia (the “Walgreens Net Lease Portfolio V Properties”) with an original principal balance of approximately $34.0 million. The Walgreens Net Lease Portfolio V Loan has an anticipated repayment date of January 1, 2025 (the “Anticipated Repayment Date” or “ARD”) and a stated maturity date of January 1, 2030. Prior to and including the Anticipated Repayment Date, the Walgreens Net Lease Portfolio V Loan is interest only and accrues interest at a fixed rate of 4.2200%. After the Anticipated Repayment Date, the Walgreens Net Lease Portfolio V Loan accrues interest at a fixed rate that is equal to 2.0000% per annum plus the greater of (i) 4.2200%, or (ii) the 10-year treasury yield as of the first business day after the ARD (the “Adjusted Interest Rate”). See “Anticipated Repayment Date” herein.
Loan proceeds, along with approximately $3.5 million in equity from the borrower and approximately $9.7 million in lender-allocated mezzanine debt, were used to acquire the Walgreens Net Lease Portfolio V Properties for approximately $46.0 million and pay closing costs of approximately $1.1 million. Based on the combined appraised value of approximately $48.6 million as of November 2014, the
THE INFORMATION IN THIS STRUCTURAL AND COLLATERAL TERM SHEET IS NOT COMPLETE AND MAY BE AMENDED PRIOR TO THE TIME OF SALE. THIS TERM SHEET IS NOT AN OFFER TO SELL THESE SECURITIES AND IT IS NOT A SOLICITATION OF AN OFFER TO BUY THESE SECURITIES IN ANY JURISDICTION WHERE THE OFFER OR SALE IS NOT PERMITTED.
| 60 |
| Various | Collateral Asset Summary – Loan No. 6 Walgreens Net Lease Portfolio V | Cut-off Date Balance: Cut-off Date LTV: U/W NCF DSCR: U/W NOI Debt Yield: | $33,963,675 69.9% 1.81x 7.8% |
cut-off date LTV is 69.9%. The most recent financing of the Walgreens Net Lease Portfolio V Properties was not included in a securitization.
| Sources and Uses | ||||||
| Sources | Proceeds | % of Total | Uses | Proceeds | % of Total | |
| Loan Amount | $33,963,675 | 72.0% | Purchase Price | $46,043,398 | 97.6% | |
| Mezzanine Loan | $9,694,360 | 20.6% | Closing Costs | $1,120,932 | 2.4% | |
| Sponsor Equity | $3,506,295 | 7.4% | ||||
| Total Sources | $47,164,330 | 100.0% | Total Uses | $47,164,330 | 100.0% | |
The Borrower / Sponsor. The borrower, WG DST 5, is a single purpose Delaware Statutory Trust structured to be bankruptcy-remote. The sponsors of the borrower and nonrecourse carve-out guarantors, on a joint and several basis, are DFB Holdings, LLC and Douglas F. Blough.
The Properties. The Walgreens Net Lease Portfolio V Properties consist of eight single tenant retail buildings totaling 118,155 sq. ft. located in six states. The properties were built between 1994 and 2008 and range in size from 13,650 sq. ft. to 16,380 sq. ft. The assets were purchased as part of a sale-leaseback from Walgreens in December 2014.
Walgreens #10652 is a 14,820 sq. ft. single tenant retail building located in Billings, Montana, approximately three miles north of the Billings central business district. Primary access to the area is provided by Route 87, which crosses the Billings metropolitan area in a north-south direction, and Interstate 90, which travels the southeastern edge of Billings. Traffic reports indicate approximately 27,480 vehicles pass the property each day. The population within a three-mile radius of the property is approximately 33,956 and has a median household income of $49,014 as of 2014.
Walgreens #4536 is a 16,380 sq. ft. single tenant retail building located in Saint Joseph, Michigan, approximately 85 miles southwest of Grand Rapids, Michigan. Primary access to the area is provided by M-63, along which approximately 18,000 vehicles pass the property each day. M-63 bisects Interstate 94, which crosses the Saint Joseph area in an east-west direction, approximately two miles from the property. The population within a three-mile radius of the property is approximately 33,568 and has a median household income of $39,849 as of 2014.
Walgreens #4066 is a 13,905 sq. ft. single tenant retail building located in Yukon, Oklahoma, approximately 15 miles west of the Oklahoma City central business district. Primary access to the area is provided by Interstate 40, which crosses through the center of Canadian County one mile south of the property in an east-west direction toward Oklahoma City. Traffic reports indicate approximately 10,600 vehicles pass the property each day. The population within a three-mile radius of the property is approximately 36,293 and has a median household income of $58,574 as of 2014.
Walgreens #9402 is a 14,820 sq. ft. single tenant retail building located in Vicksburg, Mississippi, approximately 47 miles west of Jackson, MS. Primary access to the area is provided by Interstate 20, which is one mile north of the property and crosses through Warren County in an east-west direction toward Jackson. Traffic reports indicate approximately 18,000 vehicles pass the property each day. The population within a three-mile radius of the property is approximately 19,654 and has a median household income of $31,088 as of 2014.
Walgreens #3018 is a 14,740 sq. ft. single tenant retail building located in Tulsa, Oklahoma, approximately five miles southeast of the Tulsa central business district. Primary access to the area is provided by Highway 51 and Interstate 44, which cross through the Tulsa metropolitan area in a southeast-northwest and northeast-southwest direction, respectively. Traffic reports indicate approximately 46,200 vehicles pass the property each day. The population within a three-mile radius of the property is approximately 91,233 and has a median household income of $43,339 as of 2014.
Walgreens #10007 is a 15,020 sq. ft. single tenant retail building located in Watertown, South Dakota, approximately two miles south of the Watertown central business district and approximately 100 miles north of Sioux Falls, South Dakota. Primary access to the area is provided by Interstate 29, which crosses through Codington County in a north-south direction approximately three miles from the property. Traffic reports indicate approximately 18,870 vehicles pass the property each day. The population within a three-mile radius of the property is approximately 20,545 and has a median household income of $42,278 as of 2014.
Walgreens #10347 is a 14,820 sq. ft. single tenant retail building located in Mitchell, South Dakota, approximately two miles from the Mitchell central business district and approximately 70 miles from Sioux Falls, South Dakota. Primary access to the area is provided by Interstate 90, which crosses by the property one mile to the south in an east-west direction toward Sioux Falls. Traffic reports indicate approximately 14,470 vehicles pass the property each day. The population within a three-mile radius of the property is approximately 15,871 and has a median household income of $47,650 as of 2014.
Walgreens #11981 is a 13,650 sq. ft. single tenant retail building located in Summersville, West Virginia, approximately 40 miles east of Charlestown, West Virginia. Primary access to the area is provided by US 19, which crosses through Nicholas County in a north-south
THE INFORMATION IN THIS STRUCTURAL AND COLLATERAL TERM SHEET IS NOT COMPLETE AND MAY BE AMENDED PRIOR TO THE TIME OF SALE. THIS TERM SHEET IS NOT AN OFFER TO SELL THESE SECURITIES AND IT IS NOT A SOLICITATION OF AN OFFER TO BUY THESE SECURITIES IN ANY JURISDICTION WHERE THE OFFER OR SALE IS NOT PERMITTED.
| 61 |
| Various | Collateral Asset Summary – Loan No. 6 Walgreens Net Lease Portfolio V | Cut-off Date Balance: Cut-off Date LTV: U/W NCF DSCR: U/W NOI Debt Yield: | $33,963,675 69.9% 1.81x 7.8% |
direction. Traffic reports indicate approximately 18,015 vehicles pass the property each day. The population within a three-mile radius of the property is approximately 5,204 and has a median household income of $45,225 as of 2014.
Environmental Matters. The Phase I environmental reports dated November 2014, recommended no further action at the Walgreens Net Lease Portfolio V Properties.
Major Tenant.
Walgreens (118,155 sq. ft., 100.0% of NRA, 100.0% of U/W Base Rent) Walgreens Net Lease Portfolio V Properties are each 100.0% leased and occupied by Walgreens Co., a subsidiary of Walgreens Boots Alliance, Inc. (NASDAQ: WBA; Moody’s: Baa2; S&P: BBB) (“Walgreens”), under eight separate 15-year pure net leases expiring on December 31, 2029, with each lease allowing for 12, five-year renewal options. Founded in 1901, Walgreens operates the largest drugstore chain in the United States with more than 8,300 locations. For the fiscal year ended August 31, 2014, Walgreens reported approximately $76.4 billion in net sales, $1.9 billion in net income and $37.2 billion in total assets. During the same period, Walgreens increased net sales 5.8% with same store sales increasing by 4.9%. The tenant reported average store sales for the portfolio of approximately $11.5 million for the 12 months ended May 31, 2014.
The Market. The Walgreens Net Lease Portfolio V Properties are located in Michigan (1), Mississippi (1), Montana (1), Oklahoma (2), South Dakota (2) and West Virginia (1).
Cash Flow Analysis.
Cash Flow Analysis(1) | |||
| U/W | U/W PSF | ||
Base Rent(2) | $2,752,876 | $23.30 | |
| Value of Vacant Space | 0 | 0.00 | |
| Gross Potential Rent | $2,752,876 | $23.30 | |
| Total Recoveries | 480,756 | 4.07 | |
| Total Other Income | 0 | 0.00 | |
Less: Vacancy(3) | (97,009) | (0.82) | |
| Effective Gross Income | $3,136,623 | $26.55 | |
| Total Operating Expenses | 480,756 | 4.07 | |
Net Operating Income(2) | $2,655,867 | $22.48 | |
| TI/LC | 0 | 0.00 | |
| Capital Expenditures | 23,631 | 0.20 | |
Net Cash Flow(2) | $2,632,236 | $22.28 | |
| (1) | The properties were part of a sale-leaseback, therefore, historical financials are not available. |
| (2) | Base Rent assumes a straight-line average of contractual rent due under the Walgreens leases. Based on the in-place rent, the U/W Net Operating Income and U/W Net Cash Flow are $2,592,692 and $2,569,061, respectively, and result in an Underwritten NCF DSCR and Underwritten NOI Debt Yield of 1.77x and 7.6%, respectively. |
| (3) | U/W Vacancy represents 3.0% of gross income. |
Property Management. The Walgreens Net Lease Portfolio V Properties are self-managed by the tenant.
Lockbox / Cash Management. The Walgreens Net Lease Portfolio V Loan is structured with a hard lockbox and in place cash management. The borrower sent tenant direction letters to each Walgreens tenant instructing them to deposit all rents and payments into the lockbox account controlled by the lender. The funds are then returned to an account controlled by the borrower after the deduction of the scheduled monthly debt service. Upon the occurrence of a Cash Sweep Trigger (as defined herein), all rents will be swept to a segregated cash management account and held for the benefit of the lender. The lender will have a first priority security interest in the cash management account and such account will be under the lender’s sole control and the borrower will have no rights of withdrawal with respect to such account.
A “Cash Sweep Trigger” occurs upon (i) the occurrence and continuance of an event of default, (ii) the borrower or the tenant becomes the subject of a bankruptcy, insolvency or similar action, (iii) the debt service coverage ratio as calculated in the loan agreement falls below 1.55x based on a trailing three-month period until such time the debt service coverage ratio is at least 1.60x for two consecutive quarters, (iv) the loan is not paid in full three months prior to the ARD, (v) Walgreens or any replacement tenant that is acceptable to lender (“Major Tenant”) ceases to operate at two or more individual properties and the senior unsecured debt rating of the Major Tenant issued by Moody’s falls below Ba2 or the long term foreign issuer credit rating by S&P falls below BB or (vi) the senior unsecured debt rating of the Major Tenant issued by Moody’s falls below B2 or the long term foreign issuer credit rating by S&P falls below B.
THE INFORMATION IN THIS STRUCTURAL AND COLLATERAL TERM SHEET IS NOT COMPLETE AND MAY BE AMENDED PRIOR TO THE TIME OF SALE. THIS TERM SHEET IS NOT AN OFFER TO SELL THESE SECURITIES AND IT IS NOT A SOLICITATION OF AN OFFER TO BUY THESE SECURITIES IN ANY JURISDICTION WHERE THE OFFER OR SALE IS NOT PERMITTED.
| 62 |
| Various | Collateral Asset Summary – Loan No. 6 Walgreens Net Lease Portfolio V | Cut-off Date Balance: Cut-off Date LTV: U/W NCF DSCR: U/W NOI Debt Yield: | $33,963,675 69.9% 1.81x 7.8% |
Initial Reserves. None.
Ongoing Reserves. Monthly property tax and insurance collections, as applicable, will spring upon (i) an event of default, (ii) the borrower or Major Tenant failing to pay taxes and insurance premiums pursuant to the Major Tenant lease, (iii) any Major Tenant lease no longer being in full force and effect in respect of taxes, and the applicable individual property Major Tenant lease in respect of insurance collections, (iv) with respect to monthly insurance collections only, any property no longer being self-insured by Walgreens or the Major Tenant failing to maintain a credit rating from S&P of at least BBB- or (v) with respect to monthly tax collection only, debt service coverage ratio falling below 1.55x based on a trailing three-month period.
Current Mezzanine or Subordinate Indebtedness. Mezzanine debt of $51.4 million (“Acquisition Mezzanine Debt”) was used to finance the sale-leaseback of 41 Walgreens properties including the eight properties that serve as collateral for the Walgreens Net Lease Portfolio V Loan, as well as 33 properties that do not serve as collateral for the aforementioned loan. The lender allocated $9,694,360 of the Acquisition Mezzanine Debt to the Walgreens Net Lease Portfolio V Properties for illustration of combined debt metrics (“Walgreens Net Lease Portfolio V Mezzanine Debt”). 50.0% of the Acquisition Mezzanine Debt is interest-only and accrues interest at a rate of 16.4300% per annum with payment obligations only from various sources of distributable amounts payable to the mezzanine borrowers pursuant to its existing joint venture agreement. The remaining 50.0% of the Acquisition Mezzanine Debt is interest-only with a 15.0000% per annum internal rate of return and a current interest rate of 5.0000% per annum. Including the Walgreens Net Lease Portfolio V Mezzanine Debt, the Cut-off Date LTV is 89.9%, the UW NCF DSCR is 1.55x and the UW NOI Debt Yield is 6.1%. The combined debt metrics were calculated using the current interest rate of 5.0000% on 50.0% of the Walgreens Net Lease Portfolio V Mezzanine Debt.
Future Mezzanine or Subordinate Indebtedness Permitted. None.
Anticipated Repayment Date. During the post-ARD period, all excess cash flow after payment of reserves, the interest calculated at the initial interest rate, and the Walgreens Net Lease Portfolio V Properties’ operating expenses, will be applied to the outstanding principal balance of the Walgreens Net Lease Portfolio V Loan until repaid in full. The additional ARD interest which is not paid on a current basis during the post-ARD period will accrue and bear interest at the Adjusted Interest Rate.
Partial Release. None.
Substitution. None.
THE INFORMATION IN THIS STRUCTURAL AND COLLATERAL TERM SHEET IS NOT COMPLETE AND MAY BE AMENDED PRIOR TO THE TIME OF SALE. THIS TERM SHEET IS NOT AN OFFER TO SELL THESE SECURITIES AND IT IS NOT A SOLICITATION OF AN OFFER TO BUY THESE SECURITIES IN ANY JURISDICTION WHERE THE OFFER OR SALE IS NOT PERMITTED.
| 63 |
| Various | Collateral Asset Summary – Loan No. 6 Walgreens Net Lease Portfolio V | Cut-off Date Balance: Cut-off Date LTV: U/W NCF DSCR: U/W NOI Debt Yield: | $33,963,675 69.9% 1.81x 7.8% |
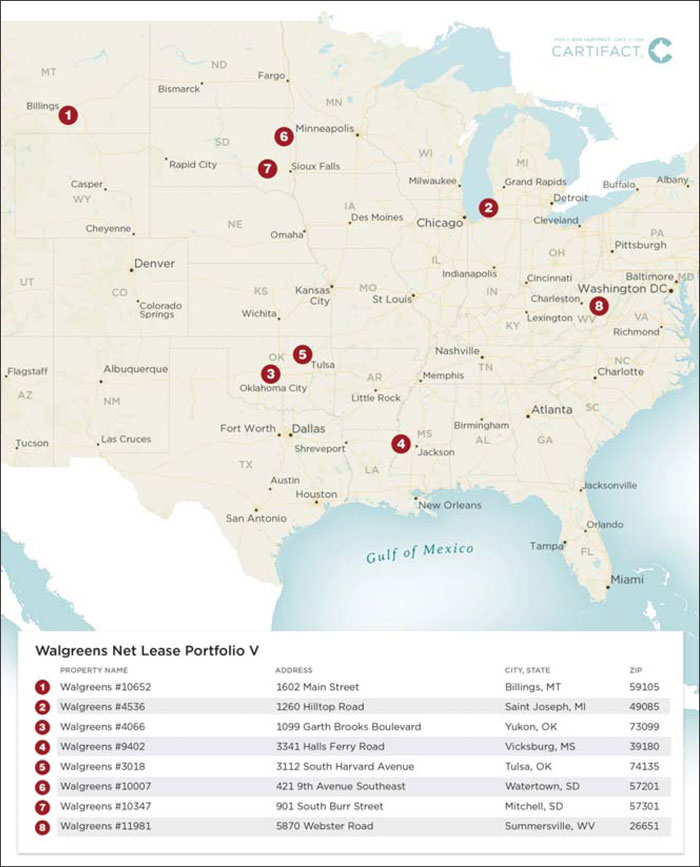
THE INFORMATION IN THIS STRUCTURAL AND COLLATERAL TERM SHEET IS NOT COMPLETE AND MAY BE AMENDED PRIOR TO THE TIME OF SALE. THIS TERM SHEET IS NOT AN OFFER TO SELL THESE SECURITIES AND IT IS NOT A SOLICITATION OF AN OFFER TO BUY THESE SECURITIES IN ANY JURISDICTION WHERE THE OFFER OR SALE IS NOT PERMITTED.
| 64 |
(THIS PAGE INTENTIONALLY LEFT BLANK)
| 65 |
2202 Mac Davis Lane Lubbock, TX 79401 | Collateral Asset Summary – Loan No. 7 University Fountains at Lubbock | Cut-off Date Balance: Cut-off Date LTV: U/W NCF DSCR: U/W NOI Debt Yield: | $27,400,000 75.1% 1.38x 8.3% |
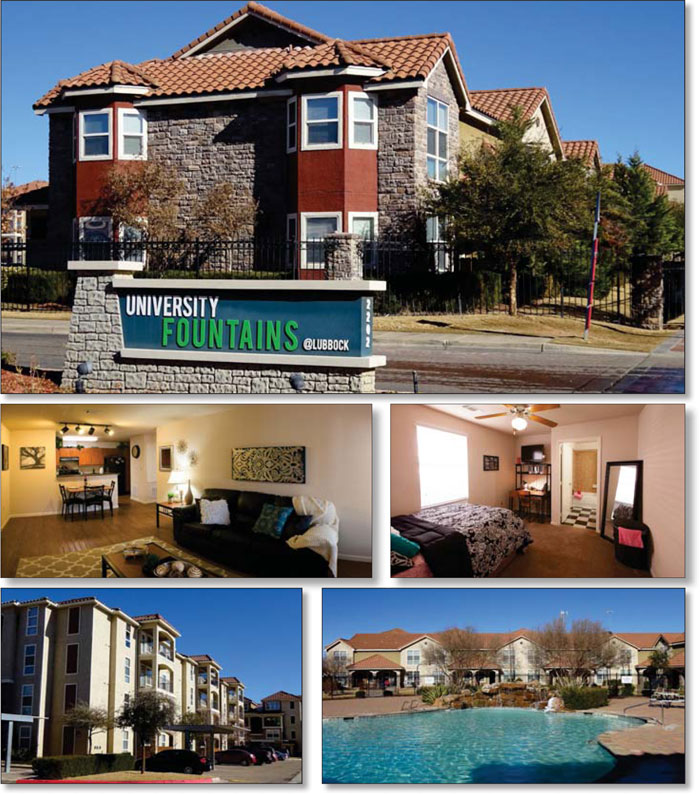
THE INFORMATION IN THIS STRUCTURAL AND COLLATERAL TERM SHEET IS NOT COMPLETE AND MAY BE AMENDED PRIOR TO THE TIME OF SALE. THIS TERM SHEET IS NOT AN OFFER TO SELL THESE SECURITIES AND IT IS NOT A SOLICITATION OF AN OFFER TO BUY THESE SECURITIES IN ANY JURISDICTION WHERE THE OFFER OR SALE IS NOT PERMITTED.
| 66 |
2202 Mac Davis Lane Lubbock, TX 79401 | Collateral Asset Summary – Loan No. 7 University Fountains at Lubbock | Cut-off Date Balance: Cut-off Date LTV: U/W NCF DSCR: U/W NOI Debt Yield: | $27,400,000 75.1% 1.38x 8.3% |
| Mortgage Loan Information | |
| Loan Seller: | KeyBank |
| Loan Purpose: | Acquisition |
| Sponsor: | Isaac Sitt; Elliot Tamir |
| Borrower: | Vesper Fountains LLC |
| Original Balance: | $27,400,000 |
| Cut-off Date Balance: | $27,400,000 |
| % by Initial UPB: | 2.1% |
| Interest Rate: | 4.1100% |
| Payment Date: | 1st of each month |
| First Payment Date: | May 1, 2015 |
| Maturity Date: | April 1, 2025 |
| Amortization: | Interest only for first 60 months; 360 months thereafter |
Additional Debt(1): | Future Mezzanine Debt Permitted |
| Call Protection: | L(26), D(88), O(6) |
| Lockbox / Cash Management: | Soft / Springing |
Reserves(2) | ||
| Initial | Monthly | |
| Taxes: | $160,043 | $53,348 |
| Insurance: | $59,736 | $7,819 |
| Replacement: | $6,282 | $6,282 |
| Capital Expenditure: | $1,800,000 | $0 |
| Financial Information | ||
| Cut-off Date Balance / Bed: | $40,177 | |
| Balloon Balance / Bed: | $36,476 | |
Cut-off Date LTV(3): | 75.1% | |
| Balloon LTV: | 68.3% | |
Underwritten NOI DSCR(4): | 1.43x | |
Underwritten NCF DSCR(4): | 1.38x | |
| Underwritten NOI Debt Yield: | 8.3% | |
| Underwritten NCF Debt Yield: | 8.0% | |
| Underwritten NOI Debt Yield at Balloon: | 9.1% | |
| Underwritten NCF Debt Yield at Balloon: | 8.8% | |
| Property Information | |
| Single Asset / Portfolio: | Single Asset |
| Property Type: | Student Housing Multifamily |
| Collateral: | Fee Simple |
| Location: | Lubbock, TX |
| Year Built / Renovated: | 2005 / NAP |
| Total Beds: | 683 |
| Property Management: | Asset Campus Housing, Inc. |
| Underwritten NOI: | $2,266,947 |
| Underwritten NCF: | $2,191,561 |
“As-is” Appraised Value(3): | $34,500,000 |
“As-is” Appraisal Date(3): | January 5, 2015 |
“As Renovated” Appraised Value(3): | $36,500,000 |
“As Renovated” Appraisal Date(3): | January 1, 2017 |
| Historical NOI | |
| Most Recent NOI: | $2,196,458 (T-12 January 31, 2015) |
| 2014 NOI: | $2,101,359 (December 31, 2014) |
| 2013 NOI: | $1,837,152 (December 31, 2013) |
| 2012 NOI: | $2,478,309 (December 31, 2012) |
| Historical Occupancy | |
| Most Recent Occupancy: | 96.2% (March 2, 2015) |
| 2014 Occupancy: | 98.5% (December 12, 2014) |
| 2013 Occupancy: | 90.5% (December 31, 2013) |
| 2012 Occupancy: | NAV |
| (1) | See “Future Mezzanine or Subordinate Indebtedness Permitted” herein. |
| (2) | See “Initial Reserves” and “Ongoing Reserves” herein. |
| (3) | The Cut-off Date LTV is based on the “As Renovated” Appraised Value, which takes into account capital expenditures being performed at the property. Based on the “As-Is” Appraised Value of $34.5 million, the Cut-off Date LTV is 79.4% |
| (4) | Based on amortizing debt service payments. Based on the current interest only payments, the Underwritten NOI DSCR and Underwritten NCF DSCR are 1.99x and 1.92x, respectively. |
THE INFORMATION IN THIS STRUCTURAL AND COLLATERAL TERM SHEET IS NOT COMPLETE AND MAY BE AMENDED PRIOR TO THE TIME OF SALE. THIS TERM SHEET IS NOT AN OFFER TO SELL THESE SECURITIES AND IT IS NOT A SOLICITATION OF AN OFFER TO BUY THESE SECURITIES IN ANY JURISDICTION WHERE THE OFFER OR SALE IS NOT PERMITTED.
| 67 |
2202 Mac Davis Lane Lubbock, TX 79401 | Collateral Asset Summary – Loan No. 7 University Fountains at Lubbock | Cut-off Date Balance: Cut-off Date LTV: U/W NCF DSCR: U/W NOI Debt Yield: | $27,400,000 75.1% 1.38x 8.3% |
Unit Mix Summary(1) | ||||||||||||||||||
| Unit Type | # of Beds | % of Total | Occupied Beds(2) | Occupancy | Average Bed Size (Sq. Ft.) | Average Monthly Rental Rate | Average Monthly Rental Rate PSF | Monthly Market Rental Rate | Monthly Market Rental Rate PSF | |||||||||
| 1 Bed / 1 Bath | 36 | 5.3% | 35 | 97.2% | 491 | $791 | $1.61 | $815 | $1.64 | |||||||||
| 3 Bed / 3 Bath flat | 216 | 31.6% | 209 | 96.8% | 394 | $558 | $1.42 | $575 | $1.44 | |||||||||
| 3 Bed / 3 Bath TH | 144 | 21.1% | 139 | 96.5% | 468 | $575 | $1.23 | $595 | $1.25 | |||||||||
| 4 Bed / 4 Bath loft | 144 | 21.1% | 137 | 95.1% | 379 | $566 | $1.49 | $590 | $1.53 | |||||||||
| 4 Bed / 4 Bath | 143 | 20.9% | 137 | 95.8% | 415 | $555 | $1.34 | $575 | $1.35 | |||||||||
| Total / Wtd. Avg. | 683 | 100.0% | 657 | 96.2% | 416 | $575 | $1.38 | $595 | $1.40 | |||||||||
| (1) | Source: Appraisal. |
| (2) | Based on the rent roll dated March 2, 2015. |
The Loan. The University Fountains at Lubbock loan (the “University Fountains at Lubbock Loan”) is a fixed rate loan secured by the borrower’s fee simple interest in a student housing multifamily property totaling 683 beds within 228 units located in Lubbock, Texas (the “University Fountains at Lubbock Property”). The University Fountains at Lubbock Loan has a 10-year term and is interest only for the first 60 months of the term and amortizes on a 30-year schedule thereafter. The University Fountains at Lubbock Loan accrues interest at a fixed rate equal to 4.1100% and has a cut-off date balance of $27.4 million. Loan proceeds, along with approximately $8.8 million of sponsor equity were used to purchase the University Fountains at Lubbock Property for $34.0 million, fund reserves of approximately $2.0 million and pay closing costs of approximately $0.5 million. Based on the “As Renovated” appraised value of $36.5 million as of January 1, 2017, the cut-off date LTV is 75.1%. The most recent financing of the University Fountains at Lubbock Property was not included in a securitization.
| Sources and Uses | ||||||
| Sources | Proceeds | % of Total | Uses | Proceeds | % of Total | |
| Loan Amount | $27,400,000 | 75.0% | Purchase Price | $34,000,000 | 93.1% | |
| Sponsor Equity | $8,820,319 | 24.2% | Reserves(1) | $2,026,061 | 5.5% | |
Capital Expenditure Reserve Funds(1) | $300,000 | 0.8% | Closing Costs | $494,258 | 1.4% | |
| Total Sources | $36,520,319 | 100.0% | Total Uses | $36,520,319 | 100.0% | |
| (1) | The borrower deposited $1,800,000 into the Capital Expenditure Reserve and $300,000 was released to the borrower to commence renovations. |
The Borrower / Sponsor. The borrower, Vesper Fountains LLC, is a single purpose Delaware limited liability company structured to be bankruptcy-remote with two independent directors in its organizational structure. The sponsors of the borrower and the non-recourse carve-out guarantors are Isaac Sitt and Elliot Tamir.
Isaac Sitt and Elliot Tamir founded Vesper Holdings LLC (“Vesper”), a privately held New York based real estate investment firm, in 2007. Vesper owns a diverse portfolio that is comprised of retail, parking and office property types, with a primary focus on student housing and conventional multifamily. Vesper owns and operates a portfolio consisting of 25 properties located throughout the United States representing three million square feet of retail, office, parking garage spaces, and over 8,000 residential beds valued at approximately $500.0 million.
The Property. The University Fountains at Lubbock Property is a 683-bed (228-unit), garden-style student housing multifamily property located on a 12.15-acre site that was developed in 2005. The loan sponsors purchased the property for a cost of $34.0 million ($49,780 per bed). As of March 2, 2015, the property was 96.2% occupied and as of April 15, 2015, the property was 98.7% pre-leased for the 2015-2016 school year. Approximately 97.4% of the 2015-2016 leases have 12-month terms and parental guarantees are generally required.
Located in the North Overton master planned mixed use development, the University Fountains at Lubbock Property primarily caters to Texas Tech University (“TTU”) students. It is comprised of 17 two- and four-story apartment buildings and a clubhouse building located approximately two blocks from the TTU campus. There are 36 one-bedroom units, 72 three-bedroom flat-style units, 48 three-bedroom townhouse-style units, and 72 four-bedroom townhouse-style units, of which, 36 units contain a loft area utilized as a study area. All units are fully furnished and include living rooms, full kitchens, in-unit washer/dryer, flat-screen televisions, and one-to-one bedroom-to-bathroom ratios. Most units include a breakfast bar, a patio area and bay windows, and the loft-style floor plans include a study room.
Amenities include a clubhouse with a fitness center, tanning beds, computer lab, student study lounges, and free parking. Other property amenities include an outdoor recreation area with a pool, jacuzzi and barbeque grilling stations, as well as a sand volleyball court and basketball court. In addition, the University Fountains at Lubbock Property provides free shuttle service to the TTU campus. The University Fountains at Lubbock Property offers a total of 723 parking spaces comprised of 552 surface space and 171 carport spaces, which results in a parking ratio of approximately 1.06 spaces per bed.
After loan origination, the loan sponsors are planning to invest an additional $1.8 million into capital improvements at the property. Planned improvements include a remodel of the clubhouse, replacement of the pool furniture, swimming pool upgrades, exterior
THE INFORMATION IN THIS STRUCTURAL AND COLLATERAL TERM SHEET IS NOT COMPLETE AND MAY BE AMENDED PRIOR TO THE TIME OF SALE. THIS TERM SHEET IS NOT AN OFFER TO SELL THESE SECURITIES AND IT IS NOT A SOLICITATION OF AN OFFER TO BUY THESE SECURITIES IN ANY JURISDICTION WHERE THE OFFER OR SALE IS NOT PERMITTED.
| 68 |
2202 Mac Davis Lane Lubbock, TX 79401 | Collateral Asset Summary – Loan No. 7 University Fountains at Lubbock | Cut-off Date Balance: Cut-off Date LTV: U/W NCF DSCR: U/W NOI Debt Yield: | $27,400,000 75.1% 1.38x 8.3% |
painting, parking lot repairs and landscape upgrades. Interior renovations will include upgrading internet and cable service, and wood flooring and flat-screen television installation in units where these items do not already exist. All capital improvement items are scheduled to be completed by September 2016.
Environmental Matters. The Phase I environmental report dated December 29, 2014 recommended no further action at the University Fountains at Lubbock Property.
The Market. The University Fountains at Lubbock Property is located in Lubbock, Texas, within the Lubbock metropolitan statistical area (“MSA”). Lubbock is the 11th largest city in Texas, is the county seat for Lubbock County, and has an estimated 307,774 residents in the MSA for 2015. Interstate 27 runs north/south through Lubbock and connects the city to Interstate 20 and Interstate 40, two major east-west interstates. The University Fountains at Lubbock Property is located within the North Overton mixed use development, on Mac Davis Lane, an east-west thoroughfare which provides access to the TTU campus. The east side of the TTU campus which includes the Jones AT&T Stadium, is located approximately two blocks to the west of the University Fountains at Lubbock Property. North Overton also contains retail such as a Wal-Mart Supercenter, restaurants such as Chipotle, Starbucks, and Chili’s, and hospitality options such as the Overton Hotel and Conference Center, all located within blocks of the University Fountains at Lubbock Property.
Lubbock is the only city in the nation with a comprehensive university, a health sciences center, an agriculture college and a law school in one location, which makes TTU the second largest contiguous university campus in the United States. Founded in 1923, TTU provides students access to 150 undergraduate, 100 masters, and 50 doctoral degrees. Total enrollment for the fall 2014 semester at TTU was 35,158. From 2004 to 2014, student enrollment increased at an average annual rate of 2.2%, and the university is projecting a fall 2020 enrollment of 40,000 students. TTU students with less than 30 hours of academic credit are required to live in the residence halls on campus, however not every first year student is able to live in the residence halls. On-campus housing at TTU consists of 13 residence halls, 4 suite-style halls, and one apartment complex containing approximately 7,200 beds, which is sufficient to house approximately 20.5% of students enrolled at the university.
Including the University Fountains at Lubbock Property, there are nine purpose-built privately-owned student housing properties containing approximately 5,156 beds within the North Overton submarket. There are two off-campus student housing properties planned in the North Overton submarket which are expected to deliver an additional 2,334 beds. The first, a 734-bed property, has an estimated completion date of August 2016, and the second, a 1,600-bed property, has an estimated completion date of fall of 2017. There are no on-campus housing properties currently planned or under construction.
The appraisal identified six competitive student apartment properties that were built between 1968 and 2009 and range in size from 334 to 847 beds. The occupancy of the rent comparables ranged from 97.9% to 100.0%, and the average rent at the competitive properties ranged from $551 to $876 per bed or $1.24 to $1.50 PSF. By comparison, the University Fountains at Lubbock Property’s average monthly rent is $575 per bed or $1.38 PSF.
The appraisal considers the following six properties to constitute the University Fountains at Lubbock Property’s competitive set:
Competitive Set (1) | |||||||
| Name | University Fountains at Lubbock Property | University Trails | The Centre at Overton | The Suites at Overton | U Lofts | University Pointe | The Cottages of Lubbock |
| Distance to Texas Tech | 2 blocks | 2 blocks | 1 block | 1 block | < 1 block | 2 blocks | 7 blocks |
| Year Built | 2005 | 2002 | 2006 | 2009 | 1968 | 2004 | 2008 |
| Total Occupancy | 96.2%(2) | 100.0% | 99.0% | 98.1% | 98.9% | 100.0% | 97.9% |
| No. of Beds | 683(2) | 684 | 401 | 465 | 334 | 682(3) | 847 |
| Avg. Rent Per Bed | $575(2) | $551 | $792 | $799 | $876 | $502 | $561 |
| (1) | Source: Appraisal. |
| (2) | Based on a rent roll dated March 2, 2015. |
| (3) | Source: University Pointe property owner. |
THE INFORMATION IN THIS STRUCTURAL AND COLLATERAL TERM SHEET IS NOT COMPLETE AND MAY BE AMENDED PRIOR TO THE TIME OF SALE. THIS TERM SHEET IS NOT AN OFFER TO SELL THESE SECURITIES AND IT IS NOT A SOLICITATION OF AN OFFER TO BUY THESE SECURITIES IN ANY JURISDICTION WHERE THE OFFER OR SALE IS NOT PERMITTED.
| 69 |
2202 Mac Davis Lane Lubbock, TX 79401 | Collateral Asset Summary – Loan No. 7 University Fountains at Lubbock | Cut-off Date Balance: Cut-off Date LTV: U/W NCF DSCR: U/W NOI Debt Yield: | $27,400,000 75.1% 1.38x 8.3% |
Cash Flow Analysis.
| Cash Flow Analysis | ||||||
| 2012 | 2013 | 2014 | T-12 1/31/2015 | U/W | U/W per Bed | |
Gross Potential Rent | $4,783,129 | $4,701,137 | $4,705,492 | $4,704,364 | $4,801,632 | $7,030 |
| Total Other Income | 253,162 | 226,398 | 298,940 | 271,314 | 298,940 | 438 |
Less: Concessions(1) | (42,856) | (67,399) | (60,815) | (61,684) | (46,000) | (67) |
Less: Vacancy & Credit Loss(2) | (276,470) | (677,734) | (353,053) | (334,254) | (264,630) | (387) |
| Effective Gross Income | $4,716,965 | $4,182,402 | $4,590,563 | $4,579,740 | $4,789,942 | $7,013 |
| Total Operating Expenses | 2,238,656 | 2,345,250 | 2,489,204 | 2,383,282 | 2,522,995 | 3,694 |
| Net Operating Income | $2,478,309 | $1,837,152 | $2,101,359 | $2,196,458 | $2,266,947 | $3,319 |
| Capital Expenditures | 0 | 103,728 | 0 | 4,405 | 75,386 | 110 |
| Net Cash Flow | $2,478,309 | $1,733,424 | $2,101,359 | $2,192,053 | $2,191,561 | $3,209 |
| (1) | U/W Concessions represent 1.0% of Gross Potential Rent. |
| (2) | U/W Vacancy & Credit Loss includes $24,548 of credit loss (0.5% of Gross Potential Rent) and economic vacancy of $240,082 (5.0% of Gross Potential Rent). |
Property Management. The University Fountains at Lubbock Property is managed by Asset Campus Housing, Inc., a privately-owned third party student housing multifamily management company, that currently manages more than 120 properties containing over 70,000 beds.
Lockbox / Cash Management. The University Fountains at Lubbock Loan is structured with a soft lockbox and springing cash management. The borrower and property manager are required to deposit all rents and other revenue into a clearing account within one business day of receipt. All funds in the clearing account are swept daily into the borrower’s operating account unless a Cash Sweep Event (as defined herein) is continuing, in which event funds will be swept on a daily basis into the cash management account and disbursed in accordance with the loan documents. The lender will have a security interest in the cash management account and such account will be under the lender’s control and the borrower will have no rights of withdrawal with respect to such account.
A “Cash Sweep Event” will commence upon (i) the occurrence of an event of default, (ii) bankruptcy or insolvency of the borrower or the property manager or (iii) if the DSCR based on a trailing six-month basis falls below 1.10x.
Initial Reserves. At closing, the borrower deposited (i) $160,043 into a tax reserve account, (ii) $59,736 into an insurance reserve account, (iii) $6,282 into a replacement reserve account and (iv) $1,800,000 into a capital expenditure reserve account which will be held as additional collateral for the University Fountains at Lubbock Loan and released to the borrower upon the completion of the capital expenditures listed on the schedule attached to the loan agreement in accordance with the loan documents. All capital improvement items must be completed no later than 24 calendar months are the loan origination date.
Ongoing Reserves. On a monthly basis, the borrower is required to deposit reserves of (i) 1/12 of the estimated annual real estate taxes, which currently equates to $53,348, into a tax reserve account, (ii) 1/12 of the annual insurance premium, which currently equates to $7,819, into an insurance reserve account and (iii) $6,282 into a replacement reserve account (approximately $110 per bed annually).
Current Mezzanine or Subordinate Indebtedness. None.
Future Mezzanine or Subordinate Indebtedness Permitted. Future mezzanine debt is permitted, provided, if among other things as detailed in the loan agreement, (i) no event of default has occurred and is continuing, (ii) the combined LTV does not exceed 75.0%, (iii) an acceptable intercreditor agreement has been executed.
THE INFORMATION IN THIS STRUCTURAL AND COLLATERAL TERM SHEET IS NOT COMPLETE AND MAY BE AMENDED PRIOR TO THE TIME OF SALE. THIS TERM SHEET IS NOT AN OFFER TO SELL THESE SECURITIES AND IT IS NOT A SOLICITATION OF AN OFFER TO BUY THESE SECURITIES IN ANY JURISDICTION WHERE THE OFFER OR SALE IS NOT PERMITTED.
| 70 |
2202 Mac Davis Lane Lubbock, TX 79401 | Collateral Asset Summary – Loan No. 7 University Fountains at Lubbock | Cut-off Date Balance: Cut-off Date LTV: U/W NCF DSCR: U/W NOI Debt Yield: | $27,400,000 75.1% 1.38x 8.3% |

THE INFORMATION IN THIS STRUCTURAL AND COLLATERAL TERM SHEET IS NOT COMPLETE AND MAY BE AMENDED PRIOR TO THE TIME OF SALE. THIS TERM SHEET IS NOT AN OFFER TO SELL THESE SECURITIES AND IT IS NOT A SOLICITATION OF AN OFFER TO BUY THESE SECURITIES IN ANY JURISDICTION WHERE THE OFFER OR SALE IS NOT PERMITTED.
| 71 |
225 Santa Monica Boulevard Santa Monica, CA 90401 | Collateral Asset Summary – Loan No. 8 Santa Monica Clock Tower | Cut-off Date Balance: Cut-off Date LTV: U/W NCF DSCR: U/W NOI Debt Yield: | $26,700,000 54.5% 1.80x 8.2% |
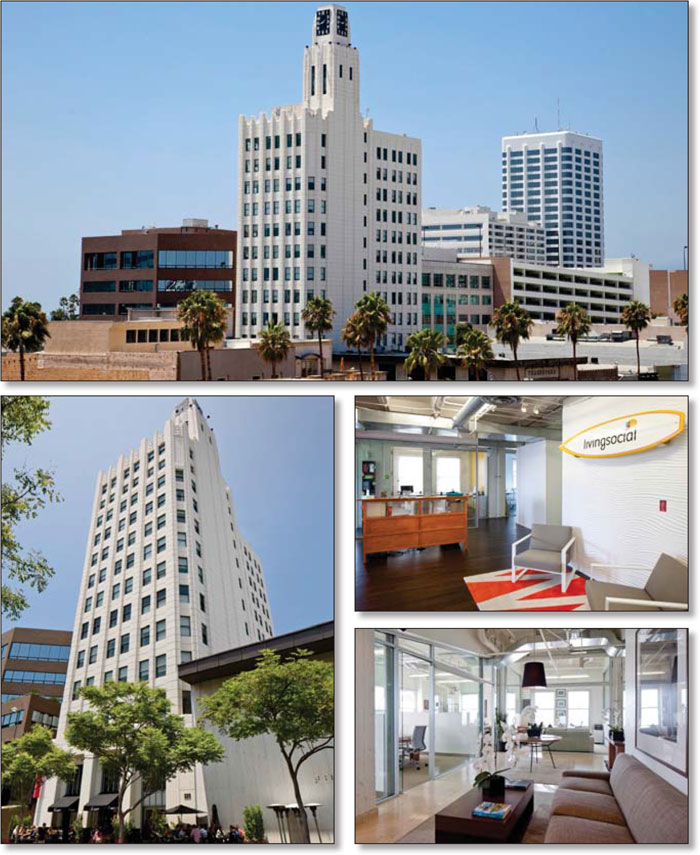
THE INFORMATION IN THIS STRUCTURAL AND COLLATERAL TERM SHEET IS NOT COMPLETE AND MAY BE AMENDED PRIOR TO THE TIME OF SALE. THIS TERM SHEET IS NOT AN OFFER TO SELL THESE SECURITIES AND IT IS NOT A SOLICITATION OF AN OFFER TO BUY THESE SECURITIES IN ANY JURISDICTION WHERE THE OFFER OR SALE IS NOT PERMITTED.
| 72 |
225 Santa Monica Boulevard Santa Monica, CA 90401 | Collateral Asset Summary – Loan No. 8 Santa Monica Clock Tower | Cut-off Date Balance: Cut-off Date LTV: U/W NCF DSCR: U/W NOI Debt Yield: | $26,700,000 54.5% 1.80x 8.2% |
| Mortgage Loan Information | |
| Loan Seller: | GACC |
| Loan Purpose: | Refinance |
| Sponsor: | Michelangelo Real Estate Corporation |
| Borrower: | SaMo Clock Tower, LLC |
| Original Balance: | $26,700,000 |
| Cut-off Date Balance: | $26,700,000 |
| % by Initial UPB: | 2.0% |
| Interest Rate: | 4.2200% |
| Payment Date: | 6th of each month |
| First Payment Date: | June 6, 2015 |
| Maturity Date: | May 6, 2025 |
| Amortization: | Interest Only |
| Additional Debt: | None |
| Call Protection: | L(25), D(91), O(4) |
| Lockbox / Cash Management: | Hard / In Place |
Reserves(1) | ||
| Initial | Monthly | |
| Taxes: | $0 | $23,626 |
| Insurance: | $0 | Springing |
| Replacement: | $261,700 | $1,589 |
| TI/LC: | $346,332 | $9,532 |
| Required Repairs: | $11,250 | NAP |
| Free Rent: | $362,344 | $0 |
| Financial Information | ||
| Cut-off Date Balance / Sq. Ft.: | $490 | |
| Balloon Balance / Sq. Ft.: | $490 | |
| Cut-off Date LTV: | 54.5% | |
| Balloon LTV: | 54.5% | |
Underwritten NOI DSCR(2): | 1.93x | |
Underwritten NCF DSCR(2): | 1.80x | |
| Underwritten NOI Debt Yield: | 8.2% | |
| Underwritten NCF Debt Yield: | 7.7% | |
| Underwritten NOI Debt Yield at Balloon: | 8.2% | |
| Underwritten NCF Debt Yield at Balloon: | 7.7% | |
| Property Information | |
| Single Asset / Portfolio: | Single Asset |
| Property Type: | CBD Office |
| Collateral: | Fee Simple |
| Location: | Santa Monica, CA |
| Year Built / Renovated: | 1929 / 2004 |
| Total Sq. Ft.: | 54,471 |
| Property Management: | Cushman & Wakefield of California, Inc. |
Underwritten NOI(3): | $2,199,241 |
| Underwritten NCF: | $2,061,501 |
| Appraised Value: | $49,000,000 |
| Appraisal Date: | March 25, 2015 |
Historical NOI(4) | |
2014 NOI(3): | $1,808,751 (December 31, 2014) |
| 2013 NOI: | NAV |
| 2012 NOI: | NAV |
| Historical Occupancy | |
Most Recent Occupancy(4): | 99.7% (April 30, 2015) |
| 2014 Occupancy: | 91.8% (December 31, 2014) |
2013 Occupancy(5): | 75.4% (December 31, 2013) |
| 2012 Occupancy: | 100.0% (December 31, 2012) |
| (1) | See “Initial Reserves” and “Ongoing Reserves” herein. |
| (2) | Based on interest-only debt service payments. Based on a hypothetical 30-year amortization schedule, the Underwritten NOI DSCR and Underwritten NCF DSCR are 1.40x and 1.31x, respectively. |
| (3) | The increase in Underwritten NOI over 2014 NOI is due in part to recent leasing at the Santa Monica Clock Tower Property. Four new leases totaling 21,949 sq. ft. (40.3% of NRA), were recently signed with commencement dates between July 2014 and October 2015. For additional information on recent leasing see “The Property” herein. |
| (4) | Assumes Revolution Studios (lease commencement date of October 2015) is in occupancy. |
| (5) | The 2013 historical occupancy over the year was 89.7%. |
THE INFORMATION IN THIS STRUCTURAL AND COLLATERAL TERM SHEET IS NOT COMPLETE AND MAY BE AMENDED PRIOR TO THE TIME OF SALE. THIS TERM SHEET IS NOT AN OFFER TO SELL THESE SECURITIES AND IT IS NOT A SOLICITATION OF AN OFFER TO BUY THESE SECURITIES IN ANY JURISDICTION WHERE THE OFFER OR SALE IS NOT PERMITTED.
| 73 |
225 Santa Monica Boulevard Santa Monica, CA 90401 | Collateral Asset Summary – Loan No. 8 Santa Monica Clock Tower | Cut-off Date Balance: Cut-off Date LTV: U/W NCF DSCR: U/W NOI Debt Yield: | $26,700,000 54.5% 1.80x 8.2% |
| Tenant Summary | |||||||
Tenant | Ratings (Fitch/Moody’s/S&P) | Net Rentable Area (Sq. Ft.) | % of Net Rentable Area | U/W Base Rent PSF | % of Total U/W Base Rent | Lease Expiration | |
Orion Health Inc.(1) | NR/NR/NR | 8,919 | 16.4% | $59.84 | 16.2% | 8/31/2020 | |
| Gum Gum, Inc. | NR/NR/NR | 8,779 | 16.1% | $60.90 | 16.3% | 1/31/2019 | |
| The Misfit | NR/NR/NR | 5,505 | 10.1% | $52.97 | 8.9% | 4/30/2021(2) | |
| The Boesch Law Group | NR/NR/NR | 4,630 | 8.5% | $58.45 | 8.2% | 1/31/2018(2) | |
| TrueCar, Inc. | NR/NR/NR | 4,520 | 8.3% | $76.43 | 10.5% | 12/31/2024(2) | |
| Total Major Tenants | 32,353 | 59.4% | $61.08 | 60.2% | |||
| Remaining Tenants | 21,948 | 40.3% | $59.49 | 39.8% | |||
| Total Occupied Collateral | 54,301 | 99.7% | $60.44 | 100.0% | |||
Vacant(3) | 170 | 0.3% | |||||
| Total | 54,471 | 100.0% | |||||
| (1) | Orion Health, Inc. is currently subleasing their space to two separate tenants, Shegerian & Associates, Inc. and Drobny Global Asset Management, L.P. For additional information on the terms of the subleases see “Major Tenants” herein. |
| (2) | The Misfit, The Boesch Law Group and True Car, Inc. each lease 350 sq. ft., 240 sq. ft. and 130 sq. ft., respectively, of storage space in the basement of the building on a month to month basis. |
| (3) | The only vacant space at the Santa Monica Clock Tower Property is storage space located in the basement of the building. |
| Lease Rollover Schedule | ||||||||
| Year | # of Leases Expiring | Total Expiring Sq. Ft. | % of Total Sq. Ft. Expiring | Cumulative Sq. Ft. Expiring | Cumulative % of Sq. Ft. Expiring | Annual U/W Base Rent PSF | % U/W Base Rent Rolling | Cumulative % of U/W Base Rent |
| MTM | 5 | 720 | 1.3% | 720 | 1.3% | $20.83 | 0.5% | 0.5% |
| 2015 | 0 | 0 | 0.0% | 720 | 1.3% | $0.00 | 0.0% | 0.5% |
| 2016 | 2 | 8,778 | 16.1% | 9,498 | 17.4% | $51.54 | 13.8% | 14.2% |
| 2017 | 2 | 8,780 | 16.1% | 18,278 | 33.6% | $59.70 | 16.0% | 30.2% |
| 2018 | 1 | 4,390 | 8.1% | 22,668 | 41.6% | $60.85 | 8.1% | 38.4% |
| 2019 | 2 | 8,779 | 16.1% | 31,447 | 57.7% | $60.90 | 16.3% | 54.6% |
| 2020 | 5 | 13,309 | 24.4% | 44,756 | 82.2% | $64.84 | 26.3% | 80.9% |
| 2021 | 2 | 5,155 | 9.5% | 49,911 | 91.6% | $54.93 | 8.6% | 89.6% |
| 2022 | 0 | 0 | 0.0% | 49,911 | 91.6% | $0.00 | 0.0% | 89.6% |
| 2023 | 0 | 0 | 0.0% | 49,911 | 91.6% | $0.00 | 0.0% | 89.6% |
| 2024 | 1 | 4,390 | 8.1% | 54,301 | 99.7% | $77.98 | 10.4% | 100.0% |
| 2025 | 0 | 0 | 0.0% | 54,301 | 99.7% | $0.00 | 0.0% | 100.0% |
| Thereafter | 0 | 0 | 0.0% | 54,301 | 99.7% | $0.00 | 0.0% | 100.0% |
| Vacant | NAP | 170 | 0.3% | 54,471 | 100.0% | NAP | NAP | |
| Total / Wtd. Avg. | 20 | 54,471 | 100.0% | $60.44 | 100.0% | |||
The Loan. The Santa Monica Clock Tower loan (the “Santa Monica Clock Tower Loan”) is a $26.7 million fixed rate loan secured by the borrower’s fee simple interest in a 54,471 sq. ft. Class A office building located at 225 Santa Monica Boulevard in Santa Monica, California (the “Santa Monica Clock Tower Property”). The Santa Monica Clock Tower Loan has a 10-year term and pays interest only for the term of the loan. The Santa Monica Clock Tower Loan accrues interest at a fixed rate equal to 4.2200%. Loan proceeds were used to pay off existing debt of approximately $18.3 million, fund upfront reserves of approximately $1.0 million, pay closing costs of approximately $0.5 million and return approximately $7.0 million of equity to the borrower. Based on the appraised value of $49.0 million, the cut-off date LTV ratio is 54.5%. The most recent prior financing of the Santa Monica Clock Tower Property was included in the MSC 2006-HQ10 securitization.
| Sources and Uses | ||||||
| Sources | Proceeds | % of Total | Uses | Proceeds | % of Total | |
| Loan Amount | $26,700,000 | 100.0% | Loan Payoff | $18,296,369 | 68.5% | |
| Reserves | $981,626 | 3.7% | ||||
| Closing Costs | $455,545 | 1.7% | ||||
| Return of Equity | $6,966,461 | 26.1% | ||||
| Total Sources | $26,700,000 | 100.0% | Total Uses | $26,700,000 | 100.0% | |
THE INFORMATION IN THIS STRUCTURAL AND COLLATERAL TERM SHEET IS NOT COMPLETE AND MAY BE AMENDED PRIOR TO THE TIME OF SALE. THIS TERM SHEET IS NOT AN OFFER TO SELL THESE SECURITIES AND IT IS NOT A SOLICITATION OF AN OFFER TO BUY THESE SECURITIES IN ANY JURISDICTION WHERE THE OFFER OR SALE IS NOT PERMITTED.
| 74 |
225 Santa Monica Boulevard Santa Monica, CA 90401 | Collateral Asset Summary – Loan No. 8 Santa Monica Clock Tower | Cut-off Date Balance: Cut-off Date LTV: U/W NCF DSCR: U/W NOI Debt Yield: | $26,700,000 54.5% 1.80x 8.2% |
The Borrower / Sponsor. The borrower, SaMo Clock Tower, LLC, is a single purpose Delaware limited liability company structured to be bankruptcy-remote, with one independent director in its organizational structure. The sponsor of the borrower and nonrecourse carve-out guarantor is Michelangelo Real Estate Corporation.
Michelangelo Real Estate Corporation is owned and controlled by Sorgente Group, a private investment holding company which, through its subsidiaries, owns and operates commercial real estate, manages real estate investment funds and offers asset management services internationally. Sorgente Group operates through three holding companies, Sorgente Group (Rome), Sorgente Group of America Corp. (New York) and Sorgente Group International Holding (London), and has been active in the United States real estate market since the early 20th century. Some notable investments it has made include taking a majority stake in the Chrysler Building and the Flatiron Building in New York City as well as the Fine Arts Building in Los Angeles. As of December 2013, the Sorgente Group owned and managed over $6.0 billion of total real estate assets.
The Property. The Santa Monica Clock Tower Property is a 12-story, 54,471 sq. ft., Class A office building that is comprised of 5,075 sq. ft. of ground floor retail space, 1,110 sq. ft. of storage space and 48,286 sq. ft. of creative office space. The Santa Monica Clock Tower Property was built in 1929 and most recently renovated in 2004. The Santa Monica Clock Tower Property originally served as the headquarters for the Bay Cities Guaranty and Loan Association and was the city’s tallest structure for over forty years. The Santa Monica Clock Tower Property is officially designated by the city of Santa Monica as a historical landmark and remains a local icon and defining feature of Santa Monica’s downtown area due to its central location and notable clock tower.
The Santa Monica Clock Tower Property is located less than a block from Third Street Promenade, an upscale shopping, dining and entertainment complex, and two blocks from the ocean. The Third Street Promenade spans three blocks between Wilshire Boulevard and Broadway and features major national tenants such as Apple, Adidas, Victoria’s Secret, H&M and Footlocker, among others.
The Santa Monica Clock Tower Property was developed with small floor plates of approximately 4,390 sq. ft. and is somewhat unique in that it provides tenants with full floor suites, with elevators opening directly into their space. This lay-out attracts smaller tech/start-up companies to the Santa Monica Clock Tower Property. The Santa Monica Clock Tower Property is currently 99.7% leased to 10 tenants, with no tenant occupying more than 16.4% of net rentable area (“NRA”). Top tenants at the property include Orion Health, Inc. which currently sub-leases its space to Shegerian & Associates, Inc. and Drobny Global Asset Management, L.P. (“Drobny Capital”), Gum Gum, Inc. and The Misfit restaurant, which occupies the first floor retail component of the building. The retail component of the building has been 100% leased to The Misfit since 2011. Over the past year, four new leases have been signed at the Santa Monica Clock Tower Property for 21,949 sq. ft. (40.3% of NRA) that commence between July 2014 and October 2015 with rental rates ranging from $56.40 PSF to $75.00 PSF. The only remaining vacant space in the building is 170 sq. ft. of storage space in the basement of the building.
Similar to other properties in the immediate vicinity, the Santa Monica Clock Tower Property has no on-site parking. All of its parking requirements are met by city owned garages, privately run garages/lots and on-street parking. The sponsor has entered into an agreement with Standard Parking for the use of 150 unreserved parking permits at their nearby parking facilities. Additionally, the building operates a valet parking service for tenants and visitors to the building. The city of Santa Monica has designated two spaces on 2nd Street that are utilized exclusively for this purpose.
Environmental Matters. The Phase I environmental report, dated April 23, 2015, recommended no further action at the Santa Monica Clock Tower Property other than the implementation of an asbestos operations and maintenance program, which is in place.
Major Tenants.
Orion Health, Inc. (8,919 sq. ft., 16.4% of NRA, 16.2% U/W Base Rent). Orion Health, Inc. is a healthcare consulting and software company that provides clinical workflow and integration technology for the healthcare sector. The company provides clinical consulting services, programs to increase staff awareness, business process mapping, user requirement analysis, clinical information systems for healthcare organizations, clinical workflow analysis/design and training services. Orion Health, Inc. was founded in 2001 and is based in Santa Monica, California. Orion Health, Inc. signed its initial lease for the 10th floor in November 2005 and signed a new seven-year lease in 2012, expanding into the 7th floor. Orion Health, Inc. has one, five-year extension option and no termination options.
In 2013, Orion Health, Inc. began to outgrow its space at the Santa Monica Clock Tower Property and signed a lease for a larger space at another building in Santa Monica. It has since subleased its space at the Santa Monica Clock Tower Property to two separate tenants. The 7th floor space is subleased to Shegerian & Associates, Inc., an employment law firm founded in 1996. Shegerian & Associates, Inc. is currently paying $59.40 PSF, which is 9.9% above Orion Health, Inc.’s base rent for the 7th floor and 10% below the appraiser’s determined market rent of $66.00 PSF for floors 4-8. Shegerian & Associates, Inc.’s sublease is co-terminus with Orion Health, Inc.’s lease. The 10th floor space is subleased to Drobny Capital, a full-service asset management, investment advisory and consulting firm founded in 2007. Drobny Capital is currently paying $58.68 PSF, which is 12.2% below Orion Health, Inc.’s base rent for the 10th floor and 21.8% below the appraiser’s concluded market rent for the floors 9-11 of $75.00 PSF. Drobny Capital’s sublease is co-terminus with Orion Health, Inc.’s lease.
THE INFORMATION IN THIS STRUCTURAL AND COLLATERAL TERM SHEET IS NOT COMPLETE AND MAY BE AMENDED PRIOR TO THE TIME OF SALE. THIS TERM SHEET IS NOT AN OFFER TO SELL THESE SECURITIES AND IT IS NOT A SOLICITATION OF AN OFFER TO BUY THESE SECURITIES IN ANY JURISDICTION WHERE THE OFFER OR SALE IS NOT PERMITTED.
| 75 |
225 Santa Monica Boulevard Santa Monica, CA 90401 | Collateral Asset Summary – Loan No. 8 Santa Monica Clock Tower | Cut-off Date Balance: Cut-off Date LTV: U/W NCF DSCR: U/W NOI Debt Yield: | $26,700,000 54.5% 1.80x 8.2% |
Gum Gum, Inc. (8,779 sq. ft., 16.1% of NRA, 16.3% U/W Base Rent). Gum Gum, Inc. provides an in-image advertising platform for publishers and advertisers. Known best for its invention of in-image advertising, Gum Gum, Inc.’s products have since expanded to include several display, mobile and video solutions to help brands tell their stories and publishers unlock new sources of revenue. Gum Gum, Inc. reaches over 600 million unique visitors per month across billions of images on premium websites. The Company was founded in 2006 and is headquartered at the Santa Monica Clock Tower Property. Gum Gum, Inc. has been at the Santa Monica Clock Tower Property since 2013 and has one, five-year extension on their lease and no termination options.
The Misfit (5,505 sq. ft., 10.1% of NRA, 8.9% of U/W Base Rent). The Misfit is a casual restaurant and bar that puts a California spin on comfort food, using locally grown and sourced produce and meats, and also offers an array of signature cocktails. The Misfit is run and operated by LGO Hospitality, which operates several restaurants in Southern California and Phoenix. The Misfit has been at the Santa Monica Clock Tower Property since 2010 and has four, five-year extension options and no termination options. Additionally, The Misfit leases four storage spaces in the basement of the Santa Monica Clock Tower Property on a month to month basis.
The Market. The Santa Monica Clock Tower Property is located at 225 Santa Monica Boulevard, in downtown Santa Monica, which is located approximately 15 miles west of downtown Los Angeles. The Santa Monica Clock Tower Property’s immediate area is an established infill location, characterized by office, retail and residential uses. The Santa Monica Clock Tower Property benefits from its central downtown location and proximity to the Third Street Promenade and the Pacific Ocean. According to the appraiser, the Santa Monica Clock Tower Property is located in the Santa Monica submarket, within the greater West Los Angeles submarket. The West Los Angeles submarket is the largest office market in Los Angeles, containing 49.6 million sq. ft. of Class A office space, with an overall vacancy rate of 12.7%. The Santa Monica submarket is one of the strongest in West Los Angeles, with an overall vacancy rate of 7.4%. Furthermore, Santa Monica is subject to stringent development regulations that create significant barriers to entry in the submarket. Since 2005, only approximately 322,000 sq. ft. of new office space has been delivered to the submarket.
The appraiser identified a set of six comparable Class A properties in the downtown Santa Monica area that it considered directly competitive with the Santa Monica Clock Tower Property. The buildings range from 47,999 to 247,225 sq. ft. with a weighted average occupancy of 86.4%. Leases signed at the competitive properties range from $61.20 to $82.20 PSF. The chart below summarizes the appraiser’s competitive set.
Competitive Set (1) | |||||
| Property Name | Distance from Property | Year Built | Net Rentable Area (sq. ft.) | Occupancy | Recent Leasing (PSF) |
| Santa Monica Clock Tower | NAP | 1929 | 54,471 | 99.7% | $56.40 - $75.00(2) |
| 100 Wilshire | 0.4 miles | 1971 | 247,225 | 95.0% | $70.80 - $82.20 |
| Portofino Plaza | 0.1 miles | 1987 | 47,999 | 100.0% | $73.80 |
| SeaRise Office Tower | 0.3 miles | 1976 | 129,933 | 98.0% | $70.20 - $73.20 |
| 429 Santa Monica | 0.2 miles | 1982 | 86,954 | 77.0% | $61.80 - $63.00 |
| 1733 Ocean Avenue | 0.6 miles | 2002 | 76,044 | 55.0% | $61.20 - $66.00 |
| Wilshire Palisades | 0.3 miles | 1981 | 205,713 | 81.0% | $62.40 |
| Total/Wtd. Avg. | 0.3 miles | 793,868 | 86.4% | ||
| (1) | Source: Appraisal |
| (2) | Source: underwritten rent roll dated April 30, 2015. |
The below chart summarizes the appraiser’s market rent conclusions.
Market Rent (1) | ||
| Category | Net Rentable Area (sq. ft.) | Rent PSF |
| Office (Fl. 2-3) | 8,779 | $60.00 |
| Office (Fl. 4-8) | 21,946 | $66.00 |
| Office (Fl. 9-11) | 13,170 | $75.00 |
| Office (Fl. 12) | 4,390 | $78.00 |
| Retail | 5,075 | $84.00 |
| Storage | 1,110 | $18.00 |
| Total / Wtd. Avg. | 54,471 | $68.87 |
| (1) | Source: Appraisal |
THE INFORMATION IN THIS STRUCTURAL AND COLLATERAL TERM SHEET IS NOT COMPLETE AND MAY BE AMENDED PRIOR TO THE TIME OF SALE. THIS TERM SHEET IS NOT AN OFFER TO SELL THESE SECURITIES AND IT IS NOT A SOLICITATION OF AN OFFER TO BUY THESE SECURITIES IN ANY JURISDICTION WHERE THE OFFER OR SALE IS NOT PERMITTED.
| 76 |
225 Santa Monica Boulevard Santa Monica, CA 90401 | Collateral Asset Summary – Loan No. 8 Santa Monica Clock Tower | Cut-off Date Balance: Cut-off Date LTV: U/W NCF DSCR: U/W NOI Debt Yield: | $26,700,000 54.5% 1.80x 8.2% |
Cash Flow Analysis.
| Cash Flow Analysis | ||||
| 2014 | U/W | U/W PSF | ||
Base Rent(1) | $2,501,388 | $3,281,882 | $60.25 | |
| Rent Steps | 0 | 82,297 | 1.51 | |
| Value of Vacant Space | 0 | 3,060 | 0.06 | |
| Gross Potential Rent | $2,501,388 | $3,367,239 | $61.82 | |
| Total Recoveries | 533,505 | 501,403 | 9.20 | |
| Total Other Income | 271,229 | 317,500 | 5.83 | |
Less: Vacancy(2) | 0 | (209,307) | (3.84) | |
| Effective Gross Income | $3,306,122 | $3,976,835 | $73.01 | |
| Total Operating Expenses | 1,497,371 | 1,777,594 | 32.63 | |
| Net Operating Income | $1,808,751 | $2,199,241 | $40.37 | |
| TI/LC | 0 | 124,122 | 2.28 | |
| Capital Expenditures | 0 | 13,618 | 0.25 | |
| Net Cash Flow | $1,808,751 | $2,061,501 | $37.85 | |
| (1) | U/W Base Rent includes 21,949 sq. ft. (40.3% of NRA) of recent leases signed in the past year. |
| (2) | Vacancy was underwritten at 5.0%, compared to the in-place vacancy of 0.3%. |
Property Management. The Santa Monica Clock Tower Property is managed by Cushman & Wakefield of California, Inc.
Lockbox / Cash Management. The Santa Monica Clock Tower Loan is structured with a hard lockbox and in place cash management. All rents and other payments are required to be deposited directly into a clearing account controlled by the lender. All funds in the clearing account will be transferred on a daily basis into a deposit account controlled by the lender and disbursed in accordance with the Santa Monica Clock Tower Loan documents. Provided no Trigger Period (as defined herein) is continuing, excess cash in the deposit account will be disbursed in accordance with the Santa Monica Clock Tower Loan documents.
A “Trigger Period” will commence upon (i) the occurrence of an event of default under the loan documents or (ii) the DSCR being less than 1.45x as of any calendar quarter and will end if (a) with respect to clause (i) the event of default has been cured and (b) with respect to clause (ii) the DSCR is at least 1.50x for two consecutive calendar quarters.
Initial Reserves. At closing, the borrower deposited (i) $261,700 into a replacement reserve account, (ii) $346,332 into a TI/LC reserve account, (iii) $11,250 into a required repairs account and (iv) $362,344 into a rent reserve account for existing free rent obligations due to certain tenants.
Ongoing Reserves. On a monthly basis, the borrower is required to deposit (i) $23,626 into a tax reserve account, (ii) $1,589 into a replacement reserve account and (iii) $9,532 into a TI/LC reserve account. In addition, the borrower is required to deposit 1/12 of the estimated annual insurance premiums into an insurance reserve account if an acceptable blanket insurance policy is no longer in place.
Current Mezzanine or Subordinate Indebtedness. None.
Future Mezzanine or Subordinate Indebtedness. None.
THE INFORMATION IN THIS STRUCTURAL AND COLLATERAL TERM SHEET IS NOT COMPLETE AND MAY BE AMENDED PRIOR TO THE TIME OF SALE. THIS TERM SHEET IS NOT AN OFFER TO SELL THESE SECURITIES AND IT IS NOT A SOLICITATION OF AN OFFER TO BUY THESE SECURITIES IN ANY JURISDICTION WHERE THE OFFER OR SALE IS NOT PERMITTED.
| 77 |
225 Santa Monica Boulevard Santa Monica, CA 90401 | Collateral Asset Summary – Loan No. 8 Santa Monica Clock Tower | Cut-off Date Balance: Cut-off Date LTV: U/W NCF DSCR: U/W NOI Debt Yield: | $26,700,000 54.5% 1.80x 8.2% |
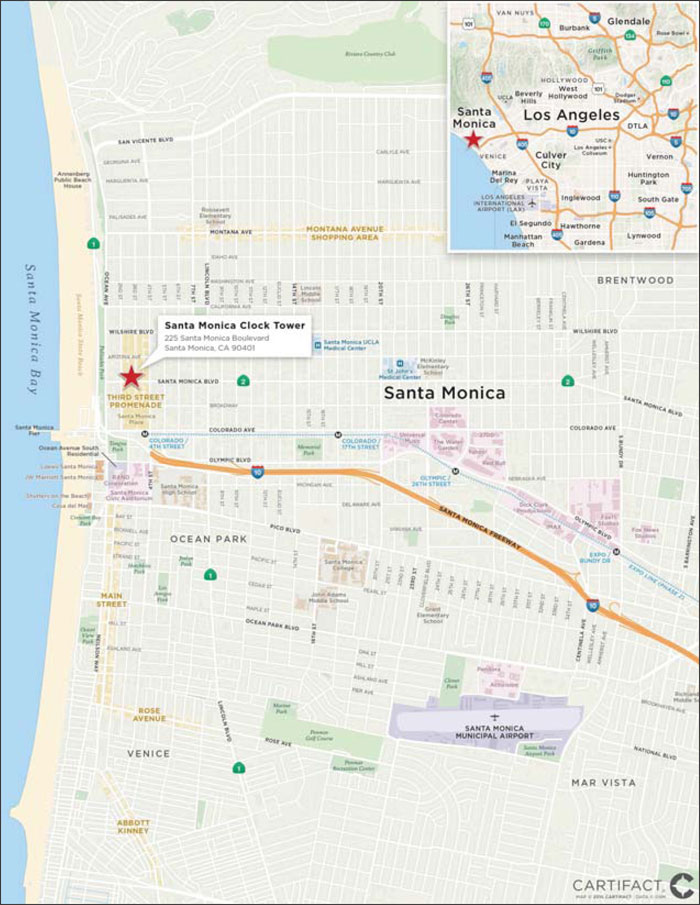
THE INFORMATION IN THIS STRUCTURAL AND COLLATERAL TERM SHEET IS NOT COMPLETE AND MAY BE AMENDED PRIOR TO THE TIME OF SALE. THIS TERM SHEET IS NOT AN OFFER TO SELL THESE SECURITIES AND IT IS NOT A SOLICITATION OF AN OFFER TO BUY THESE SECURITIES IN ANY JURISDICTION WHERE THE OFFER OR SALE IS NOT PERMITTED.
| 78 |
(THIS PAGE INTENTIONALLY LEFT BLANK)
| 79 |
1 & 2 Righter Parkway Wilmington, DE 19803 | Collateral Asset Summary – Loan No. 9 Delaware Corporate Center I & II | Cut-off Date Balance: Cut-off Date LTV: U/W NCF DSCR: U/W NOI Debt Yield: | $26,450,000 67.3% 1.75x 10.9% |
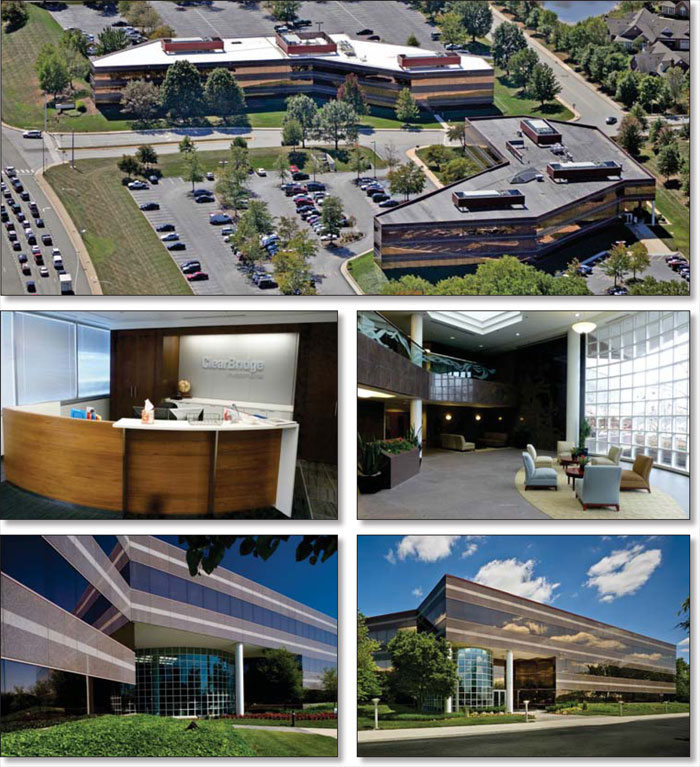
THE INFORMATION IN THIS STRUCTURAL AND COLLATERAL TERM SHEET IS NOT COMPLETE AND MAY BE AMENDED PRIOR TO THE TIME OF SALE. THIS TERM SHEET IS NOT AN OFFER TO SELL THESE SECURITIES AND IT IS NOT A SOLICITATION OF AN OFFER TO BUY THESE SECURITIES IN ANY JURISDICTION WHERE THE OFFER OR SALE IS NOT PERMITTED.
| 80 |
1 & 2 Righter Parkway Wilmington, DE 19803 | Collateral Asset Summary – Loan No. 9 Delaware Corporate Center I & II | Cut-off Date Balance: Cut-off Date LTV: U/W NCF DSCR: U/W NOI Debt Yield: | $26,450,000 67.3% 1.75x 10.9% |
| Mortgage Loan Information | |
| Loan Seller: | LCF |
| Loan Purpose: | Acquisition |
| Sponsor: | Christopher F. Buccini; Robert E. Buccini; David B. Pollin |
| Borrower: | 1 Righter LLC; 2 Righter LLC |
| Original Balance: | $26,450,000 |
| Cut-off Date Balance: | $26,450,000 |
| % by Initial UPB: | 2.0% |
| Interest Rate: | 3.9700% |
| Payment Date: | 6th of each month |
| First Payment Date: | June 6, 2015 |
| Maturity Date: | May 6, 2025 |
| Amortization: | Interest only for first 36 months; 360 months thereafter |
| Additional Debt: | None |
| Call Protection: | L(25), D(91), O(4) |
| Lockbox / Cash Management: | Springing Hard / Springing |
Reserves(1) | ||
| Initial | Monthly | |
| Taxes: | $227,120 | $25,236 |
| Insurance: | $17,533 | $2,922 |
| Replacement: | $0 | $3,338 |
| TI/LC: | $620,000 | $16,690 |
| Free Rent: | $117,543 | $0 |
| Ground Rent: | $28,000 | Springing |
| Financial Information | ||
| Cut-off Date Balance / Sq. Ft.: | $132 | |
| Balloon Balance / Sq. Ft.: | $114 | |
| Cut-off Date LTV: | 67.3% | |
| Balloon LTV: | 58.2% | |
Underwritten NOI DSCR(2): | 1.91x | |
Underwritten NCF DSCR(2): | 1.75x | |
| Underwritten NOI Debt Yield: | 10.9% | |
| Underwritten NCF Debt Yield: | 10.0% | |
| Underwritten NOI Debt Yield at Balloon: | 12.6% | |
| Underwritten NCF Debt Yield at Balloon: | 11.5% | |
| Property Information | ||
| Single Asset / Portfolio: | Single Asset | |
| Property Type: | Suburban Office | |
| Collateral: | Leasehold | |
| Location: | Wilmington, DE | |
| Year Built / Renovated: | 1987, 1989 / 2014 | |
| Total Sq. Ft.: | 200,275 | |
| Property Management: | BPG Real Estate Services LLC | |
| Underwritten NOI: | $2,883,986 | |
| Underwritten NCF: | $2,640,684 | |
| Appraised Value: | $39,275,000 | |
| Appraisal Date: | March 25, 2015 | |
| Historical NOI | ||
| Most Recent NOI: | $3,004,309 (T-12 February 28, 2015) | |
| 2014 NOI: | $2,983,338 (December 31, 2014) | |
| 2013 NOI: | $2,819,566 (December 31, 2013) | |
| 2012 NOI: | $2,078,561 (December 31, 2012) | |
| Historical Occupancy | ||
| Most Recent Occupancy: | 100.0% (March 2, 2015) | |
| 2014 Occupancy: | 100.0% (December 31, 2014) | |
| 2013 Occupancy: | 96.4% (December 31, 2013) | |
| 2012 Occupancy: | 84.4% (December 31, 2012) | |
| (1) | See “Initial Reserves” and “Ongoing Reserves” herein. |
| (2) | Based on amortizing debt service payments. Based on the current interest only payments, the Underwritten NOI DSCR and Underwritten NCF DSCR are 2.71x and 2.48x, respectively. |
THE INFORMATION IN THIS STRUCTURAL AND COLLATERAL TERM SHEET IS NOT COMPLETE AND MAY BE AMENDED PRIOR TO THE TIME OF SALE. THIS TERM SHEET IS NOT AN OFFER TO SELL THESE SECURITIES AND IT IS NOT A SOLICITATION OF AN OFFER TO BUY THESE SECURITIES IN ANY JURISDICTION WHERE THE OFFER OR SALE IS NOT PERMITTED.
| 81 |
1 & 2 Righter Parkway Wilmington, DE 19803 | Collateral Asset Summary – Loan No. 9 Delaware Corporate Center I & II | Cut-off Date Balance: Cut-off Date LTV: U/W NCF DSCR: U/W NOI Debt Yield: | $26,450,000 67.3% 1.75x 10.9% |
| Tenant Summary | ||||||||
Tenant | Ratings (Fitch/Moody’s/S&P)(1) | Net Rentable Area (Sq. Ft.) | % of Net Rentable Area | U/W Base Rent PSF | % of Total U/W Base Rent | Lease Expiration | ||
DuPont Capital(2) | A/A2/A | 53,227 | 26.6% | $26.50 | 30.5% | 12/31/2022 | ||
Morgan Stanley(3) | A/Baa2/A- | 24,947 | 12.5% | $15.20 | 8.2% | 4/30/2021 | ||
ClearBridge Advisors(4) | NR/NR/NR | 18,243 | 9.1% | $30.44 | 12.0% | 10/31/2018 | ||
Lyons Insurance(5) | NR/NR/NR | 15,119 | 7.5% | $26.25 | 8.6% | 4/30/2017 | ||
Synchrogenix(6) | NR/NR/NR | 10,702 | 5.3% | $23.93 | 5.5% | 10/31/2019 | ||
| Total Major Tenants | 122,238 | 61.0% | $24.53 | 64.8% | ||||
| Remaining Tenants | 78,037 | 39.0% | $20.89 | 35.2% | ||||
| Total Occupied Collateral | 200,275 | 100.0% | $23.11 | 100.0% | ||||
| Vacant | 0 | 0.0% | ||||||
| Total | 200,275 | 100.0% | ||||||
| (1) | Certain ratings are those of the parent company whether or not the parent company guarantees the lease. |
| (2) | DuPont Capital has two, five-year extension options. DuPont Capital has the right to terminate its lease on December 31, 2019 provided the tenant has given landlord notice on or before June 30, 2018 in addition to paying a termination payment of $345,975 plus any unamortized costs associated with the expansion space. DuPont Capital also has one month of free rent in December 2015 for which lender reserved $117,542 at closing. |
| (3) | Morgan Stanley has two, five-year extension options. Morgan Stanley has two options to terminate the in place lease on April 30, 2016 or April 30, 2018 provided the tenant has given landlord nine months’ notice. In addition, Morgan Stanley must pay the landlord the unamortized portion of the tenant allowance, transaction costs and free rent, amortized at 8.0% interest. |
| (4) | ClearBridge Advisors have two, five-year extension options and does not have any termination options. |
| (5) | Lyons Insurance has one, five-year extension option and does not have any termination options. |
| (6) | Synchrogenix has one, five-year extension option. Synchrogenix has a one-time right to terminate its lease on December 31, 2017 provided the tenant has given landlord no less than 12 months’ notice and pays a termination fee equal to the unamortized portion of the tenant allowance, transaction costs and free rent, amortized at 8.0% interest. |
Lease Rollover Schedule(1) | ||||||||
| Year | # of Leases Expiring | Total Expiring Sq. Ft. | % of Total Sq. Ft. Expiring | Cumulative Sq. Ft. Expiring | Cumulative % of Sq. Ft. Expiring | Annual U/W Base Rent PSF | % U/W Base Rent Rolling | Cumulative % of U/W Base Rent |
| MTM | 0 | 0 | 0.0% | 0 | 0.0% | $0.00 | 0.0% | 0.0% |
| 2015 | 1 | 1,400 | 0.7% | 1,400 | 0.7% | $16.40 | 0.5% | 0.5% |
| 2016 | 3 | 10,404 | 5.2% | 11,804 | 5.9% | $19.21 | 4.3% | 4.8% |
| 2017 | 4 | 24,400 | 12.2% | 36,204 | 18.1% | $25.13 | 13.2% | 18.1% |
| 2018 | 3 | 19,877 | 9.9% | 56,081 | 28.0% | $29.95 | 12.9% | 30.9% |
| 2019 | 9 | 31,980 | 16.0% | 88,061 | 44.0% | $22.96 | 15.9% | 46.8% |
| 2020 | 5 | 19,853 | 9.9% | 107,914 | 53.9% | $18.30 | 7.9% | 54.6% |
| 2021 | 1 | 24,947 | 12.5% | 132,861 | 66.3% | $15.20 | 8.2% | 62.8% |
| 2022 | 4 | 57,427 | 28.7% | 190,288 | 95.0% | $26.28 | 32.6% | 95.4% |
| 2023 | 3 | 9,301 | 4.6% | 199,589 | 99.7% | $22.69 | 4.6% | 100.0% |
| 2024 | 0 | 0 | 0.0% | 199,589 | 99.7% | $0.00 | 0.0% | 100.0% |
| 2025 | 0 | 0 | 0.0% | 199,589 | 99.7% | $0.00 | 0.0% | 100.0% |
Thereafter(2) | 0 | 686 | 0.3% | 200,275 | 100.0% | $0.00 | 0.0% | 100.0% |
| Vacant | NAP | 0 | 0.0% | 200,275 | 100.0% | NAP | NAP | NAP |
| Total / Wtd. Avg. | 33 | 200,275 | 100.0% | $23.11 | 100.0% | |||
| (1) | Certain tenants have lease termination options that may become exercisable prior to the originally stated expiration date of the tenant lease and that are not considered in the lease rollover schedule. |
| (2) | 686 square feet represents storage and maintenance space. |
THE INFORMATION IN THIS STRUCTURAL AND COLLATERAL TERM SHEET IS NOT COMPLETE AND MAY BE AMENDED PRIOR TO THE TIME OF SALE. THIS TERM SHEET IS NOT AN OFFER TO SELL THESE SECURITIES AND IT IS NOT A SOLICITATION OF AN OFFER TO BUY THESE SECURITIES IN ANY JURISDICTION WHERE THE OFFER OR SALE IS NOT PERMITTED.
| 82 |
1 & 2 Righter Parkway Wilmington, DE 19803 | Collateral Asset Summary – Loan No. 9 Delaware Corporate Center I & II | Cut-off Date Balance: Cut-off Date LTV: U/W NCF DSCR: U/W NOI Debt Yield: | $26,450,000 67.3% 1.75x 10.9% |
The Loan. The Delaware Corporate Center I & II Loan (the “Delaware Corporate Center I & II Loan”) is a 10-year fixed-rate loan secured by the borrower’s leasehold interest in a 200,275 sq. ft. Class A corporate center located at 1 & 2 Righter Parkway in Wilmington, Delaware (the “Delaware Corporate Center I & II Property”). The Delaware Corporate Center I & II Loan has an original principal balance of $26.45 million and is structured with an initial 36-month interest only period and amortizes on a 30-year schedule thereafter. The Delaware Corporate Center I & II Loan accrues interest at a fixed annual rate equal to 3.9700% and has a cut-off date balance of $26.45 million. Loan proceeds, along with approximately $8.9 million of borrower equity, were used to purchase the Delaware Corporate Center I & II Property for approximately $34.0 million, fund reserves of approximately $1.0 million and pay closing costs of approximately $0.4 million. Based on the appraised value of $39.275 million as of March 25, 2015, the cut-off date LTV is 67.3% and the balloon LTV is 58.2%. The most recent financing of the Delaware Corporate Center I & II Property was not included in a securitization.
| Sources and Uses | ||||||
| Sources | Proceeds | % of Total | Uses | Proceeds | % of Total | |
| Loan Amount | $26,450,000 | 74.8% | Purchase Price | $33,975,000 | 96.1% | |
| Borrower Equity | $8,900,643 | 25.2% | Reserves | $1,010,195 | 2.9% | |
| Closing Costs | $365,448 | 1.0% | ||||
| Total Sources | $35,350,643 | 100.0% | Total Uses | $35,350,643 | 100.0% | |
The Borrower / Sponsor. The borrowers are 1 Righter LLC and 2 Righter LLC, both Delaware limited liability companies. The sponsors and non-recourse carveout guarantors of the borrowers are Robert E. Buccini, Christopher F. Buccini and David B. Pollin who are the key principals of the Buccini/Pollin Group, Inc. (“BPG”). BPG is a privately-held, real estate acquisition, development and management company founded in 1993. Through a group of affiliated companies, including PM Hospitality Strategies, Inc., BPG Real Estate Services, LLC, BPG Residential Services, LLC, and BPGS Construction, LLC, the sponsors of BPG oversee all aspects of project acquisition, finance, development, construction, leasing, operations, and disposition for its portfolio of properties.
BPG has acquired or developed real estate assets having a value in excess of $4.0 billion and have experience investing and operating properties in the Mid-Atlantic and Northeastern regions of the United States, with a portfolio including 6.0 million sq. ft. of office and retail space, 26 hotels, 10 residential communities and multiple entertainment venues.
The Property. The Delaware Corporate Center I & II Property is a 200,275 sq. ft. office complex consisting of two freestanding, three story Class A buildings situated on 14.47 acres in Wilmington, Delaware. Delaware Corporate Center I is a three-story building constructed in 1989 containing 104,761 sq. ft., and Delaware Corporate Center II is a three-story office building constructed in 1987 containing 95,514 sq. ft., with the improvements both in good condition. A 60-year ground lease encumbers the subject site totaling 14.47 acres (6.56 acres for Delaware Corporate Center I and 7.91 acres for Delaware Corporate Center II).
The Delaware Corporate Center I & II Property is located in suburban Wilmington, in Brandywine Hundred, an administrative subdivision of New Castle County, Delaware. New Castle County is divided into ten districts known as “Hundreds”. Although these subdivisions once had political significance, the county or the incorporated towns and cities now have powers over land use and development within their jurisdictions.
Primary access to the subject neighborhood is provided by Route 202 (Concord Pike) and Interstate Highway 95, which provides access along the northeastern corridor. This arterial connects the subject neighborhood to New York, Philadelphia and Washington, D.C. Route 202 provides north-south access to the area. As of 2015, there is a population of 10,274 and 184,753 and an estimated average household income of $121,774 and $86,876 within a one- and five-mile radius respectively. According to the appraisal, the long-term trend for the Delaware Corporate Center I & II Property’s area is for moderate growth given the transportation benefits, ample labor pool, proximity to the Wilmington CBD and attractive environment. The Delaware Corporate Center I & II Property was renovated in 2014 and includes 891 surface parking spaces, which equates to a parking ratio of 4.45 spaces per 1,000 sq. ft.
As of March 2, 2015 the Delaware Corporate Center I & II Property is 100.0% leased to 25 tenants with leased spaces ranging in size from 1,005 sq. ft. to 53,227 sq. ft.
Environmental Matters. A Phase I environmental report was performed on April 3, 2015. Based on the age of the property, asbestos containing material was identified and recommended the borrower manage suspected asbestos under an in-place O&M.
THE INFORMATION IN THIS STRUCTURAL AND COLLATERAL TERM SHEET IS NOT COMPLETE AND MAY BE AMENDED PRIOR TO THE TIME OF SALE. THIS TERM SHEET IS NOT AN OFFER TO SELL THESE SECURITIES AND IT IS NOT A SOLICITATION OF AN OFFER TO BUY THESE SECURITIES IN ANY JURISDICTION WHERE THE OFFER OR SALE IS NOT PERMITTED.
| 83 |
1 & 2 Righter Parkway Wilmington, DE 19803 | Collateral Asset Summary – Loan No. 9 Delaware Corporate Center I & II | Cut-off Date Balance: Cut-off Date LTV: U/W NCF DSCR: U/W NOI Debt Yield: | $26,450,000 67.3% 1.75x 10.9% |
Major Tenants.
E.I. du Pont de Nemours and Company (“DuPont Capital”) (53,227 sq. ft., 26.6% of NRA, 30.5% of U/W Base Rent). DuPont Capital is an American Chemical company founded in July 1802 as a gunpowder mill near Wilmington, Delaware. Since then DuPont Capital has grown to be the fourth largest global chemical company in the world, whose headquarters are located in Wilmington, Delaware adjacent to the Delaware Corporate Center I & II Property and employs more than 60,000 people globally with a diverse array of product offerings.
DuPont Capital has two, five-year extension options and has the right to terminate its lease on December 31, 2019 provided the tenant has given landlord notice on or before June 30, 2018 in addition to paying an early termination fee of $345,975 plus any unamortized costs associated with the expansion space. DuPont Capital also has one month of free rent in December 2015 for which lender reserved $117,542 at closing.
Morgan Stanley (24,947 sq. ft., 12.5% of NRA, 8.2% of U/W Base Rent). Morgan Stanley, a financial holding company, was founded in 1924 and provides various financial products and services to corporations, governments, financial institutions, and individuals worldwide.
Morgan Stanley is comprised of three segments which include their Institutional Securities segment, offering various financial advisory services that include mergers and acquisitions, divestitures, and joint ventures; their Wealth Management segment (Morgan Stanley Smith Barney) which provide brokerage and investment advisory services; and their Investment Management segment which provides various alternative investment products such as hedge funds, private equity and real estate funds.
Morgan Stanley has two, five-year extension options and has two options to terminate the in place lease on April 30, 2016 or April 30, 2018 provided the tenant has given landlord nine months’ notice. In addition, Morgan Stanley must pay the landlord the unamortized portion of the tenant allowance, transaction costs and free rent, amortized at 8.0% interest.
ClearBridge Advisors (18,243 sq. ft., 9.1% of NRA, 12.0% of U/W Base Rent). ClearBridge Advisors are a well-established global investment manager with a legacy dating back more than 50 years and $114.6 billion in assets under management, as of December 31, 2014. ClearBridge Advisors employs 204 people across New York, Baltimore, San Francisco, and at the Delaware Corporate Center I & II Property in Wilmington, Delaware.
ClearBridge Advisors is owned by Legg Mason, Inc. Legg Mason, Inc. is a publicly owned asset management holding company. ClearBridge Advisors provides investment management and related services to institutional and individual clients, company-sponsored mutual funds and other pooled investment vehicles through its wholly owned subsidiaries.
ClearBridge Advisors have two, five-year extension options and does not have termination options.
The Market. The Delaware Corporate Center I & II Property are Class A office buildings in the North New Castle County submarket within the Wilmington-Newark Metropolitan Area. The City of Wilmington serves as the commercial core of this metropolitan area and part of a larger economic geographic entity known as the Delaware Valley, which extends northeast from Wilmington through the adjoining Philadelphia Metropolitan area up to Trenton, New Jersey. The City of Wilmington has a currently estimated population of 71,000 and the current population of New Castle County is estimated to be about 546,000.
Wilmington and Newark are the main employment centers of New Castle County. Due to the highway network, a number of attractive office and industrial parks have evolved throughout the suburban areas of the county. New Castle County is a net importer of jobs from Maryland, New Jersey and Pennsylvania.
The neighborhood has a concentration of commercial land uses surrounded by relatively dense residential development. The area was developed as a major commercial district due to the highway system serving it and tax differential between Delaware and Pennsylvania. There are a number of corporate headquarters in the area which serve as a source of inflow business for retailers in the neighborhood including the Concord Mall, an approximately 865,000 sq. ft. enclosed regional shopping center anchored by Sears, Macy’s and Boscov’s.
The appraisal reported there to be approximately 16.18 million sq. ft. of commercial office space and a 20.1% vacancy rate in Northern Delaware at the end of Q4 2014. Total inventory of the Class A office space in North New Castle County submarket at the end of Q4 2014 was approximately 1.79 million sq. ft. and an overall vacancy rate of 4.7%. Average rental rates in the North New Castle County submarket is $25.84 PSF vs. Class A office space in Northern Delaware at $26.47 PSF.
The appraisal identified four comparable leases within nearby competitive office buildings. A summary of recent office leases are provided in the subsequent chart:
THE INFORMATION IN THIS STRUCTURAL AND COLLATERAL TERM SHEET IS NOT COMPLETE AND MAY BE AMENDED PRIOR TO THE TIME OF SALE. THIS TERM SHEET IS NOT AN OFFER TO SELL THESE SECURITIES AND IT IS NOT A SOLICITATION OF AN OFFER TO BUY THESE SECURITIES IN ANY JURISDICTION WHERE THE OFFER OR SALE IS NOT PERMITTED.
| 84 |
1 & 2 Righter Parkway Wilmington, DE 19803 | Collateral Asset Summary – Loan No. 9 Delaware Corporate Center I & II | Cut-off Date Balance: Cut-off Date LTV: U/W NCF DSCR: U/W NOI Debt Yield: | $26,450,000 67.3% 1.75x 10.9% |
Comparable Office Rentals(1) | |||||
| Name | Delaware Corporate Center I & II Property | 3 Beaver Valley Road | Applied Bank Center | Bellevue Park Corporate Center | Chestnut Run |
| Building Sq. Ft. | 200,275 | 263,503 | 195,476 | 98,667 | 94,260 |
| Year Built | 1987, 1989 | 1995 | 1980 | 1990 | 2002 |
| Tenant Name(s) | Various | Solenis, LLC | Wells Fargo | Goldman Sachs | Charles Schwab |
| Size (Sq. Ft.) | Various | 34,321 | 38,300 | 4,573 | 7,550 |
| Base Rent PSF | Various | $20.00 | $24.50 | $28.00 | $24.00 |
| (1) | Source: Appraisal. |
Cash Flow Analysis.
| Cash Flow Analysis | ||||||
| 2012 | 2013 | 2014 | T-12 2/28/2015 | U/W | U/W PSF | |
| Base Rent | $3,399,141 | $4,152,864 | $4,339,207 | $4,370,751 | $4,628,522 | $23.11 |
| Value of Vacant Space | 0 | 0 | 0 | 0 | 0 | 0.00 |
Gross Potential Rent(1) | $3,399,141 | $4,152,864 | $4,339,207 | $4,370,751 | $4,628,522 | $23.11 |
| Total Recoveries | 244,907 | 282,231 | 353,073 | 360,581 | 366,168 | 1.83 |
| Total Other Income | 198,742 | 293,735 | 323,172 | 329,742 | 329,742 | 1.65 |
Less: Vacancy(2) | 0 | 0 | 0 | 0 | (349,628) | (1.75) |
| Effective Gross Income | $3,842,790 | $4,728,830 | $5,015,452 | $5,061,074 | $4,974,804 | $24.84 |
| Total Operating Expenses | 1,764,229 | 1,909,264 | 2,032,114 | 2,056,765 | 2,090,818 | 10.44 |
| Net Operating Income | $2,078,561 | $2,819,566 | $2,983,338 | $3,004,309 | $2,883,986 | $14.40 |
| TI/LC | 0 | 0 | 0 | 0 | 203,247 | 1.01 |
| Capital Expenditures | 0 | 0 | 0 | 0 | 40,055 | 0.20 |
| Net Cash Flow | $2,078,561 | $2,819,566 | $2,983,338 | $3,004,309 | $2,640,684 | $13.19 |
| (1) | U/W Gross Potential Rent is comprised of Base Rent from the Delaware Corporate Center I & II Property. |
| (2) | U/W Vacancy is based on an economic vacancy of 7% of Gross Revenue, greater than the appraiser’s concluded vacancy of 4.7%. The Delaware Corporate Center I and II Property is 100% occupied as of March 2, 2015. |
Property Management. The Delaware Corporate Center I & II Property is managed by BPG Real Estate Services LLC, a borrower affiliate.
Lockbox / Cash Management. The Delaware Corporate Center I & II Loan is structured with a springing hard lockbox and springing cash management. Upon a Cash Sweep Event (as described herein) event, the borrower is required to send tenant direction letters to all tenants instructing them to deposit all rents and other payments into the lockbox account controlled by the lender. Provided no Cash Sweep Event Period (as defined herein) exists, all funds in the lockbox account are swept daily to the borrower’s operating account. Upon the occurrence and during the continuance of a Cash Sweep Event Period, amounts on deposit in the clearing account will be swept to a cash management account established and maintained by the lender, and applied to the payment of all required payments and reserves as set forth in the Delaware Corporate Center I & II Loan documents, with any excess cash to be retained by the lender in the cash management account.
A “Cash Sweep Event” will commence (i) upon an event of default, (ii) upon any bankruptcy or insolvency of the property manager, (iii) when a Cash Sweep Significant Tenant Trigger Event (as defined herein) occurs and (iv) when the debt service coverage ratio (as calculated in accordance with the related loan documents) is less than 1.15x (a “Cash Sweep DSCR Trigger Event”), and will end when (a) with respect to clause (i) above, the event of default has been cured, (b) with respect to clause (ii) above, the date on which the borrower has entered into a replacement management agreement with a qualified manager (as described in the loan documents) in accordance with the loan terms, (c) with respect to clause (iii) above, the date on which the Cash Sweep Significant Tenant Trigger Event has ended, and (d) with respect to clause (iv) above, the date on which the debt service coverage ratio is at least 1.25x two consecutive quarters.
A “Cash Sweep Event Period” means any period commencing on the occurrence of a Cash Sweep Event and continuing until the earlier of (i) the monthly payment date following the end of the applicable Cash Sweep Event or (ii) the payment in full of all principal and interest on the Delaware Corporate Center I & II Loan and all other amounts payable under the related loan documents in accordance with the terms and provisions of the related loan documents.
THE INFORMATION IN THIS STRUCTURAL AND COLLATERAL TERM SHEET IS NOT COMPLETE AND MAY BE AMENDED PRIOR TO THE TIME OF SALE. THIS TERM SHEET IS NOT AN OFFER TO SELL THESE SECURITIES AND IT IS NOT A SOLICITATION OF AN OFFER TO BUY THESE SECURITIES IN ANY JURISDICTION WHERE THE OFFER OR SALE IS NOT PERMITTED.
| 85 |
1 & 2 Righter Parkway Wilmington, DE 19803 | Collateral Asset Summary – Loan No. 9 Delaware Corporate Center I & II | Cut-off Date Balance: Cut-off Date LTV: U/W NCF DSCR: U/W NOI Debt Yield: | $26,450,000 67.3% 1.75x 10.9% |
A “Cash Sweep Significant Tenant Trigger Event” will commence on (i) the date on which any “Significant Tenant” (defined as any tenant under a lease which, either individually, or when taken together with any other lease with such tenant or its affiliates (x) covers more than 25% of the total square footage at the property or (y) constitutes more than 25% of the total annual rents) goes into payment default under its lease, (ii) the date on which any Significant Tenant (or such Significant Tenant’s parent company) becomes insolvent or a debtor in any bankruptcy action, (iii) the date that is 12 months prior to the scheduled expiration date of the DuPont Capital lease (which lease is currently scheduled to expire on December 31, 2022) or (iv) the date on which DuPont Capital delivers notice that it is terminating its lease, and will end as of (a) the date on which a re-tenanting event has occurred (in the cases of a Cash Sweep Significant Tenant Trigger Event caused solely by the occurrence of clauses (iii) or (iv) in the definition thereof, with respect to DuPont Capital); or (b) with respect to clause (ii) above, the date on which the applicable Significant Tenant or such Significant Tenant’s parent company, as the case may be, becomes solvent to the lender’s satisfaction for two consecutive quarters or is no longer be a debtor in any bankruptcy action and has affirmed its lease pursuant to a final non-appealable order of a court of competent jurisdiction.
Initial Reserves. At origination, the borrower deposited (i) $227,120 into a tax reserve account, (ii) $17,533 into an insurance reserve account, (iii) $620,000 into a TI/LC reserve account for approved leasing expenses, (iv) $117,543 into a free rent reserve account and (v) $28,000 into a ground rent reserve account.
Ongoing Reserves. The borrower is required to deposit on a monthly basis reserves of (i) 1/12 of the estimated annual real estate taxes, which currently equates to $25,236, into the tax reserve account, (ii) 1/12 of the estimated insurance premiums, which currently equates to $2,922, into an insurance reserve account, (iii) $16,690 into the TI/LC reserve account, (iv) $3,338 into the replacement reserve account and (v) at any time the balance of the ground rent reserve account falls below $28,000, monthly deposits in the amount of the deficiency will be deposited into the reserve until the balance reaches $28,000.
Current Mezzanine or Subordinate Indebtedness. None.
Future Mezzanine or Subordinate Indebtedness Permitted. None.
Ground Lease. Delaware Corporate Center I & II Property is subject to a ground lease between Woodlawn Trustees, Inc. and Donohoe Wilmington Associates One Limited Partnership. Each property is on its own individual ground lease with the Woodlawn Trustees. The Delaware Corporate Center I ground lease, dated July 28, 1986, expires on July 27, 2046 and has two consecutive 10-year renewal options. The Delaware Corporate Center II ground lease, dated May 31, 1988, expires on May 30, 2048 and has two consecutive 10-year renewal options. The current annual ground rent payment for Delaware Corporate Center I and Delaware Corporate Center II are $128,451 and $176,513, respectively. Both leases are structured with 5 year escalations at the CPI over each ground lease base year.
THE INFORMATION IN THIS STRUCTURAL AND COLLATERAL TERM SHEET IS NOT COMPLETE AND MAY BE AMENDED PRIOR TO THE TIME OF SALE. THIS TERM SHEET IS NOT AN OFFER TO SELL THESE SECURITIES AND IT IS NOT A SOLICITATION OF AN OFFER TO BUY THESE SECURITIES IN ANY JURISDICTION WHERE THE OFFER OR SALE IS NOT PERMITTED.
| 86 |
1 & 2 Righter Parkway Wilmington, DE 19803 | Collateral Asset Summary – Loan No. 9 Delaware Corporate Center I & II | Cut-off Date Balance: Cut-off Date LTV: U/W NCF DSCR: U/W NOI Debt Yield: | $26,450,000 67.3% 1.75x 10.9% |
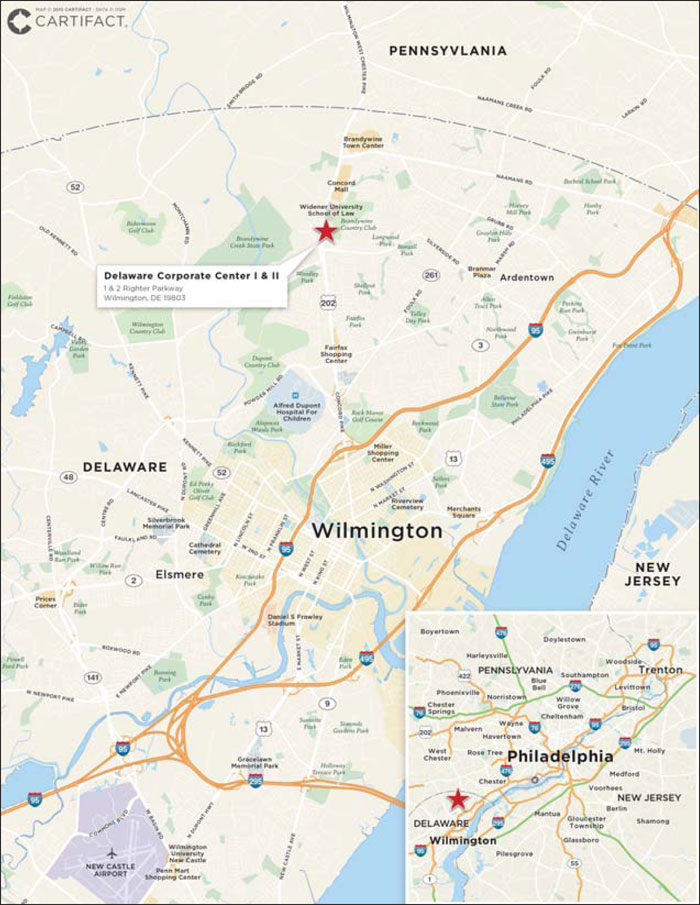
THE INFORMATION IN THIS STRUCTURAL AND COLLATERAL TERM SHEET IS NOT COMPLETE AND MAY BE AMENDED PRIOR TO THE TIME OF SALE. THIS TERM SHEET IS NOT AN OFFER TO SELL THESE SECURITIES AND IT IS NOT A SOLICITATION OF AN OFFER TO BUY THESE SECURITIES IN ANY JURISDICTION WHERE THE OFFER OR SALE IS NOT PERMITTED.
| 87 |
31571 Rancho Viejo Road San Juan Capistrano, CA 92675 | Collateral Asset Summary – Loan No. 10 Ortega Ranch | Cut-off Date Balance: Cut-off Date LTV: U/W NCF DSCR: U/W NOI Debt Yield: | $25,000,000 70.4% 1.42x 8.6% |
THE INFORMATION IN THIS STRUCTURAL AND COLLATERAL TERM SHEET IS NOT COMPLETE AND MAY BE AMENDED PRIOR TO THE TIME OF SALE. THIS TERM SHEET IS NOT AN OFFER TO SELL THESE SECURITIES AND IT IS NOT A SOLICITATION OF AN OFFER TO BUY THESE SECURITIES IN ANY JURISDICTION WHERE THE OFFER OR SALE IS NOT PERMITTED.
| 88 |
31571 Rancho Viejo Road San Juan Capistrano, CA 92675 | Collateral Asset Summary – Loan No. 10 Ortega Ranch | Cut-off Date Balance: Cut-off Date LTV: U/W NCF DSCR: U/W NOI Debt Yield: | $25,000,000 70.4% 1.42x 8.6% |
| Mortgage Loan Information | |
| Loan Seller: | GACC |
| Loan Purpose: | Refinance |
Sponsor(1): | Scott J. Seligman |
| Borrower: | Ortega Ranch, LLC |
| Original Balance: | $25,000,000 |
| Cut-off Date Balance: | $25,000,000 |
| % by Initial UPB: | 1.9% |
| Interest Rate: | 3.9000% |
| Payment Date: | 6th of each month |
| First Payment Date: | June 6, 2015 |
| Maturity Date: | May 6, 2025 |
| Amortization: | Interest only for first 36 months; 360 months thereafter |
Additional Debt(2): | Future Mezzanine Debt Permitted |
| Call Protection: | L(25), D(90), O(5) |
| Lockbox / Cash Management: | Hard / Springing |
Reserves(3) | ||
| Initial | Monthly | |
| Taxes: | $95,013 | $23,753 |
| Insurance: | $0 | Springing |
| Replacement: | $0 | $2,391 |
| TI/LC: | $300,000 | $14,946 |
| Financial Information | ||
| Cut-off Date Balance / Sq. Ft.: | $174 | |
| Balloon Balance / Sq. Ft.: | $150 | |
| Cut-off Date LTV: | 70.4% | |
| Balloon LTV: | 60.8% | |
Underwritten NOI DSCR(4): | 1.53x | |
Underwritten NCF DSCR(4): | 1.42x | |
| Underwritten NOI Debt Yield: | 8.6% | |
| Underwritten NCF Debt Yield: | 8.0% | |
| Underwritten NOI Debt Yield at Balloon: | 10.0% | |
| Underwritten NCF Debt Yield at Balloon: | 9.3% | |
| Property Information | |
| Single Asset / Portfolio: | Single Asset |
| Property Type: | Suburban Office |
| Collateral: | Fee Simple |
| Location: | San Juan Capistrano, CA |
| Year Built / Renovated: | 2005 / 2014 |
| Total Sq. Ft.: | 143,478 |
| Property Management: | S.M. Farthington Ltd., LLC, dba Seligman Western Enterprises, Ltd. II |
| Underwritten NOI: | $2,157,928 |
| Underwritten NCF: | $2,003,679 |
| Appraised Value: | $35,500,000 |
| Appraisal Date: | March 5, 2015 |
| Historical NOI | |
| 2014 NOI: | $1,857,002 (December 31, 2014) |
| 2013 NOI: | $1,701,786 (December 31, 2013) |
| 2012 NOI: | $1,750,496 (December 31, 2012) |
Historical Occupancy(5) | |
| Most Recent Occupancy: | 89.4% (April 20, 2015) |
2014 Occupancy(6): | 85.1% (December 31, 2014) |
| 2013 Occupancy: | 79.5% (December 31, 2013) |
| 2012 Occupancy: | 79.8% (December 31, 2012) |
| (1) | The sponsor is also the sponsor under the mortgage loans identified on Annex A-1 to this Free Writing Prospectus as Capistrano Business Center I & II, which has a Cut-off Date Balance of $34,700,000 and North Stadium Business Center, which has a Cut-off Date Balance of $10,360,000. |
| (2) | See “Future Mezzanine or Subordinate Indebtedness Permitted” herein. |
| (3) | See “Initial Reserves” and “Ongoing Reserves” herein. |
| (4) | Based on amortizing payments. Based on the current interest only debt service payments, the Underwritten NOI DSCR and Underwritten NCF DSCR are 2.18x and 2.03x, respectively. |
| (5) | The Ortega Ranch Property was completed in 2005 and was in a lease up phase during 2006 and 2007. |
| (6) | 2014 Historical Occupancy represents the average occupancy for the year as the historical occupancies for the months of November and December were not available. |
THE INFORMATION IN THIS STRUCTURAL AND COLLATERAL TERM SHEET IS NOT COMPLETE AND MAY BE AMENDED PRIOR TO THE TIME OF SALE. THIS TERM SHEET IS NOT AN OFFER TO SELL THESE SECURITIES AND IT IS NOT A SOLICITATION OF AN OFFER TO BUY THESE SECURITIES IN ANY JURISDICTION WHERE THE OFFER OR SALE IS NOT PERMITTED.
| 89 |
31571 Rancho Viejo Road San Juan Capistrano, CA 92675 | Collateral Asset Summary – Loan No. 10 Ortega Ranch | Cut-off Date Balance: Cut-off Date LTV: U/W NCF DSCR: U/W NOI Debt Yield: | $25,000,000 70.4% 1.42x 8.6% |
| Tenant Summary | |||||||
Tenant | Ratings (Fitch/Moody’s/S&P) | Net Rentable Area (Sq. Ft.) | % of Net Rentable Area | U/W Base Rent PSF | % of Total U/W Base Rent | Lease Expiration | |
People’s Care(1) | NR/NR/NR | 9,609 | 6.7% | $24.60 | 7.5% | 12/31/2021 | |
New Method Wellness(2) | NR/NR/NR | 8,617 | 6.0% | $23.06 | 6.3% | 4/30/2020 | |
Capital Bank(3) | NR/NR/NR | 8,287 | 5.8% | $29.40 | 7.8% | 10/31/2021 | |
Ten Media LLC(4) | NR/NR/NR | 7,761 | 5.4% | $23.16 | 5.7% | 3/31/2016 | |
The Revival Center(5) | NR/NR/NR | 7,057 | 4.9% | $26.40 | 5.9% | 4/30/2019 | |
| Total Major Tenants | 41,331 | 28.8% | $25.28 | 33.3% | |||
| Remaining Tenants | 86,957 | 60.6% | $24.04 | 66.7% | |||
| Total Occupied Tenants | 128,288 | 89.4% | $24.44 | 100.0% | |||
| Vacant | 15,190 | 10.6% | |||||
| Total | 143,478 | 100.0% | |||||
| (1) | People’s Care has one three-year renewal option upon written notice no later than 12 months and no earlier than 18 months prior to the lease expiration date. The tenant has no termination options. |
| (2) | New Method Wellness has one five-year renewal option upon written notice no later than six months and no earlier than 12 months prior to the lease expiration date. The tenant has no termination options. |
| (3) | Capital Bank has one seven-year renewal option upon written notice no less than 180 days prior to the lease expiration date. The tenant has no termination options. |
| (4) | Ten Media LLC has no renewal or termination options. |
| (5) | The Revival Center has no renewal or termination options. |
Lease Rollover Schedule(1) | ||||||||
| Year | # of Leases Expiring | Total Expiring Sq. Ft. | % of Total Sq. Ft. Expiring | Cumulative Sq. Ft. Expiring | Cumulative % of Sq. Ft. Expiring | Annual U/W Base Rent PSF | % U/W Base Rent Rolling | Cumulative % of U/W Base Rent |
| MTM | 0 | 0 | 0.0% | 0 | 0.0% | $0.00 | 0.0% | 0.0% |
| 2015 | 22 | 38,226 | 26.6% | 38,226 | 26.6% | $23.88 | 29.1% | 29.1% |
| 2016 | 12 | 24,728 | 17.2% | 62,954 | 43.9% | $25.24 | 19.9% | 49.0% |
| 2017 | 5 | 9,496 | 6.6% | 72,450 | 50.5% | $24.36 | 7.4% | 56.4% |
| 2018 | 7 | 10,187 | 7.1% | 82,637 | 57.6% | $23.43 | 7.6% | 64.0% |
| 2019 | 6 | 16,893 | 11.8% | 99,530 | 69.4% | $26.62 | 14.3% | 78.4% |
| 2020 | 4 | 8,617 | 6.0% | 108,147 | 75.4% | $23.06 | 6.3% | 84.7% |
| 2021 | 5 | 17896 | 12.5% | 126,043 | 87.8% | $26.82 | 15.3% | 100.0% |
| 2022 | 0 | 0 | 0.0% | 126,043 | 87.8% | $0.00 | 0.0% | 100.0% |
| 2023 | 0 | 0 | 0.0% | 126,043 | 87.8% | $0.00 | 0.0% | 100.0% |
| 2024 | 0 | 0 | 0.0% | 126,043 | 87.8% | $0.00 | 0.0% | 100.0% |
| 2025 | 0 | 0 | 0.0% | 126,043 | 87.8% | $0.00 | 0.0% | 100.0% |
| Thereafter | 1 | 2,245 | 1.6% | 128,288 | 89.4% | $0.00 | 0.0% | 100.0% |
| Vacant | NAP | 15,190 | 10.6% | 143,478 | 100.0% | NAP | NAP | |
| Total / Wtd. Avg. | 62 | 143,478 | 100.0% | $24.44 | 100.0% | |||
| (1) | Certain tenants have lease termination options that may become exercisable prior to the originally stated expiration date of the tenant lease that are not considered in the lease rollover schedule. |
The Loan. The Ortega Ranch loan (the “Ortega Ranch Loan”) is a $25.0 million fixed rate loan secured by the borrowers’ fee simple interest in a 143,478 sq. ft., Class A office property located at 31571 Rancho Viejo Road in San Juan Capistrano, California (the “Ortega Ranch Property”). The Ortega Ranch Loan has a 10-year term and amortizes on a 30-year schedule after a 36-month interest only period. The Ortega Ranch Loan accrues interest at a fixed rate equal to 3.9000%. Loan proceeds, along with approximately $0.9 million of sponsor equity, were used to retire existing debt of approximately $25.2 million, fund upfront reserves of approximately $0.4 million and pay closing costs of approximately $0.2 million. Based on the appraised value of $35.5 million as of March 5, 2015, the cut-off date LTV ratio is 70.4%. The most recent prior financing of the Ortega Ranch Property was not included in a securitization.
THE INFORMATION IN THIS STRUCTURAL AND COLLATERAL TERM SHEET IS NOT COMPLETE AND MAY BE AMENDED PRIOR TO THE TIME OF SALE. THIS TERM SHEET IS NOT AN OFFER TO SELL THESE SECURITIES AND IT IS NOT A SOLICITATION OF AN OFFER TO BUY THESE SECURITIES IN ANY JURISDICTION WHERE THE OFFER OR SALE IS NOT PERMITTED.
| 90 |
31571 Rancho Viejo Road San Juan Capistrano, CA 92675 | Collateral Asset Summary – Loan No. 10 Ortega Ranch | Cut-off Date Balance: Cut-off Date LTV: U/W NCF DSCR: U/W NOI Debt Yield: | $25,000,000 70.4% 1.42x 8.6% |
| Sources and Uses | |||||||
| Sources | Proceeds | % of Total | Uses | Proceeds | % of Total | ||
| Loan Amount | $25,000,000 | 96.7% | Loan Payoff | $25,233,344 | 97.6% | ||
| Sponsor Equity | $859,325 | 3.3% | Reserves | $395,013 | 1.5% | ||
| Closing Costs | $230,969 | 0.9% | |||||
| Total Sources | $25,859,325 | 100.0% | Total Uses | $25,859,325 | 100.0% | ||
The Borrower / Sponsor. The borrower, Ortega Ranch, LLC, is a single purpose Delaware limited liability company structured to be bankruptcy-remote with two independent directors in its organizational structure. The sponsor of the borrower and the non-recourse carveout guarantor is Scott J. Seligman.
Scott J. Seligman is CEO of Seligman & Associates, Inc. Founded in 1954, Seligman & Associates, Inc. is a Michigan-based developer, investor and manager of commercial and residential properties. Seligman & Associates, Inc. owns in excess of 1.0 million sq. ft. of retail space, 1.97 million of office space and 816 multifamily units throughout the western United States, including nine office and flex properties in Southern California. In addition to acting as CEO of Seligman & Associates, Inc., Scott J. Seligman also owns Sterling Bank & Trust, a regional bank in San Francisco.
The Property. The Ortega Ranch Property consists of a 143,478 sq. ft. business park located in San Juan Capistrano, California. The Ortega Ranch Property consists of 12 one- and two-story office buildings that were constructed by the sponsor in 2005 and renovated in 2014. The sponsor’s total cost basis in the Ortega Ranch Property is $46.0 million ($321 PSF). The Ortega Ranch Property features a diversified rent roll leased to more than 40 local businesses, with approximately 24,904 sq. ft. (17.4% of NRA) having been at the Ortega Ranch Property since 2006 and 2007. The Ortega Ranch Property experienced a significant drop in occupancy in 2013 due to an ongoing $86.2 million road construction project at the nearby Interstate 5 and Ortega Highway interchange. Since the aforementioned road project has entered into its completion phase, the Ortega Ranch Property has seen an upward swing in leasing. The subsequent chart shows the average annual occupancy at the Ortega Ranch Property since 2006. Since March 2014, the sponsor has signed 46,723 sq. ft. of new and renewal leases with a weighted average rental rate of $25.09 PSF and term of 4.25 years. While it is common for tenants to sign shorter term leases at the Ortega Ranch Property, many tenants renew their leases several times and have expanded into additional space. On a weighted average basis, the current tenants have been at the property for 6.6 years. In addition, the Ortega Ranch Property has 571 parking spaces, which equates to a parking ratio of approximately 3.98 spaces per 1,000 sq. ft.
Historical Average Occupancy Chart(1) | |||||||||
| Year | 2006 | 2007 | 2008 | 2009 | 2010 | 2011 | 2012 | 2013 | 2014 |
| Occupancy | 30.5% | 71.5% | 87.0% | 87.4% | 82.7% | 85.7% | 82.6% | 79.7% | 85.1% |
| (1) | Source: sponsor |
The Ortega Ranch Property is located at the intersection of Rancho Viejo Road and Ortega Highway which is a major intersection in San Juan Capistrano. Public transportation is provided to the Ortega Ranch Property via the San Juan Capistrano Amtrak station, which is located just on the other side of I-5, approximately 0.7 miles away. Additionally tenants benefit from being 0.6 miles from the Camino-Capistrano/Ortega Highway bus stop, which is located adjacent to the Amtrak station.
Environmental Matters. The Phase I environmental report dated March 13, 2015 recommended no further action at the Ortega Ranch Property.
Major Tenants.
People’s Care (9,609 sq. ft.; 6.7% of NRA; 7.5% of U/W Base Rent). People’s Care provides onsite assisted living care for elders, children, and other special services. People’s Care specializes in private, in-home senior care, rehabilitation care, chronic illness care, Alzheimer’s/dementia care and care for those with challenging behaviors. The tenant signed a lease at the Ortega Ranch Property in January 2015, for a seven-year term, with one three-year renewal option and no termination options.
New Method Wellness (8,617 sq. ft.; 6.0% of NRA; 6.3% of U/W Base Rent). New Method Wellness is a center for out-patient addiction treatment that provides a variety of services for alcohol and drug addiction. Services include medical detox, primary care, dual diagnosis, extended aftercare, outpatient treatment and family outreach. At the New Method Wellness Center, rehabilitation is supported by acupuncture, yoga, massage, process group therapy, relapse prevention, meditation, art therapy, nutrition and family therapy. The tenant has been at the Ortega Ranch Property since early 2011 and has expanded into additional space multiple times. New Method Wellness has one five-year renewal option and no termination options.
Capital Bank (8,287 sq. ft.; 5.8% of NRA; 7.8% of U/W Base Rent). Capital Bank is a business and professional community bank located in South Orange County, providing traditional personal banking products and also business banking products. The bank provides lines of credit, equipment loans, term loans, real estate loans, construction loans, professional loans and letters of credit to
THE INFORMATION IN THIS STRUCTURAL AND COLLATERAL TERM SHEET IS NOT COMPLETE AND MAY BE AMENDED PRIOR TO THE TIME OF SALE. THIS TERM SHEET IS NOT AN OFFER TO SELL THESE SECURITIES AND IT IS NOT A SOLICITATION OF AN OFFER TO BUY THESE SECURITIES IN ANY JURISDICTION WHERE THE OFFER OR SALE IS NOT PERMITTED.
| 91 |
31571 Rancho Viejo Road San Juan Capistrano, CA 92675 | Collateral Asset Summary – Loan No. 10 Ortega Ranch | Cut-off Date Balance: Cut-off Date LTV: U/W NCF DSCR: U/W NOI Debt Yield: | $25,000,000 70.4% 1.42x 8.6% |
businesses. Capital Bank has been at the Ortega Ranch Property since March 2007 and renewed its lease for seven years in November 2014. The tenant has one seven-year renewal option, and no termination provisions. According to the property manager, Capital Bank invested approximately $80.00 PSF into the build-out of their retail branch space.
The Market. The Ortega Ranch Property is located within the San Juan Capistrano neighborhood of South Orange Country, California which is considered to be a suburban location of the Santa Ana-Anaheim-Irvine metropolitan division. The Ortega Ranch Property is located directly off of Interstate 5 in an infill area characterized by office, retail and residential uses. The immediate area around the Ortega Ranch Property features low rise business park developments to the east and north with a number of commercial developments and residential developments to the west.
According to a market research report, the South Orange County office submarket consists of 662 properties totaling 22.7 million sq. ft. and featured a vacancy rate of 8.0% in 2014, the lowest of all Orange County office submarkets. Annual rental rates in the South Orange County office submarket have recovered from the recent trough of $23.16 PSF in 2012 to $26.28 PSF as of 4Q 2014. The submarket has experienced no new construction since 2009 and experienced positive absorption for the second consecutive year in 2014. In addition, the appraiser concluded the office vacancy rate for the submarket to be 6.0% and for the San Juan Capistrano area to be 5.0%.
The appraiser identified five comparable office properties in the Orange County submarket with recent leases having a base rent range of $19.80 PSF to $27.00 PSF. Based on recent leases at the Ortega Ranch Property signed since November 2014 with lease terms of 24 to 36 months, had a rental rate range of $23.40 to $26.40 PSF, averaging $24.83 PSF. Using both the market comparables and recent leasing at the Ortega Ranch Property, the appraiser determined a market rent of $24.60 PSF. The chart below summarizes the comparable office leases determined by the appraiser.
Summary of Comparable Rentals(1) | |||||||
| Name | Year Built | Net Rentable Area (Sq. Ft.) | Occupancy | Comparable Lease Sq. Ft. | Comparable Lease Term (Yrs.) | Comparable Lease Base Rent PSF | |
| Ortega Ranch Property | 2005 | 143,478 | 89.4%(2) | NAP | NAP | NAP | |
| San Juan Corporate Plaza | 1989 | 32,173 | 83.0% | 1,995 – 5,299 | 0.4 – 5.0 | $25.80 – $27.00 | |
| Marbella Commerce Center | 2001 | 46,415 | 96.0% | 3,222 | 0.3 | $24.48 | |
| Two Multi-tenant Office Buildings | 2006 | 115,517 | 85.0% | 590 – 1,801 | 1.5 – 5.4 | $20.40 – $22.32 | |
| San Juan Clock Tower | 1980 | 16,000 | 100.0% | 3,855 | 5.0 | $26.40 | |
| 33272 Valle Road, Bldg. 1 | 2006 | 10,632 | 100.0% | 10,632 | 5.2 | $19.80 | |
Total / Wtd. Avg.(3): | 220,737 | 88.8% | |||||
| (1) | Source: Appraisal. |
| (2) | Based on rent roll dated April 20, 2015. |
| (3) | Total / Wtd. Avg. excludes the Ortega Ranch Property. |
THE INFORMATION IN THIS STRUCTURAL AND COLLATERAL TERM SHEET IS NOT COMPLETE AND MAY BE AMENDED PRIOR TO THE TIME OF SALE. THIS TERM SHEET IS NOT AN OFFER TO SELL THESE SECURITIES AND IT IS NOT A SOLICITATION OF AN OFFER TO BUY THESE SECURITIES IN ANY JURISDICTION WHERE THE OFFER OR SALE IS NOT PERMITTED.
| 92 |
31571 Rancho Viejo Road San Juan Capistrano, CA 92675 | Collateral Asset Summary – Loan No. 10 Ortega Ranch | Cut-off Date Balance: Cut-off Date LTV: U/W NCF DSCR: U/W NOI Debt Yield: | $25,000,000 70.4% 1.42x 8.6% |
Cash Flow Analysis.
| Cash Flow Analysis | ||||||
| 2011 | 2012 | 2013 | 2014 | U/W | U/W PSF | |
Base Rent(1) | $2,778,584 | $2,642,634 | $2,629,881 | $2,814,114 | $3,182,006 | $22.18 |
| Value of Vacant Space | 0 | 0 | 0 | 0 | 373,674 | 2.60 |
| Gross Potential Rent | $2,778,584 | $2,642,634 | $2,629,881 | $2,814,114 | $3,555,680 | $24.78 |
| Total Recoveries | 18,332 | 12,802 | 12,841 | 11,394 | 946 | 0.01 |
| Total Other Income | 3,463 | 5,109 | 7,137 | 2,544 | 0 | 0.00 |
Less: Vacancy(2) | 0 | 0 | 0 | 0 | (373,674) | (2.60) |
| Effective Gross Income | $2,800,379 | $2,660,545 | $2,649,859 | $2,828,052 | $3,182,952 | $22.18 |
| Total Operating Expenses | 947,087 | 910,049 | 948,073 | 971,050 | 1,025,023 | 7.14 |
| Net Operating Income | $1,853,292 | $1,750,496 | $1,701,786 | $1,857,002 | $2,157,928 | $15.04 |
| TI/LC | 0 | 0 | 0 | 0 | 155,553 | 1.08 |
TI/LC Reserve Credit(3) | 0 | 0 | 0 | 0 | (30,000) | (0.21) |
| Capital Expenditures | 0 | 0 | 0 | 0 | 28,696 | 0.20 |
| Net Cash Flow | $1,853,292 | $1,750,496 | $1,701,786 | $1,857,002 | $2,003,679 | $13.97 |
| (1) | U/W Base Rent includes $46,661 of contractual rent increases through March 2016. |
| (2) | U/W Vacancy represents 10.5% of gross income and is based on the in-place vacancy. The appraiser concluded a submarket vacancy of 6.0%. |
| (3) | The TI/LC Reserve Credit is based on the upfront $300,000 TI/LC reserve deposit. |
Property Management. The Ortega Ranch Property is managed by S.M. Farthington Ltd., LLC, dba Seligman Western Enterprises, Ltd. II, a borrower affiliate.
Lockbox / Cash Management. The Ortega Ranch Loan is structured with a hard lockbox and springing cash management. The borrower is required to direct all tenants to deposit all rents and other payments into a lockbox account controlled by the lender that was established by the borrower at closing. Provided no Trigger Period (as defined below) is continuing, all funds in the lockbox account are swept daily to the borrower’s operating account. Upon the occurrence and during the continuance of a Trigger Period, all transfers to the borrower’s operating account will cease and all funds in the lockbox account will be swept on each business day to a cash management account under the control of the lender and disbursed in accordance with of the Ortega Ranch Loan documents, with any excess funds being held by lender as additional collateral for the Ortega Ranch Loan.
A “Trigger Period” will occur upon (i) an event of default, (ii) the debt service coverage ratio falls below 1.15x on an amortizing basis as of the last day of any calendar quarter or (iii) the period that any mezzanine loan is outstanding, until such time as (a) with respect to clause (i), the event of default has been cured and (b) with respect to clause (ii), the debt service coverage ratio is at least 1.20x on an amortizing basis for two consecutive quarters and (c) with respect to clause (iii), the mezzanine loan is no longer outstanding.
Initial Reserves. At closing, the borrower deposited (i) $95,013 into a tax reserve account and (ii) $300,000 into a TI/LC reserve account.
Ongoing Reserves. On a monthly basis, the borrower is required to deposit reserves of (i) 1/12 of the estimated annual real estate taxes, which currently equates to $23,753, into a tax reserve account, (ii) $2,391 into a replacement reserve account and (iii) $14,946 into a TI/LC reserve account, subject to a cap of $350,000. In addition, 1/12 of the annual insurance premium will be required to be deposited into an insurance reserve account if an acceptable blanket insurance policy is no longer in place.
Current Mezzanine or Subordinate Indebtedness. None.
Future Mezzanine or Subordinate Indebtedness Permitted. The borrower is permitted to obtain future mezzanine financing provided that, among other conditions, the principal amount of such mezzanine loan when combined with the principal amount of the Ortega Ranch Loan will result in a (i) combined LTV of no more than 70.4%, (ii) combined debt service coverage ratio of no less than 1.42x on an amortizing basis and (iii) debt yield of no less than 8.07%.
THE INFORMATION IN THIS STRUCTURAL AND COLLATERAL TERM SHEET IS NOT COMPLETE AND MAY BE AMENDED PRIOR TO THE TIME OF SALE. THIS TERM SHEET IS NOT AN OFFER TO SELL THESE SECURITIES AND IT IS NOT A SOLICITATION OF AN OFFER TO BUY THESE SECURITIES IN ANY JURISDICTION WHERE THE OFFER OR SALE IS NOT PERMITTED.
| 93 |
31571 Rancho Viejo Road San Juan Capistrano, CA 92675 | Collateral Asset Summary – Loan No. 10 Ortega Ranch | Cut-off Date Balance: Cut-off Date LTV: U/W NCF DSCR: U/W NOI Debt Yield: | $25,000,000 70.4% 1.42x 8.6% |
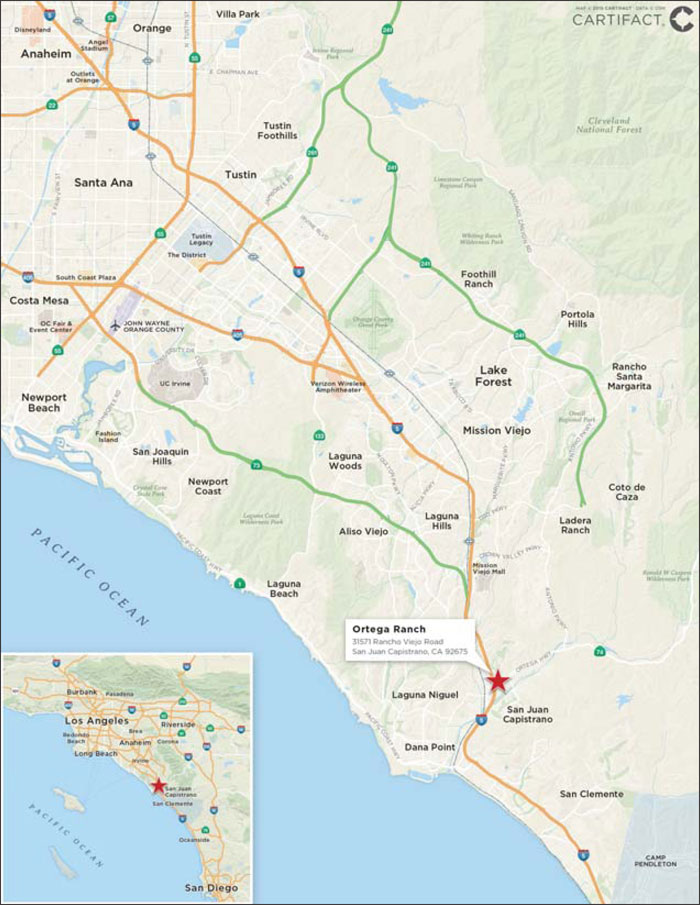
THE INFORMATION IN THIS STRUCTURAL AND COLLATERAL TERM SHEET IS NOT COMPLETE AND MAY BE AMENDED PRIOR TO THE TIME OF SALE. THIS TERM SHEET IS NOT AN OFFER TO SELL THESE SECURITIES AND IT IS NOT A SOLICITATION OF AN OFFER TO BUY THESE SECURITIES IN ANY JURISDICTION WHERE THE OFFER OR SALE IS NOT PERMITTED.
| 94 |
(THIS PAGE INTENTIONALLY LEFT BLANK)
| 95 |
400 West Tudor Road Anchorage, AK 99503 | Collateral Asset Summary – Loan No. 11 Anchorage Business Park | Cut-off Date Balance: Cut-off Date LTV: U/W NCF DSCR: U/W NOI Debt Yield: | $24,970,804 73.9% 1.36x 9.2% |
| Mortgage Loan Information | |
| Loan Seller: | CCRE |
| Loan Purpose: | Refinance |
| Sponsor: | John Ziegler |
| Borrower: | STG ABC, LLC |
| Original Balance: | $25,000,000 |
| Cut-off Date Balance: | $24,970,804 |
| % by Initial UPB: | 1.9% |
| Interest Rate: | 4.5905% |
| Payment Date: | 6th of each month |
| First Payment Date: | June 6, 2015 |
| Maturity Date: | May 6, 2025 |
| Amortization: | 360 months |
| Additional Debt: | None |
| Call Protection: | L(25), D(92), O(3) |
Lockbox / Cash Management(1): | Soft Springing Hard / Springing |
| Reserves | ||
| Initial | Monthly | |
| Taxes: | $341,764 | $34,176 |
| Insurance: | $20,472 | $2,559 |
| Replacement: | $0 | $2,947 |
TI/LC(2): | $1,500,000 | Springing |
Immediate Repairs(3): | $72,881 | NAP |
Rent Holdback(4): | $103,122 | $0 |
| Financial Information | |
| Cut-off Date Balance / Sq. Ft.: | $141 |
| Balloon Balance / Sq. Ft.: | $115 |
| Cut-off Date LTV: | 73.9% |
| Balloon LTV: | 60.0% |
| Underwritten NOI DSCR: | 1.49x |
| Underwritten NCF DSCR: | 1.36x |
| Underwritten NOI Debt Yield: | 9.2% |
| Underwritten NCF Debt Yield: | 8.3% |
| Property Information | |
| Single Asset / Portfolio: | Single Asset |
| Property Type: | CBD Office |
| Collateral: | Fee Simple |
| Location: | Anchorage, AK |
| Year Built / Renovated: | 1974-1978 / 2000 |
| Total Sq. Ft.: | 176,799 |
| Property Management: | STG Asset Management, Inc. |
| Underwritten NOI: | $2,294,276 |
| Underwritten NCF: | $2,082,118 |
| Appraised Value: | $33,800,000 |
| Appraisal Date: | March 18, 2015 |
| Historical NOI | |
| Most Recent NOI: | $2,304,050 (T-12 February 28, 2015) |
| 2014 NOI: | $2,311,253 (December 31, 2014) |
| 2013 NOI: | $2,522,626 (December 31, 2013) |
| 2012 NOI: | $2,570,695 (December 31, 2012) |
| Historical Occupancy | |
| Most Recent Occupancy: | 86.0% (April 30, 2015) |
| 2014 Occupancy: | 87.6% (December 31, 2014) |
| 2013 Occupancy: | 95.1% (December 31, 2013) |
| 2012 Occupancy: | 96.6% (December 31, 2012) |
| (1) | A hard lockbox, cash management and an excess cash flow sweep will be triggered upon (i) an event of default, (ii) the bankruptcy of any borrower, principal, guarantor or property manager, or (iii) the failure by the borrower after the end of one calendar quarter to maintain a net operating income debt service coverage ratio of at least 1.15x, until the debt service coverage ratio is at least 1.30x for one calendar quarter. |
| (2) | The borrower deposited $1,500,000 at loan closing for future general tenant rollover. Ongoing TI/LC collections will be capped at $1,000,000, including the initial deposit, provided (i) no event of default is continuing and (ii) at least 85.0% of the property is occupied by tenants that are (a) paying full contractual rent under their respective leases, (b) not the subject of any bankruptcy action and (c) not in default beyond any applicable notice and/or cure periods under the terms of their respective leases. |
| (3) | Represents 125.0% of the engineer’s required repairs for asphalt paving and exterior wall painting. |
| (4) | The borrower deposited $103,122 at closing for free rent associated with a lease the borrower anticipates will be executed, which was not underwritten. |
| TRANSACTION HIGHLIGHTS |
| § | Property. Anchorage Business Park is a 14-building, single-story office park totaling 176,799 sq. ft. located across 13.7 acres on West Tudor Road in Anchorage, Alaska. The buildings were constructed from 1974 to 1978, renovated in 2000 and are occupied by 39 different office tenants. Anchorage Business Park benefits from excellent visibility along major local arterials and access to both Walter J. Hickel Parkway and US Route 1, which provide North/South access to the entire state of Alaska. |
| § | Tenancy. The largest tenant at Anchorage Business Park is the State of Alaska – Department of Administration (rated AAA/Aaa/AAA by Fitch/Moody’s/S&P), which occupies 14.4% of the total net rentable area (“NRA”) and has occupied over 20,000 sq. ft. at the property for 15 years. The sponsor contributed $590,000 to completely retro-fit the space for the state’s use. 18 tenants occupying 48.5% of the NRA have occupied space at the property for more than ten years for an average duration of 16.7 years. Additionally, 69.8% of the NRA has been at the property for over five years. |
| § | Tenant Retention. Eight tenants have renewed leases and/or signed leases to increase total square footage, including GCI Communications (13,444 sq. ft. total; renewed 5,767 sq. ft. and increased space by 2,503 sq. ft.), Century 21 (6,824 sq. ft. total, increased space by 4,246 sq. ft.), EEIS Consulting Engineers, Inc. (6,732 sq. ft. total, renewed), WHPacific, Inc. (4,960 sq. ft. total, renewed), Alaska Integrated Media, Inc. (2,425 sq. ft. total, renewed), The Vortex Group (1,474 sq. ft. total, renewed), Sedgwick Claims Management Services, Inc. (1,368 sq. ft. total, renewed) and Alaska Medical Solutions (1,309 sq. ft. total, renewed). |
| § | Sponsorship. The sponsor, John Ziegler, principal of STG Group, has over 30 years of experience owning and managing commercial real estate with a portfolio consisting of 26 assets, comprising approximately 4.0 million sq. ft. with a market value of approximately over $370.0 million. In addition to the property, the sponsor’s Alaska holdings include 292,721 sq. ft. of industrial space in Anchorage and 93,000 sq. ft. of office space in Juneau. |
THE INFORMATION IN THIS STRUCTURAL AND COLLATERAL TERM SHEET IS NOT COMPLETE AND MAY BE AMENDED PRIOR TO THE TIME OF SALE. THIS TERM SHEET IS NOT AN OFFER TO SELL THESE SECURITIES AND IT IS NOT A SOLICITATION OF AN OFFER TO BUY THESE SECURITIES IN ANY JURISDICTION WHERE THE OFFER OR SALE IS NOT PERMITTED.
| 96 |
26-34 South State Street Chicago, IL 60603 | Collateral Asset Summary – Loan No. 12 26-34 South State Street | Cut-off Date Balance: Cut-off Date LTV: U/W NCF DSCR: U/W NOI Debt Yield: | $24,000,000 66.9% 1.60x 7.6% |
| Mortgage Loan Information | |
| Loan Seller: | GACC |
| Loan Purpose: | Refinance |
Sponsor(1): | Joseph J. Sitt |
| Borrower: | Thor Gallery at State Street, LLC |
| Original Balance: | $24,000,000 |
| Cut-off Date Balance: | $24,000,000 |
| % by Initial UPB: | 1.8% |
| Interest Rate: | 4.4800% |
| Payment Date: | 6th of each month |
| First Payment Date: | July 6, 2015 |
| Maturity Date: | June 6, 2025 |
| Amortization: | Interest Only |
| Additional Debt: | None |
| Call Protection: | L(24), D(91), O(5) |
| Lockbox / Cash Management: | Hard / In Place |
| Reserves | ||
| Initial | Monthly | |
| Taxes: | $205,678 | $45,715 |
Insurance(2): | $0 | Springing |
Replacement(3): | $0 | $1,610 |
| TI/LC: | $2,500,000 | $1,208 |
| Required Repairs: | $143,239 | NAP |
Lease Sweep(4): | $0 | Springing |
Free Rent Reserve(5): | $1,248,333 | $0 |
| Financial Information | ||
| Cut-off Date Balance / Sq. Ft.: | $248 | |
| Balloon Balance / Sq. Ft.: | $248 | |
| Cut-off Date LTV: | 66.9% | |
| Balloon LTV: | 66.9% | |
| Underwritten NOI DSCR: | 1.68x | |
| Underwritten NCF DSCR: | 1.60x | |
| Underwritten NOI Debt Yield: | 7.6% | |
| Underwritten NCF Debt Yield: | 7.3% | |
| Property Information | |
| Single Asset / Portfolio: | Single Asset |
| Property Type: | Single Tenant Retail |
| Collateral: | Fee Simple |
| Location: | Chicago, IL |
| Year Built / Renovated: | 1930 / 2015 |
| Total Sq. Ft.: | 96,600 |
| Property Management: | Thor Management Company LLC |
| Underwritten NOI: | $1,830,524 |
| Underwritten NCF: | $1,747,603 |
| Appraised Value: | $35,850,000 |
| Appraisal Date: | March 25, 2015 |
Historical NOI(6) | |
| 2014 NOI: | $1,704,174 (December 31, 2014) |
| 2013 NOI: | $1,717,548 (December 31, 2013) |
| 2012 NOI: | $1,966,780 (December 31, 2012) |
Historical Occupancy(6) | |
| Most Recent Occupancy: | 100.0% (June 6, 2015) |
| 2014 Occupancy: | 100.0% (December 31, 2014) |
| 2013 Occupancy: | 100.0% (December 31, 2013) |
| (1) | The sponsor is also the sponsor under the mortgage loans identified on Annex A-1 to the Free Writing Prospectus as 155 Mercer Street and 36 South State Street, which have Cut-Off Date Balances of $41,000,000 and $16,800,000, respectively. |
| (2) | If an acceptable blanket insurance policy is no longer in place, borrower is required to deposit 1/12 of the annual insurance premiums into the insurance reserve account. |
| (3) | The replacement reserve is subject to a cap of $50,000. |
| (4) | On each monthly payment date during a Lease Sweep Period, all excess cash flow will be deposited into the lease sweep reserve. A Lease Sweep Period will commence upon (i) 12 months prior to the expiration of Footaction’s lease, (ii) the receipt by borrower or manager of Footaction exercising its right to terminate its lease, (iii) the date the Footaction lease is surrendered, cancelled, or terminated prior to its then current expiration date or Footaction gives notice of its intention to do so, (iv) the date that Footaction discontinues its business at the property or gives notice to discontinue its business at the property, (v) upon a default of the Footaction lease by Footaction, (vi) the occurrence of an insolvency proceeding or (vii) Footaction being downgraded below “B1” by Moody’s or its functional equivalent. |
| (5) | At closing, $1,248,333 was reserved to cover five months of free rent associated with the Footaction lease. |
| (6) | Historical NOI and Historical Occupancy reflect figures for the previous tenant, Forever 21. The current tenant, Footaction, took possession of the property on April 22, 2015, but is not yet in occupancy |
| TRANSACTION HIGHLIGHTS |
| § | Location. The 26-34 South State Street property is located in Chicago’s central business district in the area generally known as the Loop. The Loop contains the main concentration of office and commercial space in the Chicago CBD. Specifically, the property in located along the west side of State Street, which is Chicago’s original shopping street and one of the city’s most visited streets. The 2015 population within a 0.5-, 1.0- and 1.5-mile radius of the property is 12,017, 70,968 and 131,927, respectively and the median household income is $76,714, $83,602 and $80,867, respectively. The property is accessible via both public and private transportation, with the four main metro stations in the city located within walking distance and ample parking provided by multiple nearby parking facilities as well as the property’s parking garage. As of year-end 2014, the retail vacancy for the submarket was 4.2%. |
| § | Long Term Lease. The 26-34 South State Street property is 100.0% leased by Footaction, a subsidiary of Footlocker Retail, Inc (rated Ba2/BB+ by Moody’s/S&P), which will initially be doing business as “Footaction” or “Footaction USA”. The property will serve as Footaction’s flagship location in Chicago. Footlocker Retail, Inc. signed a 15-year lease for its space, commencing April 22, 2015, with no termination options and one, five-year extension option. Footaction’s lease is guaranteed by its parent company, Footlocker Retail, Inc. |
| § | Sponsorship. The sponsor and the nonrecourse carve-out guarantor is Joseph J. Sitt. Mr. Sitt is an American Real estate investor and the founder and CEO of Thor Equities, LLC. Thor Equities, LLC is a real estate investment firm that specializes in real estate acquisition and development, focusing on retail, office, hotel and mixed use properties. Thor Equities, LLC was founded in 1986 and is based in New York, NY. |
THE INFORMATION IN THIS STRUCTURAL AND COLLATERAL TERM SHEET IS NOT COMPLETE AND MAY BE AMENDED PRIOR TO THE TIME OF SALE. THIS TERM SHEET IS NOT AN OFFER TO SELL THESE SECURITIES AND IT IS NOT A SOLICITATION OF AN OFFER TO BUY THESE SECURITIES IN ANY JURISDICTION WHERE THE OFFER OR SALE IS NOT PERMITTED.
| 97 |
4200 South Freeway Fort Worth, TX 76115 | Collateral Asset Summary – Loan No. 13 La Gran Plaza | Cut-off Date Balance: Cut-off Date LTV: U/W NCF DSCR: U/W NOI Debt Yield: | $23,969,702 65.1% 1.73x 11.2% |
| Mortgage Loan Information | |
| Loan Seller: | LCF |
| Loan Purpose: | Refinance |
| Sponsor: | Andrew J. Segal |
| Borrower: | Town Center Mall, L.P. |
Original Balance(1): | $24,000,000 |
Cut-off Date Balance(1): | $23,969,702 |
| % by Initial UPB: | 1.8% |
| Interest Rate: | 4.2400% |
| Payment Date: | 6th of each month |
| First Payment Date: | June 6, 2015 |
| Maturity Date: | May 6, 2025 |
| Amortization: | 360 months |
Additional Debt(1) (2): | $51,934,353 Pari Passu Debt; Future Mezzanine Debt Permitted |
Call Protection(3): | L(25), D(91), O(4) |
Lockbox / Cash Management(4): | Hard / Springing |
| Reserves | ||
| Initial | Monthly | |
| Taxes: | $546,391 | $91,065 |
| Insurance: | $77,827 | $8,647 |
Replacement(5): | $0 | $17,177 |
TI/LC(6): | $0 | $47,038 |
| Development Agreement: | $5,000,000 | $0 |
Mercado(7): | $1,318,168 | Springing |
| Free Rent: | $104,518 | $0 |
| Unfunded Obligations: | $1,436,051 | $0 |
| Financial Information | ||
| Cut-off Date Balance / Sq. Ft.: | $74 | |
| Balloon Balance / Sq. Ft.: | $59 | |
| Cut-off Date LTV: | 65.1% | |
| Balloon LTV: | 52.2% | |
| Underwritten NOI DSCR: | 1.90x | |
| Underwritten NCF DSCR: | 1.73x | |
| Underwritten NOI Debt Yield: | 11.2% | |
| Underwritten NCF Debt Yield: | 10.2% | |
| Property Information | |
| Single Asset / Portfolio: | Single Asset |
| Property Type: | Retail / Office Mixed Use |
| Collateral: | Fee Simple |
| Location: | Fort Worth, TX |
| Year Built / Renovated: | 1961 / 2004 |
| Total Sq. Ft.: | 1,030,613 |
| Property Management: | Group Zocalo, L.P. |
| Underwritten NOI: | $8,506,329 |
| Underwritten NCF: | $7,733,266 |
| Appraised Value: | $116,600,000 |
| Appraisal Date: | February 27, 2015 |
| Historical NOI | |
| Most Recent NOI: | $8,193,256 (T-12 January 31, 2015) |
| 2014 NOI: | $8,124,040 (December 31, 2014) |
| 2013 NOI: | $7,965,063 (December 31, 2013) |
| 2012 NOI: | $7,973,309 (December 31, 2012) |
| Historical Occupancy | |
| Most Recent Occupancy: | 85.8% (April 6, 2015) |
| 2014 Occupancy: | 88.8% (December 31, 2014) |
| 2013 Occupancy: | 88.4% (December 31, 2013) |
| 2012 Occupancy: | 90.2% (December 31, 2012) |
| (1) | The Original Balance and Cut-off Date Balance of approximately $24.0 million represent the non-controlling Note A-2 of a $76.0 million loan combination, that is evidenced by such Note A-2, a controlling $26.0 million Note A-1 and a non-controlling $26.0 million Note A-3. The pari passu Note A-3 was contributed to the COMM 2015-CCRE23 securitization. The pari passu Note A-1 is currently held by LCF or its affiliate and is expected to be included in one or more future securitizations. |
| (2) | Mezzanine debt is permitted provided, among other things, (i) the combined LTV is less than or equal to 70.0% and (ii) the combined DSCR is equal to or greater than 1.45x. |
| (3) | The lockout period will be at least 25 payment dates beginning with and including the payment date of June 6, 2015. Defeasance of the La Gran Plaza loan combination is permitted after the date that is the earlier to occur of (i) two years after the closing date of the securitization that includes the last pari passu note to be securitized and (ii) April 13, 2018. |
| (4) | A hard lockbox is in place from day one with all rents being directed to the clearing account. Cash management and an excess cash flow sweep will be triggered upon (i) an event of default under the loan or the property management agreement, (ii) the DSCR for the property falling below 1.35x, or (iii) the occurrence of the borrower failing to replenish the Mercado Reserve 45 days after a distribution from such account. |
| (5) | Monthly replacement reserve deposits will be capped at an aggregate amount of $420,000 provided, however, that on each capital expenditure additional work determination date (and continuing thereafter for the remainder of the term), the capital expenditure cap amount shall be increased by the capital expenditure additional deposit amount. |
| (6) | Monthly TI/LC deposits will be capped at the greater of (i) $1,150,000 or (ii) $10.00 multiplied by the sq. ft. of all specified leases (as described in the loan documents) with expiration dates occurring during the subsequent 12 calendar months. |
| (7) | Initial Mercado reserve deposit is capped at $1,318,168. |
| TRANSACTION HIGHLIGHTS |
| § | Property. La Gran Plaza property is a 1,030,613 sq. ft. mixed use property located in Fort Worth, Texas. The property includes 898,606 sq. ft. of retail space, 132,007 sq. ft. of office building space and a total of 4,068 available parking spaces. La Gran Plaza property benefits from over 5.0 million visitors annually. Additionally, La Gran Plaza property includes one of the seven bus transfer stations for Fort Worth, known as the “T Transfer Center.” The property is located directly off I-35, one-mile from the I-20 interchange, providing access to the Dallas Metroplex. 169,000 vehicles pass by the property on a daily basis. |
| § | Market. La Gran Plaza property is located in the Southwest Tarrant/North Johnson submarket within the southern part of the Fort Worth retail and office market, which exhibited a submarket vacancy of 13.7% and average asking rents of $13.29 PSF as of Q4 2014. The 2014 population within a five-mile radius was 267,137. The 2014 median household income within a five-mile radius was $37,488 and the average home value within a five-mile radius was $113,471. |
| § | Sponsorship. The sponsor of the borrower is Andrew J. Segal, founder and CEO of Boxer Property Management Corporation (“Boxer”). Boxer was founded in 1992 to acquire, manage, lease, administer, and sell closely held commercial properties. Boxer currently manages over 14.0 million sq. ft. in Texas. |
THE INFORMATION IN THIS STRUCTURAL AND COLLATERAL TERM SHEET IS NOT COMPLETE AND MAY BE AMENDED PRIOR TO THE TIME OF SALE. THIS TERM SHEET IS NOT AN OFFER TO SELL THESE SECURITIES AND IT IS NOT A SOLICITATION OF AN OFFER TO BUY THESE SECURITIES IN ANY JURISDICTION WHERE THE OFFER OR SALE IS NOT PERMITTED.
| 98 |
570 Scenic Gulf Drive Destin, FL 32550 | Collateral Asset Summary – Loan No. 14 Embassy Suites Destin | Cut-off Date Balance: Cut-off Date LTV: U/W NCF DSCR: U/W NOI Debt Yield: | $22,500,000 71.7% 1.89x 12.8% |
| Mortgage Loan Information | |
| Loan Seller: | GACC |
| Loan Purpose: | Refinance |
Sponsor(1): | Allan V. Rose |
| Borrower: | RT-Destin Associates, LLC |
| Original Balance: | $22,500,000 |
| Cut-off Date Balance: | $22,500,000 |
| % by Initial UPB: | 1.7% |
| Interest Rate: | 4.4150% |
| Payment Date: | 1st of each month |
| First Payment Date: | July 1, 2015 |
| Maturity Date: | June 1, 2025 |
| Amortization: | 360 months |
| Additional Debt: | None |
| Call Protection: | L(24), D(92), O(4) |
Lockbox / Cash Management(2): | Hard / Springing |
| Reserves | ||
| Initial | Monthly | |
| Taxes: | $28,704 | $9,568 |
Insurance(3): | $0 | Springing |
FF&E(4): | $0 | At least 4.0% of prior month’s gross revenue |
PIP(5): | $1,865,910 | $0 |
Seasonality(6): | $534,392 | $0 |
| Comfort Letter Transfer: | $2,500 | $0 |
| Financial Information | ||
| Cut-off Date Balance / Room: | $145,161 | |
| Balloon Balance / Room: | $117,034 | |
| Cut-off Date LTV: | 71.7% | |
| Balloon LTV: | 57.8% | |
| Underwritten NOI DSCR: | 2.13x | |
| Underwritten NCF DSCR: | 1.89x | |
| Underwritten NOI Debt Yield: | 12.8% | |
| Underwritten NCF Debt Yield: | 11.4% | |
| Property Information | |
| Single Asset / Portfolio: | Single Asset |
| Property Type: | Full Service Hospitality |
| Collateral: | Fee Simple |
| Location: | Destin, FL |
| Year Built / Renovated: | 2001 / 2014 |
| Total Rooms: | 155 |
| Property Management: | Dimension Development Two, LLC |
| Underwritten NOI: | $2,890,757 |
| Underwritten NCF: | $2,561,408 |
| Appraised Value: | $31,400,000 |
| Appraisal Date: | March 23, 2015 |
| Historical NOI | |
| Most Recent NOI: | $2,885,728 (T-12 April 30, 2015) |
| 2014 NOI: | $2,561,232 (December 31, 2014) |
| 2013 NOI: | $2,424,007 (December 31, 2013) |
| 2012 NOI: | $2,265,582 (December 31, 2012) |
| Historical Occupancy | |
| Most Recent Occupancy: | 82.5% (April 30, 2015) |
| 2014 Occupancy: | 77.3% (December 31, 2014) |
| 2013 Occupancy: | 81.5% (December 31, 2013) |
| 2012 Occupancy: | 79.5% (December 31, 2012) |
| (1) | The sponsor is also the sponsor under the mortgage loan identified on Annex A-1 to the Free Writing Prospectus as Courtyard by Marriott Pasadena, which has a Cut-Off Date Balance of $73,750,000. |
| (2) | Cash management and an excess cash sweep will be triggered upon (i) an event of default or (ii) if the DSCR falls below 1.15x as of any calendar quarter after June 1, 2016 and shall continue until such event of default is cured or the DSCR is at least 1.20x for two consecutive calendar quarters. |
| (3) | If an acceptable blanket insurance policy is no longer in place, borrower is required to deposit 1/12 of the annual insurance premiums into the insurance reserve account. |
| (4) | On a monthly basis, the borrower is required to deposit the greater of 4.0% of prior month’s gross rents and any amount required under the management agreement or franchise agreement for FF&E work into a FF&E reserve account. |
| (5) | At closing the borrower deposited $1,865,910 into a PIP reserve account for planned improvements at the property that are expected to be completed by 2016. |
| (6) | At closing the borrower deposited $534,392 into a seasonality reserve, which will be replenished if drawn upon. However, in the case that the seasonality reserve is not drawn upon within the first three years of the lease term, and no trigger event is continuing (as described in the loan documents), the seasonality reserve funds will be released to the borrower. |
| TRANSACTION HIGHLIGHTS |
| § | Property. Embassy Suites Destin is a 155-room full service hotel located in Miramar Beach in Destin, Florida. The hotel has a franchise agreement Hilton Franchise Holding LLC, which expires on November 30, 2029. The hotel features 155 upscale, two-room suites, over 6,000 sq. ft. of meeting and banquet space, complimentary 24 hour business center, the Calypso Café Tropical Bar and Grill, complimentary breakfast and evening reception, an outdoor swimming pool, a fitness center and private beach access. Between 2013 and 2014, approximately $5.2 million was invested in the property on various capital upgrades to the guestrooms and amenity spaces as part of a multi-stage PIP. There is an additional approximately $1.9 million of the PIP renovations planned for 2015 and 2016. As of April 30, 2015 the property had an occupancy of 82.5%, ADR of $161.42 and RevPAR of $133.09. |
| § | Market. Miramar beach is home to numerous beach front hotels, motels and tourist oriented retail. The immediate area surrounding the property is dense with hospitality and tourist related developments and is bordered by residential neighborhoods to the east and beach resorts to the west. Leisure activities are the largest demand drivers for the hotel, though it does have substantial corporate and government demand as well, due to approximately 528,598 sq. ft. of nearby Class A and B office, industrial and flex space as well as the Eglin Complex, a nearby military complex consisting of three separate air fields. The Eglin Complex is home to the U.S. Army’s 7th Special Forces Group (Airborne) and a F-35 Joint Strike Fighter Integrated Joint training site. Compared to its competitive set, the Embassy Suites Destin has occupancy, ADR and RevPAR penetrations of 129.3%, 110.2% and 142.6%, respectively, as of February 2015. |
| § | Sponsorship. The sponsor of the borrower and the non-recourse carve-out guarantor is Allan V. Rose. Mr. Rose is the owner and CEO of AVR Realty, a privately held real estate development and management company. Mr. Rose founded AVR Realty over 45 years ago and has since built, acquired and developed more than 30 million square feet of commercial and residential space. AVR Realty’s portfolio currently includes office complexes, shopping centers, corporate and industrial parks, apartment complexes, residential communities and hotels. |
THE INFORMATION IN THIS STRUCTURAL AND COLLATERAL TERM SHEET IS NOT COMPLETE AND MAY BE AMENDED PRIOR TO THE TIME OF SALE. THIS TERM SHEET IS NOT AN OFFER TO SELL THESE SECURITIES AND IT IS NOT A SOLICITATION OF AN OFFER TO BUY THESE SECURITIES IN ANY JURISDICTION WHERE THE OFFER OR SALE IS NOT PERMITTED.
| 99 |
3020 South Powers Boulevard Colorado Springs, CO 80916 | Collateral Asset Summary – Loan No. 15 Canterbury MHC | Cut-off Date Balance: Cut-off Date LTV: U/W NCF DSCR: U/W NOI Debt Yield: | $22,500,000 74.1% 1.58x 9.1% |
| Mortgage Loan Information | |
| Loan Seller: | LCF |
| Loan Purpose: | Refinance |
| Sponsor: | Ross H. Partrich |
| Borrower: | Canterbury Park MHC, LLC |
| Original Balance: | $22,500,000 |
| Cut-off Date Balance: | $22,500,000 |
| % by Initial UPB: | 1.7% |
| Interest Rate: | 3.9160% |
| Payment Date: | 6th of each month |
| First Payment Date: | June 6, 2015 |
| Maturity Date: | May 6, 2025 |
| Amortization: | Interest only for first 60 months; 360 months thereafter |
Additional Debt(1): | Future Mezzanine Debt Permitted; Future Subordinate Loan Permitted |
| Call Protection: | L(25), D(91), O(4) |
| Lockbox / Cash Management: | Springing Soft / Springing |
| Reserves | ||
| Initial | Monthly | |
| Taxes: | $1,831 | $1,831 |
Insurance(2): | $0 | Springing |
Replacement(3): | $0 | $2,067 |
| Required Repairs: | $64,454 | NAP |
| Financial Information | |
| Cut-off Date Balance / Pad: | $45,363 |
| Balloon Balance / Pad: | $41,110 |
| Cut-off Date LTV: | 74.1% |
| Balloon LTV: | 67.2% |
Underwritten NOI DSCR(4): | 1.60x |
Underwritten NCF DSCR(4): | 1.58x |
| Underwritten NOI Debt Yield: | 9.1% |
| Underwritten NCF Debt Yield: | 9.0% |
| Property Information | |
| Single Asset / Portfolio: | Single Asset |
| Property Type: | Manufactured Housing Community |
| Collateral: | Fee Simple |
| Location: | Colorado Springs, CO |
| Year Built / Renovated: | 1985 / NAP |
| Total Pads: | 496 |
| Property Management: | Newbury Management Company |
| Underwritten NOI: | $2,040,256 |
| Underwritten NCF: | $2,015,456 |
| Appraised Value: | $30,360,000 |
| Appraisal Date: | April 2, 2015 |
| Historical NOI | |
| Most Recent NOI: | $1,928,665 (T-12 February 28, 2015) |
| 2014 NOI: | $1,889,784 (December 31, 2014) |
| 2013 NOI: | $1,853,016 (December 31, 2013) |
| 2012 NOI: | $1,738,154 (December 31, 2012) |
| Historical Occupancy | |
| Most Recent Occupancy: | 85.3% (February 28, 2015) |
| 2014 Occupancy: | 91.4% (December 31, 2014) |
| 2013 Occupancy: | 91.6% (December 31, 2013) |
| 2012 Occupancy: | 91.7% (December 31, 2012) |
| (1) | Future mezzanine debt is permitted subject to the satisfaction of various conditions, including, (i) a combined LTV of less than or equal to the lesser of (x) 75.0% and (y) the LTV at the origination date (as determined by the lender), and (ii) a combined DSCR greater than or equal to 1.40x. Future unsecured indebtedness up to $1,250,000 permitted in connection with constructing additional pads at the property, subject to standard conditions and requirement that the holder of the debt execute a subordination and standstill agreement. |
| (2) | If an acceptable blanket insurance policy is no longer in place, borrower shall deposit 1/12 of the annual insurance premiums into the insurance account. |
| (3) | Replacement reserve cap of $99,216. |
| (4) | Based on amortizing debt service payments. Based on the current interest only payments, the Underwritten NOI DSCR and Underwritten NCF DSCR are 2.28x and 2.26x, respectively. |
| TRANSACTION HIGHLIGHTS |
| § | Property Condition and Amenities. The Canterbury MHC Property is a manufactured housing community located in Colorado Springs, Colorado. The property is comprised of 496 single-wide and double-wide homesites. Property amenities include an outdoor swimming pool, clubhouse, basketball court, driveway parking, and RV and boat storage. |
| § | Sponsor. RHP Properties (“RHP”), of which Ross H. Partrich is the principal sponsor, owns and manages a total of 248 communities with over 58,600 housing units and sites spanning 23 states, with a combined value of approximately $2.66 billion. RHP’s portfolio is comprised of 246 manufactured home communities with over 57,800 home sites, and two apartment properties with over 800 units. RHP employs more than 900 professionals at their Farmington Hills, Michigan corporate headquarters, regional offices and on-site management properties across the country. RHP is the second largest private owner of manufactured home communities in the country. RHP also currently owns an approximately 700,000 sq. ft. of multi-tenant industrial properties in Florida. |
THE INFORMATION IN THIS STRUCTURAL AND COLLATERAL TERM SHEET IS NOT COMPLETE AND MAY BE AMENDED PRIOR TO THE TIME OF SALE. THIS TERM SHEET IS NOT AN OFFER TO SELL THESE SECURITIES AND IT IS NOT A SOLICITATION OF AN OFFER TO BUY THESE SECURITIES IN ANY JURISDICTION WHERE THE OFFER OR SALE IS NOT PERMITTED.
| 100 |
9500 Montgomery Boulevard Northeast Albuquerque, NM 87111 | Collateral Asset Summary – Loan No. 16 Sierra Vista Shopping Center | Cut-off Date Balance: Cut-off Date LTV: U/W NCF DSCR: U/W NOI Debt Yield: | $22,125,000 75.0% 1.31x 8.2% |
| Mortgage Loan Information | |
| Loan Seller: | CCRE |
| Loan Purpose: | Refinance |
| Sponsor: | Brian Shirken; Richard Margolis |
| Borrower: | CPP Sierra Vista LLC |
| Original Balance: | $22,125,000 |
| Cut-off Date Balance: | $22,125,000 |
| % by Initial UPB: | 1.7% |
| Interest Rate: | 4.1665% |
| Payment Date: | 6th of each month |
| First Payment Date: | July 6, 2015 |
| Maturity Date: | June 6, 2025 |
| Amortization: | 360 months |
| Additional Debt: | None |
Call Protection(1): | L(24), D(92), O(4) |
Lockbox / Cash Management(2): | Springing Hard / Springing |
| Reserves | ||
| Initial | Monthly | |
Taxes(3): | $30,833 | $15,417 |
| Insurance: | $14,342 | $2,049 |
| Replacement: | $323,180 | $2,284 |
TI/LC(4): | $116,306 | $8,373 |
| Required Repairs: | $203,275 | NAP |
Earn Out(5): | $525,000 | $0 |
| Financial Information | ||
| Cut-off Date Balance / Sq. Ft.: | $121 | |
| Balloon Balance / Sq. Ft.: | $97 | |
| Cut-off Date LTV: | 75.0% | |
| Balloon LTV: | 59.9% | |
| Underwritten NOI DSCR: | 1.41x | |
| Underwritten NCF DSCR: | 1.31x | |
| Underwritten NOI Debt Yield: | 8.2% | |
| Underwritten NCF Debt Yield: | 7.7% | |
| Property Information | |
| Single Asset / Portfolio: | Single Asset |
| Property Type: | Anchored Retail |
| Collateral: | Fee Simple |
| Location: | Albuquerque, NM |
| Year Built / Renovated: | 1979 / 2014 |
| Total Sq. Ft.: | 182,694 |
| Property Management: | Columbus Pacific Properties, Inc. |
| Underwritten NOI: | $1,820,643 |
| Underwritten NCF: | $1,692,757 |
| Appraised Value: | $29,500,000 |
| Appraisal Date: | March 19, 2015 |
| Historical NOI | |
| Most Recent NOI: | $876,225 (December 31, 2014) |
| Historical Occupancy | |
| Most Recent Occupancy: | 98.0% (May 6, 2015) |
| (1) | Borrower may request the release of a non-income producing, vacant parcel subject to, among other things, (i) no event of default or cash management period having occurred and continuing and (ii) after giving effect to the release, (a) the LTV is less than 125% and the NOI DSCR is equal to or greater than 1.25x. |
| (2) | A hard lockbox and in place cash management will be triggered upon (i) an event of default, (ii) the bankruptcy of any borrower, principal, guarantor or property manager, or (iii) the failure by the borrower to maintain a NOI DSCR of at least 1.15x for two consecutive calendar quarters, until the NOI DSCR is at least 1.20x for two consecutive calendar quarters. Additionally, an excess cash flow sweep will commence upon the failure by the borrower to maintain a NOI DSCR of at least 1.10x for two consecutive calendar quarters, until the NOI DSCR is at least 1.15x for two consecutive calendar quarters. With respect to Hobby Lobby Stores, Inc., Stein Mart Inc, and Marshalls of MA, all excess cash flow will be deposited into an Occupancy reserve account upon (i) the earlier of (a) six prior months prior to each expiration date under the lease, unless an acceptable lease extension has been entered into prior to each such date, (b) the earliest date set forth in such lease on or before such tenant is required to notify the landlord of its intent to either renew or terminate its lease, unless an acceptable lease extension has been entered into prior to each such date, and/or (ii) such tenant (a) fails to continuously operate, (b) or the guarantor of such tenant’s obligations, under its lease, is the subject of a bankruptcy action, (c) gives notice of its intent to terminate its lease or to vacate or surrender its premises or otherwise vacates or surrenders its premises, (d) sublets all or a portion of its premises, unless such sublease was pre-approved by lender or (e) lease terminates or expires. |
| (3) | Borrower will not be required to make monthly tax reserve deposits on certain parcels that are paid directly by a tenant pursuant to the terms of its lease provided, among other things, (i) the applicable lease remains in full force and effect and the applicable tenant is not in the final year of its lease term, (ii) the applicable lease has not been amended or modified without lender’s prior written consent, (iii) there is no event of default by the borrower or applicable tenant under the applicable tenant’s lease, (iv) no default beyond any applicable notice and grace period exists under the applicable tenant’s lease, (v) the applicable tenant’s lease obligates such tenant to pay taxes directly to the taxing authority, (vi)) the applicable tenant maintains a rating of not less than BBB- by S&P (or if the tenant is not an investment grade tenant, a deposit equal to payment of taxes next due for the applicable tax parcel), and (viii) the applicable premises constitutes a separate tax parcel. |
| (4) | Borrower reserved $100,000 at closing for general tenant rollover and $16,306 for outstanding owed tenant improvements. Ongoing TI/LC collections will be capped at $500,000, including the initial deposit (but excluding the outstanding tenant improvements), provided (i) no event of default is continuing, (ii) the NOI DSCR (as defined in the loan agreement) is greater than or equal to 1.25x, (iii) at least 85.0% of property is occupied by tenants that are open for business, paying full contractual rent, not the subject of any bankruptcy action and not in default and (iv) the NOI debt yield is greater than or equal to 7.75%. |
| (5) | The Earn Out funds will be released to the borrower provided (i) no event of default is continuing and (ii) the borrower achieves a NCF debt yield of equal to or greater than 7.75%. |
| TRANSACTION HIGHLIGHTS |
| § | Property. Sierra Vista Shopping Center is a 182,694 sq. ft., multi-tenant, retail center that is 98.0% occupied by 24 tenants, including major tenants Hobby Lobby Stores, Inc., Stein Mart Inc. and Marshalls of MA. Hobby Lobby Stores, Inc., Stein Mart Inc. and Marshalls of MA all recently executed long term leases through 2024 and 2025 and in aggregate account for 67.9% of the total net rentable area. |
| § | Recent Renovation. The property was acquired by the sponsor in 2013 when it was approximately 50.0% occupied as a result of K-Mart vacating its space in September 2013. Since acquisition, the sponsor has invested approximately $10.0 million of capital improvements into the property, including façade and signage improvements, shell space renovations and existing space expansions, and increased occupancy to 98.0%. |
| § | Location. The property is situated in a dense infill area of Northeast Albuquerque on the signalized intersection of Montgomery Boulevard (32,600 ADT) and Eubank Boulevard (23,800 ADT). As of year-end 2014, the population and average household income within a five-mile radius was 284,355 and $70,350, respectively. |
| § | Sponsorship. The sponsors and carve-out guarantors of the Sierra Vista Shopping Center are Brian Shirken and Richard Margolis, co-founders of Columbus Pacific Properties, Inc. Founded in 1995, Columbus Pacific Properties has purchased and redeveloped over 5.0 million sq. ft. of retail properties and 3,100 multifamily units as well as provided over $200.0 million in mezzanine and equity capital, funding projects with an underlying value in excess of $1.4 billion. |
THE INFORMATION IN THIS STRUCTURAL AND COLLATERAL TERM SHEET IS NOT COMPLETE AND MAY BE AMENDED PRIOR TO THE TIME OF SALE. THIS TERM SHEET IS NOT AN OFFER TO SELL THESE SECURITIES AND IT IS NOT A SOLICITATION OF AN OFFER TO BUY THESE SECURITIES IN ANY JURISDICTION WHERE THE OFFER OR SALE IS NOT PERMITTED.
| 101 |
944 East Slauson Avenue & 5837, 5857 and 5867 South Central Avenue Los Angeles, CA 90011 | Collateral Asset Summary – Loan No. 17 Northgate Slauson Marketplace | Cut-off Date Balance: Cut-off Date LTV: U/W NCF DSCR: U/W NOI Debt Yield: | $22,000,000 74.3% 1.25x 7.6% |
| Mortgage Loan Information | |
| Loan Seller: | CCRE |
| Loan Purpose: | Acquisition |
| Sponsor: | K. Joseph Shabani; Kamyar D. Shabani |
| Borrower: | Slauson Avenue Properties, LP; Slauson Avenue Properties II, LP |
| Original Balance: | $22,000,000 |
| Cut-off Date Balance: | $22,000,000 |
| % by Initial UPB: | 1.7% |
| Interest Rate: | 4.1870% |
| Payment Date: | 6th of each month |
| First Payment Date: | June 6, 2015 |
| Maturity Date: | May 6, 2025 |
| Amortization: | Interest only for the first 24 months; 360 months thereafter |
Additional Debt(1)(2): | None |
| Call Protection: | L(25), D(90), O(5) |
Lockbox / Cash Management(3): | Springing Soft / Springing |
| Reserves | ||
| Initial | Monthly | |
| Taxes: | $110,000 | $27,500 |
| Insurance: | $3,315 | $1,540 |
Replacement(4): | $0 | $964 |
TI/LC(5): | $0 | $1,285 |
Subordinate Loan(2): | $1,662,500 | $0 |
| Financial Information | ||
| Cut-off Date Balance / Sq. Ft.: | $285 | |
| Balloon Balance / Sq. Ft.: | $242 | |
| Cut-off Date LTV: | 74.3% | |
| Balloon LTV: | 62.9% | |
Underwritten NOI DSCR(6): | 1.29x | |
Underwritten NCF DSCR(6): | 1.25x | |
| Underwritten NOI Debt Yield: | 7.6% | |
| Underwritten NCF Debt Yield: | 7.3% | |
| Property Information | |
| Single Asset / Portfolio: | Single Asset |
| Property Type: | Anchored Retail |
| Collateral: | Fee Simple |
| Location: | Los Angeles, CA |
| Year Built / Renovated: | 2014 / NAP |
| Total Sq. Ft.: | 77,096 |
| Property Management: | Optimus Property Management, LLC |
| Underwritten NOI: | $1,662,886 |
| Underwritten NCF: | $1,612,774 |
| Appraised Value: | $29,600,000 |
| Appraisal Date: | March 13, 2015 |
| Historical NOI | |
| Most Recent NOI: | $1,442,456 (T-12 February 28, 2015) |
| Historical Occupancy | |
| Most Recent Occupancy: | 100.0% (March 19, 2015) |
| (1) | As of the origination date of the Northgate Slauson Marketplace loan, there was an outstanding Housing and Urban Development loan (the “HUD Loan”) between the City of Los Angeles and the borrower, in the amount of $1,472,000. The HUD loan is self-amortizing and matures on August 1, 2023. The HUD loan is self-amortizing through tax payments and matures on August 1, 2023. The HUD loan was obtained in connection with the redevelopment of the property and a related agreement with the agency includes certain restrictions on the borrower’s operations at the property. See “Risk Factors—Risks Related to the Mortgage Loans—Some Mortgaged Properties May Note Be Readily Convertible to Alternative Uses” and “Description of the Mortgage Pool—Certain Terms and Conditions of the Mortgage Loans—Other Financing” in the Free Writing Prospectus. |
| (2) | The borrower posted with lender a letter of credit in an amount equal to the outstanding principal balance of the HUD Loan plus the amount estimated to be necessary to pay the prepayment fee, an installment of interest on the HUD Loan and the default interest and late fees that would apply in connection with a prepayment of the HUD Loan promptly following a payment default under the HUD Loan. The letter of credit may be drawn down by lender upon (i) an event of default, (ii) an event of default under the HUD Loan agreement, (iii) the HUD Loan lender’s sale, assignment, participation pledge or other transfer or encumbrance of the HUD Loan, (iv) a determination by HUD that the job creation commitment (as defined in the HUD Loan agreement) has not been satisfied, (v) a determination by the HUD Loan lender that there has been a prohibited change in use of the property, or (vi) the failure of the HUD Loan liens to be reconveyed within 45 days after repayment of all principal, interest and, if applicable, prepayment fees payable under the HUD Loan documents, in order to (a) cure any defaults under the HUD Loan or (b) reduce the outstanding principal balance of the Northgate Slauson Marketplace loan. In connection with each debt service payment under the HUD Loan that reduces the outstanding principal balance of the HUD Loan, among other things required by the HUD Loan documents, the loan documents provide that lender will not object (or, if the letter of credit deposited at closing is replaced or modified to eliminate automatic reductions, will consent) to the reduction of the letter of credit amount by the amount by which such payment amount has reduced the principal balance of the HUD Loan. |
| (3) | A soft lockbox and in-place cash management will be triggered upon (i) an event of default, (ii) any borrower, principal, guarantor or property manager bankruptcy action, or (iii) the failure by the borrowers to maintain a debt service coverage ratio of at least 1.15x for two consecutive calendar quarters, until the debt service coverage ratio is at least 1.25x for four consecutive calendar quarters. Additionally, an excess cash flow sweep will commence upon the failure by the borrowers to maintain a debt service coverage ratio of at least 1.10x for two consecutive calendar quarters, until the debt service coverage ratio is at least 1.15x for four consecutive calendar quarters. |
| (4) | Beginning May 6, 2017, the borrowers will be required to deposit $964 monthly into the replacement reserve account. |
| (5) | Beginning May 6, 2017, the monthly TI/LC deposit will increase to $5,140. Notwithstanding the foregoing, the increased monthly TI/LC deposit amount beginning May 6, 2017 will not be required to be deposited so long as (i) the TI/LC reserve balance equals or exceeds $154,193 and (ii) the property is at least 85.0% occupied by tenants who are in occupancy, open for business and paying full contractual rent without right of offset or credit. |
| (6) | Based on amortizing debt service payments. Based on the current interest only payments, the Underwritten NOI DSCR and Underwritten NCF DSCR are 1.78x and 1.73x, respectively. |
| TRANSACTION HIGHLIGHTS |
■ | Property. Northgate Slauson Marketplace is a 77,096 sq. ft. grocery-anchored retail center that was constructed in 2014 and is situated on a 5.959-acre site. The property is comprised of two multi-tenant retail buildings and two single-tenant buildings, which are occupied by Northgate Gonzalez Market and CVS. |
■ | Location. The property is located at a highly-trafficked intersection on the corner of East Slauson Avenue and South Central Avenue, which had traffic counts of 31,013 and 21,977 cars per day, respectively. The local area is dominated primarily by industrial and retail properties along arterial streets and highly dense residential uses along secondary streets. As of 2014, the population and average household income within a five-mile radius of the property are 1,229,853 and $42,790, respectively. |
■ | Sponsorship. The sponsors and carve-out guarantors are K. Joseph Shabani and Kamyar D. Shabani, co-founders of Optimus Properties, LLC. Optimus Properties, LLC is a privately held real estate investment company engaged in the acquisition, development, leasing and management of multifamily, retail and commercial real estate. |
THE INFORMATION IN THIS STRUCTURAL AND COLLATERAL TERM SHEET IS NOT COMPLETE AND MAY BE AMENDED PRIOR TO THE TIME OF SALE. THIS TERM SHEET IS NOT AN OFFER TO SELL THESE SECURITIES AND IT IS NOT A SOLICITATION OF AN OFFER TO BUY THESE SECURITIES IN ANY JURISDICTION WHERE THE OFFER OR SALE IS NOT PERMITTED.
| 102 |
2250 Roswell Drive Pittsburgh, PA 15205 | Collateral Asset Summary – Loan No. 18 2250 Roswell Drive | Cut-off Date Balance: Cut-off Date LTV: U/W NCF DSCR: U/W NOI Debt Yield: | $21,750,000 75.0% 1.81x 11.7% |
| Mortgage Loan Information | |
| Loan Seller: | GACC |
| Loan Purpose: | Acquisition |
| Sponsor: | Hayden Maguire Real Estate Fund I, L.P. |
| Borrower: | HM 2250 Roswell, L.P. |
| Original Balance: | $21,750,000 |
| Cut-off Date Balance: | $21,750,000 |
| % by Initial UPB: | 1.6% |
| Interest Rate: | 4.3000% |
| Payment Date: | 6th of each month |
| First Payment Date: | July 6, 2015 |
| Maturity Date: | June 6, 2025 |
| Amortization: | 360 months |
| Additional Debt: | None |
| Call Protection: | L(24), D(92), O(4) |
Lockbox / Cash Management(1): | Hard / Springing |
| Reserves | ||
| Initial | Monthly | |
| Taxes: | $8,710 | $14,272 |
Insurance(2): | $0 | Springing |
| Replacement: | $0 | $4,254 |
TI/LC(3): | $0 | $8,509 |
| Required Repairs: | $132,165 | NAP |
Lease Sweep(4): | $0 | Springing |
| Financial Information | ||
| Cut-off Date Balance / Sq. Ft.: | $43 | |
| Balloon Balance / Sq. Ft.: | $34 | |
| Cut-off Date LTV: | 75.0% | |
| Balloon LTV: | 60.2% | |
| Underwritten NOI DSCR: | 1.98x | |
| Underwritten NCF DSCR: | 1.81x | |
| Underwritten NOI Debt Yield: | 11.7% | |
| Underwritten NCF Debt Yield: | 10.7% | |
| Property Information | |
| Single Asset / Portfolio: | Single Asset |
| Property Type: | Warehouse Industrial |
| Collateral: | Fee Simple |
| Location: | Pittsburgh, PA |
| Year Built / Renovated: | 1967 / 2011-2015 |
| Total Sq. Ft.: | 510,531 |
| Property Management: | Hayden Management Company, LLC |
| Underwritten NOI: | $2,551,357 |
| Underwritten NCF: | $2,334,126 |
| Appraised Value: | $29,000,000 |
| Appraisal Date: | March 16, 2015 |
| Historical NOI | |
| 2014 NOI: | $1,571,794 (December 31, 2014) |
| 2013 NOI: | $1,099,704 (December 31, 2013) |
| 2012 NOI: | $720,690 (December 31, 2012) |
| Historical Occupancy | |
| Most Recent Occupancy: | 100.0% (March 31, 2015) |
2014 Occupancy(5): | 100.0% (December 31, 2014) |
2013 Occupancy(5): | 50.5% (December 31, 2013) |
| (1) | Cash management will be triggered (i) upon an event of default or (ii) if the DSCR falls below 1.20x, as of the last day of any calendar quarter, and shall continue until such time that the DSCR is at least 1.25x for two consecutive calendar quarters. |
| (2) | If an acceptable blanket insurance policy is no longer in place, the borrower is required to deposit 1/12 of the annual insurance premiums into the insurance reserve account. |
| (3) | Ongoing TI/LC reserves shall be capped at $510,531. |
| (4) | A “Lease Sweep Period” will commence upon (i) (a) the date by which a lease sweep lease, in this case either the Amazon lease or the Modcloth, Inc. lease is required to give notice of its exercise of a renewal option or (b) 12 months prior to the expiration of the Amazon lease or the Modcloth, Inc. lease, (ii) the receipt by borrower or manager of Amazon or Modcloth, Inc. exercising their right to terminate their lease, (iii) the date the Amazon or Modcloth, Inc. leases are surrendered, cancelled, or terminated prior to their then current expiration dates, (iv) the date that Amazon or Modcloth, Inc. discontinues their business at the property or give notice to discontinue their business at the property, (v) upon a default of the Amazon or Modcloth, Inc. leases by Amazon or Modcloth, Inc., respectively or (vi) the occurrence of insolvency proceeding. |
| (5) | The increase in occupancy from 2013 to 2014 is due to Amazon taking occupancy of their space in May of 2014. |
| TRANSACTION HIGHLIGHTS |
■ | Property/Tenancy. The 2250 Roswell Drive property is a 510,531 sq. ft. industrial warehouse building that is 100% occupied by two tenants, Amazon.com.dedc, LLC (“Amazon”), a subsidiary of Amazon (Baa1/AA-/NR by Moody’s/S&P/Fitch) which partially guarantees the lease and Modcloth, Inc., an online retailer of clothing, accessories and decor. The property was previously 100% owner occupied by Roomful Express Furniture, which went bankrupt in 2011, and was purchased vacant by the current seller in 2011. The seller invested approximately $6.5 million to re-tenant the space to Modcloth, Inc. and Amazon. Modcloth, Inc. signed a NNN eleven year lease in October 2011, with 3% annual increases throughout the term. Modcloth, Inc. has one five-year extension option and conditioned on-going termination options after October 2016 upon 270 days notice. Amazon signed a NNN five-year lease at the property in May 2014, with 3% annual increases throughout the term. Amazon has three, five-year extension options and no termination options. |
■ | Market. The property is located in the West Pittsburgh submarket which as of year-end 2014 contained 13.83 million sq. ft. and 12.74 million sq. ft. of industrial and warehouse space with vacancy rates of 4.2% and 4.1%, respectively. |
■ | Sponsors. The sponsor and the nonrecourse carve-out guarantor is Hayden Maguire Real Estate Fund I, L.P (the “Fund”). The Fund is a privately held investment firm focused on acquiring office, industrial and flex properties in the Mid-Atlantic region. The chairman and CEO of the Fund’s general partner, Hayden Capital II, L.P. is J. Anthony Hayden, who has been engaged in the commercial real estate acquisition, development, leasing and brokerage business for more than 40 years. |
THE INFORMATION IN THIS STRUCTURAL AND COLLATERAL TERM SHEET IS NOT COMPLETE AND MAY BE AMENDED PRIOR TO THE TIME OF SALE. THIS TERM SHEET IS NOT AN OFFER TO SELL THESE SECURITIES AND IT IS NOT A SOLICITATION OF AN OFFER TO BUY THESE SECURITIES IN ANY JURISDICTION WHERE THE OFFER OR SALE IS NOT PERMITTED.
| 103 |
315 York Road Willow Grove, PA 19090 | Collateral Asset Summary – Loan No. 19 Giant Foods | Cut-off Date Balance: Cut-off Date LTV: U/W NCF DSCR: U/W NOI Debt Yield: | $21,500,000 72.6% 1.38x 7.7% |
| Mortgage Loan Information | |
| Loan Seller: | GACC |
| Loan Purpose: | Refinance |
| Sponsor: | Robert J. Ambrosi; Marc A. Perel; The 1998 Gina Mandelbaum Grantor Trust (GST) dated May 1, 1998; The 1998 Jeanne Jemal Grantor Trust (GST) dated May 1, 1998 |
Borrower(1): | Westway at Willow Grove LP; Delran-ARC Central, LLC |
| Original Balance: | $21,500,000 |
| Cut-off Date Balance: | $21,500,000 |
| % by Initial UPB: | 1.6% |
| Interest Rate: | 3.8100% |
| Payment Date: | 6th of each month |
| First Payment Date: | June 6, 2015 |
Anticipated Repayment Date(2): | May 6, 2025 |
| Maturity Date: | May 6, 2032 |
| Amortization: | Interest only for first 24 months, 360 months thereafter, ARD |
| Additional Debt: | None |
| Call Protection: | L(25), D(91), O(4) |
Lockbox / Cash Management(3): | Springing Hard / Springing |
| Reserves | ||
| Initial | Monthly | |
Taxes(4): | $0 | Springing |
Insurance(4): | $0 | Springing |
Replacement(5): | $0 | Springing�� |
TI/LC(5): | $0 | Springing |
Lease Sweep(6): | $0 | Springing |
| Financial Information | ||
| Cut-off Date Balance / Sq. Ft.: | NAP | |
| Balloon Balance / Sq. Ft.: | NAP | |
| Cut-off Date LTV: | 72.6% | |
| Balloon LTV: | 60.9% | |
Underwritten NOI DSCR(7): | 1.38x | |
Underwritten NCF DSCR(7): | 1.38x | |
| Underwritten NOI Debt Yield: | 7.7% | |
| Underwritten NCF Debt Yield: | 7.7% | |
| Property Information | |
| Single Asset / Portfolio: | Single Asset |
| Property Type: | Leased Fee |
| Collateral: | Fee Simple |
| Location: | Willow Grove, PA |
| Year Built / Renovated: | NAP / NAP |
| Total Sq. Ft.: | 131,157 |
| Property Management: | ARC Management Services, Inc. |
| Underwritten NOI: | $1,663,761 |
| Underwritten NCF: | $1,663,761 |
| Appraised Value: | $29,600,000 |
| Appraisal Date: | March 15, 2015 |
| Historical NOI | |
| 2014 NOI: | $1,550,000 (December 31, 2014) |
| 2013 NOI: | $1,550,000 (December 31, 2013) |
| 2012 NOI: | NAV |
| Historical Occupancy | |
| Most Recent Occupancy: | NAP |
| 2014 Occupancy: | NAP |
| 2013 Occupancy: | NAP |
| (1) | The borrowers are Westway at Willow Grove LP and Delran-ARC Central, LLC as tenants-in-common, on a joint and several basis. |
| (2) | Prior to the Anticipated Repayment Date, the Giant Foods loan accrues interest at a fixed rate of 3.8100%. From and after the Anticipated Repayment, the Giant Foods loan accrues interest at a fixed rate equal the sum of 350 basis points plus the greater of (i) the initial interest rate and (ii) the then 10-year swap yield on the Anticipated Repayment Date plus 168 basis points. |
| (3) | Cash management will be triggered upon the occurrence of (i) the Anticipated Repayment Date, (ii) the commencement of an event of default, (iii) the commencement of a Lease Sweep Period or (iv) the DSCR falls below 1.25x until such time that the DSCR is at least 1.30x for two consecutive calendar quarters. |
| (4) | The borrower will be required to deposit 1/12 of the annual taxes and insurance premiums due if (i) a major tenant no longer pays taxes or insurance premiums directly with respect to such individual property or (ii) a major tenant lease is no longer in full force and effect and (iii) with respect to insurance premiums, a blanket insurance policy is no longer in place. |
| (5) | The borrower will be required to deposit an amount determined by the lender into the replacement reserve and TI/LC reserve upon (i) a major tenant no longer pays capital expenditures or TI/LCs directly with respect to such individual property or (ii) a major tenant lease is no longer in full force and effect. |
| (6) | A “Lease Sweep Period” will commence upon (i) twelve months prior to the expiration of the Giant Food Stores Lease (“Giant Foods”), (ii) the receipt by borrower or manager of Giant Foods exercising their right to terminate their lease, (iii) the date Giant Foods leases are surrendered, cancelled, or terminated prior to their then current expiration dates, (iv) the date that Giant Foods discontinues their business at the property or give notice to discontinue their business at the property, (v) upon a default of the Giant Foods leases by Giant Foods, respectively or (vi) the occurrence of insolvency proceeding or (vii) upon a decline in the credit rating of lease guarantor below “BB” or the equivalent by two out of three of S&P, Fitch and Moody’s. |
| (7) | Based on amortizing payments. Based on the current interest only debt service payments, the Underwritten NOI DSCR and Underwritten NCF DSCR are 2.00x and 2.00x, respectively. |
| TRANSACTION HIGHLIGHTS |
■ | Improvements. The improvements constructed on the subject property, which are owned by the ground tenant and are not collateral for the Giant Foods loan, consist of a 131,157 sq. ft. Class A retail building owned by Giant Foods, a supermarket chain with locations in Pennsylvania, Maryland, Virginia and West Virginia. The Giant Foods improvement was built in 2007 and is a regional flagship grocery retail location for Giant Foods and also serves as a test location for new products and marketing strategies. Giant Foods has a lease expiration date of August 13, 2032 without any termination or contraction options. The lease is structured with six, five year renewal options and is guaranteed by their parent company Koninklijke Ahold N.V which is rated Baa3/BBB/BBB by Moody’s/Fitch/S&P, respectively. |
■ | Sponsors. The sponsors Robert J. Ambrosi and Marc A. Perel are each co-founders and executives of ARC Properties, Inc. (“ARC”). ARC Properties, Inc. acquires, develops, and manages real estate throughout the United States, with a concentration of properties in the New York, Philadelphia and Washington DC metropolitan areas. Over the past 25 years, ARC Properties, Inc. and its affiliates have been responsible for the acquisition and development of more than 300 properties with an aggregate value in excess of $3.0 billion dollars. |
THE INFORMATION IN THIS STRUCTURAL AND COLLATERAL TERM SHEET IS NOT COMPLETE AND MAY BE AMENDED PRIOR TO THE TIME OF SALE. THIS TERM SHEET IS NOT AN OFFER TO SELL THESE SECURITIES AND IT IS NOT A SOLICITATION OF AN OFFER TO BUY THESE SECURITIES IN ANY JURISDICTION WHERE THE OFFER OR SALE IS NOT PERMITTED.
| 104 |
Various, Wisconsin | Collateral Asset Summary – Loan Nos. 20-22 Wisconsin Retail Crossed Loans | Cut-off Date Balance: Cut-off Date LTV: U/W NCF DSCR: U/W NOI Debt Yield: | $19,650,000 75.1% 1.44x 10.0% |
| Mortgage Loan Information | |
| Loan Seller: | CCRE |
| Loan Purpose: | Refinance |
Sponsor(1): | J. Peter Jungbacker; GLC Credit Opportunity Fund I, LLC |
| Borrower: | GLC 15740 W. Capitol Drive, LLC; GLC 3169 Van Roy, LLC; GCL 2901 South Chicago, LLC |
Original Balance(2): | $19,650,000 |
Cut-off Date Balance(2): | $19,650,000 |
| % by Initial UPB: | 1.5% |
| Interest Rate: | 4.8885% |
| Payment Date: | 6th of each month |
| First Payment Date: | July 6, 2015 |
| Maturity Date: | June 6, 2025 |
| Amortization: | 360 months |
Additional Debt(3)(4): | Future Mezzanine Debt Permitted |
| Call Protection: | L(24), YM1(91), O(5) |
Lockbox / Cash Management(5): | Hard / Springing |
| Reserves | ||
| Initial | Monthly | |
| Taxes: | $35,333 | $32,750 |
| Insurance: | $15,971 | $3,993 |
| Replacement: | $0 | $3,804 |
TI/LC(6): | $573,330 | $9,510 |
| Immediate Repairs: | $176,508 | NAP |
Recent Leasing(7): | $1,924,532 | Springing |
| Financial Information | ||
| Cut-off Date Balance / Sq. Ft.: | $86 | |
| Balloon Balance / Sq. Ft.: | $71 | |
| Cut-off Date LTV: | 75.1% | |
| Balloon LTV: | 61.6% | |
| Underwritten NOI DSCR: | 1.57x | |
| Underwritten NCF DSCR: | 1.44x | |
| Underwritten NOI Debt Yield: | 10.0% | |
| Underwritten NCF Debt Yield: | 9.2% | |
| Property Information | |
Single Asset / Portfolio(8): | Three crossed loans |
| Property Type: | Anchored Retail |
| Collateral: | Fee Simple |
| Location: | Various, WI |
| Year Built / Renovated: | 1966, 1967, 1998, 2003 / 2003, 2005 |
| Total Sq. Ft.: | 228,219 |
| Property Management: | Olympic Realty Corp., Inc. |
| Underwritten NOI: | $1,963,351 |
| Underwritten NCF: | $1,803,577 |
| Appraised Value: | $26,150,000 |
| Appraisal Date: | January 2015 |
| Historical NOI | |
| 2014 NOI: | $1,271,201 (December 31, 2014) |
| 2013 NOI: | $1,352,978 (December 31, 2013) |
| 2012 NOI: | $1,478,288 (December 31, 2012) |
| Historical Occupancy | |
| Most Recent Occupancy: | 83.3% (April 30, 2015) |
| 2014 Occupancy: | 65.8% (December 31, 2014) |
| 2013 Occupancy: | 61.2% (December 31, 2013) |
| (1) | With respect to GLC Credit Opportunity Fund I, LLC, recourse is capped at $3,000,000. |
| (2) | The Wisconsin Retail Crossed Loans are comprised of the Capitol Plaza loan, the College Park Plaza loan and the Grant Park Plaza loan, which are cross-collateralized and cross-defaulted with Original Balances and Cut-off Date Balances of $7,300,000, $6,475,000 and $5,875,000, respectively. |
| (3) | Future mezzanine debt is permitted subject to, among other things, (i) a maximum combined LTV of 75.0%, (ii) a minimum combined DSCR of 1.40x, (iii) a minimum combined debt yield of 9.0% and (iv) occupancy is at least 85.0% (in each case based on both the applicable loan and on all of the loans that are subject to the crossing arrangement in the aggregate). |
| (4) | At origination of the Wisconsin Retail Crossed Loans, an affiliate of Great Lakes Capitol Management, LLC obtained a $4,750,000 preferred equity investment in the ownership of the properties that secure the Wisconsin Retail Crossed Loans. See “Description of the Mortgage Pool—Certain Terms and Conditions of the Mortgage Loans—Other Financing” in the Free Writing Prospectus. |
| (5) | In-place cash management and an excess cash flow sweep will be triggered upon (i) an event of default, (ii) the bankruptcy of any borrower, principal, guarantor or property manager, (iii) the occurrence of a change of control event related in connection to the preferred equity interest not being redeemed on or before May 19, 2020 or (iv) the failure by the borrower to maintain a DSCR of at least 1.15x for two consecutive calendar quarters, until the DSCR is at least 1.20x for two consecutive calendar quarters. |
| (6) | The TI/LC reserve is capped at $201,540 (Grant Park Plaza), $161,195 (Capitol Plaza) and $207,883 (College Park Plaza), respectively, so long as occupancy is at least 80% and the debt yield is at least 7.5% for the applicable loan. |
| (7) | At loan closing, the borrowers deposited $1,924,532 into outstanding tenant improvement and rent abatement reserves for recent leasing. Additionally, the borrower will be required to deposit $3.0 million or a letter of credit in such amount into a litigation reserve if J. Peter Jungbacker has failed to settle and pay all amounts owed in connection with a litigation matter prior to October 19, 2015. See “Risk Factors—Risks Related to the Mortgage Loans--Risks Related to Litigation and Condemnation” in the Free Writing Prospectus. |
| (8) | The borrower may obtain the release of an individual loan from the cross collateralization agreement at any time commencing after the lockout period, provided that, among other things, (i) no event of default has occurred or is continuing, (ii) the related borrower has paid a release amount equal to, in connection with (a) prepayment and release of the related mortgage loan from the trust, 135% of the original principal balance of such loan and (b) an assumption of such loan by another borrower, 35% of the then-outstanding principal balance of such loan and (iii) after giving effect to such release, (a) no cash management period would exist under the remaining loan(s) and (b) the debt yield of the then-remaining properties is greater than or equal to 9.5%. |
| TRANSACTION HIGHLIGHTS |
■ | Property. The Wisconsin Retail Crossed Loans are collateralized by three anchored retail properties. Capitol Plaza is a 64,478 sq. ft. property located in Brookfield, Wisconsin. College Park Plaza is an 83,144 sq. ft. property located in Appleton, Wisconsin. Grant Park Plaza is an 80,597 sq. ft. property located in South Milwaukee, Wisconsin. The three loans are cross-collateralized and cross-defaulted. |
■ | Recent Leasing. The College Park Plaza property has two new executed leases for approximately 43.8% of the NRA that begin in July of 2015. The Grant Park Plaza property has two new leases executed since December 2014 that account for approximately 36.7% of the NRA at the property. Recent leasing momentum includes recently executed leases with Planet Fitness at each property. |
■ | Sponsorship. J. Peter Jungbacker is the managing member of Alexander & Bishop Real Estate Capital Markets, LLC, which has developed over 3.0 million sq. ft. of shopping centers, office buildings and multi-family apartment communities. |
■ | Cash Equity. The sponsors are investing approximately $4.8 million of fresh cash equity over the three properties. |
THE INFORMATION IN THIS STRUCTURAL AND COLLATERAL TERM SHEET IS NOT COMPLETE AND MAY BE AMENDED PRIOR TO THE TIME OF SALE. THIS TERM SHEET IS NOT AN OFFER TO SELL THESE SECURITIES AND IT IS NOT A SOLICITATION OF AN OFFER TO BUY THESE SECURITIES IN ANY JURISDICTION WHERE THE OFFER OR SALE IS NOT PERMITTED.
| 105 |
STATEMENT REGARDING ASSUMPTIONS AS TO
SECURITIES, PRICING ESTIMATES AND OTHER INFORMATION
This material is for your information, and none of Deutsche Bank Securities Inc., Cantor Fitzgerald & Co., KeyBanc Capital Markets Inc. and Goldman, Sachs & Co. (the “Underwriters”) are soliciting any action based upon it. This material is not to be construed as an offer to sell or the solicitation of any offer to buy any security in any jurisdiction where such an offer or solicitation would be illegal.
Neither this document nor anything contained herein shall form the basis for any contract or commitment whatsoever. The information contained herein is preliminary as of the date hereof. These materials are subject to change, completion or amendment from time to time. The information contained herein will be superseded by similar information delivered to you as part of the offering document relating to the COMM 2015-LC21 Mortgage Trust Commercial Mortgage Pass-Through Certificates (the “Offering Document”). The information supersedes any such information previously delivered. The information should be reviewed only in conjunction with the entire Offering Document. All of the information contained herein is subject to the same limitations and qualifications contained in the Offering Document. The information contained herein does not contain all relevant information relating to the underlying mortgage loans or mortgaged properties. Such information is described elsewhere in the Offering Document. The information contained herein will be more fully described elsewhere in the Offering Document. The information contained herein should not be viewed as projections, forecasts, predictions or opinions with respect to value. Prior to making any investment decision, prospective investors are strongly urged to read the Offering Document its entirety. Neither the Securities and Exchange Commission nor any state securities commission has approved or disapproved of these securities or determined if this free writing prospectus is truthful or complete. Any representation to the contrary is a criminal offense.
The attached information contains certain tables and other statistical analyses (the “Computational Materials”) which have been prepared in reliance upon information furnished by the Mortgage Loan Sellers. Numerous assumptions were used in preparing the Computational Materials, which may or may not be reflected herein. As such, no assurance can be given as to the Computational Materials’ accuracy, appropriateness or completeness in any particular context; or as to whether the Computational Materials and/or the assumptions upon which they are based reflect present market conditions or future market performance. The Computational Materials should not be construed as either projections or predictions or as legal, tax, financial or accounting advice. You should consult your own counsel, accountant and other advisors as to the legal, tax, business, financial and related aspects of a purchase of these securities. Any weighted average lives, yields and principal payment periods shown in the Computational Materials are based on prepayment and/or loss assumptions, and changes in such prepayment and/or loss assumptions may dramatically affect such weighted average lives, yields and principal payment periods. In addition, it is possible that prepayments or losses on the underlying assets will occur at rates higher or lower than the rates shown in the attached Computational Materials. The specific characteristics of the securities may differ from those shown in the Computational Materials due to differences between the final underlying assets and the preliminary underlying assets used in preparing the Computational Materials. The principal amount and designation of any security described in the Computational Materials are subject to change prior to issuance. None of Underwriters or any of their respective affiliates makes any representation or warranty as to the actual rate or timing of payments or losses on any of the underlying assets or the payments or yield on the securities.
This document contains forward-looking statements. Those statements are subject to certain risks and uncertainties that could cause the success of collections and the actual cash flow generated to differ materially from the information set forth herein. While such information reflects projections prepared in good faith based upon methods and data that are believed to be reasonable and accurate as of the dates thereof, the depositor undertakes no obligation to revise these forward-looking statements to reflect subsequent events or circumstances. Individuals should not place undue reliance on forward-looking statements and are advised to make their own independent analysis and determination with respect to the forecasted periods, which reflect the issuer’s view only as of the date hereof.
| IMPORTANT NOTICE RELATING TO AUTOMATICALLY GENERATED EMAIL DISCLAIMERS |
Any legends, disclaimers or other notices that may appear at the bottom of the email communication to which this free writing prospectus is attached relating to (1) these materials not constituting an offer (or a solicitation of an offer), (2) no representation being made that these materials are accurate or complete and may not be updated or (3) these materials possibly being confidential, are not applicable to these materials and should be disregarded. Such legends, disclaimers or other notices have been automatically generated as a result of these materials having been sent via Bloomberg or another system.