UNITED STATES
SECURITIES AND EXCHANGE COMMISSION
Washington, D.C. 20549
FORM N-CSR
CERTIFIED SHAREHOLDER REPORT OF REGISTERED MANAGEMENT INVESTMENT COMPANIES
Investment Company Act File Number 811-23089
M3Sixty Funds Trust
(Exact name of registrant as specified in charter)
| 4520 Main Street, Suite 1425 Kansas City, MO | 64111 |
| (Address of principal executive offices) | (Zip code) |
The Corporation Trust Company
Corporation Trust Center
1209 Orange St.
Wilmington, DE 19801
(Name and address of agent for service)
With Copies To:
John H. Lively
The Law Offices of John H. Lively & Associates, Inc.
A member firm of The 1940 Act Law GroupTM
11300 Tomahawk Creek Parkway, Suite 310
Leawood, KS 66211
Registrant's telephone number, including area code: 888-553-4233
Date of fiscal year end: 06/30/2017
Date of reporting period: 06/30/2017
| ITEM 1. | REPORTS TO SHAREHOLDERS. |
The Annual report to Shareholders of the Cognios Large Cap Value Fund and Cognios Large Cap Growth Fund, each a series of the M3Sixty Funds Trust (the “registrant”), for the period ended June 30, 2017 pursuant to Rule 30e-1 under the Investment Company Act of 1940 (the “1940 Act”), as amended (17 CFR 270.30e-1) is filed herewith.
| | | 1-888-553-4233 | www.cogniosfunds.com | |
Cognios Funds
| Shareholder Letter | June 30, 2017 (Unaudited) |
Dear Shareholder,
Thank you for investing in the Cognios Large Cap Growth Fund (“the Growth Fund”) and/or the Cognios Large Cap Value Fund (“the Value Fund”) and for taking the time to review the Annual Report for the period from October 3, 2016 (commencement of operations) through June 30, 2017. We appreciate this opportunity to offer insight into the funds’ investment strategies and to offer commentary on performance and evolving global market conditions.
Market Commentary
| Total Return Performance |
| October 3, 2016 (Inception) – June 30, 2017 |
| S&P 500 | Russell 1000 | Russell 1000 Growth | Russell 1000 Value |
| 13.88% | 13.82% | 15.44% | 12.07% |
As the table indicates, returns for large capitalization indices have been robust over the past nine months, especially for growth oriented companies. On a year-to-date(“YTD”) basis (January 2017- June 30, 2017), there has been a meaningful return divergence between the Russell 1000 Growth Index and the Russell 1000 Value Index as of June 30, 2017, as the Russell 1000 Growth Index has gained 14.0% YTD on total return basis while the Russell 1000 Value Index has only gained 4.66% YTD.
The elevated returns in the equity markets may be disguising troubles that could surface in the future. We are concerned about the elevated implied valuation multiples for the S&P 500 index at current levels. On nearly every valuation metric, whether it be price to trailing earnings1, price to forward earnings2, price to revenues3, etc., the implied valuation multiple for the S&P 500 is above its historical average. The only valuation metrics that are below historical norms are those that compare equities to Treasuries; For example, the spread of the dividend yield of the S&P 500 to the yield on the ten year Treasury bond is wider than the historical average which generally indicates a fairly priced market, but this is likely the result of unprecedented intervention by the Federal Reserve in the Treasury market rather than an indication that the market is fairly valued.
The macroeconomic view that we developed here at Cognios Capital, LLC (“Cognios” or the “Adviser”) is based on what we consider to be a straightforward model of market behavior over time. This model is based on the belief that corporate profits, market multiples, and interest rates drive stock price returns over very long periods of time. In the post-recession period of 2009-2012, all three of those factors were favorably disposed to provide above average market returns to investors throughout that period to the present time. Corporate profits were growing rapidly from recession lows, market multiples were inexpensive and interest rates were low, and actually still declining at that time. Now, market multiples are elevated, interest rates are rising and it is not yet clear if corporate profits will start growing again following a period of stagnation. Now, market valuations and interest rates are probably working against investors, while corporate profits are, at best, neutral given that rising interest rates are likely to hurt corporate profits.
This is not to say that a market correction or crash will occur in the near future. John Maynard Keynes famously said, “Markets can remain irrational longer than you can remain solvent.” However, should an adverse market event occur, we believe both our growth and value strategies are well positioned to mitigate volatility relative to their respective benchmarks.
| | Annual Report | June 30, 2017 | 1 | |
Cognios Funds
| Shareholder Letter (continued) | June 30, 2017 (Unaudited) |
The Value Fund
The Value Fund invests in high quality companies that trade at attractive valuations relative to the broader market. We utilize our proprietary ROTA/ROME® investment selection and portfolio construction methodology. ROTA/ROME® focuses on a company’s Return on Tangible Assets (“ROTA”) and Return on Market Value of Equity (“ROME”) in order to identify companies whose per share intrinsic value has diverged significantly from the current market price of its stock. We believe that companies that exhibit sustainable long-term high ROTA are higher quality companies that most likely have a competitive advantage within the marketplace. ROME is a measure of profit yield, and like a yield on a bond, the higher the ROME, the more likely that shares in the company can be purchased at a better valuation compared to a company with a lower ROME.
During the period from October 3, 2016 (commencement of operations) through June 30, 2017, the total return for the Institutional Class Shares (COGVX) was 8.09% and the total return for the Investor Class Shares (COGLX) was 7.92%. Over the course of the period from October 3, 2016 (commencement of operations) through June 30, 2017, the Value Fund maintained investment positions in one hundred sixteen positions. Of those investment positions, seventy-six were profitable for a .655 batting average. The tables below display the sector contribution to gross profit as well as the top five positions that contributed to gross profit:
| | | |
| Sector Contribution to Gross Profit of the Value Fund |
| Industry Sector: | Contribution to
Gross Profit |
| Information Technology | 50.0% |
| Consumer Staples | 26.4% |
| Industrials | 23.2% |
| Healthcare | 6.9% |
| Financials | 2.7% |
| Materials | 1.6% |
| Utilities | 0.2% |
| Real Estate | 0.0% |
| Telecommunication Services | 0.0% |
| Consumer Discretionary | -4.8% |
| Energy | -6.2% |
| Total | 100.0% |
| |
| Top 5 Investment Positions by Contribution to Gross Profit |
| Ticker | Company | Contribution to
Gross Profit |
| PM | Philip Morris International Inc. | 21.3% |
| MCD | McDonald’s Corp. | 18.8% |
| AAPL | Apple Inc. | 11.0% |
| MMM | 3M Company | 11.0% |
| VRSN | Verisign Inc. | 10.9% |
| Total | | 73.0% |
| Shareholder Letter (continued) | June 30, 2017 (Unaudited) |
| Top 5 Investment Positions by Detraction from Gross Profit |
| Ticker | Company | Contribution to
Gross Profit |
| LB | L Brands, Inc. | -4.0% |
| DNB | Dun & Bradstreet Corp. | -4.6% |
| GIS | General Mills, Inc. | -5.0% |
| FFIV | F5 Networks, Inc. | -6.7% |
| AZO | Autozone, Inc. | -18.9% |
| Total | | -39.2% |
The Growth Fund
The Growth Fund invests in companies that have accelerating revenue and earnings growth by combining proven quantitative and traditional investment practices into a rigorous framework that allows for highly systematic and adaptable alpha4 capture. Our investment process is focused on building a robust and tempered investment portfolio that may be comprised of traditional growth stocks or stocks that fall outside of the classic growth stock classification but are currently exhibiting growth characteristics. This allows us the flexibility to navigate all market environments, regardless of whether or not a particular style is in favor.
During the period from October 3, 2016 (commencement of operations) through June 30, 2017, the total return for the Institutional Class Shares (COGEX) was 12.14% and the total return for the Investor Class Shares (COGGX) was 11.98%.
The investment process utilized in the Growth Fund has two main components: a quantitative foundation coupled with a discretionary overlay. The quantitative process is driven by two proprietary scores, a fundamental score that measures growth in company fundamentals and a technical score that measures price momentum. Since inception of the Growth Fund, the market has not sufficiently rewarded companies that score well using these two factors. These factors are cyclical in nature which is why the Growth Fund’s investment process is complemented with a discretionary layer which can guide the strategy in markets that are not rewarding our proprietary fundamental and technical factors. When the quantitative factors are out of favor, we generally expect the Growth Fund’s performance to look more similar to the benchmark; whereas, in times that our factors are in favor by the market we generally expect to see the Growth Fund’s performance deviate from that of the benchmark. Despite the recent headwinds faced by the Growth Fund, performance is in line with expectations in the current market environment and we look forward to our quantitative factors coming back into favor by the market.
Since the Growth Fund’s inception, the Growth Fund maintained an active exposure to Information Technology which had the largest contribution to the Growth Fund’s performance over the period, as seen in the table below. This is consistent with our view of a well-built portfolio – the largest active weights contributing more meaningfully to a fund’s performance than sectors or positions with less active, or no active, weight.
| | Annual Report | June 30, 2017 | 3 | |
| Shareholder Letter (continued) | June 30, 2017 (Unaudited) |
| | | |
| Sector Contribution to Gross Profit of the Growth Fund |
| Industry Sector: | Contribution to
Gross Profit |
| Information Technology | 56.5% |
| Industrials | 21.9% |
| Financials | 12.9% |
| Consumer Discretionary | 6.0% |
| Consumer Staples | 4.4% |
| Utilities | 3.1% |
| Healthcare | 2.0% |
| Materials | 0.8% |
| Real Estate | 0.0% |
| Telecommunication Services | -1.1% |
| Energy | -6.5% |
| Total | 100.0% |
Over the course of the period from October 3, 2016 (commencement of operations) through June 30, 2017, the Growth Fund maintained investment positions in one hundred fourteen positions. Of those investment positions, sixty-five were profitable for a .570 batting average.
| Top 5 Investment Positions by Contribution to Gross Profit |
| Ticker | Company | Contribution to
Gross Profit |
| MU | Micron Technology Inc. | 13.2% |
| CSX | CSX Corp. | 11.4% |
| AAPL | Apple Inc. | 9.0% |
| AMZN | Amazon.com Inc. | 7.9% |
| AMAT | Applied Materials Inc. | 7.7% |
| Total | | 49.2% |
| |
| Top 5 Investment Positions by Detraction from Gross Profit |
| Ticker | Company | Contribution to
Gross Profit |
| SWKS | Skyworks Solutions, Inc. | -2.7% |
| BAC | Bank of America Corp. | -2.7% |
| EW | Edwards Sciences Corp. | -3.3% |
| CMG | Chipotle Mexican Grill, Inc. | -3.3% |
| QCOM | Qualcomm, Inc. | -4.43% |
| Total | | -16.42% |
| Shareholder Letter (continued) | June 30, 2017 (Unaudited) |
We at Cognios look forward to future opportunities to connect with our shareholders. We strive to continuously add value to your investment experience by providing access to fund information, portfolio updates and straightforward commentary.
If you have any questions regarding the Cognios Funds, please contact your account manager or financial adviser, or call one of our shareholder associates at 888-553-4233. We also invite you to visit Cognios’ website at www.cognios.com to learn more about our firm, our team and our values.
We thank you for investing with Cognios and for the trust you have placed in us.
Sincerely,
 |  |  |
| Jonathan Angrist | Brian Machtley | Francisco Bido |
Portfolio Managers,
Cognios Capital, LLC
Information in this document regarding market or economic trends, or the factors influencing historical or future performance, reflects the opinions of management as of the date of this document. The views and information discussed in this commentary are as of the date of publication, are subject to change, and may not reflect current views. These statements should not be relied upon for any other purpose. Past performance is no guarantee of future results, and there is no guarantee that the market forecasts discussed will be realized. The subject matter contained in this letter has been derived from several sources believed to be reliable and accurate at the time of compilation. Neither the Fund nor the Adviser accepts any liability for losses, either direct or consequential, caused the use of this information. All performance less than one year is cumulative.
The Funds are not suitable for all investors. Subject to investment risks, including possible loss of the principal amount invested. Portfolio holdings are subject to change at any time. References to specific securities should not be construed as recommendations by the Funds or their Adviser. Current and future holdings are subject to risk.
| 1 | Price-to-trailing earnings: Valuation metric for stocks; Trailing price-to-earnings (P/E) is calculated by taking the current stock price and dividing it by the trailing earnings per share (EPS) for the past 12 months. |
| 2 | Price-to-forward earnings: Valuation metric for stocks; The forward P/E estimates the relative value of the earnings using earnings estimates for the next four quarters. |
| 3 | Price-to-revenues: Valuation metric for stocks; It is calculated by dividing the company’s market cap by the revenue in the most recent year; or, equivalently, divide the per-share stock price by the per-share revenue. |
| 4 | Alpha: The risk-adjusted (i.e., Beta-adjusted) outperformance or underperformance of the portfolio relative to the stock market or another chosen index. |
| | Annual Report | June 30, 2017 | 5 | |
Cognios Large Cap Value Fund
| Portfolio Update | June 30, 2017 (Unaudited) |
Performance (as of June 30, 2017)
| | Since
Inception(a) |
| Cognios Large Cap Value Fund Investor Class shares | 7.92% |
| Cognios Large Cap Value Fund Institutional Class shares | 8.09% |
| S&P 500® Total Return Index(b) | 13.88% |
| Russell 1000® Value Total Return Index(c) | 12.07% |
| (a) | The Cognios Large Cap Value Fund (the “Value Fund”) commenced operations on October 3, 2016. Aggregate total return, not annualized. |
| (b) | The S&P 500® Total Return Index is a broad unmanaged index of 500 stocks, which is widely recognized as representative of the equity market in general. Please note that indices do not take into account any fees and expenses of investing in the individual securities that they track and individuals cannot invest directly in any index. |
| (c) | The Russell 1000® Value Total Return Index measures the performance of those Russell 1000 companies with lower price-to-book ratios and lower forecasted growth values. Please note that indices do not take into account any fees and expenses of investing in the individual securities that they track and individuals cannot invest directly in any index. |
The performance information quoted in this annual report assumes the reinvestment of all dividend and capital gain distributions, if any, and represents past performance, which is not a guarantee of future results. The returns shown do not reflect taxes that a shareholder would pay on Fund distributions or on the redemption of Fund shares. The investment return and principal value of an investment will fluctuate and, therefore, an investor’s shares, when redeemed, may be worth more or less than their original cost. Updated performance data current to the most recent month-end can be obtained by calling 888-553-4233.
As with any fund, save an index fund, that commonly compares its performance to the S&P 500® Total Return Index and the Russell 1000® Value Total Return Index, such a comparison may be said to be inappropriate because of the dissimilarity between the Fund’s investments and the securities comprising the indices; so too with the Cognios Large Cap Value Fund, which will generally not invest in all the securities comprising each index.
Total Fund operating expense ratios as stated in the current Fund prospectus dated October 3, 2016 for the Funds were as follows:
| | |
| Cognios Large Cap Value Fund Investor Class Shares, gross of fee waivers or expense reimbursements | 1.36% |
| Cognios Large Cap Value Fund Investor Class Shares, after fee waivers or expense reimbursements | 1.10% |
| Cognios Large Cap Value Fund Institutional Class Shares, gross of fee waivers or expense reimbursements | 1.11% |
| Cognios Large Cap Value Fund Institutional Class Shares, after fee waivers or expense reimbursements | 0.85% |
Cognios Large Cap Value Fund
| Portfolio Update (continued) | June 30, 2017 (Unaudited) |
Cognios Capital, LLC (the “Adviser”) has entered into an Expense Limitation Agreement with the Value Fund under which it has agreed to waive or reduce its fees and to assume other expenses of the Value Fund, if necessary, in an amount that limits the Value Fund’s annual operating expenses (exclusive of interest, taxes, brokerage fees and commissions, acquired funds fees and expenses, extraordinary expenses, and amounts, if any, payable pursuant to a plan adopted in accordance with Rule 12b-1 under the 1940 Act) to not more than 0.85% through at least October 31, 2018. Subject to approval by the Value Fund’s Board, any waiver under the Expense Limitation Agreement is subject to repayment by the Value Fund within the three fiscal years following the year in which such waiver occurred, if the Value Fund is able to make the payment without exceeding the expense limitation in place at the time of the waiver. The current contractual agreement cannot be terminated prior to at least one year after the effective date of the Registration Statement without the Board of Trustees’ approval. The current contractual agreement cannot be terminated prior to at least one year after the effective date of the Registration Statement without the Board of Trustees’ approval. Total Gross Operating Expenses (Annualized) during the period since inception from October 3, 2016 through June 30, 2017 were 1.52% and 1.27% for the Value Fund’s Investor Class shares and Institutional Class shares, respectively. Please see the Disclosure of Fund Expenses, the Financial Highlights and Notes to Financial Statements (Note 5) sections of this report for expense related disclosures during the period since inception from October 3, 2016 through June 30, 2017.
Cognios Large Cap Value Fund, Investor Shares Growth of $10,000 Investment(1)
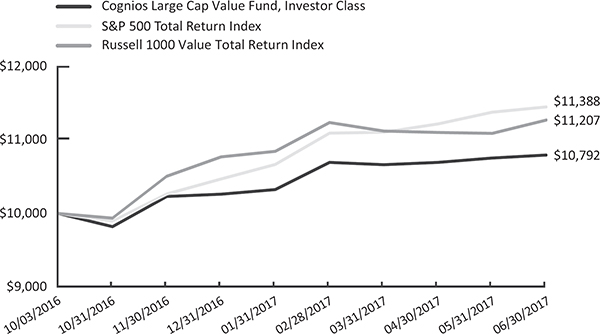
| (1) | The minimum initial investment for the Cognios Large Cap Value Fund, Investor Shares is $1,000. |
| | Annual Report | June 30, 2017 | 7 | |
Cognios Large Cap Value Fund
| Portfolio Update (continued) | June 30, 2017 (Unaudited) |
Cognios Large Cap Value Fund, Institutional Shares Growth of $100,000 Investment(2)
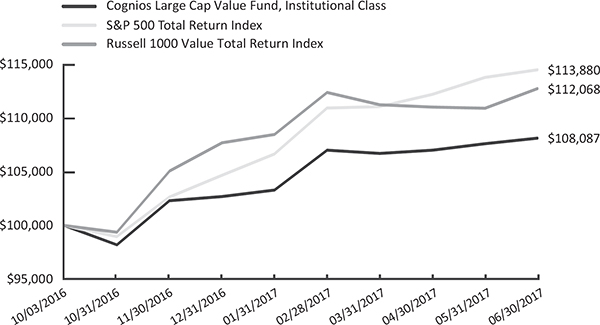
| (2) | The minimum initial investment for the Cognios Large Cap Value Fund, Institutional Shares is $100,000. |
The graphs shown above represent historical performance of hypothetical investments of $10,000 in the Cognios Large Cap Value Fund’s Investor Shares and $100,000 in the Cognios Large Cap Value Fund’s Institutional Shares since inception. Past performance does not guarantee future results. All returns reflect reinvested dividends, but do not reflect the deduction of taxes that a shareholder would pay on Fund distributions or the redemption of Fund shares.
The Value Fund’s principal investment objective is long-term growth of capital. The Value Fund seeks to achieve its investment objective by purchasing equity securities of U.S. companies that the Adviser believes are undervalued and likely to appreciate. The Value Fund generally seeks to purchase large capitalization U.S. equity common stocks of companies that are constituents of the S&P 500® Index. It may invest across different industries and sectors. Under normal circumstances, the Value Fund invests at least 80% of its assets in securities of large capitalization companies as defined by the S&P 500® Index. It may also invest up to 20% in issuers of any size.
Cognios Large Cap Value Fund
| Portfolio Update (continued) | June 30, 2017 (Unaudited) |
Sector Allocation of Portfolio Holdings (% of Net Assets)*
| | |
| Basic Materials | 0.79% |
| Communications | 8.89% |
| Consumer, Cyclical | 16.85% |
| Consumer, Non-Cyclical | 27.19% |
| Energy | 1.61% |
| Financials | 0.83% |
| Industrials | 21.45% |
| Technology | 19.69% |
| Utilities | 1.03% |
| Cash, Cash Equivalents, & Other Net Assets | 1.67% |
| TOTAL | 100.00% |
Top Ten Portfolio Holdings (% of Net Assets)*
| | |
| McDonald’s Corp. | 4.86% |
| CA, Inc. | 4.62% |
| L3 Technologies, Inc. | 4.47% |
| VeriSign, Inc. | 4.27% |
| Philip Morris International, Inc. | 4.27% |
| Raytheon Co. | 3.89% |
| F5 Networks, Inc. | 3.55% |
| Fiserv, Inc. | 3.51% |
| General Mills, Inc. | 3.45% |
| Gilead Sciences, Inc. | 3.36% |
| * | The percentages in the above tables are based on the portfolio holdings of the Value Fund as of June 30, 2017 and are subject to change. For a detailed break-out of holdings by industry, please refer to the Schedules of Investments. |
| | Annual Report | June 30, 2017 | 9 | |
Cognios Large Cap Growth Fund
| Portfolio Update | June 30, 2017 (Unaudited) |
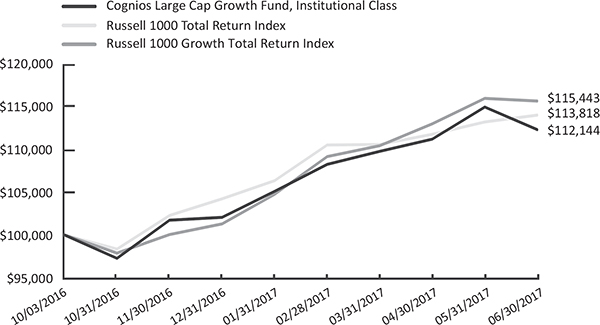
Performance (as of June 30, 2017)
| | Since |
| | Inception(a) |
| Cognios Large Cap Growth Fund Investor Class shares | 11.98% |
| Cognios Large Cap Growth Fund Institutional Class shares | 12.14% |
| Russell 1000® Total Return Index(b) | 13.82% |
| Russell 1000® Growth Total Return Index(c) | 15.44% |
| (a) | The Cognios Large Cap Growth Fund (the “Growth Fund”) commenced operations on October 3, 2016. Aggregate total return, not annualized. |
| (b) | The Russell 1000® Total Return Index measures the performance of the large-cap segment of the U.S. equity universe and consists of the largest 1000 companies in the Russell 3000 Index. Please note that indices do not take into account any fees and expenses of investing in the individual securities that they track and individuals cannot invest directly in any index. |
| (c) | The Russell 1000® Growth Total Return Index measures the performance of those Russell 1000 companies with higher price-to-book ratios and higher forecasted growth values. Please note that indices do not take into account any fees and expenses of investing in the individual securities that they track and individuals cannot invest directly in any index. |
The performance information quoted in this annual report assumes the reinvestment of all dividend and capital gain distributions, if any, and represents past performance, which is not a guarantee of future results. The returns shown do not reflect taxes that a shareholder would pay on Fund distributions or on the redemption of Fund shares. The investment return and principal value of an investment will fluctuate and, therefore, an investor’s shares, when redeemed, may be worth more or less than their original cost. Updated performance data current to the most recent month-end can be obtained by calling 888-553-4233.
As with any fund, save an index fund, that commonly compares its performance to the The Russell 1000® Total Return Index and the Russell 1000® Growth Total Return Index, such a comparison may be said to be inappropriate because of the dissimilarity between the Fund’s investments and the securities comprising the indices; so too with the Cognios Large Cap Growth Fund, which will generally not invest in all the securities comprising each index.
Total Fund operating expense ratios as stated in the current Fund prospectus dated October 3, 2016 for the Funds were as follows:
| Cognios Large Cap Growth Fund Investor Class Shares, gross of fee waivers or expense reimbursements | 2.52% |
| Cognios Large Cap Growth Fund Investor Class Shares, after fee waivers or expense reimbursements | 1.15% |
| Cognios Large Cap Growth Fund Institutional Class Shares, gross of fee waivers or expense reimbursements | 2.27% |
| Cognios Large Cap Growth Fund Institutional Class Shares, after fee waivers or expense reimbursements | 0.90% |
Cognios Large Cap Growth Fund
| Portfolio Update (continued) | June 30, 2017 (Unaudited) |
Cognios Capital, LLC (the “Adviser”) has entered into an Expense Limitation Agreement with the Growth Fund under which it has agreed to waive or reduce its fees and to assume other expenses of the Growth Fund, if necessary, in an amount that limits the Growth Fund’s annual operating expenses (exclusive of interest, taxes, brokerage fees and commissions, acquired funds fees and expenses, extraordinary expenses, and amounts, if any, payable pursuant to a plan adopted in accordance with Rule 12b-1 under the 1940 Act) to not more than 0.90% through at least October 31, 2018. Subject to approval by the Growth Fund’s Board, any waiver under the Expense Limitation Agreement is subject to repayment by the Growth Fund within the three fiscal years following the year in which such waiver occurred, if the Growth Fund is able to make the payment without exceeding the expense limitation in place at the time of the waiver. The current contractual agreement cannot be terminated prior to at least one year after the effective date of the Registration Statement without the Board of Trustees’ approval. Total Gross Operating Expenses (Annualized) during the period from October 3, 2016 (commencement of operations) through June 30, 2017 were 3.42% and 3.17% for the Growth Fund’s Investor Class shares and Institutional Class shares, respectively. Please see the Disclosure of Fund Expenses, the Financial Highlights and Notes to Financial Statements (Note 5) sections of this report for expense related disclosures during the period from October 3, 2016 (commencement of operations) through June 30, 2017.
Cognios Large Cap Growth Fund, Investor Shares Growth of $10,000 Investment (1)
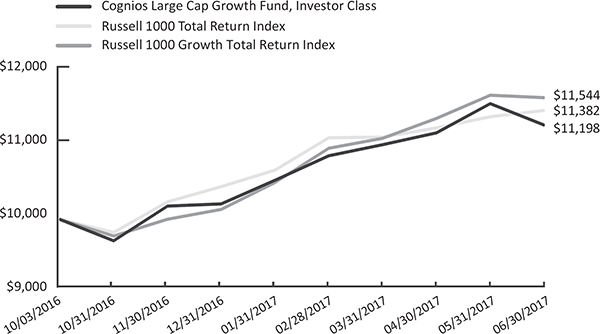
| (1) | The minimum initial investment for the Cognios Large Cap Growth Fund, Investor Shares is $1,000. |
| | Annual Report | June 30, 2017 | 11 | |
Cognios Large Cap Growth Fund
| Portfolio Update (continued) | June 30, 2017 (Unaudited) |
Cognios Large Cap Growth Fund, Institutional Shares Growth of $100,000 Investment (2)
| (2) | The minimum initial investment for the Cognios Large Cap Growth Fund, Institutional Shares is $100,000. |
The graphs shown above represent historical performance of hypothetical investments of $10,000 in the Cognios Large Cap Growth Fund’s Investor Shares and $100,000 in the Cognios Large Cap Growth Fund’s Institutional Shares since inception. Past performance does not guarantee future results. All returns reflect reinvested dividends, but do not reflect the deduction of taxes that a shareholder would pay on Fund distributions or the redemption of Fund shares.
The Growth Fund’s principal investment objective is long-term growth of capital. The Growth Fund seeks to achieve its investment objective by purchasing equity securities that the Adviser believes are likely to appreciate. It generally seeks to purchase equity securities of large capitalization U.S. companies, and may purchase American Depository Receipts (“ADR’s”) of international companies trading on U.S. exchanges, that exhibit accelerating growth in earnings and revenue. The Growth Fund may invest across different industries and sectors. The Growth Fund will invest at least 80% of its net assets in securities that have a market capitalization at the time of investment comparable to securities held in the Russell 1000® Index.
Cognios Large Cap Growth Fund
| Portfolio Update (continued) | June 30, 2017 (Unaudited) |
Sector Allocation of Portfolio Holdings (% of Net Assets)*
| Communications | 9.21% |
| Consumer, Cyclical | 5.94% |
| Consumer, Non-Cyclical | 18.37% |
| Financials | 7.07% |
| Industrials | 13.28% |
| Technology | 34.73% |
| Utilities | 7.49% |
| Cash, Cash Equivalents, & Other Net Assets | 3.91% |
| TOTAL | 100.00% |
| | |
| Top Ten Portfolio Holdings (% of Net Assets)* | |
| | |
| Microsoft Corp. | 4.61% |
| Square, Inc. - Class A | 4.51% |
| Ulta Beauty, Inc. | 4.26% |
| Amazon.com, Inc. | 4.10% |
| Apple, Inc. | 3.84% |
| Applied Materials, Inc. | 3.01% |
| Fortis, Inc. - Canada | 2.89% |
| Sempra Energy | 2.87% |
| Micron Technology, Inc. | 2.87% |
| Facebook, Inc. - Class A | 2.66% |
| * | The percentages in the above tables are based on the portfolio holdings of the Growth Fund as of June 30, 2017 and are subject to change. For a detailed break-out of holdings by industry, please refer to the Schedule of Investments. |
| | Annual Report | June 30, 2017 | 13 | |
Cognios Funds
| Disclosure of Fund Expenses | June 30, 2017 (Unaudited) |
As a shareholder of the Funds, you incur ongoing costs, including management fees, distribution and/or service (12b-1) fees; and other Fund expenses. The example below is intended to help you understand your ongoing costs (in dollars) of investing in the Funds and to compare these costs with the ongoing costs of investing in other mutual funds.
The example is based on an investment of $1,000 invested at the beginning of the period and held for the entire period as indicated below.
Actual Expenses – The first section of the table provides information about actual account values and actual expenses (relating to the example $1,000 investment made at the beginning of the period). You may use the information in this section, together with the amount you invested, to estimate the expenses that you paid over the period. Simply divide your account value by $1,000 (for example, an $8,600 account value divided by $1,000 = 8.6), then multiply the result by the number in the first section under the heading entitled “Expenses Paid During Period” to estimate the expenses you paid on your account during this period.
Hypothetical Example for Comparison Purposes – The second section of the table provides information about the hypothetical account values and hypothetical expenses based on the Funds’ actual expense ratio and an assumed rate of return of 5% per year before expenses, which are not the Fund’s actual return. The hypothetical account values and expenses may not be used to estimate the actual ending account balance or expenses you paid for the period. You may use this information to compare the ongoing costs of investing in the Funds to other funds. To do so, compare this 5% hypothetical example with the 5% hypothetical examples that appear in the shareholder reports of the other funds.
Please note that the expenses shown in the table are meant to highlight your ongoing costs only and do not reflect any transactional costs, such as exchange fees. Therefore, the second section of the table is useful in comparing ongoing costs only, and will not help you determine the relative total costs of owning different funds. In addition, if these transactional costs were included, your costs would have been higher. For more information on transactional costs, please refer to the Funds’ prospectus.
Expenses and Value of a $1,000 Investment for the Period Since Inception
from 01/01/17 through 06/30/17
| | | Beginning
Account
Value
(01/01/2017) | | Annualized
Expense
Ratio for
the Period | | Ending Account
Value
(06/30/2017) | | Expenses Paid
During Period |
| Value Fund: | | | | | | | | |
| Actual Fund Return (in parentheses) | | | | | | | | |
| Investor Class Shares (+5.17%) | | $ 1,000.00 | | 1.10% | | $ 1,051.70 | | $ 5.60(a) |
| Institutional Class Shares (+5.26%) | | $ 1,000.00 | | 0.85% | | $ 1,052.60 | | $ 4.33(a) |
| | | | | | | | | |
| Growth Fund: | | | | | | | | |
| Actual Fund Return (in parentheses) | | | | | | | | |
| Investor Class Shares (+9.81%) | | $ 1,000.00 | | 1.15% | | $ 1,098.10 | | $ 5.98(a) |
| Institutional Class Shares (+9.91%) | | $ 1,000.00 | | 0.90% | | $ 1,099.10 | | $ 4.68(a) |
| (a) | Expenses are equal to the Funds’ annualized expense ratios, multiplied by the average account value over the period, multiplied by 181/365 to reflect the one-half year period. |
Cognios Funds
| Disclosure of Fund Expenses (continued) | June 30, 2017 (Unaudited) |
Expenses and Value of a $1,000 Investment for the Period from 01/01/17 through 06/30/17
| | | Beginning
Account
Value
(01/01/2017) | | Annualized
Expense
Ratio for
the Period | | Ending Account
Value
(06/30/2017) | | Expenses Paid
During Period |
| Value Fund: | | | | | | | | |
| Hypothetical 5% Fund Return | | | | | | | | |
| Investor Class Shares | | $ 1,000.00 | | 1.10% | | $ 1,019.30 | | $ 5.51(b) |
| Institutional Class Shares | | $ 1,000.00 | | 0.85% | | $ 1,020.60 | | $ 4.26(b) |
| | | | | | | | | |
| Growth Fund: | | | | | | | | |
| Hypothetical 5% Fund Return | | | | | | | | |
| Investor Class Shares | | $ 1,000.00 | | 1.15% | | $ 1,019.10 | | $ 5.76(b) |
| Institutional Class Shares | | $ 1,000.00 | | 0.90% | | $ 1,020.30 | | $ 4.51(b) |
| (b) | Expenses are equal to the Funds’ annualized expense ratios, multiplied by the average account value over the period, multiplied by 181/365 to reflect the one-half year period. |
For more information on the Funds’ expenses, please refer to the Funds’ prospectus, which can be obtained from your investment representative or by calling 888-553-4233. Please read it carefully before you invest or send money.
| | Annual Report | June 30, 2017 | 15 | |
Cognios Large Cap Value Fund
| Schedule of Investments | June 30, 2017 |
| | | | Shares | | | Value | |
| COMMON STOCK - 98.33% | | | | | | | | |
| Basic Materials - 0.79% | | | | | | | | |
| | LyondellBasell Industries - Class A | | | 1,860 | | | $ | 156,965 | |
| | Sherwin-Williams Co. | | | 464 | | | | 162,845 | |
| | | | | | | | | 319,810 | |
| Communications - 8.89% | | | | | | | | |
| | Alphabet, Inc. - Class A (a) | | | 464 | | | | 431,372 | |
| | F5 Networks, Inc. (a) | | | 11,318 | | | | 1,438,065 | |
| | VeriSign, Inc. (a) | | | 18,624 | | | | 1,731,287 | |
| | | | | | | | | 3,600,724 | |
| Consumer, Cyclical - 16.85% | | | | | | | | |
| | Alaska Air Group, Inc. | | | 1,239 | | | | 111,213 | |
| | American Airlines Group, Inc. | | | 4,182 | | | | 210,438 | |
| | AutoZone, Inc. (a) | | | 2,167 | | | | 1,236,187 | |
| | Bed Bath & Beyond, Inc. | | | 2,792 | | | | 84,877 | |
| | Best Buy Co., Inc. | | | 4,031 | | | | 231,097 | |
| | Delta Air Lines, Inc. | | | 4,499 | | | | 241,776 | |
| | Ford Motor Co. | | | 8,811 | | | | 98,595 | |
| | GameStop Corp. - Class A | | | 1,084 | | | | 23,425 | |
| | Gap, Inc. | | | 1,239 | | | | 27,246 | |
| | Home Depot, Inc. | | | 1,239 | | | | 190,063 | |
| | Kohl’s Corp. | | | 2,335 | | | | 90,294 | |
| | L Brands, Inc. | | | 8,857 | | | | 477,304 | |
| | Marriott International, Inc. - Class A | | | 2,485 | | | | 249,270 | |
| | McDonald’s Corp. | | | 12,850 | | | | 1,968,106 | |
| | Michael Kors Holdings Ltd. (a) | | | 10,845 | | | | 393,131 | |
| | Nordstrom, Inc. | | | 3,250 | | | | 155,448 | |
| | PACCAR, Inc. | | | 775 | | | | 51,181 | |
| | Ross Stores, Inc. | | | 2,789 | | | | 161,009 | |
| | TJX Cos., Inc. | | | 7,907 | | | | 570,648 | |
| | United Continental Holdings, Inc. (a) | | | 3,413 | | | | 256,828 | |
| | | | | | | | | 6,828,136 | |
| Consumer, Non-cyclical - 27.19% | | | | | | | | |
| | AbbVie, Inc. | | | 2,789 | | | | 202,230 | |
| | Altria Group, Inc. | | | 8,509 | | | | 633,665 | |
| | AmerisourceBergen Corp. | | | 1,859 | | | | 175,731 | |
| | Campbell Soup Co. | | | 10,849 | | | | 565,775 | |
| | Centene Corp. (a) | | | 310 | | | | 24,763 | |
The accompanying notes are an integral part of these financial statements.
Cognios Large Cap Value Fund
| Schedule of Investments (continued) | June 30, 2017 |
| | | | Shares | | | Value | |
| Consumer, Non-cyclical (continued) | | | | | | | | |
| | Clorox Co. | | | 3,256 | | | $ | 433,829 | |
| | Danaher Corp. | | | 3,877 | | | | 327,180 | |
| | DaVita, Inc. (a) | | | 20,635 | | | | 1,336,323 | |
| | Endo International PLC (a) | | | 4,036 | | | | 45,082 | |
| | Express Scripts Holding Co. (a) | | | 5,591 | | | | 356,929 | |
| | General Mills, Inc. | | | 25,266 | | | | 1,399,736 | |
| | Gilead Sciences, Inc. | | | 19,229 | | | | 1,361,029 | |
| | HCA Healthcare, Inc. (a) | | | 464 | | | | 40,461 | |
| | Humana, Inc. | | | 154 | | | | 37,056 | |
| | Kellogg Co. | | | 4,495 | | | | 312,223 | |
| | Kimberly-Clark Corp. | | | 7,744 | | | | 999,828 | |
| | Laboratory Corp. of America Holdings (a) | | | 1,394 | | | | 214,871 | |
| | McKesson Corp. | | | 309 | | | | 50,843 | |
| | Philip Morris International, Inc. | | | 14,719 | | | | 1,728,747 | |
| | Quanta Services, Inc. (a) | | | 1,862 | | | | 61,297 | |
| | Quest Diagnostics, Inc. | | | 4,182 | | | | 464,871 | |
| | Robert Half International, Inc. | | | 3,722 | | | | 178,395 | |
| | United Rentals, Inc. (a) | | | 619 | | | | 69,768 | |
| | | | | | | | | 11,020,632 | |
| Energy - 1.61% | | | | | | | | |
| | Apache Corp. | | | 465 | | | | 22,287 | |
| | Baker Hughes, Inc. | | | 1,238 | | | | 67,483 | |
| | Devon Energy Corp. | | | 1,394 | | | | 44,566 | |
| | Diamond Offshore Drilling, Inc. (a) | | | 2,174 | | | | 23,544 | |
| | Helmerich & Payne, Inc. | | | 621 | | | | 33,745 | |
| | Marathon Petroleum Corp. | | | 1,083 | | | | 56,673 | |
| | Southwestern Energy Co. (a) | | | 4,802 | | | | 29,196 | |
| | Tesoro Corp. | | | 1,394 | | | | 130,478 | |
| | Transocean Ltd. (a) | | | 16,912 | | | | 139,186 | |
| | Valero Energy Corp. | | | 1,546 | | | | 104,293 | |
| | | | | | | | | 651,451 | |
| Financials - 0.83% | | | | | | | | |
| | Alliance Data Systems Corp. | | | 465 | | | | 119,361 | |
| | Marsh & McLennan Cos., Inc. | | | 2,792 | | | | 217,664 | |
| | | | | | | | | 337,025 | |
The accompanying notes are an integral part of these financial statements.
| | Annual Report | June 30, 2017 | 17 | |
Cognios Large Cap Value Fund
| Schedule of Investments (continued) | June 30, 2017 |
| | | | Shares | | | Value | |
| Industrials - 21.45% | | | | | | |
| | 3M Co. | | | 6,354 | | | $ | 1,322,839 | |
| | AMETEK, Inc. | | | 3,568 | | | | 216,114 | |
| | Amphenol Corp. - Class A | | | 2,634 | | | | 194,442 | |
| | CH Robinson Worldwide, Inc. | | | 10,085 | | | | 692,638 | |
| | Fortive Corp. | | | 2,013 | | | | 127,524 | |
| | Harris Corp. | | | 6,972 | | | | 760,506 | |
| | L3 Technologies, Inc. | | | 10,846 | | | | 1,812,150 | |
| | Northrop Grumman Corp. | | | 2,481 | | | | 636,898 | |
| | Raytheon Co. | | | 9,757 | | | | 1,575,560 | |
| | United Parcel Service, Inc. - Class B | | | 12,251 | | | | 1,354,838 | |
| | | | | | | | | 8,693,509 | |
| Technology - 19.69% | | | | | | | | |
| | Accenture PLC - Class A | | | 2,634 | | | | 325,773 | |
| | Analog Devices, Inc. | | | 775 | | | | 60,295 | |
| | Apple, Inc. | | | 6,975 | | | | 1,004,540 | |
| | CA, Inc. | | | 54,322 | | | | 1,872,479 | |
| | Dell Technologies, Inc. - Class V (a) | | | 1,553 | | | | 94,904 | |
| | Dun & Bradstreet Corp. | | | 5,884 | | | | 636,355 | |
| | Fiserv, Inc. (a) | | | 11,631 | | | | 1,422,937 | |
| | HP, Inc. | | | 7,921 | | | | 138,459 | |
| | International Business Machines Corp. | | | 3,566 | | | | 548,558 | |
| | KLA-Tencor Corp. | | | 2,797 | | | | 255,953 | |
| | Micron Technology, Inc. (a) | | �� | 3,574 | | | | 106,720 | |
| | Microsoft Corp. | | | 5,419 | | | | 373,532 | |
| | Oracle Corp. | | | 18,901 | | | | 947,696 | |
| | Synopsys, Inc. (a) | | | 2,636 | | | | 192,244 | |
| | | | | | | | | 7,980,445 | |
| Utilities - 1.03% | | | | | | | | |
| | AES Corp. | | | 16,092 | | | | 178,782 | |
| | Exelon Corp. | | | 928 | | | | 33,473 | |
| | FirstEnergy Corp. | | | 5,731 | | | | 167,116 | |
| | NiSource, Inc. | | | 1,547 | | | | 39,232 | |
| | | | | | | | | 418,603 | |
| | | | | | | | | | |
TOTAL COMMON STOCK
(Cost $38,099,186) | | | | | | | 39,850,335 | |
The accompanying notes are an integral part of these financial statements.
Cognios Large Cap Value Fund
| Schedule of Investments (continued) | June 30, 2017 |
| | | Shares | | | Value | |
TOTAL INVESTMENTS - 98.33%
(Cost $38,099,186) | | | | | | $ | 39,850,335 | |
| OTHER ASSETS IN EXCESS OF LIABILITES, NET - 1.67% | | | | | | | 675,584 | |
| NET ASSETS - 100% | | | | | | $ | 40,525,919 | |
Percentages are stated as a percent of net assets.
| (a) | Non-income producing security. |
The following abbreviations are used in this portfolio:
Ltd. - Limited
PLC - Public Limited Company
The accompanying notes are an integral part of these financial statements.
| | Annual Report | June 30, 2017 | 19 | |
Cognios Large Cap Growth Fund
| Schedule of Investments | June 30, 2017 |
| | | | Shares | | | Value | |
| COMMON STOCK - 96.09% | | | | | | | | |
| Communications - 9.21% | | | | | | | | |
| | Alphabet, Inc. - Class A (a) | | | 131 | | | $ | 121,788 | |
| | Amazon.com, Inc. (a) | | | 210 | | | | 203,280 | |
| | Facebook, Inc. - Class A (a) | | | 873 | | | | 131,806 | |
| | | | | | | | | 456,874 | |
| Consumer, Cyclical - 5.94% | | | | | | | | |
| | Home Depot, Inc. | | | 542 | | | | 83,143 | |
| | Ulta Beauty, Inc. (a) | | | 735 | | | | 211,195 | |
| | | | | | | | | 294,338 | |
| Consumer, Non-cyclical - 18.37% | | | | | | | | |
| | AmerisourceBergen Corp. | | | 461 | | | | 43,578 | |
| | Edwards Lifesciences Corp. (a) | | | 698 | | | | 82,532 | |
| | Estee Lauder Cos., Inc. - Class A | | | 1,119 | | | | 107,402 | |
| | Medtronic PLC | | | 1,475 | | | | 130,906 | |
| | PayPal Holdings, Inc. (a) | | | 1,401 | | | | 75,192 | |
| | Quest Diagnostics, Inc. | | | 921 | | | | 102,378 | |
| | Square, Inc. - Class A (a) | | | 9,533 | | | | 223,644 | |
| | Stryker Corp. | | | 457 | | | | 63,422 | |
| | Thermo Fisher Scientific, Inc. | | | 467 | | | | 81,477 | |
| | | | | | | | | 910,531 | |
| Financials - 7.07% | | | | | | | | |
| | CBOE Holdings, Inc. | | | 1,418 | | | | 129,605 | |
| | Citigroup, Inc. | | | 1,423 | | | | 95,170 | |
| | Progressive Corp. | | | 2,847 | | | | 125,524 | |
| | | | | | | | | 350,299 | |
| Industrials - 13.28% | | | | | | | | |
| | 3M Co. | | | 327 | | | | 68,078 | |
| | Caterpillar, Inc. | | | 1,149 | | | | 123,472 | |
| | CSX Corp. | | | 1,028 | | | | 56,088 | |
| | Eaton Corp. PLC | | | 1,059 | | | | 82,422 | |
| | Republic Services, Inc. | | | 1,244 | | | | 79,280 | |
| | Roper Technologies, Inc. | | | 523 | | | | 121,090 | |
| | Stanley Black & Decker, Inc. | | | 583 | | | | 82,046 | |
| | Union Pacific Corp. | | | 420 | | | | 45,742 | |
| | | | | | | | | 658,218 | |
The accompanying notes are an integral part of these financial statements.
Cognios Large Cap Growth Fund
| Schedule of Investments (continued) | June 30, 2017 |
| | | | Shares | | | Value | |
| Technology - 34.73% | | | | | | |
| | Adobe Systems, Inc. (a) | | | 856 | | | $ | 121,073 | |
| | Analog Devices, Inc. | | | 1,588 | | | | 123,546 | |
| | Apple, Inc. | | | 1,323 | | | | 190,538 | |
| | Applied Materials, Inc. | | | 3,612 | | | | 149,212 | |
| | Check Point Software Technologies Ltd. (a) | | | 1,171 | | | | 127,733 | |
| | Cognizant Technology Solutions Corp. - Class A | | | 1,103 | | | | 73,239 | |
| | Intuit, Inc. | | | 583 | | | | 77,428 | |
| | Lam Research Corp. | | | 921 | | | | 130,257 | |
| | Microchip Technology, Inc. | | | 1,283 | | | | 99,022 | |
| | Micron Technology, Inc. (a) | | | 4,764 | | | | 142,253 | |
| | Microsoft Corp. | | | 3,318 | | | | 228,710 | |
| | Skyworks Solutions, Inc. | | | 686 | | | | 65,822 | |
| | Veeva Systems, Inc. - Class A (a) | | | 1,834 | | | | 112,443 | |
| | Western Digital Corp. | | | 911 | | | | 80,715 | |
| | | | | | | | | 1,721,991 | |
| Utilities - 7.49% | | | | | | | | |
| | Consolidated Edison, Inc. | | | 1,059 | | | | 85,588 | |
| | Fortis, Inc. - Canada | | | 4,082 | | | | 143,482 | |
| | Sempra Energy | | | 1,264 | | | | 142,516 | |
| | | | | | | | | 371,586 | |
| | | | | | | | | | |
TOTAL COMMON STOCK
(Cost $4,591,049) | | | | | | | 4,763,837 | |
| | | | | | | | | | |
TOTAL INVESTMENTS - 96.09%
(Cost $4,591,049) | | | | | | $ | 4,763,837 | |
| OTHER ASSETS IN EXCESS OF LIABILITIES, NET - 3.91% | | | | | | | 194,097 | |
| NET ASSETS - 100% | | | | | | $ | 4,957,934 | |
Percentages are stated as a percent of net assets.
| (a) | Non-income producing security. |
The following abbreviations are used in this portfolio:
Ltd. - Limited
PLC - Public Limited Company
The accompanying notes are an integral part of these financial statements.
| | Annual Report | June 30, 2017 | 21 | |
Cognios Funds
| Statements of Assets and Liabilities | June 30, 2017 |
| | | Cognios Large
Cap Value Fund | | Cognios Large
Cap Growth Fund |
| Assets: | | | | | | |
| Cash and cash equivalents | | $ | 661,275 | | | $ | 202,955 | |
| Investments, at value | | | 39,850,335 | | | | 4,763,837 | |
| Due from adviser | | | — | | | | 9,355 | |
| Receivables: | | | | | | | | |
| Interest | | | 152 | | | | 49 | |
| Dividends | | | 40,029 | | | | 2,445 | |
| Investments sold | | | — | | | | 331,650 | |
| Prepaid expenses | | | 3,438 | | | | 2,438 | |
| Total assets | | | 40,555,229 | | | | 5,312,729 | |
| | | | | | | | | |
| Liabilities: | | | | | | | | |
| Payables: | | | | | | | | |
| Investment securities purchased | | | — | | | | 336,689 | |
| Due to adviser | | | 1,351 | | | | — | |
| Accrued distribution (12b-1) fees | | | 12 | | | | 12 | |
| Due to administrator | | | 11,651 | | | | 2,395 | |
| Accrued expenses | | | 16,296 | | | | 15,699 | |
| Total liabilities | | | 29,310 | | | | 354,795 | |
| Net Assets | | $ | 40,525,919 | | | $ | 4,957,934 | |
| | | | | | | | | |
| Sources of Net Assets: | | | | | | | | |
| Paid-in capital | | $ | 35,298,976 | | | $ | 4,400,535 | |
| Accumulated undistributed net realized gain on investments | | | 3,267,776 | | | | 372,389 | |
| Accumulated undistributed net investment income | | | 208,018 | | | | 12,222 | |
| Net unrealized appreciation on investments | | | 1,751,149 | | | | 172,788 | |
| Total Net Assets (Unlimited shares of beneficial interest authorized) | | $ | 40,525,919 | | | $ | 4,957,934 | |
| | | | | | | | | |
| Total Investments, at cost | | $ | 38,099,186 | | | $ | 4,591,049 | |
| | | | | | | | | |
| Investor Class Shares: | | | | | | | | |
| Net assets | | $ | 11,438 | | | $ | 9,666 | |
| Shares Outstanding (Unlimited shares of beneficial interest authorized) | | | 1,060 | | | | 864 | |
| Net Asset Value, Offering and Redemption Price Per Share | | $ | 10.79 | | | $ | 11.19 | |
| | | | | | | | | |
| Institutional Class Shares: | | | | | | | | |
| Net assets | | $ | 40,514,481 | | | $ | 4,948,268 | |
| Shares Outstanding (Unlimited shares of beneficial interest authorized) | | | 3,752,808 | | | | 441,772 | |
| Net Asset Value, Offering and Redemption Price Per Share | | $ | 10.80 | | | $ | 11.20 | |
The accompanying notes are an integral part of these financial statements.
Cognios Funds
| Statements of Operations | June 30, 2017 |
| | | Cognios
Large Cap
Value Fund | | | Cognios
Large Cap
Growth Fund | |
| | | For the
Period Ended
June 30, 2017(a) | | | For the
Period Ended
June 30, 2017(a) | |
| Investment income: | | | | | | | | |
| Dividends (net of foreign withholding taxes of $0 and $188, respectively) | | $ | 432,083 | | | $ | 39,119 | |
| Interest | | | 1,509 | | | | 495 | |
| Total investment income | | | 433,592 | | | | 39,614 | |
| | | | | | | | | |
| Expenses: | | | | | | | | |
| Advisory fees (Note 5) | | | 148,991 | | | | 19,042 | |
| Distribution (12b-1) fees - Investor Class | | | 12 | | | | 12 | |
| Accounting and transfer agent fees and expenses | | | 70,830 | | | | 17,088 | |
| Audit fees | | | 14,475 | | | | 14,475 | |
| Legal fees | | | 12,125 | | | | 5,125 | |
| Trustee fees and expenses | | | 12,637 | | | | 12,637 | |
| Compliance officer fees | | | 10,500 | | | | — | |
| Custodian fees | | | 5,602 | | | | 5,303 | |
| Pricing fees | | | 7,805 | | | | 3,731 | |
| Shareholder network fees | | | 3,039 | | | | 3,039 | |
| Miscellaneous | | | 4,138 | | | | 4,138 | |
| Reports to shareholders | | | 593 | | | | 592 | |
| Registration and filing fees | | | 538 | | | | 538 | |
| Insurance | | | 646 | | | | 646 | |
| Total expenses | | | 291,931 | | | | 86,366 | |
| Less: fees waived and expenses reimbursed | | | (97,135 | ) | | | (61,862 | ) |
| Net expenses | | | 194,796 | | | | 24,504 | |
| | | | | | | | | |
| Net investment income | | | 238,796 | | | | 15,110 | |
| | | | | | | | | |
| Realized and unrealized gain: | | | | | | | | |
| Net realized gain on: | | | | | | | | |
| Investments | | | 163,064 | | | | 238,124 | |
| Net realized gain on investments | | | 163,064 | | | | 238,124 | |
| | | | | | | | | |
| Net change in unrealized appreciation on: | | | | | | | | |
| Investments | | | 1,751,149 | | | | 172,788 | |
| Net change in unrealized appreciation | | | 1,751,149 | | | | 172,788 | |
| | | | | | | | | |
| Net gain on investments | | | 1,914,213 | | | | 410,912 | |
| | | | | | | | | |
| Net increase in net assets resulting from operations | | $ | 2,153,009 | | | $ | 426,022 | |
| (a) | The Cognios Funds commenced operations on October 3, 2016. |
The accompanying notes are an integral part of these financial statements.
| | Annual Report | June 30, 2017 | 23 | |
Cognios Funds
| Statements of Changes in Net Assets | June 30, 2017 |
| | | Cognios
Large Cap
Value Fund | |
| | | For the
Period Ended
June 30, 2017(a) | |
| Increase (decrease) in net assets from: | | | | |
| Operations: | | | | |
| Net investment income | | $ | 238,796 | |
| Net realized gain on investments | | | 163,064 | |
| Net change in unrealized appreciation on investments | | | 1,751,149 | |
| Net increase in net assets resulting from operations | | | 2,153,009 | |
| | | | | |
| Distributions to shareholders from: | | | | |
| Net investment income - Investor Class | | | (1 | ) |
| Net investment income - Institutional Class | | | (30,777 | ) |
| Total distributions | | | (30,778 | ) |
| | | | | |
| Capital share transactions (Note 3): | | | | |
| Increase in net assets from capital share transactions | | | 38,353,688 | |
| Increase in net assets | | | 40,475,919 | |
| | | | | |
| Net Assets: | | | | |
| Beginning of period (Note 1) | | | 50,000 | |
| End of period | | $ | 40,525,919 | |
| Accumulated undistributed net investment income | | $ | 208,018 | |
| (a) | The Cognios Large Cap Value Fund commenced operations on October 3, 2016. |
The accompanying notes are an integral part of these financial statements.
Cognios Funds
| Statements of Changes in Net Assets | June 30, 2017 |
| | | Cognios
Large Cap
Growth Fund | |
| | | For the Period Ended
June 30, 2017(a) | |
| Increase (decrease) in net assets from: | | | | |
| Operations: | | | | |
| Net investment income | | $ | 15,110 | |
| Net realized gain on investments | | | 238,124 | |
| Net change in unrealized appreciation on investments | | | 172,788 | |
| Net increase in net assets resulting from operations | | | 426,022 | |
| | | | | |
| Distributions to shareholders from: | | | | |
| Net investment income - Investor Class | | | (4 | ) |
| Net investment income - Institutional Class | | | (2,884 | ) |
| Total distributions | | | (2,888 | ) |
| | | | | |
| Capital share transactions (Note 3): | | | | |
| Increase in net assets from capital share transactions | | | 4,484,800 | |
| Increase in net assets | | | 4,907,934 | |
| | | | | |
| Net Assets: | | | | |
| Beginning of period (Note 1) | | | 50,000 | |
| End of period | | $ | 4,957,934 | |
| Accumulated undistributed net investment income | | $ | 12,222 | |
| (a) | The Cognios Large Cap Growth Fund commenced operations on October 3, 2016. |
The accompanying notes are an integral part of these financial statements.
| | Annual Report | June 30, 2017 | 25 | |
Cognios Funds
| Financial Highlights | June 30, 2017 |
The following tables set forth the per share operating performance data for a share of capital stock outstanding, total return ratios to average net assets and other supplemental data for the period indicated.
| | | Cognios Large Cap Value Fund | |
| | | Investor Class | | | Institutional Class | |
| | | For the Period Ended June 30, 2017(a) | | | For the Period Ended June 30, 2017(a) | |
| Net Asset Value, Beginning of Period | | $ | 10.00 | | | $ | 10.00 | |
| | | | | | | | | |
| Investment Operations: | | | | | | | | |
| Net investment income | | | 0.04 | | | | 0.06 | |
| Net realized and unrealized gain on investments | | | 0.75 | | | | 0.75 | |
| Total from investment operations | | | 0.79 | | | | 0.81 | |
| | | | | | | | | |
| Distributions: | | | | | | | | |
| From net investment income | | | — | (b) | | | (0.01 | ) |
| Total distributions | | | — | (b) | | | (0.01 | ) |
| | | | | | | | | |
| Net Asset Value, End of Period | | $ | 10.79 | | | $ | 10.80 | |
| | | | | | | | | |
| Total Return (c) | | | 7.92 | %(d) | | | 8.09 | %(d) |
| | | | | | | | | |
| Ratios/Supplemental Data | | | | | | | | |
| Net assets, end of period (in 000’s) | | $ | 11 | | | $ | 40,514 | |
| | | | | | | | | |
| Ratio of expenses to average net assets: | | | | | | | | |
| Before fees waived and expenses reimbursed | | | 1.52 | %(e) | | | 1.27 | %(e) |
| After fees waived and expenses reimbursed | | | 1.10 | %(e) | | | 0.85 | %(e) |
| | | | | | | | | |
| Ratio of net investment income: | | | | | | | | |
| Before fees waived and expenses reimbursed | | | 0.37 | %(e) | | | 0.62 | %(e) |
| After fees waived and expenses reimbursed | | | 0.79 | %(e) | | | 1.04 | %(e) |
| | | | | | | | | |
| Portfolio turnover rate | | | 24 | %(d) | | | 24 | %(d) |
| (a) | The Cognios Large Cap Value Fund commenced operations on October 3, 2016. |
| (b) | Net investment income distributed by the Investor Class was less than $0.005 per share during the period ended June 30, 2017. |
| (c) | Total Return represents the rate that the investor would have earned or lost on an investment in the Fund, assuming reinvestment of dividends. |
The accompanying notes are an integral part of these financial statements.
Cognios Funds
| Financial Highlights (continued) | June 30, 2017 |
The following tables set forth the per share operating performance data for a share of capital stock outstanding, total return ratios to average net assets and other supplemental data for the period indicated.
| | | Cognios Large Cap Growth Fund | |
| | | Investor Class | | | Institutional Class | |
| | | For the Period Ended June 30, 2017 (a) | | | For the Period Ended June 30, 2017 (a) | |
| Net Asset Value, Beginning of Period | | $ | 10.00 | | | $ | 10.00 | |
| | | | | | | | | |
| Investment Operations: | | | | | | | | |
| Net investment income | | | 0.02 | | | | 0.04 | |
| Net realized and unrealized gain on investments | | | 1.18 | | | | 1.17 | |
| Total from investment operations | | | 1.20 | | | | 1.21 | |
| | | | | | | | | |
| Distributions: | | | | | | | | |
| From net investment income | | | (0.01 | ) | | | (0.01 | ) |
| Total distributions | | | (0.01 | ) | | | (0.01 | ) |
| | | | | | | | | |
| Net Asset Value, End of Period | | $ | 11.19 | | | $ | 11.20 | |
| | | | | | | | | |
| Total Return (b) | | | 11.98 | %(c) | | | 12.14 | %(c) |
| | | | | | | | | |
| Ratios/Supplemental Data | | | | | | | | |
| Net assets, end of period (in 000’s) | | $ | 10 | | | $ | 4,948 | |
| | | | | | | | | |
| Ratio of expenses to average net assets: | | | | | | | | |
| Before fees waived and expenses reimbursed | | | 3.42 | %(d) | | | 3.17 | %(d) |
| After fees waived and expenses reimbursed | | | 1.15 | %(d) | | | 0.90 | %(d) |
| | | | | | | | | |
| Ratio of net investment income (loss): | | | | | | | | |
| Before fees waived and expenses reimbursed | | | (1.97 | %)(d) | | | (1.72 | %)(d) |
| After fees waived and expenses reimbursed | | | 0.30 | %(d) | | | 0.55 | %(d) |
| | | | | | | | | |
| Portfolio turnover rate | | | 286 | %(c) | | | 286 | %(c) |
| (a) | The Cognios Large Cap Growth Fund commenced operations on October 3, 2016. |
| (b) | Total Return represents the rate that the investor would have earned or lost on an investment in the Fund, assuming reinvestment of dividends. |
The accompanying notes are an integral part of these financial statements.
| | Annual Report | June 30, 2017 | 27 | |
Cognios Funds
| Notes to the Financial Statements | June 30, 2017 |
1. ORGANIZATION AND SIGNIFICANT ACCOUNTING POLICIES
The Cognios Large Cap Value Fund (the “Value Fund”) and the Cognios Large Cap Growth Fund (the “Growth Fund”), (collectively, the “Funds”) are each a series of M3Sixty Funds Trust (the “Trust”). The Trust was organized on May 29, 2015 as a Delaware statutory trust. The Trust is registered as an open-end management investment company under the Investment Company Act of 1940 (the “1940 Act”). Each Fund’s investment objective is long-term growth of capital. The Funds are non-diversified Funds. As non-diversified Funds, they may invest a significant portion of their assets in a small number of companies. The Funds’ investment adviser is Cognios Capital, LLC (the “Adviser”).
The Funds each have two classes of shares, Investor Class Shares and Institutional Class Shares. Each Fund’s Investor Class Shares and Institutional Class Shares commenced operations on October 3, 2016. Prior to that date, the only activity was the receipt of $100,000 on September 23, 2016 from principals of the Adviser as follows:
| Value Fund: | | Shares | | | Amount | |
| Investor Class Shares | | | 500 | | | $ | 5,000 | |
| Institutional Class Shares | | | 4,500 | | | | 45,000 | |
| Growth Fund: | | Shares | | | Amount | |
| Investor Class Shares | | | 500 | | | $ | 5,000 | |
| Institutional Class Shares | | | 4,500 | | | | 45,000 | |
Income and realized/unrealized gains or losses are allocated to each class of each Fund on the basis of the net asset value of each class in relation to the net asset value of its Fund.
The Funds accepted securities at fair value, pursuant to the Funds’ valuation procedures, from certain clients of the Adviser on October 3, 2016 and November 30, 2016 in exchange for the Funds’ shares, which were deemed to be tax-free transactions. For book purposes, the cost basis recorded was equal to the securities’ fair value as of the close of the New York Stock Exchange (“NYSE”). The net assets contributed and shares issued from the tax-free transactions were as follows:
| Fund | | | Date of Contribution | | | Net Assets | | | Share Issued | |
| Value Fund | | | November 30, 2016 | | | $ | 37,397,104 | | | | 3,655,631 | |
| Growth Fund | | | October 3, 2016 | | | | 1,485,622 | | | | 148,562 | |
The following is a summary of the significant accounting policies followed by the Funds in the preparation of their financial statements in accordance with accounting principles generally accepted in the United States of America (“GAAP”). The Funds are investment companies that follow the accounting and reporting guidance of FASB Accounting Standards Codification Topic 946 applicable to investment companies.
a) Security Valuation – All investments in securities are recorded at their estimated fair value, as described in note 2.
Cognios Funds
| Notes to the Financial Statements | June 30, 2017 |
b) Non-Diversified Funds – The Funds are non-diversified Funds. Non-diversified Funds may or may not have a diversified portfolio of investments at any given time, and may have large amounts of assets invested in a very small number of companies, industries or securities. Such lack of diversification substantially increases market risks and the risk of loss associated with an investment in the Funds, because the value of each security will have a greater impact on the Funds’ performance and the value of each shareholder’s investment. When the value of a security in a non-diversified fund falls, it may have a greater impact on the Funds than it would have in a diversified fund.
c) Federal Income Taxes – The Funds intend to qualify as regulated investment companies under Subchapter M of the Internal Revenue Code of 1986, as amended (the “Code”). It is the policy of the Funds to comply with the requirements of the Code applicable to regulated investment companies and to distribute substantially all of their net investment company taxable income and net capital gains. Therefore, no provision for federal income taxes is required. The Funds recognize tax benefits of certain tax positions only where the position is more-likely-than-not to be sustained assuming examination of tax authorities.
Management has analyzed each Fund’s tax positions and has concluded that as of and during the period from October 3, 2016 (commencement of operations) through June 30, 2017, the Funds did not have a liability for any unrecognized tax benefits. The Funds recognize interest and penalties, if any, related to unrecognized tax benefits as income tax expense in the statements of operations. During the period from October 3, 2016 (commencement of operations) through June 30, 2017, the Funds did not incur any interest or penalties. The Funds identify their major tax jurisdictions as U.S. Federal and Delaware state.
d) Cash and Cash Equivalents – Cash is held with a financial institution. The assets of the Funds may be placed in deposit accounts at U.S. banks and such deposits generally exceed Federal Deposit Insurance Corporation (“FDIC”) insurance limits. The FDIC insures deposit accounts up to $250,000 for each account holder. The counterparty is generally a single bank rather than a group of financial institutions; thus there may be a greater counterparty credit risk. The Funds place deposits only with those counterparties which are believed to be creditworthy.
e) Distributions to Shareholders – Dividends from net investment income and distributions of net realized capital gains, if any, will be declared and paid at least annually. Income and capital gain distributions, which are determined in accordance with income tax regulations, are recorded on the ex-dividend date. GAAP requires that permanent financial reporting differences relating to shareholder distributions be reclassified to paid-in capital or net realized gains. There were no reclassifications made during the period from October 3, 2016 (commencement of operations) through June 30, 2017.
f) Expenses – Expenses incurred by the Trust that do not relate to a specific fund of the Trust may be allocated equally across the funds, or to the individual funds based on each fund’s relative net assets or another basis (as determined by the Board), whichever method is deemed appropriate as stated in the Trust’s expense allocation policy. Expenses incurred specific to a particular fund are allocated entirely to that fund.
g) Use of Estimates – The preparation of financial statements in conformity with GAAP requires management to make estimates and assumptions that affect the reported amounts of assets and liabilities and disclosure of contingent assets and liabilities at the date of the financial statements and the reported amounts of revenues and expenses during the reporting period. Actual results could differ from those estimates.
| | Annual Report | June 30, 2017 | 29 | |
Cognios Funds
| Notes to the Financial Statements | June 30, 2017 |
h) Other – Investment and shareholder transactions are recorded on trade date. The Funds determine the gain or loss realized from the investment transactions by comparing the identified cost of the security lot sold with the net sales proceeds. Dividend income is recognized on the ex-dividend date or as soon as information is available to the Funds and interest income is recognized on an accrual basis. Withholding taxes on foreign dividends have been provided for in accordance with the Funds’ understanding of the applicable country’s tax rules and rates.
2. INVESTMENT VALUATIONS
Processes and Structure
The Funds’ Board of Trustees has adopted guidelines for valuing investments and other derivative instruments including in circumstances in which market quotes are not readily available, and has delegated authority to the Adviser to apply those guidelines in determining fair value prices, subject to review by the Board of Trustees.
Hierarchy of Fair Value Inputs
The Funds utilize various methods to measure the fair value of most of their investments on a recurring basis. GAAP establishes a hierarchy that prioritizes inputs to valuation techniques used to measure fair value. The three levels of inputs are as follows:
| ● | Level 1 – Unadjusted quoted prices in active markets for identical assets or liabilities that the Funds have the ability to access. |
| ● | Level 2 – Observable inputs other than quoted prices included in Level 1 that are observable for the asset or liability either directly or indirectly. These inputs may include quoted prices for the identical instrument on an inactive market, prices for similar instruments, interest rates, prepayment speeds, credit risk, yield curves, default rates, and similar data. |
| ● | Level 3 – Unobservable inputs for the asset or liability to the extent that relevant observable inputs are not available, representing the Funds’ own assumptions about the assumptions that a market participant would use in valuing the asset or liability, and that would be based on the best information available. |
The availability of observable inputs can vary from security to security and is affected by a wide variety of factors, including, for example, the type of security, whether the security is new and not yet established in the marketplace, the liquidity of markets, and other characteristics particular to the security. To the extent that valuation is based on models or inputs that are less observable or unobservable in the market, the determination of fair value requires more judgment. Accordingly, the degree of judgment exercised in determining fair value is greatest for instruments categorized in Level 3.
The inputs used to measure fair value may fall into different levels of the fair value hierarchy. In such cases, for disclosure purposes, the level in the fair value hierarchy within which the fair value measurement falls in its entirety is determined based on the lowest level input that is significant to the fair value measurement in its entirety.
Cognios Funds
| Notes to the Financial Statements | June 30, 2017 |
Fair Value Measurements
A description of the valuation techniques applied to the Funds’ major categories of assets and liabilities measured at fair value on a recurring basis follows.
Equity securities (common stock) – Securities traded on a national securities exchange (or reported on the NASDAQ national market) are stated at the last reported sales price on the day of valuation. To the extent these securities are actively traded, and valuation adjustments are not applied, they are categorized in Level 1 of the fair value hierarchy. Certain foreign securities may be fair valued using a pricing service that considers the correlation of the trading patterns of the foreign security to the intraday trading in the U.S. markets for investments such as American Depositary Receipts, financial futures, Exchange Traded Funds, and the movement of the certain indexes of securities based on a statistical analysis of the historical relationship and that are categorized in Level 2. Preferred stock and other equities traded on inactive markets or valued by reference to similar instruments are also categorized in Level 2.
Money market funds – Money market funds are valued at their net asset value of $1.00 per share and are categorized as Level 1.
The following table summarizes the inputs used to value the Funds’ assets and liabilities measured at fair value as of June 30, 2017:
| Categories (a) | | Level 1 | | | Level 2 | | | Level 3 | | | Total | |
| Value Fund: | | | | | | | | | | | | |
| Common Stock (b) | | $ | 39,850,335 | | | | — | | | | — | | | $ | 39,850,335 | |
| Total Investments | | $ | 39,850,335 | | | | — | | | | — | | | $ | 39,850,335 | |
| Growth Fund: | | | | | | | | | | | | | | | | |
| Common Stock (b) | | $ | 4,763,837 | | | | — | | | | — | | | $ | 4,763,837 | |
| Total Investments | | $ | 4,763,837 | | | | — | | | | — | | | $ | 4,763,837 | |
| (a) | As of and during the period from October 3, 2016 (commencement of operations) through June 30, 2017, the Funds held no securities that were considered to be “Level 3” securities (those valued using significant unobservable inputs). Therefore, a reconciliation of assets in which significant unobservable inputs (Level 3) were used in determining fair value is not applicable. |
| (b) | All common stock held in the Funds are Level 1 securities. For a detailed break-out of common stock by industry, please refer to the Schedules of Investments. |
The Funds recognize transfers, if any, between fair value hierarchy levels at the reporting period end. There were no transfers between levels during the period from October 3, 2016 (commencement of operations) through June 30, 2017.
| | Annual Report | June 30, 2017 | 31 | |
Cognios Funds
| Notes to the Financial Statements | June 30, 2017 |
3. CAPITAL SHARE TRANSACTIONS
Transactions in shares of capital stock for the Funds during the period from October 3, 2016 (commencement of operations) through June 30, 2017 were as follows:
| Value Fund: | | | Contributions
In-Kind | | | Sold | | | Redeemed | | | Reinvested* | | | Net Increase | |
| Investor Class Shares | | | | | | | | | | | | | | | | | | | | | |
| Shares | | | | — | | | | 560 | | | | — | | | | — | | | | 560 | |
| Value | | | $ | | | | $ | 6,000 | | | $ | — | | | $ | 1 | | | $ | 6,001 | |
| Institutional Class Shares | | | | | | | | | | | | | | | | | | | | | |
| Shares | | | | 3,655,631 | | | | 89,725 | | | | (4 | ) | | | 2,956 | | | | 3,748,308 | |
| Value | | | $ | 37,397,104 | | | $ | 919,847 | | | $ | (41 | ) | | $ | 30,777 | | | $ | 38,347,687 | |
| Growth Fund: | | | Contributions
In-Kind | | | Sold | | | Redeemed | | | Reinvested* | | | Net Increase | |
| Investor Class Shares | | | | | | | | | | | | | | | | | | | | | |
| Shares | | | | — | | | | 364 | | | | — | | | | — | | | | 364 | |
| Value | | | $ | — | | | $ | 4,000 | | | $ | — | | | $ | 4 | | | $ | 4,004 | |
| Institutional Class Shares | | | | | | | | | | | | | | | | | | | | | |
| Shares | | | | 148,562 | | | | 288,432 | | | | — | | | | 278 | | | | 437,272 | |
| Value | | | $ | 1,485,622 | | | $ | 2,992,289 | | | $ | — | | | $ | 2,885 | | | $ | 4,480,796 | |
| * | Dividend reinvestments were 0.108 shares for the Value Fund’s Investor Class Shares and 0.355 shares for the Growth Fund’s Investor Class Shares. |
4. INVESTMENT TRANSACTIONS
For the period from October 3, 2016 (commencement of operations) through June 30, 2017, aggregate purchases and sales of investment securities (excluding short-term investments) were as follows:
| Fund | | | Purchases | | | Sales | |
| Value Fund | | | $ | 8,227,204 | | | $ | 7,378,936 | |
| Growth Fund | | | | 13,377,641 | | | | 10,508,945 | |
There were no government securities purchased or sold during the period.
Cognios Funds
| Notes to the Financial Statements | June 30, 2017 |
5. ADVISORY FEES AND OTHER RELATED PARTY TRANSACTIONS
The Funds have entered into an Investment Advisory Agreement (the “Advisory Agreement”) with the Adviser. Pursuant to the Advisory Agreement, the Adviser manages the operations of the Funds and manages the Funds’ investments in accordance with the stated policies of the Funds. As compensation for the investment advisory services provided to the Funds, the Adviser receives a monthly management fee equal to an annual rate of each Fund’s net assets as follows:
| Fund | | | Management
Fee Rate | | | Management
Fees Accrued | |
| Value Fund | | | | 0.65 | % | | $ | 148,991 | |
| Growth Fund | | | | 0.70 | % | | | 19,042 | |
The Adviser and the Funds have entered into an Expense Limitation Agreement (“Expense Agreements”) under which the Adviser has agreed to waive or reduce its fees and to assume other expenses of each Fund, if necessary, in an amount that limits annual operating expenses (exclusive of interest, taxes, brokerage fees and commissions other expenditures that are capitalized in accordance with generally accepted accounting principles, acquired fund fees and expenses, shareholder servicing fees, extraordinary expenses, dividend and interest expenses in connection with securities sold short and payments, if any, under the Rule 12b-1 Plan) to not more than the following average daily net assets of each of the Funds through October 31, 2018:
| Fund | | | Expense
Limitation | | | Management
Fees Waived | | | Expenses
Reimbursed | |
| Value Fund | | | | 0.85 | % | | $ | 97,135 | | | $ | — | |
| Growth Fund | | | | 0.90 | % | | | 19,042 | | | | 42,820 | |
The current contractual agreement cannot be terminated prior to at least one year after the effective date of the Registration Statement without the Board of Trustees’ approval.
If, at any time, the annualized expenses of Funds are less than the annualized expense limitation ratios, the Funds would reimburse the Adviser for any fees previously waived and/or expenses previously assumed; provided, however, that repayment would be payable only to the extent that it (a) can be made during the three (3) years following the time at which the adviser waived fees or assumed expenses for the Funds, and (b) can be repaid without causing the expenses of Funds to exceed the annualized expense limitation ratios.
At June 30, 2017, the cumulative unreimbursed amounts paid and/or waived by the Adviser on behalf of the Funds that may be recouped no later than the dates stated below are as follows:
| Fund | | | June 30, 2020 | | | Totals | |
| Value Fund | | | $ | 97,135 | | | $ | 97,135 | |
| Growth Fund | | | | 61,862 | | | | 61,862 | |
| | Annual Report | June 30, 2017 | 33 | |
Cognios Funds
| Notes to the Financial Statements | June 30, 2017 |
The Funds have entered into an Investment Company Services Agreement (“Services Agreement”) with M3Sixty Administration, LLC (“M3Sixty”). Under the Services Agreement, M3Sixty is responsible for a wide variety of functions, including but not limited to: (a) Fund accounting services; (b) financial statement preparation; (c) valuation of the Funds’ portfolio investments; (d) pricing the Funds’ shares; (e) assistance in preparing tax returns; (f) preparation and filing of required regulatory reports; (g) communications with shareholders; (h) coordination of Board and shareholder meetings; (i) monitoring the Funds’ legal compliance; (j) maintaining shareholder account records; and, (k) Chief Compliance Officer services.
For the period from October 3, 2016 (commencement of operations) through June 30, 2017, the Funds accrued fees pursuant to the Services Agreement as follows:
| Fund | | | Services
Agreement
Fees Accrued | |
| Value Fund | | | $ | 70,830 | |
| Growth Fund | | | | 17,088 | |
Certain officers and an Interested Trustee of the Funds are also employees or officers of M3Sixty.
The Funds have entered into a Distribution Agreement with ALPS Distributors, Inc. (the “Distributor”). Pursuant to the Distribution Agreement, the Distributor will provide distribution services to the Funds. The Distributor serves as underwriter/distributor of the Funds.
The Funds have adopted a Distribution and Services Plan (the “Plan”) pursuant to Rule 12b-1 of the 1940 Act for its Investor Class shares. Under the Plan, the Funds may use 12b-1 fees to compensate broker-dealers (including, without limitation, the Distributor) for sales of the Funds’ shares, or for other expenses associated with distributing the Funds’ shares. The Funds may expend 0.25% for Investor Class shares of a Fund’s average daily net assets annually to pay for any activity primarily intended to result in the sale of shares of the Funds and the servicing of shareholder accounts, provided that the Trustees have approved the category of expenses for which payment is being made.
For the period from October 3, 2016 (commencement of operations) through June 30, 2017, the Funds accrued 12b-1 expenses attributable to Investor Class shares as follows:
| Fund | | | 12b-1
Fees Accrued | |
| Value Fund | | | $ | 12 | |
| Growth Fund | | | | 12 | |
6. ORGANIZATIONAL AND OFFERING EXPENSES
The Adviser has agreed to pay all expenses incurred related to the organization, offering and initial registration of the Funds. Such expenses are not subject to recoupment by the Adviser from the Funds.
Cognios Funds
| Notes to the Financial Statements | June 30, 2017 |
7. TAX MATTERS
For U.S. Federal income tax purposes, the cost of securities owned, gross appreciation, gross depreciation, and net unrealized appreciation/(depreciation) of investments at June 30, 2017 were as follows:
| Fund | | | Tax Cost | | | Gross Unrealized
Appreciation | | | Gross Unrealized
Depreciation | | | Net Unrealized
Appreciation | |
| Value Fund | | | $ | 35,473,702 | | | $ | 5,945,971 | | | $ | (1,569,338 | ) | | $ | 4,376,633 | |
| Growth Fund | | | | 4,592,880 | | | | 223,494 | | | | (52,537 | ) | | | 170,957 | |
The difference between book basis unrealized appreciation and tax-basis unrealized appreciation for the Funds is attributable primarily to the tax deferral of losses on wash sales and the tax treatment of the cost of securities received as in-kind subscriptions.
The Funds’ tax basis distributable earnings are determined only at the end of each fiscal year. As of June 30, 2017, the Funds’ most recent fiscal year end, the components of distributable earnings presented on an income tax basis were as follows:
| Fund | | | Undistributed Ordinary Income | | | Undistributed
Long-Term
Capital Gains | | | Net Unrealized
Appreciation | | | Total Distributable Earnings | |
| Value Fund | | | $ | 309,786 | | | $ | 540,524 | | | $ | 4,376,633 | | | $ | 5,226,943 | |
| Growth Fund | | | | 383,201 | | | | 3,241 | | | | 170,957 | | | | 557,399 | |
As of June 30, 2017, the Funds had no capital loss carryforwards for federal income tax purposes.
In accordance with GAAP, the Funds have recorded reclassifications in the capital accounts. These reclassifications have no impact on the net asset value of the Funds and are designed generally to present accumulated undistributed realized gains and paid-in capital on a tax basis which is considered to be more informative to the shareholder. The reclassifications listed below are as a result of differing book/tax treatment of capital gains from sales of securities received from in-kind subscriptions. As of June 30, 2017, the Fund recorded reclassifications to increase (decrease) the capital accounts as follows:
| Fund | | | Undistributed Net
Realized Gain | | | Paid-in Capital | |
| Value Fund | | | $ | 3,104,712 | | | $ | (3,104,712 | ) |
| Growth Fund | | | | 134,265 | | | | (134,265 | ) |
The tax character of distributions paid by the Funds during the period from October 3, 2016 (commencement of operations) through June 30, 2017, were as follows.
| Fund | | | Ordinary Income | |
| Value Fund | | | $ | 30,778 | |
| Growth Fund | | | | 2,888 | |
| | Annual Report | June 30, 2017 | 35 | |
Cognios Funds
| Notes to the Financial Statements | June 30, 2017 |
8. BENEFICIAL OWNERSHIP
The beneficial ownership, either directly or indirectly, of more than 25% of a fund’s voting securities creates a presumption of control of the fund, under Section 2(a)(9) of the Investment Company Act of 1940. As of June 30, 2017, the Value Fund and the Growth Fund had omnibus shareholder accounts which amounted to more than 25% of the total shares outstanding of the respective Fund. Shareholders with a controlling interest could affect the outcome of proxy voting or direction of management of the Funds.
9. COMMITMENTS AND CONTINGENCIES
In the normal course of business, the Trust may enter into contracts that may contain a variety of representations and warranties and provide general indemnifications. The Funds’ maximum exposure under these arrangements is dependent on future claims that may be made against the Funds and, therefore, cannot be estimated; however, management considers the risk of loss from such claims to be remote.
10. SUBSEQUENT EVENTS
Management has evaluated the impact of all subsequent events of the Funds through the date the financial statements were issued, and has determined that there were no subsequent events requiring recognition or disclosure in the financial statements.
11. NEW ACCOUNTING PRONOUNCEMENT
In October 2016, the U.S. Securities and Exchange Commission (“SEC”) issued a new rule, Investment Company Reporting Modernization, which, among other provisions, amends Regulation S-X to require standardized, enhanced disclosures, particularly related to derivatives, in investment company financial statements. The compliance date for the amendments to Regulation S-X is August 1, 2017. Management has evaluated the impact that the adoption of the amendments to Regulation S-X will have on the Funds’ financial statements and related disclosures. Any required changes will be implemented for interim and annual periods after August 1, 2017.
Cognios Funds
| Report of Independent Registered Public Accounting Firm | June 30, 2017 |
To the Shareholders of Cognios Large Cap Value Fund and Cognios Large Cap Growth Fund and Board of Trustees of M3Sixty Funds Trust
We have audited the accompanying statements of assets and liabilities, including the schedules of investments, of Cognios Large Cap Value Fund and Cognios Large Cap Growth Fund (the “Funds”), each a series of M3Sixty Funds Trust, as of June 30, 2017, and the related statements of operations and changes in net assets, and the financial highlights for the period October 3, 2016 (commencement of operations) through June 30, 2017. These financial statements and financial highlights are the responsibility of the Funds’ management. Our responsibility is to express an opinion on these financial statements and financial highlights based on our audit.
We conducted our audit in accordance with the standards of the Public Company Accounting Oversight Board (United States). Those standards require that we plan and perform the audit to obtain reasonable assurance about whether the financial statements and financial highlights are free of material misstatement. An audit includes examining, on a test basis, evidence supporting the amounts and disclosures in the financial statements. Our procedures included confirmation of securities owned as of June 30, 2017, by correspondence with the custodian and brokers. An audit also includes assessing the accounting principles used and significant estimates made by management, as well as evaluating the overall financial statement presentation. We believe that our audit provides a reasonable basis for our opinion.
In our opinion, the financial statements and financial highlights referred to above present fairly, in all material respects, the financial position of Cognios Large Cap Value Fund and Cognios Large Cap Growth Fund as of June 30, 2017, the results of their operations, the changes in their net assets, and the financial highlights for the period October 3, 2016 (commencement of operations) through June 30, 2017, in conformity with accounting principles generally accepted in the United States of America.
COHEN & COMPANY, LTD.
Cleveland, Ohio
August 29, 2017
| | Annual Report | June 30, 2017 | 37 | |
Cognios Funds
| Additional Information | June 30, 2017 (Unaudited) |
1. PROXY VOTING POLICIES AND VOTING RECORD
A description of the policies and procedures that the Funds use to determine how to vote proxies relating to portfolio securities is available without charge, upon request, by calling 1-888-553-4233; and on the Commission’s website at http://www.sec.gov.
Information regarding how the Funds voted proxies relating to portfolio securities during the most recent period ended June 30 is available without charge, upon request, by calling 1-888-553-4233; and on the Commission’s website at http://www.sec.gov.
2. PORTFOLIO HOLDINGS
The Funds file their complete schedules of portfolio holdings with the Securities and Exchange Commission (the “Commission”) for the first and third quarters of each fiscal year on Form N-Q. The Funds’ Forms N-Q will be available on the Commission’s website at http://www.sec.gov. The Funds’ Forms N-Q may be reviewed and copied at the Commission’s Public Reference Room in Washington, DC. Information on the operation of the Commission’s Public Reference Room may be obtained by calling 1-800-SEC-0330.
3. SHAREHOLDER TAX INFORMATION
The tax character of distributions paid by the Funds during the period from October 3, 2016 (commencement of operations) through June 30, 2017, were as follows.
| Fund | | | Ordinary Income | |
| Value Fund | | | $ | 30,778 | |
| Growth Fund | | | | 2,888 | |
Complete information will be computed and reported in conjunction with your 2017 Form 1099-DIV.
Shareholders should refer to their Form 1099-DIV or other tax information which will be mailed in 2018 to determine the calendar year amounts to be included on their 2017 tax returns. Shareholders should consult their own tax advisors.
Cognios Funds
| Trustees and Officers | June 30, 2017 (Unaudited) |
The Trustees are responsible for the management and supervision of the Funds. The Trustees approve all significant agreements between the Trust, on behalf of the Funds, and those companies that furnish services to the Funds; review performance of the Funds; and oversee activities of the Funds. The Statement of Additional Information of the Trust includes additional information about the Funds’ Trustees and is available upon request, without charge, by calling 888-553-4233.
Following are the Trustees and Officers of the Trust, their year of birth and address, their present position with the Trust, and their principal occupation during the past five years. As described above under “Description of the Trust”, each of the Trustees of the Trust will generally hold office indefinitely. The Officers of the Trust will hold office indefinitely, except that: (1) any Officer may resign or retire and (2) any Officer may be removed any time by written instrument signed by at least two-thirds of the number of Trustees prior to such removal. In case a vacancy or an anticipated vacancy on the Board of Trustees shall for any reason exist, the vacancy shall be filled by the affirmative vote of a majority of the remaining Trustees, subject to certain restrictions under the 1940 Act. Those Trustees who are “interested persons” (as defined in the 1940 Act) by virtue of their affiliation with either the Trust or the Adviser, are indicated in the table. The address of each trustee and officer is 4520 Main Street, Suite 1425, Kansas City, Missouri 64111.
Name
and Year
of Birth | | Position(s)
Held with
Trust | | Length of
Service | | Principal Occupation(s)
During Past 5 Years | | Number
of Series
Overseen | | Other Directorships
During Past 5 Years |
| INDEPENDENT TRUSTEES | | | | | | |
Kelley J.
Brennan
- 1942 | | Trustee | | Since 2015 | | Retired; Partner, PricewaterhouseCoopers LLP (an accounting firm) (1981–2002). | | Three | | PNC Funds
(30 Portfolios) PNC Advantage Fund
(3 Portfolios) PNC Alternative
Strategies Fund LLC
(1 Portfolio) |
Steven D.
Poppen
- 1968 | | Trustee | | Since 2015 | | Executive Vice President and Chief Financial Officer, Minnesota Vikings (professional sports organization) (1998–present). | | Three | | None |
Tobias
Caldwell
- 1967 | | Trustee | | Since 2016 | | Managing member, Bear Properties, LLC (2006–present) (real estate firm); Managing member, PTL Real Estate, LLC (2000–present) (real estate/investment firm); Managing member, Genovese Family Enterprises, LLC (1999–present) (family office). | | Three | | Strategy Shares (2016 to present) (4 funds); Mutual Fund & Variable Insurance Trust (2010-present) (9 funds); Mutual Fund Series Trust, comprised of 40 funds (2006-present) |
| | Annual Report | June 30, 2017 | 39 | |
Cognios Funds
| Trustees and Officers | June 30, 2017 (Unaudited) |
Name
and Year
of Birth | | Position(s)
Held with
Trust | | Length of
Service | | Principal Occupation(s)
During Past 5 Years | | Number
of Series
Overseen | | Other Directorships
During Past 5 Years |
| INTERESTED TRUSTEE* | | | | | | | | |
Randall K.
Linscott
- 1971 | | Trustee and President | | Since 2015 | | Chief Executive Officer, M3Sixty Administration, LLC (2013–present); President, 360 Funds (2013–present); Managing Member, M3Sixty Holdings, LLC, (2013–present); Chief Operating Officer, M3Sixty Administration LLC (2011–2013); Division Vice President, Boston Financial Data Services, (2005–2011). | | Three | | 360 Funds (7 portfolios) |
| * | The Interested Trustee is an Interested Trustee because he is an officer and employee of the Administrator. |
Name
and Year
of Birth | | Position(s)
Held with
Trust | | Length of
Service | | Principal Occupation(s)
During Past 5 Years | | Number
of Series
Overseen | | Other
Directorships
During Past
5 Years |
| OFFICERS |
András P.
Teleki
- 1971 | | Chief Compliance Officer and Secretary | | Since 2016 | | Chief Legal Officer, M3Sixty Administration, LLC, M3Sixty Holdings, LLC, M3Sixty Distributors, LLC, M3Sixty Advisors, LLC and Matrix Capital Group, Inc. (2015–present); Chief Compliance Officer and Secretary, 360 Funds (2015–present); Chief Compliance Officer and Secretary, WP Trust (2015 to present); Secretary, Monteagle Funds (2015–2016); Secretary and Assistant Treasurer, Capital Management Investment Trust (2015–2016); Partner, K&L Gates, (2009–2015). | | N/A | | N/A |
Cognios Funds
| Trustees and Officers | June 30, 2017 (Unaudited) |
Name
and Year
of Birth | | Position(s)
Held with
Trust | | Length of
Service | | Principal Occupation(s)
During Past 5 Years | | Number
of Series
Overseen | | Other
Directorships
During Past
5 Years |
Larnell D.
Smith
- 1980 | | Treasurer | | Since July 2017 | | Director of Fund Accounting, M3Sixty Administration, LLC (2017–present); Assistant Vice President, State Street Bank (2013–2017); Officer, State Street Bank (2010–2013). | | N/A | | N/A |
Larry E.
Beaver, Jr.
- 1969 | | Assistant Treasurer | | Since July 2017 | | Fund Accounting, Administration and Tax Officer, M3Sixty Administration, LLC (2017–present); Director of Fund Accounting & Administration, M3Sixty Administration, LLC (2005–2017); Assistant Treasurer, WP Trust (2016–present); Treasurer, Monteagle Funds (2013–2016); Assistant Treasurer, Capital Management Investment Trust (2013-present); Assistant Treasurer, 360 Funds (2005–2017); Chief Accounting Officer, Amidex Funds, Inc. (2003–present). | | N/A | | N/A |
Brandon J.
Byrd
- 1981 | | Assistant Secretary and AML Officer | | Since 2016 | | Chief Operating Officer, M3Sixty Administration LLC (2012–present); Chief Operations Officer, Matrix Capital Group, Inc. (2015–present); Chief Executive Officer, Matrix 360 Distributors, LLC (2017–present); Assistant Secretary and Assistant Treasurer, WP Trust (2016–present); Assistant Secretary and AML Compliance Officer, 360 Funds (2013–present); Assistant Secretary and AML Compliance Officer, Monteagle Funds (2013–2016); Assistant Secretary and AML Compliance Officer, Division Manager – Client Service Officer, Boston Financial Data Services (mutual fund service provider) (2010–2012). | | N/A | | N/A |
John H.
Lively
- 1969 | | Assistant Secretary | | Since July 2017 | | Attorney, The Law Offices of John H. Lively & Associates, Inc. (law firm), March 2010 to present. | | N/A | | N/A |
| | Annual Report | June 30, 2017 | 41 | |
Cognios Funds
| Trustees and Officers | June 30, 2017 (Unaudited) |
Officers of the Trust and Trustees who are “interested persons” of the Trust or the Adviser will receive no salary or fees from the Trust. Officers of the Trust and interested Trustees do receive compensation directly from certain service providers to the Trust. Each Trustee who is not an “interested person” receives a fee of $1,500 per Fund each year plus $200 per Fund per Board or committee meeting attended. The Trust reimburses each Trustee and officer for his or her travel and other expenses relating to attendance at such meetings.
Name of Trustee1 | | Aggregate
Compensation
From each
Fund2 | | Pension or
Retirement Benefits Accrued As Part of Portfolio Expenses | | Estimated
Annual
Benefits Upon
Retirement | | Total
Compensation
From the Funds
Paid to Trustees2 |
| Independent Trustees |
| Kelley Brennan | | $1,725 | | None | | None | | $3,450 |
| Steve Poppen | | 1,725 | | None | | None | | 3,450 |
| Tobias Caldwell | | 1,725 | | None | | None | | 3,450 |
| Interested Trustees and Officers |
| Randall K. Linscott | | None | | Not Applicable | | Not Applicable | | None |
| 1 | Each of the Trustees serves as a Trustee to each Series of the Trust. The Trust currently offers three (3) series of shares. |
| 2 | Figures are for the period from October 3, 2016 (commencement of operations) through June 30, 2017. |
M3SIXTY FUNDS TRUST
4300 Shawnee Mission Pkwy
Suite 100
Fairway, KS 66205
INVESTMENT ADVISER
Cognios Capital, LLC
11250 Tomahawk Creek Parkway
Leawood, KS 66211
ADMINISTRATOR & TRANSFER AGENT
M3Sixty Administration, LLC
4300 Shawnee Mission Pkwy
Suite 100
Fairway, KS 66205
DISTRIBUTOR
ALPS Distributors, Inc.
1290 Broadway
Suite 1100
Denver, CO 80203
INDEPENDENT REGISTERED PUBLIC ACCOUNTING FIRM
Cohen & Company, Ltd.
1350 Euclid Ave., Suite 800
Cleveland, OH 44115
LEGAL COUNSEL
John H. Lively
The Law Offices of John H. Lively & Associates, Inc.
A member firm of The 1940 Act Law GroupTM
11300 Tomahawk Creek Parkway, Suite 310
Leawood, KS 66211
CUSTODIAN BANK
MUFG Union Bank®, N.A.
350 California Street
20th Floor
San Francisco, CA 94104

| (a) | The registrant has, as of the end of the period covered by this report, adopted a code of ethics that applies to the registrant's principal executive officer, principal financial officer, and principal accounting officer or controller, or persons performing similar functions, regardless of whether these individuals are employed by the registrant or a third party. |
| (b) | During the period covered by this report, there were no amendments to any provision of the code of ethics. |
| (c) | During the period covered by this report, there were no waivers or implicit waivers of a provision of the code of ethics. |
| (d) | The registrant’s Code of Ethics is filed herewith. |
| ITEM 3. | AUDIT COMMITTEE FINANCIAL EXPERT. |
| | The Registrant's Board of Trustees has determined that Kelley J. Brennan serves on its audit committee as the "audit committee financial expert" as defined in Item 3. |
| ITEM 4. | PRINCIPAL ACCOUNTANT FEES AND SERVICES. |
(a) | Audit Fees. The aggregate fees billed for professional services rendered by the principal accountant for the audit of the registrant’s annual financial statements or for services that are normally provided by the accountant in connection with statutory and regulatory filings or engagements were $22,000 with respect to the registrant’s fiscal year ended June 30, 2017, the first fiscal year of operations for the Cognios Large Cap Value Fund and the Cognios Large Cap Growth Fund. |
| | |
| (b) | Audit-Related Fees. There were no fees billed during the fiscal year for assurances and related services by the principal accountant that are reasonably related to the performance of the audit of the registrant’s financial statements and are not reported under paragraph (a) of this item. |
| | |
| (c) | Tax Fees. The aggregate fees billed in the last fiscal year for professional services rendered by the principal accountant for tax compliance, tax advice and tax planning were $5,000 with respect to the registrant’s fiscal year ended June 30, 2017, the first fiscal year of operations for the Cognios Large Cap Value Fund and the Cognios Large Cap Growth Fund. The services comprising these fees are the preparation of the registrant’s federal income and excise tax returns. |
| | |
| (d) | All Other Fees. The aggregate fees billed in last fiscal year for products and services provided by the registrant’s principal accountant, other than the services reported in paragraphs (a) through (c) of this item were $1,950 for the fiscal year ended June 30, 2017, the first fiscal year of operations for the Cognios Large Cap Value Fund and the Cognios Large Cap Growth Fund. The fees were for the review of the semi-annual report. |
| (e)(1) | The audit committee does not have pre-approval policies and procedures. Instead, the audit committee or audit committee chairman approves on a case-by-case basis each audit or non-audit service before the principal accountant is engaged by the registrant. |
| (e)(2) | There were no services described in each of paragraphs (b) through (d) of this Item that were approved by the audit committee pursuant to paragraph (c)(7)(i)(C) of Rule 2-01 of Regulation S-X. |
| (f) | Not applicable. The percentage of hours expended on the principal accountant's engagement to audit the registrant's financial statements for the most recent fiscal year that were attributed to work performed by persons other than the principal accountant's full-time, permanent employees was zero percent (0%). |
| (g) | All non-audit fees billed by the registrant's principal accountant for services rendered to the registrant for the for the fiscal year ended June 30, 2017, the first fiscal year of operations for the Cognios Large Cap Value Fund and the Cognios Large Cap Growth Fund, are disclosed in (b)-(d) above. There were no audit or non-audit services performed by the registrant's principal accountant for the registrant's adviser. |
| (h) | There were no non-audit services rendered to the registrant’s investment adviser. |
| ITEM 5. | AUDIT COMMITTEE OF LISTED REGISTRANTS. |
Not applicable.
| ITEM 6. | SCHEDULES OF INVESTMENTS |
Included in annual report to shareholders filed under item 1 of this form.
| ITEM 7. | DISCLOSURE OF PROXY VOTING POLICIES AND PROCEDURES FOR CLOSED-END MANAGEMENT INVESTMENT COMPANIES. |
Not applicable Fund is an open-end management investment company.
| ITEM 8. | PORTFOLIO MANAGERS OF CLOSED-END MANAGEMENT INVESTMENT COMPANIES |
Not applicable Fund is an open-end management investment company.
| ITEM 9. | PURCHASES OF EQUITY SECURITIES BY CLOSED-END MANAGEMENT INVESTMENT COMPANY AND AFFILIATED PURCHASERS. |
Not applicable Fund is an open-end management investment company.
| ITEM 10. | SUBMISSION OF MATTERS TO A VOTE OF SECURITY HOLDERS. |
Not applicable at this time.
| ITEM 11. | CONTROLS AND PROCEDURES. |
(a)
The registrant's principal executive and principal financial officers, or persons performing similar functions, have concluded that the registrant's disclosure controls and procedures (as defined in Rule 30a-3(c) under the 1940 Act, are effective, as of a date within 90 days of the filing date of this report, based on the evaluation of these controls and procedures required by Rule 30a-3(b) under the 1940 Act and Rule 15d-15(b) under the Securities Exchange Act of 1934, as amended.
(b)
There were no changes in the registrant's internal control over financial reporting (as defined in Rule 30a-3(d) under the 1940 Act) that occurred during the period covered by this report that have materially affected, or are reasonably likely to materially affect, the registrant's internal control over financial reporting.
SIGNATURES
Pursuant to the requirements of the Securities Exchange Act of 1934 and the Investment Company Act of 1940, the registrant has duly caused this report to be signed on its behalf by the undersigned, thereunto duly authorized.
M3Sixty Funds Trust
| By: Randy Linscott | /s/ Randy Linscott | |
| Principal Executive Officer | | |
| Date: September 7, 2017 | | |
Pursuant to the requirements of the Securities Exchange Act of 1934 and the Investment Company Act of 1940, this report has been signed below by the following person on behalf of the registrant and in the capacities and on the date indicated.
| By: Larnell D. Smith | /s/ Larnell D. Smith | |
| Principal Financial Officer | | |
| Date: September 7, 2017 | | |