Wells Fargo Commercial Mortgage Trust 2015-NXS2
Filed: 22 Jun 15, 12:00am
| FREE WRITING PROSPECTUS | ||
| FILED PURSUANT TO RULE 433 | ||
| REGISTRATION FILE NO.: 333-195164-10 | ||

Free Writing Prospectus
Structural and Collateral Term Sheet
$914,361,541
(Approximate Aggregate Cut-off Date Balance of Mortgage Pool)
$841,212,000
(Approximate Aggregate Principal Balance of Offered Certificates)
Wells Fargo Commercial Mortgage Trust 2015-NXS2
as Issuing Entity
Wells Fargo Commercial Mortgage Securities, Inc.
as Depositor
Natixis Real Estate Capital LLC
Wells Fargo Bank, National Association
Silverpeak Real Estate Finance LLC
as Sponsors and Mortgage Loan Sellers
Commercial Mortgage Pass-Through Certificates
Series 2015-NXS2
June 22, 2015
| WELLS FARGO SECURITIES | ||||
| Lead Manager and Sole Bookrunner | ||||
| Drexel Hamilton Co-Manager | Natixis Securities Americas LLC Co-Manager | |||
STATEMENT REGARDING THIS FREE WRITING PROSPECTUS
The depositor has filed a registration statement (including a prospectus) with the Securities and Exchange Commission (‘‘SEC’’) (SEC File No. 333-195164) for the offering to which this communication relates. Before you invest, you should read the prospectus in the registration statement and other documents the depositor has filed with the SEC for more complete information about the depositor, the issuing entity and this offering. You may get these documents for free by visiting EDGAR on the SEC Web site at www.sec.gov. Alternatively, the depositor, any underwriter, or any dealer participating in the offering will arrange to send you the prospectus after filing if you request it by calling toll free 1-800-745-2063 (8 a.m. – 5 p.m. EST) or by emailing wfs.cmbs@wellsfargo.com.
Nothing in this document constitutes an offer of securities for sale in any jurisdiction where the offer or sale is not permitted. The information contained herein is preliminary as of the date hereof, supersedes any such information previously delivered to you and will be superseded by any such information subsequently delivered and ultimately by the final prospectus relating to the securities. These materials are subject to change, completion, supplement or amendment from time to time.
This free writing prospectus has been prepared by the Underwriters for information purposes only and does not constitute, in whole or in part, a prospectus for the purposes of Directive 2003/71/EC (as amended) and/or Part VI of the Financial Services and Markets Act 2000 as amended or other offering document.
STATEMENT REGARDING ASSUMPTIONS AS TO SECURITIES, PRICING ESTIMATES AND OTHER INFORMATION
The attached information contains certain tables and other statistical analyses (the “Computational Materials”) which have been prepared in reliance upon information furnished by the Mortgage Loan Sellers. Numerous assumptions were used in preparing the Computational Materials, which may or may not be reflected herein. As such, no assurance can be given as to the Computational Materials’ accuracy, appropriateness or completeness in any particular context; or as to whether the Computational Materials and/or the assumptions upon which they are based reflect present market conditions or future market performance. The Computational Materials should not be construed as either projections or predictions or as legal, tax, financial or accounting advice. You should consult your own counsel, accountant and other advisors as to the legal, tax, business, financial and related aspects of a purchase of these securities. Any weighted average lives, yields and principal payment periods shown in the Computational Materials are based on prepayment and/or loss assumptions, and changes in such prepayment and/or loss assumptions may dramatically affect such weighted average lives, yields and principal payment periods. In addition, it is possible that prepayments or losses on the underlying assets will occur at rates higher or lower than the rates shown in the attached Computational Materials. The specific characteristics of the securities may differ from those shown in the Computational Materials due to differences between the final underlying assets and the preliminary underlying assets used in preparing the Computational Materials. The principal amount and designation of any security described in the Computational Materials are subject to change prior to issuance. None of Wells Fargo Securities, LLC, Drexel Hamilton, LLC or Natixis Securities Americas LLC, or any of their respective affiliates, make any representation or warranty as to the actual rate or timing of payments or losses on any of the underlying assets or the payments or yield on the securities. The information in this presentation is based upon management forecasts and reflects prevailing conditions and management’s views as of this date, all of which are subject to change. In preparing this presentation, we have relied upon and assumed, without independent verification, the accuracy and completeness of all information available from public sources or which was provided to us by or on behalf of the Mortgage Loan Sellers or which was otherwise reviewed by us.
This free writing prospectus contains certain forward-looking statements. If and when included in this free writing prospectus, the words “expects”, “intends”, “anticipates”, “estimates” and analogous expressions and all statements that are not historical facts, including statements about our beliefs or expectations, are intended to identify forward-looking statements. Any forward-looking statements are made subject to risks and uncertainties which could cause actual results to differ materially from those stated. Those risks and uncertainties include, among other things, declines in general economic and business conditions, increased competition, changes in demographics, changes in political and social conditions, regulatory initiatives and changes in customer preferences, many of which are beyond our control and the control of any other person or entity related to this offering. The forward-looking statements made in this free writing prospectus are made as of the date stated on the cover. We have no obligation to update or revise any forward-looking statement.
Wells Fargo Securities is the trade name for the capital markets and investment banking services of Wells Fargo & Company and its subsidiaries, including but not limited to Wells Fargo Securities, LLC, a member of NYSE, FINRA, NFA and SIPC, Wells Fargo Prime Services, LLC, a member of FINRA, NFA and SIPC, and Wells Fargo Bank, N.A. Wells Fargo Securities, LLC and Wells Fargo Prime Services, LLC are distinct entities from affiliated banks and thrifts.
IMPORTANT NOTICE REGARDING THE OFFERED CERTIFICATES
The Offered Certificates referred to in these materials and the asset pool backing them are subject to modification or revision (including the possibility that one or more classes of certificates may be split, combined or eliminated at any time prior to issuance or availability of a final prospectus) and are offered on a “when, as and if issued” basis. Prospective investors should understand that, when considering the purchase of the Offered Certificates, a contract of sale will come into being no sooner than the date on which the relevant class of certificates has been priced and the underwriters have confirmed the allocation of certificates to be made to investors; any “indications of interest” expressed by any prospective investor, and any “soft circles” generated by the underwriters, will not create binding contractual obligations for such prospective investors, on the one hand, or the underwriters, the depositor or any of their respective agents or affiliates, on the other hand.
As a result of the foregoing, a prospective investor may commit to purchase certificates that have characteristics that may change, and each prospective investor is advised that all or a portion of the certificates referred to in these materials may be issued without all or certain of the characteristics described in these materials. The underwriters’ obligation to sell certificates to any prospective investor is conditioned on the certificates and the transaction having the characteristics described in these materials. If the underwriters determine that a condition is not satisfied in any material respect, such prospective investor will be notified, and neither the depositor nor the underwriters will have any obligation to such prospective investor to deliver any portion of the Offered Certificates which such prospective investor has committed to purchase, and there will be no liability between the underwriters, the depositor or any of their respective agents or affiliates, on the one hand, and such prospective investor, on the other hand, as a consequence of the non-delivery.
Each prospective investor has requested that the underwriters provide to such prospective investor information in connection with such prospective investor’s consideration of the purchase of the certificates described in these materials. These materials are being provided to each prospective investor for informative purposes only in response to such prospective investor’s specific request. The underwriters described in these materials may from time to time perform investment banking services for, or solicit investment banking business from, any company named in these materials. The underwriters and/or their affiliates or respective employees may from time to time have a long or short position in any security or contract discussed in these materials.
The information contained herein supersedes any previous such information delivered to any prospective investor and will be superseded by information delivered to such prospective investor prior to the time of sale.
IMPORTANT NOTICE RELATING TO AUTOMATICALLY-GENERATED EMAIL DISCLAIMERS
Any legends, disclaimers or other notices that may appear at the bottom of any email communication to which this free writing prospectus is attached relating to (1) these materials not constituting an offer (or a solicitation of an offer), (2) no representation that these materials are accurate or complete and may not be updated or (3) these materials possibly being confidential, are not applicable to these materials and should be disregarded. Such legends, disclaimers or other notices have been automatically generated as a result of these materials having been sent via Bloomberg or another system.
THE INFORMATION IN THIS STRUCTURAL AND COLLATERAL TERM SHEET IS NOT COMPLETE AND MAY BE AMENDED PRIOR TO THE TIME OF SALE. THIS TERM SHEET IS NOT AN OFFER TO SELL THESE SECURITIES AND IT IS NOT A SOLICITATION OF AN OFFER TO BUY THESE SECURITIES IN ANY JURISDICTION WHERE THE OFFER OR SALE IS NOT PERMITTED.
| 2 |
| Wells Fargo Commercial Mortgage Trust 2015-NXS2 | Certificate Structure |
I Certificate Structure
| Class | Expected Ratings (DBRS/KBRA/Moody’s)(1) | Approximate Initial Certificate Principal Balance or Notional Amount(2) | Approx. | Pass-Through Rate Description | Weighted Average Life (Years)(4) | Expected Principal Window(4) | Certificate Principal to Value Ratio(5) | Certificate Principal U/W NOI Debt Yield(6) | ||||||||||
| Offered Certificates | ||||||||||||||||||
| A-1 | AAA(sf)/AAA(sf)/Aaa(sf) | $27,412,000 | 30.000% | (7) | 2.44 | 08/15 – 10/19 | 46.5% | 13.6% | ||||||||||
| A-2 | AAA(sf)/AAA(sf)/Aaa(sf) | $161,100,000 | 30.000% | (7) | 4.34 | 10/19 – 03/20 | 46.5% | 13.6% | ||||||||||
| A-3 | AAA(sf)/AAA(sf)/Aaa(sf) | $7,800,000 | 30.000% | (7) | 6.84 | 05/22 – 05/22 | 46.5% | 13.6% | ||||||||||
| A-4 | AAA(sf)/AAA(sf)/Aaa(sf) | $150,000,000 | 30.000% | (7) | 9.63 | 01/25 – 04/25 | 46.5% | 13.6% | ||||||||||
| A-5 | AAA(sf)/AAA(sf)/Aaa(sf) | $240,335,000(8) | 30.000% | (7) | 9.89 | 04/25 – 06/25 | 46.5% | 13.6% | ||||||||||
| A-SB | AAA(sf)/AAA(sf)/Aaa(sf) | $53,406,000 | 30.000% | (7) | 7.17 | 03/20 – 01/25 | 46.5% | 13.6% | ||||||||||
| A-S(9) | AAA(sf)/AAA(sf)/Aa2(sf) | $51,432,000 | 24.375% | (7) | 9.92 | 06/25 – 06/25 | 50.2% | 12.6% | ||||||||||
| X-A | AAA(sf)/AAA(sf)/NR | $691,485,000(10) | N/A | Variable(11) | N/A | N/A | N/A | N/A | ||||||||||
| X-B | AAA(sf)/AAA(sf)/NR | $109,724,000(12) | N/A | Variable(13) | N/A | N/A | N/A | N/A | ||||||||||
| B(9) | AA(low)(sf)/AA-(sf)/NR | $73,149,000 | 16.375% | (7) | 9.95 | 06/25 – 07/25 | 55.5% | 11.4% | ||||||||||
| C(9) | A(low)(sf)/A-(sf)/NR | $36,575,000 | 12.375% | (7) | 10.00 | 07/25 – 07/25 | 58.2% | 10.9% | ||||||||||
| PEX(9) | A(low)(sf)/A-(sf)/NR | $161,156,000 | 12.375% | (7) | 9.95 | 06/25 – 07/25 | 58.2% | 10.9% | ||||||||||
| D | BBB(low)(sf)/BBB-(sf)/NR | $40,003,000 | 8.000% | (7) | 10.00 | 07/25 – 07/25 | 61.1% | 10.3% | ||||||||||
Non-Offered Certificates | ||||||||||||||||||
| X-E | AAA(sf)/BB-(sf)/NR | $25,145,000(14) | N/A | Variable(15) | N/A | N/A | N/A | N/A | ||||||||||
| X-F | AAA(sf)/B-(sf)/NR | $18,287,000(16) | N/A | Variable(17) | N/A | N/A | N/A | N/A | ||||||||||
| X-G | AAA(sf)/NR/NR | $29,717,540(18) | N/A | Variable(19) | N/A | N/A | N/A | N/A | ||||||||||
| A-5FL | AAA(sf)/AAA(sf)/Aaa(sf)(20) | $240,335,000(21)(22) | 30.000% | LIBOR plus [ ](23) | 9.89 | 04/25 – 06/25 | 46.5% | 13.6% | ||||||||||
| A-5FX | AAA(sf)/AAA(sf)/Aaa(sf)(20) | $0(21)(22) | 30.000% | (7) | 9.89 | 04/25 – 06/25 | 46.5% | 13.6% | ||||||||||
| E | BB(low)(sf)/BB-(sf)/NR | $25,145,000 | 5.250% | (7) | 10.00 | 07/25 – 07/25 | 62.9% | 10.0% | ||||||||||
| F | B(low)(sf)/B-(sf)/NR | $18,287,000 | 3.250% | (7) | 10.00 | 07/25 – 07/25 | 64.2% | 9.8% | ||||||||||
| G | NR/NR/NR | $29,717,540 | 0.000% | (7) | 10.00 | 07/25 – 07/25 | 66.4% | 9.5% | ||||||||||
| Notes: | |
| (1) | The expected ratings presented are those of DBRS, Inc. (“DBRS”), Kroll Bond Rating Agency, Inc. (“KBRA”) and Moody’s Investors Service, Inc. (“Moody’s”) which the depositor hired to rate the offered certificates. One or more other nationally recognized statistical rating organizations that were not hired by the depositor may use information they receive pursuant to Rule 17g-5 under the Securities Exchange Act of 1934, as amended (the “Exchange Act”) or otherwise, to rate or provide market reports and/or published commentary related to the offered certificates. We cannot assure you as to what ratings a non-hired nationally recognized statistical rating organization would assign or that its reports will not express differing, possibly negative, views of the mortgage loans and/or the offered certificates. The ratings of each class of offered certificates address the likelihood of the timely distribution of interest and, except in the case of the Class X-A and Class X-B certificates, the ultimate distribution of principal due on those classes on or before the Rated Final Distribution Date. See “Risk Factors—Risks Related to the Offered Certificates—Ratings of the Certificates Have Substantial Limitations” and “Ratings” in the free writing prospectus, dated June 22, 2015 (the “Free Writing Prospectus”). DBRS, KBRA and Moody’s have informed us that the “sf” designation in their ratings represents an identifier for structured finance product ratings. |
| (2) | The principal balances and notional amounts set forth in the table are approximate. The actual initial principal balances and notional amounts may be larger or smaller depending on the aggregate cut-off date principal balance of the mortgage loans definitively included in the pool of mortgage loans, which aggregate cut-off date principal balance may be as much as 5% larger or smaller than the amount presented in the Free Writing Prospectus. |
| (3) | The approximate initial credit support with respect to the Class A-1, A-2, A-3, A-4, A-5, A-5FL, A-5FX and A-SB Certificates represents the approximate credit enhancement for the Class A-1, A-2, A-3, A-4, A-5, A-5FL, A-5FX and A-SB Certificates in the aggregate. The percentage indicated under the column “Approx. Initial Credit Support” with respect to the Class C Certificates and the Class PEX Certificates represents the approximate credit support for the Class C regular interest. |
| (4) | Weighted Average Lives and Expected Principal Windows are calculated based on an assumed prepayment rate of 0% CPR and the “Structuring Assumptions” described on Annex B to the Free Writing Prospectus. |
| (5) | The Certificate Principal to Value Ratio for each Class of Certificates (other than the Class A-1, A-2, A-3, A-4, A-5, A-5FL, A-5FX, A-SB and PEX Certificates) is calculated as the product of (a) the weighted average Cut-off Date LTV Ratio for the mortgage loans and (b) a fraction, the numerator of which is the total initial Certificate Balance of such Class of Certificates and all Classes of Principal Balance Certificates (other than the Class PEX Certificates) senior to such Class of Certificates and the denominator of which is the total initial Certificate Balance of all of the Principal Balance Certificates (other than the Class PEX Certificates). The Certificate Principal to Value Ratios for each of the Class A-1, A-2, A-3, A-4, A-5, A-5FL, A-5FX and A-SB Certificates are calculated in the aggregate for those Classes as if they were a single Class and is calculated as the product of (a) the weighted average Cut-off Date LTV Ratio for the mortgage loans and (b) a fraction, the numerator of which is the total initial aggregate Certificate Balances of such Classes of Certificates and the denominator of which is the total initial Certificate Balance of all of the Principal Balance Certificates (other than the Class PEX Certificates). The Certificate Principal to Value Ratio of the Class PEX Certificates is equal to the Certificate Principal to Value Ratio of the Class C Certificates. In any event, however, excess mortgaged property value associated with a mortgage loan will not be available to offset losses on any other mortgage loan. |
| (6) | The Certificate Principal U/W NOI Debt Yield for each Class of Certificates (other than the Class A-1, A-2, A-3, A-4, A-5, A-5FL, A-5FX, A-SB and PEX Certificates) is calculated as the product of (a) the weighted average U/W NOI Debt Yield for the mortgage loans and (b) a fraction, the numerator of which is the total initial Certificate Balance of all of the Classes of Principal Balance Certificates (other than the Class PEX Certificates) and the denominator of which is the total initial Certificate Balance for such Class of Certificates and all Classes of Principal Balance Certificates (other than the Class PEX Certificates) senior to such Class of Certificates. The Certificate Principal U/W NOI Debt Yield for each of the Class A-1, A-2, A-3, A-4, A-5, A-5FL, A-5FX and A-SB Certificates is calculated in the aggregate for those Classes as if they were a single Class and is calculated as the product of (a) the weighted average U/W NOI Debt Yield for the mortgage loans and (b) a fraction, the numerator of which is the total initial Certificate Balance of all of the Classes of Principal Balance Certificates (other than the Class PEX Certificates) and the denominator of which is the total aggregate initial Certificate Balances for the Class A-1, A-2, A-3, A-4, A-5, A-5FL, A-5FX and A-SB Certificates. The Certificate Principal U/W NOI Debt Yield of the Class PEX Certificates is equal to the Certificate Principal U/W NOI Debt Yield for the Class C Certificates. In any event, however, cash flow from each mortgaged property supports only the related mortgage loan and will not be available to support any other mortgage loan. |
THE INFORMATION IN THIS STRUCTURAL AND COLLATERAL TERM SHEET IS NOT COMPLETE AND MAY BE AMENDED PRIOR TO THE TIME OF SALE. THIS TERM SHEET IS NOT AN OFFER TO SELL THESE SECURITIES AND IT IS NOT A SOLICITATION OF AN OFFER TO BUY THESE SECURITIES IN ANY JURISDICTION WHERE THE OFFER OR SALE IS NOT PERMITTED.
| 3 |
| Wells Fargo Commercial Mortgage Trust 2015-NXS2 | Certificate Structure |
| (7) | The pass-through rates for the Class A-1, A-2, A-3, A-4, A-5, A-5FX, A-SB, D, E, F and G Certificates and the Class A-5FX, A-S, B and C regular interests in each case will be one of the following: (i) a fixed rateper annum, (ii) the weighted average of the net mortgage interest rates on the mortgage loans for the related distribution date, (iii) a variable rateper annum equal to the lesser of (a) a fixed rate and (b) the weighted average of the net mortgage interest rates on the mortgage loans for the related distribution date or (iv) a variable rateper annum equal to the weighted average of the net mortgage interest rates on the mortgage loans for the related distribution date minus a specified percentage. For purposes of the calculation of the weighted average of the net mortgage interest rates on the mortgage loans for each distribution date, the mortgage interest rates will be adjusted as necessary to a 30/360 basis. The Class PEX Certificates will not have a pass-through rate, but will be entitled to receive the sum of the interest distributable on the Class PEX Components. The pass-through rate for the Class A-S Certificates, the Class A-S regular interest and the Class PEX Component A-S will, at all times, be the same. The pass-through rate for the Class B Certificates, the Class B regular interest and the Class PEX Component B will, at all times, be the same. The pass-through rate for the Class C Certificates, the Class C regular interest and the Class PEX Component C will, at all times, be the same. |
| (8) | Represents the maximum initial principal balance of the Class A-5 certificates that will be issued on the closing date. The aggregate initial principal balance of the Class A-5, A-5FL and A-5FX certificates will be $240,335,000. |
| (9) | The Class A-S, B, C and PEX Certificates are “Exchangeable Certificates”. On the closing date, the upper-tier REMIC of the issuing entity will issue the Class A-S, B and C regular interests (each a “regular interest”) which will have outstanding principal balances on the closing date of $51,432,000, $73,149,000 and $36,575,000, respectively. The regular interests will be held in a grantor trust for the benefit of the holders of the Class A-S, B, C and PEX Certificates. The Class A-S, B, C and PEX Certificates will, at all times, represent undivided beneficial ownership interests in a grantor trust that will hold those regular interests. Each class of the Class A-S, B and C Certificates will, at all times, represent an undivided beneficial ownership interest in a percentage of the outstanding certificate principal balance of the regular interest with the same alphabetical class designation. The Class PEX Certificates will, at all times, represent an undivided beneficial ownership interest in the remaining percentages of the outstanding certificate principal balances of the Class A-S, B and C regular interests and which portions of those regular interests are referred to in this Term Sheet as, respectively, “Class PEX Component A-S”, “Class PEX Component B” and “Class PEX Component C” (collectively, the “Class PEX Components”). Following any exchange of Class A-S, B and C Certificates for Class PEX Certificates or any exchange of Class PEX Certificates for Class A-S, B and C Certificates as described in the Free Writing Prospectus, the percentage interest of the outstanding certificate principal balances of the Class A-S, B and C regular interests that is represented by the Class A-S, B, C and PEX Certificates will be increased or decreased accordingly. The initial certificate principal balance of each of the Class A-S, B and C Certificates shown in the table represents the maximum certificate principal balance of such class without giving effect to any exchange. The initial certificate principal balance of the Class PEX Certificates is equal to the aggregate of the initial certificate principal balance of the Class A-S, B and C Certificates and represents the maximum certificate principal balance of the Class PEX Certificates that could be issued in an exchange. The certificate principal balances of the Class A-S, B and C Certificates to be issued on the closing date will be reduced, in required proportions, by an amount equal to the certificate principal balance of the Class PEX Certificates issued on the closing date. Distributions and allocations of payments and losses with respect to the Exchangeable Certificates are described in this Term Sheet under “Allocations and Distributions on the Class A-S, B, C and PEX Certificates” and under “Description of the Offered Certificates—Distributions” in the Free Writing Prospectus. The maximum certificate principal balance of the Class PEX Certificates is set forth in the table but is not included in the certificate principal balance of the certificates set forth on the cover page of this Term Sheet or on the top of the cover page of the Free Writing Prospectus. |
| (10) | The Class X-A Certificates are notional amount certificates. The Notional Amount of the Class X-A Certificates will be equal to the aggregate principal balance of the Class A-1, A-2, A-3, A-4, A-5 and A-SB Certificates and the Class A-5FX and A-S regular interests outstanding from time to time (without regard to any exchange of Class A-S, B and C Certificates for Class PEX Certificates). The Class X-A Certificates will not be entitled to distributions of principal. |
| (11) | The pass-through rate for the Class X-A Certificates for any distribution date will be aper annum rate equal to the excess, if any, of (a) the weighted average of the net mortgage interest rates on the mortgage loans for the related distribution date, over (b) the weighted average of the pass-through rates on the Class A-1, A-2, A-3, A-4, A-5 and A-SB Certificates and the Class A-5FX and A-S regular interests for the related distribution date, weighted on the basis of their respective aggregate principal balances outstanding immediately prior to that distribution date. For purposes of the calculation of the weighted average of the net mortgage interest rates on the mortgage loans for each distribution date, the mortgage interest rates will be adjusted as necessary to a 30/360 basis. |
| (12) | The Class X-B Certificates are notional amount certificates. The Notional Amount of the Class X-B Certificates will be equal to the aggregate principal balance of the Class B and C regular interests outstanding from time to time (without regard to any exchange of the Class A-S, B and C Certificates for the Class PEX Certificates). The Class X-B Certificates will not be entitled to distributions of principal. |
| (13) | The pass-through rate for the Class X-B Certificates for any distribution date will be aper annum rate equal to the excess, if any, of (a) the weighted average of the net mortgage interest rates on the mortgage loans for the related distribution date, over (b) the weighted average of the pass-through rates on the Class B and C regular interests for the related distribution date, weighted on the basis of their respective aggregate principal balances outstanding immediately prior to that distribution date. For purposes of the calculation of the weighted average of the net mortgage interest rates on the mortgage loans for each distribution date, the mortgage interest rates will be adjusted as necessary to a 30/360 basis. |
| (14) | The Class X-E Certificates are notional amount certificates. The Notional Amount of the Class X-E Certificates will be equal to the principal balance of the Class E Certificates outstanding from time to time. The Class X-E Certificates will not be entitled to distributions of principal. |
| (15) | The pass-through rate for the Class X-E Certificates for any distribution date will be aper annum rate equal to the excess, if any, of (a) the weighted average of the net mortgage interest rates on the mortgage loans for the related distribution date, over (b) the pass-through rate on the Class E Certificates for the related distribution date. For purposes of the calculation of the weighted average of the net mortgage interest rates on the mortgage loans for each distribution date, the mortgage interest rates will be adjusted as necessary to a 30/360 basis. |
| (16) | The Class X-F Certificates are notional amount certificates. The Notional Amount of the Class X-F Certificates will be equal to the principal balance of the Class F Certificates outstanding from time to time. The Class X-F Certificates will not be entitled to distributions of principal. |
| (17) | The pass-through rate for the Class X-F Certificates for any distribution date will be aper annum rate equal to the excess, if any, of (a) the weighted average of the net mortgage interest rates on the mortgage loans for the related distribution date, over (b) the pass-through rate on the Class F Certificates for the related distribution date. For purposes of the calculation of the weighted average of the net mortgage interest rates on the mortgage loans for each distribution date, the mortgage interest rates will be adjusted as necessary to a 30/360 basis. |
| (18) | The Class X-G Certificates are notional amount certificates. The Notional Amount of the Class X-G Certificates will be equal to the principal balance of the Class G Certificates outstanding from time to time. The Class X-G Certificates will not be entitled to distributions of principal. |
| (19) | The pass-through rate for the Class X-G Certificates for any distribution date will be aper annum rate equal to the excess, if any, of (a) the weighted average of the net mortgage interest rates on the mortgage loans for the related distribution date, over (b) the pass-through rate on the Class G Certificates for the related distribution date. For purposes of the calculation of the weighted average of the net mortgage interest rates on the mortgage loans for each distribution date, the mortgage interest rates will be adjusted as necessary to a 30/360 basis. |
| (20) | The ratings assigned to the Class A-5FL Certificates reflect only the receipt of up to the fixed rate of interest at a rate equal to the pass-through rate for the Class A-5FX regular interest. The ratings of DBRS, KBRA and Moody’s do not address any shortfalls or delays in payment that investors in the Class A-5FL Certificates may experience as a result of the conversion of the pass-through rate on Class A-5FL Certificates from a floating interest rate to a fixed rate. See “Ratings” in the Private Placement Memorandum. |
| (21) | The aggregate initial principal balance of the Class A-5, A-5FL and A-5FX certificates will be $240,335,000. The aggregate principal balance of the Class A-5FL and A-5FX certificates will at all times equal the principal balance of the Class A-5FX regular interest. The maximum initial principal balance of the Class A-5FL certificates is $240,335,000. The principal balance of the Class A-5FX certificates will initially be $0. The maximum initial principal balance of the Class A-5FX regular interest is $240,335,000. |
| (22) | The Class A-5FL Certificates will evidence a beneficial interest in a grantor trust that includes the Class A-5FX regular interest and an interest rate swap contract. Under some circumstances, holders of the Class A-5FL Certificates may exchange all or a portion of their certificates for a like principal amount of Class A-5FX Certificates having the same pass-through rate as the Class A-5FX regular interest. The aggregate principal balance of the Class A-5FL Certificates may be adjusted from time to time as a result of such an exchange. |
| (23) | The pass-through rate applicable to the Class A-5FL Certificates on each distribution date will be aper annum rate equal to LIBOR plus a specified percentage; provided, however, that under certain circumstances (generally involving a default or termination under the related interest rate swap contract), the pass-through rate applicable to the Class A-5FL Certificates may convert to a fixed rate equal to the pass-through rate on the Class A-5FX regular interest. The initial LIBOR rate will be determined two LIBOR business days prior to the Closing Date, and subsequent LIBOR rates for the Class A-5FL Certificates will be determined two LIBOR business days before the start of the related interest accrual period. |
THE INFORMATION IN THIS STRUCTURAL AND COLLATERAL TERM SHEET IS NOT COMPLETE AND MAY BE AMENDED PRIOR TO THE TIME OF SALE. THIS TERM SHEET IS NOT AN OFFER TO SELL THESE SECURITIES AND IT IS NOT A SOLICITATION OF AN OFFER TO BUY THESE SECURITIES IN ANY JURISDICTION WHERE THE OFFER OR SALE IS NOT PERMITTED.
| 4 |
| Wells Fargo Commercial Mortgage Trust 2015-NXS2 | Issue Characteristics |
II.Transaction Highlights
Mortgage Loan Sellers:
| Mortgage Loan Seller | Number of Mortgage Loans | Number of Mortgaged Properties | Aggregate Cut-off Date Balance | % of Cut-off Date Pool Balance | |||||||
| Natixis Real Estate Capital LLC | 39 | 42 | 503,900,454 | 55.1% | |||||||
| Wells Fargo Bank, National Association | 14 | 25 | 293,066,224 | 32.1 | |||||||
| Silverpeak Real Estate Finance LLC | 10 | 10 | 117,394,863 | 12.8 | |||||||
| Total | 63 | 77 | $914,361,541 | 100.0% | |||||||
| Loan Pool: | ||
| Cut-off Date Balance: | $914,361,541 | |
| Number of Mortgage Loans: | 63 | |
| Average Cut-off Date Balance per Mortgage Loan: | $14,513,675 | |
| Number of Mortgaged Properties: | 77 | |
| Average Cut-off Date Balance per Mortgaged Property(1): | $11,874,825 | |
| Weighted Average Mortgage Interest Rate: | 4.279% | |
| Ten Largest Mortgage Loans as % of Cut-off Date Pool Balance: | 48.2% | |
| Weighted Average Original Term to Maturity or ARD (months): | 110 | |
| Weighted Average Remaining Term to Maturity or ARD (months): | 107 | |
| Weighted Average Original Amortization Term (months)(2): | 358 | |
| Weighted Average Remaining Amortization Term (months)(2): | 357 | |
| Weighted Average Seasoning (months): | 3 |
| (1) | Information regarding mortgage loans secured by multiple properties is based on an allocation according to relative appraised values or the allocated loan amounts or property-specific release prices set forth in the related loan documents or such other allocation as the related mortgage loan seller deemed appropriate. |
| (2) | Excludes any mortgage loan that does not amortize. |
| Credit Statistics: | ||
| Weighted Average U/W Net Cash Flow DSCR(1): | 1.68x | |
| Weighted Average U/W Net Operating Income Debt Yield(1): | 9.5% | |
| Weighted Average Cut-off Date Loan-to-Value Ratio(1): | 66.4% | |
| Weighted Average Balloon or ARD Loan-to-Value Ratio(1): | 59.6% | |
| % of Mortgage Loans with Additional Subordinate Debt(2): | 2.4% | |
| % of Mortgage Loans with Single Tenants: | 21.5% |
| (1) | With respect to the Patriots Park mortgage loan, the 100 West 57th Street mortgage loan, the Stanford Research Park mortgage loan, the Cooper’s Crossing mortgage loan and the Hotel Andra mortgage loan (collectively, the “Pari Passu Mortgage Loans”), each of which is part of apari passu loan combination, loan-to-value ratio, debt service coverage ratio and debt yield calculations include the relatedpari passu companion loan(s) (unless otherwise stated). With respect to each mortgage loan, debt service coverage ratio, debt yield and loan-to-value ratio information takes no account of subordinate debt (whether or not secured by the related mortgaged property), if any, that is allowed under the terms of such mortgage loan. See Annex A-1 and Annex B to the Free Writing Prospectus. |
| (2) | The percentage figure expressed as “% of Mortgage Loans with Additional Subordinate Debt” is determined as a percentage of cut-off date principal balance and does not take into account future subordinate debt (whether or not secured by the mortgaged property), if any, that may be permitted under the terms of any mortgage loan or the pooling and servicing agreement. See “Description of the Mortgage Pool—Subordinate and/or Other Financing” in the Free Writing Prospectus. |
THE INFORMATION IN THIS STRUCTURAL AND COLLATERAL TERM SHEET IS NOT COMPLETE AND MAY BE AMENDED PRIOR TO THE TIME OF SALE. THIS TERM SHEET IS NOT AN OFFER TO SELL THESE SECURITIES AND IT IS NOT A SOLICITATION OF AN OFFER TO BUY THESE SECURITIES IN ANY JURISDICTION WHERE THE OFFER OR SALE IS NOT PERMITTED.
| 5 |
| Wells Fargo Commercial Mortgage Trust 2015-NXS2 | Issue Characteristics |
Loan Structural Features:
Amortization:Based on the Cut-off Date Pool Balance, 63.7% of the mortgage pool (53 mortgage loans) has scheduled amortization, as follows:
32.4% (36 mortgage loans) requires amortization during the entire loan term; and
31.3% (17 mortgage loans) provides for an interest-only period followed by an amortization period.
Interest-Only:Based on the Cut-off Date Pool Balance, 36.3% of the mortgage pool (ten mortgage loans) provides for interest-only payments during the entire loan term. The Weighted Average Cut-off Date Loan-to-Value Ratio and Weighted Average U/W Net Cash Flow DSCR for those mortgage loans are 63.0% and 1.87x, respectively.
Hard Lockboxes: Based on the Cut-off Date Pool Balance, 49.5% of the mortgage pool (33 mortgage loans) has hard lockboxes in place.
Reserves:The mortgage loans require amounts to be escrowed monthly as follows (excluding any mortgage loans with springing provisions):
| Real Estate Taxes: | 82.1% of the pool | ||||
| Insurance: | 58.0% of the pool | ||||
| Capital Replacements: | 85.4% of the pool | ||||
| TI/LC: | 41.5% of the pool(1) | ||||
| (1) | The percentage of Cut-off Date Balance for mortgage loans with TI/LC reserves is based on the aggregate principal balance allocable to loans that include retail, office, industrial and mixed use properties. | ||||
Call Protection/Defeasance: Based on the Cut-off Date Pool Balance, the mortgage pool had the following call protection and defeasance features:
85.6% of the mortgage pool (57 mortgage loans) features a lockout period, then defeasance only until an open period;
9.8% of the mortgage pool (one mortgage loan) features no lockout period, but requires the greater of a prepayment premium or yield maintenance, then the greater of a prepayment premium or yield maintenance or defeasance until an open period;
2.6% of the mortgage pool (three mortgage loans) features a lockout period, then the greater of a prepayment premium or yield maintenance until an open period;
2.0% of the mortgage pool (two mortgage loans) features a lockout period, then the greater of a prepayment premium or yield maintenance or defeasance until an open period;
Please refer to Annex A-1 to the Free Writing Prospectus for further information regarding individual loan call protection.
THE INFORMATION IN THIS STRUCTURAL AND COLLATERAL TERM SHEET IS NOT COMPLETE AND MAY BE AMENDED PRIOR TO THE TIME OF SALE. THIS TERM SHEET IS NOT AN OFFER TO SELL THESE SECURITIES AND IT IS NOT A SOLICITATION OF AN OFFER TO BUY THESE SECURITIES IN ANY JURISDICTION WHERE THE OFFER OR SALE IS NOT PERMITTED.
| 6 |
| Wells Fargo Commercial Mortgage Trust 2015-NXS2 | Issue Characteristics |
III.Issue Characteristics
| Securities Offered: | $841,212,000 approximate monthly pay, multi-class, commercial mortgage REMIC pass-through certificates consisting of thirteen classes (Classes A-1, A-2, A-3, A-4, A-5, A-SB, A-S, B, C, D, PEX, X-A and X-B), which are offered pursuant to a registration statement filed with the SEC. | |
| Mortgage Loan Sellers: | Natixis Real Estate Capital LLC (“Natixis”), Wells Fargo Bank, National Association (“WFB”) and Silverpeak Real Estate Finance LLC (“SPREF”). | |
| Sole Lead Bookrunning Manager: | Wells Fargo Securities, LLC | |
| Co-Managers: | Drexel Hamilton, LLC and Natixis Securities Americas LLC | |
| Rating Agencies: | DBRS, Inc., Kroll Bond Rating Agency, Inc. and Moody’s Investors Service, Inc. | |
| Master Servicer: | Wells Fargo Bank, National Association | |
| Special Servicer: | Rialto Capital Advisors, LLC | |
| Certificate Administrator: | Wells Fargo Bank, National Association | |
| Trustee: | Wilmington Trust, National Association | |
| Trust Advisor: | Pentalpha Surveillance LLC | |
| Initial Majority Subordinate Certificateholder: | RREF II CMBS AIV, LP or another affiliate of Rialto Capital Advisors, LLC | |
| Cut-off Date: | The Cut-off Date with respect to each mortgage loan is the due date for the monthly debt service payment that is due in July 2015 (or, in the case of any mortgage loan that has its first due date in August 2015, the date that would have been its due date in July 2015 under the terms of that mortgage loan if a monthly debt service payment were scheduled to be due in that month). | |
| Expected Closing Date: | On or about July 14, 2015. | |
| Determination Dates: | The 11th day of each month (or if that day is not a business day, the next succeeding business day), commencing in August 2015. | |
| Distribution Dates: | The fourth business day following the Determination Date in each month, commencing in August2015. | |
| Rated Final Distribution Date: | The Distribution Date in July 2058. | |
| Interest Accrual Period: | With respect to any Distribution Date, the calendar month immediately preceding the month in which such Distribution Date occurs. | |
| Day Count: | The Offered Certificates will accrue interest on a 30/360 basis. | |
| Minimum Denominations: | $10,000 for each Class of Offered Certificates (other than the Class X-A and X-B Certificates) and $1,000,000 for the Class X-A and X-B Certificates. Investments may also be made in any whole dollar denomination in excess of the applicable minimum denomination. | |
| Clean-up Call: | 1% | |
| Delivery: | DTC, Euroclear and Clearstream Banking | |
| ERISA/SMMEA Status: | Each Class of Offered Certificates is expected to be eligible for exemptive relief under ERISA. No Class of Offered Certificates will be SMMEA eligible. | |
| Risk Factors: | THE CERTIFICATES INVOLVE CERTAIN RISKS AND MAY NOT BE SUITABLE FOR ALL INVESTORS. SEE THE “RISK FACTORS” SECTION OF THE FREE WRITING PROSPECTUS. | |
| Bond Analytics Information: | The Certificate Administrator will be authorized to make distribution date settlements, CREFC® reports and certain supplemental reports (other than confidential information) available to certain financial modeling and data provision services, including Bloomberg, L.P., Trepp, LLC, Intex Solutions, Inc., Markit Group Limited, Interactive Data Corp., BlackRock Financial Management, Inc., CMBS.com, Inc. and Thomson Reuters Corporation. |
THE INFORMATION IN THIS STRUCTURAL AND COLLATERAL TERM SHEET IS NOT COMPLETE AND MAY BE AMENDED PRIOR TO THE TIME OF SALE. THIS TERM SHEET IS NOT AN OFFER TO SELL THESE SECURITIES AND IT IS NOT A SOLICITATION OF AN OFFER TO BUY THESE SECURITIES IN ANY JURISDICTION WHERE THE OFFER OR SALE IS NOT PERMITTED.
| 7 |
| Wells Fargo Commercial Mortgage Trust 2015-NXS2 | Characteristics of the Mortgage Pool |
IV. Characteristics of the Mortgage Pool(1)
A. Ten Largest Mortgage Loans
| Mortgage Loan Seller | Mortgage Loan Name | City | State | Number of Mortgage Loans / Mortgaged Properties | Mortgage Loan Cut-off Date Balance ($) | % of Cut-off Date Pool Balance (%) | Property Type | Number of SF/Rooms/ Units | Cut-off Date Balance Per SF/Room/ Unit ($) | Cut-off Date LTV Ratio (%) | Balloon or ARD LTV Ratio (%) | U/W NCF DSCR (x) | U/W NOI Debt Yield (%) | |||||||||||||
| Natixis | Patriots Park | Reston | VA | 1 / 1 | $90,000,000 | 9.8% | Office | 723,667 | $297 | 66.8% | 66.8% | 2.18x | 8.2% | |||||||||||||
| WFB | Campbell Technology Park | Campbell | CA | 1 / 1 | 60,000,000 | 6.6 | Office | 280,864 | 214 | 60.0 | 60.0 | 1.79 | 9.1 | |||||||||||||
| WFB | Stor All Group Portfolio | Various | Various | 1 / 10 | 58,250,000 | 6.4 | Self Storage | 684,770 | 85 | 72.8 | 63.6 | 1.31 | 8.0 | |||||||||||||
| Natixis | 100 West 57th Street | New York | NY | 1 / 1 | 45,000,000 | 4.9 | Other | 25,125 | 7,164 | 60.0 | 60.0 | 1.00 | 2.3 | |||||||||||||
| WFB | Embassy Suites Nashville | Nashville | TN | 1 / 1 | 43,000,000 | 4.7 | Hospitality | 208 | 206,731 | 64.8 | 54.9 | 1.78 | 11.6 | |||||||||||||
| WFB | Sea Harbor Office Center | Orlando | FL | 1 / 1 | 40,000,000 | 4.4 | Office | 359,514 | 111 | 60.6 | 60.6 | 2.14 | 10.4 | |||||||||||||
| Natixis | Stanford Research Park | Palo Alto | CA | 1 / 1 | 36,500,000 | 4.0 | Office | 129,678 | 667 | 62.7 | 62.7 | 1.95 | 9.4 | |||||||||||||
| Natixis | 88 Hamilton Avenue | Stamford | CT | 1 / 1 | 23,000,000 | 2.5 | Mixed Use | 154,533 | 149 | 70.8 | 62.0 | 1.35 | 8.7 | |||||||||||||
| SPREF | Robinson Crossroads | Robinson Township | PA | 1 / 1 | 22,971,720 | 2.5 | Retail | 139,034 | 165 | 73.2 | 60.0 | 1.32 | 8.7 | |||||||||||||
| Natixis | Colman Building | Seattle | WA | 1 / 1 | 22,400,000 | 2.4 | Mixed Use | 145,188 | 154 | 65.9 | 65.9 | 1.85 | 8.7 | |||||||||||||
| Top Three Total/Weighted Average | 3 / 12 | $208,250,000 | 22.8% | 66.5% | 63.9% | 1.82x | 8.4% | |||||||||||||||||||
| Top Five Total/Weighted Average | 5 / 14 | $296,250,000 | 32.4% | 65.3% | 62.0% | 1.69x | 7.9% | |||||||||||||||||||
| Top Ten Total/Weighted Average | 10 / 19 | $441,121,720 | 48.2% | 65.4% | 62.0% | 1.73x | 8.4% | |||||||||||||||||||
| Non-Top Ten Total/Weighted Average | 53 / 58 | $473,239,821 | 51.8% | 67.3% | 57.3% | 1.65x | 10.6% | |||||||||||||||||||
| (1) | With respect to the Pari Passu Mortgage Loans, each of which is part of apari passu loan combination, Cut-off Date Balance per square foot, loan-to-value ratio, debt service coverage ratio and debt yield calculations include the relatedpari passu companion loan(s) (unless otherwise stated). With respect to each mortgage loan, debt service coverage ratio, debt yield and loan-to-value ratio information takes no account of subordinate debt (whether or not secured by the related mortgaged property), if any, that is allowed under the terms of such mortgage loan. |
THE INFORMATION IN THIS STRUCTURAL AND COLLATERAL TERM SHEET IS NOT COMPLETE AND MAY BE AMENDED PRIOR TO THE TIME OF SALE. THIS TERM SHEET IS NOT AN OFFER TO SELL THESE SECURITIES AND IT IS NOT A SOLICITATION OF AN OFFER TO BUY THESE SECURITIES IN ANY JURISDICTION WHERE THE OFFER OR SALE IS NOT PERMITTED.
| 8 |
| Wells Fargo Commercial Mortgage Trust 2015-NXS2 | Characteristics of the Mortgage Pool |
| B. | Summary ofPari Passu Loan Combinations |
| Property Name | Mortgage Loan Seller | Related Notes in Loan Group (Original Balance) | Holder of Note | Lead Servicer for the Entire Loan Combination | Current Master Servicer Under Related Securitization Servicing Agreement | Current Special Servicer Under Related Securitization Servicing Agreement | ||||||
| Patriots Park | Natixis | $95,000,000 | WFCM 2015-NXS1 | Yes | Wells Fargo Bank, National Association | Rialto Capital Advisors, LLC | ||||||
| Natixis | $90,000,000 | WFCM 2015-NXS2 | No | Wells Fargo Bank, National Association | Rialto Capital Advisors, LLC | |||||||
| Natixis | $26,000,000 | COMM 2015-CCRE22 | No | Wells Fargo Bank, National Association | LNR Partners, LLC | |||||||
| Natixis | $4,070,000 | (1) | No | Wells Fargo Bank, National Association | Rialto Capital Advisors, LLC | |||||||
| 100 West 57th Street | Natixis | $45,000,000 | WFCM 2015-NXS2 | Yes | Wells Fargo Bank, National Association | Rialto Capital Advisors, LLC | ||||||
| Natixis | $60,000,000 | COMM 2015-CCRE22 | No | Wells Fargo Bank, National Association | LNR Partners, LLC | |||||||
| Natixis | $40,000,000 | COMM 2015-DC1 | No | KeyBank National Association | Rialto Capital Advisors, LLC | |||||||
| Natixis | $35,000,000 | WFCM 2015-NXS1 | No | Wells Fargo Bank, National Association | Rialto Capital Advisors, LLC | |||||||
| Stanford Research Park | Natixis | $50,000,000 | WFCM 2015-NXS1 | Yes | Wells Fargo Bank, National Association | Rialto Capital Advisors, LLC | ||||||
| Natixis | $36,500,000 | WFCM 2015-NXS2 | No | Wells Fargo Bank, National Association | Rialto Capital Advisors, LLC | |||||||
| Cooper’s Crossing | SPREF | $22,300,000 | WFCM 2015-NXS2 | Yes | Wells Fargo Bank, National Association | Rialto Capital Advisors, LLC | ||||||
| SPREF | $21,700,000 | (2) | No | Wells Fargo Bank, National Association | Rialto Capital Advisors, LLC | |||||||
| Hotel Andra | Natixis | $24,000,000 | WFCM 2015-NXS1 | Yes | Wells Fargo Bank, National Association | Rialto Capital Advisors, LLC | ||||||
| Natixis | $14,000,000 | WFCM 2015-NXS2 | No | Wells Fargo Bank, National Association | Rialto Capital Advisors, LLC |
| (1) | The relatedpari passu companion loan Note A-4 is currently held by Natixis and is expected to be contributed to a future securitization. No assurance can be provided that the Note A-4 will not be split further. |
| (2) | The relatedpari passu companion loan Note A-2 is currently held by an affiliate of SPREF and is expected to be contributed to a future securitization. No assurance can be provided that the Note A-2 will not be split further. |
C. Mortgage Loans with Additional Secured and Mezzanine Financing
| Loan No. | Mortgage Loan Seller | Mortgage Loan Name | Mortgage Loan Cut-off Date Balance ($) | % of Cut-off Date Balance (%) | Sub Debt Cut- off Date Balance ($) | Mezzanine Debt Cut-off Date Balance ($) | Total Debt Rate (%)(1)(2) | Mortgage Loan U/W NCF DSCR (x)(3) | Total Debt U/W NCF DSCR (x)(2) | Mortgage Loan Cut-off Date U/W NOI Debt Yield (%)(3) | Total Debt Cut-off Date U/W NOI Debt Yield (%) | Mortgage Loan Cut-off Date LTV Ratio (%)(3) | Total Debt Cut-off Date LTV Ratio (%) | |||||||||||||
| 11 | SPREF | Cooper’s Crossing | $22,300,000 | 2.4% | $0 | $20,237,082 | 6.400% | 1.46x | 0.86x | 9.9% | 6.8% | 64.6% | 94.3% | |||||||||||||
| Total/Weighted Average | $22,300,000 | 2.4% | $0 | $20,237,082 | 6.400% | 1.46x | 0.86x | 9.9% | 6.8% | 64.6% | 94.3% | |||||||||||||||
| (1) | Total Debt Interest Rate for any specified mortgage loan reflects the weighted average of the interest rates on the respective components of the total debt. |
| (2) | See “Cooper’s Crossing—Property Information” section. |
| (3) | With respect to the Cooper’s Crossing mortgage loan, which is part of a loan combination, debt service coverage ratio, debt yield and loan-to-value ratio calculations include the relatedpari passu companion loan. |
THE INFORMATION IN THIS STRUCTURAL AND COLLATERAL TERM SHEET IS NOT COMPLETE AND MAY BE AMENDED PRIOR TO THE TIME OF SALE. THIS TERM SHEET IS NOT AN OFFER TO SELL THESE SECURITIES AND IT IS NOT A SOLICITATION OF AN OFFER TO BUY THESE SECURITIES IN ANY JURISDICTION WHERE THE OFFER OR SALE IS NOT PERMITTED.
| 9 |
| Wells Fargo Commercial Mortgage Trust 2015-NXS2 | Characteristics of the Mortgage Pool |
D. Previous Securitization History(1)
| Loan No. | Mortgage Loan Seller | Mortgage Loan or Mortgaged Property Name | City | State | Property Type | Mortgage Loan or Mortgaged Property Cut- off Date Balance ($) | % of Cut- off Date Pool Balance (%) | Previous Securitization | |||||||||
| 2 | WFB | Campbell Technology Park | Campbell | CA | Office | $60,000,000 | 6.6 | % | WBCMT 2006-C25 | ||||||||
| 3.01 | WFB | Stor All - King Arthur | Louisville | KY | Self Storage | 8,001,506 | 0.9 | JPMCC 2005-LDP3 | |||||||||
| 3.02 | WFB | Stor All - Man-O-War | Lexington | KY | Self Storage | 7,572,794 | 0.8 | JPMCC 2005-CB12 | |||||||||
| 3.03 | WFB | Stor All - Lyndon | Louisville | KY | Self Storage | 7,002,321 | 0.8 | JPMCC 2005-LDP3 | |||||||||
| 3.04 | WFB | Stor All - Cane | Louisville | KY | Self Storage | 6,824,172 | 0.7 | JPMCC 2005-CB12 | |||||||||
| 3.05 | WFB | Stor All - Middletown | Louisville | KY | Self Storage | 6,690,377 | 0.7 | JPMCC 2005-LDP3 | |||||||||
| 3.06 | WFB | Stor All - Dixie Highway | Louisville | KY | Self Storage | 5,915,169 | 0.6 | JPMCC 2005-CB12 | |||||||||
| 3.09 | WFB | Stor All - New Cut | Louisville | KY | Self Storage | 3,945,284 | 0.4 | JPMCC 2005-CB12 | |||||||||
| 3.10 | WFB | Stor All - Palumbo | Lexington | KY | Self Storage | 3,611,459 | 0.4 | JPMCC 2005-LDP3 | |||||||||
| 9 | SPREF | Robinson Crossroads | Robinson Township | PA | Retail | 22,971,720 | 2.5 | CD 2006-CD2 | |||||||||
| 10 | Natixis | Colman Building | Seattle | WA | Mixed Use | 22,400,000 | 2.4 | GECMC 2005-C4 | |||||||||
| 12 | Natixis | Hampton Inn Philadelphia Airport | Philadelphia | PA | Hospitality | 17,800,000 | 1.9 | GSMS 2005-GG4 | |||||||||
| 13.01 | WFB | Pasadena | Pasadena | CA | Retail | 8,845,000 | 1.0 | JPMCC 2005-CB13 | |||||||||
| 13.03 | WFB | Harbor Plaza | Los Angeles | CA | Retail | 2,525,000 | 0.3 | JPMCC 2005-CB13 | |||||||||
| 16 | WFB | Alderwood Parkway Retail Center | Lynnwood | WA | Retail | 15,500,000 | 1.7 | MSC 2006-HQ8 | |||||||||
| 19 | WFB | Creekside Inn | Palo Alto | CA | Hospitality | 14,979,630 | 1.6 | MSC 2007-T27 | |||||||||
| 20 | Natixis | Hotel Andra | Seattle | WA | Hospitality | 14,000,000 | 1.5 | CSMC 2006-C5 | |||||||||
| 25 | SPREF | Residence Inn Scottsdale | Scottsdale | AZ | Hospitality | 12,500,000 | 1.4 | CSFB 2005-C3 | |||||||||
| 27 | Natixis | 3322 Hudson - Storage Blue | Union City | NJ | Self Storage | 10,735,559 | 1.2 | MLCFC 2007-9 | |||||||||
| 29 | Natixis | Rocksprings Plaza | Las Vegas | NV | Retail | 10,275,000 | 1.1 | MLCFC 2007-7 | |||||||||
| 30 | Natixis | Harvey Building | West Palm Beach | FL | Office | 9,959,473 | 1.1 | LBUBS 2005-C3 | |||||||||
| 31 | Natixis | 190 Baldwin - Storage Blue | Jersey City | NJ | Self Storage | 9,876,714 | 1.1 | MLCFC 2007-9 | |||||||||
| 36 | Natixis | Comfort Inn The Park Hershey | Hummelstown | PA | Hospitality | 8,559,119 | 0.9 | BSCMS 2005-T18 | |||||||||
| 40 | Natixis | The Grand Village Shops | Branson | MO | Retail | 7,728,952 | 0.8 | BACM 2005-3 | |||||||||
| 44 | Natixis | 1363 Mc Carter - Storage Blue | Newark | NJ | Self Storage | 6,051,859 | 0.7 | MLCFC 2007-9 | |||||||||
| 51 | Natixis | 315 Cole Street - Storage Blue | Jersey City | NJ | Self Storage | 4,568,854 | 0.5 | MLCFC 2007-9 | |||||||||
| 52 | Natixis | North Western Plaza | Greensboro | NC | Office | 4,494,186 | 0.5 | GCCFC 2005-GG5 | |||||||||
| 63 | WFB | Planet Self Storage | Waltham | MA | Self Storage | 1,597,731 | 0.2 | BSCMS 2005-PWR9 | |||||||||
| Total | $314,931,879 | 34.4 | % | ||||||||||||||
| (1) | The table above represents the most recent securitization with respect to the mortgaged property securing the related mortgage loan, based on information provided by the related borrower or obtained through searches of a third-party database. While the above mortgage loans may have been securitized multiple times in prior transactions, mortgage loans are only listed in the above chart if the mortgage loan in this securitization paid off a mortgage loan in another securitization. The information has not otherwise been confirmed by the mortgage loan sellers. |
THE INFORMATION IN THIS STRUCTURAL AND COLLATERAL TERM SHEET IS NOT COMPLETE AND MAY BE AMENDED PRIOR TO THE TIME OF SALE. THIS TERM SHEET IS NOT AN OFFER TO SELL THESE SECURITIES AND IT IS NOT A SOLICITATION OF AN OFFER TO BUY THESE SECURITIES IN ANY JURISDICTION WHERE THE OFFER OR SALE IS NOT PERMITTED.
| 10 |
| Wells Fargo Commercial Mortgage Trust 2015-NXS2 | Characteristics of the Mortgage Pool |
| E. | Mortgage Loans with Scheduled Balloon Payments and Related Classes |
| Class A-2(1) | |||||||||||||||||||||||||||||||||
| Loan No. | Mortgage Loan Seller | Mortgage Loan Name | State | Property Type | Mortgage Loan Cut-off Date Balance ($) | % of Cut-off Date Pool Balance (%) | Mortgage Loan Balance at Maturity ($) | % of Class A-2 Certificate Principal Balance (%)(2) | SF or Units | Loan per SF/Unit ($) | U/W NCF DSCR (x) | U/W NOI Debt Yield (%) | Cut-off Date LTV Ratio (%) | Balloon or ARD LTV Ratio (%) | Rem. IO Period (mos.) | Rem. Term to Maturity (mos.) | |||||||||||||||||
| 1 | Natixis | Patriots Park | VA | Office | $90,000,000 | 9.8% | $90,000,000 | 55.9% | 723,667 | $297 | 2.18x | 8.2% | 66.8% | 66.8% | 51 | 51 | |||||||||||||||||
| 4 | Natixis | 100 West 57th Street | NY | Other | 45,000,000 | 4.9 | $45,000,000 | 27.9 | 25,125 | 7,164 | 1.00 | 2.3 | 60.0 | 60.0 | 52 | 52 | |||||||||||||||||
| 11 | SPREF | Cooper’s Crossing | MD | Multifamily | 22,300,000 | 2.4 | $21,309,337 | 13.2 | 727 | 60,523 | 1.46 | 9.9 | 64.6 | 61.7 | 20 | 56 | |||||||||||||||||
| Total/Weighted Average | $157,300,000 | 17.2% | $156,309,337 | 97.0% | 1.74x | 6.8% | 64.5% | 64.1% | 47 | 52 | |||||||||||||||||||||||
| (1) | The table above presents the mortgage loan(s) whose balloon payments would be applied to pay down the principal balance of the Class A-2 Certificates, assuming a 0% CPR and applying the “Structuring Assumptions” described in the Free Writing Prospectus, including the assumptions that (i) none of the mortgage loans in the pool experience prepayments prior to maturity (or, in the case of an ARD loan, its anticipated repayment date), defaults or losses; (ii) there are no extensions of maturity dates of any mortgage loans in the pool; and (iii) each mortgage loan in the pool is paid in full on its stated maturity date (or, in the case of an ARD loan, its anticipated repayment date). Each Class of Certificates, including the Class A-2 Certificates, evidences undivided ownership interests in the entire pool of mortgage loans. Debt service coverage ratio, debt yield and loan-to-value ratio information takes no account of subordinate debt (whether or not secured by the mortgaged property), if any, that is allowed under the terms of any mortgage loan. See Annex A-1 to the Free Writing Prospectus. |
| (2) | Reflects the percentage equal to the Mortgage Loan Balance at Maturity divided by the initial Class A-2 Certificate Principal Balance. |
| Class A-3(1) | ||||||||||||||||||||||||||||||||
| Loan No. | Mortgage Loan Seller | Mortgage Loan Name | State | Property Type | Mortgage Loan Cut-off Date Balance ($) | % of Cut-off Date Pool Balance (%) | Mortgage Loan Balance at Maturity ($) | % of Class A-3 Certificate Principal Balance (%)(2) | SF | Loan per SF ($) | U/W NCF DSCR (x) | U/W NOI Debt Yield (%) | Cut-off Date LTV Ratio (%) | Balloon or ARD LTV Ratio (%) | Rem. IO Period (mos.) | Rem Term to Maturity (mos.) | ||||||||||||||||
| 38 | WFB | Prana Headquarters Building | CA | Industrial | $7,800,000 | 0.9% | $7,800,000 | 100.0% | 74,774 | $104 | 1.76x | 8.6% | 62.4% | 62.4% | 82 | 82 | ||||||||||||||||
| Total/Weighted Average | $7,800,000 | 0.9% | $7,800,000 | 100.0% | 1.76x | 8.6% | 62.4% | 62.4% | 82 | 82 | ||||||||||||||||||||||
| (1) | The table above presents the mortgage loan(s) whose balloon payments would be applied to pay down the principal balance of the Class A-3 Certificates, assuming a 0% CPR and applying the “Structuring Assumptions” described in the Free Writing Prospectus, including the assumptions that (i) none of the mortgage loans in the pool experience prepayments prior to maturity (or, in the case of an ARD loan, its anticipated repayment date), defaults or losses; (ii) there are no extensions of maturity dates of any mortgage loans in the pool; and (iii) each mortgage loan in the pool is paid in full on its stated maturity date (or, in the case of an ARD loan, its anticipated repayment date). Each Class of Certificates, including the Class A-3 Certificates, evidences undivided ownership interests in the entire pool of mortgage loans. Debt service coverage ratio, debt yield and loan-to-value ratio information takes no account of subordinate debt (whether or not secured by the mortgaged property), if any, that is allowed under the terms of any mortgage loan. See Annex A-1 to the Free Writing Prospectus. |
| (2) | Reflects the percentage equal to the Mortgage Loan Balance at Maturity divided by the initial Class A-3 Certificate Principal Balance. |
THE INFORMATION IN THIS STRUCTURAL AND COLLATERAL TERM SHEET IS NOT COMPLETE AND MAY BE AMENDED PRIOR TO THE TIME OF SALE. THIS TERM SHEET IS NOT AN OFFER TO SELL THESE SECURITIES AND IT IS NOT A SOLICITATION OF AN OFFER TO BUY THESE SECURITIES IN ANY JURISDICTION WHERE THE OFFER OR SALE IS NOT PERMITTED.
| 11 |
| Wells Fargo Commercial Mortgage Trust 2015-NXS2 | Characteristics of the Mortgage Pool |
| F. | Property Type Distribution(1) |
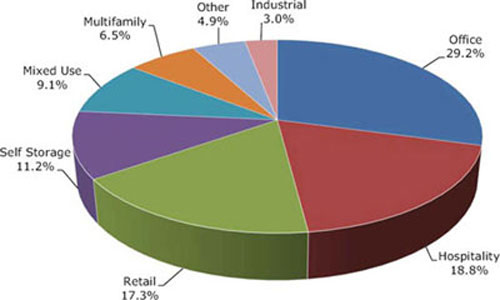
| Property Type | Number of Mortgaged Properties | Aggregate Cut-off Date Balance ($) | % of Cut- off Date Balance (%) | Weighted Average Cut- off Date LTV Ratio (%) | Weighted Average Balloon or ARD LTV Ratio (%) | Weighted Average U/W NCF DSCR (x) | Weighted Average U/W NOI Debt Yield (%) | Weighted Average U/W NCF Debt Yield (%) | Weighted Average Mortgage Rate (%) | |||||||||
| Office | 8 | $266,920,592 | 29.2% | 64.4% | 63.0% | 1.98x | 9.1% | 8.6% | 4.172% | |||||||||
| Suburban | 5 | 230,994,186 | 25.3 | 63.5 | 63.2 | 2.02 | 9.1 | 8.5 | 4.141 | |||||||||
| CBD | 3 | 35,926,405 | 3.9 | 70.7 | 61.9 | 1.67 | 9.6 | 9.1 | 4.368 | |||||||||
| Hospitality | 12 | 171,686,908 | 18.8 | 64.0 | 53.6 | 1.92 | 13.1 | 11.7 | 4.526 | |||||||||
| Full Service | 5 | 99,874,234 | 10.9 | 61.6 | 51.9 | 1.98 | 13.5 | 12.0 | 4.447 | |||||||||
| Limited Service | 6 | 59,312,674 | 6.5 | 68.1 | 56.3 | 1.80 | 12.5 | 11.1 | 4.586 | |||||||||
| Extended Stay | 1 | 12,500,000 | 1.4 | 64.4 | 54.9 | 1.94 | 13.7 | 12.3 | 4.874 | |||||||||
| Retail | 21 | 158,418,519 | 17.3 | 71.1 | 59.5 | 1.41 | 8.7 | 8.4 | 4.367 | |||||||||
| Unanchored | 9 | 62,768,274 | 6.9 | 70.9 | 59.5 | 1.49 | 9.3 | 8.8 | 4.255 | |||||||||
| Anchored | 3 | 49,201,973 | 5.4 | 71.5 | 59.5 | 1.37 | 8.6 | 8.4 | 4.481 | |||||||||
| Single Tenant | 8 | 42,381,885 | 4.6 | 70.7 | 59.4 | 1.31 | 8.0 | 7.9 | 4.396 | |||||||||
| Shadow Anchored | 1 | 4,066,388 | 0.4 | 74.5 | 60.4 | 1.37 | 8.6 | 8.3 | 4.410 | |||||||||
| Self Storage | 17 | 102,327,310 | 11.2 | 70.2 | 59.4 | 1.44 | 8.8 | 8.7 | 4.386 | |||||||||
| Self Storage | 17 | 102,327,310 | 11.2 | 70.2 | 59.4 | 1.44 | 8.8 | 8.7 | 4.386 | |||||||||
| Mixed Use | 7 | 82,832,807 | 9.1 | 65.6 | 60.4 | 1.65 | 9.4 | 8.7 | 4.330 | |||||||||
| Office/Retail | 4 | 38,502,807 | 4.2 | 61.8 | 59.1 | 1.88 | 9.8 | 8.6 | 4.241 | |||||||||
| Office/Industrial | 2 | 29,330,000 | 3.2 | 70.3 | 62.2 | 1.37 | 8.7 | 8.3 | 4.528 | |||||||||
| Office/Multifamily | 1 | 15,000,000 | 1.6 | 66.4 | 60.2 | 1.63 | 9.7 | 9.5 | 4.169 | |||||||||
| Multifamily | 7 | 59,625,404 | 6.5 | 69.1 | 59.9 | 1.42 | 9.8 | 9.2 | 4.912 | |||||||||
| Garden | 7 | 59,625,404 | 6.5 | 69.1 | 59.9 | 1.42 | 9.8 | 9.2 | 4.912 | |||||||||
| Other | 1 | 45,000,000 | 4.9 | 60.0 | 60.0 | 1.00 | 2.3 | 2.3 | 2.307 | |||||||||
| Leased Fee | 1 | 45,000,000 | 4.9 | 60.0 | 60.0 | 1.00 | 2.3 | 2.3 | 2.307 | |||||||||
| Industrial | 4 | 27,550,000 | 3.0 | 65.4 | 60.5 | 1.70 | 9.3 | 8.6 | 4.584 | |||||||||
| Warehouse | 3 | 19,750,000 | 2.2 | 66.5 | 59.8 | 1.68 | 9.6 | 8.9 | 4.617 | |||||||||
| Flex | 1 | 7,800,000 | 0.9 | 62.4 | 62.4 | 1.76 | 8.6 | 8.0 | 4.500 | |||||||||
| Total/Weighted Average: | 77 | $914,361,541 | 100.0% | 66.4% | 59.6% | 1.68x | 9.5% | 8.9% | 4.279% |
| (1) | Because this table presents information relating to the mortgaged properties and not the mortgage loans, the information for mortgage loans secured by more than one mortgaged property is based on allocated amounts (allocating the mortgage loan principal balance to each of those properties according to the relative appraised values of the mortgaged properties or the allocated loan amounts or property-specific release prices set forth in the related mortgage loan documents or such other allocation as the related mortgage loan seller deemed appropriate). With respect to the Pari Passu Mortgage Loans, each of which is part of apari passu loan combination, loan-to-value ratio, debt service coverage ratio and debt yield calculations include the relatedpari passu companion loan(s) (unless otherwise stated). With respect to each mortgage loan, debt service coverage ratio, debt yield and loan-to-value ratio information takes no account of subordinate debt (whether or not secured by the related mortgaged property) that is allowed under the terms of such mortgage loan. See Annex A-1 to the Free Writing Prospectus. |
THE INFORMATION IN THIS STRUCTURAL AND COLLATERAL TERM SHEET IS NOT COMPLETE AND MAY BE AMENDED PRIOR TO THE TIME OF SALE. THIS TERM SHEET IS NOT AN OFFER TO SELL THESE SECURITIES AND IT IS NOT A SOLICITATION OF AN OFFER TO BUY THESE SECURITIES IN ANY JURISDICTION WHERE THE OFFER OR SALE IS NOT PERMITTED.
| 12 |
| Wells Fargo Commercial Mortgage Trust 2015-NXS2 | Characteristics of the Mortgage Pool |
| G. | Geographic Distribution(1)(2) |
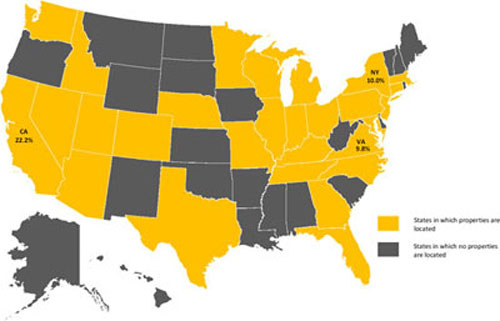
| Location | Number of Mortgaged Properties | Aggregate Cut-off Date Balance ($) | % of Cut-off Date Balance (%) | Weighted Average Cut- off Date LTV Ratio (%) | Weighted Average Balloon or ARD LTV Ratio (%) | Weighted Average U/W NCF DSCR (x) | Weighted Average U/W NOI Debt Yield (%) | Weighted Average U/W NCF Debt Yield (%) | Weighted Average Mortgage Rate (%) | |||||||||
| California | 14 | 203,167,764 | 22.2% | 62.1% | 57.2% | 1.81x | 10.3% | 9.5% | 4.445% | |||||||||
| Northern | 7 | 157,337,764 | 17.2 | 61.5 | 57.8 | 1.88 | 10.4 | 9.6 | 4.419 | |||||||||
| Southern | 7 | 45,830,000 | 5.0 | 64.3 | 55.1 | 1.59 | 9.7 | 9.3 | 4.535 | |||||||||
| New York | 6 | 91,472,326 | 10.0 | 62.9 | 58.6 | 1.28 | 6.5 | 6.0 | 3.501 | |||||||||
| Virginia | 1 | 90,000,000 | 9.8 | 66.8 | 66.8 | 2.18 | 8.2 | 8.1 | 3.658 | |||||||||
| Washington | 4 | 64,900,000 | 7.1 | 68.4 | 64.4 | 1.74 | 9.3 | 8.6 | 4.192 | |||||||||
| Pennsylvania | 5 | 58,433,645 | 6.4 | 70.4 | 57.5 | 1.55 | 10.8 | 9.7 | 4.748 | |||||||||
| Florida | 2 | 49,959,473 | 5.5 | 62.5 | 59.8 | 2.02 | 10.3 | 9.4 | 4.276 | |||||||||
| Kentucky | 8 | 49,563,082 | 5.4 | 72.8 | 63.6 | 1.31 | 8.0 | 7.9 | 4.385 | |||||||||
| Other | 37 | 306,865,250 | 33.6 | 68.5 | 58.0 | 1.59 | 10.2 | 9.5 | 4.496 | |||||||||
| Total/Weighted Average | 77 | $914,361,541 | 100.0% | 66.4% | 59.6% | 1.68x | 9.5% | 8.9% | 4.279% |
| (1) | The Mortgaged Properties are located in 28 states and the District of Columbia. |
| (2) | Because this table presents information relating to the mortgaged properties and not the mortgage loans, the information for mortgage loans secured by more than one mortgaged property is based on allocated amounts (allocating the mortgage loan principal balance to each of those properties according to the relative appraised values of the mortgaged properties or the allocated loan amounts or property-specific release prices set forth in the related mortgage loan documents or such other allocation as the related mortgage loan seller deemed appropriate). With respect to the Pari Passu Mortgage Loans, each of which is part of apari passu loan combination, loan-to-value ratio, debt service coverage ratio and debt yield calculations include the relatedpari passu companion loan(s) (unless otherwise stated). With respect to each mortgage loan, debt service coverage ratio, debt yield and loan-to-value ratio information takes no account of subordinate debt (whether or not secured by the related mortgaged property), if any, that is allowed under the terms of such mortgage loan. See Annex A-1 to the Free Writing Prospectus. |
| (3) | For purposes of determining whether a mortgaged property is in Northern California or Southern California, Northern California includes areas with zip codes above 93600 and Southern California includes areas with zip codes of 93600 and below. |
| (4) | Includes 21 other states and the District of Columbia. |
THE INFORMATION IN THIS STRUCTURAL AND COLLATERAL TERM SHEET IS NOT COMPLETE AND MAY BE AMENDED PRIOR TO THE TIME OF SALE. THIS TERM SHEET IS NOT AN OFFER TO SELL THESE SECURITIES AND IT IS NOT A SOLICITATION OF AN OFFER TO BUY THESE SECURITIES IN ANY JURISDICTION WHERE THE OFFER OR SALE IS NOT PERMITTED.
| 13 |
| Wells Fargo Commercial Mortgage Trust 2015-NXS2 | Characteristics of the Mortgage Pool |
H. Characteristics of the Mortgage Pool(1)
CUT-OFF DATE BALANCE
| Range of Cut-off Date Balances ($) | Number of Mortgage Loans | Aggregate Cut- off Date Balance | % of Cut-off Date Balance | |||||
| 1,597,731 - 2,000,000 | 2 | $3,245,870 | 0.4 | % | ||||
| 2,000,001 - 3,000,000 | 1 | 2,496,593 | 0.3 | |||||
| 3,000,001 - 4,000,000 | 5 | 18,279,430 | 2.0 | |||||
| 4,000,001 - 5,000,000 | 6 | 26,588,283 | 2.9 | |||||
| 5,000,001 - 6,000,000 | 5 | 27,643,108 | 3.0 | |||||
| 6,000,001 - 7,000,000 | 4 | 26,381,859 | 2.9 | |||||
| 7,000,001 - 8,000,000 | 3 | 23,291,452 | 2.5 | |||||
| 8,000,001 - 9,000,000 | 3 | 25,559,119 | 2.8 | |||||
| 9,000,001 - 10,000,000 | 5 | 47,688,994 | 5.2 | |||||
| 10,000,001 - 15,000,000 | 12 | 151,458,399 | 16.6 | |||||
| 15,000,001 - 20,000,000 | 6 | 98,306,714 | 10.8 | |||||
| 20,000,001 - 30,000,000 | 4 | 90,671,720 | 9.9 | |||||
| 30,000,001 - 50,000,000 | 4 | 164,500,000 | 18.0 | |||||
| 50,000,001 - 70,000,000 | 2 | 118,250,000 | 12.9 | |||||
| 80,000,001 - 90,000,000 | 1 | 90,000,000 | 9.8 | |||||
| Total: | 63 | $914,361,541 | 100.0 | % | ||||
| Average: | $14,513,675 | |||||||
UNDERWRITTEN NOI DEBT SERVICE COVERAGE RATIO
| Range of U/W NOI DSCRs (x) | Number of Mortgage Loans | Aggregate Cut- off Date Balance | % of Cut-off Date Balance | |||||
| 1.00 - 1.20 | 1 | $45,000,000 | 4.9 | % | ||||
| 1.21 - 1.30 | 7 | 53,853,567 | 5.9 | |||||
| 1.31 - 1.40 | 7 | 115,006,133 | 12.6 | |||||
| 1.41 - 1.50 | 8 | 69,783,995 | 7.6 | |||||
| 1.51 - 1.60 | 6 | 69,398,139 | 7.6 | |||||
| 1.61 - 1.70 | 5 | 45,020,597 | 4.9 | |||||
| 1.71 - 1.80 | 3 | 27,736,119 | 3.0 | |||||
| 1.81 - 1.90 | 6 | 70,504,268 | 7.7 | |||||
| 1.91 - 2.00 | 5 | 119,028,952 | 13.0 | |||||
| 2.01 - 2.25 | 10 | 231,192,410 | 25.3 | |||||
| 2.26 - 2.50 | 1 | 40,000,000 | 4.4 | |||||
| 2.51 - 2.75 | 1 | 4,260,000 | 0.5 | |||||
| 2.76 - 3.00 | 1 | 7,000,000 | 0.8 | |||||
| 3.51 - 3.83 | 2 | 16,577,361 | 1.8 | |||||
| Total: | 63 | $914,361,541 | 100.0 | % | ||||
| Weighted Average: | 1.80x | |||||||
UNDERWRITTEN NCF DEBT SERVICE COVERAGE RATIO
| Range of U/W NCF DSCRs (x) | Number of Mortgage Loans | Aggregate Cut- off Date Balance | % of Cut-off Date Balance | |||||
| 1.00 - 1.20 | 1 | $45,000,000 | 4.9 | % | ||||
| 1.21 - 1.30 | 7 | 53,853,567 | 5.9 | |||||
| 1.31 - 1.40 | 16 | 189,358,267 | 20.7 | |||||
| 1.41 - 1.50 | 6 | 72,084,268 | 7.9 | |||||
| 1.51 - 1.60 | 6 | 51,714,783 | 5.7 | |||||
| 1.61 - 1.70 | 4 | 54,741,932 | 6.0 | |||||
| 1.71 - 1.80 | 7 | 168,143,144 | 18.4 | |||||
| 1.81 - 1.90 | 5 | 54,438,071 | 6.0 | |||||
| 1.91 - 2.00 | 4 | 64,693,555 | 7.1 | |||||
| 2.01 - 2.25 | 3 | 132,496,593 | 14.5 | |||||
| 2.26 - 2.50 | 1 | 4,260,000 | 0.5 | |||||
| 2.51 - 2.75 | 1 | 7,000,000 | 0.8 | |||||
| 3.01 - 3.50 | 1 | 14,979,630 | 1.6 | |||||
| 3.51 - 3.73 | 1 | 1,597,731 | 0.2 | |||||
| Total: | 63 | $914,361,541 | 100.0 | % | ||||
| Weighted Average: | 1.68x | |||||||
LOAN PURPOSE
| Loan Purpose | Number of Mortgage Loans | Aggregate Cut- off Date Balance | % of Cut-off Date Balance | |||||
| Refinance | 37 | $499,994,629 | 54.7 | % | ||||
| Acquisition | 26 | 414,366,912 | 45.3 | |||||
| Total: | 63 | $914,361,541 | 100.0 | % | ||||
MORTGAGE RATE
| Range of Mortgage Rates (%) | Number of Mortgage Loans | Aggregate Cut- off Date Balance | % of Cut-off Date Balance | |||||
| 2.307 - 3.000 | 1 | $45,000,000 | 4.9 | % | ||||
| 3.501 - 3.750 | 1 | 90,000,000 | 9.8 | |||||
| 3.751 - 4.000 | 1 | 15,955,253 | 1.7 | |||||
| 4.001 - 4.250 | 16 | 186,386,335 | 20.4 | |||||
| 4.251 - 4.500 | 26 | 376,686,163 | 41.2 | |||||
| 4.501 - 4.750 | 7 | 74,875,574 | 8.2 | |||||
| 4.751 - 5.000 | 7 | 93,515,275 | 10.2 | |||||
| 5.001 - 5.250 | 1 | 5,693,340 | 0.6 | |||||
| 5.251 - 5.500 | 2 | 16,999,600 | 1.9 | |||||
| 5.751 - 5.990 | 1 | 9,250,000 | 1.0 | |||||
| Total: | 63 | $914,361,541 | 100.0 | % | ||||
| Weighted Average: | 4.279% | |||||||
UNDERWRITTEN NOI DEBT YIELD
| Range of U/W NOI Debt Yields (%) | Number of Mortgage Loans | Aggregate Cut- off Date Balance | % of Cut-off Date Balance | |||||
| 2.3 - 8.0 | 9 | $157,103,567 | 17.2 | % | ||||
| 8.1 - 9.0 | 16 | 248,296,788 | 27.2 | |||||
| 9.1 - 10.0 | 12 | 212,471,667 | 23.2 | |||||
| 10.1 - 11.0 | 7 | 90,882,341 | 9.9 | |||||
| 11.1 - 12.0 | 8 | 103,325,946 | 11.3 | |||||
| 12.1 - 13.0 | 5 | 55,191,197 | 6.0 | |||||
| 13.1 - 14.0 | 2 | 21,059,119 | 2.3 | |||||
| 14.1 - 15.0 | 1 | 5,193,555 | 0.6 | |||||
| 15.1 - 16.0 | 1 | 4,260,000 | 0.5 | |||||
| 20.1 - 22.9 | 2 | 16,577,361 | 1.8 | |||||
| Total: | 63 | $914,361,541 | 100.0 | % | ||||
| Weighted Average: | 9.5% | |||||||
UNDERWRITTEN NCF DEBT YIELD
| Range of U/W NCF Debt Yields (%) | Number of Mortgage Loans | Aggregate Cut- off Date Balance | % of Cut-off Date Balance | |||||
| 2.3 - 8.0 | 13 | $259,678,567 | 28.4 | % | ||||
| 8.1 - 9.0 | 18 | 252,267,935 | 27.6 | |||||
| 9.1 - 10.0 | 15 | 210,404,854 | 23.0 | |||||
| 10.1 - 11.0 | 7 | 114,130,413 | 12.5 | |||||
| 11.1 - 12.0 | 4 | 36,852,262 | 4.0 | |||||
| 12.1 - 13.0 | 3 | 20,190,148 | 2.2 | |||||
| 13.1 - 14.0 | 1 | 4,260,000 | 0.5 | |||||
| 20.1 - 21.6 | 2 | 16,577,361 | 1.8 | |||||
| Total: | 63 | $914,361,541 | 100.0 | % | ||||
| Weighted Average: | 8.9% | |||||||
| (1) | With respect to the Pari Passu Mortgage Loans, each of which is part of apari passu loan combination, loan-to-value ratio, debt service coverage ratio and debt yield calculations include the relatedpari passu companion loan(s) (unless otherwise stated). With respect to each mortgage loan, debt service coverage ratio, debt yield and loan-to-value ratio information takes no account of subordinate debt (whether or not secured by the related mortgaged property), if any, that is allowed under the terms of such mortgage loan. See Annex A-1 to the Free Writing Prospectus. Prepayment provisions for each mortgage loan reflects the entire life of the loan (from origination to maturity or ARD). |
THE INFORMATION IN THIS STRUCTURAL AND COLLATERAL TERM SHEET IS NOT COMPLETE AND MAY BE AMENDED PRIOR TO THE TIME OF SALE. THIS TERM SHEET IS NOT AN OFFER TO SELL THESE SECURITIES AND IT IS NOT A SOLICITATION OF AN OFFER TO BUY THESE SECURITIES IN ANY JURISDICTION WHERE THE OFFER OR SALE IS NOT PERMITTED.
| 14 |
| Wells Fargo Commercial Mortgage Trust 2015-NXS2 | Characteristics of the Mortgage Pool |
ORIGINAL TERM TO MATURITY OR ARD
| Original Terms to Maturity or ARD (months) | Number of Mortgage Loans | Aggregate Cut- off Date Balance | % of Cut-off Date Balance | |||||
| 60 | 3 | $157,300,000 | 17.2 | % | ||||
| 84 | 1 | 7,800,000 | 0.9 | |||||
| 120 | 58 | 712,761,541 | 78.0 | |||||
| 127 | 1 | 36,500,000 | 4.0 | |||||
| Total: | 63 | $914,361,541 | 100.0 | % | ||||
| Weighted Average: | 110 months | |||||||
REMAINING TERM TO MATURITY OR ARD
| Range of Remaining Terms to Maturity or ARD (months) | Number of Mortgage Loans | Aggregate Cut- off Date Balance | % of Cut-off Date Balance | |||||
| 51 - 60 | 3 | $157,300,000 | 17.2 | % | ||||
| 61 - 84 | 1 | 7,800,000 | 0.9 | |||||
| 85 - 120 | 59 | 749,261,541 | 81.9 | |||||
| Total: | 63 | $914,361,541 | 100.0 | % | ||||
| Weighted Average: | 107 months | |||||||
ORIGINAL AMORTIZATION TERM(2)
| Range of Original Amortization Terms (months) | Number of Mortgage Loans | Aggregate Cut- off Date Balance | % of Cut-off Date Balance | |||||
| Interest-Only | 10 | $332,200,000 | 36.3 | % | ||||
| 300 | 2 | 12,750,000 | 1.4 | |||||
| 301 - 360 | 51 | 569,411,541 | 62.3 | |||||
| Total: | 63 | $914,361,541 | 100.0 | % | ||||
| Weighted Average(3): | 358 months | |||||||
| (2) | The original amortization term shown for any mortgage loan that is interest-only for part of its term does not include the number of months in its interest-only period and reflects only the number of months as of the commencement of amortization remaining from the end of such interest-only period. |
| (3) | Excludes the non-amortizing mortgage loans. |
REMAINING AMORTIZATION TERM(4)
| Range of Remaining Amortization Terms (months) | Number of Mortgage Loans | Aggregate Cut- off Date Balance | % of Cut-off Date Balance | |||||
| Interest-Only | 10 | $332,200,000 | 36.3 | % | ||||
| 300 | 2 | 12,750,000 | 1.4 | |||||
| 301 - 360 | 51 | 569,411,541 | 62.3 | |||||
| Total: | 63 | $914,361,541 | 100.0 | % | ||||
| Weighted Average(5): | 357 months | |||||||
| (4) | The remaining amortization term shown for any mortgage loan that is interest-only for part of its term does not include the number of months in its interest-only period and reflects only the number of months as of the commencement of amortization remaining from the end of such interest-only period. |
| (5) | Excludes the non-amortizing mortgage loans. |
LOCKBOXES
| Type of Lockbox | Number of Mortgage Loans | Aggregate Cut- off Date Balance | % of Cut-off Date Balance | |||||
| Hard | 33 | $452,731,053 | 49.5 | % | ||||
| Springing | 14 | 278,672,774 | 30.5 | |||||
| Soft | 12 | 165,871,121 | 18.1 | |||||
| None | 4 | 17,086,594 | 1.9 | |||||
| Total: | 63 | $914,361,541 | 100.0 | % | ||||
PREPAYMENT PROVISION SUMMARY
| Prepayment Provision | Number of Mortgage Loans | Aggregate Cut- off Date Balance | % of Cut-off Date Balance | |||||
| Lockout/Defeasance/Open | 57 | $782,676,540.96 | 85.6 | % | ||||
| GTR YM or 1%/GTR YM or 1% or Defeasance/Open | 1 | $90,000,000.00 | 9.8 | |||||
| Lockout/GTR YM or 1%/Open | 3 | $23,425,000.00 | 2.6 | |||||
| Lockout/GTR YM or 1% or Defeasance/Open | 2 | $18,260,000.00 | 2.0 | |||||
| Total: | 63 | $914,361,541 | 100.0 | % | ||||
CUT-OFF DATE LOAN-TO-VALUE RATIO
| Range of Cut-off Date LTV Ratios (%) | Number of Mortgage Loans | Aggregate Cut- off Date Balance | % of Cut-off Date Balance | |||||
| 26.6 - 30.0 | 2 | $16,577,361 | 1.8 | % | ||||
| 35.1 - 40.0 | 1 | 4,260,000 | 0.5 | |||||
| 50.1 - 55.0 | 1 | 7,000,000 | 0.8 | |||||
| 55.1 - 60.0 | 4 | 122,852,807 | 13.4 | |||||
| 60.1 - 65.0 | 9 | 185,460,866 | 20.3 | |||||
| 65.1 - 70.0 | 19 | 267,483,152 | 29.3 | |||||
| 70.1 - 75.0 | 26 | 298,144,220 | 32.6 | |||||
| 75.1 - 78.2 | 1 | 12,583,135 | 1.4 | |||||
| Total: | 63 | $914,361,541 | 100.0 | % | ||||
| Weighted Average: | 66.4% | |||||||
BALLOON OR ARD LOAN-TO-VALUE RATIO
| Range of Balloon LTV Ratios (%) | Number of Mortgage Loans | Aggregate Cut- off Date Balance | % of Cut-off Date Balance | |||||
| 21.3 - 25.0 | 2 | $16,577,361 | 1.8 | % | ||||
| 30.1 - 35.0 | 1 | 4,260,000 | 0.5 | |||||
| 45.1 - 50.0 | 4 | 30,713,673 | 3.4 | |||||
| 50.1 - 55.0 | 9 | 121,511,195 | 13.3 | |||||
| 55.1 - 60.0 | 23 | 301,655,441 | 33.0 | |||||
| 60.1 - 65.0 | 17 | 273,843,871 | 29.9 | |||||
| 65.1 - 69.1 | 7 | 165,800,000 | 18.1 | |||||
| Total: | 63 | $914,361,541 | 100.0 | % | ||||
| Weighted Average: | 59.6% | |||||||
AMORTIZATION TYPE
| Type of Amortization | Number of Mortgage Loans | Aggregate Cut- off Date Balance | % of Cut-off Date Balance | |||||
| Interest-only, Amortizing Balloon | 17 | $285,942,500 | 31.3 | % | ||||
| Amortizing Balloon | 32 | 279,153,862 | 30.5 | |||||
| Interest-only, Balloon | 8 | 197,200,000 | 21.6 | |||||
| Interest-only, ARD | 2 | 135,000,000 | 14.8 | |||||
| Amortizing ARD | 4 | 17,065,179 | 1.9 | |||||
| Total: | 63 | $914,361,541 | 100.0 | % | ||||
ORIGINAL TERM OF INTEREST-ONLY PERIOD FOR PARTIAL IO LOANS
| IO Term (months) | Number of Mortgage Loans | Aggregate Cut- off Date Balance | % of Cut-off Date Balance | |||||
| 12 | 1 | $7,000,000 | 0.8 | % | ||||
| 18 | 1 | 12,500,000 | 1.4 | |||||
| 24 | 5 | 105,062,500 | 11.5 | |||||
| 36 | 3 | 90,750,000 | 9.9 | |||||
| 48 | 1 | 12,375,000 | 1.4 | |||||
| 58 | 1 | 15,000,000 | 1.6 | |||||
| 60 | 5 | 43,255,000 | 4.7 | |||||
| Total: | 17 | $285,942,500 | 31.3 | % | ||||
| Weighted Average: | 36 months | |||||||
SEASONING
| Seasoning (months) | Number of Mortgage Loans | Aggregate Cut- off Date Balance | % of Cut-off Date Balance | |||||
| 0 | 12 | $207,260,000 | 22.7 | % | ||||
| 1 | 24 | 290,034,903 | 31.7 | |||||
| 2 | 8 | 83,478,186 | 9.1 | |||||
| 3 | 6 | 64,904,077 | 7.1 | |||||
| 4 | 5 | 66,851,662 | 7.3 | |||||
| 5 | 3 | 12,611,165 | 1.4 | |||||
| 6 | 2 | 17,721,547 | 1.9 | |||||
| 8 | 1 | 45,000,000 | 4.9 | |||||
| 9 | 1 | 90,000,000 | 9.8 | |||||
| 13 | 1 | 36,500,000 | 4.0 | |||||
| Total: | 63 | $914,361,541 | 100.0 | % | ||||
| Weighted Average: | 3 months | |||||||
THE INFORMATION IN THIS STRUCTURAL AND COLLATERAL TERM SHEET IS NOT COMPLETE AND MAY BE AMENDED PRIOR TO THE TIME OF SALE. THIS TERM SHEET IS NOT AN OFFER TO SELL THESE SECURITIES AND IT IS NOT A SOLICITATION OF AN OFFER TO BUY THESE SECURITIES IN ANY JURISDICTION WHERE THE OFFER OR SALE IS NOT PERMITTED.
| 15 |
| Wells Fargo Commercial Mortgage Trust 2015-NXS2 | Certain Terms and Conditions |
V. Certain Terms and Conditions
| Interest Entitlements: | The interest entitlement of each Class of Offered Certificates on each Distribution Date generally will be the interest accrued during the related Interest Accrual Period on the related Certificate Principal Balance or Notional Amount at the related pass-through rate, net of any prepayment interest shortfalls allocated to that Class for such Distribution Date as described below. If prepayment interest shortfalls arise from voluntary prepayments (without Special Servicer consent) on particular non-specially serviced mortgage loans during any collection period, the Master Servicer is required to make a compensating interest payment to offset those shortfalls, generally up to an amount equal to the portion of its master servicing fees that accrue at one basis pointper annum. The remaining amount of prepayment interest shortfalls will be allocated to reduce the interest entitlement on all Classes of Certificates (other than the Class X-A, X-B, X-E, X-F and X-G Certificates),pro rata, based on their respective amounts of accrued interest for the related Distribution Date (except with respect to the allocation among the Class A-S, B, C and PEX Certificates as described below under “Allocations and Distributions on the Class A-S, B, C and PEX Certificates”). If a Class receives less than the entirety of its interest entitlement on any Distribution Date, then the shortfall, excluding any shortfall due to prepayment interest shortfalls, will be added to its interest entitlement for the next succeeding Distribution Date. Interest entitlements on the Class E and D Certificates and the Class C and B regular interests, in that order, may be reduced by certain Trust Advisor expenses (subject to the discussion below under “Allocations and Distributions on the Class A-S, B, C and PEX Certificates”). | |||
| Principal Distribution Amount: | The Principal Distribution Amount for each Distribution Date generally will be the aggregate amount of principal received or advanced in respect of the mortgage loans, net of any non-recoverable advances and interest thereon that are reimbursed to the Master Servicer, the Special Servicer or the Trustee during the related collection period. Non-recoverable advances and interest thereon are reimbursable from principal collections and advances before reimbursement from other amounts. The Principal Distribution Amount may also be reduced, with a corresponding loss, to the Class E and D Certificates and the Class C, B and A-S regular interests, then to the Class A-1, A-2, A-3, A-4, A-5 and A-SB Certificates and Class A-5FX regular interest (with any losses on the Class A-1, A-2, A-3, A-4, A-5 and A-SB Certificates and Class A-5FX regular interest allocatedpro rata according to their respective Certificate Principal Balances immediately prior to that Distribution Date), in that order, in connection with certain Trust Advisor expenses to the extent that interest entitlements on the Class B and C regular interests and the Class D and E Certificates are insufficient to absorb the effect of the expense on any particular Distribution Date. For a discussion on the allocation of amounts distributable in respect of the Class A-S, B and C regular interests, see “Allocations and Distributions on the Class A-S, B, C and PEX Certificates” below. | |||
| Distributions: | On each Distribution Date, funds available for distribution from the mortgage loans, net of specified trust fees, expenses and reimbursements will generally be distributed in the following amounts and order of priority (in each case to the extent of remaining available funds): | |||
| 1. | Class A-1, A-2, A-3, A-4, A-5, A-SB, X-A, X-B, X-E, X-F and X-G Certificates and Class A-5FX regular interest: To interest on the Class A-1, A-2, A-3, A-4, A-5, A-SB, X-A, X-B, X-E, X-F and X-G Certificates and the Class A-5FX regular interest,pro rata, according to their respective interest entitlements. | |||
| 2. | Class A-1, A-2, A-3, A-4, A-5 and A-SB Certificates and Class A-5FX regular interest: To principal on the Class A-1, A-2, A-3, A-4, A-5 and A-SB Certificates and the Class A-5FX regular interest in the following amounts and order of priority: (i) first, to principal on the Class A-SB Certificates, in an amount up to the Principal Distribution Amount for such Distribution Date until their Certificate Principal Balance is reduced to the Class A-SB Planned Principal Balance for such Distribution Date; (ii) second, to principal on the Class A-1 Certificates until their Certificate Principal Balance is reduced to zero, up to the remainder of the Principal Distribution Amount for such Distribution Date; (iii) third, to principal on the Class A-2 Certificates until their Certificate Principal Balance is reduced to zero, up to the remainder of the Principal Distribution Amount for such Distribution Date; (iv) fourth, to principal on the Class A-3 Certificates until their Certificate Principal Balance is reduced to zero, up to the remainder of the Principal Distribution Amount for such Distribution Date; (v) fifth, to principal on the Class A-4 Certificates until their Certificate Principal Balance is reduced to zero, up to the remainder of the Principal Distribution Amount for such Distribution Date; (vi) sixth, on apro rata basis, to principal on the Class A-5 Certificates and the Class A-5FX regular interest until their respective Certificate Principal Balances are reduced to zero, up to the remainder of the Principal Distribution Amount for such Distribution Date; and (vii) seventh, to principal on the Class A-SB Certificates until their Certificate Principal Balance is reduced to zero, up to the remainder of the Principal Distribution Amount for such Distribution Date. However, | |||
THE INFORMATION IN THIS STRUCTURAL AND COLLATERAL TERM SHEET IS NOT COMPLETE AND MAY BE AMENDED PRIOR TO THE TIME OF SALE. THIS TERM SHEET IS NOT AN OFFER TO SELL THESE SECURITIES AND IT IS NOT A SOLICITATION OF AN OFFER TO BUY THESE SECURITIES IN ANY JURISDICTION WHERE THE OFFER OR SALE IS NOT PERMITTED.
| 16 |
| Wells Fargo Commercial Mortgage Trust 2015-NXS2 | Certain Terms and Conditions |
| if the Certificate Principal Balance of each and every Class of Principal Balance Certificates, other than the Class A-1, A-2, A-3, A-4, A-5 and A-SB Certificates and the Class A-5FX regular interest, has been reduced to zero as a result of the allocation of Mortgage Loan losses and expenses and any of the Class A-1, A-2, A-3, A-4, A-5 and A-SB Certificates and Class A-5FX regular interest remains outstanding, then the Principal Distribution Amount will be distributed on the Class A-1, A-2, A-3, A-4, A-5 and A-SB Certificates and the Class A-5FX regular interest,pro rata, based on their respective outstanding Certificate Principal Balances, until their Certificate Principal Balances have been reduced to zero. | ||||
| 3. | Class A-1, A-2, A-3, A-4, A-5 and A-SB Certificates and Class A-5FX regular interest: To reimburse the holders of the Class A-1, A-2, A-3, A-4, A-5 and A-SB Certificates and the Class A-5FX regular interest,pro rata, for any previously unreimbursed losses (other than certain Trust Advisor expenses) on the mortgage loans that were previously allocated in reduction of the Certificate Principal Balances of such Classes. | |||
| 4. | Class A-S regular interest: To make distributions on the Class A-S regular interest as follows: (a) first, to interest on the Class A-S regular interest in the amount of the interest entitlement for that Class; (b) next, to the extent of the portion of the Principal Distribution Amount remaining after distributions in respect of principal to each Class with a higher distribution priority (in this case, the Class A-1, A-2, A-3, A-4, A-5 and A-SB Certificates and the Class A-5FX regular interest), to principal on the Class A-S regular interest until its principal balance is reduced to zero; and (c) next, to reimburse the holders of the Class A-S regular interest for any previously unreimbursed losses (other than certain Trust Advisor expenses) on the mortgage loans that were previously allocated to that Class in reduction of its principal balance. | |||
| 5. | Class B regular interest: To make distributions on the Class B regular interest as follows: (a) first, to interest on the Class B regular interest in the amount of the interest entitlement for that Class; (b) next, to the extent of the portion of the Principal Distribution Amount remaining after distributions in respect of principal to each Class with a higher distribution priority (in this case, the Class A-1, A-2, A-3, A-4, A-5 and A-SB Certificates and the Class A-5FX and A-S regular interests), to principal on the Class B regular interest until its principal balance is reduced to zero; and (c) next, to reimburse the holders of the Class B regular interest for any previously unreimbursed losses (other than certain Trust Advisor expenses) on the mortgage loans that were previously allocated to that Class in reduction of its principal balance. | |||
| 6. | Class C regular interest: To make distributions on the Class C regular interest as follows: (a) first, to interest on the Class C regular interest in the amount of the interest entitlement for that Class; (b) next, to the extent of the portion of the Principal Distribution Amount remaining after distributions in respect of principal to each Class with a higher distribution priority (in this case, the Class A-1, A-2, A-3, A-4, A-5 and A-SB Certificates and the Class A-5FX, A-S and B regular interests), to principal on the Class C regular interest until its principal balance is reduced to zero; and (c) next, to reimburse the holders of the Class C regular interest for any previously unreimbursed losses (other than certain Trust Advisor expenses) on the mortgage loans that were previously allocated to that Class in reduction of its principal balance. | |||
| 7. | Class D Certificates: To make distributions on the Class D Certificates as follows: (a) first, to interest on the Class D Certificates in the amount of the interest entitlement for that Class; (b) next, to the extent of the portion of the Principal Distribution Amount remaining after distributions in respect of principal to each Class with a higher distribution priority (in this case, the Class A-1, A-2, A-3, A-4, A-5 and A-SB Certificates and the Class A-5FX, A-S, B and C regular interests), to principal on the Class D Certificates until its principal balance is reduced to zero; and (c) next, to reimburse the holders of the Class D Certificates for any previously unreimbursed losses (other than certain Trust Advisor expenses) on the mortgage loans that were previously allocated to that Class in reduction of its principal balance. | |||
| 8. | After the Class A-1, A-2, A-3, A-4, A-5 and A-SB Certificates, the Class A-5FX, A-S, B and C regular interests and the Class D Certificates are paid all amounts to which they are entitled, the remaining funds available for distribution will be used to pay interest, principal and loss reimbursement amounts (other than certain Trust Advisor expenses) on the Class E, F and G Certificates sequentially in that order in a manner analogous to the Class D Certificates. |
THE INFORMATION IN THIS STRUCTURAL AND COLLATERAL TERM SHEET IS NOT COMPLETE AND MAY BE AMENDED PRIOR TO THE TIME OF SALE. THIS TERM SHEET IS NOT AN OFFER TO SELL THESE SECURITIES AND IT IS NOT A SOLICITATION OF AN OFFER TO BUY THESE SECURITIES IN ANY JURISDICTION WHERE THE OFFER OR SALE IS NOT PERMITTED.
| 17 |
| Wells Fargo Commercial Mortgage Trust 2015-NXS2 | Certain Terms and Conditions |
| Allocations and Distributions on the Class A-S, B, C and PEX Certificates: | On the closing date, the upper-tier REMIC of the issuing entity will issue the Class A-S, Class B and Class C regular interests (each a “regular interest”) which will have outstanding principal balances on the closing date of $51,432,000, $73,149,000 and $36,575,000, respectively. The regular interests will be held in a grantor trust for the benefit of the holders of the Class A-S, B, C and PEX Certificates. The Class A-S, B, C and PEX Certificates will, at all times, represent undivided beneficial ownership interests in a grantor trust that will hold those regular interests. Each class of the Class A-S, B and C Certificates will, at all times, represent an undivided beneficial ownership interest in a percentage of the outstanding principal balance of the regular interest with the same alphabetical class designation. The Class PEX Certificates will, at all times, represent an undivided beneficial ownership interest in the remaining percentages of the outstanding principal balances of the Class A-S, B and C regular interests and which percentage interests are referred to in this Term Sheet as, respectively, “Class PEX Component A-S”, “Class PEX Component B” and “Class PEX Component C” (collectively, the “Class PEX Components”). | |
| Interest, principal, prepayment premiums, yield maintenance charges and voting rights that are allocated to the Class A-S, B or C regular interest will be distributed or allocated, as applicable, as between the Class A-S, B or C Certificates, as applicable, on the one hand, and Class PEX Component A-S, Class PEX Component B or Class PEX Component C, as applicable (and correspondingly, the Class PEX Certificates), on the other hand,pro rata, based on their respective percentage interests in the Class A-S, Class B or Class C regular interests, as applicable. In addition, any losses (including, without limitation, as a result of Trust Advisor expenses) that are allocated to the Class A-S, Class B or Class C regular interests will correspondingly be allocated as between the Class A-S, B or C Certificates, as applicable, on the one hand, and Class PEX Component A-S, Class PEX Component B or Class PEX Component C, as applicable (and correspondingly, the Class PEX Certificates), on the other hand,pro rata, based on their respective percentage interests in the Class A-S, Class B or Class C regular interests, as applicable. For a complete description of the allocations and distributions with respect to the Class A-S regular interest, the Class B regular interest and the Class C regular interest (and correspondingly the Class A-S, B, C and PEX Certificates and the Class PEX Component A-S, Class PEX Component B and Class PEX Component C), see “Description of the Offered Certificates” in the Free Writing Prospectus. See “Material Federal Income Tax Consequences” in the Free Writing Prospectus for a discussion of the tax treatment of the Exchangeable Certificates. | ||
| Exchanging Certificates through Combination and Recombination: | If you own Class A-S, B and C Certificates, you will be able to exchange them for a proportionate interest in the Class PEX Certificates, and vice versa, as described in the Free Writing Prospectus. You can exchange your Exchangeable Certificates by notifying the Certificate Administrator. If Exchangeable Certificates are outstanding and held by certificateholders, those certificates will receive principal and interest that would otherwise have been payable on the same proportion of certificates exchanged therefor if those certificates were outstanding and held by certificateholders. Any such allocations of principal and interest between classes of Exchangeable Certificates will have no effect on the principal or interest entitlements of any other class of certificates. The Free Writing Prospectus describes the available combinations of Exchangeable Certificates eligible for exchange. | |
| Allocation of Yield Maintenance and Prepayment Premiums: | If any yield maintenance charge or prepayment premium is collected during any particular collection period with respect to any mortgage loan, then on the distribution date corresponding to that collection period, the certificate administrator will pay that yield maintenance charge or prepayment premium (net of liquidation fees payable therefrom) in the following manner: (1) to each of the Class A-1, A-2, A-3, A-4, A-5, A-SB and D Certificates and Class A-5FX, A-S, B and C regular interests, the product of (a) such yield maintenance charge or prepayment premium, (b) the related Base Interest Fraction (as defined in the Free Writing Prospectus) for such class or regular interest, and (c) a fraction, the numerator of which is equal to the amount of principal distributed to such class or regular interest for that distribution date, and the denominator of which is the total amount of principal distributed to all Principal Balance Certificates (other than the Class A-5FX and A-5FL Certificates and the Exchangeable Certificates) and the Class A-5FX, A-S, B and C regular interests for that distribution date, and (2) to the Class X-A Certificates, the excess, if any, of (a) the product of (i) such yield maintenance charge or prepayment premium and (ii) a fraction, the numerator of which is equal to the amount of principal distributed to the Class A-1, A-2, A-3, A-4, A-5, A-SB Certificates and Class A-5FX and A-S regular interests for that distribution date, and the denominator of which is the total amount of principal distributed to all Principal Balance Certificates (other than the Class A-5FX and A-5FL Certificates and the Exchangeable Certificates) and the Class A-5FX, A-S, B and C regular interests for that distribution date, over (b) the amount of such yield maintenance charge or prepayment premium distributed to the Class A-1, A-2, A-3, A-4, A-5, A-SB Certificates and Class A-5FX and A-S regular interests as described above, and (3) to the Class X-B Certificates, any remaining such yield maintenance charge or prepayment premium not distributed as described above. No prepayment premiums or yield maintenance charges will be distributed to the holders of the Class X-E, X-F, X-G, E, F, G, V or R Certificates. For a description of when prepayment premiums and yield maintenance charges are generally required on the mortgage loans, see Annex A-1 to the |
THE INFORMATION IN THIS STRUCTURAL AND COLLATERAL TERM SHEET IS NOT COMPLETE AND MAY BE AMENDED PRIOR TO THE TIME OF SALE. THIS TERM SHEET IS NOT AN OFFER TO SELL THESE SECURITIES AND IT IS NOT A SOLICITATION OF AN OFFER TO BUY THESE SECURITIES IN ANY JURISDICTION WHERE THE OFFER OR SALE IS NOT PERMITTED.
| 18 |
| Wells Fargo Commercial Mortgage Trust 2015-NXS2 | Certain Terms and Conditions |
| Free Writing Prospectus. See also “Risk Factors—Prepayments and Repurchases of the Mortgage Assets Will Affect the Timing of Your Cash Flow and May Affect Your Yield” in the prospectus attached to the Free Writing Prospectus. Prepayment premiums and yield maintenance charges will be distributed on each Distribution Date only to the extent they are actually received on the mortgage loans as of the related Determination Date. | ||
| Realized Losses: | The Certificate Principal Balances of the Class A-1, A-2, A-3, A-4, A-5, A-SB, D, E, F and G Certificates, and the Class A-5FX, A-S, B and C regular interests will be reduced without distribution on any Distribution Date as a write-off to the extent of any losses realized on the mortgage loans allocated to such Class or regular interest on such Distribution Date. Such losses (other than certain Trust Advisor expenses) will be applied in the following order, in each case until the related Certificate Principal Balance is reduced to zero: first, to Class G; second, to Class F; third, to Class E; fourth, to Class D; fifth, to the Class C regular interest; sixth, to the Class B regular interest; seventh, to the Class A-S regular interest; and, finally,pro rata, to Classes A-1, A-2, A-3, A-4, A-5 and A-SB Certificates and the Class A-5FX regular interest based on their outstanding Certificate Principal Balances. Certain Trust Advisor expenses (if not absorbed by reductions of interest entitlements on the Class E and D Certificates and the Class C and B regular interests) will be applied as write-offs in a similar manner, except that such write-offs will be applied only to the Class E and D Certificates, the Class C, B and A-S regular interests, and the Class A-1, A-2, A-3, A-4, A-5 and A-SB Certificates and the Class A-5FX regular interest (with any write-offs on the Class A-1, A-2, A-3, A-4, A-5 and A-SB Certificates and the Class A-5FX regular interest to be allocatedpro rata according to their respective Certificate Principal Balances immediately prior to that Distribution Date), in that order. Any realized losses allocated to the Class A-S, B and C regular interests will, in turn, be allocated to the Class A-S, B, C and PEX Certificates as described above in “Allocations and Distributions on the Class A-S, B, C and PEX Certificates”. | |
| The notional amount of the Class X-A Certificates will be reduced by the amount of all losses that are allocated to the Class A-1, A-2, A-3, A-4, A-5 or A-SB Certificates or the Class A-5FX or A-S regular interests as write-offs in reduction of their Certificate Principal Balances. The notional amount of the Class X-B Certificates will be reduced by the amount of all losses that are allocated to the Class B and C regular interests as write-offs in reduction of their Certificate Principal Balances. The notional amount of the Class X-E Certificates will be reduced by the amount of all losses that are allocated to the Class E Certificates as write-offs in reduction of its Certificate Principal Balance. The notional amount of the Class X-F Certificates will be reduced by the amount of all losses that are allocated to the Class F Certificates as write-offs in reduction of its Certificate Principal Balance. The notional amount of the Class X-G Certificates will be reduced by the amount of all losses that are allocated to the Class G Certificates as write-offs in reduction of its Certificate Principal Balance. | ||
| Debt Service Advances: | The Master Servicer or, if the Master Servicer fails to do so, the Trustee, will be obligated to advance delinquent debt service payments (other than balloon payments and default interest) and assumed debt service payments on the mortgage loans (including eachpari passu mortgage loan but not its relatedpari passucompanion loans), except to the extent any such advance is deemed non-recoverable from collections on the related mortgage loan. In addition, if an Appraisal Reduction Amount exists for a given mortgage loan, the interest portion of any debt service advance for such mortgage loan will be reduced, which will have the effect of reducing the amount of interest available for distribution to the Certificates in reverse alphabetical order of their Class designations (except that interest payments on the Class A-1, A-2, A-3, A-4, A-5, A-SB, X-A, X-B, X-E, X-F and X-G Certificates and the Class A-5FX regular interest would be affected on apari passu basis). | |
| Servicing Advances: | The Master Servicer or, if the Master Servicer fails to do so, the Trustee, will be obligated to make servicing advances with respect to each mortgage loan it services, including the payment of delinquent property taxes, insurance premiums and ground rent, except to the extent that those advances are deemed non-recoverable from collections on the related mortgage loan. The master servicer under the WFCM 2015-NXS1 securitization will have the primary obligation to make any servicing advances with respect to the Patriots Park loan combination, the Stanford Research Park loan combination and the Hotel Andra loan combination. The master servicer under the WFCM 2015-NXS2 securitization will have the primary obligation to make any servicing advances with respect to the 100 West 57th Street loan combination and the Cooper’s Crossing loan combination. | |
| Appraisal Reduction Amounts: | An Appraisal Reduction Amount generally will be created in the amount, if any, by which the principal balance of a required appraisal loan (which is a mortgage loan with respect to which certain defaults, modifications or insolvency events have occurred as further described in the Free Writing Prospectus) plus other amounts overdue or advanced in connection with such mortgage loan exceeds 90% of the appraised value of the related mortgaged property plus certain escrows |
THE INFORMATION IN THIS STRUCTURAL AND COLLATERAL TERM SHEET IS NOT COMPLETE AND MAY BE AMENDED PRIOR TO THE TIME OF SALE. THIS TERM SHEET IS NOT AN OFFER TO SELL THESE SECURITIES AND IT IS NOT A SOLICITATION OF AN OFFER TO BUY THESE SECURITIES IN ANY JURISDICTION WHERE THE OFFER OR SALE IS NOT PERMITTED.
| 19 |
| Wells Fargo Commercial Mortgage Trust 2015-NXS2 | Certain Terms and Conditions |
| and reserves (including letters of credit) held with respect to the mortgage loan. | ||
| A mortgage loan will cease to be a required appraisal loan when the same has ceased to be a specially serviced mortgage loan (if applicable), has been brought current for at least three consecutive months and no other circumstances exist that would cause such mortgage loan to be a required appraisal loan. | ||
| Appraisal Reduction Amounts will affect the amount of debt service advances on the related mortgage loan. Appraisal Reduction Amounts will also be taken into account in the determination of the identity of the Class whose majority constitutes the “majority subordinate certificateholder” and is entitled to appoint the subordinate class representative. | ||
| Clean-Up Call and Exchange Termination: | On each Distribution Date occurring after the aggregate unpaid principal balance of the mortgage loans is reduced below 1% of the initial aggregate principal balance of the mortgage loans as of the Cut-off Date, certain specified persons will have the option to purchase all of the remaining mortgage loans (and the trust’s interest in all property acquired through exercise of remedies in respect of any mortgage loan) at the price specified in the Free Writing Prospectus. Exercise of the option will terminate the trust and retire the then-outstanding certificates. | |
| If the aggregate Certificate Principal Balances of each of the Class A-1, A-2, A-3, A-4, A-5, A-SB, PEX and D Certificates and the Class A-5FX, A-S, B and C regular interests have been reduced to zero, the trust may also be terminated in connection with an exchange of all the then-outstanding certificates, for the mortgage loans and REO properties then remaining in the issuing entity, but all of the holders of those Classes of outstanding certificates would have to voluntarily participate in the exchange. | ||
| Liquidation Loan Waterfall: | Following the liquidation of any loan or property, the net liquidation proceeds generally will be applied (after reimbursement of advances and certain trust fund expenses), first, as a recovery of accrued interest, other than delinquent interest that was not advanced as a result of Appraisal Reduction Amounts, second, as a recovery of principal until all principal has been recovered, and then as a recovery of delinquent interest that was not advanced as a result of Appraisal Reduction Amounts. Please see “Description of the Offered Certificates—Distributions—Application of Mortgage Loan Collections” in the Free Writing Prospectus. | |
| Majority Subordinate Certificateholder and Subordinate Class Representative: | A subordinate class representative may be appointed by the “majority subordinate certificate-holder”, which will be the holder(s) of a majority of: (a) during a “subordinate control period”, the most subordinate class among the Class F and G Certificates that has a Certificate Principal Balance, as notionally reduced by any Appraisal Reduction Amounts allocable to that class, that is at least equal to 25% of its total initial principal balance and (b) during a “collective consultation period”, the most subordinate class among the Class F and G Certificates that has a total principal balance, without regard to Appraisal Reduction Amounts, that is at least equal to 25% of its initial Certificate Principal Balance. The majority subordinate certificateholder will have a continuing right to appoint, remove or replace the subordinate class representative in its sole discretion. This right may be exercised at any time and from time to time. See “Servicing of the Mortgage Loans and Administration of the Trust Fund—The Majority Subordinate Certificateholder and the Subordinate Class Representative” in the Free Writing Prospectus. | |
| Control and Consultation: | The rights of various parties to replace the Special Servicer and approve or consult with respect to major actions of the Special Servicer will vary according to defined periods. A “subordinate control period” will exist as long as the Class F Certificates have a Certificate Principal Balance, net of any Appraisal Reduction Amounts allocable to that class, that is not less than 25% of the initial principal balance of that class (unless a senior consultation period is deemed to occur generally or with respect to a particular mortgage loan, pursuant to clause (ii) of the definition of “senior consultation period”). In general, during a subordinate control period, (i) the subordinate class representative will be entitled to grant or withhold approval of asset status reports prepared, and material servicing actions proposed, by the Special Servicer, and (ii) the majority subordinate certificateholder, or the subordinate class representative on its behalf, will be entitled to terminate and replace the Special Servicer with or without cause, and appoint itself or another person as the successor special servicer (other than with respect to the Patriots Park loan combination, the Stanford Research Park loan combination and the Hotel Andra loan combination). It will be a condition to such appointment that DBRS, KBRA and Moody’s confirm that the appointment would not result in a qualification, downgrade or withdrawal of any of their then-current ratings of certificates. A “collective consultation period” will exist as long as the Class F Certificates have a Certificate Principal Balance that both (i) as notionally reduced by any Appraisal Reduction Amounts allocable to that class, is less than 25% of its initial principal balance and (ii) without regard to any Appraisal Reduction Amounts allocable to that class, is 25% or more of its initial Certificate Principal Balance (unless a senior consultation period is deemed to occur generally or |
THE INFORMATION IN THIS STRUCTURAL AND COLLATERAL TERM SHEET IS NOT COMPLETE AND MAY BE AMENDED PRIOR TO THE TIME OF SALE. THIS TERM SHEET IS NOT AN OFFER TO SELL THESE SECURITIES AND IT IS NOT A SOLICITATION OF AN OFFER TO BUY THESE SECURITIES IN ANY JURISDICTION WHERE THE OFFER OR SALE IS NOT PERMITTED.
| 20 |
| Wells Fargo Commercial Mortgage Trust 2015-NXS2 | Certain Terms and Conditions |
| with respect to a particular mortgage loan, pursuant to clause (ii) of the definition of “senior consultation period”). In general, during a collective consultation period, the Special Servicer will be required to consult with the Trust Advisor (in addition to the subordinate class representative, during a collective consultation period) in connection with asset status reports and material special servicing actions. A “senior consultation period” will exist as long as either (i) the Class F certificates have an aggregate principal balance, without regard to any Appraisal Reduction Amounts allocable to that class, that is less than 25% of its initial principal balance or (ii) during such time as the Class F certificates are the most subordinate class of control-eligible certificates that have a then outstanding principal balance, net of Appraisal Reduction Amounts, at least equal to 25% of its initial principal balance, the then-majority subordinate certificateholder has irrevocably waived its right to appoint a subordinate class representative and to exercise any of the rights of the majority subordinate certificateholder or cause the exercise of the rights of the subordinate class representative and such rights have not been reinstated to a successor majority subordinate certificateholder as set forth in the pooling and servicing agreement. In general, during a senior consultation period, the Special Servicer must seek to consult with the Trust Advisor in connection with asset status reports and material special servicing actions, and, in general, no subordinate class representative will be recognized or have any right to terminate the Special Servicer or approve, direct or consult with respect to servicing matters. With respect to the 100 West 57th Street mortgage loan and the Cooper’s Crossing mortgage loan, the rights of the subordinate class representative described above will be subject to the consultation rights of the holder of the relatedpari passu companion loans as described under “Loan Combinations” below. | ||
| Notwithstanding any contrary description set forth above, with respect to the Patriots Park mortgage loan, the Stanford Research Park mortgage loan and the Hotel Andra mortgage loan, in general the related loan combination will be serviced under the WFCM 2015-NXS1 pooling and servicing agreement which grants to the related subordinate class representative control rights that include the right to approve or disapprove various material servicing actions involving the related loan combination but the subordinate class representative for this securitization will nonetheless have the right to be consulted on a non-binding basis with respect to such actions. For purposes of the servicing of the Patriots Park loan combination, the Stanford Research Park loan combination and the Hotel Andra loan combination, the occurrence and continuance of a collective consultation period or senior consultation period with respect to the subordinate class representative under this securitization will not limit the control or other rights of the subordinate class representative under the WFCM 2015-NXS1 securitization, but any collective consultation period or senior consultation period under the WFCM 2015-NXS1 securitization will operate to prevent the exercise of the consultation rights of the subordinate class representative. In general, loan combination control rights also include the right, in certain circumstances, to direct the replacement of the applicable special servicer for the related loan combination only. | ||
| Also, notwithstanding any contrary description set forth above, with respect to the 100 West 57th Street mortgage loan and the Cooper’s Crossing mortgage loan, (a) each holder of apari passu companion loan in the related loan combination (including any subordinate class representative or special servicer under any securitization of suchpari passu companion loan) will have consultation rights with respect to asset status reports and material special servicing actions involving the related loan combination, as provided for in the related intercreditor agreement and as described in the Free Writing Prospectus, and those rights will be in addition to the rights of the subordinate class representative in this transaction described above; and (b) the existence of a subordinate control period, collective consultation period or senior consultation period under the WFCM 2015-NXS2 pooling and servicing agreement will not limit the consultation rights of the holders of the relatedpari passu companion loans. | ||
| In general, loan combination control rights also include the right, in certain circumstances, to direct the replacement of the special servicer for the related loan combination only. | ||
| Notwithstanding any contrary description set forth above, in the event that, with respect to any mortgage loan, the majority subordinate certificateholder or the subordinate class representative is a borrower, a manager of a related mortgaged property, an affiliate of any borrower or manager of a related mortgaged property, or an agent, principal, partner, member, joint venturer, limited partner, employee, representative, director, trustee, advisor or investor in or of a borrower, a manager of a related mortgaged property or an affiliate of any borrower, the majority subordinate certificateholder and the subordinate class representative will have no right to receive asset status reports, to grant or withhold approval of, or consult with respect to, asset status reports prepared, and material servicing actions proposed, by the Special Servicer, with respect to such mortgage loan. |
THE INFORMATION IN THIS STRUCTURAL AND COLLATERAL TERM SHEET IS NOT COMPLETE AND MAY BE AMENDED PRIOR TO THE TIME OF SALE. THIS TERM SHEET IS NOT AN OFFER TO SELL THESE SECURITIES AND IT IS NOT A SOLICITATION OF AN OFFER TO BUY THESE SECURITIES IN ANY JURISDICTION WHERE THE OFFER OR SALE IS NOT PERMITTED.
| 21 |
| Wells Fargo Commercial Mortgage Trust 2015-NXS2 | Certain Terms and Conditions |
| Replacement of Special Servicer by General Vote of Certificateholders: | During any “collective consultation period” or “senior consultation period”, the Special Servicer may be terminated and replaced upon the affirmative direction of certificate owners holding not less than 75% of the appraisal-reduced voting rights of all certificates, following a proposal from certificate owners holding not less than 25% of the appraisal-reduced voting rights of all certificates. The certificateholders who initiate a vote on a termination and replacement of the Special Servicer without cause must cause DBRS, KBRA and Moody’s to confirm the then-current ratings of the certificates (or decline to review the matter) and cause the payment of the fees and expenses incurred in the replacement. | |
| Appraisal Remedy: | Solely for purposes of determining whether a “subordinate control period” is in effect, whenever the Special Servicer obtains an appraisal or updated appraisal under the pooling and servicing agreement, the subordinate class representative, with respect to the mortgage loans serviced by the Special Servicer will have the right (at its or their expense) to direct the Special Servicer to hire a qualified appraiser to prepare a second appraisal of the mortgaged property. The Special Servicer must thereafter determine whether, based on its assessment of such second appraisal, any recalculation of the Appraisal Reduction Amount is warranted. The Appraisal Reduction Amount, whether based on the first or the second appraisal, will become effective following the second appraisal, except that the Appraisal Reduction Amount based on the first appraisal shall become effective if the subordinate class representative declines to demand a second appraisal within a specified number of business days, or if a second appraisal is not received within 90 days after the direction of the subordinate class representative. In addition, for the same purposes, if there is a material change in the mortgaged property securing any mortgage loan for which an Appraisal Reduction Amount has been calculated, the majority certificateholder of the Class F or G Certificates or other designated certificateholders will be entitled (at its expense) to present an additional appraisal to the Special Servicer, which will generally be required to recalculate the Appraisal Reduction Amount based upon such additional appraisal. This latter right may not be exercised more frequently than once in any 12-month period for each mortgage loan for which an Appraisal Reduction Amount was calculated and can only be exercised during a subordinate control period or a collective consultation period as further described in the Free Writing Prospectus. | |
| Sale of Defaulted Assets: | There will be no “fair value” purchase option. Instead, the pooling and servicing agreement will authorize the Special Servicer to sell defaulted mortgage loans serviced by the Special Servicer to the highest bidder in a manner generally similar to sales of REO properties. The sale of a defaulted loan (other than with respect to the Patriots Park mortgage loan, the Stanford Research Park mortgage loan and the Hotel Andra mortgage loan) for less than par plus accrued interest and certain other fees and expenses owed on the loan will be subject to consent or consultation rights of the subordinate class representative and/or Trust Advisor and, in the case of the100 West 57th Street mortgage loan and the Cooper’s Crossing mortgage loan, consultation rights of the holders of the relatedpari passu companion loans, as described in the Free Writing Prospectus. | |
| In the case of the Patriots Park mortgage loan, the Stanford Research Park mortgage loan and the Hotel Andra mortgage loan, pursuant to the related intercreditor agreement and the WFCM 2015-NXS1 pooling and servicing agreement, the WFCM 2015-NXS1 special servicer may offer to sell to any person (or may offer to purchase) for cash the related loan combination during such time as the relatedpari passu companion loan constitutes a defaulted mortgage loan under the WFCM 2015-NXS1 pooling and servicing agreement, and, in connection with any such sale, the WFCM 2015-NXS1 special servicer is required to sell both the applicable mortgage loan and the relatedpari passu companion loan as a whole loan. The subordinate class representative for this securitization will have consultation rights as the holder of an interest in the relatedpari passu mortgage loan, as described in the Free Writing Prospectus. | ||
| “As-Is” Appraisals: | Appraisals must be conducted on an “as-is” basis, and must be no more than 9 months old, for purposes of determining Appraisal Reduction Amounts, market value in connection with REO sales, etc. Required appraisals may consist of updates of prior appraisals. Internal valuations by the Special Servicer are permitted if the principal balance of a mortgage loan is less than $2,000,000. | |
| Trust Advisor: | The Trust Advisor will perform certain review duties that will generally include a limited annual review of and report regarding the Special Servicer to the Certificate Administrator. The review and report generally will be based on: (a) during a collective consultation period or senior consultation period, any asset status reports and additional information delivered to the Trust Advisor by the Special Servicer with respect to any mortgage loan serviced by the Special Servicer, and/or (b) during a senior consultation period, in addition to the applicable information described above, a meeting with the Special Servicer to conduct a limited review of the Special Servicer’s operational practices on a platform basis in light of the servicing standard. In addition, during any collective consultation period or senior consultation period, the Special Servicer must seek to consult with the Trust Advisor (in addition to the subordinate class representative during a |
THE INFORMATION IN THIS STRUCTURAL AND COLLATERAL TERM SHEET IS NOT COMPLETE AND MAY BE AMENDED PRIOR TO THE TIME OF SALE. THIS TERM SHEET IS NOT AN OFFER TO SELL THESE SECURITIES AND IT IS NOT A SOLICITATION OF AN OFFER TO BUY THESE SECURITIES IN ANY JURISDICTION WHERE THE OFFER OR SALE IS NOT PERMITTED.
| 22 |
| Wells Fargo Commercial Mortgage Trust 2015-NXS2 | Certain Terms and Conditions |
| collective consultation period) in connection with material special servicing actions with respect to specially serviced mortgage loans serviced by the Special Servicer. Furthermore, under certain circumstances, but only during a senior consultation period, the Trust Advisor may recommend the replacement of the Special Servicer, in which case the Certificate Administrator will deliver notice of such recommendation to the certificateholders, and certificateholders with specified percentages of the voting rights may direct the replacement of the Special Servicer at their expense. | ||
| The Trust Advisor may be removed and replaced without cause upon the affirmative direction of certificates owners holding not less than 75% of the appraisal-reduced voting rights of all certificates, following a proposal from certificate owners holding not less than 25% of the appraisal-reduced voting rights of all certificates. The certificateholders who initiate a vote on a termination and replacement of the Trust Advisor without cause must cause DBRS, KBRA and Moody’s to confirm the then-current ratings of the certificates (or decline to review the matter) and cause the payment of the fees and expenses incurred in the replacement. During any “subordinate control period”, the proposed replacement trust advisor will be subject to the subordinate class representative’s consent (such consent not to be unreasonably withheld). If a proposed termination and replacement of the Trust Advisor is not consummated within 180 days following the initial request of the certificateholders who requested a vote, the proposed termination and replacement shall have no further force or effect. The Trust Advisor generally may be discharged from its duties if and when the Class A-1, A-2, A-3, A-4, A-5, A-5FL, A-5FX, A-SB, A-S, B, C, PEX, D and E Certificates are retired. | ||
| Certain Fee Offsets: | If a workout fee is earned by the Special Servicer following a loan default with respect to any mortgage loan that it services, then certain limitations will apply to the collection and retention of a modification fee from the borrower. The modification fee generally must not exceed 1% of the principal balance of the loan as modified. In addition, if the loan re-defaults within a specified period of months and other conditions are satisfied, any subsequent workout or liquidation fee on that loan must be reduced by a portion of the previously-collected modification fee. Furthermore, workout fees, liquidation fees and modification fees collected with respect to any workout, liquidation and/or partial liquidation of a mortgage loan or loan combination that is serviced by the Special Servicer will be subject to an aggregate cap equal to the greater of (i) $1,000,000 and (ii) 1.00% of the stated principal balance of the subject mortgage loan or loan combination. | |
| Deal Website: | The Certificate Administrator will be required to maintain a deal website which will include, among other items: (a) summaries of asset status reports prepared by the Special Servicer, (b) inspection reports, (c) appraisals, (d) various “special notices” described in the Free Writing Prospectus, (e) the “Investor Q&A Forum” and (f) a voluntary “Investor Registry”. Investors may access the deal website following execution of a certification and confidentiality agreement. | |
| Initial Majority Subordinate Certificateholder: | It is expected that RREF II CMBS AIV, LP or another affiliate of Rialto Capital Advisors, LLC will be the initial majority subordinate certificateholder. | |
| Loan Combinations: | Each of the mortgaged properties identified on Annex A-1 to the Free Writing Prospectus as Patriots Park, 100 West 57th Street, Stanford Research Park, Cooper’s Crossing and Hotel Andra secures both a mortgage loan to be included in the trust fund and one or more other mortgage loans that will not be included in the trust fund, which will bepari passuin right of payment with the trust mortgage loan.We refer to each such group of mortgage loans as a “loan combination”. The 100 West 57th Street loan combination and the Cooper’s Crossing loan combination will be principally serviced under the pooling and servicing agreement. ThePatriots Park loan combination, Stanford Research Park loan combination and Hotel Andra loan combination will be principally serviced under the pooling and servicing agreement for the WFCM 2015-NXS1 securitization. | |
| As of the closing date, thepari passu companion loans in such loan combinations will be held by the parties identified above under “IV. Characteristics of the Mortgage Pool—B. Summary of Pari Passu Loan Combinations”. |
THE INFORMATION IN THIS STRUCTURAL AND COLLATERAL TERM SHEET IS NOT COMPLETE AND MAY BE AMENDED PRIOR TO THE TIME OF SALE. THIS TERM SHEET IS NOT AN OFFER TO SELL THESE SECURITIES AND IT IS NOT A SOLICITATION OF AN OFFER TO BUY THESE SECURITIES IN ANY JURISDICTION WHERE THE OFFER OR SALE IS NOT PERMITTED.
| 23 |
| PATRIOTS PARK |
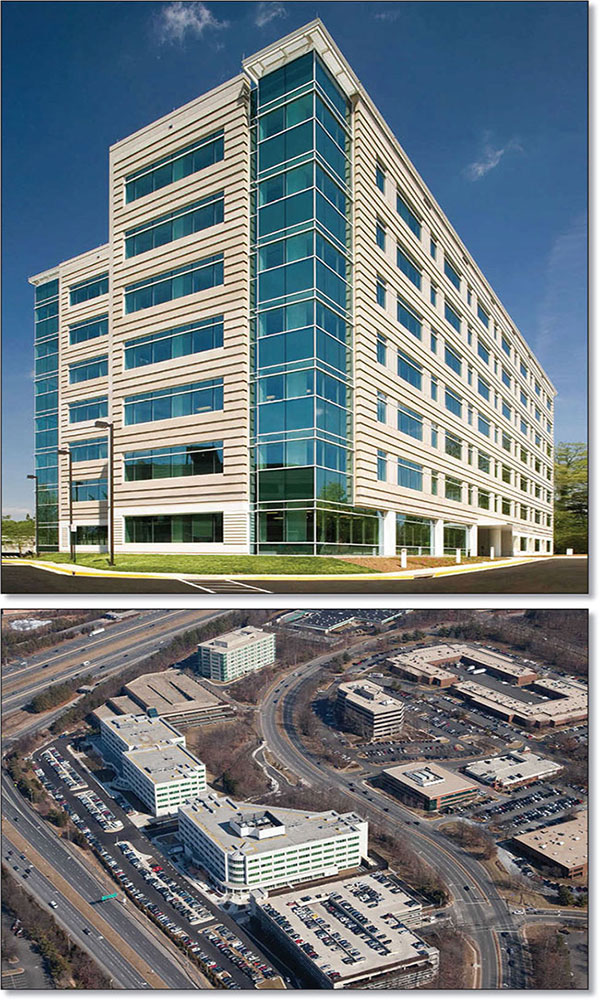
THE INFORMATION IN THIS STRUCTURAL AND COLLATERAL TERM SHEET IS NOT COMPLETE AND MAY BE AMENDED PRIOR TO THE TIME OF SALE. THIS TERM SHEET IS NOT AN OFFER TO SELL THESE SECURITIES AND IT IS NOT A SOLICITATION OF AN OFFER TO BUY THESE SECURITIES IN ANY JURISDICTION WHERE THE OFFER OR SALE IS NOT PERMITTED.
| 24 |
| PATRIOTS PARK |

THE INFORMATION IN THIS STRUCTURAL AND COLLATERAL TERM SHEET IS NOT COMPLETE AND MAY BE AMENDED PRIOR TO THE TIME OF SALE. THIS TERM SHEET IS NOT AN OFFER TO SELL THESE SECURITIES AND IT IS NOT A SOLICITATION OF AN OFFER TO BUY THESE SECURITIES IN ANY JURISDICTION WHERE THE OFFER OR SALE IS NOT PERMITTED.
| 25 |
| No. 1 – Patriots Park | |||||||
| Loan Information | Property Information | ||||||
| Mortgage Loan Seller: | Natixis Real Estate Capital LLC | Single Asset/Portfolio: | Single Asset | ||||
| Credit Assessment (DBRS/KBRA/Moody’s): | NR/NR/NR | Property Type: | Office | ||||
| Original Principal Balance(1): | $90,000,000 | Specific Property Type: | Suburban | ||||
| Cut-off Date Principal Balance(1): | $90,000,000 | Location: | Reston, VA | ||||
| % of Initial Pool Balance: | 9.8% | Size(3): | 723,667 SF | ||||
| Loan Purpose: | Acquisition | Cut-off Date Principal Balance Per SF(1): | $297.19 | ||||
| Borrower Name: | Hyundai Able Patriots Park, LLC | Year Built/Renovated: | 1986/2013 | ||||
| Sponsors: | Hyundai Securities Co. Ltd.; Hyundai Able Investment REIT | Title Vesting: | Fee | ||||
| Mortgage Rate: | 3.658% | Property Manager: | Boston Properties Limited Partnership | ||||
| Note Date: | October 2, 2014 | 3rdMost Recent Occupancy(4): | NAV | ||||
| Anticipated Repayment Date: | October 5, 2019 | 2ndMost Recent Occupancy(4): | NAV | ||||
| Maturity Date: | March 5, 2033 | Most Recent Occupancy (As of): | 97.5% (12/31/2014) | ||||
| IO Period: | 60 months | Current Occupancy (As of)(3): | 97.5% (7/1/2015) | ||||
| Loan Term (Original): | 60 months | ||||||
| Seasoning: | 9 months | Underwriting and Financial Information: | |||||
| Amortization Term (Original): | NAP | ||||||
| Loan Amortization Type: | Interest-only, ARD | 3rdMost Recent NOI(4): | NAV | ||||
| Interest Accrual Method: | Actual/360 | 2ndMost Recent NOI(4): | NAV | ||||
| Call Protection: | GRTR 1% or YM(33), GRTR 1% or YM or D(23), O(4) | Most Recent NOI (As of): | $17,985,597 (12/31/2014) | ||||
| Lockbox Type: | Hard/Springing Cash Management | ||||||
| Additional Debt(1): | Yes | ||||||
| Additional Debt Type(1): | Pari Passu | U/W Revenues(5): | $25,241,098 | ||||
| U/W Expenses: | $7,672,221 | ||||||
| U/W NOI(5): | $17,568,877 | ||||||
| U/W NCF(5): | $17,460,327 | ||||||
| U/W NOI DSCR(1)(5): | 2.20x | ||||||
| U/W NCF DSCR(1)(5): | 2.18x | ||||||
| Escrows and Reserves(2): | U/W NOI Debt Yield(1)(5): | 8.2% | |||||
| U/W NCF Debt Yield(1)(5): | 8.1% | ||||||
| Type: | Initial | Monthly | Cap (If Any) | As-Is Appraised Value: | $322,000,000 | ||
| Taxes | $1,101,043 | $220,209 | NAP | As-Is Appraisal Valuation Date: | July 14, 2014 | ||
| Insurance | $18,896 | $18,896 | NAP | Cut-off Date LTV Ratio(1): | 66.8% | ||
| Replacement Reserves | $4,187,856 | $9,046 | $4,187,856 | LTV Ratio at Maturity or ARD(1): | 66.8% | ||
| (1) | The Patriots Park Loan Combination, totaling $215,070,000, is comprised of fourpari passunotes (Notes A-1, A-2, A-3 and A-4). The non-controlling Note A-2 had an original principal balance of $90,000,000, has an outstanding principal balance of $90,000,000 as of the Cut-Off Date and will be contributed to the WFCM 2015-NXS2 Trust. The controlling Note A-1 had an original principal balance of $95,000,000 and was contributed to the WFCM 2015-NXS1 Trust. The non-controlling Note A-3 had an original principal balance of $26,000,000 and was contributed to the COMM 2015-CCRE22 Trust. The non-controlling Note A-4 had an original principal balance of $4,070,000 and is currently held by Natixis Real Estate Capital LLC and is expected to be contributed to a future trust. All statistical financial information related to balances per square foot, loan-to-value ratios, debt service coverage ratios and debt yields are based on the Patriots Park Loan Combination. See “Description of the Mortgage Pool—Loan Combinations—The Patriots Park Loan Combination” in the Free Writing Prospectus. |
| (2) | See “Escrows” section. |
| (3) | The Patriots Park Property is comprised of 705,905 square feet of office space (97.5% of net rentable area) and 17,762 square feet of warehouse (2.5% of net rentable area). The General Services Administration is in negotiation to lease the warehouse space. See “The Property” section. |
| (4) | Historical occupancy and financials are not available as the sponsor recently acquired the Patriots Park Property and these were not provided by the previous owner. |
| (5) | See “Cash Flow Analysis” section. |
The Mortgage Loan. The mortgage loan is part of a loan combination (the “Patriots Park Loan Combination”) that is evidenced by fourpari passu promissory notes (Notes A-1, A-2, A-3 and A-4) secured by a first mortgage encumbering three office buildings with a total of 723,667 square feet located in Reston, Virginia (the “Patriots Park Property”). The Patriots Park Loan Combination was originated on October 2, 2014 by Natixis Real Estate Capital LLC. The Patriots Park Loan Combination had an original principal balance of $215,070,000, has an outstanding principal balance as of the Cut-off Date of $215,070,000 and accrues interest at an interest rate of 3.658%per annum. The Patriots Park Loan Combination had an initial term of 60 months, has a remaining term of 51 months as of the Cut-off Date and requires interest-only payments through the Anticipated Repayment Date (“ARD”). The ARD is October 5, 2019 and the final maturity date is March 5, 2033. In the event that the Patriots Park Loan Combination is not repaid in full by the ARD, the interest rate will increase to an amount equal to the sum of (a) 3.500% and (b) 2.500% plus the amount (if any) by which the five-year treasury rate exceeds 3.000%. The borrower’s failure to repay the Patriots Park Loan Combination in full at least one month prior to the ARD automatically triggers a full cash flow sweep whereby all excess cash flow will be used to pay down the principal balance of the Patriots Park Loan Combination.
THE INFORMATION IN THIS STRUCTURAL AND COLLATERAL TERM SHEET IS NOT COMPLETE AND MAY BE AMENDED PRIOR TO THE TIME OF SALE. THIS TERM SHEET IS NOT AN OFFER TO SELL THESE SECURITIES AND IT IS NOT A SOLICITATION OF AN OFFER TO BUY THESE SECURITIES IN ANY JURISDICTION WHERE THE OFFER OR SALE IS NOT PERMITTED.
| 26 |
| PATRIOTS PARK |
Note A-2, which will be contributed to the WFCM 2015-NXS2 Trust, had an original principal balance of $90,000,000, has an outstanding principal balance as of the Cut-off Date of $90,000,000 and represents a non-controlling interest in the Patriots Park Loan Combination. The controlling Note A-1 had an original principal balance of $95,000,000 and was contributed to the WFCM 2015-NXS1 Trust. The non-controlling Note A-3 had an original principal balance of $26,000,000 and was contributed to the COMM 2015-CCRE22 Trust. The non-controlling Note A-4 (together with Note A-1 and A-3, the “Patriot Park Companion Loans”) had an original principal balance of $4,070,000 and is currently held by Natixis Real Estate Capital LLC and is expected to be contributed to a future trust. See “Description of the Mortgage Pool—Loan Combinations—The Patriots Park Loan Combination” in the Free Writing Prospectus.
The borrower has the right to prepay in full or in part the Patriots Park Loan Combination, on any date before July 5, 2019, provided that the borrower pays the greater of (i) 1.0% of the principal balance being repaid, or (ii) a yield maintenance premium. Following the lockout period, the borrower has the option to defease the full principal amount of the Patriots Park Loan Combination or a portion thereof on any date before July 5, 2019. In addition, the Patriots Park Loan Combination is prepayable without penalty on July 5, 2019 or any payment date thereafter prior to March 5, 2033.
Sources and Uses
| Sources | Uses | |||||||||
| Original loan combination amount | $215,070,000 | 65.1 | % | Purchase price | $321,000,000 | 97.2 | % | |||
| Sponsor’s new cash contribution | 115,196,168 | 34.9 | Reserves | 5,307,795 | 1.6 | |||||
| Closing costs | 3,958,373 | 1.2 | ||||||||
| Total Sources | $330,266,168 | 100.0 | % | Total Uses | $330,266,168 | 100.0 | % | |||
The Property. The Patriots Park Property is a highly-secured class A office campus situated on 22.7 acres and comprised of three office buildings (Patriots Park I, II and III) totaling 705,905 rentable square feet located in Reston, Virginia. The Patriots Park Property includes two parking garages and a small surface lot with a combined total of 2,660 parking spaces (3.8 spaces per 1000 rentable square feet). A warehouse comprising 17,762 square feet is nearing construction completion next to one of the parking garages and also serves as collateral for the Patriots Park Loan Combination. Patriots Park I and II were built in 1986 and 1987, respectively, and were fully renovated in 2012 and 2013, receiving a full facade replacement and replacement of all building systems including new HVAC, new elevators and refurbishment of the electrical systems. Patriots Park I and II have been certified LEED Silver. Patriots Park III, built in 2006, received minor renovations in 2013. The Patriots Park Property also received significant security upgrades commensurate with GSA protocol. Patriots Park II has a cafeteria with commercial seating for over 500 employees. Amenities in each building include numerous break rooms, as well as a convenience store, coffee counter and ATM machine, and a fitness center. The Patriots Park Property was 97.5% occupied as of July 1, 2015, by the United States of America (AAA/Aaa/AA+ by Fitch/Moody’s/S&P) via the General Services Administration (“GSA”) under two 20-year leases expiring on September 30, 2032 (72.3% of the net rentable area) and March 6, 2033 (25.2% of the net rentable area). Neither lease includes an appropriations-based termination clause. According to the borrower, the GSA and the previous owner of the Patriots Park Property invested approximately $55.0 million ($76.00 per square foot) and $40.5 million ($56.00 per square foot), respectively, into the space in 2012 and 2013. GSA is in negotiation to lease the warehouse space, which is nearing completion and comprises approximately 2.5% of the net rentable area of the Patriots Park Property.
The following table presents certain information relating to the tenancy at the Patriots Park Property:
Major Tenants
| Tenant Name | Credit Rating | Tenant NRSF(1) | % of | Annual U/W Base Rent PSF | Annual | % of Total Annual U/W Base Rent | Lease | |||||
| Major Tenants | ||||||||||||
| GSA (Patriots Park I & II) | AAA/Aaa/AA+ | 523,482 | 72.3% | $33.50 | $17,536,647 | 73.0% | 9/30/2032(2) | |||||
| GSA (Patriots Park III) | AAA/Aaa/AA+ | 182,423 | 25.2% | $35.55 | $6,484,321 | 27.0% | 3/06/2033(2) | |||||
| Total Major Tenants | 705,905 | 97.5% | $34.03 | $24,020,968 | 100.0% | |||||||
| Occupied Collateral Total | 705,905 | 97.5% | $34.03 | $24,020,968 | 100.0% | |||||||
| Warehouse Space | 17,762 | 2.5% | ||||||||||
| Collateral Total | 723,667 | 100.0% | ||||||||||
| (1) | The Patriots Park Property is comprised of 705,905 square feet of office space (97.5% of net rentable area) and 17,762 square feet of warehouse (2.5% of net rentable area). GSA is in negotiation to lease the warehouse space. |
| (2) | Neither the Patriots Park I and II lease nor the Patriots Park III lease includes an appropriations-based termination clause. GSA has the right to terminate the leases if the borrower discloses the identity of any government agency occupying the premises, other than the GSA, to a third party, unless specifically authorized by a contracting officer representing the GSA, upon providing 18 months’ prior written notice to the lessor. The related loan agreement and guaranty provide that the borrower and guarantor will be liable for any losses arising from any termination of the applicable leases resulting from a breach of such provisions. |
THE INFORMATION IN THIS STRUCTURAL AND COLLATERAL TERM SHEET IS NOT COMPLETE AND MAY BE AMENDED PRIOR TO THE TIME OF SALE. THIS TERM SHEET IS NOT AN OFFER TO SELL THESE SECURITIES AND IT IS NOT A SOLICITATION OF AN OFFER TO BUY THESE SECURITIES IN ANY JURISDICTION WHERE THE OFFER OR SALE IS NOT PERMITTED.
| 27 |
| PATRIOTS PARK |
The following table presents certain information relating to the lease rollover schedule at the Patriots Park Property:
Lease Expiration Schedule(1)
Year Ending | No. of Leases Expiring | Expiring NRSF | % of Total NRSF | Cumulative Expiring NRSF | Cumulative % of Total NRSF | Annual | Annual | ||
| MTM | 0 | 0 | 0.0% | 0 | 0.0% | $0 | $0.00 | ||
| 2015 | 0 | 0 | 0.0% | 0 | 0.0% | $0 | $0.00 | ||
| 2016 | 0 | 0 | 0.0% | 0 | 0.0% | $0 | $0.00 | ||
| 2017 | 0 | 0 | 0.0% | 0 | 0.0% | $0 | $0.00 | ||
| 2018 | 0 | 0 | 0.0% | 0 | 0.0% | $0 | $0.00 | ||
| 2019 | 0 | 0 | 0.0% | 0 | 0.0% | $0 | $0.00 | ||
| 2020 | 0 | 0 | 0.0% | 0 | 0.0% | $0 | $0.00 | ||
| 2021 | 0 | 0 | 0.0% | 0 | 0.0% | $0 | $0.00 | ||
| 2022 | 0 | 0 | 0.0% | 0 | 0.0% | $0 | $0.00 | ||
| 2023 | 0 | 0 | 0.0% | 0 | 0.0% | $0 | $0.00 | ||
| 2024 | 0 | 0 | 0.0% | 0 | 0.0% | $0 | $0.00 | ||
| 2025 | 0 | 0 | 0.0% | 0 | 0.0% | $0 | $0.00 | ||
| Thereafter | 2 | 705,905 | 97.5% | 705,905 | 97.5% | $24,020,968 | $34.03 | ||
| Vacant/Warehouse | 0 | 17,762(3) | 2.5%(3) | 723,667 | 100.0% | $0 | $0.00 | ||
| Total/Weighted Average | 2 | 723,667 | 100.0% | $24,020,968 | $34.03 |
| (1) | Information obtained from the underwritten rent roll. |
| (2) | Annual U/W Base Rent PSF excludes vacant space. |
| (3) | The Patriots Park Property includes 17,762 square feet of warehouse (2.5% of net rentable area). GSA is in negotiation to lease the warehouse space. |
The following table presents historical occupancy percentages at the Patriots Park Property:
Historical Occupancy
12/31/2012(1) | 12/31/2013(1) | 12/31/2014(2) | 7/1/2015(3) | |||
| NAV | NAV | 97.5% | 97.5% |
| (1) | Historical occupancy is not available, as the sponsor recently acquired the Patriots Park Property, and the information was not provided by the previous owner. |
| (2) | Information is based on the leases then in place at the Patriots Park Property. |
| (3) | Information obtained from the underwritten rent roll. |
THE INFORMATION IN THIS STRUCTURAL AND COLLATERAL TERM SHEET IS NOT COMPLETE AND MAY BE AMENDED PRIOR TO THE TIME OF SALE. THIS TERM SHEET IS NOT AN OFFER TO SELL THESE SECURITIES AND IT IS NOT A SOLICITATION OF AN OFFER TO BUY THESE SECURITIES IN ANY JURISDICTION WHERE THE OFFER OR SALE IS NOT PERMITTED.
| 28 |
| PATRIOTS PARK |
Operating History and Underwritten Net Cash Flow. The following table presents certain information relating to the historical operating performance and the underwritten net cash flow at the Patriots Park Property:
Cash Flow Analysis(1)
| 2014 | U/W | % of U/W Effective Gross Income | U/W $ | |||||||||
| Base Rent | $24,593,660(2) | $24,020,968(2) | 95.2 | % | $33.19 | |||||||
| Grossed Up Vacant Space | 0 | 595,027 | 2.4 | 0.82 | ||||||||
| Total Reimbursables | 0 | 185,292 | 0.7 | 0.26 | ||||||||
| Parking Income | 227,088(2) | 891,480(2) | 3.5 | 1.23 | ||||||||
| Other Income | 545,809(2) | 143,358(2) | 0.6 | 0.20 | ||||||||
| Less Vacancy & Credit Loss | 0 | (595,027)(3) | (2.4) | (0.82 | ) | |||||||
| Effective Gross Income | $25,366,558 | $25,241,098 | 100.0 | % | $34.88 | |||||||
| Total Operating Expenses | $7,380,961 | $7,672,221 | 30.4 | % | $10.60 | |||||||
| Net Operating Income | $17,985,597 | $17,568,877 | 69.6 | % | $24.28 | |||||||
| TI/LC | 0 | 0 | 0.0 | 0.00 | ||||||||
| Capital Expenditures | 0 | 108,550 | 0.4 | 0.15 | ||||||||
| Net Cash Flow | $17,985,597 | $17,460,327 | 69.2 | % | $24.13 | |||||||
| NOI DSCR(4) | 2.25x | 2.20x | ||||||||||
| NCF DSCR(4) | 2.25x | 2.18x | ||||||||||
| NOI DY(4) | 8.4% | 8.2% | ||||||||||
| NCF DY(4) | 8.4% | 8.1% | ||||||||||
| (1) | Historical financials prior to 2014 were not available as the sponsor recently acquired the Patriots Park Property and this information was not provided by the previous owner. |
| (2) | 2014 Base Rent is higher than U/W Base Rent as it includes revenue from the warehouse space and Parking Income in Q1 to Q3 2014. 2014 Parking Income of $227,088 is lower than U/W Parking Income because the prior owner did not provide a breakout of the Parking Income from the first quarter to the third quarter of 2014. 2014 Other Income includes $309,076 of tax abatements which is not included in U/W Other Income. |
| (3) | The underwritten economic vacancy is 2.3%. The Patriots Park Property was 97.5% physically occupied as of July 1, 2015. GSA is in negotiation to lease the warehouse space, which accounts for 2.5% of the net rentable area. |
| (4) | DSCRs and debt yields are based on the Patriots Park Loan Combination. |
Appraisal. As of the appraisal valuation date of July 14, 2014, the Patriots Park Property had an “as-is” appraised value of $322,000,000.
Environmental Matters. According to a Phase I environmental site assessment dated July 21, 2014, there was no evidence of any recognized environmental condition at the Patriots Park Property.
Market Overview and Competition. The Patriots Park Property is located at the intersection of Fairfax County Parkway and the Dulles Toll Road (Route 267) along Sunrise Valley Drive in Reston, Virginia, approximately 18 miles west of Washington D.C. and just east of the Washington Dulles International Airport. The property is in close proximity (approximately two miles) to Reston Town Center, which offers a variety of amenities such as restaurants, shopping, and open space. The property is located approximately one mile west of the Wiehle-Reston East Metrorail station, the terminus of the first phase of the Silver Line. In addition, the Patriots Park Property will be in close proximity to the Reston Town Center and Herndon stations once the second phase of the Silver Line is completed, expected to be in 2018. Upon completion, the Silver Line will link the Patriots Park Property with Dulles International Airport. The Patriots Park Property is located in Fairfax County in the Washington, D.C. metro area. According to the appraisal, the estimated 2014 population and median household income of the Washington, D.C. metro area were 6.0 million and $91,436, respectively. The Fairfax County/Fairfax City/Falls Church area has the largest population in the Washington, D.C. metro area with nearly 1.2 million people.
Per the appraisal, the Patriots Park Property is located in the Reston/Herndon office submarket, which contains 24.7 million square feet of office space. As of the first quarter of 2015, the submarket’s direct vacancy was 15.8% and the average direct asking gross rent was $30.76 per square foot.
THE INFORMATION IN THIS STRUCTURAL AND COLLATERAL TERM SHEET IS NOT COMPLETE AND MAY BE AMENDED PRIOR TO THE TIME OF SALE. THIS TERM SHEET IS NOT AN OFFER TO SELL THESE SECURITIES AND IT IS NOT A SOLICITATION OF AN OFFER TO BUY THESE SECURITIES IN ANY JURISDICTION WHERE THE OFFER OR SALE IS NOT PERMITTED.
| 29 |
| PATRIOTS PARK |
The following table presents certain information relating to comparable office properties to the Patriots Park Property:
Competitive Set(1)
Patriots | Commerce Executive Park IV | Commerce Executive Park VI | Two Freedom Square | Plaza America Tower 2 | Reston Square | Two Fountain Square | |
| Location | Reston, VA | Reston, VA | Reston, VA | Reston, VA | Reston, VA | Reston, VA | Reston, VA |
| Distance from Subject | -- | 2.9 miles | 3.0 miles | 1.8 miles | 2.3 miles | 1.7 miles | 2.0 miles |
| Property Type | Office | Office | Office | Office | Office | Office | Office |
| Year Built/Renovated | 1986/2013 | 1987/NAV | 1998/NAV | 2002/NAV | 1999/NAV | 2007/NAV | 1990/NAV |
| Stories | 5-7 | 6 | 6 | 16 | 10 | 6 | 11 |
| Total GLA | 723,667 SF | 138,980 SF | 145,750 SF | 379,270 SF | 230,034 SF | 139,075 SF | 250,000 SF |
| (1) | Information obtained from the appraisal. |
The Borrower.The borrower is Hyundai Able Patriots Park, LLC, a Delaware limited liability company and single purpose entity with two independent directors. Legal counsel to the borrower delivered a non-consolidation opinion in connection with the origination of the Patriots Park Loan Combination. Hyundai Able Patriots Park, LLC is owned by Hyundai Able Patriots Park Manager, LLC which is owned by the Hyundai Able Investment REIT, which is over 99% owned by and 100% controlled by Hyundai Securities Co. Ltd. Hyundai Securities Co. Ltd. and Hyundai Able Investment REIT are the guarantors of certain nonrecourse carveouts under the Patriots Park Loan Combination.
The Sponsor.The sponsors are Hyundai Able Investment REIT and Hyundai Securities Co. Ltd. (“HSC”). HSC is a publicly traded company listed on the South Korean stock exchange. HSC is a leading South Korea-based financial company engaged in the securities and investment banking sector and an experienced owner of office, retail and residential properties in London, Tokyo, Shanghai and South Korea. As of 2013, HSC reported net worth in excess of $2.9 billion and liquidity of approximately $1.6 billion.
Escrows.The loan documents provide for upfront reserves in the amount of $1,101,043 for taxes, $18,896 for insurance and $4,187,856 for replacement reserves. The loan documents require monthly deposits of one-twelfth of the estimated annual real estate taxes, which currently equates to $220,209 and one-twelfth of the annual insurance premiums, which currently equates to $18,896. The loan documents require monthly escrows for replacement reserves of $9,046, subject to a cap of $4,187,856.
Lockbox and Cash Management.The Patriots Park Loan Combination is structured with a lender-controlled hard lockbox and springing cash management. The Patriots Park Loan Combination requires all rents to be transmitted directly into the lockbox. Prior to the occurrence of a Cash Management Period (as defined below), all funds in the lockbox account are required to be swept to the borrower’s operating account. During a Cash Management Period, all funds in the lockbox account are required to be swept to a lender-controlled cash management account.
A “Cash Management Period” will commence upon any of the following: (i) the occurrence and continuance of an event of default, (ii) the failure by the borrower, after the end of a calendar quarter, to maintain a debt service coverage ratio of at least 1.10x, (iii) the delivery by the GSA to the borrower of a confidentiality breach termination notice (which is required to be at least 18 months prior to GSA’s intention to vacate) or (iv) the failure by the borrower to repay the outstanding principal balance of the Patriots Park Loan Combination in full at least one month prior to the ARD. A Cash Management Period will end, with respect to clause (i) above, upon the cure of such event of default; with respect to clause (ii) above, upon the debt service coverage ratio being at least 1.15x for six consecutive months since the commencement of the Cash Management Period; with respect to clause (iii) above, (a) upon the revocation of the confidentiality breach termination notice by the government, (b) upon a judgment by a court of competent jurisdiction nullifying the lease termination, provided that, and for so long as, such judgment is not challenged or appealed by the government, or (c) upon the occurrence of a confidentiality breach termination cure, and in any case, prior to the occurrence of an event of default.
Property Management. The Patriots Park Property is managed by Boston Properties Limited Partnership (rated Baa2/A-/BBB+ by Moody’s/S&P/Fitch).
Assumption. The lender may not unreasonably withhold its consent to the sale of the Patriots Park Property in its entirety to a special purpose entity that meets the lender’s then current requirements for special purpose entities and provided that the borrower satisfies certain other conditions including (i) no event of default has occurred and is continuing; and (ii) the lender has reasonably determined that the proposed transferee and any successor guarantor satisfy the lender’s credit review and underwriting standards, taking into consideration such transferee’s experience, financial strength and general business standing. No such transfer is permitted during the 60 days prior to or immediately following a securitization. The lender will have the right to approve or disapprove the proposed transferee in its reasonable discretion, and the lender may, as a condition to approving any proposed transferee, require a rating agency confirmation from DBRS, KBRA and Moody’s stating that such assumption will not result in a downgrade, withdrawal or qualification of the respective ratings to the Series 2015-NXS2 Certificates and similar confirmations from each rating agency rating securities backed by any of the Patriots Park Companion Loans.
Partial Release.Not permitted.
Real Estate Substitution.Not permitted.
THE INFORMATION IN THIS STRUCTURAL AND COLLATERAL TERM SHEET IS NOT COMPLETE AND MAY BE AMENDED PRIOR TO THE TIME OF SALE. THIS TERM SHEET IS NOT AN OFFER TO SELL THESE SECURITIES AND IT IS NOT A SOLICITATION OF AN OFFER TO BUY THESE SECURITIES IN ANY JURISDICTION WHERE THE OFFER OR SALE IS NOT PERMITTED.
| 30 |
| PATRIOTS PARK |
Subordinate and Mezzanine Indebtedness.Not permitted.
Ground Lease.None.
Terrorism Insurance. The loan documents provide that the required “all risk” insurance policy must include coverage for terrorism in an amount equal to the full replacement cost of the Patriots Park Property. The loan documents also require business interruption insurance covering no less than the 18-month period following the occurrence of a casualty event.
THE INFORMATION IN THIS STRUCTURAL AND COLLATERAL TERM SHEET IS NOT COMPLETE AND MAY BE AMENDED PRIOR TO THE TIME OF SALE. THIS TERM SHEET IS NOT AN OFFER TO SELL THESE SECURITIES AND IT IS NOT A SOLICITATION OF AN OFFER TO BUY THESE SECURITIES IN ANY JURISDICTION WHERE THE OFFER OR SALE IS NOT PERMITTED.
| 31 |
(THIS PAGE INTENTIONALLY LEFT BLANK)
THE INFORMATION IN THIS STRUCTURAL AND COLLATERAL TERM SHEET IS NOT COMPLETE AND MAY BE AMENDED PRIOR TO THE TIME OF SALE. THIS TERM SHEET IS NOT AN OFFER TO SELL THESE SECURITIES AND IT IS NOT A SOLICITATION OF AN OFFER TO BUY THESE SECURITIES IN ANY JURISDICTION WHERE THE OFFER OR SALE IS NOT PERMITTED.
| 32 |
| CAMPBELL TECHNOLOGY PARK |
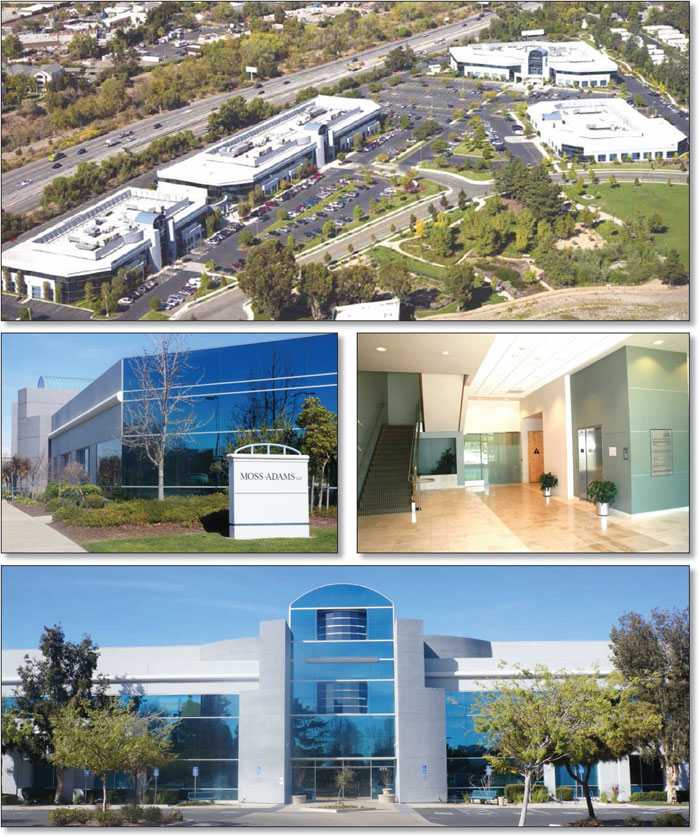
THE INFORMATION IN THIS STRUCTURAL AND COLLATERAL TERM SHEET IS NOT COMPLETE AND MAY BE AMENDED PRIOR TO THE TIME OF SALE. THIS TERM SHEET IS NOT AN OFFER TO SELL THESE SECURITIES AND IT IS NOT A SOLICITATION OF AN OFFER TO BUY THESE SECURITIES IN ANY JURISDICTION WHERE THE OFFER OR SALE IS NOT PERMITTED.
| 33 |
| CAMPBELL TECHNOLOGY PARK |
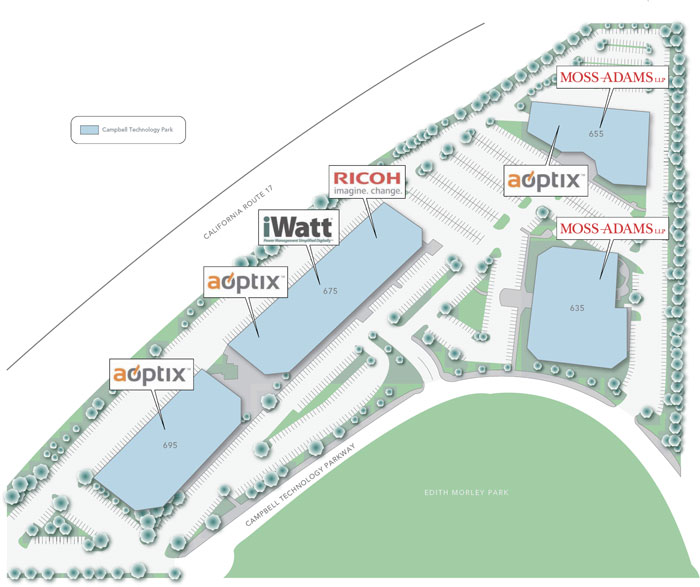
THE INFORMATION IN THIS STRUCTURAL AND COLLATERAL TERM SHEET IS NOT COMPLETE AND MAY BE AMENDED PRIOR TO THE TIME OF SALE. THIS TERM SHEET IS NOT AN OFFER TO SELL THESE SECURITIES AND IT IS NOT A SOLICITATION OF AN OFFER TO BUY THESE SECURITIES IN ANY JURISDICTION WHERE THE OFFER OR SALE IS NOT PERMITTED.
| 34 |
| CAMPBELL TECHNOLOGY PARK |

THE INFORMATION IN THIS STRUCTURAL AND COLLATERAL TERM SHEET IS NOT COMPLETE AND MAY BE AMENDED PRIOR TO THE TIME OF SALE. THIS TERM SHEET IS NOT AN OFFER TO SELL THESE SECURITIES AND IT IS NOT A SOLICITATION OF AN OFFER TO BUY THESE SECURITIES IN ANY JURISDICTION WHERE THE OFFER OR SALE IS NOT PERMITTED.
| 35 |
| No. 2 – Campbell Technology Park | ||||||
| Loan Information | Property Information | |||||
| Mortgage Loan Seller: | Wells Fargo Bank, National Association | Single Asset/Portfolio: | Single Asset | |||
Credit Assessment (DBRS/KBRA/Moody’s): | NR/NR/NR | Property Type: | Office | |||
| Original Principal Balance: | $60,000,000 | Specific Property Type: | Suburban | |||
| Cut-off Date Principal Balance: | $60,000,000 | Location: | Campbell, CA | |||
| % of Initial Pool Balance: | 6.6% | Size: | 280,864 SF | |||
| Loan Purpose: | Refinance | Cut-off Date Principal Balance Per SF: | $213.63 | |||
| Borrower Name: | Campbell Technology Park, LLC | Year Built/Renovated: | 2000/NAP | |||
| Sponsors: | Carl Russo; Timothy Pasquinelli | Title Vesting: | Fee | |||
| Mortgage Rate: | 4.410% | Property Manager: | Self-managed | |||
| Note Date: | June 11, 2015 | 3rdMost Recent Occupancy (As of)(2): | 86.0% (12/31/2012) | |||
| Anticipated Repayment Date: | NAP | 2ndMost Recent Occupancy (As of)(2): | 80.0% (12/31/2013) | |||
| Maturity Date: | June 11, 2025 | Most Recent Occupancy (As of)(2): | 91.0% (12/31/2014) | |||
| IO Period: | 120 months | Current Occupancy (As of)(2): | 93.4% (4/30/2015) | |||
| Loan Term (Original): | 120 months | |||||
| Seasoning: | 1 month | Underwriting and Financial Information: | ||||
| Amortization Term (Original): | NAP | |||||
| Loan Amortization Type: | Interest-only, Balloon | 3rdMost Recent NOI (As of): | $3,770,424 (12/31/2012) | |||
| Interest Accrual Method: | Actual/360 | 2ndMost Recent NOI (As of)(3): | $3,590,973 (12/31/2013) | |||
| Call Protection: | L(25),D(91),O(4) | Most Recent NOI (As of)(3): | $4,579,817 (12/31/2014) | |||
| Lockbox Type: | Soft/Springing Cash Management | |||||
| Additional Debt: | None | |||||
| Additional Debt Type: | NAP | U/W Revenues(3): | $8,276,061 | |||
| U/W Expenses: | $2,831,835 | |||||
| U/W NOI(3): | $5,444,226 | |||||
| U/W NCF(3): | $4,805,020 | |||||
| U/W NOI DSCR: | 2.02x | |||||
| Escrows and Reserves(1): | U/W NCF DSCR: | 1.79x | ||||
| U/W NOI Debt Yield: | 9.1% | |||||
| Type: | Initial | Monthly | Cap (If Any) | U/W NCF Debt Yield: | 8.0% | |
| Taxes | $231,690 | $77,230 | NAP | As-Is Appraised Value: | $100,000,000 | |
| Insurance | $0 | Springing | NAP | As-Is Appraisal Valuation Date: | April 21, 2015 | |
| Replacement Reserves | $0 | $4,700 | NAP | Cut-off Date LTV Ratio: | 60.0% | |
| TI/LC Reserves | $0 | $67,700 | $1,150,000 | LTV Ratio at Maturity or ARD: | 60.0% | |
| (1) | See “Escrows” section. |
| (2) | See “Historical Occupancy” section. |
| (3) | See “Cash Flow Analysis” section. |
The Mortgage Loan. The mortgage loan (the “Campbell Technology Park Mortgage Loan”) is evidenced by a single promissory note that is secured by a first mortgage encumbering an office park located in Campbell, California (the “Campbell Technology Park Property”). The Campbell Technology Park Mortgage Loan was originated on June 11, 2015 by Wells Fargo Bank, National Association. The Campbell Technology Park Mortgage Loan had an original principal balance of $60,000,000, has an outstanding principal balance as of the Cut-off Date of $60,000,000 and accrues interest at an interest rate of 4.410%per annum. The Campbell Technology Park Mortgage Loan had an initial term of 120 months, has a remaining term of 119 months as of the Cut-off Date and requires interest-only payments through the term of the Campbell Technology Park Mortgage Loan. The Campbell Technology Park Mortgage Loan matures on June 11, 2025.
Following the lockout period, the borrower has the right to defease the Campbell Technology Park Mortgage Loan in whole, but not in part, on any date before March 11, 2025. In addition, the Campbell Technology Park Mortgage Loan is prepayable without penalty on or after March 11, 2025.
THE INFORMATION IN THIS STRUCTURAL AND COLLATERAL TERM SHEET IS NOT COMPLETE AND MAY BE AMENDED PRIOR TO THE TIME OF SALE. THIS TERM SHEET IS NOT AN OFFER TO SELL THESE SECURITIES AND IT IS NOT A SOLICITATION OF AN OFFER TO BUY THESE SECURITIES IN ANY JURISDICTION WHERE THE OFFER OR SALE IS NOT PERMITTED.
| 36 |
| CAMPBELL TECHNOLOGY PARK |
Sources and Uses
| Sources | Uses | |||||||
| Original loan amount | $60,000,000 | 100.0% | Loan payoff(1) | $43,036,890 | 71.7% | |||
| Reserves | 231,690 | 0.4 | ||||||
| Closing costs(2) | 2,468,931 | 4.1 | ||||||
| Return of equity | 14,262,489 | 23.8 | ||||||
| Total Sources | $60,000,000 | 100.0% | Total Uses | $60,000,000 | 100.0% |
| (1) | The Campbell Technology Park Property was previously securitized in the WBCMT 2006-C25 transaction. |
| (2) | Closing costs include a yield maintenance prepayment fee of $2,117,589. |
The Property. The Campbell Technology Park Property was built in 2000 and is comprised of three two-story and one single story, class A, suburban office buildings totaling 280,864 square feet located on 17.3 acres in Campbell, California, a submarket of Silicon Valley and approximately 8.7 miles southwest of the San Jose central business district. The single story building includes 39,770 square feet and is 100.0% occupied by Moss Adams LLP (“Moss Adams”). The two-story buildings range in size from 59,908 to 100,326 square feet and are occupied by multiple tenants. The largest tenant at the Campbell Technology Park Property, AOptix Technologies (“AOptix”) (69,321 square feet or 24.7% of net rentable area), which has been in occupancy since 2005, recently expanded its space by 7,813 square feet in January 2015 and extended the term of its lease (on the majority of its space) through December 2019. Moss Adams (52,226 square feet or 18.6% of net rentable area), the second largest tenant, has been in occupancy since 2000 and took an additional 12,456 square feet of space in February 2015. The third largest tenant is iWatt, Inc. (“iWatt”) (44,884 square feet or 16.0% of net rentable area), which was acquired by Dialog Semiconductor Plc (publicly traded on the Frankfurt Stock Exchange) in July 2013. iWatt, Inc. has been a tenant at the Campbell Technology Park Property since November 2011 and signed a new lease in February 2014 to nearly double its square footage (from 24,873 square feet to 44,884 square feet) and extend its term to February 2018. The Campbell Technology Park Property offers 1,059 parking spaces, resulting in a parking ratio of 3.8 spaces per 1,000 square feet of net rentable area. The borrower has invested a substantial amount of capital since acquiring the Campbell Technology Park Property in 2006 and has increased occupancy from 46.9% in December 2009 (Qualcomm vacated approximately 35.7% of net rentable area) to 93.4% as of April 30, 2015 (see “Historical Occupancy” and “Cash Flow Analysis” section). AOptix is not currently in occupancy of 24,660 square feet (8.8% of net rentable area) and is actively marketing the space for sublease; current occupancy excluding this space is 84.6%.
The following table presents certain information relating to the tenancy at the Campbell Technology Park Property:
Major Tenants
| Tenant Name | Credit Rating Moody’s/ S&P(1) | Tenant NRSF | % of NRSF | Annual U/W Base Rent PSF(2) | Annual U/W Base | % of Total Annual U/W Base Rent | Lease Expiration Date |
| Major Tenants | |||||||
| AOptix Technologies | NR/NR/NR | 69,321(3)(4)(5) | 24.7% | $22.17 | $1,536,940 | 27.2% | Various(6) |
| Moss Adams LLP | NR/NR/NR | 52,226 | 18.6% | $19.63 | $1,025,351 | 18.1% | 12/31/2017(7) |
| iWatt, Inc. | NR/NR/NR | 44,884 | 16.0% | $22.74 | $1,020,438 | 18.0% | 2/28/2018(8) |
| Ricoh Americas Corp. | NR/NR/A | 22,969 | 8.2% | $22.87 | $525,209 | 9.3% | 5/30/2019(9) |
| Dasher Technologies, Inc. | NR/NR/NR | 18,996 | 6.8% | $23.83 | $452,672 | 8.0% | 8/31/2020 |
| Total Major Tenants | 208,396 | 74.2% | $21.88 | $4,560,610 | 80.6% | ||
| Non-Major Tenants | 53,817 | 19.2% | $20.34 | $1,094,846 | 19.4% | ||
| Occupied Collateral Total | 262,213 | 93.4% | $21.57 | $5,655,456 | 100% | ||
| Vacant Space | 18,651 | 6.6% | |||||
| Collateral Total | 280,864 | 100.0% | |||||
| (1) | Certain ratings are those of the parent company whether or not the parent guarantees the lease. |
| (2) | Annual U/W Base Rent PSF and Annual U/W Base Rent include contractual rent steps through April 2016 totaling $280,081. |
| (3) | 7,921 square feet (2.8% of net rentable area) of AOptix’s space is subleased to Keyssa, Inc. at $21.00 per square foot triple-net. Keyssa Inc.’s sublease expiration is coterminous with AOptix’s lease expiration date of December 31, 2016. Annual U/W Base Rent for this space was underwritten to AOptix’s primary lease rate of $18.69 per square foot triple-net. |
| (4) | AOptix signed a lease on January 1, 2015 for an additional 7,813 square feet (2.8% of net rentable area). They are currently building out the space and are not yet in occupancy; however, AOptix is already paying rent on this space. |
| (5) | AOptix is not currently in occupancy of 24,660 square feet (8.8% of net rentable area) and is actively marketing the space for sublease. See “Cash Flow Analysis” section. |
| (6) | 7,921 square feet (2.8% of net rentable area) of AOptix’s space (the space subleased to Keyssa, Inc.) has a lease expiration date of December 31, 2016 and the remaining 61,400 square feet (21.9% of net rentable area) has a lease expiration date of December 31, 2019. |
| (7) | Moss Adams LLP has two, 5-year lease renewal options. |
| (8) | iWatt, Inc. has one, 4-year lease renewal option. |
| (9) | Ricoh Americas Corp. has a one-time right to terminate its lease on May 31, 2017 with six months’ notice and payment of a termination fee of $557,946. |
THE INFORMATION IN THIS STRUCTURAL AND COLLATERAL TERM SHEET IS NOT COMPLETE AND MAY BE AMENDED PRIOR TO THE TIME OF SALE. THIS TERM SHEET IS NOT AN OFFER TO SELL THESE SECURITIES AND IT IS NOT A SOLICITATION OF AN OFFER TO BUY THESE SECURITIES IN ANY JURISDICTION WHERE THE OFFER OR SALE IS NOT PERMITTED.
| 37 |
| CAMPBELL TECHNOLOGY PARK |
The following table presents certain information relating to the lease rollover schedule at the Campbell Technology Park Property:
Lease Expiration Schedule(1)(2)
Year Ending December 31, | No. of Leases Expiring | Expiring NRSF | % of Total NRSF | Cumulative Expiring NRSF | Cumulative % of Total NRSF | Annual U/W Base Rent | Annual U/W Base Rent PSF(3) |
| MTM | 0 | 0 | 0.0% | 0 | 0.0% | $0 | $0.00 |
| 2015 | 1 | 16,669 | 5.9% | 16,669 | 5.9% | $340,048 | $20.40 |
| 2016 | 3 | 22,288 | 7.9% | 38,957 | 13.9% | $421,658 | $18.92 |
| 2017 | 3 | 68,196 | 24.3% | 107,153 | 38.2% | $1,382,376 | $20.27 |
| 2018 | 2 | 44,884 | 16.0% | 152,037 | 54.1% | $1,020,438 | $22.74 |
| 2019 | 5 | 91,180 | 32.5% | 243,217 | 86.6% | $2,038,264 | $22.35 |
| 2020 | 2 | 18,996 | 6.8% | 262,213 | 93.4% | $452,672 | $23.83 |
| 2021 | 0 | 0 | 0.0% | 262,213 | 93.4% | $0 | $0.00 |
| 2022 | 0 | 0 | 0.0% | 262,213 | 93.4% | $0 | $0.00 |
| 2023 | 0 | 0 | 0.0% | 262,213 | 93.4% | $0 | $0.00 |
| 2024 | 0 | 0 | 0.0% | 262,213 | 93.4% | $0 | $0.00 |
| 2025 | 0 | 0 | 0.0% | 262,213 | 93.4% | $0 | $0.00 |
| Thereafter | 0 | 0 | 0.0% | 262,213 | 93.4% | $0 | $0.00 |
| Vacant | 0 | 18,651 | 6.6% | 280,864 | 100.0% | $0 | $0.00 |
| Total/Weighted Average | 16 | 280,864 | 100.0% | $5,655,456 | $21.57 |
| (1) | Information obtained from the underwritten rent roll. |
| (2) | Certain tenants may have lease termination options that are exercisable prior to the originally stated expiration date of the subject lease and that are not considered in the Lease Expiration Schedule. |
| (3) | Weighted Average Annual U/W Base Rent PSF excludes vacant space. |
The following table presents historical occupancy percentages at the Campbell Technology Park Property:
Historical Occupancy
12/31/2012(1) | 12/31/2013(1)(2) | 12/31/2014(1)(2) | 4/30/2015(2)(3)(4) | |||
| 86.0% | 80.0% | 91.0% | 93.4% |
| (1) | Information obtained from the borrower. |
| (2) | The increase in occupancy from 2013 through underwriting was due to continued new leasing activity and the recent expansion of several tenants at the Campbell Technology Park Property including iWatt, Ricoh Americas Corp and AOptix, which totaled 58,714 square feet (20.9% of net rentable area). |
| (3) | Information obtained from the underwritten rent roll. |
| (4) | AOptix signed a lease on January 1, 2015 for an additional 7,813 square feet (2.8% of net rentable area). AOptix is currently building out the space and is not yet in occupancy; however, AOptix is currently paying rent on this space. Also, AOptix is not currently in occupancy of 24,660 square feet (8.8% of net rentable area) and is actively marketing the space for sublease; however, AOptix is currently paying rent on this space also. Current occupancy excluding both spaces is 81.8%. |
THE INFORMATION IN THIS STRUCTURAL AND COLLATERAL TERM SHEET IS NOT COMPLETE AND MAY BE AMENDED PRIOR TO THE TIME OF SALE. THIS TERM SHEET IS NOT AN OFFER TO SELL THESE SECURITIES AND IT IS NOT A SOLICITATION OF AN OFFER TO BUY THESE SECURITIES IN ANY JURISDICTION WHERE THE OFFER OR SALE IS NOT PERMITTED.
| 38 |
| CAMPBELL TECHNOLOGY PARK |
Operating History and Underwritten Net Cash Flow. The following table presents certain information relating to the historical operating performance and underwritten net cash flow at the Campbell Technology Park Property:
Cash Flow Analysis
| 2012(1) | 2013(1) | 2014(1) | U/W(1)(2) | % of U/W Effective Gross Income | U/W $ per SF | ||||||||
| Base Rent | $3,624,969 | $3,751,527 | $4,449,620 | $5,655,456(3) | 68.3% | $20.14 | |||||||
| Grossed Up Vacant Space | 0 | 0 | 0 | 470,005 | 5.7 | $1.67 | |||||||
| Total Reimbursables | 2,019,969 | 2,122,685 | 2,365,235 | 2,620,605 | 31.7 | $9.33 | |||||||
| Other Income | 79,816 | 25,081(4) | 141,478 | 0 | 0.0 | $0.00 | |||||||
| Less Vacancy & Credit Loss | 0
| 0
| 0
| (470,005)(5)
| (5.7)
| ($1.67)
| |||||||
| Effective Gross Income | $5,724,754 | $5,899,293 | $6,956,333 | $8,276,061 | 100.0% | $29.47 | |||||||
| Total Operating Expenses | $1,954,331 | $2,308,321(4) | $2,376,517 | $2,831,835 | 34.2% | $10.08 | |||||||
| Net Operating Income | $3,770,424 | $3,590,973(4) | $4,579,817 | $5,444,226 | 65.8% | $19.38 | |||||||
| TI/LC | 0 | 0 | 0 | 583,034 | 7.0 | 2.08 | |||||||
| Capital Expenditures | 0
| 0
| 0
| 56,173
| 0.7
| 0.20
| |||||||
| Net Cash Flow | $3,770,424 | $3,590,973 | $4,579,817 | $4,805,020 | 58.1% | $17.11 | |||||||
| NOI DSCR | 1.40x | 1.33x | 1.70x | 2.02x | |||||||||
| NCF DSCR | 1.40x | 1.33x | 1.70x | 1.79x | |||||||||
| NOI DY | 6.3% | 6.0% | 7.6% | 9.1% | |||||||||
| NCF DY | 6.3% | 6.0% | 7.6% | 8.0% | |||||||||
| (1) | The increase in Effective Gross Income and Net Operating Income from 2012 through underwriting was due to continued new leasing activity and the recent expansion of several tenants at the Campbell Technology Park Property, which totaled 58,714 square feet (20.9% of net rentable area). |
| (2) | AOptix is not currently in occupancy of 24,660 square feet (8.8% of net rentable area) and is actively marketing the space for sublease. Current occupancy excluding this space is 84.6%, and the NOI DSCR and NCF DSCR are 1.73x and 1.51x, respectively, and the NOI DY and NCF DY are 7.7% and 6.8%, respectively. |
| (3) | U/W Base Rent includes contractual rent steps through April 2016 totaling $280,081 and income from recent leasing activity and the expansion of several tenants. |
| (4) | The decrease in Net Operating Income from 2012 to 2013 was due to the decrease in Other Income and the increase in Total Operating Expenses. The primary source of Other Income was early termination fees and forfeited lease deposits, which were nominal in 2013. Additionally, Total Operating Expenses increased from 2012 due to an increase in real estate taxes. |
| (5) | The underwritten economic vacancy is 7.7%. The Campbell Technology Park Property was 93.4% leased and 84.6% physically occupied as of April 30, 2015. |
Appraisal. As of the appraisal valuation date of April 21, 2015, the Campbell Technology Park Property had an “as-is” appraised value of $100,000,000.
Environmental Matters. According to the Phase I environmental site assessment dated April 24, 2015, there was no evidence of any recognized environmental conditions at the Campbell Technology Park Property.
Market Overview and Competition.The Campbell Technology Park Property is located in the greater San Francisco Bay Area (“Bay Area”), which is the fifth largest metropolitan region in the United States. The Bay Area is one of the largest and most diversified economies in the United States and is home to 31 Fortune 500 companies. Additionally, the Bay Area contains the highest concentration of venture capital firms in the world. These venture capital firms provide the capital and management expertise needed by a number of technology companies located in the region, which in turn helps expedite the technological advancements these businesses create.
The Campbell Technology Park Property is conveniently located 8.7 miles southwest of the San Jose central business district and 9.2 miles southwest of the Mineta San Jose International Airport. The Campbell Technology Park Property is located in the Silicon Valley Non-CBD market, which is home to some of the largest technology and e-commerce companies in the world including Apple, eBay, Google and Netflix. The Campbell Technology Park Property is located in the Campbell/Los Gatos submarket and is situated along a private drive (Campbell Technology Parkway) with access and visibility from Highway 17. Los Gatos is a wealthy community where many technology executives reside, including the managing partners of Moss Adams and AOptix.
The Campbell Technology Park Property is approximately 1.2 miles south of the Pruneyard, a 250,000 square foot mixed-used development featuring a movie theater, Trader Joe’s, over 15 eating establishments and 35 retail, service and entertainment businesses. In addition to the shopping center, the Pruneyard also includes two hotels. The Campbell Technology Park Property benefits from its proximity to the Pruneyard and the amenities it has to offer. According to the appraisal, the estimated 2014 population within a three- and five-mile radius of the Campbell Technology Park Property is 215,589 and 514,287, respectively, and the estimated median household income within the same radii is $86,100 and $88,084, respectively. Furthermore, the Campbell Technology Park Property is an attractive option for tenants desiring class A office space at a lower rental rate compared to competing office spaces near the intersection of Hamilton Avenue and South Bascom Avenue, adjacent to the Pruneyard (and further north in Sunnyvale and Menlo Park). According to the appraisal, the competitive set of the Campbell Technology Park Property contains rental rates ranging from $26.40 per square foot, triple-net to $36.00 per square foot, triple-net with an average of $32.40 per square foot, triple-net, compared to the Annual U/W Base Rent at the Campbell Technology Park Property of $21.57 per square foot, triple-net. As of the first quarter 2015, the Campbell Los/Gatos office submarket reported an average vacancy rate of 5.2%.
THE INFORMATION IN THIS STRUCTURAL AND COLLATERAL TERM SHEET IS NOT COMPLETE AND MAY BE AMENDED PRIOR TO THE TIME OF SALE. THIS TERM SHEET IS NOT AN OFFER TO SELL THESE SECURITIES AND IT IS NOT A SOLICITATION OF AN OFFER TO BUY THESE SECURITIES IN ANY JURISDICTION WHERE THE OFFER OR SALE IS NOT PERMITTED.
| 39 |
| CAMPBELL TECHNOLOGY PARK |
The following table presents certain information relating to some comparable office properties for the Campbell Technology Park Property:
Competitive Set(1)
Campbell (Subject) | Legacy Hamilton Plaza | Lincoln Court | 910 Campisi Way | |
| Location | Campbell, CA | Campbell, CA | Campbell, CA | Campbell, CA |
| Distance from Subject | -- | 1.8 miles | 1.2 miles | 1.6 miles |
| Property Type | Office | Office | Office | Office |
| Year Built/Renovated | 2000/NAP | 1989/NAV | 1988/NAV | 1985/NAV |
| Stories | 2 | 6 | 3 | 2 |
| Total GLA | 280,864 SF | 175,000 SF | 123,529 SF | 34,118 SF |
| Total Occupancy | 93% | 94% | 99% | 100% |
| (1) | Information obtained from the appraisal. |
The Borrower.The borrower is Campbell Technology Park, LLC, a California limited liability company, which is a single purpose entity with two independent directors. Legal counsel to the borrower delivered a non-consolidation opinion in connection with the origination of the Campbell Technology Park Mortgage Loan. Campbell Technology Park, LLC is owned by CD Real Estate Investments, LLC (“CDREI”) (80.0%) and CMC Campbell, LLC (20.0%). CDREI is the guarantor of certain nonrecourse carveouts under the Campbell Technology Park Mortgage Loan.
The Sponsors.The sponsors are Carl Russo and Timothy Pasquinelli. CDREI is 99.0% owned by Carl Russo and managed by Timothy Pasquinelli, Mr. Russo’s wealth advisor. Mr. Pasquinelli has a working relationship with Mr. Russo spanning over 20 years as a wealth advisor and business partner. Mr. Pasquinelli and Mr. Russo founded Consigliare Management Company (“CMC”) in 1999 to invest in commercial real estate. Since inception, CMC has developed, acquired, and owned six office and research and development projects in the Bay Area totaling approximately one million square feet.
Escrows.The loan documents provide for upfront reserves in the amount of $231,690 for real estate taxes. The loan documents require monthly deposits of $77,230 for real estate taxes and $4,700 for replacement reserves. The loan documents also require monthly deposits of $67,700 for tenant improvements and leasing commissions (“TI/LC”) commencing on August 11, 2016 (subject to a cap of $1.15 million). Upon the occurrence of any Moss Adams Non-Renewal Event (as defined below), the borrower must deposit an additional $316,000 into the account. Ongoing monthly reserves for insurance are not required provided (i) no event of default has occurred and is continuing; (ii) the insurance required to be maintained by borrower is maintained pursuant to one or more blanket insurance policies approved by the lender; and (iii) the borrower provides the lender with evidence of renewal of the insurance policy and evidence of timely proof of payment.
A “Moss Adams Non-Renewal Event” will commence upon the earlier of (i) four months prior to the expiration date of the Moss Adams lease, unless, prior to such date, the lender receives evidence that Moss Adams has exercised its option to extend the term of its lease or has otherwise renewed the lease on terms reasonably acceptable to the lender and/or (ii) 30 days after Moss Adams exercises any right to terminate or cancel its lease prior to the scheduled expiration thereof for any reason.
Lockbox and Cash Management.The Campbell Technology Park Mortgage Loan requires a lender-controlled lockbox account, which is already in place, and that the borrower and property manager deposit all rents directly into such lockbox account within one day of receipt. Prior to the occurrence of a Cash Trap Event Period (as defined below), all funds on deposit in the lockbox account are disbursed to the borrower. During a Cash Trap Event Period, all cash flow is swept to a lender-controlled cash management account.
A “Cash Trap Event Period” will commence upon the earlier of (i) the occurrence and continuance of an event of default or (ii) the net operating income debt service coverage ratio for the trailing 12-month period falling below 1.45x. A Cash Trap Event Period will expire, with regard to clause (i), upon the cure of such event of default, and with regard to clause (ii), upon the net operating income debt service coverage ratio being equal to or greater than 1.45x for two consecutive calendar quarters.
Property Management. The Campbell Technology Park Property is managed by an affiliate of the borrower.
Assumption.The borrower has a two-time right to transfer the Campbell Technology Park Property provided that certain conditions are satisfied, including (i) no event of default has occurred and is continuing; (ii) the lender has reasonably determined that the proposed transferee and guarantor satisfy the lender’s credit review and underwriting standards, taking into consideration transferee experience, financial strength and general business standing; and (iii) the lender has received confirmation from DBRS, KBRA and Moody’s that such assumption will not result in a downgrade, withdrawal or qualification of the respective ratings assigned to the Series 2015-NXS2 Certificates.
Partial Release. Not Permitted.
Real Estate Substitution.Not permitted.
Subordinate and Mezzanine Indebtedness. Not permitted.
THE INFORMATION IN THIS STRUCTURAL AND COLLATERAL TERM SHEET IS NOT COMPLETE AND MAY BE AMENDED PRIOR TO THE TIME OF SALE. THIS TERM SHEET IS NOT AN OFFER TO SELL THESE SECURITIES AND IT IS NOT A SOLICITATION OF AN OFFER TO BUY THESE SECURITIES IN ANY JURISDICTION WHERE THE OFFER OR SALE IS NOT PERMITTED.
| 40 |
| CAMPBELL TECHNOLOGY PARK |
Ground Lease.None.
Terrorism Insurance. The loan documents require that the “all risk” insurance policy required to be maintained by the borrower provides coverage for terrorism in an amount equal to the full replacement cost of the Campbell Technology Park Property. The loan documents also require business interruption insurance covering no less than the 12-month period following the occurrence of a casualty event, together with a six-month extended period of indemnity.
Earthquake Insurance.A seismic report dated April 22, 2015 determined that the probable maximum loss at the Campbell Technology Park Property was 15.0%. Earthquake insurance is not required.
THE INFORMATION IN THIS STRUCTURAL AND COLLATERAL TERM SHEET IS NOT COMPLETE AND MAY BE AMENDED PRIOR TO THE TIME OF SALE. THIS TERM SHEET IS NOT AN OFFER TO SELL THESE SECURITIES AND IT IS NOT A SOLICITATION OF AN OFFER TO BUY THESE SECURITIES IN ANY JURISDICTION WHERE THE OFFER OR SALE IS NOT PERMITTED.
| 41 |
| STOR ALL GROUP PORTFOLIO |
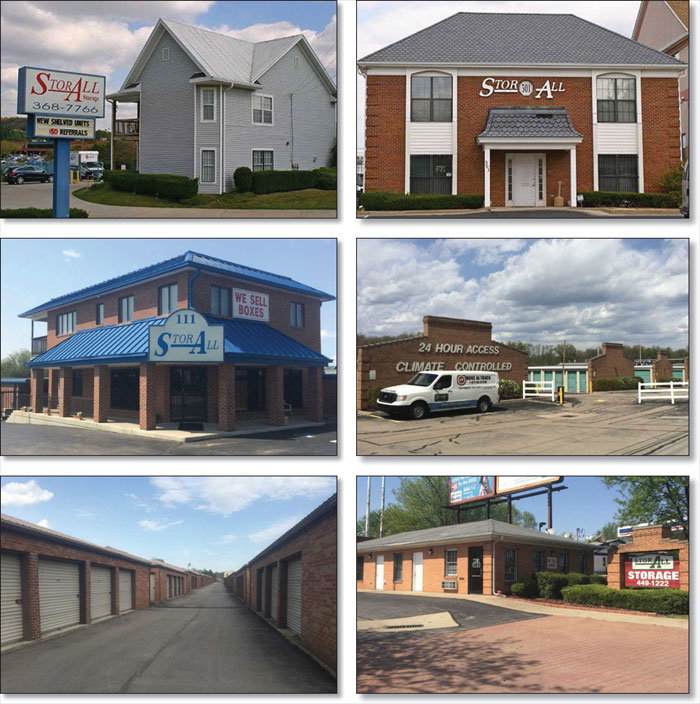
THE INFORMATION IN THIS STRUCTURAL AND COLLATERAL TERM SHEET IS NOT COMPLETE AND MAY BE AMENDED PRIOR TO THE TIME OF SALE. THIS TERM SHEET IS NOT AN OFFER TO SELL THESE SECURITIES AND IT IS NOT A SOLICITATION OF AN OFFER TO BUY THESE SECURITIES IN ANY JURISDICTION WHERE THE OFFER OR SALE IS NOT PERMITTED.
| 42 |
| STOR ALL GROUP PORTFOLIO |
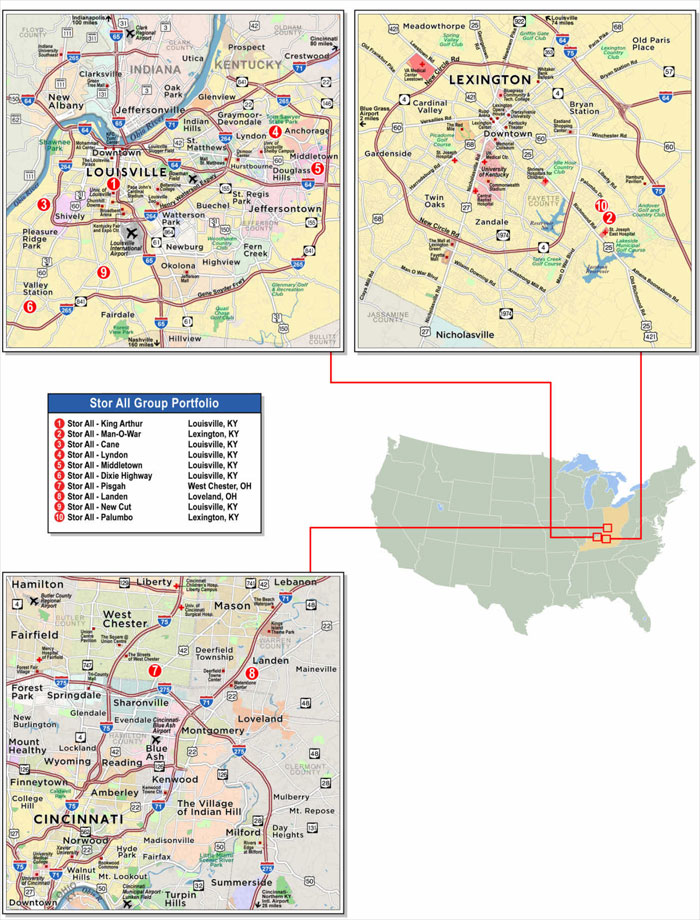
THE INFORMATION IN THIS STRUCTURAL AND COLLATERAL TERM SHEET IS NOT COMPLETE AND MAY BE AMENDED PRIOR TO THE TIME OF SALE. THIS TERM SHEET IS NOT AN OFFER TO SELL THESE SECURITIES AND IT IS NOT A SOLICITATION OF AN OFFER TO BUY THESE SECURITIES IN ANY JURISDICTION WHERE THE OFFER OR SALE IS NOT PERMITTED.
| 43 |
| No. 3 – Stor All Group Portfolio | ||||||
| Loan Information | Property Information | |||||
| Mortgage Loan Seller: | Wells Fargo Bank, National Association | Single Asset/Portfolio: | Portfolio | |||
| Credit Assessment (DBRS/KBRA/Moody’s): | NR/NR/NR | Property Type: | Self Storage | |||
| Original Principal Balance: | $58,250,000 | Specific Property Type: | Self Storage | |||
| Cut-off Date Principal Balance: | $58,250,000 | Location: | Various – See Table | |||
| % of Initial Pool Balance: | 6.4% | Size: | 684,770 SF | |||
| Loan Purpose: | Refinance | Cut-off Date Principal Balance Per SF: | $85.07 | |||
| Borrower Names(1): | Various | Year Built/Renovated: | Various – See Table | |||
| Sponsor: | James S. Womack | Title Vesting: | Fee | |||
| Mortgage Rate: | 4.385% | Property Manager: | Self-managed | |||
| Note Date: | June 5, 2015 | 3rd Most Recent Occupancy (As of): | 87.5% (12/31/2012) | |||
| Anticipated Repayment Date: | NAP | 2nd Most Recent Occupancy (As of): | 87.5% (12/31/2013) | |||
| Maturity Date: | July 1, 2025 | Most Recent Occupancy (As of): | 89.6% (12/31/2014) | |||
| IO Period: | 36 months | Current Occupancy (As of)(4): | 89.9% (TTM 4/30/2015) | |||
| Loan Term (Original): | 120 months | |||||
| Seasoning: | 0 months | Underwriting and Financial Information: | ||||
| Amortization Term (Original): | 360 months | |||||
| Loan Amortization Type: | Interest-only, Amortizing Balloon | 3rd Most Recent NOI (As of): | $4,271,446 (12/31/2013) | |||
| Interest Accrual Method: | Actual/360 | 2nd Most Recent NOI (As of): | $4,634,446 (12/31/2014) | |||
| Call Protection: | L(24),D(92),O(4) | Most Recent NOI (As of): | $4,645,047 (TTM 4/30/2015) | |||
| Lockbox Type: | Springing (Without Established Account) | |||||
| Additional Debt(2): | Yes | U/W Revenues: | $6,825,667 | |||
| Additional Debt Type(2): | Future Mezzanine | U/W Expenses: | $2,177,296 | |||
| U/W NOI: | $4,648,371 | |||||
| U/W NCF: | $4,579,894 | |||||
| U/W NOI DSCR: | 1.33x | |||||
| U/W NCF DSCR: | 1.31x | |||||
| Escrows and Reserves(3): | U/W NOI Debt Yield: | 8.0% | ||||
| U/W NCF Debt Yield: | 7.9% | |||||
| Type: | Initial | Monthly | Cap (If Any) | As-Is Appraised Value(5): | $80,000,000 | |
| Taxes | $175,488 | $31,160 | NAP | As-Is Appraisal Valuation Date(5): | April 22, 2015 | |
| Insurance | $0 | Springing | NAP | Cut-off Date LTV Ratio(5): | 72.8% | |
| Replacement Reserves | $136,954 | $5,706 | $136,954 | LTV Ratio at Maturity or ARD(5): | 63.6% | |
| (1) | See “The Borrowers” section. |
| (2) | See “Subordinate and Mezzanine Indebtedness” section. |
| (3) | See “Escrows” section. |
| (4) | See “Historical Occupancy” section. |
| (5) | See “Appraisal” section. |
The Mortgage Loan. The mortgage loan (the “Stor All Group Portfolio Mortgage Loan”) is evidenced by a single promissory note that is secured by a first mortgage encumbering 10 self storage properties located in Ohio and Kentucky (the “Stor All Group Portfolio Properties”). The Stor All Group Portfolio Mortgage Loan was originated on June 5, 2015 by Wells Fargo Bank, National Association. The Stor All Group Portfolio Mortgage Loan had an original principal balance of $58,250,000, has an outstanding principal balance as of the Cut-off Date of $58,250,000 and accrues interest at an interest rate of 4.385%per annum. The Stor All Group Portfolio Mortgage Loan had an initial term of 120 months, has a remaining term of 120 months as of the Cut-off Date and requires interest-only payments for the first 36 payments following origination and, thereafter, requires payments of principal and interest based on a 30-year amortization schedule. The Stor All Group Portfolio Mortgage Loan matures on July 1, 2025.
Following the lockout period, the borrowers have the right to defease the Stor All Group Portfolio Mortgage Loan in whole, but not in part, on any day before April 1, 2025. In addition, the Stor All Group Portfolio Mortgage Loan is prepayable without penalty on or after April 1, 2025.
THE INFORMATION IN THIS STRUCTURAL AND COLLATERAL TERM SHEET IS NOT COMPLETE AND MAY BE AMENDED PRIOR TO THE TIME OF SALE. THIS TERM SHEET IS NOT AN OFFER TO SELL THESE SECURITIES AND IT IS NOT A SOLICITATION OF AN OFFER TO BUY THESE SECURITIES IN ANY JURISDICTION WHERE THE OFFER OR SALE IS NOT PERMITTED.
| 44 |
| STOR ALL GROUP PORTFOLIO |
Sources and Uses
| Sources | Uses | ||||||||
| Original loan amount | $58,250,000 | 100.0% | Loans payoff(1) | $43,328,732 | 74.4 | % | |||
| Reserves | 312,442 | 0.5 | |||||||
| Closing costs | 950,533 | 1.6 | |||||||
| Return of equity | 13,658,293 | 23.4 | |||||||
| Total Sources | $58,250,000 | 100.0% | Total Uses | $58,250,000 | 100.0 | % |
| (1) | Eight of the 10 Stor All Group Portfolio Properties were previously securitized in the JPMCC 2005-LDP3 and JPMCC 2005-CB12 transactions. |
The Properties.The Stor All Group Portfolio Properties are comprised of a portfolio of 10 self storage properties totaling 684,770 rentable square feet or 5,590 units which are located in Kentucky (8) and Ohio (2). The Stor All Group Portfolio Properties range in size from 52,400 square feet to 85,365 square feet and climate controlled units account for approximately 23.1% of net rentable area. Built between 1988 and 1999, the Stor All Group Portfolio Properties have exhibited an average occupancy of 88.7% over the last eight years and have demonstrated a 28.4% net operating income increase over the last five years. As of the trailing 12-month period ending April 30, 2015, the Stor All Group Portfolio Properties were 89.9% occupied.
The following table presents certain information relating to the Stor All Group Portfolio Properties:
| Property Name – Location | Allocated Cut-off Date | % of Portfolio Cut-off Date Principal Balance | Occupancy | Year Built/ Renovated | Net Rentable Area (SF) | Appraised Value(3) | |
| King Arthur – Louisville, KY(1) | $8,001,506 | 13.7% | 87.3% | 1997/NAP | 85,365 | $9,350,000 | |
| Man-O-War – Lexington, KY(2) | $7,572,794 | 13.0% | 92.6% | 1995/NAP | 76,475 | $8,600,000 | |
| Lyndon – Louisville, KY(1) | $7,002,321 | 12.0% | 88.9% | 1996/NAP | 64,875 | $8,450,000 | |
| Cane – Louisville, KY(2) | $6,824,172 | 11.7% | 87.3% | 1992/NAP | 82,750 | $8,500,000 | |
| Middleton – Louisville, KY(1) | $6,690,377 | 11.5% | 95.3% | 1999/NAP | 65,325 | $7,950,000 | |
| Dixie Highway – Louisville, KY(2) | $5,915,169 | 10.2% | 86.5% | 1996/NAP | 72,910 | $7,050,000 | |
| Pisgah – Cincinnati, OH | $4,499,746 | 7.7% | 89.1% | 1999/NAP | 70,120 | $5,100,000 | |
| Landen – Loveland, OH | $4,187,172 | 7.2% | 95.5% | 1996/NAP | 61,180 | $4,900,000 | |
| New Cut – Louisville, KY(2) | $3,945,284 | 6.8% | 87.2% | 1988/NAP | 53,370 | $5,550,000 | |
| Palumbo – Lexington, KY(1) | $3,611,459 | 6.2% | 91.3% | 1990/NAP | 52,400 | $4,950,000 | |
| Total/Weighted Average | $58,250,000 | 100.0% | 89.9% | 684,770 | $80,000,000 | ||
| (1) | Previously securitized in the JPMCC 2005-LDP3 transaction. |
| (2) | Previously securitized in the JPMCC 2005-CB12 transaction. |
| (3) | See “Appraisal” section. |
The following table presents historical occupancy percentages at the Stor All Group Portfolio Properties:
Historical Occupancy
| 12/31/2012(1) | 12/31/2013(1) | 12/31/2014(1) | TTM 4/30/2015(2)(3) | |||
| 87.5% | 87.5% | 89.6% | 89.9% |
| (1) | Information obtained from the borrowers. |
| (2) | Information obtained from the underwritten rent roll. |
| (3) | The TTM 4/30/2015 occupancy represents the average monthly occupancy of the Stor All Group Portfolio Properties for the trailing 12-month period ending April 30, 2015. |
THE INFORMATION IN THIS STRUCTURAL AND COLLATERAL TERM SHEET IS NOT COMPLETE AND MAY BE AMENDED PRIOR TO THE TIME OF SALE. THIS TERM SHEET IS NOT AN OFFER TO SELL THESE SECURITIES AND IT IS NOT A SOLICITATION OF AN OFFER TO BUY THESE SECURITIES IN ANY JURISDICTION WHERE THE OFFER OR SALE IS NOT PERMITTED.
| 45 |
| STOR ALL GROUP PORTFOLIO |
Operating History and Underwritten Net Cash Flow. The following table presents certain information relating to the historical operating performance and the underwritten net cash flow at the Stor All Group Portfolio Properties:
Cash Flow Analysis
2013 | 2014 | TTM 4/30/2015 | U/W | % of U/W Effective Gross Income | U/W $ per SF | ||||||||
| Base Rent | $6,038,341 | $6,394,516 | $6,409,280 | $6,409,280 | 93.9% | $9.36 | |||||||
| Grossed Up Vacant Space | 0 | 0 | 0 | 1,222,204 | 17.9 | 1.78 | |||||||
| Less Concessions | 0 | 0 | 0 | 0 | 0.0 | 0.00 | |||||||
| Other Income | 277,215 | 386,450 | 416,387 | 416,387 | 6.1 | 0.61 | |||||||
| Less Vacancy & Credit Loss | 0 | 0 | 0 | (1,222,204)(1) | (17.9) | (1.78) | |||||||
| Effective Gross Income | $6,315,556 | $6,780,966 | $6,825,667 | $6,825,667 | 100.0% | $9.97 | |||||||
| Total Operating Expenses | $2,044,110 | $2,146,520 | $2,180,620 | $2,177,296 | 31.9% | $3.18 | |||||||
| Net Operating Income | $4,271,446 | $4,634,446 | $4,645,047 | $4,648,371 | 68.1% | $6.79 | |||||||
| Capital Expenditures | 0 | 0 | 0 | 68,477 | 1.0 | 0.10 | |||||||
| Net Cash Flow | $4,271,446 | $4,634,446 | $4,645,047 | $4,579,894 | 67.1% | $6.69 | |||||||
| NOI DSCR | 1.22x | 1.33x | 1.33x | 1.33x | |||||||||
| NCF DSCR | 1.22x | 1.33x | 1.33x | 1.31x | |||||||||
| NOI DY | 7.3% | 8.0% | 8.0% | 8.0% | |||||||||
| NCF DY | 7.3% | 8.0% | 8.0% | 7.9% | |||||||||
| (1) | The underwritten economic vacancy is 16.0%. As of the trailing 12-months ending April 30, 2015, the Stor All Group Portfolio Properties were 88.9% physically occupied. |
Appraisal.As of the appraisal valuation date of April 22, 2015, the Stor All Group Portfolio Properties had an aggregate portfolio “as-is” appraised value of $80,000,000. The Stor All Group Portfolio Properties were also valued individually, with the individual values combining to reflect an aggregate “as-is” appraised value of $70,400,000. Due to the diversified and cross-collateralized portfolio with no partial releases or substitutions permitted, the “as-is” appraised value is based on the portfolio valuation.
Environmental Matters. According to Phase I environmental assessments dated from April 30, 2015 through May 5, 2015, there was no evidence of any recognized environmental conditions at any of the Stor All Group Portfolio Properties.
Market Overview and Competition. The Stor All Group Portfolio Properties are located in Louisville, Kentucky; Lexington, Kentucky; Cincinnati, Ohio; and Loveland, Ohio. The appraisal noted that given the close proximity of Lexington to Louisville, Kentucky, the overall Louisville self storage market included the properties located in Lexington, Kentucky.
Eight of the Stor All Group Portfolio Properties are located in Louisville and Lexington, Kentucky (“Kentucky Properties”). According to the appraisal, the existing self storage supply in the Louisville market is 6.1 square feet per person (which is 26.1% below the existing nationwide supply of self storage square footage per person) and the Kentucky Properties’ self storage market is currently undersupplied with a demand of 6.7 square feet per person. The 2014 estimated populations within a three-mile radius of the Kentucky Properties ranged from 35,372 to 124,187 with an average of 72,058. The 2014 estimated household incomes within the same three-mile radius of Kentucky Properties range from $43,083 to $108,140 with an average of $68,350.
Two of the Stor All Group Portfolio Properties are located in Cincinnati, Ohio and nearby Loveland, Ohio (“Ohio Properties”). According to the appraisal, the existing self storage supply in Cincinnati, Ohio is 4.0 square feet per person (which is 51.9% below the existing nationwide supply of self storage square footage per person) and the Cincinnati self storage market is currently undersupplied with a demand of 6.7 square feet per person. The 2014 estimated populations within a three-mile radius of the Ohio Properties range from 43,995 to 53,274 with an average of 48,635. The 2014 estimated household incomes within the same three-mile radius of Ohio Properties range from $99,199 to $106,490 with an average of $102,845.
The Borrowers. The borrowers are comprised of 10 separate Kentucky limited liability companies, each of which is a single purpose entity with one independent director. Legal counsel to the borrowers provided a non-consolidation opinion in connection with the origination of the Stor All Group Portfolio Mortgage Loan. James S. Womack is the guarantor of certain nonrecourse carveouts under the Stor All Group Portfolio Mortgage Loan.
The Sponsor. The sponsor is James S. Womack, the founder, owner, and president of Stor All Self Storage (“Stor All”). James S. Womack is an experienced commercial real estate developer and self storage owner/operator with over 30 years of experience in self storage investments, development, acquisitions and management. Stor All was founded in 1984 and within the first 15 years after its inception, developed 15 self storage properties in Kentucky and Ohio and four self storage properties in New Orleans, Louisiana. Stor All’s current self storage portfolio consists of 18 self storage properties (including one self storage property under development) totaling 1.2 million square feet and valued at approximately $103.5 million.
Escrows.The loan documents provide for upfront reserves of $175,488 for real estate taxes and $136,954 for replacement reserves. The loan documents also provide for ongoing monthly reserves of $31,160 for real estate taxes and $5,706 for replacement reserves (subject to a cap of $136,954).Ongoing monthly reserves for insurance are not required as long as (a) no event of default has occurred and is continuing; (b) the Stor All Group Portfolio Properties are insured via an acceptable blanket insurance policy; and (c) the borrowers provide the lender with evidence of renewal of the insurance policies and timely proof of payment of insurance premiums.
THE INFORMATION IN THIS STRUCTURAL AND COLLATERAL TERM SHEET IS NOT COMPLETE AND MAY BE AMENDED PRIOR TO THE TIME OF SALE. THIS TERM SHEET IS NOT AN OFFER TO SELL THESE SECURITIES AND IT IS NOT A SOLICITATION OF AN OFFER TO BUY THESE SECURITIES IN ANY JURISDICTION WHERE THE OFFER OR SALE IS NOT PERMITTED.
| 46 |
| STOR ALL GROUP PORTFOLIO |
Lockbox and Cash Management.Upon the occurrence of a Cash Trap Event Period (as defined below), the borrowers will be required to establish a lender-controlled lockbox account and direct tenants to deposit all rents directly into such lockbox account. Additionally, all revenues and other monies received by the borrowers or property manager relating to the Stor All Group Portfolio Properties shall be deposited into the lockbox account within 30 days. During a Cash Trap Event Period, all excess funds on deposit in the lockbox account are swept to a lender-controlled subaccount on a monthly basis.
A “Cash Trap Event Period” will commence upon the earlier of (i) the occurrence and continuance of an event of default; and (ii) the amortizing debt service coverage ratio for the trailing 12-month period falling below 1.10x at the end of any calendar month. A Cash Trap Event Period will expire, with regard to clause (i), upon the cure of such event of default; and with regard to clause (ii), upon the amortizing debt service coverage ratio being equal to or greater than 1.15x for two consecutive calendar quarters.
Property Management.The Stor All Group Portfolio Properties are managed by affiliates of the borrowers.
Assumption.The borrowers have a two-time right to transfer the Stor All Group Portfolio Properties in whole, but not in part, provided that no event of default has occurred and is continuing and certain other conditions are satisfied, including (i) the lender’s reasonable determination that the proposed transferee and guarantor satisfy the lender’s credit review and underwriting standards, taking into consideration transferee experience, financial strength and general business standing; (ii) execution of a recourse guaranty and an environmental indemnity by an affiliate of the transferee; and (iii) if requested by the lender, rating agency confirmation from DBRS, KBRA and Moody’s that the transfer will not result in a downgrade, withdrawal or qualification of the respective ratings assigned to the Series 2015-NXS2 Certificates.
Partial Release.Not permitted.
Real Estate Substitution.Not permitted.
Subordinate and Mezzanine Indebtedness.Provided no event of default has occurred and is continuing, the borrowers have a one-time right to incur mezzanine financing subject to the satisfaction of certain conditions, including but not limited to (i) the execution of an intercreditor agreement in form and substance acceptable to lender and each of DBRS, KBRA and Moody’s; (ii) the combined loan-to-value is not greater than 75.0%; (iii) the combined amortizing debt service coverage ratio is not less than 1.30x (assuming a 30-year amortization schedule on the proposed mezzanine financing); and (iv) the lender receives rating agency confirmation from DBRS, KBRA and Moody’s that the mezzanine financing will not result in a downgrade, withdrawal or qualification of the respective ratings assigned to the Series 2015-NXS2 Certificates.
Ground Lease. None.
Terrorism Insurance. The loan documents require that the “all risk” insurance policy required to be maintained by the borrowers provide coverage for terrorism in an amount equal to the full replacement cost of the Stor All Group Portfolio Properties (with no exclusion or separate coverage for terrorism), as well as business interruption insurance covering no less than the 18-month period following the occurrence of a casualty event, together with a six-month extended period of indemnity.
THE INFORMATION IN THIS STRUCTURAL AND COLLATERAL TERM SHEET IS NOT COMPLETE AND MAY BE AMENDED PRIOR TO THE TIME OF SALE. THIS TERM SHEET IS NOT AN OFFER TO SELL THESE SECURITIES AND IT IS NOT A SOLICITATION OF AN OFFER TO BUY THESE SECURITIES IN ANY JURISDICTION WHERE THE OFFER OR SALE IS NOT PERMITTED.
| 47 |
| 100 WEST 57TH STREEET |
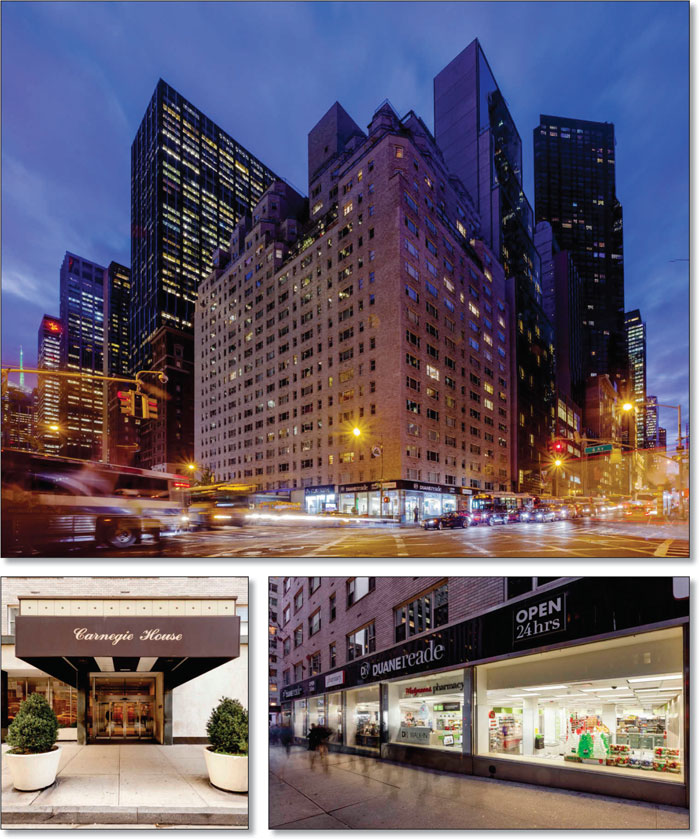
THE INFORMATION IN THIS STRUCTURAL AND COLLATERAL TERM SHEET IS NOT COMPLETE AND MAY BE AMENDED PRIOR TO THE TIME OF SALE. THIS TERM SHEET IS NOT AN OFFER TO SELL THESE SECURITIES AND IT IS NOT A SOLICITATION OF AN OFFER TO BUY THESE SECURITIES IN ANY JURISDICTION WHERE THE OFFER OR SALE IS NOT PERMITTED.
| 48 |
| 100 WEST 57TH STREEET |
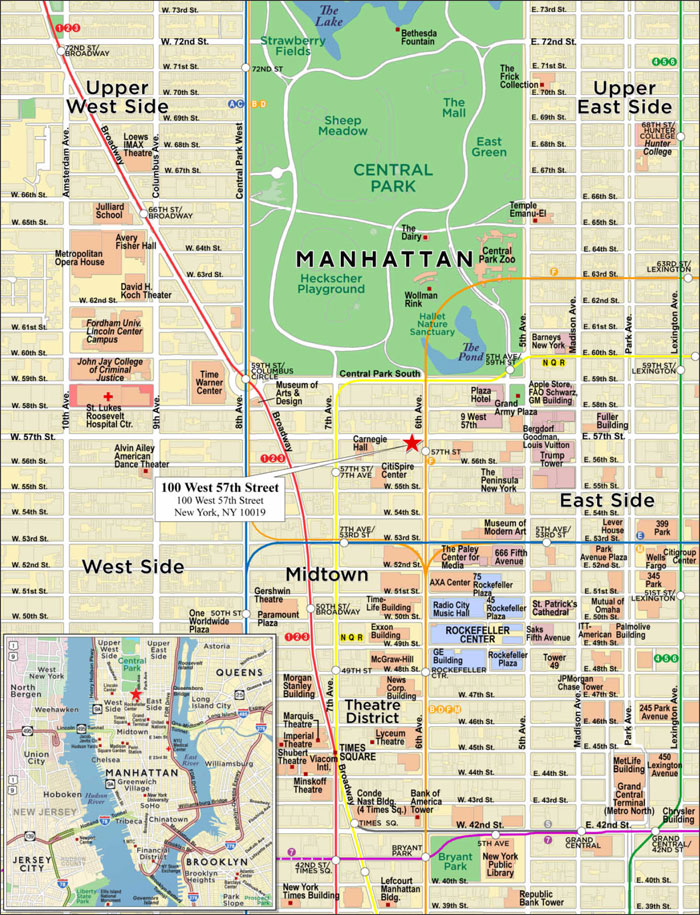
THE INFORMATION IN THIS STRUCTURAL AND COLLATERAL TERM SHEET IS NOT COMPLETE AND MAY BE AMENDED PRIOR TO THE TIME OF SALE. THIS TERM SHEET IS NOT AN OFFER TO SELL THESE SECURITIES AND IT IS NOT A SOLICITATION OF AN OFFER TO BUY THESE SECURITIES IN ANY JURISDICTION WHERE THE OFFER OR SALE IS NOT PERMITTED.
| 49 |
| No. 4 – 100 West 57th Street | ||||||
| Loan Information | Property Information | |||||
| Mortgage Loan Seller: | Natixis Real Estate Capital LLC | Single Asset/Portfolio: | Single Asset | |||
| Credit Assessment (DBRS/KBRA/Moody’s): | NR/NR/NR | Property Type: | Other | |||
| Original Principal Balance(1): | $45,000,000 | Specific Property Type: | Leased Fee | |||
| Cut-off Date Principal Balance(1): | $45,000,000 | Location: | New York, NY | |||
| % of Initial Pool Balance: | 4.9% | Size(3): | 25,125 SF | |||
| Loan Purpose: | Acquisition | Cut-off Date Principal Balance Per SF(1)(3): | $7,164.18 | |||
| Borrower Name: | 57th & 6th Ground LLC | Year Built/Renovated: | NAP/NAP | |||
| Sponsors: | David Werner; Eli Schron; Avi Schron; Mark Schron | Title Vesting: | Fee | |||
| Mortgage Rate: | 2.307% | Property Manager: | Self-managed | |||
| Note Date: | November 5, 2014 | 3rdMost Recent Occupancy: | NAP | |||
| Anticipated Repayment Date: | November 5, 2019 | 2ndMost Recent Occupancy: | NAP | |||
| Maturity Date: | April 5, 2035 | Most Recent Occupancy: | NAP | |||
| IO Period: | 60 months | Current Occupancy: | NAP | |||
| Loan Term (Original): | 60 months | |||||
| Seasoning: | 8 months | Underwriting and Financial Information: | ||||
| Amortization Term (Original): | NAP | |||||
| Loan Amortization Type: | Interest-only, ARD | In Place Contractual Ground Rent: | $4,070,655 | |||
| Interest Accrual Method: | Actual/360 | Estimated Ground Rent Reset(4): | $21,233,420 | |||
| Call Protection: | L(32),D(24),O(4) | |||||
| Lockbox Type: | Hard/Upfront Cash Management | |||||
| Additional Debt(1): | Yes | |||||
| Additional Debt Type(1): | Pari Passu | U/W Revenues(5): | $4,213,128 | |||
| U/W Expenses: | $0 | |||||
| U/W NOI(5): | $4,213,128 | |||||
| U/W NCF(5): | $4,213,128 | |||||
| U/W NOI DSCR(1)(5): | 1.00x | |||||
| U/W NCF DSCR(1)(5): | 1.00x | |||||
| Escrows and Reserves(2): | U/W NOI Debt Yield(1)(5): | 2.3% | ||||
| U/W NCF Debt Yield(1)(5): | 2.3% | |||||
| Type: | Initial | Monthly | Cap (If Any) | As-Is Appraised Value: | $300,000,000 | |
| Taxes | $0 | Springing | NAP | “Unencumbered Land” Appraised Value: | $260,000,000 | |
| Insurance | $0 | Springing | NAP | As-Is Appraisal Valuation Date: | August 1, 2014 | |
| Quarterly Rent | $0 | (2) | NAP | Cut-off Date LTV Ratio(1)(6): | 60.0% | |
| Future Rent | $605,510 | $0 | NAP | LTV Ratio at Maturity or ARD(1)(6): | 60.0% | |
| (1) | The 100 West 57th Street Loan Combination, totaling $180,000,000, is comprised of fourpari passu notes (Notes A-1, A-2, A-3 and A-4). The controlling Note A-1 had an original principal balance of $45,000,000, has an outstanding principal balance of $45,000,000 as of the Cut-Off Date and will be contributed to the WFCM 2015-NXS2 Trust. The non-controlling Notes A-2, A-3 and A-4 had an original principal balance of $60,000,000, $40,000,000 and $35,000,000, respectively, and were contributed to the COMM 2015-CCRE22 Trust, the COMM 2015-DC1 Trust and the WFCM 2015-NXS1 Trust, respectively. All statistical financial information related to balances per square foot, loan-to-value ratios, debt service coverage ratios and debt yield are based on the 100 West 57th Street Loan Combination. See “Description of the Mortgage Pool—Loan Combinations—The 100 West 57th Street Loan Combination” in the Free Writing Prospectus. |
| (2) | See “Escrows” section. |
| (3) | Size represents the land area. The 100 West 57th Street Property is improved by 418,114 square feet of mixed use residential cooperative and retail space, which are not part of the collateral. Cut-off Date Principal Balance Per SF based on the fee (collateral) and leasehold (non-collateral) is $430.50. |
| (4) | The ground rent will reset on March 15, 2025 and, per the ground lease, the annual ground rent will be calculated as 8.1667% of the then fair market value of the land as unimproved and unencumbered. The number shown was calculated based on the “Unencumbered Land” appraised value of $260.0 million. |
| (5) | See “Cash Flow Analysis” section. |
| (6) | Based on the “fee and leasehold” Appraised Value of $450,000,000, which reflects the value of the improvements (418,114 square feet of mixed use residential cooperative and retail space), which are not part of the collateral, plus the value of the land (collateral), the Cut-off Date LTV Ratio and LTV Ratio at Maturity or ARD are 40.0%. |
The Mortgage Loan. The mortgage loan is part of a loan combination (the “100 West 57th Street Loan Combination”) that is evidenced by fourpari passu promissory notes (Notes A-1, A-2, A-3 and A-4), secured by a first mortgage encumbering the fee simple interest in a land parcel totaling 25,125 square feet located at 100 West 57th Street (also known as 1381-1399 Avenue of the Americas), in Midtown Manhattan, New York (the “100 West 57th Street Property”). The 100 West 57th Street Loan Combination was originated on November 5, 2014 by Natixis Real Estate Capital LLC. The 100 West 57th Street Loan Combination had an original principal balance of $180,000,000, has an outstanding principal balance as of the Cut-off Date of $180,000,000 and accrues interest at an interest rate of 2.307%per annum. The 100 West 57th Street Loan Combination had an initial term of 60 months, has a remaining term of 52 months as of the Cut-off Date and requires interest-only payments through the Anticipated Repayment Date (“ARD”). The ARD is November 5, 2019 and the final maturity date is April 5, 2035. In the event the 100 West 57th Street Loan Combination is not paid in full on or before the ARD, the interest rate will increase to 5.617% per annum until, but excluding, March 5, 2025. On the March 5, 2025 payment date, the interest rate will increase to the greater of (i) 6.367% and (ii)
THE INFORMATION IN THIS STRUCTURAL AND COLLATERAL TERM SHEET IS NOT COMPLETE AND MAY BE AMENDED PRIOR TO THE TIME OF SALE. THIS TERM SHEET IS NOT AN OFFER TO SELL THESE SECURITIES AND IT IS NOT A SOLICITATION OF AN OFFER TO BUY THESE SECURITIES IN ANY JURISDICTION WHERE THE OFFER OR SALE IS NOT PERMITTED.
| 50 |
| 100 WEST 57TH STREEET |
the then five-year swap spread on March 5, 2025 plus 4.060%. The difference between the adjusted interest rate and the initial interest rate is referred to herein as the additional ARD interest. From and after the ARD, all excess cash flow from the 100 West 57th Street Property, after payment of reserves, interest calculated at the initial interest rate and 100 West 57th Street Property operating expenses, will be applied to the outstanding principal balance of the 100 West 57th Street Loan Combination until repaid in full. The additional ARD interest will accrue from and after the ARD and, subject to applicable law, will be added to the then outstanding principal balance of the 100 West 57th Street Loan Combination, but payments will be deferred until the 100 West 57th Street Loan Combination has been paid in full, at which time the additional ARD interest (plus any accrued and unpaid interest at the adjusted interest rate) will be due and payable.
Note A-1, which will be contributed to the WFCM 2015-NXS2 Trust, had an original principal balance of $45,000,000, has an outstanding principal balance as of the Cut-off Date of $45,000,000 and represents the controlling interest in the 100 West 57th Street Loan Combination. The non-controlling Note A-2, which had an original principal balance of $60,000,000, was contributed to the COMM 2015-CCRE22 Trust. The non-controlling Note A-3, which had an original principal balance of $40,000,000, was contributed to the COMM 2015-DC1 Trust. The non-controlling Note A-4 (together with Note A-2 and Note A-3, the “100 West 57th Street Companion Loans”), which had an original principal balance of $35,000,000, was contributed to the WFCM 2015-NXS1 Trust. See “Description of the Mortgage Pool—Loan Combinations—The 100 West 57th Street Loan Combination” in the Free Writing Prospectus.
Following the lockout period, the borrower has the right to defease the 100 West 57th Street Loan Combination, in whole or in part, on any date before August 5, 2019. In addition, the 100 West 57th Street Loan Combination is prepayable without penalty on or after August 5, 2019.
Sources and Uses
| Sources | Uses | ||||||||
| Original loan amount | $180,000,000 | 59.2% | Purchase price | $286,000,000 | 94.0 | % | |||
| Sponsor new cash contribution | 124,138,000 | 40.8 | Closing costs | 17,532,490 | 5.8 | ||||
| Reserves | 605,510 | 0.2 | |||||||
| Total Sources | $304,138,000 | 100.0% | Total Uses | $304,138,000 | 100.0 | % |
The Property. The 100 West 57th Street Loan Combination is collateralized by the borrower’s fee interest in a 25,125 square foot parcel of land located at 100 West 57th Street (also known as 1381-1399 Avenue of the Americas) in Midtown Manhattan that is improved by a 21-story, class A, mixed-use residential cooperative and retail building (collectively, the “Improvements” or “Leasehold Improvements”), known as the Carnegie House (Improvements not part of the collateral for the 100 West 57th Street Loan Combination). The land is a through-block parcel located on the westerly block-front of Avenue of the Americas between West 56th and West 57th Street in the Plaza District of Midtown Manhattan. The borrower’s fee simple interest is subject to a ground lease (the “Ground Lease”) pursuant to which the ground lessee constructed, developed and owns the Improvements that sit on top of the 100 West 57th Street Property (see “Ground Lease” section). The Improvements comprise 323 cooperative apartment units on floors 2 through 21, a 225-space parking garage on two sub-cellar levels with an entrance on West 56th Street and 28,337 square feet of retail space on the ground and basement levels. The Carnegie House was constructed in 1962 on the 100 West 57th Street Property shortly after the original developer ground-leased it in 1959. All Leasehold Improvements were converted to cooperative ownership in 1978. The ground lessee’s interest in the Improvements is not collateral for the 100 West 57th Street Loan Combination.
The residential entrance to the Carnegie House mixed-use building is located on Avenue of the Americas with a main lobby with an attended front desk. The apartment floors are serviced by three passenger elevators and two freight elevators. The building amenities include a full-time doorman, live-in superintendent, valet service, private storage, bike room, central laundry and an on-site garage (which is leased to a third-party operator). The apartment unit mix includes studio, one-bedroom, two-bedroom, three-bedroom and four-bedroom units based on the original co-op offering plan reviewed; however, the exact current unit mix is not available. Some apartment units have outdoor terraces or balconies.
The retail space contains approximately 28,337 square feet on the ground and basement floors with an occupancy rate of 92.0% as of November 2014. Duane Reade, the retail anchor tenant, occupies approximately 7,316 square feet of grade-level corner space at Avenue of the Americas and West 57th Street with an additional 12,350 square feet on the basement level. There are seven grade level in-line retail suites, of which six suites totaling 6,402 square feet are currently occupied and one (2,269 square feet) is vacant.
THE INFORMATION IN THIS STRUCTURAL AND COLLATERAL TERM SHEET IS NOT COMPLETE AND MAY BE AMENDED PRIOR TO THE TIME OF SALE. THIS TERM SHEET IS NOT AN OFFER TO SELL THESE SECURITIES AND IT IS NOT A SOLICITATION OF AN OFFER TO BUY THESE SECURITIES IN ANY JURISDICTION WHERE THE OFFER OR SALE IS NOT PERMITTED.
| 51 |
| 100 WEST 57TH STREEET |
The following table presents certain information relating to the retail tenancy at the non-collateral Improvements at the 100 West 57th Street Property:
Retail Tenant Summary(1)
Tenant | Credit Rating (Fitch/Moody’s/ | Tenant NRSF | % of NRSF | In Place Rent PSF | % of Total In Place | Market Rent PSF(3) | Lease Expiration | |
| Major Tenants | ||||||||
| Duane Reade(4) | NR/Baa2/BBB | 7,316 | 25.8% | $140.11 | 30.9% | $350.00 | 2/28/2025 | |
| Duane Reade (Basement)(4) (5) | NR/Baa2/BBB | 5,150 | 18.2% | $140.11 | 21.7% | $100.00 | 2/28/2025 | |
| Duane Reade (Cellar)(4) | NR/Baa2/BBB | 7,200 | 25.4% | $25.00 | 5.4% | $25.00 | 2/28/2025 | |
| Total Major Tenants | 19,666 | 69.4% | $97.96 | 58.1% | $165.54 | |||
| In-Line Tenants | ||||||||
| Jamba Juice(4) | NR/NR/NR | 1,702 | 6.0% | $224.74 | 11.5% | $275.00 | 8/31/2015 | |
| Coterie (1387 Sixth Avenue Inc) | NR/NR/NR | 1,364 | 4.8% | $178.13 | 7.3% | $250.00 | 10/31/2023 | |
| City Souvenirs on 6th | NR/NR/NR | 1,083 | 3.8% | $221.97 | 7.2% | $250.00 | 10/31/2021 | |
| NY Diva Nails & Spa | NR/NR/NR | 1,017 | 3.6% | $224.21 | 6.9% | $250.00 | 12/31/2015 | |
| Tucci Italia (Yaron H) | NR/NR/NR | 784 | 2.8% | $223.95 | 5.3% | $250.00 | 9/30/2021 | |
| Zibetto Espresso Bar | NR/NR/NR | 452 | 1.6% | $269.05 | 3.7% | $250.00 | 1/31/2016 | |
| Total In-Line Tenants | 6,402 | 22.6% | $217.29 | 41.9% | $256.65 | |||
| Total Occupied Improvements | 26,068 | 92.0% | $127.27 | 100.0% | $187.92 | |||
| Vacant Space | 2,269 | 8.0% | ||||||
| Total | 28,337 | 100.0% | ||||||
| (1) | Information obtained from the retail rent roll as of November 2014. |
| (2) | Certain ratings are those of the parent company whether or not the parent company guarantees the lease. |
| (3) | Information obtained from the appraisal. |
| (4) | Duane Reade has one five-year lease renewal option and Jamba Juice has two five-year lease renewal options. |
| (5) | The Duane Reade (Basement) space is a retail space and is fully operational. |
Operating History and Underwritten Net Cash Flow. The following table presents certain information relating to the historical operating performance and underwritten net cash flow at the 100 West 57th Street Property:
Cash Flow Analysis
| In Place Contractual Ground Rent(1) | U/W(1) | Estimated Ground Rent Reset(2) | Mark-to-Market Look-Through of Leasehold Interest (Non- collateral)(3) | ||||||
| Base Rent | $4,070,655 | $4,213,128 | $21,233,420 | $29,257,185 | |||||
| Less Vacancy & Credit Loss | 0 | 0 | 0 | (932,188)(4) | |||||
| Effective Gross Income | $4,070,655 | $4,213,128 | $21,233,420 | $28,324,997 | |||||
| Total Operating Expenses | 0 | 0 | 0 | 8,835,882 | |||||
| Net Operating Income | $4,070,655 | $4,213,128 | $21,233,420 | $19,489,115 | |||||
| TI/LC | 0 | 0 | 0 | 226,900 | |||||
| Capital Expenditures | 0 | 0 | 0 | 166,249 | |||||
| Net Cash Flow | $4,070,655 | $4,213,128 | $21,233,420 | $19,095,966 | |||||
| NOI DSCR(5) | 0.96x | 1.00x | 5.03x | 4.63x | |||||
| NCF DSCR(5) | 0.96x | 1.00x | 5.03x | 4.54x | |||||
| NOI DY(5) | 2.3% | 2.3% | 11.8% | 10.8% | |||||
| NCF DY(5) | 2.3% | 2.3% | 11.8% | 10.6% |
| (1) | Ground rent steps up from $4,070,655 to $4,213,128 beginning on March 15, 2019, then to $4,360,587 on March 15, 2024. |
| (2) | Calculated based on the unencumbered land appraised value of $260.0 million. The ground rent will reset on March 15, 2025 and per the ground lease is calculated as 8.1667% of the then fair market value of the land as unimproved and unencumbered. |
| (3) | Information derived from the market rents and discounted cash flow expenses in the appraisal. See “Mark-to-Market Look-Through Analysis” section. |
| (4) | Estimated Mark-to-Market Look-Through of Leasehold Interest (non-collateral) Vacancy represents 3.2% of gross income. |
| (5) | DSCRs and debt yields are based on the 100 West 57th Street Loan Combination. |
Appraisal. As of the appraisal valuation date of August 1, 2014, the 100 West 57th Street Property had an “as-is” appraised value of $300,000,000, an “unencumbered land” appraised value of $260,000,000 and a “fee and leasehold” appraised value of $450,000,000.
THE INFORMATION IN THIS STRUCTURAL AND COLLATERAL TERM SHEET IS NOT COMPLETE AND MAY BE AMENDED PRIOR TO THE TIME OF SALE. THIS TERM SHEET IS NOT AN OFFER TO SELL THESE SECURITIES AND IT IS NOT A SOLICITATION OF AN OFFER TO BUY THESE SECURITIES IN ANY JURISDICTION WHERE THE OFFER OR SALE IS NOT PERMITTED.
| 52 |
| 100 WEST 57TH STREEET |
Environmental Matters. According to a Phase I environmental site assessment dated September 23, 2014, there was no evidence of any recognized environmental conditions at the 100 West 57th Street Property.
Market Overview and Competition. The 100 West 57th Street Property is located on the westerly block-front of Avenue of the Americas between West 56th and West 57th Street in Midtown Manhattan. The 100 West 57th Street Property is surrounded by many of New York’s landmarks, restaurants, hotels, theatres, retail shops and tourist attractions, made accessible by the presence of several major transportation hubs. The F line stop located at 6th Avenue and West 57th Street and stops for the A, B, C, D, E, N, Q, R, 1, 2 and 3 lines are within walking distance of the 100 West 57th Street Property. The 100 West 57th Street Property is located within the Plaza District, which is bounded by 47th Street to the south and 65th Street to the north, and from Avenue of the Americas to the west and Park Avenue to the east.
The following table presents certain information relating to land sale comparables for the 100 West 57th Street Property:
Competitive Set(1)
| 100 West 57th Street (Subject) | 985-989 Third Avenue | 118-122 East 59th Street | 950 Second Avenue | 101 Murray Street | 616 First Avenue | 961 First Avenue | |
| Distance from Subject | - | <1mile | <1mile | 1.2 miles | 4.2 miles | 2.0 miles | 1.1 miles |
| Sales Price | $286,000,000 | $102,500,000 | $49,000,000 | $61,000,000 | $223,000,000 | $172,125,000 | $64,000,000 |
| Transaction Date | 11 / 2014 | In Contract | 11 / 2013 | 8 / 2013 | 5 / 2013 | 2 / 2013 | 12 / 2012 |
| Size (Acres / Square feet) | 0.58 / 25,125 | 0.16 / 6,843 | 0.17 / 7,532 | 0.20 / 8,837 | 0.71 / 31,028 | 1.04 / 45,190 | 0.20 / 8,814 |
| Max. Buildable FAR (Square feet) | 376,875 | 89,480 | 76,693 | 118,726 | 310,280 | 523,930 | 159,153 |
| (1) | Information obtained from the appraisal. |
Mark-to-Market Look-Through Analysis. The appraisal concluded retail market rents of $350.00 per square foot for the ground retail space on the corner of West 57th Street and Avenue of the Americas, $275.00 per square foot for the ground retail space on the corner of West 56th Street and Avenue of the Americas and $250.00 per square foot for the in line retail space along Avenue of the Americas. Market rent for the lower level (basement) retail space is estimated to be $100.00 per square foot, while the lower level storage retail space is estimated to be $25.00 per square foot. Based on these market rents, estimated recoveries and a market vacancy factor of 3.0%, the market gross revenue for the retail space is estimated to be approximately $5.3 million. Assuming underwritten expenses of $37.71 per square foot, the retail space leasehold interest’s estimated market net operating income is approximately $4.3 million. The concluded rental market rents were $70 per square foot on average. Based on these market rents, estimated recoveries and a market vacancy factor of 3.0%, the market gross revenue for the residential space is estimated to be approximately $23.0 million, including $2.6 million of parking revenue. Assuming underwritten expenses of $25.85 per square foot, the residential space leasehold interest’s estimated market net operating income is approximately $15.2 million. The combined estimated market net operating income for the Leasehold Improvements interest is approximately $19.5 million resulting in a mark-to-market look-through debt yield and debt service coverage ratio for the 100 West 57th Street Loan Combination of 10.8% and 4.63x, respectively. Replacement reserves were estimated at $0.10 per square foot for the retail space and $150 per unit for the residential space. Leasing commissions were based on 40.0% of first year’s base rent including a 125% override (paid in year one) with a 65.0% renewal probability, assuming equal tenant rollover throughout the 100 West 57th Street Loan Combination term. The combined estimated market net cash flow for the Leasehold Improvements interests is approximately $19.1 million, resulting in a mark-to-market look-through underwritten debt yield and debt service coverage ratio for the 100 West 57th Street Loan Combination of 10.6% and 4.54x, respectively.
The Borrower. The borrower is 57th & 6th Ground LLC, a Delaware limited liability company and single purpose entity with two independent directors. Legal counsel to the borrower delivered a non-consolidation opinion in connection with the origination of the 100 West 57th Street Loan Combination. Eli Schron, Avi Schron and Mark Schron are the guarantors on certain nonrecourse carveouts under the 100 West 57th Street Loan Combination. The guarantors reported their combined net worth and liquidity of $706.6 million and $17.5 million, respectively, in their financial statements as of March 31, 2014.
The Sponsor. The sponsors of the borrower are David Werner of David Werner Real Estate Investments and Avi Schron, Eli Schron and Mark Schron of Cammeby’s International, Ltd. David Werner is a real estate investor with over 30 years of experience in investment and development. According to the sponsors, selected projects include approximately 13.4 million square feet of office space in New York, Boston, Chicago, and San Francisco. Cammeby’s International Ltd. (“Cammeby’s”), founded by Rubin Schron, owns, develops, operates and manages real estate throughout the United States and has been active in the industry for nearly 40 years. Avi Schron, Eli Schron and Mark Schron, three sons of Rubin Schron, support the company’s operations. Cammeby’s owns and manages over 28,000 residential units, and over 20.0 million square feet of commercial and industrial space. The majority of their holdings are located in the New York metropolitan area. Avi Schron, Eli Schron and Mark Schron of Cammeby’s International, Ltd. are the children of Rubin Schron, the founder of Cammeby’s International Ltd. Certain loans obtained by Rubin Schron have defaulted and/or been restructured, including a loan that secured a portfolio of properties that was securitized in 2005. See “Description of the Mortgage Pool—Default History, Bankruptcy Issues and Other Proceedings” in the Free Writing Prospectus.
Escrows. At closing, the borrower deposited $605,510 into the future rent reserve subaccount. Ongoing tax and insurance reserves are not required as long as the Ground Lease remains in full force and effect and the borrower provides evidence as required by the lender that the ground lessee has provided timely payment of all property taxes and insurance premiums. On a quarterly basis, the borrower will cause the ground lessee to deposit with the deposit bank the quarterly rent payment due under the Ground Lease.
THE INFORMATION IN THIS STRUCTURAL AND COLLATERAL TERM SHEET IS NOT COMPLETE AND MAY BE AMENDED PRIOR TO THE TIME OF SALE. THIS TERM SHEET IS NOT AN OFFER TO SELL THESE SECURITIES AND IT IS NOT A SOLICITATION OF AN OFFER TO BUY THESE SECURITIES IN ANY JURISDICTION WHERE THE OFFER OR SALE IS NOT PERMITTED.
| 53 |
| 100 WEST 57TH STREEET |
Lockbox and Cash Management. The 100 West 57th Street Loan Combination is structured with a lender-controlled hard lockbox and upfront cash management. All rents, revenues and receipts from the 100 West 57th Street Property (which, for so long as the Ground Lease remains in effect, will primarily consist of the ground rent) will be deposited directly by the ground lessee into a lockbox account controlled by the lender. All funds in the lockbox account are swept daily to a cash management account under the control of the lender and disbursed in accordance with the 100 West 57th Street Loan Combination documents. Upon the commencement of a Cash Trap Period (as defined below), excess cash flow will be controlled by the lender. Additionally, from and after the ARD, all excess cash flow will be applied first to repay the outstanding principal of the 100 West 57th Street Loan Combination and then to repay all accrued additional ARD interest.
A “Cash Trap Period” will commence upon the occurrence of: (i) an event of default under the 100 West 57th Street Loan Combination, (ii) an event of default as defined in the Ground Lease by the ground tenant under the Ground Lease beyond applicable notice, grace and cure periods, or (iii) the failure by the ground tenant, after the end of a calendar quarter, to maintain a ground rent coverage ratio of at least 1.10x. A Cash Trap Period will end, with respect to clause (i) upon the cure of such event of default; with respect to clause (ii) upon the cure of such ground tenant “event of default”; and with respect to clause (iii) upon the ground rent coverage ratio being at least 1.15x for six consecutive months.
Property Management. The 100 West 57th Street Property is managed by an affiliate of the borrower.
Assumption. The borrower has the right to sell the 100 West 57th Street Property, provided certain conditions are satisfied, including but not limited to (i) no event of default has occurred and is continuing; (ii) obtaining the lender’s reasonable determination that the proposed transferee satisfies the lender’s then–current requirements of a “Special Purpose Entity” and is otherwise acceptable to and approved by the lender; (iii) a replacement guarantor approved by the lender in its sole discretion assumes the obligations of the existing guarantors; and (iv) payment of a fee equal to one-half of one percent of the then outstanding principal of the 100 West 57th Street Loan Combination. The lender will have the right to approve or disapprove the proposed transferee in its reasonable discretion, including requiring a rating comfort letter from DBRS, KBRA and Moody’s that such assumption will not result in a downgrade, withdrawal or qualification of the respective ratings assigned to the Series 2015-NXS2 Certificates and similar confirmations from each rating agency rating any securities backed by any 100 West 57th Street Companion Loans.
Real Estate Substitution. Not Permitted.
Subordinate and Mezzanine Indebtedness. Not Permitted.
Ground Lease. The 100 West 57thStreet Property is currently subject to the long-term Ground Lease which has an initial rent reset date of March 15, 2025. The Ground Lease has fixed annual payments of $4,070,655 payable quarterly through March 14, 2019, then $4,213,128 payable quarterly through March 14, 2024 and then $4,360,587 payable quarterly through March 14, 2025. The ground lessee has the right to renew the Ground Lease for two renewal terms of 21 years each by giving written notice no later than 12 months and no more than 48 months prior to the commencement date of the particular renewal term, subject to a ground rent reset. Pursuant to the terms of the Ground Lease, the annual ground rent resets to 8.1667% of the fair market value of the land as unimproved and unencumbered as of a date six months prior to the commencement date of each renewal term but in no event will the renewal rent be less than that in effect for the immediately preceding term. According to the appraisal, the unencumbered value of the land without any improvements is $260.0 million and the rent is projected to increase to $21.2 millionper annum by 2025 based on this unencumbered value. Pursuant to the terms of the Ground Lease, if the parties cannot agree on the fair market value, they are required to resolve the dispute by arbitration. See “Risk Factors—Risks Related to The Mortgage Loans—Leased Fee Properties Have Special Risks” and “—Risks Related to the 100 West 57th Street Ground Lease” in the Free Writing Prospectus.
The ground lessee’s leasehold interest is held by (i) Carnegie House Tenants Corporation (“CHTC”), owner of a 75% tenant in common (“TIC”) interest in the tenancy and the exclusive use of the residential and garage space (“Apartment/Garage Premises”) and (ii) Georgetown 57, LLC, owner of a 25% TIC interest and the exclusive use and control of the retail space (“Retail Premises”). CHTC must (i) pay its fixed rent; (ii) pay its allocable share of any real estate taxes provided under the TIC agreement; (iii) maintain and pay for the insurance; and (iv) perform any material repair or maintenance related to the Apartment/Garage Premises. Georgetown 57, LLC is required to (i) pay its fixed rent; (ii) pay its allocable share of any real estate taxes provided under the TIC agreement; (iii) pay its allocable share of insurance premiums for the property under the TIC agreement; and (iv) perform any material repair or maintenance related to the Retail Premises.
Terrorism Insurance. The loan documents provide that the required “all risk” insurance policy must include coverage for terrorism in an amount equal to the full replacement cost of the 100 West 57th Street Property. The loan documents also require business interruption insurance covering no less than the 18-month period following the occurrence of a casualty event. The borrower will require the ground tenant to maintain all insurance coverage that ground tenant is required to provide pursuant to the terms of the Ground Lease, or as otherwise acceptable to the lender in its sole discretion.
THE INFORMATION IN THIS STRUCTURAL AND COLLATERAL TERM SHEET IS NOT COMPLETE AND MAY BE AMENDED PRIOR TO THE TIME OF SALE. THIS TERM SHEET IS NOT AN OFFER TO SELL THESE SECURITIES AND IT IS NOT A SOLICITATION OF AN OFFER TO BUY THESE SECURITIES IN ANY JURISDICTION WHERE THE OFFER OR SALE IS NOT PERMITTED.
| 54 |
(THIS PAGE INTENTIONALLY LEFT BLANK)
THE INFORMATION IN THIS STRUCTURAL AND COLLATERAL TERM SHEET IS NOT COMPLETE AND MAY BE AMENDED PRIOR TO THE TIME OF SALE. THIS TERM SHEET IS NOT AN OFFER TO SELL THESE SECURITIES AND IT IS NOT A SOLICITATION OF AN OFFER TO BUY THESE SECURITIES IN ANY JURISDICTION WHERE THE OFFER OR SALE IS NOT PERMITTED.
| 55 |
| EMBASSY SUITES NASHVILLE |
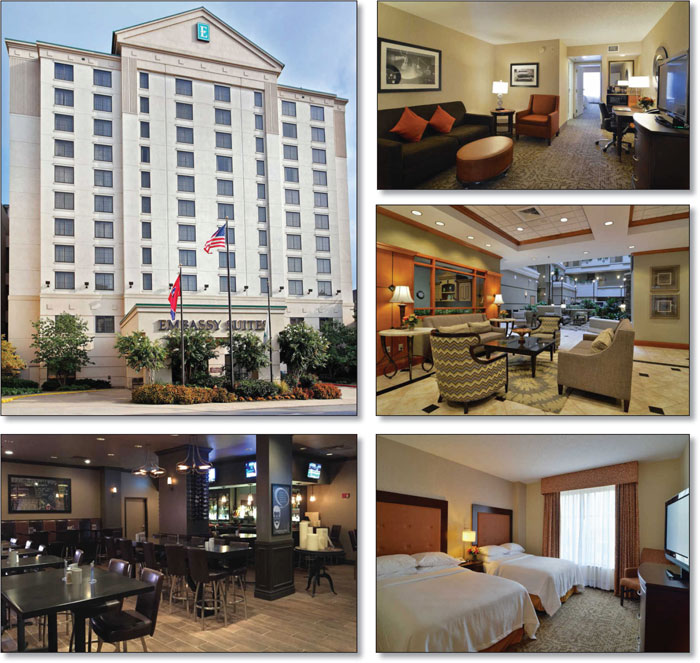
THE INFORMATION IN THIS STRUCTURAL AND COLLATERAL TERM SHEET IS NOT COMPLETE AND MAY BE AMENDED PRIOR TO THE TIME OF SALE. THIS TERM SHEET IS NOT AN OFFER TO SELL THESE SECURITIES AND IT IS NOT A SOLICITATION OF AN OFFER TO BUY THESE SECURITIES IN ANY JURISDICTION WHERE THE OFFER OR SALE IS NOT PERMITTED.
| 56 |
| EMBASSY SUITES NASHVILLE |

THE INFORMATION IN THIS STRUCTURAL AND COLLATERAL TERM SHEET IS NOT COMPLETE AND MAY BE AMENDED PRIOR TO THE TIME OF SALE. THIS TERM SHEET IS NOT AN OFFER TO SELL THESE SECURITIES AND IT IS NOT A SOLICITATION OF AN OFFER TO BUY THESE SECURITIES IN ANY JURISDICTION WHERE THE OFFER OR SALE IS NOT PERMITTED.
| 57 |
| No. 5 – Embassy Suites Nashville | |||||||
| Loan Information | Property Information | ||||||
| Mortgage Loan Seller: | Wells Fargo Bank, National Association | Single Asset/Portfolio: | Single Asset | ||||
Credit Assessment (DBRS/KBRA/Moody’s): | NR/NR/NR | Property Type: | Hospitality | ||||
| Original Principal Balance: | $43,000,000 | Specific Property Type: | Full Service | ||||
| Cut-off Date Principal Balance: | $43,000,000 | Location: | Nashville, TN | ||||
| % of Initial Pool Balance: | 4.7% | Size: | 208 Rooms | ||||
| Loan Purpose: | Acquisition | Cut-off Date Principal Balance Per Room: | $206,731 | ||||
| Borrower Name: | Moody National Broadway-Nashville Holding, LLC | Year Built/Renovated: | 2001/2013 | ||||
| Sponsor: | Brett C. Moody | Title Vesting: | Fee | ||||
| Mortgage Rate: | 4.212% | Property Manager: | Self-managed | ||||
| Note Date: | June 16, 2015 | 3rd Most Recent Occupancy (As of): | 79.5% (12/31/2012) | ||||
| Anticipated Repayment Date: | NAP | 2nd Most Recent Occupancy (As of): | 79.9% (12/31/2013) | ||||
| Maturity Date: | July 11, 2025 | Most Recent Occupancy (As of): | 82.1% (12/31/2014) | ||||
| IO Period: | 24 months | Current Occupancy (As of): | 82.6% (4/30/2015) | ||||
| Loan Term (Original): | 120 months | ||||||
| Seasoning: | 0 months | Underwriting and Financial Information: | |||||
| Amortization Term (Original): | 360 months | ||||||
| Loan Amortization Type: | Interest-only, Amortizing Balloon | 3rd Most Recent NOI (As of): | $5,213,233 (12/31/2013) | ||||
| Interest Accrual Method: | Actual/360 | 2nd Most Recent NOI (As of): | $5,693,855 (12/31/2014) | ||||
| Call Protection: | L(24),D(92),O(4) | Most Recent NOI (As of): | $5,843,136 (TTM 4/30/2015) | ||||
| Lockbox Type: | Springing (Without Established Account) | ||||||
| Additional Debt: | None | ||||||
| Additional Debt Type: | NAP | ||||||
| U/W Revenues: | $12,033,033 | ||||||
| U/W Expenses: | $7,056,664 | ||||||
| U/W NOI: | $4,976,369 | ||||||
| U/W NCF: | $4,495,048 | ||||||
| U/W NOI DSCR: | 1.97x | ||||||
| Escrows and Reserves(1): | U/W NCF DSCR: | 1.78x | |||||
| U/W NOI Debt Yield: | 11.6% | ||||||
| Type: | Initial | Monthly | Cap (If Any) | U/W NCF Debt Yield: | 10.5% | ||
| Taxes | $177,276 | $44,319 | NAP | As-Is Appraised Value(2): | $66,400,000 | ||
| Insurance | $0 | Springing | NAP | As-Is Appraisal Valuation Date(2): | May 8, 2015 | ||
| FF&E Reserve | $40,110 | $40,110 | NAP | Cut-off Date LTV Ratio(2): | 64.8% | ||
| PIP Reserve | $2,000,000 | $0 | NAP | LTV Ratio at Maturity or ARD(2): | 54.9% | ||
| (1) | See “Escrows” section. |
| (2) | See “The Appraisal” section. |
The Mortgage Loan. The mortgage loan (the “Embassy Suites Nashville Mortgage Loan”) is evidenced by a single promissory note secured by a first mortgage encumbering the fee interest in a full-service hotel located in Nashville, Tennessee (the “Embassy Suites Nashville Property”). The Embassy Suites Nashville Mortgage Loan was originated on June 16, 2015 by Wells Fargo Bank, National Association. The Embassy Suites Nashville Mortgage Loan had an original principal balance of $43,000,000, has an outstanding principal balance as of the Cut-off Date of $43,000,000 and accrues interest at an interest rate of 4.212%per annum. The Embassy Suites Nashville Mortgage Loan had an initial term of 120 months, has a remaining term of 120 months as of the Cut-off Date and requires interest-only payments for the first 24 payments following origination and, thereafter, requires payments of principal and interest based on a 30-year amortization schedule. The Embassy Suites Nashville Mortgage Loan matures on July 11, 2025.
Following the lockout period, the borrower has the right to defease the Embassy Suites Nashville Mortgage Loan in whole, but not in part, on any date before April 11, 2025. In addition, the Embassy Suites Nashville Mortgage Loan is prepayable without penalty on or after April 11, 2025.
THE INFORMATION IN THIS STRUCTURAL AND COLLATERAL TERM SHEET IS NOT COMPLETE AND MAY BE AMENDED PRIOR TO THE TIME OF SALE. THIS TERM SHEET IS NOT AN OFFER TO SELL THESE SECURITIES AND IT IS NOT A SOLICITATION OF AN OFFER TO BUY THESE SECURITIES IN ANY JURISDICTION WHERE THE OFFER OR SALE IS NOT PERMITTED.
| 58 |
| EMBASSY SUITES NASHVILLE |
Sources and Uses
| Sources | Uses | |||||||
| Original loan amount | $43,000,000 | 62.2 | % | Purchase price | $66,300,000 | 95.9 | % | |
| Sponsor’s new cash contribution | 26,110,437 | 37.8 | Reserves | 2,217,386 | 3.2 | |||
| Closing costs | 593,051 | 0.9 | ||||||
| Total Sources | $69,110,437 | 100.0 | % | Total Uses | $69,110,437 | 100.0 | % |
The Property.The Embassy Suites Nashville Property is comprised of the fee interest in a 208-room, eleven-story, full-service hotel located in Nashville, Tennessee, approximately three blocks east of Vanderbilt University (“Vanderbilt”). Built in 2001 and situated on a 1.2-acre site, the Embassy Suites Nashville Property’s guestroom configuration includes 122 king suites, 74 double/double suites, 11 handicap-accessible king suites and one two-bedroom king suite. Each guestroom features a separate living room and bedroom with a king or two double beds, dresser, two flat screen televisions, work desk and chair, wet bar, small refrigerator and microwave oven. Amenities at the Embassy Suites Nashville Property include 2,679 square feet of meeting space, an indoor whirlpool, a fitness center, a business center, guest laundry, a sundry shop and the Five Odd Fellows restaurant, which offers a full lunch, dinner and cocktail menu. The Embassy Suites Nashville Property also offers free local area transportation, a made-to-order breakfast and an evening manager’s reception. The Embassy Suites Nashville Property also features 215 surface parking spaces, equating to a parking ratio of 1.0 space per room.
The Embassy Suites Nashville Property has been continually updated, with approximately $3.0 million invested since 2011, which included lobby, guestroom and common area upgrades. The current $2.0 million Property Improvement Plan (“PIP”) ($9,615 per room) primarily consists of guestroom upgrades and is required to be completed by December 2016. The new 20-year franchise agreement with Hilton Worldwide expires in June 2035.
Operating History and Underwritten Net Cash Flow.The following table presents certain information relating to the historical operating performance and the underwritten net cash flow at the Embassy Suites Nashville Property:
Cash Flow Analysis
2013 | 2014 | TTM 4/30/2015 | U/W | % of U/W Total Revenue | U/W $ per Room | |||||||
| Occupancy | 79.9% | 82.1% | 82.6% | 80.0% | ||||||||
| ADR | $171.29 | $180.74 | $184.35 | $184.35 | ||||||||
| RevPAR | $136.90 | $148.34 | $152.23 | $147.48 | ||||||||
| Total Revenue | $11,230,048 | $12,123,388 | $12,393,960 | $12,033,033 | 100.0% | $57,851 | ||||||
| Total Department Expenses | 2,337,502 | 2,486,860 | 2,520,753 | 2,951,990 | 24.5 | 14,192 | ||||||
| Gross Operating Profit | $8,892,546 | $9,636,528 | $9,873,207 | $9,081,042 | 75.5% | $43,659 | ||||||
| Total Undistributed Expenses | 3,080,714 | 3,346,770 | 3,431,368 | 3,498,085 | 29.1 | 16,818 | ||||||
| Profit Before Fixed Charges | $5,811,832 | $6,289,758 | $6,441,839 | $5,582,957 | 46.4% | $26,841 | ||||||
| Total Fixed Charges | 598,599 | 595,903 | 598,703 | 606,588(2) | 5.0 | 2,916 | ||||||
| Net Operating Income | $5,213,233 | $5,693,855 | $5,843,136(1) | $4,976,369(1) | 41.4% | $23,925 | ||||||
| FF&E | 0 | 0 | 0 | 481,321 | 4.0 | 2,314 | ||||||
| Net Cash Flow | $5,213,233 | $5,693,855 | $5,843,136 | $4,495,048 | 37.4% | $21,611 | ||||||
| NOI DSCR | 2.06x | 2.25x | 2.31x | 1.97x | ||||||||
| NCF DSCR | 2.06x | 2.25x | 2.31x | 1.78x | ||||||||
| NOI DY | 12.1% | 13.2% | 13.6% | 11.6% | ||||||||
| NCF DY | 12.1% | 13.2% | 13.6% | 10.5% | ||||||||
| (1) | The decrease from trailing 12-month net operating income to underwriting is due to the underwritten occupancy rate (80.0% compared to 82.6% as of the trailing-12 month period ending April 30, 2015). |
The Appraisal.As of the appraisal valuation date of May 8, 2015, the Embassy Suites Nashville Property had an “as-is” appraised value of $66,400,000. The appraiser also concluded to an “as-complete & stabilized” value of $70,000,000 with an “as-complete & stabilized” valuation date of May 8, 2016. The “as-complete & stabilized” valuation assumes that the PIP has been completed (the $2.0 million PIP cost was reserved upfront) and the Embassy Suites Nashville Property is operating at a stabilized RevPAR of $159.87. The “as-complete & stabilized” value equates to a Cut-off Date LTV Ratio of 61.4% and an LTV Ratio at Maturity or ARD of 52.1%.
Environmental Matters.According to the Phase I environmental site assessment dated May 12, 2015, there was no evidence of any recognized environmental conditions at the Embassy Suites Nashville Property.
Market Overview and Competition.The Embassy Suites Nashville Property is located in Nashville, Tennessee, approximately three blocks east of Vanderbilt in the West End neighborhood, approximately two miles southwest of downtown Nashville and six miles west of the Nashville International Airport. The West End neighborhood is home to a large medical presence, anchored by Baptist Memorial Hospital, Centennial Medical Center and Vanderbilt University Medical Center, which alone generated $2.8 billion in
THE INFORMATION IN THIS STRUCTURAL AND COLLATERAL TERM SHEET IS NOT COMPLETE AND MAY BE AMENDED PRIOR TO THE TIME OF SALE. THIS TERM SHEET IS NOT AN OFFER TO SELL THESE SECURITIES AND IT IS NOT A SOLICITATION OF AN OFFER TO BUY THESE SECURITIES IN ANY JURISDICTION WHERE THE OFFER OR SALE IS NOT PERMITTED.
| 59 |
| EMBASSY SUITES NASHVILLE |
revenue in 2013 and is the only Level I trauma center in middle Tennessee. Some of the top accounts at the Embassy Suites Nashville Property include Cigna, HCA Healthcare, Vanderbilt, local hospital patients and Vanderbilt Nursing. Further, Vanderbilt has a total enrollment of 11,871 full-time students (undergraduate and graduate) and, according to a major news publication, Vanderbilt was ranked in the top 20 of undergraduate universities (as of 2015). Vanderbilt is one of the largest private employers in Tennessee, employing 19,862 individuals.
The Embassy Suites Nashville Property is also proximate to numerous other demand drivers. Music Row, which encompasses offices, recording studios and publishing operations oriented around the music business, is approximately one mile south of the Embassy Suites Nashville Property. The newly constructed Music City Center convention center is located 1.5 miles east of the Embassy Suites Property. The 1.2 million square foot convention center opened in May 2013, comprises six city blocks and features a 353,143-square foot exhibit hall, 90,000 square feet of meeting and break-out rooms, and a 57,000 square foot ballroom with a built-in stage. According to media reports, Nashville has seen its convention attendance more than quadruple from an average of 1,500 attendees for national trade shows to 6,500 participants in 2014. Additional demand drivers include the Country Music Hall of Fame and Museum located 1.2 miles east of the Embassy Suites Nashville Property, which recently completed a $100.0 million expansion that doubled its size to 350,000 square feet, state, federal and local governments located two miles east of the Embassy Suites Nashville Property in the Nashville central business district and the nearby LP Field and Bridgestone Arena, home to the Tennessee Titans and Nashville Predators, respectively. The demand segmentation at the Embassy Suites Nashville Property is 35.0% commercial, 25.0% meeting and group and 40.0% leisure. According to the appraisal, as of year-end 2014, the Embassy Suites Nashville Property exhibited a leisure penetration rate of 163.2% as compared to the competitive set. A third party hospitality research report identified a competitive set of seven hospitality properties, which contain 1,657 rooms and exhibited an average occupancy, ADR and RevPAR of 80.3%, $177.66 and $142.63, respectively, for the trailing 12-month period ending March 31, 2015.
The following table presents certain information relating to the Embassy Suites Nashville Property’s competitive set:
Subject and Market Historical Occupancy, ADR and RevPAR(1)
| Competitive Set | Embassy Suites Nashville | Penetration Factor | |||||||||||||||||
| Year | Occupancy | ADR | RevPAR | Occupancy | ADR | RevPAR | Occupancy | ADR | RevPAR | ||||||||||
| 3/31/2015 TTM | 80.3% | $177.66 | $142.63 | 83.0% | $182.78 | $151.63 | 103.3% | 102.9% | 106.3% | ||||||||||
| 3/31/2014 TTM | 83.7% | $158.57 | $132.72 | 79.9% | $174.36 | $139.37 | 95.5% | 110.0% | 105.0% | ||||||||||
| 3/31/2013 TTM | 78.9% | $140.53 | $110.83 | 79.5% | $155.25 | $123.41 | 100.8% | 110.5% | 111.3% | ||||||||||
| (1) | Information obtained from a third party hospitality research report dated April 17, 2015. The competitive set includes: Holiday Inn Nashville Vanderbilt Downtown, Doubletree Nashville, Courtyard Nashville Vanderbilt West End, Hampton Inn Suites Nashville Vanderbilt Elliston Place, Marriott Nashville @ Vanderbilt University, aloft Hotel Nashville West End and Hilton Garden Inn Nashville Vanderbilt. |
The Borrower.The borrower is Moody National Broadway-Nashville Holding, LLC, a Delaware limited liability company and a single purpose entity with one independent director. Legal counsel to the borrower provided a non-consolidation opinion in connection with the origination of the Embassy Suites Nashville Mortgage Loan. Moody National REIT I, Inc. is the guarantor of certain nonrecourse carveouts under the Embassy Suites Nashville Mortgage Loan.
The Sponsor.The sponsor is Brett C. Moody, the founder of Moody National REIT I, Inc., a real estate investment trust that owns nine select-service hotels totaling 1,204 rooms in major markets across the United States. Moody National REIT I, Inc. is an affiliate of Moody National Companies, a full-service commercial real estate company founded in 1996 (by Brett C. Moody) that has managed over $2.0 billion in commercial real estate, and Moody National Management, which owns and manages 28 hotels and 3,556 guestrooms throughout the United States, in addition to 1,352 apartment units and 350,000 square feet of office properties. Affiliates of Moody National Companies and Brett Moody disclosed one prior bankruptcy and certain loan defaults with prior lenders. See “Description of the Mortgage Pool—Default History, Bankruptcy Issues and Other Proceedings” in the Free Writing Prospectus.
Operating Lessee.An affiliate of the borrower leases and operates the Embassy Suites Nashville Property pursuant to an operating lease. The operating lessee is a special purpose entity and subordinated the operating lease to the loan documents. The operating lessee assigned the operating lease to the borrower and the borrower assigned the lease to the lender as security for its obligations.
Escrows.The loan documents provide for upfront escrows in the amount of $177,276 for real estate taxes, $40,110 for FF&E reserves and $2.0 million for the PIP. The PIP is required to be completed by December 2016. The loan documents provide for monthly escrows in an amount equal to $44,319 for real estate taxes and FF&E reserves in an amount equal to 4.0% of total revenue for the prior month (initially estimated to be $40,110). Ongoing monthly reserves for insurance are not required as long as (i) no event of default has occurred and is continuing; (ii) the Embassy Suites Nashville Property is insured by an acceptable blanket insurance policy; and (iii) the borrower provides the lender with evidence of renewal of the insurance policies and timely proof of payment of insurance premiums.
Lockbox and Cash Management.Upon the occurrence of a Cash Trap Event Period (as defined below), the borrower will be required to establish a lender-controlled lockbox account and the borrower and property manager will be required to deposit any revenues received within two business days of receipt, and direct all credit card providers to deposit all revenues received into the lockbox account. During a Cash Trap Event Period, all excess funds on deposit in the lockbox account are swept to a lender-controlled cash flow sub-account.
THE INFORMATION IN THIS STRUCTURAL AND COLLATERAL TERM SHEET IS NOT COMPLETE AND MAY BE AMENDED PRIOR TO THE TIME OF SALE. THIS TERM SHEET IS NOT AN OFFER TO SELL THESE SECURITIES AND IT IS NOT A SOLICITATION OF AN OFFER TO BUY THESE SECURITIES IN ANY JURISDICTION WHERE THE OFFER OR SALE IS NOT PERMITTED.
| 60 |
| EMBASSY SUITES NASHVILLE |
A “Cash Trap Event Period” will commence upon the earlier of (i) the occurrence and continuance of an event of default; and (ii) the amortizing debt service coverage ratio for the trailing 12-month period falling below 1.50x. A Cash Trap Event Period will be cured, with regard to clause (i), upon the cure of such event of default; and with regard to clause (ii), upon the amortizing debt service coverage ratio being equal to or greater than 1.55x for one calendar quarter.
Property Management.The Embassy Suites Nashville Property is managed by an affiliate of the borrower.
Assumption.The borrower has a two-time right to transfer the Embassy Suites Nashville Property provided that certain conditions are satisfied, including (i) no event of default has occurred and is continuing; (ii) the lender reasonably determines that the proposed transferee and guarantor satisfy the lender’s credit review and underwriting standards, taking into consideration transferee experience, financial strength and general business standing; and (iii) the lender has received confirmation from DBRS, KBRA and Moody’s that such assumption will not result in a downgrade, withdrawal or qualification of the respective ratings assigned to the Series 2015-NXS2 Certificates.
Partial Release.Not permitted.
Real Estate Substitution.Not permitted.
Subordinate and Mezzanine Indebtedness.Not permitted.
Ground Lease.None.
Terrorism Insurance.The loan documents require that the “all risk” insurance policy required to be maintained by the borrower provide coverage for terrorism in an amount equal to the full replacement cost of the Embassy Suites Nashville Property (provided that the borrower is not required to pay terrorism insurance premiums in excess of two times the premium for all risk and business interruption coverage if Terrorism Risk Insurance Program Reauthorization is no longer in effect), as well as business interruption insurance covering no less than the 18-month period following the occurrence of a casualty event, together with a six-month extended period of indemnity.
THE INFORMATION IN THIS STRUCTURAL AND COLLATERAL TERM SHEET IS NOT COMPLETE AND MAY BE AMENDED PRIOR TO THE TIME OF SALE. THIS TERM SHEET IS NOT AN OFFER TO SELL THESE SECURITIES AND IT IS NOT A SOLICITATION OF AN OFFER TO BUY THESE SECURITIES IN ANY JURISDICTION WHERE THE OFFER OR SALE IS NOT PERMITTED.
| 61 |
| SEA HARBOR OFFICE CENTER |

THE INFORMATION IN THIS STRUCTURAL AND COLLATERAL TERM SHEET IS NOT COMPLETE AND MAY BE AMENDED PRIOR TO THE TIME OF SALE. THIS TERM SHEET IS NOT AN OFFER TO SELL THESE SECURITIES AND IT IS NOT A SOLICITATION OF AN OFFER TO BUY THESE SECURITIES IN ANY JURISDICTION WHERE THE OFFER OR SALE IS NOT PERMITTED.
| 62 |
| SEA HARBOR OFFICE CENTER |
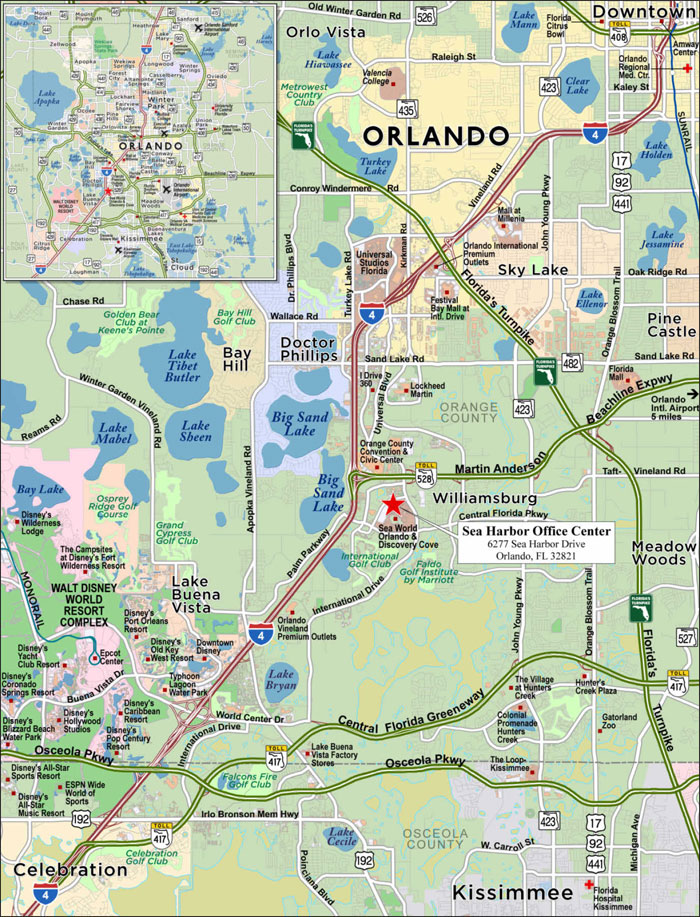
THE INFORMATION IN THIS STRUCTURAL AND COLLATERAL TERM SHEET IS NOT COMPLETE AND MAY BE AMENDED PRIOR TO THE TIME OF SALE. THIS TERM SHEET IS NOT AN OFFER TO SELL THESE SECURITIES AND IT IS NOT A SOLICITATION OF AN OFFER TO BUY THESE SECURITIES IN ANY JURISDICTION WHERE THE OFFER OR SALE IS NOT PERMITTED.
| 63 |
| No. 6 – Sea Harbor Office Center | |||||||
| Loan Information | Property Information | ||||||
| Mortgage Loan Seller: | Wells Fargo Bank, National Association | Single Asset/Portfolio: | Single Asset | ||||
Credit Assessment (DBRS/KBRA/Moody’s): | NR/NR/NR | Property Type: | Office | ||||
| Original Principal Balance: | $40,000,000 | Specific Property Type: | Suburban | ||||
| Cut-off Date Principal Balance: | $40,000,000 | Location: | Orlando, FL | ||||
| % of Initial Pool Balance: | 4.4% | Size: | 359,514 SF | ||||
| Loan Purpose: | Acquisition | Cut-off Date Principal Balance Per SF: | $111.26 | ||||
| Borrower Name: | Sea Harbor Property SPV, LLC | Year Built/Renovated: | 1984/2012 | ||||
| Sponsors(1): | Various | Title Vesting: | Fee | ||||
| Mortgage Rate: | 4.290% | Property Manager: | Self-managed | ||||
| Note Date: | June 5, 2015 | 3rd Most Recent Occupancy (As of): | 74.8% (12/31/2012) | ||||
| Anticipated Repayment Date: | NAP | 2nd Most Recent Occupancy (As of): | 87.2% (12/31/2013) | ||||
| Maturity Date: | June 11, 2025 | Most Recent Occupancy (As of)(3): | 99.7% (12/31/2014) | ||||
| IO Period: | 120 months | Current Occupancy (As of)(3): | 99.7% (4/11/2015) | ||||
| Loan Term (Original): | 120 months | ||||||
| Seasoning: | 1 month | Underwriting and Financial Information: | |||||
| Amortization Term (Original): | NAP | ||||||
| Loan Amortization Type: | Interest-only, Balloon | 3rdMost Recent NOI(4): | NAV | ||||
| Interest Accrual Method: | Actual/360 | 2ndMost Recent NOI (As of)(4): | ($1,026,216) (12/31/2013) | ||||
| Call Protection: | L(25),D(91),O(4) | Most Recent NOI (As of)(4): | $3,072,110 (12/31/2014) | ||||
| Lockbox Type: | Springing (Without Established Account) | ||||||
| Additional Debt: | None | ||||||
| Additional Debt Type: | NAP | ||||||
| U/W Revenues: | $7,813,025 | ||||||
| U/W Expenses: | $3,668,538 | ||||||
| U/W NOI(3): | $4,144,487 | ||||||
| U/W NCF: | $3,742,088 | ||||||
| U/W NOI DSCR: | 2.38x | ||||||
| Escrows and Reserves(2): | U/W NCF DSCR: | 2.14x | |||||
| U/W NOI Debt Yield: | 10.4% | ||||||
| Type: | Initial | Monthly | Cap (If Any) | U/W NCF Debt Yield: | 9.4% | ||
| Taxes | $388,186 | $48,524 | NAP | As-Is Appraised Value: | $66,000,000 | ||
| Insurance | $164,580 | $20,572 | NAP | As-Is Appraisal Valuation Date: | April 9, 2015 | ||
| Replacement Reserves | $0 | $4,494 | NAP | Cut-off Date LTV Ratio: | 60.6% | ||
| TI/LC Reserve | $0 | Springing | NAP | LTV Ratio at Maturity or ARD: | 60.6% | ||
| (1) | See “The Sponsors” section. |
| (2) | See “Escrows” section. |
| (3) | See “Historical Occupancy” section. |
| (4) | See “Cash Flow Analysis” section. |
The Mortgage Loan. The mortgage loan (the “Sea Harbor Office Center Mortgage Loan”) is evidenced by a single promissory note that is secured by a first mortgage encumbering an office building and an adjacent parking garage located in Orlando, Florida (the “Sea Harbor Office Center Property”). The Sea Harbor Office Center Mortgage Loan was originated on June 5, 2015 by Wells Fargo Bank, National Association. The Sea Harbor Office Center Mortgage Loan had an original principal balance of $40,000,000, has an outstanding principal balance as of the Cut-off Date of $40,000,000 and accrues interest at an interest rate of 4.290%per annum. The Sea Harbor Office Center Mortgage Loan had an initial term of 120 months, has a remaining term of 119 months as of the Cut-off Date and requires interest-only payments through the term of the Sea Harbor Office Center Mortgage Loan. The Sea Harbor Mortgage Loan matures on June 11, 2025.
Following the lockout period, the borrower has the right to defease the Sea Harbor Office Center Mortgage Loan in whole, but not in part, on any date before March 11, 2025. In addition, the Sea Harbor Office Center Mortgage Loan is prepayable without penalty on or after March 11, 2025.
THE INFORMATION IN THIS STRUCTURAL AND COLLATERAL TERM SHEET IS NOT COMPLETE AND MAY BE AMENDED PRIOR TO THE TIME OF SALE. THIS TERM SHEET IS NOT AN OFFER TO SELL THESE SECURITIES AND IT IS NOT A SOLICITATION OF AN OFFER TO BUY THESE SECURITIES IN ANY JURISDICTION WHERE THE OFFER OR SALE IS NOT PERMITTED.
| 64 |
| SEA HARBOR OFFICE CENTER |
Sources and Uses
| Sources | Uses | |||||||
| Original loan amount | $40,000,000 | 60.4 | % | Purchase price | $64,675,000 | 97.7 | % | |
| Sponsor’s new cash contribution | 26,209,975 | 39.6 | Reserves | 552,766 | 0.8 | |||
| Closing costs | 982,209 | 1.5 | ||||||
| Total Sources | $66,209,975 | 100.0 | % | Total Uses | $66,209,975 | 100.0 | % |
The Property.The Sea Harbor Office Center Property is comprised of an eight-story, class A, LEED gold certified office building totaling 359,514 square feet and an adjacent five-story parking garage located on 15.1-acres in Orlando, Florida, approximately 10.0 miles southwest of the Orlando central business district. Built in 1984, the Sea Harbor Office Center Property was significantly renovated in 2012 at an estimated cost of approximately $18.0 million ($50 per square foot) and included an upgrade to common areas; and new roof, cooling towers, parking surfaces, electrical service, plumbing, café and fitness center. The Sea Harbor Office Center Property is primarily occupied by Wyndham Vacation Ownership, Inc. (“Wyndham Vacation”) (84.6% of net rentable area) which consolidated operations from four separate Orlando locations into the Sea Harbor Office Center Property. Wyndham Vacation is a division of Wyndham Worldwide Corporation, which guarantees the lease (rated BBB-/Baa3/BBB- by Fitch/Moody’s/S&P). As of the first quarter of 2015, Wyndham Vacation represented approximately 46.9% of Wyndham Worldwide Corporation’s EBITDA. Wyndham Vacation is the largest developer and marketer of flexible, points-based vacation ownership products and has developed or acquired more than 200 vacation ownership resorts throughout the United States, Canada, Mexico, the Caribbean and the South Pacific that includes approximately 24,000 individual vacation ownership units. The Sea Harbor Office Center Property serves as the world headquarters for the Wyndham Vacation division. The five-story parking garage includes 1,250 parking spaces and another 380 parking spaces in three surface lots for a total of 1,630 parking spaces reflecting a parking ratio of 4.5 spaces per 1,000 square feet of rentable area. As of April 11, 2015, the Sea Harbor Office Center Property was 99.7% leased (and 87.2% occupied) by three tenants.
The following table presents certain information relating to the tenancy at the Sea Harbor Office Center Property:
Major Tenants
| Tenant Name | Credit Rating (Fitch/Moody’s/ S&P) | Tenant NRSF | % of NRSF | Annual U/W Base Rent PSF(1) | Annual U/W Base Rent(1) | % of Total Annual U/W Base Rent | Lease Expiration Date | |||
| Major Tenants | ||||||||||
| Wyndham Vacation(2) | BBB-/Baa3/BBB-(3) | 304,153(4) | 84.6% | $22.24(4) | $6,764,792 | 86.3% | 10/31/2025(5) | |||
| Visit Orlando | NR/NR/NR | 44,752 | 12.4% | $22.22 | $994,389 | 12.7% | 10/12/2024 | |||
| Aramark Corporation | NR/NR/NR | 8,261 | 2.3% | $10.00 | $82,610 | 1.1% | 11/30/2017(6) | |||
| Total Major Tenants | 357,166 | 99.3% | $21.96 | $7,841,791 | 100.0% | |||||
| �� | ||||||||||
| Non-Major Tenant(7) | 1,133(7) | 0.3%(7) | $0.00(7) | $0(7) | 0.0%(7) | |||||
| Occupied Collateral Total | 358,299 | 99.7% | $21.89 | $7,841,791 | 100.0% | |||||
| Vacant Space | 1,215 | 0.3% | ||||||||
| Collateral Total | 359,514 | 100.0% | ||||||||
| (1) | Annual U/W Base Rent PSF and Annual U/W Base Rent include contractual rent steps through December 31, 2015 totaling $310,453. |
| (2) | Wyndham Vacation is in the process of building out 44,752 square feet (12.4% of the net rentable area) of expansion space on the third floor. Wyndham Vacation has already commenced paying rent on the expansion space and the buildout is expected to be completed within four to six months of the Sea Harbor Office Center Mortgage Loan closing. Tenant improvement funds for the expansion space were released by the seller directly to the tenant at Sea Harbor Office Center Mortgage Loan closing. |
| (3) | The indicative ratings are for Wyndham Worldwide Corporation, which guarantees the Wyndham Vacation lease. |
| (4) | Wyndham Vacation leases 293,290 square feet of office space that has an Annual U/W Base Rent of $6,651,817 ($22.68 per square foot) and 10,863 of basement storage space that has an Annual U/W Base Rent of $112,975 ($10.40 per square foot). |
| (5) | Wyndham Vacation has the right to terminate two contiguous floors (up to 89,504 square feet or 24.9% of the net rentable area) on November 31, 2021 with 12 months’ notice and payment of a termination fee of approximately $3.0 million. |
| (6) | Both the borrower and Aramark Corporation have the right to terminate the lease at any time with 60 days’ notice. |
| (7) | Non-Major Tenant includes the management office (1,133 square feet or 0.3% of the net rentable area) which does not have an associated lease and pays no rent. |
THE INFORMATION IN THIS STRUCTURAL AND COLLATERAL TERM SHEET IS NOT COMPLETE AND MAY BE AMENDED PRIOR TO THE TIME OF SALE. THIS TERM SHEET IS NOT AN OFFER TO SELL THESE SECURITIES AND IT IS NOT A SOLICITATION OF AN OFFER TO BUY THESE SECURITIES IN ANY JURISDICTION WHERE THE OFFER OR SALE IS NOT PERMITTED.
| 65 |
| SEA HARBOR OFFICE CENTER |
The following table presents certain information relating to the lease rollover schedule at the Sea Harbor Office Center Property:
Lease Expiration Schedule(1)(2)
Year Ending December 31, | No. of Leases Expiring | Expiring NRSF | % of Total NRSF | Cumulative Expiring NRSF | Cumulative % of Total NRSF | Annual U/W Base Rent | Annual U/W Base Rent PSF(3) | |
| MTM(4) | 0 | 1,133 | 0.3% | 1,133 | 0.3% | $0 | $0.00 | |
| 2015 | 0 | 0 | 0.0% | 1,133 | 0.3% | $0 | $0.00 | |
| 2016 | 0 | 0 | 0.0% | 1,133 | 0.3% | $0 | $0.00 | |
| 2017 | 1 | 8,261 | 2.3% | 9,394 | 2.6% | $82,610 | $10.00 | |
| 2018 | 0 | 0 | 0.0% | 9,394 | 2.6% | $0 | $0.00 | |
| 2019 | 0 | 0 | 0.0% | 9,394 | 2.6% | $0 | $0.00 | |
| 2020 | 0 | 0 | 0.0% | 9,394 | 2.6% | $0 | $0.00 | |
| 2021 | 0 | 0 | 0.0% | 9,394 | 2.6% | $0 | $0.00 | |
| 2022 | 0 | 0 | 0.0% | 9,394 | 2.6% | $0 | $0.00 | |
| 2023 | 0 | 0 | 0.0% | 9,394 | 2.6% | $0 | $0.00 | |
| 2024 | 1 | 44,752 | 12.4% | 54,146 | 15.1% | $994,389 | $22.22 | |
| 2025 | 1 | 304,153 | 84.6% | 358,299 | 99.7% | $6,764,792 | $22.24 | |
| Thereafter | 0 | 0 | 0.0% | 358,299 | 99.7% | $0 | $0.00 | |
| Vacant | 0 | 1,215 | 0.3% | 359,514 | 100.0% | $0 | $0.00 | |
| Total/Weighted Average | 3 | 359,514 | 100.0% | $7,841,791 | $21.89 | |||
| (1) | Information obtained from the underwritten rent roll. |
| (2) | Certain tenants may have lease termination options that are exercisable prior to the originally stated expiration date of the subject lease and that are not considered in the Lease Expiration Schedule. |
| (3) | Weighted Average Annual U/W Base Rent PSF excludes vacant space. |
| (4) | MTM includes the management office which does not have an associated lease and pays no rent. |
The following table presents historical occupancy percentages at the Sea Harbor Office Center Property:
Historical Occupancy
12/31/2012(1) | 12/31/2013(1) | 12/31/2014(1) | 4/11/2015(2)(3) | |||
| 74.8% | 87.2% | 99.7% | 99.7% |
| (1) | Information obtained from the borrower. |
| (2) | Information obtained from the underwritten rent roll. |
| (3) | Wyndham Vacation is in the process of building out 44,752 square feet (12.4% of the net rentable area) of expansion space on the third floor. Wyndham Vacation has already commenced paying rent on the expansion space and the buildout is expected to be completed within four to six months of Sea Harbor Office Center Mortgage Loan closing. Wyndham Vacation is responsible for the cost of the buildout of the expansion space. The Sea Harbor Office Center Property was 99.7% leased (and 87.2% physically occupied) as of April 11, 2015. |
THE INFORMATION IN THIS STRUCTURAL AND COLLATERAL TERM SHEET IS NOT COMPLETE AND MAY BE AMENDED PRIOR TO THE TIME OF SALE. THIS TERM SHEET IS NOT AN OFFER TO SELL THESE SECURITIES AND IT IS NOT A SOLICITATION OF AN OFFER TO BUY THESE SECURITIES IN ANY JURISDICTION WHERE THE OFFER OR SALE IS NOT PERMITTED.
| 66 |
| SEA HARBOR OFFICE CENTER |
Operating History and Underwritten Net Cash Flow. The following table presents certain information relating to the historical operating performance and underwritten net cash flow at the Sea Harbor Office Center Property:
Cash Flow Analysis(1)
| 2013(2) | 2014(2) | U/W(3) | % of U/W Effective Gross Income | U/W $ per SF | ||||||||
| Base Rent | $1,655,908 | $6,993,113 | $7,841,791 | 100.4% | $21.81 | |||||||
| Grossed Up Vacant Space | 0 | 0 | 28,553 | 0.4 | 0.08 | |||||||
| Total Reimbursables | 343,185 | 308,960 | 505,652 | 6.5 | 1.41 | |||||||
| Other Income | 40,640 | 31,660 | 27,305 | 0.3 | 0.08 | |||||||
| Less Vacancy & Free Rent | 0 | (971,229) | (590,276)(4) | (7.6) | (1.64) | |||||||
| Effective Gross Income | $2,039,733 | $6,362,504 | $7,813,025 | 100.0% | $21.73 | |||||||
| Total Operating Expenses | $3,065,949 | $3,290,394 | $3,668,538 | 47.0% | $10.20 | |||||||
|
|
|
|
| ||||||||
| Net Operating Income | ($1,026,216) | $3,072,110 | $4,144,487 | 53.0% | $11.53 | |||||||
| TI/LC | 0 | 0 | 312,521 | 4.0 | 0.87 | |||||||
| Capital Expenditures | 0 | 0 | 89,879 | 1.2 | 0.25 | |||||||
| Net Cash Flow | ($1,026,216) | $3,072,110 | $3,742,088 | 47.9% | $10.41 | |||||||
| NOI DSCR | (0.59x) | 1.76x | 2.38x | |||||||||
| NCF DSCR | (0.59x) | 1.76x | 2.14x | |||||||||
| NOI DY | (2.6%) | 7.7% | 10.4% | |||||||||
| NCF DY | (2.6%) | 7.7% | 9.4% | |||||||||
| (1) | Historical cash flows prior to 2013 were not provided by the seller. |
| (2) | Wyndham Vacation took occupancy at the Sea Harbor Office Center Property in the fourth quarter of 2012 and paid abated rent for the first year of its lease. Unabated annual rental payments of $5,433,041 commenced on October 18, 2013. |
| (3) | The increase in Base Rent and Net Operating Income from 2014 to Underwritten is primarily due to the Wyndham Vacation expansion commencing rent on January 1, 2015 totaling $830,523 and contractual rent steps through December 31, 2015 totaling $310,453. |
| (4) | The underwritten economic vacancy is 7.5%. The Sea Harbor Office Center Property was 99.7% leased (and 87.2% physically occupied) as of April 11, 2015. |
Appraisal.As of the appraisal valuation date of April 9, 2015, the Sea Harbor Office Center Property had an “as-is” appraised value of $66,000,000. The appraiser also concluded to a “go dark” value of $41,900,000.
Environmental Matters.According to the Phase I environmental report dated April 24, 2015, there was no evidence of any recognized environmental conditions at the Sea Harbor Office Center Property.
Market Overview and Competition.The Sea Harbor Office Center Property is located in Orlando, Florida, approximately 10.0 miles southwest of the Orlando central business district. The immediate area has benefited from its proximity to Walt Disney World, Universal Studios, Sea World, the Orange County Convention Center and the Orlando International Airport. According to the appraisal, more than 62.0 million people visited Orlando in 2014. The Orlando Convention Center, which is located approximately 3.5 miles north of the Sea Harbor Office Center Property, is the second largest convention center in the United States with 2.1 million square feet of exhibition space and provides an economic impact of approximately $1.9 billion annually. International Drive, which is located 0.2 miles east of the Sea Harbor Office Center Property, is home to numerous tourist commercial uses with some notable projects currently planned or under construction, including the I-Drive 360, a $200.0 million retail, entertainment and tourist oriented development, currently under construction that is scheduled to open in Spring 2015, Sea Life Aquarium and a 450 foot tall Orlando Eye Ferris wheel. The 2015 estimated population within a one-, three- and five-mile radii of the Sea Harbor Office Center Property was 2,850, 32,086 and 135,037, respectively, and the estimated average household income within the same radii was $50,797, $75,020 and $70,020, respectively.
Orlando is home to many timeshare company headquarter locations as demonstrated by both Marriott International, Inc.’s and Hilton Worldwide’s timeshare brands being headquartered in Orlando and the recent Starwood Hotels & Resorts Worldwide, Inc. announcement that it will spin off the timeshare portion of its company, which will also be headquartered in Orlando. In addition, Diamond Resorts International Inc., a Las Vegas timeshare company, expanded its footprint to a total of approximately 86,000 square feet in the Orlando market in May 2015. Wyndham Vacation’s headquarters is housed at the Sea Harbor Office Center Property due to consolidation of operations and Wyndham Worldwide Corporation’s ownership of six large resorts and multiple condominium and home rentals in the Orlando area.
According to the appraisal, the Sea Harbor Office Center Property is located in the Orlando office market, and within the Tourist Corridor office submarket, which, as of year-end 2014, comprised approximately 8.4 million square feet of office space. As of year-end 2014, the Tourist Corridor office submarket vacancy rate was 9.5%, a decrease from the 11.0% vacancy rate as of year-end 2013, and reported an average asking rate of $18.90 per square foot, full service gross. The Tourist Corridor office submarket vacancy within a 3-mile radius of the Sea Harbor Office Center Property has averaged 8.7% over the past 10 years. As of year-end 2014, the Tourist Corridor class A office submarket reported an average vacancy rate of 10.7% and average asking rent of $21.41 per square foot, full service gross.
THE INFORMATION IN THIS STRUCTURAL AND COLLATERAL TERM SHEET IS NOT COMPLETE AND MAY BE AMENDED PRIOR TO THE TIME OF SALE. THIS TERM SHEET IS NOT AN OFFER TO SELL THESE SECURITIES AND IT IS NOT A SOLICITATION OF AN OFFER TO BUY THESE SECURITIES IN ANY JURISDICTION WHERE THE OFFER OR SALE IS NOT PERMITTED.
| 67 |
| SEA HARBOR OFFICE CENTER |
The following table presents certain information relating to comparable office properties for the Sea Harbor Office Center Property:
Competitive Set(1)
Sea Harbor | Offices at Rialto | Sand Lake IV | Millenia Park One | Millenia Lakes One | Kirkman Point I | Southpark Center 1200 | |
| Location | Orlando, FL | Orlando, FL | Orlando, FL | Orlando, FL | Orlando, FL | Orlando, FL | Orlando, FL |
| Distance from Subject | -- | 4.2 miles | 4.3 miles | 8.0 miles | 8.3 miles | 4.6 miles | 4.4 miles |
| Property Type | Office | Office | Office | Office | Office | Office | Office |
| Year Built/Renovated | 1984/2012 | 2008/NAP | 1987/2008 | 1999/NAP | 2001/2010 | 2012/NAP | 2005/NAP |
| Stories | 8 | 3 | 10 | 6 | 6 | 4 | 4 |
| Total GLA | 359,514 SF | 45,494 SF | 116,215 SF | 158,891 SF | 200,448 SF | 130,500 SF | 136,414 SF |
| Total Occupancy | 100% | 93% | 95% | 85% | 93% | 98% | 97% |
(1) Information obtained from the appraisal.
The Borrower.The borrower is Sea Harbor Property SPV, LLC, a Delaware limited liability company and a single purpose entity with one independent director. Legal counsel to the borrower delivered a non-consolidation opinion in connection with the origination of the Sea Harbor Office Center Mortgage Loan. Certain indirect owners of 50.0% of the borrower are members of the Islamic faith, which requires a Shari’ah compliant loan structure. In order to facilitate a Shari’ah compliant loan structure, the borrower master leases the Sea Harbor Office Center Property to an entity controlled by Northridge Capital, LLC. See “Risk Factors—Risks Related to the Mortgage Loans—Shari’ah Compliant Loans” and “Certain Characteristics of the Mortgage Pool—Shari’ah Compliant Loans” in the Free Writing Prospectus. Saturn Property Investments, LLC is the guarantor of certain nonrecourse carveouts under the Sea Harbor Office Center Mortgage Loan.
The Sponsors.The sponsors are Northridge Capital, LLC and Saturn Property Investments, LLC. Saturn Property Investments, LLC is controlled by the Abudawood Family. Sheikh Ali Abudawood founded the Ismail Abudawood Trading Company Limited (“Abudawood”), which, since 1956, has been the exclusive distributor of Proctor & Gamble brands throughout Saudi Arabia and has distribution relationships with other brands including Quaker Oats and United Riceland. In the 1970’s, Abudawood added other business ventures including the ownership of both domestic and international real estate and investment in various financial instruments. As of December 31, 2014, the sponsor had a portfolio of real estate investments that included three office buildings, two hotels and one condominium located in Arizona, Colorado and Georgia, respectively, that had a total value of approximately $107.6 million.
Escrows.The loan documents provide for upfront reserves in the amount of $388,186 for real estate taxes and $164,580 for insurance. The loan documents also provide for ongoing monthly escrows in the amount of $48,524 for real estate taxes, $20,572 for insurance and $4,494 for replacement reserves. Monthly escrows in the amount of $29,960 for tenant improvements and leasing commissions are required to commence upon the earlier of (i) the occurrence of an event of default under the loan documents; (ii) the net cash flow debt yield being less than 9.3%; or (iii) July 11, 2022.
Lockbox and Cash Management.Upon the occurrence of a Cash Trap Event Period (as defined below), the borrower will be required to establish a lender-controlled lockbox and direct tenants to deposit all rents directly into such lockbox account. During a Cash Trap Event Period, all excess funds on deposit in the lockbox account are swept into a lender-controlled cash flow sub-account.
A “Cash Trap Event Period” will commence upon the earlier of (i) the occurrence of an event of default under the loan documents; (ii) the hypothetical amortizing debt service coverage ratio being less than 1.20x at the end of any calendar month; or (iii) the occurrence of a Major Tenant Event Period (as defined below). A Cash Trap Event Period will expire, with regard to clause (i), upon the cure of such event of default; with regard to clause (ii), the hypothetical amortizing debt service coverage ratio being equal to or greater than 1.25x for two consecutive calendar quarters; and with regard to clause (iii), the Major Tenant Event Period ending.
A “Major Tenant Event Period” will commence upon Wyndham Vacation (i) going dark, vacating, failing to occupy 50.0% or more of its space, or giving notice of its intent to commence any of the foregoing; (ii) filing or being subject to bankruptcy or similar insolvency; (iii) terminating or canceling its lease, the lease otherwise ceasing to be in full force and effect, or giving notice of any of the foregoing; (iv) providing a termination notice under its lease for all or any portion of its space; or (v) Wyndham Worldwide Corporation’s unsecured debt rating being downgraded below ’BBB-’ by S&P or equivalent rating by any other rating agency. A Major Tenant Event Period will expire, with regard to clause (i), upon (a) a Major Tenant Re-Tenanting Event (as defined below) occurring, (b) Wyndham Vacation resuming occupancy in greater than 50.0% of its space for two consecutive calendar quarters, or (c) a combination of the events described in (a) and (b) with respect to greater than 50.0% of the Wyndham space; with regard to clause (ii), upon the bankruptcy or insolvency proceedings being terminated and the lease being affirmed or a Major Tenant Re-Tenanting Event occurring; with regard to clause (iii), the Wyndham Vacation lease being in full force and effect for two consecutive calendar quarters or a Major Tenant Re-Tenanting Event occurring; with regard to clause (iv), upon a Major Tenant Re-Tenanting Event occurring or the date 12 months following Wyndham Vacation giving notice of its intent to terminate its lease; and with regard to clause (v), upon Wyndham Worldwide Corporation’s senior unsecured debt rating being no less than ’BBB’ by S&P or a Major Tenant Re-Tenanting Event occurring.
THE INFORMATION IN THIS STRUCTURAL AND COLLATERAL TERM SHEET IS NOT COMPLETE AND MAY BE AMENDED PRIOR TO THE TIME OF SALE. THIS TERM SHEET IS NOT AN OFFER TO SELL THESE SECURITIES AND IT IS NOT A SOLICITATION OF AN OFFER TO BUY THESE SECURITIES IN ANY JURISDICTION WHERE THE OFFER OR SALE IS NOT PERMITTED.
| 68 |
| SEA HARBOR OFFICE CENTER |
A “Major Tenant Re-Tenanting Event” is defined as the lender receiving satisfactory evidence that the applicable portion of the Wyndham Vacation space has been leased to one or more satisfactory replacement tenants and such replacement tenants are in occupancy, open for business and paying full, unabated rent.
Property Management.The Sea Harbor Office Center Property is managed by an affiliate of the borrower who sub-contracts the management duties to Jones Lang LaSalle Americas, Inc.
Assumption.The borrower has the two-time right to transfer the Sea Harbor Office Center Property, provided that no event of default under the loan documents has occurred and is continuing and certain other conditions are satisfied, including (i) the lender’s reasonable determination that the proposed transferee and guarantor satisfy the lender’s credit review and underwriting standards, taking into consideration transferee experience, financial strength and general business standing; (ii) execution of a recourse guaranty (which includes an environmental indemnity) by an affiliate of the transferee; and (iii) rating agency confirmation from DBRS, KBRA, and Moody’s that the transfer will not result in a downgrade, withdrawal or qualification of the respective ratings assigned to the Series 2015-NXS2 Certificates.
Partial Release.Not permitted.
Real Estate Substitution.Not permitted.
Subordinate and Mezzanine Indebtedness. Not permitted.
Ground Leases.None.
Terrorism Insurance.The loan documents require that the “all risk” insurance policy required to be maintained by the borrower provide coverage for terrorism in an amount equal to the full replacement cost of the Sea Harbor Office Center Property (provided that the borrower is not required to pay terrorism insurance premiums in excess of two times the premium for all risk and business interruption coverage if Terrorism Risk Insurance Program Reauthorization is no longer in effect), as well as business interruption insurance covering no less than the 12-months period following the occurrence of a casualty event, together with a six-month extended period of indemnity.
Windstorm Insurance.The loan documents require windstorm insurance covering the full replacement cost of the Sea Harbor Office Center Property. At the time of Sea Harbor Office Center Mortgage Loan closing, the Sea Harbor Office Center Property has insurance coverage for windstorm.
THE INFORMATION IN THIS STRUCTURAL AND COLLATERAL TERM SHEET IS NOT COMPLETE AND MAY BE AMENDED PRIOR TO THE TIME OF SALE. THIS TERM SHEET IS NOT AN OFFER TO SELL THESE SECURITIES AND IT IS NOT A SOLICITATION OF AN OFFER TO BUY THESE SECURITIES IN ANY JURISDICTION WHERE THE OFFER OR SALE IS NOT PERMITTED.
| 69 |
| STANFORD RESEARCH PARK |
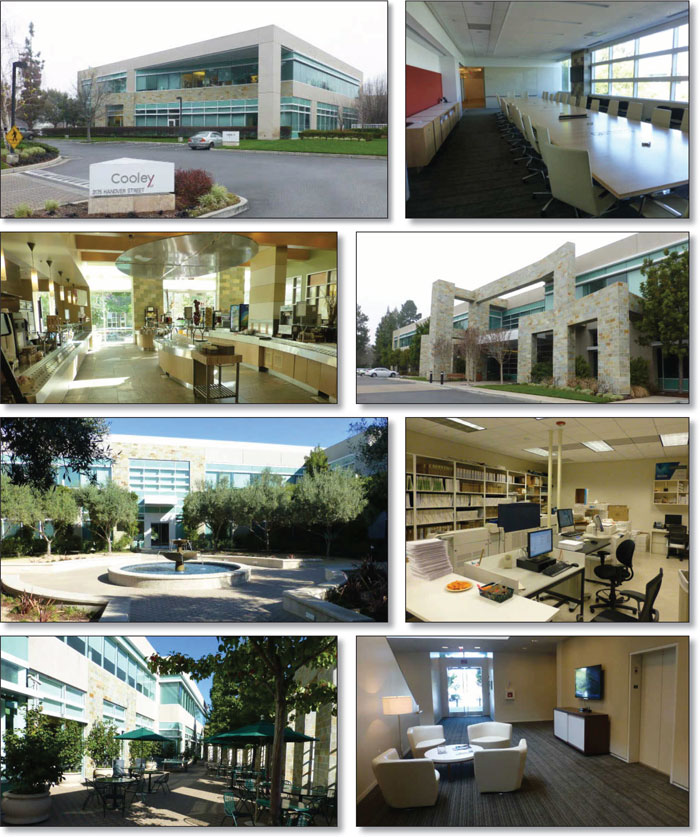
THE INFORMATION IN THIS STRUCTURAL AND COLLATERAL TERM SHEET IS NOT COMPLETE AND MAY BE AMENDED PRIOR TO THE TIME OF SALE. THIS TERM SHEET IS NOT AN OFFER TO SELL THESE SECURITIES AND IT IS NOT A SOLICITATION OF AN OFFER TO BUY THESE SECURITIES IN ANY JURISDICTION WHERE THE OFFER OR SALE IS NOT PERMITTED.
| 70 |
| STANFORD RESEARCH PARK |
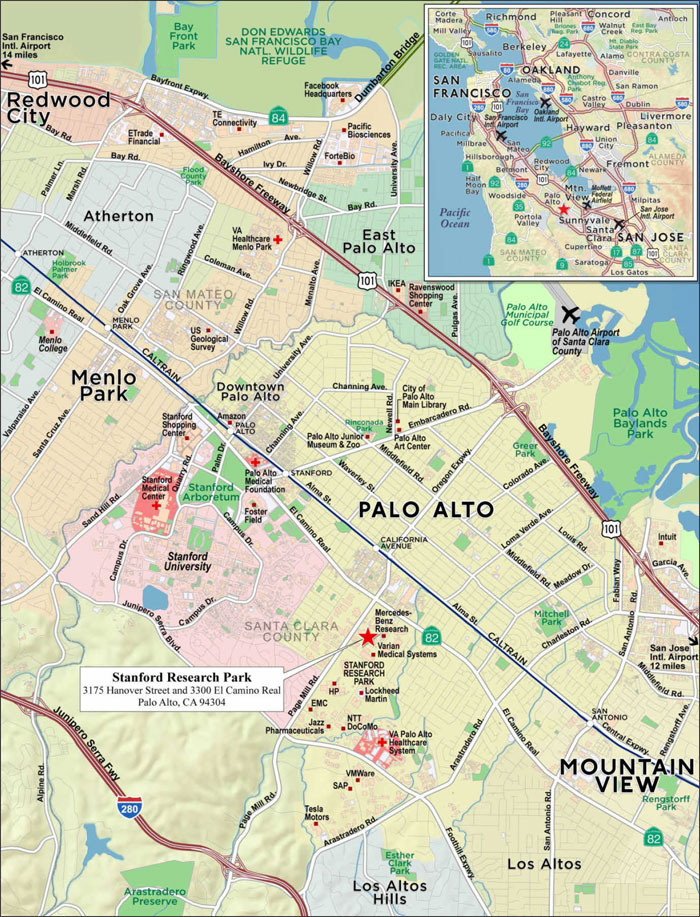
THE INFORMATION IN THIS STRUCTURAL AND COLLATERAL TERM SHEET IS NOT COMPLETE AND MAY BE AMENDED PRIOR TO THE TIME OF SALE. THIS TERM SHEET IS NOT AN OFFER TO SELL THESE SECURITIES AND IT IS NOT A SOLICITATION OF AN OFFER TO BUY THESE SECURITIES IN ANY JURISDICTION WHERE THE OFFER OR SALE IS NOT PERMITTED.
| 71 |
| No. 7 – Stanford Research Park | |||||||
| Loan Information | Property Information | ||||||
| Mortgage Loan Seller: | Natixis Real Estate Capital LLC | Single Asset/Portfolio: | Single Asset | ||||
| Credit Assessment (DBRS/KBRA/Moody’s): | NR/NR/NR | Property Type: | Office | ||||
| Original Principal Balance(1): | $36,500,000 | Specific Property Type: | Suburban | ||||
| Cut-off Date Principal Balance(1): | $36,500,000 | Location: | Palo Alto, CA | ||||
| % of Initial Pool Balance: | 4.0% | Size(2): | 129,678 SF | ||||
| Loan Purpose: | Acquisition | Cut-off Date Principal Balance Per SF(1): | $667.04 | ||||
| Borrower Name: | Hanover Property, LLC | Year Built/Renovated: | 2000/2014 | ||||
| Sponsor: | Henley Holding Company | Title Vesting: | Leasehold | ||||
| Mortgage Rate: | 4.672% | Property Manager: | Self-managed | ||||
| Note Date: | June 4, 2014 | 3rdMost Recent Occupancy (As of)(3): | 100.0% (12/31/2012) | ||||
| Anticipated Repayment Date: | NAP | 2ndMost Recent Occupancy (As of)(3): | 100.0% (12/31/2013) | ||||
| Maturity Date: | January 5, 2025 | Most Recent Occupancy (As of)(3): | 100.0% (12/31/2014) | ||||
| IO Period: | 127 months | Current Occupancy (As of)(3): | 100.0% (7/1/2015) | ||||
| Loan Term (Original): | 127 months | ||||||
| Seasoning: | 13 months | Underwriting and Financial Information: | |||||
| Amortization Term (Original): | NAP | ||||||
| Loan Amortization Type: | Interest-only, Balloon | 3rdMost Recent NOI (As of)(3): | NAV | ||||
| Interest Accrual Method: | Actual/360 | 2ndMost Recent NOI (As of)(3): | NAV | ||||
| Call Protection: | L(37),D(86),O(4) | Most Recent NOI(3): | NAV | ||||
| Lockbox Type: | Hard/Springing Cash Management | ||||||
| Additional Debt(1): | Yes | ||||||
| Additional Debt Type(1): | Pari Passu | U/W Revenues(4): | $11,571,768 | ||||
| U/W Expenses: | $3,438,839 | ||||||
| U/W NOI(4): | $8,132,928 | ||||||
| U/W NCF(4): | $8,016,218 | ||||||
| U/W NOI DSCR(1)(4): | 1.98x | ||||||
| Escrows and Reserves(2): | U/W NCF DSCR(1)(4): | 1.95x | |||||
| U/W NOI Debt Yield(1)(4): | 9.4% | ||||||
| Type: | Initial | Monthly | Cap (If Any) | U/W NCF Debt Yield(1)(4): | 9.3% | ||
| Taxes | $0 | Springing | NAP | As-Is Appraised Value(5): | $138,000,000 | ||
| Insurance | $0 | Springing | NAP | As-Is Appraisal Valuation Date(5): | January 30, 2015 | ||
| Replacement Reserves | $0 | $1,621 | $100,000 | Cut-off Date LTV Ratio(1): | 62.7% | ||
| TI/LC Reserve | $1,887,146 | $0 | NAP | LTV Ratio at Maturity or ARD(1): | 62.7% | ||
| (1) | The Stanford Research Park Loan Combination, totaling $86,500,000, is comprised of twopari passu notes (Notes A-1 and A-2). The non-controlling Note A-2 had an original principal balance of $36,500,000, has an outstanding principal balance of $36,500,000 as of the Cut-Off Date and will be contributed to the WFCM 2015-NXS2 Trust. The controlling Note A-1 had an original principal balance of $50,00,000 and was contributed to the WFCM 2015-NXS1 Trust. All statistical financial information related to balances per square foot, loan-to-value ratios, debt service coverage ratios and debt yield are based on the Stanford Research Park Loan Combination. See “Description of the Mortgage Pool—Loan Combinations—The Stanford Research Park Loan Combination” in the Free Writing Prospectus. |
| (2) | See “Escrows” section. |
| (3) | Historical financials were not available as the borrower recently acquired the Stanford Research Park Property and such information was not provided by the previous owner. Per the lease, Cooley LLP has been at the Hanover Property since 2000. |
| (4) | See “Cash Flow Analysis” section. |
| (5) | The As-Is Appraised Value refers to the value of the Hanover Property; no value was attributed to the El Camino Real Property. |
The Mortgage Loan.The mortgage loan is part of a loan combination (the “Stanford Research Park Loan Combination”) that is evidenced by twopari passu promissory notes (Notes A-1 and A-2) secured by the borrower’s leasehold interest in a class A office property and a 2.9-acre land parcel in Palo Alto, California (collectively, the “Stanford Research Park Properties”). The Stanford Research Park Loan Combination was originated on June 4, 2014 by Natixis Real Estate Capital LLC. The Stanford Research Park Loan Combination had an original principal balance of $86,500,000, has an outstanding principal balance as of the Cut-off Date of $86,500,000 and accrues interest at an interest rate of 4.672%per annum. The Stanford Research Park Loan Combination had an initial term of 127 months, has a remaining term of 114 months as of the Cut-off Date and requires interest-only payments through the term of the Stanford Research Park Loan Combination.
Note A-2, which will be contributed to the WFCM 2015-NXS2 Trust, had an original principal balance of $36,500,000, has an outstanding principal balance as of the Cut-off Date of $36,500,000 and represents the non-controlling interest in the Stanford Research Park Loan Combination. The controlling Note A-1 (the “Stanford Research Park Companion Loan”) had an original principal balance of $50,000,000 and was contributed to the WFCM 2015-NXS1 Trust. See “Description of the Mortgage Pool—Loan Combinations—The Stanford Research Park Loan Combination” in the Free Writing Prospectus.
THE INFORMATION IN THIS STRUCTURAL AND COLLATERAL TERM SHEET IS NOT COMPLETE AND MAY BE AMENDED PRIOR TO THE TIME OF SALE. THIS TERM SHEET IS NOT AN OFFER TO SELL THESE SECURITIES AND IT IS NOT A SOLICITATION OF AN OFFER TO BUY THESE SECURITIES IN ANY JURISDICTION WHERE THE OFFER OR SALE IS NOT PERMITTED.
| 72 |
| STANFORD RESEARCH PARK |
Following the lockout period, the borrower has the right to defease the Stanford Research Park Loan Combination in whole, or in part (see “Partial Release” section), on any date before October 5, 2024. In addition, the Stanford Research Park Mortgage Loan is prepayable without penalty on or after October 5, 2024.
Sources and Uses
| Sources | Uses | ||||||||
| Original loan combination amount | $86,500,000 | 60.6 | % | Purchase price | $140,000,000 | 98.1 | % | ||
| Sponsor’s new cash contribution | 56,152,732 | 39.4 | Reserves | 1,887,146 | 1.3 | ||||
| Closing costs | 765,586 | 0.5 | |||||||
| Total Sources | $142,652,732 | 100.0 | % | Total Uses | $142,652,732 | 100.0 | % |
The Property.The Stanford Research Park Properties are comprised of 3175 Hanover Street (the “Hanover Property”) and 3300 El Camino Real (the “El Camino Real Property”), both of which are located in the Stanford Research Park in Palo Alto, California and are approximately one mile apart. Both properties are subject to a single Stanford University ground lease agreement (see “Ground Lease” section). Stanford University and the borrower are working together to bifurcate the Hanover Property and the El Camino Real Property, which is expected to be released following the effective bifurcation of the ground lease; however, no value or income has been attributed to this property (See “Partial Release” section).
The Hanover Property was built in 2000 and comprises a two-story class A office building totaling 129,678 square feet of rentable area and is situated off Page Mill Road and directly across the street from Hewlett Packard’s worldwide headquarters. The Hanover Property’s ground lease payment is 15% of gross rental revenue at the Hanover Property. The Hanover Property includes 435 parking spaces (3.4 spaces per 1,000 square feet of rentable area). The Hanover Property is 100.0% leased to Cooley LLP (“Cooley”), an international law firm with 750 attorneys and 11 offices across the United States and China, pursuant to a lease expiring in January 2025 with two five-year renewal options. Cooley has been a tenant at the Hanover Property since it was completed in 2000. The Hanover Property underwent a $6.5 million renovation in 2014 when Cooley converted interior cubicles and other meeting space to offices to accommodate the relocation of other attorneys to the Hanover Property. Cooley also renovated conference rooms and upgraded technology systems in 2014.
The El Camino Real Property is a rectangular-shaped 2.9-acre unimproved land parcel with frontage on El Camino Real, providing for a development opportunity in Stanford Research Park. The El Camino Real Property’s current zoning allows for several permitted uses including office and research and development. El Camino Real (SR-82) is a major thoroughfare that runs north-south through Silicon Valley and connects to the San Francisco area. A portion of the El Camino Real Property serves as the eastern boundary of the Stanford Research Park. The El Camino Real Property is currently a paved parking lot.
The following table presents certain information relating to the tenancy at the Hanover Property:
Major Tenants
| Tenant Name | Credit Rating (Fitch/Moody’s/ S&P) | Tenant NRSF | % of NRSF | Annual U/W Base Rent PSF | Annual U/W Base Rent(1) | % of Total Annual U/W Base Rent | Lease Expiration Date | |||||||||
| Major Tenants | ||||||||||||||||
| Cooley LLP | NR/NR/NR | 129,678 | 100.0% | $79.10 | $10,257,628 | 100.0% | 1/31/2025(2) | |||||||||
| Total Major Tenants | 129,678 | 100.0% | $79.10 | $10,257,628 | 100.0% | |||||||||||
| Occupied Collateral Total | 129,678 | 100.0% | $79.10 | $10,257,628 | 100.0% | |||||||||||
| Vacant Space | 0 | 0.0% | ||||||||||||||
| Collateral Total | 129,678 | 100.0% | ||||||||||||||
| (1) | The U/W Base Rent includes rent averaging through February 2024 totaling $1,309,846. Cooley’s current in-place rental rate is $69.00 per square foot. |
| (2) | Cooley has two five-year lease renewal options. |
THE INFORMATION IN THIS STRUCTURAL AND COLLATERAL TERM SHEET IS NOT COMPLETE AND MAY BE AMENDED PRIOR TO THE TIME OF SALE. THIS TERM SHEET IS NOT AN OFFER TO SELL THESE SECURITIES AND IT IS NOT A SOLICITATION OF AN OFFER TO BUY THESE SECURITIES IN ANY JURISDICTION WHERE THE OFFER OR SALE IS NOT PERMITTED.
| 73 |
| STANFORD RESEARCH PARK |
The following table presents certain information relating to the lease rollover schedule at the Hanover Property:
Lease Expiration Schedule(1)
Year Ending | No. of Leases Expiring | Expiring | % of Total NRSF | Cumulative Expiring NRSF | Cumulative % of Total NRSF | Annual U/W Base Rent | Annual | |||||||
| MTM | 0 | 0 | 0.0% | 0 | 0.0% | $0 | $0.00 | |||||||
| 2015 | 0 | 0 | 0.0% | 0 | 0.0% | $0 | $0.00 | |||||||
| 2016 | 0 | 0 | 0.0% | 0 | 0.0% | $0 | $0.00 | |||||||
| 2017 | 0 | 0 | 0.0% | 0 | 0.0% | $0 | $0.00 | |||||||
| 2018 | 0 | 0 | 0.0% | 0 | 0.0% | $0 | $0.00 | |||||||
| 2019 | 0 | 0 | 0.0% | 0 | 0.0% | $0 | $0.00 | |||||||
| 2020 | 0 | 0 | 0.0% | 0 | 0.0% | $0 | $0.00 | |||||||
| 2021 | 0 | 0 | 0.0% | 0 | 0.0% | $0 | $0.00 | |||||||
| 2022 | 0 | 0 | 0.0% | 0 | 0.0% | $0 | $0.00 | |||||||
| 2023 | 0 | 0 | 0.0% | 0 | 0.0% | $0 | $0.00 | |||||||
| 2024 | 0 | 0 | 0.0% | 0 | 0.0% | $0 | $0.00 | |||||||
| 2025 | 1 | 129,678 | 100.0% | 129,678 | 100.0% | $10,257,628 | $79.10 | |||||||
| Thereafter | 0 | 0 | 0.0% | 129,678 | 100.0% | $0 | $0.00 | |||||||
| Vacant | 0 | 0 | 0.0% | 129,678 | 100.0% | $0 | $0.00 | |||||||
| Total/Weighted Average | 1 | 129,678 | 100.0% | $10,257,628 | $79.10 |
| (1) | Information obtained from the underwritten rent roll. |
The following table presents historical occupancy percentages at the Hanover Property:
Historical Occupancy
12/31/2012(1) | 12/31/2013(1) | 12/31/2014(1) | 7/1/2015(2) | |||
| 100.0% | 100.0% | 100.0% | 100.0% |
| (1) | Information obtained from the lease which commenced in 2000. |
| (2) | Information obtained from the underwritten rent roll. |
THE INFORMATION IN THIS STRUCTURAL AND COLLATERAL TERM SHEET IS NOT COMPLETE AND MAY BE AMENDED PRIOR TO THE TIME OF SALE. THIS TERM SHEET IS NOT AN OFFER TO SELL THESE SECURITIES AND IT IS NOT A SOLICITATION OF AN OFFER TO BUY THESE SECURITIES IN ANY JURISDICTION WHERE THE OFFER OR SALE IS NOT PERMITTED.
| 74 |
| STANFORD RESEARCH PARK |
Operating History and Underwritten Net Cash Flow. The following table presents certain information relating to the underwritten net cash flow at the Hanover Property:
Cash Flow Analysis(1)
| U/W | % of U/W Effective Gross Income | U/W $ per SF | ||||||||
| Base Rent | $10,257,628 | 88.6% | $79.10 | |||||||
| Grossed Up Vacant Space | 0 | 0.0 | 0.00 | |||||||
| Total Reimbursables | 1,550,298 | 13.4 | 11.95 | |||||||
| Other Income | 0 | 0.0 | 0.00 | |||||||
| Less Vacancy & Credit Loss | (236,159)(2) | (2.0) | (1.82) | |||||||
| Effective Gross Income | $11,571,768 | 100.0% | $89.23 | |||||||
| Total Operating Expenses | $3,438,839 | 29.7% | $26.52 | |||||||
| Net Operating Income | $8,132,928 | 70.3% | $62.72 | |||||||
| TI/LC | 97,259 | 0.8 | 0.75 | |||||||
| Capital Expenditures | 19,452 | 0.2 | 0.15 | |||||||
| Net Cash Flow | $8,016,218 | 69.3% | $61.82 | |||||||
| NOI DSCR(3) | 1.98x | |||||||||
| NCF DSCR(3) | 1.95x | |||||||||
| NOI DY(3) | 9.4% | |||||||||
| NCF DY(3) | 9.3% | |||||||||
| (1) | Historical financials were not available as the sponsor recently acquired the Stanford Research Park Properties and such information was not provided by the previous owner. |
| (2) | The underwritten economic vacancy is 2.0%. The Hanover Property was 100.0% occupied as of July 1, 2015. |
| (3) | DSCRs and debt yields are based on the Stanford Research Park Loan Combination. |
Appraisal.As of the appraisal valuation date of January 30, 2015, the Hanover Property had an “as-is” appraised value of $138,000,000.
Environmental Matters. According to Phase I environmental site assessments dated May 12, 2014 and June 3, 2014, six groundwater monitoring wells were located throughout the Stanford Research Park Properties. According to information obtained from previous environmental reports, these wells were installed at the site between 1989 and 1991 as part of a soil and groundwater investigation at the Varian Medical Systems, Inc. (“Varian”) Site and Study Area (the “Varian Site”) within the Stanford Research Park Property, which includes the Hanover Property. According to a review of the 2012 Long Term Monitoring Report, analytical results reported that trichloroethene (“TCE”) was detected at a maximum concentration of 14 micrograms per liter (μg/L) from a monitoring well located along the western Hanover Property boundary. The cleanup goal for TCE is 5 μg/L. Groundwater flow from the Varian Site is towards the northeast, therefore, the Hanover Property site is located upgradient of three source areas (Buildings 1, 3, and 4) and is situated within the Building 6 Plume Area. Based on the most recent groundwater monitoring data, it is apparent that historical releases from Building 6 have resulted in TCE contaminated groundwater beneath the site. Remedial activities to clean up impacted groundwater throughout the Varian Site, including the Hanover Property, are ongoing. The presence of TCE in groundwater beneath the site at a concentration above the cleanup goal indicates historical operations conducted at Building 6 and throughout the remaining areas of the Varian Site has adversely impacted the Hanover Property. This represents a recognized environmental condition at the Hanover Property.
Varian is the responsible party for the remediation/monitoring. According to a Phase I environmental site assessment, the Hanover Property should continue to allow access to the site as needed to monitor, sample, etc. until remediation is complete.
Market Overview and Competition.The Stanford Research Park Properties are located within the Stanford Research Park in Palo Alto, California, midway between San Francisco and San Jose in Silicon Valley. Established in 1951 by Stanford University, the Stanford Research Park is one of the first technology-oriented office parks in the world. The Stanford Research Park’s 60-year relationship with Stanford University and proximity to Sand Hill Road (home to the highest concentration of venture capitalists in the world according to the appraisal) positions the area as a desirable address for technology companies and professional service firms, with approximately 150 companies and 23,000 employees. Silicon Valley is home to 14 Fortune 500 corporations as of 2014. Current tenants in the Stanford Research Park include SAP Labs (headquarters for SAP Labs US), Hewlett Packard (world headquarters), VMware (world headquarters), Lockheed Martin, Xerox PARC, TIBCO Software (world headquarters), Varian (world headquarters), Merck, Mercedes-Benz Research & Development (North American headquarters), Skype (North American headquarters), Theranos (world headquarters) and Tesla Motors (World headquarters). The Stanford Research Park contains approximately 700 acres and is improved with approximately 10.6 million square feet of office and research and development (“R&D”) space. However, the Stanford Research Park is restricted to only 3.0 million rentable square feet dedicated to office use with the remaining use devoted to R&D, manufacturing and industrial. Of the 3.0 million square feet of office space, only four buildings built after 2000 are considered to be class A (including the Hanover Property), according to the appraisal. As of the fourth quarter of 2014, vacancy within the Stanford Research Park was 0.3% with a waiting list for office space. Stanford University tends to reserve office premises for start-up and other select companies that will further the original technology-based tenancy and will limit the service-oriented tenancy.
THE INFORMATION IN THIS STRUCTURAL AND COLLATERAL TERM SHEET IS NOT COMPLETE AND MAY BE AMENDED PRIOR TO THE TIME OF SALE. THIS TERM SHEET IS NOT AN OFFER TO SELL THESE SECURITIES AND IT IS NOT A SOLICITATION OF AN OFFER TO BUY THESE SECURITIES IN ANY JURISDICTION WHERE THE OFFER OR SALE IS NOT PERMITTED.
| 75 |
| STANFORD RESEARCH PARK |
The following table presents certain information relating to comparable properties to the Hanover Property:
Competitive Set(1)
| Stanford Research Park (Subject) | Hanover Page Mill Centre | Two Palo Alto Square | Four Palo Alto Square | 260 N. California Avenue | College Terrace Centre | |
| Location | Palo Alto, CA | Palo Alto, CA | Palo Alto, CA | Palo Alto, CA | Palo Alto, CA | Palo Alto, CA |
| Distance from Subject | -- | 1.0 mile | 0.7 miles | 0.9 miles | 1.4 miles | 0.9 miles |
| Property Type | Office | Office | Office | Office | Office | Office |
| Year Built/Renovated | 2000/2014 | 2014/NAP | 1972/NAP | 1972/NAP | 2015/NAP | 2015/NAP |
| Stories | 2 | 2 | 10 | 2 | 3 | 3 |
| Total GLA | 129,678 SF | 89,584 SF | 132,910 SF | 19,532 SF | 25,972 SF | 54,472 SF |
| (1) | Information obtained from the appraisal. |
The Borrower.The borrower is Hanover Property, LLC (“Hanover”), a Delaware limited liability company and single purpose entity with two independent directors. Legal counsel to the borrower delivered a non-consolidation opinion in connection with the origination of the Stanford Research Park Loan Combination. Hanover is a joint venture between Sand Hill Property Company (“Sand Hill”) and Abu Dhabi Investment Authority (“ADIA”). Founded in 1988 by Peter Pau and Susanna Pau, Sand Hill is a real estate investment and development company focused on Silicon Valley properties. Over the last two decades, the company has developed over $1.0 billion worth of real estate projects encompassing approximately 14.0 million square feet of building area throughout the Silicon Valley. Henley Holding Company is the guarantor of certain nonrecourse carveouts under the Stanford Research Park Mortgage Loan.
The Sponsor.The sponsor is Henley Holding Company, which is a holding company of ADIA. ADIA is a sovereign wealth fund owned by the Emirate of Abu Dhabi (in United Arab Emirates) founded for the purpose of investing funds on behalf of the government of the Emirate of Abu Dhabi. ADIA manages the emirate’s excess oil reserves, estimated to be as much as $500.0 billion. ADIA is an experienced real estate investor with a portfolio estimated to be worth in excess of $1.0 billion.
Escrows.The loan documents provide for upfront reserves in the amount of $1,887,146 for tenant improvement and leasing commission reserves. The loan documents require monthly deposits of $1,621 for replacement reserves, subject to a cap of $100,000. The loan documents require monthly escrows of one-twelfth of the estimated annual real estate taxes for real estate taxes and one-twelfth of the annual insurance premiums upon the occurrence of (i) an event of default, (ii) Cooley’s failure to directly pay or reimburse the borrower for taxes and insurance premiums, (iii) a default under the Cooley lease or (iv) the failure of the borrower to provide evidence of tax and insurance payments.
Lockbox and Cash Management.The Stanford Research Park Mortgage Loan is structured with a hard lockbox and springing cash management. The Stanford Research Park Mortgage Loan requires all rents to be transmitted directly by all tenants of the Stanford Research Park Property into the clearing account. Prior to the occurrence of a Cash Management Period (as defined below), all funds in the lockbox account are swept to the borrower’s operating account. During a Cash Management Period, all funds in the lockbox account will be swept to a lender-controlled cash management account.
A “Cash Management Period” will commence upon the occurrence of any of the following: (i) an event of default, (ii) the failure by the borrower, after the end of a calendar quarter, to maintain a debt service coverage ratio of at least 1.15x or (iii) the occurrence of a Cooley Trigger Event (as defined below). A Cash Management Period will end with respect to clause (i) above, upon the cure of such event of default; with respect to clause (ii) above, upon the debt service coverage ratio being at least 1.20x for six consecutive months; and with respect to clause (iii) above, upon the occurrence of a Cooley Trigger Event Cure (as defined below). Notwithstanding the foregoing, if a Cash Management Period is triggered pursuant to clause (ii) above, such Cash Management Period will not commence, or, if commenced, will be deemed cured, provided that within five days after the giving of notice of a Cash Management Period by the lender, the borrower either (a) commences and thereafter diligently pursues completion of a partial defeasance of an amount sufficient to increase the debt service coverage ratio calculated upon the remaining outstanding principal to at least 1.15x, or (b) deposits with the lender a cash reserve or an acceptable letter of credit that causes the debt service coverage ratio to equal or exceed 1.15x (after deducting the amount of the cash reserve or the face amount of such acceptable letter of credit, as applicable, from the then-outstanding principal when determining the debt service coverage ratio for the applicable twelve month period). In the event the borrower delivers an acceptable letter of credit pursuant to the prior sentence, the lender will be permitted to draw upon such letter of credit upon the occurrence of any event of default or in any circumstance where such letter of credit is expiring and will not be renewed. Upon satisfaction of clause (b) above, without consideration of any cash reserve or any acceptable letter of credit, such cash reserve or the acceptable letter of credit, as applicable, will be returned to the borrower.
A “Cooley Trigger Event” means any of: (i) Cooley becomes the subject of a bankruptcy action; (ii) Cooley “goes dark” in a majority of the Cooley premises (excluding any portion that is or will be occupied pursuant to an executed sublease) for a continuous period of not less than 90 days; provided, however, if Cooley “goes dark” for the purpose of remodeling its space, such period will be extended to 120 days or such other longer period as may be approved by the lender in advance; (iii) a monetary or material non-monetary default (beyond any applicable notice and/or cure period) occurs under the Cooley lease; or (iv) Cooley fails to exercise
THE INFORMATION IN THIS STRUCTURAL AND COLLATERAL TERM SHEET IS NOT COMPLETE AND MAY BE AMENDED PRIOR TO THE TIME OF SALE. THIS TERM SHEET IS NOT AN OFFER TO SELL THESE SECURITIES AND IT IS NOT A SOLICITATION OF AN OFFER TO BUY THESE SECURITIES IN ANY JURISDICTION WHERE THE OFFER OR SALE IS NOT PERMITTED.
| 76 |
| STANFORD RESEARCH PARK |
any remaining lease extension option by the earlier of (a) the date which is 12 months prior to the Stanford Research Park Loan Combination maturity date, or (b) the date by which Cooley must exercise such lease renewal options pursuant to the Cooley lease. A “Cooley Trigger Event Cure” will occur, with respect to clause (i) of the Cooley Trigger Event definition, if either (a) the bankruptcy action is dismissed and the Cooley lease is affirmed, or (b) a Cooley Renew/Replacement (as defined below) event has occurred; with respect to clause (ii) of the Cooley Trigger Event definition, if either (a) Cooley or another tenant re-opens for business for a continuous period of not less than three months, or (b) a Cooley Renew/Replacement Event has occurred; with respect to clause (iii) of the Cooley Trigger Event definition, if either (a) the monetary or material non-monetary default is cured and no other monetary or material non-monetary default (beyond any applicable notice and/or cure period) exists under the Cooley Lease, or (b) a Cooley Renew/Replacement event has occurred; or pursuant to clause (iv) a Cooley Renew/Replacement event has occurred.
A “Cooley Renew/Replacement Event” means either (i) the renewal, extension or replacement of the Cooley Lease with Cooley, as tenant, upon such terms and conditions as are provided in the Cooley lease or upon such terms and conditions as are reasonably acceptable to the lender in all respects; or (ii) the termination of the Cooley lease and the borrower entering into one or more new leases for all of the Cooley premises with acceptable replacement tenant(s) and upon such terms and conditions as are reasonably acceptable to the lender in all respects.
Property Management. The Stanford Research Park property is managed by an affiliate of the borrower.
Assumption.The lender may not unreasonably withhold its consent to the sale of the Stanford Research Park Property in its entirety to a special purpose entity that meets the lender’s then current requirements for special purpose entities and provided the borrower satisfies certain other conditions including (i) no event of default has occurred and is continuing; and (ii) the lender has reasonably determined that the proposed transferee and any successor guarantor satisfy the lender’s credit review and underwriting standards, taking into consideration such transferee’s experience, financial strength and general business standing. The lender will have the right to approve or disapprove the proposed transferee in its reasonable discretion, it being acknowledged that the lender may, as a condition to approving any proposed transferee require a rating comfort letter from DBRS, KBRA and Moody’s that such assumption will not result in a downgrade, withdrawal or qualification of the respective ratings to the Series 2015-NXS2 Certificates and similar confirmations from each rating agency rating securities backed by the Stanford Research Park Companion Loan.
Partial Release. The borrower may obtain a one-time free release of the El Camino Real Property provided the conditions in the loan documents are met including, among others: as a result of the partial release, the remaining parcel will have a sufficient number of available parking spaces to satisfy the requirements of all applicable legal requirements and all leases affecting the remaining parcel and will not be in violation, in any material respects, of any applicable legal requirements (including, without limitation, all zoning and subdivision laws, setback requirements, sideline requirements, parking ratio requirements, use requirements, building and fire code requirements, environmental requirements and wetland requirements), all necessary variances, if any, will have been obtained and evidence of the foregoing will have been delivered to the lender. No value was attributed to the El Camino Real Property.
Real Estate Substitution.Not permitted.
Subordinate and Mezzanine Indebtedness.Not permitted.
Ground Lease.The Stanford Research Park Properties are subject to a single ground lease from The Board of Trustees of the Leland Stanford Junior University (“Stanford University”). The ground lease is dated July 1, 1998 and is scheduled to expire on January 27, 2051. The borrower is subject to ground rent equal to 15.0% of the gross revenues from the Stanford Research Park Properties (i.e., all sublease revenue, parking fees, business interruption insurance proceeds, etc.), which is paid monthly with year-end adjustments.
Terrorism Insurance. The loan documents provide that the required “all risk” insurance policy must include coverage for terrorism in an amount equal to the full replacement cost of the Stanford Research Park Properties. The loan documents also require business interruption insurance covering no less than the 18-month period following the occurrence of a casualty event.
Earthquake Insurance.The loan documents do not require earthquake insurance. The seismic report dated February 28, 2014 indicated a probable maximum loss of 12.0%.
THE INFORMATION IN THIS STRUCTURAL AND COLLATERAL TERM SHEET IS NOT COMPLETE AND MAY BE AMENDED PRIOR TO THE TIME OF SALE. THIS TERM SHEET IS NOT AN OFFER TO SELL THESE SECURITIES AND IT IS NOT A SOLICITATION OF AN OFFER TO BUY THESE SECURITIES IN ANY JURISDICTION WHERE THE OFFER OR SALE IS NOT PERMITTED.
| 77 |
| 88 HAMILTON AVENUE |

THE INFORMATION IN THIS STRUCTURAL AND COLLATERAL TERM SHEET IS NOT COMPLETE AND MAY BE AMENDED PRIOR TO THE TIME OF SALE. THIS TERM SHEET IS NOT AN OFFER TO SELL THESE SECURITIES AND IT IS NOT A SOLICITATION OF AN OFFER TO BUY THESE SECURITIES IN ANY JURISDICTION WHERE THE OFFER OR SALE IS NOT PERMITTED.
| 78 |
| 88 HAMILTON AVENUE |
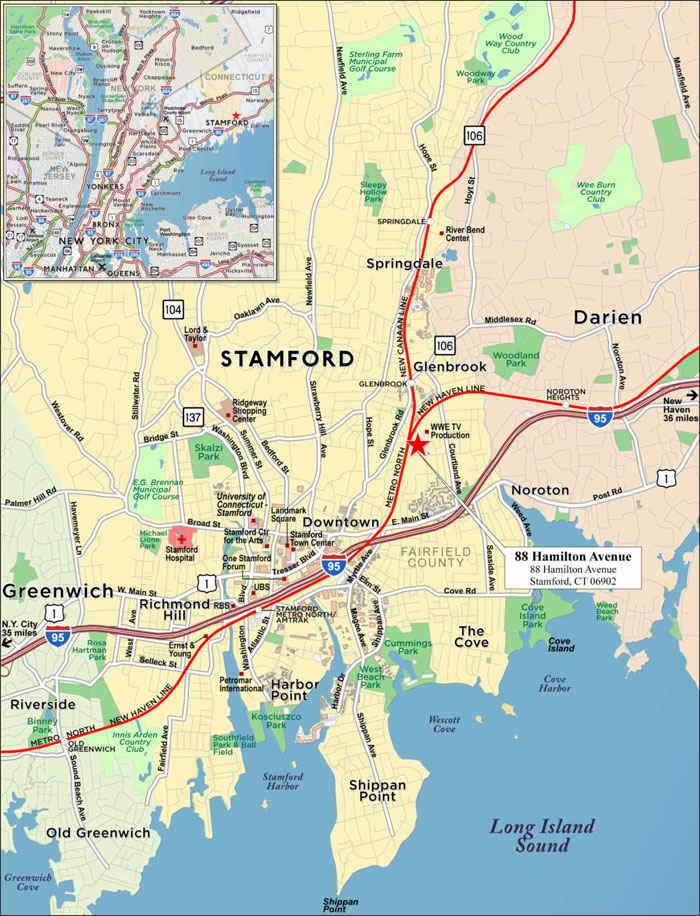
THE INFORMATION IN THIS STRUCTURAL AND COLLATERAL TERM SHEET IS NOT COMPLETE AND MAY BE AMENDED PRIOR TO THE TIME OF SALE. THIS TERM SHEET IS NOT AN OFFER TO SELL THESE SECURITIES AND IT IS NOT A SOLICITATION OF AN OFFER TO BUY THESE SECURITIES IN ANY JURISDICTION WHERE THE OFFER OR SALE IS NOT PERMITTED.
| 79 |
| No. 8 – 88 Hamilton Avenue | |||||||
| Loan Information | Property Information | ||||||
| Mortgage Loan Seller: | Natixis Real Estate Capital LLC | Single Asset/Portfolio: | Single Asset | ||||
| Credit Assessment (DBRS/KBRA/Moody’s): | NR/NR/NR | Property Type: | Mixed Use | ||||
| Original Principal Balance: | $23,000,000 | Specific Property Type: | Office/Industrial | ||||
| Cut-off Date Principal Balance: | $23,000,000 | Location: | Stamford, CT | ||||
| % of Initial Pool Balance: | 2.5% | Size: | 154,533 SF | ||||
| Loan Purpose: | Refinance | Cut-off Date Principal Balance Per SF: | $148.84 | ||||
| Borrower Name: | 88 Hamilton Avenue Associates, LLC | Year Built/Renovated: | 1940/2006 | ||||
| Sponsor: | John J. DiMenna, Jr. | Title Vesting: | Fee | ||||
| Mortgage Rate: | 4.500% | Property Manager: | Self-managed | ||||
| Note Date: | June 8, 2015 | 3rdMost Recent Occupancy (As of): | 100.0% (12/31/2012) | ||||
| Anticipated Repayment Date: | NAP | 2ndMost Recent Occupancy (As of): | 100.0% (12/31/2013) | ||||
| Maturity Date: | July 5, 2025 | Most Recent Occupancy (As of): | 100.0% (12/31/2014) | ||||
| IO Period: | 36 months | Current Occupancy (As of): | 100.0% (2/20/2015) | ||||
| Loan Term (Original): | 120 months | ||||||
| Seasoning: | 0 months | Underwriting and Financial Information: | |||||
| Amortization Term (Original): | 360 months | ||||||
| Loan Amortization Type: | Interest-only, Amortizing Balloon | 3rdMost Recent NOI (As of): | $2,125,673 (12/31/2012) | ||||
| Interest Accrual Method: | Actual/360 | 2ndMost Recent NOI (As of): | $2,188,131 (12/31/2013) | ||||
| Call Protection: | L(24),D(93),O(3) | Most Recent NOI (As of): | $2,219,024 (12/31/2014) | ||||
| Lockbox Type: | Hard/Springing Cash Management | ||||||
| Additional Debt: | None | ||||||
| Additional Debt Type: | NAP | ||||||
| U/W Revenues: | $2,767,191 | ||||||
| U/W Expenses: | $773,610 | ||||||
| U/W NOI: | $1,993,581 | ||||||
| Escrows and Reserves(1): | U/W NCF: | $1,893,134 | |||||
| U/W NOI DSCR: | 1.43x | ||||||
| Type: | Initial | Monthly | Cap (If Any) | U/W NCF DSCR: | 1.35x | ||
| Taxes | $190,259 | $27,180 | NAP | U/W NOI Debt Yield: | 8.7% | ||
| Insurance | $30,627 | $3,063 | NAP | U/W NCF Debt Yield: | 8.2% | ||
| Replacement Reserves | $0 | $1,932 | NAP | As-Is Appraised Value: | $32,500,000 | ||
| TI/LC Reserve | $0 | $6,439 | $309,066 | As-Is Appraisal Valuation Dates: | January 8, 2015 | ||
| Environmental Reserve | $391,250 | NAP | NAP | Cut-off Date LTV Ratio: | 70.8% | ||
| Deferred Maintenance | $625 | NAP | NAP | LTV Ratio at Maturity or ARD: | 62.0% | ||
| (1) | See “Escrows” section. |
The Mortgage Loan.The mortgage loan (the “88 Hamilton Avenue Mortgage Loan”) is evidenced by a single promissory note that is secured by a first mortgage encumbering a mixed-use office and industrial building located in Stamford, Connecticut (the “88 Hamilton Avenue Property”). The 88 Hamilton Avenue Mortgage Loan was originated on June 8, 2015 by Natixis Real Estate Capital LLC. The 88 Hamilton Avenue Mortgage Loan had an original principal balance of $23,000,000, has an outstanding principal balance as of the Cut-off Date of $23,000,000 and accrues interest at an interest rate of 4.500%per annum. The 88 Hamilton Avenue Mortgage Loan had an initial term of 120 months, has a remaining term of 120 months as of the Cut-off Date and requires interest-only payments for the first 36 payments following origination, and, thereafter, requires payments of principal and interest based on a 30-year amortization schedule. The 88 Hamilton Avenue Mortgage Loan matures on July 5, 2025.
Following the lockout period, the borrower has the right to defease the 88 Hamilton Avenue Mortgage Loan in whole or in part on any date before May 5, 2025. In addition, the 88 Hamilton Avenue Mortgage Loan is prepayable without penalty on or after May 5, 2025.
THE INFORMATION IN THIS STRUCTURAL AND COLLATERAL TERM SHEET IS NOT COMPLETE AND MAY BE AMENDED PRIOR TO THE TIME OF SALE. THIS TERM SHEET IS NOT AN OFFER TO SELL THESE SECURITIES AND IT IS NOT A SOLICITATION OF AN OFFER TO BUY THESE SECURITIES IN ANY JURISDICTION WHERE THE OFFER OR SALE IS NOT PERMITTED.
| 80 |
| 88 HAMILTON AVENUE |
Sources and Uses
| Sources | Uses | |||||||
| Original loan amount | $23,000,000 | 100.0% | Loan payoff | $20,068,129 | 87.3% | |||
| Closing costs | 1,152,112 | 5.0 | ||||||
| Reserves | 612,761 | 2.7 | ||||||
| Return of equity | 1,166,997 | 5.1 | ||||||
| Total Sources | $23,000,000 | 100.0% | Total Uses | $23,000,000 | 100.0% | |||
The Property.The 88 Hamilton Avenue Property is a class B mixed-use building comprising 154,533 square feet, located in Stamford, Connecticut. The 88 Hamilton Avenue Property is situated on a 9.5-acre site and was built in 1940 as a manufacturing building and was renovated into an office/warehouse property in 2006. The property consists of a one-story warehouse portion that comprises of 114,874 square feet (74.3% of net rentable area) and a two-story office portion that comprises of 39,659 square feet (25.7% of net rentable area). Amenities at the 88 Hamilton Avenue Property include an elevator in the office portion, five dock-high and five overhead doors (accessed in the rear of the 88 Hamilton Avenue Property), a guardhouse at the main entrance, a fire pump house with a fire suppression system and diesel fired engine, and approximately 200 surface parking spaces (equating to a parking ratio of 1.3 spacers per 1,000 square feet of net rentable area). Additionally, the Metro North Stamford station is located 1.7 miles southwest of the 88 Hamilton Avenue Property, for which shuttle service is provided. Historically, the 88 Hamilton Avenue Property has been 100.0% occupied since World Wrestling Entertainment took occupancy of the warehouse space in 2008. The largest tenant, Americares Foundation, Inc., originally took occupancy of 76,452 square feet at the 88 Hamilton Avenue Property in 2002 and 2003 and expanded by 15,007 square feet in 2008. As of February 20, 2015, the 88 Hamilton Avenue Property is 100.0% occupied by four tenants.
The following table presents certain information relating to the tenancy at the 88 Hamilton Avenue Property:
Major Tenants
| Tenant Name | Credit Rating (Fitch/Moody’s/ S&P) | Tenant NRSF | % of NRSF | Annual U/W Base Rent PSF(1) | Annual U/W Base | % of Total Annual U/W Base Rent | Lease Expiration Date |
| Major Tenants | |||||||
| Americares Foundation, Inc. | NR/NR/NR | 91,459 | 59.2% | $15.76 | $1,441,220 | 62.4% | 10/31/2023(2) |
| Retail Brand Alliance | NR/NR/NR | 41,481 | 26.8% | $13.00 | $539,290 | 23.3% | 9/30/2017 |
| World Wrestling Entertainment | NR/NR/NR | 16,859 | 10.9% | $17.09 | $288,092 | 12.5% | 9/30/2016 |
| The Squash Alley, LLC | NR/NR/NR | 4,734 | 3.1% | $9.00 | $42,606 | 1.8% | 9/30/2018(3) |
| Total Major Tenants | 154,533 | 100.0% | $14.96 | $2,311,208 | 100.0% | ||
| Occupied Collateral Total | 154,533 | 100.0% | $14.96 | $2,311,208 | 100.0% | ||
| Vacant Space | 0 | 0.0% | |||||
| Collateral Total | 154,533 | 100.0% | |||||
| (1) | Annual U/W Base Rent PSF and Annual U/W Base Rent include contractual rent steps through June 30, 2016, totaling $33,657. |
| (2) | Americares Foundation, Inc. has two five-year lease renewal options. |
| (3) | The Squash Alley, LLC has one five-year renewal option. |
THE INFORMATION IN THIS STRUCTURAL AND COLLATERAL TERM SHEET IS NOT COMPLETE AND MAY BE AMENDED PRIOR TO THE TIME OF SALE. THIS TERM SHEET IS NOT AN OFFER TO SELL THESE SECURITIES AND IT IS NOT A SOLICITATION OF AN OFFER TO BUY THESE SECURITIES IN ANY JURISDICTION WHERE THE OFFER OR SALE IS NOT PERMITTED.
| 81 |
| 88 HAMILTON AVENUE |
The following table presents certain information relating to the lease rollover schedule at the 88 Hamilton Avenue Property:
Lease Expiration Schedule(1)
Year Ending December 31, | No. of Leases Expiring | Expiring NRSF | % of Total NRSF | Cumulative Expiring NRSF | Cumulative % of Total NRSF | Annual U/W Base Rent | Annual U/W Base Rent PSF |
| MTM | 0 | 0 | 0.0% | 0 | 0.0% | $0 | $0.00 |
| 2015 | 0 | 0 | 0.0% | 0 | 0.0% | $0 | $0.00 |
| 2016 | 2 | 16,859 | 10.9% | 16,859 | 10.9% | $288,092 | $17.09 |
| 2017 | 1 | 41,481 | 26.8% | 58,340 | 37.8% | $539,290 | $13.00 |
| 2018 | 1 | 4,734 | 3.1% | 63,074 | 40.8% | $42,606 | $9.00 |
| 2019 | 0 | 0 | 0.0% | 63,074 | 40.8% | $0 | $0.00 |
| 2020 | 0 | 0 | 0.0% | 63,074 | 40.8% | $0 | $0.00 |
| 2021 | 0 | 0 | 0.0% | 63,074 | 40.8% | $0 | $0.00 |
| 2022 | 0 | 0 | 0.0% | 63,074 | 40.8% | $0 | $0.00 |
| 2023 | 4 | 91,459 | 59.2% | 154,533 | 100.0% | $1,441,220 | $15.76 |
| 2024 | 0 | 0 | 0.0% | 154,533 | 100.0% | $0 | $0.00 |
| 2025 | 0 | 0 | 0.0% | 154,533 | 100.0% | $0 | $0.00 |
| Thereafter | 0 | 0 | 0.0% | 154,533 | 100.0% | $0 | $0.00 |
| Vacant | 0 | 0 | 0.0% | 154,533 | 100.0% | $0 | $0.00 |
| Total/Weighted Average | 8 | 154,533 | 100.0% | $2,311,208 | $14.96 |
| (1) | Information obtained from the underwritten rent roll. |
The following table presents historical occupancy percentages at the 88 Hamilton Avenue Property:
Historical Occupancy
12/31/2012(1) | 12/31/2013(1) | 12/31/2014(1) | 2/20/2015(2) | |||
| 100.0% | 100.0% | 100.0% | 100.0% |
| (1) | Information obtained from the borrower. |
| (2) | Information obtained from the underwritten rent roll. |
THE INFORMATION IN THIS STRUCTURAL AND COLLATERAL TERM SHEET IS NOT COMPLETE AND MAY BE AMENDED PRIOR TO THE TIME OF SALE. THIS TERM SHEET IS NOT AN OFFER TO SELL THESE SECURITIES AND IT IS NOT A SOLICITATION OF AN OFFER TO BUY THESE SECURITIES IN ANY JURISDICTION WHERE THE OFFER OR SALE IS NOT PERMITTED.
| 82 |
| 88 HAMILTON AVENUE |
Operating History and Underwritten Net Cash Flow. The following table presents certain information relating to the historical operating performance and underwritten net cash flow at the 88 Hamilton Avenue Property:
Cash Flow Analysis
| 2012 | 2013 | 2014 | U/W | % of U/W Effective Gross Income | U/W $ per SF | ||||||||
| Base Rent | $2,134,012 | $2,182,940 | $2,258,065 | $2,311,212 | 83.5% | $14.96 | |||||||
| Grossed Up Vacant Space | 0 | 0 | 0 | 0 | 0.0 | 0.00 | |||||||
| Total Reimbursables | 515,632 | 789,164 | 772,840 | 601,621 | 21.7 | 3.89 | |||||||
| Other Income | 166,944 | 0 | 0 | 0 | 0.0 | 0.00 | |||||||
| Less Vacancy & Credit Loss | 0 | 0 | 0 | (145,642)(1) | (5.3) | (0.94) | |||||||
| Effective Gross Income | $2,816,588 | $2,972,104 | $3,030,905 | $2,767,191 | 100.0% | $17.91 | |||||||
| Total Operating Expenses | $690,915 | $783,973 | $811,881 | $773,610 | 28.0% | $5.01 | |||||||
| Net Operating Income | $2,125,673 | $2,188,131 | $2,219,024 | $1,993,581 | 72.0% | $12.90 | |||||||
| TI/LC | 0 | 0 | 0 | 77,267 | 2.8 | 0.50 | |||||||
| Capital Expenditures | 0 | 0 | 0 | 23,180 | 0.8 | 0.15 | |||||||
| Net Cash Flow | $2,125,673 | $2,188,131 | $2,219,024 | $1,893,134 | 68.4% | $12.25 | |||||||
| NOI DSCR | 1.52x | 1.56x | 1.59x | 1.43x | |||||||||
| NCF DSCR | 1.52x | 1.56x | 1.59x | 1.35x | |||||||||
| NOI DY | 9.2% | 9.5% | 9.6% | 8.7% | |||||||||
| NCF DY | 9.2% | 9.5% | 9.6% | 8.2% |
| (1) | The underwritten economic vacancy is 5.3%. The 88 Hamilton Avenue Property was 100.0% physically occupied as of February 20, 2015. |
Appraisal. As of the appraisal valuation date of January 8, 2015, the 88 Hamilton Avenue Property had an “as-is” appraised value of $32,500,000.
Environmental Matters. According to the Phase I environmental report dated June 3, 2015, the 88 Hamilton Avenue Property was used for various manufacturing purposes since the early 1920’s during which time soil contamination occurred. Multiple subsurface investigations and groundwater monitoring activities have been performed on the 88 Hamilton Avenue Property since 2001. Certain Areas of Concern (“AOCs”) have been investigated and remediated however, a few AOCs remain. The lender’s environmental consultant reviewed the 2013 summary of AOCs and the June 2015 cost of regulatory compliance memorandum prepared by a third party environmental consultant on behalf of the borrower. The third party environmental consultant estimated that the additional remediation cost will be approximately $313,000 in order for the 88 Hamilton Avenue Property to receive a No Further Action letter from a Licensed Environmental Professional for the site issues on behalf of the Connecticut Department of Energy and Environmental Protection. The remedial activities will include among others soil investigations, soil remediation, groundwater monitoring and placement of an Environmental Land Use Restriction. An upfront environmental reserve of $391,250, 125% of the recommended amount, was reserved at closing.
Market Overview and Competition.The 88 Hamilton Avenue Property is located in Stamford, Connecticut. Stamford is home to many national corporations including UBS, Royal Bank of Scotland, Thomson-Reuters, General Electric, and Sikorsky, who all have their corporate headquarters or a very large office presence in the area. Stamford hosts large corporate headquarters and regional offices due to its proximity to New York City (approximately 42.0 miles northeast) and significantly less expensive office rents than Manhattan.
According to the appraiser, Stamford is located within Fairfield County, wherein average household income is nearly double the United States’ average, and has over twice the number of households making more than $100,000 annually. The appraiser noted that the presence of interstate transportation arteries, the extensive coastline along the Long Island Sound, and the continuing storage/distribution needs of the surrounding retail market have driven demand for industrial development in Fairfield County.
According to a third party market research report, as of first quarter of 2015, the warehouse market in Stamford consisted of 366 buildings with 5.9 million square feet and was 5.1% vacant with average asking rents of $13.87 per square foot on a gross basis. Additionally, the same report indicated that the flex office market in Stamford consisted of 42 buildings with 2.3 million square feet and a vacancy rate of 13.2% with an average asking rent of $16.30 per square foot on a gross basis.
THE INFORMATION IN THIS STRUCTURAL AND COLLATERAL TERM SHEET IS NOT COMPLETE AND MAY BE AMENDED PRIOR TO THE TIME OF SALE. THIS TERM SHEET IS NOT AN OFFER TO SELL THESE SECURITIES AND IT IS NOT A SOLICITATION OF AN OFFER TO BUY THESE SECURITIES IN ANY JURISDICTION WHERE THE OFFER OR SALE IS NOT PERMITTED.
| 83 |
| 88 HAMILTON AVENUE |
The following table presents certain information relating to comparable office properties for the 88 Hamilton Avenue Property:
Competitive Set(1)
88 Hamilton (Subject) | 650 West Avenue | 64-70 Research Drive | 72 Camp Avenue | Washington Plaza | Stamford Square | 850 Canal Street | |
| Location | Stamford, CT | Stamford, CT | Stamford, CT | Stamford, CT | Stamford, CT | Stamford, CT | Stamford, CT |
| Distance from Subject | -- | 2.7 miles | 1.3 miles | 2.8 miles | 1.7 miles | 2.2 miles | 1.9 miles |
| Property Type | Mixed Use | Industrial | Warehouse | Industrial | Office | Office | Office |
| Year Built/Renovated | 1940/2006 | 1998 | 1970 | 1973 | NAV | NAV | NAV |
| Number of Stories | 2 | NAV | NAV | NAV | NAV | NAV | NAV |
| Total GLA | 154,533 SF | 60,057 SF | 18,700 SF | 33,800 SF | 219,216 SF | 281,554 SF | 66,000 SF |
| Total Occupancy | 100% | NAV | NAV | NAV | NAV | NAV | NAV |
| (1) | Information obtained from the appraisal and a third party market research report. |
The Borrower.The borrower is 88 Hamilton Avenue Associates, LLC, a Delaware limited liability company and single-purpose entity managed by John J. DiMenna, Jr., William Merritt, and Thomas Kelly, members of Seaboard Properties Inc. Legal counsel to the borrower delivered a non-consolidation opinion in connection with the origination of the 88 Hamilton Avenue Mortgage Loan. John J. DiMenna, Jr. is the guarantor of certain nonrecourse carveouts under the 88 Hamilton Avenue Mortgage Loan.
The Sponsor.The sponsor is John J. DiMenna, Jr., the president and chief executive officer of Seaboard Properties, Inc. (“Seaboard”). Seaboard is a real estate investment organization established in 1992 by John J. DiMenna, Jr. that is primarily focused on the Stamford real estate market. Seaboard has commercial real estate investments in excess of 1.5 million square feet. Additionally, Seaboard currently manages approximately 550,000 square feet of office properties and 350,000 square feet of luxury multifamily properties, primarily in Fairfield County, Connecticut. John J. DiMenna, Jr. has a net worth of $25.2 million and liquidity of $5.9 million as of February 20, 2015.
Escrows.The loan documents provide for upfront reserves in the amount of $190,259 for taxes, $30,627 for insurance, $625 for required repairs and $391,250 for environmental reserves. The loan documents require monthly deposits of one-twelfth of the estimated annual real estate taxes, which currently equates to $27,180, one-twelfth of the annual insurance premiums, which currently equates to $3,063, $1,932 for replacement reserves and $6,439 for tenant improvements and leasing commissions (“TI/LCs”) (subject to a cap of $309,066 and a minimum of $154,533).
Lockbox and Cash Management.The 88 Hamilton Avenue Mortgage Loan is structured with a lender-controlled hard lockbox and springing cash management. The 88 Hamilton Avenue Mortgage Loan requires all rents to be transmitted directly by tenants of the 88 Hamilton Avenue Property into the clearing account. Prior to the occurrence of a Cash Management Period (as defined below), all funds in the lockbox account are swept to the borrower’s operating account. Upon a Cash Management Period, all funds in the lockbox account will be swept to a lender-controlled cash management account.
A “Cash Management Period” will commence upon the occurrence of any of the following: (i) an event of default,(ii) the failure by the borrower, after the end of a calendar quarter, to maintain an amortizing debt service coverage ratio of at least 1.15x, (iii) the occurrence of a Major Tenant Trigger Event (as defined below) or (iv) the occurrence of a Major Tenant Renewal Trigger Event (as defined below). A Cash Management Period will end, with respect to clause (i) above, upon the cure of such event of default; with respect to clause (ii) above, upon the amortizing debt service coverage ratio being at least 1.20x for six consecutive months since the commencement of the Cash Management Period; with respect to clause (iii) above, upon the occurrence of a Major Tenant Trigger Cure Event (as defined below); or with respect to clause (iv) above, upon the occurrence of a Major Tenant Renewal Trigger Cure Event (as defined below).
A “Major Tenant Trigger Event” means any Major Tenant (defined as either Americares Foundation, Inc. or Retail Brand Alliance) (i) goes dark, (ii) is the subject of a bankruptcy action or (iii) is in material or monetary default under its lease beyond any applicable notice and/or cure period.
A “Major Tenant Renewal Trigger Event” means the earlier of (i) for Americares Foundation, Inc., the date that is 18 months prior to the expiration of such Americares Foundation, Inc.’s lease and regarding Retail Brand Alliance, the date that is six months prior to the expiration of such Retail Brand Alliance’s lease or (ii) the date upon which such Major Tenant must provide notice of its intent to renew its lease, unless prior to such date, such Major Tenant will have renewed its lease and no TI/LCs, free rent or other concessions are required pursuant to such renewal or the borrower has deposited amounts with the lender satisfactory to cover such expenses and/or free rent; provided, however, the borrower will have the right to prevent a Major Tenant Renewal Trigger Event by depositing into the TI/LC reserve an amount determined by the lender in its sole discretion to adequately cover contemplated approved leasing expenses associated with the applicable Major Tenant demised space.
A “Major Tenant Trigger Cure Event” means, with respect to a Major Tenant Trigger Event described in clause (i) of the definition of Major Tenant Trigger Event, such Major Tenant resumes operations in its leased premises at the 88 Hamilton Avenue Property; with respect to a Major Tenant Trigger Event described in clause (ii) of the definition of Major Tenant Trigger Event, such Major Tenant has affirmed and assumed its lease in the related bankruptcy proceeding; with respect to the first Major Tenant Trigger
THE INFORMATION IN THIS STRUCTURAL AND COLLATERAL TERM SHEET IS NOT COMPLETE AND MAY BE AMENDED PRIOR TO THE TIME OF SALE. THIS TERM SHEET IS NOT AN OFFER TO SELL THESE SECURITIES AND IT IS NOT A SOLICITATION OF AN OFFER TO BUY THESE SECURITIES IN ANY JURISDICTION WHERE THE OFFER OR SALE IS NOT PERMITTED.
| 84 |
| 88 HAMILTON AVENUE |
Event described in clause (iii) of the definition of Major Tenant Trigger Event, such lease default is cured and no other default has occurred under such lease; or with respect to any of clauses (i) to (iii) of the definition of Major Tenant Trigger Event, all of the space at the 88 Hamilton Avenue Property demised by such Major Tenant is re-tenanted and the lender receives an acceptable tenant estoppel from the related replacement tenant(s).
A “Major Tenant Renewal Trigger Cure Event” means the receipt of either (i) an acceptable tenant estoppel from the applicable Major Tenant if such Major Tenant has renewed its lease or executed a new lease for the same demised space or (ii) receipt of an acceptable tenant estoppel from replacement tenant(s) for the entire demised space.
Property Management. The 88 Hamilton Avenue Property is managed by an affiliate of the borrower.
Assumption. The borrower has the right to transfer the 88 Hamilton Avenue Property provided that certain conditions are satisfied, including (i) no event of default has occurred and is continuing; and (ii) the lender has reasonably determined that the proposed transferee and guarantor satisfy the lender’s credit review and underwriting standards, taking into consideration such transferee’s experience, financial strength and general business standing. The lender will have the right to approve or disapprove of the proposed transferee in its reasonable discretion, it being acknowledged that the lender may as a condition to approving any proposed transferee require a rating agency comfort letter from DBRS, KBRA and Moody’s that the transfer will not result in a downgrade, withdrawal or qualification of the respective ratings assigned to the Series 2015-NXS2 Certificates.
Partial Release. Not permitted.
Real Estate Substitution.Not permitted.
Subordinate and Mezzanine Indebtedness.Not permitted.
Ground Lease.None.
Terrorism Insurance. The loan documents provide that the required “all risk” insurance policy must include coverage for terrorism in an amount equal to the full replacement cost of the 88 Hamilton Avenue Property. The loan documents also require business interruption insurance covering no less than the 18-month period following the occurrence of a casualty event.
THE INFORMATION IN THIS STRUCTURAL AND COLLATERAL TERM SHEET IS NOT COMPLETE AND MAY BE AMENDED PRIOR TO THE TIME OF SALE. THIS TERM SHEET IS NOT AN OFFER TO SELL THESE SECURITIES AND IT IS NOT A SOLICITATION OF AN OFFER TO BUY THESE SECURITIES IN ANY JURISDICTION WHERE THE OFFER OR SALE IS NOT PERMITTED.
| 85 |
(THIS PAGE INTENTIONALLY LEFT BLANK)
THE INFORMATION IN THIS STRUCTURAL AND COLLATERAL TERM SHEET IS NOT COMPLETE AND MAY BE AMENDED PRIOR TO THE TIME OF SALE. THIS TERM SHEET IS NOT AN OFFER TO SELL THESE SECURITIES AND IT IS NOT A SOLICITATION OF AN OFFER TO BUY THESE SECURITIES IN ANY JURISDICTION WHERE THE OFFER OR SALE IS NOT PERMITTED.
| 86 |
| ROBINSON CROSSROADS |
THE INFORMATION IN THIS STRUCTURAL AND COLLATERAL TERM SHEET IS NOT COMPLETE AND MAY BE AMENDED PRIOR TO THE TIME OF SALE. THIS TERM SHEET IS NOT AN OFFER TO SELL THESE SECURITIES AND IT IS NOT A SOLICITATION OF AN OFFER TO BUY THESE SECURITIES IN ANY JURISDICTION WHERE THE OFFER OR SALE IS NOT PERMITTED.
| 87 |
| ROBINSON CROSSROADS |
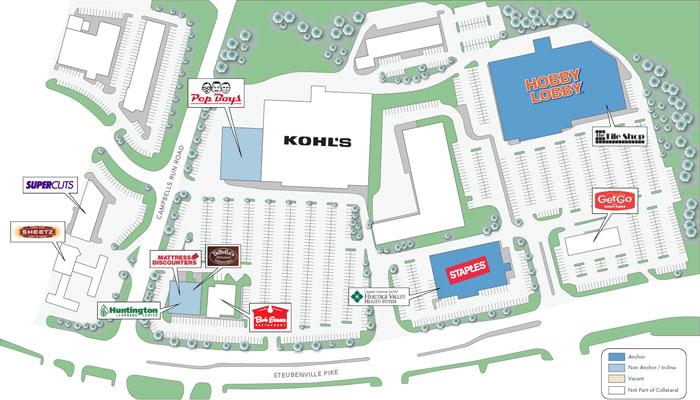
THE INFORMATION IN THIS STRUCTURAL AND COLLATERAL TERM SHEET IS NOT COMPLETE AND MAY BE AMENDED PRIOR TO THE TIME OF SALE. THIS TERM SHEET IS NOT AN OFFER TO SELL THESE SECURITIES AND IT IS NOT A SOLICITATION OF AN OFFER TO BUY THESE SECURITIES IN ANY JURISDICTION WHERE THE OFFER OR SALE IS NOT PERMITTED.
| 88 |
| ROBINSON CROSSROADS |

THE INFORMATION IN THIS STRUCTURAL AND COLLATERAL TERM SHEET IS NOT COMPLETE AND MAY BE AMENDED PRIOR TO THE TIME OF SALE. THIS TERM SHEET IS NOT AN OFFER TO SELL THESE SECURITIES AND IT IS NOT A SOLICITATION OF AN OFFER TO BUY THESE SECURITIES IN ANY JURISDICTION WHERE THE OFFER OR SALE IS NOT PERMITTED.
| 89 |
| No. 9 – Robinson Crossroads | ||||||||
| Loan Information | Property Information | |||||||
| Mortgage Loan Seller: | Silverpeak Real Estate Finance LLC | Single Asset/Portfolio: | Single Asset | |||||
Credit Assessment (DBRS/KBRA/Moody’s): | NR/NR/NR | Property Type: | Retail | |||||
| Original Principal Balance: | $23,000,000 | Specific Property Type: | Anchored | |||||
| Cut-off Date Principal Balance: | $22,971,720 | Location: | Robinson Township, PA | |||||
| % of Initial Pool Balance: | 2.5% | Size: | 139,034 SF | |||||
| Loan Purpose: | Refinance | Cut-off Date Principal Balance Per SF: | $165.22 | |||||
| Borrower Name: | Maria Associates | Year Built/Renovated: | 1997/NAP | |||||
| Sponsor: | Costa Land Company | Title Vesting: | Fee | |||||
| Mortgage Rate: | 4.875% | Property Manager: | Self-managed | |||||
| Note Date: | June 2, 2015 | 3rdMost Recent Occupancy (As of): | 100.0% (12/31/2012) | |||||
| Anticipated Repayment Date: | NAP | 2ndMost Recent Occupancy (As of): | 100.0% (12/31/2013) | |||||
| Maturity Date: | June 6, 2025 | Most Recent Occupancy (As of): | 100.0% (12/31/2014) | |||||
| IO Period: | 0 months | Current Occupancy (As of): | 100.0% (4/1/2015) | |||||
| Loan Term (Original): | 120 months | |||||||
| Seasoning: | 1 month | Underwriting and Financial Information: | ||||||
| Amortization Term (Original): | 360 months | |||||||
| Loan Amortization Type: | Amortizing Balloon | 3rdMost Recent NOI (As of): | $1,942,661 (12/31/2013) | |||||
| Interest Accrual Method: | Actual/360 | 2ndMost Recent NOI (As of): | $2,000,525 (12/31/2014) | |||||
| Call Protection: | L(25),D(92),O(3) | Most Recent NOI (As of) : | $2,126,905 (TTM 3/31/2015) | |||||
| Lockbox Type: | Hard/Springing Cash Management | |||||||
| Additional Debt: | None | |||||||
| Additional Debt Type: | NAP | U/W Revenues: | $2,861,458 | |||||
| U/W Expenses: | $851,726 | |||||||
| U/W NOI(2): | $2,009,731 | |||||||
| U/W NCF(2): | $1,931,872 | |||||||
| U/W NOI DSCR: | 1.38x | |||||||
| Escrows and Reserve(1): | U/W NCF DSCR: | 1.32x | ||||||
| U/W NOI Debt Yield: | 8.7% | |||||||
| Type: | Initial | Monthly | Cap (If Any) | U/W NCF Debt Yield: | 8.4% | |||
| Taxes | $257,099 | Springing | NAP | As-Is Appraised Value: | $31,400,000 | |||
| Insurance | $6,938 | $2,313 | NAP | As-Is Appraisal Valuation Date: | April 14, 2015 | |||
| Replacement Reserves | $0 | $2,317 | $111,227 | Cut-off Date LTV Ratio: | 73.2% | |||
| TI/LC Reserve | $30,000 | $4,172 | $250,261 | LTV Ratio at Maturity or ARD: | 60.0% | |||
| (1) | See “Escrows” section. |
| (2) | See “Cash Flow Analysis” section. |
The Mortgage Loan. The mortgage loan (the “Robinson Crossroads Mortgage Loan”) is evidenced by a single promissory note that is secured by a first mortgage encumbering the fee interest in a retail property located in Robinson Township, Pennsylvania (the “Robinson Crossroads Property”). The Robinson Crossroads Mortgage Loan was originated on June 2, 2015 by Silverpeak Real Estate Finance LLC. The Robinson Crossroads Mortgage Loan had an original principal balance of $23,000,000, has an outstanding principal balance as of the Cut-off Date of $22,971,720 and accrues interest at an interest rate of 4.875%per annum. The Robinson Crossroads Mortgage Loan had an initial term of 120 months, has a remaining term of 119 months as of the Cut-off Date and requires payments of principal and interest based on a 30-year amortization schedule. The Robinson Crossroads Mortgage Loan matures on June 6, 2025.
Following the lockout period, the borrower has the right to defease the Robinson Crossroads Mortgage Loan in whole, but not in part, on any date before April 6, 2025. In addition, the Robinson Crossroads Mortgage Loan is prepayable without penalty on or after April 6, 2025.
Sources and Uses
| Sources | Uses | |||||||
| Original loan amount | $23,000,000 | 100.0% | Loan payoff | $19,102,486 | 83.1% | |||
| Reserves | 294,037 | 1.3 | ||||||
| Closing costs | 283,717 | 1.2 | ||||||
| Return of equity | 3,319,761 | 14.4 | ||||||
| Total Sources | $23,000,000 | 100.0% | Total Uses | $23,000,000 | 100.0% |
THE INFORMATION IN THIS STRUCTURAL AND COLLATERAL TERM SHEET IS NOT COMPLETE AND MAY BE AMENDED PRIOR TO THE TIME OF SALE. THIS TERM SHEET IS NOT AN OFFER TO SELL THESE SECURITIES AND IT IS NOT A SOLICITATION OF AN OFFER TO BUY THESE SECURITIES IN ANY JURISDICTION WHERE THE OFFER OR SALE IS NOT PERMITTED.
| 90 |
| ROBINSON CROSSROADS |
The Property. The Robinson Crossroads Property comprises an anchored retail center with four one-story buildings of approximately 139,034 square feet of rentable area located in Robinson Township, Pennsylvania, which is approximately 15.0 miles west of Pittsburgh, Pennsylvania. The Robinson Crossroads Property was built in 1997 and is located off of Steubenville Pike, proximate to exit 60 off Interstate 376. The Robinson Crossroads Property was originally anchored by Giant Eagle, Inc. In 2009, Giant Eagle, Inc. physically vacated the Robinson Crossroads Property, but continues to be the tenant of record with two subleases in place to Hobby Lobby in approximately 62,000 square feet and Tile Shop in approximately 25,500 square feet. In August 2010, Giant Eagle, Inc. extended its lease until August 2026. Additional tenants include Staples, The Pep Boys, Heritage Valley Health System and Huntington Learning Center. The Robinson Crossroads Property contains 640 parking spaces, resulting in a parking ratio of 4.6 spaces per 1,000 square feet of rentable area. As of April 1, 2015, the Robinson Crossroads Property was 100.0% leased to seven tenants.
The following table presents certain information relating to the tenancy at the Robinson Crossroads Property:
Major Tenants
| Tenant Name | Credit Rating (Fitch/Moody’s/ S&P)(1) | Tenant NRSF | % of NRSF | Annual U/W Base Rent PSF(2) | Annual U/W Base Rent(2) | % of Total Annual U/W Base Rent | Sales PSF(3) | Occupancy Cost(3) | Lease Expiration Date | ||||||||||
| Anchor Tenants | |||||||||||||||||||
| Giant Eagle, Inc.(4) | NR/NR/NR | 87,519 | 62.9% | $15.20 | $1,330,289 | 61.3% | NAV | NAV | 8/31/2026(5) | ||||||||||
| Staples | BBB-/Baa2/BBB- | 16,465 | 11.8% | $12.75 | $209,929 | 9.7% | NAV | NAV | 11/30/2022(6) | ||||||||||
| Total Anchor Tenants | 103,984 | 74.8% | $14.81 | $1,540,218 | 71.0% | ||||||||||||||
| Major Tenants | |||||||||||||||||||
| The Pep Boys(7) | NR/NR/NR | 18,600(7) | 13.4%(7) | $9.66(7) | $179,685 | 8.3% | NAV | NAV | 10/31/2017(7) | ||||||||||
| Heritage Valley Health System | NR/NR/NR | 7,500 | 5.4% | $23.50 | $176,250 | 8.1% | NAV | NAV | 8/20/2022(8) | ||||||||||
| Huntington Learning Center | NR/NR/NR | 3,000 | 2.2% | $29.00 | $87,000 | 4.0% | NAV | NAV | 6/30/2017 | ||||||||||
| Total Major Tenants | 29,100 | 20.9% | $15.22 | $442,935 | 20.4% | ||||||||||||||
| Non-Major Tenants | 5,950 | 4.3% | $31.44 | $187,075 | 8.6% | ||||||||||||||
| Occupied Collateral Total(9) | 139,034 | 100.0% | $15.61 | $2,170,228 | 100.0% | ||||||||||||||
| Vacant Space | 0 | 0.0% | |||||||||||||||||
| Collateral Total | 139,034 | 100.0% | |||||||||||||||||
| (1) | Certain ratings are those of the parent company whether or not the parent company guarantees the lease. |
| (2) | Annual U/W Base Rent PSF and Annual U/W Base Rent include contractual rent steps through June 2016 totaling $13,479. |
| (3) | Most tenants are not required to report sales figures under their respective leases. |
| (4) | Giant Eagle, Inc. vacated their space in 2009 and subleased to Hobby Lobby and Tile Shop. The sublease documents and terms are not available, but at the time of sublease, Giant Eagle, Inc. executed renewal options through 2026. |
| (5) | Giant Eagle, Inc. has five, 4-year renewal options. |
| (6) | Staples has three, 5-year renewal options. |
| (7) | The Pep Boys is on a ground lease and owns its own improvements. The Pep Boys has four, 5-year lease renewal options remaining. |
| (8) | Heritage Valley Health System has three, five-year renewal options. |
| (9) | Occupied Collateral Total square footage includes The Pep Boys lease, which is a ground lease. The Pep Boys, a service station, has four, five-year renewal options remaining. |
THE INFORMATION IN THIS STRUCTURAL AND COLLATERAL TERM SHEET IS NOT COMPLETE AND MAY BE AMENDED PRIOR TO THE TIME OF SALE. THIS TERM SHEET IS NOT AN OFFER TO SELL THESE SECURITIES AND IT IS NOT A SOLICITATION OF AN OFFER TO BUY THESE SECURITIES IN ANY JURISDICTION WHERE THE OFFER OR SALE IS NOT PERMITTED.
| 91 |
| ROBINSON CROSSROADS |
The following table presents certain information relating to the lease rollover schedule at the Robinson Crossroads Property:
Lease Expiration Schedule(1)(2)
| Year Ending December 31, | No. of Leases Expiring | Expiring NRSF | % of Total NRSF | Cumulative Expiring NRSF | Cumulative % of Total NRSF | Annual U/W Base Rent | Annual U/W Base Rent PSF |
| MTM | 0 | 0 | 0.0% | 0 | 0.0% | $0 | $0 |
| 2015 | 0 | 0 | 0.0% | 0 | 0.0% | $0 | $0 |
| 2016 | 0 | 0 | 0.0% | 0 | 0.0% | $0 | $0 |
| 2017 | 2 | 21,600 | 15.5% | 21,600 | 15.5% | $266,685 | $12.35 |
| 2018 | 1 | 2,957 | 2.1% | 24,557 | 17.7% | $97,285 | $32.90 |
| 2019 | 0 | 0 | 0.0% | 24,557 | 17.7% | $0 | $0 |
| 2020 | 0 | 0 | 0.0% | 24,557 | 17.7% | $0 | $0 |
| 2021 | 0 | 0 | 0.0% | 24,557 | 17.7% | $0 | $0 |
| 2022 | 2 | 23,965 | 17.2% | 48,522 | 34.9% | $386,179 | $16.11 |
| 2023 | 0 | 0 | 0.0% | 48,522 | 34.9% | $0 | $0 |
| 2024 | 0 | 0 | 0.0% | 48,522 | 34.9% | $0 | $0 |
| 2025 | 1 | 2,993 | 2.2% | 51,515 | 37.1% | $89,790 | $30.00 |
| Thereafter | 1 | 87,519 | 62.9% | 139,034 | 100.0% | $1,330,289 | $15.20 |
| Vacant | 0 | 0 | 0.0% | 139,034 | 100.0% | $0 | $0 |
| Total/Weighted Average | 7 | 139,034 | 100.0% | 2,170,228 | $15.61 |
| (1) | Information obtained from the underwritten rent roll. |
| (2) | Certain tenants may have lease termination options that are exercisable prior to the originally stated expiration date of the subject lease and are not considered in the Lease Expiration Schedule. |
The following table presents historical occupancy percentages at the Robinson Crossroads Property:
Historical Occupancy
12/31/2012(1) | 12/31/2013(1) | 12/31/2014(1) | 4/1/2015(2) | |||
| 100.0% | 100.0% | 100.0% | 100.0% | |||
| (1) Information obtained from the borrower. | ||||||
| (2) Information obtained from the underwritten rent roll. | ||||||
THE INFORMATION IN THIS STRUCTURAL AND COLLATERAL TERM SHEET IS NOT COMPLETE AND MAY BE AMENDED PRIOR TO THE TIME OF SALE. THIS TERM SHEET IS NOT AN OFFER TO SELL THESE SECURITIES AND IT IS NOT A SOLICITATION OF AN OFFER TO BUY THESE SECURITIES IN ANY JURISDICTION WHERE THE OFFER OR SALE IS NOT PERMITTED.
| 92 |
| ROBINSON CROSSROADS |
Operating History and Underwritten Net Cash Flow. The following table presents certain information relating to the historical operating performance and the underwritten net cash flow at the Robinson Crossroads Property:
Cash Flow Analysis
| 2012 | 2013 | 2014 | U/W |
% of U/W | U/W $ per SF | |||||||
| Base Rent | $2,021,274 | $2,129,540 | $2,156,749 | $2,170,228(1) | 75.8% | $15.61 | ||||||
| Grossed Up Vacant Space | 0 | 0 | 0 | 0 | 0.0 | 0.00 | ||||||
| Total Reimbursables | 879,276 | 827,015 | 837,955 | 841,833 | 29.4 | 6.05 | ||||||
| Other Income | 0 | 0 | 0 | 0 | 0.0 | 0.00 | ||||||
| Less Vacancy & Credit Loss | 0 | 0 | 0 | (150,603)(2) | (5.3) | (1.08) | ||||||
| Effective Gross Income | $2,900,551 | $2,956,555 | $2,994,704 | $2,861,458 | 100.0% | $20.58 | ||||||
| Total Operating Expenses | $1,022,399 | $1,013,895 | $994,178 | $851,726 | 29.8% | $6.13 | ||||||
| Net Operating Income | $1,878,152 | $1,942,661 | $2,000,525 | $2,009,731 | 70.2% | $14.45 | ||||||
| TI/LC | 0 | 0 | 0 | 50,052 | 1.7 | 0.36 | ||||||
| Reserves for Replacements | 0 | 0 | 0 | 27,807 | 1.0 | 0.20 | ||||||
| Net Cash Flow | $1,878,152 | $1,942,661 | $2,000,525 | $1,931,872 | 67.5% | $13.89 | ||||||
| NOI DSCR | 1.29x | 1.33x | 1.37x | 1.38x | ||||||||
| NCF DSCR | 1.29x | 1.33x | 1.37x | 1.32x | ||||||||
| NOI DY | 8.2% | 8.5% | 8.7% | 8.7% | ||||||||
| NCF DY | 8.2% | 8.5% | 8.7% | 8.4% |
| (1) | U/W Base Rent includes contractual rent increases through June 2016 totaling approximately $13,479. |
| (2) | The underwritten economic vacancy is 5.0%. The Robinson Crossroads Property was 100.0% physically occupied as of April 1, 2015. |
Appraisal. As of the appraisal valuation date of April 14, 2015, the Robinson Crossroads Property had an “as-is” appraised value of $31,400,000.
Environmental Matters. According to a Phase I environmental report dated April 15, 2015, there was no evidence of any recognized environmental conditions at the Robinson Crossroads Property.
Market Overview and Competition. The Robinson Crossroads Property is located in Robinson Township, approximately 15.0 miles west of Pittsburgh, Pennsylvania. The Robinson Crossroads Property is located about halfway between downtown Pittsburgh and the Pittsburgh International Airport. Robinson Crossroads is known as a retail hub in the greater Pittsburgh area. The primary trade area of the Robinson Crossroads Property is considered to be an approximate five mile radius. Current population in the primary trade area is 80,249 people and 35,194 households, which are projected to grow annually 0.6% and 0.6%, respectively, over the next five years. Average household income and median household income within the primary trade area is $80,861 and $60,994, respectively.
The Robinson Crossroads Property is located in the Pittsburgh retail market. According to the appraisal, the market has 135.7 million square feet of retail inventory, with 126,894 square feet under construction. The Pittsburgh retail market exhibits average asking rents of $12.20 per square foot triple-net and an average vacancy rate of 7.7% as of year-end 2014. The Robinson Crossroads Property is located in the Parkway West submarket, which has 6.6 million square feet of retail space, and no new inventory under construction. According to the appraisal, as of year-end 2014, rents averaged $12.46 per square foot triple-net with a vacancy rate of approximately 2.8%. Additional retail centers in the Parkway West submarket include The Mall at Robinson (super-regional mall anchored by Dick’s, JCPenney, Macy’s, and Sears), Robinson Town Centre (anchored by IKEA, Marshall’s, JoAnn Fabrics, TJ Maxx), The Pointe at North Fayette (anchored by Target, Walmart, Sam’s Club), and Settlers Ridge (anchored by Barnes & Noble, Cinemark Theaters, Giant Eagle Market District, LA Fitness, REI).
THE INFORMATION IN THIS STRUCTURAL AND COLLATERAL TERM SHEET IS NOT COMPLETE AND MAY BE AMENDED PRIOR TO THE TIME OF SALE. THIS TERM SHEET IS NOT AN OFFER TO SELL THESE SECURITIES AND IT IS NOT A SOLICITATION OF AN OFFER TO BUY THESE SECURITIES IN ANY JURISDICTION WHERE THE OFFER OR SALE IS NOT PERMITTED.
| 93 |
| ROBINSON CROSSROADS |
The following table presents certain information relating to some comparable retail properties for the Robinson Crossroads Property:
Competitive Set(1)
| Robinson Crossroads (Subject) | Plaza at Robinson Towne Center | 5470 Campbells Run Road - Phase II | Heritage Square | Settlers Ridge Center | Montour Church Place | |
| Market | Robinson Crossroads, PA | Robinson Crossroads, PA | Pittsburgh, PA | Pittsburgh, PA | Pittsburgh, PA | North Fayette, PA |
| Distance from Subject | -- | 0.3 miles | 0.3 miles | 0.4 miles | 1.2 miles | 1.3 miles |
| Property Type | Neighborhood / Community center | Power Center | Neighborhood / Community center | Un-Anchored Retail Strip | Power Center | Shadow-Anchored Retail Strip |
| Year Built | 1997 | 1989 | 2006 | 2008 | 2009 | 2000 |
| Anchors | Hobby Lobby, Tile Shop, and Staples | Jo-ann Stores, Marshalls, TJ Maxx and Value City Furniture | Anytime Fitness | NAP | Barnes & Noble, Cinemark Theaters, Giant Eagle Market District, LA Fitness, and REI | Pier One |
| Total GLA | 139,034 | 457,231 | 15,400 | 15,738 | 513,169 | 56,396 |
| Total Occupancy | 100% | 94% | 83% | 86% | 100% | 100% |
| (1) | Information obtained from the appraisal. |
The Borrower. The borrower is Maria Associates, a Pennsylvania limited partnership and single purpose entity with two independent directors. Legal counsel to the borrower delivered a non-consolidation opinion in connection with the origination of the Robinson Crossroads Mortgage Loan. The general partner of the borrower is Maria Land Company, Inc., which is controlled and wholly-owned by Alfonso A. Costa. Alfonso A. Costa is the guarantor of certain nonrecourse carveouts under the Robinson Crossroads Mortgage Loan.
The Sponsor. The sponsor is Costa Land Company. In 1990, Alfonso A. Costa founded the Costa Land Company, which is a real estate development, management, and investment company that owns 16 properties in Pennsylvania, New York City, South Carolina, Florida, and Italy, totaling over one million square feet of commercial, retail, and office space.
Escrows. The loan documents provide for upfront reserves in the amount of $257,099 for taxes, $6,938 for insurance premiums and $30,000 for tenant improvements owed in relation to the Dibella’s Old Fashioned Submarines, Inc. lease.
Ongoing monthly reserves are required in an amount equal to $2,313 for insurance premiums, $2,317 for replacement reserves (subject to a cap of $111,227), and $4,172 for tenant improvements and leasing commissions (subject to a cap of $250,261 excluding the upfront reserve). The loan documents do not require monthly escrows for real estate taxes provided that (i) there is no continuing Cash Management Period (as defined below); (ii) the borrower provides evidence of the timely payment of real estate taxes; (iii) and the borrower maintains on deposit with the lender an amount equivalent to the largest of the tri-annual tax payments.
Lockbox and Cash Management. The Robinson Crossroads Mortgage Loan requires a lender-controlled lockbox account, which is already in place and that the borrower or property manager directs tenants to pay their rents directly into such lockbox account. The loan documents also require that all cash revenues and all other monies received by the borrower or the property manager be deposited into the lockbox account within one business day after receipt. Prior to the occurrence of a Cash Management Period, all funds on deposit in the lockbox account shall be transferred to the borrower within one business day. Upon the occurrence and continuance of a Cash Management Period (as defined below), the funds in the lockbox account shall be transferred to a lender-controlled cash management account.
A “Cash Management Period” will commence upon the earlier of (i) the occurrence and continuance of an event of default, (ii) the amortizing debt service coverage ratio being less than 1.15x at the end of any calendar quarter or (iii) the commencement of a Lease Sweep Period (as defined below). A Cash Management Period will be cured with regard to clause (i) when such event of default has been cured; with regard to clause (ii) when the amortizing debt service coverage ratio is greater than or equal to 1.15x for two consecutive calendar quarters; and with regard to clause (iii), upon the termination of a Lease Sweep Period.
A “Lease Sweep Period” will commence upon the occurrence of any of the following: (i) the date eight calendar months prior to the expiration of the term of the Staple’s lease, (ii) the date twelve calendar months prior to the expiration of the term of any other lease with a Major Tenant (as defined below), provided, as it pertains solely to The Pep Boys lease, a Lease Sweep Period shall not commence under this item (ii) to the extent as of the dates which are thirteen months and twelve months prior to the expiration of such lease, the amount on deposit in tenant improvements and leasing commissions reserve is equal to or greater than $250,261 or as of the date which is twelve calendar months prior to the expiration of the term of The Pep Boys lease, the borrower deposits cash or a letter of credit in the amount of $125,000, (iii) the date on which any Major Tenant is required to give notice of its exercise of a renewal option under the related lease and such renewal has not been so exercised, (iv) any Major Lease (or material portion thereof) being surrendered, cancelled or terminated prior to its then current expiration date, (v) the date on which any Major Tenant has vacated its space, goes dark or gives notice of its intent to discontinue its business, (vi) the occurrence and continuance of a default by a Major Tenant under its lease or (vii) a Major Tenant is subject to a bankruptcy proceeding. A Lease Sweep Period will
THE INFORMATION IN THIS STRUCTURAL AND COLLATERAL TERM SHEET IS NOT COMPLETE AND MAY BE AMENDED PRIOR TO THE TIME OF SALE. THIS TERM SHEET IS NOT AN OFFER TO SELL THESE SECURITIES AND IT IS NOT A SOLICITATION OF AN OFFER TO BUY THESE SECURITIES IN ANY JURISDICTION WHERE THE OFFER OR SALE IS NOT PERMITTED.
| 94 |
| ROBINSON CROSSROADS |
end (a) to the extent the Major Tenant under the Giant Eagle lease goes dark or gives notice of its intent to discontinue its business, once cash or a letter of credit in the amount of $2,670,000 is deposited with the lender, (b) with respect to clauses (i) – (v), upon the earlier to occur of (1) the applicable Major Tenant renews or extends its lease with sufficient funds on deposit to pay any applicable tenant improvements and leasing commissions or (2) the space occupied by such Major Lease (as defined below) being fully released at no less than market rent and all applicable tenant improvements and leasing commissions being paid provided, in each case, no default exists under a lease with a Major Tenant for a period of six consecutive months, (c) with respect to clause (vi), when the applicable default by the Major Tenant has been cured or (d) with respect to clause (vii), when the applicable bankruptcy has terminated or the applicable lease has been affirmed, assumed or assigned.
A “Major Tenant” is defined as any tenant under the Staple’s lease, the Giant Eagle, Inc. lease (or the related subleases), The Pep Boys lease or any other lease for at least 15,000 rentable square feet.
Property Management. The Robinson Crossroads Property is managed by an affiliate of the borrower.
Assumption. The borrower has a right to transfer the Robinson Crossroads Property provided that certain conditions are satisfied, including (i) no event of default has occurred and is continuing; (ii) the lender reasonably determines that the proposed transferee and guarantor satisfy the lender’s credit review and underwriting standards, taking into consideration transferee experience, financial strength and general business standing; and (iii) the lender has received confirmation from DBRS, KBRA and Moody’s that such assumption will not result in a downgrade, withdrawal or qualification of the respective ratings assigned to the Series 2015-NXS2 Certificates.
Partial Release. Not permitted.
Real Estate Substitution. Not permitted.
Subordinate and Mezzanine Indebtedness.Not permitted.
Ground Lease. None
Terrorism Insurance. The loan documents require that the “all-risk” insurance policy required to be maintained by the borrower provides coverage for terrorism in an amount equal to the full replacement cost of the Robinson Crossroads Property, as well as business interruption insurance covering no less than the 12-month period following the occurrence of a casualty event.
THE INFORMATION IN THIS STRUCTURAL AND COLLATERAL TERM SHEET IS NOT COMPLETE AND MAY BE AMENDED PRIOR TO THE TIME OF SALE. THIS TERM SHEET IS NOT AN OFFER TO SELL THESE SECURITIES AND IT IS NOT A SOLICITATION OF AN OFFER TO BUY THESE SECURITIES IN ANY JURISDICTION WHERE THE OFFER OR SALE IS NOT PERMITTED.
| 95 |
| COLMAN BUILDING |
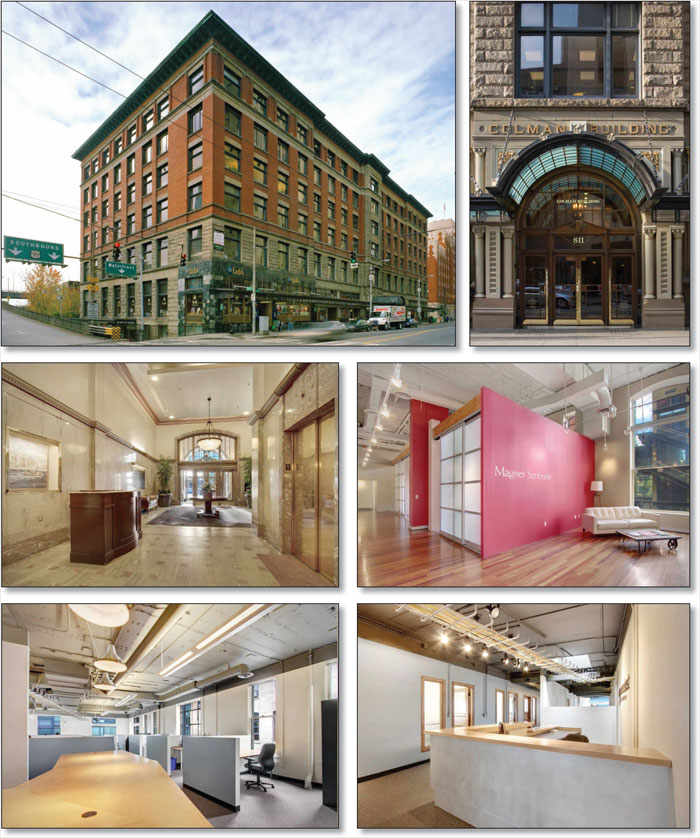
THE INFORMATION IN THIS STRUCTURAL AND COLLATERAL TERM SHEET IS NOT COMPLETE AND MAY BE AMENDED PRIOR TO THE TIME OF SALE. THIS TERM SHEET IS NOT AN OFFER TO SELL THESE SECURITIES AND IT IS NOT A SOLICITATION OF AN OFFER TO BUY THESE SECURITIES IN ANY JURISDICTION WHERE THE OFFER OR SALE IS NOT PERMITTED.
| 96 |
| COLMAN BUILDING |
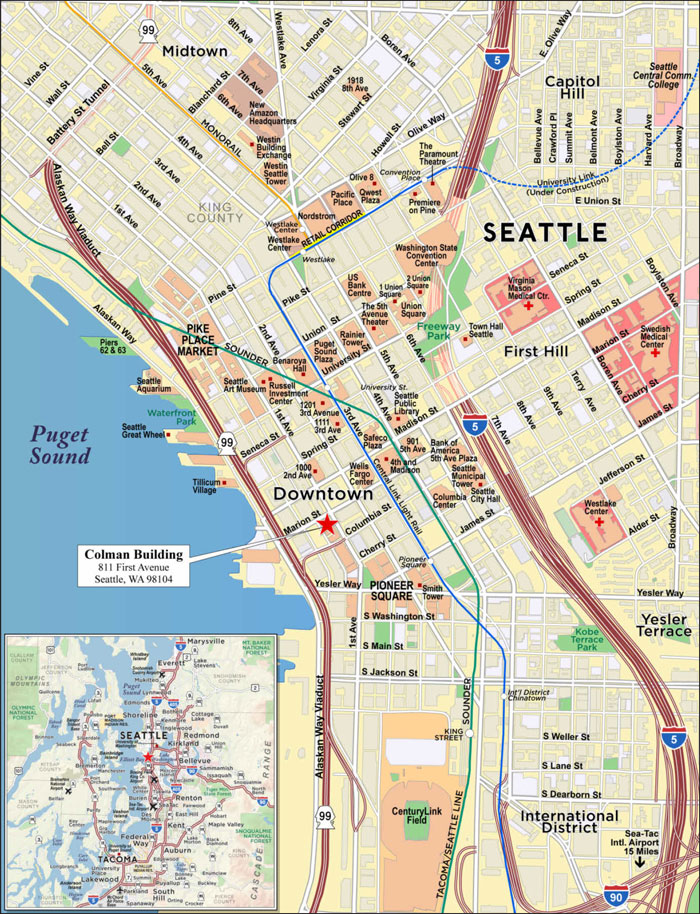
THE INFORMATION IN THIS STRUCTURAL AND COLLATERAL TERM SHEET IS NOT COMPLETE AND MAY BE AMENDED PRIOR TO THE TIME OF SALE. THIS TERM SHEET IS NOT AN OFFER TO SELL THESE SECURITIES AND IT IS NOT A SOLICITATION OF AN OFFER TO BUY THESE SECURITIES IN ANY JURISDICTION WHERE THE OFFER OR SALE IS NOT PERMITTED.
| 97 |
| No. 10 – Colman Building | ||||||
| Loan Information | Property Information | |||||
| Mortgage Loan Seller: | Natixis Real Estate Capital LLC | Single Asset/Portfolio: | Single Asset | |||
| Credit Assessment (DBRS/KBRA/Moody’s): | NR/NR/NR | Property Type: | Mixed Use | |||
| Original Principal Balance: | $22,400,000 | Specific Property Type: | Office/Retail | |||
| Cut-off Date Principal Balance: | $22,400,000 | Location: | Seattle, WA | |||
| % of Initial Pool Balance: | 2.4% | Size: | 145,188 SF | |||
| Loan Purpose: | Refinance | Cut-off Date Principal Balance Per SF: | $154.28 | |||
| Borrower Name: | Colman Properties Limited Partnership | Year Built/Renovated: | 1900/2014 | |||
| Sponsors: | John A. Goodman | Title Vesting: | Fee | |||
| Mortgage Rate: | 4.200% | Property Manager: | Self-managed | |||
| Note Date: | February 24, 2015 | 3rdMost Recent Occupancy (As of): | 91.0% (12/31/2012) | |||
| Anticipated Repayment Date: | NAP | 2ndMost Recent Occupancy (As of): | 91.5% (12/31/2013) | |||
| Maturity Date: | March 5, 2025 | Most Recent Occupancy (As of): | 94.0% (12/31/2014) | |||
| IO Period: | 120 months | Current Occupancy (As of): | 93.5% (6/1/2015) | |||
| Loan Term (Original): | 120 months | |||||
| Seasoning: | 4 months | Underwriting and Financial Information: | ||||
| Amortization Term (Original): | None | |||||
| Loan Amortization Type: | Interest-only, Balloon | 3rdMost Recent NOI (As of): | $1,851,955 (12/31/2012) | |||
| Interest Accrual Method: | Actual/360 | 2ndMost Recent NOI (As of): | $1,508,646 (12/31/2013) | |||
| Call Protection: | L(28),D(88),O(4) | Most Recent NOI (As of): | $1,621,161 (12/31/2014) | |||
| Lockbox Type: | Springing (Without Established Account) | |||||
| Additional Debt: | None | |||||
| Additional Debt Type: | NAP | |||||
| U/W Revenues(2): | $3,403,616 | |||||
| U/W Expenses: | $1,458,075 | |||||
| U/W NOI(2): | $1,945,541 | |||||
| U/W NCF(2): | $1,769,860 | |||||
| Escrows and Reserves(1): | U/W NOI DSCR(2): | 2.03x | ||||
| U/W NCF DSCR(2): | 1.85x | |||||
| Type: | Initial | Monthly | Cap (If Any) | U/W NOI Debt Yield(2): | 8.7% | |
| Taxes | $76,755 | $15,351 | NAP | U/W NCF Debt Yield(2): | 7.9% | |
| Insurance | $119,808 | $11,981 | NAP | As-Is Appraised Value: | $34,000,000 | |
| Replacement Reserves | $65,322 | Springing | $65,322 | As-Is Appraisal Valuation Date: | December 19, 2014 | |
| TI/LC Reserve | $200,000 | Springing | $200,000 | Cut-off Date LTV Ratio: | 65.9% | |
| Outstanding TI Reserve | $22,004 | NAP | NAP | LTV Ratio at Maturity or ARD: | 65.9% | |
| (1) | See “Escrows” section. |
| (2) | See “Cash Flow Analysis” section. |
The Mortgage Loan.The mortgage loan (the “Colman Building Mortgage Loan”) is evidenced by a single promissory note that is secured by a first mortgage encumbering a mixed-use office and retail building located in Seattle, Washington (the “Colman Building Property”). The Colman Building Mortgage Loan was originated on February 24, 2015 by Natixis Real Estate Capital LLC. The Colman Building Mortgage Loan had an original principal balance of $22,400,000, has an outstanding principal balance as of the Cut-off Date of $22,400,000 and accrues interest at an interest rate of 4.200%per annum. The Colman Building Mortgage Loan had an initial term of 120 months, has a remaining term of 116 months as of the Cut-off Date and requires interest-only payments through the term of the Colman Building Mortgage Loan. The Colman Building Mortgage Loan matures on March 5, 2025.
Following the lockout period, the borrower has the right to defease the Colman Building Mortgage Loan in whole on any date before December 5, 2024. In addition, the Colman Building Mortgage Loan is prepayable without penalty on or after December 5, 2024.
THE INFORMATION IN THIS STRUCTURAL AND COLLATERAL TERM SHEET IS NOT COMPLETE AND MAY BE AMENDED PRIOR TO THE TIME OF SALE. THIS TERM SHEET IS NOT AN OFFER TO SELL THESE SECURITIES AND IT IS NOT A SOLICITATION OF AN OFFER TO BUY THESE SECURITIES IN ANY JURISDICTION WHERE THE OFFER OR SALE IS NOT PERMITTED.
| 98 |
| COLMAN BUILDING |
Sources and Uses
| Sources | Uses | |||||||
| Original loan amount | $22,400,000 | 100.0% | Loan payoff(1) | $14,000,000 | 62.5 | % | ||
| Closing costs | 1,050,279 | 4.7 | ||||||
| Reserves | 483,889 | 2.2 | ||||||
| Return of equity | 6,865,832 | 30.7 | ||||||
| Total Sources | $22,400,000 | 100.0% | Total Uses | $22,400,000 | 100.0 | % |
| (1) | The Colman Building Property was previously securitized in the GECMC 2005-C4 transaction. |
The Property.The Colman Building Property is a class B six-story office building with ground-floor retail, a basement, and a sub-basement comprising 145,188 square feet located on a 0.6-acre site in the central business district of Seattle, Washington. Amenities at the Colman Building Property include a marble lobby with high ceilings, three elevators and one service elevator, secure building access with 24-hour keycard access, on-site building management, complimentary notary service, a building conference room with high-speed internet access, audio-visual equipment, a catering kitchen, a bike room, showers and a walking bridge connecting to the Washington State Ferry. Onsite parking, which is not required per current zoning requirements, is not offered, but several parking lots and garages are located within one block of the Colman Building Property. The Colman Building Property was built in 1900 and is listed on the United States Register of Historical Places. The Colman Building Property has been preserved and renovated several times during the sponsor’s 18 years of ownership. Most recently, from 2010 through 2014, approximately $600,000 was spent on various capital improvement projects including new carpets, paint, roof coating, and décor upgrades. As of June 1, 2015, the Colman Building Property was 93.5% occupied by 58 tenants, with no single tenant occupying more than 6.0% of the net rentable area. The Colman Building Property features 28,776 square feet (19.8% of the net rentable area) of street level retail space which is 89.3% leased to 14 tenants.
The following table presents certain information relating to the tenancy at the Colman Building Property:
Major Tenants
| Tenant Name | Credit Rating (Fitch/Moody’s/ S&P) | Tenant NRSF | % of NRSF | Annual U/W Base Rent PSF(1) | Annual U/W Base Rent(1) | % of Total Annual U/W Base Rent | Lease Expiration Date | |||||||
| Major Tenants – Office | ||||||||||||||
| Make A Wish | NR/NR/NR | 8,209 | 5.7% | $23.43 | $192,357 | 6.0% | 4/30/2019 | |||||||
| Mimic Technologies, Inc. | NR/NR/NR | 7,002 | 4.8% | $25.63 | $179,427 | 5.6% | 7/31/2020(2) | |||||||
| PCS Structural Solutions | NR/NR/NR | 6,247 | 4.3% | $26.12 | $163,172 | 5.1% | 5/31/2018 | |||||||
| Clarity Health | NR/NR/NR | 6,862 | 4.7% | $23.00 | $157,826 | 5.0% | 9/30/2015 | |||||||
| Morse Best Incorporated | NR/NR/NR | 6,297 | 4.3% | $21.10 | $132,887 | 4.2% | 1/31/2017(3) | |||||||
| Total Major Tenants – Office | 34,617 | 23.8% | $23.85 | $825,669 | 25.9% | |||||||||
| Non-Major Tenants – Office(4) | 69,055 | 47.6% | $24.26(5) | 1,663,271 | 52.3% | |||||||||
| Total Occupied Collateral – Office | 103,672 | 71.4% | $24.13(5) | $ 2,488,940 | 78.2% | |||||||||
| Total Occupied Collateral – Retail | 25,693 | 17.7% | $22.61 | $580,967 | 18.3% | |||||||||
| Total Occupied Collateral – Storage(6) | 6,432 | 4.4% | $17.60 | $113,204 | 3.6% | |||||||||
|
| |||||||||||||
| Total Occupied Collateral | 135,797 | 93.5% | $23.53(5) | $3,183,111 | 100.0% | |||||||||
| Vacant Space – Office | 6,263 | 4.3% | ||||||||||||
| Vacant Space – Retail | 3,083 | 2.1% | ||||||||||||
| Vacant Space – Other | 45 | 0.0% | ||||||||||||
| Collateral Total | 145,188 | 100.0% | ||||||||||||
| (1) | Annual U/W Base Rent PSF and Annual U/W Base Rent include contractual rent steps through June 30, 2016 totaling $94,445. |
| (2) | On or after January 1, 2017, if Mimic Technologies, Inc. elects to expand by a minimum of 2,000 square feet and the sponsor is unable to accommodate such expansion within six months of Mimic Technologies, Inc.’s written notice, Mimic Technologies, Inc. may terminate its lease with 12 months’ written notice. |
| (3) | Morse Best Incorporated (doing business as Sappington) has one five-year renewal option. |
| (4) | The Non-Major Tenants’ Office square footage includes 505 square feet of conference room space. |
| (5) | Excludes conference room space of 505 square feet. |
| (6) | Three tenants (cell phone antenna) have no square footage but are included in the Annual U/W Base Rent. |
THE INFORMATION IN THIS STRUCTURAL AND COLLATERAL TERM SHEET IS NOT COMPLETE AND MAY BE AMENDED PRIOR TO THE TIME OF SALE. THIS TERM SHEET IS NOT AN OFFER TO SELL THESE SECURITIES AND IT IS NOT A SOLICITATION OF AN OFFER TO BUY THESE SECURITIES IN ANY JURISDICTION WHERE THE OFFER OR SALE IS NOT PERMITTED.
| 99 |
| COLMAN BUILDING |
The following table presents certain information relating to the lease rollover schedule at the Colman Building Property:
Lease Expiration Schedule(1)(2)
| Year Ending December 31, | No. of Leases Expiring | Expiring NRSF | % of Total NRSF | Cumulative Expiring NRSF | Cumulative % of Total NRSF | Annual U/W Base Rent | Annual U/W Base Rent PSF(4) | |
| MTM | 30 | 6,799 | 4.7% | 6,799 | 4.7% | $74,806 | $11.00 | |
| 2015(3) | 7 | 13,268 | 9.1% | 20,067 | 13.8% | $314,311 | $23.69 | |
| 2016(3) | 15 | 21,203 | 14.6% | 41,270 | 28.4% | $535,207 | $25.24 | |
| 2017 | 10 | 25,693 | 17.7% | 66,963 | 46.1% | $566,591 | $22.05 | |
| 2018 | 13 | 24,697 | 17.0% | 91,660 | 63.1% | $646,400 | $26.17 | |
| 2019 | 9 | 22,535 | 15.5% | 114,195 | 78.7% | $543,615 | $24.12 | |
| 2020 | 9 | 10,693 | 7.4% | 124,888 | 86.0% | $272,695 | $25.50 | |
| 2021 | 2 | 4,943 | 3.4% | 129,831 | 89.4% | $95,691 | $19.36 | |
| 2022 | 1 | 5,461 | 3.8% | 135,292 | 93.2% | $133,795 | $24.50 | |
| 2023 | 0 | 0 | 0.0% | 135,292 | 93.2% | $0 | $0.00 | |
| 2024 | 0 | 0 | 0.0% | 135,292 | 93.2% | $0 | $0.00 | |
| 2025 | 0 | 0 | 0.0% | 135,292 | 93.2% | $0 | $0.00 | |
| Thereafter | 0 | 505(5) | 0.3% | 135,797 | 93.5% | $0 | $0.00 | |
| Vacant | 0 | 9,391 | 6.5% | 145,188 | 100.0% | $0 | $0.00 | |
| Total/Weighted Average | 96 | 145,188 | 100.0% | $3,183,111 | $23.53 | |||
| (1) | Information obtained from the underwritten rent roll. |
| (2) | Certain tenants may have lease termination options that are exercisable prior to the originally stated expiration date of the subject lease and that are not considered in the Lease Expiration Schedule. |
| (3) | Three tenants have no square footage but are included in the Annual U/W Base Rent. |
| (4) | Weighted Average Annual U/W Base Rent PSF excludes vacant space and 505 square feet of conference room space. |
| (5) | There is no lease associated with the conference room. |
The following table presents historical occupancy percentages at the Colman Building Property:
Historical Occupancy
12/31/2012(1) | 12/31/2013(1) | 12/31/2014(1) | 6/1/2015(2) | |||
| 91.0% | 91.5% | 94.0% | 93.5% |
| (1) | Information obtained from the borrower. |
| (2) | Information obtained from the underwritten rent roll. |
THE INFORMATION IN THIS STRUCTURAL AND COLLATERAL TERM SHEET IS NOT COMPLETE AND MAY BE AMENDED PRIOR TO THE TIME OF SALE. THIS TERM SHEET IS NOT AN OFFER TO SELL THESE SECURITIES AND IT IS NOT A SOLICITATION OF AN OFFER TO BUY THESE SECURITIES IN ANY JURISDICTION WHERE THE OFFER OR SALE IS NOT PERMITTED.
| 100 |
| COLMAN BUILDING |
Operating History and Underwritten Net Cash Flow.The following table presents certain information relating to the historical operating performance and underwritten net cash flow at the Colman Building Property:
Cash Flow Analysis
| 2012 | 2013 | 2014 | U/W | % of U/W Effective Gross Income | U/W $ per SF | ||||||||
| Base Rent | $2,902,387(1) | $2,626,497(1) | $2,795,375(1)(2) | $3,183,111(2) | 93.5% | $21.93 | |||||||
| Grossed Up Vacant Space | 0 | 0 | 0 | 219,952 | 6.5 | 1.51 | |||||||
| Percentage Rent | 27,299 | 13,959 | 512 | 0 | 0.0 | 0.00 | |||||||
| Total Reimbursables | 232,623 | 189,790 | 254,262 | 220,505 | 6.5 | 1.52 | |||||||
| Other Income | 13,085 | (4,150) | 13,016 | 0 | 0.0 | 0.00 | |||||||
| Less Vacancy & Credit Loss | 0 | 0 | 0 | (219,952)(3) | (6.5) | (1.51) | |||||||
| Effective Gross Income | $3,175,394 | $2,826,096 | $3,063,165 | $3,403,616 | 100.0% | $23.44 | |||||||
| Total Operating Expenses | $1,323,439 | $1,317,450 | $1,442,003 | $1,458,075 | 42.8 | $10.04 | |||||||
|
|
|
|
|
| ||||||||
| Net Operating Income | $1,851,955 | $1,508,646 | $1,621,161 | $1,945,541 | 57.2% | $13.40 | |||||||
| TI/LC | 0 | 0 | 0 | 145,191 | 4.3 | 1.00 | |||||||
| Capital Expenditures | 0 | 0 | 0 | 30,490 | 0.9 | 0.21 | |||||||
| Net Cash Flow | $1,851,955 | $1,508,646 | $1,621,161 | $1,769,860 | 52.0% | $12.19 | |||||||
| NOI DSCR | 1.94x | 1.58x | 1.69x | 2.03x | |||||||||
| NCF DSCR | 1.94x | 1.58x | 1.69x | 1.85x | |||||||||
| NOI DY | 8.3% | 6.7% | 7.2% | 8.7% | |||||||||
| NCF DY | 8.3% | 6.7% | 7.2% | 7.9% |
| (1) | Base Rent decreased from 2012 to 2013 by approximately $2.00 per square foot after PND Engineers Inc. vacated its space totaling 8,456 square feet in March 2013. PND Engineers Inc. was paying above market rent of $43.20 per square foot. Base Rent increased from 2013 to 2014 by approximately $1.16 per square foot due to new leasing activity and renewals. |
| (2) | The increase in U/W Base Rent from 2014 is due to contractual rent steps through June 30, 2016, new leasing activity and renewals. U/W Base Rent includes contractual rent steps through June 30, 2016, totalling $94,445. |
| (3) | The underwritten economic vacancy is 6.5%. The Colman Building Property was 93.5% physically occupied as of June 1, 2015. |
Appraisal.As of the appraisal valuation date of December 19, 2014, the Colman Building Property had an “as-is” appraised value of $34,000,000.
Environmental Matters. According to the Phase I environmental report dated January 6, 2015, there was no evidence of any recognized environmental conditions at the Colman Building Property.
Market Overview and Competition.The Colman Building Property is located in the central business district of Seattle, Washington. The Seattle-Tacoma-Bellevue, Washington metropolitan statistical area is also home to the headquarters of eight global companies: Microsoft, Weyerhaeuser, Nordstrom, Costco Wholesale, Amazon.com, Paccar, Starbucks and Expeditors International of Washington. According to a third party research report, as of April 2015, the Seattle-Tacoma-Bellevue, WA metropolitan statistical area exhibited a 3.9% unemployment rate versus 5.5% in the state of Washington.
According to the appraisal, the Colman Building Property is located in the Pioneer Square submarket of the Seattle central business district, adjacent to Marion and Columbia streets and three blocks east of the Colman Dock and Pier 52, a commuter port for the Washington State Ferry. Pioneer Square was developed in 1852 and is the location of Seattle’s original downtown. Rebuilt after the Great Seattle Fire of 1889, the area is characterized by late nineteenth century brick and stone buildings. The area features one of the United States’ only surviving collections of Romanesque Revival style urban architecture and became a national historic district and a local preservation district in 1970. Ordinance and design guidelines are in place to help preserve the unique aesthetics of the 88-acre neighborhood and ensure sensitive rehabilitation of older buildings. The area’s character has attracted numerous cafes, boutiques, bars, clubs, and over three dozen art galleries. Seattle’s two major sport stadiums, Century Link Stadium (home of the Seattle Seahawks) and Safeco Field (home of the Seattle Mariners), are located in the neighboring district to the south.
According to the appraisal, as of the first quarter of 2015, the Pioneer Square office submarket reported average asking rents of $27.70 per square foot on a gross basis, with a 6.8% vacancy rate. As of the first quarter of 2015, the Pioneer Square retail submarket reported average asking rents of $17.65 per square foot on a gross basis, with a 3.5% vacancy rate. There are no new buildings under construction.
THE INFORMATION IN THIS STRUCTURAL AND COLLATERAL TERM SHEET IS NOT COMPLETE AND MAY BE AMENDED PRIOR TO THE TIME OF SALE. THIS TERM SHEET IS NOT AN OFFER TO SELL THESE SECURITIES AND IT IS NOT A SOLICITATION OF AN OFFER TO BUY THESE SECURITIES IN ANY JURISDICTION WHERE THE OFFER OR SALE IS NOT PERMITTED.
| 101 |
| COLMAN BUILDING |
The following table presents certain information relating to comparable office properties for the Colman Building Property:
Competitive Set(1)
Colman Building | Smith Tower | Grand Central on the Park | Court in the Square | |
| Location | Seattle, WA | Seattle, WA | Seattle, WA | Seattle, WA |
| Distance from Subject | -- | 0.2 miles | 0.2 miles | 0.5 miles |
| Property Type | Mixed Use | Mixed Use | Office | Office |
| Year Built/Renovated | 1900/2014 | 1914/NAV | 1904/NAV | 1900/NAV |
| Number of Stories | 6 | NAV | NAV | NAV |
| Total GLA | 145,188 SF | 256,481 | 75,881 SF | 71,280 SF |
| Total Occupancy | 94% | 91% | 97% | 93% |
| (1) Information obtained from the appraisal. | ||||
The Borrower.The borrower is Colman Properties Limited Partnership, a single purpose Washington limited partnership with one independent director. Legal counsel to the borrower delivered a non-consolidation opinion in connection with the origination of the Colman Building Mortgage Loan. Colman Properties Limited Partnership is managed and controlled by John A. Goodman. John A. Goodman is the guarantor of certain non-recourse carveouts under the Colman Building Mortgage Loan.
The Sponsor.The sponsor is John A. Goodman. John A. Goodman founded Goodman Real Estate (“GRE”) in 1980, and over the last 34 years, has built GRE into a diversified, privately held real estate investment company with holdings throughout the United States and Canada. Through its Seattle headquarters, GRE owns and operates a $2.5 billion portfolio comprising multifamily properties, hotels and resorts, office and retail buildings, land developments and structured investments. As of September 30, 2014, John A. Goodman had a certified net worth of $558.5 million, with a liquidity of $58.7 million. The sponsor is involved in pending litigation. See “Description of the Mortgage Pool-Litigation Considerations” in the Free Writing Prospectus.
Escrows.The loan documents provide for upfront reserves in the amount of $76,755 for real estate taxes, $119,808 for insurance, $65,322 for replacement reserves, $200,000 for tenant improvements and leasing commissions (“TI/LCs”) and $22,004 for outstanding tenant improvements. The loan documents require monthly deposits of one-twelfth of the estimated annual real estate taxes, which currently equates to $15,351 and one-twelfth of the annual insurance premiums, which currently equates to $11,981. If at any time during the term of the Colman Building Mortgage Loan, the replacement reserve balance falls below $32,661, the loan documents require monthly deposits of $2,540 (subject to a cap of $65,322). If at any time during the term of the loan, the TI/LC reserve balance falls below $100,000, the loan documents require monthly deposits of $12,097 (subject to a cap of $200,000).
Lockbox and Cash Management.During a Cash Management Period (as defined below), the borrower is required to establish a lender-controlled lockbox account. The loan documents require all rents to be deposited directly by tenants of the Colman Building Property into the lockbox account. The loan documents also require that all rents received by the borrower or the property manager be deposited into the lockbox account within one business day of receipt. All funds in the lockbox account will be swept to a lender-controlled cash management account. Prior to a Cash Management Period, all excess funds on deposit are disbursed to the borrower.
A “Cash Management Period” will commence upon the occurrence of any of the following: (i) an event of default or (ii) the failure by the borrower, after the end of a calendar quarter, to maintain an amortizing debt service coverage ratio of at least 1.25x. A Cash Management Period will end, with respect to clause (i) above, upon the cure of such event of default; and with respect to clause (ii) above, upon the amortizing debt service coverage ratio being at least 1.30x for six consecutive months since the commencement of the Cash Management Period.
Property Management. The Colman Building Property is managed by an affiliate of the borrower.
Assumption.The borrower has the right to transfer the Colman Building Property provided that certain conditions are satisfied, including (i) no event of default has occurred and is continuing; and (ii) the lender has reasonably determined that the proposed transferee and guarantor satisfy the lender’s credit review and underwriting standards, taking into consideration such transferee’s experience, financial strength and general business standing. The lender will have the right to approve or disapprove the proposed transferee in its reasonable discretion, it being acknowledged that the lender may, as a condition to approving any proposed transferee, require a rating agency comfort letter from DBRS, KBRA and Moody’s that the transfer will not result in a downgrade, withdrawal or qualification of the respective ratings assigned to the Series 2015-NXS2 Certificates.
Partial Release. Not permitted.
Real Estate Substitution.Not permitted.
Subordinate and Mezzanine Indebtedness.Not permitted.
Ground Lease.None.
THE INFORMATION IN THIS STRUCTURAL AND COLLATERAL TERM SHEET IS NOT COMPLETE AND MAY BE AMENDED PRIOR TO THE TIME OF SALE. THIS TERM SHEET IS NOT AN OFFER TO SELL THESE SECURITIES AND IT IS NOT A SOLICITATION OF AN OFFER TO BUY THESE SECURITIES IN ANY JURISDICTION WHERE THE OFFER OR SALE IS NOT PERMITTED.
| 102 |
| COLMAN BUILDING |
Terrorism Insurance. The loan documents provide that the required “all risk” insurance policy must include coverage for terrorism in an amount equal to the full replacement cost of the Colman Building Property. The loan documents also require business interruption insurance covering no less than the 18-month period following the occurrence of a casualty event.
Earthquake Insurance.A seismic report dated January 7, 2015 determined that the probable maximum loss at the Colman Building Property was 16.0%. Earthquake insurance is not required but is in-place.
THE INFORMATION IN THIS STRUCTURAL AND COLLATERAL TERM SHEET IS NOT COMPLETE AND MAY BE AMENDED PRIOR TO THE TIME OF SALE. THIS TERM SHEET IS NOT AN OFFER TO SELL THESE SECURITIES AND IT IS NOT A SOLICITATION OF AN OFFER TO BUY THESE SECURITIES IN ANY JURISDICTION WHERE THE OFFER OR SALE IS NOT PERMITTED.
| 103 |
| No. 11– Cooper’s Crossing | |||||||
| Loan Information | Property Information | ||||||
| Mortgage Loan Seller: | Silverpeak Real Estate Finance LLC | Single Asset/Portfolio: | Single Asset | ||||
| Credit Assessment (DBRS/KBRA/Moody’s): | NR/NR/NR | Property Type: | Multifamily | ||||
| Original Principal Balance(1): | $22,300,000 | Specific Property Type: | Garden | ||||
| Cut-off Date Principal Balance(1): | $22,300,000 | Location: | Landover Hills, MD | ||||
| % of Initial Pool Balance: | 2.4% | Size: | 727 Units | ||||
| Loan Purpose: | Acquisition | Cut-off Date Principal Balance Per Unit(1): | $60,523 | ||||
| Borrower Name: | Cooper’s Apartments LLC | Year Built/Renovated: | 1966/2008 | ||||
| Sponsors: | Vito Dragone III | Title Vesting: | Fee | ||||
| Mortgage Rate: | 4.974% | Property Manager: | GREP Atlantic, LLC | ||||
| Note Date: | February 27, 2015 | 3rdMost Recent Occupancy(2): | 68.3% (12/31/2012) | ||||
| Anticipated Repayment Date: | NAP | 2nd Most Recent Occupancy (As of)(2): | 83.4% (12/31/2013) | ||||
| Maturity Date: | March 6, 2020 | Most Recent Occupancy (As of): | 89.6% (12/31/2014) | ||||
| IO Period: | 24 months | Current Occupancy (As of): | 90.8% (4/8/2015) | ||||
| Loan Term (Original): | 60 months | ||||||
| Seasoning: | 4 months | Underwriting and Financial Information: | |||||
| Amortization Term (Original): | 360 months | ||||||
| Loan Amortization Type: | Interest-only, Amortizing Balloon | 3rdMost Recent NOI: | $3,646,336 (12/31/2013) | ||||
| Interest Accrual Method: | Actual/360 | 2ndMost Recent NOI (As of): | $3,918,947 (12/31/2014) | ||||
| Call Protection: | L(28),D(28),O(4) | Most Recent NOI (As of): | $4,147,193 (TTM 3/31/2015) | ||||
| Lockbox Type: | Soft/Upfront Cash Management | ||||||
| Additional Debt(1): | Yes | ||||||
| Additional Debt Type(1): | Pari Passu; Mezzanine | U/W Revenues: | $9,200,442 | ||||
| U/W Expenses: | $4,851,539 | ||||||
| U/W NOI: | $4,348,902 | ||||||
| U/W NCF: | $4,124,986 | ||||||
| U/W NOI DSCR(1): | 1.54x | ||||||
| Escrows and Reserves: | U/W NCF DSCR(1): | 1.46x | |||||
| U/W NOI Debt Yield(1): | 9.9% | ||||||
| Type: | Initial | Monthly | Cap (If Any) | U/W NCF Debt Yield(1): | 9.4% | ||
| Taxes | $519,863 | $57,763 | NAP | As-Is Appraised Value: | $68,100,000 | ||
| Insurance | $21.600 | $21,600 | NAP | As-Is Appraisal Valuation Date: | February 3, 2015 | ||
| Replacement Reserves | $2,007,191 | $18,660 | NAP | Cut-off Date LTV Ratio(1): | 64.6% | ||
| Deferred Maintenance | $490,600 | NAP | NAP | LTV Ratio at Maturity or ARD(1): | 61.7% | ||
| (1) | The Cooper’s Crossing Loan Combination, totaling $44,000,000, is comprised of two pari passu notes (Notes A-1 and A-2). The controlling Note A-1 had an original principal balance of $22,300,000, has an outstanding principal balance of $22,300,000 as of the Cut-off Date and will be contributed to the WFCM 2015-NXS2 Trust. The non-controlling Note A-2 had an original principal balance of $21,700,000, has an outstanding principal balance of $21,700,000 as of the Cut-off Date and is currently held by an affiliate of Silverpeak Real Estate Finance LLC (although Silverpeak Real Estate Finance LLC reserves the right to reapportion the balance or sub-divide such note) and is expected to be securitized in a future transaction. All statistical financial information related to balances per unit, loan-to-value ratios, debt service coverage ratios and debt yields are based on the Cooper’s Crossing Loan Combination. See also “Description of the Mortgage Pool— Loan Combinations—The Cooper’s Crossing Loan Combination” in the Free Writing Prospectus. As of the Cut-off Date, the combined U/W NCF DSCR (based on the current interest rate of 9.50%), combined Cut-off Date LTV Ratio and combined U/W NCF Debt Yield are 0.86x, 94.3% and 6.4%, respectively. See “Subordinate and Mezzanine Indebtedness” section. |
| (2) | See “Historical Occupancy” section. |
The Cooper’s Crossing mortgage loan is part of a loan combination that is evidenced by two pari passu promissory notes (Notes A-1 and A-2) secured by a first mortgage encumbering a 727-unit garden-style multifamily property, located in Landover Hills, Maryland (the “Cooper’s Crossing Property”). The Cooper’s Crossing Property consists of 25, three- and four-story buildings constructed in 1966 and renovated in 2008. Amenities include a clubhouse, a swimming pool, a fully-equipped business center, a fitness center, and three playgrounds. The Cooper’s Crossing Property is comprised of one, two, and three bedroom units. Each unit contains standard kitchen appliances, including a frost-free refrigerator, a gas or electric range/oven, and garbage disposal. The Cooper’s Crossing Property has frontage along the east side of Cooper Lane, the north and south sides of Warner Avenue, the east and west sides of Alliston Street, and the south side of 68th Place. Major regional roadways include Interstates 95, 295 and 495 (Capital Beltway). Access to the Capital Beltway (I-495) is located approximately two miles east via Annapolis Road (Route 450). Interstate 295 provides north-south access through the eastern part of the Washington, DC metropolitan area into Baltimore, Maryland. There are 1,178 surface parking spaces resulting in a parking ratio of 1.6 spaces per unit. As of April 8, 2015, the Cooper’s Crossing Property was 90.8% occupied.
THE INFORMATION IN THIS STRUCTURAL AND COLLATERAL TERM SHEET IS NOT COMPLETE AND MAY BE AMENDED PRIOR TO THE TIME OF SALE. THIS TERM SHEET IS NOT AN OFFER TO SELL THESE SECURITIES AND IT IS NOT A SOLICITATION OF AN OFFER TO BUY THESE SECURITIES IN ANY JURISDICTION WHERE THE OFFER OR SALE IS NOT PERMITTED.
| 104 |
| COOPER’S CROSSING |
Subordinate and Mezzanine Indebtedness. A mezzanine loan of $20,237,082 was funded at closing. The mezzanine loan is coterminous with the Cooper’s Crossing Loan Combination and is subject to an intercreditor agreement. The mezzanine loan is comprised of an initial advance of $20,237,082 and future advances of up to $9,612,918, which funds may be used for mezzanine lender approved capital expenses during the first two years of the term of the Cooper’s Crossing Loan Combination. The mezzanine loan may have a maximum loan balance of $29,850,000. The mezzanine loan accrues interest at a rate of 14.0%per annum, of which interest accrued at 9.50%per annum is paid on a current basis to the extent cash flow is available (with the remaining interest accruing) and interest accrued at 4.50%per annum, which is paid at maturity, if cash flow is available. The mezzanine loan contains a partial equity participation to be paid after repayment of the Cooper’s Crossing Loan Combination, mezzanine loan (inclusive of accrued interest) and certain proceeds to the borrower. In addition, the mezzanine loan agreement has a debt service coverage ratio covenant of 0.72x. If the debt service coverage ratio falls below 0.72x, it constitutes an event of default under the mezzanine loan agreement, which can be cured with a pay down of the mezzanine loan that results in a 0.72x debt service coverage ratio.
Sources and Uses
| Sources | Uses | |||||||
| Original loan amount | $44,000,000 | 64.0% | Purchase price | $63,000,000 | 91.7% | |||
| Mezzanine loan | 20,237,082 | 29.4% | Reserves | 3,039,254 | 4.4% | |||
| Sponsor’s new cash contribution | 4,491,753 | 6.5% | Closing costs | 2,689,581 | 3.9% | |||
| Total Sources | $68,728,835 | 100.0% | Total Uses | $68,728,835 | 100.0% |
The following table presents certain information relating to the unit mix of the Cooper’s Crossing Property:
Unit Mix Summary(1)
| Unit Type | No. of Units | % of Total Units | Average Unit Size (SF) | Average U/W Monthly Rent per Unit |
| Small 1 Bedroom | 183 | 25.2% | 681 | $984 |
| Large 1 Bedroom | 73 | 10.0% | 703 | $1,062 |
| 2 Bedroom | 396 | 54.5% | 899 | $1,196 |
| 3 Bedroom | 75 | 10.3% | 1,075 | $1,453 |
| Total/Weighted Average | 727 | 100.0% | 843 | $1,156 |
| (1) | Information obtained from the appraisal and underwritten rent roll. |
The following table presents historical occupancy percentages at the Cooper’s Crossing Property:
Historical Occupancy
12/31/2012(1)(2) | 12/31/2013(1)(2) | 12/31/2014(1) | 4/8/2015(3) | |||
| 68.3% | 83.4% | 89.6% | 90.8% |
| (1) | Information obtained from the borrower |
| (2) | The increase in occupancy from 2012 to 2013 was due to the Cooper’s Crossing Property being purchased out of foreclosure and having the deferred maintenance remedied. |
| (3) | Information obtained from the underwritten rent roll. |
THE INFORMATION IN THIS STRUCTURAL AND COLLATERAL TERM SHEET IS NOT COMPLETE AND MAY BE AMENDED PRIOR TO THE TIME OF SALE. THIS TERM SHEET IS NOT AN OFFER TO SELL THESE SECURITIES AND IT IS NOT A SOLICITATION OF AN OFFER TO BUY THESE SECURITIES IN ANY JURISDICTION WHERE THE OFFER OR SALE IS NOT PERMITTED.
| 105 |
| COOPER’S CROSSING |
Operating History and Underwritten Net Cash Flow.The following table presents certain information relating to the historical operating performance and Underwritten Net Cash Flow at the Cooper’s Crossing Property:
Cash Flow Analysis
| 2012 | 2013 | 2014 | TTM 3/31/2015 | U/W | % of U/W Effective Gross Income | U/W $ per Unit | |||||||||
| Gross Potential Rent | $9,803,892 | $9,691,876 | $9,838,966 | 9,904,919 | $10,002,839 | 108.7% | $13,759 | ||||||||
| Tenant Reimbursements | 7,767 | 91,216 | 291,765 | 279,630 | 279,630 | 3.0 | 385 | ||||||||
| Concessions | (473,083) | (644,212) | (359,615) | (323,726) | (323,726) | (3.5) | (445) | ||||||||
| Other Income | 33,904 | 346,431 | 326,640 | 309,859 | 309,859 | 3.4 | 426 | ||||||||
| Less Vacancy & Credit Loss | (3,045,548) | (1,627,115) | (1,221,032) | (1,254,538) | (1,068,160)(1) | (11.6) | (1,469) | ||||||||
| Effective Gross Income | $6,326,932(2) | $7,858,197(2) | $8,876,724(2) | $8,916,144 | $9,200,442 | 100.0% | $12,655 | ||||||||
| Total Operating Expenses | $4,685,927 | $4,211,861 | $4,957,777 | $4,768,951 | $4,851,539 | 52.7% | $6,673 | ||||||||
|
|
|
|
|
|
| |||||||||
| Net Operating Income | $1,641,005 | $3,646,336 | $3,918,947 | $4,147,193 | $4,348,902 | 47.3% | $5,982 | ||||||||
| Capital Expenditures | 0 | 0 | 0 | 0 | 223,916 | 2.4% | 308 | ||||||||
| Net Cash Flow | $1,641,005 | $3,646,336 | $3,918,947 | $4,147,193 | $4,124,986 | 44.8% | $5,674 | ||||||||
| NOI DSCR | 0.58x | 1.29x | 1.39x | 1.47x | 1.54x | ||||||||||
| NCF DSCR | 0.58x | 1.29x | 1.39x | 1.47x | 1.46x | ||||||||||
| NOI DY | 3.7% | 8.3% | 8.9% | 9.4% | 9.9% | ||||||||||
| NCF DY | 3.7% | 8.3% | 8.9% | 9.4% | 9.4% |
| (1) | The underwritten economic vacancy is 14.6%. The Cooper’s Crossing Property was 90.8% physically occupied as of April 8, 2015. |
| (2) | The increase in Effective Gross Income from 2012 to 2013 and from 2013 to 2014 was due to the remedying of deferred maintenance and investing additional capital after the Cooper’s Crossing Property was purchased out of foreclosure in 2013. |
THE INFORMATION IN THIS STRUCTURAL AND COLLATERAL TERM SHEET IS NOT COMPLETE AND MAY BE AMENDED PRIOR TO THE TIME OF SALE. THIS TERM SHEET IS NOT AN OFFER TO SELL THESE SECURITIES AND IT IS NOT A SOLICITATION OF AN OFFER TO BUY THESE SECURITIES IN ANY JURISDICTION WHERE THE OFFER OR SALE IS NOT PERMITTED.
| 106 |
(THIS PAGE INTENTIONALLY LEFT BLANK)
THE INFORMATION IN THIS STRUCTURAL AND COLLATERAL TERM SHEET IS NOT COMPLETE AND MAY BE AMENDED PRIOR TO THE TIME OF SALE. THIS TERM SHEET IS NOT AN OFFER TO SELL THESE SECURITIES AND IT IS NOT A SOLICITATION OF AN OFFER TO BUY THESE SECURITIES IN ANY JURISDICTION WHERE THE OFFER OR SALE IS NOT PERMITTED.
| 107 |
| No. 12 – Hampton Inn Philadelphia Airport | ||||||
| Loan Information | Property Information | |||||
| Mortgage Loan Seller: | Natixis Real Estate Capital LLC | Single Asset/Portfolio: | Single Asset | |||
Credit Assessment (DBRS/KBRA/Moody’s): | NR/NR/NR | Property Type: | Hospitality | |||
| Original Principal Balance: | $17,800,000 | Specific Property Type: | Limited Service | |||
| Cut-off Date Principal Balance: | $17,800,000 | Location: | Philadelphia, PA | |||
| % of Initial Pool Balance: | 1.9% | Size: | 151 Rooms | |||
| Loan Purpose: | Refinance | Cut-off Date Principal Balance Per Room: | $117,881 | |||
| Borrower Name: | PHL Hotel Franchisee, LLC | Year Built/Renovated: | 1998/2012 | |||
| Sponsors: | Lloyd Kendall; Quinn Palomino | Title Vesting: | Fee | |||
| Mortgage Rate: | 4.791% | Property Manager: | Synergy Hospitality, Inc. | |||
| Note Date: | June 12, 2015 | 3rd Most Recent Occupancy: | 75.1% (12/31/2012) | |||
| Anticipated Repayment Date: | NAP | 2nd Most Recent Occupancy (As of): | 73.9% (12/31/2013) | |||
| Maturity Date: | July 5, 2025 | Most Recent Occupancy (As of): | 76.3% (12/31/2014) | |||
| IO Period: | 0 months | Current Occupancy (As of): | 75.6% (5/31/2015) | |||
| Loan Term (Original): | 120 months | |||||
| Seasoning: | 0 months | Underwriting and Financial Information: | ||||
| Amortization Term (Original): | 360 months | |||||
| Loan Amortization Type: | Amortizing Balloon | 3rd Most Recent NOI (As of): | $1,888,981 (12/31/2013) | |||
| Interest Accrual Method: | Actual/360 | 2nd Most Recent NOI (As of): | $2,126,181 (12/31/2014) | |||
| Call Protection: | L(24),D(93),O(3) | Most Recent NOI (As of): | $2,258,007 (TTM 5/31/2015) | |||
| Lockbox Type: | Hard/Springing Cash Management | |||||
| Additional Debt: | None | |||||
| Additional Debt Type: | NAP | |||||
| U/W Revenues: | $6,088,008 | |||||
| U/W Expenses: | $3,894,638 | |||||
| U/W NOI: | $2,193,371 | |||||
| Escrows and Reserves: | U/W NCF: | $1,949,850 | ||||
| U/W NOI DSCR: | 1.96x | |||||
| Type: | Initial | Monthly | Cap (If Any) | U/W NCF DSCR: | 1.74x | |
| Taxes | $65,246 | $16,312 | NAP | U/W NOI Debt Yield: | 12.3% | |
| Insurance | $16,204 | $16,204 | NAP | U/W NCF Debt Yield: | 11.0% | |
| FF&E | $0 | Springing(1) | NAP | As-Is Appraised Value: | $25,000,000 | |
| Seasonal Reserve | $56,000 | $14,500(2) | NAP | As-Is Appraisal Valuation Dates: | March 23, 2015 | |
| PIP Reserve(3) | $3,248,063 | $0 | NAP | Cut-off Date LTV Ratio: | 71.2% | |
| Deferred Maintenance | $13,125 | $0 | NAP | LTV Ratio at Maturity or ARD: | 58.1% | |
| (1) | The borrower is required to deposit one-twelfth of 4.0% of gross revenues for the previous calendar year from August 5, 2016 through loan maturity. |
| (2) | The borrower is required to deposit a monthly amount equal to $14,500 on each payment date occurring in April through November each year. The funds will be disbursed into the clearing account as follows (i) December - $10,000, (ii) January - $42,000, (iii) February - $42,000, and (iv) March - $20,000. |
| (3) | The Property Improvement Plan (“PIP”) reserve will be used to upgrade the Hampton Inn Philadelphia Airport Property to comply with Hampton Inn’s new Forever Young Initiative standards. |
The Hampton Inn Philadelphia Airport mortgage loan is evidenced by a single promissory note that is secured by a first mortgage encumbering the fee interest in a 151-room limited service hotel located on a 2.6-acre site in Philadelphia, Pennsylvania (the “Hampton Inn Philadelphia Airport Property”). The six-story hotel opened in 1998. The majority of investors in the current ownership have owned the Hampton Inn Philadelphia Airport Property since February 2005, when the Hampton Inn Philadelphia Airport Property was purchased for $19.5 million, and have invested more than $1.6 million in renovations. A $3.2 million ($21,510 per room) upfront PIP reserve will be used to upgrade the Hampton Inn Philadelphia Airport Property to Hampton Inn’s new Forever Young Initiative (“FYI”) standard as a consequence of signing a new 15-year franchise agreement, which expires in June 2030. The improvements are expected to include updating the guestroom soft goods, case goods, full interior and exterior FF&E re-branding and an upgrading of the bathrooms, floors, and corridors. The Hampton Inn Philadelphia Airport Property includes 83 king rooms, 62 double rooms, and six full-sized rooms, of which seven rooms are handicapped accessible. The Hampton Inn Philadelphia Airport Property amenities include an outdoor swimming pool, a guest laundry, a fitness room, a business center and vending areas. The Hampton Inn Philadelphia Airport Property is located within the Philadelphia International Airport market and is adjacent to the Philadelphia International Airport, which services more than 30 million passengers per year.
THE INFORMATION IN THIS STRUCTURAL AND COLLATERAL TERM SHEET IS NOT COMPLETE AND MAY BE AMENDED PRIOR TO THE TIME OF SALE. THIS TERM SHEET IS NOT AN OFFER TO SELL THESE SECURITIES AND IT IS NOT A SOLICITATION OF AN OFFER TO BUY THESE SECURITIES IN ANY JURISDICTION WHERE THE OFFER OR SALE IS NOT PERMITTED.
| 108 |
| HAMPTON INN PHILADELPHIA AIRPORT |
Sources and Uses
| Sources | Uses | ||||||||
| Original loan combination amount | $17,800,000 | 100.0 | % | Loan payoff(1) | $11,497,458 | 64.6 | % | ||
| Reserves | 3,398,638 | 19.1 | |||||||
| Closing costs(2) | 1,753,327 | 9.9 | |||||||
| Return of equity | 1,150,577 | 6.5 | |||||||
| Total Sources | $17,800,000 | 100.0 | % | Total Uses | $17,800,000 | 100.0 | % | ||
| (1) | The Hampton Inn Philadelphia Airport Property was previously securitized in the GSMS 2005-GG4 transaction. |
| (2) | Closing costs include the buyout of an existing general partner totalling $574,690. |
The following table presents certain information relating to the Hampton Inn Philadelphia Airport Property’s competitive set.
Subject and Market Historical Occupancy, ADR and RevPAR(1)
| Competitive Set | Hampton Inn Philadelphia | Penetration Factor | |||||||||||||||||
Year |
| Occupancy |
| ADR |
| RevPAR |
| Occupancy |
| ADR |
| RevPAR |
| Occupancy |
| ADR |
| RevPAR |
|
| TTM 4/30/2015 | 69.7% | $115.33 | $80.38 | 75.6% | $141.37 | $106.94 | 108.5% | 122.6% | 133.0% | ||||||||||
| TTM 4/30/2014 | 72.4% | $110.67 | $80.10 | 75.0% | $135.49 | $101.68 | 103.7% | 122.4% | 126.9% | ||||||||||
| TTM 4/30/2013 | 74.1% | $110.79 | $82.13 | 76.8% | $136.19 | $104.59 | 103.6% | 122.9% | 127.3% | ||||||||||
| (1) | Information obtained from a third party hospitality report dated May 18, 2015. The competitive set includes the following hotels: Wyndham Garden Hotel Philadelphia Airport, Four Points by Sheraton Philadelphia Airport, Courtyard Philadelphia Airport, Embassy Suites Philadelphia Airport, Fairfield Inn Philadelphia Airport and Aloft Hotel Philadelphia Airport. |
Operating History and Underwritten Net Cash Flow.The following table presents certain information relating to the historical operating performance and underwritten net cash flow at the Hampton Inn Philadelphia Airport Property:
Cash Flow Analysis
| 2012 | 2013 | 2014 | TTM 5/31/2015 | U/W | % of U/W Total Revenue | U/W $ per Room | |||||||||
| Occupancy | 75.1% | 73.9% | 76.3% | 75.6% | 75.6% | ||||||||||
| ADR | $136.07 | $134.18 | $138.95 | $142.55 | $142.55 | ||||||||||
| RevPAR | $102.23 | $99.21 | $106.05 | $107.80 | $107.80 | ||||||||||
| Total Revenue | $5,761,560 | $5,570,184 | $5,960,736 | $6,088,008 | $6,088,008 | 100.0% | $40,318 | ||||||||
| Total Department Expenses |
| 1,520,122 |
| 1,541,375 |
| 1,612,033 |
| 1,588,244 |
| 1,588,244 |
| 26.1 |
| 10,518 |
|
| Gross Operating Profit | $4,241,438 | $4,028,809 | $4,348,703 | $4,499,764 | $4,499,764 | 73.9% | $29,800 | ||||||||
| Total Undistributed Expenses |
| 1,808,564 |
| 1,796,653 |
| 1,963,208 |
| 1,994,643 |
| 1,931,171 |
| 31.7 |
| 12,789 |
|
| Profit Before Fixed Charges | $2,432,874 | $2,232,156 | $2,385,495 | $2,505,121 | $2,568,593 | 42.2% | $17,011 | ||||||||
| Total Fixed Charges |
| 306,302 |
| 343,175 |
| 259,314 |
| 247,114 |
| 375,222 |
| 6.2 |
| 2,485 |
|
| Net Operating Income | $2,126,572 | $1,888,981 | $2,126,181 | $2,258,007 | $2,193,371 | 36.0% | $14,526 | ||||||||
| FF&E |
| 0 |
| 0 |
| 0 |
| 0 |
| 243,520 |
| 4.0 |
| 1,613 |
|
| Net Cash Flow | $2,126,572 | $1,888,981 | $2,126,181 | $2,258,007 | $1,949,850 | 32.0% | $12,913 | ||||||||
| NOI DSCR | 1.90x | 1.69x | 1.90x | 2.02x | 1.96x | ||||||||||
| NCF DSCR | 1.90x | 1.69x | 1.90x | 2.02x | 1.74x | ||||||||||
| NOI DY | 11.9% | 10.6% | 11.9% | 12.7% | 12.3% | ||||||||||
| NCF DY | 11.9% | 10.6% | 11.9% | 12.7% | 11.0% |
THE INFORMATION IN THIS STRUCTURAL AND COLLATERAL TERM SHEET IS NOT COMPLETE AND MAY BE AMENDED PRIOR TO THE TIME OF SALE. THIS TERM SHEET IS NOT AN OFFER TO SELL THESE SECURITIES AND IT IS NOT A SOLICITATION OF AN OFFER TO BUY THESE SECURITIES IN ANY JURISDICTION WHERE THE OFFER OR SALE IS NOT PERMITTED.
| 109 |
| No. 13 – Westland Retail Portfolio | ||||||
| Loan Information | Property Information | |||||
| Mortgage Loan Seller: | Wells Fargo Bank, National Association | Single Asset/Portfolio: | Portfolio | |||
| Credit Assessment (DBRS/KBRA/Moody’s): | NR/NR/NR | Property Type: | Retail | |||
| Original Principal Balance: | $17,200,000 | Specific Property Type: | Unanchored | |||
| Cut-off Date Principal Balance: | $17,200,000 | Location: | Various – See Table | |||
| % of Initial Pool Balance: | 1.9% | Size: | 82,556 SF | |||
| Loan Purpose: | Refinance | Cut-off Date Principal Balance Per SF: | $208.34 | |||
| Borrower Name: | Amusement LFP LLC | Year Built/Renovated: | Various – See Table | |||
| Sponsors: | Allen Alevy; Deanna Alevy; The Alevy Family Trust | Title Vesting: | Fee | |||
| Mortgage Rate: | 4.420% | Property Manager: | Self-managed | |||
| Note Date: | June 12, 2015 | 3rd Most Recent Occupancy (As of): | 89.3% (12/31/2012) | |||
| Anticipated Repayment Date: | NAP | 2nd Most Recent Occupancy (As of): | 95.5% (12/31/2013) | |||
| Maturity Date: | July 11, 2025 | Most Recent Occupancy (As of): | 95.9% (12/31/2014) | |||
| IO Period: | None | Current Occupancy (As of): | 93.4% (6/10/2015) | |||
| Loan Term (Original): | 120 months | |||||
| Seasoning: | 0 months | Underwriting and Financial Information: | ||||
| Amortization Term (Original): | 360 months | |||||
| Loan Amortization Type: | Amortizing Balloon | 3rd Most Recent NOI: | $1,603,867 (12/31/2013) | |||
| Interest Accrual Method: | Actual/360 | 2nd Most Recent NOI: | $1,699,776 (12/31/2014) | |||
| Call Protection: | L(24),D(91),O(5) | Most Recent NOI: | $1,714,851 (TTM 3/31/2015) | |||
| Lockbox Type: | Springing (Without Established Account) | |||||
| Additional Debt: | None | U/W Revenues: | $2,148,811 | |||
| Additional Debt Type: | NAP | U/W Expenses: | $488,101 | |||
| U/W NOI: | $1,660,710 | |||||
| U/W NCF: | $1,560,547 | |||||
| Escrows and Reserves: | 1.60x | |||||
| U/W NCF DSCR: | 1.51x | |||||
| Type: | Initial | Monthly | Cap (If Any) | U/W NOI Debt Yield: | 9.7% | |
| Taxes | $47,228 | $11,807 | NAP | U/W NCF Debt Yield: | 9.1% | |
| Insurance(1) | $0 | Springing | NAP | As-Is Appraised Value: | $25,770,000 | |
| Replacement Reserves(2) | $0 | $3,944 | $66,840 | As-Is Appraisal Valuation Date: | April 3, 2015 | |
| TI/LC Reserve(3) | $0 | $6,250 | $150,000 | Cut-off Date LTV Ratio: | 66.7% | |
| Environmental Reserve(4) | $355,000 | $0 | NAP | LTV Ratio at Maturity or ARD: | 53.8% | |
| (1) | Ongoing monthly reserves for insurance are not required so long as (i) no event of default has occurred and is continuing; (ii) the Westland Retail Portfolio is insured via an acceptable blanket insurance policy; and (iii) the borrower provides the lender with evidence of renewal of the insurance policies and timely proof of payment of insurance premiums. |
| (2) | Monthly replacement reserves will be collected in the amount of $3,944 from August 11, 2015 to July 11, 2020. Beginning on August 11, 2020, the replacement reserve will be collected in the amount of $2,785 until the reserve has reached the cap of $66,840. |
| (3) | Monthly TI/LC reserves of $6,250 are required until the reserve has reached the cap of $150,000. If funds are drawn from the TI/LC reserve, the borrower is required to replenish the reserve with monthly deposits until the reserve has reached the cap of $150,000. |
| (4) | A Phase II environmental assessment was performed at the La Habra property whereby it was determined that the borrower must perform remediation work and obtain a “No Further Action” letter from the Orange County Health Care Agency with respect to the historic on-site dry cleaning activity. A Phase II environmental assessment was performed at the Harbor Plaza property whereby it was determined that remediation work must be completed within 180 days of closing for potential vapor encroachment. The upfront Environmental Reserve of $355,000 represents 125% of the estimated remediation costs at the La Habra and the Harbor Plaza properties. |
The Westland Retail Portfolio mortgage loan is evidenced by a single promissory note that is secured by a first mortgage encumbering the borrower’s fee interest in three unanchored retail properties totaling 82,556 rentable square feet (the “Westland Retail Portfolio Properties”). Built between 1977 and 1987, the Westland Retail Portfolio Properties are all located in California within Los Angeles County (2) and Orange County (1). The Westland Retail Portfolio Properties range in size from 10,724 square feet to 41,416 square feet and include a diverse and granular rent roll with no tenant occupying more than 4.9% of net rentable area. The 10-year average occupancy for the Westland Retail Portfolio Properties is 87.5% and 41.3% of the underwritten base rent is from tenants that have occupied their space for over 10 years.
The Westland Retail Portfolio Properties feature 323 surface parking spaces resulting in a parking ratio of 3.9 spaces per 1,000 square feet of rentable area. In 2014, the population within a three-mile and five-mile radius of each individual property ranged from 127,483 to 351,929 and from 378,691 to 1,073,736, respectively, while average household income within the same radii ranged from $46,144 to $98,991 and from $48,675 to $94,204, respectively. As of June 10, 2015, the Westland Retail Portfolio Properties were 93.4% occupied by 49 tenants.
THE INFORMATION IN THIS STRUCTURAL AND COLLATERAL TERM SHEET IS NOT COMPLETE AND MAY BE AMENDED PRIOR TO THE TIME OF SALE. THIS TERM SHEET IS NOT AN OFFER TO SELL THESE SECURITIES AND IT IS NOT A SOLICITATION OF AN OFFER TO BUY THESE SECURITIES IN ANY JURISDICTION WHERE THE OFFER OR SALE IS NOT PERMITTED.
| 110 |
| WESTLAND RETAIL PORTFOLIO |
Sources and Uses
| Sources | Uses | ||||||||
| Original loan amount | $17,200,000 | 92.3 | % | Loan payoff(1) | $18,055,927 | 96.9 | % | ||
| Sponsor’s new cash contribution | $1,437,994 | 7.7 | Closing costs | 179,839 | 1.0 | ||||
| Reserves | $402,228 | 2.2 | |||||||
| Total Sources | $18,637,994 | 100.0 | % | Total Uses | $18,637,994 | 100.0 | % |
| (1) | The Pasadena property and the Harbor Plaza property were previously securitized in the JPMCC 2005-CB13 transaction. |
The following table presents certain information relating to the Westland Retail Portfolio Properties:
| Property Name – Location | Allocated Cut-off Date Principal Balance | % of Portfolio Cut-off Date Principal Balance | Occupancy | Year Built/ Renovated | Net Rentable Area (SF) | Appraised Value | Allocated LTV | |
| Pasadena – Pasadena, CA | $8,845,000 | 51.4% | 92.8% | 1987/NAP | 30,416 | $13,000,000 | 68.0% | |
| La Habra – La Habra, CA | $5,830,000 | 33.9% | 92.2% | 1977/1986 | 41,416 | $8,570,000 | 68.0% | |
| Harbor Plaza – Los Angeles, CA | $2,525,000 | 14.7% | 100.0% | 1987/2003 | 10,724 | $4,200,000 | 60.1% | |
| Total/Weighted Average | $17,200,000 | 100.0% | 93.4% | 82,556 | $25,770,000 | 66.7% | ||
The following table presents certain information relating to the tenants at the Westland Retail Portfolio Properties:
Major Tenants
| Tenant Name | Property | Credit Rating Moody’s/ | Tenant NRSF | % of NRSF | Annual U/W Base Rent PSF(1) | Annual U/W Base Rent(1) | % of Total Annual U/W Base Rent | Sales PSF(2) | Occupancy Cost(2) | Lease Expiration Date | ||||||||||
| Major Tenants | ||||||||||||||||||||
| Functional Fitness | Pasadena | NR/NR/NR | 4,035 | 4.9% | $28.06 | $113,220 | 6.6% | NAV | NAV | 1/31/2018(3) | ||||||||||
| Cosmo Prof | Pasadena | NR/NR/NR | 3,360 | 4.1% | $25.36 | $85,210 | 5.0% | NAV | NAV | 5/31/2017(4) | ||||||||||
| Harbor Liquor | La Habra | NR/NR/NR | 3,267 | 4.0% | $18.00 | $58,800 | 3.4% | NAV | NAV | 1/31/2025(5) | ||||||||||
| 99 Outlet Plus | Harbor Plaza | NR/NR/NR | 3,597 | 4.4% | $14.18 | $51,000 | 3.0% | NAV | NAV | 12/31/2016 | ||||||||||
| T-Shirts Outlet Plus | La Habra | NR/NR/NR | 3,670 | 4.4% | $12.10 | $44,400 | 2.6% | NAV | NAV | 10/31/2017 | ||||||||||
| Total Major Tenants | 17,929 | 21.7% | $19.67 | $352,630 | 20.6% | |||||||||||||||
| Non-Major Tenants | 59,201(6) | 71.7% | $22.91(6) | $1,356,299(6) | 79.4% | |||||||||||||||
| Occupied Collateral Total | 77,130 | 93.4% | $22.16 | $1,708,929 | 100.0% | |||||||||||||||
| Vacant Space | 5,426 | 6.6% | ||||||||||||||||||
| Collateral Total | 82,556 | 100.0% | ||||||||||||||||||
| (1) | Annual U/W Base Rent PSF and Annual U/W Base Rent include contractual rent steps through June 2016 totaling $18,179. |
| (2) | Most tenants are not required to report sales. |
| (3) | Functional Fitness has one, 3-year renewal option. |
| (4) | Cosmo Prof has one, 5-year renewal option. |
| (5) | Harbor Liquor has one, 5-year renewal option. |
| (6) | The Annual U/W Base Rent PSF and Annual U/W Base Rent include ground rent from McDonald’s ($54,456) but the square footage attributed to the McDonald’s outparcel was excluded from the Non-Major Tenants NRSF since the tenant is on a ground lease and owns its own improvements. The Annual U/W Base Rent PSF excluding the McDonald’s rent is $21.45. |
THE INFORMATION IN THIS STRUCTURAL AND COLLATERAL TERM SHEET IS NOT COMPLETE AND MAY BE AMENDED PRIOR TO THE TIME OF SALE. THIS TERM SHEET IS NOT AN OFFER TO SELL THESE SECURITIES AND IT IS NOT A SOLICITATION OF AN OFFER TO BUY THESE SECURITIES IN ANY JURISDICTION WHERE THE OFFER OR SALE IS NOT PERMITTED.
| 111 |
| WESTLAND RETAIL PORTFOLIO |
The following table presents certain information relating to the lease rollover schedule at the Westland Retail Portfolio Properties:
Lease Expiration Schedule(1)
Year Ending December 31, | No. of Leases Expiring | Expiring NRSF | % of Total NRSF | Cumulative Expiring NRSF | Cumulative % of Total NRSF | Annual U/W Base Rent | Annual U/W Base Rent PSF(2) | |
| MTM | 1 | 1,911 | 2.3% | 1,911 | 2.3% | $34,398 | $18.00 | |
| 2015 | 7 | 7,698 | 9.3% | 9,609 | 11.6% | $172,723 | $22.44 | |
| 2016 | 7 | 10,014 | 12.1% | 19,623 | 23.8% | $167,872 | $16.76 | |
| 2017 | 12 | 21,549 | 26.1% | 41,172 | 49.9% | $465,377 | $21.60 | |
| 2018 | 9 | 16,197 | 19.6% | 57,369 | 69.5% | $327,291 | $20.21 | |
| 2019 | 6(3) | 8,564(3) | 10.4%(3) | 65,933(3) | 79.9%(3) | $261,444(3) | $30.53(3) | |
| 2020 | 4 | 4,880 | 5.9% | 70,813 | 85.8% | $128,981 | $26.43 | |
| 2021 | 0 | 0 | 0.0% | 70,813 | 85.8% | $0 | $0.00 | |
| 2022 | 1 | 1,000 | 1.2% | 71,813 | 87.0% | $30,000 | $30.00 | |
| 2023 | 1 | 2,050 | 2.5% | 73,863 | 89.5% | $62,042 | $30.26 | |
| 2024 | 0 | 0 | 0.0% | 73,863 | 89.5% | $0 | $0.00 | |
| 2025 | 1 | 3,267 | 4.0% | 77,130 | 93.4% | $58,800 | $18.00 | |
| Thereafter | 0 | 0 | 0.0% | 77,130 | 93.4% | $0 | $0.00 | |
| Vacant | 0 | 5,426 | 6.6% | 82,556 | 100.0% | $0 | $0.00 | |
| Total/Weighted Average | 49 | 82,556 | 100.0% | $1,708,929 | $22.16 |
| (1) | Information obtained from the underwritten rent roll. |
| (2) | Weighted Average Annual U/W Base Rent PSF excludes vacant space. |
| (3) | The square footage attributed to a McDonald’s outparcel was excluded from the total NRSF since the tenant is on a ground lease and owns its own improvements. |
The following table presents historical occupancy percentages at the Westland Retail Portfolio Properties:
Historical Occupancy
12/31/2012(1) |
| 12/31/2013(1) |
| 12/31/2014(1) |
| 6/10/2015(2) |
| 89.3% | 95.5% | 95.9% | 93.4% |
| (1) | Information obtained from the borrower. |
| (2) | Information obtained from the underwritten rent roll. |
Operating History and Underwritten Net Cash Flow. The following table presents certain information relating to the historical operating performance and underwritten net cash flow at the Westland Retail Portfolio Properties:
Cash Flow Analysis
| 2012 | 2013 | 2014 | TTM 3/31/2015 | U/W | % of U/W Effective Gross Income | U/W $ per SF | |||||||||
| Base Rent | $1,541,028 | $1,621,858 | $1,683,786 | $1,694,749 | $1,708,929(1) | 79.5% | $20.70 | ||||||||
| Grossed Up Vacant Space | 0 | 0 | 0 | 0 | 114,360 | 5.3 | 1.39 | ||||||||
| Total Reimbursables | 307,753 | 329,506 | 348,733 | 346,691 | 433,057 | 20.2 | 5.25 | ||||||||
| Other Income | 125 | 6,815 | 6,826 | 11,603 | 6,826 | 0.3 | 0.08 | ||||||||
| Less Vacancy & Credit Loss |
| 0 |
| 0 |
| 0 |
| 0 |
| (114,360)(2) |
| (5.3) |
| (1.39) | |
| Effective Gross Income | $1,848,906 | $1,958,179 | $2,039,346 | $2,053,043 | $2,148,811 | 100.0% | $26.03 | ||||||||
| Total Operating Expenses | $367,412 | $354,313 | $339,569 | $338,192 | $488,101 | 22.7% | $5.91 | ||||||||
|
|
|
|
|
|
|
|
|
|
|
|
|
| ||
| Net Operating Income | $1,481,494 | $1,603,867 | $1,699,776 | $1,714,851 | $1,660,710 | 77.3% | $20.12 | ||||||||
| TI/LC | 0 | 0 | 0 | 0 | 67,770 | 3.2 | 0.82 | ||||||||
| Replacement Reserves |
| 0 |
| 0 |
| 0 |
| 0 |
| 32,394 |
| 1.5 |
| 0.39 | |
| Net Cash Flow | $1,481,494 | $1,603,867 | $1,699,776 | $1,714,851 | $1,560,547 | 72.6% | $18.90 | ||||||||
| NOI DSCR | 1.43x | 1.55x | 1.64x | 1.66x | 1.60x | ||||||||||
| NCF DSCR | 1.43x | 1.55x | 1.64x | 1.66x | 1.51x | ||||||||||
| NOI DY | 8.6% | 9.3% | 9.9% | 10.0% | 9.7% | ||||||||||
| NCF DY | 8.6% | 9.3% | 9.9% | 10.0% | 9.1% |
| (1) | Annual U/W Base Rent includes contractual rent steps through June 2016 totaling $18,179. |
| (2) | The underwritten economic vacancy is 6.3%. The Westland Retail Portfolio Properties were 93.4% physically occupied as of June 10, 2015. |
THE INFORMATION IN THIS STRUCTURAL AND COLLATERAL TERM SHEET IS NOT COMPLETE AND MAY BE AMENDED PRIOR TO THE TIME OF SALE. THIS TERM SHEET IS NOT AN OFFER TO SELL THESE SECURITIES AND IT IS NOT A SOLICITATION OF AN OFFER TO BUY THESE SECURITIES IN ANY JURISDICTION WHERE THE OFFER OR SALE IS NOT PERMITTED.
| 112 |
(THIS PAGE INTENTIONALLY LEFT BLANK)
THE INFORMATION IN THIS STRUCTURAL AND COLLATERAL TERM SHEET IS NOT COMPLETE AND MAY BE AMENDED PRIOR TO THE TIME OF SALE. THIS TERM SHEET IS NOT AN OFFER TO SELL THESE SECURITIES AND IT IS NOT A SOLICITATION OF AN OFFER TO BUY THESE SECURITIES IN ANY JURISDICTION WHERE THE OFFER OR SALE IS NOT PERMITTED.
| 113 |
| No. 14 – Springhill Suites Napa Valley | |||||||
| Loan Information | Property Information | ||||||
| Mortgage Loan Seller: | Natixis Real Estate Capital LLC | Single Asset/Portfolio: | Single Asset | ||||
Credit Assessment (DBRS/KBRA/Moody’s): | NR/NR/NR | Property Type: | Hospitality | ||||
| Original Principal Balance: | $16,500,000 | Specific Property Type: | Limited Service | ||||
| Cut-off Date Principal Balance: | $16,500,000 | Location: | Napa, CA | ||||
| % of Initial Pool Balance: | 1.8% | Size: | 100 Rooms | ||||
| Loan Purpose: | Refinance | Cut-off Date Principal Balance Per Room: | $165,000 | ||||
| Borrower Name: | Airport Boulevard Realty LLC | Year Built/Renovated: | 2008/NAP | ||||
| Sponsors: | Shohreh Maleksalehi; Ron Johnson; William Maston | Title Vesting: | Fee | ||||
| Mortgage Rate: | 4.220% | Property Manager: | Self-managed | ||||
| Note Date: | April 16, 2015 | 3rdMost Recent Occupancy (As of): | 73.9% (12/31/2012) | ||||
| Anticipated Repayment Date: | NAP | 2ndMost Recent Occupancy (As of): | 77.1% (12/31/2013) | ||||
| Maturity Date: | May 5, 2025 | Most Recent Occupancy (As of): | 79.2% (12/31/2014) | ||||
| IO Period: | 24 months | Current Occupancy (As of): | 79.9% (1/31/2015) | ||||
| Loan Term (Original): | 120 months | ||||||
| Seasoning: | 2 months | Underwriting and Financial Information: | |||||
| Amortization Term (Original): | 360 months | ||||||
| Loan Amortization Type: | Interest-only, Amortizing Balloon | 3rdMost Recent NOI (As of): | $1,450,118 (12/31/2013) | ||||
| Interest Accrual Method: | Actual/360 | 2ndMost Recent NOI (As of): | $1,687,262 (12/31/2014) | ||||
| Call Protection: | L(26),D(91),O(3) | Most Recent NOI (As of): | $1,724,817 (TTM 1/31/2015) | ||||
| Lockbox Type: | Hard/Springing Cash Management | ||||||
| Additional Debt: | None | ||||||
| Additional Debt Type: | NAP | ||||||
| U/W Revenues: | $4,771,221 | ||||||
| U/W Expenses: | $2,998,701 | ||||||
| U/W NOI: | $1,772,520 | ||||||
| U/W NCF: | $1,581,672 | ||||||
| U/W NOI DSCR: | 1.83x | ||||||
| Escrows and Reserves: | U/W NCF DSCR: | 1.63x | |||||
| U/W NOI Debt Yield: | 10.7% | ||||||
| Type: | Initial | Monthly | Cap (If Any) | U/W NCF Debt Yield: | 9.6% | ||
| Taxes | $45,636 | $15,212 | NAP | As-Is Appraised Value: | $23,800,000 | ||
| Insurance | $10,246 | $2,049 | NAP | As-Is Appraisal Valuation Dates: | March 6, 2015 | ||
| FF&E Reserve | $0 | (1) | NAP | Cut-off Date LTV Ratio: | 69.3% | ||
| Seasonality Reserve | $16,353 | $5,451(2) | NAP | LTV Ratio at Maturity or ARD: | 58.8% | ||
| (1) | The borrower is required to deposit one-twelfth of 4.0% of gross revenues for the previous calendar year. |
| (2) | The borrower is required to deposit on each payment date (other than the payment date occurring in January) through and including May 5, 2017, an amount equal to $5,451. On June 5, 2017, the monthly payment increases to $7,326. The funds may be used to pay any debt service shortfalls that occur during the term of the mortgage loan. |
The Springhill Suites Napa Valley mortgage loan is evidenced by a promissory note secured by a first mortgage encumbering the fee interest in a 100-room limited service hotel located on a 1.6-acre site in Napa, California (the “Springhill Suites Napa Valley Property”). The borrower developed the Springhill Suites Napa Valley Property in 2008 for a total estimated cost of $23.6 million. Since development, the sponsors have invested approximately $157,000 of additional capital expenditures, bringing their total cost basis to $23.8 million. The Springhill Suites Napa Valley operates as Springhill Suites pursuant a long term license agreement with Marriott International, Inc., that expires in January 2029. The Springhill Suites Napa Valley Property features an outdoor swimming pool and whirlpool, a fitness room, three indoor meeting and banquet facilities totaling 2,431 square feet, a breakfast dining area, a bar, a business center, a guest laundry room, a barbeque grill, and a fire pit. Additionally, the decor of the Springhill Suites Napa Valley Property is inspired by the San Francisco Bay area and the surrounding wine country, with upscale finishes in guestrooms and public areas. According to the appraisal, the Napa Valley area is a major regional, national, and international destination with tourism largely driven by local vineyards, wineries, and restaurants and is commonly referred to as the “Food and Wine Capital” of the United States. The Napa Valley area has continued to experience growth with food and beverage sales in the county growing to $350.0 million in 2014 compared to $318.0 million in 2010 resulting in an average annual growth of 2.4%. A large portion of visitor traffic to the area is from the greater San Francisco Bay area. Driven by the technology sector, the San Francisco Bay area economy is expected to continue to strengthen in the near term, generating increasing levels of lodging demand and visitation to the Napa Valley market.
THE INFORMATION IN THIS STRUCTURAL AND COLLATERAL TERM SHEET IS NOT COMPLETE AND MAY BE AMENDED PRIOR TO THE TIME OF SALE. THIS TERM SHEET IS NOT AN OFFER TO SELL THESE SECURITIES AND IT IS NOT A SOLICITATION OF AN OFFER TO BUY THESE SECURITIES IN ANY JURISDICTION WHERE THE OFFER OR SALE IS NOT PERMITTED.
| 114 |
| Springhill Suites Napa Valley |
Sources and Uses
| Sources | Uses | |||||||
| Original loan amount | $16,500,000 | 100.0% | Loan payoff | $14,653,174 | 88.8% | |||
| Reserves | 72,235 | 0.4 | ||||||
| Closing costs | 267,627 | 1.6 | ||||||
| Return of equity | 1,506,965 | 9.1 | ||||||
| Total Sources | $16,500,000 | 100.0% | Total Uses | $16,500,000 | 100.0% | |||
The following table presents certain information relating to the Springhill Suites Napa Valley Property’s competitive set.
Subject and Market Historical Occupancy, ADR and RevPAR(1)
Competitive Set | Springhill Suites Napa Valley | Penetration Factor | |||||||||||||||
Year | Occupancy | ADR | RevPAR | Occupancy | ADR | RevPAR | Occupancy | ADR | RevPAR | ||||||||
| TTM 4/30/2015 | 79.7% | $155.07 | $123.53 | 81.1% | $154.50 | $125.23 | 101.7% | 99.6% | 101.4% | ||||||||
| TTM 4/30/2014 | 74.1% | $147.76 | $109.46 | 76.5% | $143.84 | $110.06 | 103.3% | 97.3% | 100.6% | ||||||||
| TTM 4/30/2013 | 68.9% | $137.39 | $94.61 | 74.3% | $133.42 | $99.09 | 107.9% | 97.1% | 104.7% | ||||||||
| (1) | Information obtained from a third party hospitality report dated May 19, 2015. The competitive set includes: Hawthorn Suites by Wyndham Napa Valley, Hilton Garden Inn Napa, River Terrace Inn, Fairfield Inn & Suites Napa American Canyon, Doubletree Hotel & Spa Napa Valley American Canyon, and Holiday Inn Express & Suites Napa Valley American. |
Operating History and Underwritten Net Cash Flow.The following table presents certain information relating to the historical operating performance and underwritten net cash flow at the Springhill Suites Napa Valley Property:
Cash Flow Analysis
| 2012 | 2013 | 2014 | TTM 1/31/2015 | U/W | % of U/W Total Revenue | U/W $ per Room | |||||||||
| Occupancy | 73.9% | 77.1% | 79.2% | 79.9% | 79.9% | ||||||||||
| ADR | $131.60 | $140.47 | $149.31 | $149.89 | $149.89 | ||||||||||
| RevPAR | $97.30 | $108.23 | $118.24 | $119.79 | $119.79 | ||||||||||
| Total Revenue | $3,964,991 | $4,417,057 | $4,711,023 | $4,771,221 | $4,771,221 | 100.0% | $47,712 | ||||||||
| Total Department Expenses | 1,299,279 | 1,306,966 | 1,384,437 | 1,417,427 | 1,417,427 | 29.7 | 14,174 | ||||||||
| Gross Operating Profit | $2,665,712 | $3,110,091 | $3,326,586 | $3,353,794 | $3,353,794 | 70.3% | $33,538 | ||||||||
| Total Undistributed Expenses | 1,246,295 | 1,466,422 | 1,449,854 | 1,439,042 | 1,391,339 | 29.2 | 13,913 | ||||||||
| Profit Before Fixed Charges | $1,419,417 | $1,643,669 | $1,876,732 | $1,914,752 | $1,962,455 | 41.1% | $19,625 | ||||||||
| Total Fixed Charges | 193,551 | 193,551 | 189,470 | 189,935 | 189,935 | 4.0 | 1,899 | ||||||||
| Net Operating Income | $1,225,866 | $1,450,118 | $1,687,262 | $1,724,817 | $1,772,520 | 37.2% | $17,725 | ||||||||
| FF&E | 0 | 0 | 0 | 0 | 190,849 | 4.0 | 1,908 | ||||||||
| Net Cash Flow | $1,225,866 | $1,450,118 | $1,687,262 | $1,724,817 | $1,581,672 | 33.2% | $15,817 | ||||||||
| NOI DSCR | 1.26x | 1.49x | 1.74x | 1.78x | 1.83x | ||||||||||
| NCF DSCR | 1.26x | 1.49x | 1.74x | 1.78x | 1.63x | ||||||||||
| NOI DY | 7.4% | 8.8% | 10.2% | 10.5% | 10.7% | ||||||||||
| NCF DY | 7.4% | 8.8% | 10.2% | 10.5% | 9.6% |
THE INFORMATION IN THIS STRUCTURAL AND COLLATERAL TERM SHEET IS NOT COMPLETE AND MAY BE AMENDED PRIOR TO THE TIME OF SALE. THIS TERM SHEET IS NOT AN OFFER TO SELL THESE SECURITIES AND IT IS NOT A SOLICITATION OF AN OFFER TO BUY THESE SECURITIES IN ANY JURISDICTION WHERE THE OFFER OR SALE IS NOT PERMITTED.
| 115 |
| No. 15 – 655 K Street | |||||||
| Loan Information | Property Information | ||||||
| Mortgage Loan Seller: | Natixis Real Estate Capital LLC | Single Asset/Portfolio: | Single Asset | ||||
| Credit Assessment (DBRS/KBRA/Moody’s): | NR/NR/NR | Property Type: | Retail | ||||
| Original Principal Balance: | $16,000,000 | Specific Property Type: | Anchored | ||||
| Cut-off Date Principal Balance: | $15,955,253 | Location: | Washington, DC | ||||
| % of Initial Pool Balance: | 1.7% | Size: | 13,926 SF | ||||
| Loan Purpose: | Refinance | Cut-off Date Principal
Balance Per SF:
| $1,145.72 | ||||
| Borrower Name: | 451 West Retail L.L.C. | Year Built/Renovated: | 2015/NAP | ||||
| Sponsors: | Norman Jemal | Title Vesting: | Fee | ||||
| Mortgage Rate: | 3.960% | Property Manager: | Self-managed | ||||
| Note Date: | May 1, 2015 | 3rdMost Recent Occupancy(6): | NAP | ||||
| Anticipated Repayment Date: | NAP | 2ndMost Recent Occupancy(6): | NAP | ||||
| Maturity Date: | May 5, 2025 | Most Recent Occupancy(6): | NAP | ||||
| IO Period: | None | Current Occupancy (As of)(6): | 100% (3/20/2015) | ||||
| Loan Term (Original): | 120 months | ||||||
| Seasoning: | 2 months | Underwriting and Financial Information: | |||||
| Amortization Term (Original): | 360 months | ||||||
| Loan Amortization Type: | Amortizing Balloon | 3rdMost Recent NOI: | NAP | ||||
| Interest Accrual Method: | Actual/360 | 2ndMost Recent NOI: | NAP | ||||
| Call Protection: | L(26),D(90),O(4) | Most Recent NOI: | NAP | ||||
| Lockbox Type: | Hard/Springing Cash Management | ||||||
| Additional Debt(1): | Yes | ||||||
| Additional Debt Type(1): | Future Mezzanine | ||||||
| Escrows and Reserves: | |||||||
| U/W Revenues: | $1,443,259 | ||||||
| U/W Expenses: | $268,938 | ||||||
| U/W NOI: | $1,174,322 | ||||||
| Type: | Initial | Monthly | Cap (If Any) | U/W NCF: | $1,170,603 | ||
| Taxes | $37,621 | $13,316 | NAP | U/W NOI DSCR: | 1.29x | ||
| Insurance(2) | $3,000 | Springing | NAP | U/W NCF DSCR: | 1.28x | ||
| Replacement Reserve | $0 | $58 | NAP | U/W NOI Debt Yield: | 7.4% | ||
| Initial TI Reserve(3) | $695,628 | NAP | NAP | U/W NCF Debt Yield: | 7.3% | ||
| Initial LC Reserve(4) | $40,389 | NAP | NAP | As-Is Appraised Value(7): | $23,100,000 | ||
| Free Rent Reserve(5) | $171,447 | NAP | NAP | As-Is Appraisal Valuation Dates(7): | March 23, 2015 | ||
| Landlord Work Reserve | $477,500 | NAP | NAP | Cut-off Date LTV Ratio(7): | 69.1% | ||
| Common Charge Reserve | $9,806 | NAP | NAP | LTV Ratio at Maturity or ARD(7): | 55.0% | ||
| (1) | Future mezzanine debt is permitted subject to: (i) a maximum combined loan-to-value ratio of 80.0%, (ii) a minimum combined underwritten debt service coverage ratio of 1.10x; (iii) the receipt of a rating agency confirmation from DBRS, KBRA and Moody’s that the mezzanine financing will not result in a downgrade, withdrawal or qualification of the respective ratings assigned to the Series 2015-NXS2 Certificates; (iv) the execution of an intercreditor agreement acceptable to the lender; and (v) no event of default exists with respect to the 655 K Street mortgage loan. |
| (2) | Ongoing monthly reserves for insurance are not required as long as (i) there is no event of default; (ii) the 655 K Street Property is insured by an acceptable blanket insurance policy; and (iii) the borrower provides the lender with evidence of renewal of insurance policies and timely proof of payment of insurance premiums. |
| (3) | The loan documents provide for $695,628 for initial tenant improvements ($544,328 for CVS, $60,040 for Pie 360 and $91,260 for Nussbar (dba Shouk)). |
| (4) | The loan documents provide for $40,389 for the initial leasing commissions ($20,021 for Pie 360 and $20,368 for Nussbar (dba Shouk)). |
| (5) | The loan documents provide for $171,447 for outstanding free rent ($70,047 for Pie 360 and $101,400 for Nussbar (dba Shouk)). |
| (6) | See “Historical Occupancy” Section. |
| (7) | The “As Stabilized” Appraised Value is $24,400,000 as of December 1, 2015, which results in a Cut-off Date LTV Ratio and LTV Ratio at Maturity or ARD of 65.4% and 52.0%, respectively. |
The 655 K Street mortgage loan is evidenced by a single promissory note that is secured by a first mortgage encumbering two retail condominium units (the “655 K Street Property”) totaling 13,926 square feet which are located on the ground floor of a recently completed, 11-story, 287,792 square foot, class A office building in Washington, District of Columbia. As of March 20, 2015, the 655 K Street Property is 100.0% leased to three tenants including CVS and two restaurants. Although not part of the collateral, the office portion of the building is entirely occupied by the Association of American Medical Colleges. The 655 K Street Property is located in Washington District of Columbia’s East End submarket and more specifically within the Mount Vernon Square neighborhood. The 655 K Street Property is a mid-block property with frontage along both K Street and New York Avenue (US-Route 50). According to a third party market research report, as of the fourth quarter of 2014, the East End submarket had a total retail inventory of 1,828,625 square feet and an overall vacancy rate of 4.1%.
THE INFORMATION IN THIS STRUCTURAL AND COLLATERAL TERM SHEET IS NOT COMPLETE AND MAY BE AMENDED PRIOR TO THE TIME OF SALE. THIS TERM SHEET IS NOT AN OFFER TO SELL THESE SECURITIES AND IT IS NOT A SOLICITATION OF AN OFFER TO BUY THESE SECURITIES IN ANY JURISDICTION WHERE THE OFFER OR SALE IS NOT PERMITTED.
| 116 |
| 655 K STREET |
Sources and Uses
| Sources | Uses | |||||||
| Original loan amount | $16,000,000 | 100.0% | Loan payoff | $9,100,000 | 56.9% | |||
| Reserves | 1,435,390 | 9.0 | ||||||
| Closing costs | 168,820 | 1.1 | ||||||
| Return of equity | 5,295,789 | 33.1 | ||||||
| Total Sources | $16,000,000 | 100.0% | Total Uses | $16,000,000 | 100.0% | |||
The following table presents certain information relating to the tenancy at the 655 K Street Property:
Major Tenants
| Tenant Name | Credit Rating (Fitch/Moody’s/ S&P)(1) | Tenant NRSF | % of NRSF | Annual U/W Base Rent PSF | Annual U/W Base Rent | % of Total Annual U/W Base Rent | Lease Expiration Date |
| Major Tenants | |||||||
| CVS | NR/Baa1/BBB+ | 10,904 | 78.3% | $93.18 | $1,016,040 | 80.8% | 3/31/2030(2) |
| Nussbar (dba Shouk) | NR/NR/NR | 1,521 | 10.9% | $80.00 | $121,680 | 9.7% | 2/28/2026(3) |
| Pie 360 | NR/NR/NR | 1,501 | 10.8% | $80.00 | $120,080 | 9.5% | 11/30/2025(4) |
| Total Major Tenants | 13,926 | 100.0% | $90.32 | $1,257,800 | 100.0% | ||
| Occupied Collateral Total | 13,926 | 100.0% | $90.32 | $1,257,800 | 100.0% | ||
| Vacant Space | 0 | 0.0% | |||||
| Collateral Total | 13,926 | 100.0% | |||||
| (1) | Certain ratings are those of the parent company whether or not the parent company guarantees the lease. |
| (2) | CVS is not yet open for business; however, CVS commenced paying rent on April 1, 2015 and is expected to open for business by December 2015. CVS has three five-year renewal options. |
| (3) | Nussbar (dba Shouk) has not yet taken possession of its space. Nussbar (dba Shouk) has the right to terminate the lease with 60 days’ notice if the landlord fails to deliver the premises to the tenant by the anticipated delivery date with the landlord’s work substantially completed. The landlord expects to deliver the space by July 15, 2015, per the lease the outside delivery date is August 31, 2015. |
| (4) | Pie 360 has not yet taken possession of its space. Pie 360 has the right to terminate the lease with 60 days’ notice if the landlord fails to deliver the premises to the tenant by the anticipated delivery date with the landlord’s work substantially completed. The landlord is past the outside delivery date of June 1, 2015 but Pie 360 has agreed to extend the outside delivery date to July 15, 2015. The landlord expects to deliver the space by July 15, 2015. |
The following table presents certain information relating to the lease rollover schedule at the 655 K Street Property:
Lease Expiration Schedule(1)
| Year Ending December 31, | No. of Leases Expiring | Expiring | % of Total NRSF | Cumulative Expiring NRSF | Cumulative % of Total NRSF | Annual U/W Base Rent | Annual U/W Base Rent PSF |
| MTM | 0 | 0 | 0.0% | 0 | 0.0% | $0 | $0.00 |
| 2015 | 0 | 0 | 0.0% | 0 | 0.0% | $0 | $0.00 |
| 2016 | 0 | 0 | 0.0% | 0 | 0.0% | $0 | $0.00 |
| 2017 | 0 | 0 | 0.0% | 0 | 0.0% | $0 | $0.00 |
| 2018 | 0 | 0 | 0.0% | 0 | 0.0% | $0 | $0.00 |
| 2019 | 0 | 0 | 0.0% | 0 | 0.0% | $0 | $0.00 |
| 2020 | 0 | 0 | 0.0% | 0 | 0.0% | $0 | $0.00 |
| 2021 | 0 | 0 | 0.0% | 0 | 0.0% | $0 | $0.00 |
| 2022 | 0 | 0 | 0.0% | 0 | 0.0% | $0 | $0.00 |
| 2023 | 0 | 0 | 0.0% | 0 | 0.0% | $0 | $0.00 |
| 2024 | 0 | 0 | 0.0% | 0 | 0.0% | $0 | $0.00 |
| 2025 | 1 | 1,501 | 10.8% | 1,501 | 10.8% | $120,080 | $80.00 |
| Thereafter | 2 | 12,425 | 89.2% | 13,926 | 100.0% | $1,137,720 | $91.57 |
| Vacant | 0 | 0 | 0.0% | 13,926 | 100.0% | $0 | $0.00 |
| Total/Weighted Average | 3 | 13,926 | 100.0% | $1,257,800 | $90.32 |
| (1) | Information obtained from the underwritten rent roll. |
THE INFORMATION IN THIS STRUCTURAL AND COLLATERAL TERM SHEET IS NOT COMPLETE AND MAY BE AMENDED PRIOR TO THE TIME OF SALE. THIS TERM SHEET IS NOT AN OFFER TO SELL THESE SECURITIES AND IT IS NOT A SOLICITATION OF AN OFFER TO BUY THESE SECURITIES IN ANY JURISDICTION WHERE THE OFFER OR SALE IS NOT PERMITTED.
| 117 |
| 655 K STREET |
The following table presents historical occupancy percentages at the 655 K Street Property:
Historical Occupancy
12/31/2012(1) | 12/31/2013(1) | 12/31/2014(1) | 3/20/2015(2) | |||
| NAP | NAP | NAP | 100.0% |
| (1) | Historical occupancy is not available as the property was completed in 2015. |
| (2) | Information obtained from the underwritten rent roll. The 655 K Street Property is 100.0% leased. Pie 360 and Nussbar (dba Shouk) are expected to take possession of their premises by mid-July 2015.Occupancy excluding these two tenants is 78.3%. |
Operating History and Underwritten Net Cash Flow.The following table presents certain information relating to the historical operating performance and underwritten net cash flow at the 655 K Street Property:
Cash Flow Analysis(1)
| U/W | % of U/W Effective Gross Income | U/W $ per SF | |||||
| Base Rent | $1,257,800 | 87.1% | $90.32 | ||||
| Percentage Rent | 0 | 0.0 | 0.00 | ||||
| Total Reimbursables | 230,096 | 15.9 | 16.52 | ||||
| Other Income | 0 | 0.0 | 0.00 | ||||
| Less Vacancy & Credit Loss | (44,637)(2) | (3.1) | (3.21) | ||||
| Effective Gross Income | $1,443,259 | 100.0% | $103.64 | ||||
| Total Operating Expenses | $268,938 | 18.6 | $19.31 | ||||
| Net Operating Income | $1,174,322 | 81.4% | $84.33 | ||||
| TI/LC | 3,022 | 0.2 | 0.22 | ||||
| Capital Expenditures | 696 | 0.0 | 0.05 | ||||
| Net Cash Flow | $1,170,603 | 81.1% | $84.06 | ||||
| NOI DSCR | 1.29x | ||||||
| NCF DSCR | 1.28x | ||||||
| NOI DY | 7.4% | ||||||
| NCF DY | 7.3% |
| (1) | Historical cash flows are not available as the property was completed in 2015. |
| (2) | The underwritten economic vacancy is 3.1 %. The 655 K Street Property was 100.0% leased as of March 20, 2015. |
THE INFORMATION IN THIS STRUCTURAL AND COLLATERAL TERM SHEET IS NOT COMPLETE AND MAY BE AMENDED PRIOR TO THE TIME OF SALE. THIS TERM SHEET IS NOT AN OFFER TO SELL THESE SECURITIES AND IT IS NOT A SOLICITATION OF AN OFFER TO BUY THESE SECURITIES IN ANY JURISDICTION WHERE THE OFFER OR SALE IS NOT PERMITTED.
| 118 |
| Wells Fargo Commercial Mortgage Trust 2015-NXS2 | Transaction Contact Information |
VI. Transaction Contact Information
Questions regarding this Structural and Collateral Term Sheet may be directed to any of the following individuals:
| Wells Fargo Securities, LLC | |
| Brigid Mattingly | Tel. (312) 269-3062 |
| Fax (312) 658-0140 | |
| A.J. Sfarra | Tel. (212) 214-5613 |
| Fax (212) 214-8970 | |
| Alex Wong | Tel. (212) 214-5615 |
| Fax (212) 214-8970 |
THE INFORMATION IN THIS STRUCTURAL AND COLLATERAL TERM SHEET IS NOT COMPLETE AND MAY BE AMENDED PRIOR TO THE TIME OF SALE. THIS TERM SHEET IS NOT AN OFFER TO SELL THESE SECURITIES AND IT IS NOT A SOLICITATION OF AN OFFER TO BUY THESE SECURITIES IN ANY JURISDICTION WHERE THE OFFER OR SALE IS NOT PERMITTED.
| 119 |