Exhibit 99.1
| 1 Investor Presentation February 2025 |

| 2 This presentation contains information about Service Properties Trust, Diversified Healthcare Trust, Office Properties Income Trust, Industrial Logistics Properties Trust and Seven Hills Realty Trust (together, the REITs). The information regarding each REIT (each, a company) has been provided solely by that company. No company guarantees the accuracy or completeness of information herein about another company. Each company’s filings with the securities and exchange commission (SEC) are available at the SEC’s website at www.sec.gov. This presentation contains forward-looking statements within the meaning of the Private Securities Litigation Reform Act of 1995 and other securities laws that are subject to risks and uncertainties. These statements may include words such as “believe”, “expect”, “anticipate”, “intend”, “plan”, “estimate”, “will”, “opportunity”, “may”, “positioned”, “potential” and negatives or derivatives of these or similar expressions. These forward-looking statements include, among others, statements about: RMR’s business strategy; economic and industry conditions; the impact and opportunities for RMR and RMR’s clients’ businesses from business cycles in the U.S. real estate industry as well as economic and industry conditions, including interest rates; RMR’s belief that it is possible to grow real estate based businesses in selected property types or geographic areas despite national trends; RMR’s liquidity, including its sufficiency to pursue a range of capital allocation strategies and fund RMR’s operations and enhance its technology infrastructure and limit risk exposure; and RMR’s sustainability practices. Forward-looking statements reflect RMR’s current expectations and those of the REITs, are based on judgments and assumptions, are inherently uncertain and are subject to risks, uncertainties and other factors, which could cause actual results, performance or achievements to differ materially from expected future results, performance or achievements expressed or implied in those forward-looking statements. Forward looking statements are not guaranteed to occur and may not occur. Some of the risks, uncertainties and other factors that may cause actual results, performance or achievements to differ materially from those expressed or implied by forward-looking statements include, but are not limited to, the following: The dependence of RMR's revenues on a limited number of clients; the variability of its revenues; risks related to supply chain constraints, commodity pricing and inflation, including inflation impacting wages and employee benefits; changing market conditions, practices and trends, which may adversely impact its clients and the fees RMR receives from them; potential terminations of the management agreements with its clients; uncertainty surrounding interest rates and sustained high interest rates, which may impact RMR's clients and significantly reduce RMR's revenues or impede its growth; RMR's dependence on the growth and performance of its clients; RMR's ability to obtain or create new clients for its business which is often dependent on circumstances beyond RMR's control; the ability of RMR's clients to operate their businesses profitably, optimize their capital structures and to grow and increase their market capitalizations and total shareholder returns; RMR's ability to successfully provide management services to its clients; RMR's ability to maintain or increase the distributions RMR pays to its shareholders; RMR's ability to successfully pursue and execute capital allocation and new business strategies; RMR's ability to prudently invest in its business to enhance its operations, services and competitive positioning; RMR's ability to successfully grow the RMR Residential business and realize RMR's expected returns on its investment within the anticipated timeframe; RMR's ability to successfully integrate acquired businesses and realize the expected returns on its investments; the ability of Tremont to identify and close suitable investments for RMR's private capital debt vehicle, or its Real Estate Lending Venture, and SEVN and to monitor, service and administer existing investments; RMR's ability to obtain additional capital from third party investors in its Real Estate Lending Venture in order to make additional investments and to increase potential returns; changes to RMR's operating leverage or client diversity; litigation risks; risks related to acquisitions, dispositions and other activities by or among its clients; allegations, even if untrue, of any conflicts of interest arising from RMR's management activities; RMR's ability to retain the services of its managing directors and other key personnel; RMR's and its clients’ risks associated with RMR's and its clients' costs of compliance with laws and regulations, including securities regulations, exchange listing standards and other laws and regulations affecting public companies; and other matters. These risks, uncertainties and other factors are not exhaustive and should be read in conjunction with other cautionary statements that are included in RMR's and each company’s periodic filings. The information contained in RMR’s and each company’s filings with the SEC, including under the caption “Risk Factors” in its periodic reports, or incorporated therein, identifies important factors that could cause differences from the forward-looking statements in this presentation. RMR’s and each company’s filings with the SEC are available on the SEC’s website at www.sec.gov. You should not place undue reliance on forward-looking statements. Except as required by law, RMR and the applicable companies do not intend to update or change any forward-looking statements as a result of new information, future events or otherwise. Unless otherwise expressly noted, all data presented are as of or for the fiscal quarter ended December 31, 2024. This presentation may contain or refer to third party reports and other information relating to the REITs or other persons. The author and source of any third party information and the date of its publication are clearly and prominently identified. No company has communicated with the providers of this information in this presentation. The REITs have not independently verified any of the third party information, have not assisted in the preparation of the third party information, cannot guarantee the accuracy, completeness or availability of the third party information and do not explicitly or implicitly endorse or approve such information. Warning Regarding Forward-Looking Statements and Disclaimers 2 |
| 3 Overview of The RMR Group (Nasdaq: RMR) |
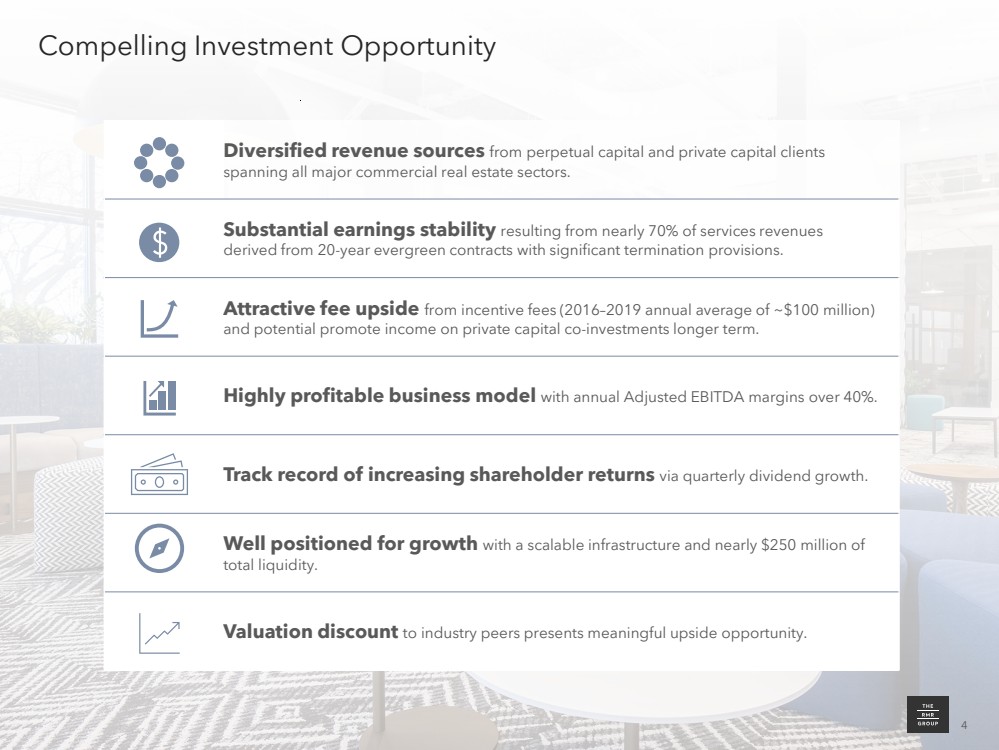
| 4 1 Diversified revenue sources from perpetual capital and private capital clients spanning all major commercial real estate sectors. Substantial earnings stability resulting from nearly 70% of services revenues derived from 20-year evergreen contracts with significant termination provisions. Attractive fee upside from incentive fees (2016–2019 annual average of ~$100 million) and potential promote income on private capital co-investments longer term. Highly profitable business model with annual Adjusted EBITDA margins over 40%. Track record of increasing shareholder returns via quarterly dividend growth. Well positioned for growth with a scalable infrastructure and nearly $250 million of total liquidity. Valuation discount to industry peers presents meaningful upside opportunity. Compelling Investment Opportunity 4 |
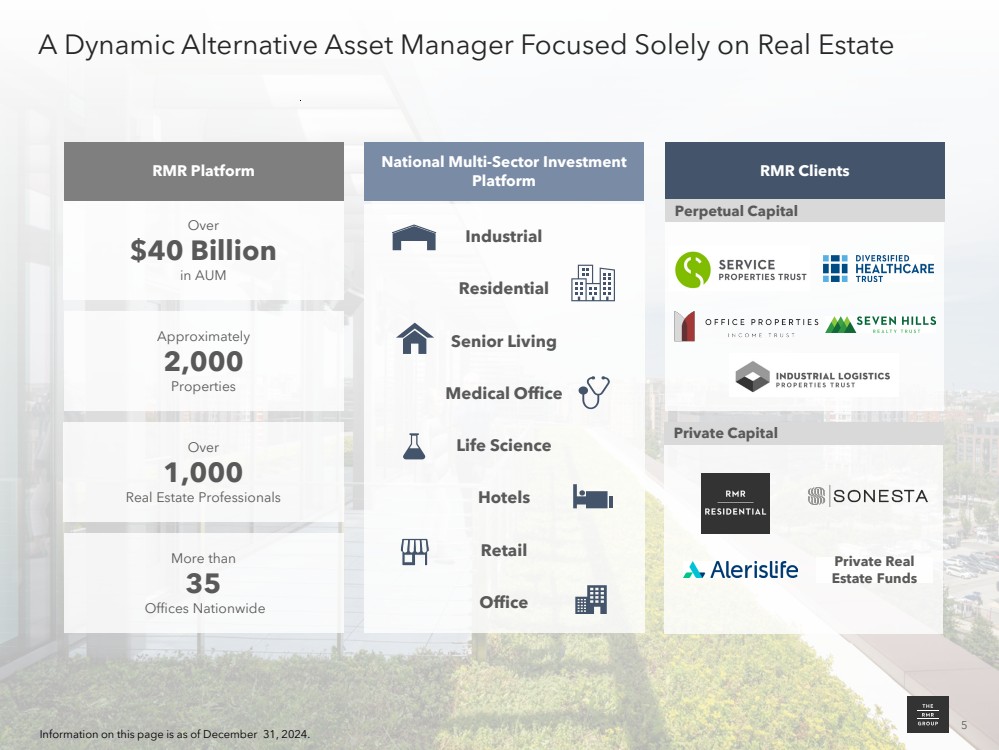
| 5 Private Clients A Dynamic Alternative Asset Manager Focused Solely on Real Estate Over $40 Billion in AUM RMR Platform Approximately 2,000 Properties More than 35 Offices Nationwide Over 1,000 Real Estate Professionals National Multi-Sector Investment Platform Industrial Residential Senior Living Medical Office Life Science Hotels Retail Office RMR Clients Perpetual Capital Private Real Estate Funds Private Capital 5 Information on this page is as of December 31, 2024. |
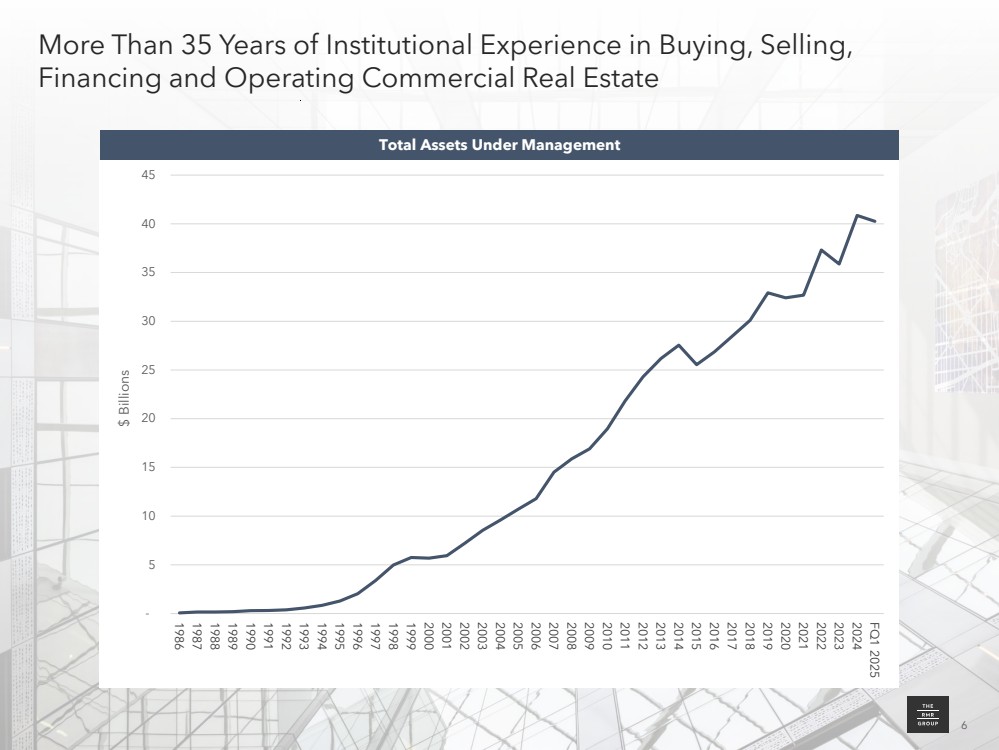
| 6 More Than 35 Years of Institutional Experience in Buying, Selling, Financing and Operating Commercial Real Estate - 5 10 15 20 25 30 35 40 45 1986 1987 1988 1989 1990 1991 1992 1993 1994 1995 1996 1997 1998 1999 2000 2001 2002 2003 2004 2005 2006 2007 2008 2009 2010 2011 2012 2013 2014 2015 2016 2017 2018 2019 2020 2021 2022 2023 2024 FQ1 2025 $ Billions Total Assets Under Management 6 |
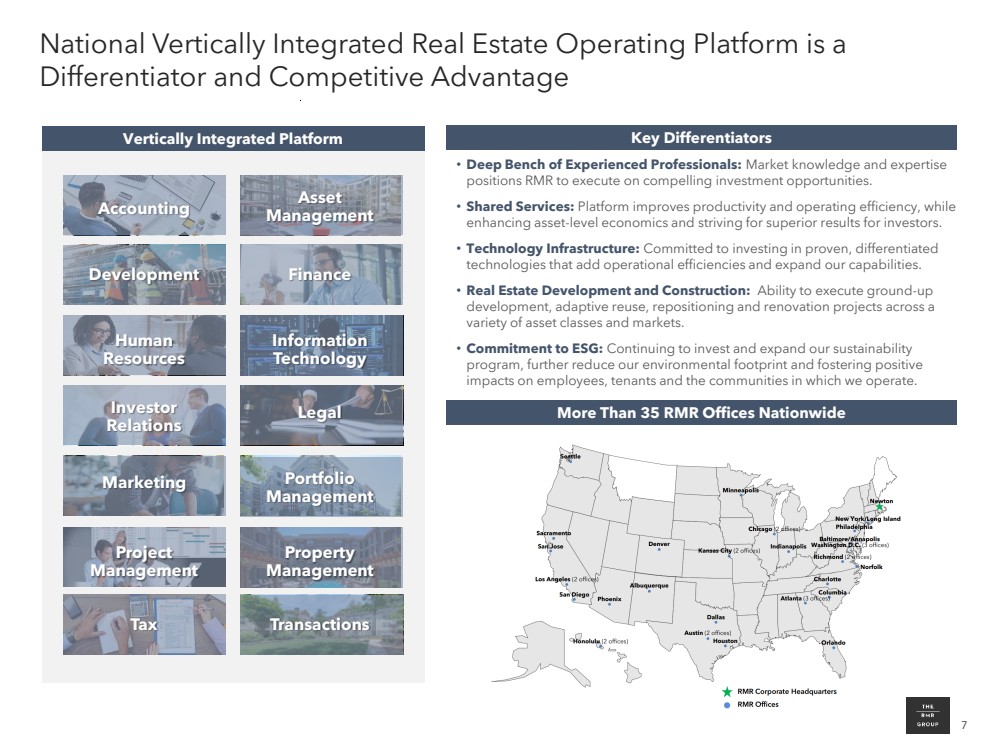
| 7 Vertically Integrated Platform Accounting Marketing Human Resources Investor Relations Property Management Development Finance Legal Information Technology Project Management Tax Portfolio Management Transactions Asset Management Key Differentiators • Deep Bench of Experienced Professionals: Market knowledge and expertise positions RMR to execute on compelling investment opportunities. • Shared Services: Platform improves productivity and operating efficiency, while enhancing asset-level economics and striving for superior results for investors. • Technology Infrastructure: Committed to investing in proven, differentiated technologies that add operational efficiencies and expand our capabilities. • Real Estate Development and Construction: Ability to execute ground-up development, adaptive reuse, repositioning and renovation projects across a variety of asset classes and markets. • Commitment to ESG: Continuing to invest and expand our sustainability program, further reduce our environmental footprint and fostering positive impacts on employees, tenants and the communities in which we operate. National Vertically Integrated Real Estate Operating Platform is a Differentiator and Competitive Advantage More Than 35 RMR Offices Nationwide |
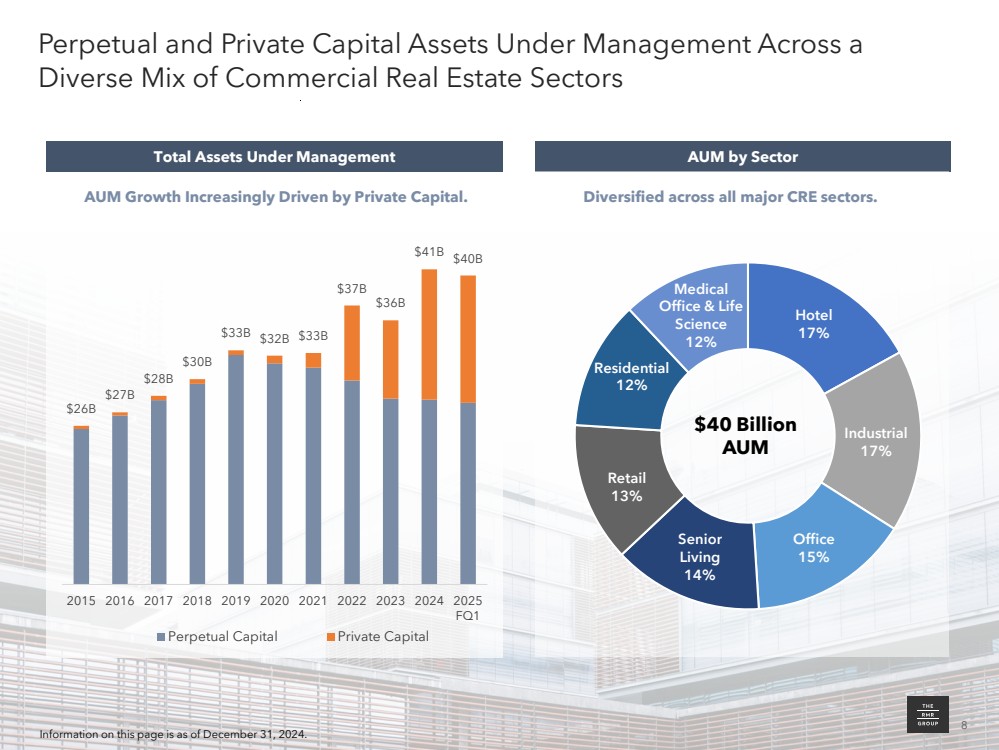
| 8 $26B $27B $28B $30B $33B $32B $33B $37B $36B $41B $40B 2015 2016 2017 2018 2019 2020 2021 2022 2023 2024 2025 FQ1 Perpetual Capital Private Capital Perpetual and Private Capital Assets Under Management Across a Diverse Mix of Commercial Real Estate Sectors AUM by Sector Diversified across all major CRE sectors. $40 Billion AUM 8 Information on this page is as of December 31, 2024. Total Assets Under Management AUM Growth Increasingly Driven by Private Capital. Hotel 17% Industrial 17% Office 15% Senior Living 14% Retail 13% Residential 12% Medical Office & Life Science 12% |
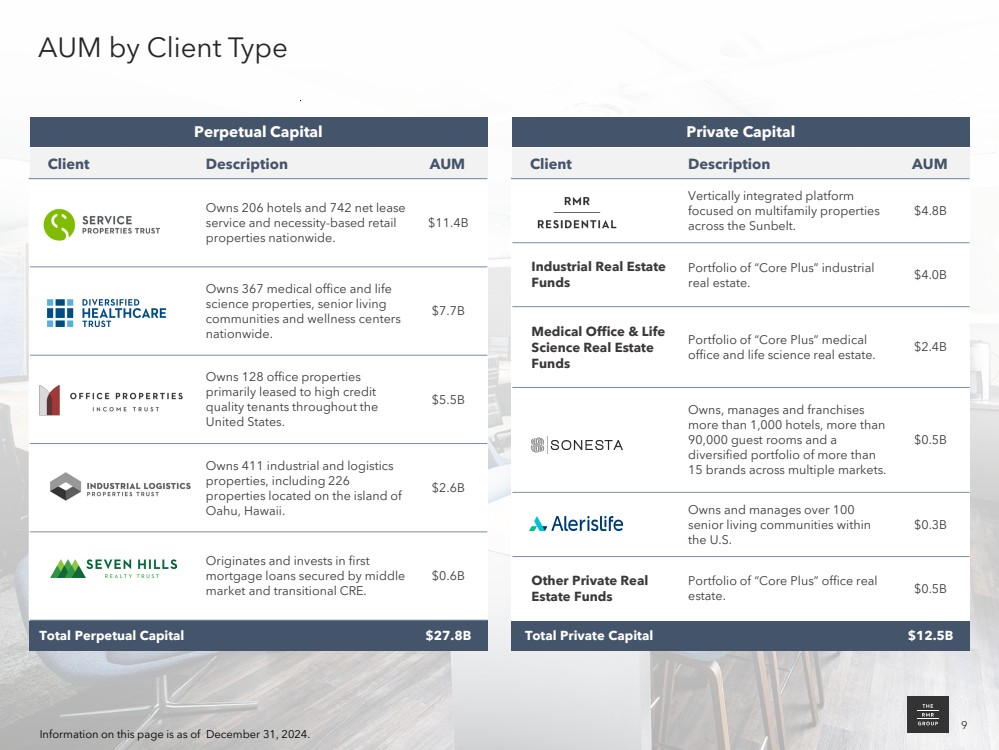
| 9 AUM by Client Type Vertically integrated platform focused on multifamily properties across the Sunbelt. $4.8B Industrial Real Estate Funds Portfolio of “Core Plus” industrial real estate. $4.0B Medical Office & Life Science Real Estate Funds Portfolio of “Core Plus” medical office and life science real estate. $2.4B Owns, manages and franchises more than 1,000 hotels, more than 90,000 guest rooms and a diversified portfolio of more than 15 brands across multiple markets. $0.5B Owns and manages over 100 senior living communities within the U.S. $0.3B Other Private Real Estate Funds Portfolio of “Core Plus” office real estate. $0.5B Total Private Capital $12.5B Client Description AUM 9 Private Capital Owns 206 hotels and 742 net lease service and necessity-based retail properties nationwide. $11.4B Owns 367 medical office and life science properties, senior living communities and wellness centers nationwide. $7.7B Owns 128 office properties primarily leased to high credit quality tenants throughout the United States. $5.5B Owns 411 industrial and logistics properties, including 226 properties located on the island of Oahu, Hawaii. $2.6B Originates and invests in first mortgage loans secured by middle market and transitional CRE. $0.6B Total Perpetual Capital $27.8B Client Description AUM Perpetual Capital Information on this page is as of December 31, 2024. |
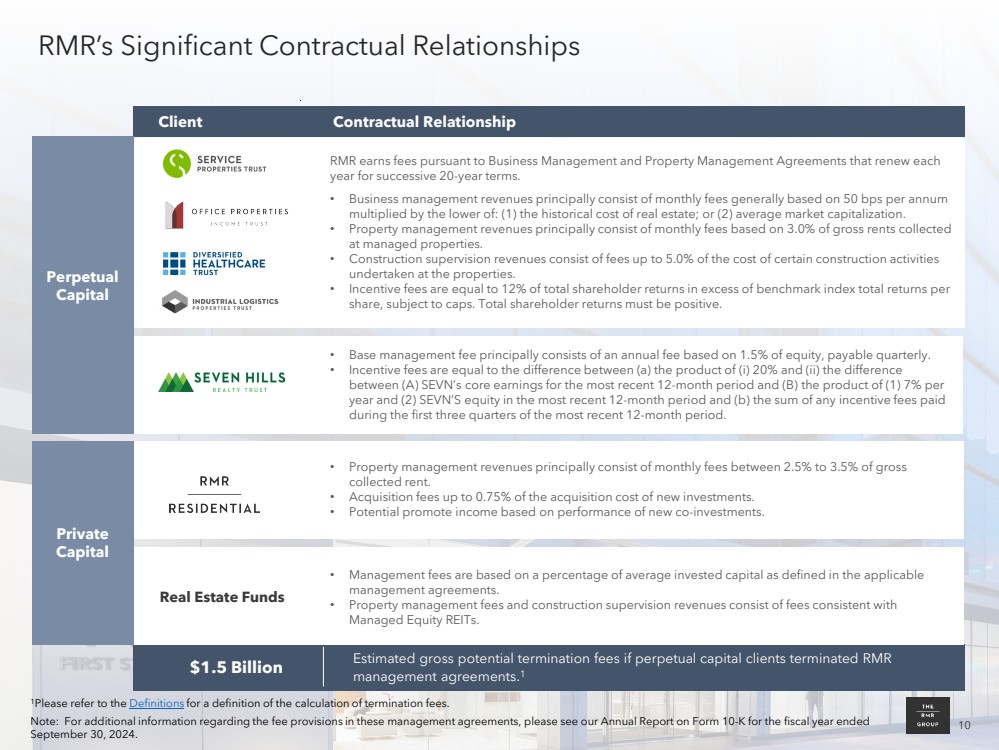
| 10 RMR earns fees pursuant to Business Management and Property Management Agreements that renew each year for successive 20-year terms. • Business management revenues principally consist of monthly fees generally based on 50 bps per annum multiplied by the lower of: (1) the historical cost of real estate; or (2) average market capitalization. • Property management revenues principally consist of monthly fees based on 3.0% of gross rents collected at managed properties. • Construction supervision revenues consist of fees up to 5.0% of the cost of certain construction activities undertaken at the properties. • Incentive fees are equal to 12% of total shareholder returns in excess of benchmark index total returns per share, subject to caps. Total shareholder returns must be positive. RMR’s Significant Contractual Relationships 1Please refer to the Definitions for a definition of the calculation of termination fees. Note: For additional information regarding the fee provisions in these management agreements, please see our Annual Report on Form 10-K for the fiscal year ended September 30, 2024. • Property management revenues principally consist of monthly fees between 2.5% to 3.5% of gross collected rent. • Acquisition fees up to 0.75% of the acquisition cost of new investments. • Potential promote income based on performance of new co-investments. • Management fees are based on a percentage of average invested capital as defined in the applicable management agreements. • Property management fees and construction supervision revenues consist of fees consistent with Managed Equity REITs. Estimated gross potential termination fees if perpetual capital clients terminated RMR management agreements. $1.5 Billion 1 Client Contractual Relationship 10 Real Estate Funds • Base management fee principally consists of an annual fee based on 1.5% of equity, payable quarterly. • Incentive fees are equal to the difference between (a) the product of (i) 20% and (ii) the difference between (A) SEVN’s core earnings for the most recent 12-month period and (B) the product of (1) 7% per year and (2) SEVN’S equity in the most recent 12-month period and (b) the sum of any incentive fees paid during the first three quarters of the most recent 12-month period. Perpetual Capital Private Capital |
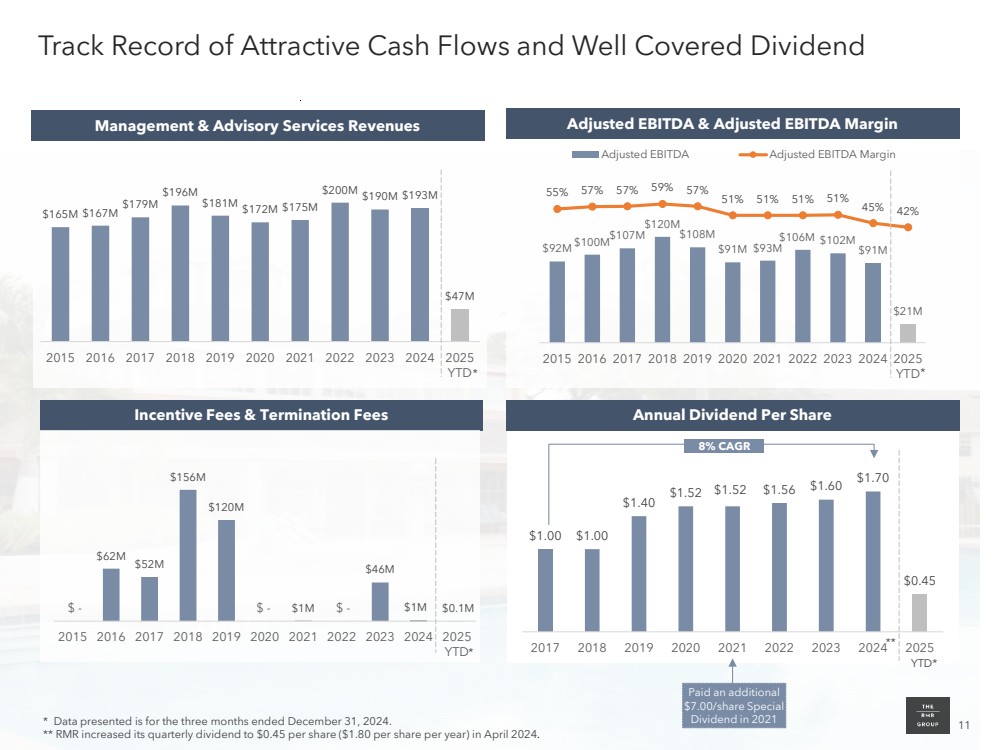
| 11 $92M $100M$107M $120M $108M $91M $93M $106M $102M $91M $21M 55% 57% 57% 59% 57% 51% 51% 51% 51% 45% 42% -40% -30% -20% -10% 0% 10% 20% 30% 40% 50% 60% $0 $20 $40 $60 $80 $100 $120 $140 $160 2015 2016 2017 2018 2019 2020 2021 2022 2023 2024 2025 YTD Adjusted EBITDA Adjusted EBITDA Margin Track Record of Attractive Cash Flows and Well Covered Dividend Incentive Fees & Termination Fees Annual Dividend Per Share $62M $52M $156M $120M $1M $46M $1M $0.1M 2015 2016 2017 2018 2019 2020 2021 2022 2023 2024 2025 YTD $ - $ - $ - $165M $167M $179M $196M $181M $172M $175M $200M $190M $193M $47M 2015 2016 2017 2018 2019 2020 2021 2022 2023 2024 2025 YTD Management & Advisory Services Revenues Adjusted EBITDA & Adjusted EBITDA Margin * Data presented is for the three months ended December 31, 2024. ** RMR increased its quarterly dividend to $0.45 per share ($1.80 per share per year) in April 2024. * * * $1.00 $1.00 $1.40 $1.52 $1.52 $1.56 $1.60 $1.70 $0.45 2017 2018 2019 2020 2021 2022 2023 2024 2025 ** 8% CAGR YTD* Paid an additional $7.00/share Special Dividend in 2021 |
| 12 Positioned for Growth 12 |
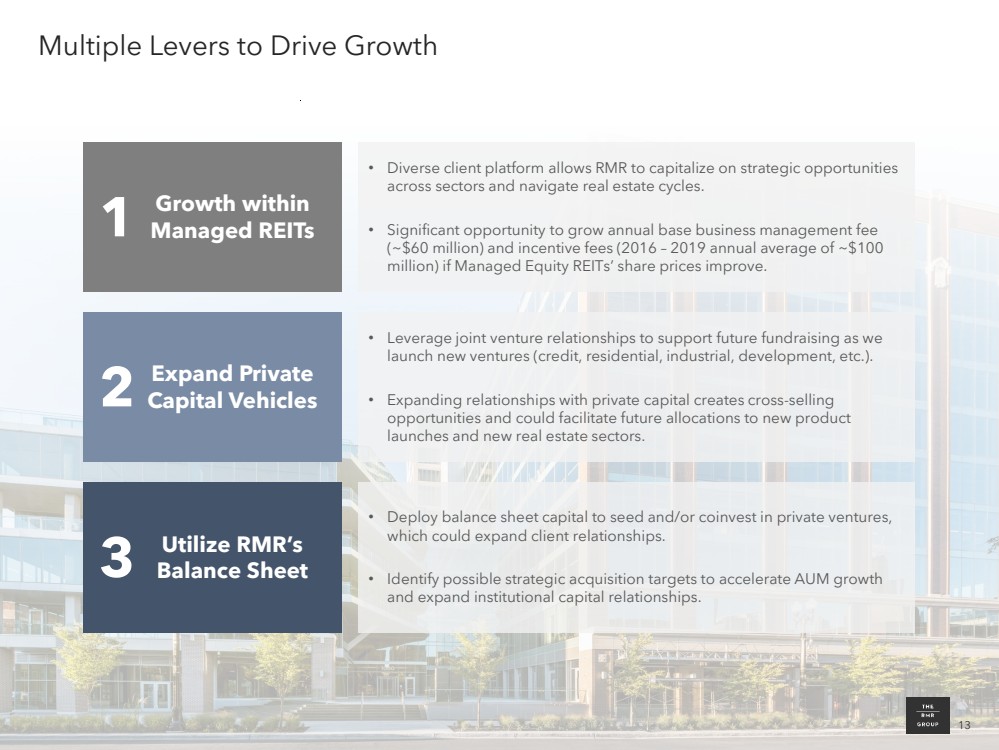
| 13 Multiple Levers to Drive Growth • Diverse client platform allows RMR to capitalize on strategic opportunities across sectors and navigate real estate cycles. • Significant opportunity to grow annual base business management fee (~$60 million) and incentive fees (2016 – 2019 annual average of ~$100 million) if Managed Equity REITs’ share prices improve. • Leverage joint venture relationships to support future fundraising as we launch new ventures (credit, residential, industrial, development, etc.). • Expanding relationships with private capital creates cross-selling opportunities and could facilitate future allocations to new product launches and new real estate sectors. • Deploy balance sheet capital to seed and/or coinvest in private ventures, which could expand client relationships. • Identify possible strategic acquisition targets to accelerate AUM growth and expand institutional capital relationships. Growth within Managed REITs Expand Private Capital Vehicles 1 2 Utilize RMR’s 3 Balance Sheet 13 |
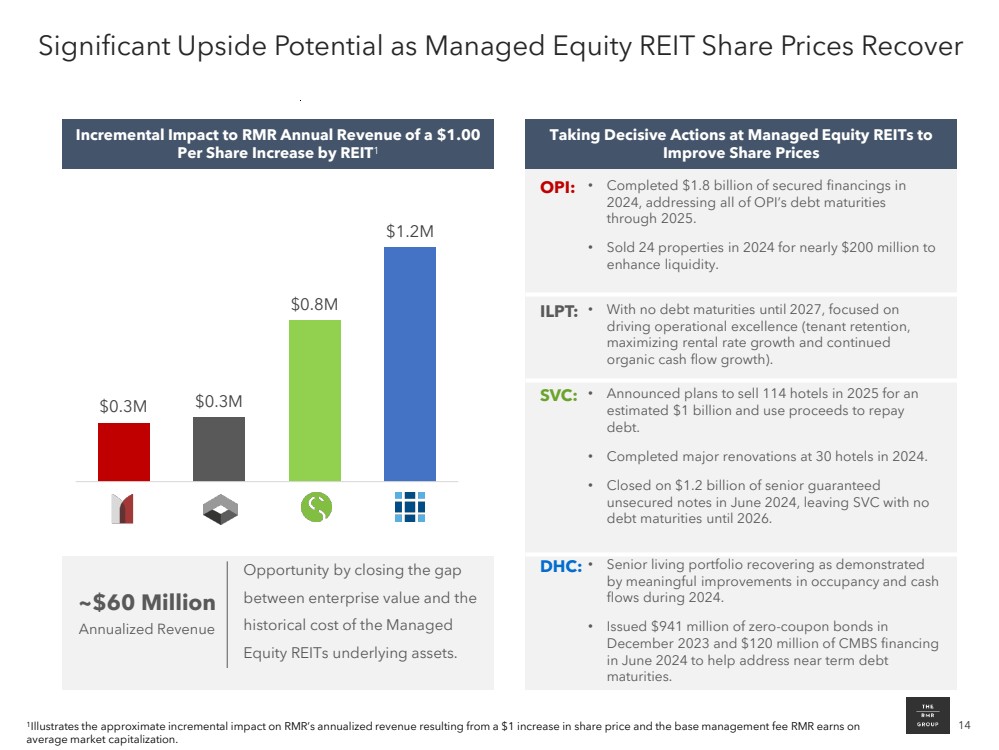
| 14 OPI: • Completed $1.8 billion of secured financings in 2024, addressing all of OPI’s debt maturities through 2025. • Sold 24 properties in 2024 for nearly $200 million to enhance liquidity. ILPT: • With no debt maturities until 2027, focused on driving operational excellence (tenant retention, maximizing rental rate growth and continued organic cash flow growth). SVC: • Announced plans to sell 114 hotels in 2025 for an estimated $1 billion and use proceeds to repay debt. • Completed major renovations at 30 hotels in 2024. • Closed on $1.2 billion of senior guaranteed unsecured notes in June 2024, leaving SVC with no debt maturities until 2026. DHC: • Senior living portfolio recovering as demonstrated by meaningful improvements in occupancy and cash flows during 2024. • Issued $941 million of zero-coupon bonds in December 2023 and $120 million of CMBS financing in June 2024 to help address near term debt maturities. Significant Upside Potential as Managed Equity REIT Share Prices Recover 1Illustrates the approximate incremental impact on RMR’s annualized revenue resulting from a $1 increase in share price and the base management fee RMR earns on average market capitalization. $0.3M $0.3M $0.8M $1.2M OPI ILPT SVC DHC Opportunity by closing the gap between enterprise value and the historical cost of the Managed Equity REITs underlying assets. ~$60 Million Annualized Revenue Incremental Impact to RMR Annual Revenue of a $1.00 Per Share Increase by REIT1 Taking Decisive Actions at Managed Equity REITs to Improve Share Prices |
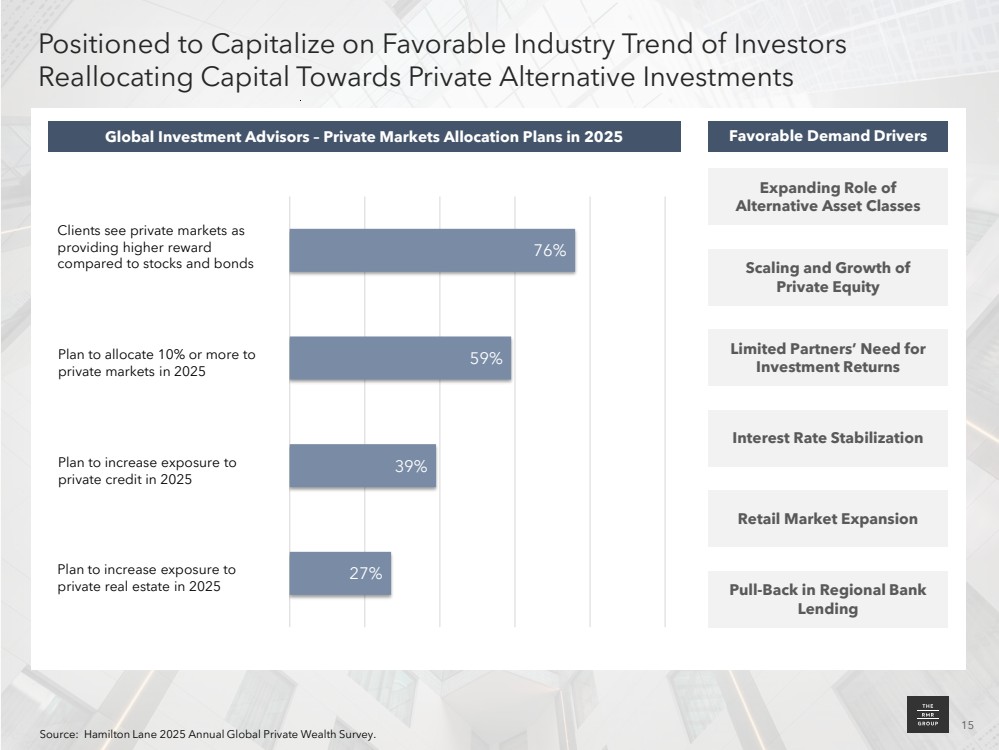
| 15 Positioned to Capitalize on Favorable Industry Trend of Investors Reallocating Capital Towards Private Alternative Investments Source: Hamilton Lane 2025 Annual Global Private Wealth Survey. Favorable Demand Drivers Expanding Role of Alternative Asset Classes Interest Rate Stabilization Retail Market Expansion Pull-Back in Regional Bank Lending Limited Partners’ Need for Investment Returns Scaling and Growth of Private Equity 27% 39% 59% 76% Global Investment Advisors – Private Markets Allocation Plans in 2025 15 Clients see private markets as providing higher reward compared to stocks and bonds Plan to increase exposure to private credit in 2025 Plan to allocate 10% or more to private markets in 2025 Plan to increase exposure to private real estate in 2025 |
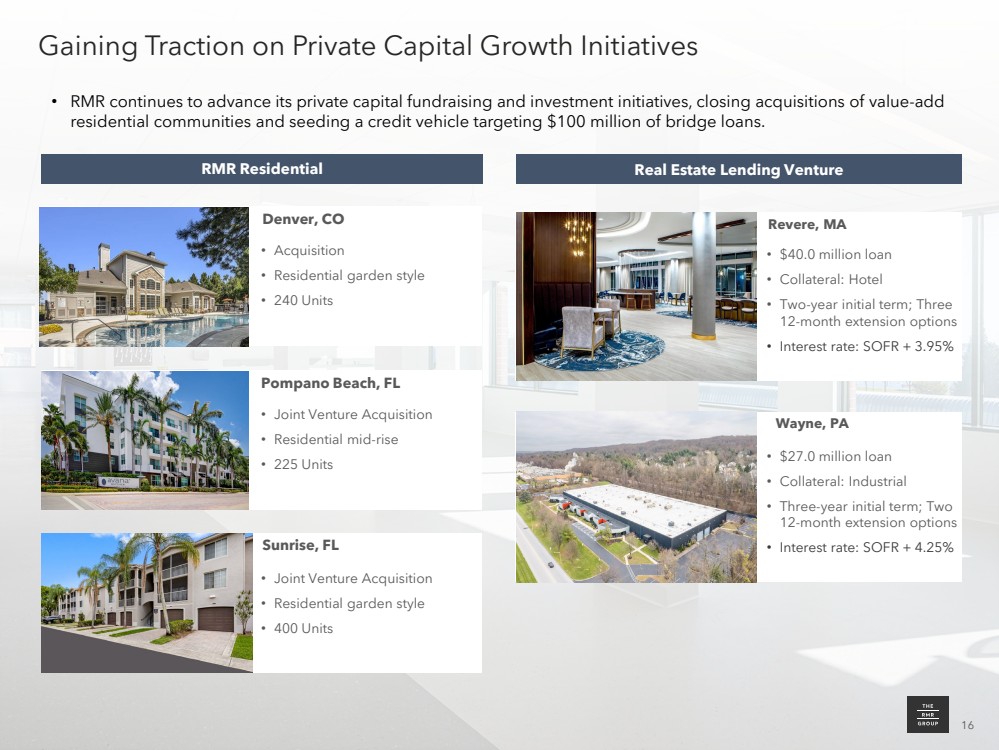
| 16 Gaining Traction on Private Capital Growth Initiatives 16 Pompano Beach, FL Revere, MA Wayne, PA RMR Residential Real Estate Lending Venture • RMR continues to advance its private capital fundraising and investment initiatives, closing acquisitions of value-add residential communities and seeding a credit vehicle targeting $100 million of bridge loans. Sunrise, FL • Joint Venture Acquisition • Residential mid-rise • 225 Units • Joint Venture Acquisition • Residential garden style • 400 Units • $40.0 million loan • Collateral: Hotel • Two-year initial term; Three 12-month extension options • Interest rate: SOFR + 3.95% • $27.0 million loan • Collateral: Industrial • Three-year initial term; Two 12-month extension options • Interest rate: SOFR + 4.25% Denver, CO • Acquisition • Residential garden style • 240 Units |
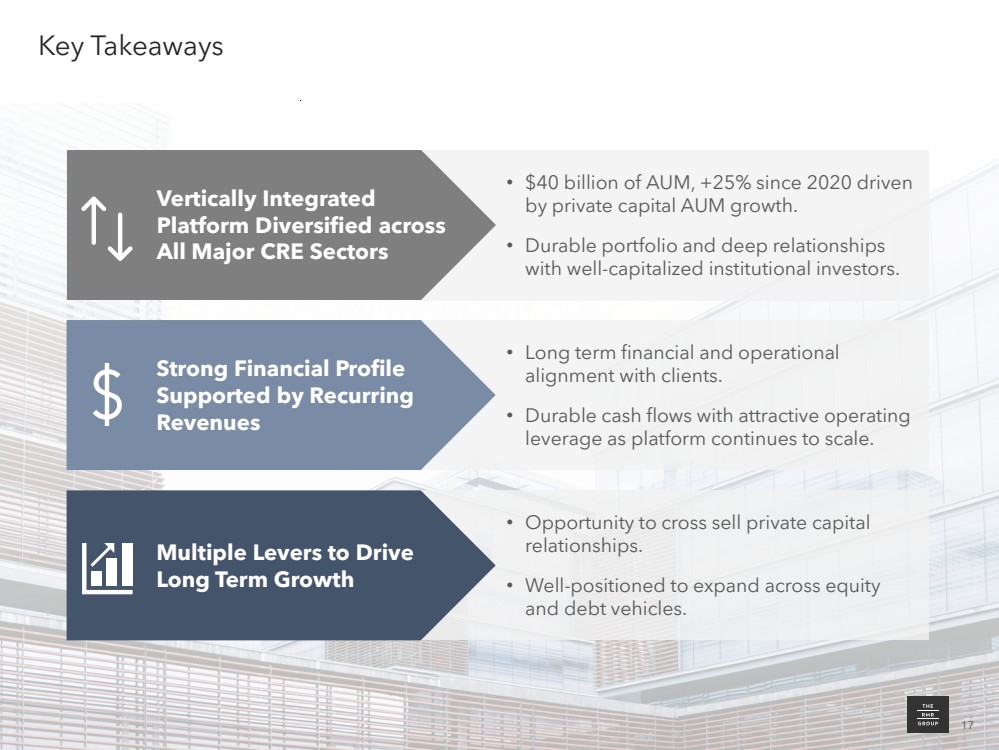
| 17 • Long term financial and operational alignment with clients. • Durable cash flows with attractive operating leverage as platform continues to scale. • Opportunity to cross sell private capital relationships. • Well-positioned to expand across equity and debt vehicles. Key Takeaways • $40 billion of AUM, +25% since 2020 driven by private capital AUM growth. • Durable portfolio and deep relationships with well-capitalized institutional investors. Vertically Integrated Platform Diversified across All Major CRE Sectors Strong Financial Profile Supported by Recurring Revenues Multiple Levers to Drive Long Term Growth 17 |
| 18 Appendix |
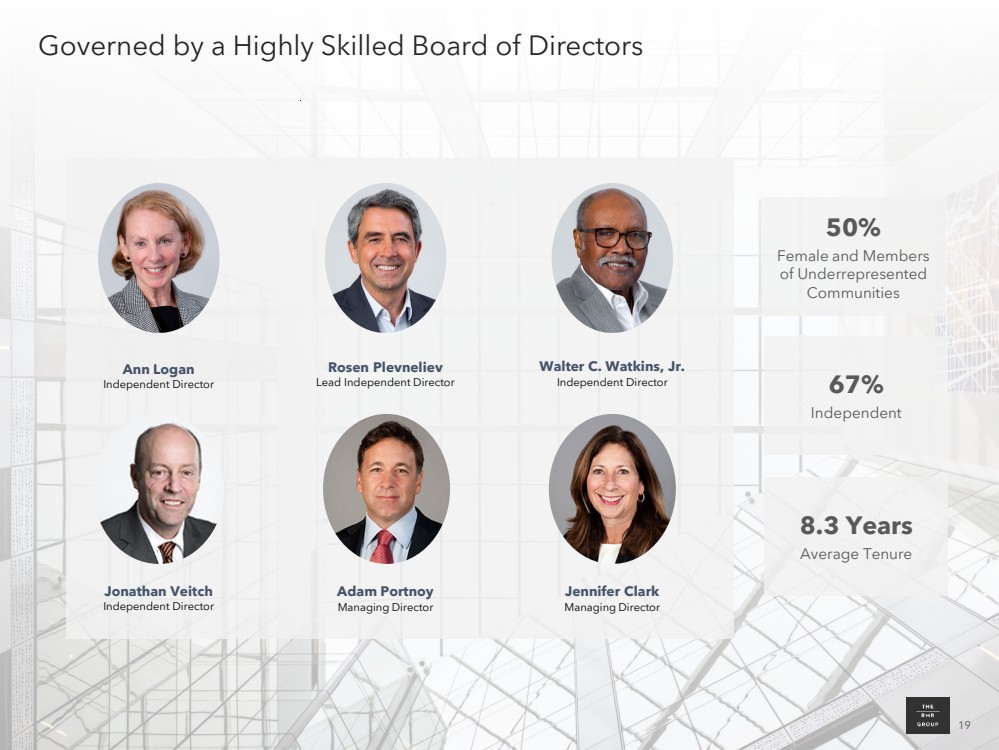
| 19 Governed by a Highly Skilled Board of Directors Ann Logan Independent Director Rosen Plevneliev Lead Independent Director Walter C. Watkins, Jr. Independent Director Jonathan Veitch Independent Director Adam Portnoy Managing Director Jennifer Clark Managing Director 50% Female and Members of Underrepresented Communities 67% Independent 8.3 Years Average Tenure 19 |
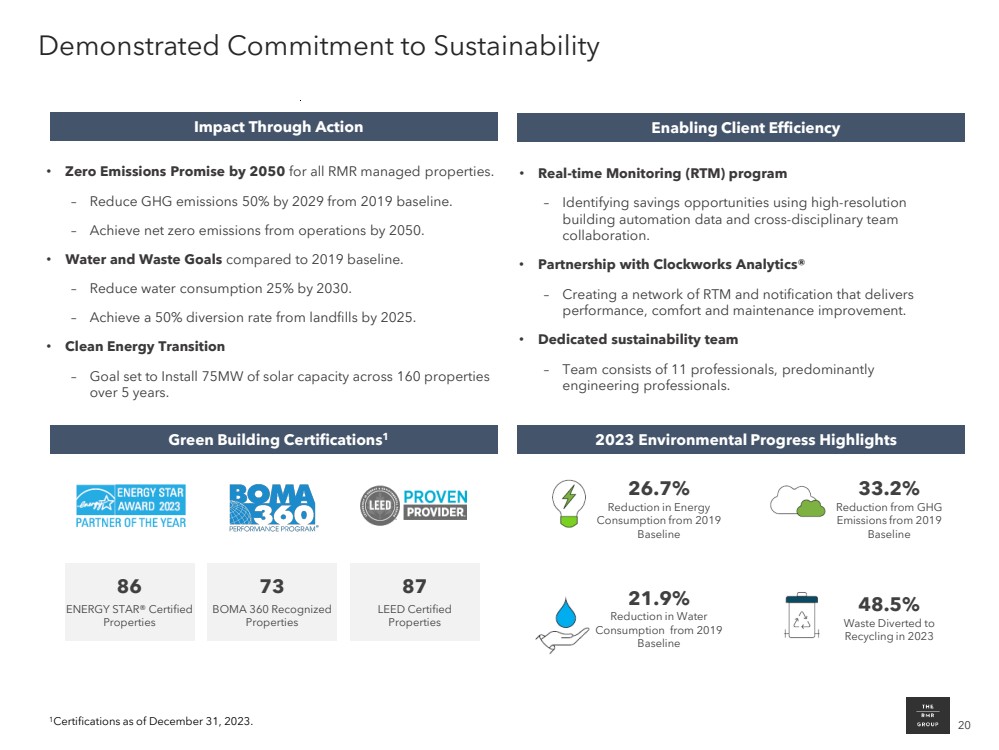
| 20 Demonstrated Commitment to Sustainability 1Certifications as of December 31, 2023. • Zero Emissions Promise by 2050 for all RMR managed properties. – Reduce GHG emissions 50% by 2029 from 2019 baseline. – Achieve net zero emissions from operations by 2050. • Water and Waste Goals compared to 2019 baseline. – Reduce water consumption 25% by 2030. – Achieve a 50% diversion rate from landfills by 2025. • Clean Energy Transition – Goal set to Install 75MW of solar capacity across 160 properties over 5 years. 86 ENERGY STAR® Certified Properties 73 BOMA 360 Recognized Properties 87 LEED Certified Properties Impact Through Action Enabling Client Efficiency • Real-time Monitoring (RTM) program – Identifying savings opportunities using high-resolution building automation data and cross-disciplinary team collaboration. • Partnership with Clockworks Analytics® – Creating a network of RTM and notification that delivers performance, comfort and maintenance improvement. • Dedicated sustainability team – Team consists of 11 professionals, predominantly engineering professionals. Green Building Certifications1 2023 Environmental Progress Highlights 26.7% Reduction in Energy Consumption from 2019 Baseline 33.2% Reduction from GHG Emissions from 2019 Baseline 21.9% Reduction in Water Consumption from 2019 Baseline 48.5% Waste Diverted to Recycling in 2023 |
| 21 Annual Sustainability Report 2023 Annual Sustainability Report To access sustainability reports, visit RMR’s website at www.rmrgroup.com/corporate-sustainability |
| 22 Financials |

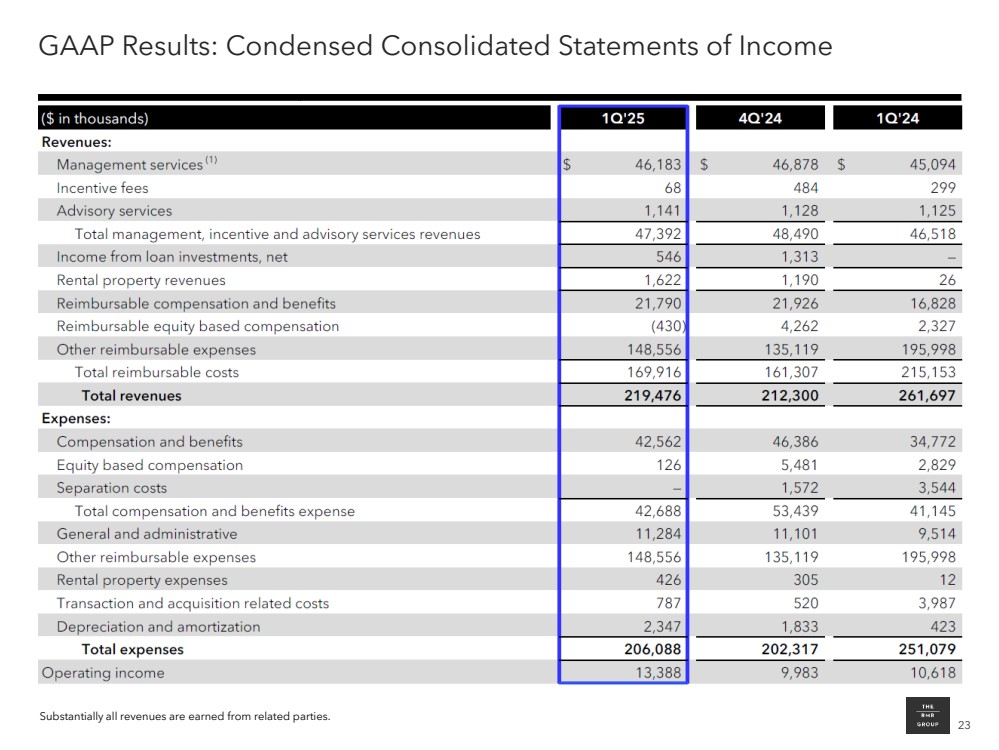
| 23 GAAP Results: Condensed Consolidated Statements of Income Substantially all revenues are earned from related parties. |
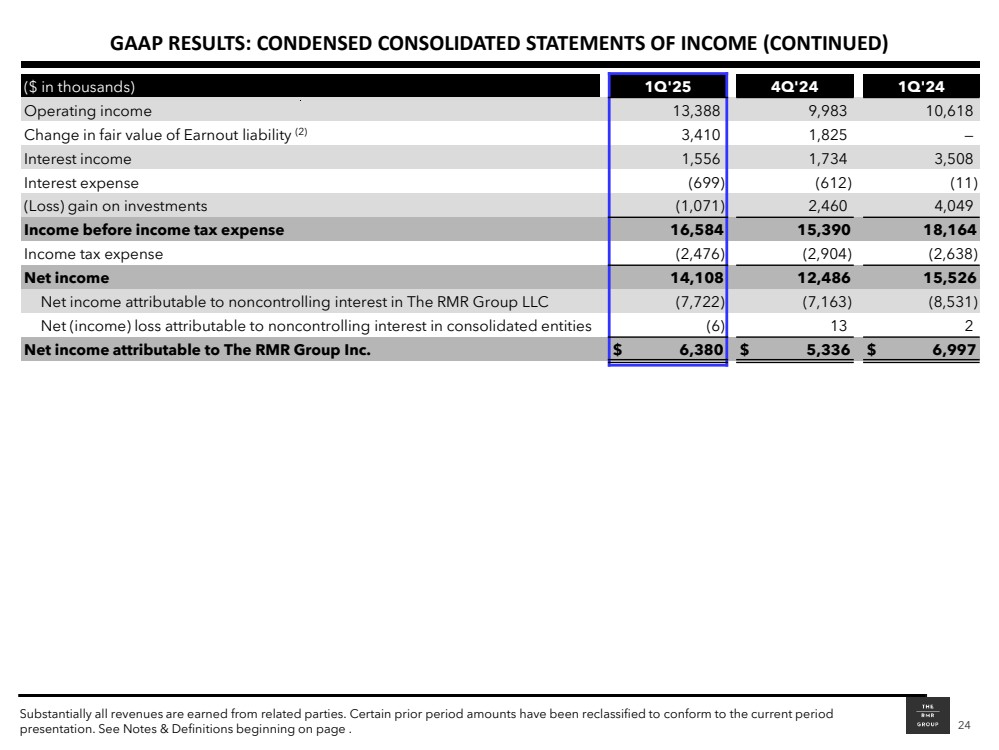
| 24 GAAP RESULTS: CONDENSED CONSOLIDATED STATEMENTS OF INCOME (CONTINUED) ($ in thousands) 1Q'25 4Q'24 1Q'24 Operating income 13,388 9,983 10,618 Change in fair value of Earnout liability (2) 3,410 1,825 — Interest income 1,556 1,734 3,508 Interest expense (699) (612) (11) (Loss) gain on investments (1,071) 2,460 4,049 Income before income tax expense 16,584 15,390 18,164 Income tax expense (2,476) (2,904) (2,638) Net income 14,108 12,486 15,526 Net income attributable to noncontrolling interest in The RMR Group LLC (7,722) (7,163) (8,531) Net (income) loss attributable to noncontrolling interest in consolidated entities (6) 13 2 Net income attributable to The RMR Group Inc. $ 6,380 $ 5,336 $ 6,997 Substantially all revenues are earned from related parties. Certain prior period amounts have been reclassified to conform to the current period presentation. See Notes & Definitions beginning on page . |
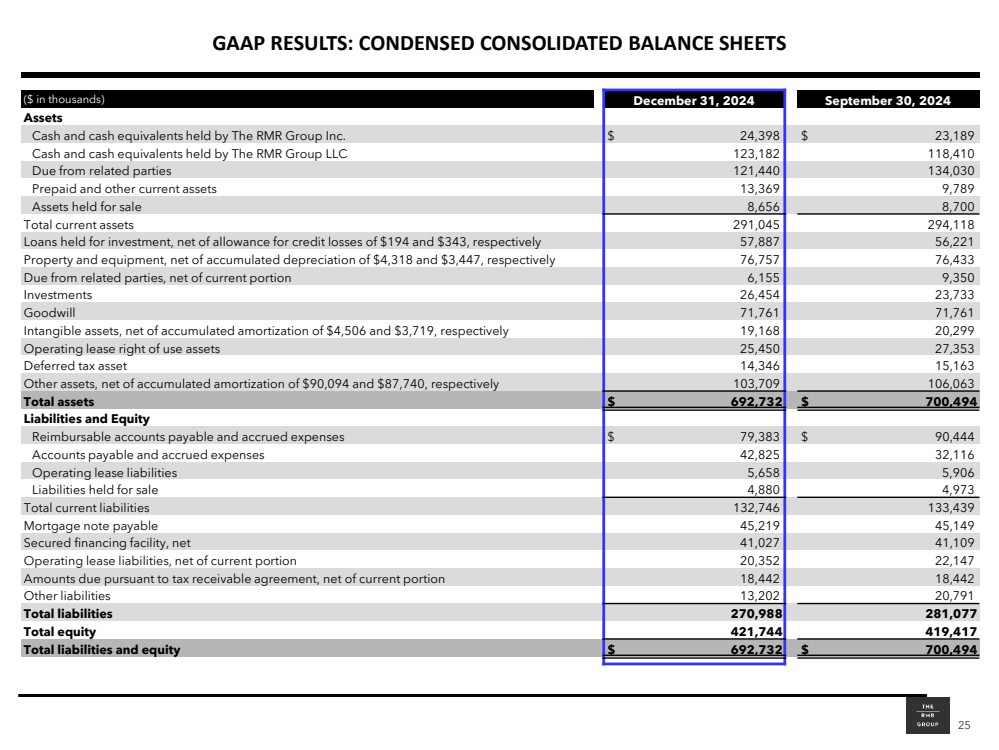
| 25 GAAP RESULTS: CONDENSED CONSOLIDATED BALANCE SHEETS ($ in thousands) December 31, 2024 September 30, 2024 Assets Cash and cash equivalents held by The RMR Group Inc. $ 24,398 $ 23,189 Cash and cash equivalents held by The RMR Group LLC 123,182 118,410 Due from related parties 121,440 134,030 Prepaid and other current assets 13,369 9,789 Assets held for sale 8,656 8,700 Total current assets 291,045 294,118 Loans held for investment, net of allowance for credit losses of $194 and $343, respectively 57,887 56,221 Property and equipment, net of accumulated depreciation of $4,318 and $3,447, respectively 76,757 76,433 Due from related parties, net of current portion 6,155 9,350 Investments 26,454 23,733 Goodwill 71,761 71,761 Intangible assets, net of accumulated amortization of $4,506 and $3,719, respectively 19,168 20,299 Operating lease right of use assets 25,450 27,353 Deferred tax asset 14,346 15,163 Other assets, net of accumulated amortization of $90,094 and $87,740, respectively 103,709 106,063 Total assets $ 692,732 $ 700,494 Liabilities and Equity Reimbursable accounts payable and accrued expenses $ 79,383 $ 90,444 Accounts payable and accrued expenses 42,825 32,116 Operating lease liabilities 5,658 5,906 Liabilities held for sale 4,880 4,973 Total current liabilities 132,746 133,439 Mortgage note payable 45,219 45,149 Secured financing facility, net 41,027 41,109 Operating lease liabilities, net of current portion 20,352 22,147 Amounts due pursuant to tax receivable agreement, net of current portion 18,442 18,442 Other liabilities 13,202 20,791 Total liabilities 270,988 281,077 Total equity 421,744 419,417 Total liabilities and equity $ 692,732 $ 700,494 |
| 26 Definitions |

| 27 Definitions • Assets Under Management (AUM) All references in this presentation to AUM on, or as of, a date are calculated at a point in time. • AUM is calculated as: (i) the historical cost of real estate and related assets, excluding depreciation, amortization, impairment charges or other non-cash reserves, of the Managed Equity REITs and certain Private Capital clients, plus (ii) the gross book value of real estate assets, property and equipment of AlerisLife, Sonesta and until May 15, 2023, TA, excluding depreciation, amortization, impairment charges or other non-cash reserves, plus (iii) the carrying value of loans held for investment and real estate owned by SEVN, plus (iv) the fair value of RMR Residential, both owned and third-party managed assets. Upon deconsolidation from a Managed Equity REIT, the respective real estate and related assets are characterized as Private Capital and their historical cost represents the fair value of the real estate at the time of deconsolidation. • Fee-Earning AUM is calculated (i) monthly for the Managed Equity REITs, based upon the lower of the average historical cost of each REIT's properties and its average market capitalization, plus (ii) for all other clients, Fee-Earning AUM equals AUM and includes amounts that may differ from the measures used for purposes of calculating fees under the terms of the respective management agreements. For additional information on the calculation of AUM for purposes of the fee provisions of the business management agreements, see RMR's Annual Report on Form 10-K for the fiscal year ended September 30, 2024, filed with the SEC. RMR's SEC filings are available at the SEC website: www.sec.gov. • Managed Equity REITs include Diversified Healthcare Trust (DHC), Industrial Logistics Properties Trust (ILPT), Office Properties Income Trust (OPI) and Service Properties Trust (SVC). • Perpetual Capital refers to capital with an indefinite duration, which may be terminated under certain conditions, and includes the Managed Equity REITs and Seven Hills Realty Trust (SEVN). • Private Capital consists of AlerisLife Inc. (AlerisLife), Sonesta International Hotels Corporation (Sonesta), residential real estate which RMR manages through RMR Residential, and other private capital vehicles including ABP Trust and other private entities that own commercial real estate. Some of the Managed Equity REITs own minority interests in certain of these entities. Continued on next page. |
| 28 Definitions (Continued) Non-GAAP Measures: RMR presents certain “non-GAAP financial measures” within the meaning of the applicable rules of the SEC, including EBITDA, Adjusted EBITDA and Adjusted EBITDA Margin. The GAAP financial measure that is most directly comparable to EBITDA and Adjusted EBITDA is net income and the GAAP financial measure that is most directly comparable to Adjusted EBITDA Margin is Net Income Margin, which represents net income divided by total management and advisory services revenues. These non-GAAP financial measures do not represent net income, net income attributable to The RMR Group Inc. or cash generated by operating activities determined in accordance with GAAP, and should not be considered alternatives to net income, net income attributable to The RMR Group Inc. or net income margin determined in accordance with GAAP, as indicators of RMR’s financial performance or as measures of its liquidity. Other asset management businesses may calculate these non-GAAP measures differently than RMR does. Several non-GAAP measures are referenced in this presentation, including EBITDA, Adjusted EBITDA, Distributable Earnings and Adjusted EBITDA Margin. The RMR Group Inc. considers EBITDA, Adjusted EBITDA, Distributable Earnings and Adjusted EBITDA Margin to be appropriate supplemental measures of its operating performance, along with net income, net income attributable to The RMR Group Inc. and net income margin. These measures should be considered in conjunction with net income and net income attributable to The RMR Group Inc. as presented in The RMR Group Inc.’s consolidated statements of income. • EBITDA, Adjusted EBITDA and Adjusted EBITDA Margin are supplemental measures used to assess operating performance, along with net income, net income attributable to The RMR Group Inc. and net income margin. RMR believes that EBITDA, Adjusted EBITDA and Adjusted EBITDA Margin provide useful information to investors because by excluding the effects of certain amounts, such as non-cash items or non-recurring gains and losses, EBITDA, Adjusted EBITDA and Adjusted EBITDA Margin may facilitate a comparison of current operating performance with RMR’s historical operating performance and with the performance of other asset management businesses. RMR also believes that providing Adjusted EBITDA Margin may help investors assess RMR’s performance of its business by providing the margin that Adjusted EBITDA represents to its contractual management and advisory fees (excluding incentive business management fees, if any). Termination Fee Calculation: The $1.5 billion total estimated termination fee is the sum of the termination fees calculated under each of the applicable business and property management agreements based on the following assumptions: (a) assumed termination date of September 30, 2024; (b) for the Managed Equity REITs, monthly future fees were based on actual fees earned by RMR over the 12 months preceding the assumed termination date divided by twelve and, for purposes of determining present value, the monthly future fees were discounted using a rate equal to 1/12th of the sum of the applicable Treasury Rate for that future month plus 300bps. Additionally, in the event the management agreement is terminated by SEVN without a cause event or by Tremont Realty Capital LLC for a material breach, SEVN will be required to pay Tremont Realty Capital LLC a termination fee equal to (a) three times the sum of (i) the average annual base management fee and (ii) the average annual incentive fee, in each case paid or payable to Tremont Realty Capital LLC during the 24 month period immediately preceding the most recently completed calendar quarter prior to the date of termination or, if such termination occurs within 24 months of its initial commencement, the base management fee and the incentive fee will be annualized for such two year period based on such fees earned by Tremont Realty Capital LLC during such period, plus (b) $1.6 million. In addition, the initial organizational costs related to Tremont Mortgage Trust's formation and the costs of its initial public offering and the concurrent private placement that Tremont Mortgage Trust had paid pursuant to its management agreement with Tremont Realty Capital LLC will be included in the “Termination Fee” under and as defined in SEVN’s management agreement with Tremont Realty Capital LLC. No termination fee will be payable if the management agreement is terminated by SEVN for a cause event or by Tremont Realty Capital LLC without SEVN’s material breach. The estimated termination fee is presented for illustrative purposes only based on the assumptions described. Any actual termination fee may be higher or lower than the estimate depending on the actual calculation at the time, including then applicable fees, the then applicable discount rate and other factors. |
| 29 Investor Presentation February 2025 Two Newton Place 255 Washington Street, Suite 300 Newton, MA 02458 RMRGROUP.COM |