
Voortman Acquisition December 2, 2019
Forward Looking Statements This investor presentation contains statements reflecting our views about the future performance of Hostess Brands, Inc. and its subsidiaries (referred to as “Hostess Brands” or the “Company”) that constitute “forward-looking statements” that involve substantial risks and uncertainties. Forward-looking statements are generally identified through the inclusion of words such as “believes,” “expects,” “intends,” “estimates,” “projects,” “anticipates,” “will,” “plan,” “may,” “should,” or similar language. Statements addressing our future operating performance and statements addressing events and developments that we expect or anticipate will occur are also considered as forward-looking statements. All forward looking statements included herein are made only as of the date hereof. We undertake no obligation to update any forward-looking statement, whether as a result of new information, future events, or otherwise. These statements inherently involve risks and uncertainties that could cause actual results to differ materially from those anticipated in such forward-looking statements. These risks and uncertainties include, but are not limited to; the timing and completion of the acquisition of Voortman, the Company’s ability to integrate Voortman and achieve expected synergies, our ability to maintain, extend or expand our reputation and brand image; failing to protect our intellectual property rights; our ability to leverage our brand value to compete against lower-priced alternative brands; our ability to correctly predict, identify and interpret changes in consumer preferences and demand and offering new products to meet those changes; our ability to operate in a highly competitive industry; our ability to maintain or add additional shelf or retail space for our products; our ability to continue to produce and successfully market products with extended shelf life; our ability to successfully integrate, achieve expected synergies and manage our acquired businesses and brands; our ability to drive revenue growth in our key products or add products that are faster-growing and more profitable; volatility in commodity, energy, and other input prices and our ability to adjust our pricing to cover any increased costs; the availability and pricing of transportation to distribute our products; our dependence on our major customers; our geographic focus could make us particularly vulnerable to economic and other events and trends in North America; consolidation of retail customers; increased costs to comply with governmental regulation; general political, social and economic conditions; increased healthcare and labor costs; the fact that a portion of our workforce belongs to unions and strikes or work stoppages could cause our business to suffer; product liability claims, product recalls, or regulatory enforcement actions; unanticipated business disruptions; dependence on third parties for significant services; inability to identify or complete strategic acquisitions; our insurance not providing adequate levels of coverage against claims; failures, unavailability, or disruptions of our information technology systems; departure of key personnel or a highly skilled and diverse workforce; and our ability to finance our indebtedness on terms favorable to us; and other risks as set forth under the caption “Risk Factors” from time to time in our Securities and Exchange Commission filings. Industry and Market Data In this Investor Presentation, Hostess Brands relies on and refers to information and statistics regarding market shares in the sectors in which it competes and other industry data. Hostess Brands obtained this information and statistics from third-party sources, including reports by market research firms, such as Nielsen. Hostess Brands has supplemented this information where necessary with information from discussions with Hostess customers and its own internal estimates, taking into account publicly available information about other industry participants and Hostess Brands’ management’s best view as to information that is not publicly available. Use of Non-GAAP Financial Measures This Investor Presentation includes non-GAAP financial measures, including earnings before interest, taxes, depreciation, amortization and other adjustments to eliminate the impact of certain items that we do not consider indicative of our ongoing performance (“Adjusted EBITDA”) and Adjusted Earnings per Share (“Adjusted EPS”), collectively referred to as “Non-GAAP Financial Measures”. These non-GAAP Financial Measures exclude certain items included in the comparable GAAP financial measure. Hostess Brands believes that these Non-GAAP Financial Measures provide useful information to management and investors regarding certain financial and business trends relating to Hostess Brands’ financial condition and results of operations. Hostess Brands’ management uses these Non-GAAP Financial Measures to compare Hostess Brands’ performance to that of prior periods for trend analysis, for purposes of determining management incentive compensation, and for budgeting and planning purposes. Hostess Brands believes that the use of these Non-GAAP Financial Measures provides an additional tool for investors to use in evaluating ongoing operating results and trends. Management of Hostess Brands does not consider these Non-GAAP Financial Measures in isolation or as an alternative to financial measures determined in accordance with GAAP. Other companies may calculate non-GAAP measures differently, and therefore Hostess Brands’ Non-GAAP Measures may not be directly comparable to similarly titled measures of other companies. The Company does not provide a reconciliation of the forward-looking information to the most directly comparable GAAP measures because of the inherent difficulty in forecasting and quantifying certain amounts that are necessary for such reconciliations. Totals in this Investor Presentation may not add up due to rounding. 2
Leveraging Hostess Core Competencies ▪ Provides entry into attractive, adjacent wafer and sugar-free cookie Expands categories with market-leading positions and better-for-you characteristics Hostess’ Snacking ▪ Fastest growing independent sweet snacking brand of scale in North America Portfolio ▪ #1 Crème Wafer and #1 Sugar-Free Cookie ▪ Leverages Hostess model and unlocks meaningful distribution expansion in Meaningful key growth channels utilizing our proven expertise Growth Opportunities ▪ Point of Sale CAGR of 5.1% over past 3 years, ahead of the overall 1.8% growth of the Cookie Category ▪ Acquisition expected to be accretive to gross margins, EBITDA margins Compelling and EPS with strong future growth potential Financial Benefits ▪ Target leverage ratio expected to be maintained in 3.5x – 4.5x range and expectation to deleverage quickly 3 Source: Nielsen, Total Nielsen Universe for the 52 weeks ending 11/5/16 and 11/2/19.
Aligns with Hostess’ Existing Pillars for Growth ✓ Grow✓ through Improve✓ through Cultivate✓ Talent Leverage✓ Strong Grow the Core Innovation Agility & Efficiency & Capabilities Cash Flow ▪ Adds an ▪ Strong, ▪ Leverages ▪ Addition of ▪ Efficient use adjacent incremental Hostess’ talent and of capital category with innovation broad-based expertise to with high differentiated platform to ACV complement expected wafer and develop into distribution the existing returns cookie offerings the future to drive Hostess team ▪ Operations at scale improved provide ▪ Voortman brand performance additional has been ▪ Creates future cash growing at 5.1% additional flow once CAGR over last 3 capabilities fully years and scale of integrated operations 4 Source: Nielsen, Total Nielsen Universe for the 52 weeks ending 11/5/16 and 11/2/19.
Meaningfully accretive with strong growth opportunities • Hostess will acquire Voortman, a leading manufacturer of wafers as well as sugar-free and specialty cookies, for CAD $425 million (~USD $320 million) in cash, subject to a customary working capital adjustment Summary • Represents a post-synergy 9.1x EBITDA multiple transaction price (2020 estimated EBITDA + run-rate synergy estimate = $35 million) • Net revenue of approximately $90 million in 20201 Expected • Adjusted EBITDA of approximately $20 million in 2020 and $40-$50 million by 20221 Financial Impact • Annual run-rate synergies of at least $15 million within 12-18 months • Mid-single digit adjusted EPS accretion in 2020 and double-digit accretion thereafter1 Capital • Funding with existing cash and proceeds from $140 million incremental term loan Structure • Post-synergy pro forma leverage expected to be 4.5x, with expectation to be around 4.0x by end of 20201 Conditions • Expect to close in early January 2020 and Timing • Subject to customary closing conditions 1 Assumes an early January 2020 close 5
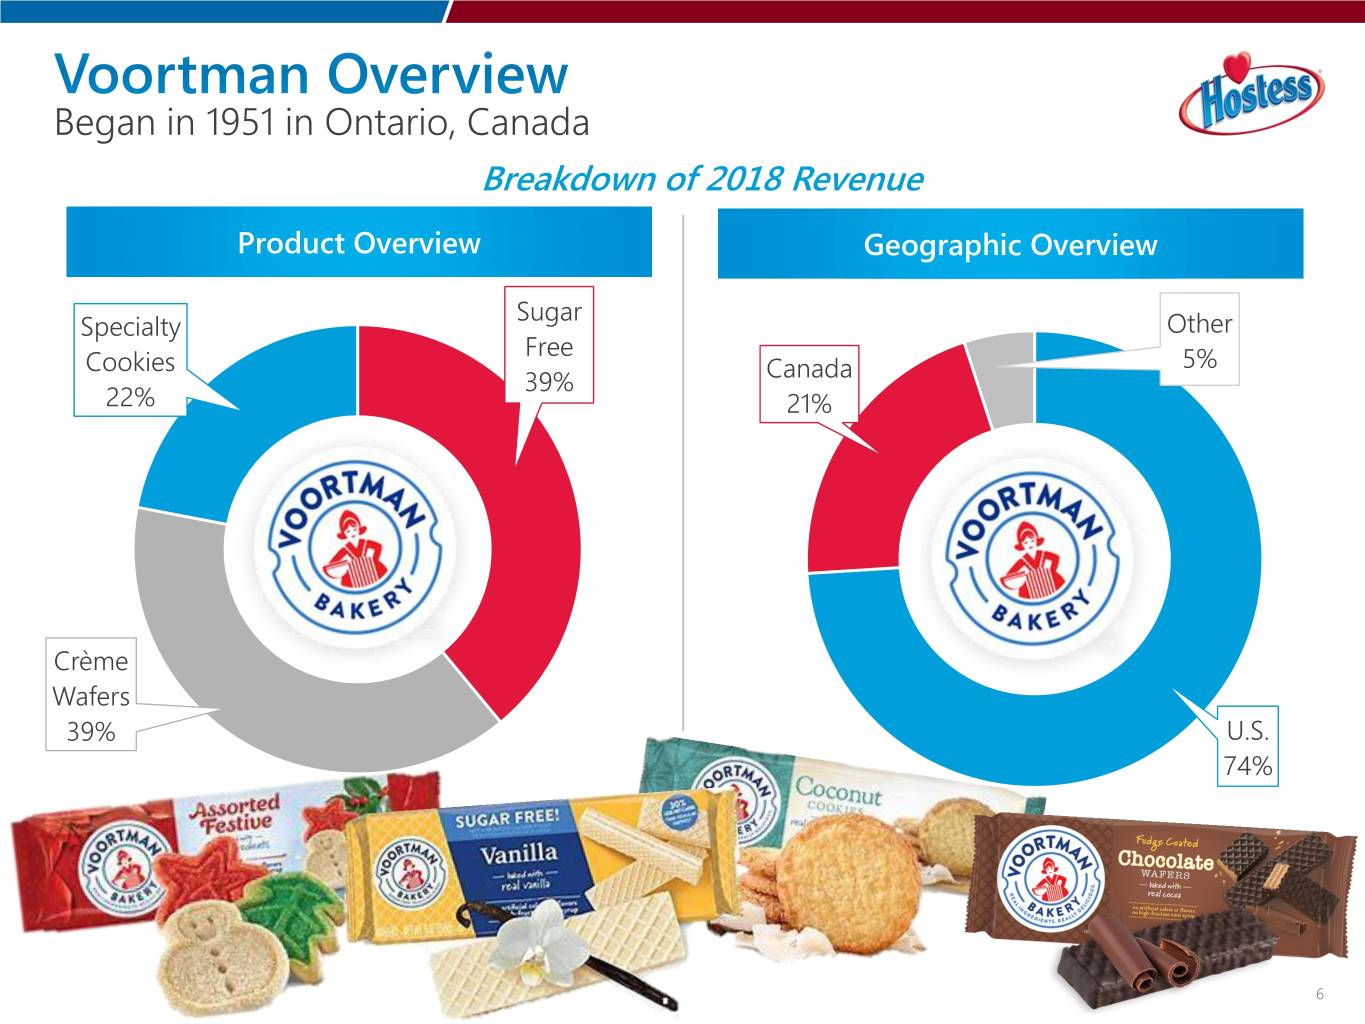
Began in 1951 in Ontario, Canada Breakdown of 2018 Revenue Product Overview Geographic Overview Sugar Specialty Other Free Cookies Canada 5% 39% 22% 21% Crème Wafers 39% U.S. 74% 6
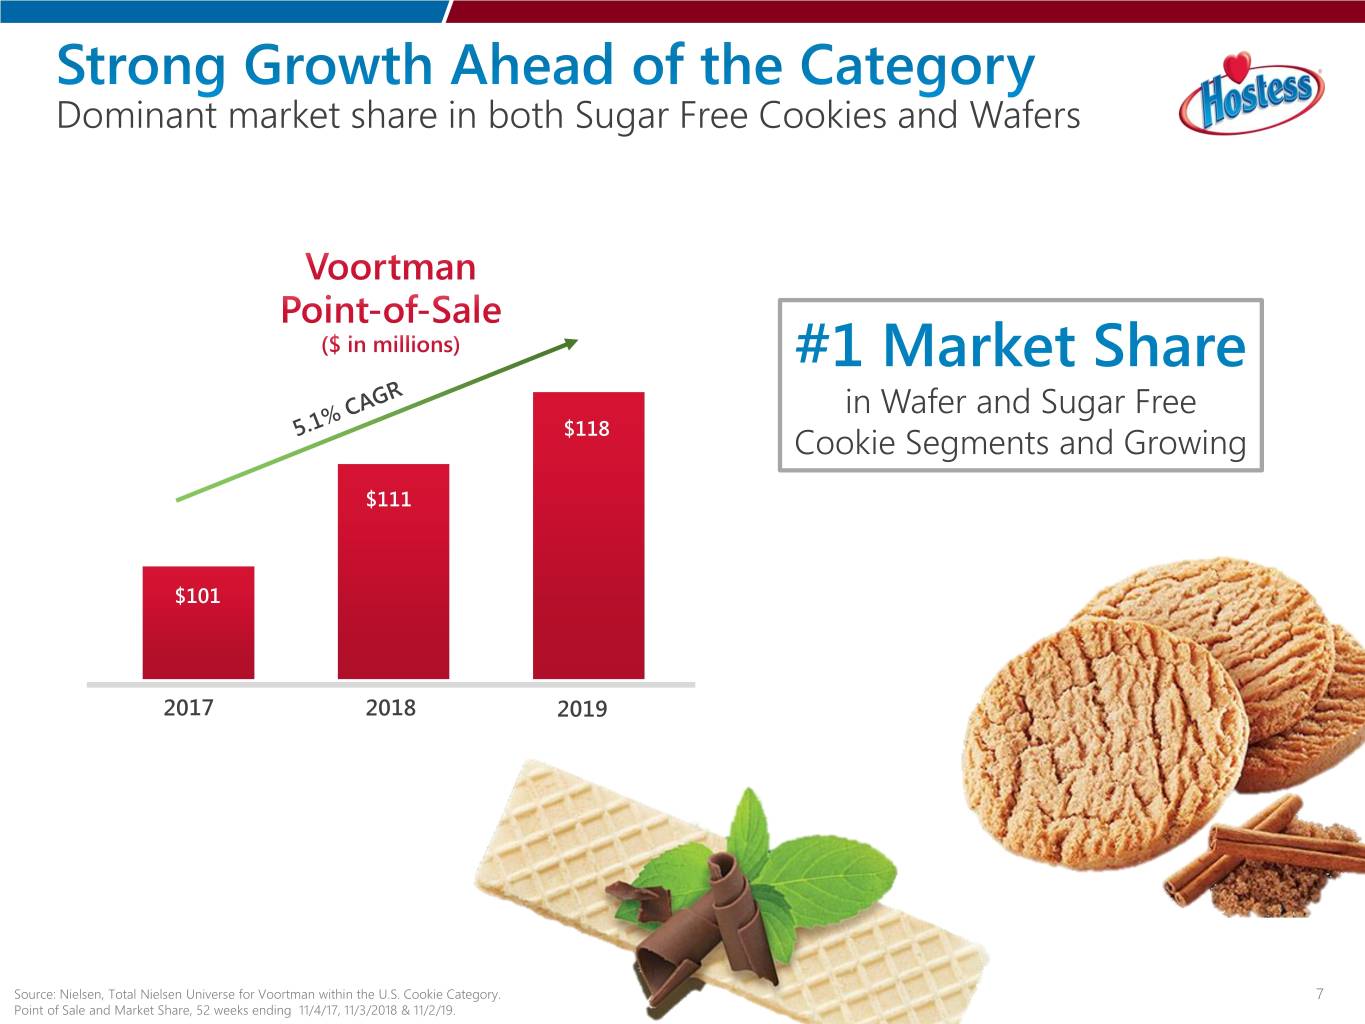
Dominant market share in both Sugar Free Cookies and Wafers #1 Market Share 18.2% in Wafer and Sugar Free $118 1.40% 17.7% Cookie Segments and Growing 1.36% $111 1. $101 27% 2017 2018 2019 Source: Nielsen, Total Nielsen Universe for Voortman within the U.S. Cookie Category. 7 Point of Sale and Market Share, 52 weeks ending 11/4/17, 11/3/2018 & 11/2/19.

Snacking Market Growth1 Voortman is part of +$30B large growing addressable snacking market $180B $125B $150B 2017 2019E 2022E Consumer Preference for Types of Snacks2 Consumer tailwinds Sweet Snacks 74% on sweetness and Better-for-You 69% better for you Late-Night 68% Most valued characteristics attributes Breakfast 66% Plant-Based 63% Sources: (1) IRI Actuals Total US -Multi Outlet + Conv Calendar; Mintel Forecast Total US –Multi Outlet + Conv Calendar 8 (2) Mintel/Lightspeed Snack Motivations and Attitudes, Jan 2019;
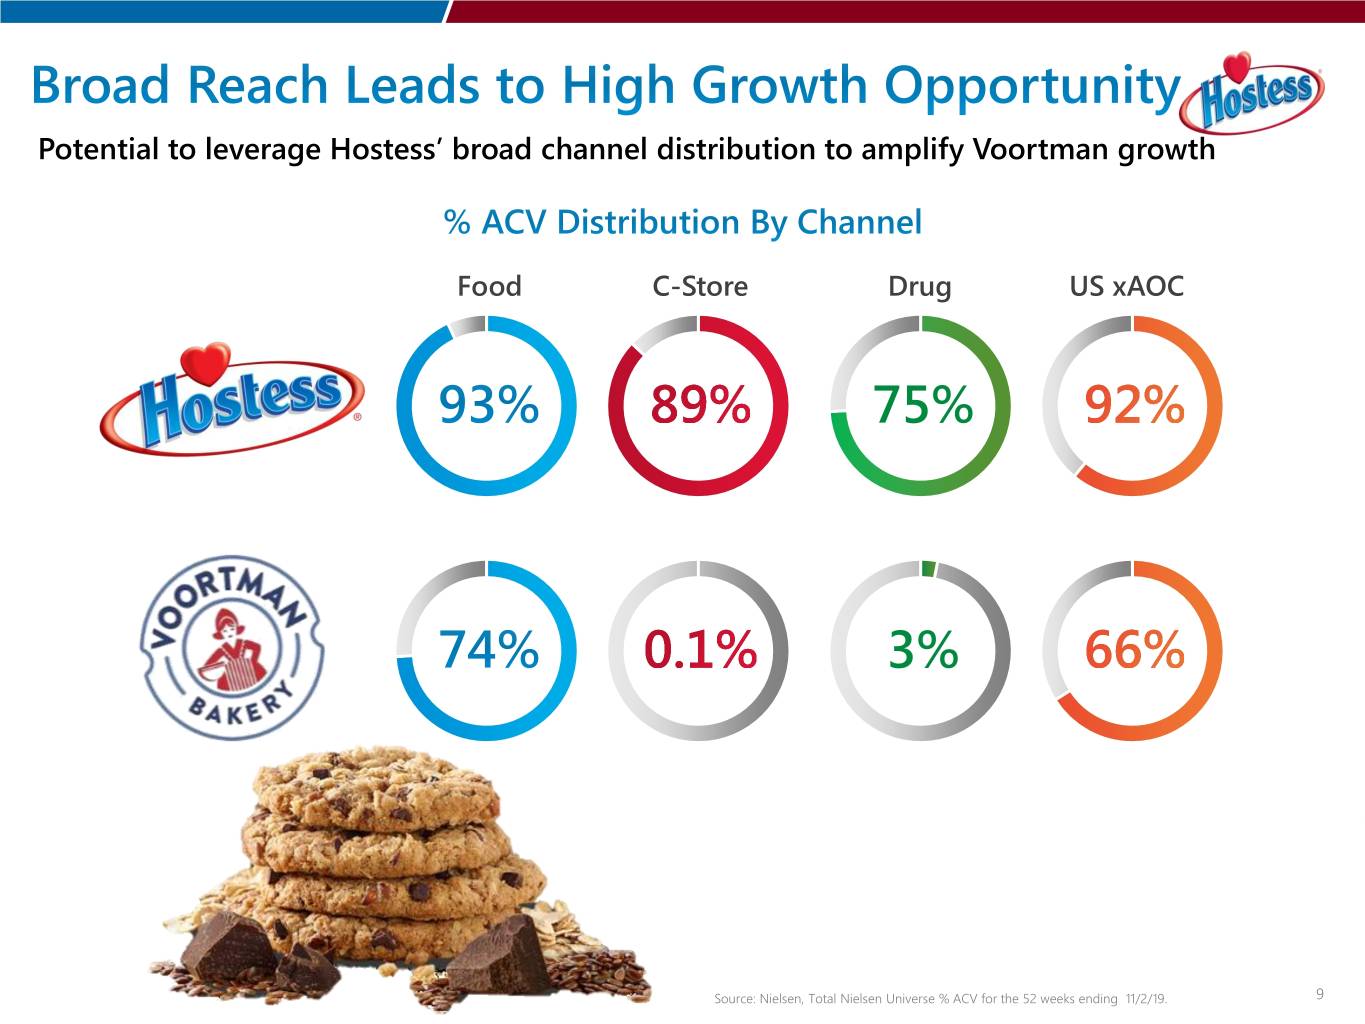
Potential to leverage Hostess’ broad channel distribution to amplify Voortman growth Food C-Store Drug US xAOC 75% 3% Source: Nielsen, Total Nielsen Universe % ACV for the 52 weeks ending 11/2/19. 9

Voortman Historical Hostess Merchandising Merchandising Execution at Scale Ability to expand merchandising efficiently at scale Seasonal programming correlates well with how Hostess goes to market to drive incremental sales 10
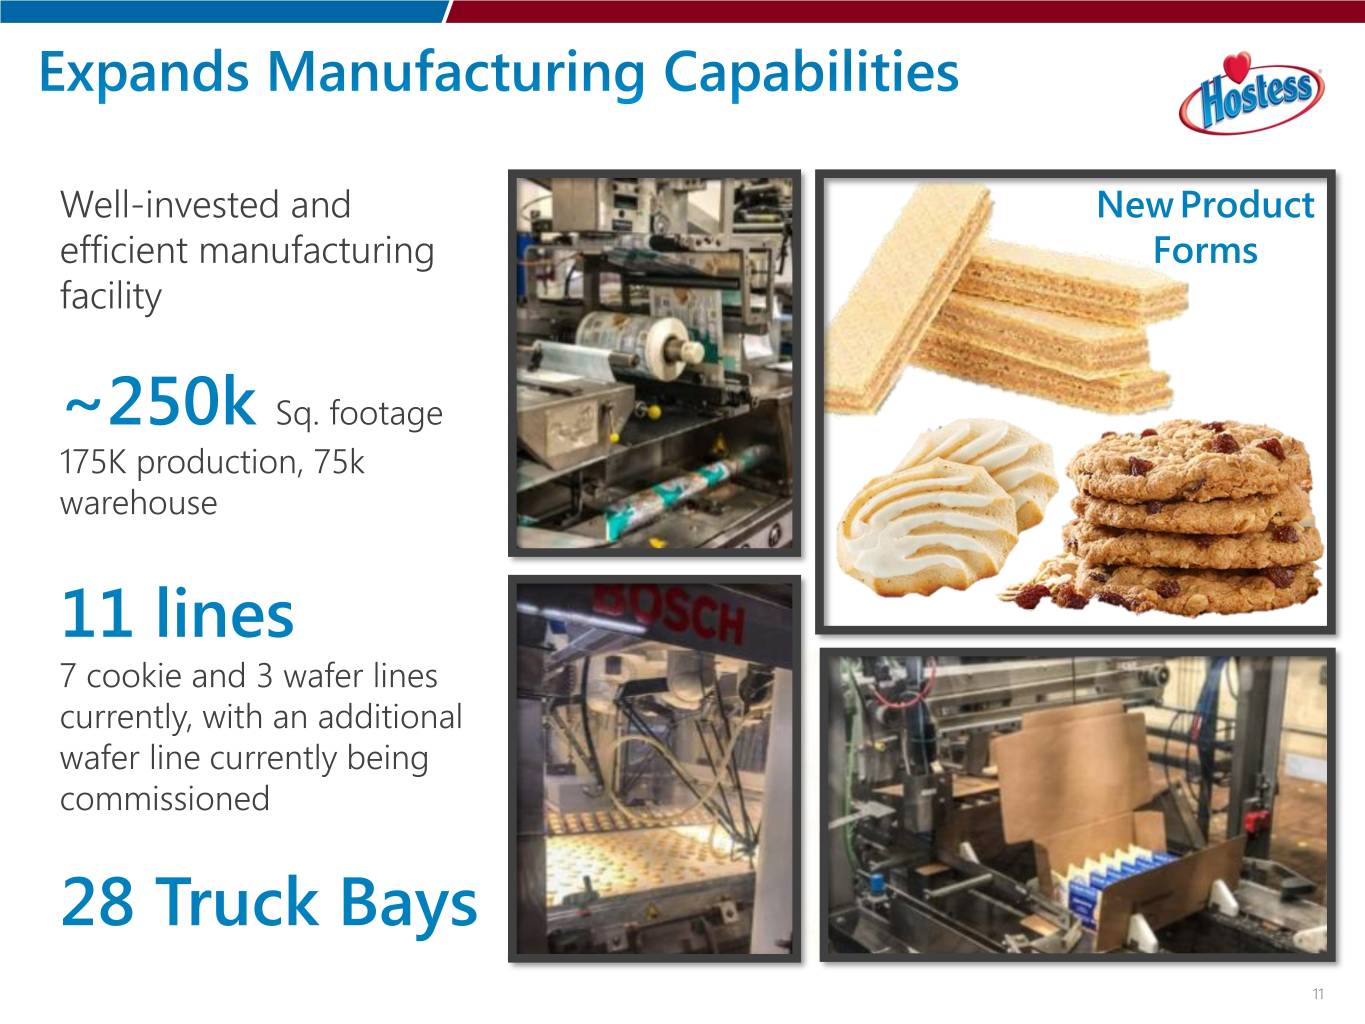
Well-invested and New Product efficient manufacturing Forms facility ~250k Sq. footage 175K production, 75k warehouse 11 lines 7 cookie and 3 wafer lines currently, with an additional wafer line currently being commissioned 28 Truck Bays 11
Diversifies and Expands Product Offerings and Manufacturing 1 Capabilities in Attractive, Adjacent Category Leverages Hostess’ Broad Customer Reach and 2 Lean and Agile Business Model 3 Significant Cost Synergy Opportunities 4 Compelling Financial Benefits 12


