January 21, 2016
Dear W. R. Grace & Co. Shareholder:
I am pleased to report that the previously announced separation of the business, assets and liabilities associated with the Grace Construction Products operating segment and the Darex Packaging Technologies business ("GCP") from the remaining W. R. Grace & Co. businesses is expected to become effective on February 3, 2016. GCP Applied Technologies Inc., a Delaware corporation, and wholly-owned subsidiary of W. R. Grace & Co., will become an independent public company on that date.
The separation will be completed by way of a pro rata distribution of common stock of GCP Applied Technologies Inc. to the shareholders of record of Grace common stock as of 5:00 p.m., Eastern Time, on January 27, 2016, the distribution record date. Each holder of Grace common stock will receive one share of GCP common stock for each share of Grace common stock held by the shareholder on the record date. The distribution of these shares will be made in book-entry form, which means that no physical share certificates will be issued. At any time following the distribution, shareholders may request that their shares of GCP common stock be transferred to a brokerage or other account. No fractional shares of GCP common stock will be issued. The distribution agent will aggregate fractional shares into whole shares, sell the whole shares in the open market at prevailing rates and distribute the net cash from proceeds from the sales pro rata to each holder who would otherwise have been entitled to receive a fractional share in the distribution.
The distribution is subject to certain customary conditions including, among other conditions, the receipt of an opinion of counsel, in form and substance satisfactory to Grace in its sole discretion, regarding the U.S. federal income tax treatment of the distribution of shares of GCP common stock and certain related transactions. The distribution is intended to qualify as tax-free to the holders of Grace common stock for U.S. federal income tax purposes.
The distribution does not require shareholder approval, nor do you need to take any action to receive your shares of GCP common stock. Grace common stock will continue to trade on the New York Stock Exchange (“NYSE”) under the symbol “GRA.” GCP has applied to have its common stock listed on the NYSE under the symbol “GCP.”
The enclosed information statement, which we are mailing to all holders of Grace common stock, describes the separation in detail and contains important information about GCP, including its historical combined financial statements. We encourage you to read this information statement carefully.
Thank you for your continued investment in Grace.
|
| |
| | Sincerely, |
| | |
| | Fred E. Festa |
| | Chairman of the Board and |
| | Chief Executive Officer |
January 21, 2016
Dear GCP Applied Technologies Inc. Shareholder:
It is our pleasure to welcome you as a shareholder of GCP Applied Technologies Inc. Our foremost priority as we become an independent public company is to affirm the trust and confidence of our employees, our customers, our communities, and our investors.
Like the very products we sell, we have proven our ability to create value as we protect and build on an industry-leading foundation.
In the following pages, you will read about the past performance of our three operating segments, our strategies for growth, and our focus on our customers.
What is more difficult to convey in an information statement like the accompanying document, is our passion and excitement. We are extraordinarily proud of our place in the long history of W. R. Grace & Co., a pedigree that has given rise to strong relationships with our customers; strong brands; a culture of focus, professionalism, and performance; and a commitment to innovation. Just as our customers expect our products to perform and create value even in the most challenging environments, we expect the same of ourselves and our organization.
As you review our information statement, we believe you will agree we are aligned with our commitment to deliver world-class products, applied knowledge, and service excellence to create value.
Our new logo expresses stepwise movement toward a strong future. Our name acknowledges our proud history with Grace and our unrelenting commitment to technology that works hard for our customers. We believe it’s a formula for success.
Thank you in advance for your investment and your confidence.
|
| |
| Sincerely, | |
| | |
| Ronald C. Cambre | Gregory E. Poling |
| Chairman of the Board of Directors | President and Chief Executive Officer |
| GCP Applied Technologies Inc. | GCP Applied Technologies Inc. |
Information Statement
Distribution of Common Stock of
GCP Applied Technologies Inc.
by
W. R. Grace & Co.
To W. R. Grace & Co. Shareholders
W. R. Grace & Co. ("Grace") is furnishing this information statement in connection with the distribution to Grace shareholders of all of the shares of common stock of GCP Applied Technologies Inc. (the "Company") owned by Grace, which will be 100 percent of the GCP common stock outstanding immediately prior to the distribution. The Company is a wholly-owned subsidiary of Grace that at the time of the distribution will hold the business, assets and liabilities associated with the Grace Construction Products operating segment and the Darex Packaging Technologies business ("GCP").
To implement the distribution, Grace will distribute the shares of GCP common stock on a pro rata basis to the holders of Grace common stock in a transaction that is intended to qualify as tax-free to the holders of Grace common stock for U.S. federal income tax purposes. Each of you, as a holder of Grace common stock, will receive one share of GCP common stock for each share of Grace common stock that you hold at 5:00 p.m., Eastern Time, on January 27, 2016, the record date for the distribution.
The distribution is expected to occur after the New York Stock Exchange (“NYSE”) market closing on February 3, 2016. Immediately after Grace completes the distribution, the Company will be an independent, publicly traded company. It is a condition to the completion of the separation that Grace obtains an opinion of counsel, in form and substance satisfactory to Grace in its sole discretion, regarding the U.S. federal income tax treatment of the distribution of shares of GCP common stock and certain related transactions.
No vote of Grace shareholders is required in connection with this distribution. Grace shareholders will not be required to pay any consideration for the shares of GCP common stock they receive in the distribution, and they will not be required to surrender or exchange shares of their Grace common stock or take any other action in connection with the distribution.
As Grace currently owns all of the outstanding shares of GCP common stock, there currently is no public trading market for the GCP common stock. We have applied to have the GCP common stock authorized for listing on the NYSE under the ticker symbol “GCP.” Assuming that the NYSE authorizes the GCP common stock for listing, we anticipate that a limited market, commonly known as a “when-issued” trading market, for GCP common stock will develop on or shortly before the record date for the distribution and will continue up to and including the distribution date, and we expect that the “regular-way” trading of GCP common stock will begin on the first trading day following the distribution date.
In reviewing this information statement, you should carefully consider the matters described in the section entitled “Risk Factors” of this information statement.
Neither the Securities and Exchange Commission nor any state securities commission has approved or disapproved of any of the securities of GCP Applied Technologies Inc. or determined whether this information statement is truthful or complete. Any representation to the contrary is a criminal offense.
This information statement does not constitute an offer to sell or the solicitation of an offer to buy any securities.
The date of this information statement is January 21, 2016.
This information statement was first mailed to holders of Grace common stock on or about January 21, 2016.
TABLE OF CONTENTS
|
| |
| |
| Our Company | |
| Our Strengths | |
| Our Business Strategy | |
| Summary of Risk Factors | |
| The Separation | |
| Questions and Answers About the Separation and Distribution | |
| Summary of the Separation and Distribution | |
| Corporate Information | |
| Reason for Furnishing this Information Statement | |
| |
| Risks Relating to Our Business | |
| Risks Relating to the Separation | |
| Risks Relating to Ownership of GCP Common Stock | |
| |
| |
| |
| |
| |
| Business Overview | |
| Products | |
| Sales and Marketing | |
| Manufacturing, Raw Materials and Supply Chain | |
| Financial Information about Industry Segments and Geographic Areas | |
| Backlog of Orders | |
| Research Activities; Intellectual Property | |
| Environment, Health and Safety Matters | |
| Employee Relations | |
| Properties | |
| Legal Proceedings | |
| |
| General | |
| Reasons for the Separation | |
| The Number of Shares You Will Receive | |
| Treatment of Fractional Shares | |
| When and How You Will Receive the Distribution | |
| Treatment of Equity-Based Compensation | |
| Results of the Distribution | |
| Incurrence of Debt | |
| Market for GCP Common Stock | |
| Trading Between Record Date and Distribution Date | |
| Conditions to the Distribution | |
Reason for Furnishing this Information Statement
| |
| |
| |
| |
|
| |
| |
| Executive Officers Following the Distribution | |
| Board of Directors Following the Distribution | |
| Corporate Governance Principles | |
| Director Independence | |
| Committees of the Board of Directors | |
| Compensation Committee Interlocks and Insider Participation | |
| Corporate Governance | |
| Board Leadership Structure | |
| Board Risk Oversight | |
| Communications with the Board of GCP | |
| |
| Grace 2014 Executive Compensation | |
| Effects of the Separation on Outstanding Executive Compensation Awards | |
| GCP Compensation Programs | |
| |
| |
| |
| |
| The Separation from Grace | |
| Related Party Transactions | |
| Agreements with Grace | |
| |
| |
| General | |
| Distributions of Securities | |
| Common Stock | |
| Preferred Stock | |
| Restrictions on Payment of Dividends | |
| Transfer Restrictions | |
| Size of Board and Vacancies; Removal | |
| Shareholder Action by Written Consent | |
| Shareholder Meetings | |
| Requirements for Advance Notice of Shareholder Nominations and Proposals | |
| No Cumulative Voting | |
| Stock Exchange Listing | |
| Limitation on Liability of Directors and Indemnification of Directors and Officers | |
| Anti-Takeover Effects of Various Provisions of Delaware Law and GCP’s Certificate of Incorporation and Bylaws | |
| Exclusive Forum | |
| Transfer Agent and Registrar | |
| |
| |
NOTE REGARDING THE USE OF CERTAIN TERMS
Except as otherwise indicated, we use the following terms to refer to the items indicated:
“W. R. Grace & Co.” refers to W. R. Grace & Co., a Delaware corporation, and “Grace” refers to W. R. Grace & Co. and its consolidated subsidiaries, in each case unless otherwise indicated or the context otherwise requires. “Grace Conn” refers to W. R. Grace & Co.—Conn., a direct wholly owned subsidiary of W. R. Grace & Co. “Grace common stock” refers to the common stock, par value $0.01 per share, of W. R. Grace & Co.
“GCP” refers collectively to the business, assets and liabilities associated with the Grace Construction Products operating segment and the Darex Packaging Technologies business that at the time of the distribution will be held by the Company.
Except as otherwise noted, “we,” “us,” and “our,” refer to GCP and, unless otherwise indicated or the context otherwise requires, the management of GCP and/or the Company.
The “Company” refers to GCP Applied Technologies Inc., a Delaware corporation, that prior to the separation is a wholly owned subsidiary of Grace and that at the time of the separation will hold GCP. Where appropriate in context and except as noted, this term includes the subsidiaries of the Company. “GCP common stock” refers to the common stock, par value $0.01 per share, of the Company.
“Separation” or “separation” refers to the separation of GCP from Grace’s other businesses and the creation of an independent, publicly traded company holding GCP through a distribution of shares of GCP common stock to the holders of Grace common stock as of the record date.
“Distribution” or “distribution” refers to the distribution of all of the shares of GCP common stock owned by Grace to shareholders of Grace as of the record date.
“Distribution Date” means the date on which the Distribution occurs.
Except as otherwise indicated or unless the context otherwise requires, the information included in this information statement, including the combined financial statements of GCP, assumes the completion of all the transactions referred to in this information statement in connection with the separation and distribution.
CAUTIONARY STATEMENT CONCERNING FORWARD-LOOKING STATEMENTS
This information statement contains forward-looking statements, that is, information related to future, not past, events. Such statements generally include the words “believes,” “plans,” “intends,” “targets,” “will,” “expects,” "estimates," “suggests,” “anticipates,” “outlook,” “continues” or similar expressions. Forward-looking statements include, without limitation, expected financial positions; results of operations; cash flows; financing plans; business strategy; operating plans; capital and other expenditures; competitive positions; growth opportunities for existing products; benefits from new technology and cost reduction initiatives, plans and objectives; and markets for securities. Like other businesses, GCP is subject to risks and uncertainties that could cause its actual results to differ materially from its projections or that could cause other forward-looking statements to prove incorrect. Factors that could cause actual results to materially differ from those contained in the forward-looking statements include, without limitation, risks related to: the cyclical and seasonal nature of the industries GCP serves; the effectiveness of GCP's research and development and new product introductions; the cost and availability of raw materials and energy; foreign operations, especially in emerging regions; changes in currency exchange rates; developments affecting the Company’s outstanding liquidity and indebtedness, including debt covenants and interest rate exposure; developments affecting the Company’s funded and unfunded pension obligations; acquisitions and divestitures of assets and gains and losses from dispositions; warranty and product liability claims; hazardous materials and costs of environmental compliance; the separation, such as: uncertainties that may delay or negatively impact the separation and distribution or cause the separation and distribution to not occur at all, the Company’s lack of history as a public company and the costs of the separation, the Company’s ability to realize the anticipated benefits of the separation and distribution, and the value of GCP common stock following the separation; and those additional factors set forth in this information statement and W. R. Grace & Co.’s most recent Annual Report on Form 10-K, quarterly report on Form 10-Q and current reports on Form 8‑K, which have been filed with the Securities and Exchange Commission and are readily available on the Internet at www.sec.gov.
In particular, information included under “The Separation and Distribution,” “Risk Factors,” “Dividend Policy,” “Business” and “Management’s Discussion and Analysis of Financial Condition and Results of Operations” contains forward-looking statements.
You should consider the areas of risk described above, as well as those set forth in the section entitled “Risk Factors” included elsewhere in this information statement, in connection with considering any forward-looking statements that may be made by us and our businesses generally. We cannot assure you that projected results or events reflected in the forward-looking statements will be achieved or occur. The forward-looking statements included in this document are made as of the date of this information statement. Except as may be required by law, we undertake no obligation to publicly release any revisions to any forward-looking statements, to report events or to report the occurrence of unanticipated events.
INDUSTRY DATA
The data included in this information statement regarding industry size and relative industry position is derived from a variety of sources, including company research, third‑party studies and surveys, industry and general publications and estimates based on our knowledge and experience in the industries in which we operate. Our estimates have been based on information obtained from our customers, suppliers, trade and business organizations and other contacts in the industry. In using this information, you should consider the methods by which we obtained the data for our estimates and recognize that this information cannot always be verified with complete certainty due to the limits on the availability and reliability of raw data, the voluntary nature of the data gathering process and other limitations and uncertainties.
TRADEMARKS AND TRADE NAMES
As of the date of this information statement, Grace owns, has rights or will own or acquire rights to trademarks, service marks, copyrights and trade names that we use in conjunction with the operation of our business, including Grace®, and, except as otherwise indicated, the other trademarks, service marks or trade names used in this information statement. This information statement may include trademarks, service marks and trade names of other companies. Each trademark, service mark or trade name of any other company appearing in this information statement belongs to its holder. Unless otherwise indicated, use or display by us of other parties’ trademarks, service marks, or trade names is not intended to and does not imply a relationship with the trade name owner, or endorsement or sponsorship by us of the trademark, service mark, or trade name owner.
SUMMARY
This summary highlights selected information from this information statement relating to GCP, the separation of GCP from W. R. Grace & Co. and the distribution of GCP common stock by W. R. Grace & Co. to holders of Grace common stock. For a more complete understanding of our businesses and the separation and distribution, you should read this information statement carefully, particularly the discussion set forth under “Risk Factors” of this information statement, and our audited and unaudited historical combined financial statements, our unaudited pro forma combined financial statements and the respective notes to those statements appearing elsewhere in this information statement.
Except as otherwise indicated or unless the context otherwise requires, the information included in this information statement, including the combined financial statements of GCP, assumes the completion of all the transactions referred to in this information statement in connection with the separation and distribution.
Our Company
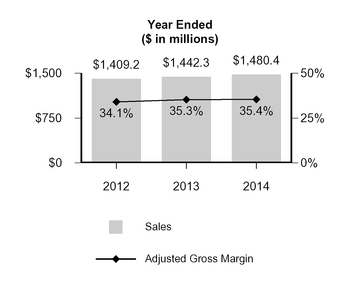
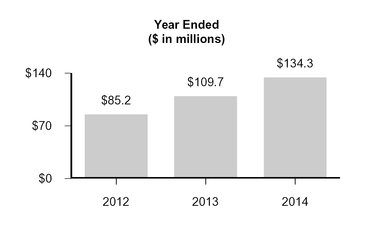
GCP is a leading global provider of products and technology solutions for customers in the specialty construction chemicals, specialty building materials and packaging sealants and coatings industries. We believe our customers derive meaningful value and distinct competitive advantages from our products and technical services. Our products help improve the performance of our customers’ products, increase productivity in their application or manufacturing processes, and meet the increasing regulatory requirements impacting their industry. The result is long-standing relationships with customers that we believe is a durable competitive advantage allowing us to secure high margins. For the year ended December 31, 2014, we had sales of $1.5 billion, and generated net income of $134.3 million.
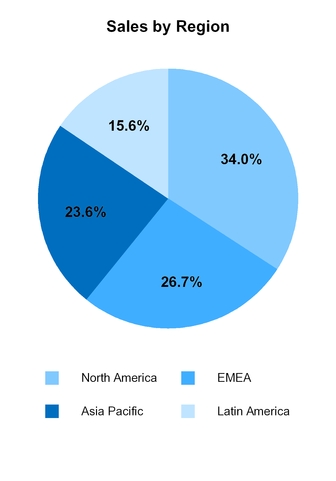
We are a global business with a diverse sales and geographic mix and operations around the world.
We hold global leadership positions in each of our businesses. We manage our business in three operating segments:
| |
| • | Specialty Construction Chemicals. Specialty Construction Chemicals (SCC) provides products, technologies, and services that reduce the cost and improve the performance of cement, concrete, mortar, masonry and other cementitious based construction materials. |
| |
| • | Specialty Building Materials. Specialty Building Materials (SBM) produces and sells sheet and liquid membrane systems and other products that protect both new and existing structures from water, air, vapor penetration, and fire damage. We also manufacture and sell specialized cementitious and chemical grouts used for soil consolidation and leak-sealing applications. |
| |
| • | Darex Packaging Technologies. Darex Packaging Technologies (Darex) produces and sells sealants and coatings for consumer and industrial applications to protect the integrity of packaged products. |
|
| | | | | | | | | |
Year Ended December 31, 2014 ($ in millions) | Specialty Construction Chemicals | Specialty Building Materials | Darex Packaging Technologies |
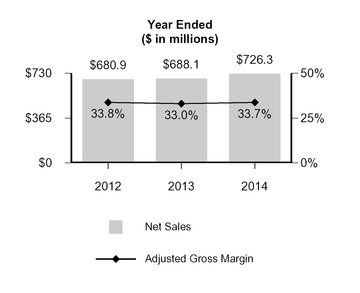
| Net sales | $ | 726.3 |
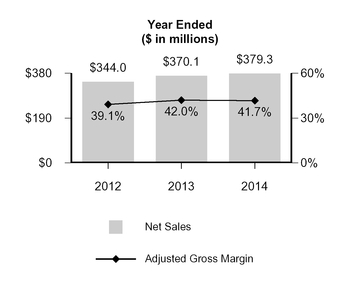
| $ | 379.3 |
| $ | 374.8 |
|
| Segment operating income | 72.4 |
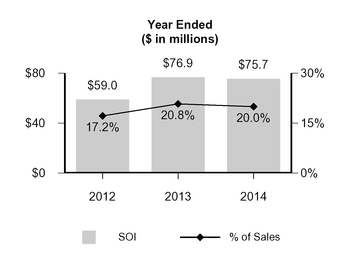
| 75.7 |
| 74.1 |
|
| Adjusted EBITDA | 90.9 |
| 84.3 |
| 79.6 |
|
| Adjusted EBITDA margin | 12.5 | % | 22.2 | % | 21.2 | % |
| Product groups | Ÿ Concrete admixtures Ÿ Cement additives | Ÿ Building envelope Ÿ Residential building products Ÿ Specialty construction products | Ÿ Sealants and closures Ÿ Coatings |
| End use industries | Ÿ Building and construction | Ÿ Building and construction | Ÿ Packaging Ÿ Food and beverage |
| Annual global industry sales(1) | $7.8 billion |
| $3.5 billion |
| $3.2 billion |
|
| Forecasted annual industry growth rate | 3% - 4%(2) |
| 3% - 4%(2) |
| 2% - 3%(1) |
|
________________________________________________________________________________________________________________
| |
| (1) | Based on GCP's internal estimates. |
| |
| (2) | IHS Global Construction Outlook, Q4 2015. |
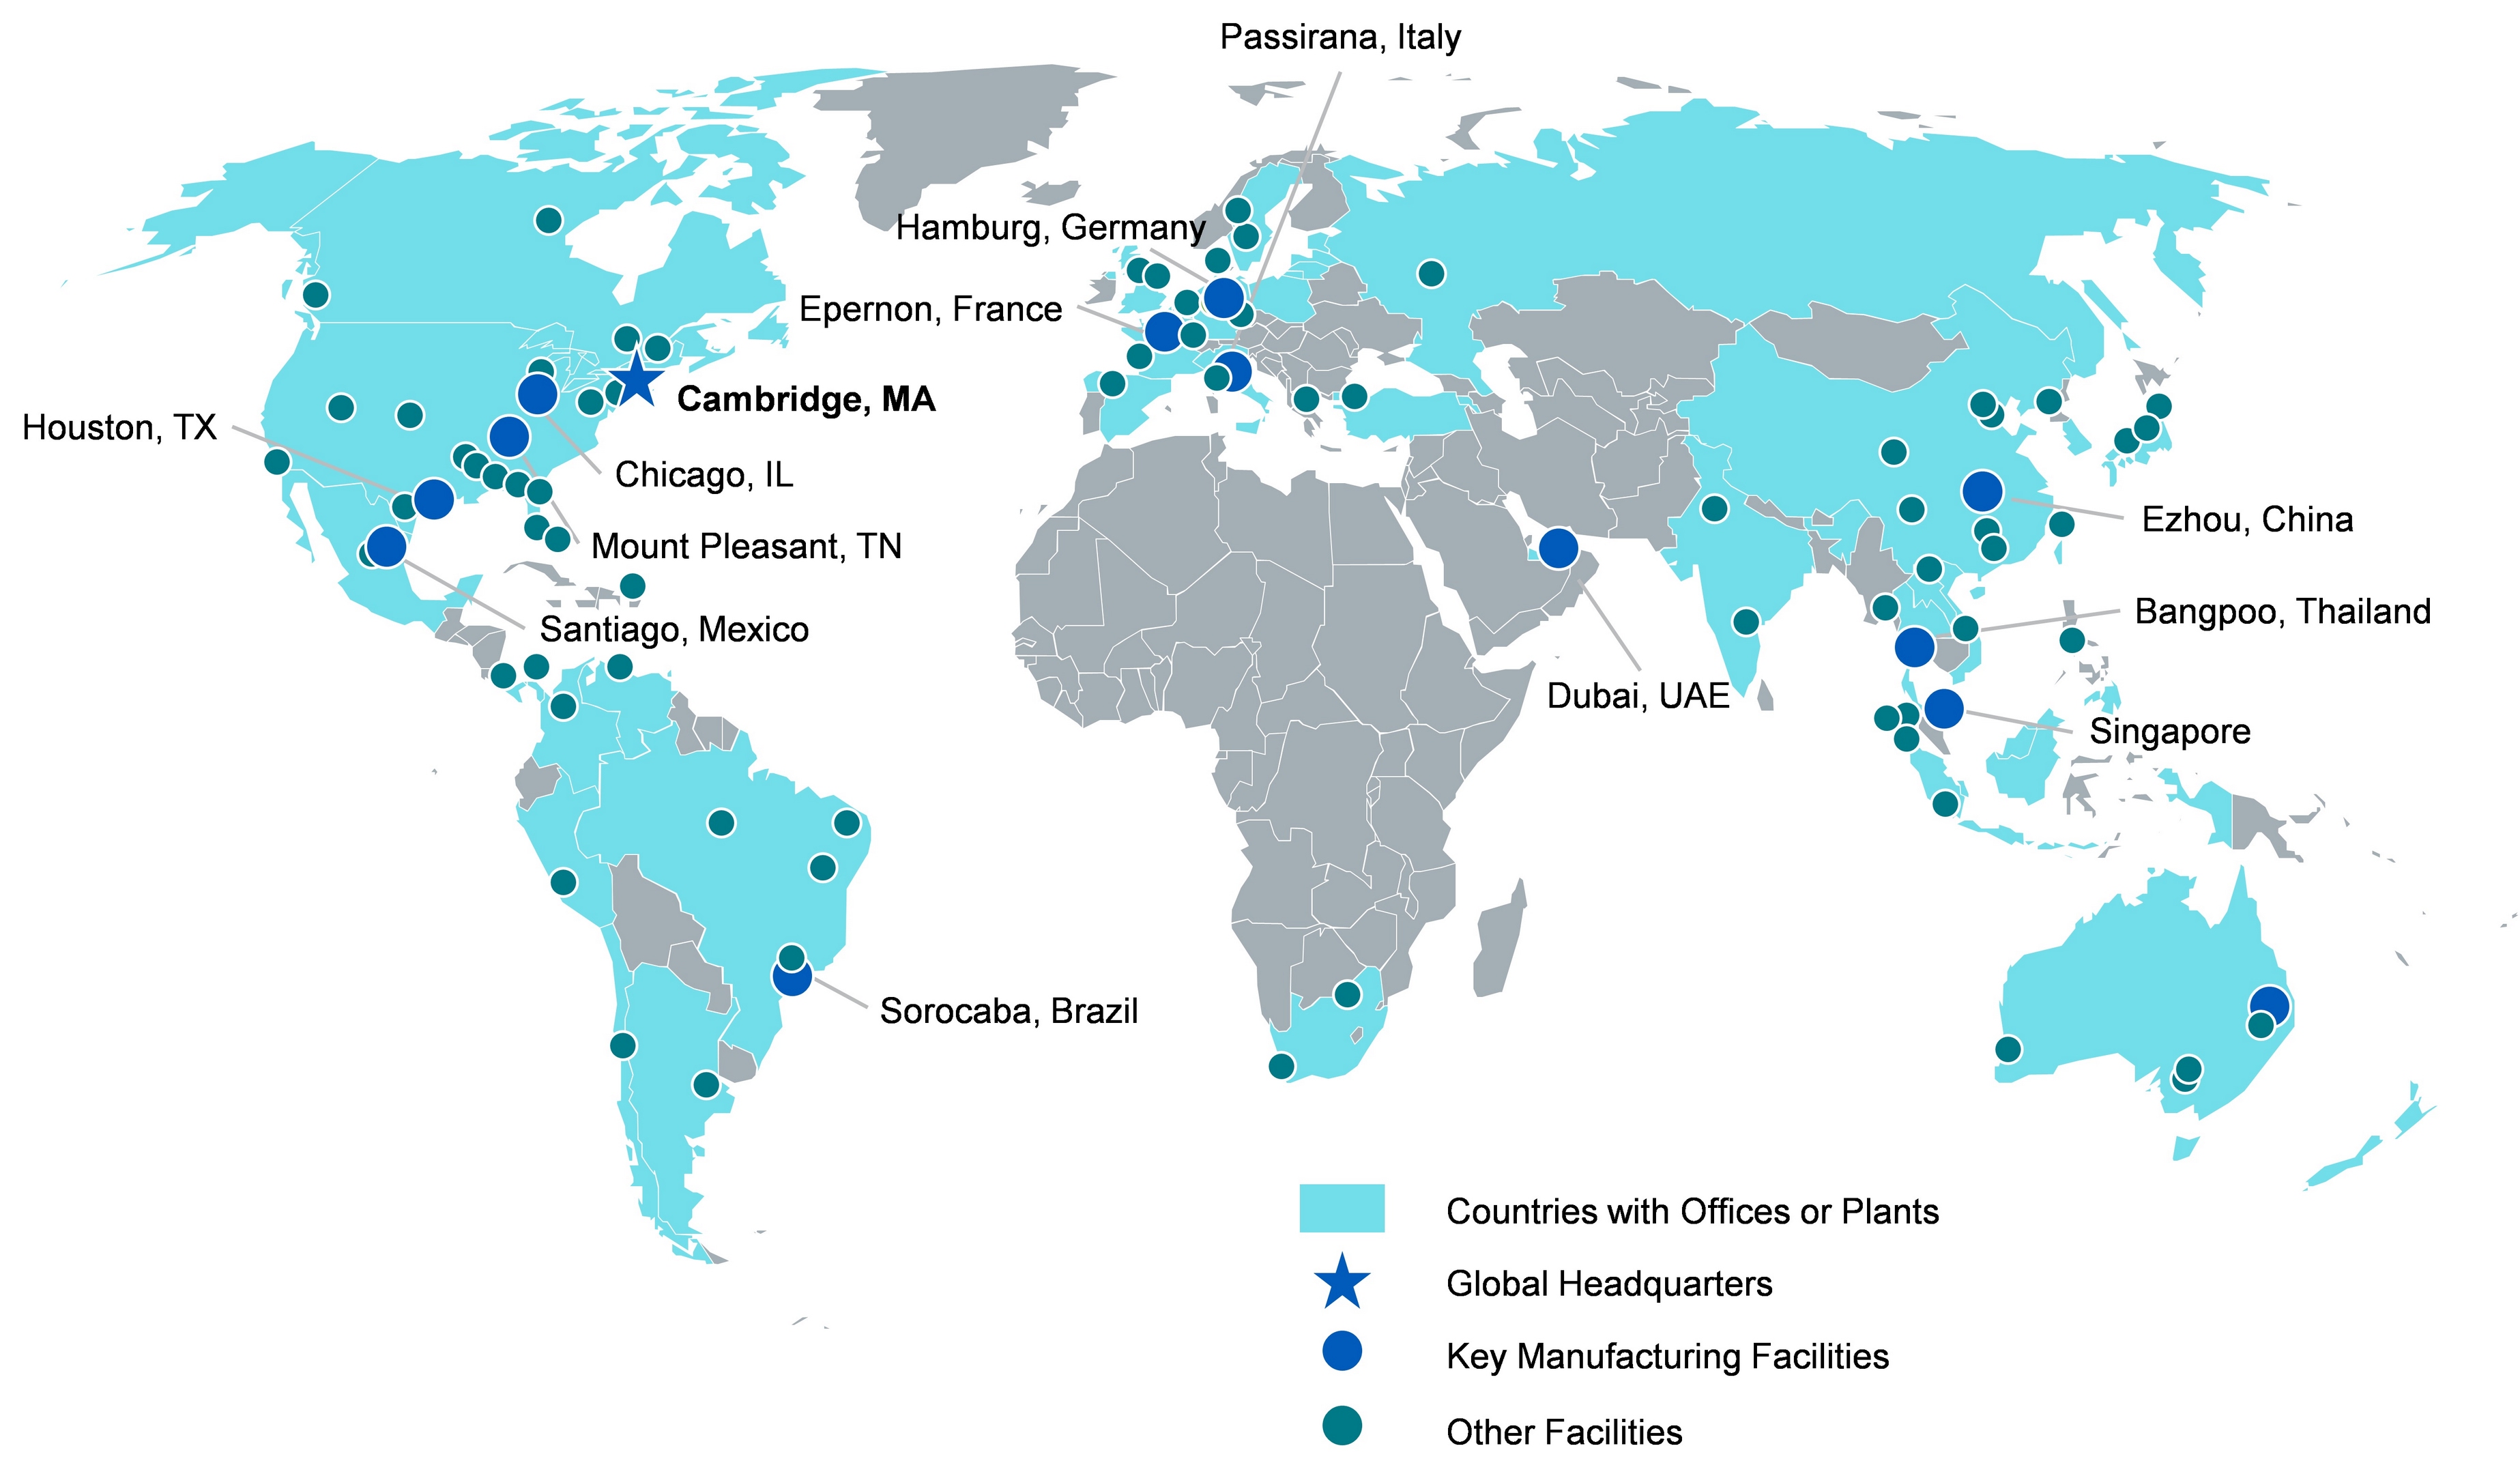
We have manufacturing, research and development (R&D), sales and technical service sites in over 40 countries and on six continents, with approximately 65 manufacturing and technical sites worldwide. As of the date of the separation, we will have approximately 2,850 employees of whom approximately 770 will be employed in the United States.
Global Operational Footprint
Our Strengths
We expect to grow our segment leadership positions by leveraging our competitive strengths, which we believe include:
Global Leadership Positions — We maintain global leadership positions in each of our operating segments and hold number one or number two positions, based on sales, that accounted for approximately 66% of our sales for the year ended December 31, 2014, including:
| |
| • | SCC — #1 position in cement additives, and #2 position in concrete admixtures; |
| |
| • | SBM — #1 position in bonded pre-applied waterproofing membranes; and |
| |
| • | Darex — #1 position in can sealants, with leading positions in can coatings and closure sealants. |
Our innovative construction chemicals and materials are used in commercial, residential, and infrastructure projects around the world. They have been widely used in projects with demanding product, performance and engineering requirements ranging from the Getty Center in Los Angeles and the London Underground to Hong Kong’s Bank of China Tower and the Guggenheim Museum Bilbao in Spain. Our packaging technologies are used by many of the world’s most recognized brand owners and are part of over 300 billion food and beverage cans and packages produced each year.
GCP’s leadership positions are the result of our reputation for quality, innovation, specialized technical expertise and industry knowledge, which we believe are significant competitive advantages. We believe these strengths permit us to maintain leading segment positions, grow our sales and generate attractive margins.
Global Manufacturing and Sales and Technical Service Presence — We operate manufacturing, R&D, sales and technical service sites in over 40 countries; with approximately 65 manufacturing and technical sites, we are strategically located near our customers’ sites and in our key geographic areas. Our operating segments share common processes, manufacturing sites, and technical service and sales centers around the world. Our global R&D and technical service organizations deliver innovative products and technology solutions to our customers at a local level by leveraging centralized R&D capabilities, regional technical centers for formulation expertise, and expert field technical service resources.
Ability to Capitalize on Growth Opportunities — We believe our close alignment with our customers and involvement in our local areas allow us to identify changing industry trends and customer dynamics to execute on new growth opportunities. We believe our global infrastructure and low capital manufacturing model enable us to quickly gain customer penetration with minimal capital investment to efficiently invest in new areas and pursue strategic bolt-on acquisitions.
Technology Leadership and Differentiated Products through R&D — Central to our business is our commitment to technology leadership and innovation, sustained by continuing investment in our R&D and technical service capabilities. Our focus on product and formulation development, application expertise, and industry knowledge is a key competitive advantage for GCP.
Our technology position is supported by our intellectual property portfolio consisting of trade secrets, know-how and patents. Additionally, we maintain trademarks including widely recognized brands such as ADVA®, MIRA®, STRUX®, Pieri® and CBA® within specialty construction chemicals; PREPRUFE®, BITUTHENE®, ICE & WATER SHIELD® and MONOKOTE® within specialty building materials; and DAREX®, APPERTA® and CELOX® within packaging technologies. We expect the continued evolution of our product portfolio to allow us to accelerate growth and further our leading global positions. We have over 800 active patents and patent applications in a number of countries around the world, including approximately 150 in the U.S.
Cash Flow Generation — GCP has generated strong cash flow. Driven by differentiated products with high margins, cash flow from operations has been well above $100 million in each of the past three years. Our low capital manufacturing model has also contributed to our strong cash flow. Historically, capital expenditures have been less than 3% of sales on an annual basis. In particular, Darex has provided stable and predictable cash flow supported by the stable can beverage industry. We plan to leverage Darex to support our growth investments across the portfolio as we deploy cash to the highest return projects.
Diverse Customer Base with Long-Standing Relationships — We serve thousands of customers in more than 110 countries with no single customer accounting for more than 5% of sales. Our relationships with many of our customers are long-standing and often span decades. Our products are often specified into customers’ projects, operations or products and we work diligently alongside our customers to tailor solutions to their complex requirements that vary across regions and localities.
Our specialty construction chemicals and specialty building materials products are regularly chosen to meet the demanding product, performance and engineering requirements of our customers. This is reflected in the portfolio of challenging construction projects where our products are used and lends exceptional credibility with architects, engineers, general contractors, specialty contractors and other channel partners, which in turn drives our sales.
Our packaging products consistently and reliably deliver solutions for our customers, including some of the world’s largest packaging companies and most recognizable brand owners for whom quality and reliability are vital to their operations.
Strong Management Team with Extensive Industry Experience — Our global management team has extensive industry experience and a successful track record of managing large global organizations, executing on attractive growth opportunities, reducing costs and driving operating efficiencies, and improving working capital performance.
Our Business Strategy
Our objective is to increase our earnings, cash flow, and return on invested capital to increase shareholder value through the implementation of our business strategies. We use our strengths to pursue these objectives through the following investment and growth strategies:
Grow Sales by Leveraging Strong Segment Leadership Positions — We intend to continue to leverage our global manufacturing and technical service footprint and our research and development and sales organizations to profitably increase geographic and customer penetration. We intend to make targeted investments to expand our geographic footprint in areas and segments where trends and economic cycles present the best opportunities.
Grow Through Strategic Acquisitions — We will continue to seek strategic, bolt-on acquisitions and alliances to accelerate our customer and geographic penetration, broaden our technology and product portfolios, and expand our manufacturing capacity and capability. Darex has provided stable and predictable cash flow and we plan to leverage Darex to help us capture growth opportunities across our portfolio.
Growth and Margin Enhancement Through Product Innovation — We will seek to further our position as an industry innovator by continuing to invest in research and development to commercialize highly valued, technically differentiated products and services to address both global mega trends and regional and local applications critical to our customers. To drive this innovation, we intend to leverage our model of introducing and supporting new technologies through our centralized research and development center in Cambridge, Massachusetts and regional applications labs globally. We may invest in additional regional application labs and field technical support resources as we expand our customer and geographic penetration.
Maintain Strong Customer Focus — A key aspect of our strategy is to continue to deliver product and technology solutions to our customers that help them improve their product performance and productivity in their manufacturing operations. We believe that maintaining a close partnership with our customers allows us to effectively focus our innovation efforts and respond to their changing demands at a global, regional and local level.
Increase Productivity by Leveraging Global Supply Chain — Given the relatively low conversion costs of our products, GCP’s productivity strategies focus on the supply chain. We have established deep procurement and product formulation expertise to manage our product costs and production efficiencies. Product formulations are optimized at our regional development labs around the world. These formulations are designed to meet specific customer needs while also considering the costs of the various raw material options available to meet those needs. Our global supply chain organization balances local raw material supply with global contracts that leverage our buying power. Our strategic manufacturing network also optimizes production and delivery efficiencies.
Drive Cash Flow and Return on Invested Capital to Deliver Long-Term Value to Our Shareholders — We believe these strategies will allow us to generate significant cash flow to invest in our research and development activities, manufacturing operations, technical service and sales organizations and strategic acquisitions and to return excess capital to shareholders.
Summary of Risk Factors
An investment in our company is subject to a number of risks, including risks relating to our business and the separation and distribution. The following list of certain risk factors is a high-level summary and is not exhaustive. For a more thorough description of risks, see “Risk Factors” and “Management’s Discussion and Analysis of Financial Condition and Results of Operations” included elsewhere in this information statement.
Risks Relating to Our Business
| |
| • | The length and depth of product and industry business cycles in our segments may result in periods of reduced sales, earnings and cash flows, and portions of our business are subject to seasonality and weather-related effects. |
| |
| • | If we are not able to continue our technological innovation and successful introduction of new products, our customers may turn to other suppliers to meet their requirements. |
| |
| • | Prices for certain raw materials are volatile and can have a significant effect on our manufacturing and supply chain strategies as we seek to maximize our profitability. If we are unable to successfully adjust our strategies in response to volatile raw materials and energy prices, such volatility could have a negative effect on our earnings in future periods. |
| |
| • | The global scope of our operations subjects us to the risks of doing business in foreign countries, which could adversely affect our business, financial condition and results of operations. |
| |
| • | We are exposed to currency exchange rate changes that impact our profitability. |
| |
| • | Following the separation, the Company will have debt obligations that could restrict our business, adversely impact our financial condition, results of operations or cash flows or restrict our ability to return cash to shareholders. |
| |
| • | We intend to pursue acquisitions, joint ventures and other transactions that complement or expand our businesses. We may not be able to complete proposed transactions and even if completed, the transactions may not achieve the earnings, cash flow or returns on investment that we had contemplated. |
Risks Relating to the Separation
| |
| • | We have no history operating as an independent public company. We will incur significant costs to create the corporate infrastructure necessary to operate as an independent public company, and we may experience increased ongoing costs in connection with being an independent public company. |
| |
| • | We may not realize the potential benefits from the separation, and our historical combined and pro forma financial information is not necessarily indicative of our future performance. |
| |
| • | If the distribution and certain related transactions fail to qualify under applicable Internal Revenue Code provisions, Grace, the Company, and Grace shareholders could be subject to significant tax liabilities and, in certain circumstances, the Company could be required to indemnify Grace for material taxes and other related amounts pursuant to indemnification obligations under the Tax Sharing Agreement. |
| |
| • | In connection with our separation from Grace, Grace will indemnify the Company for certain liabilities and the Company will indemnify Grace for certain liabilities. If the Company is required to act on these indemnities to Grace, we may need to divert cash to meet those obligations and our financial results could be negatively impacted. Grace may not be able to satisfy its indemnification obligations to the Company in the future. |
Risks Relating to Ownership of GCP Common Stock
| |
| • | Because there has not been any public market for GCP common stock, the market price and trading volume of its common stock may be volatile and you may not be able to resell your shares at or above the initial market price of the GCP common stock following the separation and distribution. |
| |
| • | A large number of the Company’s shares are or will be eligible for future sale, which may cause the market price for GCP common stock to decline. |
| |
| • | Provisions in the Company’s corporate documents, the Tax Sharing Agreement and Delaware law could delay or prevent a change in control of the Company, even if that change may be considered beneficial by some Company shareholders. |
The Separation
Overview — On February 5, 2015, Grace announced its intent to separate GCP into an independent publicly-traded company. Subject to the satisfaction of specified conditions, the separation will be accomplished by distributing to Grace shareholders all of the shares of common stock of the Company. The Company is a wholly owned subsidiary of Grace that at the time of the separation will hold GCP. Immediately following the distribution, Grace shareholders as of the record date will own 100 percent of the outstanding shares of GCP common stock.
Before the separation of GCP from Grace, the Company and Grace will enter into a Separation and Distribution Agreement and they and/or their respective subsidiaries will enter into several other agreements to effect the separation and distribution. These agreements will provide for the allocation between the Company and Grace of Grace’s assets, liabilities and obligations and will govern the relationship between the Company and Grace after the separation (including with respect to employee matters, tax matters and intellectual property matters). The Company and Grace Conn and/or their respective subsidiaries will also enter into one or more Transition Services Agreements which will provide for, among other things, the provision of transitional services.
Reasons for the Separation. The W. R. Grace & Co. board of directors believes that separating GCP from Grace’s other businesses through the distribution is in the best interests of Grace and its shareholders and has
concluded the separation will provide each company with a number of material opportunities and benefits, including the following:
| |
| • | Enhanced Strategic Focus. Create two strong, more focused operating companies, each with industry-leading customer and technology positions, with Grace well-positioned to pursue distinct growth opportunities in the catalysts and materials businesses, and the Company well-positioned to pursue distinct growth opportunities in the specialty construction chemicals, specialty building materials and packaging products businesses. |
| |
| • | Simplified Operating Structures. Allow management of each company to concentrate that company’s resources wholly on its particular industry segments, customers and core businesses, with greater ability to anticipate and respond to changing industry conditions and new opportunities. Each company will focus on cost productivity and optimizing functional support for its core operations, with greater management focus on customized strategies that can deliver long-term shareholder value. |
| |
| • | Optimized Capital Structures and Financial Flexibility. Establish a capital structure appropriate for each company’s business needs, with each company having direct access to the debt and equity markets to pursue its distinct growth, acquisition and joint venture opportunities, eliminating competition for capital between the two. The separation will provide each company with an independent equity currency that will (1) facilitate the ability of each company to consummate future acquisitions using its common stock if required and (2) facilitate incentive compensation arrangements for employees that are more directly tied to the performance of each company’s business, and enhance employee hiring and retention by, among other things, improving the alignment of management and employee incentives with performance and growth objectives. |
| |
| • | Investor Choice. Provide investors with a more targeted investment opportunity in each company that offers different investment and business characteristics, including different growth opportunities, business models, capital requirements and financial returns. This will allow investors to evaluate the separate and distinct merits, performance and future prospects of each company. |
Questions and Answers About the Separation and Distribution
| |
| Q: | How will W. R. Grace & Co. accomplish the separation of GCP? |
| |
| A: | The separation involves W. R. Grace & Co.’s distribution to holders of Grace common stock of all the shares of GCP common stock that it owns. Following the separation and distribution, the Company will be an independent, publicly traded company separate from Grace, and Grace will not retain any ownership interest in the Company. You do not have to pay any consideration or give up any portion of your Grace common stock to receive GCP common stock in the distribution. |
| |
| Q: | What will I receive in the distribution? |
| |
| A: | W. R. Grace & Co. will distribute one share of GCP common stock for each share of Grace common stock outstanding as of the record date for the distribution. You will pay no consideration nor give up any portion of your Grace common stock to receive shares of GCP common stock in the distribution. |
| |
| Q: | What is the record date for the distribution, and when will the distribution occur? |
| |
| A: | The record date is January 27, 2016, and ownership is determined as of 5:00 p.m. Eastern Time on that date. When we refer to the “record date,” we are referring to that time and date. W. R. Grace & Co. will distribute shares of GCP common stock on or about February 3, 2016, which we refer to as the distribution date. |
| |
| Q: | As a holder of shares of Grace common stock as of the record date, what do I have to do to participate in the distribution? |
| |
| A: | No action is required of shareholders. Holders of Grace common stock on the record date are not required to pay any cash or deliver any other consideration, including any shares of Grace common stock, for the shares of GCP common stock to be distributed to them. No shareholder approval of the distribution is required or sought. You are not being asked for a proxy. |
| |
| Q: | If I sell my shares of Grace common stock before or on the distribution date, will I still be entitled to receive shares of GCP common stock in the distribution? |
| |
| A: | If you sell your shares of Grace common stock prior to or on the distribution date, you may also be selling your right to receive shares of GCP common stock. See “The Separation and Distribution—Trading Between Record Date and Distribution Date.” You are encouraged to consult with your financial advisor regarding the specific implications of selling your Grace common stock prior to or on the distribution date. |
| |
| Q: | How will fractional shares be treated in the distribution? |
| |
| A. | Grace will not distribute any fractional shares of GCP common stock to Grace stockholders. Any fractional share of GCP common stock otherwise issuable to you will be sold on your behalf, and you will receive a cash payment with respect to that fractional share. For an explanation of how the cash payments for fractional shares will be determined, see “The Separation and Distribution—Treatment of Fractional Shares.” |
| |
| Q: | Will the distribution affect the number of shares of Grace common stock that I currently hold? |
| |
| A: | No, the number of shares of Grace common stock held by a shareholder will be unchanged. The market value of each share of Grace common stock, however, will decline to reflect the effect of the separation and distribution. |
| |
| Q: | What are the material U.S. federal income tax consequences of the distribution of shares of GCP common stock to U.S. shareholders? |
| |
| A: | The distribution is conditioned upon, among other things, the receipt by Grace of an opinion of counsel, in form and substance satisfactory to Grace in its sole discretion, regarding the U.S. federal income tax treatment of the distribution of shares of GCP common stock and certain related transactions. We expect that, for U.S. federal income tax purposes, you will not recognize any gain or loss, and no amount will be included in your income, upon your receipt of shares of GCP common stock pursuant to the distribution, except with respect to any cash received in lieu of fractional shares. You should consult your own tax advisor as to the particular consequences of the distribution to you, including the applicability and effect of any U.S. federal, state and local tax laws, as well as foreign tax laws. For more information regarding certain material U.S. federal income tax consequences of the distribution, see the section entitled “Material U.S. Federal Income Tax Consequences.” |
| |
| Q: | Will I receive a stock certificate for shares of GCP common stock distributed as a result of the distribution? |
| |
| A: | No. Registered holders of Grace common stock who are entitled to participate in the distribution will receive a book-entry account statement reflecting their ownership of GCP common stock. For additional information, registered shareholders in the United States, Canada or Puerto Rico should contact W. R. Grace & Co.’s transfer agent, Wells Fargo Shareowner Services, at 800-648-8392 or through its website at shareowneronline.com. Shareholders from outside the United States, Canada and Puerto Rico may call 651-450-4064. See “The Separation and Distribution—When and How You Will Receive the Distribution.” |
| |
| Q: | What if I hold my shares through a broker, bank or other nominee? |
| |
| A: | Holders of Grace common stock who hold their shares through a broker, bank or other nominee will have their brokerage account credited with GCP common stock. For additional information, those shareholders should contact their broker or bank directly. |
| |
| Q: | What if I have stock certificates reflecting my shares of Grace common stock? Should I send them to the transfer agent or to W. R. Grace & Co.? |
| |
| A: | No, you should not send your stock certificates to the transfer agent or to W. R. Grace & Co. You should retain your Grace common stock certificates. |
| |
| Q: | Why is the separation of the two companies structured as a distribution of shares of GCP common stock? |
| |
| A: | Grace believes a distribution of shares of GCP common stock to holders of Grace common stock is the most efficient way to separate the companies. |
| |
| Q: | Can Grace decide to cancel the distribution of the GCP common stock even if all the conditions have been met? |
| |
| A: | Yes. Grace has the right to terminate the distribution at any time prior to the distribution date, even if all of the conditions are satisfied, if at any time Grace’s board determines that the distribution is not in the best interests of Grace and its shareholders. In the event the W. R. Grace & Co. board of directors determines to abandon, modify or change the terms of the distribution, the Company and W. R. Grace & Co. intend to promptly issue a press release and file a Current Report on Form 8-K to report such event. |
| |
| Q: | Will GCP incur any debt prior to or at the time of the distribution? |
| |
| A: | Yes. We intend to enter into new financing arrangements in anticipation of the distribution for borrowings of approximately $810 million. Approximately $750 million of the debt proceeds are expected to be distributed to Grace and the balance is expected to be retained to meet operating requirements. See “Risk Factors” and “Description of Material Indebtedness.” |
| |
| Q: | Does GCP intend to pay cash dividends? |
| |
| A: | GCP does not anticipate paying cash dividends on GCP common stock in the immediate future. The declaration and amount of future dividends, however, will be determined by our board of directors and will depend on our financial condition, earnings and cash flow, capital requirements, legal requirements, regulatory constraints and any other factors that our board of directors believes are relevant. See “Dividend Policy.” |
| |
| Q: | Will GCP common stock trade on a stock market? |
| |
| A: | Currently, there is no public market for GCP common stock. Subject to the consummation of the distribution, we have applied to list GCP common stock on the NYSE under the symbol “GCP.” We cannot predict the trading prices for GCP common stock when such trading begins. |
| |
| Q: | Will my shares of Grace common stock continue to trade? |
| |
| A: | Yes. Grace common stock will continue to be listed and trade on the NYSE under the symbol “GRA.” |
| |
| Q: | Will the separation affect the trading price of my Grace stock? |
| |
| A: | Yes. The trading price of shares of Grace common stock immediately following the distribution is expected to be lower than immediately prior to the distribution because the trading price will no longer reflect the value of GCP. We cannot provide you with any assurance regarding the price at which shares of Grace common stock will trade following the separation. |
| |
| Q: | What will happen to W. R. Grace & Co. stock options and other equity-based compensation awards? |
| |
| A: | For information on the treatment of W. R. Grace & Co. equity-based compensation awards, see “The Separation and Distribution—Treatment of Equity-Based Compensation” and “Certain Relationships and Related Transactions—Agreements with Grace-Employee Matters Agreement." |
| |
| Q: | What will the relationship be between Grace and GCP following the separation? |
| |
| A: | After the separation, Grace will not own any shares of GCP common stock, and each of Grace and GCP will be independent, publicly traded companies with their own management teams and boards of directors. However, in connection with the separation, we expect to enter into a number of agreements with Grace that will govern the separation and allocate responsibilities for obligations arising before and after the separation, including, among others, obligations relating to our employees, tax matters, |
intellectual property matters and transitional services. See “Certain Relationships and Related Transactions—Agreements with Grace.”
| |
| Q: | How much will the separation cost and who will bear that cost? |
| |
| A: | The separation is expected to cost approximately $100 million, of which approximately 65% is expected to be incurred prior to the separation. Grace will bear all costs prior to the separation. GCP will bear its costs after the separation which we expect to be approximately $10 million to $15 million. |
| |
| Q: | Will I have appraisal rights in connection with the separation and distribution? |
| |
| A: | No. Holders of Grace common stock are not entitled to appraisal rights in connection with the separation and distribution. |
| |
| Q: | Who is the transfer agent for the GCP common stock? |
| |
| A: | Wells Fargo Shareowner Services |
P.O. Box 64874
St. Paul, MN 55164-0874
Telephone: 800-648-8392 or 651-450-4064 (outside the United States, Canada and Puerto Rico).
| |
| Q: | Who is the distribution agent for the distribution? |
| |
| A: | Wells Fargo Shareowner Services |
P.O. Box 64874
St. Paul, MN 55164-0874
Telephone: 800-648-8392 or 651-450-4064 (outside the United States, Canada and Puerto Rico).
| |
| Q: | Whom can I contact for more information? |
| |
| A: | If you have questions relating to the mechanics of the distribution of shares of GCP common stock, you should contact the distribution agent: |
Wells Fargo Shareowner Services
P.O. Box 64874
St. Paul, MN 55164-0874
Telephone: 800-648-8392 or 651-450-4064 (outside the United States, Canada and Puerto Rico).
Before the separation, if you have questions relating to the separation and distribution, you should contact Grace at:
W. R. Grace & Co.
7500 Grace Drive
Columbia, MD 21044
Attention: Investor Relations/Shareholder Services
Telephone: 410-531-4000
Email: investor.relations@grace.com
Summary of the Separation and Distribution
The following is a summary of the material terms of the separation, distribution and other related transactions.
|
| | |
| Distributing company | | W. R. Grace & Co., a Delaware corporation. After the distribution, W. R. Grace & Co. will not own any shares of GCP common stock. |
| | | |
| Distributed company | | GCP Applied Technologies Inc., a Delaware corporation, the Company, an indirect wholly owned subsidiary of W. R. Grace & Co. that was formed in 2015. At the time of the distribution, the Company will hold the businesses, assets and liabilities associated with the Grace Construction Products operating segment and the Darex Packaging Technologies business. After the distribution, the Company will be an independent, publicly traded entity. |
| | | |
| Record date | | The record date for the distribution is 5:00 p.m. Eastern Time on January 27, 2016. |
| | | |
| Distribution date | | The distribution date is February 3, 2016. |
| | | |
| Distributed securities | | Grace will distribute 100 percent of the shares of GCP common stock outstanding immediately prior to the distribution. Based on the approximately 70.5 million shares of Grace common stock outstanding on January 11, 2016, and applying the distribution ratio of one share of GCP common stock for each share of Grace common stock, Grace will distribute approximately 70.5 million shares of GCP common stock to Grace shareholders who hold Grace common stock as of the record date. |
| | | |
| Distribution ratio | | Each holder of Grace common stock will receive one share of GCP common stock for each share of Grace common stock held at 5:00 p.m. Eastern Time on January 27, 2016. |
| | | |
| Fractional shares | | Grace will not distribute any fractional shares of GCP common stock to Grace stockholders. Instead, as soon as practicable on or after the distribution date, the distribution agent will aggregate fractional shares into whole shares, sell the whole shares in the open market and distribute the aggregate cash proceeds, net of brokerage fees and other costs, from the sales pro rata to each holder who would otherwise have been entitled to receive a fractional share in the distribution. The distribution agent will determine when, how, through which broker-dealers and at what prices to sell the aggregated fractional shares. Recipients of cash in lieu of fractional shares will not be entitled to any interest on the amounts of payments made in lieu of fractional shares. The receipt of cash in lieu of fractional shares generally will be taxable to the recipient stockholders for U.S. federal income tax purposes as described in “Material U.S. Federal Income Tax Consequences” in this information statement. |
| | | |
| Distribution method | | GCP common stock will be issued only by direct registration in book-entry form. Registration in book-entry form is a method of recording stock ownership when no physical paper share certificates are issued to shareholders, as is the case in this distribution. |
| | | |
| Conditions to the distribution | | The distribution is subject to the satisfaction or waiver by Grace of the following condition, as well as other conditions described in this information statement in “The Separation and Distribution-Conditions to the Distribution.” • The receipt of an opinion of counsel, in form and substance satisfactory to Grace in its sole discretion, regarding the U.S. federal income tax treatment of the distribution and certain related transactions.The fulfillment of the foregoing condition and the other conditions to the distribution does not create any obligations on Grace’s part to effect the distribution, and the Grace board of directors has reserved the right, in its sole discretion, to abandon, modify or change the terms of the distribution, including by accelerating or delaying the timing of the consummation of all or part of the distribution, at any time prior to the distribution date. |
| | | |
|
| | |
| Stock exchange listing | | GCP has applied to have the GCP common stock listed on the NYSE under the symbol “GCP.” |
| | | |
| Dividend policy | | While remaining at the discretion of the Company's board of directors, the Company does not anticipate paying cash dividends on GCP common stock in the immediate future. |
| | | |
| Transfer agent | | Wells Fargo Shareowner Services P.O. Box 64874 St. Paul, MN 55164-0874 Telephone: 800-648-8392 or 651-450-4064 (outside the United States, Canada and Puerto Rico). |
| | | |
| U.S. federal income tax consequences | | It is a condition to the completion of the distribution that Grace obtains an opinion of counsel, in form and substance satisfactory to Grace in its sole discretion, regarding the U.S. federal income tax treatment of the distribution of shares of GCP common stock and certain related transactions. We expect that, for U.S. federal income tax purposes, a holder of Grace common stock will not recognize any gain or loss, and no amount will be included in the income of a holder of Grace common stock, upon the receipt of shares of GCP common stock pursuant to the distribution, except with respect to any cash received in lieu of fractional shares. You should consult your own tax advisor as to the particular tax consequences of the distribution to you, including the applicability and effect of any U.S. federal, state and local tax laws, as well as foreign tax laws. For more information regarding certain material U.S. federal income tax consequences of the distribution, see “Material U.S. Federal Income Tax Consequences.” |
Corporate Information
The Company was formed in 2015 and will, at the time of the distribution, hold the businesses, assets and liabilities associated with the Grace Construction Products operating segment and the Darex Packaging Technologies business. Our headquarters will be located at 62 Whittemore Avenue, Cambridge, MA 02140 and our general telephone number is 617-876-1400. Our Internet website is www.gcpat.com. Our website and information contained on that site, or connected to that site, are not incorporated by reference into this information statement.
Reason for Furnishing this Information Statement
This information statement is being furnished solely to provide information to Grace shareholders who are entitled to receive shares of GCP common stock in the distribution. The information statement is not, and is not to be construed as, an inducement or encouragement to buy, hold or sell any of our securities. We believe the information contained in this information statement is accurate as of the date set forth on the cover. Changes may occur after that date and neither Grace nor we undertake any obligation to update such information except in the normal course of our respective public disclosure obligations.
RISK FACTORS
You should carefully consider each of the following risk factors and all of the other information set forth in this information statement. The risk factors generally have been separated into three groups: (1) risks relating to our business, (2) risks relating to the separation and (3) risks relating to the ownership of GCP common stock. Based on the information currently known to us, we believe that the following information identifies the most significant risk factors affecting the Company and our business in each of these categories of risks. However, the risks and uncertainties the Company faces are not limited to those set forth in the risk factors described below. Additional risks and uncertainties not presently known to us or that we currently believe to be immaterial may also adversely affect our business. In addition, past financial performance may not be a reliable indicator of future performance, and historical trends should not be used to anticipate results or trends in future periods.
If any of the following risks and uncertainties develops into actual events, these events could have a material adverse effect on our business, financial condition or results of operations. In such case, the trading price of our common stock could decline.
Risks Relating to Our Business
The length and depth of product and industry business cycles in our segments may result in periods of reduced sales, earnings and cash flows, and portions of our business are subject to seasonality and weather-related effects.
Our operating segments are sensitive to the cyclical nature of the industries they serve. Our construction business is cyclical in response to economic conditions and construction demand and is also seasonal and dependent on favorable weather conditions, with a decrease in construction activity during the winter months. Our packaging products are affected by seasonal and weather-related factors including the consumption of beverages and the size and quality of food crops.
If we are not able to continue our technological innovation and successful introduction of new products, our customers may turn to other suppliers to meet their requirements.
The specialty chemicals industry and the end-use applications into which we sell our products experience ongoing technological change and product improvements. A key element of our business strategy is to invest in research and development activities with the goal of introducing new high-performance, technically differentiated products. We may not be successful in developing new technology and products that successfully compete with products introduced by our competitors, and our customers may not accept, or may have lower demand for, our new products. If we fail to keep pace with evolving technological innovations or fail to improve our products in response to our customers’ needs, then our business, financial condition and results of operations could be adversely affected as a result of reduced sales of our products.
Prices for certain raw materials are volatile and can have a significant effect on our manufacturing and supply chain strategies as we seek to maximize our profitability. If we are unable to successfully adjust our strategies in response to volatile raw materials prices, such volatility could have a negative effect on our earnings in future periods.
We use petroleum-based materials, natural gas derivatives and other materials in the manufacture of our products. Prices for these materials are volatile and can have a significant effect on our pricing, sales, manufacturing and supply chain strategies as we seek to maximize our profitability. Our ability to successfully adjust strategies in response to volatile raw material prices by increasing prices, reducing costs or taking other actions is a significant factor in maintaining or improving our profitability. If we are unable to successfully adjust our strategies in response to volatile prices, such volatility could have a negative effect on our sales and earnings in future periods.
A substantial portion of our raw materials are commodities whose prices fluctuate as market supply and demand fundamentals change. We attempt to manage exposure to price volatility of major commodities through:
| |
| • | long-term supply contracts; |
| |
| • | customer contracts that permit adjustments for changes in prices of commodity-based materials and energy; |
| |
| • | forward buying programs that layer in our expected requirements systematically over time; and |
| |
| • | limited use of financial instruments. |
Although we regularly assess our exposure to raw material price volatility, we cannot always predict the prospects of volatility and we cannot always cover the risk in a cost-effective manner.
We have a policy of maintaining, when available, multiple sources of supply for raw materials. However, certain of our raw materials may be provided by single sources of supply. We may not be able to obtain sufficient raw materials due to unforeseen developments that would cause an interruption in supply. Even if we have multiple sources of supply for raw materials, these sources may not make up for the loss of a major supplier.
The global scope of our operations subjects us to the risks of doing business in foreign countries, which could adversely affect our business, financial condition and results of operations.
We operate our business on a global scale with approximately 68% of our 2014 sales outside the United States. We conduct business in over 40 countries and in approximately 40 currencies. We currently have many production facilities, technical centers and administrative and sales offices located outside North America, including facilities and offices in Europe, the Middle East, Africa, Asia and Latin America. We expect non-U.S. sales to continue to represent a substantial majority of our revenue. Accordingly, our business is subject to risks related to the differing legal, political, social and economic conditions as well as regulatory requirements of many jurisdictions. Risks inherent in non-U.S. operations include the following:
| |
| • | commercial agreements may be more difficult to enforce and receivables more difficult to collect; |
| |
| • | intellectual property rights may be more difficult to enforce; |
| |
| • | we may experience increased shipping costs, disruptions in shipping or reduced availability of freight transportation; |
| |
| • | we may have difficulty transferring our profits or capital from foreign operations to other countries where such funds could be more profitably deployed; |
| |
| • | we may experience unexpected adverse changes in export duties, quotas and tariffs and difficulties in obtaining export licenses; |
| |
| • | some foreign countries have adopted, and others may impose, additional withholding taxes or other restrictions on foreign trade or investment, including currency exchange and capital controls; |
| |
| • | foreign governments may nationalize private enterprises; |
| |
| • | our business and profitability in a particular country could be affected by political or economic repercussions on a domestic, country specific or global level from terrorist activities and the response to such activities; |
| |
| • | we may be affected by unexpected adverse changes in foreign laws or regulatory requirements; and |
| |
| • | unanticipated events, such as geopolitical changes, could adversely affect our foreign operations. |
Our success as a global business will depend, in part, upon our ability to succeed in differing legal, regulatory, economic, social and political conditions by developing, implementing and maintaining policies and strategies that are effective in each location where we do business.
We are exposed to currency exchange rate changes that impact our profitability.
We are exposed to currency exchange rate risk through our U.S. and non-U.S. operations. Changes in currency exchange rates may materially affect our operating results. For example, changes in currency exchange rates may affect the relative prices at which we and our competitors sell products in the same region and the cost of materials used in our operations. A substantial portion of our net sales and assets are denominated in currencies other than the U.S. dollar. When the U.S. dollar strengthens against other currencies, at a constant level of business, our reported sales, earnings, assets and liabilities are reduced because the non-U.S. currencies translate into fewer U.S. dollars. In addition, since we manufacture a portion of our construction products and packaging products in emerging regions using raw materials from suppliers in the U.S., Europe and other
advanced economies, changes in the values of the currencies of these emerging regions versus the U.S. dollar and the euro may adversely affect our raw material costs.
We incur a currency transaction risk whenever one of our operating subsidiaries enters into either a purchase or a sales transaction using a currency different from the operating subsidiary's functional currency. Given the volatility of exchange rates, we may not be able to manage our currency transaction risks effectively, or volatility in currency exchange rates may expose our financial condition or results of operations to significant additional risk.
Following the separation, the Company will have debt obligations that could restrict our business, adversely impact our financial condition, results of operations or cash flows or restrict our ability to return cash to shareholders.
As of December 31, 2014, we had $79.0 million of unsecured indebtedness outstanding. Immediately following the separation, we expect the Company will bear a total combined indebtedness for borrowed money of approximately $820 million, including approximately $750 million borrowed to pay a distribution to Grace prior to the separation. The Company's indebtedness may have material effects on our business, including to:
| |
| • | require us to dedicate a substantial portion of our cash flow to debt payments, thereby reducing funds available for working capital, capital expenditures, acquisitions, research and development, distributions to holders of GCP common stock and other purposes; |
| |
| • | restrict us from making strategic acquisitions or taking advantage of favorable business opportunities; |
| |
| • | limit our flexibility in planning for, or reacting to, changes in our business and the industries in which we operate; |
| |
| • | increase our vulnerability to adverse economic, credit and industry conditions, including recessions; |
| |
| • | make it more difficult for us to satisfy our debt service and other obligations; |
| |
| • | place us at a competitive disadvantage compared to our competitors that have relatively less debt; and |
| |
| • | limit the Company's ability to borrow additional funds, or to dispose of assets to raise funds, if needed, for working capital, capital expenditures, acquisitions, research and development and other purposes. |
The Company may also incur substantial additional indebtedness in the future. If the Company incurs additional debt, the risks related to the Company's indebtedness may intensify.
We require liquidity to service the Company's debt and to fund operations, capital expenditures, research and development efforts, acquisitions and other corporate expenses.
Our ability to fund operations, capital expenditures, research and development efforts, acquisitions and other corporate expenses, including repayment of our debt, depends on our ability to generate cash through future operating performance, which is subject to economic, financial, competitive, legislative, regulatory and other factors. Many of these factors are beyond our control. We cannot be certain that our businesses will generate sufficient cash or that future borrowings will be available to us in amounts sufficient to fund all of our requirements. If we are unable to generate sufficient cash to fund all of our requirements, we may need to pursue one or more alternatives, such as to:
| |
| • | reduce or delay planned capital expenditures, research and development spending or acquisitions; |
| |
| • | obtain additional financing or restructure or refinance all or a portion of our debt on or before maturity; |
| |
| • | sell assets or businesses; and |
Any reduction or delay in planned capital expenditures, research and development spending or acquisitions or sale of assets or businesses may materially and adversely affect our future revenue prospects. In addition, we
cannot be certain that we will be able to raise additional equity capital, restructure or refinance any of our debt or obtain additional financing on commercially reasonable terms or at all.
We expect restrictions imposed by agreements governing the Company's indebtedness may limit our ability to operate our business, finance our future operations or capital needs or engage in other business activities. If we fail to comply with certain restrictions under these agreements, the Company's debt could be accelerated and the Company may not have sufficient cash to pay the accelerated debt.
We expect the agreements governing our indebtedness may contain various covenants that limit, among other things, our ability, and the ability of certain of our subsidiaries, to:
| |
| • | enter into sale and leaseback transactions; and |
| |
| • | consolidate, merge or sell all or substantially all of our assets or the assets of our guarantors. |
As a result of these covenants, we will be limited in the manner in which we can conduct our business, and may be unable to engage in favorable business activities or finance future operations or capital needs. Accordingly, these restrictions may limit our flexibility to operate our business. A failure to comply with the restrictions contained in these agreements, including maintaining the financial ratios that we expect to be required by our credit facilities, could lead to an event of default which could result in an acceleration of the indebtedness. We cannot assure you that our future operating results will be sufficient to enable us to comply with the covenants contained in the agreements that we expect to govern our indebtedness or to remedy any such default. In addition, in the event of an acceleration, we may not have or be able to obtain sufficient funds to make any accelerated payments.
Our indebtedness exposes us to interest expense increases if interest rates increase.
As of the time of the separation and distribution, we expect that $295 million, or approximately 36%, of our borrowings, will be at variable interest rates and expose us to interest rate risk. If interest rates increase, our debt service obligations on the variable rate indebtedness would increase even though the amount borrowed would remain the same, and our net income would decrease. An increase of 1% in the interest rates payable on the variable rate indebtedness we expect to have at the time of the separation and distribution would increase our annual estimated debt-service requirements by $3 million, assuming our consolidated variable interest rate indebtedness outstanding as of the time of the separation and distribution remains the same.
We have unfunded and underfunded pension plan liabilities. We will require future operating cash flow to fund these liabilities. We have no assurance that we will generate sufficient cash to satisfy these obligations.
We maintain U.S. and non-U.S. defined benefit pension plans covering current and former employees who meet or met age and service requirements. Our net pension liability and cost is materially affected by the discount rate used to measure pension obligations, the longevity and actuarial profile of our workforce, the level of plan assets available to fund those obligations and the actual and expected long-term rate of return on plan assets. Significant changes in investment performance or a change in the portfolio mix of invested assets can result in corresponding increases and decreases in the valuation of plan assets or in a change in the expected rate of return on plan assets. In addition, any changes in the discount rate could result in a significant increase or decrease in the valuation of pension obligations, affecting the reported funded status of our pension plans as well as the net periodic pension cost in the following years. Similarly, changes in the expected return on plan assets can result in significant changes in the net periodic pension cost in the following years.
We intend to pursue acquisitions, joint ventures and other transactions that complement or expand our businesses. We may not be able to complete proposed transactions and even if completed, the transactions may not achieve the earnings, cash flow or returns on investment that we had contemplated.
We have recently completed a number of acquisitions that we believe will contribute to our future success. We intend to continue to pursue opportunities to buy other businesses or technologies that could complement, enhance or expand our current businesses or product lines or that might otherwise offer us growth opportunities. We may have difficulty identifying appropriate opportunities or, if we do identify opportunities, we may not be
successful in completing transactions for a number of reasons. Any transactions that we are able to identify and complete may involve a number of risks, including:
| |
| • | the diversion of management's attention from our existing businesses to integrate the operations and personnel of the acquired or combined business or joint venture; |
| |
| • | possible adverse effects on our operating results during the integration process; |
| |
| • | failure of the acquired business to achieve expected operational objectives; and |
| |
| • | our possible inability to achieve the intended objectives of the transaction. |
In addition, we may not be able to successfully or profitably integrate, operate, maintain and manage our newly acquired operations or their employees. We may not be able to maintain uniform standards, controls, procedures and policies, which may lead to operational inefficiencies.
Our results of operations could be adversely affected by warranty claims and product liability.
We provide standard warranties that our products perform according to their specifications and do not have material defects. In particular, for a limited number of high value construction projects we warrant the performance of some products for periods of 10 to 20 years. Our products are generally sold to the commercial construction, residential construction and food packaging industries and they often constitute an integral part of our customers’ products. If our products do not meet specifications, are otherwise defective, or are used contrary to our instructions or in applications for which they are not designed, they may contribute to damage to our customers’ products, the end users of our customers’ products and buildings and other installations that contain our products. Although we take measures to avoid product defects and instruct our customers on the proper use of our products, if a substantial warranty claim or product liability lawsuit is brought against us, the cost of defending the claim or lawsuit could be significant and any adverse determination could have a material adverse effect on our results of operations.
We manufacture and sell products into many global jurisdictions where our efforts to contractually limit our liability (e.g. by defining a maximum liability, disclaiming implied or other statutory forms of liability or by waiving certain types of damages, including consequential, indirect and non-proximately caused damages) may not be enforceable or may be found by a court to not apply in a particular situation.
We work with dangerous materials that can injure our employees, damage our facilities and disrupt our operations.
Some of our operations involve the handling of hazardous materials that may pose the risk of fire, explosion, or the release of hazardous substances. Such events could result from terrorist attacks, natural disasters, or operational failures, and might cause injury or loss of life to our employees and others, environmental contamination, and property damage. These events might cause a temporary shutdown of an affected plant, or portion thereof, and we could be subject to penalties or claims as a result. A disruption of our operations caused by these or other events could have a material adverse effect on our results of operations.
We may be required to spend large amounts of money for environmental compliance and are subject to extensive environmental, health and safety laws and regulations, which could result in significant costs or liabilities.
As a manufacturer of specialty chemicals and specialty materials, we are subject to stringent regulations under numerous U.S. federal, state, local and foreign environmental, health and safety laws and regulations relating to among other things, the discharge and emission of hazardous materials into the environment, the generation, storage, handling, discharge, disposition, treatment, disposal and stewardship of hazardous substances, wastes and other materials, and the investigation and remediation of contamination. We expend funds to comply with such laws and regulations and have established a policy to minimize our emissions to the environment. Nevertheless, legislative, regulatory and economic uncertainties (including existing and potential laws and regulations pertaining to climate change) make it difficult for us to project future spending for these purposes and if there is a change in, or stricter interpretation of, existing laws and regulations or if there is the promulgation of new requirements, we may be required to expend significant additional funds, including capital expenditures, to remain in compliance, which could reduce our profitability. Failure to comply with such laws and
regulations can result in significant fines, penalties, costs, liabilities or restrictions on operations that could negatively affect our business, financial condition or results of operations.
From time to time, we are subject to lawsuits and regulatory actions, in connection with current and former operations for breaches of environmental laws that seek clean-up or other remedies. We are also subject to lawsuits and investigations by public and private parties under various environmental laws in connection with our current and former operations in various states, including with respect to off-site disposal at facilities where we have been identified as a potentially responsible party under the Comprehensive Environmental Response, Compensation and Liability Act of 1980, as amended, commonly referred to as “CERCLA.” CERCLA, and other similar environmental laws, may impose joint and several liability for the costs of remedial investigations and cleanup actions, as well as damages to natural resources, regardless of fault, the legality of the original disposal or ownership of the disposal site. We are also subject to similar risks outside the United States.
Some of our employees are unionized, represented by works councils or employed subject to local laws that are less favorable to employers than the laws in the United States.
As of the date of the separation, we will have approximately 2,850 employees. Approximately 85 of our approximately 770 U.S. employees are unionized. In addition, a large number of our employees are employed in countries in which employment laws provide greater bargaining or other rights to employees than the laws in the United States. Such employment rights require us to work collaboratively with the legal representatives of the employees to effect any changes to labor arrangements. For example, most of our employees in Europe are represented by works councils that have co-determination rights on any changes in conditions of employment, including salaries and benefits and staff changes, and may impede efforts to restructure our workforce. A strike, work stoppage or slowdown by our employees or significant dispute with our employees, whether or not related to these negotiations, could result in a significant disruption of our operations or higher ongoing labor costs.
We may be subject to claims of infringement of the intellectual property rights of others, which could hurt our business.
From time to time, we face claims from our competitors or others alleging that our processes or products infringe or otherwise misappropriate their intellectual property rights. Any claims that our products or processes infringe or misappropriate the intellectual property rights of others, regardless of the merit or resolution of the claims, could cause us to incur significant costs in responding to, defending and resolving the claims, and may divert the efforts and attention of our management and technical personnel from our business. If we are found to be infringing or misappropriating intellectual property of others, we may be liable for damages, including damages that may have occurred from our customers using any infringing products, and we may be required to change our processes, redesign our products, pay others to use the technology or stop using the technology or producing the infringing product or otherwise exploiting the misappropriated intellectual property. Even if we ultimately prevail, the existence of the lawsuit could prompt our customers to switch to products that are not the subject of infringement or misappropriation suits.
We are subject to business continuity risks associated with centralization of certain administrative functions.
We have centralized certain administrative functions in a few designated centers around the world, to improve efficiency and reduce costs. To the extent that these central locations are disrupted or disabled, key business processes, such as invoicing, payments and general management operations, could be interrupted.
A failure of our information technology infrastructure could adversely impact our business and operations.
We rely upon the capacity, reliability and security of our information technology (IT) infrastructure and our ability to expand and continually update this infrastructure in response to the changing needs of our business. If we experience a problem with the functioning of an important IT system or a security breach of our IT systems, the resulting disruptions could have an adverse effect on our business.
We and certain of our third-party vendors receive and store personal information in connection with our human resources operations and other aspects of our business. Despite our implementation of security measures, our IT systems are vulnerable to damages from computer viruses, natural disasters, unauthorized access, cyber-attack and other similar disruptions. Any system failure, accident or security breach could result in
disruptions to our operations. A material network breach in the security of our IT systems could include the theft of our intellectual property, trade secrets or customer information. To the extent that any disruptions or security breach results in a loss or damage to our data, or an inappropriate disclosure of confidential or customer information, it could cause significant damage to our reputation, affect our relationships with our customers, lead to claims against us and ultimately harm our business. In addition, we may be required to incur significant costs to protect against damage caused by these disruptions or security breaches in the future.
Risks Relating to the Separation
We have no history operating as an independent public company. We will incur significant costs to create the corporate infrastructure necessary to operate as an independent public company, and we may experience increased ongoing costs in connection with being an independent public company.
We have historically used Grace’s corporate infrastructure to support our business functions, including information technology systems. The expenses related to establishing and maintaining this infrastructure were spread among all of Grace’s businesses. Following the separation and after the expiration of the Transition Services Agreement, we will no longer have access to Grace’s infrastructure, and we will need to establish our own. We expect to incur costs beginning in 2015 to establish the necessary infrastructure. See “Unaudited Pro Forma Combined Financial Statements.”
Grace Conn currently performs many important corporate functions for us, including some information technology, treasury, tax administration, accounting, financial reporting, human resources, compensation, legal and other services. We currently compensate Grace Conn for many of these services on a cost-allocation basis. Following the separation, Grace Conn will continue to provide some of these services to us on a transitional basis, generally for a period of up to 18 months, pursuant to a Transition Services Agreement that we will enter into with Grace Conn. For more information regarding the Transition Services Agreement, see “Certain Relationships and Related Transactions-Agreements with Grace-Transition Services Agreement.” Grace Conn may not successfully execute all these functions during the transition period or we may have to expend significant efforts or costs materially in excess of those estimated under the Transition Services Agreement. Any interruption in these services could have a material adverse effect on our business, financial condition, results of operation and cash flows. In addition, at the end of this transition period, we will need to perform these functions ourselves or hire third parties to perform these functions on our behalf. The costs associated with performing or outsourcing these functions may exceed the amounts reflected in our historical combined financial statements or that we have agreed to pay Grace Conn during the transition period. A significant increase in the costs of performing or outsourcing these functions could materially and adversely affect our business, financial condition, results of operations and cash flows.
Currently, the Company is not directly subject to the reporting and other requirements of the Securities Exchange Act of 1934, as amended, which we refer to as the “Exchange Act.” After the separation, the Company will be directly subject to reporting and other obligations under the Exchange Act, including the requirements of Section 404 of the Sarbanes-Oxley Act of 2002, which will require, in the future, annual management assessments of the effectiveness of our internal control over financial reporting and a report by the Company's independent registered public accounting firm addressing the effectiveness of these controls. These reporting and other obligations will place significant demands on our management and administrative and operational resources, including accounting resources.
We may not realize the potential benefits from the separation, and our historical combined and pro forma combined financial information is not necessarily indicative of our future performance.
We may not realize the potential benefits we expect from our separation from Grace. We have described those anticipated benefits elsewhere in this information statement. See “The Separation and Distribution-Reasons for the Separation.” In addition, we will incur significant costs, including those described below, which may exceed our estimates, and we will incur some negative effects from our separation from Grace, including loss of access to some of the financial, managerial and professional resources from which we have benefited in the past.
Our historical combined and pro forma combined financial information is not necessarily indicative of our future financial condition, future results of operations or future cash flows, nor does it reflect what our financial condition, results of operations or cash flows would have been as an independent public company during the
periods presented. The historical combined financial information is not necessarily indicative of our future financial condition, results of operations or cash flows primarily because of the following factors:
| |
| • | Our historical combined financial results reflect allocations of expenses for services historically provided by Grace Conn, and those allocations may be significantly lower than the comparable expenses we would have incurred as an independent company; |
| |
| • | Our working capital requirements historically have been satisfied as part of Grace’s corporate-wide cash management programs, and our cost of debt and other capital may significantly differ from that reflected in our historical combined financial statements; |
| |
| • | The historical combined financial information may not fully reflect the costs associated with the Company being an independent public company, including significant changes that may occur in our cost structure, management, financing arrangements and business operations as a result of our separation from Grace including all the costs related to being an independent public company; and |
| |
| • | The historical combined financial information may not fully reflect the effects of certain liabilities that we will incur or assume. |
We based the pro forma adjustments on available information and assumptions that may prove not to be accurate. In addition, our unaudited pro forma combined financial information may not give effect to various ongoing additional costs we may incur in connection with being an independent public company. Accordingly, our unaudited pro forma combined financial information does not reflect what our financial condition, results of operations or cash flows would have been as an independent public company and is not necessarily indicative of our future financial condition or future results of operations.
Please refer to “Management’s Discussion and Analysis of Financial Condition and Results of Operations,” “Unaudited Pro Forma Combined Financial Statements” and our historical combined financial statements and the notes to those statements included elsewhere in this information statement.
If the distribution and certain related transactions fail to qualify under applicable Internal Revenue Code provisions, Grace, the Company and Grace shareholders could be subject to significant tax liabilities and, in certain circumstances, the Company could be required to indemnify Grace for material taxes and other related amounts pursuant to indemnification obligations under the Tax Sharing Agreement.
It is a condition to the distribution that Grace receive an opinion of counsel, in form and substance satisfactory to Grace in its sole discretion, regarding the U.S. federal income tax treatment of the distribution and certain related transactions. The opinion of counsel will be based upon and rely on, among other things, certain facts and assumptions, as well as certain representations, statements and undertakings of Grace and us, including those relating to the past and future conduct of Grace and us. If any of these representations, statements or undertakings are, or become, inaccurate or incomplete, or if Grace or we breach any of its or our covenants in the separation documents, the opinion of counsel may be invalid and the conclusions reached therein could be jeopardized.
Notwithstanding the opinion of counsel, the Internal Revenue Service (the “IRS”) could determine that the distribution and certain related transactions fail to qualify under applicable Internal Revenue Code provisions if it determines that any of the representations, assumptions or undertakings upon which the opinion of counsel was based are false or have been violated, or if it disagrees with the conclusions in the opinion of counsel. The opinion of counsel is not binding on the IRS and there can be no assurance that the IRS will not assert a contrary position.
If the distribution is determined to fail to qualify under applicable Internal Revenue Code provisions, then, in general, Grace may recognize taxable gain as if it had sold the GCP common stock in a taxable sale for its fair market value (unless Grace and the Company jointly make an election under Section 336(e) of the Internal Revenue Code (the “Code”) with respect to the distribution, in which case, in general, the Company would (i) recognize taxable gain as if it had sold all of its assets in a taxable sale in exchange for an amount equal to the fair market value of the GCP common stock and the assumption of all of the Company’s liabilities and (ii) obtain a related step up in the basis of its assets), and Grace shareholders who receive shares of GCP common stock in the distribution would be subject to tax as if they had received a taxable distribution equal to the fair market value of such shares. For more information, see “Material U.S. Federal Income Tax Consequences.”
Under the Tax Sharing Agreement to be entered into between Grace and the Company, the Company may be required to indemnify Grace against any additional taxes and related amounts resulting from (1) an acquisition under certain circumstances of all or a portion of the equity securities or assets of the Company, whether by merger or otherwise (and regardless of whether the Company participated in or otherwise facilitated the acquisition), (2) other actions or failures to act by the Company, or (3) any of the Company's representations or undertakings in connection with the separation and the distribution being incorrect or violated. Any such indemnity obligations could be material. See “Certain Relationships and Related Transactions-Agreements with Grace-Tax Sharing Agreement.” In addition, Grace, the Company and their respective subsidiaries may incur certain tax costs in connection with the separation, including non-U.S. tax costs resulting from separations in non-U.S. jurisdictions, which may be material.
U.S. federal income tax consequences may restrict our ability to engage in desirable strategic or capital-raising transactions following the distribution.
Under current law, a separation can be rendered taxable to the parent corporation and its shareholders as a result of certain post-separation acquisitions of shares or assets of the spun-off corporation. For example, a separation may result in taxable gain to the parent corporation under Section 355(e) of the Tax Code if the separation were later deemed to be part of a plan (or series of related transactions) pursuant to which one or more persons acquire, directly or indirectly, shares representing a 50 percent or greater interest (by vote or value) in the spun-off corporation. To preserve the U.S. federal income tax treatment of the separation and distribution, and in addition to our indemnity obligation described immediately above, the Tax Sharing Agreement will restrict the Company, for the two-year period following the distribution, except in specified circumstances, from:
| |
| • | Entering into any transaction pursuant to which all or a portion of the Company's assets or shares of GCP common stock would be acquired, whether by merger or otherwise; |
| |
| • | Issuing Company equity securities beyond certain thresholds; |
| |
| • | Repurchasing Company shares other than in certain open-market transactions; |
| |
| • | Ceasing to actively conduct or run certain of our businesses; or |
| |
| • | Taking or failing to take any other action that jeopardizes the expected U.S. federal income tax treatment of the distribution and certain related transactions. |
These restrictions may limit the Company's ability to pursue certain equity issuances, strategic transactions or other transactions that may maximize the value of our business. See “Material U.S. Federal Income Tax Consequences” and “Certain Relationships and Related Transactions-Agreements with Grace-Tax Sharing Agreement.”
In connection with our separation from Grace, Grace will indemnify the Company for certain liabilities and the Company will indemnify Grace for certain liabilities. If the Company is required to act on these indemnities to Grace, we may need to divert cash to meet those obligations and our financial results could be negatively impacted. The Grace indemnity may not be sufficient to insure the Company against the full amount of liabilities for which it will be allocated responsibility, and Grace may not be able to satisfy its indemnification obligations in the future.
Pursuant to the Separation and Distribution Agreement and the Tax Sharing Agreement, Grace will agree to indemnify the Company for certain liabilities, and the Company will agree to indemnify Grace for certain liabilities, in each case for uncapped amounts, as discussed further in “Certain Relationships and Related Transactions-Agreements with Grace.” Indemnities that the Company may be required to provide Grace are not subject to any cap, may be significant and could negatively impact our business, particularly indemnities relating to our actions that could impact the U.S. federal income tax treatment of the distribution and certain related transactions. Third parties could also seek to hold the Company responsible for any of the liabilities that Grace has agreed to retain. Further, the indemnity from Grace may not be sufficient to protect the Company against the full amount of such liabilities, and Grace may not be able to fully satisfy its indemnification obligations in the future. Moreover, even if the Company ultimately succeeds in recovering from Grace any amounts for which the Company is held liable, the Company may be temporarily required to bear these losses itself. Each of these risks could negatively affect our business, results of operations and financial condition.
After the separation, certain of Grace’s insurance policies may not cover the Company for losses associated with occurrences prior to the separation.
In connection with the separation, the Company will enter into agreements with Grace to address several matters associated with the separation, including insurance coverage. See “Certain Relationships and Related Transactions-Agreements with Grace.” After the separation, some of Grace’s insurance policies may not cover the Company for losses associated with occurrences prior to the separation.
Several members of the Company's board of directors and management may have actual or potential conflicts of interest because of their ownership of shares of common stock of Grace.
Several members of the Company's board of directors and management own common stock of Grace and/or stock options to purchase common stock of Grace or other equity-based awards because of their current or prior relationships with Grace, which could create, or appear to create, potential conflicts of interest when the Company's directors and executive officers are faced with decisions that could have different implications for Grace and the Company. See “Management.”
Transfer or assignment to us of certain contracts, investments in joint ventures and other assets may require the consent of a third party. If such consent is not given, the Company may not be entitled to the benefit of such contracts, investments and other assets in the future.
The Separation and Distribution Agreement provides that in connection with the separation from Grace, a number of contracts with customers, suppliers, landlords and other third-parties are to be assigned from Grace or its affiliates to the Company or its affiliates. However, some of these contracts require the contractual counterparty’s consent to such an assignment. Similarly, in some circumstances, the Company and one or more business units of Grace are joint beneficiaries of contracts, and the Company will need to enter into a new agreement with the third-party to replicate the contract or assign the portion of the contract related to our business. It is possible that some parties may use the requirement of a consent or the fact that the separation is occurring to seek more favorable contractual terms from the Company or to seek to terminate the contract. If (1) the Company is unable to complete the assignments in a timely manner, (2) the Company enters into new agreements on significantly less favorable terms, or (3) if the contracts are terminated, the Company may be unable to obtain the benefits, assets and contractual commitments which are intended to be allocated to the Company as part of the separation from Grace. The failure to timely complete the assignment of existing contracts, or the negotiation of new arrangements, with any of our large customers or key suppliers (including those that are single source or limited source suppliers), or a termination of any of those arrangements, could negatively impact the Company's financial condition and future results of operations.
Risks Relating to Ownership of the GCP Common Stock
Because there has not been any public market for GCP common stock, the market price and trading volume of its common stock may be volatile and you may not be able to resell your shares at or above the initial market price of the GCP common stock following the separation and distribution.
Prior to the separation, there will have been no trading market for GCP common stock. The Company cannot assure you that an active trading market will develop or be sustained for the GCP common stock after the separation nor can the Company predict the prices at which the GCP common stock will trade after the separation. The market price of the GCP common stock could fluctuate significantly due to a number of factors, many of which are beyond the Company's control, including:
| |
| • | fluctuations in the Company's quarterly or annual earnings results or those of other companies in the industry; |
| |
| • | failures of the Company's operating results to meet the estimates of securities analysts or the expectations of shareholders or changes by securities analysts in their estimates of the Company's future earnings; |
| |
| • | announcements by the Company or our customers, suppliers or competitors; |
| |
| • | changes in laws or regulations which adversely affect our industry or the Company; |
| |
| • | changes in accounting standards, policies, guidance, interpretations or principles; |
| |
| • | general economic, industry and stock market conditions; |
| |
| • | future sales of GCP common stock by shareholders; |
| |
| • | future issuances of the Company’s common stock by the Company; and |
| |
| • | the other factors described in these “Risk Factors” and other parts of this information statement. |
A large number of the Company’s shares are or will be eligible for future sale, which may cause the market price for GCP common stock to decline.
Upon completion of the separation and distribution, the Company will have outstanding an aggregate of approximately 70.5 million shares of common stock. Virtually all of those shares will be freely tradable without restriction or registration under the Securities Act of 1933, as amended. We are unable to predict whether large amounts of GCP common stock will be sold in the open market following the separation and distribution. We are also unable to predict whether a sufficient number of buyers would be in the market at that time. It is possible that Grace shareholders will sell the shares of GCP common stock they receive in the distribution for various reasons. For example, such shareholders may not believe that our business profile or the Company's level of market capitalization as an independent company fits their investment objectives. The sale of significant amounts of GCP common stock or the perception in the market that this will occur may lower the market price of the GCP common stock.
Provisions in the Company’s corporate documents, the Tax Sharing Agreement and Delaware law could delay or prevent a change in control of the Company, even if that change may be considered beneficial by some Company shareholders.
The existence of some provisions of the Company’s certificate of incorporation and bylaws and Delaware law could discourage, delay or prevent a change in control of the Company that a shareholder may consider favorable. These include provisions:
| |
| • | authorizing a large number of shares of common stock that are not yet issued, which would allow the Company board of directors to issue shares to persons friendly to current management, thereby protecting the continuity of the Company's management, or which could be used to dilute the stock ownership of persons seeking to obtain control of the Company; |
| |
| • | prohibiting shareholders from calling special meetings of shareholders or taking action by written consent; |
| |
| • | establishing advance notice requirements for nominations of candidates for election to the Company's board of directors or for proposing matters that can be acted on by shareholders at the annual shareholder meetings; |
| |
| • | establishing supermajority vote requirements for certain amendments to the Company’s certificate of incorporation or shareholder proposals for amendments to the Company’s bylaws. |
In addition, following the separation, the Company will be subject to Section 203 of the Delaware General Corporation Law, which may have an anti-takeover effect with respect to transactions not approved in advance by the Company's board of directors, including discouraging takeover attempts that might result in a premium over the market price for shares of GCP common stock.
We believe these provisions protect the Company's shareholders from coercive or otherwise unfair takeover tactics by requiring potential acquirors to negotiate with the Company's board of directors and by providing the board of directors with more time to assess any acquisition proposal. However, these provisions apply even if a proposal may be considered beneficial by some shareholders and could delay or prevent an acquisition that the Company's board of directors determines is not in the best interests of the Company and its shareholders. See “Description of Capital Stock-Anti-Takeover Effects of Various Provisions of Delaware and the Company's Certificate of Incorporation and Bylaws.”
In addition, an acquisition or further issuance of our stock could trigger the application of Section 355(e) of the Code. For a discussion of Section 355(e), see “Material U.S. Federal Income Tax Consequences” and “-Risks Relating to the Separation." The Company may not be able to engage in desirable strategic or capital-raising
transactions following the distribution. Under the Tax Sharing Agreement, the Company would be required to indemnify Grace for any resulting tax and related amounts, and this indemnity obligation might discourage, delay or prevent a change of control that you may consider favorable.
The Company may issue preferred stock with terms that could dilute the voting power or reduce the value of GCP common stock.
The Company’s certificate of incorporation authorizes it to issue, without the approval of the Company’s shareholders, one or more classes or series of preferred stock having such designation, powers, preferences and relative, participating, optional and other special rights, including preferences over GCP common stock respecting dividends and distributions, as the Company's board of directors generally may determine. The terms of one or more classes or series of preferred stock could dilute the voting power or reduce the value of GCP common stock. For example, the Company could grant holders of preferred stock the right to elect some number of directors in all events or on the happening of specified events or the right to veto specified transactions. Similarly, the repurchase or redemption rights or liquidation preferences that the Company could assign to holders of preferred stock could affect the residual value of the common stock. See “Description of Capital Stock-Preferred Stock.”
The Company does not expect to pay any cash dividends for the foreseeable future.
The Company currently intends to retain future earnings to finance our business. As a result, the Company does not expect to pay any cash dividends for the foreseeable future. All decisions regarding the payment of dividends by the Company will be made by the Company's board of directors from time to time in accordance with applicable law. There can be no assurance that the Company will have sufficient surplus under Delaware law to be able to pay any dividends at any time in the future. This may result from extraordinary cash expenses, actual expenses exceeding contemplated costs, funding of capital expenditures or increases in reserves. If the Company does not pay dividends, the price of GCP common stock that you receive in the distribution must appreciate for you to receive a gain on your investment. This appreciation may not occur. Further, you may have to sell some or all of your shares of GCP common stock in order to generate cash flow from your investment.
SELECTED HISTORICAL COMBINED FINANCIAL DATA OF GCP
The following selected financial data reflect the combined operations of GCP. We derived the combined operating data for the years ended December 31, 2014, 2013 and 2012, and the combined balance sheet data as of December 31, 2014 and 2013, as set forth below, from GCP’s audited combined financial statements, which are included elsewhere in this information statement. We derived the combined operating data for the nine months ended September 30, 2015, and September 30, 2014, and the combined balance sheet data as of September 30, 2015, from GCP’s unaudited combined financial statements, which are included elsewhere in this information statement. We derived the combined operating data for the years ended December 31, 2011, and December 31, 2010, and the combined balance sheet data as of September 30, 2014, December 31, 2012, December 31, 2011, and December 31, 2010, from GCP’s underlying financial records, which were derived from the financial records of Grace. In management’s opinion, the unaudited combined financial statements have been prepared on substantially the same basis as the audited combined financial statements and include all adjustments, consisting only of normal recurring adjustments, necessary for a fair presentation of the combined financial information for the periods presented. The historical and pro forma results do not necessarily indicate the results expected for any future period.
The unaudited pro forma combined statement of operations data presented below have been prepared as though the distribution occurred on January 1, 2014. The unaudited pro forma combined balance sheet data presented below have been prepared as though the distribution occurred on September 30, 2015.
The selected historical and unaudited pro forma combined financial data presented below should be read in conjunction with “Management’s Discussion and Analysis of Financial Condition and Results of Operations” and the combined financial statements and accompanying notes included elsewhere in this information statement.
Selected Historical Combined Financial Data
|
| | | | | | | | | | | | | | | | | | | | | | | | | | | | | | | | | | | |
| | Nine Months Ended
September 30, | | Year Ended December 31, |
| (in millions, except per share amounts) | Pro Forma 2015 | | 2015 | | 2014 | | Pro Forma 2014 | | 2014 | | 2013 | | 2012 | | 2011 | | 2010 |
| Statement of Operations | | | | | | | | | | | | | | | | |
| Net sales | $ | 1,086.1 |
| | $ | 1,086.1 |
| | $ | 1,115.4 |
| | $ | 1,480.4 |
| | $ | 1,480.4 |
| | $ | 1,442.3 |
| | $ | 1,409.2 |
| | $ | 1,364.0 |
| | $ | 1,221.9 |
|
| Net income | 7.9 |
| | 33.0 |
| | 89.6 |
| | 96.0 |
| | 135.5 |
| | 111.3 |
| | 86.3 |
| | 60.3 |
| | 46.8 |
|
| Net (income) loss attributable to noncontrolling interests | (0.6 | ) | | (0.6 | ) | | (1.3 | ) | | (1.2 | ) | | (1.2 | ) | | (1.6 | ) | | (1.1 | ) | | 0.6 |
| | (0.3 | ) |
| Net income attributable to GCP | 7.3 |
| | 32.4 |
| | 88.3 |
| | 94.8 |
| | 134.3 |
| | 109.7 |
| | 85.2 |
| | 60.9 |
| | 46.5 |
|
| Financial Position | | | | | | | | | | | | | | | | | |
| Total assets | 961.6 |
| | 881.8 |
| | 1,005.9 |
| | NA |
| | 987.1 |
| | 991.9 |
| | 971.2 |
| | 904.5 |
| | 817.3 |
|
| Long-term debt | 795.9 |
| | — |
| | — |
| | NA |
| | — |
| | 4.5 |
| | 11.4 |
| | 0.1 |
| | 0.1 |
|
| Long-term debt—related party | — |
| | — |
| | 7.3 |
| | NA |
| | — |
| | 9.3 |
| | 20.1 |
| | 8.8 |
| | 0.9 |
|
| Data Per Common Share (Basic) | | | | | | | | | | | | | | | | | |
| Net income attributable to GCP | $ | 0.10 |
| | NA |
| | NA |
| | $ | 1.26 |
| | NA |
| | NA |
| | NA |
| | NA |
| | NA |
|
| Average common basic shares outstanding | 72.5 |
| | NA |
| | NA |
| | 75.3 |
| | NA |
| | NA |
| | NA |
| | NA |
| | NA |
|
| Data Per Common Share (Diluted) | | | | | | | | | | | | | | | | | |
| Net income attributable to GCP | $ | 0.10 |
| | NA |
| | NA |
| | $ | 1.26 |
| | NA |
| | NA |
| | NA |
| | NA |
| | NA |
|
| Average common diluted shares outstanding | 72.6 |
| | NA |
| | NA |
| | 75.4 |
| | NA |
| | NA |
| | NA |
| | NA |
| | NA |
|
UNAUDITED PRO FORMA COMBINED FINANCIAL STATEMENTS
The following unaudited pro forma combined financial statements of GCP consist of unaudited pro forma combined statements of operations for the nine months ended September 30, 2015, and for the year ended December 31, 2014, and an unaudited pro forma combined balance sheet as of September 30, 2015. The unaudited pro forma combined statements of operations for the nine months ended September 30, 2015, and the year ended December 31, 2014, have been prepared as though the distribution occurred on January 1, 2014. The unaudited pro forma combined balance sheet as of September 30, 2015, has been prepared as though the distribution occurred on September 30, 2015. The unaudited pro forma combined financial statements should be read in conjunction with our historical combined financial statements and “Management’s Discussion and Analysis of Financial Condition and Results of Operations” included in this information statement.
The unaudited pro forma combined financial statements have been derived from our historical combined financial statements included in this information statement and include certain adjustments to give effect to events that are (i) directly attributable to the distribution and related transaction agreements, (ii) factually supportable, and (iii) with respect to the statement of operations, expected to have a continuing impact on GCP. The unaudited pro forma combined financial statements are for illustrative purposes only, and do not reflect what our financial position and results of operations would have been had the distribution occurred as of and for the periods indicated. The unaudited pro forma combined financial statements are not necessarily indicative of our future financial position and results of operations as an independent, publicly traded company. The pro forma adjustments are based on available information and assumptions that management believes are reasonable given the information that is currently available. However, such adjustments are subject to change based on the finalization of the terms of the Separation and Distribution Agreement and related agreements.
The unaudited pro forma combined financial statements have been prepared to give effect to the following adjustments:
| |
| • | our anticipated post-separation equity capital, including (i) the issuance and subsequent distribution to holders of Grace common stock of approximately 71.4 million shares of our common stock, based on the distribution of one share of GCP common stock for each share of Grace common stock outstanding as of the record date for the distribution, and (ii) the resulting re-designation of Grace’s historical net investment as common stock and accumulated deficit; |
| |
| • | the incurrence of approximately $810 million of indebtedness with unrelated lenders, and the distribution of approximately $750 million of the proceeds to Grace; |
| |
| • | the transfer from Grace of certain pension obligations and assets associated with our employees; and |
| |
| • | the settlement of intercompany account balances between us and Grace. |
The pro forma adjustments do not result in a change to Adjusted EBIT for the nine months ended September 30, 2015 or for the year ended December 31, 2014.
The operating expenses reported in our historical combined statements of operations include allocations of certain Grace costs. These costs include allocation of Grace corporate costs that benefit us, including corporate governance, executive management, finance, legal, IT, human resources, supply chain, other general and administrative costs, shared services and depreciation on shared Grace assets.
To operate as an independent public company, we expect our recurring costs to replace these services to be lower than expenses historically allocated to us from Grace as presented in our historical combined statements of operations.
We estimate that the reduction of these costs as compared to our historical combined statements of operations will range from $5 million to $7 million per year. The reduction in costs is driven by lower estimated costs to replicate functional and shared services, offset by increased costs for corporate governance (including board of director compensation and expenses, audit and other professional services fees, annual report costs, proxy and filing fees and stock exchange fees, among others) and higher incentive and share-based compensation costs than were allocated to us historically. Certain factors could impact these stand-alone public company costs, including the finalization of our staffing and infrastructure needs.
Due to the scope and complexity of these activities, the amount and timing of these costs could vary and, therefore, are not included within the Unaudited Pro Forma Consolidated Financial Data.
We currently estimate expenses that we will incur during our transition to being a stand-alone public company to range from approximately $10 million to $15 million. We have not adjusted the accompanying unaudited pro forma combined statements of operations for these estimated expenses as they are not expected to have an ongoing impact on our operating results. We anticipate that substantially all of these expenses will be incurred within 12 months of the distribution. The expenses primarily relate to the following:
| |
| • | accounting, tax, legal and other professional costs pertaining to the separation and establishment as a stand-alone public company; |
| |
| • | costs related to information technology systems; |
| |
| • | salaries, benefits, and stock compensation, such as modifications to certain bonus awards, upon completion of the separation; and |
| |
| • | recruiting and relocation costs associated with hiring and relocating employees. |
Due to the scope and complexity of these activities, the amount of these costs could increase or decrease materially and the timing of incurrence could change.
GCP
Unaudited Pro Forma Combined Statement of Operations
Nine Months Ended September 30, 2015
|
| | | | | | | | | | | | |
| (in millions, except per share amounts) | Historical | | Pro Forma Adjustments | | Pro Forma | |
| Net sales | $ | 1,086.1 |
| | $ | — |
| | $ | 1,086.1 |
| |
| Cost of goods sold | 688.0 |
| | — |
| | 688.0 |
| |
| Gross profit | 398.1 |
| | — |
| | 398.1 |
| |
| Selling, general and administrative expenses | 217.5 |
| | — |
| | 217.5 |
| |
| Research and development expenses | 16.8 |
| | — |
| | 16.8 |
| |
| Interest expense and related financing costs | 1.1 |
| | 43.0 |
| (a) | 44.1 |
| |
| Interest expense, net—related party | 0.7 |
| | (0.7 | ) | (b) | — |
| |
| Loss in Venezuela | 59.6 |
| | — |
| | 59.6 |
| |
| Restructuring expenses and asset impairments | 9.9 |
| | — |
| | 9.9 |
| |
| Other expense (income), net | 1.3 |
| | — |
| | 1.3 |
| |
| Total costs and expenses | 306.9 |
| | 42.3 |
| | 349.2 |
| |
| Income before income taxes | 91.2 |
| | (42.3 | ) | | 48.9 |
| |
| Provision for income taxes | (58.2 | ) | | 17.2 |
| (c) | (41.0 | ) | |
| Net income | 33.0 |
| | (25.1 | ) | | 7.9 |
| |
| Less: Net income attributable to noncontrolling interests | (0.6 | ) | | — |
| | (0.6 | ) | |
| Net income attributable to GCP | $ | 32.4 |
| | $ | (25.1 | ) | | $ | 7.3 |
| |
| Earnings Per Share Attributable to GCP | | | | | | |
| Basic earnings per share: | | | | | | |
| Net income attributable to GCP |
|
| |
|
| | $ | 0.10 |
| (j) |
| Weighted average number of basic shares | | | | | 72.5 |
| (j) |
| Diluted earnings per share: | | | | | | |
| Net income attributable to GCP |
|
| |
|
| | $ | 0.10 |
| (k) |
| Weighted average number of diluted shares | | | | | 72.6 |
| (k) |
See Notes to Unaudited Pro Forma Combined Financial Statements.
GCP
Unaudited Pro Forma Combined Statement of Operations
Year Ended December 31, 2014
|
| | | | | | | | | | | | |
| (In millions, except per share amounts) | Historical | | Pro Forma Adjustments | | Pro Forma | |
| Net sales | $ | 1,480.4 |
| | $ | — |
| | $ | 1,480.4 |
| |
| Cost of goods sold | 949.9 |
| | 2.4 |
| (d) | 952.3 |
| |
| Gross profit | 530.5 |
| | (2.4 | ) | | 528.1 |
| |
| Selling, general and administrative expenses | 288.9 |
| | 6.9 |
| (d) | 295.8 |
| |
| Research and development expenses | 27.9 |
| | — |
| | 27.9 |
| |
| Interest expense and related financing costs | 3.9 |
| | 54.9 |
| (a) | 58.8 |
| |
| Interest expense, net—related party | 0.9 |
| | (0.9 | ) | (b) | — |
| |
| Restructuring expenses and asset impairments | 18.3 |
| | — |
| | 18.3 |
| |
| Other expense (income), net | (0.5 | ) | | — |
| | (0.5 | ) | |
| Total costs and expenses | 339.4 |
| | 60.9 |
| | 400.3 |
| |
| Income before income taxes | 191.1 |
| | (63.3 | ) | | 127.8 |
| |
| Provision for income taxes | (55.6 | ) | | 23.8 |
| (c) | (31.8 | ) | |
| Net income | 135.5 |
| | (39.5 | ) | | 96.0 |
| |
| Less: Net income attributable to noncontrolling interests | (1.2 | ) | | — |
| | (1.2 | ) | |
| Net income attributable to GCP | $ | 134.3 |
| | $ | (39.5 | ) | | $ | 94.8 |
| |
| Earnings Per Share Attributable to GCP | | | | | | |
| Basic earnings per share: | | | | | | |
| Net income attributable to GCP |
|
| | | | $ | 1.26 |
| (j) |
| Weighted average number of basic shares | | | | | 75.3 |
| (j) |
| Diluted earnings per share: | | | | | | |
| Net income attributable to GCP |
|
| | | | $ | 1.26 |
| (k) |
| Weighted average number of diluted shares | | | | | 75.4 |
| (k) |
See Notes to Unaudited Pro Forma Combined Financial Statements.
GCP
Unaudited Pro Forma Combined Balance Sheet
September 30, 2015
|
| | | | | | | | | | | |
| (In millions) | Historical | | Pro Forma Adjustments | | Pro Forma |
| ASSETS | | | | | |
| Current Assets | | | | | |
| Cash and cash equivalents | $ | 99.9 |
| | $ | (1.6 | ) | (e) | $ | 98.3 |
|
| Trade accounts receivable | 234.4 |
| | — |
| | 234.4 |
|
| Inventories | 114.2 |
| | — |
| | 114.2 |
|
| Loans receivable—related party | 3.0 |
| | (3.0 | ) | (b) | — |
|
| Deferred income taxes | 7.4 |
| | | | 7.4 |
|
| Other current assets | 32.8 |
| | (1.4 | ) | (b) | 31.4 |
|
| Total Current Assets | 491.7 |
| | (6.0 | ) | | 485.7 |
|
| Properties and equipment | 187.1 |
| | — |
| | 187.1 |
|
| Goodwill | 102.8 |
| | — |
| | 102.8 |
|
| Technology and other intangible assets, net | 34.2 |
| | — |
| | 34.2 |
|
| Deferred income taxes | 12.5 |
| | 60.3 |
| (f) | 72.8 |
|
| Overfunded defined benefit pension plans | 44.7 |
| | — |
| | 44.7 |
|
| Other assets | 8.8 |
| | 25.5 |
| (g) | 34.3 |
|
| Total Assets | $ | 881.8 |
| | $ | 79.8 |
| | $ | 961.6 |
|
| LIABILITIES AND EQUITY | | | |
| | |
|
| Current Liabilities | | | | | |
| Debt payable within one year | $ | 10.2 |
| | $ | 14.1 |
| (h) | $ | 24.3 |
|
| Accounts payable | 117.5 |
| | — |
| | 117.5 |
|
| Loans payable—related party | 48.8 |
| | (48.8 | ) | (b) | — |
|
| Other current liabilities | 129.8 |
| | (3.5 | ) | (b) | 126.3 |
|
| Total Current Liabilities | 306.3 |
| | (38.2 | ) | | 268.1 |
|
| Debt payable after one year | — |
| | 795.9 |
| (h) | 795.9 |
|
| Deferred income taxes | 21.5 |
| | | | 21.5 |
|
| Income tax contingencies | 7.5 |
| | 7.6 |
| (l) | 15.1 |
|
| Underfunded and unfunded defined benefit pension plans | 33.2 |
| | 43.7 |
| (d) | 76.9 |
|
| Other liabilities | 8.2 |
| | — |
| | 8.2 |
|
| Total Liabilities | 376.7 |
| | 809.0 |
| | 1,185.7 |
|
| Parent company equity (accumulated deficit) | | | |
| | |
|
| Net parent investment | 589.1 |
| | (589.1 | ) | (i) | — |
|
| Common stock issued | — |
| | 0.8 |
| (i) | 0.8 |
|
| Accumulated deficit | — |
| | (140.9 | ) | (i) | (140.9 | ) |
| Accumulated other comprehensive loss | (87.1 | ) | | | | (87.1 | ) |
| Total GCP Equity (Accumulated Deficit) | 502.0 |
| | (729.2 | ) | | (227.2 | ) |
| Noncontrolling interests | 3.1 |
| | — |
| | 3.1 |
|
| Total Equity (Accumulated Deficit) | 505.1 |
| | (729.2 | ) | | (224.1 | ) |
| Total Liabilities and Equity | $ | 881.8 |
| | $ | 79.8 |
| | $ | 961.6 |
|
See Notes to Unaudited Pro Forma Combined Financial Statements.
GCP
Notes to Unaudited Pro Forma Combined Financial Statements
The unaudited pro forma combined financial statements as of and for the nine months ended September 30, 2015, and the unaudited pro forma combined financial statements for the year ended December 31, 2014, include the following adjustments:
| |
| (a) | The adjustments of $43.0 million and $54.9 million for the nine months ended September 30, 2015, and the year ended December 31, 2014, respectively, represent interest expense and amortization of debt issuance costs in connection with the debt described in note (h) below. We have assumed a weighted average interest rate of approximately 6.5%. Interest expense may be higher or lower depending on the terms we obtain with third-party lenders. A 1/8% change in the assumed interest rate on new debt securities would change annual interest expense by approximately $1 million. |
| |
| (b) | These adjustments represent the settlement of intercompany balances between us and Grace. |
| |
| (c) | These adjustments reflect the tax effect of the pro forma adjustments using the applicable statutory rate. |
| |
| (d) | Effective as of the distribution date, Grace expects to transfer to GCP certain defined benefit pension plan assets related to GCP employees and GCP expects to become the sponsor of new plans for these employees and assume all liabilities associated with such plans. For purposes of the combined financial statements, these shared plans were accounted for as multi-employer defined benefit plans. The benefit plan expenses (other than mark-to-market adjustments) associated with these plans were allocated to GCP and are included in the historical combined financial statements. The net liability associated with such plans is approximately $44 million. The mark-to-market losses for the year ended December 31, 2014, of $6.9 million added to selling, general and administrative expenses and $2.4 million added to cost of goods sold associated with these plans were not included in the historical combined financial statements. No mark-to-market gains or losses were included in the nine months ended September 30, 2015 as the mark-to-market adjustments are recorded by Grace during the fourth quarter of each year. The actual assumed net benefit plan obligations could change significantly in the future from our estimates. |
| |
| (e) | This adjustment reflects a change to cash as set forth in the table below. |
|
| | | |
| (In millions) | September 30, 2015 |
| Cash, historical | $ | 99.9 |
|
| Principal debt, net | 810.0 |
|
| Debt issuance costs | (19.9 | ) |
| Domestic cash dividend(1) | (750.0 | ) |
| Other cash payments to Grace, including foreign cash repatriations | (41.7 | ) |
| Cash, pro forma | $ | 98.3 |
|
________________________________________________________________________________________________________________
| |
| (1) | This reflects the anticipated cash dividend to be paid to Grace from funds obtained through the issuance of principal debt. |
| |
| (f) | This adjustment reflects the transfer of tax assets to GCP associated with the pension liability discussed in note (d) above as well as a "step up" in tax basis for GCP assets resulting from taxable gain recognized by Grace related to the separation. It also reflects the effect of Grace retaining certain tax assets and liabilities reflected in the historical combined financial statements. |
| |
| (g) | This adjustment includes debt issuance costs of $19.9 million and a $5.6 million indemnity receivable from Grace associated with indemnity obligations under the Tax Sharing Agreement. |
| |
| (h) | These adjustments reflect the anticipated incurrence of approximately $810 million of debt, net of unamortized discounts. The target debt balance at the time of separation was determined by senior management based upon a review of a number of factors including forecasted liquidity and capital requirements, expected operating results, credit ratings consideration, and general economic considerations. |
| |
| (i) | These adjustments reflect the pro forma recapitalization of our equity. As of the distribution date, Grace’s investment in our business will be re-designated as our shareholders’ equity and will be allocated between common stock and accumulated deficit. |
|
| | | |
| (In millions) | September 30, 2015 |
| Net parent investment, historical | $ | 589.1 |
|
| Domestic cash dividend | (750.0 | ) |
| Other cash payments to Grace, including foreign cash repatriations | (41.7 | ) |
| Pension liability contribution | (43.7 | ) |
| Income tax contingencies, net | (2.0 | ) |
| Deferred income taxes, net | 60.3 |
|
| Intercompany settlement, net | 47.9 |
|
| Net parent investment, before redesignation | $ | (140.1 | ) |
| Redesignation of net parent investment | |
| Common stock issued, par value $0.01 | $ | 0.8 |
|
| Accumulated deficit | (140.9 | ) |
| Total | $ | (140.1 | ) |
| |
| (j) | The number of GCP shares used to compute pro forma basic earnings per share is based on the number of shares of GCP common stock assumed to be outstanding on the record date. This is based on the weighted average number of Grace common shares outstanding for the periods ended September 30, 2015 and December 31, 2014, respectively, assuming a distribution ratio of one share of GCP common stock for each share of Grace common stock. |
| |
| (k) | Pro forma diluted earnings per share and pro forma weighted-average diluted shares outstanding reflect potential common shares from Grace equity plans in which our employees participate. |
| |
| (l) | This adjustment reflects the effect of GCP assuming certain income tax contingencies, pursuant to the Tax Sharing Agreement, not reflected in the historical financial statements. This adjustment primarily relates to a $5.6 million income tax contingency arising from transactions between Grace and GCP foreign subsidiaries. As referenced in note (g), Grace will indemnify GCP for this matter under the Tax Sharing Agreement. |
MANAGEMENT'S DISCUSSION AND ANALYSIS OF FINANCIAL CONDITION AND RESULTS OF OPERATIONS
Our references to "advanced economies" and "emerging regions" refer to classifications established by the International Monetary Fund. We generally refer to the nine months ended September 30, 2015, as the "nine months" and the nine months ended September 30, 2014, as the "prior-year period."
Separation from Grace
On February 5, 2015, Grace announced its intent to separate the business, assets and liabilities associated with the Grace Construction Products operating segment and the Darex Packaging Technologies business, GCP, into an independent publicly-traded company. Subject to the satisfaction of specified conditions, the separation will be accomplished by distributing to holders of Grace common stock all of the shares of common stock of GCP Applied Technologies Inc. GCP Applied Technologies Inc., or the Company, is a wholly-owned subsidiary of Grace that at the time of the separation will hold GCP. Immediately following the distribution, holders of Grace common stock as of the record date will own 100 percent of the outstanding shares of GCP common stock.
Summary Description of the GCP Business
We are engaged in the production and sale of specialty construction chemicals, specialty building materials and packaging products through three operating segments:
| |
| • | Specialty Construction Chemicals. Specialty Construction Chemicals (SCC) provides products, technologies, and services that reduce the cost and improve the performance of cement, concrete, mortar, masonry and other cementitious based construction materials. |
| |
| • | Specialty Building Materials. Specialty Building Materials (SBM) produces and sells sheet and liquid membrane systems and other products that protect both new and existing structures from water, air, and vapor penetration, and from fire damage. We also manufacture and sell specialized cementitious and chemical grouts used for soil consolidation and leak-sealing applications. |
| |
| • | Darex Packaging Technologies. Darex Packaging Technologies (Darex) produces and sells sealants and coatings for consumer and industrial applications to protect the integrity of packaged products. |
We are a global industry leader in each of our operating segments and expect to remain so following our separation from Grace. See "Business—Business Overview" in this information statement for a summary description of our business.
Non-GAAP Financial Measures
The non-GAAP financial measures described below are supplemental measures of our performance and are not required by, or presented in accordance with, GAAP.
We define Adjusted EBIT (a non-GAAP financial measure) to be net income adjusted for interest income and expense; income taxes; restructuring expenses and asset impairments; repositioning expenses; pension costs other than service and interest costs, expected returns on plan assets, and amortization of prior service costs/credits; income and expense items related to certain product lines and other investments; gains and losses on sales of businesses, product lines, and certain other investments; and certain other unusual or infrequent items that are not representative of underlying trends.
We define Adjusted EBITDA (a non-GAAP financial measure) to be Adjusted EBIT adjusted for depreciation and amortization.
We define Adjusted EBIT Return On Invested Capital (a non-GAAP financial measure) to be Adjusted EBIT (on a trailing four quarters basis) divided by the sum of net working capital, properties and equipment and certain other assets and liabilities.
We define Adjusted Gross Margin (a non-GAAP financial measure) to be gross margin adjusted for pension-related costs and loss in Venezuela included in cost of goods sold.
We use Adjusted EBIT as a performance measure in significant business decisions and in determining certain incentive compensation. We use Adjusted EBIT as a performance measure because it provides improved period-to-period comparability for decision making and compensation purposes, and because it better measures the ongoing earnings results of our strategic and operating decisions by excluding the earnings effects of our restructuring activities.
Adjusted EBIT, Adjusted EBITDA, Adjusted EBIT Return On Invested Capital and Adjusted Gross Margin do not purport to represent income measures as defined under GAAP, and should not be used as alternatives to such measures as an indicator of our performance. These measures are provided to investors and others to improve the period-to-period comparability and peer-to-peer comparability of our financial results, and to ensure that investors understand the information we use to evaluate the performance of our businesses. We have provided in the following tables a reconciliation of Adjusted EBIT to Net Income attributable to GCP, the most directly comparable financial measure calculated and presented in accordance with GAAP.
Adjusted EBIT has material limitations as an operating performance measure because it excludes costs related to income and expenses from restructuring activities, which historically has been a material component of our net income. Adjusted EBITDA also has material limitations as an operating performance measure because it excludes the impact of depreciation and amortization expense. Our business is substantially dependent on the successful deployment of capital, and depreciation and amortization expense is a necessary element of our costs. We compensate for the limitations of these measurements by using these indicators together with net income as measured under GAAP to present a complete analysis of our results of operations. Adjusted EBIT and Adjusted EBITDA should be evaluated together with net income measured under GAAP for a complete understanding of our results of operations.
Results of Operations
2014 Performance Summary
Following is a summary of our financial performance for the year ended December 31, 2014.
| |
| • | Net sales increased 2.6% to $1,480.4 million. |
| |
| • | Adjusted Gross Margin increased 10 basis points to 35.4%. |
| |
| • | Adjusted EBIT increased 0.3% to $195.4 million or 13.2% of sales. |
| |
| • | Net income increased 22.4% to $134.3 million. |
2013 Performance Summary
Following is a summary of our financial performance for the year ended December 31, 2013.
| |
| • | Net sales increased 2.3% to $1,442.3 million. |
| |
| • | Adjusted Gross Margin increased 120 basis points to 35.3%. |
| |
| • | Adjusted EBIT increased 23.4% to $194.9 million or 13.5% of sales. |
| |
| • | Net income increased 28.8% to $109.7 million. |
Analysis of Operations for 2014, 2013, and 2012
We have set forth in the table below our key operating statistics with percentage changes for the years ended December 31, 2014, 2013, and 2012. Please refer to this Analysis of Operations when reviewing this Management's Discussion and Analysis of Financial Condition and Results of Operations.
|
| | | | | | | | | | | | | | | | | |
Analysis of Operations (In millions) | 2014 | | 2013 | | % Change | | 2012 | | % Change |
| Net sales: | | | | | | | | | |
| Specialty Construction Chemicals | $ | 726.3 |
| | $ | 688.1 |
| | 5.6 | % | | $ | 680.9 |
| | 1.1 | % |
| Specialty Building Materials | 379.3 |
| | 370.1 |
| | 2.5 | % | | 344.0 |
| | 7.6 | % |
| Darex Packaging Technologies | 374.8 |
| | 384.1 |
| | (2.4 | )% | | 384.3 |
| | (0.1 | )% |
| Total GCP net sales | $ | 1,480.4 |
| | $ | 1,442.3 |
| | 2.6 | % | | $ | 1,409.2 |
| | 2.3 | % |
| Net sales by region: | | | | | | | | | |
| North America | $ | 503.9 |
| | $ | 488.2 |
| | 3.2 | % | | $ | 478.3 |
| | 2.1 | % |
| Europe Middle East Africa (EMEA) | 396.0 |
| | 385.2 |
| | 2.8 | % | | 392.7 |
| | (1.9 | )% |
| Asia Pacific | 349.7 |
| | 335.6 |
| | 4.2 | % | | 318.6 |
| | 5.3 | % |
| Latin America | 230.8 |
| | 233.3 |
| | (1.1 | )% | | 219.6 |
| | 6.2 | % |
| Total net sales by region | $ | 1,480.4 |
| | $ | 1,442.3 |
| | 2.6 | % | | $ | 1,409.2 |
| | 2.3 | % |
| Profitability performance measures: | | | | | | | | | |
| Adjusted EBIT(A): | | | | | | | | | |
| Specialty Construction Chemicals segment operating income | $ | 72.4 |
| | $ | 62.8 |
| | 15.3 | % | | $ | 57.1 |
| | 10.0 | % |
| Specialty Building Materials segment operating income | 75.7 |
| | 76.9 |
| | (1.6 | )% | | 59.0 |
| | 30.3 | % |
| Darex Packaging Technologies segment operating income | 74.1 |
| | 79.6 |
| | (6.9 | )% | | 72.5 |
| | 9.8 | % |
| Corporate costs | (19.3 | ) | | (19.1 | ) | | (1.0 | )% | | (24.1 | ) | | 20.7 | % |
| Certain pension costs(B) | (7.5 | ) | | (5.3 | ) | | (41.5 | )% | | (6.6 | ) | | 19.7 | % |
| Adjusted EBIT | 195.4 |
| | 194.9 |
| | 0.3 | % | | 157.9 |
| | 23.4 | % |
| Pension MTM adjustment and other related costs, net | 18.6 |
| | (14.4 | ) | | | | (17.7 | ) | | |
| Restructuring expenses and asset impairments | (18.3 | ) | | (7.4 | ) | | | | (4.3 | ) | | |
| Currency and other financial losses in Venezuela | (1.0 | ) | | (6.9 | ) | | | | — |
| | |
| Interest expense, net | (4.8 | ) | | (4.9 | ) | | 2.0 | % | | (2.6 | ) | | (88.5 | )% |
| Provision for income taxes | (55.6 | ) | | (51.6 | ) | | (7.8 | )% | | (48.1 | ) | | (7.3 | )% |
| Net income attributable to GCP | $ | 134.3 |
| | $ | 109.7 |
| | 22.4 | % | | $ | 85.2 |
| | 28.8 | % |
|
| | | | | | | | | | | | | | | | | |
Analysis of Operations (In millions) | 2014 | | 2013 | | % Change | | 2012 | | % Change |
| Adjusted profitability performance measures: | | | | | | | | | |
| Adjusted Gross Margin: | | | | | | | | | |
| Specialty Construction Chemicals | 33.7 | % | | 33.0 | % | | 0.7 pts |
| | 33.8 | % | | (0.8) pts |
|
| Specialty Building Materials | 41.7 | % | | 42.0 | % | | (0.3) pts |
| | 39.1 | % | | 2.9 pts |
|
| Darex Packaging Technologies | 32.3 | % | | 32.8 | % | | (0.5) pts |
| | 30.2 | % | | 2.6 pts |
|
| Adjusted Gross Margin | 35.4 | % | | 35.3 | % | | 0.1 pts |
| | 34.1 | % | | 1.2 pts |
|
| Pension costs in cost of goods sold | 0.4 | % | | (0.5 | )% | | 0.9 pts |
| | (0.6 | )% | | 0.1 pts |
|
| Total GCP | 35.8 | % | | 34.8 | % | | 1.0 pts |
| | 33.5 | % | | 1.3 pts |
|
| Adjusted EBIT: | | | | | | | | | |
| Specialty Construction Chemicals | $ | 72.4 |
| | $ | 62.8 |
| | 15.3 | % | | $ | 57.1 |
| | 10.0 | % |
| Specialty Building Materials | 75.7 |
| | 76.9 |
| | (1.6 | )% | | 59.0 |
| | 30.3 | % |
| Darex Packaging Technologies | 74.1 |
| | 79.6 |
| | (6.9 | )% | | 72.5 |
| | 9.8 | % |
| Corporate | (26.8 | ) | | (24.4 | ) | | (9.8 | )% | | (30.7 | ) | | 20.5 | % |
| Total GCP | 195.4 |
| | 194.9 |
| | 0.3 | % | | 157.9 |
| | 23.4 | % |
| Depreciation and amortization: | | | | | | | | | |
| Specialty Construction Chemicals | $ | 18.5 |
| | $ | 19.9 |
| | (7.0 | )% | | $ | 20.4 |
| | (2.5 | )% |
| Specialty Building Materials | 8.6 |
| | 8.1 |
| | 6.2 | % | | 7.8 |
| | 3.8 | % |
| Darex Packaging Technologies | 5.5 |
| | 5.1 |
| | 7.8 | % | | 5.0 |
| | 2.0 | % |
| Corporate | 1.4 |
| | 1.6 |
| | (12.5 | )% | | 1.6 |
| | — | % |
| Total GCP | 34.0 |
| | 34.7 |
| | (2.0 | )% | | 34.8 |
| | (0.3 | )% |
| Adjusted EBITDA: | | | | | | | | | |
| Specialty Construction Chemicals | $ | 90.9 |
| | $ | 82.7 |
| | 9.9 | % | | $ | 77.5 |
| | 6.7 | % |
| Specialty Building Materials | 84.3 |
| | 85.0 |
| | (0.8 | )% | | 66.8 |
| | 27.2 | % |
| Darex Packaging Technologies | 79.6 |
| | 84.7 |
| | (6.0 | )% | | 77.5 |
| | 9.3 | % |
| Corporate | (25.4 | ) | | (22.8 | ) | | (11.4 | )% | | (29.1 | ) | | 21.6 | % |
| Total GCP | 229.4 |
| | 229.6 |
| | (0.1 | )% | | 192.7 |
| | 19.1 | % |
| Adjusted EBIT margin: | | | | | | | | | |
| Specialty Construction Chemicals | 10.0 | % | | 9.1 | % | | 0.9 pts |
| | 8.4 | % | | 0.7 pts |
|
| Specialty Building Materials | 20.0 | % | | 20.8 | % | | (0.8) pts |
| | 17.2 | % | | 3.6 pts |
|
| Darex Packaging Technologies | 19.8 | % | | 20.7 | % | | (0.9) pts |
| | 18.9 | % | | 1.8 pts |
|
| Total GCP | 13.2 | % | | 13.5 | % | | (0.3) pts |
| | 11.2 | % | | 2.3 pts |
|
| Adjusted EBITDA margin: | | | | | | | | | |
| Specialty Construction Chemicals | 12.5 | % | | 12.0 | % | | 0.5 pts |
| | 11.4 | % | | 0.6 pts |
|
| Specialty Building Materials | 22.2 | % | | 23.0 | % | | (0.8) pts |
| | 19.4 | % | | 3.6 pts |
|
| Darex Packaging Technologies | 21.2 | % | | 22.1 | % | | (0.9) pts |
| | 20.2 | % | | 1.9 pts |
|
| Total GCP | 15.5 | % | | 15.9 | % | | (0.4) pts |
| | 13.7 | % | | 2.2 pts |
|
|
| | | | | | | | | | | |
Analysis of Operations (In millions) | 2014 | | 2013 | | 2012 |
| Calculation of Adjusted EBIT Return On Invested Capital (trailing four quarters): | | | | | |
| Adjusted EBIT | $ | 195.4 |
| | $ | 194.9 |
| | $ | 157.9 |
|
| Invested Capital: | | | | | |
| Trade accounts receivable | 225.8 |
| | 240.3 |
| | 252.2 |
|
| Inventories | 122.9 |
| | 104.7 |
| | 112.0 |
|
| Accounts payable | (112.3 | ) | | (118.3 | ) | | (126.2 | ) |
| | 236.4 |
| | 226.7 |
| | 238.0 |
|
| Other current assets (excluding income taxes) | 38.6 |
| | 34.1 |
| | 29.0 |
|
| Properties and equipment, net | 197.5 |
| | 211.5 |
| | 206.7 |
|
| Goodwill | 114.0 |
| | 128.6 |
| | 122.4 |
|
| Technology and other intangible assets, net | 44.0 |
| | 54.1 |
| | 58.0 |
|
| Other assets | 8.5 |
| | 19.8 |
| | 11.0 |
|
| Other current liabilities (excluding income taxes, restructuring and accrued interest) | (95.0 | ) | | (93.1 | ) | | (95.8 | ) |
| Other liabilities | (9.1 | ) | | (8.0 | ) | | (6.9 | ) |
| Total invested capital | $ | 534.9 |
| | $ | 573.7 |
| | $ | 562.4 |
|
| Adjusted EBIT Return On Invested Capital | 36.5 | % | | 34.0 | % | | 28.1 | % |
___________________________________________________________________________________________________________________
Amounts may not add due to rounding.
| |
| (A) | GCP segment operating income includes only GCP's share of income of consolidated and unconsolidated joint ventures. |
| |
| (B) | Certain pension costs include only ongoing costs recognized quarterly, which include service and interest costs, expected returns on plan assets, and amortization of prior service costs/credits. SCC, SBM, and Darex segment operating income and corporate costs do not include any amounts for pension expense. Other pension related costs including annual mark-to-market adjustments and actuarial gains and losses are excluded from Adjusted EBIT. These amounts are not used by management to evaluate the performance of the GCP businesses and significantly affect the peer-to-peer and period-to-period comparability of our financial results. Mark-to-market adjustments and actuarial gains and losses relate primarily to changes in financial market values and actuarial assumptions and are not directly related to the operation of the GCP businesses. |
NM—Not Meaningful
Nine Months Performance Summary
Following is a summary of our financial performance for the nine months ended September 30, 2015.
| |
| • | Net sales decreased 2.6% to $1,086.1 million. |
| |
| • | Adjusted EBIT increased 21.0% to $175.9 million or 16.2% of sales. |
| |
| • | Net income decreased 63.3% to $32.4 million. |
| |
| • | Net income includes a pre-tax charge of $73.2 million related to our Venezuelan operations. |
| |
| • | Adjusted EBIT Return On Invested Capital was 46.6% on a trailing four quarters basis compared with 36.5% on the same basis for the 2014 fourth quarter. |
Analysis of Operations for the nine months and the prior-year period
We have set forth in the table below our key operating statistics with percentage changes for the nine months compared with the prior-year period. Please refer to this Analysis of Operations when reviewing this Management's Discussion and Analysis of Financial Condition and Results of Operations.
|
| | | | | | | | | | |
Analysis of Operations (In millions) | Nine Months Ended September 30, |
| 2015 | | 2014 | | % Change |
| Net sales: | | | | | |
| Specialty Construction Chemicals | $ | 534.2 |
| | $ | 542.9 |
| | (1.6 | )% |
| Specialty Building Materials | 297.6 |
| | 284.0 |
| | 4.8 | % |
| Darex Packaging Technologies | 254.3 |
| | 288.5 |
| | (11.9 | )% |
| Total GCP net sales | $ | 1,086.1 |
| | $ | 1,115.4 |
| | (2.6 | )% |
| Net sales by region: | | | | | |
| North America | $ | 401.2 |
| | $ | 374.4 |
| | 7.2 | % |
| Europe Middle East Africa (EMEA) | 260.7 |
| | 307.8 |
| | (15.3 | )% |
| Asia Pacific | 248.6 |
| | 261.1 |
| | (4.8 | )% |
| Latin America | 175.6 |
| | 172.1 |
| | 2.0 | % |
| Total net sales by region | $ | 1,086.1 |
| | $ | 1,115.4 |
| | (2.6 | )% |
| Profitability performance measures: | | | | | |
| Adjusted EBIT(A): | | | | | |
| Specialty Construction Chemicals segment operating income | $ | 66.9 |
| | $ | 52.3 |
| | 27.9 | % |
| Specialty Building Materials segment operating income | 73.3 |
| | 56.7 |
| | 29.3 | % |
| Darex Packaging Technologies segment operating income | 56.0 |
| | 57.3 |
| | (2.3 | )% |
| Corporate costs | (16.5 | ) | | (15.3 | ) | | (7.8 | )% |
| Certain pension costs(B) | (3.8 | ) | | (5.6 | ) | | 32.1 | % |
| Adjusted EBIT | 175.9 |
| | 145.4 |
| | 21.0 | % |
| Currency and other losses in Venezuela | (73.2 | ) | | (1.0 | ) | | |
| Pension MTM adjustment and other related costs, net | (0.5 | ) | | 0.2 |
| | |
| Restructuring expenses and asset impairments | (9.9 | ) | | (16.1 | ) | | |
| Interest expense, net | (1.7 | ) | | (3.8 | ) | | 55.3 | % |
| Provision for income taxes | (58.2 | ) | | (36.4 | ) | | (59.9 | )% |
| Net income attributable to GCP | $ | 32.4 |
| | $ | 88.3 |
| | (63.3 | )% |
|
| | | | | | | | | | |
Analysis of Operations (In millions) | Nine Months Ended September 30, |
| 2015 | | 2014 | | % Change |
| Adjusted profitability performance measures: | |
| | |
| | |
|
| Adjusted Gross Margin: | |
| | |
| | |
|
| Specialty Construction Chemicals | 35.6 | % | | 33.2 | % | | 2.4 pts |
|
| Specialty Building Materials | 44.8 | % | | 41.7 | % | | 3.1 pts |
|
| Darex Packaging Technologies | 35.2 | % | | 32.3 | % | | 2.9 pts |
|
| Adjusted Gross Margin | 38.0 | % | | 35.2 | % | | 2.8 pts |
|
| Loss in Venezuela | (1.2 | )% | | — | % | | NM |
|
| Pension costs in cost of goods sold | (0.1 | )% | | (0.1 | )% | | 0.0 pts |
|
| Total GCP | 36.7 | % | | 35.1 | % | | 1.6 pts |
|
| Adjusted EBIT: | |
| | |
| | |
|
| Specialty Construction Chemicals | $ | 66.9 |
| | $ | 52.3 |
| | 27.9 | % |
| Specialty Building Materials | 73.3 |
| | 56.7 |
| | 29.3 | % |
| Darex Packaging Technologies | 56.0 |
| | 57.3 |
| | (2.3 | )% |
| Corporate | (20.3 | ) | | (20.9 | ) | | 2.9 | % |
| Total GCP | 175.9 |
| | 145.4 |
| | 21.0 | % |
| Depreciation and amortization: | |
| | |
| | |
|
| Specialty Construction Chemicals | $ | 13.8 |
| | $ | 13.5 |
| | 2.2 | % |
| Specialty Building Materials | 5.9 |
| | 6.4 |
| | (7.8 | )% |
| Darex Packaging Technologies | 3.8 |
| | 4.0 |
| | (5.0 | )% |
| Corporate | 0.9 |
| | 1.1 |
| | (18.2 | )% |
| Total GCP | 24.4 |
| | 25.0 |
| | (2.4 | )% |
| Adjusted EBITDA: | |
| | |
| | |
|
| Specialty Construction Chemicals | $ | 80.7 |
| | $ | 65.8 |
| | 22.6 | % |
| Specialty Building Materials | 79.2 |
| | 63.1 |
| | 25.5 | % |
| Darex Packaging Technologies | 59.8 |
| | 61.3 |
| | (2.4 | )% |
| Corporate | (19.4 | ) | | (19.8 | ) | | 2.0 | % |
| Total GCP | 200.3 |
| | 170.4 |
| | 17.5 | % |
| Adjusted EBIT margin: | |
| | |
| | |
|
| Specialty Construction Chemicals | 12.5 | % | | 9.6 | % | | 2.9 pts |
|
| Specialty Building Materials | 24.6 | % | | 20.0 | % | | 4.6 pts |
|
| Darex Packaging Technologies | 22.0 | % | | 19.9 | % | | 2.1 pts |
|
| Total GCP | 16.2 | % | | 13.0 | % | | 3.2 pts |
|
| Adjusted EBITDA margin: | |
| | |
| | |
|
| Specialty Construction Chemicals | 15.1 | % | | 12.1 | % | | 3.0 pts |
|
| Specialty Building Materials | 26.6 | % | | 22.2 | % | | 4.4 pts |
|
| Darex Packaging Technologies | 23.5 | % | | 21.2 | % | | 2.3 pts |
|
| Total GCP | 18.4 | % | | 15.3 | % | | 3.1 pts |
|
|
| | | | | | | |
Analysis of Operations (In millions) | Four Quarters Ended |
September 30,
2015 | | December 31, 2014 |
| Calculation of Adjusted EBIT Return On Invested Capital (trailing four quarters): |
| Adjusted EBIT | $ | 225.9 |
| | $ | 195.4 |
|
| Invested Capital: | | | |
| Trade accounts receivable | 234.4 |
| | 225.8 |
|
| Inventories | 114.2 |
| | 122.9 |
|
| Accounts payable | (117.5 | ) | | (112.3 | ) |
| | 231.1 |
| | 236.4 |
|
| Other current assets (excluding income taxes and related party loans receivable) | 30.4 |
| | 38.6 |
|
| Properties and equipment, net | 187.1 |
| | 197.5 |
|
| Goodwill | 102.8 |
| | 114.0 |
|
| Technology and other intangible assets, net | 34.2 |
| | 44.0 |
|
| Other assets | 8.8 |
| | 8.5 |
|
| Other current liabilities (excluding income taxes, restructuring and accrued interest) | (101.4 | ) | | (95.0 | ) |
| Other liabilities | (8.2 | ) | | (9.1 | ) |
| Total invested capital | $ | 484.8 |
| | $ | 534.9 |
|
| Adjusted EBIT Return On Invested Capital | 46.6 | % | | 36.5 | % |
___________________________________________________________________________________________________________________
Amounts may not add due to rounding.
| |
| (A) | GCP segment operating income includes only GCP's share of income of consolidated and unconsolidated joint ventures. |
| |
| (B) | Certain pension costs include only ongoing costs recognized quarterly, which include service and interest costs, expected returns on plan assets, and amortization of prior service costs/credits. SCC, SBM, and Darex segment operating income and corporate costs do not include any amounts for pension expense. Other pension related costs including annual mark-to-market adjustments and actuarial gains and losses are excluded from Adjusted EBIT. These amounts are not used by management to evaluate the performance of the GCP businesses and significantly affect the peer-to-peer and period-to-period comparability of our financial results. Mark-to-market adjustments and actuarial gains and losses relate primarily to changes in financial market values and actuarial assumptions and are not directly related to the operation of the GCP businesses. |
NM—Not Meaningful
GCP Overview
Following is an overview of our financial performance for the years ended December 31, 2014, 2013, and 2012 and for the nine months compared with the prior-year period.
During these periods, we benefited from increased construction spending in North America, and to a lesser extent, increased construction spending in Asia Pacific. Sales volumes in Europe and Latin America have been weaker, particularly in Latin America where sales volumes have decreased most recently. We also benefited from relatively stable raw material costs through 2014, and from declining raw material costs in 2015, which contributed to the increase in gross margin in 2015. Currency changes, particularly the stronger U.S. dollar and weaker emerging region currencies, have had a significant negative effect on sales and earnings during this time period. We generally expect these demand trends to continue through 2015. We also expect currency changes, particularly in the emerging regions, to continue to have a negative effect on sales and earnings through 2015.
Net Sales and Adjusted Gross Margin
The following tables identify the year-over-year increase or decrease in sales attributable to changes in sales volume and/or mix, product price, and the impact of currency translation.
|
| | | | | | | | | | | |
| | 2014 as a Percentage Increase (Decrease) from 2013 |
| Net Sales Variance Analysis | Volume | | Price | | Currency Translation | | Total |
| SCC | 6.3 | % | | 2.7 | % | | (3.4 | )% | | 5.6 | % |
| SBM | 0.8 | % | | 2.0 | % | | (0.3 | )% | | 2.5 | % |
| Darex | (1.4 | )% | | 1.1 | % | | (2.1 | )% | | (2.4 | )% |
| Net sales | 2.8 | % | | 2.1 | % | | (2.3 | )% | | 2.6 | % |
| By Region: | | | | | | | |
| North America | 2.6 | % | | 1.0 | % | | (0.4 | )% | | 3.2 | % |
| Europe Middle East Africa (EMEA) | 2.0 | % | | 1.3 | % | | (0.5 | )% | | 2.8 | % |
| Asia Pacific | 7.1 | % | | 0.3 | % | | (3.2 | )% | | 4.2 | % |
| Latin America | (1.4 | )% | | 8.2 | % | | (7.9 | )% | | (1.1 | )% |
Sales for 2014 increased 2.6% overall compared with the prior year. The sales increase was due to higher sales volumes (+2.8%) and improved pricing (+2.1%), partially offset by unfavorable currency translation (-2.3%). Sales volume growth was strongest in SCC due to increased demand in North America and Asia Pacific. SBM experienced sales volume growth in the building envelope and specialty construction product groups. Sales volumes declined in the residential product group in North America during a transition in our channel partner strategy and business model during the year. Sales volumes declined in Darex in the coatings and sealants
product groups due to weaker Asia Pacific and Latin America demand. Pricing improved in all three operating segments, particularly in Latin America. Improved pricing in Latin America offset the effects of unfavorable currency translation in the region.
|
| | | | | | | | | | | |
| | 2013 as a Percentage Increase (Decrease) from 2012 |
| Net Sales Variance Analysis | Volume | | Price | | Currency Translation | | Total |
| SCC | 3.0 | % | | 2.6 | % | | (4.5 | )% | | 1.1 | % |
| SBM | 7.5 | % | | 0.4 | % | | (0.3 | )% | | 7.6 | % |
| Darex | 0.9 | % | | 2.1 | % | | (3.1 | )% | | (0.1 | )% |
| Net sales | 2.9 | % | | 2.0 | % | | (2.6 | )% | | 2.3 | % |
| By Region: | | | | | | | |
| North America | 2.5 | % | | (0.2 | )% | | (0.2 | )% | | 2.1 | % |
| Europe Middle East Africa (EMEA) | (3.7 | )% | | 1.5 | % | | 0.3 | % | | (1.9 | )% |
| Asia Pacific | 8.0 | % | | 0.6 | % | | (3.3 | )% | | 5.3 | % |
| Latin America | 8.3 | % | | 9.6 | % | | (11.7 | )% | | 6.2 | % |
Sales for 2013 increased 2.3% overall compared with the prior year. The sales increase was due to higher sales volumes (+2.9%) and improved pricing (+2.0%), partially offset by unfavorable currency translation (-2.6%). Sales volume growth was primarily due to higher demand for building envelope products in Asia Pacific and North America. SCC sales volumes increased in both the concrete admixtures and cement additives product groups with strong demand in Latin America. Pricing improved in all three operating segments, particularly in Latin America. The improved pricing in Latin America offset the effects of unfavorable currency translation in the region.
|
| | | | | | | | | | | |
| | Nine Months Ended September 30, 2015 as a Percentage Increase (Decrease) from Nine Months Ended September 30, 2014 |
| Net Sales Variance Analysis | Volume | | Price | | Currency Translation | | Total |
| SCC | 3.1 | % | | 2.6 | % | | (7.2 | )% | | (1.5 | )% |
| SBM | 8.0 | % | | 1.3 | % | | (4.5 | )% | | 4.8 | % |
| Darex | (4.8 | )% | | 1.3 | % | | (8.4 | )% | | (11.9 | )% |
| Net sales | 2.3 | % | | 1.9 | % | | (6.8 | )% | | (2.6 | )% |
| By Region: | | | | | | | |
| North America | 8.0 | % | | (0.1 | )% | | (0.7 | )% | | 7.2 | % |
| Europe Middle East Africa (EMEA) | (1.2 | )% | | 0.1 | % | | (14.1 | )% | | (15.2 | )% |
| Asia Pacific | 2.0 | % | | (0.3 | )% | | (6.5 | )% | | (4.8 | )% |
| Latin America | (3.3 | )% | | 12.8 | % | | (7.5 | )% | | 2.0 | % |
Sales for the nine months decreased 2.6% overall compared with the prior-year period. The sales decrease was due to unfavorable currency translation (-6.8%), partially offset by higher sales volumes (+2.3%) and improved pricing (+1.9%). Unfavorable currency translation affected all three operating segments, primarily in Europe and Latin America as the dollar strengthened against those currencies. Sales volumes in SCC and SBM increased in North America and Asia Pacific. Sales volumes increased in the concrete admixtures product group and in all three SBM product groups. Sales volumes in the residential products group in North America have improved significantly since we changed our channel partner strategy and business model in 2014. Darex sales volumes decreased due to lower demand in Latin America, Asia Pacific, and North America, but increased in Europe. Pricing improved in all three operating segments.
Net sales of our Venezuelan subsidiary were $68.6 million compared with $34.4 million for the prior-year period. In the third quarter, we were temporarily able to import a significant amount of raw materials into Venezuela, leading to a significant increase in sales and earnings that is not expected to continue. The remaining assets and liabilities, as well as future sales, earnings and cash flows of our Venezuelan subsidiary will be
immaterial after September 30, 2015, based on our actions in the third quarter. See "—Venezuela" below for further discussion.
Adjusted Gross Margin was 38.0% for the nine months compared with 35.2% for the prior-year period, an improvement of 280 basis points. The increase in Adjusted Gross Margin was primarily due to increased operating leverage on higher sales volumes in SCC and SBM, improved pricing, and lower raw material costs in Darex and SBM, which had a positive effect of approximately 80 basis points.
Adjusted EBIT
Adjusted EBIT was $195.4 million for 2014, an increase of 0.3% compared with the prior year. The increase was primarily due to improved SCC sales and profitability, partially offset by lower earnings in SBM and Darex. Adjusted EBIT margin was 13.2% for 2014, a decrease compared with 13.5% for the prior year. The transition in our channel partner strategy and business model in the SBM residential products group in North America negatively affected our results for the year. Since completing the transition in 2014, sales volumes and gross margins in the residential products group have improved significantly.
Adjusted EBIT was $194.9 million for 2013, an increase of 23.4% compared with the prior year. The increase was due to improved gross margins on improved pricing and higher sales volumes and lower operating expenses. Adjusted EBIT margin was 13.5% for 2013 compared with 11.2% for the prior year. The increase in Adjusted EBIT margin was primarily due to increased profitability in all three business segments and lower corporate costs.
Adjusted EBIT was $175.9 million for the nine months, an increase of 21.0% compared with the prior-year period, primarily due to higher gross profit. Adjusted EBIT margin was 16.2% for the nine months compared with 13.0% for the prior-year period. The increase in Adjusted EBIT margin was primarily due to improved gross margins. Adjusted EBIT for our Venezuelan subsidiary was $28.7 million compared to $12.7 million for the prior year period.
Net Income
Net income was $134.3 million for 2014, an increase of 22.4% compared with $109.7 million for the prior year. The increase was primarily due to a favorable mark-to-market pension adjustment.
Net income was $109.7 million for 2013, an increase of 28.8% compared with $85.2 million for the prior year. The increase was primarily due to improved segment operating income in all three segments and lower corporate costs, partially offset by an adjustment for the currency transaction loss incurred on our Venezuelan cash balances.
Net income was $32.4 million for the nine months, a decrease of 63.3% compared with $88.3 million for the prior-year period, primarily due to a pre-tax charge of $73.2 million associated with our operations in Venezuela and increased income taxes, partially offset by an increase in gross profit and lower expenses.
Adjusted EBIT Return On Invested Capital
Adjusted EBIT Return On Invested Capital for 2014 was 36.5% on a trailing four quarters basis, an increase from 34.0% on the same basis for 2013 and an increase from 28.1% for 2012. Adjusted EBIT Return On Invested Capital for the 2015 third quarter was 46.6% on a trailing four quarters basis compared with 36.5% on the same basis for the 2014 fourth quarter. The increase was due to increased earnings, including earnings in Venezuela in the 2015 third quarter, and decreased invested capital, including the impact of the devaluation and impairment related to our Venezuelan operations.
We manage our operations with the objective of maximizing sales, earnings and cash flow over time. Doing so requires that we successfully balance our growth, profitability and working capital and other investments to support sustainable, long-term financial performance. We use Adjusted EBIT Return On Invested Capital as a performance measure in evaluating our operating results, in making operating and investment decisions and in balancing the growth and profitability of our operations. Generally, we favor those businesses and investments that provide the highest return on invested capital.
Operating Segment Overview—Specialty Construction Chemicals (SCC)
Following is an overview of the financial performance of SCC for the years ended December 31, 2014, 2013, and 2012 and for the nine months compared with the prior-year period.
Net Sales—SCC
Sales were $726.3 million for 2014, an increase of 5.6% compared with the prior year. The sales increase was due to higher sales volumes (+6.3%) and improved pricing (+2.7%), partially offset by unfavorable currency translation (-3.4%). Sales volumes benefited from increased concrete and cement demand primarily in North America and Asia Pacific. Concrete admixtures sales volumes increased 6.0%, driven by increased demand in Asia Pacific, North America and Latin America. Cement additives sales volumes increased 6.9%, primarily due to increased demand in North America, Europe and Asia Pacific. Prices improved in Latin America, offsetting unfavorable currency movements, and to a lesser extent in other regions. We generally are able to increase prices over time to reflect improved value of our products and in response to higher raw materials costs or unfavorable currency movements.
Sales were $688.1 million for 2013, an increase of 1.1% compared with the prior year. The sales increase was due to higher sales volumes (+3.0%) and improved pricing (+2.6%), partially offset by unfavorable currency translation (-4.5%). Sales volumes for concrete admixtures increased 3.3%, primarily in North America and Latin America, including the full-year benefit of the 2012 acquisition of Rheoset, a leading manufacturer and distributor of concrete admixtures in Brazil. The higher sales volumes were partially offset by lower demand in Europe and Asia Pacific. Cement additives sales decreased 0.7%, due to unfavorable currency translation, partially offset by sales volume growth. Unfavorable currency translation primarily affected Latin America and Asia Pacific and was partially offset by price increases in those regions. The acquisition in Brazil added approximately $28 million and $15 million to sales in 2013 and 2012, respectively.
Sales were $534.2 million for the nine months, a decrease of 1.6% compared with the prior-year period. The decrease was due to unfavorable currency translation (-7.2%), partially offset by higher sales volumes (+3.1%) and improved pricing (+2.6%). Sales for concrete admixtures increased 1.8%. Sales growth in North America and Latin America was offset by sales declines in Asia and Europe. Sales for cement additives decreased 11.6%. Sales growth in North America and Asia was offset by sales declines in Latin America and Europe. We continued to implement price increases in concrete admixtures, particularly in Latin America to offset inflationary pressures in that region.
Segment Operating Income (SOI) and Margin—SCC
Gross profit was $244.8 million for 2014, an increase of 7.7% compared with the prior year. Adjusted Gross Margin was 33.7% compared with 33.0% for the prior year. During 2014 we integrated our concrete production management systems product line into the SCC operating segment and reclassified the cost of certain of its employees from cost of goods sold to operating expenses to be consistent with the classification of similar employee costs in the SCC operating segment. This change increased Adjusted Gross Margin by approximately 60 basis points, decreased segment operating expenses by the same amount, and had no effect on segment operating income.
Segment operating income was $72.4 million for 2014, an increase of 15.3% compared with the prior year. Segment operating margin increased to 10.0%, an improvement of 90 basis points compared with the prior year. This increase was primarily due to improved operating leverage and good expense control.
Gross profit was $227.4 million for 2013, a decrease of 1.2% compared with the prior year. Adjusted Gross Margin was 33.0% compared with 33.8% for the prior year. The decrease in Adjusted Gross Margin was primarily attributable to raw material inflation in the concrete admixtures product group which had a negative effect of approximately 100 basis points. We price our products primarily based on their value to our customers, rather than their cost of production. We generally are able to increase prices over time to reflect improved value of our products and in response to higher raw materials costs or unfavorable currency movements, though significant or rapid increases in raw materials costs or unfavorable currency movements may result in a decrease in Adjusted Gross Margins until prices fully adjust.
Segment operating income was $62.8 million for 2013, an increase of 10.0% compared with the prior year. Segment operating margin for 2013 increased to 9.1%, an improvement of 70 basis points compared with the prior year. This increase was primarily due to operating expense reductions.
Gross profit was $190.0 million for the nine months, an increase of 5.3% compared with the prior-year period. Adjusted Gross Margin was 35.6% compared with 33.2% for the prior-year period. Excluding Venezuela, Adjusted Gross Margin was 33.6%. The increase was primarily due to the reclassification of certain expenses from cost of goods sold to operating expenses discussed above and favorable cement additives margins.
Segment operating income was $66.9 million for the nine months, an increase of 27.9% compared with the prior-year period. Segment operating margin for the nine months was 12.5%, an improvement of 290 basis points compared with the prior-year period. The increase in inflation in Venezuela added an estimated $5-$6 million to segment operating income for the nine months.
Operating Segment Overview—Specialty Building Materials (SBM)
Following is an overview of the financial performance of SBM for the years ended December 31, 2014, 2013, and 2012 and for the nine months compared with the prior-year period.
Net Sales—SBM
Sales were $379.3 million for 2014, an increase of 2.5% compared with the prior year. The sales increase was due to higher sales volumes (+0.8%) and improved pricing (+2.0%), partially offset by unfavorable currency translation (-0.3%). Sales volumes increased primarily due to strong commercial waterproofing demand and increased fire protection sales as a result of improved distribution of our fire protection products in the emerging regions. Sales volumes declined approximately 15% in the residential products group in North America during a transition in our channel partner strategy and business model during the year. We added new channel partners, revised the design of our channel partner compensation program and made other changes to our channel marketing program. Since completing these changes, sales volumes in the residential products group have improved significantly.
Sales were $370.1 million for 2013, an increase of 7.6% compared with the prior year. The sales increase was due to higher sales volumes (+7.5%) and improved pricing (+0.4%), partially offset by unfavorable currency translation (-0.3%). Sales increased more than 10% in the building envelope product group, including the acquisition of a specialty manufacturer and distributor of waterproofing technologies headquartered in Australia and the benefit of increased capacity in our Ezhou, China manufacturing facility. This growth was partially offset by sales volume declines in residential products due to weak demand in North American residential roofing. The acquisition in Australia added approximately $12 million to sales in 2013.
Sales were $297.6 million for the nine months, an increase of 4.8% compared with the prior-year period. The increase was due to higher sales volumes (+8.0%) and improved pricing (+1.3%), partially offset by unfavorable currency translation (-4.5%). Residential products sales increased more than 35% following changes to our channel partner strategy and business model during 2014 and due to strong demand in North America.
Segment Operating Income (SOI) and Margin—SBM
Gross profit was $158.0 million for 2014, an increase of 1.7% compared with the prior year. Adjusted Gross Margin was 41.7% compared with 42.0% for the prior year. The decline in Adjusted Gross Margin was due to lower margins in certain growth markets, partially offset by improved Adjusted Gross Margin in North America.
Segment operating income was $75.7 million for 2014, a decrease of 1.6% compared with the prior year. Segment operating margin for 2014 decreased to 20.0%, a decrease of 80 basis points. The decrease in segment operating income was primarily due to the transition in our channel partner strategy and business model in the residential products group in North America, partially offset by growth in our building envelope and specialty construction product groups.
Gross profit was $155.3 million for 2013, an increase of 15.5% compared with the prior year. Adjusted Gross Margin was 42.0% compared with 39.1% for the prior year. The gross profit increase was primarily due to improved product and regional mix and improved operating leverage.
Segment operating income was $76.9 million for 2013, an increase of 30.3% compared with the prior year. Segment operating margin for 2013 increased to 20.8%, an improvement of 360 basis points compared with the prior year, primarily due to increased Adjusted Gross Margin and improved operating leverage.
Gross profit was $133.2 million for the nine months, an increase of 12.5% compared with the prior-year period. Adjusted Gross Margin was 44.8% compared with 41.7% for the prior-year period. The increase was primarily due to improved product and regional mix, and lower raw materials costs which added approximately 100 basis points.
Segment operating income was $73.3 million for the nine months, an increase of 29.3% compared with the prior-year period. Segment operating margin for the nine months was 24.6% an improvement of 460 basis points compared with the prior-year period, primarily due to increased Adjusted Gross Margin and improved operating leverage.
Operating Segment Overview—Darex Packaging Technologies (Darex)
Following is an overview of the financial performance of Darex for the years ended December 31, 2014, 2013, and 2012 and for the nine months compared with the prior-year period.
Net Sales—Darex
Sales were $374.8 million for 2014, a decrease of 2.4% compared with the prior year. The sales decrease was due to lower sales volumes (-1.4%) and unfavorable currency translation (-2.1%), partially offset by improved pricing (+1.1%). Sales volume decreased primarily in the Asia Pacific and Latin America regions due to a technology shift from three-piece to two-piece cans, resulting in lower demand for our sealant products. We anticipate this conversion to be complete in 2016. Sales volumes were also lower in closures after demand peaked in 2013 due to a technology change to PVC-free products. We implemented price increases, particularly in Latin America to offset unfavorable currency translation in that region. We generally are able to increase prices over time to reflect improved value of our products and in response to higher raw materials costs or unfavorable currency movements.
Sales were $384.1 million for 2013, a decrease of 0.1% compared with the prior year. The sales decrease was due to unfavorable currency translation (-3.1%), partially offset by higher sales volumes (+0.9%) and improved pricing (+2.1%). Sales volumes increased in Asia Pacific due to strong demand for PVC-free closures and sealants. Sales volumes decreased in North America due to lower demand for sealants.
Sales were $254.3 million for the nine months, a decrease of 11.9% compared with the prior-year period. The decrease was due to unfavorable currency translation (-8.4%) and lower sales volumes (-4.8%), partially offset by improved pricing (+1.3%). Both product groups had decreased sales volumes in the nine months primarily due to lower coatings demand in Latin America, lower sealants demand across all regions and lower closures demand in Asia Pacific, partially offset by increased coatings and closures demand in Europe. We implemented price increases in Latin America to offset unfavorable currency translation in that region.
Segment Operating Income (SOI) and Margin—Darex
Gross profit was $121.0 million for 2014, a decrease of 3.9% compared with the prior year. Adjusted Gross Margin was 32.3% compared with 32.8% for the prior year. Gross profit and Adjusted Gross Margin declined due to lower sales volumes, higher manufacturing costs, including higher raw materials costs, which had a negative effect of approximately 20 basis points, and currency translation.
Segment operating income was $74.1 million for 2014, a decrease of 6.9% compared with the prior year. Segment operating margin decreased to 19.8%, a decrease of 90 basis points. Operating income decreased due to a decline in Adjusted Gross Margin and higher operating expenses.
Gross profit was $125.9 million for 2013, an increase of 8.3% compared with the prior year. Adjusted Gross Margin was 32.8% compared with 30.2% for the prior year. Gross profit and Adjusted Gross Margin improvement were driven by improved prices and sales volumes, partially offset by unfavorable currency translation.
Segment operating income was $79.6 million for 2013, an increase of 9.8% compared with the prior year. Segment operating margin increased to 20.7%, an improvement of 180 basis points. Operating income improved due to improved Adjusted Gross Margin and operating expense reductions.
Gross profit was $89.5 million for the nine months, a decrease of 4.0% compared with the prior-year period. Adjusted Gross Margin was 35.2% compared with 32.3% for the prior-year period. The increase was primarily due to lower manufacturing costs partially offset by lower sales volumes.
Segment operating income was $56.0 million for the nine months, a decrease of 2.3% from the prior-year period primarily due to lower gross profit from reduced sales volumes, partially offset by lower manufacturing expenses. Segment operating margin for the nine months was 22.0%, an increase of 210 basis points from the prior-year period. The increase in inflation in Venezuela added an estimated $2-$3 million to segment operating income for the nine months.
Corporate Overview
Corporate costs include certain functional costs and other corporate costs such as certain performance-based compensation and public company costs. Corporate costs for 2014 increased 1.0% compared with the prior year. Corporate costs for 2013 decreased 20.7% compared with the prior year primarily due to the impact of lower performance-based compensation and other expenses. Corporate costs for the nine months increased 7.8% compared with the prior-year period.
Defined Benefit Pension Expense
Our employees participate in funded and unfunded defined benefit pension and other postretirement benefit plans (the “Shared Plans”) sponsored by Grace, which include employees of other Grace businesses. For purposes of the Combined Financial Statements, we account for the Shared Plans as multiemployer defined benefit plans. Accordingly, we do not record an asset or liability to recognize the funded status of these plans in the Combined Balance Sheets. Our allocated expense for the defined benefit pension plans was $5.3 million, $3.0 million, and $4.6 million for the years ended December 31, 2014, 2013, and 2012, respectively.
Grace provided postretirement health care and life insurance benefits for retired employees of certain U.S. business units and certain divested business units. The postretirement medical plan provided various levels of benefits to employees hired before 1993 who retired from Grace after age 55 with at least 10 years of service. In June 2014, Grace announced plans to discontinue its postretirement medical plan for all U.S. employees effective October 31, 2014, and to eliminate certain postretirement life insurance benefits. Our allocated income (expense) for the postretirement health care and life insurance benefits plan was $0.7 million, $(1.5) million, and $(1.8) million for the years ended December 31, 2014, 2013, and 2012, respectively.
Our employees also participate in certain funded and unfunded defined benefit pension plans, primarily in the U.K., that we sponsor. We record an asset or liability to recognize the funded status of these plans in the Combined Balance Sheets.
Defined benefit pension expense includes costs under U.S. and non-U.S. defined benefit pension plans that provide benefits to operating segment and corporate employees, as well as retirees and former employees of divested businesses where we retained these obligations.
Under mark-to-market accounting, our pension costs consist of two elements: 1) "certain pension costs"—ongoing costs recognized quarterly, which include service and interest costs, expected returns on plan assets, and amortization of prior service costs/credits; and 2) "pension mark-to-market adjustment and other related costs, net"—mark-to-market gains and losses recognized annually in the fourth quarter, or at an interim period should a significant event occur, resulting from changes in actuarial assumptions, such as discount rates and the difference between actual and expected returns on plan assets.
Certain pension costs were $7.5 million, $5.3 million and $6.6 million for 2014, 2013 and 2012, respectively. Certain pension costs for the nine months were $3.8 million compared with $5.6 million for the prior-year period.
The pension mark-to-market adjustment and other related income (expense), net was $18.6 million, $(14.4) million and $(17.7) million for 2014, 2013 and 2012, respectively. These costs are reported in "cost of goods sold" and in "selling, general and administrative expenses” in our Combined Financial Statements based upon the functions of the employees to whom the pension costs relate.
Interest and Financing Expenses
Interest and financing expenses were $3.9 million for 2014, an increase of 18.2% compared with 2013, primarily due to interest expense related to additional debt incurred during the second half of 2013, which was outstanding for the full year in 2014. Interest expense was $3.3 million for 2013, an increase of 94.1% compared with 2012, primarily due to interest expense related to additional debt incurred in 2013, which also had a higher rate of interest than the previously existing debt.
Related party interest expense, net was $0.9 million for 2014, a decrease of 50.0% compared with 2013, primarily due to an increase in interest income on lending to related parties. Interest expense was $1.8 million for 2013, an increase of 80.0% compared with 2012, primarily due to interest expense related to additional related party debt incurred in 2013.
Interest and financing expenses were $1.1 million for the nine months, a decrease of 63.3% compared with the prior-year period, primarily due to the repayment of outstanding third-party debt.
Related party interest expense, net was $0.7 million for the nine months, a decrease compared with the prior-year period, primarily due to the repayment of loans receivable.
Income Taxes
Income tax expense for 2014, 2013 and 2012 was $55.6 million, $51.6 million and $48.1 million, respectively, on income from combined operations before income taxes of $191.1 million, $162.9 million and $134.4 million in 2014, 2013 and 2012, respectively.
Our effective tax rate was approximately 29%, 32% and 36% in 2014, 2013 and 2012, respectively.
Our 2014 effective tax rate of approximately 29% was lower than the 35% U.S. statutory rate primarily due to benefits recognized during the year including $12.3 million due to lower taxes in non-U.S. jurisdictions, $2.2 million due to the domestic production activities deduction and $1.9 million related to the release of reserves for uncertain tax positions, partially offset by charges of $2.7 million for state and local income taxes and $2.5 million for non-deductible expenses.
Our 2013 effective tax rate of approximately 32% was lower than the 35% U.S. statutory rate primarily due to benefits recognized during the year including $4.3 million related to repatriated foreign earnings, $3.1 million related to the release of reserves for uncertain tax positions, $2.6 million due to the domestic production activities deduction and $2.2 million due to lower taxes in non-U.S. jurisdictions, partially offset by $4.1 million in charges related to state and local income taxes and $2.7 million for non-deductible expenses.
Our 2012 effective tax rate of approximately 36% was higher than the 35% U.S. statutory rate primarily due to non-deductible expenses of $4.1 million, an increase in reserves for uncertain tax positions of $3.4 million, and state and local income taxes of $2.6 million, partially offset by benefits recognized during the year including $7.0 million due to lower taxes in non-U.S. jurisdictions and $1.5 million due to the domestic production activities deduction.
As stated above, our 2014 effective tax rate was approximately 29% and our 2013 effective tax rate was approximately 32%. The decrease in the rate compared with the prior year primarily results from a higher percentage of earnings, including the effect of mark-to-market pension adjustments in jurisdictions with lower statutory rates, partially offset by an increase in tax costs associated with foreign dividends.
As stated above, our 2013 effective tax rate was approximately 32% and our 2012 effective tax rate was approximately 36%. The decrease in the rate compared with the prior year primarily relates to benefits for the release of uncertain tax positions and decrease in tax costs associated with foreign dividends partially offset by an increase in earnings in jurisdictions with higher statutory rates.
The income tax provision at the U.S. federal corporate rate of 35% for the nine months and the prior-year period would have been $31.9 million and $44.1 million, respectively, compared with the recorded provision for income taxes of $58.2 million and $36.4 million, respectively. The annualized effective tax rate on 2015 forecasted income is estimated to be approximately 58% as of September 30, 2015, compared with approximately 29% for the year ended December 31, 2014. The increase in the rate compared with the prior year primarily relates to the tax effect of repatriating foreign earnings in connection with the separation, including $17.0 million of costs recorded through September 30, 2015, and a $24.7 million impact on the effective rate from the nondeductible charge related to Venezuela.
Income taxes paid in cash, net of refunds, were $41.7 million, $47.1 million and $36.9 million in 2014, 2013 and 2012, respectively. Our annual cash tax rate was approximately 22%, 29% and 27% in 2014, 2013 and 2012, respectively.
Income taxes paid in cash, net of refunds, were $65.5 million for the nine months and $33.3 million for the prior-year period. Our annual cash tax rate for 2015 is expected to be approximately 38%, including taxes paid as a result of the separation.
The above amounts include cash taxes paid to tax authorities as well as tax payments which are deemed settled with Grace as the tax payer during these time periods.
As of December 31, 2014, we had the intent and ability to indefinitely reinvest undistributed earnings of our foreign subsidiaries outside the United States. In the 2015 first quarter, Grace announced its plan to separate into two publicly traded companies and has reassessed the capital structure and financial requirements of both companies. In the 2015 second quarter, we determined that Grace would repatriate approximately $131 million of foreign earnings in the 2015 third and fourth quarters in advance of the separation. In the 2015 fourth quarter, we determined that Grace would repatriate approximately $42 million of additional foreign earnings prior to the separation. Such amounts were determined based on an analysis of each non-US subsidiary's requirements for working capital, debt repayment and strategic initiatives. We also considered local country legal and regulatory restrictions. Additionally, the tax consequences of other separation-related transactions may require recognition of additional tax expense for deemed repatriation of undistributed earnings of our foreign subsidiaries. We believe that the separation is a one-time, non-recurring event, and such repatriation would not have occurred if not for the separation.
Excluding the repatriation of undistributed earnings prior to the completion of the separation, we expect undistributed prior-year earnings of our foreign subsidiaries to remain permanently reinvested except in certain instances where repatriation of such earnings would result in minimal or no tax. We base this assertion on:
| |
| (1) | the expectation that we will satisfy our U.S. cash obligations in the foreseeable future without requiring the repatriation of prior-year foreign earnings; |
| |
| (2) | plans for significant and continued reinvestment of foreign earnings in organic and inorganic growth initiatives outside the U.S.; and |
| |
| (3) | remittance restrictions imposed by local governments. |
We will continually analyze and evaluate our cash needs to determine the appropriateness of our indefinite reinvestment assertion.
See Note 6 to the annual Combined Financial Statements for additional information regarding income taxes.
Financial Condition, Liquidity, and Capital Resources
Our principal uses of cash generally have been capital investments and acquisitions and working capital investments. Prior to the separation, we plan to raise new debt capital and expect a total combined indebtedness for borrowed money of approximately $820 million, including approximately $750 million borrowed to pay a distribution to Grace prior to the separation and approximately $30 million expected to be retained to meet operating requirements. We believe our liquidity and capital resources, including cash at separation, cash we expect to generate during 2016 and thereafter, future borrowings if any, and other available liquidity and capital resources, are sufficient to finance our operations and growth strategy and to meet our debt obligations.
Cash Resources and Available Credit Facilities
At December 31, 2014, we had available liquidity of $142.4 million, consisting of $120.9 million in cash and cash equivalents ($113.2 million held in non-U.S. subsidiaries) and $21.5 million of available liquidity under various non-U.S. credit facilities.
At September 30, 2015, we had available liquidity of $128.3 million, consisting of $99.9 million in cash and cash equivalents ($99.1 million held in non-U.S. subsidiaries) and $28.4 million of available liquidity under various non-U.S. credit facilities.
Our non-U.S. credit facilities are extended to various subsidiaries that use them primarily to issue bank guarantees supporting trade activity and to provide working capital during occasional cash shortfalls. We generally renew these credit facilities as they expire.
As a result of the separation, we will repatriate approximately $173 million from our non-U.S. subsidiaries in advance of the separation. We expect to have sufficient cash and liquidity in our non-U.S. subsidiaries to fund working capital and operating needs.
We expect to meet U.S. cash and liquidity requirements with cash at separation, cash we expect to generate during 2016 and thereafter, future borrowings if any, and other available liquidity including royalties and service fees from our foreign subsidiaries. We may also repatriate future foreign earnings if that results in minimal or no U.S. tax consequences. We expect to have sufficient cash and liquidity to finance our U.S. operations and growth strategy and to meet our debt obligations in the U.S.
The following table summarizes our non-U.S. credit facilities as of December 31, 2014:
|
| | | | | | | | | |
(In millions) | Maximum Borrowing Amount | | Available Liquidity | | Expiration Date |
| Venezuela | $ | 14.8 |
| | $ | 4.8 |
| | Various through 2015 |
| India | 7.5 |
| | 2.8 |
| | 1/31/15 |
| Canada | 7.5 |
|
| 4.5 |
|
| 1/31/16 |
| Australia | 7.2 |
| | 3.0 |
| | 1/31/15 |
| Turkey | 3.3 |
| | 0.9 |
| | 6/30/15 |
| Argentina | 2.6 |
| | 2.0 |
| | Various through 2015 |
| United Arab Emirates | 2.5 |
| | 2.5 |
| | 11/30/15 |
| Vietnam | 1.0 |
| | 1.0 |
| | 4/29/2015 |
| Total | $ | 46.4 |
| | $ | 21.5 |
| | |
The following table summarizes our non-U.S. credit facilities as of September 30, 2015:
|
| | | | | | | | | |
(In millions) | Maximum Borrowing Amount | | Available Liquidity | | Expiration Date |
| China(1) | $ | 11.6 |
| | $ | 6.2 |
| | Various through 2016 |
| India | 8.5 |
| | 3.0 |
| | 1/31/16 |
| Australia | 8.0 |
| | 4.2 |
| | 1/31/16 |
| Canada | 7.5 |
| | 6.5 |
| | 1/31/16 |
| Turkey | 4.1 |
| | 3.5 |
| | Open end |
| Argentina | 2.9 |
| | 2.5 |
| | Various though 2015 |
| United Arab Emirates | 2.5 |
| | 2.5 |
| | 11/30/15 |
| Total | $ | 45.1 |
| | $ | 28.4 |
| | |
________________________________________________________________________________________________________________
| |
| (1) | This is an existing line of credit that was shared among Grace entities in Asia Pacific as of December 31, 2014. As of September 30, 2015, $11.6 million of the shared line was allocated to GCP and $5.4 million has been drawn. |
See Note 1 to the annual Combined Financial Statements for a detailed discussion of our allocations of cash and cash equivalents.
Analysis of Cash Flows
The following table summarizes our cash flows for the years ended December 31, 2014, 2013, and 2012:
|
| | | | | | | | | | | |
| | Year Ended December 31, |
| (In millions) | 2014 | | 2013 | | 2012 |
| Net cash provided by operating activities | $ | 161.0 |
| | $ | 163.1 |
| | $ | 143.5 |
|
| Net cash used for investing activities | (75.6 | ) | | (60.1 | ) | | (70.3 | ) |
| Net cash used for financing activities | (106.9 | ) | | (61.4 | ) | | (60.2 | ) |
| Effect of currency exchange rate changes on cash and cash equivalents | (15.4 | ) | | 3.6 |
| | 1.9 |
|
| (Decrease) increase in cash and cash equivalents | (36.9 | ) | | 45.2 |
| | 14.9 |
|
| Cash and cash equivalents, beginning of period | 157.8 |
| | 112.6 |
| | 97.7 |
|
| Cash and cash equivalents, end of period | $ | 120.9 |
| | $ | 157.8 |
| | $ | 112.6 |
|
Net cash provided by operating activities in 2014 was $161.0 million, compared with $163.1 million in the prior year.
Net cash provided by operating activities in 2013 was $163.1 million compared with $143.5 million in the prior year. Net cash provided by operating activities benefited from improved net income.
Net cash used for investing activities in 2014 was $75.6 million compared with $60.1 million in the prior year. The year-over-year change in cash flow was primarily due to an increase in loans to related party resulting from internal capital structure changes following Grace's emergence from Chapter 11 in 2014. There were no business acquisitions in 2014.
Net cash used for investing activities in 2013 was $60.1 million compared with $70.3 million in the prior year. The year-over-year change in cash flow was primarily due to smaller investments in businesses acquired in 2013 compared with the prior year.
Our capital expenditures include investments in new capacity, productivity projects, information technology, and maintenance of our manufacturing and office facilities. We expect to fund our capital expenditures from net cash provided by operating activities.
Net cash used for financing activities in 2014 was $106.9 million compared with $61.4 million in the prior year. The change in cash used for financing activities was primarily due to an increase in transfers to parent and net repayments under credit arrangements.
Net cash used for financing activities in 2013 was $61.4 million compared with $60.2 million in the prior year. The change in cash provided by financing activities was primarily due to a decrease in net borrowings, partially offset by a decrease in transfers to parent.
Included in net cash provided by operating activities are restructuring payments of $4.3 million, $7.8 million and $6.8 million and accelerated defined benefit pension plan contributions of $0.8 million, $1.3 million and $0.1 million for 2014, 2013 and 2012, respectively.
The following table summarizes our cash flows for the nine months and the prior-year period:
|
| | | | | | | |
| | Nine Months Ended September 30, |
| (In millions) | 2015 | | 2014 |
| Net cash provided by operating activities | $ | 101.9 |
| | $ | 89.3 |
|
| Net cash provided by (used for) investing activities | 14.2 |
| | (68.0 | ) |
| Net cash used for financing activities | (84.0 | ) | | (60.9 | ) |
| Effect of currency exchange rate changes on cash and cash equivalents | (53.1 | ) | | (8.5 | ) |
| Decrease in cash and cash equivalents | (21.0 | ) | | (48.1 | ) |
| Cash and cash equivalents, beginning of period | 120.9 |
| | 157.8 |
|
| Cash and cash equivalents, end of period | $ | 99.9 |
| | $ | 109.7 |
|
Net cash provided by operating activities for the nine months was $101.9 million, compared with $89.3 million for the prior-year period. The year-over-year change was primarily due to improvements in Adjusted EBIT.
Net cash provided by investing activities for the nine months was $14.2 million, compared with net cash used for investing activities $68.0 million for the prior-year period. The year-over-year change was primarily due to an increase in loans to related party in the prior-year period resulting from internal capital structure changes following Grace's emergence from Chapter 11 in 2014 and an increase in payments from related parties in the nine months.
Net cash used for financing activities for the nine months was $84.0 million, compared with $60.9 million in the prior-year period. The year-over-year change was primarily due to an increase in net repayments under credit arrangements and related party loans.
Included in net cash provided by operating activities are restructuring payments of $7.9 million and $1.9 million for the nine months and the prior-year period, respectively.
Debt and Other Contractual Obligations
Total debt outstanding at December 31, 2014, and September 30, 2015, was $79.0 million and $59.0 million, respectively.
Set forth below are our contractual obligations as of December 31, 2014:
|
| | | | | | | | | | | | | | | | | | | |
| | Payments Due by Period |
| (In millions) | Total | | Less than 1 Year | | 1-3 Years | | 4-5 Years | | More Than 5 Years |
| Debt(1) | $ | 79.0 |
| | $ | 79.0 |
| | $ | — |
| | $ | — |
| | $ | — |
|
| Expected interest payments on debt(2) | 1.7 |
| | 1.7 |
| | — |
| | — |
| | — |
|
| Operating lease obligations | 56.2 |
| | 14.7 |
| | 17.9 |
| | 6.9 |
| | 16.7 |
|
| Operating commitments(3) | 27.8 |
| | 10.0 |
| | 13.9 |
| | — |
| | 3.9 |
|
| Pension funding requirements for non-U.S. pension plans(4) | 16.9 |
| | 3.5 |
| | 6.5 |
| | 6.9 |
| | — |
|
| Total Contractual Obligations | $ | 181.6 |
| | $ | 108.9 |
| | $ | 38.3 |
| | $ | 13.8 |
| | $ | 20.6 |
|
___________________________________________________________________________________________________________________
| |
| (1) | A majority of the debt outstanding as of December 31, 2014, is related party debt between us and Grace. This debt is expected to be effectively settled in cash at or before our separation from Grace. See Note 1 to the annual Combined Financial Statements for additional details. |
| |
| (2) | Amounts are based on interest rates as of December 31, 2014, for principal debt outstanding as of December 31, 2014. |
| |
| (3) | Amounts do not include open purchase commitments, which are routine in nature and normally settle within 90 days, or obligations to employees under annual or long-term incentive programs. |
| |
| (4) | Based on the non-U.S. pension plans' status as of December 31, 2014, funding requirements have been estimated for the next five years for plans that are our direct obligation. Amounts do not include estimated funding requirements for the Shared Plans. Amounts in subsequent years have not yet been determined. |
Employee Benefit Plans
Multiemployer Plans
Our employees participate in funded and unfunded defined benefit pension and other postretirement benefit plans (the “Shared Plans”) sponsored by Grace, which include employees of other Grace businesses. For purposes of the Combined Financial Statements, we account for the Shared Plans as multiemployer benefit plans. Accordingly, we do not record an asset or liability to recognize the funded status of these plans in the Combined Balance Sheets. Our allocated expense for the defined benefit pension plans was $5.3 million, $3.0 million, and $4.6 million for the years ended December 31, 2014, 2013, and 2012, respectively. Our allocated income (expense) for the postretirement health care and life insurance benefits plan was $0.7 million, $(1.5) million, and $(1.8) million for the years ended December 31, 2014, 2013, and 2012, respectively. Our allocated expense for the defined benefit pension plans was $2.8 million and $4.0 million for the nine months and the prior-year period, respectively. Our allocated income for the postretirement health care and life insurance benefits plan was $1.2 million and $0.3 million for the nine months and the prior-year period, respectively.
Defined Contribution Retirement Plan
Grace also sponsors a defined contribution retirement plan for its employees in the United States, in which our employees participate. This plan is qualified under section 401(k) of the U.S. tax code. Currently, Grace contributes an amount equal to 100% of employee contributions, up to 6% of an individual employee's salary or wages. For the years ended December 31, 2014, 2013, and 2012, we received an allocation of the total cost related to this benefit plan of $4.5 million, $4.3 million, and $4.1 million, respectively. For the nine months and the prior-year period, we received an allocation of the total cost related to this benefit plan of $3.8 million and $3.3 million, respectively.
Defined Benefit Pension Plans
Our employees also participate in certain funded and unfunded defined benefit pension plans, primarily in the U.K., that we sponsor. We record an asset or liability to recognize the funded status of these plans in the Combined Balance Sheets. Information for these defined benefit pension plans is discussed below.
We sponsor defined benefit pension plans for our employees in the U.S., the U.K., and a number of other countries, and fund government-sponsored programs in other countries where we operate. Certain of our defined
benefit pension plans are advance-funded and others are pay-as-you-go. The advance-funded plans are administered by trustees who direct the management of plan assets and arrange to have obligations paid when due. Our most significant advance-funded plans cover current and former salaried employees in the U.K. and employees covered by collective bargaining agreements at certain of our U.S. facilities. Our U.S. advance-funded plans are qualified under the U.S. tax code.
Fully-funded plans include several advance-funded plans where the fair value of the plan assets exceeds the projected benefit obligation, or PBO. This group of plans was overfunded by $44.1 million as of December 31, 2014, and the overfunded status is reflected as "overfunded defined benefit pension plans" in the Combined Balance Sheets. Underfunded plans include a group of advance-funded plans that are underfunded on a PBO basis by a total of $7.7 million as of December 31, 2014. Additionally, we have several plans that are funded on a pay-as-you-go basis, and therefore, the entire PBO of $28.0 million at December 31, 2014, is unfunded. The combined balance of the underfunded and unfunded plans was $35.7 million as of December 31, 2014, and is presented as a liability on the Combined Balance Sheets as follows: $1.0 million in "other current liabilities", and $34.7 million included in "underfunded and unfunded defined benefit pension plans."
Based on the U.S. advance-funded plans' status as of December 31, 2014, there are no minimum required payments under ERISA for 2015. We contributed $0.8 million, $1.3 million and $0.4 million to these plans in 2014, 2013 and 2012, respectively.
We intend to fund non-U.S. pension plans based upon applicable legal requirements and actuarial and trustee recommendations. We contributed $3.6 million, $2.3 million and $1.3 million to these plans in 2014, 2013 and 2012, respectively. We contributed $1.7 million to these plans during the nine months compared with $2.3 million during the prior-year period.
Tax Matters
See Note 6 to the annual Combined Financial Statements and "Income Taxes" above for additional discussion of our tax accounting matters including tax contingencies.
Other Contingencies
See Note 9 to the annual Combined Financial Statements for a discussion of our other contingent matters.
Inflation
We recognize that inflationary pressures may have an adverse effect on us through higher asset replacement costs and higher raw materials and other operating costs. We try to minimize these impacts through effective control of operating expenses and productivity improvements as well as price increases to customers.
We estimate that the cost of replacing our property and equipment today is greater than its historical cost. Accordingly, our depreciation expense would be greater if the expense were stated on a current cost basis.
Venezuela
Effective January 1, 2010, we began to account for Venezuela as a highly inflationary economy. As a result, the functional currency of our Venezuelan subsidiary became the U.S. dollar; therefore, all translation adjustments are reflected in net income in the accompanying Combined Statements of Operations. The official exchange rate of 4.3 was used to remeasure our financial statements from bolivars to U.S. dollars upon Venezuela's designation as a highly inflationary economy.
Effective February 13, 2013, the official exchange rate of the bolivar to the U.S. dollar devalued from 4.3 to 6.3. As a result of this currency devaluation, we incurred a charge to net income of $8.5 million in the 2013 first quarter. Of this amount, $1.6 million was included in Adjusted EBIT.
In March 2013, the Venezuelan government launched a new foreign exchange mechanism called the "Complimentary System of Foreign Currency Acquirement" (or SICAD1). The SICAD1 operates similarly to an auction system and allows entities in specific sectors to bid for U.S. dollars to be used for specified import transactions. In March 2014, the Venezuelan government launched another foreign exchange mechanism, known as the SICAD2, which operates similarly to the SICAD1. Neither the SICAD1 nor the SICAD2 have changed or eliminated the official exchange rate of the bolivar to the U.S. dollar. There have been no changes in the official
exchange rate of the bolivar to the U.S. dollar since February 13, 2013. Until September 30, 2015, we continued to use the official exchange rate of 6.3 bolivars to U.S. dollars (CENCOEX) for remeasurement purposes.
In February 2015, the Venezuelan government unified SICAD1 and SICAD2 into a single exchange mechanism, which is now called SICAD. Additionally, a new exchange mechanism, SIMADI, was also implemented. These changes were effective in the first quarter of 2015.
Specialty Construction Chemicals and Darex Packaging Technologies have operated in Venezuela for several decades with sales in that country representing approximately 10% and 6% of each segment’s sales, respectively, for the nine months. Bolivar-denominated sales represented approximately 6% of our total sales for the nine months. In the 2014 first quarter, we began seeing a significant impact to our sales and earnings as a result of Venezuela's difficult economic conditions and this trend continued through the 2015 second quarter. It became increasingly difficult for us and our customers to operate normally in the country. Currency and import controls impacted our ability to import necessary raw materials for production, and we were unable to fully satisfy customer demand from the 2014 first quarter through the 2015 second quarter. In the 2015 third quarter, we were able to import a significant amount of raw materials, leading to a significant increase in sales and earnings in the quarter. These raw materials were purchased by our Venezuelan subsidiary using cash it held outside of Venezuela and through other GCP subsidiaries. Our Venezuelan subsidiary has used substantially all of the cash it held outside of Venezuela. While the Venezuelan government has approved permits for GCP to import raw materials at the CENCOEX exchange rate, they have not approved the release of the currency needed to pay intercompany payables or other invoices since the 2014 fourth quarter. As a result of the uncertainty of our ability to settle transactions through CENCOEX, we are evaluating other ways to procure raw materials in Venezuela including the alternative exchange mechanisms. During the 2015 third quarter we continued to experience a significant increase to the rate of inflation for employee costs, import taxes, professional fees and other costs to run the business.
Based on company specific and macro-economic developments in Venezuela in the third quarter, including changed expectations about our ability to import raw materials at the official exchange rate in the future, the extended period of time since we have received payment at the official exchange rate, the increase in the rate of inflation and the weaker outlook for the Venezuelan economy, we have determined that it is no longer appropriate to use the official exchange rate. Effective September 30, 2015, we will account for our results at the SIMADI rate. At September 30, 2015, this rate was 199 VEB/USD. We recorded a pre-tax charge of $73.2 million in the third quarter to reflect the devaluation of monetary assets and the impairment of non-monetary assets, including $40.2 million for cash, $28.9 million for working capital and $4.1 million for property and equipment. Of this amount, $13.7 million related to inventory was recorded in cost of goods sold, and $59.5 million related to other assets and liabilities was recorded as a separate line in the third quarter Combined Statement of Operations. The assets, liabilities, sales, earnings and cash flows of our Venezuelan subsidiary are expected to be immaterial after September 30, 2015. Since cash in Venezuela has been unavailable for use outside the country, this change has no effect on our ability to finance our global GCP operations and growth strategy and our ability to meet our debt obligations.
The following table presents net sales, gross profit, and pre-tax income for our Venezuelan subsidiary for 2012, 2013, 2014, the third quarter and nine months and the respective prior-year periods.
|
| | | | | | | | | | | | | | | | | | | | | | | | | | | |
| | Year Ended December 31, | | Three Months Ended September 30, | | Nine Months Ended September 30, |
| (In millions) | 2014 | | 2013 | | 2012 | | 2015 | | 2014 | | 2015 | | 2014 |
| Net sales | $ | 48.1 |
| | $ | 37.2 |
| | $ | 30.4 |
| | $ | 41.5 |
| | $ | 12.3 |
| | $ | 68.6 |
| | $ | 34.4 |
|
| Gross profit | 21.5 |
| | 15.5 |
| | 12.0 |
| | 25.2 |
| | 5.4 |
| | 34.6 |
| | 15.3 |
|
| Adjusted EBIT | 17.3 |
| | 11.0 |
| | 8.6 |
| | 22.8 |
| | 4.4 |
| | 28.7 |
| | 12.7 |
|
As noted above we experienced significant sales and earnings in Venezuela in the 2015 third quarter. This activity resulted in higher cash, customer accounts receivable and other assets in the Venezuelan subsidiary at the end of the 2015 third quarter compared to the end of the 2015 second quarter. The charge of $73.2 million in the 2015 third quarter to devalue and impair the monetary assets and non-monetary assets included $22.2 million related to 2015 third quarter sales and earnings and was therefore higher than the exposure that we disclosed at the end of the 2015 second quarter.
Critical Accounting Estimates
The preparation of financial statements in conformity with GAAP requires that we make estimates and assumptions affecting the assets and liabilities reported at the date of the Combined Financial Statements, and the revenues and expenses reported for the periods presented. We believe that our accounting estimates are appropriate and the related balances are reasonable; however, actual amounts could differ from the original estimates, requiring adjustments in future periods. Changes in estimates are recorded in the period in which the change is identified. Our accounting policies are described in Note 1 to the annual Combined Financial Statements. Critical accounting estimates are described in this section.
An accounting estimate is considered critical if the estimate requires management to make assumptions and judgments about matters that were highly uncertain at the time the estimate was made, if different estimates reasonably could have been used, or if changes in the estimate are reasonably likely to occur from period to period that could have a material impact on our financial condition or results of operations. As part of our quarterly disclosure controls and procedures, management has discussed the development, selection and disclosure of the critical accounting estimates with the Audit Committee of the Grace Board of Directors.
Contingent Liabilities
We record a liability if we have determined that a loss is probable and we are able to reasonably estimate the amount of the loss or have another reasonable basis for recording a liability. We have determined that each of the contingencies discussed below involves an accounting judgment that is material to our Combined Financial Statements.
Goodwill
We review our goodwill for impairment on an annual basis at October 31 and whenever events or a change in circumstances indicate that the carrying amount may not be fully recoverable. We test our goodwill for impairment at the reporting units level which are defined as Specialty Construction Chemicals, Specialty Building Materials and Darex Packaging Technologies.
We performed a quantitative analysis as of October 31, 2014, and concluded that the estimated fair value of all of our reporting units substantially exceeded their carrying values.
Pension and Other Postretirement Benefits Expenses and Liabilities
We sponsor defined benefit pension plans for our employees in the United States, the United Kingdom, and a number of other countries, and fund government-sponsored programs in other countries where we operate. See Note 7 to the annual Combined Financial Statements and "— Employee Benefit Plans" above for a detailed discussion of our pension plans and other postretirement benefit plans.
In order to estimate our pension and other postretirement benefits expenses and liabilities we evaluate the range of possible assumptions to be used in the calculation of pension and other postretirement benefits expenses and liabilities. We select the assumptions that we believe to be most indicative of factors such as participant demographics, past experiences and market indices, and provide the assumptions to independent actuaries. These assumptions are updated annually and primarily include factors such as discount rates, expected return on plan assets, mortality rates, retirement rates, and rate of compensation increase. The independent actuaries review our assumptions for reasonableness, and use the assumptions to calculate our estimated liability and future pension expense. We review the actuarial reports for reasonableness and adjust our expenses, assets and liabilities to reflect the amounts calculated in the actuarial reports.
The two key assumptions used in determining our pension benefit obligations and pension expense are the discount rate and expected return on plan assets. Our most significant pension assets and pension liabilities relate to U.S. and U.K. pension plans.
The assumed discount rate for pension plans reflects the market rates for high-quality corporate bonds currently available and is subject to change based on changes in overall market interest rates. For the U.S. pension plans, the assumed discount rate was selected in consultation with our independent actuaries, based on a yield curve constructed from a portfolio of high quality bonds for which the timing and amount of cash outflows approximate the estimated payouts of the plan. For the U.K. pension plan, the assumed discount rate was selected in consultation with our independent actuaries, based on a yield curve constructed from a portfolio of
sterling-denominated high quality bonds for which the timing and amount of cash outflows approximate the estimated payouts of the plan.
We selected the expected return on plan assets for the U.S. qualified pension plans for 2014 in consultation with our independent actuaries, using an expected return model. The model determines the weighted average return for an investment portfolio based on the target asset allocation and expected future returns for each asset class, which were developed using a building block approach based on observable inflation, available interest rate information, current market characteristics, and historical results. In determining the expected rate of return for the U.K. pension plan, we considered the trustees' strategic investment policy together with long-term historical returns and investment community forecasts for each asset class.
Income Taxes
We are a global enterprise with operations in more than 40 countries. This global reach results in a complexity of tax regulations, which require assessments of applicable tax law and judgments in estimating our ultimate income tax liability. See Note 6 to the annual Combined Financial Statements for additional details regarding our estimates used in accounting for income tax matters including income tax contingencies.
We recognize the tax benefit from an uncertain tax position only if it is more likely than not that the tax position will be sustained upon examination by the taxing authorities, based on the technical merits of the position. We measure tax benefits in our financial statements from such a position as the largest benefit that has a greater than fifty percent likelihood of being realized upon ultimate settlement. Unrecognized tax benefits are tax benefits claimed in our tax returns that do not meet these recognition and measurement standards.
We record a liability for unrecognized tax benefits when it is more likely than not that a tax position we have taken will not be sustained upon audit. We evaluate such likelihood based on relevant facts and tax law. We adjust our recorded liability for income tax matters due to changes in circumstances or new uncertainties, such as amendments to existing tax law. Our ultimate tax liability depends upon many factors, including negotiations with taxing authorities in the jurisdictions in which we operate, outcomes of tax litigation, and resolution of disputes arising from federal, state, and foreign tax audits. Due to the varying tax laws in each jurisdiction, senior management, with the assistance of local tax advisors as necessary, assesses individual matters in each jurisdiction on a case-by-case basis. We research and evaluate our income tax positions, including why we believe they are compliant with income tax regulations, and these positions are documented as appropriate.
Deferred income taxes result from the differences between the financial and tax basis of our assets and liabilities and are adjusted for changes in tax rates and tax laws when changes are enacted. If it is more likely than not that all or a portion of deferred tax assets will not be realized, a valuation allowance is provided for such deferred tax assets. As of December 31, 2014, we have recorded a valuation allowance of $1.8 million on deferred tax assets, all of which relates to foreign net operating loss carryforwards.
The realization of deferred tax assets is dependent on the generation of sufficient taxable income in the appropriate tax jurisdictions. In evaluating our ability to realize our deferred tax assets, we consider all reasonably available positive and negative evidence, including recent earnings experience, expectations of future taxable income and the tax character of that income, the extended period of time over which the temporary differences become deductible and the carryforward and/or carryback periods available to us for tax reporting purposes in the related jurisdiction. In estimating future taxable income, we develop assumptions, including the amount of future federal, state and international pretax operating income that we can reasonably expect to generate, the reversal of temporary differences and the implementation of feasible and prudent tax planning strategies. We record a valuation allowance to reduce deferred tax assets to the amount that we believe is more likely than not to be realized.
We believe it is more likely than not that the net deferred tax assets as of December 31, 2014, will be realized. If we were to determine that we would not be able to realize a portion of our net deferred tax assets in the future, an adjustment to the net deferred tax assets would be charged to earnings in the period such determination was made. Conversely, if we were to make a determination that it is more likely than not that deferred tax assets would be realized, the related valuation allowance would be reduced and a benefit to earnings would be recorded.
Corporate Cost Estimates
Our Combined Financial Statements include expenses of Grace allocated to us for certain functions provided by Grace, including, but not limited to, general corporate expenses related to finance, legal, information technology, human resources, communications, ethics and compliance, environment health and safety, supply chain, shared services, employee benefits and incentives, insurance and stock-based compensation. These expenses have been allocated to us on the basis of direct usage when identifiable, with the remainder allocated on the basis of revenue, headcount or other measures. These cost allocations are included in selling, general and administrative expenses in the Statement of Operations. Most of these costs are included in segment operating income with only a portion included in corporate costs. Both we and Grace consider the basis on which the expenses have been allocated to be a reasonable reflection of the utilization of services provided to, or the benefit received by, us during the periods presented. The allocations may not, however, reflect the expense GCP would have incurred as an independent company for the period presented. Actual costs that would have been incurred if GCP had been an independent company would depend on a number of factors, including the chosen organizational structure and certain strategic decisions.
Recent Accounting Pronouncements
See Note 1 to the annual and interim Combined Financial Statements for a discussion of recent accounting pronouncements and their effect on us.
QUANTITATIVE AND QUALITATIVE DISCLOSURES ABOUT MARKET RISK
Our global operations, raw materials and energy requirements, and debt obligations expose us to various market risks. The following is a discussion of our primary market risk exposures, how these exposures may be managed, and certain quantitative data pertaining to these exposures. We expect to use derivative financial instruments to mitigate certain of these risks. Currently, all material currency, commodity and interest rate derivatives are held by Grace, are not specifically identifiable to GCP, and are not included in the Combined Financial Statements.
Currency Exchange Rate Risk
Because we do business in over 40 countries, our results of operations are exposed to changes in currency exchange rates. We seek to minimize exposure to these changes by matching revenue streams in volatile currencies with expenditures in the same currencies, but it is not always possible to do so. We expect to use financial instruments such as currency forward contracts, options, or combinations of the two to reduce the risk of certain specific transactions. However, we do not have a policy of hedging all exposures, because management does not believe that such a level of hedging would be cost-effective. We do not hedge translation exposures that are not expected to affect cash flows in the near-term.
Commodity Price Risk
We operate in markets where the prices of raw materials and energy are commonly affected by cyclical movements in the economy and other factors. The principal raw materials used in our products include amines, polycarboxylates, rubber and latex, solvents, naphthalene, sulfonate, lignins, and saccharides. These commodities are generally available to be purchased from more than one supplier. In order to minimize the risk of increasing prices on certain raw materials and energy, we use a centralized supply chain organization for sourcing in order to optimize procurement activities. We have a risk management committee to review proposals to hedge purchases of raw materials and energy, but we do not currently use financial instruments to hedge these costs.
Interest Rate Risk
At the time of the separation we expect that approximately $295 million of our borrowings will be at variable interest rates. As a result, we expect to be subject to interest rate risk in respect of such floating-rate debt. A 100 basis point increase in the interest rates payable on our variable rate debt would increase our annual interest expense by approximately $3 million.
BUSINESS
BUSINESS OVERVIEW
We are engaged in the production and sale of specialty construction chemicals, specialty building materials and packaging sealants and coatings through three operating segments. Specialty Construction Chemicals manufactures and markets concrete admixtures, concrete production management systems, and cement additives. Specialty Building Materials manufactures and markets building envelope products, residential products, and specialty construction products. Darex Packaging Technologies manufactures and markets sealants and coatings for use in beverage and food containers and other consumer and industrial applications. Following our separation from Grace, we expect to be a global industry leader in each of our operating segments. For the years ended December 31, 2014 and 2013, we had sales of $1.5 billion and $1.4 billion, income before income taxes of $191.1 million and $162.9 million and net income of $134.3 million and $109.7 million, respectively.
Global Scope
We operate our business on a global scale with approximately 68% of our 2014 sales outside the United States. We conduct business in over 40 countries and manage our operating segments on a global basis, to serve global markets. Currency fluctuations affect our reported results of operations, cash flows, and financial position.
Strategy Overview
Our objective is to increase our earnings, cash flow, and returns on invested capital to increase shareholder value through the implementation of our business strategies. We use our strengths to pursue these objectives through the following investment and growth strategies:
Grow Sales by Leveraging Strong Segment Leadership Positions — We intend to continue to leverage our global manufacturing and technical service footprint and our research and development and sales organizations to profitably increase geographic and customer penetration in our current regions—especially emerging markets and the recovering developed markets. We intend to make targeted investments to expand our geographic footprint in areas and segments where trends and economic cycles present the best opportunities.
Grow Through Strategic Acquisitions — We will continue to seek strategic, bolt-on acquisitions and alliances to accelerate our customer and geographic penetration, broaden our technology and product portfolios, and bolster our manufacturing capacity and capability. Darex has provided stable and predictable cash flows and we plan to leverage Darex to help us capture growth opportunities across our portfolio.
Strengthen and Enhance Our Segment Positions with Product Innovation — We will seek to further our position as an industry innovator by continuing to invest in research and development to commercialize highly valued, technically differentiated products and services to address both global mega trends and regional and local applications critical to our customers. To drive this innovation, we intend to leverage our model of introducing and supporting new technologies through our centralized research and development center in Cambridge, MA and regional applications labs globally. We may invest in additional regional application labs and field technical support resources as we expand our customer and geographic penetration.
Maintain Strong Customer Focus — A key aspect of our strategy is to continue to deliver product and technology solutions to our customers that help them improve their product performance and productivity in their manufacturing operations. We believe that maintaining a close partnership with our customers allows us to effectively focus our innovation efforts and respond to their changing demands at a global, regional and local level.
Increase Productivity by Leveraging Global Supply Chain — Given the relatively low conversion costs of our products, GCP’s productivity strategies focus on the supply chain. We have established deep procurement and product formulation expertise to manage our product costs and production efficiencies. Product formulations are optimized at our regional development labs around the world. These formulations are designed to meet specific customer needs while also considering the costs of the various raw material options available to meet those needs. Our global supply chain organization balances local raw material supply with global contracts that leverage our buying power. Our strategic manufacturing network also optimizes production and delivery efficiencies.
Drive Cash Flow and Return on Invested Capital to Deliver Long-Term Value to Our Shareholders — We believe these strategies will allow us to generate significant cash flow to invest in our research and development activities, manufacturing operations, technical service and sales organizations and strategic acquisitions and to return excess capital to shareholders.
Specialty Construction Chemicals, Specialty Building Materials and Packaging Technologies Industries
Specialty construction chemicals, specialty building materials and packaging sealants and coatings are high performance products. They are generally produced in relatively small volumes (compared with commodity chemicals) and must satisfy well-defined performance requirements and specifications. Accordingly, close relationships with our customers are essential to our success. We focus our business on the following, which we believe are important competitive factors in the specialty construction chemicals, specialty materials, and packaging industries:
| |
| • | value-added products, technologies and services, sold at competitive prices; |
| |
| • | customer technical service, including rapid response to changing customer needs and helping customers realize the maximum value from our products; |
| |
| • | technological leadership resulting from investment in research and development and technical customer service; and |
| |
| • | reliability of product and supply. |
We believe that our focus on these competitive factors enables us to deliver increased value to customers and competitive operating margins notwithstanding the increased customer and technical service and research and development costs that this focus entails.
PRODUCTS
Specialty Construction Chemicals Operating Segment (SCC)
We supply concrete admixtures and cement additives to producers of cement, concrete, mortar, masonry and other cementitious based construction materials on a global basis. These products are used to improve the quality, consistency, durability, and other engineering properties of these materials. Our products reduce our customers' environmental footprints by lowering the energy use and CO2 emissions of our customers' processes. Portland cement-based concrete is the dominant construction material in the world, with global production of approximately 4 billion tons of portland cement and more than 10 billion cubic yards of concrete. We compete with several large international suppliers, and regionally with numerous smaller competitors. Competition for our products is based on product performance, technical support, the breadth of our manufacturing and distribution infrastructure, and our ability to bring value to our customers in the construction industry. Our major global competitors are BASF and Sika.
The following table sets forth SCC sales of similar products as a percentage of GCP total revenue.
|
| | | | | | | | | | | | | | | | | | | | |
| | 2014 | | 2013 | | 2012 |
| (In millions) | Sales | | % of GCP Revenue | | Sales | | % of GCP Revenue | | Sales | | % of GCP Revenue |
| Concrete Admixtures | $ | 541.9 |
| | 36.6 | % | | $ | 513.5 |
| | 35.6 | % | | $ | 505.0 |
| | 35.8 | % |
| Cement Additives | 184.4 |
| | 12.5 | % | | 174.6 |
| | 12.1 | % | | 175.9 |
| | 12.5 | % |
| Total SCC Revenue | $ | 726.3 |
| | 49.1 | % | | $ | 688.1 |
| | 47.7 | % | | $ | 680.9 |
| | 48.3 | % |
The following table sets forth SCC sales by geographic region as a percentage of SCC total revenue.
|
| | | | | | | | | | | | | | | | | | | | |
| | 2014 | | 2013 | | 2012 |
| (In millions) | Sales | | % of SCC Revenue | | Sales | | % of SCC Revenue | | Sales | | % of SCC Revenue |
| North America | $ | 235.0 |
| | 32.4 | % | | $ | 219.1 |
| | 31.8 | % | | $ | 212.1 |
| | 31.2 | % |
| Europe Middle East Africa (EMEA) | 170.3 |
| | 23.4 | % | | 164.6 |
| | 23.9 | % | | 174.6 |
| | 25.6 | % |
| Asia Pacific | 185.5 |
| | 25.5 | % | | 170.6 |
| | 24.8 | % | | 174.2 |
| | 25.6 | % |
| Latin America | 135.5 |
| | 18.7 | % | | 133.8 |
| | 19.5 | % | | 120.0 |
| | 17.6 | % |
| Total SCC Revenue | $ | 726.3 |
| | 100.0 | % |
| $ | 688.1 |
| | 100.0 | % | | $ | 680.9 |
| | 100.0 | % |
SCC sales of our Venezuelan subsidiary were $31.6 million, $21.6 million and $16.0 million for 2014, 2013 and 2012, respectively.
SCC consists of two product groups: concrete admixtures and cement additives.
Concrete admixtures
The concrete admixtures product group includes concrete admixtures, admixtures for decorative concrete and concrete production management systems.
Concrete admixtures allow concrete producers to use a limited selection of locally-sourced raw materials (cement and aggregates) to produce concrete to meet a wide variety of performance specifications. Our products are based on a set of core platform technologies formulated regionally into admixtures tailored to local end-use requirements. For example, our MIRA® admixtures allow concrete to be produced with a lower amount of water, which improves the compressive strength and the long-term durability of the concrete. ADVA® admixtures are used to make flowable "self-compacting concrete" which is popular in precast concrete manufacturing where the rapid filling of large molds is a major driver of economics. ECLIPSE® admixtures are used to minimize the formation of shrinkage cracks in critical applications, such as bridge decks. STRUX® polymeric fibers are designed to improve the ductility of concrete which is a naturally brittle material. In some cases, STRUX® polymeric fibers may be used to replace steel reinforcement near the surface of concrete that will be exposed to corrosive de-icing salts.
Admixtures for decorative concrete are used to create decorative/architectural concrete. Pieri® surface retarders are used to obtain exposed aggregate finishes in precast and cast-in-place concrete, achieving the desired surface appearance. Pieri® release agents allow for the efficient removal of mold forms with a resultant blemish-free concrete surface.
Concrete production management systems provide sophisticated process monitoring and control while concrete is in transit to the jobsite. Our patented concrete production management system, Verifi®, measures, monitors, and manages critical concrete properties and systematically adds water or admixtures to maintain optimum concrete flow properties. The result is increased product quality and consistency of concrete, fewer rejected loads, increased jobsite efficiency and minimized costly project delays.
Cement additives
Portland cement is the binding agent for concrete. National standards usually dictate the compressive strength and other properties that must be met by cement. Cement additives are used to reduce the energy required to mill cement to the desired fineness and to improve the handling characteristics of the powdered material. These products are also used to adjust the performance of portland cement, permitting our customers to optimize production economics. Examples include HEA2®, which is used around the world to improve the energy efficiency of cement grinding operations, and CBA®, which is used to produce higher cement strength, providing a high level of process flexibility to the cement manufacturer. Increasingly, cement manufacturers seek to reduce the environmental impact of their manufacturing processes; our additives provide greater flexibility in raw materials, enabling customers to achieve improvements such as reductions in energy use and carbon dioxide emissions. SYNCHRO® products are used by cement producers to reduce the amount of soluble chromium in concrete.
The SCC product portfolio includes:
|
| | | | | | |
| Products | | Uses | | Customers | | Key Brands |
| Concrete admixtures | | Chemicals and polymeric fibers used to reduce the production and in-place costs of concrete, increase the performance of concrete and improve the life cycle cost of structures | | Ready-mix and precast concrete producers, engineers and specifiers | | ADVA®, STRUX®, MIRA®, POLARSET®, ECLIPSE®, DARACEM®, DARASET®, DCI®, RECOVER®, WRDA®, ZYLA® |
| Admixtures for decorative concrete | | Products for architectural concrete include surface retarders, coatings, pigments and release agents used by concrete producers and contractors to enhance the surface appearance and aesthetics of concrete | | Precast concrete producers and architects | | PIERI® |
| Concrete production management systems | | Proprietary sensors, algorithms, and control systems which monitor and adjust the flow properties while in transit to construction sites, providing concrete producers quality control and operational efficiencies | | Ready-mix concrete manufacturers | | VERIFI® |
| Cement additives | | Formulated chemicals added to the milling stage of the cement manufacturing process to improve plant energy efficiency, enhance the performance of the finished cement and help our customers meet environmental regulations and reduce their CO2 footprints | | Cement manufacturers | | CBA®, SYNCHRO®, HEA2®, TDA®, ESE® |
Specialty Building Materials Operating Segment (SBM)
We supply building materials used in both new construction and renovation/repair projects. We manufacture and sell products that protect structures from water, vapor transmission, and air penetration as well as fire damage. Our products also reduce energy usage and improve the long-term durability of structures. They include waterproofing membranes and roofing underlayments for use in commercial and residential buildings, polymeric grouts for use in waterproofing and soil stabilization applications, air and vapor barriers, cementitious grouts, and passive fire protection.
Our products are specified and installed on commercial, residential and infrastructure projects around the world. Our technology platforms, project selling competencies and international reach are the foundation for our industry leadership. We are dedicated to understanding local codes and construction practices to ensure that our technology solutions address the regional needs of our customers. Our global specification sales organization emphasizes its technical expertise and has established relationships with key influencers and decision makers across the entire project selling value chain including architects, engineers, general contractors, specialty contractors and other channel partners. We continue to expand our international presence in targeted regions with our core product lines and by adding new technologies.
SBM's product sales are global. Our customers include global architectural and contracting firms as well as local specifiers, engineers, contractors and building material distributors. We compete globally with several large international construction materials suppliers, and regionally and locally with numerous smaller competitors. Competition for our products is based on product performance, technical support and service, brand name recognition and price. Our major competitors are Sika, RPM and Carlisle.
The following table sets forth SBM sales of similar products as a percentage of GCP total revenue.
|
| | | | | | | | | | | | | | | | | | | | |
| | 2014 | | 2013 | | 2012 |
| (In millions) | Sales | | % of GCP Revenue | | Sales | | % of GCP Revenue | | Sales | | % of GCP Revenue |
| Building Envelope | $ | 236.3 |
| | 16.0 | % | | $ | 219.1 |
| | 15.2 | % | | $ | 185.3 |
| | 13.1 | % |
| Residential Products | 59.2 |
| | 4.0 | % | | 69.3 |
| | 4.8 | % | | 75.4 |
| | 5.4 | % |
| Specialty Construction Products | 83.8 |
| | 5.6 | % | | $ | 81.7 |
| | 5.7 | % | | 83.3 |
| | 5.9 | % |
| Total SBM Revenue | $ | 379.3 |
| | 25.6 | % | | $ | 370.1 |
| | 25.7 | % | | $ | 344.0 |
| | 24.4 | % |
The following table sets forth SBM sales by geographic region as a percentage of SBM total revenue.
|
| | | | | | | | | | | | | | | | | | | | |
| | 2014 | | 2013 | | 2012 |
| (In millions) | Sales | | % of SBM Revenue | | Sales | | % of SBM Revenue | | Sales | | % of SBM Revenue |
| North America | $ | 201.0 |
| | 53.0 | % | | $ | 204.2 |
| | 55.2 | % | | $ | 199.3 |
| | 58.0 | % |
| Europe Middle East Africa (EMEA) | 100.4 |
| | 26.4 | % | | 96.3 |
| | 26.0 | % | | 95.1 |
| | 27.6 | % |
| Asia Pacific | 72.0 |
| | 19.0 | % | | 63.0 |
| | 17.0 | % | | 43.4 |
| | 12.6 | % |
| Latin America | 5.9 |
| | 1.6 | % | | 6.6 |
| | 1.8 | % | | 6.2 |
| | 1.8 | % |
| Total SBM Revenue | $ | 379.3 |
| | 100.0 | % | | $ | 370.1 |
| | 100.0 | % | | $ | 344.0 |
| | 100.0 | % |
SBM consists of three product groups: building envelope, residential building products and specialty construction products.
Building envelope products
Building envelope products protect structures from water and help manage air and vapor transmission through building walls. The majority of sales in this product group are waterproofing products that protect commercial structures, residential structures and infrastructure. Our waterproofing products are used in both above-grade and below-grade applications. Above grade, our products protect the material to which they are applied and allow architects to design occupied spaces free from water infiltration, and below grade, our products enable the construction of structures in challenging sites, including portions below the existing water table. Examples of these products include our self-adhesive rubberized asphalt membrane, BITUTHENE®, and our innovative pre-applied sheet membrane, PREPRUFE®.
Our BITUTHENE® product line is manufactured globally and has a long track record of providing waterproofing in the most challenging conditions. Designers and contractors have relied on BITUTHENE® for over 40 years and continue to specify it by name. We pioneered the pre-applied waterproofing category with our Advanced Bond Technology™ found in PREPRUFE®. Our unique technology allows a waterproofing membrane to be installed on the ground or on walls before concrete is placed for a foundation. This technology also allows waterproofing of walls normally inaccessible during the construction of a building, such as foundations in densely populated cities. Major projects around the world have successfully implemented our PREPRUFE® system, and it continues to gain recognition for its waterproofing performance.
Residential building products
Residential building products consist of roofing underlayments, flashing and weather barriers. Roofing underlayments are placed below the outermost roof covering, such as shingles, to protect sloped roofs from water damage caused by wind-driven rain and ice dams. ICE & WATER SHIELD® roofing underlayments are known throughout the industry and are sold in North America through a network of distributors. The Vycor® flashing portfolio consists of high performance self-adhered flashing products that provide premium protection against water infiltration in critical areas such as windows and doors. Vycor® flashing reduces the risk of mold and rot development, and contributes to energy efficiency by sealing air leakages from the building.
Specialty construction products
Specialty construction products include fire protection, chemical grouts and cementitious grouts and mortars. Passive fire protection products are marketed under the MONOKOTE® brand. Chemical grouts are sold under the DE NEEF® brand and are used to repair cracks in concrete and seal water leaks in commercial buildings and infrastructure. BETEC® cementitious grouts and mortars are used in applications where specific strength and/or flow are required. Examples of these applications include assembly of concrete precast elements for wind turbines, filling under rails for railroads and providing a high-strength surface for heavy machinery in industrial settings.
The SBM product portfolio includes:
|
| | | | | | |
| Products | | Uses | | Customers | | Key Brands |
| Building envelope products | | Structural barrier systems to prevent above and below ground water, vapor, and air infiltration of the building envelope of commercial structures, including self-adhered sheet and liquid membranes, joint sealing materials, drainage composites and waterstops | | Architects, consultants and structural engineers; specialty waterproofing, masons, dry wall contractors and general contractors; specialty distributors | | BITUTHENE®, PROCOR®, PREPRUFE®, ADPRUFE®, HYDRODUCT®, ADCOR®, SILCOR®, PERM-A-BARRIER® |
| Residential products | | Specialty roofing membranes and flexible flashings for windows, doors, decks and detail areas, including fully adhered roofing underlayments, synthetic underlayments and self-adhered flashing | | Roofing contractors, home builders and remodelers; building material distributors, lumberyards and home centers; architects and specifiers | | ICE & WATER SHIELD®, TRI-FLEX®, VYCOR® |
| Fire protection materials | | Fire protection products spray-applied to the structural steel frame, encasing and insulating the steel and protecting the building in the event of fire and enhancing the heat resistance during a fire | | Local contractors and specialty subcontractors and applicators; building materials distributors; industrial manufacturers; architects and structural engineers | | MONOKOTE® |
| Chemical grouts | | Products for repair and remediation in waterproofing applications and soil stabilization | | Contractors; specialty distributors; municipalities; and other owners of large infrastructure facilities | | DE NEEF®, HYDRO ACTIVE®, SWELLSEAL®, DE NEEF® PURe™ |
| Cementitious grouts and mortars | | Cementitious grouts and mortars used for under filling and gap filling | | Specialty contractors engaged in the repair of concrete, installation of new precast concrete elements and infrastructure repair | | BETEC® |
Darex Packaging Technologies Operating Segment (Darex)
We supply sealants and coatings to manufacturers of beverage, food and consumer metal containers and closures and industrial packaging applications. These products, designed with our significant regulatory and application knowledge, protect the packaging materials and preserve their contents. We are the global leader in can sealants.
Our growth is driven by innovation of higher performing products, continuous development of new applications, increasing demand for sustainability, rising disposable income in emerging regions, general economic growth and increasing demand for canned and bottled packaged products. Our customers trust and rely on our global technical service as well as our expertise in global regulatory compliance (including food laws) to address industry challenges and enhance their productivity. We believe we are well positioned to capture industry growth, especially in emerging regions with our global infrastructure. We seek to develop and introduce new products that add additional value to the current and future needs of our customers, such as our introduction of new BPA-NI coatings and products with oxygen scavenging functionality.
The following table sets forth Darex sales of similar products as a percentage of GCP total revenue. Between 2012 and 2014, the decrease in revenue was primarily driven by adverse currency translation in Latin America and Asia Pacific; and to a lesser extent, by lower demand for can sealants in China due to the conversion from 3-piece cans to 2-piece cans in the country.
Our Darex business is global. We compete with several large international suppliers, and regionally, with many smaller competitors. Our primary global competitors are Altana, Akzo Nobel, PPG and Valspar. Competition for our products is generally based on product performance and reliability, technical service, price and additional value-added features to address the needs of our customers, end-users and brand owners.
The following table sets forth Darex sales of similar products as a percentage of GCP total revenue.
|
| | | | | | | | | | | | | | | | | | | | |
| | 2014 | | 2013 | | 2012 |
| (In millions) | Sales | | % of GCP Revenue | | Sales | | % of GCP Revenue | | Sales | | % of GCP Revenue |
| Sealants and Closures | $ | 254.8 |
| | 17.2 | % | | $ | 262.2 |
| | 18.2 | % | | $ | 263.5 |
| | 18.7 | % |
| Coatings | 120.0 |
| | 8.1 | % | | 121.9 |
| | 8.4 | % | | 120.8 |
| | 8.6 | % |
| Total Darex Revenue | $ | 374.8 |
| | 25.3 | % | | $ | 384.1 |
| | 26.6 | % | | $ | 384.3 |
| | 27.3 | % |
The following table sets forth Darex sales by geographic region as a percentage of Darex total revenue.
|
| | | | | | | | | | | | | | | | | | | | |
| | 2014 | | 2013 | | 2012 |
| (In millions) | Sales | | % of Darex Revenue | | Sales | | % of Darex Revenue | | Sales | | % of Darex Revenue |
| North America | $ | 67.9 |
| | 18.1 | % | | $ | 64.9 |
| | 16.9 | % | | $ | 66.9 |
| | 17.4 | % |
| Europe Middle East Africa (EMEA) | 125.3 |
| | 33.4 | % | | 124.3 |
| | 32.3 | % | | 123.0 |
| | 32.0 | % |
| Asia Pacific | 92.2 |
| | 24.6 | % | | 102.0 |
| | 26.6 | % | | 101.0 |
| | 26.3 | % |
| Latin America | 89.4 |
| | 23.9 | % | | 92.9 |
| | 24.2 | % | | 93.4 |
| | 24.3 | % |
| Total Darex Revenue | $ | 374.8 |
| | 100.0 | % | | $ | 384.1 |
| | 100.0 | % | | $ | 384.3 |
| | 100.0 | % |
Darex sales of our Venezuelan subsidiary were $16.5 million, $15.6 million and $14.4 million for 2014, 2013 and 2012, respectively.
Darex consists of two product groups: sealants and closures, and coatings.
Sealants and closures
Our sealants and closures product group includes two product lines: can sealants and closures.
Can sealants provide a hermetic seal between the lid and the body of the metal can used in beverage, food, aerosol and industrial packaging. We offer our customers a complete portfolio of both water-base and solvent-base technologies to address current industry trends of thinner gauge metals and high-speed production processes.
Closures provide the seal for pry-off crowns, twist-off crowns and roll-on pilfer-proof (ROPP) and plastic caps. Our CELOX® oxygen scavenging technology protects sensitive beverages from oxygen ingress into the packaging to extend product shelf life and prevent flavor deterioration, color changes and nutrient depletion. Our SINCERA® lubricants are specifically designed for taste sensitive applications.
Coatings
Coatings protect both the interior and exterior surfaces of metal packaging containers and closures. Our coatings are engineered to prevent metal corrosion, ensure proper adhesion of sealing compounds and enhance graphic decorations on the exterior of containers and closures. We introduced our APPERTA® coatings to address increasing industry demands for non-BPA technology. We specifically formulated our SISTIAGA® coatings for technically demanding monobloc beverage and aerosol containers.
The Darex product portfolio includes:
|
| | | | | | |
| Products | | Uses | | Customers | | Key Brands |
| Sealants | | Solvent and water-based compounds for rigid metal containers that ensure a hermetic seal between the lid and the body of beverage, food, aerosol and other cans | | Packaging manufacturers and food and beverage companies | | DAREX® |
| Closures | | PVC and PVC-free compounds for metal and plastic bottle closures that are used on pry-off and twist-off metal crowns, as well as roll-on pilfer-proof and plastic closures to seal and enhance the shelf life of food and beverages in glass and plastic bottles and jars | | Manufacturers of closures for food and beverages | | DAREX®, DARAFORM®, DARASEAL®, DARABLEND®, SINCERA®, CELOX® |
| Coatings | | Products for coating metal cans, crowns and closure packaging that protect the metal against corrosion, protect the contents against the influences of metal, ensure proper adhesion of sealing compounds to metal surfaces, and provide base coats for inks and for decorative purposes | | Packaging manufacturers and food and beverage companies | | DAREX®, APPERTA®, SISTIAGA® |
SALES AND MARKETING
Our three operating segments maintain a direct sales and technical team made up of approximately 700 employees who support customers in over 100 countries worldwide. Our global team sells products under annual and multi-year global, regional, and local agreements and has developed deep segment and product application knowledge that is key to our customers' success. We believe our deep rooted understanding of our customers' needs, challenges and operations, and our ability to service at high standards throughout the world, give all three segments a competitive advantage. The majority of our products require local, regional, country and international code approvals related to use, storage and performance. Our worldwide sales and technical services teams both support and consult on committees and technical associations in order to ensure codes and product standards are consistently applied.
Our SCC and SBM sales professionals work with leading architects, engineers and contractors across the globe seeking to insure that our products are specified for use in thousands of projects annually including projects with demanding product, performance and engineering requirements ranging from the Getty Center in Los Angeles and the London Underground to Hong Kong’s Bank of China Tower and the Guggenheim Museum Bilbao in Spain, and many other landmarks. SCC provides technical services to over 10,000 concrete and cement production facilities worldwide and in many cases provides dispensing equipment at the customer's site as an integral part of the concrete and cement production process. We also use distributors for both U.S. and non-U.S. sales for the SCC and SBM segments.
We use country-based direct sales forces backed by the extensive expertise of application-specific technical customer service teams to market our Darex sealants and coatings products in over 30 countries. Our sales force has developed long-term relationships with our customers and focuses on consultative sales, technical support and key account growth programs. We have multi-year contracts with many of our largest customers. Our research and development and marketing organizations utilize a growth and innovation process to develop and continually improve our products to meet the changing needs of our customers and brand owners. To ensure full geographic coverage, our direct sales organization is further supplemented by a network of distributors and agents.
Darex provides a high level of technical service at the customer facility to ensure proper use of our products, as well as ongoing consultation with our customers to drive productivity and value for the customer throughout the value chain. Sales of our packaging products are affected by seasonal and weather-related factors including the consumption of beverages and the size and quality of food crops. These impacts are partially mitigated by the global scope of our business.
MANUFACTURING, RAW MATERIALS AND SUPPLY CHAIN
Our three operating segments share global supply chain processes, manufacturing facilities, and technical service and sales centers around the world, which provide cost efficiency.
Specialty Construction Chemicals
Specialty Building Materials
We manufacture our products in our own plants or we have third parties contract manufacture to our specifications. Our low capital intensive plants along with third-party manufacturers give us flexibility in the manner in which we service our customers and the range of technologies we can employ. Several of our plants ship internationally to leverage capacity, but most are intended to serve local demand. We have the ability to respond quickly to changes in local demand by establishing or expanding manufacturing capacity with low capital investment. With both vendors and customers we have numerous multiyear supply and purchasing agreements which help to minimize volume disruption. Seasonal variations in demand due to construction activity require effective management of our manufacturing and distribution assets. For many of our SCC customers, we install and maintain a chemical dispensing and storage system stocked with our products at their production facilities. We periodically replenish the on-site systems to give our customers instant access to our SCC products in the amounts they require twenty-four hours a day. These dispensing and storage systems have accounted for approximately 20% of our annual capital spend.
The key raw materials we use in our products are obtained from a variety of suppliers, including basic chemical and petrochemical producers. Many of our raw materials are organic chemicals derived from olefins, including specialty films and fibers. We also make significant purchases of inorganic materials such as gypsum and specialty materials, including papers, rubber and asphalt. We have multiple raw material sources and balance our purchasing requirements between local and global sources seeking to maximize performance and profitability. Global supply and demand factors, changes in currency exchange rates, and petroleum prices can significantly impact the price and availability of our key raw materials.
Our global supply chain team is constantly monitoring the global market to identify cost and productivity opportunities. We seek to leverage our overall volumes for all regions. Since we manufacture a portion of our products in emerging regions using raw materials from suppliers in the U.S., Europe and other advanced economies, changes in the values of the currencies of these emerging regions versus the U.S. dollar and the euro may adversely affect our raw material costs. This effect is partially mitigated by our reliance on local sourcing for some raw materials.
The construction business is cyclical, in response to economic conditions, as well as seasonal, driven by weather conditions. Demand for our products is primarily driven by global non-residential construction activity and U.S. residential construction activity. We seek to increase profitability and minimize the impact of cyclical downturns in regional economies by introducing technically advanced high-performance products and expanding geographically.
Darex Packaging Technologies
Our packaging products are manufactured by a network of globally integrated plants that are positioned to service our customers regionally. Our packaging products are manufactured in both large facilities to permit economies of scale and a network of smaller operations that enable customization to local conditions.
The principal raw materials for Darex products include resins, solvents, latexes (including certain food-grade raw materials), polyolefins, pigments and rubber. Multiple suppliers are generally available for each of these materials; however, some of our raw materials may be provided by single sources of supply. We seek to mitigate the risk of using single source suppliers by identifying and qualifying alternative suppliers or, for unique materials, by using alternative formulations from other suppliers. In some instances, we produce our own raw materials and intermediates.
Prices for many of our raw materials, including specialty and commodity materials such as latex, rubbers, pigments, resins and solvents, have been volatile in recent years. In response to increases in raw material costs, we generally take actions to mitigate the effect of higher costs including increasing our product prices, developing alternative formulations for our products, increasing productivity, and fixing purchase costs for certain raw materials.
Since we manufacture a substantial portion of our packaging products in emerging regions using raw materials from suppliers in the U.S., Europe and other advanced economies, changes in the values of the currencies of these emerging regions versus the U.S. dollar and the euro may adversely affect our raw material costs. This effect is partially mitigated by our reliance on local sourcing of many raw materials.
FINANCIAL INFORMATION ABOUT INDUSTRY SEGMENTS AND GEOGRAPHIC AREAS
See Note 14 Operating Segment Information in the annual Notes to the Combined Financial Statements for financial information about industry segments and geographic areas.
BACKLOG OF ORDERS
While at any given time there may be some backlog of orders, this backlog is not material in respect to our total annual sales, nor are the changes, from time to time, significant.
RESEARCH ACTIVITIES; INTELLECTUAL PROPERTY
We believe success in our industries is driven by technological superiority and innovation. Growing our businesses and maintaining our margins depends on our ability to introduce new products based on innovative technology, as well as our ability to obtain patent or other intellectual property protection. Our research and development programs emphasize development of new products and processes, improvement of existing products and processes and application of existing products and processes to new industries and uses. The programs with the highest risk-adjusted impacts garner the necessary resources for success.
Our world-class Global Technology Center in Cambridge, Massachusetts houses the consolidated product research activities of all three of our operating segment in order to accelerate commercialization. The global marketing resources that we believe are essential to a successful product development process are also located close to the research and development group in Cambridge. Overall, we have approximately 75 research and development employees based in Cambridge, Massachusetts.
Technologies developed by our Global Technology Center are customized for the regions and supported in the field by a network of Regional Technical Centers. This includes facilities in Sorocaba, Brazil; Singapore; Beijing, China; Atsugi, Japan; Epernon, France; Lügde, Germany; Norderstedt, Germany; and Heist, Belgium. Across all three segments, there are over 200 research and development and technical service employees in our Regional Technical Centers. Globally we have close to 13% of our workforce focused on technology. We believe the technical expertise, industry knowledge, and professionalism of this team are a significant differentiator for us.
We routinely file and are awarded patents in a number of countries around the world in support of our products, formulations, manufacturing processes, equipment and improvements. We also benefit from technology covered by trade secrets, including know-how and other proprietary information relating to many of our products and technologies. We have over 800 active patents and patent applications in a number of countries around the world, including approximately 150 in the U.S.
Research and development expenses were approximately $27.9 million in 2014, $24.3 million in 2013 and $24.2 million in 2012. These amounts include depreciation and amortization expenses related to research and development and expenses incurred in funding external research projects. The amount of research and development expenses relating to government- and customer-sponsored projects (rather than projects that we sponsor) was not material during these periods.
ENVIRONMENT, HEALTH AND SAFETY MATTERS
We are subject, along with other manufacturers of specialty chemicals, to stringent regulations under numerous U.S. federal, state and local and foreign environmental, health and safety laws and regulations relating to, among other things, the discharge and emission of hazardous materials into the environment, the generation, storage, handling, discharge, disposition, treatment, disposal and stewardship of hazardous substances, wastes and other materials, and the investigation and remediation of contamination. Environmental laws require that certain responsible parties, as defined in the relevant statute, fund remediation actions regardless of fault, the legality of original disposal or ownership of a disposal site. We are involved in remediation actions to address hazardous substances, wastes or other materials as required by U.S. federal, state and local and foreign laws.
We continuously seek to improve our environment, health and safety performance. We have expended funds to comply with environmental laws and regulations and expect to continue to do so in the future. The following table sets forth our expenditures in the past three years, and our estimated expenditures in 2015 and 2016, for (i) the operation and maintenance of manufacturing facilities and the disposal of wastes; (ii) capital expenditures for environmental control facilities; and (iii) site remediation:
|
| | | | | | | | | | | | | |
Year (In millions) | | Operation of Facilities and Waste Disposal | | Capital Expenditures | | Site Remediation | |
| 2012 | | $ | 6.5 |
| | $ | 1.4 |
| | $ | 0.8 |
| |
| 2013 | | 4.8 |
| | 1.9 |
| | 1.0 |
| |
| 2014 | | 4.8 |
| | 2.4 |
| | 0.6 |
| |
| 2015 | | 4.8 |
| | 2.1 |
| | — |
| * |
| 2016 | | 5.0 |
| | 1.5 |
| | — |
| * |
___________________________________________________________________________________________________________________
| |
| * | Amounts are based on site remediation matters for which sufficient information is available to estimate remediation costs. We do not have sufficient information to estimate all of our possible future remediation costs. As we receive new information, our estimate of remediation costs may change materially. |
EMPLOYEE RELATIONS
As of the date of the separation, GCP Applied Technologies will have approximately 2,850 employees of whom approximately 770 will be employed in the United States. Of our total employees, approximately 2,250 will be salaried and 600 will be hourly.
Approximately 85 of our manufacturing employees in the United States are represented for collective bargaining purposes by five different local collective bargaining groups. We have operated without a labor work stoppage for more than 10 years.
We have works councils representing the majority of our European sites serving approximately 350 employees.
PROPERTIES
We operate manufacturing plants and other facilities (including offices, warehouses, labs and other service facilities) throughout the world. Some of these plants and facilities are shared by our operating segments. We consider our major operating properties to be in good operating condition and suitable for their current use. We believe that, after taking planned expansion into account, the productive capacity of our plants and other facilities is generally adequate for current operations. We manufacture our products in our own plants or we have third parties toll manufacture to our specifications. The low capital needed for our smaller plants and third-party manufacturers gives us flexibility in the manner in which we service our customers in the local areas. The table below summarizes our primary facilities by operating segment and region:
|
| | | | | | | | | | | | | | |
| | Number of Facilities* |
| | North America | | Europe Middle East Africa (EMEA) | | Asia Pacific | | Latin America | | Total |
| Specialty Construction Chemicals | 13 |
| | 7 |
| | 22 |
| | 11 |
| | 53 |
|
| Specialty Building Materials | 5 |
| | 4 |
| | 5 |
| | — |
| | 14 |
|
| Darex Packaging Technologies | 2 |
| | 6 |
| | 5 |
| | 7 |
| | 20 |
|
___________________________________________________________________________________________________________________
* Shared facilities are counted in all applicable operating segments. The total number of facilities included in the above table, without regard to sharing amongst operating segments, is 68.
We own our principal facilities, which are located in Cambridge, Massachusetts; Epernon, France; Hamburg, Germany; and Mount Pleasant, Tennessee. The remainder of our facilities are leased, owned or held under land lease arrangements. We lease most of our sales offices. For information on our net properties and equipment by region and country, see disclosure set forth in Note 3 to the annual Combined Financial Statements.
Our corporate headquarters is located in Cambridge, Massachusetts, and we also lease and operate a shared services facility in Manila, Philippines.
|
| | | | | | | | | | | | | | |
| | Number of Facilities—Leased* |
| | North America | | Europe Middle East Africa (EMEA) | | Asia Pacific | | Latin America | | Total |
| Specialty Construction Chemicals | 4 |
| | 3 |
| | 18 |
| | 7 |
| | 32 |
|
| Specialty Building Materials | — |
| | 3 |
| | 4 |
| | — |
| | 7 |
|
| Darex Packaging Technologies | — |
| | 1 |
| | 2 |
| | 4 |
| | 7 |
|
|
| | | | | | | | | | | | | | |
| | Number of Facilities—Owned* |
| | North America | | Europe Middle East Africa (EMEA) | | Asia Pacific | | Latin America | | Total |
| Specialty Construction Chemicals | 9 |
| | 4 |
| | 4 |
| | 4 |
| | 21 |
|
| Specialty Building Materials | 5 |
| | 1 |
| | 1 |
| | — |
| | 7 |
|
| Darex Packaging Technologies | 2 |
| | 5 |
| | 3 |
| | 3 |
| | 13 |
|
___________________________________________________________________________________________________________________
* Shared facilities are counted in all applicable operating segments.
In connection with the existing W. R. Grace & Co. credit agreement, Grace entered into security agreements with respect to our Mount Pleasant, Tennessee, facility. We expect that in connection with the Company's anticipated borrowings, prior to the Distribution, the Company will enter into security agreements with respect to our United States facilities in Cambridge, Massachusetts, and Mount Pleasant, Tennessee. For a description of our material indebtedness see "Description of Material Indebtedness."
LEGAL PROCEEDINGS
We are the subject of, or a party to, a number of pending or threatened legal actions, contingencies and commitments involving a variety of matters, including laws and regulations relating to the environment. We do not believe that the ultimate resolution of any of these legal actions is likely to be material to GCP’s financial condition, results of operations, or cash flows.
THE SEPARATION AND DISTRIBUTION
General
On January 12, 2016, the board of directors of W. R. Grace & Co. approved the distribution to holders of Grace common stock of all of the shares of common stock ("GCP common stock") of GCP Applied Technologies Inc. (the "Company"). The Company was formed as an indirect wholly owned subsidiary of W. R. Grace & Co. and is currently a direct wholly-owned subsidiary of W. R. Grace & Co.—Conn. (“Grace Conn”), a direct wholly owned subsidiary of W. R. Grace & Co. At the time of the distribution, the Company will hold the business, assets and liabilities associated with the Grace Construction Products operating segment and the Darex Packaging Technologies business ("GCP"). Prior to the distribution to Grace shareholders, Grace Conn will first distribute 100% of the outstanding GCP common stock to its direct parent W. R. Grace & Co. (which we refer to as the “Internal Distribution”), and second, W. R. Grace & Co. will distribute 100% of the outstanding GCP common stock to holders of Grace common stock as of the record date.
The distribution of GCP common stock as described in this information statement is subject to the satisfaction or waiver of certain conditions. We cannot provide any assurances W. R. Grace & Co. will complete the distribution. For a more detailed description of these conditions, see “Conditions to the Distribution,” below.
Reasons for the Separation
On February 5, 2015, Grace announced its intent to separate GCP into an independent publicly-traded company. The W. R. Grace & Co. board of directors believes that separating GCP from Grace’s other businesses through the distribution is in the best interests of Grace and its shareholders and has concluded the separation will provide each of Grace and the Company with a number of material opportunities and benefits, including the following:
| |
| • | Enhanced Strategic Focus — Create two strong, more focused operating companies, each with industry‑leading customer and technology positions, with Grace well-positioned to pursue distinct growth opportunities in the catalysts and materials businesses, and the Company well-positioned to pursue distinct growth opportunities in the specialty construction chemicals, specialty building materials and packaging products businesses; |
| |
| • | Simplified Operating Structures — Allow management of each company to concentrate that company’s resources wholly on its particular industry segments, customers and core businesses, with greater ability to anticipate and respond to changing industry conditions and new opportunities. Each company will focus on cost productivity and optimizing functional support for its core operations, with greater management focus on customized strategies that can deliver long-term shareholder value; |
| |
| • | Optimized Capital Structures and Financial Flexibility — Establish a capital structure appropriate for each company’s business needs, with each company having direct access to the debt and equity markets to pursue its distinct growth, acquisition and joint venture opportunities eliminating competition for capital between the two. The separation will provide each company with an independent equity currency that will (1) facilitate the ability of each company to consummate future acquisitions using its common stock if required and (2) facilitate incentive compensation arrangements for employees that are more directly tied to the performance of each company’s business, and enhance employee hiring and retention by, among other things, improving the alignment of management and employee incentives with performance and growth objectives; and |
| |
| • | Investor Choice — Provide investors with a more targeted investment opportunity in each company that offers different investment and business characteristics, including different growth opportunities, business models, capital requirements and financial returns. This will allow investors to evaluate the separate and distinct merits, performance and future prospects of each company. |
The Number of Shares You Will Receive
For each share of Grace common stock you own at 5:00 p.m. Eastern Time on January 27, 2016, the record date, you will receive one share of GCP common stock on the distribution date.
Treatment of Fractional Shares
The distribution agent will not distribute any fractional shares of GCP common stock to Grace stockholders. Instead, as soon as practicable on or after the distribution date, the distribution agent will aggregate fractional shares into whole shares, sell the whole shares in the open market and distribute the aggregate cash proceeds from the sales, net of brokerage fees and other costs, pro rata to each holder who would otherwise have been entitled to receive a fractional share in the distribution. The distribution agent will determine when, how, through which broker-dealers and at what prices to sell the aggregated fractional shares. Recipients of cash in lieu of fractional shares will not be entitled to any interest on the amounts of payments made in lieu of fractional shares. The receipt of cash in lieu of fractional shares generally will be taxable to the recipient stockholders for U.S. federal income tax purposes as described below in “Material U.S. Federal Income Tax Consequences.”
When and How You Will Receive the Distribution
W. R. Grace & Co. will distribute the shares of GCP common stock on February 3, 2016, to holders of record of Grace common stock on the record date. The distribution is expected to occur following the NYSE market closing on the distribution date. Wells Fargo Shareowner Services will serve as transfer agent and registrar for the GCP common stock and as distribution agent in connection with the distribution.
If you own Grace common stock as of 5:00 p.m. Eastern Time on the record date, the shares of GCP common stock that you are entitled to receive in the distribution will be issued electronically, as of the distribution date, to your account as follows:
| |
| • | Registered Shareholders. If you own your shares of Grace stock directly, either in book-entry form through an account at Grace’s transfer agent and/or if you hold paper stock certificates, you will receive your shares of GCP common stock by way of direct registration in book-entry form. Registration in book-entry form is a method of recording stock ownership when no physical paper share certificates are issued to shareholders, as is the case in this distribution. |
On or shortly after the distribution date, the distribution agent will mail to you an account statement that indicates the number of shares of GCP common stock that have been registered in book-entry form in your name.
Shareholders having any questions concerning the mechanics of having shares of our common stock registered in book-entry form may contact Wells Fargo Shareowner Services at the address set forth in “Questions and Answers About the Separation and Distribution” in this information statement.
| |
| • | Beneficial Shareholders. Many Grace shareholders hold their shares of Grace common stock beneficially through a bank or brokerage firm. In such cases, the bank or brokerage firm would be said to hold the stock in “street name” and ownership would be recorded on the bank or brokerage firm’s books. If you hold your Grace common stock through a bank or brokerage firm, your bank or brokerage firm will credit your account for the shares of GCP common stock that you are entitled to receive in the distribution. If you have any questions concerning the mechanics of having securities held in “street name,” we encourage you to contact your bank or brokerage firm. |
Treatment of Equity-Based Compensation
The Employee Matters Agreement to be entered into among Grace, Grace Conn, and the Company will provide for the conversion of the outstanding awards granted under the Grace equity compensation programs into adjusted awards relating to shares of Grace common stock and/or GCP common stock. The adjusted awards generally will be subject to the same vesting conditions and other terms that applied to the original Grace award immediately before the separation. Effective as of the separation, all awards converted into awards relating to shares of GCP common stock will be assumed by, and become the obligation of, the Company.
Each Grace stock option granted prior to January 1, 2015 and held by a current employee as of the separation date will be converted into an adjusted Grace stock option and a Company stock option. The exercise price and number of shares subject to each stock option will be adjusted to preserve the aggregate intrinsic value of the original Grace stock option as measured immediately before and immediately after the separation, subject to rounding. Each Grace stock option granted prior to January 1, 2015 and held by a former employee will be converted into an adjusted Grace stock option, with the exercise price and the number of shares subject to such
stock option adjusted to preserve the aggregate intrinsic value of the original Grace stock option as measured immediately before and immediately after the separation, subject to rounding.
Each Grace stock option and restricted stock unit granted on or after January 1, 2015 will be converted into either a corresponding adjusted Grace award or a Company award, depending on whether the original Grace award is held by (1) an employee who will be employed by Grace following the separation or a former employee, or (2) an employee who will be employed by the Company following the separation. The number of shares subject to the award (and in the case of stock options, the exercise price of the award) will be adjusted to preserve the aggregate intrinsic value of the original Grace award, as measured immediately before and immediately after the separation, subject to rounding.
Grace performance-based units granted in respect of 2014 (which we refer to as “2014 Grace PBU awards”) will be divided into two portions, representing (1) the portion of the performance period that has elapsed between the beginning of the performance period on January 1, 2014 and December 31, 2015 and (2) the portion of the performance period between January 1, 2016 and the end of the performance period on December 31, 2016. Performance conditions with respect to the first portion of the 2014 Grace PBU award will be deemed satisfied based on the actual performance of Grace through the separation, and performance conditions with respect to the second portion of the 2014 Grace PBU award will be deemed satisfied at target as of the separation. The number of shares of Grace common stock underlying the 2014 Grace PBU awards will be established once such performance conditions are deemed satisfied.
Holders of 2014 Grace PBU awards granted in 2014 who are current employees will retain their 2014 Grace PBU awards, and, pursuant to the adjustment provisions of the Grace equity plan, will also receive restricted stock units of the Company in an amount that reflects the distribution of GCP common stock to Grace shareholders, determined by applying the distribution ratio to the number of shares of Grace common stock underlying their original 2014 Grace PBU awards. Together, these Grace and Company awards are intended to preserve the value of a holder’s original 2014 Grace PBU award, as measured immediately before and immediately after the distribution. The Grace and Company awards will continue to be subject to substantially the same terms and conditions (other than performance-vesting conditions) that applied to the original 2014 Grace PBU awards, and will vest on the orignal settlement date of the 2014 Grace PBU award, generally subject to the award holder’s continued employment through that date. Any 2014 Grace PBU awards granted in 2015 and any 2014 Grace PBU awards held by former employees will be adjusted (with performance-vesting conditions deemed satisfied as described above) to preserve the value of the original 2014 Grace PBU awards, as measured immediately before and immediately after the distribution. These adjusted Grace 2014 PBU awards will continue to be subject to substantially the same terms and conditions (other than performance-vesting conditions) that applied to the original 2014 Grace PBU awards.
Grace performance-based units granted in 2013 (which we refer to as “2013 Grace PBU awards”) will be converted into either a corresponding adjusted Grace award or a Company award, depending on whether the original Grace award is held by (1) an employee who will be employed by Grace following the separation or a former employee, or (2) an employee who will be employed by the Company following the separation. The number of shares subject to the award will be adjusted to preserve the aggregate intrinsic value of the original Grace award, as measured immediately before and immediately after the separation, subject to rounding.
Grace restricted stock awards held by non-employee directors will be canceled immediately prior to the record date and replaced with an adjusted Grace restricted stock award following the separation. The number of shares subject to the award will be adjusted to preserve the aggregate intrinsic value of the original Grace award, as measured immediately before and immediately after the separation, subject to rounding.
Grace deferred share awards held by Grace employees and non-employee directors will be converted into an adjusted Grace award. The number of shares subject to the award will be adjusted to preserve the aggregate intrinsic value of the original Grace award, as measured immediately before and immediately after the separation, subject to rounding.
If local regulations outside the United States do not permit use of the adjustment method described above or would cause an adverse effect for equity award holders, a compliant alternative adjustment method will be used. In such cases, affected employees typically will receive adjusted awards in the equity of their post-distribution employer or an amount in cash equal to the intrinsic value of the award.
Results of the Distribution
After our separation from Grace, the Company will be an independent, publicly traded company. Immediately following the distribution, we expect the Company to have approximately 5,100 shareholders of record, based on the number of registered shareholders of Grace common stock on January 11, 2016, and approximately 70.5 million shares of GCP common stock outstanding. The actual number of shares of GCP common stock to be distributed will be determined on the record date and will reflect any exercise of Grace stock options and the vesting and settlement of Grace performance-based units (PBUs) and Grace restricted stock units prior to the record date for the distribution.
Before the distribution, the Company will enter into a Separation and Distribution Agreement and several other agreements with Grace to effect the separation and provide a framework for the Company's relationship with Grace after the separation. These agreements will provide for the allocation between the Company and Grace of Grace’s assets, liabilities and obligations subsequent to the separation (including with respect to transition services, employee matters, intellectual property matters and tax matters).
For a more detailed description of these agreements, see the section entitled “Certain Relationships and Related Transactions-Agreements with Grace” included elsewhere in this information statement.
The distribution will not affect the number of outstanding shares of Grace common stock or any other rights of Grace shareholders.
Incurrence of Debt
In accordance with the expected plan of separation to be set forth in the Separation and Distribution Agreement, prior to the separation, we expect that the Company will incur up to $800 million of new debt in two separate tranches. We expect the Company to incur the first tranche of new debt prior to the Internal Distribution in an amount of approximately $525 million and to distribute the proceeds of this first tranche (approximately $500 million) to Grace Conn prior to the Internal Distribution. We expect the Company to incur the second tranche of new debt after the Internal Distribution and prior to the distribution of GCP common stock to Grace shareholders in an amount of approximately $275 million and to distribute the proceeds of this second tranche (approximately $250 million) to Grace immediately prior to the distribution of GCP common stock to Grace shareholders.
Market for GCP Common Stock
There is not currently a public market for GCP common stock. A condition to the distribution is the listing on the NYSE of GCP common stock. We have applied to have the GCP common stock authorized for listing on the NYSE under the ticker symbol “GCP,” subject to official notice of distribution.
Trading Between Record Date and Distribution Date
Beginning on, or shortly before, the record date and continuing up to and including the distribution date, we expect there will be two markets in Grace common stock: a “regular-way” market and an “ex-distribution” market. Shares of Grace common stock that trade on the “regular-way” market will trade with an entitlement to receive shares of GCP common stock in the distribution. Shares that trade on the “ex-distribution” market will trade without an entitlement to receive shares of GCP common stock in the distribution. Therefore, if you sell shares of Grace common stock in the “regular-way” market after 5:00 p.m. Eastern Time on the record date and up to and including through the distribution date, you will be selling your right to receive shares of GCP common stock in the distribution. If you own shares of Grace common stock at 5:00 p.m. Eastern Time on the record date and sell those shares in the “ex-distribution” market, up to and including through the distribution date, you will still receive the shares of GCP common stock that you would be entitled to receive in respect of your ownership, as of the record date, of the shares of Grace common stock that you sold.
Furthermore, beginning on or shortly before the record date and continuing up to and including the distribution date, we expect there will be a “when-issued” market in GCP common stock. “When-issued” trading refers to a sale or purchase made conditionally because the security has been authorized but not yet issued. The “when-issued” trading market will be a market for shares of GCP common stock that will be distributed to Grace shareholders on the distribution date. If you own shares of Grace common stock at 5:00 p.m. Eastern Time on the record date, you would be entitled to receive shares of our common stock in the distribution. You may trade this entitlement to receive shares of GCP common stock, without trading the shares of Grace common stock you own,
in the “when-issued” market. On the first trading day following the distribution date, we expect “when-issued” trading with respect to GCP common stock will end and “regular-way” trading will begin.
Conditions to the Distribution
We expect the distribution will be effective on February 3, 2016, the distribution date, provided that, among other conditions described in the Separation and Distribution Agreement, the following conditions shall have been satisfied or waived by Grace:
| |
| • | the SEC shall have declared effective the registration statement on Form 10, of which this information statement is a part, under the Securities Exchange Act of 1934, as amended; no order suspending the effectiveness of the registration statement shall be in effect; and no proceedings for such purpose shall have been instituted or threatened by the SEC; |
| |
| • | Grace shall have received an opinion of counsel, in form and substance satisfactory to Grace in its sole discretion, regarding the U.S. federal income tax treatment of the distribution and certain related transactions; |
| |
| • | the actions and filings necessary or appropriate under applicable U.S. federal, U.S. state or other securities laws or blue sky laws and the rules and regulations thereunder shall have been taken or made, and, where applicable, shall have become effective or been accepted; |
| |
| • | no order, injunction or decree issued by any court or agency of competent jurisdiction or other legal restraint or prohibition preventing the consummation of the separation, the distribution or any of the transactions related thereto shall be in effect; |
| |
| • | the Company shall have entered into the financing transactions described in the Form 10 and contemplated to occur on or prior to the distribution date and the respective financings thereunder shall have been consummated; and such financing arrangements shall be in full force and effect immediately prior to the distribution; |
| |
| • | the GCP common stock shall have been accepted for listing on the NYSE, subject to official notice of distribution; |
| |
| • | any government approvals and other material consents necessary to effect the separation, the distribution and the other transactions contemplated by the Separation and Distribution Agreement shall have been obtained and be in full force and effect; and |
| |
| • | no other events or developments shall exist or shall have occurred that, in the judgment of the W. R. Grace & Co. board of directors, in its sole and absolute discretion, make it inadvisable to effect the separation, the distribution or the transactions contemplated by the Separation and Distribution Agreement or the ancillary agreements described therein. |
The fulfillment of the foregoing conditions will not create any obligations on the part of W. R. Grace & Co. to effect the distribution, and the W. R. Grace & Co. board of directors has reserved the right, in its sole discretion, to abandon, modify or change the terms of the distribution, including by accelerating or delaying the timing of the consummation of all or part of the distribution, at any time prior to the distribution date. In the event the W. R. Grace & Co. board of directors determines to abandon, modify or change the terms of the distribution, the Company and W. R. Grace & Co. intend to promptly issue a press release and file a Current Report on Form 8-K to report such event.
Reason for Furnishing This Information Statement
This information statement is being furnished solely to provide information to Grace shareholders who are entitled to receive shares of GCP common stock in the distribution. The information statement is not, and is not to be construed as, an inducement or encouragement to buy, hold or sell GCP common stock or any other securities of the Company. We believe the information contained in this information statement is accurate as of the date set forth on the cover. Changes may occur after that date and neither Grace nor the Company undertakes any obligation to update such information except in the normal course of its respective public disclosure obligations.
MATERIAL U.S. FEDERAL INCOME TAX CONSEQUENCES
The following is a discussion of material U.S. federal income tax consequences of the distribution of GCP common stock to “U.S. Holders” (as defined below) of Grace common stock. This summary is based on the Code, the U.S. Treasury regulations promulgated thereunder, rulings and other administrative pronouncements issued by the IRS, and judicial decisions, all as in effect on the date of this information statement, and all of which are subject to change at any time, possibly with retroactive effect. No assurance can be given that the IRS will not assert, or that a court will not sustain, a position contrary to any of the tax consequences described below. This discussion applies only to U.S. Holders (defined below) of shares of Grace common stock who hold such shares as a capital asset within the meaning of Section 1221 of the Code (generally, property held for investment). This discussion is based upon the assumption that the distribution, together with certain related transactions, will be consummated in accordance with the separation documents and as described in this information statement. This summary is for general information only and is not tax advice. It does not discuss all aspects of U.S. federal income taxation that may be relevant to a particular holder in light of its particular circumstances or to holders subject to special rules under the Code (including, but not limited to, insurance companies, brokers-dealers, tax-exempt organizations, financial institutions, partners in partnerships that hold Grace common stock, traders in securities who elect to apply a mark-to-market method of accounting, mutual funds, pass‑through entities and investors in such entities, shareholders who hold Grace common stock as part of a “hedge,” “straddle,” “conversion,” “synthetic security,” “integrated investment” or “constructive sale transaction,” holders who are liable for alternative minimum tax, individuals who receive GCP common stock upon the exercise of employee stock options or otherwise as compensation or any holders who actually or constructively own 5% or more of Grace common stock). This discussion does not address any tax consequences arising under the unearned Medicare contribution tax pursuant to the Health Care and Education Reconciliation Act of 2010, nor does it address any tax considerations under state, local or foreign laws or U.S. federal laws other than those pertaining to the U.S. federal income tax.
If a partnership, including for this purpose any entity or arrangement that is treated as a partnership for U.S. federal income tax purposes, holds Grace common stock, the tax treatment of a partner in the partnership will generally depend upon the status of the partner and the activities of the partnership. An investor that is a partnership and the partners in such partnership should consult their tax advisors about the U.S. federal income tax consequences of the distribution.
For purposes of this discussion, a “U.S. Holder” is any beneficial owner of Grace common stock that is, for U.S. federal income tax purposes: (i) an individual who is a citizen or a resident of the United States; (ii) a corporation, or other entity taxable as a corporation for U.S. federal income tax purposes, created or organized under the laws of the United States, any state thereof or the District of Columbia; (iii) an estate, the income of which is subject to U.S. federal income taxation regardless of its source; or (iv) a trust, if (a) a court within the United States is able to exercise primary supervision over its administration and one or more United States persons have the authority to control all of its substantial decisions or (b) it has a valid election in place under applicable Treasury Regulations to be treated as a United States person.
THE FOLLOWING DISCUSSION IS A SUMMARY OF MATERIAL U.S. FEDERAL INCOME TAX CONSEQUENCES OF THE DISTRIBUTION UNDER CURRENT LAW AND IS FOR GENERAL INFORMATION ONLY. ALL HOLDERS SHOULD CONSULT THEIR OWN TAX ADVISORS AS TO THE PARTICULAR CONSEQUENCES OF THE DISTRIBUTION TO THEM, INCLUDING THE APPLICATION AND EFFECT OF U.S. FEDERAL, STATE, LOCAL AND FOREIGN TAX LAWS.
Neither Grace nor the Company has sought (nor do they intend to seek) a ruling from the IRS with respect to the treatment of the distribution and certain related transactions for U.S. federal income tax purposes and there can be no assurance that the IRS will not assert that the distribution and/or certain related transactions are taxable. It is a condition to the distribution that Grace receive an opinion of counsel, in form and substance satisfactory to Grace in its sole discretion, regarding the U.S. federal income tax treatment of the distribution and certain related transactions. The opinion of counsel will be based upon and rely on, among other things, certain facts and assumptions, as well as certain representations, statements and undertakings of the Company and Grace (including those relating to the past and future conduct of the Company and Grace). If any of these representations, statements or undertakings are, or become, inaccurate or incomplete, or if the Company or Grace breaches any of its respective covenants in the separation documents, the opinion of counsel may be
invalid and the conclusions reached therein could be jeopardized. An opinion of counsel is not binding on the IRS or the courts.
Notwithstanding receipt by Grace of the opinion of counsel, the IRS could assert that the distribution and certain related transactions fail to qualify under applicable Internal Revenue Code provisions. If the IRS were successful in taking this position, Grace, the Company and holders of Grace common stock could be subject to significant U.S. federal income tax liability. Please refer to “-Material U.S. Federal Income Tax Consequences if the Distribution Fails to Qualify Under Applicable Internal Revenue Code Provisions” below.
Assuming the distribution and certain related transactions qualify under Section 355 and other applicable Internal Revenue Code provisions, for U.S. federal income tax purposes, (i) no gain or loss will be recognized by, and no amount will be includible in the income of Grace as a result of the distribution, other than gain or income arising in connection with certain transactions undertaken in connection with the separation and distribution (including with respect to a portion of the funds transferred (A) to Grace Conn from the Company and (B) to W. R. Grace & Co. from the Company) and with respect to any “excess loss account” or “intercompany transaction” required to be taken into account by W. R. Grace & Co. under U.S. Treasury regulations relating to consolidated federal income tax returns; (ii) no gain or loss will be recognized by (and no amount will be included in the income of) U.S. Holders of Grace common stock upon the receipt of GCP common stock in the distribution, except with respect to any cash received in lieu of fractional shares of GCP common stock (as described below); (iii) the aggregate tax basis of the Grace common stock and the GCP common stock received in the distribution (including any fractional share interest in GCP common stock for which cash is received) in the hands of each U.S. Holder of Grace common stock after the distribution will equal the aggregate basis of Grace common stock held by the U.S. Holder immediately before the distribution, allocated between the Grace common stock and the GCP common stock (including any fractional share interest in GCP common stock for which cash is received) in proportion to the relative fair market value of each on the date of the distribution; and (iv) the holding period of the GCP common stock received by each U.S. Holder of Grace common stock in the distribution (including any fractional share interest in GCP common stock for which cash is received) will generally include the holding period at the time of the distribution for the Grace common stock with respect to which the distribution is made.
A U.S. Holder of Grace common stock who receives cash in lieu of a fractional share of GCP common stock in the distribution will be treated as having sold such fractional share for cash, and will recognize capital gain or loss in an amount equal to the difference between the amount of cash received and such U.S. Holder’s adjusted tax basis in such fractional share. Such gain or loss will generally be long-term capital gain or loss if the U.S. Holder’s holding period for its Grace common stock exceeds one year at the time of distribution.
If a U.S. Holder of Grace common stock holds different blocks of Grace common stock (generally shares of Grace common stock purchased or acquired on different dates or at different prices), such holder should consult its tax advisor regarding the determination of the basis and holding period of shares of GCP common stock received in the distribution in respect of particular blocks of Grace common stock.
U.S. Treasury regulations require certain U.S. Holders who receive shares of GCP common stock in the distribution to attach to such U.S. Holder’s federal income tax return for the year in which the distribution occurs a detailed statement setting forth certain information relating to the tax-free nature of the distribution.
Material U.S. Federal Income Tax Consequences if the Distribution Fails to Qualify Under Applicable Internal Revenue Code Provisions.
As discussed above, W. R. Grace & Co. has not sought and does not intend to seek a ruling from the IRS with respect to the treatment of the distribution and certain related transactions for U.S. federal income tax purposes. Notwithstanding receipt by W. R. Grace & Co. of an opinion of counsel, the IRS could assert that the distribution fails to qualify under applicable Internal Revenue Code provisions. If the IRS were successful in taking this position, the consequences described above would not apply and W. R. Grace & Co., the Company and W. R. Grace & Co. shareholders could be subject to significant U.S. federal income tax liability. In addition, certain events that may or may not be within the control of W. R. Grace & Co. or the Company could cause the distribution and certain related transactions to fail to qualify under applicable Internal Revenue Code provisions. Depending on the circumstances, the Company may be required to indemnify W. R. Grace & Co. for taxes (and certain related losses) resulting from the distribution and certain related transactions failing to qualify under applicable Internal Revenue Code provisions.
If the distribution is determined to fail to qualify under applicable Internal Revenue Code provisions, in general, W. R. Grace & Co. would recognize taxable gain as if it had sold the GCP common stock in a taxable sale for its fair market value (unless W. R. Grace & Co. and the Company jointly make an election under Section 336(e) of the Code with respect to the distribution, in which case, in general, (i) the Grace group would recognize taxable gain as if the Company had sold all of its assets in a taxable sale in exchange for an amount equal to the fair market value of the GCP common stock and the assumption of all the Company’s liabilities and (ii) the Company would obtain a related step up in the basis of its assets) and W. R. Grace & Co. shareholders who receive GCP common stock in the distribution would be subject to tax as if they had received a taxable distribution equal to the fair market value of such shares.
Even if the distribution were otherwise to qualify under Section 355 of the Code, it may result in taxable gain at the entity level under Section 355(e) of the Code if the distribution were later deemed to be part of a plan (or series of related transactions) pursuant to which one or more persons acquire, directly or indirectly, shares representing a 50% or greater interest (by vote or value) in W. R. Grace & Co. or the Company. For this purpose, any acquisitions of shares of Grace common stock or GCP common stock within the period beginning two years before the separation and ending two years after the separation are presumed to be part of such a plan, although the Company or W. R. Grace & Co. may be able to rebut that presumption.
In connection with the distribution, the Company and Grace will enter into a Tax Sharing Agreement pursuant to which the Company will be responsible for certain liabilities and obligations following the distribution. In general, under the terms of the Tax Sharing Agreement, if the distribution and certain related transactions fail to qualify under Section 355 and other applicable Internal Revenue Code provisions (whether by application of Section 355(e) of the Code or otherwise) and if such failure were the result of actions taken after the distribution by the Company, then the Company will be responsible for all taxes imposed on Grace or the Company to the extent such taxes result from such actions. Further, if such failure were the result of any acquisition of shares of GCP common stock or assets, or of any of the Company’s representations, statements or undertakings being incorrect, incomplete or breached, the Company generally will be responsible for all taxes imposed as a result of such acquisition or breach. For a discussion of the Tax Sharing Agreement, see “Certain Relationships and Related Transactions-Agreements with Grace-Tax Sharing Agreement.” The Company’s indemnification obligations to Grace under the Tax Sharing Agreement are not expected to be limited in amount or subject to any cap. If the Company is required to pay any taxes or indemnify Grace and its subsidiaries and their respective officers and directors under the circumstances set forth in the Tax Sharing Agreement, the Company may be subject to substantial liabilities.
Backup Withholding and Information Reporting.
Payments of cash to U.S. Holders of Grace common stock in lieu of fractional shares of GCP common stock may be subject to information reporting and backup withholding (currently, at a rate of 28%), unless such holder delivers a properly completed IRS Form W-9 certifying such holder’s correct taxpayer identification number and certain other information, or otherwise establishing a basis for exemption from backup withholding. Backup withholding is not an additional tax. Any amounts withheld under the backup withholding rules may be refunded or credited against a U.S. Holder’s U.S. federal income tax liability provided that the required information is timely furnished to the IRS.
THE FOREGOING DISCUSSION IS A SUMMARY OF MATERIAL U.S. FEDERAL INCOME TAX CONSEQUENCES OF THE DISTRIBUTION UNDER CURRENT LAW AND IS FOR GENERAL INFORMATION ONLY. THE FOREGOING DISCUSSION DOES NOT PURPORT TO ADDRESS ALL U.S. FEDERAL INCOME TAX CONSEQUENCES OF THE DISTRIBUTION OR TAX CONSEQUENCES THAT MAY ARISE UNDER THE TAX LAWS OF OTHER JURISDICTIONS OR THAT MAY APPLY TO PARTICULAR CATEGORIES OF SHAREHOLDERS. HOLDERS SHOULD CONSULT THEIR OWN TAX ADVISORS AS TO THE PARTICULAR TAX CONSEQUENCES OF THE DISTRIBUTION TO THEM, INCLUDING THE APPLICATION OF U.S. FEDERAL, STATE, LOCAL AND FOREIGN TAX LAWS, AND THE EFFECT OF POSSIBLE CHANGES IN TAX LAWS THAT MAY AFFECT THE TAX CONSEQUENCES DESCRIBED ABOVE.
DIVIDEND POLICY
While remaining at the discretion of the Company's board of directors, the Company does not anticipate paying cash dividends on GCP common stock in the immediate future.
CAPITALIZATION
The following table sets forth our cash and cash equivalents and capitalization as of September 30, 2015, on a historical and on a pro forma basis to give effect to the separation and distribution and the transactions related to the separation and distribution as if they occurred on September 30, 2015. Explanation of the pro forma adjustments made to our historical combined financial statements can be found under "Unaudited Pro Forma Combined Financial Statements." The following table should be reviewed in conjunction with "Unaudited Pro Forma Combined Financial Statements," "Management's Discussion and Analysis of Financial Condition and Results of Operations" and our historical combined financial statements and accompanying notes included elsewhere in this information statement.
|
| | | | | | | | |
| | | September 30, 2015 |
| (in millions) (unaudited) | | Historical | | Pro forma |
| Cash and cash equivalents | | $ | 99.9 |
| | $ | 98.3 |
|
| Borrowings | | | | |
| Current borrowings | | 59.0 |
| | 24.3 |
|
| Long-term borrowings | | — |
| | 795.9 |
|
| Total borrowings | | 59.0 |
| | 820.2 |
|
| Preferred stock subject to mandatory redemption | | — |
| | — |
|
| Total borrowings and preferred stock subject to mandatory redemption | | 59.0 |
| | 820.2 |
|
| Equity: | | | | |
| Net parent investment | | 589.1 |
| | — |
|
| Common stock, par value | | — |
| | 0.8 |
|
| Accumulated deficit | | — |
| | (140.9 | ) |
| Accumulated other comprehensive loss | | (87.1 | ) | | (87.1 | ) |
| Total GCP equity (accumulated deficit) | | 502.0 |
| | (227.2 | ) |
| Total capitalization | | $ | 561.0 |
| | $ | 593.0 |
|
MANAGEMENT
Executive Officers Following the Distribution
The following table sets forth information regarding the individuals who are expected to serve as executive officers of the Company following the distribution. While these individuals are currently employees of Grace and Mr. Poling is an executive officer of Grace, following the separation, none of these individuals will continue to be employees or officers of Grace.
|
| | | | |
| Name | | Age | | Position |
| G. E. Poling | | 60 | | President and Chief Executive Officer |
| D. P. Freeman | | 52 | | Vice President and Chief Financial Officer |
| J. W. Kapples | | 56 | | Vice President, General Counsel and Secretary |
| Z. Mahmood | | 48 | | Vice President and President, SBM and Global Operations |
| W. J. McCall | | 61 | | Vice President and Chief Human Resources Officer |
Gregory E. Poling has been employed with Grace since 1977. He has held positions in sales, marketing, business development and general management across all of Grace's operating segments. From 1977 to 1999, Mr. Poling held positions of increasing responsibility in Grace's construction products business. In 2005, Mr. Poling became President of Grace Davison (one of Grace's two operating segments at the time which included Darex) and a Vice President of W. R. Grace & Co. On November 3, 2011, Mr. Poling was elected President and Chief Operating Officer of W. R. Grace & Co.
Dean P. Freeman joined Grace in September 2015 as Vice President, GCP Finance. He previously served as Interim Chief Executive Officer and President, from January to May 2014, and as Executive Vice President and Chief Financial Officer, from 2012 to October 2014, at Watts Water Technologies, a global provider of products that improve the quality, conservation, safety, and control of water in residential, commercial and industrial markets. Mr. Freeman served as Senior Vice President of Finance and Treasurer of Flowserve Corporation from 2009 to 2011 and as Vice President, Finance and Chief Financial Officer of the Flowserve Pump Division from 2006 to 2009. Flowserve is a global provider of fluid motion and control products and services, producing engineered and industrial pumps, seals and valves as well as a range of related flow management services. Prior to Flowserve, Mr. Freeman served as Chief Financial Officer, Europe for The Stanley Works Corporation. Mr. Freeman has also served in financial executive and management roles of progressive responsibility with United Technologies Corporation and SPX Corporation.
John W. Kapples joined Grace in December 2015 as Vice President and General Counsel, GCP. He previously served as Vice President at Medtronic plc from February 2015 to August 2015, where he assisted with legal transition and integration matters related to Medtronic's acquisition of Covidien plc. From 2006 to 2015, Mr. Kapples served as Vice President and Secretary at Covidien, a medical device and pharmaceutical company. Prior to Covidien, Mr. Kapples served in management and legal roles of increasing responsibility at Raytheon Company.
Zain Mahmood joined Grace in November 2015 as Vice President and President, SBM and Global Operations, GCP. He previously served from 2013 to 2015 as President and CEO at Demilec Inc., a polyurethane-based insulation and coatings manufacturer. From 2007 to 2012, Mr. Mahmood served as President and CEO at Parkson Corporation, a water and wastewater treatment equipment manufacturer. Prior to Parkson, Mr. Mahmood served in management roles of increasing responsibility with Johns Manville Corporation, ABB and AlliedSignal (currently Honeywell).
William J. McCall has served as Vice President Human Resources of Grace since 2010. He previously served as Vice President Talent Management, from 2009 to 2010, and Vice President Human Resources, Laboratory Products Group, from 2007 to 2009 at Thermo Fisher Scientific, Inc. Prior to Thermo Fisher, he served as a human resources executive at Cabot Corporation from 2005 to 2007 and in human resources positions of increasing responsibility at Boehringer Ingelheim Pharmaceuticals, Inc.
Board of Directors Following the Distribution
The following table sets forth information regarding those individuals who are expected to serve on the Company’s board of directors following the completion of the separation. Janice Henry was elected a director in January 2016 and all of the nominees will be presented to Grace as the Company’s sole shareholder for election prior to the separation.
|
| | | | | | |
| Name | | Age | | Position | | Class |
| M. J. Avedon | | 54 | | Director | | II |
| R. C. Cambre | | 77 | | Non-Executive Chairman of the Board and Director | | III |
| M. A. Fox | | 68 | | Director | | III |
| J. K. Henry | | 64 | | Director | | I |
| P. J. Mason | | 65 | | Director | | II |
| E. Mora | | 55 | | Director | | II |
| G. E. Poling | | 60 | | President, Chief Executive Officer and Director | | I |
| D. R. Shepherd | | 64 | | Director | | I |
Marcia J. Avedon has served as Senior Vice President of Human Resources, Communications, and Corporate Affairs for Ingersoll Rand, a global diversified industrial company, since 2007. In this role, she leads global human resources, public affairs, corporate social responsibility, communications, and brand management. She has served as a director of Lincoln National Corporation, and currently serves on the boards of several policy, professional, and nonprofit organizations. Dr. Avedon is the inaugural chair of the University of South Carolina’s Center for Executive Succession and chairs the Board of Advisors for the Belk College of Business, University of North Carolina at Charlotte. Dr. Avedon brings to our board her strong business operating experience across the industrial, healthcare, consumer products, and professional services sectors. She has led businesses through large-scale organizational changes, including mergers, acquisitions, divestitures, and spin-offs.
Ronald C. Cambre served as Chairman of the Board and Chief Executive Officer of Newmont Mining Corporation until his retirement as CEO in 2000 and Chairman in 2001. He joined Newmont as Vice Chairman and CEO in 1993. Mr. Cambre is a director since 1998 of W. R. Grace & Co. and served as Chairman of the Board of McDermott International, Inc. (an engineering and construction company) and as a director of Cliffs Natural Resources Inc. until 2011. Mr. Cambre brings to our board his extensive background in leadership and management at the most senior level in major corporations, his deep understanding of international business and global energy issues and his governance and oversight experience developed as a director of multiple public companies.
Marye Anne Fox retired in 2012 as Chancellor of the University of California San Diego (UCSD) and Distinguished Professor of Chemistry at that institution after serving in those positions since 2004. She currently serves as Chancellor Emerita and Distinguished Professor of Chemistry and Biochemistry at UCSD. She was previously Chancellor of North Carolina State University and Distinguished University Professor of Chemistry. Dr. Fox has served as the Co-Chair of the National Academy of Sciences' Government-University-Industry Research Roundtable and served on the National Science Board and on President Bush's Council of Advisors on Science and Technology. She has served as the Vice Chair of the National Science Board. Dr. Fox is a director of W. R. Grace & Co., since 1996, Bridgepoint Education, Inc. and Red Hat, Inc. and served as a director of Pharmaceutical Product Development, Inc. until 2008 and Boston Scientific Corporation until 2010. With her chemistry background, strong financial and operational experience leading large and successful educational institutions as well as service as an outside director to public and private boards, Dr. Fox brings to our board a full understanding of GCP's products and research and development efforts, substantial experience in overseeing corporate management and finance and high-level knowledge of operations and strategic planning for large institutions.
Janice K. Henry served as Senior Vice President and Treasurer until 2006 and Chief Financial Officer until 2005 of Martin Marietta Materials, Inc. (a chemical and materials manufacturer) until her retirement in 2006, after which she provided consulting services to Martin Marietta Materials, Inc. until 2009. Ms. Henry is a director of W. R. Grace & Co., since 2012 and served as a director of North American Galvanizing and Coatings, Inc. until its acquisition in 2010 by AZZ Incorporated, of Inco Limited until its acquisition in 2006 by CVRD, and of Cliffs Natural
Resources, Inc. until 2014. Ms. Henry brings to our Board her substantial experience in financial and accounting leadership, including with respect to acquisitions and capital structuring, gained as an officer of a chemicals and materials manufacturer. She also has significant governance and oversight experience from her service on public and private corporate boards.
Phillip J. Mason served as President of the Europe, Middle East Africa (EMEA) Sector of Ecolab, Inc. (a leading provider of food safety, public health and infection prevention products and services), a position he held from 2010 until his retirement in 2012. Prior to leading Ecolab’s EMEA Sector, Mr. Mason had responsibility for Ecolab’s Asia Pacific and Latin America businesses as President of Ecolab’s International Sector from 2005 to 2010 and as Senior Vice President, Strategic Planning in 2004. Mr. Mason has served on the board of Lincoln Electric Holdings since 2013. Mr. Mason brings 35 years of international business experience to the board, including starting, developing and growing businesses abroad in both mature and emerging markets. Additionally, he brings a strong finance and strategic planning background, including merger and acquisition experience, along with significant experience working with and advising boards on diverse issues confronting companies with international operations.
Elizabeth Mora has served since 2008 as the Chief Financial Officer, Vice President for Finance and Administration, and Treasurer for the Charles Stark Draper Laboratory, a non-profit engineering research and development laboratory serving the national interest in applied research, engineering development, advanced technical education, and technology transfer. Previously she served as Chief Financial Officer of Harvard University, with its large endowment, $3 billion annual operating budget, and 15,000 employees. In her 12 years at Harvard, she was a leader in research administration, the business side of information technology, and a key liaison between the university and government partners including OMB, NIH, NSF, DoD, and the various Offices of Inspectors General. She is a certified public accountant and spent nine years in public accounting and consulting in the National Regulatory Consulting Practice at PricewaterhouseCoopers. She has served as a director of MKS Instruments since 2012. Ms. Mora brings to our board a wide breadth of financial, audit, accounting, risk management, and financial controls experience.
Gregory E. Poling serves President and Chief Operating Officer of W. R. Grace & Co. As a result of his service at Grace since 1977, Mr. Poling has developed valuable business, management and leadership experience, including 22 years of experience in construction products, and has long-standing relationships with GCP's major customers. Mr. Poling brings our board his extensive experience in sales, manufacturing, marketing and executive management, including in particular his experience in leading Grace Construction Products and Darex.
Danny R. Shepherd served as Vice Chairman of Vulcan Materials Company (the nation’s largest producer of construction aggregates: primarily crushed stone, sand and gravel), a position he held from 2013 until his retirement in 2015. Prior to becoming Vice Chairman, Mr. Shepherd served as Executive Vice President and Chief Operating Officer, from 2012 to 2013, Executive Vice President, Construction Materials, from 2011 to 2012, and Senior Vice President, Construction Materials East, from 2007 to 2011. He originally joined Vulcan in 1973 and left in 1993 to build a lime and limestone business, ultimately serving as President of Global Stone Corp. before returning to Vulcan in 2002. Mr. Shepherd has served on the Boards of Directors of the American Road and Transportation Builders Association; National Stone, Sand & Gravel Association; National Ready Mix Concrete Association; National Lime Association; and Pulverized Minerals Association. Mr. Shepherd brings to our board over 40 years of executive, operations, and commercial leadership experience with public companies, spanning P&L management, corporate strategy, business development, mergers and acquisitions, investor relations, capital planning, organization structure, and succession planning.
Temporary Classification of the Board of Directors
Upon completion of the separation, the Company’s board of directors will initially be divided into three classes, with Class I comprised of three directors, Class II comprised of three directors and Class III comprised of two directors as specified in the table above. The directors designated as Class I directors will have terms expiring at the first annual meeting of shareholders following the distribution, which the Company expects to hold in 2017. The directors designated as Class II directors will have terms expiring at the following year’s annual meeting of shareholders, which the Company expects to hold in 2018, and the directors designated as Class III directors will have terms expiring at the following year’s annual meeting of shareholders, which the Company expects to hold in 2019. At the first annual meeting of shareholders following the distribution, Class I directors will be elected to serve for a term of three years each. Commencing with the second annual meeting of shareholders following the
distribution, directors for each class will be elected at the annual meeting of shareholders held in the year in which the term for that class expires and thereafter will serve for a term of one year each. Consequently, by 2020, all of our directors will stand for election each year for one year terms, and the board will therefore no longer be divided into three classes.
At any meeting of shareholders for the election of directors at which a quorum is present, the election will be determined by a majority of the votes cast by the shareholders entitled to vote in the election, with directors not receiving a majority of the votes cast required to tender their resignations for consideration by the board, except that in the case of a contested election, the election will be determined by a plurality of the votes cast by the shareholders entitled to vote in the election. Before the Company’s board is declassified, it would take at least two elections of directors for any individual or group to gain control of the Company’s board. Accordingly, while the classified board is in effect, these provisions could discourage a third party from initiating a proxy contest, making a tender offer or otherwise attempting to gain control of the Company.
Current Board of Directors
The current board of directors of the Company consists of Fred Festa (Age: 56), Hudson La Force (Age: 51), Mark Shelnitz (Age: 57) and Janice Henry. Each of Messrs. Festa, La Force and Shelnitz has been a director and officer of the Company since 2015, with Mr. Festa serving as Chairman and Chief Executive Officer, Mr. La Force serving as Vice President and Chief Financial Officer, and Mr. Shelnitz serving as Vice President and Secretary. Each of Messrs. Festa, La Force and Shelnitz has been actively engaged in the business of W. R. Grace & Co. for the past five years with Mr. Festa serving as Chairman and Chief Executive Officer, Mr. La Force serving as Senior Vice President and Chief Financial Officer and Mr. Shelnitz serving as Vice President, General Counsel and Secretary. Mr. Festa is also a director of NVR, Inc., a publicly held home builder. Messrs. Festa, La Force and Shelnitz are expected to resign as officers and directors of the Company following the separation. Ms. Henry was elected a director in January 2016 and is expected to continue to serve in that role following the separation. For a discussion of Ms. Henry’s biography, see - “Board of Directors Following the Distribution.”
Corporate Governance Principles
Prior to the distribution, we expect that the Company's board of directors will adopt Corporate Governance Principles to provide a governance framework for the governance of the Company, and to promote the efficient functioning of the board.
Director Independence
We expect a substantial majority of the Company’s board of directors will be comprised of directors who are “independent” as determined under guidelines set forth in the listing rules of the New York Stock Exchange and the Corporate Governance Principles to be adopted by the board. The Company will seek to have all of its non-management directors qualify as “independent” under these standards. The Company’s board of directors is expected to establish categorical standards to assist it in making its determination of director independence. In addition to the application of the NYSE rules, this independence determination will be based on a number of factors, principal among them, the following:
| |
| • | neither the director, nor any member of the director’s immediate family, being, or at any time during the last three years having been, a Company executive officer or employee; |
| |
| • | neither the director, nor any member of the director’s immediate family, being an executive officer of any other entity with whom we do any material amount of business; |
| |
| • | neither the director, nor any member of the director’s immediate family having, during the prior three years, received more than $50,000 in direct compensation from the Company (other than director and committee fees); and |
| |
| • | neither the director serving, or within the prior three years having served, as an executive officer, director, trustee or fiduciary of any charitable organization to which we made any material charitable donation. |
Committees of the Board of Directors
Effective upon the completion of the separation, the Company’s board of directors will have the following standing committees: an Audit Committee, a Compensation Committee, a Nominating and Governance Committee and a Corporate Responsibility Committee. The Company's board of directors is expected to adopt a written charter for each of the Audit Committee, the Compensation Committee, the Nominating and Governance Committee and the Corporate Responsibility Committee. These charters will be posted on the Company’s website in connection with the separation.
Audit Committee. Ms. Henry is the sole member of the Audit Committee. Following the separation, Messrs. Cambre, Mason and Shepherd, Mss. Mora and Henry and Drs. Avedon and Fox are expected to be the members of the board’s Audit Committee and Ms. Henry is expected to be the Audit Committee Chair. The board of directors has determined that Ms. Henry is an “audit committee financial expert” for purposes of the rules of the SEC and that she has accounting or related financial management expertise as required by NYSE rules. The board of directors is expected to determine that each other Audit Committee member is financially literate as required by NYSE rules. In addition, the board of directors has determined that Ms. Henry is, and the Company expects that the board of directors will determine that each of the other members of the Audit Committee is, independent, as defined by the rules of the NYSE, Section 10A(m)(3) of the Exchange Act, and in accordance with the Company's Corporate Governance Principles. The Audit Committee will meet at least quarterly and will assist the Company's board of directors in overseeing:
| |
| • | the integrity of the Company’s financial statements; |
| |
| • | the Company’s compliance with legal and regulatory requirements; |
| |
| • | the qualifications and independence of the independent auditors; |
| |
| • | the performance of the Company’s internal audit function and independent auditors; and |
| |
| • | the preparation of the internal control report and an audit committee report as required by the SEC. |
The Audit Committee will have the authority and responsibility for the appointment, retention, compensation, oversight and, if circumstances dictate, discharge of the Company’s independent auditors, including pre-approval of all audit and non-audit services to be performed by the independent auditors. The independent auditors will report directly to the Audit Committee and, with the internal auditors, will have full access to the Audit Committee and routinely meet with the Audit Committee without management being present. The Audit Committee also will be responsible for reviewing, approving and ratifying any related party transaction.
Compensation Committee. Messrs. Cambre, Mason, Shepherd, Mss. Henry and Mora and Drs. Avedon and Fox are expected to be the members of the board’s Compensation Committee. Dr. Avedon is expected to be the Compensation Committee Chair. The board of directors is expected to determine that each member of the Compensation Committee is independent, as defined by the rules of the NYSE and in accordance with the Company’s Corporate Governance Principles. In addition, the Company expects that the members of the Compensation Committee will qualify as “non-employee directors” for purposes of Rule 16b-3 under the Exchange Act and as “outside directors” for purposes of Section 162(m) of the Code. The Compensation Committee will have the authority and responsibility to:
| |
| • | approve all compensation actions with respect to the Company’s directors, executive officers, and certain other members of senior management; |
| |
| • | evaluate and approve the Company's annual and long-term incentive compensation plans (including equity-based plans), and oversee the general compensation structure, policies, and programs of the Company; and |
| |
| • | produce an annual report on executive officer compensation as required by applicable law. |
The Compensation Committee will have the sole authority, under its charter, to select, retain, and/or terminate independent compensation advisors.
Nominating and Governance Committee. Messrs. Cambre, Mason, Shepherd, Mss. Henry and Mora and Drs. Avedon and Fox are expected to be the members of the board’s Nominating and Governance Committee. Mr.
Cambre is expected to be the Nominating and Governance Committee Chair. The board of directors is expected to determine that each of the members of the Nominations and Governance Committee is independent, as defined by the rules of the NYSE and in accordance with the Company’s Corporate Governance Principles. The Nominating and Governance Committee will:
| |
| • | set criteria for the selection of directors, identify individuals qualified to become directors and recommend to the Company's board the director nominees for the annual meeting of shareholders; |
| |
| • | develop and recommend to the Company's board appropriate corporate governance principles applicable to the Company; and |
| |
| • | oversee the evaluation of the Company's board. |
We expect the Company's board will delegate to the Nominating and Governance Committee the sole authority to retain and terminate any search firm to be used to identify director candidates and the sole authority to approve the search firm's fees and other retention terms.
In considering candidates for election to the board (including candidates recommended by shareholders), we believe that, at a minimum, the board should be composed of individuals with a commitment to increasing shareholder value, a diversity of experience, the highest integrity, the education and ability to understand business problems and evaluate and propose solutions, the personality to work well with others, a reasoned commitment to the Company’s social responsibilities, and the availability of time to assist the Company. We wish to ensure that a diversity of experience is reflected on the board, including a broad diversity of industry experience, product experience and functional background. We also believe that a substantial majority of the board should be independent, as defined by NYSE rules and applicable laws and regulations.
We expect that the board will conduct a self-assessment process every year and periodically review the skills and characteristics needed by the board. As part of the review process, we expect the board will consider the skill areas represented on the board, those skill areas represented by directors expected to retire or leave the board in the near future, and recommendations of directors regarding skills that could improve the ability of the board to carry out its responsibilities.
We expect the board or the Nominating and Governance Committee will make appointments in the following manner. When the board or the Nominating and Governance Committee has identified the need to add a new board member with specific qualifications or to fill a vacancy on the board, the chair of the Nominating and Governance Committee will initiate a search, seeking input from other directors and management, review any candidates that the Nominating and Governance Committee has previously identified or that have been recommended by shareholders in that year, and may retain a search firm. The Nominating and Governance Committee will identify the initial list of candidates who satisfy the specific criteria, if any, and otherwise qualify for membership on the board. Generally, two members of the Nominating and Governance Committee (with one preferably the chair), the Chairman of the board and the Chief Executive Officer will interview each qualified candidate. Other directors may also interview the candidate if practicable. Based on a satisfactory outcome of those reviews, the Nominating and Governance Committee will make its recommendation on the candidate to the board.
Corporate Responsibility Committee. Messrs. Cambre, Mason, Shepherd, Mss. Henry and Mora and Drs. Avedon and Fox are expected to be the members of the board’s Corporate Responsibility Committee. Dr. Fox is expected to be the Corporate Responsibility Committee Chair. The board of directors is expected to determine that each member of the Corporate Responsibility Committee will be independent, as defined by the rules of the NYSE and in accordance with the Company’s Corporate Governance Principles. The Corporate Responsibility Committee will assist the Company's board and management in addressing the Company’s responsibilities as a global corporate citizen. In particular, the Corporate Responsibility Committee will counsel management with respect to:
| |
| • | the development, implementation and continuous improvement of procedures, programs, policies and practices relating to the Company’s responsibilities as a global corporate citizen; |
| |
| • | the adherence to those procedures, programs, policies and practices at all levels of the Company; and |
| |
| • | the maintenance of open communications to ensure that issues are brought to the attention of, and considered by, all appropriate parties. |
Compensation Committee Interlocks and Insider Participation
During the Company’s fiscal year ended December 31, 2015, the Company was not an independent company, and did not have a compensation committee or any other committee serving a similar function. Decisions as to the compensation of those who currently serve as GCP’s executive officers were made by Grace, as described in the section of this information statement captioned “Compensation Discussion and Analysis.”
Shareholder Recommendations for Director Nominees
The Company’s amended and restated bylaws will contain provisions that address the process by which a shareholder may nominate an individual to stand for election to the board of directors. The Company expects that the board of directors will adopt a policy concerning the evaluation of shareholder recommendations of board candidates by the Nominating and Governance Committee.
Board Leadership Structure
The Company’s board leadership structure, including whether the Company’s bylaws will require that the positions of Chairman of the Board and Chief Executive Officer be held by different individuals, has not been determined at this time. Additional information concerning the Company’s board leadership structure will be included in an amendment to this information statement.
Board Risk Oversight
The Company's board of directors will actively oversee the risk management of the Company and the implementation of our strategic plan and the risks inherent in the operation of our businesses. The board will review the Company's enterprise risk management program at least annually and consider whether risk management processes are functioning properly and are appropriately adapted to the Company’s strategy, culture, risk appetite and value-generation objectives. The board will provide guidance to management regarding risk management as appropriate. These activities will be supplemented by a rigorous internal audit function that will report directly to the Audit Committee.
Standing board committees will be responsible for overseeing risk management practices relevant to their functions. The Audit Committee will oversee the management of market and operational risks that could have a financial impact, such as those relating to internal controls and financial liquidity. The Nominating and Governance Committee will oversee risks related to governance issues, such as the independence of directors and the breadth of skills on the board. The Compensation Committee will manage risks related to the Company’s executive compensation plans and the succession of the Chief Executive Officer. The Corporate Responsibility Committee will manage certain risks related to government regulation and environment, health and safety matters.
Communications with the Board of the Company
The Company’s Corporate Governance Principles will include procedures by which shareholders and other interested parties who would like to communicate with one or more members of the Company’s board of directors, a board committee, or the independent non-management directors as a group may do so by writing to any such party c/o Corporate Secretary, GCP Applied Technologies Inc., 62 Whittemore Avenue, Cambridge Massachusetts 02140.
COMPENSATION DISCUSSION AND ANALYSIS
In 2015, GCP was operated as part of Grace by the Grace executive officers. Accordingly, the 2015 Grace named executive officers are also the "named executive officers" of the Company included in the Summary Compensation Table set forth under "Executive Compensation—Compensation Tables" in respect of 2015. With the exception of Mr. Poling, these individuals will not be officers of the Company following the separation (see “Management—Executive Officers Following the Distribution”).
The compensation decisions described in this section with respect to 2015 were made by the Compensation Committee of the Board of Directors of W. R. Grace & Co. (which we refer to as the "Grace Compensation Committee"), which is composed entirely of independent directors. Following the separation, executive compensation decisions with respect to the Company will be made by the Compensation Committee of the Board of Directors of the Company (which we refer to as the "GCP Compensation Committee") which also will be composed entirely of independent directors.
This Compensation Discussion and Analysis has three main parts:
| |
| • | Grace 2015 Executive Compensation — This section describes and analyzes the executive compensation programs at Grace in 2015. In this section, the terms “we,” “our” and “us” refer to the Grace Compensation Committee. |
| |
| • | Effects of the Separation on Outstanding Executive Compensation Awards — This section discusses the effect of the separation on outstanding compensation awards for Grace employees who are expected to become executive officers of the Company. |
| |
| • | The Company's Compensation Programs — This section discusses the anticipated executive compensation programs at the Company following the separation. |
Grace 2015 Executive Compensation
Executive Compensation Philosophy and Objectives
The key objectives of the Grace executive compensation program is to incentivize and motivate them to improve our performance, increase shareholder value, and enable us to compete effectively with other firms in attracting, motivating and retaining executives. The incentive compensation portion of the program is designed to align closely the financial interests of our executive officers with those of our shareholders. Because executive officers have a substantial ability to influence business success, we believe that the portion of compensation that is at-risk based on company-wide performance should increase as the level of responsibility increases. We also expect the executive compensation program to be consistent with a culture of ethical conduct, personal integrity and compliance with our policies and applicable law. We require executive officers to set an example for our employees and our other business associates in emphasizing the Grace Core Values in their daily business conduct. The Grace Core Values consist of a commitment to teamwork, performance, integrity, speed and innovation, which, with our overall commitment to safety, are the foundation of our corporate culture.
Setting Compensation
The W. R. Grace & Co. Board of Directors, which we refer to in this section as our Board, has delegated authority for approving and administering the compensation program for executive officers, including the “named executive officers” included in the Summary Compensation Table set forth under “Executive Compensation” and other members of senior management to the Grace Compensation Committee. Our Board has appointed all of the independent members of our Board to serve as members of the committee.
Elements of Compensation
The following table outlines the major elements of compensation in 2015 for the named executive officers:
|
| | | | |
| Compensation Element | | Definition | | Rationale |
| Base Salary | | Fixed cash compensation paid monthly | | Payment for completion of day-to-day responsibilities |
| Annual Incentive Compensation Plan | | Variable cash compensation earned by achievement of pre-established annual corporate financial performance goals and annual personal performance | | Builds accountability for achieving annual financial and business results and personal performance goals |
| Long-Term Incentive Compensation Plan (Stock Options) | | Equity compensation with staggered vesting that increases in value with increases in stock price; value is equivalent to 50% of executive officer’s long-term incentive | | Builds accountability for sustained financial performance Aligns long-term interests of executive officers and shareholders
Encourages executive retention |
| Long-Term Incentive Compensation Plan (Restricted Stock Units) | | Equity compensation subject to time-based vesting; value is equivalent to 50% of executive officer’s long-term incentive
| | Builds accountability for sustained financial results
Aligns long-term interests of executive officers and shareholders
Encourages executive retention |
| U.S. Defined Contribution Retirement Plans | | Savings and Investment Plan (401(k))-Standard tax-qualified defined contribution retirement benefit subject to limitations on compensation and benefits under the U.S. Tax Code | | Provides U.S. employees with opportunity to save for retirement on tax-advantaged basis with matched contributions from Grace
|
| | | Savings and Investment Plan Replacement Payment Plan (nonqualified)
| | Highly-paid U.S. employees made eligible for the same level of Grace match as all other participants in the Savings and Investment Plan notwithstanding Tax Code limitations |
| U.S. Defined Benefit Retirement Plans | | Pension Plan-Standard tax-qualified pension plan subject to limitations on compensation and benefits under the U.S. Tax Code
| | Provides U.S. employees with retirement income |
| | | Supplemental Executive Retirement Plan (nonqualified) | | Highly-paid U.S. employees made eligible for the same benefit formula as all other participants in the Pension Plan notwithstanding U.S. Tax Code limitations |
Compensation Benchmarking
In order to gauge market compensation levels and practices, we have retained the services of Towers Watson, an independent human resources consulting firm. Periodically, we consult with Towers Watson for an assessment of the competitiveness of our executive officer compensation relative to certain benchmark companies in the chemicals, materials and specialty chemicals industry that we deem to be Grace's peer group for compensation purposes, and relative to certain broad industry data. We selected the peer companies as the compensation peer group based upon their size and global scope, the quality of their executive talent, the likelihood that Grace competes with them for executive talent, and the availability of public information regarding their compensation practices. We rely upon the compensation data gathered from the peer group as well as the broad industry data to represent the competitive market for executive talent for our executive officers and do not focus on any specific data or benchmark for guidance when we make pay decisions. We annually review the composition of the compensation peer group to ensure that it remains relevant. For 2015 compensation, the peer group consisted of:
|
| | |
| Albemarle Corp. | | Olin Corp. |
| Axiall Corp. | | OM Group Inc. |
| Cabot Corp. | | PolyOne Corp. |
| Celanese Corp. | | Rockwood Holdings Inc. |
| Cytec Industries Inc. | | RPM International Inc. |
| Eastman Chemical Co. | | A. Schulman Inc. |
| Ferro Corp. | | Sigma-Aldrich Corp. |
| FMC Corp. | | Valspar Corp. |
| International Flavors & Fragrances Inc. | | Westlake Chemical Corp. |
The broad industry data that we review is included in studies produced by Towers Watson for any given compensation year. We use the chemicals and general industry sections of these studies. These data are used in conjunction with the peer group data to determine market competitive levels for executive officer compensation.
Role of the Grace Compensation Committee
Pursuant to delegation from our Board, we are responsible for reviewing and approving the compensation of all executive officers, including:
| |
| • | annual incentive compensation; |
| |
| • | long-term incentive compensation; |
| |
| • | change-in-control agreements; and |
| |
| • | any special or supplemental benefits not generally available to salaried employees. |
We also review and approve all corporate goals and objectives used in determining the incentive compensation of each executive officer. We receive advice and legal and administrative assistance from the Grace human resources department and legal services group in meeting our responsibilities.
In setting an executive officer’s compensation level, we do not target a specific percentile at which pay levels should be set, as our members believe the market for executive talent includes a wide range of practices. Instead, we review the distribution of peer group pay practices and broad industry data and determine the appropriate positioning of each executive officer’s compensation based on factors including:
| |
| • | The executive officer’s role and level of responsibility; |
| |
| • | The need to attract, motivate and retain world-class leadership; |
| |
| • | The economic and business environment in which Grace operates; |
| |
| • | The importance of the executive officer to Grace’s objectives and strategy; |
| |
| • | Legal and governance requirements and standards related to executive compensation, including internal pay equity with other salaried employees; and |
| |
| • | With respect to executive officers other than the CEO, the CEO’s recommendation of appropriate compensation levels. |
We conduct an evaluation of each executive officer’s leadership ability, business experience, technical skill and potential to contribute to Grace’s overall performance. In addition, since the number of executive officers is small, our members are able to spend considerable time with each executive officer outside committee meetings, so our members are able to develop strong personal views of each executive officer’s performance and potential. We also review each executive officer’s existing compensation. This information, presented in the form of a “tally
sheet,” reflects all compensation payable or potentially payable to each executive officer under the Grace compensation program. For each executive officer, we review the tally sheet, the peer group information, and broad industry data to provide context to the compensation decision. We then review the recommendation of the CEO, solely with respect to the other executive officers, and make the compensation determination based on our individual evaluation of each executive officer. Grace executive officers are generally eligible for periodic compensation reviews.
Our process for determining the compensation of the CEO is similar to the process we apply to other executive officers. We review and approve corporate goals and objectives used in determining the compensation of the CEO. We evaluate the CEO’s performance in light of those goals and objectives and have sole authority to determine the CEO’s compensation based on this evaluation. The CEO plays no part in our deliberations or approval of his own compensation. We believe the CEO’s compensation should be higher than the compensation of other executive officers because the CEO is uniquely positioned to influence all aspects of Grace's operations and performance and the resulting return to our shareholders. In addition, we believe that a competitive compensation package that aligns the interests of the CEO with shareholders is the most effective way to incentivize the CEO and maximize Grace performance. Our view is consistent with the practices of the compensation peer group companies and the broad industry data that we have reviewed.
Role of the Chief Executive Officer
As noted above, the CEO proposes compensation levels for the other executive officers. The CEO’s recommendations for the other executive officers are based on his assessment and consideration of the factors we consider as described above. Although we give the CEO’s recommendations significant weight, we retain full discretion when determining executive officer compensation. Although not a member of the committee, the CEO attends our meetings and participates in our deliberations regarding compensation levels for the other executive officers. The CEO is excused from deliberations regarding his own compensation and from the “executive session” portion of each meeting when we meet alone or alone with our outside advisors. The CEO is also excused when we meet separately with internal advisors from the Grace human resources group.
Role of the Compensation Consultant
In order to add rigor in the process of setting executive officer compensation and to inform us of market trends, we have engaged the services of Towers Watson to analyze our executive compensation structure and plan designs, and to assess whether the compensation program is competitive and supports our goal to align the interest of the executive team to the interests of the shareholders.
Specific services provided by Towers Watson in 2015 include:
| |
| • | participated in selected committee meetings; |
| |
| • | recommended companies to be included in the compensation peer group; |
| |
| • | prepared market compensation data for executives and outside directors; |
| |
| • | recommended ranges of annual and long-term compensation consistent with our compensation philosophy and objectives; |
| |
| • | advised on incentive compensation plan design; |
| |
| • | advised on current market trends and practices; |
| |
| • | advised on executive compensation decisions related to the separation; and |
| |
| • | reviewed compensation disclosure. |
In addition to services in respect of executive officer and director compensation, management engaged Towers Watson to provide additional services to Grace in an amount that was less than $125,000 during 2015. We expect Towers Watson and our executive officers, including our CEO, Chief Human Resources Officer and our General Counsel, and their respective subordinates, to meet, exchange information and otherwise cooperate in the performance of their respective duties outside committee meetings.
We have the sole authority to approve the independent compensation consultant’s fees and terms of the engagement. We annually review our relationship with Towers Watson to ensure independence. The process includes a review of the services Towers Watson provides, the quality of those services, and fees associated with the services during 2015 as well as consideration of the factors impacting independence that the NYSE rules require. In its review, we noted no conflicts of interest related to the work of Towers Watson.
Stock Ownership Guidelines
In order to ensure that the long-term financial interests of our directors and executive officers are fully aligned with the long-term interests of our shareholders, our Board has implemented stock ownership guidelines. The guidelines are as follows:
|
| | |
| Category of Executive | | Ownership Guideline |
| Directors (other than CEO) | | 5 times cash portion of annual retainer |
| Chief Executive Officer | | 5 times base salary |
| Members of the Grace Leadership Team | | 3 times base salary |
| Presidents of Operating Segments | | 2 times base salary |
| Certain Key Vice Presidents | | 1 times base salary |
Current directors and executives subject to the stock ownership guidelines generally have five years from the later of the 2013 adoption of the guidelines or the date of hire/election until they are expected to comply with the relevant guideline.
Compensation Elements
Base Salary
The Grace Compensation Committee generally reviews base salaries for executive officers every 18 to 24 months. The Grace Compensation Committee takes into account individual performance, achievement of individual strategic objectives, changes in the breadth or scope of responsibilities, and its review of competitive compensation information described above. In 2015, the Grace Compensation Committee maintained base salaries for the named executive officers, other than Mr. Poling, at the 2014 level as set forth in the following table. Effective December 1, 2015, the Grace Compensation Committee increased Mr. Poling's base salary to reflect his increased responsibilities in connection with the separation.
|
| | | | | | |
| Named Executive Officer | | Base Salary Rate as of 12/31/2015 ($) | | Base Salary Rate as of 12/31/2014 ($) | | Percentage Increase in Base Salary Rate (%) |
| A. E. Festa | | 975,000 | | 975,000 | | — |
| H. La Force III | | 500,000 | | 500,000 | | — |
| G. E. Poling | | 800,000 | (1) | 600,000 | | 33.3 |
| M. A. Shelnitz | | 425,000 | | 425,000 | | — |
| E. C. Brown (2) | | 375,000 | | — | | — |
___________________________________________________________________________________________________________________
| |
| (1) | Effective December 1, 2015, Mr. Poling's annual base salary rate increased from $600,000 to $800,000. |
| |
| (2) | Ms. Brown joined Grace in 2015. |
Annual Incentive Compensation (AICP)
The AICP is a cash-based pay-for-performance incentive plan. Its purpose is to motivate and reward upper- and middle-level employees, including executive officers, for their contributions to our performance. The amount of an individual incentive award payment under the AICP is based upon:
| |
| • | the individual's AICP target amount; |
| |
| • | the funding of the AICP incentive pool based on Grace performance; and |
| |
| • | the individual's personal performance. |
We established 2015 AICP targets in February 2015, based on the performance targets in the Grace 2015 operating plan and after considering the general economic environment in which we expected Grace to be operating during the year.
Consistent with 2014, we emphasized both earnings and cash generation performance in setting the annual incentive compensation plan goals. We viewed strong cash performance as critical to Grace's strategic direction in 2015 and a key component in Grace's future plans so we gave equal weight to earnings and cash generation for 2015.
For earnings, we used "Adjusted EBIT," (weighted 50%) calculated as net income adjusted for interest income and expense; income taxes; costs related to Chapter 11 and asbestos; restructuring and repositioning expenses and asset impairments; pension costs other than service and interest costs, expected returns on plan assets, and amortization of prior service costs/credits; income and expense items related to divested businesses, product lines, and certain other investments; gains and losses on sales of businesses, product lines, and certain other investments; and certain other unusual or infrequent items that are not representative of underlying trends.
For cash generation, we used “Adjusted Free Cash Flow,” (weighted 50%) calculated as net cash provided by or used for operating activities minus capital expenditures plus the net cash flow from costs related to Chapter 11, cash paid to resolve contingencies subject to Chapter 11, accelerated payments under defined benefit pension arrangements, and expenditures for asbestos-related items.
The AICP targets for our named executive officers, other than Mr. Festa and Mr. Poling, remained the same as in 2014. Effective December 1, 2015, the Grace Compensation Committee increased Mr. Poling's AICP target to reflect his increased responsibilities in connection with the separation.
|
| | | | | | | |
| Named Executive Officer | | AICP Target as Percentage of Base Salary in 2015 | | AICP Target as Percentage of Base Salary in 2014 | |
| A. E. Festa | | 125 | % | | 114 | % | (1) |
| H. La Force III | | 80 | % | | 80 | % | |
| G. E. Poling | | 91 | % | (2) | 90 | % | |
| M. A. Shelnitz | | 70 | % | | 70 | % | |
| E. C. Brown | | 70 | % | | n/a |
| (3) |
___________________________________________________________________________________________________________________
| |
| (1) | Reflects Mr. Festa's 2014 blended AICP target. Effective June 1, 2014, Mr. Festa's AICP target increased from 100% to 125% of his base salary. |
| |
| (2) | Reflects Mr. Poling's 2015 blended AICP target. Effective December 1, 2015, Mr. Poling's AICP target increased from 90% to 100% of his base salary. |
| |
| (3) | Ms. Brown joined Grace in 2015. |
Actual awards for executive officers may range from $0 to an amount equal to 200% of the target amount, based on the factors described above.
The target AICP incentive pool is the sum of the target awards of all participants in the AICP. For 2015, 50% of the available AICP incentive pool is established based on our performance in respect of Adjusted EBIT and 50% on performance in respect of Adjusted Free Cash Flow, which aligns the funded amount of our AICP incentive pool with our actual performance. We refer to the relevant targets as the "Adjusted EBIT Target" and the "Cash Target", respectively.
2015 AICP Performance Targets
The amount of the AICP incentive pool is the sum of the amount funded in the Adjusted EBIT Pool and the amount funded in the Adjusted Free Cash Flow Pool. The funding of each pool is determined independently by reference to the Adjusted EBIT Target and Cash Target set forth in the Grace Annual Operating Plan for the one-year performance period as follows:
2015 AICP Performance Targets-Adjusted EBIT
|
| | | | |
Percentage Funded in Adjusted EBIT Pool* (%) | | Grace Performance as a Percentage of Adjusted EBIT Target (%) | | Grace Adjusted EBIT Target (in millions $) |
| 200 | | 108.68 or above | | 701 or above |
| 125 | | 104.65 | | 675 |
| 100 | | 100 | | 645 |
| 75 | | 95.35 | | 615 |
| 0 | | 91.32 or below | | 589 or below |
__________________________________________________________________________________________________________________
| |
| * | Actual amount funded to the Adjusted EBIT Pool is prorated on a straight line basis for performance that falls between the performance targets set forth in the table. |
2015 AICP Performance Targets-Adjusted Free Cash Flow
|
| | | | |
Percentage Funded in Cash Pool (%)* | | Grace Performance as a Percentage of Cash Target (%) | | Grace Cash Targets (in millions $) |
| 200 | | 115.12 or above | | 495 or above |
| 150 | | 107.67 | | 463 |
| 100 | | 100 | | 430 |
| 50 | | 93.02 | | 400 |
| 0 | | below 93.02 | | below 400 |
___________________________________________________________________________________________________________________
| |
| * | Actual amount funded to the Cash Pool is prorated on a straight line basis for performance that falls between the performance targets set forth in the table. |
Executive Officer Annual Incentive Compensation Plan (EAICP)—Funding of Payments
The Executive Officer Annual Incentive Compensation Plan, EAICP, applicable to the executive officers, provides for performance-based incentives designed to meet the requirements for tax deductibility under Section 162(m) of the Code. AICP payments to executive officers are funded from the EAICP incentive pool. The EAICP incentive pool is funded if Grace meets the performance targets that we establish for a specified year. The maximum pool that can be used to make AICP payments to executive officers is set at 200% of the aggregate of the executive officers' AICP target awards. For 2015, the EAICP performance target was $400 million. In setting the actual amount of executive officers' AICP awards, we have the discretion to reduce, but not increase, the amount of the EAICP incentive pool and the amounts, based on the EAICP incentive pool, of individual AICP payments to executive officers.
Actual 2015 AICP Funding and Payouts
The actual AICP payments to the named executive officers cannot be determined as of the date of this information statement because as of the date of this information statement, Grace's 2015 audited financial have not been completed. We expect the amount of such payments to be determined on or before March 12, 2016, consistent with Grace's historical practices, and we expect the Company to disclose such amounts on or about such date as required by SEC rules.
Long-Term Incentive Compensation
The Grace Long-Term Incentive Plans, or LTIPs, are designed to motivate and reward our key employees, including our named executive officers, for their contributions to Grace performance over a multi-year period and align their financial interests with those of the shareholders by making a significant portion of their total compensation variable and dependent upon Grace's sustained financial performance. We determined the target value of the LTIP award for each LTIP participant, with the exception of the CEO, based on the recommendation of the CEO. We determined the target value of the CEO’s LTIP award. We determined these target award values
by reviewing current market compensation data (as discussed above), historical long-term incentive target values, the level of dilution represented by outstanding equity awards, and internal pay equity considerations.
Fifty percent of the target award value of the 2015 LTIP is awarded in options to purchase Grace common stock and 50% is awarded in restricted stock units, or RSUs.
Stock Options
Stock options represent 50% of the value of our LTIP awards. The value of stock options is directly related to the increase in value of Grace common stock, so stock options provide direct alignment between the interests of our executive officers and shareholders. In determining the value of stock option awards, we used an analysis of stock option value based on an adjusted Black-Scholes option pricing model and reviewed this analysis with Towers Watson. We approved the stock option grants included in the 2015 LTIP on May 7, 2015. The exercise price of the options was $96.005, which was the average of the high and low trading prices of Grace common stock on the NYSE on May 7, 2015. The term of the options is five years and they vest over three years in equal annual installments commencing the year after the date of grant, generally subject to the continued employment of the holder of the stock options.
Restricted Stock Units (RSUs)
RSUs represent 50% of the value of Grace 2015 LTIP awards. In previous years we have issued performance-based units that consist of a target award of shares that can be increased, decreased or forfeited based on Grace performance. Due to the separation, we did not believe that a three-year performance period based on Grace's 2014 performance was appropriate for long-term compensation. Accordingly, we selected RSUs as the stock component of the 2015 LTIP awards. The value of an RSU is equal to the increase in value of Grace common stock, so RSUs provide direct alignment between the interests of our executive officers and shareholders. RSUs granted in 2015 will vest and be settled on May 7, 2018, generally subject to continued employment of the holder of the RSUs.
RSUs also provide direct alignment between the interests of executive officers and shareholders. Payouts to executive officers who are subject to the stock ownership guidelines, including the named executive officers, are payable in shares of common stock. Payouts to other participants are payable in cash.
Special Equity Awards to Ms. Brown
In connection with the commencement of her employment with Grace as Vice President and Chief Human Resources Officer, Ms. Brown was awarded a new hire Performance Based Unit (PBU) grant and a new hire stock option grant. In recognition of the special efforts required of Ms. Brown and her department in connection with the separation, we awarded Ms. Brown a separate retention RSU grant.
The PBUs awarded to Ms. Brown are share-denominated and the actual number of shares earned by Ms. Brown can vary based on the achievement of specified business performance objectives. The value of the PBUs also varies based on the value of our stock. The amount of the payout under the PBUs is based upon: Ms. Brown's PBU target share amount; the growth in our Adjusted EBIT over the three-year performance period; and the value of Grace common stock on the payout date. Since Ms. Brown is an executive officer who is subject to our stock ownership guidelines, the PBUs are payable in shares of Grace common stock. The performance measure for the PBUs is Adjusted EBIT. In determining cumulative Adjusted EBIT growth for use in determining PBU payouts, referred to as LTIP Adjusted EBIT, Adjusted EBIT may be adjusted in the discretion of the committee to eliminate the effect of changes in accounting or significant changes in our business. In order to earn the target payout, our cumulative annual LTIP Adjusted EBIT growth from the 2013 baseline performance to 2016 actual performance must be 30%, to earn the maximum of 200% of the target payout, growth must be 45% and no payout is earned if growth is less than15% as reflected in the following table:
|
| | | | |
| 3-Year Cumulative PBU Adjusted EBIT Growth | | 2016 PBU Adjusted EBIT (in millions) | | Number of PBU Shares Paid Out (# Shares) |
| Greater than 45% | | Greater than $798.7 | | 200% of PBU Award |
| 45% | | $798.7 | | 200% of PBU Award |
| 30% | | $716.0 | | 100% of PBU Award |
| 15% | | $633.4 | | 50% of PBU Award |
| Less than 15% | | Less than $633.4 | | — |
In determining the value of Ms. Brown's stock option award, we used an analysis of stock option value based on an adjusted Black-Scholes option pricing model. We approved Ms. Brown's stock option grant on January 6, 2015. The exercise price of the options was $93.15, which was the average of the high and low trading prices of Grace common stock on the NYSE on January 6, 2015. The term of the options is five years and they vest over two years in equal annual installments on January 6, 2016 and January 6, 2017, generally subject to the continued employment of Ms. Brown.
The retention RSUs granted to Ms. Brown will vest and be settled on May 7, 2018, generally subject to her continued employment with Grace.
Pension Plan/Supplemental Executive Retirement Plan
As described below under the caption “Executive Compensation—Compensation Tables—Pension Benefits,” payments under the Grace tax-qualified pension plan are calculated using annual compensation, including base salary and AICP awards, and years of credited Grace service. We have also implemented a Supplemental Executive Retirement Plan, generally referred to as a SERP, which currently applies to approximately 80 upper level employees, including the named executive officers, whose annual compensation exceeds the amount permitted to be taken into account for purposes of calculating benefits under tax-qualified pension plans. Under this plan, each such employee will receive the full pension to which that employee would be entitled in the absence of the limitations described above and other limitations imposed under federal income tax law. The SERP is unfunded and is not qualified for tax purposes.
Savings and Investment Plan/Replacement Payment Plan
Grace generally offers a tax-qualified 401(k)-type Savings and Investment Plan, or S&I Plan, to employees under which they may save a portion of their annual compensation in investment accounts on a pre- or post-tax basis. Grace currently matches 100% of employee savings under the S&I Plan up to 6% of the employee’s base salary and annual incentive compensation. We believe that a 401(k)-type plan with a meaningful company match is an effective recruiting and retention tool for Grace’s employees, including the named executive officers. We have also implemented an S&I Plan Replacement Payment Plan that applies to approximately 55 upper level employees, including the named executive officers, whose annual compensation exceeds the amount permitted to be taken into account for purposes of calculating benefits under tax-qualified savings plans. Under this plan, each such employee will receive the full matching payments to which that employee would be entitled in the absence of the limitations described above and other limitations imposed under federal income tax law.
Executive Personal Benefits
We believe that executive personal benefits should be limited. Executive officers are eligible to participate in an executive physical examination program that offers executives an annual comprehensive physical examination within a compressed time period. Mr. Festa has access to corporate aircraft for reasonable personal travel, though he is responsible for paying income taxes on the value of such travel as determined by the Internal Revenue Service. In connection with joining Grace, Ms. Brown received certain benefits related to her relocation, at Grace's request, to Maryland and, in connection with the separation, Mr. Poling received certain benefits related to his relocation, at Grace's request, to Massachusetts.
Change-In-Control Severance Agreements
As described below under the caption “Executive Compensation—Compensation Tables—Termination and Change-in-Control Arrangements,” we have entered into change-in-control severance agreements with each of the named executive officers. The provisions in these agreements are based on competitive practice and are designed to ensure that the executive officers’ interests remain aligned with the interests of our shareholders if a
potential change in control occurs. Payments under these agreements are triggered by the involuntary termination of the executive officer’s employment without cause (including constructive termination caused by a material reduction in his or her authority or responsibility or by certain other circumstances) following a “change in control.” A change in control situation often undermines an executive officer’s job security, and it is to our benefit and our shareholders’ benefit to encourage our executive officers to seek out beneficial transactions and to remain employed through the closing of any transaction, even though their future employment at Grace may be uncertain. The change-in-control severance agreements are designed to reinforce and encourage the continued attention and dedication of the executive officers to their assigned duties without distraction in the face of potentially adverse circumstances arising from the possibility of a change in control of Grace. Certain terms of these agreements are described below under the caption “Executive Compensation—Compensation Tables—Potential Payments Upon Termination or Change-In-Control.”
Severance Arrangements
As described below under “Executive Compensation-Compensation Tables-Termination and Change-in-Control Arrangements,” we have entered into severance arrangements with each of the named executive officers. Payments under these arrangements are triggered by involuntary termination of employment under most circumstances. Our severance arrangements are designed to encourage and reinforce the continued attention and dedication of our executive officers to their assigned duties without undue concern regarding their job security. In the case of Mr. La Force and Ms. Brown, the severance arrangements were negotiated on an arms-length basis prior to the time they joined Grace. The payments required by these arrangements were designed to encourage Mr. La Force and Ms. Brown to join and remain with Grace in lieu of other employment opportunities available to them. In connection with the separation, we have agreed that, in the event of the involuntary termination by Grace of Ms. Brown's employment, without cause or performance issues, within two years of her relocation to Columbia Maryland, Grace will pay all necessary moving expenses, including tax gross-ups, to a location of her choice within the continental United States. Certain terms of these arrangements are described below under the caption “Executive Compensation—Compensation Tables—Potential Payments Upon Termination or Change-In-Control.”
Executive Salary Protection Plan
As described below under the caption “Executive Compensation—Compensation Tables—Potential Payments Upon Termination or Change-In-Control,” our Executive Salary Protection Plan provides payments to our named executive officers, or their respective beneficiaries, in the event of their disability or death prior to age 70 while employed by Grace. The plan is designed to encourage the continued attention and dedication of our executive officers to their assigned duties without undue concern regarding their ability to earn a living and support their families in the event of death or disability.
Compensation Policies and Practices Relating to Risk Management
We do not believe that risks arising from our compensation policies and practices for our employees are reasonably likely to have a material adverse effect on Grace through excessive risk-taking incentives or otherwise. The Grace compensation program, though tailored to Grace's specific needs, is generally similar to compensation programs used by other companies in the industry. We have many years of experience with the various components of our compensation program, including the incentive plans under which payments may vary based on the performance of the business. We believe these plans, backed by the Grace corporate ethics program and the Grace Core Values, have been successful in aligning the interests of the executives and senior employees with the interests of the shareholders and in encouraging the responsible pursuit of corporate objectives by Grace employees.
In order to ensure that the executive officer compensation program does not encourage excessive risk-taking, we conduct a periodic risk assessment of the compensation plans. We believe that several elements of the compensation program mitigate risk, including the use of performance measures based on reasonable targets, the implementation of stock ownership guidelines, the use of severance and change of control agreements and our oversight and discretion regarding incentive compensation.
Deductibility of Executive Compensation
Section 162(m) of the Code limits the tax deduction for compensation expense in excess of $1 million paid to certain executive officers unless such compensation is “performance-based” and satisfies certain other conditions.
Tax deductibility is one criterion we consider when establishing compensation plans. The Grace AICPs and LTIPs are structured with the intention that the compensation payable thereunder will generally qualify as deductible “performance-based” compensation. However, the rules governing Section 162(m) of the Code are complex and subject to different interpretations. Therefore, there is no certainty that awards intended to constitute “performance-based compensation” will, in fact, meet that exception. In addition, we believe that it is important to preserve the ability to structure compensation plans to meet a variety of corporate objectives even if the compensation is not deductible.
Effects of the Separation on Outstanding Executive Equity Compensation Awards
For a discussion of the effects of the separation on outstanding executive equity compensation see "The Separation and Distribution—Treatment of Equity-Based Compensation."
For a discussion of provisions concerning retirement, health and welfare benefits to our employees upon completion of the separation, see “Certain Relationships and Related Transactions—Agreements with Grace—Employee Matters Agreement.” The separation is not a change-in-control and therefore will not entitle officers of W. R. Grace & Co. or the Company to any change-in-control benefits.
The Company's Compensation Program
We believe the Grace executive compensation programs are effective both at retaining and motivating Grace officers and competitive as compared to compensation programs at other industry peer companies. We expect the executive compensation programs that will initially be adopted by the Company will be very similar to those in place at Grace immediately prior to the separation. However, after the separation, the GCP Compensation Committee will continue to evaluate the Company's compensation and benefit programs and may make adjustments as necessary to meet prevailing business needs. Following the separation, we expect that the GCP Compensation Committee will retain Towers Watson to provide compensation advice.
Executive Annual Incentive Compensation Plan
We expect that, prior to the completion of the separation, the Company’s board of directors and sole stockholder, Grace Conn, will adopt the GCP Applied Technologies, Inc. Executive Annual Incentive Compensation Plan (which we refer to as the “GCP AICP”), which will become effective upon the consummation of the distribution. The following summary of the GCP AICP is qualified in its entirety by reference to the specific provisions of the GCP AICP, the full text of which is attached as an Exhibit to the registration statement of which this information statement is a part.
Administration
The GCP AICP will be administered by the GCP Compensation Committee. The GCP Compensation Committee will select participants, set the performance goals and targets, and be responsible for all decisions with respect to payouts. The GCP Compensation Committee may delegate functions related to the GCP AICP to one or more officers or a committee of officers to the extent permitted by applicable law including Section 162(m) of the Code and applicable stock exchange rules.
Eligibility
Eligible employees under the GCP AICP are the chief executive officer, other executive officers, and other executives of the Company selected by the GCP Compensation Committee.
Performance Period
The performance period under the GCP AICP will be the Company’s fiscal year or a portion of such fiscal year established by the GCP Compensation Committee.
Limitation of Benefits
No participant may be granted awards under the GCP AICP greater than $3 million for any fiscal year, adjusted pro rata for periods shorter than 12 months.
Designation of Performance Period, Participants, and Goals
No later than 90 days after the beginning of the performance period, or, if earlier, before expiration of 25% of the performance period, the GCP Compensation Committee is expected to determine the performance period, the participants for the performance period and the performance goals for determining the award for each participant.
The GCP Compensation Committee may choose one or more of the following performance criteria:
| |
| • | basic or diluted earnings per share of GCP common stock; |
| |
| • | Adjusted Earnings Per Share of GCP common stock (diluted earnings per share of GCP common stock adjusted for restructuring expenses and asset impairments; pension costs other than service and interest costs, expected returns on plan assets, and amortization of prior service costs/credits; specified income and expense items related to divested businesses, product lines, and specified other investments; gains and losses on sales of businesses, product lines and specified other investments; and certain discrete tax items); |
| |
| • | GCP common stock price earnings ratio; |
| |
| • | total stockholder return; |
| |
| • | relative total stock return measured against a set peer group; |
| |
| • | sales (including total sales, net sales and gross sales) of the Company or one (or more) of its operating activities; |
| |
| • | revenue, operating income, net income of the Company or one (or more) of its operating activities (in each case, either before or after taxes); |
| |
| • | Company earnings and/or net income before interest and taxes (EBIT); |
| |
| • | Adjusted EBIT (net income adjusted for: interest income and expense; income taxes; restructuring and repositioning expenses and related asset impairments; pension costs other than service and interest costs, expected returns on plan assets, and amortization of prior service costs/credits; specified income and expense items related to divested businesses, product lines, and specified other investments; and gains and losses on sales of businesses, product lines, and specified other investments); |
| |
| • | Adjusted EBIT Return On Invested Capital (Adjusted EBIT (on a trailing four quarters basis) divided by the sum of net working capital, properties and equipment and specified other assets and liabilities); |
| |
| • | Company earnings and/or net income before interest, taxes, depreciation and amortization (EBITDA); |
| |
| • | Adjusted EBITDA (Adjusted EBIT adjusted for depreciation and amortization); |
| |
| • | operating or other expense of the Company or one (or more) of its operating activities; |
| |
| • | gross, operating or cash flow margin of the Company or one (or more) of its operating activities; |
| |
| • | Segment Gross Margin (gross margin adjusted for pension-related costs included in cost of goods sold); |
| |
| • | return on investment (determined with reference to one or more categories of income or cash flow and one or more categories of assets, capital or equity, including return on net assets, return on sales, return on equity and return on invested capital); |
| |
| • | total cash flow, net cash flow or free cash flow (each as provided by the Company or one (or more) of its operating activities, investing activities, financing activities or any combination thereof); |
| |
| • | Adjusted Free Cash Flow (net cash provided by or used for operating activities minus capital expenditures plus cash flows related to cash paid for restructuring and repositioning, accelerated payments under defined benefit pension arrangements, and expenditures for legacy items); |
| |
| • | gross margins and costs; |
| |
| • | market or industry share; |
| |
| • | days on hand of inventory; |
| |
| • | days payables outstanding; |
| |
| • | objectively determined measures for: productivity increases, efficiency, new product releases, customer satisfaction, diversity, safety performance or employee engagement, satisfaction or turnover. |
All items to be specified in the definitions in the list of performance criteria above will be so specified by the GCP Compensation Committee when the performance goals are established for the performance period. When the GCP Compensation Committee sets the performance goals, it may provide for an adjustment to reflect (or for the exclusion of) extraordinary items, acquisitions, divestitures, asset impairment, capital expenditures, unusual or non-recurring items, cost and expenses related to restructuring and/or repositioning, costs and expenditures related to legacy environmental matters, material tax law changes and/or assessments and the cumulative effect of tax or accounting changes. The performance goals designated by the GCP Compensation Committee may be expressed with respect to the Company’s performance or the performance of one or more subsidiaries, divisions, business segments or business units of the Company, and may be expressed in terms of dollars, rates of growth, absolute levels or percentages or ratios expressing relationships between two or more of the performance criteria, period-to-period changes, relative to business plans or budgets, or relative to one or more other companies or one or more indices. Performance goals may be calculated for a year or a portion of a year.
Determination and Payment of Awards
After the end of the performance period, the GCP Compensation Committee will review actual performance against the pre-established performance goals and determines the extent, if any, to which the performance goals have been met. If performance goals are not met, the participants do not receive any payments under the GCP AICP. If performance goals are met, the amount of the payout to the participant may, in the discretion of the GCP Compensation Committee, be less than the amount otherwise payable to the participant based on the attainment of the performance goals for the performance period. The GCP Compensation Committee may establish factors to take into consideration in implementing its discretion to reduce the amount of a bonus award, including such factors as individual performance and/or one or more of the performance criteria described above. The GCP Compensation Committee, may not, however, increase the amount of an award otherwise payable to a participant based on the attainment of performance goals for the performance period.
Payment of Awards
Awards are payable on or before March 15 of the year following the period for which the performance is measured.
Change in Control
In connection with a change in control of the Company (as defined in the executive severance agreement between each executive officer and the Company), which occurs during a performance period, the GCP Compensation Committee shall take action as to awards under the GCP AICP for such period as it deems necessary and appropriate to treat participants equitably, including modification or waiver of applicable performance goals, performance criteria, performance periods or awards.
Termination of Employment
Generally, a participant whose employment terminates prior to a GCP AICP payout date will not receive a GCP AICP payment. However, in the discretion of the GCP Compensation Committee, a participant who has more than three months service during a performance period and whose employment terminates prior to the payout date may receive a GCP AICP award payment if the employment terminates for any of the following reasons: retirement under a Company retirement plan; death; disability; reduction in force or job elimination,
divestment of the participant’s employing unit or other termination not for “cause” (as determined by the GCP Compensation Committee). If a participant whose employment terminates prior to the end of a year receives a GCP AICP award payment for that year, the amount of the GCP AICP award payment will generally be prorated for the period of the participant’s service during the year and paid at the time the award is paid to active participants. Except in cases of termination of employment due to death or disability, a terminated participant will receive an award for the year of termination only if the performance goals are certified in writing by the GCP Compensation Committee as having been met for the year. In the case of death or disability, the GCP Compensation Committee may grant an award even if the achievement of the applicable performance goals were not met.
Amendment and Termination
The Company’s Board of Directors or the GCP Compensation Committee may amend, modify, suspend or terminate the GCP AICP in whole or in part at any time or from time to time, subject to any requirement of applicable law, including Section 162(m) of the Code, and any applicable stock exchange rule requiring stockholder approval. No amendments to, or termination of, the GCP AICP shall in any way impair the rights of a participant under any award previously granted without the participant's consent.
2016 Stock Incentive Plan
We expect that, prior to the completion of the separation, the Company’s board of directors will adopt, subject to the approval of Grace Conn in its capacity as the Company’s sole stockholder, the GCP Applied Technologies, Inc. 2016 Stock Incentive Plan (which we refer to as the “2016 SIP”). The following summary of the 2016 SIP is qualified in its entirety by reference to the specific provisions of the 2016 SIP, the full text of which is set attached as an Exhibit to the registration statement of which this information statement is a part.
The 2016 SIP is designed to enable the Company to attract, motivate and retain key employees and directors, to link their incentives directly to the performance of the GCP common stock, and to unite their interests with those of the stockholders. The 2016 SIP will be administered by the Company Compensation Committee.
Under the 2016 SIP, “stock incentives” may be granted to key employees and non-employee directors in the form of stock options, stock appreciation rights (“SARs”), stock awards or a combination of any of the foregoing, for such consideration and upon such other terms as the Company Compensation Committee may determine.
Stock Options and Stock Appreciation Rights
The 2016 SIP permits the Company to grant to key employees and directors (1) options to purchase GCP common stock at a purchase price, and (2) SARs (which may be settled in cash or GCP common stock) with an exercise price, in each case equal to not less than 100% of the fair market value of a share of GCP common stock on the date the option or SAR is granted. A SAR is a right to receive, upon the exercise of the SAR by the holder, an amount equal in value to the product of (x) the fair market value of one share of GCP common stock, minus, the per share exercise price of the SAR, and (y) the number of shares of GCP common stock in respect of which the SAR is being exercised. The maximum term of any stock option or SAR will be 10 years from the date of grant. Each option is exercisable at the time or times determined by the Company Compensation Committee.
In general, unless the Company Compensation Committee shall approve a longer period (not to exceed three years), any stock option or SAR held by an employee whose employment terminates prior to exercise will terminate:
| |
| • | when employment terminates, if employment terminates voluntarily, without the consent of the Company Compensation Committee (subject to a 45 day administrative period during which exercise is permitted), or for cause; |
| |
| • | three years after employment terminates, if employment terminates due to death or incapacity; |
| |
| • | three years after employment terminates, if employment terminates due to retirement under a Company retirement plan; or |
| |
| • | three months (subject to extension by the Company Compensation Committee for up to three years) after employment terminates, if employment terminates for another reason; provided however, if the holder |
dies or becomes incapacitated during the three-month period (or such longer period as the Company Compensation Committee approves) the option shall terminate three years after employment termination.
In the event of a change in control, unless the GCP Compensation Committee provides otherwise, any stock options or SARs outstanding under the 2016 SIP that are not exercisable and vested, shall become fully exercisable and vested to the full extent of the original grant. In addition, the GCP Compensation Committee may provide for, among other things, (1) the appropriate adjustments in the number of shares subject to, and exercise prices of, stock options and SARs, if stock options or SARs are assumed or replaced by the successor entity in the change in control, and/or (2) the cancellation of any stock option or SAR upon payment to the holder in cash the excess (if any) of (x) the fair market value of the shares subject to the stock option or SAR as of the date of the change in control, over (y) the aggregate exercise price of the stock option or SAR . For purposes of the 2016 SIP, “change in control” means:
| |
| • | the acquisition of 20% or more of the outstanding GCP common stock (but not if such acquisition is the result of the sale of GCP common stock by the Company that has been approved by the Company Board); |
| |
| • | the failure of Company Board-nominated directors to constitute a majority of any class of the Company Board; |
| |
| • | the occurrence of a transaction in which the shareholders of the Company immediately preceding such transaction do not own more than 50% of the combined voting power of the entity resulting from such transaction; or |
| |
| • | the liquidation or dissolution of the Company. |
In addition, the GCP Compensation Committee may provide that option holders will have the right, subject to certain restrictions, to elect, within the 60-day period following a change in control, to receive, in cancellation of their options, a cash payment equal to (1) the difference between the change in control price and the purchase price per share under their options times (2) the number of shares as to which they are exercising this right. On a change in control, the GCP Compensation Committee also has the right to cancel any stock options resulting in such a cash payment to the option holder.
The 2016 SIP authorizes the grant of "incentive stock options "("ISOs"), which are accorded special tax treatment under Section 422 of the Code, as discussed below, as well as nonstatutory options.
The 2016 SIP specifically prohibits the surrender of an outstanding stock option or SAR in exchange for the grant of a new stock option or SAR with a lower purchase price or the repricing of the stock option or SAR to an exercise price below the price on the date of grant (other than in the case of adjustment for stock splits, recapitalizations and similar events).
The foregoing outlines certain provisions of the 2016 SIP relating to stock options and SARS; documentation relating to individual stock options and SARS may contain other terms.
Stock Awards
The 2016 SIP permits the Company to grant to key employees and directors “stock awards.” A stock award is an issuance of shares of GCP common stock or an undertaking to issue such shares in the future (other than an option or SAR), and includes “restricted stock units”. Stock awards may be settled in GCP common stock, or cash equal to the fair market value of the GCP common stock subject to the stock awards being settled. Shares subject to a stock award are valued at not less than 100% of their fair market value on the date the award is granted, whether or not they are subject to restrictions. We expect that stock awards to employees will in some cases be:
| |
| • | made contingent upon the attainment of one or more specified performance objectives; |
| |
| • | made contingent upon the continued employment or provision of services by the holder to the Company; and/or |
| |
| • | subject to restrictions on the sale or other disposition of the stock awards. |
If stock awards are made contingent upon the attainment of one or more specified performance objectives, they will be subject to one or more of the following criteria, or such other operating objectives selected by the GCP Compensation Committee to measure performance of the Company or any subsidiary or other business division of same for a given performance period, whether in absolute or relative terms: basic or diluted earnings per share of GCP Common Stock; revenue; operating income; net income (either before or after taxes); earnings and/or net income before interest and taxes; earnings and/or net income before interest, taxes, depreciation and amortization; return on capital; return on equity; return on assets; net cash provided by operations; free cash flow; GCP Common Stock price; economic profit; economic value added; total stockholder return; gross margins and costs. These performance metrics may be adjusted to omit the effects of extraordinary items, gain or loss on the disposal of a business segment, unusual or infrequently occurring events and transactions and cumulative effects of changes in accounting principles.
Upon a change in control, unless the GCP Compensation Committee provides otherwise, any stock awards outstanding under the 2016 SIP that are not vested, will vest and become free of all restrictions to the full extent of the original grant. In addition, In addition, the GCP Compensation Committee may provide for, among other things, among other things, the appropriate adjustments in the number of shares subject to the stock awards, if stock awards are assumed or replaced by the successor entity in the change in control.
The foregoing outlines certain features of stock awards required or permitted under the 2016 SIP; documentation relating to individual stock awards may contain other terms.
Limitations
Up to 7,000,000 shares of GCP common stock (subject to adjustment for stock splits, recapitalizations and similar events) may be issued pursuant to stock incentives under the 2016 SIP, and up to 1,000,000 shares of GCP common stock (subject to adjustment for stock splits, recapitalizations and similar events) may be issued to any executive whose compensation is subject to the deduction limitations under Section 162(m) of the Code during any one calendar year.
Shares not issued when a stock incentive terminates, and shares issued pursuant to stock incentives that are subsequently reacquired by the Company from the recipient or his/her estate, will again be available for grants under the 2016 SIP. Further, under the 2016 SIP, for each share of GCP common stock issued under a stock award, three shares of GCP common stock will be regarded as utilized, and for each share of GCP common stock issued under a stock option (excluding shares used in the net settlement of an option) or SAR, one share of GCP common stock will be regarded as utilized, in each case for purposes of determining the number of shares that have been issued under the limitations referenced above. In addition, the 2016 SIP imposes certain limitations upon the grant of ISOs, including that no more than 7,000,000 shares of GCP common stock (subject to adjustment for stock splits, recapitalizations and similar events) may be issued pursuant to ISOs.
Options and SARS are not assignable or transferable except as may be provided in the relevant option or SAR grant agreement and except by will or the laws of descent and distribution and, in the case of nonstatutory options or SARS, pursuant to a qualified domestic relations order (as defined in the Code).
Tax Treatment of Stock Incentives
Under the present provisions of the Code, the federal income tax treatment of stock incentives under the 2016 SIP is as follows. Generally, (a) stock option holders are not taxed upon the receipt of options, but recognize ordinary income upon the exercise of nonstatutory stock options in an amount equal to the difference between the fair market value of the stock acquired and the purchase price paid for such stock and (b) SAR holders are not taxed upon the receipt of SARs, but recognize ordinary income upon the exercise of the SARs in an amount equal to the cash, or fair market value of the shares, being delivered to the holder upon the exercise of the SAR. Holders of ISOs do not recognize ordinary income as a result of the exercise of such options if certain holding period requirements are met. In that case, the ISO holder will recognize capital gain upon disposition of the stock and the Company can take no deduction. The difference between the option price and the fair market value of the stock on the date of exercise of an ISO is generally treated as a minimum tax preference item. Holders of stock awards are generally taxed when stock is delivered and/or vested, or when cash is paid, pursuant to such awards, whichever is earlier. The Company will generally be permitted a tax deduction equal to the amount of ordinary income recognized by the holder of a stock incentive at the time the holder recognizes such income. However, this deduction may be limited with respect to a stock incentive granted to an individual who is the chief executive
officer or one of the three other most highly compensated executive officers of the Company (excluding the chief financial officer) in any year if the award fails to comply with the requirements for "qualified performance-based compensation" under the Section 162(m) of the Code. Under Section 162(m) of the Code, compensation in excess of $1 million for each such individual may not be deducted unless certain exceptions apply such as the exception for performance-based compensation.
The foregoing discussion is provided as general information only and is not intended to be and does not constitute specific tax advice. In addition, it does not address the impact of state and local taxes or securities laws restrictions.
The Company has a right to withhold any sums required by federal, state or local tax laws with respect to the exercise of any option or SAR or the vesting of any stock award, or to require payment of such amounts before shares are delivered under a stock option, SAR or stock award.
General
Authorized but unissued shares of GCP common stock, as well as shares held by the Company or a subsidiary, may be used for purposes of the 2016 SIP.
The 2016 SIP permits certain variations from the terms described above in the case of grants of stock incentives to non-U.S. employees and the assumption of, or the grant of stock incentives in substitution for, stock incentives held by employees of acquired companies. The 2016 SIP may be amended or terminated by the Company Compensation Committee without stockholder approval, except as specified in the 2016 SIP, and except that no amendment or termination may adversely affect any stock incentive granted under the 2016 SIP without the consent of the holder. No preemptive rights are applicable to the shares covered by the 2016 SIP. Any cash proceeds received by the Company in connection with stock incentives granted under the 2016 SIP are expected to be used for general corporate purposes.
It is not possible to state which key employees will be granted stock incentives under the 2016 SIP, or the value or number of shares subject to any particular stock incentive, since these matters will be determined by the Company Compensation Committee in the future based on an individual's ability to contribute to the profitability, growth and success of the Company.
Say-On-Pay Vote
Prior to the separation, the Company was not a public company and did not hold an annual meeting of shareholders. Therefore, the Company has not obtained a say-on-pay advisory vote of the shareholders under Section 14A of the Exchange Act. The Company expects that the Company's Compensation Committee will consider the results of the say-on-pay vote at the first annual meeting of shareholders and future such votes in making compensation decisions for the Company's named executive officers.
EXECUTIVE COMPENSATION
In 2015, GCP was operated as part of Grace by the Grace executive officers. Accordingly, the 2015 Grace named executive officers are also the "named executive officers" of the Company included in the Summary Compensation Table set forth below under "—Compensation Tables" in respect of 2015. With the exception of Mr. Poling, these individuals will not be officers of the Company following the separation (see “Management—Executive Officers Following the Distribution”).
The compensation decisions described in this section with respect to 2015 were made by the Grace Compensation Committee, which is composed entirely of independent directors. Following the separation, executive compensation decisions with respect to the Company will be made by the GCP Compensation Committee, which also will be composed entirely of independent directors.
Unless indicated otherwise, the terms “we”, “our” and “us” in this section refer to Grace.
Compensation Tables
Summary Compensation Table
The following table sets forth the compensation we paid for the periods indicated to our Chief Executive Officer, our Chief Financial Officer and each of our other three most highly compensated executive officers who were executive officers as of December 31, 2015, determined by reference to the total compensation earned by such individuals for 2015 (reduced by the amount set forth in the table below under the caption “Change in Pension Value and Nonqualified Deferred Compensation Earnings”).
|
| | | | | | | | | | | | | | | | | | | | | | | | | | |
Name and
Principal Position | | Year | | Salary
($) | | Bonus
($) | | Stock
Awards(a)($) | | Option
Awards(a)($) | | Non-Equity Incentive Plan Compensation
($) | | Change in Pension Value and Nonqualified Deferred Compensation Earnings (c)($) | | All Other Compensation (d)($) | | Total
($) |
| | | | | | | AICP(b) | | | |
| A. E. Festa | | 2015 | | 975,000 |
| | — |
| | 2,124,975 |
| | 2,131,941 |
| | — |
| | 282,000 |
| | 129,703 |
| | 5,643,619 |
|
| Chairman & Chief | | 2014 | | 975,000 |
| | 1,500,000 |
| | 2,107,352 |
| | 1,935,708 |
| | 824,586 |
| | 1,221,000 |
| | 104,885 |
| | 8,668,531 |
|
| Executive Officer | | 2013 | | 975,000 |
| | — |
| | 1,849,992 |
| | 1,761,324 |
| | 243,750 |
| | 57,000 |
| | 162,603 |
| | 5,049,669 |
|
| | | | | | | | | | | | | | | | | | | |
| H. La Force III | | 2015 | | 500,000 |
| | — |
| | 412,533 |
| | 413,844 |
| | — |
| | 80,000 |
| | 49,266 |
| | 1,455,643 |
|
| Senior Vice President & | | 2014 | | 487,500 |
| | 750,000 |
| | 409,032 |
| | 375,757 |
| | 296,000 |
| | 281,000 |
| | 36,305 |
| | 2,635,594 |
|
| Chief Financial Officer | | 2013 | | 453,333 |
| | — |
| | 399,986 |
| | 380,834 |
| | 94,000 |
| | 64,000 |
| | 46,572 |
| | 1,438,725 |
|
| | | | | | | | | | | | | | | | | | | |
| G. E. Poling | | 2015 | | 616,667 |
| | — |
| | 749,991 |
| | 752,444 |
| | — |
| | 203,000 |
| | 87,126 |
| | 2,409,228 |
|
| President & Chief | | 2014 | | 600,000 |
| | 750,000 |
| | 743,820 |
| | 683,192 |
| | 399,600 |
| | 1,594,000 |
| | 45,515 |
| | 4,816,127 |
|
| Operating Officer | | 2013 | | 579,167 |
| | — |
| | 749,993 |
| | 714,046 |
| | 135,000 |
| | — |
| | 62,004 |
| | 2,240,210 |
|
| | | | | | | | | | | | | | | | | | | |
| M. A. Shelnitz | | 2015 | | 425,000 |
| | — |
| | 274,958 |
| | 275,896 |
| | — |
| | 57,000 |
| | 40,215 |
| | 1,073,069 |
|
| Vice President, General | | 2014 | | 410,417 |
| | 1,000,000 |
| | 272,688 |
| | 250,497 |
| | 220,150 |
| | 874,000 |
| | 29,355 |
| | 3,057,107 |
|
| Counsel & Secretary | | 2013 | | 383,750 |
| | — |
| | 275,038 |
| | 261,820 |
| | 68,250 |
| | — |
| | 38,143 |
| | 1,027,001 |
|
| | | | | | | | | | | | | | | | | | | |
| E. C. Brown | | 2015 | | 372,595 |
| | — |
| | 898,111 |
| | 381,534 |
| | — |
| | 49,000 |
| | 174,159 |
| | 1,875,399 |
|
| Vice President & Chief | | | | | | | | | | | | | | | | | | |
| Human Resources Officer | | | | | | | | | | | | | | | | | | |
___________________________________________________________________________________________________________________
| |
| (a) | Amounts reflect the aggregate grant date fair value of restricted stock unit awards to each executive officer, performance-based unit awards to Ms. Brown (each, in the “Stock Awards” column) and option awards to each executive officer (in the “Option Awards” column), in each case computed in accordance with FASB ASC Topic 718, “Compensation-Stock Compensation.” In the case of restricted stock units and performance-based unit awards, the amounts shown in the Stock Awards column are based on an estimate of aggregate compensation cost to be recognized over the service period determined as of the grant date under FASB ASC Topic 718 excluding the effect of estimated forfeitures. The values of the performance-based unit awards to Ms. Brown at the grant date if the target and highest levels of performance are achieved would be $148,120 and $296,240, respectively. Grace values options using the Black-Scholes option-pricing model, which was developed for use in estimating the fair value of traded options. The risk-free rate is based on the U.S. Treasury yield curve published as of the grant date, with maturities approximating the expected term of the options. The expected term of the options is estimated using the simplified method as allowed by ASC 718-20, whereby the average between the vesting period and contractual term is used. The expected |
volatility was estimated using both actual stock volatility and the volatility of an industry peer group. Grace believes its actual stock volatility in the last several years may not be representative of expected future volatility because of its previous status in Chapter 11. The following summarizes the assumptions used for estimating the fair value of stock options granted during 2015:
|
| |
| | 2015 |
| Expected Volatility | 22.97% - 28.73% |
| Weighted average expected volatility | 24.54% |
| Expected term | 3 - 4 years |
| Risk-free rate | 1.25% - 1.29% |
| Dividend yield | — |
| |
| (b) | Actual 2015 AICP payments to the named executive officers cannot be determined as of the date of this information statement because, as of the date of this information statement, Grace's 2015 audited financial statements have not been completed. We expect the amount of such payments to be determined on or before March 15, 2016, consistent with Grace's historical practices, and we expect the Company to disclose such amounts on or about such date as required by SEC rules. |
| |
| (c) | The 2015 amount consists of the aggregate change in the actuarial present value of the individual's accumulated benefit under the Grace Pension Plan and Grace Supplemental Executive Retirement Plan (SERP) from December 31, 2014, to December 31, 2015, assuming retirement at age 62 with benefits payable on a straight life annuity basis, based on assumptions used for financial reporting purposes under generally accepted accounting principles, including a 4.31% discount rate determined consistent with the methodology set forth in Note 7 (Pension Plans and Other Postretirement Benefits Plans) to the GCP Combined Financial Statements as of December 31, 2014, 2013 and 2012 included in this information statement. Negative amounts are not reflected in the table pursuant to SEC rules. Although these amounts appear as a lump sum, they are generally paid as an annuity. The amount reported is an accounting value and was not realized by the individual in cash during 2015. The amounts include benefits that the individual may not currently be entitled to receive because the executive is not vested in such benefits. No executive officer received preferential or above market earnings on nonqualified deferred compensation. |
| |
| (d) | The 2015 amount consists of the following: |
|
| | | | | | | | | | | | | | | | | | |
| Name | | Personal Benefits* ($) | | S&I Plan Matching Payments ($) | | S&I Plan Replacement Payments ($) | | Liability Insurance ($) | | Relocation Payments** ($) | | Total ($) |
| A. E. Festa | | 21,497 |
| | 14,625 |
| | 92,075 |
| | 1,506 |
| | — |
| | 129,703 |
|
| H. La Force III | | — |
| | 15,900 |
| | 31,860 |
| | 1,506 |
| | — |
| | 49,266 |
|
| G. E. Poling | | — |
| | 15,900 |
| | 45,076 |
| | 1,506 |
| | 24,644 |
| | 87,126 |
|
| M. A. Shelnitz | | — |
| | 15,900 |
| | 22,809 |
| | 1,506 |
| | — |
| | 40,215 |
|
| E. C. Brown | | — |
| | 14,169 |
| | 6,456 |
| | 1,506 |
| | 152,028 |
| | 174,159 |
|
* Consists of our aggregate incremental cost of providing perquisites and other personal benefits or property if the aggregate amount of personal benefits provided to the individual equaled or exceeded $10,000. For Mr. Festa, amount consists of personal use of Grace-provided aircraft, calculated based on personal-use flight hours as a percentage of total flight hours charged to Grace.
** Amount includes tax gross up payments in respect of relocation expenses in the amount of $12,037 for Mr. Poling and $37,243 for Ms. Brown.
Grants of Plan-Based Awards in 2015
The following table provides information regarding grants under our Annual Incentive Compensation Plan, or AICP, and Long Term Incentive Plan, or LTIP, to the executive officers named in the Summary Compensation Table above during 2015.
|
| | | | | | | | | | | | | | | | | | | | | | | | | | | | | | | | | |
| Name | | Plan | | Grant Date | | Estimated Possible Payouts Under Non-Equity Incentive Plan Awards(a) | | Estimated Possible Payouts Under Equity Incentive Plan Awards(b) | | All Other Stock Awards: Number of Shares of Stock (#)(c) | | All Other Option Awards: Number of Securities Underlying Options (#)(d) | | Exercise or Base Price of Option Awards ($/Sh)(e) | | Closing Price on Grant Date ($/Sh) | | Grant Date Fair Value of Stock and Option Awards ($)(f) |
| | Threshold ($) | Target ($) | Maximum ($) | Threshold (#) | Target (#) | Maximum (#) |
| A. E. Festa | | 2015 AICP | | n/a | | 304,688 |
| 1,218,750 |
| 2,437,500 |
| | — |
| — |
| — |
| | — |
| | — |
| | — |
| | — |
| | — |
| | | 2015 LTIP (Option) | | 5/7/2015 | | — |
| — |
| — |
| | — |
| — |
| — |
| | — |
| | 110,671 |
| | 96.01 |
| | 95.82 |
| | 2,131,941 |
|
| | | 2015 LTIP (RSU) | | 5/7/2015 | | — |
| — |
| — |
| | — |
| — |
| — |
| | 22,134 |
| | — |
| | — |
| | — |
| | 2,124,975 |
|
| H. La Force III | | 2015 AICP | | n/a | | 100,000 |
| 400,000 |
| 800,000 |
| | — |
| — |
| — |
| | — |
| | — |
| | — |
| | — |
| | — |
| | | 2015 LTIP (Option) | | 5/7/2015 | | — |
| — |
| — |
| | — |
| — |
| — |
| | — |
| | 21,483 |
| | 96.01 |
| | 95.82 |
| | 413,844 |
|
| | | 2015 LTIP (RSU) | | 5/7/2015 | | — |
| — |
| — |
| | — |
| — |
| — |
| | 4,297 |
| | — |
| | — |
| | — |
| | 412,533 |
|
| G. E. Poling | | 2015 AICP | | n/a | | 141,186 |
| 564,745 |
| 1,129,490 |
| | — |
| — |
| — |
| | — |
| | — |
| | — |
| | — |
| | — |
| | | 2015 LTIP (Option) | | 5/7/2015 | | — |
| — |
| — |
| | — |
| — |
| — |
| | — |
| | 39,060 |
| | 96.01 |
| | 95.82 |
| | 752,444 |
|
| | | 2015 LTIP (RSU) | | 5/7/2015 | | — |
| — |
| — |
| | — |
| — |
| — |
| | 7,812 |
| | — |
| | — |
| | — |
| | 749,991 |
|
| M. A. Shelnitz | | 2015 AICP | | n/a | | 74,375 |
| 297,500 |
| 595,000 |
| | — |
| — |
| — |
| | — |
| | — |
| | — |
| | — |
| | — |
| | | 2015 LTIP (Option) | | 5/7/2015 | | — |
| — |
| — |
| | — |
| — |
| — |
| | — |
| | 14,322 |
| | 96.01 |
| | 95.82 |
| | 275,896 |
|
| | | 2015 LTIP (RSU) | | 5/7/2015 | | — |
| — |
| — |
| | — |
| — |
| — |
| | 2,864 |
| | — |
| | — |
| | — |
| | 274,958 |
|
| E. C. Brown | | 2015 AICP | | n/a | | 65,625 |
| 262,500 |
| 525,000 |
| | — |
| — |
| — |
| | — |
| | — |
| | — |
| | — |
| | — |
| | | New Hire Grant (Option) | | 1/6/2015 | | — |
| — |
| — |
| | — |
| — |
| — |
| | — |
| | 6,441 |
| | 93.15 |
| | 92.18 |
| | 130,719 |
|
| | | 2015 LTIP (Option) | | 5/7/2015 | | — |
| — |
| — |
| | — |
| — |
| — |
| | — |
| | 13,020 |
| | 96.01 |
| | 95.82 |
| | 250,814 |
|
| | | New Hire Grant (PBU) | | 1/6/2015 | | — |
| — |
| — |
| | 805 |
| 1,610 |
| 3,220 |
| | — |
| | — |
| | — |
| | — |
| | 148,120 |
|
| | | 2015 LTIP (RSU) | | 5/7/2015 | | — |
| — |
| — |
| | — |
| — |
| — |
| | 2,604 |
| | — |
| | — |
| | — |
| | 249,997 |
|
| | | 2015 Retention (RSU) | | 5/7/2015 | | — |
| — |
| — |
| | — |
| — |
| — |
| | 5,208 |
| | — |
| | — |
| | — |
| | 499,994 |
|
___________________________________________________________________________________________________________________
| |
| (a) | Amounts are based on base salary rates in effect at the end of the performance period and will be based on performance for fiscal years 2014 to 2016. |
| |
| (b) | The number of PBUs that are earned, if any, will be determined after the close of the performance period on December 31, 2016 and will be based on performance for fiscal years 2014 to 2016. PBUs awarded under the 2014 LTIP are payable on or before March 15, 2017, generally subject to continued employment. |
| |
| (c) | RSUs vest on May 7, 2018, generally subject to continued employment. |
| |
| (d) | Options awarded under the 2015 LTIP are exercisable in one-third increments on May 6, 2016, May 5, 2017, and May 7, 2018, generally subject to continued employment. New hire options awarded to Ms. Brown are exercisable in one-half increments on January 6, 2016 and January 6, 2017. |
| |
| (e) | The exercise price was determined based on the average of the high and low trading prices of Grace common stock on the NYSE on the grant date. |
| |
| (f) | The grant date fair value is generally the amount that Grace would expense in its financial statements over the award’s service period, but does not include a reduction for forfeitures. |
Outstanding Equity Awards at Fiscal Year End 2015
The following table provides information regarding outstanding stock options, restricted stock units, and performance based units held by the executive officers named in the Summary Compensation Table above as of December 31, 2015.
|
| | | | | | | | | | | | | | | | | | | | | | | | | |
| | | Option Awards | | Stock Awards | |
| Name | | Number of Securities Underlying Unexercised Options (#) Exercisable | | Number of Securities Underlying Unexercised Options (#) Unexercisable | | Option Exercise Price ($) | | Option Expiration Date | | Number of Units of Stock That Have Not Vested (#) | | Market Value of Units of Stock That Have Not Vested ($) | | Equity Incentive Plan Awards: Number of Unearned Units That Have Not Vested (#) | | Equity Incentive Plan Awards: Payout Value of Unearned Units That Have Not Vested ($) | |
| A. E. Festa | | — |
| | — |
| | — |
| | — |
| | 22,134 |
| | 2,204,325 |
| (a) | — |
| | — |
| |
| | | — |
| | — |
| | — |
| | — |
| | — |
| | — |
| | 22,906 |
| | 2,281,209 |
| (b) |
| | | — |
| | — |
| | — |
| | — |
| | — |
| | — |
| | 24,134 |
| | 2,403,505 |
| (c) |
| | | — |
| | 110,671 |
| (d) | 96.005 |
| | 5/7/2020 |
| | — |
| | — |
| | — |
| | — |
| |
| | | 30,542 |
| | 61,082 |
| (e) | 92.770 |
| | 5/8/2019 |
| | — |
| | — |
| | — |
| | — |
| |
| | | 60,658 |
| | 30,328 |
| (f) | 76.655 |
| | 5/2/2018 |
| | — |
| | — |
| | — |
| | — |
| |
| | | 162,000 |
| | — |
| | 48.450 |
| | 6/28/2017 |
| | — |
| | — |
| | — |
| | — |
| |
| | 264,290 |
| | — |
| | 42.255 |
| | 5/5/2016 |
| | | | | | | | | |
| H. La Force III | | — |
| | — |
| | — |
| | — |
| | 4,297 |
| | 427,938 |
| (a) | — |
| | — |
| |
| | | — |
| | — |
| | — |
| | — |
| | — |
| | — |
| | 4,446 |
| | 442,777 |
| (b) |
| | | — |
| | — |
| | — |
| | — |
| | — |
| | — |
| | 5,218 |
| | 519,661 |
| (c) |
| | | — |
| | 21,483 |
| (d) | 96.005 |
| | 5/7/2020 |
| | — |
| | — |
| | — |
| | — |
| |
| | | 5,929 |
| | 11,857 |
| (e) | 92.770 |
| | 5/8/2019 |
| | — |
| | — |
| | — |
| | — |
| |
| | | 13,116 |
| | 6,557 |
| (f) | 76.655 |
| | 5/2/2018 |
| | — |
| | — |
| | — |
| | — |
| |
| | | 40,000 |
| | — |
| | 48.450 |
| | 6/28/2017 |
| | — |
| | — |
| | — |
| | — |
| |
| | | 33,000 |
| | — |
| | 42.255 |
| | 5/5/2016 |
| | | | | | | | | |
| G. E. Poling | | — |
| | — |
| | — |
| | — |
| | 7,812 |
| | 777,997 |
| (a) | — |
| | — |
| |
| | | — |
| | — |
| | — |
| | — |
| | — |
| | — |
| | 8,085 |
| | 805,185 |
| (b) |
| | | — |
| | — |
| | — |
| | — |
| | — |
| | — |
| | 9,784 |
| | 974,389 |
| (c) |
| | | — |
| | 39,060 |
| (d) | 96.005 |
| | 5/7/2020 |
| | — |
| | — |
| | — |
| | — |
| |
| | | 10,780 |
| | 21,558 |
| (e) | 92.770 |
| | 5/8/2019 |
| | — |
| | — |
| | — |
| | — |
| |
| | | 24,591 |
| | 12,295 |
| (f) | 76.655 |
| | 5/2/2018 |
| | — |
| | — |
| | — |
| | — |
| |
| | | 81,000 |
| | — |
| | 48.450 |
| | 6/28/2017 |
| | — |
| | — |
| | — |
| | — |
| |
| | | 10,000 |
| | — |
| | 41.250 |
| | 11/3/2016 |
| | — |
| | — |
| | — |
| | — |
| |
| | | 60,000 |
| | — |
| | 42.255 |
| | 5/5/2016 |
| | | | | | | | | |
| M. A. Shelnitz | | — |
| | — |
| | — |
| | — |
| | 2,864 |
| | 285,226 |
| (a) | — |
| | — |
| |
| | | — |
| | — |
| | — |
| | — |
| | — |
| | — |
| | 2,964 |
| | 295,185 |
| (b) |
| | | — |
| | — |
| | — |
| | — |
| | — |
| | — |
| | 3,588 |
| | 357,329 |
| (c) |
| | | — |
| | 14,322 |
| (d) | 96.005 |
| | 5/7/2020 |
| | — |
| | — |
| | — |
| | — |
| |
| | | 3,953 |
| | 7,904 |
| (e) | 92.770 |
| | 5/8/2019 |
| | — |
| | — |
| | — |
| | — |
| |
| | | 9,017 |
| | 4,508 |
| (f) | 76.655 |
| | 5/2/2018 |
| | — |
| | — |
| | — |
| | — |
| |
| | | 27,000 |
| | — |
| | 48.450 |
| | 6/28/2017 |
| | — |
| | — |
| | — |
| | — |
| |
| | | 35,000 |
| | — |
| | 42.255 |
| | 5/5/2016 |
| | | | | | | | | |
| E. C. Brown | | — |
| | — |
| | — |
| | — |
| | 2,604 |
| | 259,332 |
| (a) | — |
| | — |
| |
| | | — |
| | — |
| | — |
| | — |
| | 5,208 |
| | 518,665 |
| (a) | — |
| | — |
| |
| | | — |
| | — |
| | — |
| | — |
| | — |
| | — |
| | 1,610 |
| | 160,340 |
| (b) |
| | | — |
| | 13,020 |
| (d) | 96.005 |
| | 5/7/2020 |
| | — |
| | — |
| | — |
| | — |
| |
| | | — |
| | 6,441 |
| (g) | 93.150 |
| | 1/6/2020 |
| | — |
| | — |
| | — |
| | — |
| |
___________________________________________________________________________________________________________________
| |
| (a) | Market value of restricted stock units that have not been earned is based on the December 31, 2015, closing market price of Grace common stock of $99.59 per share. The restricted stock units will generally be earned or forfeited based on continued employment with Grace through May 7, 2018. |
| |
| (b) | Market value of performance-based units that have not been earned is based on the December 31, 2015, closing market price of Grace common stock of $99.59 per share. The performance-based units will be earned or forfeited based on Grace performance from fiscal year 2014 through fiscal year 2016. Grace's performance for fiscal year 2015 cannot be determined as of the date of this information statement because, as of the date of this information statement. Grace's 2015 audited financial statements have not been completed; therefore, the target payout amounts are shown. |
| |
| (c) | Market value of performance-based units that have not been earned is based on the December 31, 2015, closing market price of Grace common stock of $99.59 per share. The performance-based units will be |
earned or forfeited based on Grace performance from fiscal year 2013 through fiscal year 2015. Grace's performance for fiscal year 2015 cannot be determined as of the date of this information statement because, as of the date of this information statement, Grace's 2015 audited financial statements have not been completed; therefore, the target payout amounts are shown. We expect the amount of performance-based units earned or forfeited will determined on or before March 15, 2016, consistent with Grace's historical practices, and we expect the Company to disclose such amounts on or about such date as required by SEC rules.
| |
| (d) | Options are exercisable in one-third increments on May 6, 2016, May 5, 2017, and May 7, 2018. |
| |
| (e) | Options are exercisable in one-third increments on May 8, 2015, May 6, 2016, and May 8, 2017. |
| |
| (f) | Options are exercisable in one-third increments on May 2, 2014, May 1, 2015, and May 2, 2016. |
| |
| (g) | Options are exercisable in one-half increments on January 6, 2016 and January 6, 2017. |
Option Exercises and Stock Vested in 2015
The following table provides information regarding the exercise of options and the vesting of performance-based units held by the executive officers named in the Summary Compensation Table above during 2015.
|
| | | | | | | | | | | | |
| | | Option Awards | | Stock Awards |
| Name | | Number of Shares Acquired on Exercise (#) | | Value Realized on Exercise ($) | | Number of Shares Acquired on Vesting (#)(a) | | Value Realized on Vesting ($)(a) |
| A. E. Festa | | 200,000 |
| | 14,576,480 |
| | — |
| | — |
|
| H. La Force III | | 57,000 |
| | 3,815,656 |
| | — |
| | — |
|
| G. E. Poling | | 66,938 |
| | 4,830,872 |
| | — |
| | — |
|
| M. A. Shelnitz | | 42,000 |
| | 2,910,524 |
| | — |
| | — |
|
| E. C. Brown | | — |
| | — |
| | — |
| | — |
|
___________________________________________________________________________________________________________________
| |
| (a) | Performance-based units included in 2013 LTIP will be earned or forfeited based on Grace performance from fiscal year 2013 through fiscal year 2015 and any actions of the Grace Compensation Committee. Grace's performance for fiscal year 2015 cannot be determined as of the date of this information statement because, as of the date of this information statement, Grace's 2015 audited financial statements have not been completed. We expect the amount of performance-based units earned will determined on or before March 15, 2016, consistent with Grace's historical practices, and we expect the Company to disclose such amounts on or about such date as required by SEC rules. |
Pension Benefits
The following table provides information regarding benefits under our Retirement Plan for Salaried Employees, or Pension Plan, our Supplemental Executive Retirement Plan, or SERP, and any supplemental pension arrangements under employment agreements for the executive officers named in the Summary Compensation Table above.
|
| | | | | | | | | | | |
| Name | | Plan Name | | Number of Years Credited Service (years) | | Present Value of Accumulated Benefit(a) ($) | | Payments During Last Fiscal Year ($) |
| A. E. Festa | | Pension Plan | | 12.08 |
| | 484,000 |
| | — |
|
| | | SERP | | 12.08 |
| | 3,991,000 |
| | — |
|
| H. La Force III | | Pension Plan | | 7.75 |
| | 256,000 |
| | — |
|
| | | SERP | | 7.75 |
| | 602,000 |
| | — |
|
| G. E. Poling | | Pension Plan | | 36.42 |
| | 1,744,000 |
| | — |
|
| | | SERP | | 36.42 |
| | 5,668,000 |
| | — |
|
| M. A. Shelnitz | | Pension Plan | | 32.17 |
| | 1,369,000 |
| | — |
|
| | | SERP | | 32.17 |
| | 2,388,000 |
| | — |
|
| E. C. Brown | | Pension Plan | | 1.00 |
| | 34,000 |
| | — |
|
| | | SERP | | 1.00 |
| | 15,000 |
| | — |
|
___________________________________________________________________________________________________________________
| |
| (a) | Amounts comprise the actuarial present value of the individual's accumulated benefit under the Pension Plan and SERP as of December 31, 2015, assuming retirement at age 62 with benefits payable on a straight life annuity basis, based on assumptions used for financial reporting purposes under generally accepted accounting principles, including a 4.31% discount rate determined consistent with the methodology set forth in Note 7 (Pension Plans and Other Postretirement Benefits Plans) to the GCP Combined Financial Statements as of December 31, 2014, 2013 and 2012 included in this information statement. The Pension Plan and SERP provide for a reduction in pension benefits to employees that elect early retirement ranging from a 17% reduction for retirement at age 55 to no reduction for retirement at age 62. Although these amounts appear as a lump sum, they are generally paid as an annuity. The amount reported is an accounting value and was not realized by the individual in cash during 2015. The amounts include benefits that the individual may not currently be entitled to receive because the executive is not vested in such benefits. |
Retirement Plan for Salaried Employees
Full-time salaried employees who are 21 or older and who have one or more years of service are eligible to participate in our Retirement Plan for Salaried Employees, or Pension Plan. Under this basic retirement plan, pension benefits are based upon (a) the employee’s average annual compensation for the 60 consecutive months in which his or her compensation is highest during the last 180 months of continuous participation, and (b) the number of years of the employee’s credited Grace service. At age 62, a participant is entitled to full benefits under the Pension Plan but a participant may elect reduced payments upon early retirement beginning at age 55. For purposes of the Pension Plan, compensation generally includes base salary and AICP awards; however, for 2015, federal income tax law limits to $260,000 the annual compensation on which benefits under the Pension Plan may be based.
Supplemental Executive Retirement Plan
We also have an unfunded, nonqualified Supplemental Executive Retirement Plan, or SERP, under which an employee will receive the full pension to which he or she would be entitled in the absence of the limitations described above and other limitations imposed under federal income tax law. In addition, the SERP recognizes deferred base salary, deferred annual incentive compensation awards and, in some cases, periods of employment during which an employee was ineligible to participate in the basic retirement plan. In respect to payments, the SERP generally operates in the same manner as the Pension Plan. Since 2001, we have not permitted deferrals of base salary or incentive compensation.
Non-Qualified Deferred Compensation Plan
The following table summarizes the compensation deferred by the named executive officer pursuant to the provisions of Grace’s incentive compensation plan in 1998, under which certain employees were permitted to voluntarily defer receipt of shares of Grace common stock. Deferred shares under the plan are fully vested and may be distributed to the plan beneficiary upon retirement or termination of service with us. Since 1998, executives may no longer defer receipt of shares under the plan, although existing balances remain in place.
Fiscal Year 2015 Non-Qualified Deferred Compensation
|
| | | | | | | | | | | | | | | | |
| Name | | Executive Contributions in Fiscal Year 2015 ($) | | Registrant Contributions in Fiscal Year 2015 ($) | | Aggregate Earnings in Fiscal Year 2015 ($) | | Aggregate Withdrawals/ Distributions in Fiscal Year 2015 ($) | | Aggregate Balance at Fiscal Year 2015 End ($) | |
| M. A. Shelnitz | | — |
| | — |
| | 39,568 |
| (a) | — |
| | 938,222 |
| (b) |
___________________________________________________________________________________________________________________
| |
| (a) | Amount represents the decrease in value of 9,420.8496 shares of Grace common stock held in the plan based on the closing prices of Grace common stock on December 31, 2014, of $95.39 and December 31, 2015, of $99.59. Amounts reflected are not included in the Summary Compensation Table above because the earnings are not “above market.” |
| |
| (b) | Amount represents the value of 9,420.8496 shares of Grace common stock deferred under the plan based on the closing price of Grace common stock on December 31, 2015, of $99.59. |
Potential Payments Upon Termination or Change-In-Control
The following table sets forth potential payments to executive officers named in the Summary Compensation Table above in the event of the listed events, calculated under the assumption that employment terminated on the last day of 2015. The following table does not include payments pursuant to contracts, agreements, plans and arrangements that do not discriminate in scope, terms or operation, in favor of executive officers and that are available generally to all salaried employees. The value of payments to be made following termination of employment pursuant to the Grace Retirement Plan and the Grace SERP are described above under the caption "—Pension Benefits." The value of payments to be made following termination of employment pursuant to Mr. Shelnitz’s deferred shares arrangement are described above under the caption “—Non-Qualified Deferred Compensation Plan.”
|
| | | | | | | | | | | | | | | |
| Name | | Involuntary Termination Without Cause ($)(a) | | Change-in-Control ($)(b) | | Involuntary Termination Without Cause Following Change-in- Control ($)(c)(d)(e) | | Death ($)(c)(d)(f) | | Disability ($)(c)(d)(g) |
| A. E. Festa | | 3,412,500 |
| | 1,508,907 |
| | 12,213,960 |
| | 5,388,960 |
| | 4,721,460 |
|
| H. La Force III | | 750,000 |
| | 309,557 |
| | 4,009,904 |
| | 1,409,904 |
| | 1,080,737 |
|
| G. E. Poling | | 1,600,000 |
| | 569,041 |
| | 6,330,664 |
| | 2,483,996 |
| | 1,903,996 |
|
| M. A. Shelnitz | | 850,000 |
| | 208,641 |
| | 3,082,476 |
| | 1,042,476 |
| | 723,726 |
|
| E. C. Brown | | 562,500 |
| (h) | 88,157 |
| | 2,454,754 |
| (h) | 654,754 |
| | 442,254 |
|
___________________________________________________________________________________________________________________
| |
| (a) | Consists: (i) in the case of Mr. Festa, of minimum severance payments pursuant to his employment agreement as described below under “—Termination and Change-in-Control Arrangements—CEO Severance Arrangements;” and (ii) in the case of the other executive officers, minimum severance payments pursuant to severance agreements as described below under “—Termination and Change-in-Control Arrangements—Other Executive Officer Severance Arrangements.” Amount excludes LTIP payments (in amounts set forth below in footnote (c)) and/or AICP payments that executive officers may receive in the discretion of the Grace Compensation Committee as described below under “—Termination and Change-in-Control Arrangements.” |
| |
| (b) | Upon change-in-control, stock options immediately become fully vested and exercisable. Amount shown represents the in-the-money value of unvested stock options as of December 31, 2015. |
| |
| (c) | Includes payments under the 2013-2015 and 2014-2016 Performance-based Units (PBUs) calculated as described below under “—Long Term Incentive Plan (Amended and Restated 2011 and 2014 Stock Incentive Plans—Performance-Based Unit (PBU) and Restricted Stock Unit (RSU) Awards)” under the assumption that the PBUs pay out at the target amount as follows: |
|
| | | | | | |
| Name | | 2013-2015 PBUs ($) | | 2014-2016 PBUs ($) |
| A. E. Festa | | 2,403,505 |
| | 1,520,654 |
|
| H. La Force III | | 519,661 |
| | 295,155 |
|
| G. E. Poling | | 974,389 |
| | 536,736 |
|
| M. A. Shelnitz | | 357,329 |
| | 196,770 |
|
| E. C. Brown | | — |
| | 106,883 |
|
| |
| (d) | Includes payments under the 2015-2017 Restricted Stock Units (RSUs) calculated as described below under “-Long Term Incentive Plan (Amended and Restated 2011 and 2014 Stock Incentive Plans—Performance-Based Unit (PBU) and Restricted Stock Unit (RSU) Awards)” as follows: |
|
| | | |
| Name | | 2015-2017 RSUs ($) |
| A. E. Festa | | 489,801 |
|
| H. La Force III | | 95,088 |
|
| G. E. Poling | | 172,871 |
|
| M. A. Shelnitz | | 63,377 |
|
| E. C. Brown | | 172,871 |
|
| |
| (e) | Includes contractual payments pursuant to each executive’s respective Change-in-Control Severance Agreement calculated under the assumption that no excise tax will apply as follows: |
|
| | | |
| Name | | Change-in-Control Severance Payments ($) |
| A. E. Festa | | 7,800,000 |
|
| H. La Force III | | 3,100,000 |
|
| G. E. Poling | | 4,646,668 |
|
| M. A. Shelnitz | | 2,465,000 |
|
| E. C. Brown | | 2,175,000 |
|
| |
| (f) | Includes the sum of payments under the Grace Executive Salary Protection Plan (“ESPP”) during the first year following death. Amount excludes AICP payments executive officers may receive under certain circumstances in the discretion of the Grace Compensation Committee as described below under “-Termination and Change-in-Control Arrangements.” During subsequent years after death until the specified termination year (reflecting the executive officer’s age as of December 31, 2015), the sum of payments each year would be as follows: |
|
| | | | | |
| Name | | ESPP Payments Each Year Following Year of Death ($) | | Year of Termination of Payments* |
| A. E. Festa | | 487,500 |
| | 2025 |
| H. La Force III | | 250,000 |
| | 2026 |
| G. E. Poling | | 400,000 |
| | 2021 |
| M. A. Shelnitz | | 212,500 |
| | 2024 |
| E. C. Brown | | 187,500 |
| | 2026 |
___________________________________________________________________________________________________________________
* Payments terminate 10 years following death; however, if the executive officer is over age 55 at the time of death, the duration of payments is reduced.
| |
| (g) | Includes sum of payments under the ESPP during the first year following disability, assuming the executive officer remains disabled for at least 12 consecutive months. Amounts reflect the offset of expected payments under Grace’s long-term and short-term disability plans that are based, in part, on the duration of the executive officer’s employment. Amount excludes AICP payments executive officers may receive under certain circumstances in the discretion of the Grace Compensation Committee as described below under “— |
Termination and Change-in-Control Arrangements—Annual Incentive Compensation Plan.” During subsequent years after disability until the specified termination year or earlier death or end of disability, the sum of payments each year would be:
|
| | | | |
| Name* | | ESPP Payments Each Year Following Year of Disability ($) | | Year of Termination of Payments |
| A. E. Festa | | 225,000 | | 2024 |
| H. La Force III | | 50,000 | | 2029 |
| G. E. Poling | | 120,000 | | 2020 |
| M. A. Shelnitz | | 42,500 | | 2023 |
| E. C. Brown | | 37,500 | | 2028 |
___________________________________________________________________________________________________________________
* Due to the offset of expected payments under Grace’s long-term and short-term disability plans, Grace expects that Mr. Poling would not receive any additional payments under the ESPP after the first year of disability.
| |
| (h) | In addition, in the event of the involuntary termination by Grace of Ms. Brown's employment, without cause or performance issues, within two years of her relocation to Columbia Maryland, Grace will pay all necessary moving expenses, including tax gross-ups, to a location of her choice within the continental United States. |
Termination and Change-in-Control Arrangements
Change-in-Control Severance Agreements
We have entered into change-in-control severance agreements with all of our executive officers, which renew automatically unless the Grace Board of Directors elects not to renew them. These agreements generally provide that in the event of the involuntary termination of the individual’s employment without cause (including constructive termination caused by a material reduction in his or her authority or responsibility or by certain other circumstances) following a “change-in-control,” he or she will generally receive a severance payment equal to three times the sum of his or her annual base salary plus target annual incentive compensation, subject to reduction, pro rata in the case of an executive officer who is within 36 months of normal retirement age (65) or, under certain circumstances, to minimize the effect of certain excise taxes if applicable. For purposes of the severance agreements, “change-in-control” means the acquisition of 20% or more of the outstanding Grace common stock (but not if such acquisition is the result of the sale of common stock by Grace that has been approved by Grace’s Board of Directors), the failure of Board-nominated directors to constitute a majority of any class of Grace’s Board of Directors, the occurrence of a transaction in which the shareholders of Grace immediately preceding such transaction do not own more than 50% of the combined voting power of the entity resulting from such transaction, or the liquidation or dissolution of Grace. The severance amount would be paid in a single lump-sum after termination. Our change-in-control severance agreements do not provide for any “gross up” or other payments in respect of taxes owed by our executive officers following a termination of employment.
CEO Severance Arrangements
Under the terms of Mr. Festa’s employment agreement, if we terminate Mr. Festa’s employment without cause, or he terminates his employment as a result of constructive discharge, he would be entitled to a severance payment equal to two times a dollar amount equal to 175% of his annual base salary at the time of his termination. The severance amount would be paid in installments over a period of 24 months; however, at Mr. Festa’s option, as approved by the Grace Compensation Committee, the entire severance amount may be paid in a single lump-sum after termination. Severance payments under Mr. Festa’s employment agreement are contingent upon Mr. Festa’s execution of an agreement releasing Grace from liabilities related to Mr. Festa’s employment by Grace.
Other Executive Officer Severance Arrangements
We have entered into severance arrangements with Messrs. La Force, Poling and Shelnitz and Ms. Brown. Under the terms of the severance arrangements applicable to these named executive officers, in the event of the involuntary termination of the executive officer’s employment under circumstances that would qualify the executive officer for severance pay under the severance plan that generally covers our salaried employees, the executive officer would be entitled to severance pay equal to two times his or her annual base salary, in the case
of Messrs. Poling and Shelnitz, or one and one-half times his or her annual base salary, in the case of Mr. La Force and Ms. Brown. The severance amount would be paid in installments in the form of salary continuation; however an executive officer could elect to receive the entire severance amount as a single lump sum after termination in conjunction with the termination of certain employee benefit coverage. Severance payments are contingent upon the named executive officer’s execution of an agreement releasing Grace from liabilities related to his or her employment by Grace. In connection with the separation, we have agreed that, in the event of the involuntary termination by Grace of Ms. Brown's employment, without cause or performance issues, within two years of her relocation to Columbia Maryland, Grace will pay all necessary moving expenses, including tax gross-ups, to a location of her choice within the continental United States. Other than with respect to the amount of severance and Ms. Brown's relocation arrangement, the severance arrangements for these named executive officers are the same.
Executive Salary Protection Plan
All executive officers participate in the Executive Salary Protection Plan which provides that, in the event of a participant’s disability or death prior to age 70, we will continue to pay all or a portion of base salary to the participant or a beneficiary for a period based on the participant’s age at the time of disability or death. Payments under the plan may not exceed 100% of base salary for the first year and 60% thereafter in the case of disability (50% in the case of death). Any payment under the plan as a result of disability would be reduced by the amount of disability income received under Grace’s long-term and short-term disability plans that are generally applicable to U.S. salaried employees. The payments would be paid in installments in the form of salary continuation.
Annual Incentive Compensation Plan
An employee whose employment terminates prior to an AICP payout date will generally not receive an AICP payment. However, an employee whose employment terminates prior to the payout date may receive an AICP award payment in the discretion of the Grace Compensation Committee. If an employee whose employment terminates prior to the end of a year receives an AICP award payment for that year, the amount of the AICP award payment will generally be prorated for the period of the employee’s service during the year and paid at the time the award is paid to active Grace employees.
Long Term Incentive Plan (Amended and Restated 2011 and 2014 Stock Incentive Plans—Performance-Based Unit (PBU) and Restricted Stock Unit (RSU) Awards)
An employee whose employment terminates prior to the payout date will forfeit any unpaid PBU or RSU award payment if employment terminates for any of the following reasons:
| |
| • | voluntary termination without the consent of the Grace Compensation Committee; |
| |
| • | retirement under a Grace retirement plan prior to age 62 without the consent of the Grace Compensation Committee; or |
An employee whose employment terminates prior to the payout date will receive a PBU or RSU award payment if employment terminates for any of the following reasons:
| |
| • | retirement under a Grace retirement plan either at or after age 62; |
| |
| • | involuntary termination after a change in control of Grace (“change in control” means that a person beneficially owns 20% or more of the outstanding Grace common stock (but not if such ownership is the result of the sale of Grace common stock by Grace that has been approved by Grace’s Board of Directors or pursuant to a plan of reorganization that is confirmed and effective), the failure of Board-nominated directors to constitute a majority of any class of the Grace Board of Directors, the occurrence of a corporate transaction in which the shareholders of Grace immediately preceding such transaction do not own more than 50% of the combined voting power of the entity resulting from such transaction, or the liquidation or dissolution of Grace). |
In the discretion of the Grace Compensation Committee, an employee whose employment terminates for a reason that is not described above (i.e. involuntary termination not for cause or transfer to the buyer of a Grace business unit) prior to the payout date may receive a PBU or RSU award payment. If an employee whose
employment terminates prior to the end of a PBU or RSU performance period receives a PBU or RSU award payment for that performance period, the amount of the PBU or RSU award payment will generally be prorated for the period of the employee’s service during the performance period and paid at the time the award is paid to active Grace employees.
Long Term Incentive Plan (2011, Amended and Restated 2011 and 2014 Stock Incentive Plans—Stock Option Awards)
Any stock option held by an employee whose employment terminates prior to exercise will terminate:
| |
| • | when employment terminates, if employment terminates voluntarily, without the consent of the Grace Compensation Committee, or for cause; |
| |
| • | three years after employment terminates, if employment terminates due to death or incapacity; |
| |
| • | three years after employment terminates, if employment terminates due to retirement under a Grace retirement plan, provided the employee continues to serve Grace until the first installment of the stock option becomes exercisable; or |
| |
| • | three months (subject to extension by the Grace Compensation Committee for up to three years) after employment terminates, if employment terminates for another reason; however, if the holder dies or becomes incapacitated during the three-month period (or such longer period as the Compensation Committee approves) the option shall terminate three years after employment termination. |
In the event of a Change in Control, any Grace stock options outstanding under the 2011, Amended and Restated 2011 and 2014 Stock Incentive Plans that are not exercisable and vested, shall become fully exercisable and vested to the full extent of the original grant. For purposes of the 2011, Amended and Restated 2011 and 2014 Stock Incentive Plans, “change in control” means:
| |
| • | the acquisition of 20% or more of the outstanding common stock of Grace (but not if such acquisition is the result of the sale of Grace common stock by Grace that has been approved by Grace’s Board of Directors); |
| |
| • | the failure of Board-nominated directors to constitute a majority of any class of the Grace Board of Directors; |
| |
| • | the occurrence of a transaction in which the shareholders of Grace immediately preceding such transaction do not own more than 50% of the combined voting power of the entity resulting from such transaction; or |
| |
| • | the liquidation or dissolution of Grace. |
NON-EMPLOYEE DIRECTOR COMPENSATION
The Company's non-employee directors will receive compensation for their services on the Company's board of directors. Following the separation, we expect the Company's director compensation programs and amounts will be structured similarly to those currently in place at Grace. We expect that the Company will have a non-executive Chairman of the Board whose compensation will be structured similarly to that of the Grace Lead Independent Director.The primary elements of our non-employee director compensation are expected to consist of a combination of equity compensation and cash compensation. We expect that Mr. Poling will receive no additional compensation for serving as a member of the Company's board of directors. Information on Grace’s non-employee director compensation is included below.
Grace Non-Employee Director Compensation
Grace’s director compensation program is intended to enhance Grace's ability to attract, retain, and motivate nonemployee directors of exceptional ability and to promote the common interest of directors and shareholders in enhancing the value of Grace. The Grace Compensation Committee reviews director compensation at least annually. The Grace Compensation Committee has the sole authority to engage a consulting firm to evaluate director compensation and, in 2015, engaged Towers Watson, a human resources consulting firm, to assist in establishing director compensation. The Grace Compensation Committee determines director compensation based on recommendations and information provided by Towers Watson and based on reviewing commercially available survey data from Towers Watson related to general industry director compensation trends at companies
of comparable size and Grace’s peer group companies (as described under the caption “Compensation Discussion and Analysis”).
Under Grace’s compensation program for nonemployee directors, each nonemployee director receives an annual retainer of $180,000 that is split between cash and equity. For any portion of a retainer denominated in cash but paid in shares of Grace common stock, Grace calculates the number of shares of common stock to be issued by dividing the amount payable in shares of Grace common stock by the fair market value per share. The fair market value per share is the closing price of the Grace common stock on the date of grant. If any calculation would result in a fractional share being issued, Grace rounds the amount of equity to be issued up to the nearest whole share. Under this program, each nonemployee director receives an annual retainer of $80,000 paid quarterly in cash and an annual award of approximately $100,000 of Grace common stock generally issued in May. Additional annual cash retainers are paid in December as follows: the Lead Independent Director receives $20,000; the Audit Committee Chair receives $15,000; and the Chairs of the Compensation and the Nominating and Governance Committees of the Grace Board of Directors each receive $10,000. Grace reimburses directors for expenses they incur in attending board and committee meetings and other activities incidental to their service as directors, but Grace’s directors are not paid any separate meeting fees. Grace’s directors, and all Grace employees, are entitled to participate in the Grace Foundation's Matching Grants Program. Grace also maintains business travel accident insurance coverage for its directors.
SECURITY OWNERSHIP OF CERTAIN BENEFICIAL OWNERS AND MANAGEMENT
As of the date of this information statement, all of the outstanding shares of GCP common stock are owned by Grace. After the distribution, Grace will not directly or indirectly own any GCP common stock.
Following the distribution, the Company will have outstanding an aggregate of 70,612,425 shares of common stock based upon 70,612,425 shares of Grace common stock outstanding on November 30, 2015, the application of the distribution ratio of one share of GCP common stock for each share of Grace common stock held as of the record date and the assumption that there will be no issuances of Grace common stock on the exercise of outstanding stock options or otherwise.
The following table sets forth the expected amount of GCP common stock that will be beneficially owned, directly or indirectly, immediately following the separation, based on holdings of Grace common stock as of November 30, 2015, (unless some other date or basis for the share amounts is indicated in the applicable footnotes) and assuming the application of a distribution ratio of one share of GCP common stock for every one share of Grace common stock, no issuances of Grace common stock and no changes in the beneficial ownership of the listed holders, by:
| |
| • | each person that we believe is the beneficial owner of more than 5% of the outstanding shares of Grace common stock; |
| |
| • | each person who we expect to be elected as a director of the Company following the separation, referred to as expected directors; |
| |
| • | each of the executive officers named in the Summary Compensation Table set forth in "Executive Compensation—Compensation Tables"; and |
| |
| • | all expected directors and all executive officers as a group. |
In 2015, GCP was operated as part of Grace by the Grace' s executive officers. Accordingly, GCP's officers named in the Summary Compensation Table are the 2015 Grace executive officers and the Company's directors are currently Grace executive officers. With the exception of Mr. Poling, these individuals will not be officers or directors of the Company following the separation (see “Management—Executive Officers Following the Distribution”).
Except as otherwise noted in the footnotes below, each person or entity identified below has sole voting and investment power with respect to such securities. To the extent the expected directors and Grace executive officers own Grace common stock at the record date for the distribution, they will participate in the distribution on the same terms as other holders of Grace common stock.
|
| | | | | | |
| Name and Address of Beneficial Owner(1)(2) | | Shares of Common Stock Beneficially Owned | | Percent(3) |
| Iridian Asset Management LLC(4) | | 7,504,232 |
| | 10.6 | % |
David L. Cohen
Harold J. Levy | | | | |
276 Post Road West
Westport, CT 06880-4704 | | | | |
| The Vanguard Group, Inc.(5) | | 4,291,635 |
| | 6.1 | % |
100 Vanguard Blvd. Malvern, PA 19355 | | | | |
| M. J. Avedon | | — |
| | * |
|
| R. C. Cambre | | 11,042 |
| | * |
|
| M. A. Fox | | 50,267 |
| | |
|
| | | 8,942 |
| (T) | |
|
| | | 59,209 |
| | * |
|
| J. K. Henry | | 4,921 |
| | * |
|
P. J. Mason | | — |
| | * |
|
| E. Mora | | — |
| | * |
|
| D. R. Shepherd | | — |
| | * |
|
| E. C. Brown | | 3,221 |
| (O) | * |
|
| A. E. Festa | | 150,517 |
| | |
|
| | | 517,490 |
| (O) | |
|
| | | 668,007 |
| | * |
|
| H. La Force III | | 50,000 |
| | |
|
| | | 92,045 |
| (O) | |
|
| | | 142,045 |
| | * |
|
| G. E. Poling | | 186,371 |
| (O) | |
|
| | | 41,813 |
| (T) | |
|
| | | 228,184 |
| | * |
|
| M. A. Shelnitz | | 53,500 |
| | |
|
| | | 74,970 |
| (O) | |
|
| | | 9,421 |
| (T) | |
|
| | | 137,891 |
| | * |
|
| Expected directors and executive officers as a group (13 persons) | | 323,247 |
| | |
| | | 879,742 |
| (O) | |
|
| | | 60,176 |
| (T) | |
| | | 1,263,165 |
| | 1.8 | % |
___________________________________________________________________________________________________________________
* Indicates less than 1%
| |
| (O) | Pursuant to SEC rules, shares of Grace common stock to be issued upon the exercise of Grace common stock options that are exercisable, and shares of restricted Grace common stock that will vest, within 60 days after after November 30, 2015 are deemed to be beneficially owned as of November 30, 2015. For purposes of this table, shares of Grace common stock underlying such options and such shares of restricted Grace common stock are treated as outstanding as of November 30, 2015 and converted into GCP common stock based upon the distribution ratio. |
| |
| (T) | Shares owned by trusts and other entities as to which the person has the power to direct voting and/or investment. |
| |
| (1) | The address of each of our proposed directors and executive officers is c/o Corporate Secretary, W. R. Grace & Co., 7500 Grace Drive, Columbia, Maryland 21044. |
| |
| (2) | Except as otherwise indicated, to our knowledge, each individual, along with his or her spouse, has sole voting and investment power over the shares. |
| |
| (3) | Based on 70,612,425 shares of Grace common stock outstanding on November 30, 2015. |
| |
| (4) | The ownership information set forth is based in its entirety on material contained in a Schedule 13G/A filed with the SEC by Iridian Asset Management LLC ("Iridian"), David L. Cohen and Harold J. Levy on May 6, 2015. Iridian is majority owned by Arovid Associates LLC. Arovid is owned and controlled by the following: 12.5% by Mr. Cohen, 12.5% by Mr. Levy, 37.5% by LLMD LLC and 37.5% by ALHERO LLC. LLMD LLC is owned 1% by Mr. Cohen and 99% by a family trust controlled by Mr. Cohen. ALHERO LLC is owned 1% by Mr. Levy and 99% by a family trust controlled by Mr. Levy. Iridian has shared voting and investment power with respect to 6,714,485 shares held in accounts for which it serves as the investment adviser. Messrs. Cohen and Levy may be deemed to possess beneficial ownership of the shares of Common Stock beneficially owned by Iridian by virtue of their indirect controlling ownership of Iridian and having the shared voting and investment power over shares of Common Stock owned by Iridian as joint Chief Investment Officers of Iridian. Messrs. Cohen and Levy disclaim beneficial ownership of such shares. |
| |
| (5) | The ownership information set forth is based in its entirety on material contained in a Schedule 13G/A filed with the SEC by The Vanguard Group, Inc. ("VGI") on February 10, 2015. VGI has sole voting power over 50,149 shares and sole and shared investment power over 4,247,886 and 43,749 shares, respectively. Vanguard Fiduciary Trust Company, a wholly-owned subsidiary of VGI, is the beneficial owner of 43,749 shares as a result of serving as investment manager of collective trust accounts. Vanguard Investments Australia, Ltd., a wholly-owned subsidiary of VGI, is the beneficial owner of 6,400 shares as a result of its serving as investment manager of Australian investment offerings. |
CERTAIN RELATIONSHIPS AND RELATED TRANSACTIONS
The Separation from Grace
The separation will be accomplished by means of the distribution by W. R. Grace & Co. of all of the outstanding shares of GCP common stock to holders of Grace common stock entitled to such distribution, as described under “The Separation and Distribution” included elsewhere in this information statement. Completion of the distribution will be subject to satisfaction or waiver by Grace of the conditions to the distribution described under “The Separation and Distribution-Conditions to the Distribution.”
Related Party Transactions
Under the Corporate Governance Principles to be in effect as of the distribution date, a related party transaction is a transaction that is required to be disclosed pursuant to Section 404(a) of Regulation S-K of the SEC, which generally requires disclosure of transactions in which the Company (including its affiliates) is a participant and in which any director or executive officer (or their immediate family members) had or will have a direct or indirect material interest. Any such transaction or relationship will be reviewed and subject to approval or ratification by the disinterested members of the audit committee of the Company’s board of directors, if the disinterested members constitute a majority of the audit committee, or otherwise by the disinterested members of the Company’s board of directors. The Company's Corporate Governance Principles to be in effect as of the distribution date will require (1) directors to promptly inform the Chair of the board of directors (or the Chair of the audit committee, in the case of the Chair of the board of directors) of an actual or potential conflict of interest that arises for the director and (2) executive officers to promptly inform the Chair of the Audit Committee of an actual or potential conflict of interest that arises for the executive officer.
Agreements with Grace
As part of our separation from Grace, the Company will enter into a Separation and Distribution Agreement and several other agreements with Grace to effect the separation and provide a framework for the Company's relationships with Grace after the separation. These agreements will provide for the allocation between the Company and Grace of the assets, liabilities and obligations of Grace and its subsidiaries, and will govern the relationships between the Company and Grace subsequent to the separation (including with respect to transition services, employee matters and tax matters). In addition to the Separation and Distribution Agreement (which will contain many of the key provisions related to our separation from Grace and the distribution of shares of GCP common stock to Grace shareholders), these agreements include:
| |
| • | Employee Matters Agreement; |
| |
| • | Transition Services Agreement; |
| |
| • | Cross-License Agreement; and |
| |
| • | Grace Transitional License Agreement. |
The forms of certain of the principal agreements described below are filed as exhibits to the registration statement on Form 10 of which this information statement is a part. These summaries are qualified in their entirety by reference to the full text of the applicable agreements, which is incorporated by reference into this information statement.
The terms of the agreements described below that will be in effect following the separation have not yet been finalized. Changes, some of which may be material, may be made prior to our separation from Grace. No changes may be made after the separation without the Company’s consent.
Separation and Distribution Agreement
Transfer of Assets and Assumption of Liabilities
The Separation and Distribution Agreement will identify the assets to be transferred, the liabilities to be assumed and the contracts to be assigned to each of the Company and Grace as part of the separation of Grace
into two companies, and it will provide for when and how these transfers, assumptions and assignments will occur.
In particular, the Separation and Distribution Agreement will provide, among other things, that subject to the terms and conditions contained therein:
| |
| • | Certain assets related to the GCP business, which are referred to as the “GCP Assets,” will be transferred to the Company from entities that will be Grace entities after the separation, including: |
| |
| ◦ | equity interests in certain Grace subsidiaries that hold assets relating to the GCP business; |
| |
| ◦ | contracts that primarily relate to the GCP business; |
| |
| ◦ | information, technology, software and intellectual property related to the GCP Assets, the GCP Liabilities, or the GCP business; |
| |
| ◦ | real property primarily related to the GCP business; |
| |
| ◦ | rights and assets expressly allocated to the Company pursuant to the terms of the Separation and Distribution Agreement or certain other agreements entered into in connection with the separation; and |
| |
| ◦ | permits that primarily relate to the GCP business. |
| |
| • | Certain liabilities related to the GCP business or the GCP Assets, which are referred to as the “GCP Liabilities,” will be retained or assumed by the Company. |
| |
| • | All of the assets and liabilities (including whether accrued, contingent, or otherwise) other than the GCP Assets and GCP Liabilities (such assets and liabilities, other that the GCP Assets and the GCP Liabilities, referred to as the Grace Assets and Grace Liabilities, respectively) will be retained or assumed by Grace. |
| |
| • | Certain assets related to the Grace business, which are referred to as the “Grace Assets,” will be transferred to Grace from entities that will be the Company's entities after the separation, including: |
| |
| ◦ | equity interests in certain Grace subsidiaries that hold assets relating to the Grace business; |
| |
| ◦ | contracts that primarily relate to the Grace business; |
| |
| ◦ | information, technology, software and intellectual property related to the Grace Assets, the Grace Liabilities, or the Grace business; |
| |
| ◦ | real property primarily related to the Grace business; |
| |
| ◦ | rights and assets expressly allocated to Grace pursuant to the terms of the Separation and Distribution Agreement or certain other agreements entered into in connection with the separation; and |
| |
| ◦ | permits that primarily relate to the Grace business. |
| |
| • | Certain liabilities related to the Grace business or the Grace Assets, which are referred to as the “Grace Liabilities,” will be retained or assumed by Grace. |
| |
| • | All of the assets and liabilities (including whether accrued, contingent, or otherwise) other than the Grace Assets and Grace Liabilities (such assets and liabilities, other that the Grace Assets and the Grace Liabilities, referred to as the GCP Assets and GCP Liabilities, respectively) will be retained or assumed by the Company. |
Except as expressly set forth in the Separation and Distribution Agreement or any ancillary agreement, neither the Company nor Grace will make any representation or warranty as to the assets, business or liabilities transferred or assumed as part of the separation, as to any approvals or notifications required in connection with the transfers, as to the value of or the freedom from any security interests of any of the assets transferred, as to the absence or presence of any defenses or right of setoff or freedom from counterclaim with respect to any claim
or other asset of either the Company or Grace, or as to the legal sufficiency of any assignment, document or instrument delivered to convey title to any asset or thing of value to be transferred in connection with the separation. All assets will be transferred on an “as is,” “where is” basis and the respective transferees will bear the economic and legal risks that any conveyance will prove to be insufficient to vest in the transferee good and marketable title, free and clear of all security interests, and that any necessary consents or governmental approvals are not obtained or that any requirements of laws, agreements, security interests, or judgments are not complied with.
Information in this information statement with respect to the assets and liabilities of the parties following the distribution is presented based on the allocation of such assets and liabilities pursuant to the Separation and Distribution Agreement, unless the context otherwise requires. The Separation and Distribution Agreement will provide that, in the event that the transfer or assignment of certain assets and liabilities to the Company or Grace, as applicable, does not occur prior to the separation, then until such assets or liabilities are able to be transferred or assigned, the Company or Grace, as applicable, will hold such assets on behalf and for the benefit of the other party and will pay, perform, and discharge such liabilities, for which the other party will reimburse the Company or Grace, as applicable, for all commercially reasonable payments made in connection with the performance and discharge of such liabilities.
The Distribution
The Separation and Distribution Agreement will also govern the rights and obligations of the parties regarding the distribution following the completion of the separation. On the distribution date, Grace will distribute to its shareholders that hold Grace common shares as of the record date for the distribution all of the issued and outstanding shares of GCP common stock on a pro rata basis.
Conditions to the Distribution
The Separation and Distribution Agreement will provide that the distribution is subject to satisfaction (or waiver by Grace) of certain conditions. These conditions are described under “The Separation and Distribution-Conditions to the Distribution.” Grace will have the sole and absolute discretion to determine (and change) the terms of, and to determine whether to proceed with, the distribution and, to the extent it determines to so proceed, to determine the record date for the distribution, the distribution date and the distribution ratio.
Claims
In general, each party to the Separation and Distribution Agreement will assume liability for all pending, threatened and unasserted legal matters related to its own business or its assumed or retained liabilities and will indemnify the other party for any liability to the extent arising out of or resulting from such assumed or retained legal matters.
Releases
The Separation and Distribution Agreement will provide that the Company and its affiliates will release and discharge Grace and its affiliates from all liabilities assumed by the Company as part of the separation, from all acts and events occurring or failing to occur, and all conditions existing, on or before the distribution date relating to the Company’s business, and from all liabilities existing or arising in connection with the implementation of the separation, except as expressly set forth in the Separation and Distribution Agreement. Grace and its affiliates will release and discharge the Company and its affiliates from all liabilities retained by Grace and its affiliates as part of the separation and from all liabilities existing or arising in connection with the implementation of the separation, except as expressly set forth in the Separation and Distribution Agreement.
These releases will not extend to obligations or liabilities under any agreements between the parties that remain in effect following the separation, which agreements include, but are not limited to, the Separation and Distribution Agreement, the Transition Services Agreement, the Tax Sharing Agreement, the Employee Matters Agreement, and certain other agreements, including the intellectual property agreements and the transfer documents in connection with the separation.
Indemnification
In the Separation and Distribution Agreement, the Company will agree to indemnify, defend and hold harmless Grace, each of its affiliates and each of their respective directors, officers and employees, from and against all liabilities relating to, arising out of or resulting from:
| |
| • | the failure of the Company or any other person to pay, perform or otherwise promptly discharge any of the GCP Liabilities, in accordance with their respective terms, whether prior to, at or after the distribution; |
| |
| • | except to the extent relating to a Grace Liability, any guarantee, indemnification or contribution obligation for the benefit of the Company by Grace that survives the distribution; |
| |
| • | any breach by the Company of the Separation and Distribution Agreement or any of the ancillary agreements; and |
| |
| • | any untrue statement or alleged untrue statement or omission or alleged omission of material fact in the registration statement of which this information statement forms a part, or in this information statement (as amended or supplemented). |
Grace will agree to indemnify, defend and hold harmless the Company, each of its affiliates and each of its respective directors, officers and employees from and against all liabilities relating to, arising out of or resulting from:
| |
| • | the failure of Grace or any other person to pay, perform, or otherwise promptly discharge any of the Grace Liabilities, in accordance with their respective terms whether prior to, at, or after the distribution; |
| |
| • | except to the extent relating to a GCP Liability, any guarantee, indemnification or contribution obligation for the benefit of Grace by the Company that survives the distribution; |
| |
| • | any breach by Grace of the Separation and Distribution Agreement or any of the ancillary agreements; and |
| |
| • | any untrue statement or alleged untrue statement or omission or alleged omission of a material fact made explicitly in Grace’s name in the registration statement of which this information statement forms a part, or in this information statement (as amended or supplemented). |
The Separation and Distribution Agreement will also establish procedures with respect to claims subject to indemnification and related matters.
Insurance
The Separation and Distribution Agreement will provide for the allocation between the parties of rights and obligations under existing insurance policies with respect to occurrences prior to the distribution and sets forth procedures for the administration of insured claims.
Further Assurances
In addition to the actions specifically provided for in the Separation and Distribution Agreement, except as otherwise set forth therein or in any ancillary agreement, both the Company and Grace will agree in the Separation and Distribution Agreement to use reasonable best efforts, prior to, on and after the distribution date, to take, or cause to be taken, all actions, and to do, or cause to be done, all things necessary, proper or advisable under applicable laws, regulations and agreements to consummate and make effective the transactions contemplated by the Separation and Distribution Agreement and the ancillary agreements.
Dispute Resolution
The Separation and Distribution Agreement will contain provisions that govern, except as otherwise provided in any ancillary agreement, the resolution of disputes, controversies or claims that may arise between the Company and Grace related to the separation or distribution and that are unable to be resolved by the transition committee. These provisions will contemplate that efforts will be made to resolve disputes, controversies and claims by escalation of the matter to executives of the Company and Grace. If such efforts are not successful, either the Company or Grace may submit the dispute, controversy or claim to nonbinding mediation or, if such nonbinding mediation is not successful, binding alternative dispute resolution, subject to the provisions of the Separation and Distribution Agreement.
Expenses
Except as expressly set forth in the Separation and Distribution Agreement or in any ancillary agreement, all costs and expenses incurred in connection with the separation and distribution incurred prior to the distribution date, including costs and expenses relating to legal and tax counsel, financial advisors and accounting advisory work related to the separation and distribution, will be paid by the party incurring such cost and expense.
Other Matters
Other matters that will be governed by the Separation and Distribution Agreement include access to financial and other information, confidentiality and access to and provision of records.
Termination
The Separation and Distribution Agreement will provide that it may be terminated, and the separation and distribution may be modified or abandoned, at any time prior to the distribution date in the sole discretion of Grace without the approval of any person, including the Company’s or Grace’s shareholders. In the event of a termination of the Separation and Distribution Agreement, no party, nor any of its directors, officers, or employees, will have any liability of any kind to the other party or any other person. After the distribution date, the Separation and Distribution Agreement will provide that it may not be terminated except by an agreement in writing signed by both Grace and the Company.
Tax Sharing Agreement
The Company, Grace Conn and Grace will enter into a Tax Sharing Agreement prior to the distribution that will generally govern the parties’ respective rights, responsibilities and obligations after the distribution with respect to taxes (including taxes arising in the ordinary course of business and taxes, if any, incurred as a result of any failure of the distribution and certain related transactions to qualify under Sections 355 and certain other relevant provisions of the Code), tax attributes, the preparation and filing of tax returns, tax elections, tax contests, and certain other tax matters.
In addition, the Tax Sharing Agreement will impose certain restrictions on the Company and its subsidiaries (including restrictions on share issuances, business combinations, sales of assets and similar transactions) that will be designed to preserve the qualification of the distribution and certain related transactions under Sections 355 and certain other relevant provisions of the Code. The Tax Sharing Agreement will provide special rules that allocate tax liabilities in the event the distribution, together with certain related transactions, does not so qualify. In general, under the Tax Sharing Agreement, each party is expected to be responsible for any taxes imposed on, and certain related amounts payable by, Grace or the Company that arise from the failure of the distribution and certain related transactions, to qualify under Sections 355 and certain other relevant provisions of the Code, to the extent that the failure to so qualify is attributable to actions, events or transactions relating to such party’s respective stock, assets or business, or a breach of the relevant representations or covenants made by that party in the Tax Sharing Agreement.
Employee Matters Agreement
The Company, Grace Conn and Grace will enter into an Employee Matters Agreement prior to the separation to allocate certain liabilities and responsibilities relating to employment matters, employee compensation and benefits plans and programs, and other related matters. The Employee Matters Agreement will govern certain compensation and employee benefit obligations with respect to the current and former employees and non-employee directors of each company.
The Employee Matters Agreement will provide that, unless otherwise specified, Grace will be responsible for liabilities associated with employees who will be employed by Grace following the separation, former employees whose last employment was with the Grace business, and certain specified current and former corporate employees (which we collectively refer to as “Grace allocated employees”), and the Company will be responsible for liabilities associated with employees who will be employed by the Company following the separation, former employees whose last employment was with the Company’s business, and certain specified current and former corporate employees (which we collectively refer to as “Company allocated employees”).
Employee Benefits Generally
Company allocated employees will be eligible to participate in the Company's benefit plans as of the separation in accordance with the terms and conditions of the Company's plans as in effect from time to time. Generally and subject to certain exceptions, the Company will adopt compensation and benefit plans that mirror the terms of corresponding Grace compensation and benefit plans, and the Company will credit each Company allocated employee with his or her service with Grace prior to the separation for all purposes under the Company's benefit plans to the same extent such service was recognized by Grace for similar purposes and so long as such crediting does not result in a duplication of benefits.
Equity Compensation Awards
The Employee Matters Agreement will provide for the conversion of the outstanding awards granted under the Grace equity compensation programs into adjusted awards relating to shares of Grace common stock and/or GCP common stock. The adjusted awards generally will be subject to the same vesting conditions and other terms that applied to the original Grace award immediately before the separation. Effective as of the separation, all awards converted into awards relating to shares of GCP common stock will be assumed by, and become the obligation of, the Company.
Each Grace stock option granted prior to January 1, 2015 and held by a current employee as of the separation date will be converted into an adjusted Grace stock option and a Company stock option. The exercise price and number of shares subject to each stock option will be adjusted to preserve the aggregate intrinsic value of the original Grace stock option as measured immediately before and immediately after the separation, subject to rounding. Each Grace stock option granted prior to January 1, 2015 and held by a former employee will be converted into an adjusted Grace stock option, with the exercise price and the number of shares subject to such stock option adjusted to preserve the aggregate intrinsic value of the original Grace stock option as measured immediately before and immediately after the separation, subject to rounding.
Each Grace stock option or restricted stock unit granted on or after January 1, 2015 will be converted into either a corresponding adjusted Grace award or a Company award, depending on whether the original Grace award is held by (1) an employee who will be employed by Grace following the separation or a former employee, or (2) an employee who will be employed by the Company following the separation. The number of shares subject to each award (and in the case of stock options, the exercise price of the award) will be adjusted to preserve the aggregate intrinsic value of the original Grace award as measured immediately before and immediately after the separation, subject to rounding.
Grace performance-based units granted in respect of 2014 (which we refer to as “2014 Grace PBU awards”) will be divided into two portions representing (1) the portion of the performance period that has elapsed between the beginning of the performance period on January 1, 2014 and the separation and (2) the portion of the performance period between the separation and the end of the performance period on December 31, 2016. Performance conditions with respect to the first portion of the 2014 Grace PBU award will be deemed satisfied based on the actual performance of Grace through the separation, and performance conditions with respect to the second portion of the Grace 2014 PBU award will be deemed satisfied at target as of the separation. The number of shares of Grace common stock underlying the 2014 Grace PBU awards will be established once such performance conditions are deemed satisfied.
Holders of 2014 Grace PBU awards granted in 2014 who are current employees will retain their 2014 Grace PBU awards, and, pursuant to the adjustment provisions of the Grace equity plan, will also receive restricted stock units of the Company in an amount that reflects the distribution of GCP common stock to Grace shareholders by applying the distribution ratio to the number of Grace common shares underlying their original 2014 Grace PBU awards. Together, these Grace and Company awards are intended to preserve the value of a
holder’s original 2014 Grace PBU award, as measured immediately before and immediately after the distribution. The Grace and Company awards will continue to be subject to substantially the same terms and conditions (other than performance-vesting conditions) that applied to the original 2014 Grace PBU awards, and will vest on December 31, 2016, generally subject to the award holder’s continued employment through that date. Any 2014 Grace PBU awards granted in 2015 and any 2014 Grace PBU awards held by former employees will be adjusted (with performance-vesting conditions deemed satisfied as described above) to preserve the value of the original 2014 Grace PBU awards as measured immediately before and immediately after the distribution. These adjusted Grace 2014 PBU awards will continue to be subject to substantially the same terms and conditions (other than performance-vesting conditions) that applied to the original 2014 Grace PBU awards.
Grace performance-based units granted in 2013 (which we refer to as “2013 Grace PBU awards”) will be converted into either a corresponding adjusted Grace award or a Company award, depending on whether the original Grace award is held by (1) an employee who will be employed by Grace following the separation or a former employee, or (2) an employee who will be employed by the Company following the separation. The number of shares subject to the award will be adjusted to preserve the aggregate intrinsic value of the original Grace award, as measured immediately before and immediately after the separation, subject to rounding.
Grace restricted stock awards held by non-employee directors will be canceled immediately prior to the record date and replaced with an adjusted Grace restricted stock award following the separation. The number of shares subject to the award will be adjusted to preserve the aggregate intrinsic value of the original Grace award, as measured immediately before and immediately after the separation, subject to rounding.
Grace deferred share awards held by Grace employees and non-employee directors will be converted into an adjusted Grace award. The number of shares subject to the award will be adjusted to preserve the aggregate intrinsic value of the original Grace award, as measured immediately before and immediately after the separation, subject to rounding.
Any dividend equivalent payments on Grace or Company restricted stock units in respect of dividends declared after the separation will be paid by Grace to Grace allocated employees, and by the Company to Company allocated employees. For purposes of vesting for all awards, continued employment with or service to Grace or the Company, as applicable, will be treated as continued employment with or service to both Grace and the Company.
If local regulations outside the United States do not permit use of the adjustment method described above or would cause an adverse effect for equity award holders, a compliant alternative adjustment method will be used. In such cases, it is anticipated that affected employees will receive adjusted awards in the equity of their post-distribution employer or an amount in cash equal to the intrinsic value of the award.
Miscellaneous
The Employee Matters Agreement will also address other current and former employee-related issues and certain special circumstances, including employees who will transfer to their eventual permanent employer on a delayed basis, and special rules for benefit arrangements in various jurisdictions.
Transition Services Agreement
The Company and Grace Conn will enter into a Transition Services Agreement prior to the distribution pursuant to which Grace Conn and its subsidiaries and the Company and its subsidiaries will provide, on an interim, transitional basis, various services to each other. The services to be provided include information technology, accounts payable, payroll, and other financial functions and administrative services. The agreed upon charges for such services will be generally intended to allow the servicing party to recover all out-of-pocket costs and expenses of providing such services.
Cross-License Agreement
The Company, Grace Conn and Grace GmbH & Co. KG, a wholly owned subsidiary of Grace Conn, will enter into a Cross-License Agreement that provides each party licenses under certain intellectual property assets owned by the other party. The agreement permits the Company and Grace Conn to continue current business activities that may utilize intellectual property retained by the other party pursuant to the Separation Agreement.
The Cross-License Agreement will remain in effect until expiration of the relevant IP right in accordance with the terms of the Agreement.
Grace Transitional License Agreement
The Company and Grace Conn will enter into the Grace Transitional License Agreement, wherein Grace Conn provides a limited license to the Company under the Grace trademark for certain products until new brands for those products are phased in. The relevant products are those which rely on the Grace brand at time of the separation.
DESCRIPTION OF MATERIAL INDEBTEDNESS
Credit Facilities
We expect that the Company will enter into new senior secured credit facilities (the “Credit Facilities”) in an aggregate principal amount of $525 million, providing for term loans (the “Term Loans”) in an aggregate principal amount of $275 million and for revolving loans (the “Revolving Loans”) in an aggregate principal amount of $250 million from a syndicate of banks and other financial institutions. We expect that the Company will use borrowings under the Credit Facilities (i) to fund a distribution to W. R. Grace & Co. prior to the completion of the separation, (ii) to pay fees and expenses related to the separation, borrowings under the Credit Facilities and any related transactions and (iii) for working capital purposes, to fund acquisitions and for general corporate purposes.
We expect the Credit Facilities will provide that, subject to customary conditions, the Company will be able to obtain incremental Term Loans and/or Revolving Loans under the Credit Facilities in an aggregate amount not to exceed $175 million, plus the amount of all voluntary prepayments and commitment reductions under the Credit Facilities, plus additional amounts provided the total secured leverage ratio calculated on a pro forma basis is equal to or less than 1.00x.
We expect the interest rates per annum applicable to loans under the Credit Facilities to be, at the Company's option, equal to either a base rate plus a margin or LIBOR plus a margin. The LIBOR rate with respect to the Term Loans only will be subject to a “floor.” In addition, we expect that the Company will pay a commitment fee on the unused portion of the Revolving Loan commitments.
We expect that the Term Loans will amortize in equal quarterly installments in aggregate annual amounts equal to 1.00% of the original principal amount thereof. We expect that the Revolving Loans will not be subject to interim amortization. The Term Loans will be subject to standard mandatory prepayment provisions including (1) 100% of the net cash proceeds from issuances or incurrence of debt by the Company or any of its restricted subsidiaries (other than with respect to certain permitted indebtedness); (2) 100% of the net cash proceeds from certain sales or other dispositions of assets by the Company or any of its restricted subsidiaries in excess of a certain amount and subject to customary reinvestment provisions and certain other exceptions; and (3) 50% (with step-downs to 25% and 0% based upon achievement of specified first lien leverage ratios) of annual excess cash flow of the Company and its restricted subsidiaries subject to customary exceptions and limitations.
We expect that the Credit Facilities will be guaranteed, jointly and severally, by certain of the Company's existing and future wholly owned domestic subsidiaries (the “Guarantors”) and secured by a first-priority security interest in substantially all of the Company's and the Guarantor’s assets. The Credit Facilities are expected to contain customary covenants that, among other things, restrict, subject to certain exceptions, the Company's and its restricted subsidiaries’ ability to grant liens on its and its restricted subsidiaries’ assets, incur indebtedness, sell assets, make investments, engage in acquisitions, mergers or consolidations and pay certain dividends and other restricted payments. We also expect that the Credit Facilities with respect to the Revolving Loans will require the Company to comply with a financial maintenance covenant to be tested quarterly, consisting of a maximum net total leverage ratio and minimum interest coverage ratio. We expect that the Credit Facilities will also contain certain customary events of default.
The foregoing summarizes some of the currently expected terms of the Credit Facilities. However, the foregoing summary does not purport to be complete, and the terms of the Credit Facilities have not yet been finalized. There may be changes to the expected size and other terms of the Credit Facilities, some of which may be material.
Unsecured Notes
We expect the Company to issue new unsecured senior notes (the “Notes”) in an aggregate principal amount of approximately $525 million, pursuant to an Indenture (the “Base Indenture”), as supplemented by that certain First Supplemental Indenture (the "Supplemental Indenture" and, together with the Base Indenture, the "Indenture"), by and among the Company, the Guarantors and Wilmington Trust, National Association, as trustee (the “Trustee”). We expect that the Company will use the proceeds of the Notes offering (i) to fund a distribution to Grace Conn prior to the completion of the separation, (ii) to pay fees and expenses related to the separation, Notes offering and any related transactions and (iii) for working capital purposes, to fund acquisitions and for general corporate purposes.
We expect the Indenture to provide, among other things, that the Notes will be the Company's general unsecured obligations. We expect the Company to be able to redeem the Notes, in whole or in part, at its option at the prices and times set forth in the Indenture. If certain events constituting a change of control under the Indenture occur, we expect that the Company will be required to offer to repurchase the Notes from the holders at the redemption price specified in the indenture. We expect the Indenture to require that if (1) the effective date of the separation has not occurred on or prior to a certain date specified in the Indenture after the issue date of the Notes (the “Outside Date”) or (2) the Company delivers to the Trustee an Officer’s Certificate stating that the Company has made a good faith judgment that the effective date of the separation will not occur on or prior to the Outside Date, then the Company will be required to redeem all of the outstanding Notes at the redemption price specified in the Indenture. The Notes and the related guarantees are not expected to be registered under the Securities Act of 1933, as amended (the “Securities Act”), and are expected to be offered only to qualified institutional buyers in reliance on Rule 144A under the Securities Act or, outside the United States, to persons other than “U.S. persons” in compliance with Regulation S under the Securities Act. We expect that the Company will use the proceeds of the Notes to fund a distribution to Grace and a distribution to Grace Conn prior to the closing of the transaction, to pay fees and expenses related to the transactions and for working capital purposes, to fund acquisitions and for other general corporate purposes.
Certain of the Company's existing and future wholly-owned domestic subsidiaries that will guarantee the Credit Facilities are expected to jointly and severally guarantee the Notes on a senior unsecured basis. The Notes and the related guarantees will be the Company's and the Guarantors’ senior obligations and will rank equally with all of the Company's and the Guarantors’ existing and future senior indebtedness, including the Credit Facilities, and senior in right of payment to any of the Company's and the Guarantors’ existing and future subordinated indebtedness. The Notes are expected to be effectively subordinated to any secured indebtedness, including the Credit Facilities, to the extent of the value of the assets securing such indebtedness and structurally subordinated to all of the Company's non-guarantor subsidiaries’ existing and future indebtedness and other liabilities.
We expect the terms of the Indenture, among other things, to limit the Company's and its restricted subsidiaries’ ability to incur additional debt and issue preferred stock; pay dividends or make other restricted payments; make certain investments; create liens; allow restrictions on the ability of certain of its subsidiaries to pay dividends or make other payments; sell assets; merge or consolidate with other entities; and enter into transactions with affiliates. Further, we expect the Indenture to provide for customary events of default (subject in certain cases to customary grace and cure periods), which may include, among others, nonpayment of principal or interest; breach of other covenants or agreements in the Indenture; failure to pay certain other indebtedness; failure to pay certain final judgments; failure of certain guarantees to be enforceable; and certain events of bankruptcy or insolvency.
The foregoing summarizes some of the currently expected terms of the Base Indenture, the Supplemental Indenture, the Notes and the guarantees. However, the foregoing summary does not purport to be complete, and the terms of the Base Indenture, the Supplemental Indenture and the Notes have not yet been finalized. There may be changes to the expected size and other terms of the Base Indenture, the Supplemental Indenture, the Notes and the guarantees, some of which may be material. The foregoing description and the other information in this information statement regarding the potential offering of Notes is included in this information statement solely for informational purposes. Nothing in this information statement should be construed as an offer to sell, or the solicitation of an offer to buy, any such Notes.
DESCRIPTION OF CAPITAL STOCK
The Company’s certificate of incorporation and bylaws will be amended and restated prior to the separation. The following is a summary of the material terms governing the Company’s capital stock that will be contained in the amended and restated certificate of incorporation and bylaws of the Company at the time of the distribution. The summaries and descriptions below do not purport to be complete statements of the relevant provisions of the certificate of incorporation or of the bylaws to be in effect at the time of the distribution, which you must read for complete information on the Company’s capital stock as of the time of the distribution. The certificate of incorporation and bylaws, each in a form expected to be in effect at the time of the distribution, will be included as exhibits to the Company’s registration statement on Form 10, of which this information statement forms a part. The Company will include its amended and restated certificate of incorporation and bylaws, as in effect at the time of the distribution, in a Current Report on Form 8-K filed with the SEC. The summaries and descriptions below do not purport to be complete statements of the Delaware General Corporation Law.
General
The Company’s authorized capital stock consists of 300,000,000 shares of common stock, par value $.01 per share, and 50,000,000 shares of preferred stock, par value $.01 per share, all of which shares of preferred stock are undesignated. The Company's board of directors may establish the rights and preferences of the preferred stock from time to time. Immediately following the distribution, we expect that approximately 70.5 million shares of GCP common stock will be issued and outstanding and that no shares of preferred stock will be issued and outstanding.
Distributions of Securities
In the past three years, the Company has not sold any securities, including sales of reacquired securities, new issues (other than to Grace in connection with our formation), securities issued in exchange for property, services or other securities, and new securities resulting from the modification of outstanding securities.
Common Stock
Each holder of GCP common stock will be entitled to one vote for each share on all matters to be voted upon by the common shareholders, and there will be no cumulative voting rights. Subject to any preferential rights of any outstanding preferred stock, holders of GCP common stock will be entitled to receive ratably the dividends, if any, as may be declared from time to time by the Company’s board of directors out of funds legally available for that purpose. If there is a liquidation, dissolution or winding up of the Company, holders of GCP common stock would be entitled to ratable distribution of the Company’s assets remaining after the payment in full of liabilities and any preferential rights of any then outstanding preferred stock.
Holders of GCP common stock will have no preemptive or conversion rights or other subscription rights, and there are no redemption or sinking fund provisions applicable to the common stock. After the distribution, all outstanding shares of GCP common stock will be fully paid and non-assessable. The rights, preferences and privileges of the holders of GCP common stock are subject to, and may be adversely affected by, the rights of the holders of shares of any series of preferred stock that the Company may designate and issue in the future.
Preferred Stock
Under the terms of the Company’s amended and restated certificate of incorporation, its board of directors will be authorized, subject to limitations prescribed by the Delaware General Corporation Law, or the DGCL, and by the Company’s amended and restated certificate of incorporation, to issue up to 50,000,000 shares of preferred stock in one or more series without further action by the holders of GCP common stock. The Company’s board of directors will have the discretion, subject to limitations prescribed by the DGCL and by the Company’s amended and restated certificate of incorporation, to determine the rights, preferences, privileges and restrictions, including voting rights, dividend rights, conversion rights, redemption privileges and liquidation preferences, of each series of preferred stock.
Limitation on Liability of Directors and Indemnification of Directors and Officers
The DGCL authorizes corporations to limit or eliminate the personal liability of directors to corporations and their shareholders for monetary damages for breaches of directors’ fiduciary duties as directors, and the
Company’s amended and restated certificate of incorporation will include such an exculpation provision. The Company’s amended and restated certificate of incorporation and bylaws will include provisions that indemnify, to the fullest extent allowable under the DGCL, the personal liability of directors or officers for monetary damages for actions taken as a director or officer of the Company, or for serving at the Company’s request as a director or officer or another position at another corporation or enterprise, as the case may be. The Company’s amended and restated certificate of incorporation and bylaws will also provide that GCP must indemnify and advance reasonable expenses to its directors and officers, subject to its receipt of an undertaking from the indemnified party as may be required under the DGCL. The Company’s amended and restated certificate of incorporation will expressly authorize the Company to carry directors’ and officers’ insurance to protect the Company, its directors, officers and certain employees for some liabilities.
The limitation of liability and indemnification provisions that will be included in the Company’s amended and restated certificate of incorporation and bylaws may discourage shareholders from bringing a lawsuit against directors for breach of their fiduciary duty. These provisions may also have the effect of reducing the likelihood of derivative litigation against the Company’s directors and officers, even though such an action, if successful, might otherwise benefit the Company and its shareholders. However, these provisions will not limit or eliminate the Company’s rights, or those of any shareholder, to seek non-monetary relief such as injunction or rescission in the event of a breach of a director’s duty of care. The provisions will not alter the liability of directors under the federal securities laws. In addition, your investment may be adversely affected to the extent that, in a class action or direct suit, the Company pays the costs of settlement and damage awards against directors and officers pursuant to these indemnification provisions. There is currently no pending material litigation or proceeding against any of the Company's directors, officers or employees for which indemnification is sought.
Anti-Takeover Effects of Various Provisions of Delaware Law and the Company’s Certificate of Incorporation and Bylaws
Provisions of the DGCL and the Company’s amended and restated certificate of incorporation and bylaws as of the time of the distribution could make it more difficult to acquire the Company by means of a tender offer, a proxy contest or otherwise, or to remove incumbent officers and directors. These provisions, summarized below, are expected to discourage certain types of coercive takeover practices and takeover bids that the Company’s board of directors may consider inadequate and to encourage persons seeking to acquire control of the Company to first negotiate with the Company’s board of directors. The Company believes that the benefits of increased protection of its ability to negotiate with the proponent of an unfriendly or unsolicited proposal to acquire or restructure it outweigh the disadvantages of discouraging takeover or acquisition proposals because, among other things, negotiation of these proposals could result in an improvement of their terms.
Classified Board. Upon completion of the separation, the Company’s board of directors will initially be divided into three classes, with Class I comprised of three directors, Class II comprised of three directors and Class III comprised of two directors. The directors designated as Class I directors will have terms expiring at the first annual meeting of shareholders following the distribution, which the Company expects to hold in 2017. The directors designated as Class II directors will have terms expiring at the following year’s annual meeting of shareholders, which the Company expects to hold in 2018, and the directors designated as Class III directors will have terms expiring at the following year’s annual meeting of shareholders, which the Company expects to hold in 2019. At the first annual meeting of shareholders following the distribution, Class I directors will be elected to serve for a term of three years each. Commencing with the second annual meeting of shareholders following the distribution, directors for each class will be elected at the annual meeting of shareholders held in the year in which the term for that class expires and thereafter will serve for a term of one year each. Consequently, by 2020, all of our directors will stand for election each year for one year terms, and our board will therefore no longer be divided into three classes.
At any meeting of shareholders for the election of directors at which a quorum is present, the election will be determined by a majority of the votes cast by the shareholders entitled to vote in the election, with directors not receiving a majority of the votes cast required to tender their resignations for consideration by the board, except that in the case of a contested election, the election will be determined by a plurality of the votes cast by the shareholders entitled to vote in the election. Before the Company’s board is declassified, it would take at least two elections of directors for any individual or group to gain control of the Company’s board. Accordingly, while the classified board is in effect, these provisions could discourage a third party from initiating a proxy contest, making a tender offer or otherwise attempting to gain control of the Company.
Delaware Anti-Takeover Statute. The Company will be subject to Section 203 of the DGCL, an anti‑takeover statute. In general, Section 203 of the DGCL prohibits a publicly-held Delaware corporation from engaging in a “business combination” with an “interested shareholder” for a period of three years following the time the person became an interested shareholder, unless the business combination or the acquisition of shares that resulted in a shareholder becoming an interested shareholder is approved in a prescribed manner. Generally, a “business combination” includes a merger, asset or stock sale, or other transaction resulting in a financial benefit to the interested shareholder. Generally, an “interested shareholder” is a person who, together with affiliates and associates, owns (or within three years prior to the determination of interested shareholder status did own) 15 percent or more of a corporation’s voting stock. The existence of this provision would be expected to have an anti-takeover effect with respect to transactions not approved in advance by the Company’s board of directors, including discouraging attempts that might result in a premium over the market price for the shares of common stock held by the Company’s shareholders.
Removal. The Company's charter and amended and restated bylaws will provide that (i) prior to the board being fully declassified as discussed above shareholders may remove the Company's directors only for cause, and that (ii) after the board has been fully declassified, shareholders may remove the Company's directors with or without cause. Removal will require the affirmative vote of holders of at least two thirds of the Company’s voting stock.
Shareholder Action by Written Consent. The Company’s amended and restated certificate of incorporation will expressly eliminate the right of its shareholders to act by written consent. Shareholder action must take place at the annual meeting or a special meeting of shareholders.
Cumulative Voting. The DGCL provides that shareholders are denied the right to cumulate votes in the election of directors unless the Company’s certificate of incorporation provides otherwise. The Company’s amended and restated certificate of incorporation will not provide for cumulative voting.
Shareholder Meetings. The Company’s amended and restated certificate of incorporation will provide that only the president, the chairman, or the Company’s board of directors pursuant to a resolution adopted by a majority of the entire board of directors may call special meetings of shareholders. Shareholders may not call special meetings of shareholders.
Size of Board and Vacancies. The Company’s amended and restated certificate of incorporation will provide that the number of directors on its board of directors will be fixed exclusively by its board of directors. Any vacancies created in its board of directors resulting from any increase in the authorized number of directors or the death, resignation, retirement, disqualification, removal from office or other cause will be filled by a majority of the board of directors then in office. Any director appointed to fill a vacancy on the Company’s board of directors will be appointed for a term expiring at the next election of the term for which such director has been appointed, and until his or her successor has been elected and qualified.
Requirements for Advance Notice of Shareholder Nominations and Proposals. The Company's amended and restated bylaws will establish advance notice procedures with respect to shareholder proposals and nomination of candidates for election as directors other than nominations made by or at the direction of its board of directors or a committee of its board of directors.
Amendments to Certificate of Incorporation. The Company’s amended and restated certificate of incorporation will provide that the affirmative vote of the holders of at least two thirds of its voting stock then outstanding is required to amend certain provisions relating to the ability of shareholders to act by written consent, board classification, removal of directors by shareholders and the provision with respect to bylaw amendments.
Amendments to Bylaws. The Company’s amended and restated bylaws will provide that they may be amended by the Company’s board of directors or by the affirmative vote of holders of at least two thirds of the Company’s voting stock.
Undesignated Preferred Stock. The authority that the Company’s board of directors will possess to issue preferred stock could potentially be used to discourage attempts by third parties to obtain control of the Company through a merger, tender offer, proxy contest or otherwise by making such attempts more difficult or more costly. The Company’s board of directors may be able to issue preferred stock with voting rights or conversion rights that, if exercised, could adversely affect the voting power of the holders of GCP common stock.
Exclusive Forum
The Company’s amended and restated certificate of incorporation will provide that unless the Company otherwise consents in writing, a state court located within the State of Delaware will be the sole and exclusive forum for any derivative action or proceeding brought on behalf of the Company, any action asserting a claim of breach of a fiduciary duty owed by any director or officer or other employee of the Company to the Company or the Company’s shareholders, any action asserting a claim against the Company or any director or officer of the Company arising pursuant to any provision of the DGCL or the Company’s amended and restated certificate of incorporation or bylaws, or any action asserting a claim against the Company or any director or officer of the Company governed by the internal affairs doctrine. However, if no such court has jurisdiction, the United States Court for the District of Delaware will be the sole and exclusive forum for any such action or proceeding. Although the Company’s amended and restated certificate of incorporation will include this exclusive forum provision, it is possible that a court could rule that this provision is inapplicable or unenforceable.
Transfer Agent and Registrar
After the distribution, the transfer agent and registrar for the Company’s common stock will be Wells Fargo Shareowner Services.
WHERE YOU CAN FIND MORE INFORMATION
The Company has filed a registration statement on Form 10 with the SEC with respect to the shares of GCP common stock that Grace shareholders will receive in the distribution. This information statement is a part of that registration statement and, as allowed by SEC rules, does not include all of the information you can find in the registration statement or the exhibits to the registration statement. For additional information relating to the Company and the distribution, reference is made to the registration statement and the exhibits to the registration statement. Statements contained in this information statement as to the contents of any contract or document referred to are not necessarily complete and in each instance, if the contract or document is filed as an exhibit to the registration statement, we refer you to the copy of the contract or other document filed as an exhibit to the registration statement. Each such statement is qualified in all respects by reference to the applicable document. We maintain an Internet site at www.gcpat.com. Our website and the information contained on that site or on any website referenced in this information statement, or connected to any such site, are not incorporated by reference into this information statement or the registration statement on Form 10.
Following the distribution, the Company will file annual, quarterly and special reports, proxy statements and other information with the SEC. The Company intends to furnish its shareholders with annual reports containing consolidated financial statements audited by an independent registered public accounting firm. The registration statement is, and any of these future filings with the SEC will be, available to the public over the Internet on the SEC’s website at http://www.sec.gov. You may read and copy any filed document at the SEC’s public reference rooms in Washington, D.C. at 100 F Street, N.E., Washington, D.C. 20549, at the SEC’s regional offices in New York at 233 Broadway, New York, New York 10279, and in Chicago at Citicorp Center, 500 W. Madison Street, Suite 1400, Chicago, Illinois 60661. Please call the SEC at 1-800-SEC-0330 for further information about the public reference rooms.
INDEX TO FINANCIAL STATEMENTS AND SUPPLEMENTARY DATA
|
| |
| |
| Audited Combined Financial Statements: | |
| |
| |
| |
| |
| |
| |
| |
| |
| Combined Financial Statements for GCP as of September 30, 2015, and December 31, 2014, and for the nine months ended September 30, 2015, and 2014: | |
| |
| |
| |
| |
| |
| |
Report of Independent Registered Public Accounting Firm
To the Shareholders and Board of Directors of W. R. Grace & Co.:
In our opinion, the combined financial statements listed in the accompanying index present fairly, in all material respects, the financial position of the combination of W. R. Grace & Co.’s (“Grace”) Construction Products operating segment and Darex Packaging Technologies business (“GCP”) at December 31, 2014 and 2013, and the results of their operations and their cash flows for each of the three years in the period ended December 31, 2014 in conformity with accounting principles generally accepted in the United States of America. In addition, in our opinion, the financial statement schedule listed in the accompanying index presents fairly, in all material respects, the information set forth therein when read in conjunction with the related combined financial statements. These financial statements and financial statement schedule are the responsibility of Grace’s management. Our responsibility is to express an opinion on these financial statements and financial statement schedule based on our audits. We conducted our audits of these financial statements and financial statement schedule in accordance with the standards of the Public Company Accounting Oversight Board (United States). Those standards require that we plan and perform the audit to obtain reasonable assurance about whether the financial statements and financial statement schedule are free of material misstatement. An audit includes examining, on a test basis, evidence supporting the amounts and disclosures in the financial statements, assessing the accounting principles used and significant estimates made by management, and evaluating the overall financial statement presentation. We believe that our audits provide a reasonable basis for our opinion.
As described in Note 1, the combined financial statements have been derived from the accounting records of Grace. The combined financial statements include expense allocations for the functions provided by Grace. These allocations may not be indicative of the actual expense that would have been incurred had GCP operated as a separate entity apart from Grace. See Note 12 to the combined financial statements for a summary of transactions with Grace.
/s/ PricewaterhouseCoopers LLP
Baltimore, Maryland
August 5, 2015
GCP
Combined Statements of Operations
|
| | | | | | | | | | | |
| | Year Ended December 31, |
| (In millions) | 2014 | | 2013 | | 2012 |
| Net sales | $ | 1,480.4 |
| | $ | 1,442.3 |
| | $ | 1,409.2 |
|
| Cost of goods sold | 949.9 |
| | 940.5 |
| | 937.4 |
|
| Gross profit | 530.5 |
| | 501.8 |
| | 471.8 |
|
| Selling, general and administrative expenses | 288.9 |
| | 295.3 |
| | 308.4 |
|
| Research and development expenses | 27.9 |
| | 24.3 |
| | 24.2 |
|
| Interest expense and related financing costs | 3.9 |
| | 3.3 |
| | 1.7 |
|
| Interest expense, net—related party | 0.9 |
| | 1.8 |
| | 1.0 |
|
| Restructuring expenses and asset impairments | 18.3 |
| | 7.4 |
| | 4.3 |
|
| Other (income) expense, net | (0.5 | ) | | 6.8 |
| | (2.2 | ) |
| Total costs and expenses | 339.4 |
| | 338.9 |
| | 337.4 |
|
| Income before income taxes | 191.1 |
| | 162.9 |
| | 134.4 |
|
| Provision for income taxes | (55.6 | ) | | (51.6 | ) | | (48.1 | ) |
| Net income | 135.5 |
| | 111.3 |
| | 86.3 |
|
| Less: Net income attributable to noncontrolling interests | (1.2 | ) | | (1.6 | ) | | (1.1 | ) |
| Net income attributable to GCP | $ | 134.3 |
| | $ | 109.7 |
| | $ | 85.2 |
|
The Notes to Combined Financial Statements are an integral part of these statements.
F-3
GCP
Combined Statements of Comprehensive Income
|
| | | | | | | | | | | |
| | Year Ended December 31, |
| (In millions) | 2014 | | 2013 | | 2012 |
| Net income | $ | 135.5 |
| | $ | 111.3 |
| | $ | 86.3 |
|
| Other comprehensive (loss) income: | | | | | |
| Defined benefit pension and other postretirement plans, net of income taxes | 0.1 |
| | — |
| | 0.1 |
|
| Currency translation adjustments | (41.1 | ) | | (11.9 | ) | | 0.7 |
|
| Gain (loss) from hedging activities, net of income taxes | 0.2 |
| | (0.2 | ) | | (0.2 | ) |
| Other than temporary impairment of investment | 0.8 |
| | — |
| | — |
|
| (Loss) gain on securities available for sale, net of income taxes | (0.1 | ) | | 0.1 |
| | — |
|
| Total other comprehensive (loss) income attributable to noncontrolling interests | (2.5 | ) | | (0.9 | ) | | 0.8 |
|
| Total other comprehensive (loss) income | (42.6 | ) | | (12.9 | ) | | 1.4 |
|
| Comprehensive income | 92.9 |
| | 98.4 |
| | 87.7 |
|
| Less: comprehensive loss (income) attributable to noncontrolling interests | 1.3 |
| | (0.7 | ) | | (1.9 | ) |
| Comprehensive income attributable to GCP | $ | 94.2 |
| | $ | 97.7 |
| | $ | 85.8 |
|
The Notes to Combined Financial Statements are an integral part of these statements.
F-4
GCP
Combined Statements of Cash Flows
|
| | | | | | | | | | | |
| | Year Ended December 31, |
| (In millions) | 2014 | | 2013 | | 2012 |
| OPERATING ACTIVITIES | | | | | |
| Net income | $ | 135.5 |
| | $ | 111.3 |
| | $ | 86.3 |
|
| Reconciliation to net cash provided by operating activities: | | | | | |
| Depreciation and amortization | 34.0 |
| | 34.7 |
| | 34.8 |
|
| Impairments of certain assets | 13.4 |
| | — |
| | — |
|
| Provision for income taxes | 55.6 |
| | 51.6 |
| | 48.1 |
|
| Cash paid for income taxes, net of refunds | (19.5 | ) | | (26.0 | ) | | (18.3 | ) |
| Cash paid for income taxes, net of refunds—related party | (22.2 | ) | | (21.1 | ) | | (18.6 | ) |
| Excess tax benefits from stock-based compensation | (7.1 | ) | | (5.6 | ) | | (7.7 | ) |
| Cash paid for interest on credit arrangements | (4.4 | ) | | (2.6 | ) | | (1.6 | ) |
| Defined benefit pension (income) expense | (15.3 | ) | | 16.6 |
| | 20.4 |
|
| Cash paid under defined benefit pension arrangements | (4.4 | ) | | (3.6 | ) | | (1.7 | ) |
| Changes in assets and liabilities, excluding effect of currency translation and businesses acquired: | | | | | |
| Trade accounts receivable | (1.0 | ) | | 7.6 |
| | (11.1 | ) |
| Inventories | (24.5 | ) | | 4.8 |
| | 2.2 |
|
| Accounts payable | 5.5 |
| | (7.8 | ) | | 8.1 |
|
| All other items, net | 15.4 |
| | 3.2 |
| | 2.6 |
|
| Net cash provided by operating activities | 161.0 |
| | 163.1 |
| | 143.5 |
|
| INVESTING ACTIVITIES | | | | | |
| Capital expenditures | (37.5 | ) | | (41.5 | ) | | (32.0 | ) |
| Businesses acquired, net of cash acquired | — |
| | (15.8 | ) | | (40.9 | ) |
| Transfer from (to) restricted cash and cash equivalents | 5.3 |
| | (0.5 | ) | | (0.1 | ) |
| Purchase of bonds | (2.8 | ) | | (6.5 | ) | | — |
|
| Proceeds from sale of bonds | 9.3 |
| | — |
| | — |
|
| Increase in lending to related party | (51.7 | ) | | — |
| | — |
|
| Receipt of payment on loan from related party | 2.4 |
| | — |
| | 2.3 |
|
| Other investing activities | (0.6 | ) | | 4.2 |
| | 0.4 |
|
| Net cash used for investing activities | (75.6 | ) | | (60.1 | ) | | (70.3 | ) |
| FINANCING ACTIVITIES | | | | | |
| Borrowings under credit arrangements | 26.6 |
| | 44.9 |
| | 31.7 |
|
| Repayments under credit arrangements | (34.4 | ) | | (30.2 | ) | | (18.4 | ) |
| Borrowings under related party loans | 9.2 |
| | 18.7 |
| | 43.0 |
|
| Repayments under related party loans | (8.9 | ) | | (29.0 | ) | | (12.8 | ) |
| Purchase of interest in consolidated joint venture | (6.3 | ) | | — |
| | — |
|
| Excess tax benefits from stock-based compensation | 7.1 |
| | 5.6 |
| | 7.7 |
|
| Transfers to parent, net | (100.2 | ) | | (71.4 | ) | | (111.4 | ) |
| Net cash used for financing activities | (106.9 | ) | | (61.4 | ) | | (60.2 | ) |
| Effect of currency exchange rate changes on cash and cash equivalents | (15.4 | ) | | 3.6 |
| | 1.9 |
|
| (Decrease) increase in cash and cash equivalents | (36.9 | ) | | 45.2 |
| | 14.9 |
|
| Cash and cash equivalents, beginning of period | 157.8 |
| | 112.6 |
| | 97.7 |
|
| Cash and cash equivalents, end of period | $ | 120.9 |
| | $ | 157.8 |
| | $ | 112.6 |
|
The Notes to Combined Financial Statements are an integral part of these statements.
F-5
GCP
Combined Balance Sheets
|
| | | | | | | |
| (In millions, except par value and shares) | December 31, 2014 | | December 31, 2013 |
| ASSETS | | | |
| Current Assets | | | |
| Cash and cash equivalents | $ | 120.9 |
| | $ | 157.8 |
|
| Restricted cash and cash equivalents | — |
| | 5.3 |
|
| Trade accounts receivable, less allowance of $4.8 (2013—$4.9) | 225.8 |
| | 240.3 |
|
| Inventories | 122.9 |
| | 104.7 |
|
| Loans receivable—related party | 47.0 |
| | 3.3 |
|
| Deferred income taxes | 8.8 |
| | 6.2 |
|
| Other current assets | 41.3 |
| | 36.2 |
|
| Total Current Assets | 566.7 |
| | 553.8 |
|
| Properties and equipment, net of accumulated depreciation and amortization of $474.0 (2013—$480.2) | 197.5 |
| | 211.5 |
|
| Goodwill | 114.0 |
| | 128.6 |
|
| Technology and other intangible assets, net | 44.0 |
| | 54.1 |
|
| Deferred income taxes | 12.3 |
| | 7.4 |
|
| Overfunded defined benefit pension plans | 44.1 |
| | 16.7 |
|
| Other assets | 8.5 |
| | 19.8 |
|
| Total Assets | $ | 987.1 |
| | $ | 991.9 |
|
| LIABILITIES AND EQUITY | | | |
| Current Liabilities | | | |
| Debt payable within one year | $ | 25.2 |
| | $ | 29.5 |
|
| Accounts payable | 112.3 |
| | 118.3 |
|
| Loans payable—related party | 53.8 |
| | 46.5 |
|
| Other current liabilities | 119.0 |
| | 113.2 |
|
| Total Current Liabilities | 310.3 |
| | 307.5 |
|
| Debt payable after one year | — |
| | 4.5 |
|
| Loans payable—related party | — |
| | 9.3 |
|
| Deferred income taxes | 18.9 |
| | 14.9 |
|
| Income tax contingencies | 6.7 |
| | 9.0 |
|
| Underfunded and unfunded defined benefit pension plans | 34.7 |
| | 29.0 |
|
| Other liabilities | 9.1 |
| | 8.0 |
|
| Total Liabilities | 379.7 |
| | 382.2 |
|
| Commitments and Contingencies—Note 9 |
| |
|
| Parent Company Equity | | | |
| Net parent investment | 652.8 |
| | 607.4 |
|
| Accumulated other comprehensive loss | (48.2 | ) | | (8.1 | ) |
| Total GCP Equity | 604.6 |
| | 599.3 |
|
| Noncontrolling interests | 2.8 |
| | 10.4 |
|
| Total Equity | 607.4 |
| | 609.7 |
|
| Total Liabilities and Equity | $ | 987.1 |
| | $ | 991.9 |
|
The Notes to Combined Financial Statements are an integral part of these statements.
F-6
GCP
Combined Statements of Parent Company Equity
|
| | | | | | | | | | | | | | | |
| (In millions) | Net Parent Investment | | Accumulated Other Comprehensive Income (Loss) | | Noncontrolling Interests | | Total Parent Company Equity |
| Parent company equity at December 31, 2011 | $ | 561.5 |
| | $ | 3.3 |
| | $ | 7.8 |
| | $ | 572.6 |
|
| Net income | 85.2 |
| | — |
| | 1.1 |
| | 86.3 |
|
| Other comprehensive income | — |
| | 0.6 |
| | 0.8 |
| | 1.4 |
|
| Net transfer to parent | (83.7 | ) | | — |
| | — |
| | (83.7 | ) |
| Parent company equity at December 31, 2012 | 563.0 |
| | 3.9 |
| | 9.7 |
| | 576.6 |
|
| Net income | 109.7 |
| | — |
| | 1.6 |
| | 111.3 |
|
| Other comprehensive loss | — |
| | (12.0 | ) | | (0.9 | ) | | (12.9 | ) |
| Net transfer to parent | (65.3 | ) | | — |
| | — |
| | (65.3 | ) |
| Parent company equity at December 31, 2013 | 607.4 |
| | (8.1 | ) | | 10.4 |
| | 609.7 |
|
| Net income | 134.3 |
| | — |
| | 1.2 |
| | 135.5 |
|
| Other comprehensive loss | — |
| | (40.1 | ) | | (2.5 | ) | | (42.6 | ) |
| Purchase of noncontrolling investment | — |
| | — |
| | (6.3 | ) | | (6.3 | ) |
| Net transfer to parent | (88.9 | ) | | — |
| | — |
| | (88.9 | ) |
| Parent company equity at December 31, 2014 | $ | 652.8 |
| | $ | (48.2 | ) | | $ | 2.8 |
| | $ | 607.4 |
|
The Notes to Combined Financial Statements are an integral part of these statements.
F-7
Notes to Combined Financial Statements
1. Basis of Presentation and Summary of Significant Accounting and Financial Reporting Policies
On February 5, 2015, W. R. Grace & Co. announced its intent to separate the business, assets and liabilities associated with the Grace Construction Products operating segment and the Darex Packaging Technologies business (collectively, "GCP") into an independent publicly-traded company. Subject to satisfaction of specified conditions, the separation will be accomplished by way of the distribution to holders of shares of W. R. Grace & Co. common stock of all of the shares of common stock of GCP Applied Technologies Inc., a Delaware corporation (the "Company"). The Company is a wholly-owned subsidiary of W. R. Grace & Co., that at the time of the distribution will hold GCP. Immediately following the distribution, holders of W. R. Grace & Co. common stock as of the record date will own 100 percent of the outstanding shares of common stock of the Company. As used in these notes, the term "Grace" refers to W. R. Grace & Co. and/or one or more of its subsidiaries and, in certain cases, their respective predecessors.
GCP is engaged in the production and sale of specialty construction chemicals, specialty building materials, and packaging products through three operating segments. Specialty Construction Chemicals ("SCC") manufactures and markets concrete admixtures and cement additives. Specialty Building Materials ("SBM") manufactures and markets sheet and liquid membrane systems that protect structures from water, air and vapor penetration, fireproofing, and other products designed to protect the building envelope. Darex Packaging Technologies ("Darex") manufactures and markets packaging materials for use in beverage and food containers, industrial containers and other consumer and industrial applications.
Principles of Combination and Basis of Presentation
The Combined Financial Statements have been prepared on a stand-alone basis and are derived from the consolidated financial statements and accounting records of Grace. The Combined Financial Statements reflect the financial position, results of operations and cash flows as GCP was historically managed, in conformity with accounting principles generally accepted in the United States of America (GAAP).
All intracompany transactions between GCP's businesses have been eliminated. All intercompany transactions between GCP and Grace have been included in these Combined Financial Statements and are considered to be effectively settled for cash, other than intercompany loan transactions, in the Combined Financial Statements at the time the transaction is recorded. The intercompany loans payable to Grace, and related interest thereon, as discussed in Note 5 to the annual Combined Financial Statements, are reflected in the Combined Balance Sheets and Combined Statements of Operations and the related cash flows are reflected in the Combined Statements of Cash Flows as "Borrowings under related party loans" and "Repayments of related party loans." The intercompany loans from Grace, and related interest thereon, are reflected on the Combined Balance Sheets as "Loans receivable—related party" and in the Combined Statements of Operations as "Interest expense (income), net—related party" and the related cash flows are reflected in the Combined Statements of Cash Flows as "Increase in lending to related party" and "Receipt of payment on loan from related party."
The Combined Financial Statements include expenses of Grace allocated to GCP for certain functions provided by Grace, including, but not limited to, general corporate expenses related to finance, legal, information technology, human resources, communications, ethics and compliance, environment health and safety, supply chain, shared services, employee benefits and incentives, insurance and stock-based compensation. These expenses have been allocated to GCP on the basis of direct usage when identifiable, with the remainder allocated on the basis of revenue, headcount or other measures. These cost allocations are included in selling, general and administrative expenses in the Combined Statements of Operations. Most of these costs are included in segment operating income with only a portion included in corporate costs. Both GCP and Grace consider the basis on which the expenses have been allocated to be a reasonable reflection of the utilization of services provided to, or the benefit received by, GCP during the periods presented.
Management believes such allocations are reasonable. The allocations may not, however, reflect the expense GCP would have incurred as an independent, publicly-traded company for the periods presented. Actual costs that may have been incurred if GCP had been a stand-alone company would depend on a number of factors, including the chosen organizational structure, what functions were outsourced or performed by employees and strategic decisions made in areas such as information technology and infrastructure. Following its separation from
Notes to Combined Financial Statements (Continued)
1. Basis of Presentation and Summary of Significant Accounting and Financial Reporting Policies (Continued)
Grace, GCP will perform these functions using its own resources or purchased services. For an interim period, however, some of these functions will continue to be provided by Grace Conn under a Transition Services Agreement, which will generally have a term of 18 months or less. In addition to the Transition Services Agreement, GCP will enter into arrangements with Grace in connection with the separation, several of which are expected to have terms longer than one year. See Note 12 to the annual Combined Financial Statements for further description of the transactions between GCP and Grace.
Grace uses a centralized approach to cash management and financing of its operations and Grace funds GCP's operating and investing activities as needed. Cash transfers to and from the cash management accounts of Grace are reflected in the Combined Statements of Cash Flows as “Transfers to parent, net.”
The Combined Financial Statements also include the push down of certain assets and liabilities that have historically been held at the Grace corporate level but are specifically identifiable or otherwise pushed down to GCP. The cash and cash equivalents held by Grace at the corporate level are not specifically identifiable to GCP and therefore were not pushed down to GCP for any of the periods presented. Cash and cash equivalents in the Combined Balance Sheets represent primarily cash held locally by entities included in the Combined Financial Statements. Third-party debt and the related interest expense of Grace were not allocated to GCP for any of the periods presented as GCP is not the legal obligor of the debt and the Grace borrowings were not directly attributable to GCP's business.
In 2001, Grace and 61 of its United States subsidiaries and affiliates filed voluntary petitions for reorganization under Chapter 11 of the United States Bankruptcy Code in the United States Bankruptcy Court for the District of Delaware in order to resolve outstanding asbestos personal injury and property damage claims, including class-action lawsuits. In 2008, Grace and other parties filed a joint plan of reorganization with the Bankruptcy Court. Following the confirmation of the Joint Plan in 2011 by the Bankruptcy Court and in 2012 by a U.S. District Court, and the resolution of all appeals, Grace emerged from bankruptcy on February 3, 2014. The Combined Financial Statements exclude all assets, liabilities, income, gains, costs and expenses reported by Grace related to asbestos and bankruptcy matters. These matters were not allocated to GCP for any period presented as Grace will continue as the legal obligor for those liabilities, Grace is expected to pay all future liabilities and costs, and such matters were not historically managed by GCP. Additionally, the components of liabilities subject to compromise, other than the asbestos-related liabilities, previously reported by Grace that are specific to GCP have been presented within separate line items in the Combined Balance Sheets based on their nature.
Noncontrolling Interests in Combined Entities GCP conducts certain of its business through joint ventures with unaffiliated third parties. For joint ventures in which GCP has a controlling financial interest, GCP consolidates the results of such joint venture in the Combined Financial Statements. GCP deducts the amount of income attributable to noncontrolling interests in the measurement of its combined net income. During the 2014 fourth quarter, GCP acquired the remaining 50% equity interest in its joint venture in Turkey for $11.7 million, making the business a wholly owned subsidiary of GCP.
Operating Segments GCP reports financial results of each of its operating segments that engage in business activities that generate revenues and expenses, and whose operating results are regularly reviewed by GCP's chief operating decision maker.
Use of Estimates The preparation of financial statements in conformity with U.S. generally accepted accounting principles requires management to make estimates and assumptions that affect the reported amount of assets and liabilities and disclosure of contingent assets and liabilities at the date of the Combined Financial Statements, and the reported amounts of revenues and expenses for the periods presented. Actual amounts could differ from those estimates, and the differences could be material. Changes in estimates are recorded in the period identified. GCP's accounting measurements that are most affected by management's estimates of future events are:
Notes to Combined Financial Statements (Continued)
1. Basis of Presentation and Summary of Significant Accounting and Financial Reporting Policies (Continued)
| |
| • | Contingent liabilities, which depend on an assessment of the probability of loss and an estimate of ultimate resolution cost, such as material commitments (see Note 9 to the annual Combined Financial Statements) and income taxes (see Note 6 to the annual Combined Financial Statements); |
| |
| • | Pension and postretirement liabilities that depend on assumptions regarding participant life spans, future inflation, discount rates and total returns on invested funds (see Note 7 to the annual Combined Financial Statements); and |
| |
| • | Realization values of net deferred tax assets, which depend on projections of future taxable income (see Note 6 to the annual Combined Financial Statements). |
Revenue Recognition GCP recognizes revenue when all of the following criteria are satisfied: risk of loss and title transfer to the customer; the price is fixed and determinable; persuasive evidence of a sales arrangement exists; and collectability is reasonably assured. Risk of loss and title transfers to customers are based on individual contractual terms. Terms of delivery are generally included in customer contracts of sale, order confirmation documents and invoices.
Certain customer arrangements include conditions for volume rebates. GCP accrues a rebate allowance and reduces recorded sales for anticipated selling price adjustments at the time of sale. GCP regularly reviews rebate accruals based on actual and anticipated sales patterns.
Cash Equivalents Cash equivalents consist of liquid instruments and investments with maturities of three months or less when purchased. The recorded amounts approximate fair value.
Inventories Inventories are stated at the lower of cost or market. The method used to determine cost is first-in/first-out, or "FIFO." Market values for raw materials are based on current cost and, for other inventory classifications, net realizable value. Inventories are evaluated regularly for salability, and slow moving and/or obsolete items are adjusted to expected salable value. Inventory values include direct and certain indirect costs of materials and production. Abnormal costs of production are expensed as incurred.
Long Lived Assets Properties and equipment are stated at cost. Depreciation of properties and equipment is generally computed using the straight-line method over the estimated useful life of the asset. Estimated useful lives range from 20 to 40 years for buildings, 3 to 7 years for information technology equipment, 3 to 10 years for operating machinery and equipment, and 5 to 10 years for furniture and fixtures. Interest is capitalized in connection with major project expenditures. Fully depreciated assets are retained in properties and equipment and related accumulated depreciation accounts until they are removed from service. In the case of disposals, assets and related accumulated depreciation are removed from the accounts and the net amount, less any proceeds from disposal, is charged or credited to earnings. Obligations for costs associated with asset retirements, such as requirements to restore a site to its original condition, are accrued at net present value and amortized along with the related asset.
Intangible assets with finite lives consist of technology, customer lists, trademarks and other intangibles and are amortized over their estimated useful lives, ranging from 1 to 20 years.
GCP reviews long-lived assets for impairment whenever events or changes in circumstances indicate that the carrying amount of an asset may not be fully recoverable. No impairment charge was required in 2013 or 2012; however, there were impairment charges recorded in 2014 (see Note 10 to the annual Combined Financial Statements).
Goodwill Goodwill arises from certain business combinations. GCP reviews its goodwill for impairment on an annual basis at October 31 and whenever events or changes in circumstances indicate that the carrying amount may not be fully recoverable. Recoverability is assessed at the reporting unit level most directly associated with the business combination that generated the goodwill. For the purpose of measuring impairment under the provisions of ASC 350 "Intangibles—Goodwill and Other," GCP has identified its reporting units as its
Notes to Combined Financial Statements (Continued)
1. Basis of Presentation and Summary of Significant Accounting and Financial Reporting Policies (Continued)
operating segments. GCP has evaluated its goodwill annually with no impairment charge required in any of the periods presented.
Financial Instruments GCP uses currency forward and/or option contracts to manage exposure to fluctuations in currency exchange rates. GCP does not hold or issue derivative financial instruments for trading purposes. Derivative instruments are recorded in the Combined Balance Sheets as either assets or liabilities at their fair value. For derivative instruments designated as fair value hedges, changes in the fair values of the derivative instruments closely offset changes in the fair values of the hedged items in "other expense, net" in the Combined Statements of Operations. For derivative instruments designated as cash flow hedges, if the derivative instruments qualify for hedge accounting pursuant to ASC 815, the effective portion of any hedge is reported as "accumulated other comprehensive income" in the Combined Balance Sheets until it is cleared to earnings during the same period in which the hedged item affects earnings. The ineffective portion of all hedges, and changes in the fair values of derivative instruments that are not designated as hedges, are recorded in current period earnings. Cash flows from derivative instruments are reported in the same category as the cash flows from the items being hedged.
Income Taxes GCP taxable income was historically included in the U.S. federal and state income tax returns of Grace. In the accompanying combined financial statements, GCP's provision for income taxes is computed following the separate return method. The separate return method applies ASC 740 to the stand-alone financial statements of each member of a consolidated group as if the group member were a separate taxpayer and stand-alone enterprise. As a result, actual tax transactions included in the Combined Financial Statements of GCP may not be included in the separate financial statements of Grace. Further, the tax treatment of certain items reflected in the separate financial statements of Grace may not be reflected in the Combined Financial Statements and tax returns of GCP. For example, certain items such as net operating losses, credit carryforwards, and valuation allowances that exist within Grace's financial statements may or may not exist in GCP's stand-alone statements.
With the exception of certain dedicated foreign entities, GCP does not maintain taxes payable to and from Grace and GCP is deemed to settle the annual current tax balances immediately with the legal entities liable for the taxes in the respective jurisdictions. These settlements are reflected as changes in net parent investment. The Combined Statements of Cash Flows reflect cash paid for income taxes including GCP’s cash taxes paid to tax authorities as well as tax payments which are deemed settled with Grace as the tax payer during these time periods.
Deferred tax assets and liabilities are recognized with respect to the expected future tax consequences of events that have been recorded in the Combined Financial Statements. If it is more likely than not that all or a portion of deferred tax assets will not be realized, a valuation allowance is provided against such deferred tax assets. The assessment of realization of deferred tax assets is performed based on the weight of the positive and negative evidence available to indicate whether the asset is recoverable, including tax planning strategies that are prudent and feasible.
Tax benefits from an uncertain tax position are recognized only if it is more likely than not that the tax position will be sustained upon examination by the taxing authorities based on the technical merits of the position. Tax benefits recognized in the financial statements from such a position are measured based on the largest benefit that has a greater than fifty percent likelihood of being realized upon ultimate settlement. GCP evaluates such likelihood based on relevant facts and tax law.
Pension Benefits GCP's method of accounting for actuarial gains and losses relating to its global defined benefit pension plans is referred to as "mark-to-market accounting." Under mark-to-market accounting, GCP's pension costs consist of two elements: 1) ongoing costs recognized quarterly, which include service and interest costs, expected returns on plan assets, and amortization of prior service costs/credits; and 2) mark-to-market gains and losses recognized annually in the fourth quarter resulting from changes in actuarial assumptions, such as discount rates and the difference between actual and expected returns on plan assets. Should a significant
Notes to Combined Financial Statements (Continued)
1. Basis of Presentation and Summary of Significant Accounting and Financial Reporting Policies (Continued)
event occur, GCP's pension obligation and plan assets would be remeasured at an interim period, and the gains or losses on remeasurement would be recognized in that period.
Stock-Based Compensation GCP recognizes expenses related to stock-based compensation payment transactions in which it receives employee services in exchange for (a) equity instruments of Grace or (b) liabilities that are based on the fair value of Grace’s equity instruments or that may be settled by the issuance of equity instruments. Stock-based compensation cost for restricted stock units (RSUs) and share settled performance based units (PBUs) are measured based on the high/low average of the price of Grace’s common stock on the date of grant. Cash settled performance based units (CSPBU) are remeasured at the end of each reporting period based on the closing fair market value of Grace’s common stock. Stock-based compensation cost for stock options is estimated at the grant date based on each option’s fair value as calculated by the Black-Scholes option pricing model. GCP recognizes stock-based compensation cost as expense ratably on a straight-line basis over the requisite service period.
Currency Translation Assets and liabilities of foreign subsidiaries (other than those located in countries with highly inflationary economies) are translated into U.S. dollars at current exchange rates, while revenues, costs and expenses are translated at average exchange rates during each reporting period. The resulting translation adjustments are included in "accumulated other comprehensive loss" in the Combined Balance Sheets. The financial statements of any subsidiaries located in countries with highly inflationary economies are remeasured as if the functional currency were the U.S. dollar; the remeasurement creates translation adjustments that are reflected in net income in the Combined Statements of Operations.
On February 8, 2013, the Venezuelan government announced that, effective February 13, 2013, the official exchange rate of the bolivar to U.S. dollar would devalue from 4.3 to 6.3. As a result of this currency devaluation, GCP incurred a charge to net income of $8.5 million in the 2013 first quarter. Of this amount, $1.6 million is included in segment operating income.
Subsequent Events GCP has evaluated transactions and events for potential recognition and disclosure from the balance sheet date through August 5, 2015, the date the financial statements were issued. With the exception of the cash repatriation discussed in Note 6, there were no other subsequent events identified that require recognition of, or disclosure in, these financial statements.
Effect of New Accounting Standards In July 2013, the FASB issued ASU 2013-11 "Presentation of an Unrecognized Tax Benefit When a Net Operating Loss Carryforward, a Similar Tax Loss, or a Tax Credit Carryforward Exists." This update is intended to improve the consistency surrounding the presentation of an unrecognized tax benefit when a net operating loss carryforward exists, requiring the unrecognized tax benefit to be presented as a reduction to a deferred tax asset for a net operating loss carryforward, a similar tax loss, or a tax credit carryforward. The new requirements are effective for fiscal years beginning after December 15, 2013, and for interim periods within those fiscal years, with early adoption permitted. GCP adopted this standard for the 2014 first quarter, and it did not have a material effect on the Combined Financial Statements.
In April 2014, the FASB issued ASU 2014-08 "Reporting Discontinued Operations and Disclosures of Disposals of Components of an Entity." This update is intended to change the requirements for reporting discontinued operations and enhance convergence of the FASB’s and the International Accounting Standard Board’s (IASB) reporting requirements for discontinued operations. The new requirements are effective for fiscal years beginning on or after December 15, 2014, and for interim periods within fiscal years beginning on or after December 15, 2015, with early adoption permitted. GCP adopted this standard for the 2015 first quarter, and it did not have a material effect on the Combined Financial Statements.
In May 2014, the FASB issued ASU 2014-09 "Revenue from Contracts with Customers." This update is intended to remove inconsistencies and weaknesses in revenue requirements; provide a more robust framework for addressing revenue issues; improve comparability of revenue recognition practices across entities, industries, jurisdictions and capital markets; provide more useful information to users of financial statements through improved disclosure requirements; and simplify the preparation of financial statements by reducing the number of
Notes to Combined Financial Statements (Continued)
1. Basis of Presentation and Summary of Significant Accounting and Financial Reporting Policies (Continued)
requirements to which an entity must refer. The new requirements were to be effective for fiscal years beginning after December 15, 2016, and for interim periods within those fiscal years, with early adoption not permitted. On July 9, 2015, the FASB voted to defer the effective date by one year but will permit adoption as of the original effective date. The revised standard allows for two methods of adoption: (a) full retrospective adoption, meaning the standard is applied to all periods presented, or (b) modified retrospective adoption, meaning the cumulative effect of applying the new standard is recognized as an adjustment to the opening retained earnings balance. GCP does not intend to adopt the standard early and is in the process of determining the adoption method as well as the effects the adoption will have on the Combined Financial Statements.
In April 2015, the FASB issued ASU 2015-03 "Simplifying the Presentation of Debt Issuance Costs." This update is part of the FASB's Simplification Initiative and is also intended to enhance convergence with the IASB's treatment of debt issuance costs. The update requires that debt issuance costs related to a recognized debt liability be presented in the balance sheet as a direct deduction from the carrying amount of that debt liability, consistent with debt discounts. The new requirements are effective for fiscal years beginning after December 15, 2015, and for interim periods within those fiscal years, with early adoption permitted. GCP is currently evaluating its effect on the Combined Financial Statements and the timing of adoption.
2. Inventories
Inventories are stated at the lower of cost or market, and cost is determined using FIFO. Inventories consisted of the following at December 31, 2014 and 2013:
|
| | | | | | | |
| | December 31, |
| (In millions) | 2014 | | 2013 |
| Raw materials | $ | 44.5 |
| | $ | 37.4 |
|
| In process | 6.1 |
| | 5.4 |
|
| Finished products | 62.9 |
| | 52.7 |
|
| Other | 9.4 |
| | 9.2 |
|
| Total inventories | $ | 122.9 |
| | $ | 104.7 |
|
3. Properties and Equipment
|
| | | | | | | |
| | December 31, |
| (In millions) | 2014 | | 2013 |
| Land | $ | 8.1 |
| | $ | 8.6 |
|
| Buildings | 164.7 |
| | 171.7 |
|
| Information technology and equipment | 18.8 |
| | 20.6 |
|
| Machinery, equipment and other | 469.9 |
| | 474.2 |
|
| Projects under construction | 10.0 |
| | 16.6 |
|
| Properties and equipment, gross | 671.5 |
| | 691.7 |
|
| Accumulated depreciation and amortization | (474.0 | ) | | (480.2 | ) |
| Properties and equipment, net | $ | 197.5 |
| | $ | 211.5 |
|
Depreciation expense relating to properties and equipment was $28.1 million, $28.4 million, and $29.5 million in 2014, 2013, and 2012, respectively. GCP's rental expense for operating leases was $22.6 million, $22.1 million, and $23.2 million in 2014, 2013, and 2012, respectively.
Notes to Combined Financial Statements (Continued)
3. Properties and Equipment (Continued)
At December 31, 2014, minimum future non-cancelable payments for operating leases are:
|
| | | |
| | (In millions) |
| 2015 | $ | 14.7 |
|
| 2016 | 12.0 |
|
| 2017 | 5.9 |
|
| 2018 | 4.1 |
|
| 2019 | 2.8 |
|
| Thereafter | 16.7 |
|
| | $ | 56.2 |
|
4. Goodwill and Other Intangible Assets
The carrying amount of goodwill attributable to each operating segment and the changes in those balances during the years ended December 31, 2014 and 2013, are as follows:
|
| | | | | | | | | | | | | | | |
| (In millions) | SCC | | SBM | | Darex | | Total GCP |
| Balance, December 31, 2012 | $ | 54.9 |
| | $ | 61.9 |
| | $ | 5.6 |
| | $ | 122.4 |
|
| Goodwill acquired during the year | 3.9 |
| | 4.3 |
| | — |
| | 8.2 |
|
| Foreign currency translation | (0.7 | ) | | (0.8 | ) | | 0.1 |
| | (1.4 | ) |
| Other adjustments | (0.3 | ) | | (0.3 | ) | | — |
| | (0.6 | ) |
| Balance, December 31, 2013 | 57.8 |
| | 65.1 |
| | 5.7 |
| | 128.6 |
|
| Foreign currency translation | (5.1 | ) | | (5.7 | ) | | (0.4 | ) | | (11.2 | ) |
| Other adjustments | (3.4 | ) | | — |
| | — |
| | (3.4 | ) |
| Balance, December 31, 2014 | $ | 49.3 |
| | $ | 59.4 |
| | $ | 5.3 |
| | $ | 114.0 |
|
Other adjustments in the table above relate primarily to deferred income taxes for prior acquisitions that were corrected during the current period. GCP determined that these amounts are not material to the current or prior periods.
GCP's net book value of other intangible assets at December 31, 2014 and 2013, was $44.0 million and $54.1 million, respectively, detailed as follows:
|
| | | | | | | |
| | December 31, 2014 |
| (In millions) | Gross Carrying Amount | | Accumulated Amortization |
| Customer lists | $ | 44.9 |
| | $ | 19.1 |
|
| Technology | 19.9 |
| | 9.6 |
|
| Trademarks | 15.1 |
| | 9.6 |
|
| Other | 14.4 |
| | 12.0 |
|
| Total | $ | 94.3 |
| | $ | 50.3 |
|
Notes to Combined Financial Statements (Continued)
4. Goodwill and Other Intangible Assets (Continued)
|
| | | | | | | |
| | December 31, 2013 |
| (In millions) | Gross Carrying Amount | | Accumulated Amortization |
| Customer lists | $ | 49.4 |
| | $ | 17.9 |
|
| Technology | 20.6 |
| | 8.6 |
|
| Trademarks | 17.2 |
| | 9.9 |
|
| Other | 16.0 |
| | 12.7 |
|
| Total | $ | 103.2 |
| | $ | 49.1 |
|
Total indefinite-lived trademarks, included above, at December 31, 2014 and 2013, were $4.2 million and $4.9 million, respectively. Amortization expense related to intangible assets was $5.9 million, $6.3 million, and $5.3 million in 2014, 2013 and 2012 respectively.
At December 31, 2014, estimated future annual amortization expense for intangible assets is:
|
| | | |
| | (In millions) |
| 2015 | $ | 4.9 |
|
| 2016 | 4.1 |
|
| 2017 | 3.2 |
|
| 2018 | 3.1 |
|
| 2019 | 2.7 |
|
| Thereafter | 21.8 |
|
| Total estimated amortization expense | $ | 39.8 |
|
5. Debt
Components of Debt
|
| | | | | | | |
| | December 31, |
| (In millions) | 2014 | | 2013 |
| Related party | $ | 53.8 |
| | $ | 55.8 |
|
| Letters of credit and other borrowings(1) | 25.2 |
| | 34.0 |
|
| Total debt | 79.0 |
| | 89.8 |
|
| Debt payable within one year | 79.0 |
| | 76.0 |
|
| Debt payable after one year | $ | — |
| | $ | 13.8 |
|
| Full-year weighted average interest rates on related party debt | 3.2 | % | | 2.9 | % |
| Full-year weighted average interest rates on letters of credit and other borrowings | 11.7 | % | | 10.0 | % |
___________________________________________________________________________________________________________________
| |
| (1) | Represents borrowings under various lines of credit and other borrowings, primarily by non-U.S. subsidiaries. |
At December 31, 2014, the recorded values of other financial instruments such as cash equivalents and trade receivables and payables approximated their fair values, based on the short-term maturities and floating rate characteristics of these instruments.
At December 31, 2014, the fair value of GCP's debt payable approximated the recorded value of $79.0 million. Fair value is determined based on Level 2 inputs, including expected future cash flows (discounted at market interest rates), estimated current market prices and quotes from financial institutions.
Debt at December 31, 2014, was used primarily to fund the working capital needs of the business and for acquisitions. All debt is scheduled to mature on or before December 31, 2015.
Notes to Combined Financial Statements (Continued)
6. Income Taxes
Provision for Income Taxes
The components of income before income taxes and the related provision for income taxes for 2014, 2013, and 2012 are as follows:
Income Taxes
|
| | | | | | | | | | | |
| (In millions) | 2014 | | 2013 | | 2012 |
| Income before income taxes: | | | | | |
| Domestic | $ | 65.6 |
| | $ | 86.8 |
| | $ | 46.0 |
|
| Foreign | 125.5 |
| | 76.1 |
| | 88.4 |
|
| Total | $ | 191.1 |
| | $ | 162.9 |
| | $ | 134.4 |
|
| Benefit from (provision for) income taxes: | | | | | |
| Federal—current | $ | (23.3 | ) | | $ | (16.8 | ) | | $ | (23.2 | ) |
| Federal—deferred | 3.6 |
| | (3.7 | ) | | 3.8 |
|
| State and local—current | (4.7 | ) | | (5.7 | ) | | (4.5 | ) |
| State and local—deferred | 0.6 |
| | (0.6 | ) | | 0.6 |
|
| Foreign—current | (29.2 | ) | | (22.3 | ) | | (19.1 | ) |
| Foreign—deferred | (2.6 | ) | | (2.5 | ) | | (5.7 | ) |
| Total | $ | (55.6 | ) | | $ | (51.6 | ) | | $ | (48.1 | ) |
The income by jurisdiction above does not reflect $7.9 million, $18.4 million, and $13.8 million of domestic income resulting from repatriated earnings in 2014, 2013, and 2012, respectively.
The difference between the provision for income taxes at the U.S. federal income tax rate of 35% and GCP's overall income tax provision is summarized as follows:
Income Tax Provision Analysis
|
| | | | | | | | | | | |
| (In millions) | 2014 | | 2013 | | 2012 |
| Tax provision at U.S. federal income tax rate | $ | (66.9 | ) | | $ | (57.0 | ) | | $ | (47.0 | ) |
| Change in provision resulting from: | | | | | |
| Effect of tax rates in foreign jurisdictions | 12.3 |
| | 2.2 |
| | 7.0 |
|
| State and local income taxes, net of federal income tax benefit | (2.7 | ) | | (4.1 | ) | | (2.6 | ) |
| Nontaxable income/non-deductible expenses | (2.5 | ) |
| (2.7 | ) |
| (4.1 | ) |
| Benefit from domestic production activities and other | 2.2 |
| | 2.6 |
| | 1.5 |
|
| Adjustments to uncertain tax positions | 1.9 |
| | 3.1 |
| | (3.4 | ) |
| Benefit from U.S. taxes on foreign earnings | 0.1 |
| | 4.3 |
| | 0.5 |
|
| Provision for income taxes | $ | (55.6 | ) | | $ | (51.6 | ) | | $ | (48.1 | ) |
In 2014, the positive effect of lower tax rates in foreign jurisdictions was more significant than in 2013 or 2012. The increased effect in 2014 was primarily due to year-over-year increases in earnings in lower tax rate jurisdictions and year-over-year decreases in book-to-tax permanent adjustments. Expenses in foreign jurisdictions that were not deductible for tax purposes (book-to-tax permanent adjustments) were higher in 2013 than in 2014 or 2012.
Notes to Combined Financial Statements (Continued)
6. Income Taxes (Continued)
Deferred Tax Assets and Liabilities
At December 31, 2014 and 2013, the deferred tax assets and liabilities consisted of the following items:
Deferred Tax Analysis
|
| | | | | | | |
| (In millions) | December 31, 2014 | | December 31, 2013 |
| Deferred tax assets: | | | |
| Reserves and allowances | $ | 9.1 |
| | $ | 7.5 |
|
| Research and development | 9.0 |
| | 7.5 |
|
| Foreign net operating loss carryforwards | 7.7 |
| | 8.4 |
|
| Pension benefits | — |
| | 5.1 |
|
| Other | 8.1 |
| | 5.6 |
|
| Total deferred tax assets | $ | 33.9 |
| | $ | 34.1 |
|
| Deferred tax liabilities: | |
| | |
|
| Intangible assets | $ | (14.4 | ) | | $ | (19.2 | ) |
| Properties and equipment | (14.2 | ) | | (12.7 | ) |
| Other | (2.1 | ) | | (2.4 | ) |
| Total deferred tax liabilities | $ | (30.7 | ) | | $ | (34.3 | ) |
| Valuation Allowance: | | | |
| Foreign net operating loss carryforwards | (1.8 | ) | | (1.6 | ) |
| Net deferred tax assets (liabilities) | $ | 1.4 |
| | $ | (1.8 | ) |
At December 31, 2014 and 2013, GCP has recorded a valuation allowance of $1.8 million and $1.6 million respectively, to reduce its net deferred tax assets to the amount that is more likely than not to be realized. The realization of deferred tax assets is dependent on the generation of sufficient taxable income in the appropriate tax jurisdictions. GCP believes it is more likely than not that the remaining deferred tax assets will be realized. If GCP were to determine that it would not be able to realize a portion of its deferred tax assets in the future, for which there is currently no valuation allowance, an adjustment to the deferred tax assets would be charged to earnings in the period such determination was made. Conversely, if GCP were to make a determination that it is more likely than not that deferred tax assets, for which there is currently a valuation allowance, would be realized, the related valuation allowance would be reduced and a benefit to earnings would be recorded.
Unrepatriated Foreign Earnings
GCP has not provided for U.S. federal, state and foreign deferred income taxes on $577.3 million of undistributed earnings of foreign subsidiaries. The unrecorded deferred tax liability associated with these earnings is $43.7 million. Earnings of $7.9 million, $18.4 million, and $13.8 million were repatriated from non-U.S. GCP subsidiaries in 2014, 2013, and 2012, respectively, resulting in an insignificant amount of U.S. income tax expense or benefit.
As of December 31, 2014, GCP had the intent and ability to indefinitely reinvest undistributed earnings of its foreign subsidiaries outside the United States. In the 2015 first quarter, Grace announced its plan to separate into two publicly traded companies and has reassessed the capital structure and financial requirements of both Grace and GCP. In the 2015 second quarter, Grace and GCP determined that Grace will repatriate approximately $131 million of foreign earnings in the 2015 third and fourth quarters in advance of the separation. Grace and GCP believe that the separation is a one-time, non-recurring event, and such repatriation would not have occurred if not for the separation.
With the exception of the repatriation of undistributed earnings prior to the completion of the separation, GCP expects undistributed prior-year earnings of its foreign subsidiaries to remain permanently reinvested except
Notes to Combined Financial Statements (Continued)
6. Income Taxes (Continued)
in certain instances where repatriation of such earnings would result in minimal or no tax. GCP bases this assertion on:
| |
| (1) | the expectation that it will satisfy its U.S. cash obligations in the foreseeable future without requiring the repatriation of prior-year foreign earnings; |
| |
| (2) | plans for significant and continued reinvestment of foreign earnings in organic and inorganic growth initiatives outside the U.S.; and |
| |
| (3) | remittance restrictions imposed by local governments. |
GCP will continually analyze and evaluate its cash needs to determine the appropriateness of its indefinite reinvestment assertion.
Unrecognized Tax Benefits
A reconciliation of the unrecognized tax benefits, excluding interest and penalties, for the three years ended December 31, 2014, follows:
Rollforward of Unrecognized Tax Benefits
|
| | | |
| (In millions) | Unrecognized Tax Benefits |
| Balance, January 1, 2012 | $ | 6.6 |
|
| Additions for current year tax positions | — |
|
| Additions for prior year tax positions | 6.6 |
|
| Reductions for prior year tax positions and reclassifications | (1.0 | ) |
| Reductions for expirations of statute of limitations | (0.7 | ) |
| Settlements | (0.6 | ) |
| Balance, December 31, 2012 | 10.9 |
|
| Additions for current year tax positions | 1.5 |
|
| Additions for prior year tax positions | — |
|
| Reductions for prior year tax positions and reclassifications | (0.3 | ) |
| Reductions for expirations of statute of limitations | (4.4 | ) |
| Settlements | — |
|
| Balance, December 31, 2013 | 7.7 |
|
| Additions for current year tax positions | — |
|
| Additions for prior year tax positions | 0.7 |
|
| Reductions for prior year tax positions and reclassifications | (0.4 | ) |
| Reductions for expirations of statute of limitations | (0.3 | ) |
| Settlements | (2.4 | ) |
| Balance, December 31, 2014 | $ | 5.3 |
|
The balance of unrecognized tax benefits as of December 31, 2014, 2013 and 2012 of $5.3 million, $7.7 million and $10.9 million, respectively, if recognized, would affect the effective tax rate. GCP accrues potential interest and any associated penalties related to uncertain tax positions in "benefit from (provision for) income taxes" in the Combined Statements of Operations. The balances of unrecognized tax benefits in the preceding table do not include accrued interest and penalties. The total amount of interest and penalties accrued on uncertain tax positions as of December 31, 2014, 2013, and 2012 was $1.4 million, $1.3 million and $1.3 million, respectively, net of applicable federal income tax benefits.
Unrecognized tax benefits from GCP's operations are included in the Combined Financial Statements including those that in certain jurisdictions have historically been included in tax returns filed by Grace. In such
Notes to Combined Financial Statements (Continued)
6. Income Taxes (Continued)
instances, uncertain tax positions related to GCP's operations may represent obligations of Grace. As of December 31, 2014, 2013, 2012, the amount of unrecognized tax benefits considered obligations of Grace (including both interest and penalties) were $2.1 million, $4.1 million and $7.4 million, respectively.
GCP believes it is reasonably possible that in the next 12 months the amount of the liability for unrecognized tax benefits could decrease by approximately $3.7 million.
GCP files U.S. federal income tax returns as well as income tax returns in various state and foreign jurisdictions. Unrecognized tax benefits relate to income tax returns for tax years that remain subject to examination by the relevant tax authorities. Since GCP's operations have historically been included in federal and state returns filed by Grace, the information reflected below for the United States relates to historical Grace returns.
The following table summarizes open tax years by major jurisdiction:
|
| | | |
| Tax Jurisdiction(1) | Examination in Progress | | Examination Not Initiated |
| United States—Federal | None | | 2010-2013 |
| United States—States | 2007-2010 | | 2007-2013 |
| United Kingdom | None | | 2013 |
| France | 2010-2011 | | 2012-2013 |
| Canada | None | | 2006-2013 |
___________________________________________________________________________________________________________________
(1) Includes federal, state, provincial or local jurisdictions, as applicable.
7. Pension Plans and Other Postretirement Benefit Plans
Multiemployer Plans GCP employees participate in funded and unfunded defined benefit pension and other postretirement benefit plans (the “Shared Plans”) sponsored by Grace, which include participants of other Grace subsidiaries. For purposes of the Combined Financial Statements, the Shared Plans are accounted for as multiemployer benefit plans. Accordingly, GCP does not record an asset or liability to recognize the funded status of these plans in the Combined Balance Sheets. GCP’s allocated pension expense for the defined benefit pension plans was $5.3 million, $3.0 million, and $4.6 million for the years ended December 31, 2014, 2013, and 2012, respectively. GCP is not allocated any portion of the mark-to-market adjustments for multiemployer plans.
Grace provided postretirement health care and life insurance benefits for retired employees of certain U.S. business units and certain divested business units. The postretirement medical plan provided various levels of benefits to employees hired before 1993 who retired from Grace after age 55 with at least 10 years of service. In June 2014, Grace announced plans to discontinue its postretirement medical plan for all U.S. employees effective October 31, 2014, and to eliminate certain postretirement life insurance benefits. GCP’s allocated income (expense) for the postretirement health care and life insurance benefits plan was $0.7 million, $(1.5) million, and $(1.8) million for the years ended December 31, 2014, 2013, and 2012, respectively. GCP was not allocated any portion of the gain on termination of the postretirement plans.
Defined Contribution Retirement Plan Grace also sponsors a defined contribution retirement plan for its employees in the United States, in which GCP’s employees participate. This plan is qualified under section 401(k) of the U.S. tax code. Currently, Grace contributes an amount equal to 100% of employee contributions, up to 6% of an individual employee's salary or wages. For the years ended December 31, 2014, 2013, and 2012, GCP received an allocation of the total cost related to this benefit plan of $4.5 million, $4.3 million, and $4.1 million, respectively.
Pension Plans GCP’s employees also participate in certain defined benefit pension plans, primarily in the U.K., that GCP sponsors. GCP records an asset or liability to recognize the funded status of these plans in the Combined Balance Sheets. Information for these defined benefit pension plans is shown below.
Notes to Combined Financial Statements (Continued)
7. Pension Plans and Other Postretirement Benefit Plans (Continued)
The following table presents the funded status of GCP's fully-funded, underfunded, and unfunded pension plans:
|
| | | | | | | |
| (In millions) | December 31, 2014 | | December 31, 2013 |
| Overfunded defined benefit pension plans | $ | 44.1 |
| | $ | 16.7 |
|
| Underfunded defined benefit pension plans | (7.7 | ) | | (5.6 | ) |
| Unfunded defined benefit pension plans | (27.0 | ) | | (23.4 | ) |
| Total underfunded and unfunded defined benefit pension plans | (34.7 | ) | | (29.0 | ) |
| Pension liabilities included in other current liabilities | (1.0 | ) | | (1.1 | ) |
| Net funded status | $ | 8.4 |
| | $ | (13.4 | ) |
Fully-funded plans include several advance-funded plans where the fair value of the plan assets exceeds the projected benefit obligation ("PBO"). This group of plans was overfunded by $44.1 million as of December 31, 2014, and the overfunded status is reflected as "overfunded defined benefit pension plans" in the Combined Balance Sheets. Underfunded plans include a group of advance-funded plans that are underfunded on a PBO basis. Unfunded plans include several plans that are funded on a pay-as-you-go basis, and therefore, the entire PBO is unfunded. The combined balance of the underfunded and unfunded plans was $35.7 million as of December 31, 2014.
GCP maintains defined benefit pension plans covering current and former employees of certain business units and divested business units who meet age and service requirements. Benefits are generally based on final average salary and years of service. GCP funds its U.S. qualified pension plans ("U.S. qualified pension plans") in accordance with U.S. federal laws and regulations. Non-U.S. pension plans ("non-U.S. pension plans") are funded under a variety of methods, as required under local laws and customs.
At the December 31, 2014, measurement date for GCP's defined benefit pension plans, the PBO was $298.6 million as measured under GAAP compared with $294.7 million as of December 31, 2013. The PBO basis reflects the present value (using a 3.95% discount rate for U.S. plans and a 3.39% weighted average discount rate for non-U.S. plans as of December 31, 2014) of vested and non-vested benefits earned from employee service to date, based upon current services and estimated future pay increases for active employees.
On an annual basis a full remeasurement of pension assets and pension liabilities is performed based on GCP's estimates and actuarial valuations. These valuations reflect the terms of the plan and use participant-specific information as well as certain key assumptions provided by management.
Notes to Combined Financial Statements (Continued)
7. Pension Plans and Other Postretirement Benefit Plans (Continued)
Analysis of Plan Accounting and Funded Status The following table summarizes the changes in benefit obligations and fair values of retirement plan assets during 2014 and 2013:
|
| | | | | | | | | | | | | | | | | | | | | | | |
| | Defined Benefit Pension Plans |
Change in Financial Status of Retirement Plans (In millions) | U.S. | | Non-U.S. | | Total |
| 2014 | | 2013 | | 2014 | | 2013 | | 2014 | | 2013 |
| Change in Projected Benefit Obligation (PBO): | | | | | | | | | | |
| Benefit obligation at beginning of year | $ | 11.2 |
| | $ | 12.2 |
| | $ | 283.5 |
| | $ | 274.3 |
| | $ | 294.7 |
| | $ | 286.5 |
|
| Service cost | 0.2 |
| | 0.3 |
| | 3.2 |
| | 3.1 |
| | 3.4 |
| | 3.4 |
|
| Interest cost | 0.5 |
| | 0.5 |
| | 12.0 |
| | 11.0 |
| | 12.5 |
| | 11.5 |
|
| Plan participants' contributions | — |
| | — |
| | 0.6 |
| | 0.6 |
| | 0.6 |
| | 0.6 |
|
| Actuarial loss (gain) | 1.3 |
| | (1.5 | ) | | 22.1 |
| | 2.0 |
| | 23.4 |
| | 0.5 |
|
| Benefits paid | (0.3 | ) | | (0.3 | ) | | (15.4 | ) | | (12.3 | ) | | (15.7 | ) | | (12.6 | ) |
| Currency exchange translation adjustments | — |
| | — |
| | (20.3 | ) | | 4.8 |
| | (20.3 | ) | | 4.8 |
|
| Benefit obligation at end of year | $ | 12.9 |
| | $ | 11.2 |
| | $ | 285.7 |
| | $ | 283.5 |
| | $ | 298.6 |
| | $ | 294.7 |
|
| Change in Plan Assets: | | | | | | | | | | | |
| Fair value of plan assets at beginning of year | $ | 10.6 |
| | $ | 9.3 |
| | $ | 270.7 |
| | $ | 277.4 |
| | $ | 281.3 |
| | $ | 286.7 |
|
| Actual return on plan assets | 1.1 |
| | 0.3 |
| | 54.4 |
| | (0.8 | ) | | 55.5 |
| | (0.5 | ) |
| Employer contributions | 0.8 |
| | 1.3 |
| | 3.6 |
| | 2.3 |
| | 4.4 |
| | 3.6 |
|
| Plan participants' contributions | — |
| | — |
| | 0.6 |
| | 0.6 |
| | 0.6 |
| | 0.6 |
|
| Benefits paid | (0.3 | ) | | (0.3 | ) | | (15.4 | ) | | (12.3 | ) | | (15.7 | ) | | (12.6 | ) |
| Currency exchange translation adjustments | — |
| | — |
| | (19.1 | ) | | 3.5 |
| | (19.1 | ) | | 3.5 |
|
| Fair value of plan assets at end of year | $ | 12.2 |
| | $ | 10.6 |
| | $ | 294.8 |
| | $ | 270.7 |
| | $ | 307.0 |
| | $ | 281.3 |
|
| Funded status at end of year (PBO basis) | $ | (0.7 | ) | | $ | (0.6 | ) | | $ | 9.1 |
| | $ | (12.8 | ) | | $ | 8.4 |
| | $ | (13.4 | ) |
| Amounts recognized in the Combined Balance Sheets consist of: | | | | | | | | | | | |
| Noncurrent assets | $ | — |
| | $ | — |
| | $ | 44.1 |
| | $ | 16.7 |
| | $ | 44.1 |
| | $ | 16.7 |
|
| Current liabilities | — |
| | — |
| | (1.0 | ) | | (1.1 | ) | | (1.0 | ) | | (1.1 | ) |
| Noncurrent liabilities | (0.7 | ) | | (0.6 | ) | | (34.0 | ) | | (28.4 | ) | | (34.7 | ) | | (29.0 | ) |
| Net amount recognized | $ | (0.7 | ) | | $ | (0.6 | ) | | $ | 9.1 |
| | $ | (12.8 | ) | | $ | 8.4 |
| | $ | (13.4 | ) |
| Amounts recognized in Accumulated Other Comprehensive Income consist of: | | | | | | | | | | | |
| Prior service cost | 0.1 |
| | 0.2 |
| | 0.3 |
| | 0.3 |
| | 0.4 |
| | 0.5 |
|
| Net amount recognized | $ | 0.1 |
| | $ | 0.2 |
| | $ | 0.3 |
| | $ | 0.3 |
| | $ | 0.4 |
| | $ | 0.5 |
|
|
| | | | | | | | | | | | | | | |
| | Defined Benefit Pension Plans |
Change in Financial Status of Retirement Plans (In millions) | U.S. | | Non-U.S. | | Total |
| 2014 | | 2013 | | 2014 | | 2013 | | 2014 | | 2013 |
| Weighted Average Assumptions Used to Determine Benefit Obligations as of December 31: | | | | | | | | | | | |
| Discount rate | 3.95 | % | | 4.76 | % | | 3.39 | % | | 4.37 | % | | NM | | NM |
| Rate of compensation increase | NM |
| | NM |
| | 3.12 | % | | 3.30 | % | | NM | | NM |
| Weighted Average Assumptions Used to Determine Net Periodic Benefit Cost for Years Ended December 31: | | | | | | | | | | | |
| Discount rate | 4.76 | % | | 3.75 | % | | 4.37 | % | | 4.23 | % | | NM | | NM |
| Expected return on plan assets | 6.00 | % | | 6.00 | % | | 4.88 | % | | 4.39 | % | | NM | | NM |
| Rate of compensation increase | NM |
| | NM |
| | 3.30 | % | | 3.26 | % | | NM | | NM |
___________________________________________________________________________________________________________________
NM—Not meaningful
Notes to Combined Financial Statements (Continued)
7. Pension Plans and Other Postretirement Benefit Plans (Continued)
|
| | | | | | | | | | | | | | | | | | | | | | | |
Components of Net Periodic Benefit Cost (Income) and Other Amounts Recognized in Other Comprehensive Loss (Income) (In millions) | 2014 | | 2013 | | 2012 |
| U.S. | | Non-U.S. | | U.S. | | Non-U.S. | | U.S. | | Non-U.S. |
| Net Periodic Benefit Cost (Income) (1) | | | | | | | | | | | |
| Service cost | $ | 0.2 |
| | $ | 3.2 |
| | $ | 0.3 |
| | $ | 3.1 |
| | $ | 0.3 |
| | $ | 2.7 |
|
| Interest cost | 0.5 |
| | 12.0 |
| | 0.4 |
| | 11.0 |
| | 0.4 |
| | 11.5 |
|
| Expected return on plan assets | (0.6 | ) | | (12.9 | ) | | (0.6 | ) | | (11.6 | ) | | (0.5 | ) | | (12.2 | ) |
| Amortization of prior service cost | 0.1 |
| | — |
| | 0.1 |
| | — |
| | 0.1 |
| | — |
|
| Annual mark-to-market adjustment | 0.9 |
| | (18.7 | ) | | (1.2 | ) | | 15.1 |
| | 0.4 |
| | 17.7 |
|
| Net periodic benefit cost (income) | $ | 1.1 |
| | $ | (16.4 | ) | | $ | (1.0 | ) | | $ | 17.6 |
| | $ | 0.7 |
| | $ | 19.7 |
|
| Other Changes in Plan Assets and Benefit Obligations Recognized in Other Comprehensive Loss (Income) | | | | | | | | | | | |
| Amortization of prior service cost | (0.1 | ) | | — |
| | (0.1 | ) | | — |
| | (0.1 | ) | | — |
|
| Total recognized in other comprehensive income | (0.1 | ) | | — |
| | (0.1 | ) | | — |
| | (0.1 | ) | | — |
|
| Total recognized in net periodic benefit cost (income) and other comprehensive loss (income) | $ | 1.0 |
| | $ | (16.4 | ) | | $ | (1.1 | ) | | $ | 17.6 |
| | $ | 0.6 |
| | $ | 19.7 |
|
___________________________________________________________________________________________________________________
| |
| (1) | Includes expense that was allocated to Grace of $0.4 million, $0.4 million, and $0.6 million for the years ended December 31, 2014, 2013, and 2012, respectively. GCP allocates such expense excluding any mark-to-market adjustment. |
The estimated prior service cost for the defined benefit pension plans that will be amortized from accumulated other comprehensive income into net periodic benefit cost (income) over the next fiscal year is $0.1 million.
The accumulated benefit obligation for all defined benefit pension plans was approximately $281 million and $278 million as of December 31, 2014 and 2013, respectively.
|
| | | | | | | | | | | | | | | | | | | | | | | |
Pension Plans with Underfunded or Unfunded Accumulated Benefit Obligation (In millions) | U.S. | | Non-U.S. | | Total |
| 2014 | | 2013 | | 2014 | | 2013 | | 2014 | | 2013 |
| Projected benefit obligation | $ | 12.7 |
| | $ | 11.1 |
| | $ | 39.9 |
| | $ | 32.2 |
| | $ | 52.6 |
| | $ | 43.3 |
|
| Accumulated benefit obligation | 12.7 |
| | 11.1 |
| | 31.8 |
| | 25.9 |
| | 44.5 |
| | 37.0 |
|
| Fair value of plan assets | 12.0 |
| | 10.5 |
| | 4.9 |
| | 4.0 |
| | 16.9 |
| | 14.5 |
|
Notes to Combined Financial Statements (Continued)
7. Pension Plans and Other Postretirement Benefit Plans (Continued)
|
| | | | | | | | | | | |
Estimated Expected Future Benefit Payments Reflecting Future Service for the Fiscal Years Ending (In millions) | Pension Plans | | Total Payments |
| U.S. | | Non-U.S.(1) | |
Benefit Payments | | Benefit Payments | |
| 2012 (actual) | $ | 0.3 |
| | $ | 12.3 |
| | $ | 12.6 |
|
| 2013 (actual) | 0.3 |
| | 12.3 |
| | 12.6 |
|
| 2014 (actual) | 0.3 |
| | 15.4 |
| | 15.7 |
|
| 2015 | 0.6 |
| | 11.8 |
| | 12.4 |
|
| 2016 | 0.6 |
| | 11.4 |
| | 12.0 |
|
| 2017 | 0.6 |
| | 12.1 |
| | 12.7 |
|
| 2018 | 0.7 |
| | 12.4 |
| | 13.1 |
|
| 2019 | 0.7 |
| | 13.6 |
| | 14.3 |
|
| 2020 - 2024 | 3.8 |
| | 73.6 |
| | 77.4 |
|
___________________________________________________________________________________________________________________
| |
| (1) | Non-U.S. estimated benefit payments for 2015 and future periods have been translated at the applicable December 31, 2014, exchange rates. |
Discount Rate Assumption The assumed discount rate for pension plans reflects the market rates for high-quality corporate bonds currently available and is subject to change based on changes in overall market interest rates. For the U.S. qualified pension plans, the assumed discount rate of 3.95% as of December 31, 2014, was selected, in consultation with Grace's independent actuaries, based on a yield curve constructed from a portfolio of high quality bonds for which the timing and amount of cash outflows approximate the estimated payouts of the plan.
As of December 31, 2014 and 2013, the United Kingdom pension plan represented approximately 84% and 85%, respectively, of the benefit obligation of the non-U.S. pension plans. The assumed discount rate as of December 31, 2014, for the United Kingdom (3.44%) was selected, in consultation with Grace's independent actuaries, based on a yield curve constructed from a portfolio of sterling-denominated high quality bonds for which the timing and amount of cash outflows approximate the estimated payouts of the plan. The assumed discount rates for the remaining non-U.S. pension plans were determined based on the nature of the liabilities, local economic environments and available bond indices.
Investment Guidelines for Advance-Funded Pension Plans The investment goal for the U.S. qualified pension plans subject to advance funding is to earn a long-term rate of return consistent with the related cash flow profile of the underlying benefit obligation. The plans are pursuing a well-defined risk management strategy designed to reduce investment risks as their funded status improves.
The U.S. qualified pension plans have adopted a diversified set of portfolio management strategies to optimize the risk reward profile of the plans:
| |
| • | Liability hedging portfolio: primarily invested in intermediate-term and long-term investment grade corporate bonds in actively managed strategies. |
| |
| • | Growth portfolio: invested in a diversified set of assets designed to deliver performance in excess of the underlying liabilities with controls regarding the level of risk. |
| |
| • | U.S. equity securities: the portfolio contains domestic equities that are passively managed to the S&P 500 and Russell 2000 benchmark and an allocation to an active portfolio benchmarked to the Russell 2000. |
| |
| • | Non-U.S. equity securities: the portfolio contains non-U.S. equities in an actively managed strategy. Currency futures and forward contracts may be held for the sole purpose of hedging existing currency risk in the portfolio. |
Notes to Combined Financial Statements (Continued)
7. Pension Plans and Other Postretirement Benefit Plans (Continued)
| |
| • | Other investments: may include (a) high yield bonds: fixed income portfolio of securities below investment grade including up to 30% of the portfolio in non-U.S. issuers; and (b) global real estate securities: portfolio of diversified REIT and other liquid real estate related securities. These portfolios combine income generation and capital appreciation opportunities from developed markets globally. |
| |
| • | Liquidity portfolio: invested in short-term assets intended to pay periodic plan benefits and expenses. |
For 2014, the expected long-term rate of return on assets for the U.S. qualified pension plans was 6.00%.
The expected return on plan assets for the U.S. qualified pension plans for 2014 was selected, in consultation with Grace's independent actuaries, using an expected return model. The model determines the weighted average return for an investment portfolio based on the target asset allocation and expected future returns for each asset class, which were developed using a building block approach based on observable inflation, available interest rate information, current market characteristics, and historical results.
The target allocation of investment assets at December 31, 2014, and the actual allocation at December 31, 2014 and 2013, for GCP's U.S. qualified pension plans are as follows:
|
| | | | | | | | |
| | Target Allocation | | Percentage of Plan Assets December 31, |
| U.S. Qualified Pension Plans Asset Category | 2014 | | 2014 | | 2013 |
| U.S. equity securities | 11 | % | | 11 | % | | 10 | % |
| Non-U.S. equity securities | 7 | % | | 6 | % | | 6 | % |
| Short-term debt securities | 10 | % | | 10 | % | | 10 | % |
| Intermediate-term debt securities | 26 | % | | 26 | % | | 28 | % |
| Long-term debt securities | 44 | % | | 45 | % | | 44 | % |
| Other investments | 2 | % | | 2 | % | | 2 | % |
| Total | 100 | % | | 100 | % | | 100 | % |
The following tables present the fair value hierarchy for GCP's proportionate share of the U.S. qualified pension plan assets measured at fair value, which are held in a trust by Grace, as of December 31, 2014 and 2013.
|
| | | | | | | | | | | | | | | |
| | Fair Value Measurements at December 31, 2014, Using |
(In millions) | Total | | Quoted Prices in Active Markets for Identical Assets or Liabilities (Level 1) | | Significant Other Observable Inputs (Level 2) | | Significant Unobservable Inputs (Level 3) |
| U.S. equity group trust funds | $ | 1.3 |
| | $ | — |
| | $ | 1.3 |
| | $ | — |
|
| Non-U.S. equity group trust funds | 0.7 |
| | — |
| | 0.7 |
| | — |
|
| Corporate bond group trust funds—intermediate-term | 3.1 |
| | — |
| | 3.1 |
| | — |
|
| Corporate bond group trust funds—long-term | 5.5 |
| | — |
| | 5.5 |
| | — |
|
| Other fixed income group trust funds | 0.2 |
| | — |
| | 0.2 |
| | — |
|
| Common/collective trust funds | 1.2 |
| | — |
| | 1.2 |
| | — |
|
| Annuity and immediate participation contracts | 0.2 |
| | — |
| | 0.2 |
| | — |
|
| Total Assets | $ | 12.2 |
| | $ | — |
| | $ | 12.2 |
| | $ | — |
|
Notes to Combined Financial Statements (Continued)
7. Pension Plans and Other Postretirement Benefit Plans (Continued)
|
| | | | | | | | | | | | | | | |
| | Fair Value Measurements at December 31, 2013, Using |
(In millions) | Total | | Quoted Prices in Active Markets for Identical Assets or Liabilities (Level 1) | | Significant Other Observable Inputs (Level 2) | | Significant Unobservable Inputs (Level 3) |
| U.S. equity group trust funds | $ | 1.0 |
| | $ | — |
| | $ | 1.0 |
| | $ | — |
|
| Non-U.S. equity group trust funds | 0.6 |
| | — |
| | 0.6 |
| | — |
|
| Corporate bond group trust funds—intermediate-term | 3.0 |
| | — |
| | 3.0 |
| | — |
|
| Corporate bond group trust funds—long-term | 4.7 |
| | — |
| | 4.7 |
| | — |
|
| Other fixed income group trust funds | 0.2 |
| | — |
| | 0.2 |
| | — |
|
| Common/collective trust funds | 0.9 |
| | — |
| | 0.9 |
| | — |
|
| Annuity and immediate participation contracts | 0.2 |
| | — |
| | 0.2 |
| | — |
|
| Total Assets | $ | 10.6 |
| | $ | — |
| | $ | 10.6 |
| | $ | — |
|
Non-U.S. pension plans accounted for approximately 96% of total global pension assets at December 31, 2014 and 2013. Each of these plans, where applicable, follows local requirements and regulations. Some of the local requirements include the establishment of a local pension committee, a formal statement of investment policy and procedures, and routine valuations by plan actuaries.
The target allocation of investment assets for non-U.S. pension plans varies depending on the investment goals of the individual plans. The plan assets of the United Kingdom pension plan represent approximately 95% and 94% of the total non-U.S. pension plan assets at December 31, 2014 and 2013, respectively. In determining the expected rate of return for the U.K. pension plan, the trustees' strategic investment policy has been considered together with long-term historical returns and investment community forecasts for each asset class. The expected return by sector has been combined with the actual asset allocation to determine the 2014 expected long-term return assumption of 4.75%.
The target allocation of investment assets at December 31, 2014, and the actual allocation at December 31, 2014 and 2013, for the U.K. pension plan are as follows:
|
| | | | | | | | |
| | Target Allocation | | Percentage of Plan Assets December 31, |
| United Kingdom Pension Plan Asset Category | 2014 | | 2014 | | 2013 |
| Diversified growth funds | 12 | % | | 11 | % | | 13 | % |
| U.K. gilts | 41 | % | | 42 | % | | 40 | % |
| U.K. corporate bonds | 47 | % | | 47 | % | | 47 | % |
| Total | 100 | % | | 100 | % | | 100 | % |
The plan assets of the other country plans represent approximately 5% and 6% in the aggregate (with no country representing more than 3% individually) of total non-U.S. pension plan assets at December 31, 2014 and 2013, respectively.
Notes to Combined Financial Statements (Continued)
7. Pension Plans and Other Postretirement Benefit Plans (Continued)
The following tables present the fair value hierarchy for the non-U.S. pension plan assets measured at fair value as of December 31, 2014 and 2013.
|
| | | | | | | | | | | | | | | |
| | Fair Value Measurements at December 31, 2014, Using |
| (In millions) | Total | | Quoted Prices in Active Markets for Identical Assets or Liabilities (Level 1) | | Significant Other Observable Inputs (Level 2) | | Significant Unobservable Inputs (Level 3) |
| Common/collective trust funds | $ | 289.7 |
| | $ | — |
| | $ | 289.7 |
| | $ | — |
|
| Government and agency securities | 0.8 |
| | — |
| | 0.8 |
| | — |
|
| Insurance contracts and other investments | 3.3 |
| | — |
| | 3.3 |
| | — |
|
| Cash | 1.0 |
| | 1.0 |
| | — |
| | — |
|
| Total Assets | $ | 294.8 |
| | $ | 1.0 |
|
| $ | 293.8 |
| | $ | — |
|
|
| | | | | | | | | | | | | | | |
| | Fair Value Measurements at December 31, 2013, Using |
| (In millions) | Total | | Quoted Prices in Active Markets for Identical Assets or Liabilities (Level 1) | | Significant Other Observable Inputs (Level 2) | | Significant Unobservable Inputs (Level 3) |
| Common/collective trust funds | $ | 263.5 |
| | $ | — |
| | $ | 263.5 |
| | $ | — |
|
| Government and agency securities | 0.7 |
| | — |
| | 0.7 |
| | — |
|
| Insurance contracts and other investments | 5.1 |
| | — |
| | 5.1 |
| | — |
|
| Cash | 1.4 |
| | 1.4 |
| | — |
| | — |
|
| Total Assets | $ | 270.7 |
| | $ | 1.4 |
| | $ | 269.3 |
| | $ | — |
|
Plan Contributions and Funding GCP intends to satisfy its funding obligations under the U.S. qualified pension plans and to comply with all of the requirements of the Employee Retirement Income Security Act of 1974 ("ERISA"). For ERISA purposes, funded status is calculated on a different basis than under GAAP. In April 2014, GCP made an accelerated contribution to the trusts that hold assets of the U.S. qualified pension plans of $0.8 million. Based on the U.S. qualified pension plans' status as of December 31, 2014, there are no minimum required payments under ERISA for 2015.
GCP intends to fund non-U.S. pension plans based on applicable legal requirements and actuarial and trustee recommendations. GCP expects to contribute approximately $4 million to its non-U.S. pension plans in 2015.
8. Other Balance Sheet Accounts
|
| | | | | | | |
| (In millions) | December 31, 2014 | | December 31, 2013 |
| Other Current Assets | | | |
| Non trade receivables | 30.9 |
| | 25.2 |
|
| Prepaid expenses | 7.5 |
| | 8.7 |
|
| Income tax receivable(1) | 2.7 |
| | 2.1 |
|
| Marketable securities | 0.2 |
| | 0.2 |
|
| Total other current assets | $ | 41.3 |
| | $ | 36.2 |
|
Notes to Combined Financial Statements (Continued)
8. Other Balance Sheet Accounts (Continued)
|
| | | | | | | |
| (In millions) | December 31, 2014 | | December 31, 2013 |
| Other Current Liabilities | | | |
| Customer volume rebates | $ | 31.2 |
| | $ | 26.7 |
|
| Accrued compensation | 28.5 |
| | 26.9 |
|
| Income tax payable(1) | 18.8 |
| | 16.1 |
|
| Accrued interest | 3.3 |
| | 2.1 |
|
| Deferred income taxes | 1.1 |
| | 0.8 |
|
| Pension liabilities | 1.0 |
| | 1.1 |
|
| Other accrued liabilities | 35.1 |
| | 39.5 |
|
| Total other current liabilities | $ | 119.0 |
| | $ | 113.2 |
|
___________________________________________________________________________________________________________________
| |
| (1) | Income tax items above do not include amounts due from/to Grace. |
Accrued compensation in the table above includes salaries and wages as well as estimated current amounts due under the annual and long-term incentive programs.
9. Commitments and Contingent Liabilities
Purchase Commitments GCP uses purchase commitments to ensure supply and to minimize the volatility of certain key raw materials including lignins, polycarboxylates, amines and other materials. Such commitments are for quantities that GCP fully expects to use in its normal operations.
Guarantees and Indemnification Obligations GCP is a party to many contracts containing guarantees and indemnification obligations. These contracts primarily consist of:
| |
| • | Product warranties with respect to certain products sold to customers in the ordinary course of business. These warranties typically provide that products will conform to specifications. GCP accrues a warranty liability on a transaction-specific basis depending on the individual facts and circumstances related to each sale. Both the liability and annual expense related to product warranties are immaterial to the Combined Financial Statements. |
| |
| • | Performance guarantees offered to customers. GCP has not established a liability for these arrangements based on past performance. |
| |
| • | Contracts providing for the sale of a former business unit or product line in which GCP has agreed to indemnify the buyer against liabilities arising prior to the closing of the transaction, including environmental liabilities. |
Environmental Remediation GCP is subject to loss contingencies resulting from extensive and evolving federal, state, local and foreign environmental laws and regulations relating to the generation, storage, handling, discharge, disposition and stewardship of hazardous wastes and other materials. GCP accrues for anticipated costs associated with response efforts where an assessment has indicated that a probable liability has been incurred and the cost can be reasonably estimated. These accruals do not take into account any discounting for the time value of money.
GCP's environmental liabilities are reassessed whenever circumstances become better defined or response efforts and their costs can be better estimated. These liabilities are evaluated based on currently available information, including the progress of remedial investigation at each site, the current status of discussions with regulatory authorities regarding the method and extent of remediation at each site, existing technology, prior experience in contaminated site remediation and the apportionment of costs among potentially responsible parties.
Notes to Combined Financial Statements (Continued)
9. Commitments and Contingent Liabilities (Continued)
At December 31, 2014, GCP's estimated liability for environmental investigation and remediation costs totaled $0.2 million, compared with $0.5 million at December 31, 2013, and was included in "other current liabilities" and "other liabilities" in the Consolidated Balance Sheets.
Financial Assurances Financial assurances have been established for a variety of purposes, including insurance and environmental matters, trade-related commitments and other matters. At December 31, 2014, GCP had gross financial assurances issued and outstanding of $9.2 million, composed of $0.1 million of surety bonds issued by various insurance companies and $9.1 million of standby letters of credit and other financial assurances issued by various banks.
General From time to time, GCP and its subsidiaries are parties to, or targets of, lawsuits, claims, investigations and proceedings which are being managed and defended in the ordinary course of business. While GCP is unable to predict the outcome of these matters, it does not believe, based upon currently available facts, that the ultimate resolution of any such pending matters will have a material adverse effect on its overall financial condition, results of operations, or cash flows.
Accounting for Contingencies Although the outcome of each of the matters discussed above cannot be predicted with certainty, GCP has assessed its risk and has made accounting estimates as required under GAAP.
10. Restructuring Expenses and Asset Impairments
In 2014, GCP incurred costs from restructuring actions as a result of changes in the business environment and its business structure. GCP incurred $4.0 million ($3.1 million in SCC, $0.5 million in SBM, and $0.4 million in Darex) of restructuring expenses during 2014, compared with $7.4 million in 2013 ($3.4 million in SCC, $3.7 million in SBM, and $0.3 million in Darex). During 2014, GCP's concrete production management systems product line was not meeting performance expectations, resulting in reduced cash flow and increasing obligations. GCP evaluated its concrete production management systems product line long-lived assets for impairment. During the three months ended June 30, 2014, based on reviewing undiscounted cash flow information, GCP determined that the fair value of these long-lived assets was less than their carrying value and therefore recorded an impairment charge of $9.8 million ($3.8 million of equipment, $5.5 million of technology and $0.5 million of intellectual property). The remaining fair value of these assets subsequent to impairment was $8.2 million ($5.6 million of equipment, $2.3 million of technology and $0.3 million of intellectual property). During 2014, GCP also recorded an impairment charge of $4.5 million related to an unconsolidated investment. The remaining fair value of this investment subsequent to impairment was zero.
GCP had restructuring liabilities of $0.8 million, $1.1 million and $1.5 million as of December 31, 2014, 2013, and 2012 respectively related to severance actions made during the years then ended. The majority of the severance expense was paid in the year it was incurred. These costs are not included in segment operating income. Substantially all costs related to the 2013 programs were paid as of December 31, 2014, while substantially all costs related to the 2014 restructuring programs are expected to be paid by December 31, 2015.
|
| | | | | | | | | | | |
Restructuring Expenses and Asset Impairments
(In millions) | Year Ended December 31, |
| 2014 | | 2013 | | 2012 |
| Restructuring expenses | $ | 4.0 |
| | $ | 7.4 |
| | $ | 4.3 |
|
| Asset impairments | 14.3 |
| | — |
| | — |
|
| Total restructuring expenses and asset impairments | $ | 18.3 |
| | $ | 7.4 |
| | $ | 4.3 |
|
Notes to Combined Financial Statements (Continued)
10. Restructuring Expenses and Asset Impairments (Continued)
|
| | | | | | | | | | | |
Restructuring Liability (In millions) | December 31, |
| 2014 | | 2013 | | 2012 |
| Beginning Balance | $ | 1.1 |
| | $ | 1.5 |
| | $ | 4.0 |
|
| Accruals for severance and other costs | 4.0 |
| | 7.4 |
| | 4.3 |
|
| Payments | (4.3 | ) | | (7.8 | ) | | (6.8 | ) |
| Ending Balance | $ | 0.8 |
| | $ | 1.1 |
| | $ | 1.5 |
|
11. Other Comprehensive Income (Loss)
The following tables present the pre-tax, tax, and after-tax components of GCP's other comprehensive income (loss) for the years ended December 31, 2014, 2013, and 2012:
|
| | | | | | | | | | | |
Year Ended December 31, 2014 (In millions) | Pre-Tax Amount | | Tax Benefit/ (Expense) | | After-Tax Amount |
| Defined benefit pension and other postretirement plans: | | | | | |
| Amortization of net prior service cost included in net periodic benefit cost | $ | 0.1 |
| | $ | — |
| | $ | 0.1 |
|
| Benefit plans, net | 0.1 |
| | — |
| | 0.1 |
|
| Currency translation adjustments | (41.1 | ) | | — |
| | (41.1 | ) |
| Gain from hedging activities | 0.2 |
| | — |
| | 0.2 |
|
| Other than temporary impairment of investment | 0.8 |
| | — |
| | 0.8 |
|
| Loss on securities available for sale | (0.1 | ) | | — |
| | (0.1 | ) |
| Other comprehensive loss attributable to GCP | $ | (40.1 | ) | | $ | — |
| | $ | (40.1 | ) |
|
| | | | | | | | | | | |
Year Ended December 31, 2013 (In millions) | Pre-Tax Amount | | Tax Benefit/ (Expense) | | After-Tax Amount |
| Defined benefit pension and other postretirement plans: | | | | | |
| Amortization of net prior service cost included in net periodic benefit cost | $ | 0.1 |
| | $ | (0.1 | ) | | $ | — |
|
| Benefit plans, net | 0.1 |
| | (0.1 | ) | | — |
|
| Currency translation adjustments | (11.9 | ) | | — |
| | (11.9 | ) |
| Loss from hedging activities | (0.3 | ) | | 0.1 |
| | (0.2 | ) |
| Gain on securities available for sale | 0.1 |
| | — |
| | 0.1 |
|
| Other comprehensive loss attributable to GCP | $ | (12.0 | ) | | $ | — |
| | $ | (12.0 | ) |
|
| | | | | | | | | | | |
Year Ended December 31, 2012 (In millions) | Pre-Tax Amount | | Tax Benefit/ (Expense) | | After-Tax Amount |
| Defined benefit pension and other postretirement plans: | | | | | |
| Amortization of net prior service cost included in net periodic benefit cost | $ | 0.1 |
| | $ | — |
| | $ | 0.1 |
|
| Benefit plans, net | 0.1 |
| | — |
| | 0.1 |
|
| Currency translation adjustments | 0.7 |
| | — |
| | 0.7 |
|
| Loss from hedging activities | (0.2 | ) | | — |
| | (0.2 | ) |
| Other comprehensive income attributable to GCP | $ | 0.6 |
| | $ | — |
| | $ | 0.6 |
|
Notes to Combined Financial Statements (Continued)
11. Other Comprehensive Income (Loss) (Continued)
The following tables present the changes in accumulated other comprehensive income (loss), net of tax, for the years ended December 31, 2014, 2013, and 2012:
|
| | | | | | | | | | | | | | | | | | | | | | | |
Year Ended December 31, 2014 (In millions) | Defined Benefit Pension and Other Postretirement Plans | | Currency Translation Adjustments | | Gain (Loss) from Hedging Activities | | Unrealized Loss on Investment | | Gain (Loss) on Securities Available for Sale | | Total |
| Beginning balance | $ | (0.4 | ) | | $ | (6.6 | ) | | $ | (0.4 | ) | | $ | (0.8 | ) | | $ | 0.1 |
| | $ | (8.1 | ) |
| Other comprehensive income (loss) before reclassifications | — |
| | (41.1 | ) | | (0.4 | ) | | — |
| | (0.7 | ) | | (42.2 | ) |
| Amounts reclassified from accumulated other comprehensive income | 0.1 |
| | — |
| | 0.6 |
| | 0.8 |
| | 0.6 |
| | 2.1 |
|
| Net current-period other comprehensive income (loss) | 0.1 |
| | (41.1 | ) | | 0.2 |
| | 0.8 |
| | (0.1 | ) | | (40.1 | ) |
| Ending balance | $ | (0.3 | ) | | $ | (47.7 | ) | | $ | (0.2 | ) | | $ | — |
| | $ | — |
| | $ | (48.2 | ) |
|
| | | | | | | | | | | | | | | | | | | | | | | |
Year Ended December 31, 2013 (In millions) | Defined Benefit Pension and Other Postretirement Plans | | Currency Translation Adjustments | | Gain (Loss) from Hedging Activities | | Unrealized Loss on Investment | | Gain (Loss) on Securities Available for Sale | | Total |
| Beginning balance | $ | (0.4 | ) | | $ | 5.3 |
| | $ | (0.2 | ) | | $ | (0.8 | ) | | $ | — |
| | $ | 3.9 |
|
| Other comprehensive income (loss) before reclassifications | — |
| | (11.9 | ) | | 1.6 |
| | — |
| | 0.1 |
| | (10.2 | ) |
| Amounts reclassified from accumulated other comprehensive income | — |
| | — |
| | (1.8 | ) | | — |
| | — |
| | (1.8 | ) |
| Net current-period other comprehensive income (loss) | — |
| | (11.9 | ) | | (0.2 | ) | | — |
| | 0.1 |
| | (12.0 | ) |
| Ending balance | $ | (0.4 | ) | | $ | (6.6 | ) | | $ | (0.4 | ) | | $ | (0.8 | ) | | $ | 0.1 |
| | $ | (8.1 | ) |
|
| | | | | | | | | | | | | | | | | | | |
Year Ended December 31, 2012 (In millions) | Defined Benefit Pension and Other Postretirement Plans | | Currency Translation Adjustments | | Gain (Loss) from Hedging Activities | | Unrealized Loss on Investment | | Total |
| Beginning balance | $ | (0.5 | ) | | $ | 4.6 |
| | $ | — |
| | $ | (0.8 | ) | | $ | 3.3 |
|
| Other comprehensive income (loss) before reclassifications | — |
| | 0.7 |
| | 0.9 |
| | — |
| | 1.6 |
|
| Amounts reclassified from accumulated other comprehensive income | 0.1 |
| | — |
| | (1.1 | ) | | — |
| | (1.0 | ) |
| Net current-period other comprehensive income (loss) | 0.1 |
| | 0.7 |
| | (0.2 | ) | | — |
| | 0.6 |
|
| Ending balance | $ | (0.4 | ) | | $ | 5.3 |
| | $ | (0.2 | ) | | $ | (0.8 | ) | | $ | 3.9 |
|
GCP is a global enterprise operating in over 40 countries with local currency generally deemed to be the functional currency for accounting purposes. The currency translation amount represents the adjustments necessary to translate the balance sheets valued in local currencies to the U.S. dollar as of the end of each period presented, and to translate revenues and expenses at average exchange rates for each period presented.
See Note 7 to the annual Combined Financial Statements for a discussion of pension plans and other postretirement benefit plans.
Notes to Combined Financial Statements (Continued)
12. Related Party Transactions and Parent Company Equity
The Combined Financial Statements have been prepared on a stand-alone basis and are derived from the consolidated financial statements and accounting records of Grace.
Allocation of General Corporate Expenses
The Combined Financial Statements include expense allocations for certain functions provided by Grace as well as other Grace employees not solely dedicated to GCP, including, but not limited to, general corporate expenses related to finance, legal, information technology, human resources, communications, ethics and compliance, shared services, employee benefits and incentives, and stock-based compensation. These expenses have been allocated to GCP on the basis of direct usage when identifiable, with the remainder allocated on the basis of revenue, headcount or other measures. During 2014, 2013 and 2012, GCP was allocated $52.1 million, $48.7 million and $55.8 million, respectively, of general corporate expenses incurred by Grace, which is primarily included within selling, general and administrative expenses in the Combined Statements of Operations.
The expense allocations from Grace discussed above include costs associated with defined benefit pension and other postretirement benefit plans (the “Shared Plans”) sponsored by Grace in which some of GCP's employees participate. GCP accounts for such Shared Plans as multiemployer benefit plans. Accordingly, GCP does not record an asset or liability to recognize the funded status of the Shared Plans. As part of the separation, Grace expects to split certain Shared Plans and transfer the assets and liabilities of such plans related to GCP employees to GCP.
The expense allocations have been determined on a basis that GCP considers to be a reasonable reflection of the utilization of services provided or the benefit received by GCP during the periods presented. The allocations may not, however, reflect the expense GCP would have incurred as an independent company for the periods presented. Actual costs that would have been incurred if GCP had been a stand-alone company would depend on a number of factors, including the chosen organizational structure, whether functions were outsourced or performed by employees and strategic decisions made in areas such as information technology and infrastructure.
Parent Company Equity
Net transfers to parent are included within net parent investment on the Combined Statements of Parent Company Equity. The components of the net transfers to parent as of December 31, 2014, 2013 and 2012 are as follows:
|
| | | | | | | | | | | |
| | Year Ended December 31, |
| (In millions) | 2014 | | 2013 | | 2012 |
| Cash pooling and general financing activities | $ | (260.0 | ) | | $ | (212.8 | ) | | $ | (233.9 | ) |
| GCP expenses funded by parent | 63.4 |
| | 47.2 |
| | 46.3 |
|
| Corporate costs allocations | 52.1 |
| | 48.7 |
| | 55.8 |
|
| Provision for income taxes | 55.6 |
| | 51.6 |
| | 48.1 |
|
| Total net transfers to parent | (88.9 | ) | | (65.3 | ) | | (83.7 | ) |
| Share-based compensation | (4.1 | ) | | (4.9 | ) | | (5.7 | ) |
| Other, net | (7.2 | ) | | (1.2 | ) | | (22.0 | ) |
| Transfers to parent, net per Combined Statements of Cash Flows | $ | (100.2 | ) | | $ | (71.4 | ) | | $ | (111.4 | ) |
13. Stock Incentive Plans
Basis of Presentation Until completion of the separation of GCP from Grace, GCP employees will continue to participate in the Grace share-based compensation plans. The following sections on Grace’s Performance Based Units and Non-Qualified Employee Stock Options disclose the activity of these awards granted to direct employees of GCP. Awards to indirect employees of GCP (e.g., awards to Grace’s corporate staff
Notes to Combined Financial Statements (Continued)
13. Stock Incentive Plans (Continued)
that provide services to GCP) are excluded from the following disclosures; however, the expense for those awards is included in expense allocated to GCP for certain corporate functions historically performed by Grace. See Note 1 to the annual Combined Financial Statements.
Grace granted nonstatutory stock options to certain key employees under its stock incentive plans ("Plans"). The Plans are administered by the Compensation Committee of the Board of Directors. Stock options are generally non-qualified and are at exercise prices not less than 100% of the per share fair market value on the date of grant. Stock-based compensation awards granted under the Plans are generally subject to a vesting period from the date of the grant ranging from 1 - 3 years. Currently outstanding options expire on various dates through November 2019.
The following table sets forth information relating to such options during 2014, 2013, and 2012:
|
| | | | | | | | | | |
| Stock Option Activity | Number Of Shares | | Average Exercise Price | | Weighted- Average Grant Date Fair Value |
| Balance, January 1, 2012 | 886,980 |
| | $ | 25.69 |
| | |
| Options exercised | (332,427 | ) | | 22.51 |
| | |
| Options forfeited | (12,294 | ) | | 29.96 |
| | |
| Options granted | 176,036 |
| | 50.30 |
| | $ | 14.80 |
|
| Balance, December 31, 2012 | 718,295 |
| | 34.35 |
| | |
| Options exercised | (335,549 | ) | | 31.44 |
| | |
| Options forfeited | (49,607 | ) | | 55.79 |
| | |
| Options granted | 68,962 |
| | 77.06 |
| | 18.98 |
|
| Balance, December 31, 2013 | 402,101 |
| | 48.39 |
| | |
| Options exercised | (57,607 | ) | | 41.97 |
| | |
| Options forfeited | (11,417 | ) | | 77.33 |
| | |
| Options granted | 66,923 |
| | 93.84 |
| | 21.08 |
|
| Balance, December 31, 2014 | 400,000 |
| |
|
| |
|
|
The following is a summary of nonvested option activity for the year ended December 31, 2014:
|
| | | | | | |
| Stock Option Activity | Number Of Shares | | Weighted- Average Grant Date Fair Value |
| Nonvested options outstanding at beginning of year | 216,218 |
| | $ | 17.20 |
|
| Granted | 66,923 |
| | 21.08 |
|
| Vested | (125,595 | ) | | 14.59 |
|
| Forfeited | (11,417 | ) | | 20.96 |
|
| Nonvested options outstanding at end of year | 146,129 |
| |
|
|
As of December 31, 2014, the intrinsic value (the difference between the exercise price and the market price) for options outstanding was $16.4 million and for options exercisable was $13.4 million. The total intrinsic value of all options exercised during the years ended December 31, 2014, 2013 and 2012 was $3.1 million, $25.0 million and $15.4 million, respectively. A summary of GCP's stock options outstanding and exercisable at December 31, 2014, follows:
Notes to Combined Financial Statements (Continued)
13. Stock Incentive Plans (Continued)
|
| | | | | | | | | | | |
| Exercise Price Range | Number Outstanding | | Number Exercisable | | Outstanding Weighted- Average Remaining Contractual Life (Years) | | Exercisable Weighted- Average Exercise Price |
| $20 - $30 | 74,315 |
| | 74,315 |
| | 0.33 | | $ | 27.75 |
|
| $40 - $50 | 202,825 |
| | 158,894 |
| | 1.86 | | 44.95 |
|
| $60 - $70 | 1,000 |
| | 500 |
| | 2.97 | | 67.85 |
|
| $70 - $80 | 60,207 |
| | 19,717 |
| | 3.04 | | 76.66 |
|
| $80 - $90 | 1,335 |
| | 445 |
| | 3.49 | | 84.74 |
|
| $90 - $100 | 58,318 |
| | — |
| | 4.35 | | — |
|
| $100 - $110 | 2,000 |
| | — |
| | 4.16 | | — |
|
| | 400,000 |
| | 253,871 |
| | | | |
At December 31, 2014, the weighted-average remaining contractual term of all options outstanding and exercisable was 2.25 years.
Options Granted Grace granted approximately 0.1 million, 0.1 million, and 0.2 million nonstatutory stock options in 2014, 2013, and 2012, respectively, under the Plans.
For the years ended December 31, 2014, 2013 and 2012, GCP recognized non-cash stock-based compensation expense of $4.1 million, $4.9 million and $5.7 million, respectively, which is included in selling, general and administrative expense.
Grace values options using the Black-Scholes option-pricing model, which was developed for use in estimating the fair value of traded options. The risk-free rate is based on the U.S. Treasury yield curve published as of the grant date, with maturities approximating the expected term of the options. The expected term of the options is estimated using the simplified method as allowed by ASC 718-20, whereby the average between the vesting period and contractual term is used. The expected volatility was estimated using both actual stock volatility and the volatility of an industry peer group. Grace believes its actual stock volatility in the last several years may not be representative of expected future volatility because of its previous status in Chapter 11. The following summarizes the assumptions used for estimating the fair value of stock options granted during 2014, 2013 and 2012, respectively.
|
| | | | | |
| | 2014 | | 2013 | | 2012 |
| Expected volatility | 28.2% - 28.7% | | 32.3% - 34.3% | | 35.8% - 46.4% |
| Weighted average expected volatility | 28.6% | | 33.3% | | 40.6% |
| Expected term | 3.00 - 4.00 years | | 3.00 - 4.00 years | | 3.00 - 4.00 years |
| Risk-free rate | 1.25% | | 0.61% | | 0.55% |
| Dividend yield | —% | | —% | | —% |
Total unrecognized stock-based compensation expense at December 31, 2014, was $0.8 million and the weighted-average period over which this expense will be recognized is 0.8 years.
Performance Based Units During 2014 and 2013 Grace granted 15,981 and 18,291 Performance Based Units (PBUs), respectively, under Grace's Long-term Incentive Plan (LTIP) to GCP employees. During 2014 and 2013, 3,032 and 848 PBUs were forfeited, respectively. The awards cliff vest on December 31, 2016 and 2015, and have a weighted average grant date fair value of $92.77 and $76.81, respectively. Grace anticipates that approximately 55% of the PBUs granted in 2014 will be settled in common stock and approximately 45% will be settled in cash, assuming full vesting. Grace anticipates that approximately 53% of the PBUs granted in 2013 will be settled in common stock and approximately 47% will be settled in cash, assuming full vesting. PBUs are recorded at fair value at the date of grant. The estimated grant date fair value is based on the expected payout of
Notes to Combined Financial Statements (Continued)
13. Stock Incentive Plans (Continued)
the award, which may range from 0% to 200% of the payout target. The common stock settled portion is considered an equity award with the payout being valued based on Grace’s stock price on the grant date. The cash settled portion of the award is considered a liability award with payout being remeasured each reporting period based on Grace’s current stock price. Both equity and cash awards are remeasured each reporting period based on the expected payout of the award; therefore these portions of the awards are subject to volatility until the payout is finally determined at the end of the performance period. During 2014 and 2013 GCP recognized $0.7 million and $0.3 million in compensation expense for these awards. As of December 31, 2014, $1.5 million of total unrecognized compensation expense related to the PBUs is expected to be recognized over the remaining weighted-average service period of 1.5 years.
14. Operating Segment Information
GCP is engaged in the production and sale of specialty construction chemicals, specialty building materials and packaging products through three operating segments. Specialty Construction Chemicals manufactures and markets concrete admixtures and cement additives. Specialty Building Materials manufactures and markets sheet and liquid membrane systems that protect structures from water, air and vapor penetration, fireproofing, and other products designed to protect the building envelope. Darex Packaging Technologies manufactures and markets packaging materials for use in beverage and food containers, industrial containers and other consumer and industrial applications. The table below presents information related to GCP's operating segments. Only those corporate expenses directly related to the operating segments are allocated for reporting purposes. All remaining corporate items are reported separately and labeled as such.
GCP excludes defined benefit pension expense from the calculation of segment operating income. GCP believes that the exclusion of defined benefit pension expense provides a better indicator of its operating segment performance as defined benefit pension expense is not managed at an operating segment level.
GCP defines Adjusted EBIT (a non-GAAP financial measure) to be net income adjusted for interest income and expense; income taxes; restructuring expenses and asset impairments; repositioning expenses; pension costs other than service and interest costs, expected returns on plan assets, and amortization of prior service costs/credits; income and expense items related to certain product lines and other investments; gains and losses on sales of businesses, product lines, and certain other investments; and certain other unusual or infrequent items that are not representative of underlying trends.
Notes to Combined Financial Statements (Continued)
14. Operating Segment Information (Continued)
Operating Segment Data
|
| | | | | | | | | | | |
| (In millions) | 2014 | | 2013 | | 2012 |
| Net Sales | | | | | |
| Specialty Construction Chemicals | $ | 726.3 |
| | $ | 688.1 |
| | $ | 680.9 |
|
| Specialty Building Materials | 379.3 |
| | 370.1 |
| | 344.0 |
|
| Darex Packaging Technologies | 374.8 |
| | 384.1 |
| | 384.3 |
|
| Total | $ | 1,480.4 |
| | $ | 1,442.3 |
| | $ | 1,409.2 |
|
| Adjusted EBIT | | | | | |
| Specialty Construction Chemicals segment operating income | $ | 72.4 |
| | $ | 62.8 |
| | $ | 57.1 |
|
| Specialty Building Materials segment operating income | 75.7 |
| | 76.9 |
| | 59.0 |
|
| Darex Packaging Technologies segment operating income | 74.1 |
| | 79.6 |
| | 72.5 |
|
| Corporate costs | (19.3 | ) | | (19.1 | ) | | (24.1 | ) |
| Certain pension costs | (7.5 | ) | | (5.3 | ) | | (6.6 | ) |
| Total | $ | 195.4 |
| | $ | 194.9 |
| | $ | 157.9 |
|
| Depreciation and Amortization | | | | | |
| Specialty Construction Chemicals | $ | 18.5 |
| | $ | 19.9 |
| | $ | 20.4 |
|
| Specialty Building Materials | 8.6 |
| | 8.1 |
| | 7.8 |
|
| Darex Packaging Technologies | 5.5 |
| | 5.1 |
| | 5.0 |
|
| Corporate | 1.4 |
| | 1.6 |
| | 1.6 |
|
| Total | $ | 34.0 |
| | $ | 34.7 |
| | $ | 34.8 |
|
| Capital Expenditures | | | | | |
| Specialty Construction Chemicals | $ | 24.3 |
| | $ | 23.4 |
| | $ | 17.4 |
|
| Specialty Building Materials | 6.3 |
| | 9.9 |
| | 8.0 |
|
| Darex Packaging Technologies | 6.7 |
| | 7.3 |
| | 5.4 |
|
| Corporate | 0.2 |
| | 0.9 |
| | 1.2 |
|
| Total | $ | 37.5 |
| | $ | 41.5 |
| | $ | 32.0 |
|
| Total Assets | | | | | |
| Specialty Construction Chemicals | $ | 329.0 |
| | $ | 358.6 |
| | $ | 366.1 |
|
| Specialty Building Materials | 247.3 |
| | 247.6 |
| | 237.1 |
|
| Darex Packaging Technologies | 157.4 |
| | 168.3 |
| | 168.4 |
|
| Corporate | 253.4 |
| | 217.4 |
| | 199.6 |
|
| Total | $ | 987.1 |
| | $ | 991.9 |
| | $ | 971.2 |
|
Corporate costs include certain functional costs and other corporate costs such as certain performance-based compensation and public company costs.
Notes to Combined Financial Statements (Continued)
14. Operating Segment Information (Continued)
GCP Adjusted EBIT for the years ended December 31, 2014, 2013 and 2012 is reconciled below to income before income taxes presented in the accompanying Combined Statements of Operations.
Reconciliation of Operating Segment Data to Financial Statements
|
| | | | | | | | | | | |
| | Year Ended December 31, |
| (In millions) | 2014 | | 2013 | | 2012 |
| GCP Adjusted EBIT | $ | 195.4 |
| | $ | 194.9 |
| | $ | 157.9 |
|
| Pension MTM adjustment and other related costs, net | 18.6 |
| | (14.4 | ) | | (17.7 | ) |
| Restructuring expenses and asset impairments | (18.3 | ) | | (7.4 | ) | | (4.3 | ) |
| Interest expense, net | (4.8 | ) | | (4.9 | ) | | (2.6 | ) |
| Currency and other financial losses in Venezuela | (1.0 | ) | | (6.9 | ) | | — |
|
| Net income attributable to noncontrolling interests | 1.2 |
| | 1.6 |
| | 1.1 |
|
| Income before income taxes | $ | 191.1 |
| | $ | 162.9 |
| | $ | 134.4 |
|
Sales by Product Group
|
| | | | | | | | | | | |
| | Year Ended December 31, |
| (In millions) | 2014 | | 2013 | | 2012 |
| Specialty Construction Chemicals: | | | | | |
| Concrete Admixtures | $ | 541.9 |
| | $ | 513.5 |
| | $ | 505.0 |
|
| Cement Additives | 184.4 |
| | 174.6 |
| | 175.9 |
|
| Total Sales | $ | 726.3 |
| | $ | 688.1 |
| | $ | 680.9 |
|
| Specialty Building Materials: | | | | | |
| Building Envelope | $ | 236.3 |
| | $ | 219.1 |
| | $ | 185.3 |
|
| Residential Products | 59.2 |
| | 69.3 |
| | 75.4 |
|
| Specialty Construction Products | 83.8 |
| | 81.7 |
| | 83.3 |
|
| Total Sales | $ | 379.3 |
| | $ | 370.1 |
| | $ | 344.0 |
|
| Darex Packaging Technologies: | | | | | |
| Sealants and Closures | $ | 254.8 |
| | $ | 262.2 |
| | $ | 263.5 |
|
| Coatings | 120.0 |
| | 121.9 |
| | 120.8 |
|
| Total Sales | $ | 374.8 |
| | $ | 384.1 |
| | $ | 384.3 |
|
Notes to Combined Financial Statements (Continued)
14. Operating Segment Information (Continued)
The table below presents information related to the geographic areas in which GCP operates. Sales are attributed to geographic areas based on customer location. With the exception of the United States as presented below, there are no individually significant countries with sales exceeding 10% of total sales. Brazil and France each have long-lived assets of approximately 10%-12% of total long-lived assets. There are no other individually significant countries with long-lived assets exceeding 10% of total long-lived assets.
Geographic Area Data
|
| | | | | | | | | | | |
| | Year Ended December 31, |
| (In millions) | 2014 | | 2013 | | 2012 |
| Net Sales | | | | | |
| United States | $ | 468.4 |
| | $ | 451.1 |
| | $ | 436.4 |
|
| Canada and Puerto Rico | 35.5 |
| | 37.1 |
| | 41.9 |
|
| Total North America | 503.9 |
| | 488.2 |
| | 478.3 |
|
| Europe Middle East Africa (EMEA) | 396.0 |
| | 385.2 |
| | 392.7 |
|
| Asia Pacific | 349.7 |
| | 335.6 |
| | 318.6 |
|
| Latin America | 230.8 |
| | 233.3 |
| | 219.6 |
|
| Total | $ | 1,480.4 |
| | $ | 1,442.3 |
| | $ | 1,409.2 |
|
| Properties and Equipment, net | | | | | |
| United States | $ | 87.8 |
| | $ | 97.4 |
| | $ | 94.3 |
|
| Canada and Puerto Rico | 2.7 |
| | 3.1 |
| | 3.5 |
|
| Total North America | 90.5 |
| | 100.5 |
| | 97.8 |
|
| Europe Middle East Africa (EMEA) | 47.0 |
| | 50.9 |
| | 52.9 |
|
| Asia Pacific | 40.9 |
| | 41.3 |
| | 40.5 |
|
| Latin America | 19.1 |
| | 18.8 |
| | 15.5 |
|
| Total | $ | 197.5 |
| | $ | 211.5 |
| | $ | 206.7 |
|
| Goodwill, Intangibles and Other Assets | | | | | |
| United States | $ | 34.8 |
| | $ | 39.1 |
| | $ | 38.2 |
|
| Canada and Puerto Rico | 2.9 |
| | 4.6 |
| | 4.9 |
|
| Total North America | 37.7 |
| | 43.7 |
| | 43.1 |
|
| Europe Middle East Africa (EMEA) | 69.7 |
| | 81.2 |
| | 80.7 |
|
| Asia Pacific | 23.4 |
| | 25.3 |
| | 13.8 |
|
| Latin America | 35.7 |
| | 52.3 |
| | 53.9 |
|
| Total | $ | 166.5 |
| | $ | 202.5 |
| | $ | 191.5 |
|
GCP
FINANCIAL STATEMENT SCHEDULE II—VALUATION AND QUALIFYING ACCOUNTS AND RESERVES
(In millions)
For the Year Ended December 31, 2014 |
| | | | | | | | | | | | | | | | | | | |
| Description | Balance at beginning of period | | Additions charged to costs and expenses | | Deductions | | Other, net(1) | | Balance at end of period |
| Valuation and qualifying accounts deducted from assets: | | | | | | | | | |
| Allowances for notes and accounts receivable | $ | 4.9 |
| | $ | 2.1 |
| | $ | (2.6 | ) | | $ | 0.4 |
| | $ | 4.8 |
|
| Valuation allowance for deferred tax assets | 1.6 |
| | 0.2 |
| | — |
| | — |
| | 1.8 |
|
___________________________________________________________________________________________________________________
| |
| (1) | Various miscellaneous adjustments against reserves and effects of currency translation. |
For the Year Ended December 31, 2013 |
| | | | | | | | | | | | | | | | | | | |
| Description | Balance at beginning of period | | Additions charged to costs and expenses | | Deductions | | Other, net | | Balance at end of period |
| Valuation and qualifying accounts deducted from assets: | | | | | | | | | |
| Allowances for notes and accounts receivable | $ | 4.5 |
| | $ | 1.5 |
| | $ | (1.1 | ) | | $ | — |
| | $ | 4.9 |
|
| Valuation allowance for deferred tax assets | 1.7 |
| | — |
| | (0.1 | ) | | — |
| | 1.6 |
|
For the Year Ended December 31, 2012 |
| | | | | | | | | | | | | | | | | | | |
| Description | Balance at beginning of period | | Additions charged to costs and expenses | | Deductions | | Other, net | | Balance at end of period |
| Valuation and qualifying accounts deducted from assets: | | | | | | | | | |
| Allowances for notes and accounts receivable | $ | 7.2 |
| | $ | 1.5 |
| | $ | (4.2 | ) | | $ | — |
| | $ | 4.5 |
|
| Valuation allowance for deferred tax assets | 1.5 |
| | 0.2 |
| | — |
| | — |
| | 1.7 |
|
Report of Independent Registered Public Accounting Firm
To the Shareholders and Board of Directors of W. R. Grace & Co.:
We have reviewed the accompanying combined financial statements listed in the accompanying index of the combination of W.R. Grace & Co.’s (“Grace”) Construction Products operating segment and Darex Packaging Technologies business (“GCP”) as of September 30, 2015, and for the nine-month periods ended September 30, 2015 and 2014. These interim financial statements are the responsibility of Grace’s management.
We conducted our review in accordance with the standards of the Public Company Accounting Oversight Board (United States). A review of interim financial information consists principally of applying analytical procedures and making inquiries of persons responsible for financial and accounting matters. It is substantially less in scope than an audit conducted in accordance with the standards of the Public Company Accounting Oversight Board (United States), the objective of which is the expression of an opinion regarding the financial statements taken as a whole. Accordingly, we do not express such an opinion.
Based on our review, we are not aware of any material modifications that should be made to the accompanying combined interim financial statements for them to be in conformity with accounting principles generally accepted in the United States of America.
We have previously audited, in accordance with the standards of the Public Company Accounting Oversight Board (United States), the combined balance sheet as of December 31, 2014 and the related combined statements of operations, comprehensive income, parent company equity, and of cash flows for the year ended December 31, 2014 (not presented herein), and in our report dated August 5, 2015, we expressed an unqualified opinion on those combined financial statements. In our opinion, the information set forth in the accompanying combined balance sheet as of December 31, 2014, is fairly stated in all material respects in relation to the combined balance sheet from which it has been derived.
As described in Note 1, the combined interim financial statements have been derived from the accounting records of Grace. The combined interim financial statements include expense allocations for the functions provided by Grace. These allocations may not be indicative of the actual expense that would have been incurred had GCP operated as a separate entity apart from Grace. See Note 10 to the combined interim financial statements for a summary of transactions with Grace.
/s/ PricewaterhouseCoopers LLP
Baltimore, Maryland
November 30, 2015
GCP
Combined Statements of Operations (unaudited)
|
| | | | | | | |
| | Nine Months Ended
September 30, |
| (In millions) | 2015 | | 2014 |
| Net sales | $ | 1,086.1 |
| | $ | 1,115.4 |
|
| Cost of goods sold | 688.0 |
| | 724.3 |
|
| Gross profit | 398.1 |
| | 391.1 |
|
| Selling, general and administrative expenses | 217.5 |
| | 223.2 |
|
| Research and development expenses | 16.8 |
| | 21.8 |
|
| Interest expense and related financing costs | 1.1 |
| | 3.0 |
|
| Interest expense, net—related party | 0.7 |
| | 0.8 |
|
| Loss in Venezuela | 59.6 |
| | 1.0 |
|
| Restructuring expenses and asset impairments | 9.9 |
| | 16.1 |
|
| Other expense (income), net | 1.3 |
| | (0.8 | ) |
| Total costs and expenses | 306.9 |
| | 265.1 |
|
| Income before income taxes | 91.2 |
| | 126.0 |
|
| Provision for income taxes | (58.2 | ) | | (36.4 | ) |
| Net income | 33.0 |
| | 89.6 |
|
| Less: Net income attributable to noncontrolling interests | (0.6 | ) | | (1.3 | ) |
| Net income attributable to GCP | $ | 32.4 |
| | $ | 88.3 |
|
The Notes to Combined Financial Statements are an integral part of these statements.
F-40
GCP
Combined Statements of Comprehensive (Loss) Income (unaudited)
|
| | | | | | | |
| | Nine Months Ended
September 30, |
| (In millions) | 2015 | | 2014 |
| Net income | $ | 33.0 |
| | $ | 89.6 |
|
| Other comprehensive (loss) income: | | | |
| Currency translation adjustments | (39.1 | ) | | (14.5 | ) |
| Gain from hedging activities, net of income taxes | 0.2 |
| | — |
|
| Other than temporary impairment of investment | — |
| | 0.8 |
|
| Loss on securities available for sale, net of income taxes | — |
| | (0.1 | ) |
| Total other comprehensive (loss) income attributable to noncontrolling interests | (0.3 | ) | | 0.7 |
|
| Total other comprehensive loss | (39.2 | ) | | (13.1 | ) |
| Comprehensive (loss) income | (6.2 | ) | | 76.5 |
|
| Less: comprehensive income attributable to noncontrolling interests | (0.3 | ) | | (2.0 | ) |
| Comprehensive (loss) income attributable to GCP | $ | (6.5 | ) | | $ | 74.5 |
|
The Notes to Combined Financial Statements are an integral part of these statements.
F-41
GCP
Combined Statements of Cash Flows (unaudited)
|
| | | | | | | |
| | Nine Months Ended
September 30, |
| (In millions) | 2015 | | 2014 |
| OPERATING ACTIVITIES | | | |
| Net income | $ | 33.0 |
| | $ | 89.6 |
|
| Reconciliation to net cash provided by operating activities: | | | |
| Depreciation and amortization | 24.4 |
| | 25.0 |
|
| Impairments of certain assets | — |
| | 13.4 |
|
| Provision for income taxes | 58.2 |
| | 36.4 |
|
| Cash paid for income taxes, net of refunds | (15.8 | ) | | (16.7 | ) |
| Cash paid for income taxes, net of refunds—related party | (49.7 | ) | | (16.6 | ) |
| Excess tax benefits from stock-based compensation | (2.8 | ) | | (5.3 | ) |
| Cash paid for interest on credit arrangements | (1.7 | ) | | (3.4 | ) |
| Defined benefit pension expense | 1.1 |
| | 1.9 |
|
| Cash paid under defined benefit pension arrangements | (1.7 | ) | | (3.1 | ) |
| Currency and other losses in Venezuela | 73.2 |
| | 1.0 |
|
| Changes in assets and liabilities, excluding effect of currency translation and businesses acquired: | | | |
| Trade accounts receivable | (51.7 | ) | | (27.1 | ) |
| Inventories | (13.2 | ) | | (29.5 | ) |
| Accounts payable | 17.1 |
| | 11.0 |
|
| All other items, net | 31.5 |
| | 12.7 |
|
| Net cash provided by operating activities | 101.9 |
| | 89.3 |
|
| INVESTING ACTIVITIES | | | |
| Capital expenditures | (26.2 | ) | | (27.4 | ) |
| Transfer from restricted cash and cash equivalents | — |
| | 5.3 |
|
| Purchase of bonds | — |
| | (2.8 | ) |
| Proceeds from sale of bonds | — |
| | 8.0 |
|
| Increase in lending to related party | — |
| | (51.7 | ) |
| Receipt of payment from related party | 40.0 |
| | — |
|
| Other investing activities | 0.4 |
| | 0.6 |
|
| Net cash provided by (used for) investing activities | 14.2 |
| | (68.0 | ) |
| FINANCING ACTIVITIES | | | |
| Borrowings under credit arrangements | 27.6 |
| | 16.9 |
|
| Repayments under credit arrangements | (41.0 | ) | | (23.3 | ) |
| Borrowings under related party loans | 2.1 |
| | 9.0 |
|
| Repayments under related party loans | (5.9 | ) | | (1.8 | ) |
| Purchase of interest in consolidated joint ventures | — |
| | (0.7 | ) |
| Excess tax benefits from stock-based compensation | 2.8 |
| | 5.3 |
|
| Transfers to parent, net | (69.6 | ) | | (66.3 | ) |
| Net cash used for financing activities | (84.0 | ) | | (60.9 | ) |
| Effect of currency exchange rate changes on cash and cash equivalents | (53.1 | ) | | (8.5 | ) |
| Decrease in cash and cash equivalents | (21.0 | ) | | (48.1 | ) |
| Cash and cash equivalents, beginning of period | 120.9 |
| | 157.8 |
|
| Cash and cash equivalents, end of period | $ | 99.9 |
| | $ | 109.7 |
|
The Notes to Combined Financial Statements are an integral part of these statements.
F-42
GCP
Combined Balance Sheets (unaudited)
|
| | | | | | | | | | | |
| (In millions, except par value and shares) | Grace Dividend Pro Forma September 30, 2015 (Note 1) | | September 30,
2015 | | December 31,
2014 |
| ASSETS | | | | | |
| Current Assets | | | | | |
| Cash and cash equivalents | $ | 99.9 |
| | $ | 99.9 |
| | $ | 120.9 |
|
| Trade accounts receivable, less allowance of $5.7 (2014—$4.8) | 234.4 |
| | 234.4 |
| | 225.8 |
|
| Inventories | 114.2 |
| | 114.2 |
| | 122.9 |
|
| Loans receivable—related party | 3.0 |
| | 3.0 |
| | 47.0 |
|
| Deferred income taxes | 7.4 |
| | 7.4 |
| | 8.8 |
|
| Other current assets | 32.8 |
| | 32.8 |
| | 41.3 |
|
| Total Current Assets | 491.7 |
| | 491.7 |
| | 566.7 |
|
| Properties and equipment, net of accumulated depreciation and amortization of $433.4 (2014—$474.0) | 187.1 |
| | 187.1 |
| | 197.5 |
|
| Goodwill | 102.8 |
| | 102.8 |
| | 114.0 |
|
| Technology and other intangible assets, net | 34.2 |
| | 34.2 |
| | 44.0 |
|
| Deferred income taxes | 12.5 |
| | 12.5 |
| | 12.3 |
|
| Overfunded defined benefit pension plans | 44.7 |
| | 44.7 |
| | 44.1 |
|
| Other assets | 8.8 |
| | 8.8 |
| | 8.5 |
|
| Total Assets | $ | 881.8 |
| | $ | 881.8 |
| | $ | 987.1 |
|
| LIABILITIES AND EQUITY | | | | | |
| Current Liabilities | | | | | |
| Debt payable within one year | $ | 10.2 |
| | $ | 10.2 |
| | $ | 25.2 |
|
| Accounts payable | 117.5 |
| | 117.5 |
| | 112.3 |
|
| Loans payable—related party | 48.8 |
| | 48.8 |
| | 53.8 |
|
| Other current liabilities | 129.8 |
| | 129.8 |
| | 119.0 |
|
| Total Current Liabilities | 306.3 |
| | 306.3 |
| | 310.3 |
|
| Deferred income taxes | 21.5 |
| | 21.5 |
| | 18.9 |
|
| Income tax contingencies | 7.5 |
| | 7.5 |
| | 6.7 |
|
| Underfunded and unfunded defined benefit pension plans | 33.2 |
| | 33.2 |
| | 34.7 |
|
| Dividend payable to W. R. Grace & Co. | 750.0 |
| | — |
| | — |
|
| Other liabilities | 8.2 |
| | 8.2 |
| | 9.1 |
|
| Total Liabilities | 1,126.7 |
| | 376.7 |
| | 379.7 |
|
| Commitments and Contingencies—Note 7 | | | | | |
| Parent Company (Accumulated Deficit) Equity | | |
|
| |
|
|
| Net parent investment | (160.9 | ) | | 589.1 |
| | 652.8 |
|
| Accumulated other comprehensive loss | (87.1 | ) | | (87.1 | ) | | (48.2 | ) |
| Total GCP (Accumulated Deficit) Equity | (248.0 | ) | | 502.0 |
| | 604.6 |
|
| Noncontrolling interests | 3.1 |
| | 3.1 |
| | 2.8 |
|
| Total (Accumulated Deficit) Equity | (244.9 | ) | | 505.1 |
| | 607.4 |
|
| Total Liabilities and Equity | $ | 881.8 |
| | $ | 881.8 |
| | $ | 987.1 |
|
The Notes to Combined Financial Statements are an integral part of these statements.
F-43
GCP
Combined Statements of Parent Company Equity (unaudited)
|
| | | | | | | | | | | | | | | |
| (In millions) | Net Parent Investment | | Accumulated Other Comprehensive Loss | | Noncontrolling Interests | | Total Parent Company Equity |
| Parent company equity at December 31, 2013 | $ | 607.4 |
| | $ | (8.1 | ) | | $ | 10.4 |
| | $ | 609.7 |
|
| Net income | 88.3 |
| | — |
| | 1.3 |
| | 89.6 |
|
| Other comprehensive loss | — |
| | (13.8 | ) | | 0.7 |
| | (13.1 | ) |
| Purchase of noncontrolling investment | — |
| | — |
| | (0.7 | ) | | (0.7 | ) |
| Net transfer to parent | (71.3 | ) | | — |
| | — |
| | (71.3 | ) |
| Parent company equity at September 30, 2014 | $ | 624.4 |
| | $ | (21.9 | ) | | $ | 11.7 |
| | $ | 614.2 |
|
| Parent company equity at December 31, 2014 | $ | 652.8 |
| | $ | (48.2 | ) | | $ | 2.8 |
| | $ | 607.4 |
|
| Net income | 32.4 |
| | — |
| | 0.6 |
| | 33.0 |
|
| Other comprehensive loss | — |
| | (38.9 | ) | | (0.3 | ) | | (39.2 | ) |
| Net transfer to parent | (96.1 | ) | | — |
| | — |
| | (96.1 | ) |
| Parent company equity at September 30, 2015 | $ | 589.1 |
| | $ | (87.1 | ) | | $ | 3.1 |
| | $ | 505.1 |
|
The Notes to Combined Financial Statements are an integral part of these statements.
F-44
Notes to Combined Financial Statements
1. Basis of Presentation and Summary of Significant Accounting and Financial Reporting Policies
On February 5, 2015, W. R. Grace & Co. announced its intent to separate the business, assets and liabilities associated with the Grace Construction Products operating segment and the Darex Packaging Technologies business (collectively, "GCP") into an independent publicly-traded company. Subject to satisfaction of specified conditions, the separation will be accomplished by way of the distribution to holders of shares of W. R. Grace & Co. common stock of all of the shares of common stock of GCP Applied Technologies Inc., a Delaware corporation (the "Company"). The Company is a wholly-owned subsidiary of W. R. Grace & Co., that at the time of the distribution will hold GCP. Immediately following the distribution, holders of W. R. Grace & Co. common stock as of the record date will own 100 percent of the outstanding shares of common stock of the Company. As used in these notes, the term "Grace" refers to W. R. Grace & Co. and/or one or more of its subsidiaries and, in certain cases, their respective predecessors.
GCP is engaged in the production and sale of specialty construction chemicals, specialty building materials, and packaging products through three operating segments. Specialty Construction Chemicals manufactures and markets concrete admixtures and cement additives. Specialty Building Materials manufactures and markets sheet and liquid membrane systems that protect structures from water, air and vapor penetration, fireproofing, and other products designed to protect the building envelope. Darex Packaging Technologies manufactures and markets packaging materials for use in beverage and food containers, industrial containers and other consumer and industrial applications.
Principles of Combination and Basis of Presentation
The Combined Financial Statements have been prepared on a stand-alone basis and are derived from the consolidated and combined financial statements and accounting records of Grace. The Combined Financial Statements reflect the financial position, results of operations and cash flows as GCP was historically managed, in conformity with accounting principles generally accepted in the United States of America (GAAP).
The interim Combined Financial Statements presented herein are unaudited and should be read in conjunction with the 2014 Combined Financial Statements presented in this information statement. Such interim Combined Financial Statements reflect all adjustments that, in the opinion of management, are necessary for a fair statement of the results of the interim periods presented; all such adjustments are of a normal recurring nature except for the impacts of adopting new accounting standards as discussed below. The results of operations for the nine-month interim period ended September 30, 2015, are not necessarily indicative of the results of operations for the year ending December 31, 2015.
All intracompany transactions between GCP's businesses have been eliminated. All intercompany transactions between GCP and Grace have been included in these Combined Financial Statements and are considered to be effectively settled for cash, other than intercompany loan transactions, in the Combined Financial Statements at the time the transaction is recorded. The intercompany loans payable to Grace, and related interest thereon, as discussed in Note 3 to the interim Combined Financial Statements, are reflected in the Combined Balance Sheets and Combined Statements of Operations and the related cash flows are reflected in the Combined Statements of Cash Flows as "Borrowings under related party loans" and "Repayments of related party loans." The intercompany loans from Grace, and related interest thereon, are reflected on the Combined Balance Sheets as "Loans receivable—related party" and in the Combined Statements of Operations as "Interest expense (income), net—related party."
The Combined Financial Statements include expenses of Grace allocated to GCP for certain functions provided by Grace, including, but not limited to, general corporate expenses related to finance, legal, information technology, human resources, communications, ethics and compliance, environment health and safety, supply chain,shared services, employee benefits and incentives, insurance and stock-based compensation. These expenses have been allocated to GCP on the basis of direct usage when identifiable, with the remainder allocated on the basis of revenue, headcount or other measures. These cost allocations are included in selling, general and administrative expenses in the Statement of Operations. Most of these costs are included in segment operating income with only a portion included in corporate costs. Both GCP and Grace consider the basis on which the expenses have been allocated to be a reasonable reflection of the utilization of services provided to, or the benefit received by, GCP during the periods presented.
Notes to Combined Financial Statements (Continued)
1. Basis of Presentation and Summary of Significant Accounting and Financial Reporting Policies (Continued)
Management believes such allocations are reasonable. The allocations may not, however, reflect the expense GCP would have incurred as an independent, publicly-traded company for the periods presented. Actual costs that may have been incurred if GCP had been a stand-alone company would depend on a number of factors, including the chosen organizational structure, what functions were outsourced or performed by employees and strategic decisions made in areas such as information technology and infrastructure. Following its separation from Grace, GCP will perform these functions using its own resources or purchased services. For an interim period, however, some of these functions will continue to be provided by Grace Conn under a Transition Services Agreement, which will generally have a term of 18 months or less. In addition to the Transition Services Agreement, GCP will enter into arrangements with Grace in connection with the separation, several of which are expected to have terms longer than one year. See Note 10 to the interim Combined Financial Statements for further description of the transactions between GCP and Grace.
Grace uses a centralized approach to cash management and financing of its operations and Grace funds GCP's operating and investing activities as needed. Cash transfers to and from the cash management accounts of Grace are reflected in the Combined Statements of Cash Flows as “Transfers to parent, net.”
The Combined Financial Statements also include the push down of certain assets and liabilities that have historically been held at the Grace corporate level but are specifically identifiable or otherwise pushed down to GCP. The cash and cash equivalents held by Grace at the corporate level are not specifically identifiable to GCP and therefore were not allocated to GCP for any of the periods presented. Cash and cash equivalents in the Combined Balance Sheets represent primarily cash held locally by entities included in the Combined Financial Statements. Third-party debt and the related interest expense of Grace were not allocated to GCP for any of the periods presented as GCP is not the legal obligor of the debt and the Grace borrowings were not directly attributable to GCP's business.
The Combined Financial Statements exclude all assets, liabilities, income, gains, costs and expenses reported by Grace related to asbestos and bankruptcy matters. These matters were not allocated to GCP for any period presented as Grace will continue as the legal obligor for those liabilities, Grace is expected to pay all future liabilities and costs, and such matters were not historically managed by GCP. Additionally, the components of liabilities subject to compromise, other than the asbestos related liabilities, previously reported by Grace have been presented within separate line items in the Combined Balance Sheets based on their nature.
Unaudited Pro Forma Balance Sheet for Grace Transfer In connection with the separation from Grace, GCP expects to incur approximately $810 million of indebtedness. Proceeds of $750 million received in connection with these borrowings are expected to be transferred to Grace. The accompanying unaudited pro forma balance sheet as of September 30, 2015, gives effect to the $750 million transfer expected to be paid to Grace.
Use of Estimates The preparation of financial statements in conformity with U.S. generally accepted accounting principles requires management to make estimates and assumptions that affect the reported amount of assets and liabilities and disclosure of contingent assets and liabilities at the date of the Combined Financial Statements, and the reported amounts of revenues and expenses for the periods presented. Actual amounts could differ from those estimates, and the differences could be material. Changes in estimates are recorded in the period identified. GCP's accounting measurements that are most affected by management's estimates of future events are:
| |
| • | Contingent liabilities, which depend on an assessment of the probability of loss and an estimate of ultimate resolution cost, such as material commitments (see Note 7 to the interim Combined Financial Statements) and income taxes (see Note 4 to the interim Combined Financial Statements); |
| |
| • | Pension and postretirement liabilities that depend on assumptions regarding participant life spans, future inflation, discount rates and total returns on invested funds (see Note 5 to the interim Combined Financial Statements); and |
Notes to Combined Financial Statements (Continued)
1. Basis of Presentation and Summary of Significant Accounting and Financial Reporting Policies (Continued)
| |
| • | Realization values of net deferred tax assets, which depend on projections of future taxable income (see Note 4 to the interim Combined Financial Statements). |
Revisions Certain prior period amounts related to borrowings and repayments under credit arrangements reported as financing activities on the Combined Statements of Cash Flows have been revised. For the three months ended March 31, 2015 and the six months ended June 30, 2015, borrowings and repayments under certain credit facilities of $3.3 million and $8.2 million, respectively, were netted within cash flows from financing activities. GCP will revise the affected periods when they are presented on a comparable basis in future filings. The revision will result in borrowings and repayments under credit arrangements of $7.1 million and $18.1 million, respectively, for the three months ended March 31, 2015, and $18.8 million and $31.1 million, respectively, for the six months ended June 30, 2015. GCP concluded that these revisions were not material to the previously issued Combined Financial Statements.
Subsequent Events GCP has evaluated transactions and events for potential recognition and disclosure from the balance sheet date through November 30, 2015, the date the financial statements were issued. With the exception of the cash repatriation discussed in Note 4, there were no other subsequent events identified that require recognition of, or disclosure in, these financial statements.
Venezuela Until September 30, 2015, GCP accounted for its results in Venezuela at the official exchange rate of 6.3 bolivars to U.S. dollar. Based on developments in the 2015 third quarter, including changed expectations about GCP's ability to import raw materials at the official exchange rate in the future and the increase in inflation, GCP determined that it is no longer appropriate to do so. Effective September 30, 2015, GCP is accounting for its results in Venezuela at the SIMADI rate. At September 30, 2015, this rate was 199 bolivars to U.S. dollar. GCP recorded a pre-tax charge of $73.2 million in the 2015 third quarter to reflect the devaluation of monetary assets and the impairment of non-monetary assets, including $40.2 million for cash, $28.9 million for working capital and $4.1 million for properties and equipment. Of this amount, $13.7 million related to inventory was recorded in cost of goods sold, and $59.5 million related to other assets and liabilities was recorded as a separate line in the Combined Statement of Operations. GCP will continue to operate in Venezuela; however, the remaining assets and liabilities, as well as future sales, earnings and cash flows of GCP's Venezuelan subsidiary will be immaterial after September 30, 2015. See "Management's Discussion and Analysis—Venezuela" above for further discussion.
Effect of New Accounting Standards In April 2014, the FASB issued ASU 2014-08 "Reporting Discontinued Operations and Disclosures of Disposals of Components of an Entity." This update is intended to change the requirements for reporting discontinued operations and enhance convergence of the FASB’s and the International Accounting Standard Board’s (IASB) reporting requirements for discontinued operations. The new requirements are effective for fiscal years beginning on or after December 15, 2014, and for interim periods within fiscal years beginning on or after December 15, 2015, with early adoption permitted. GCP is currently evaluating its effect on the Combined Financial Statements and will adopt this standard when it becomes applicable.
In May 2014, the FASB issued ASU 2014-09 "Revenue from Contracts with Customers." This update is intended to remove inconsistencies and weaknesses in revenue requirements; provide a more robust framework for addressing revenue issues; improve comparability of revenue recognition practices across entities, industries, jurisdictions and capital markets; provide more useful information to users of financial statements through improved disclosure requirements; and simplify the preparation of financial statements by reducing the number of requirements to which an entity must refer. The new requirements were to be effective for fiscal years beginning after December 15, 2016, and for interim periods within those fiscal years, with early adoption not permitted. On July 9, 2015, the FASB voted to defer the effective date by one year but will permit adoption as of the original effective date. The revised standard allows for two methods of adoption: (a) full retrospective adoption, meaning the standard is applied to all periods presented, or (b) modified retrospective adoption, meaning the cumulative effect of applying the new standard is recognized as an adjustment to the opening retained earnings balance. GCP does not intend to adopt the standard early and is in the process of determining the adoption method as well as the effects the adoption will have on the Combined Financial Statements.
Notes to Combined Financial Statements (Continued)
1. Basis of Presentation and Summary of Significant Accounting and Financial Reporting Policies (Continued)
In April 2015, the FASB issued ASU 2015-03 "Simplifying the Presentation of Debt Issuance Costs." This update is part of the FASB's Simplification Initiative and is also intended to enhance convergence with the IASB's treatment of debt issuance costs. The update requires that debt issuance costs related to a recognized debt liability be presented in the balance sheet as a direct deduction from the carrying amount of that debt liability, consistent with debt discounts. In August 2015, the FASB issued ASU 2015-15 "Presentation and Subsequent Measurement of Debt Issuance Costs Associated with Line-of-Credit Arrangements." The update clarifies ASU 2015-03, allowing debt issuance costs related to line of credit arrangements to be deferred and presented as an asset and subsequently amortized ratably over the term of the line-of-credit arrangement, regardless of whether there are any outstanding borrowings on the line-of-credit arrangement. The new requirements are effective for fiscal years beginning after December 15, 2015, and for interim periods within those fiscal years, with early adoption permitted. GCP is currently evaluating its effect on the Combined Financial Statements and the timing of adoption.
In July 2015, the FASB issued ASU 2015-11 "Simplifying the Measurement of Inventory." This update is part of the FASB's Simplification Initiative and is also intended to enhance convergence with the IASB's measurement of inventory. The update requires that inventory be measured at the lower of cost and net realizable value for entities using FIFO or average cost methods. The new requirements are effective for fiscal years beginning after December 15, 2016, and for interim periods within fiscal years beginning after December 31, 2016, with early adoption permitted. GCP is currently evaluating its effect on the Combined Financial Statements and the timing of adoption.
2. Inventories
Inventories are stated at the lower of cost or market, and cost is determined using FIFO. Inventories consisted of the following at September 30, 2015, and December 31, 2014:
|
| | | | | | | |
| (In millions) | September 30,
2015 | | December 31,
2014 |
| Raw materials | $ | 43.5 |
| | $ | 44.5 |
|
| In process | 6.6 |
| | 6.1 |
|
| Finished products | 55.7 |
| | 62.9 |
|
| Other | 8.4 |
| | 9.4 |
|
| | $ | 114.2 |
| | $ | 122.9 |
|
3. Debt
Components of Debt
|
| | | | | | | |
| (In millions) | September 30,
2015 | | December 31,
2014 |
| Related party—debt payable | $ | 48.8 |
| | $ | 53.8 |
|
| Letters of credit and other borrowings(1) | 10.2 |
| | 25.2 |
|
| Total debt | 59.0 |
| | 79.0 |
|
| Less debt payable within one year | 59.0 |
| | 79.0 |
|
| Debt payable after one year | $ | — |
| | $ | — |
|
| Weighted average interest rates on related party debt | 3.2 | % | | 3.2 | % |
| Weighted average interest rates on letters of credit and other borrowings | 9.2 | % | | 11.7 | % |
___________________________________________________________________________________________________________________
| |
| (1) | Represents borrowings under various lines of credit and other borrowings, primarily by non-U.S. subsidiaries. |
Notes to Combined Financial Statements (Continued)
3. Debt
At September 30, 2015, the recorded values of other financial instruments such as cash equivalents and trade receivables and payables approximated their fair values, based on the short-term maturities and floating rate characteristics of these instruments.
At September 30, 2015, the fair value of GCP's debt payable approximated the recorded value of $59.0 million. Fair value is determined based on Level 2 inputs, including expected future cash flows (discounted at market interest rates), estimated current market prices and quotes from financial institutions.
Debt at September 30, 2015, was used primarily to fund the working capital needs of the business and for acquisitions. All debt is scheduled to mature on or before September 30, 2016.
4. Income Taxes
The annualized effective tax rate on 2015 forecasted income is estimated to be 58.4% as of September 30, 2015, compared with 29.4% for the year ended December 31, 2014. The increase in the rate compared with the prior year primarily relates to the estimated $17 million tax effect of repatriating foreign earnings in connection with the separation transaction and a $24.7 million effect on the effective tax rate from the nondeductible charge related to Venezuela. Approximately $13 million of the tax costs of repatriation related to prior year earnings have been recorded as discrete items in 2015. The remaining $4 million relates to current earnings and is included in the calculation of the annualized effective tax rate. The tax effect of the repatriation is determined by several variables including the tax rate applicable to the entity making the distribution, the cumulative earnings and associated foreign taxes of the entity and the extent to which those earnings may have already been taxed in the U.S.
As of December 31, 2014, GCP had the intent and ability to indefinitely reinvest undistributed earnings of its foreign subsidiaries outside the United States. In the 2015 first quarter, Grace announced its plan to separate into two publicly traded companies and has reassessed the capital structure and financial requirements of both Grace and GCP. In the 2015 second quarter, Grace and GCP determined that Grace will repatriate approximately $131 million of foreign earnings in the 2015 third and fourth quarters in advance of the separation. Grace and GCP ultimately determined Grace would repatriate approximately $42 million of additional foreign earnings, with an additional discrete tax cost of approximately $2 million, prior to the separation. Such amounts were determined based on an analysis of each non-U.S. subsidiary's requirements for working capital, debt repayment and strategic initiatives. Grace and GCP also considered local country legal and regulatory restrictions. Additionally, the tax consequences of other separation related transactions may require recognition of additional tax expense for deemed repatriation of undistributed earnings of our foreign subsidiaries. Grace and GCP believe that the separation is a one-time, non-recurring event, and such repatriation would not have occurred if not for the separation.
Excluding the repatriation of undistributed earnings prior to the completion of the separation, GCP expects undistributed prior-year earnings of its foreign subsidiaries to remain permanently reinvested except in certain instances where repatriation of such earnings would result in minimal or no tax. GCP bases this assertion on:
| |
| (1) | the expectation that it will satisfy its U.S. cash obligations in the foreseeable future without requiring the repatriation of prior-year foreign earnings; |
| |
| (2) | plans for significant and continued reinvestment of foreign earnings in organic and inorganic growth initiatives outside the U.S.; and |
| |
| (3) | remittance restrictions imposed by local governments. |
GCP will continually analyze and evaluate its cash needs to determine the appropriateness of its indefinite reinvestment assertion.
5. Pension Plans and Other Postretirement Benefit Plans
Multiemployer Plans GCP employees participate in funded and unfunded defined benefit pension and other postretirement benefit plans (the “Shared Plans”) sponsored by Grace, which include participants of other
Notes to Combined Financial Statements (Continued)
5. Pension Plans and Other Postretirement Benefit Plans (Continued)
Grace subsidiaries. For purposes of the Combined Financial Statements, the Shared Plans are accounted for as multiemployer benefit plans. Accordingly, GCP does not record an asset or liability to recognize the funded status of these plans in the Combined Balance Sheets. GCP’s allocated expense for the defined benefit pension plans was $2.8 million and $4.0 million for the nine months ended September 30, 2015 and 2014, respectively. GCP’s allocated income for the postretirement health care and life insurance benefits plan was $1.2 million and $0.3 million for the nine months ended September 30, 2015 and 2014, respectively. GCP is not allocated a portion of the mark-to-market adjustments for multiemployer plans.
Defined Contribution Retirement Plan Grace also sponsors a defined contribution retirement plan for its employees in the United States, in which GCP’s employees participate. This plan is qualified under section 401(k) of the U.S. tax code. Currently, Grace contributes an amount equal to 100% of employee contributions, up to 6% of an individual employee's salary or wages. For the nine months ended September 30, 2015 and 2014, GCP received an allocation of the total cost related to this benefit plan of $3.8 million and $3.3 million, respectively.
Pension Plans GCP’s employees also participate in certain defined benefit pension plans, primarily in the U.K., that GCP sponsors. GCP records an asset or liability to recognize the funded status of these plans in the Combined Balance Sheets. Information for these defined benefit pension plans is shown below.
The following table presents the funded status of GCP's fully-funded, underfunded, and unfunded pension plans:
|
| | | | | | | |
| (In millions) | September 30,
2015 | | December 31,
2014 |
| Overfunded defined benefit pension plans | $ | 44.7 |
| | $ | 44.1 |
|
| Underfunded defined benefit pension plans | (7.5 | ) | | (7.7 | ) |
| Unfunded defined benefit pension plans | (25.7 | ) | | (27.0 | ) |
| Total underfunded and unfunded defined benefit pension plans | (33.2 | ) | | (34.7 | ) |
| Pension liabilities included in other current liabilities | (0.9 | ) | | (1.0 | ) |
| Net funded status | $ | 10.6 |
| | $ | 8.4 |
|
Fully-funded plans include several advance-funded plans where the fair value of the plan assets exceeds the projected benefit obligation ("PBO"). This group of plans was overfunded by $44.7 million as of September 30, 2015, and the overfunded status is reflected as "overfunded defined benefit pension plans" in the Combined Balance Sheets. Underfunded plans include a group of advance-funded plans that are underfunded on a PBO basis. Unfunded plans include several plans that are funded on a pay-as-you-go basis, and therefore, the entire PBO is unfunded. The combined balance of the underfunded and unfunded plans was $34.1 million as of September 30, 2015.
Components of Net Periodic Benefit Cost
|
| | | | | | | | | | | | | | | |
| | Nine Months Ended September 30, |
| | 2015 | | 2014 |
| | Pension | | Pension |
| (In millions) | U.S. | | Non-U.S. | | U.S. | | Non-U.S. |
| Service cost | $ | 0.2 |
| | $ | 2.3 |
| | $ | 0.2 |
| | $ | 2.4 |
|
| Interest cost | 0.4 |
| | 6.9 |
| | 0.4 |
| | 9.2 |
|
| Expected return on plan assets | (0.5 | ) | | (8.3 | ) | | (0.5 | ) | | (9.9 | ) |
| Amortization of prior service cost | — |
| | 0.1 |
| | — |
| | 0.1 |
|
| Net periodic benefit cost (1) | $ | 0.1 |
| | $ | 1.0 |
| | $ | 0.1 |
| | $ | 1.8 |
|
___________________________________________________________________________________________________________________
| |
| (1) | Includes expense that was allocated to Grace of $0.1 million and $0.2 million for the nine months ended September 30, 2015 and 2014, respectively. |
Notes to Combined Financial Statements (Continued)
5. Pension Plans and Other Postretirement Benefit Plans (Continued)
Plan Contributions and Funding GCP intends to satisfy its funding obligations under the U.S. qualified pension plans and to comply with all of the requirements of the Employee Retirement Income Security Act of 1974 ("ERISA"). For ERISA purposes, funded status is calculated on a different basis than under GAAP.
GCP intends to fund non-U.S. pension plans based on applicable legal requirements and actuarial and trustee recommendations.
6. Other Balance Sheet Accounts
|
| | | | | | | |
| (In millions) | September 30,
2015 | | December 31, 2014 |
| Other Current Assets | | | |
| Non trade receivables | $ | 22.8 |
| | $ | 30.9 |
|
| Prepaid expenses | 7.5 |
| | 7.5 |
|
| Income tax receivable(1) | 2.4 |
| | 2.7 |
|
| Marketable securities | 0.1 |
| | 0.2 |
|
| Total other current assets | $ | 32.8 |
| | $ | 41.3 |
|
|
| | | | | | | |
| (In millions) | September 30,
2015 | | December 31,
2014 |
| Other Current Liabilities | | | |
| Customer volume rebates | $ | 32.7 |
| | $ | 31.2 |
|
| Accrued compensation | 26.0 |
| | 28.5 |
|
| Income tax payable(1) | 21.8 |
| | 18.8 |
|
| Accrued interest | 3.5 |
| | 3.3 |
|
| Pension liabilities | 0.9 |
| | 1.0 |
|
| Deferred income taxes | 0.3 |
| | 1.1 |
|
| Other accrued liabilities | 44.6 |
| | 35.1 |
|
| Total other current liabilities | $ | 129.8 |
| | $ | 119.0 |
|
___________________________________________________________________________________________________________________
| |
| (1) | Income tax items above do not include amounts due from/to Grace. |
Accrued compensation in the table above includes salaries and wages as well as estimated current amounts due under the annual and long-term incentive programs.
7. Commitments and Contingent Liabilities
Purchase Commitments GCP uses purchase commitments to ensure supply and to minimize the volatility of certain key raw materials including lignins, polycarboxylates, amines and other materials. Such commitments are for quantities that GCP fully expects to use in its normal operations.
Guarantees and Indemnification Obligations GCP is a party to many contracts containing guarantees and indemnification obligations. These contracts primarily consist of:
| |
| • | Product warranties with respect to certain products sold to customers in the ordinary course of business. These warranties typically provide that products will conform to specifications. GCP accrues a warranty liability on a transaction-specific basis depending on the individual facts and circumstances related to each sale. Both the liability and annual expense related to product warranties are immaterial to the Combined Financial Statements. |
| |
| • | Performance guarantees offered to customers. GCP has not established a liability for these arrangements based on past performance. |
Notes to Combined Financial Statements (Continued)
7. Commitments and Contingent Liabilities (Continued)
| |
| • | Contracts providing for the sale of a former business unit or product line in which GCP has agreed to indemnify the buyer against liabilities arising prior to the closing of the transaction, including environmental liabilities. |
Environmental Remediation GCP is subject to loss contingencies resulting from extensive and evolving federal, state, local and foreign environmental laws and regulations relating to the generation, storage, handling, discharge, disposition and stewardship of hazardous wastes and other materials. GCP accrues for anticipated costs associated with response efforts where an assessment has indicated that a probable liability has been incurred and the cost can be reasonably estimated. These accruals do not take into account any discounting for the time value of money.
GCP's environmental liabilities are reassessed whenever circumstances become better defined or response efforts and their costs can be better estimated. These liabilities are evaluated based on currently available information, including the progress of remedial investigation at each site, the current status of discussions with regulatory authorities regarding the method and extent of remediation at each site, existing technology, prior experience in contaminated site remediation and the apportionment of costs among potentially responsible parties.
Financial Assurances Financial assurances have been established for a variety of purposes, including insurance and environmental matters, trade-related commitments and other matters. At September 30, 2015, GCP had gross financial assurances issued and outstanding of $6.1 million, composed of $0.1 million of surety bonds issued by various insurance companies and $6.0 million of standby letters of credit and other financial assurances issued by various banks.
General From time to time, GCP and its subsidiaries are parties to, or targets of, lawsuits, claims, investigations and proceedings which are being managed and defended in the ordinary course of business. While GCP is unable to predict the outcome of these matters, it does not believe, based upon currently available facts, that the ultimate resolution of any such pending matters will have a material adverse effect on its overall financial condition, results of operations, or cash flows.
Accounting for Contingencies Although the outcome of each of the matters discussed above cannot be predicted with certainty, GCP has assessed its risk and has made accounting estimates as required under GAAP.
8. Restructuring Expenses and Asset Impairments
In the nine months ended September 30, 2015, GCP incurred costs from restructuring actions as a result of changes in the business environment and its business structure. GCP incurred $9.9 million ($5.7 million in Specialty Construction Chemicals, $2.7 million in Specialty Building Materials, and $1.5 million in Darex Packaging Technologies) of restructuring expenses during the nine months, compared with $1.8 million ($1.5 million in Specialty Construction Chemicals, $0.2 million in Specialty Building Materials, and $0.1 million in Darex Packaging Technologies) during the prior-year period. These costs are not included in segment operating income. Substantially all costs related to the restructuring programs are expected to be paid by September 30, 2016.
During 2014, GCP's concrete production management systems product line was not meeting performance expectations, resulting in reduced cash flow and increasing obligations. GCP evaluated its concrete production management systems product line long-lived assets for impairment. Based on reviewing undiscounted cash flow information, GCP determined that the fair value of these long-lived assets was less than their carrying value and therefore recorded an impairment charge of $9.8 million ($3.8 million of equipment, $5.5 million of technology and $0.5 million of intellectual property). The remaining fair value of these assets subsequent to impairment was $8.2 million ($5.6 million of equipment, $2.3 million of technology and $0.3 million of intellectual property). In the 2014 third quarter, GCP also incurred an impairment charge of $4.5 million related to an unconsolidated investment.
Notes to Combined Financial Statements (Continued)
8. Restructuring Expenses and Asset Impairments (Continued)
|
| | | | | | | |
Restructuring Expenses and Asset Impairments (In millions) | Nine Months Ended September 30, |
| 2015 | | 2014 |
| Restructuring expenses | $ | 9.9 |
| | $ | 1.8 |
|
| Asset impairments | — |
| | 14.3 |
|
| Total restructuring expenses and asset impairments | $ | 9.9 |
| | $ | 16.1 |
|
|
| | | |
Restructuring Liability (In millions) | Total |
| Balance, December 31, 2014 | $ | 0.8 |
|
| Accruals for severance and other costs | 9.9 |
|
| Payments | (7.9 | ) |
| Balance, September 30, 2015 | $ | 2.8 |
|
9. Other Comprehensive Loss
The following tables present the pre-tax, tax, and after-tax components of GCP's other comprehensive loss for the nine months ended September 30, 2015 and 2014:
|
| | | | | | | | | | | |
Nine Months Ended September 30, 2015 (In millions) | Pre-Tax Amount | | Tax Benefit/ (Expense) | | After-Tax Amount |
| Defined benefit pension and other postretirement plans: | | | | | |
| Amortization of net prior service cost included in net periodic benefit cost | $ | 0.1 |
| | $ | (0.1 | ) | | $ | — |
|
| Benefit plans, net | 0.1 |
| | (0.1 | ) | | — |
|
| Currency translation adjustments | (39.1 | ) | | — |
| | (39.1 | ) |
| Gain from hedging activities | 0.4 |
| | (0.2 | ) | | 0.2 |
|
| Other comprehensive loss attributable to GCP | $ | (38.6 | ) | | $ | (0.3 | ) | | $ | (38.9 | ) |
|
| | | | | | | | | | | |
Nine Months Ended September 30, 2014 (In millions) | Pre-Tax Amount | | Tax Benefit/ (Expense) | | After-Tax Amount |
| Defined benefit pension and other postretirement plans: | | | | | |
| Amortization of net prior service cost included in net periodic benefit cost | $ | 0.1 |
| | $ | (0.1 | ) | | $ | — |
|
| Benefit plans, net | 0.1 |
| | (0.1 | ) | | — |
|
| Currency translation adjustments | (14.5 | ) | | — |
| | (14.5 | ) |
| Other than temporary impairment of investment | 0.8 |
| | — |
| | 0.8 |
|
| Loss on securities available for sale | (0.1 | ) | | — |
| | (0.1 | ) |
| Other comprehensive loss attributable to GCP | $ | (13.7 | ) | | $ | (0.1 | ) | | $ | (13.8 | ) |
Notes to Combined Financial Statements (Continued)
9. Other Comprehensive Loss (Continued)
The following tables present the changes in accumulated other comprehensive loss, net of tax, for the nine months ended September 30, 2015 and 2014:
|
| | | | | | | | | | | | | | | |
Nine Months Ended September 30, 2015 (In millions) | Defined Benefit Pension and Other Postretirement Plans | | Currency Translation Adjustments | | Gain (Loss) from Hedging Activities | | Total |
| Beginning balance | $ | (0.3 | ) | | $ | (47.7 | ) | | $ | (0.2 | ) | | $ | (48.2 | ) |
| Other comprehensive (loss) income before reclassifications | — |
| | (39.1 | ) | | 0.4 |
| | (38.7 | ) |
| Amounts reclassified from accumulated other comprehensive loss | — |
| | — |
| | (0.2 | ) | | (0.2 | ) |
| Net current-period other comprehensive (loss) income | — |
| | (39.1 | ) | | 0.2 |
| | (38.9 | ) |
| Ending balance | $ | (0.3 | ) | | $ | (86.8 | ) | | $ | — |
| | $ | (87.1 | ) |
|
| | | | | | | | | | | | | | | | | | | | | | | |
Nine Months Ended September 30, 2014 (In millions) | Defined Benefit Pension and Other Postretirement Plans | | Currency Translation Adjustments | | Gain (Loss) from Hedging Activities | | Unrealized Loss on Investment | | Gain (Loss) on Securities Available for Sale | | Total |
| Beginning balance | $ | (0.4 | ) | | $ | (6.6 | ) | | $ | (0.4 | ) | | $ | (0.8 | ) | | $ | 0.1 |
| | $ | (8.1 | ) |
| Other comprehensive loss before reclassifications | — |
| | (14.5 | ) | | (0.5 | ) | | — |
| | (0.7 | ) | | (15.7 | ) |
| Amounts reclassified from accumulated other comprehensive loss | — |
| | — |
| | 0.5 |
| | 0.8 |
| | 0.6 |
| | 1.9 |
|
| Net current-period other comprehensive (loss) income | — |
| | (14.5 | ) | | — |
| | 0.8 |
| | (0.1 | ) | | (13.8 | ) |
| Ending balance | $ | (0.4 | ) | | $ | (21.1 | ) | | $ | (0.4 | ) | | $ | — |
| | $ | — |
| | $ | (21.9 | ) |
GCP is a global enterprise operating in over 40 countries with local currency generally deemed to be the functional currency for accounting purposes. The currency translation amount represents the adjustments necessary to translate the balance sheets valued in local currencies to the U.S. dollar as of the end of each period presented, and to translate revenues and expenses at average exchange rates for each period presented.
See Note 5 to the interim Combined Financial Statements for a discussion of pension plans and other postretirement benefit plans.
10. Related Party Transactions and Parent Company Equity
The Combined Financial Statements have been prepared on a stand-alone basis and are derived from the consolidated financial statements and accounting records of Grace.
Allocation of General Corporate Expenses
The Combined Financial Statements include expense allocations for certain functions provided by Grace as well as other Grace employees not solely dedicated to GCP, including, but not limited to, general corporate expenses related to finance, legal, information technology, human resources, communications, ethics and compliance, shared services, employee benefits and incentives, and stock-based compensation. These expenses have been allocated to GCP on the basis of direct usage when identifiable, with the remainder allocated on the basis of revenue, headcount or other measures. During the nine months of 2015 and 2014, GCP was allocated $40.2 million and $39.6 million, respectively, of general corporate expenses incurred by Grace, which is primarily included within selling, general and administrative expenses in the Combined Statements of Operations.
Notes to Combined Financial Statements (Continued)
10. Related Party Transactions and Parent Company Equity (Continued)
The expense allocations from Grace discussed above include costs associated with defined benefit pension and other postretirement benefit plans (the “Shared Plans”) sponsored by Grace in which some of GCP's employees participate. GCP accounts for such Shared Plans as multiemployer benefit plans. Accordingly, GCP does not record an asset or liability to recognize the funded status of the Shared Plans. As part of the separation, Grace expects to split certain Shared Plans and transfer the assets and liabilities of such plans related to GCP employees to GCP.
The expense allocations have been determined on a basis that GCP considers to be a reasonable reflection of the utilization of services provided or the benefit received by GCP during the periods presented. The allocations may not, however, reflect the expense GCP would have incurred as an independent company for the periods presented. Actual costs that would have been incurred if GCP had been a stand-alone company would depend on a number of factors, including the chosen organizational structure, whether functions were outsourced or performed by employees and strategic decisions made in areas such as information technology and infrastructure.
Parent Company Equity
Net transfers to parent are included within net parent investment on the Combined Statements of Parent Company Equity. The components of the net transfers to parent as of September 30, 2015, and 2014 are as follows:
|
| | | | | | | |
| | Nine Months Ended September 30, |
| (In millions) | 2015 | | 2014 |
| Cash pooling and general financing activities | $ | (237.5 | ) | | $ | (195.2 | ) |
| GCP expenses funded by parent | 43.0 |
| | 47.9 |
|
| Corporate costs allocations | 40.2 |
| | 39.6 |
|
| Provision for income taxes | 58.2 |
| | 36.4 |
|
| Total net transfers to parent | (96.1 | ) | | (71.3 | ) |
| Share-based compensation | (2.8 | ) | | (3.1 | ) |
| Other, net | 29.3 |
| | 8.1 |
|
| Transfers to parent, net per Combined Statements of Cash Flows | $ | (69.6 | ) | | $ | (66.3 | ) |
11. Operating Segment Information
GCP is engaged in the production and sale of specialty construction chemicals, specialty building materials and packaging products through three operating segments. Specialty Construction Chemicals manufactures and markets concrete admixtures and cement additives. Specialty Building Materials manufactures and markets sheet and liquid membrane systems that protect structures from water, air and vapor penetration, fireproofing, and other products designed to protect the building envelope. Darex Packaging Technologies manufactures and markets packaging materials for use in beverage and food containers, industrial containers and other consumer and industrial applications. The table below presents information related to GCP's operating segments. Only those corporate expenses directly related to the operating segments are allocated for reporting purposes. All remaining corporate items are reported separately and labeled as such.
GCP excludes defined benefit pension expense from the calculation of segment operating income. GCP believes that the exclusion of defined benefit pension expense provides a better indicator of its operating segment performance as defined benefit pension expense is not managed at an operating segment level.
GCP defines Adjusted EBIT (a non-GAAP financial measure) to be net income adjusted for interest income and expense; income taxes; restructuring expenses and asset impairments; repositioning expenses; pension costs other than service and interest costs, expected returns on plan assets, and amortization of prior service costs/credits; income and expense items related to certain product lines and other investments; gains and losses
Notes to Combined Financial Statements (Continued)
11. Operating Segment Information (Continued)
on sales of businesses, product lines, and certain other investments; and certain other unusual or infrequent items that are not representative of underlying trends.
Operating Segment Data
|
| | | | | | | |
| | Nine Months Ended September 30, |
| (In millions) | 2015 | | 2014 |
| Net Sales | | | |
| Specialty Construction Chemicals | $ | 534.2 |
| | $ | 542.9 |
|
| Specialty Building Materials | 297.6 |
| | 284.0 |
|
| Darex Packaging Technologies | 254.3 |
| | 288.5 |
|
| Total | $ | 1,086.1 |
| | $ | 1,115.4 |
|
| Adjusted EBIT | | | |
| Specialty Construction Chemicals segment operating income | $ | 66.9 |
| | $ | 52.3 |
|
| Specialty Building Materials segment operating income | 73.3 |
| | 56.7 |
|
| Darex Packaging Technologies segment operating income | 56.0 |
| | 57.3 |
|
| Corporate costs | (16.5 | ) | | (15.3 | ) |
| Certain pension costs | (3.8 | ) | | (5.6 | ) |
| Total | $ | 175.9 |
| | $ | 145.4 |
|
Corporate costs include certain functional costs and other corporate costs such as certain performance-based compensation incentive compensation and public company costs.
GCP Adjusted EBIT for the nine months ended September 30, 2015 and 2014, is reconciled below to income before income taxes presented in the accompanying Combined Statements of Operations.
Reconciliation of Operating Segment Data to Financial Statements
|
| | | | | | | |
| | Nine Months Ended September 30, |
| (In millions) | 2015 | | 2014 |
| GCP Adjusted EBIT | $ | 175.9 |
| | $ | 145.4 |
|
| Currency and other losses in Venezuela | (73.2 | ) | | (1.0 | ) |
| Pension MTM adjustment and other related costs, net | (0.5 | ) | | 0.2 |
|
| Restructuring expenses and asset impairments | (9.9 | ) | | (16.1 | ) |
| Interest expense, net | (1.7 | ) | | (3.8 | ) |
| Net income attributable to noncontrolling interests | 0.6 |
| | 1.3 |
|
| Income before income taxes | $ | 91.2 |
| | $ | 126.0 |
|
Notes to Combined Financial Statements (Continued)
11. Operating Segment Information (Continued)
The table below presents information related to the geographic areas in which GCP operates. Sales are attributed to geographic areas based on customer location.
Geographic Area Data
|
| | | | | | | |
| | Nine Months Ended September 30, |
| (In millions) | 2015 | | 2014 |
| Net Sales | | | |
| United States | $ | 378.3 |
| | $ | 347.8 |
|
| Canada and Puerto Rico | 22.9 |
| | 26.6 |
|
| Total North America | 401.2 |
| | 374.4 |
|
| Europe Middle East Africa (EMEA) | 260.7 |
| | 307.8 |
|
| Asia Pacific | 248.6 |
| | 261.1 |
|
| Latin America | 175.6 |
| | 172.1 |
|
| Total | $ | 1,086.1 |
| | $ | 1,115.4 |
|