UNITED STATES
SECURITIES AND EXCHANGE COMMISSION
Washington, D.C. 20549
FORM N-CSR
CERTIFIED SHAREHOLDER REPORT OF REGISTERED MANAGEMENT INVESTMENT COMPANIES
Investment Company Act File Number 811-23086
WP Trust
(Exact name of registrant as specified in charter)
| 4300 Shawnee Mission Parkway, Suite 100 Fairway, KS | 66205 |
| (Address of principal executive offices) | (Zip code) |
The Corporation Trust Company
Corporation Trust Center
1209 Orange St.
Wilmington, DE 19801
(Name and address of agent for service)
With Copies To:
John H. Lively
Practus, LLP
11300 Tomahawk Creek Parkway, Suite 310
Leawood, KS 66211
Registrant’s telephone number, including area code: 877-244-6235
Date of fiscal year end: 11/30/2018
Date of reporting period: 11/30/2018
| ITEM 1. | REPORTS TO SHAREHOLDERS |
The Annual report to Shareholders of the WP Smaller Companies Income Plus Fund (“WPSMX”), WP International Companies Income Plus Fund (“WPITX”), WP Income Plus Fund (“WPINX”), each a series of the WP Trust (the “registrant”), for the year ended November 30, 2018 and for the three month period ended November 30, 2018 for the WP Large Cap Income Plus Fund (“WPLCX”) pursuant to Rule 30e-1 under the Investment Company Act of 1940 (the “1940 Act”), as amended (17 CFR 270.30e-1) is filed herewith.

WP Smaller Companies Income Plus Fund
Institutional Class Shares (Ticker Symbol: WPSMX)
WP International Companies Income Plus Fund
Institutional Class Shares (Ticker Symbol: WPITX)
WP Income Plus Fund
Institutional Class Shares (Ticker Symbol: WPINX)
WP Large Cap Income Plus Fund
Institutional Class Shares (Ticker Symbol: WPLCX)
Series of the
WP Trust
ANNUAL REPORT
November 30, 2018
Investment Adviser
Winning Points Advisers, LLC
129 NW 13th Street, Suite D-26
Boca Raton, Florida 33431
IMPORTANT NOTE: Beginning on January 1, 2021, as permitted by regulations adopted by the SEC, paper copies of the WP Funds’ shareholder reports will no longer be sent by mail unless you specifically request paper copies of the reports from a WP Fund or from your financial intermediary, such as a broker-dealer or bank. Instead, the reports will be made available on a website, and you will be notified by mail each time a report is posted and provided with a website link to access the report. If you already elected to receive shareholder reports electronically, you will not be affected by this change and you need not take any action. You may elect to receive all future reports in paper free of charge. You can inform a WP Fund or your financial intermediary that you wish to continue receiving paper copies of your shareholder reports by calling or sending an e-mail request. Your election to receive reports in paper will apply to all funds held with the WP Fund complex/your financial intermediary.
TABLE OF CONTENTS
To the shareholders of WPSMX, WPITX and WPINX:
This is our third Shareholder letter as the WP Smaller Companies Income Plus Fund (“WPSMX”), WP International Companies Income Plus Fund (“WPITX”) and WP Income Plus Fund (“WPINX”), (individually, a “Fund”, together, the “Funds”) have now been open for three years and this year proved to be our most challenging year so far especially in light of the market performance in December. Our performance numbers are as follows:
Average Annual Total Returns as of November 30, 2018 | | One Year ended November 30, 2018 | | Since Inception from January 4, 2016 through November 30, 2018 |
| WP Smaller Companies Income Plus Fund Institutional Class shares | | 2.23% | | 11.21% |
| S&P 500® Total Return Index | | 6.27% | | 13.79% |
| Russell 2000® Total Return Index | | 0.57% | | 13.34% |
| | One Year ended November 30, 2018 | | Since Inception from January 4, 2016 through November 30, 2018 |
| WP International Companies Income Plus Fund Institutional Class shares | | (11.97)% | | 4.03% |
| S&P 500® Total Return Index | | 6.27% | | 13.79% |
| MSCI EAFE Index | | (7.94)% | | 5.69% |
| | One Year ended November 30, 2018 | | Since Inception from January 4, 2016 through November 30, 2018 |
| WP Income Plus Fund Institutional Class shares | | (4.69)% | | 4.35% |
| S&P 500® Total Return Index | | 6.27% | | 13.79% |
| Markit iBoxx USD Liquid High Yield Index | | 0.89% | | 7.66% |
All of our Funds utilize our Option/Cash Flow Process which is something we developed ourselves and has been evolving over the eight years since we started it with individual accounts and now with our Mutual Funds. Through the use of options, we are able to increase our cash flow in each Fund on a yearly basis and use some of that cash flow to purchase puts which may act as a buffer in market downturns. The structure of the Funds (because of the options) and their objectives are to: (1) out- perform in up markets, and (2) protect in violent and sharp down markets, but unfortunately there are no full proof investments and the structure of our Funds will cause us to under-perform in markets that go through a gradual and rolling correction which is what we did or are experiencing right now and our performance numbers reflect just that. This was expected and our Funds are performing as we expected them to perform in this type of market. We are hopeful the market stabilizes in 2019 at which point objective (1) from above comes back into play.
WPINX owns two Corporate High Yield Bond ETFs, HYG and JNK, which invest in liquid, U.S. dollar-denominated high yielding corporate bonds for sale in the U.S. We also have a few smaller dividend paying stocks. We made no significant changes to the portfolio in 2018. The Bond Market took a downturn in the latter part of 2018 which caused the price of our underlying positions to decline: HYG -7.1% for the year and JNK -8.7% for the year. These price declines and how the Fund is structured is what produced our underperformance for the year. We expect yields to work slightly higher in 2019 and hope to increase our monthly dividend to reach $0.03 (from $0.025 now) a share which will produce a yield of 3.6%.
WPITX owns the iShares MSCI EAFE ETF, EAF, and two smaller positions in DGS and DLS, two Wisdom Tree ETFs. These ETFs invest in large and mid-capitalization developed market equities excluding the U.S. and Canada markets. We made no significant changes to the portfolio in 2018. The developed market space was hit hard in 2018 because of slower growth fears and the unwinding of the balance sheet of the ECB which is a large “unknown”. This can be seen in the prices of our 3 holdings EFA -16.5% for the year, DGS -19.6% for the year, and DLS -21.6% for the year. These price declines and how the Fund is structured is what produced our underperformance for the year.
WPSMX owns the iShares Russell 2000 ETF, IWM, which invests in the small-capitalization sector of the U.S. equity market, and two very small positions in stocks involved in fighting the opioid addiction problem. We made no significant changes to the portfolio in 2018. The small cap space, which had been outperforming most asset classes, was not exempt from the market decline and we saw a 12.8 % decline in IWM. This price decline and how the Fund is structured is what produced our underperformance for the year.
We expect the stock market to be much more volatile in 2019 and expect big swings in the market on a frequent basis due to trading by “algorithms” and computer-based decisions. According to the Wall Street Journal 85% of all trades in December 2018 were on what they described as “auto-pilot” which to us means the potential circuit breakers of human input is missing and all the algorithm or computer knows is to “hit the bid”. This very well might be the new normal and will produce the kind of volatility the Wall Street trading desks thrive on. Being short volatility for the past 3 years has been a winning trade but it appears those days are over and volatility is here to stay for a while.
We still like the income space, the small cap space, and the developed markets space so we will stick with the underlying positions in our three Funds, continue to refine our option cash/flow process, and adapt to the ever changing landscape in the stock market and hopefully produce positive returns in 2019.
Thank you for your confidence in us.
 |  | |
| | | |
| John Brandt | Charles S Soll | |
| Portfolio Manager | Portfolio Manager | |
To the shareholders of WPLCX:
It has been five years since we started the WP Large Cap Income Plus Fund (the “Fund’ or “WPLCX”) and the fifth year has been our most challenging period yet. We underperformed in this period due to the structure of the Fund. We typically underperform in times of a gradual market decline, which we saw in the latter part of the year.
During the year, we changed the Fund’s fiscal year-end from August 31st to November 30th to align with our other three Funds’ fiscal year end. During the three-month period ended November 30, 2018, WPLCX returned (6.26)% vs (1.07)% for the Dow Jones Industrial Average Total Return Index. Other performance figures are as follows:
Average Annual Total Returns as of November 30, 2018 | | One Year ended November 30, 2018 | | Since Inception from December 4, 2013 through November 30, 2018 |
| WP Large Cap Income Plus Fund Institutional Class shares | | 2.11% | | 7.24% |
| Dow Jones Industrial Average Total Return Index | | 7.62% | | 12.68% |
We are a Large Cap Value Fund and 88% of our assets are in Large Cap stocks paying dividends in the 2% to 4% range. We sold Clough Global Equities and Virtus Total Return Fund, took new positions in Facebook and Archer Daniels Midland and added to positions in Catasys, WalMart, China Mobile, Intel and Alibaba.
We are positive on the stock market for 2019 and while we don’t think we will see 4% GDP growth, we think the economy will grow in the 2 ½% to 3% range for the year. We don’t think the market is anticipating this kind of growth and if it turns out to be the case we think the market will do well and will be a good environment for the stocks we own and produce a successful year for our Funds.
In the mean time we will collect our dividends and our positive option cash flow. Expect a dividend again from this Fund prior to the next year end.
Thank you for your confidence in us.
| | | |
| | | |
| John Brandt | Charles S Soll | |
| Portfolio Manager | Portfolio Manager | |
WP Smaller Companies Income Plus Fund
INVESTMENT HIGHLIGHTS
November 30, 2018 (Unaudited)
The investment objective of the WP Smaller Companies Income Plus Fund (the “Fund” or “Smaller Companies Fund”) is total return. The Smaller Companies Fund seeks to meet its investment objective by investing at least 80% of its net assets, plus the amount of any borrowings for investment purposes, in unaffiliated mutual funds and exchange-traded funds (“ETFs”) that invest primarily in securities of small-capitalization issuers (“Underlying Small-Cap Funds”). The Smaller Companies Fund seeks to produce income through dividends paid on such Underlying Small-Cap Funds. The Smaller Companies Fund also seeks to produce income (e.g., premium income on the sale of an option) and total return through an options strategy.
Winning Points Advisers, LLC (the “Adviser”) will generally buy and sell options linked to either the Russell 2000® Index or the S&P 500® Index. The portfolio managers will strategically allocate the Smaller Companies Fund’s resources to the Underlying Small-Cap Funds and the options strategy as the portfolio managers deem appropriate to perform well over a market cycle.
The Smaller Companies Fund may also sell put options on ETFs that the Adviser believes are attractive for purchase at prices at or above the exercise price of the put options sold. The Adviser generally will sell put options to increase the total return component of the options strategy described in the Fund’s investment objective. The Smaller Companies Fund may, in certain circumstances, purchase put options on the S&P 500® Index (or another broad-based securities index deemed suitable for this purpose) to protect against a loss of principal value due to stock price decline. The Adviser generally purchases put options to protect the total return component of the options strategy described in the Fund’s investment objective. The extent of option selling or purchasing activity will depend upon market conditions and the Adviser’s assessment of the advantages of selling index call options, purchasing index put options and selling put options on individual stocks.
The Smaller Companies Fund may be appropriate for investors with long-term time horizons who are not sensitive to short-term losses and want to participate in the long-term growth of the financial markets.
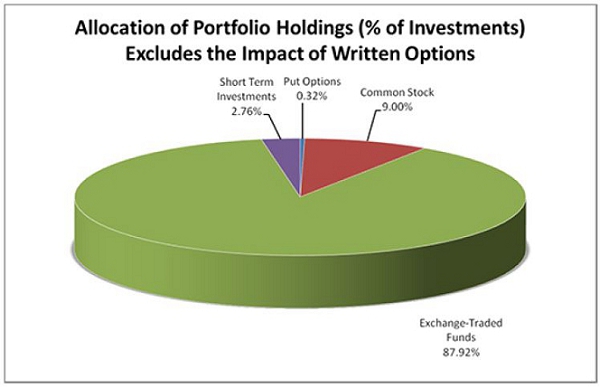
The percentages in the above graph are based on the portfolio holdings of the Fund as of November 30, 2018 and are subject to change. For a detailed break-out of holdings by investment type, please refer to the Schedules of Investments and Options Purchased.
WP Smaller Companies Income Plus Fund
INVESTMENT HIGHLIGHTS
November 30, 2018 (Unaudited)
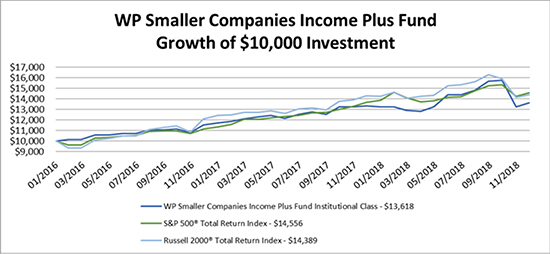
Average Annual Total Returns as of November 30, 2018 | | One Year ended November 30, 2018 | | Since Inception from January 4, 2016 through November 30, 2018 |
| WP Smaller Companies Income Plus Fund Institutional Class shares | | 2.23% | | 11.21% |
| S&P 500® Total Return Index | | 6.27% | | 13.79% |
| Russell 2000® Total Return Index | | 0.57% | | 13.34% |
The performance information quoted in this annual report assumes the reinvestment of all dividend and capital gain distributions, if any, and represents past performance, which is not a guarantee of future results. The returns shown do not reflect taxes that a shareholder would pay on Fund distributions or on the redemption of Fund shares. The investment return and principal value of an investment will fluctuate and, therefore, an investor’s shares, when redeemed, may be worth more or less than their original cost. Updated performance data current to the most recent month-end can be obtained by calling 1-877-244-6235.
The above graph depicts the performance of the WP Smaller Companies Income Plus Fund versus the S&P 500® Total Return Index and the Russell 2000® Total Return Index. The S&P 500® Total Return Index is a broad unmanaged index of 500 stocks, which is widely recognized as representative of the equity market in general. The Russell 2000® Total Return Index measures the performance of the small-cap segment of the U.S. equity universe. Please note that indices do not take into account any fees and expenses of investing in the individual securities that they track and individuals cannot invest directly in any index.
As with any fund, save an index fund, that commonly compares its performance to the S&P 500® Total Return Index and the Russell 2000® Total Return Index, such a comparison may be said to be inappropriate because of the dissimilarity between the Fund’s investments and the securities comprising the indexes; so too with the WP Smaller Companies Income Plus Fund, which will generally not invest in all the securities comprising each index.
WP International Companies Income Plus Fund
INVESTMENT HIGHLIGHTS
November 30, 2018 (Unaudited)
The investment objective of the WP International Companies Income Plus Fund (the “Fund” or “International Companies Fund”) is total return. The International Companies Fund seeks to meet its investment objective by investing in unaffiliated mutual funds and exchange-traded funds (“ETFs”) that invest primarily in equity securities and depositary receipts of internationally-domiciled issuers (“Underlying International Funds”). The International Companies Fund seeks to produce income through dividends paid on such Underlying International Funds. The International Companies Fund also seeks to produce income (e.g., premium income on the sale of an option) and total return through an options strategy.
The Adviser will generally buy and sell options linked to either the MSCI EAFE Index or the S&P 500® Index. The portfolio managers will strategically allocate the International Companies Fund’s resources to the Underlying International Funds and the options strategy as the portfolio managers deem appropriate to perform well over a market cycle.
The International Companies Fund may also sell put options on ETFs that the Adviser believes are attractive for purchase at prices at or above the exercise price of the put options sold. The Adviser generally will sell put options to increase the total return component of the options strategy described in the Fund’s investment objective. The International Companies Fund may, in certain circumstances, purchase put options on the S&P 500® Index (or another broad-based securities index deemed suitable for this purpose) to protect against a loss of principal value due to stock price decline. The Adviser generally purchases put options to protect the total return component of the options strategy described in the Fund’s investment objective. The extent of option selling or purchasing activity will depend upon market conditions and the Adviser’s assessment of the advantages of selling index call options, purchasing index put options and selling put options on individual stocks.
The International Companies Fund may be appropriate for investors with long-term time horizons who are not sensitive to short-term losses and want to participate in the long-term growth of the financial markets.
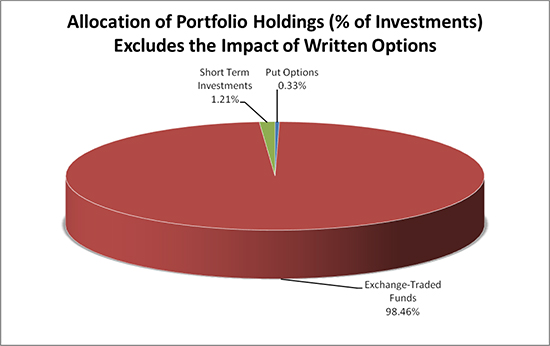
The percentages in the above graph are based on the portfolio holdings of the Fund as of November 30, 2018 and are subject to change. For a detailed break-out of holdings by investment type, please refer to the Schedules of Investments and Options Purchased.
WP International Companies Income Plus Fund
INVESTMENT HIGHLIGHTS
November 30, 2018 (Unaudited)
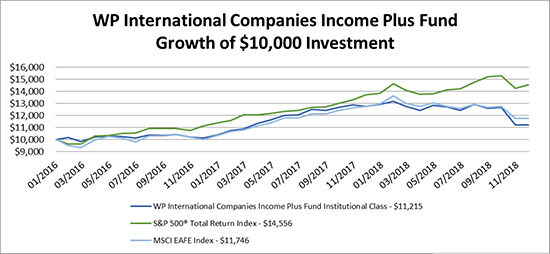
Average Annual Total Returns as of November 30, 2018 | | One Year ended November 30, 2018 | | Since Inception from January 4, 2016 through November 30, 2018 |
| WP International Companies Income Plus Fund Institutional Class shares | | (11.97)% | | 4.03% |
| S&P 500® Total Return Index | | 6.27% | | 13.79% |
| MSCI EAFE Index | | (7.94)% | | 5.69% |
The performance information quoted in this annual report assumes the reinvestment of all dividend and capital gain distributions, if any, and represents past performance, which is not a guarantee of future results. The returns shown do not reflect taxes that a shareholder would pay on Fund distributions or on the redemption of Fund shares. The investment return and principal value of an investment will fluctuate and, therefore, an investor’s shares, when redeemed, may be worth more or less than their original cost. Updated performance data current to the most recent month-end can be obtained by calling 1-877-244-6235.
The above graph depicts the performance of the WP International Companies Income Plus Fund versus the S&P 500® Total Return Index and the MSCI EAFE Index. The S&P 500® Total Return Index is a broad unmanaged index of 500 stocks, which is widely recognized as representative of the equity market in general. The MSCI EAFE Index is a free-float weighted equity index that covers DM countries in Europe, Australasia, Israel and the Far East. Please note that indices do not take into account any fees and expenses of investing in the individual securities that they track and individuals cannot invest directly in any index.
As with any fund, save an index fund, that commonly compares its performance to the S&P 500® Total Return Index and the MSCI EAFE Index, such a comparison may be said to be inappropriate because of the dissimilarity between the Fund’s investments and the securities comprising the indexes; so too with the WP International Companies Income Plus Fund, which will generally not invest in all the securities comprising each index.
WP Income Plus Fund
INVESTMENT HIGHLIGHTS
November 30, 2018 (Unaudited)
The investment objective of the WP Income Plus Fund (the “Fund” or “Income Fund”) is total return. The Income Fund seeks to meet its investment objective by investing approximately 80% in unaffiliated open- and closed-end mutual funds and exchange-traded funds that primarily invest in fixed-income securities (“Underlying Bond Funds”). The principal types of fixed-income securities in which the Underlying Bond Funds invest are bonds, U.S. Treasury and agency securities, and mortgage-backed and asset-backed securities. The Underlying Bond Funds may invest in fixed income securities of any credit or maturity. The Underlying Bond Funds’ investments in securities rated below investment-grade are also known as “junk bonds” and are speculative in nature. The Income Fund seeks to produce income through yield on the Underlying Bond Funds. The Income Fund also seeks to produce income (e.g., premium income on the sale of an option) and total return through an options strategy.
The Adviser will generally buy and sell options linked to either the Markit iBoxx USD Liquid High Yield Index or the S&P 500® Index. The portfolio managers will strategically allocate the Income Fund’s resources to the Underlying Bond Funds and the options strategy as the portfolio managers deem appropriate to perform well over a market cycle.
The Income Fund may also sell put options on ETFs that the portfolio managers believe are attractive for purchase at prices at or above the exercise price of the put options sold. The Adviser generally will sell put options to increase the total return component of the options strategy described in the Fund’s investment objective. The Income Fund may, in certain circumstances, purchase put options on the S&P 500® Index (or another broad-based securities index deemed suitable for this purpose) to protect against a loss of principal value due to stock price decline. The Adviser generally purchases put options to protect the total return component of the options strategy described in the Fund’s investment objective. The extent of option selling or purchasing activity will, again, depend upon market conditions and the portfolio managers’ assessment of the advantages of selling index call options, purchasing index put options and selling put options on individual stocks.
The Income Fund may be appropriate for investors with long-term time horizons who are not sensitive to short-term losses and want to participate in the long-term growth of the financial markets.
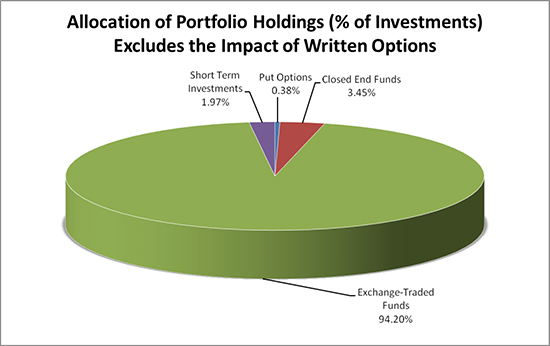
The percentages in the above graph are based on the portfolio holdings of the Fund as of November 30, 2018 and are subject to change. For a detailed break-out of holdings by investment type, please refer to the Schedules of Investments and Options Purchased.
WP Income Plus Fund
INVESTMENT HIGHLIGHTS
November 30, 2018 (Unaudited)
Average Annual Total Returns as of November 30, 2018 | | One Year ended November 30, 2018 | | Since Inception from January 4, 2016 through November 30, 2018 |
| WP Income Plus Fund Institutional Class shares | | (4.69)% | | 4.35% |
| S&P 500® Total Return Index | | 6.27% | | 13.79% |
| Markit iBoxx USD Liquid High Yield Index | | 0.89% | | 7.66% |
The performance information quoted in this annual report assumes the reinvestment of all dividend and capital gain distributions, if any, and represents past performance, which is not a guarantee of future results. The returns shown do not reflect taxes that a shareholder would pay on Fund distributions or on the redemption of Fund shares. The investment return and principal value of an investment will fluctuate and, therefore, an investor’s shares, when redeemed, may be worth more or less than their original cost. Updated performance data current to the most recent month-end can be obtained by calling 1-877-244-6235.
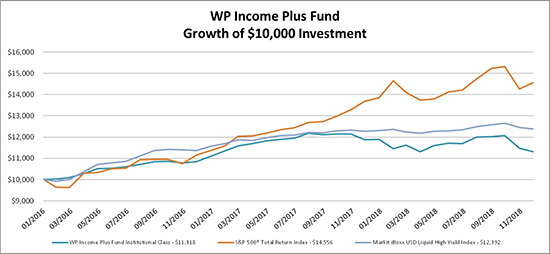
The above graph depicts the performance of the WP Income Plus Fund versus the S&P 500® Total Return Index and the Markit iBoxx USD Liquid High Yield Index. The S&P 500® Total Return Index is a broad unmanaged index of 500 stocks, which is widely recognized as representative of the equity market in general. The Markit iBoxx USD Liquid High Yield Index consists of liquid USD high yield bonds, selected to provide a balanced representation of the broad USD high yield corporate bond universe. Please note that indices do not take into account any fees and expenses of investing in the individual securities that they track and individuals cannot invest directly in any index.
As with any fund, save an index fund, that commonly compares its performance to the S&P 500® Total Return Index and the Markit iBoxx USD Liquid High Yield Index, such a comparison may be said to be inappropriate because of the dissimilarity between the Fund’s investments and the securities comprising the indexes; so too with the WP Income Plus Fund, which will generally not invest in all the securities comprising each index.
WP Large Cap Income Plus Fund
INVESTMENT HIGHLIGHTS
November 30, 2018 (Unaudited)
The investment objective of the WP Large Cap Income Plus Fund (the “Fund”) is total return. To meet its investment objective, the Fund will invest 80% of its total assets in large cap domestic equity securities and exchange-traded funds (“ETFs”) that primarily invest in large cap domestic equity securities. The Fund will seek income through dividends paid on such securities. The Fund will also seek to produce income (e.g., premium income on the sale of an option) and return stability through an options strategy.
Winning Points Advisers, LLC (the “Adviser”), the investment adviser to the Fund, intends to sell covered call options on a portion of the Fund’s stock holdings. The extent of option selling will depend on market conditions and the Adviser’s consideration of the advantages of selling call options on the Fund’s equity investments.
The Fund may also sell put options on stocks and ETFs the Adviser believes are attractive for purchase at prices at or above the exercise price of the put options sold. The Fund may, in certain circumstances, purchase put options on the S&P 500® Composite Stock Price Index (the “S&P 500”) and on individual stocks to protect against a loss of principal value due to stock price decline. The extent of option selling depends on market conditions and the Adviser’s judgment. The Fund may also seek to pursue its investment objective by selling a series of call and put option spread combinations on the S&P 500.
The Fund may be appropriate for investors with long-term horizons who are not sensitive to short-term losses and want to participate in the long-term growth of the financial markets. The Fund seeks to minimize the effects of inflation on its portfolio.
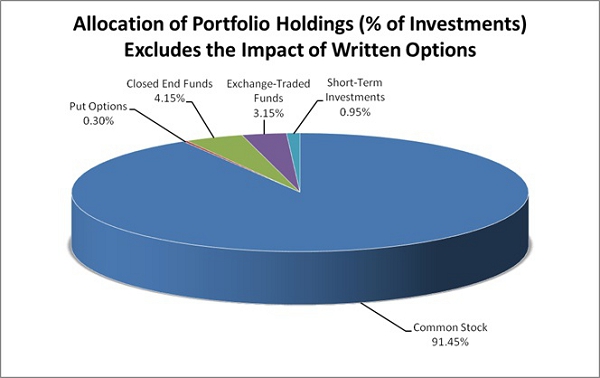
The percentages in the above graph are based on the portfolio holdings of the Fund as of November 30, 2018 and are subject to change. For a detailed break-out of holdings by investment type, please refer to the Schedules of Investments and Options Purchased.
WP Large Cap Income Plus Fund
INVESTMENT HIGHLIGHTS
November 30, 2018 (Unaudited)
Average Annual Total Returns as of November 30, 2018 | One Year ended November 30, 2018 | Since Inception from December 4, 2013 through November 30, 2018 |
| WP Large Cap Income Plus Fund Institutional Class shares | 2.11% | 7.24% |
| Dow Jones Industrial Average Total Return Index | 7.62% | 12.68% |
The performance information quoted in this annual report assumes the reinvestment of all dividend and capital gain distributions, if any, and represents past performance, which is not a guarantee of future results. The returns shown do not reflect taxes that a shareholder would pay on Fund distributions or on the redemption of Fund shares. The investment return and principal value of an investment will fluctuate and, therefore, an investor’s shares, when redeemed, may be worth more or less than their original cost. Updated performance data current to the most recent month-end can be obtained by calling 1-877-244-6235.
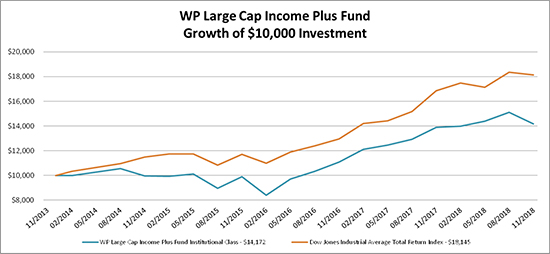
The above graph depicts the performance of the WP Large Cap Income Plus Fund versus the Dow Jones Industrial Average Total Return Index. The Dow Jones Industrial Total Return Average Index is a price-weighted average of 30 blue-chip stocks that are generally the leaders in their industry. Please note that indices do not take into account any fees and expenses of investing in the individual securities that they track and individuals cannot invest directly in any index.
As with any fund, save an index fund, that commonly compares its performance to the Dow Jones Industrial Average Total Return Index, such a comparison may be said to be inappropriate because of the dissimilarity between the Fund’s investments and the securities comprising the index; so too with the WP Large Cap Income Plus Fund, which will generally not invest in all the securities comprising the index.
| WP TRUST | |
| WP SMALLER COMPANIES INCOME PLUS FUND | |
| SCHEDULE OF INVESTMENTS | |
| November 30, 2018 | ANNUAL REPORT |
| | | Shares | | | Fair Value | |
| | | | | | | |
| COMMON STOCKS - 10.24% | | | | | | |
| | | | | | | |
| Healthcare - Services - 9.65% | | | | | | | | |
| Catasys, Inc. (a) (b) | | | 66,000 | | | $ | 772,860 | |
| | | | | | | | | |
| Pharmaceuticals - 0.08% | | | | | | | | |
| Titan Pharmaceuticals, Inc. (a) (b) | | | 20,000 | | | | 6,606 | |
| | | | | | | | | |
| Products - 0.51% | | | | | | | | |
| Alphatec Holdings, Inc. (a) (b) | | | 15,000 | | | | 40,650 | |
| | | | | | | | | |
| TOTAL COMMON STOCKS (Cost $417,014) | | | | | | | 820,116 | |
| | | | | | | | | |
| EXCHANGE-TRADED FUND - 100.01% | | | | | | | | |
| | | | | | | | | |
| Equity Fund - 100.01% | | | | | | | | |
| iShares Russell 2000 ETF (a) | | | 52,500 | | | | 8,012,550 | |
| | | | | | | | | |
| TOTAL EXCHANGE-TRADED FUND (Cost $6,824,538) | | | | | | | 8,012,550 | |
| | | | | | | | | |
| OPTIONS PURCHASED (Cost $59,008) - 0.37% (c) | | | | | | | 29,375 | |
| | | | | | | | | |
| SHORT-TERM INVESTMENT - 3.13% | | | | | | | | |
| Federated Government Obligations Fund - Institutional Class, 2.08% (d) | | | 251,034 | | | | 251,034 | |
| TOTAL SHORT-TERM INVESTMENT (Cost $251,034) | | | | | | | 251,034 | |
| | | | | | | | | |
| TOTAL INVESTMENTS (Cost $7,551,594) – 113.75% | | | | | | $ | 9,113,075 | |
| | | | | | | | | |
| OPTIONS WRITTEN (Proceeds $881,453) - (14.67%) (e) | | | | | | | (1,175,120 | ) |
| | | | | | | | | |
| OTHER ASSETS IN EXCESS OF LIABILITIES, NET - 0.92% | | | | | | | 73,882 | |
| | | | | | | | | |
| NET ASSETS - 100% | | | | | | $ | 8,011,837 | |
| (a) | All or a portion of the security is segregated as collateral for options written. |
| (b) | Non-income producing security. |
| (c) | Please refer to the Schedule of Options Purchased for details of options purchased. |
| (d) | Rate shown represents the 7-day effective yield at November 30, 2018, is subject to change and resets daily. |
| (e) | Please refer to the Schedule of Options Written for details of options written. |
The accompanying notes are an integral part of these financial statements.
| WP TRUST | |
| WP SMALLER COMPANIES INCOME PLUS FUND | |
| SCHEDULE OF OPTIONS PURCHASED | |
| November 30, 2018 | ANNUAL REPORT |
OPTIONS PURCHASED - 0.37%
| PUT OPTIONS PURCHASED - 0.37% | | | | | Notional | | | Exercise | | | | | | | |
| | | Contracts1 | | | Amount | | | Price | | | Expiration | | | Fair Value | |
| | | | | | | | | | | | | | | | |
| CBOE S&P 500 Index | | | 94 | | | $ | 21,150,000 | | | $ | 2,250.00 | | | | 12/28/2018 | | | $ | 9,400 | |
| CBOE S&P 500 Index | | | 94 | | | $ | 19,975,000 | | | $ | 2,125.00 | | | | 1/25/2019 | | | | 19,975 | |
| TOTAL PUT OPTIONS PURCHASED (Cost $59,008) | | | | | | | | | | | | | | | | | | | 29,375 | |
| | | | | | | | | | | | | | | | | | | | | |
| TOTAL OPTIONS PURCHASED (Cost $59,008) | | | | | | | | | | | | | | | | | | $ | 29,375 | |
| 1 | Each option contract is equivalent to 100 units of the underlying Index. |
All options are non-income producing.
The accompanying notes are an integral part of these financial statements.
| WP TRUST | |
| WP SMALLER COMPANIES INCOME PLUS FUND | |
| SCHEDULE OF OPTIONS WRITTEN | |
| November 30, 2018 | ANNUAL REPORT |
OPTIONS WRITTEN - (14.67)%
| | | | | | Notional | | | Exercise | | | | | | | |
| CALL OPTIONS WRITTEN - (2.04)% | | Contracts1 | | | Amount | | | Price | | | Expiration | | | Fair Value | |
| | | | | | | | | | | | | | | | |
| CBOE S&P 500 Index | | | 11 | | | $ | 3,382,500 | | | $ | 3,075.00 | | | | 12/18/2020 | | | $ | 163,680 | |
| TOTAL CALL OPTIONS WRITTEN (Proceeds $253,503) | | | | | | | | | | | | | | | | | | | 163,680 | |
| | | | | | | | | | | | | | | | | | | | | |
| PUT OPTIONS WRITTEN - (12.63)% | | | | | | | | | | | | | | | | | | | | |
| CBOE S&P 500 Index | | | 94 | | | $ | 23,500,000 | | | $ | 2,500.00 | | | | 12/20/2019 | | | | 1,011,440 | |
| TOTAL PUT OPTIONS WRITTEN (Proceeds $627,950) | | | | | | | | | | | | | | | | | | | 1,011,440 | |
| | | | | | | | | | | | | | | | | | | | | |
| TOTAL OPTIONS WRITTEN (Proceeds $881,453) | | | | | | | | | | | | | | | | | | $ | 1,175,120 | |
| 1 | Each option contract is equivalent to 100 units of the underlying Index. |
All options are non-income producing.
The accompanying notes are an integral part of these financial statements.
| WP TRUST | |
| WP INTERNATIONAL COMPANIES INCOME PLUS FUND | |
| SCHEDULE OF INVESTMENTS | |
| November 30, 2018 | ANNUAL REPORT |
| | | | | | | |
| EXCHANGE-TRADED FUNDS- 112.97% | | Shares | | | Fair Value | |
| | | | | | | |
| Equity Funds - 112.97% | | | | | | | | |
| iShares MSCI EAFE ETF (a) | | | 148,500 | | | $ | 9,321,345 | |
| WisdomTree Emerging Markets SmallCap Dividend Fund (a) | | | 9,850 | | | | 426,308 | |
| WisdomTree International SmallCap Dividend Fund (a) | | | 6,216 | | | | 404,972 | |
| | | | | | | | 10,152,625 | |
| | | | | | | | | |
| TOTAL EXCHANGE-TRADED FUNDS (Cost $9,819,039) | | | | | | | 10,152,625 | |
| | | | | | | | | |
| OPTIONS PURCHASED (Cost $69,051) - 0.38% (b) | | | | | | | 34,375 | |
| | | | | | | | | |
| SHORT-TERM INVESTMENT - 1.38% | | | | | | | | |
| Federated Government Obligations Fund - Institutional Class, 2.08% (c) | | | 124,198 | | | | 124,198 | |
| TOTAL SHORT-TERM INVESTMENT (Cost $124,198) | | | | | | | 124,198 | |
| | | | | | | | | |
| TOTAL INVESTMENTS (Cost $10,012,288) – 114.73% | | | | | | $ | 10,311,198 | |
| | | | | | | | | |
| OPTIONS WRITTEN (Proceeds $1,150,192) - (16.15%) (d) | | | | | | | (1,451,440 | ) |
| | | | | | | | | |
| OTHER ASSETS IN EXCESS OF LIABILITIES, NET - 1.42% | | | | | | | 127,731 | |
| | | | | | | | | |
| NET ASSETS - 100% | | | | | | $ | 8,987,489 | |
| (a) | All or a portion of the security is segregated as collateral for options written. |
| (b) | Please refer to the Schedule of Options Purchased for details of options purchased. |
| (c) | Rate shown represents the 7-day effective yield at November 30, 2018, is subject to change and resets daily. |
| (d) | Please refer to the Schedule of Options Written for details of options written. |
The accompanying notes are an integral part of these financial statements.
| WP TRUST | |
| WP INTERNATIONAL COMPANIES INCOME PLUS FUND | |
| SCHEDULE OF OPTIONS PURCHASED | |
| November 30, 2018 | ANNUAL REPORT |
| | | | | | | | | | | | | | | | |
| OPTIONS PURCHASED - 0.38% | | | | | | | | | | | | | | | |
| | | | | | Notional | | | Exercise | | | | | | | |
| PUT OPTIONS PURCHASED - 0.38% | | Contracts1 | | | Amount | | | Price | | | Expiration | | | Fair Value | |
| | | | | | | | | | | | | | | | |
| CBOE S&P 500 Index | | | 110 | | | $ | 24,750,000 | | | $ | 2,250.00 | | | | 12/28/2018 | | | $ | 11,000 | |
| CBOE S&P 500 Index | | | 110 | | | $ | 23,375,000 | | | $ | 2,125.00 | | | | 1/25/2019 | | | | 23,375 | |
| TOTAL PUT OPTIONS PURCHASED (Cost $69,051) | | | | | | | | | | | | | | | | | | | 34,375 | |
| | | | | | | | | | | | | | | | | | | | | |
| TOTAL OPTIONS PURCHASED (Cost $69,051) | | | | | | | | | | | | | | | | | | $ | 34,375 | |
| 1 | Each option contract is equivalent to 100 units of the underlying Index. |
All options are non-income producing.
The accompanying notes are an integral part of these financial statements.
| WP TRUST | |
| WP INTERNATIONAL COMPANIES INCOME PLUS FUND | |
| SCHEDULE OF OPTIONS WRITTEN | |
| November 30, 2018 | ANNUAL REPORT |
| OPTIONS WRITTEN - (16.15)% | | | | | | | | | | | | | | | |
| | | | | | Notional | | | Exercise | | | | | | | |
| CALL OPTIONS WRITTEN - (2.98)% | | Contracts1 | | | Amount | | | Price | | | Expiration | | | Fair Value | |
| | | | | | | | | | | | | | | | |
| CBOE S&P 500 Index | | | 18 | | | $ | 5,535,000 | | | $ | 3,075.00 | | | | 12/18/2020 | | | | 267,840 | |
| TOTAL CALL OPTIONS WRITTEN (Proceeds $414,824) | | | | | | | | | | | | | | | | | | | 267,840 | |
| | | | | | | | | | | | | | | | | | | | | |
| PUT OPTIONS WRITTEN - (13.17)% | | | | | | | | | | | | | | | | | | | | |
| CBOE S&P 500 Index | | | 110 | | | $ | 27,500,000 | | | $ | 2,500.00 | | | | 12/20/2019 | | | | 1,183,600 | |
| TOTAL PUT OPTIONS WRITTEN (Proceeds $735,368) | | | | | | | | | | | | | | | | | | | 1,183,600 | |
| | | | | | | | | | | | | | | | | | | | | |
| TOTAL OPTIONS WRITTEN (Proceeds $1,150,192) | | | | | | | | | | | | | | | | | | $ | 1,451,440 | |
| 1 | Each option contract is equivalent to 100 units of the underlying Index. |
All options are non-income producing.
The accompanying notes are an integral part of these financial statements.
| WP TRUST | |
| WP INCOME PLUS FUND | |
| SCHEDULE OF INVESTMENTS | |
| November 30, 2018 | ANNUAL REPORT |
| | | | | | | |
| EXCHANGE-TRADED FUNDS - 109.72% | | Shares | | | Fair Value | |
| | | | | | | |
| Debt Fund - 109.72% | | | | | | | | |
| iShares iBoxx $ High Yield Corporate Bond ETF (a) | | | 127,400 | | | $ | 10,650,640 | |
| SPDR Bloomberg Barclays High Yield Bond ETF (a) | | | 181,000 | | | | 6,286,130 | |
| | | | | | | | 16,936,770 | |
| | | | | | | | | |
| TOTAL EXCHANGE-TRADED FUNDS (Cost $17,461,002) | | | | | | | 16,936,770 | |
| | | | | | | | | |
| CLOSED END FUND- 4.01% | | | | | | | | |
| | | | | | | | | |
| Closed End Fund - 4.01% | | | | | | | | |
| Alpine Total Dynamic Dividend Fund (a) | | | 76,400 | | | | 619,604 | |
| | | | | | | | | |
| TOTAL CLOSED END FUND (Cost $604,676) | | | | | | | 619,604 | |
| | | | | | | | | |
| OPTIONS PURCHASED (Cost $138,102) - 0.45% (b) | | | | | | | 68,750 | |
| | | | | | | | | |
| SHORT-TERM INVESTMENT - 2.29% | | | | | | | | |
| Federated Government Obligations Fund - Institutional Class, 2.08% (c) | | | 354,052 | | | | 354,052 | |
| TOTAL SHORT-TERM INVESTMENT (Cost $354,052) | | | | | | | 354,052 | |
| | | | | | | | | |
| TOTAL INVESTMENTS (Cost $18,557,832) – 116.47% | | | | | | $ | 17,979,176 | |
| | | | | | | | | |
| OPTIONS WRITTEN (Proceeds $2,027,601) - (16.15%) (d) | | | | | | | (2,492,900 | ) |
| | | | | | | | | |
| LIABILITIES IN EXCESS OF OTHER ASSETS, NET - (0.32)% | | | | | | | (49,300 | ) |
| | | | | | | | | |
| NET ASSETS - 100% | | | | | | $ | 15,436,976 | |
| (a) | All or a portion of the security is segregated as collateral for options written. |
| (b) | Please refer to the Schedule of Options Purchased for details of options purchased. |
| (c) | Rate shown represents the 7-day effective yield at November 30, 2018, is subject to change and resets daily. |
| (d) | Please refer to the Schedule of Options Written for details of options written. |
The accompanying notes are an integral part of these financial statements.
WP TRUST
WP INCOME PLUS FUND
SCHEDULE OF OPTIONS PURCHASED
| November 30, 2018 | ANNUAL REPORT |
| OPTIONS PURCHASED - 0.45% | | | | | | | | | | | | | | | |
| | | | | | Notional | | | Exercise | | | | | | | |
| PUT OPTIONS PURCHASED - 0.45% | | Contracts 1 | | | Amount | | | Price | | | Expiration | | | Fair Value | |
| | | | | | | | | | | | | | | | |
| CBOE S&P 500 Index | | | 220 | | | $ | 49,500,000 | | | $ | 2,250.00 | | | | 12/28/2018 | | | $ | 46,750 | |
| CBOE S&P 500 Index | | | 220 | | | $ | 46,750,000 | | | $ | 2,125.00 | | | | 1/25/2019 | | | | 22,000 | |
| TOTAL PUT OPTIONS PURCHASED (Cost $138,102) | | | | | | | | | | | | | | | | | | | 68,750 | |
| | | | | | | | | | | | | | | | | | | | | |
| TOTAL OPTIONS PURCHASED (Cost $138,102) | | | | | | | | | | | | | | | | | | $ | 68,750 | |
| 1 | Each option contract is equivalent to 100 units of the underlying Index. |
All options are non-income producing.
The accompanying notes are an integral part of these financial statements.
WP TRUST
WP INCOME PLUS FUND
SCHEDULE OF OPTIONS WRITTEN
| November 30, 2018 | ANNUAL REPORT |
| OPTIONS WRITTEN - (16.15)% | | | | | | | | | | | | | | | |
| | | | | | Notional | | | Exercise | | | | | | | |
| CALL OPTIONS WRITTEN - (3.32)% | | Contracts 1 | | | Amount | | | Price | | | Expiration | | | Fair Value | |
| | | | | | | | | | | | | | | | |
| CBOE S&P 500 Index | | | 10 | | | $ | 3,175,000 | | | $ | 3,175.00 | | | | 12/20/2019 | | | $ | 36,900 | |
| CBOE S&P 500 Index | | | 32 | | | $ | 9,840,000 | | | $ | 3,075.00 | | | | 12/18/2020 | | | | 476,160 | |
| TOTAL CALL OPTIONS WRITTEN (Proceeds $798,047) | | | | | | | | | | | | | | | | | | | 513,060 | |
| | | | | | | | | | | | | | | | | | | | | |
| PUT OPTIONS WRITTEN - (12.83)% | | | | | | | | | | | | | | | | | | | | |
| CBOE S&P 500 Index | | | 184 | | | $ | 46,000,000 | | | $ | 2,500.00 | | | | 12/20/2019 | | | | 1,979,840 | |
| TOTAL PUT OPTIONS WRITTEN (Proceeds $1,229,554) | | | | | | | | | | | | | | | | | | | 1,979,840 | |
| | | | | | | | | | | | | | | | | | | | | |
| TOTAL OPTIONS WRITTEN (Proceeds $2,027,601) | | | | | | | | | | | | | | | | | | $ | 2,492,900 | |
| 1 | Each option contract is equivalent to 100 units of the underlying Index. |
All options are non-income producing.
The accompanying notes are an integral part of these financial statements.
WP TRUST
WP LARGE CAP INCOME PLUS FUND
SCHEDULE OF INVESTMENTS
| November 30, 2018 | ANNUAL REPORT |
| COMMON STOCKS - 105.28% | | Shares | | | Fair Value | |
| | | | | | | |
| Aerospace & Defense - 3.64% | | | | | | | | |
| Lockheed Martin Corp. (b) | | | 4,200 | | | $ | 1,261,806 | |
| | | | | | | | | |
| Agriculture - 2.84% | | | | | | | | |
| Altria Group, Inc. (b) | | | 15,400 | | | | 844,382 | |
| Archer-Daniels-Midland Co. (b) | | | 3,000 | | | | 138,060 | |
| | | | | | | | 982,442 | |
| Banks - 22.81% | | | | | | | | |
| Bank of America Corp. (b) | | | 69,000 | | | | 1,959,600 | |
| BB&T Corp. (b) | | | 4,900 | | | | 250,390 | |
| Citigroup, Inc. (b) | | | 21,000 | | | | 1,360,590 | |
| Goldman Sachs Group, Inc. (b) | | | 2,600 | | | | 495,794 | |
| JPMorgan Chase & Co. (b) | | | 17,200 | | | | 1,912,468 | |
| Lloyds Banking Group PLC - ADR (b) | | | 58,000 | | | | 164,140 | |
| PNC Financial Services Group, Inc. (b) | | | 2,300 | | | | 312,294 | |
| Wells Fargo & Co. (b) | | | 26,600 | | | | 1,443,848 | |
| | | | | | | | 7,899,124 | |
| Beverages - 4.92% | | | | | | | | |
| Diageo PLC - ADR (b) | | | 5,800 | | | | 837,230 | |
| PepsiCo, Inc. (b) | | | 7,100 | | | | 865,774 | |
| | | | | | | | 1,703,004 | |
| Biotechnology - 0.50% | | | | | | | | |
| Biogen, Inc. (a) (b) | | | 300 | | | | 100,116 | |
| Gilead Sciences, Inc. (b) | | | 1,000 | | | | 71,940 | |
| | | | | | | | 172,056 | |
| Building Materials - 0.20% | | | | | | | | |
| Johnson Controls International PLC (b) | | | 2,000 | | | | 69,560 | |
| | | | | | | | | |
| Computers - 7.22% | | | | | | | | |
| Apple, Inc. (b) | | | 10,500 | | | | 1,875,090 | |
| International Business Machines Corp. (b) | | | 4,700 | | | | 584,069 | |
| Leidos Holdings, Inc. (b) | | | 665 | | | | 41,895 | |
| | | | | | | | 2,501,054 | |
| Diversified Financial Services - 3.83% | | | | | | | | |
| BlackRock, Inc. (b) | | | 3,100 | | | | 1,326,831 | |
| | | | | | | | | |
| Food - 3.52% | | | | | | | | |
| Sysco Corp. (b) | | | 18,100 | | | | 1,219,940 | |
| | | | | | | | | |
| Healthcare - Products - 1.80% | | | | | | | | |
| Baxter International, Inc. (b) | | | 9,100 | | | | 623,805 | |
| | | | | | | | | |
| Healthcare - Services - 3.81% | | | | | | | | |
| Catasys, Inc. (a) (b) | | | 112,600 | | | | 1,318,546 | |
| | | | | | | | | |
| Insurance - 4.44% | | | | | | | | |
| Allianz SE - ADR (b) | | | 1,400 | | | | 29,582 | |
| Berkshire Hathaway, Inc. - Class B (a) (b) | | | 6,900 | | | | 1,505,856 | |
| | | | | | | | 1,535,438 | |
| Internet - 0.78% | | | | | | | | |
| Alibaba Group Holding Ltd. - ADR (a) (b) | | | 800 | | | | 128,688 | |
| Facebook, Inc. - Class A (a) (b) | | | 1,000 | | | | 140,610 | |
| | | | | | | | 269,298 | |
| Investment Companies - 0.19% | | | | | | | | |
| Ares Capital Corp. (b) | | | 2,300 | | | | 39,192 | |
| BlackRock Capital Investment Corp. (b) | | | 4,500 | | | | 26,370 | |
| | | | | | | | 65,562 | |
WP TRUST
WP LARGE CAP INCOME PLUS FUND
SCHEDULE OF INVESTMENTS
| November 30, 2018 | ANNUAL REPORT |
| COMMON STOCKS - 105.28% (Continued) | | Shares | | | Fair Value | |
| | | | | | | |
| Lodging - 0.39% | | | | | | | | |
| MGM Resorts International (b) | | | 5,000 | | | $ | 134,800 | |
| | | | | | | | | |
| Media - 1.13% | | | | | | | | |
| Comcast Corp. - Class A (b) | | | 10,000 | | | | 390,100 | |
| | | | | | | | | |
| Miscellaneous Manufacturing - 0.15% | | | | | | | | |
| General Electric Co. (b) | | | 7,000 | | | | 52,500 | |
| | | | | | | | | |
| Oil & Gas - 16.66% | | | | | | | | |
| BP PLC - ADR (b) | | | 36,200 | | | | 1,460,670 | |
| Chevron Corp. (b) | | | 8,900 | | | | 1,058,566 | |
| China Petroleum & Chemical Corp. - ADR (b) | | | 5,500 | | | | 469,370 | |
| ConocoPhillips (b) | | | 18,000 | | | | 1,191,240 | |
| Exxon Mobil Corp. (b) | | | 20,000 | | | | 1,590,000 | |
| | | | | | | | 5,769,846 | |
| Pharmaceuticals - 1.01% | | | | | | | | |
| AstraZeneca PLC - ADR (b) | | | 2,800 | | | | 111,496 | |
| Pfizer, Inc. (b) | | | 5,000 | | | | 231,150 | |
| Titan Pharmaceuticals, Inc. (a) (b) | | | 22,000 | | | | 7,267 | |
| | | | | | | | 349,913 | |
| Retail - 10.79% | | | | | | | | |
| McDonald’s Corp. (b) | | | 10,800 | | | | 2,035,908 | |
| Target Corp. (b) | | | 8,800 | | | | 624,448 | |
| Walmart, Inc. (b) | | | 11,000 | | | | 1,074,150 | |
| | | | | | | | 3,734,506 | |
| Semiconductors - 4.75% | | | | | | | | |
| Intel Corp. (b) | | | 32,000 | | | | 1,577,920 | |
| Skyworks Solutions, Inc. (b) | | | 900 | | | | 65,493 | |
| | | | | | | | 1,643,413 | |
| Software - 7.33% | | | | | | | | |
| Microsoft Corp. (b) | | | 22,900 | | | | 2,539,381 | |
| | | | | | | | | |
| Telecommunications - 2.57% | | | | | | | | |
| China Mobile Ltd. - ADR (b) | | | 17,900 | | | | 890,346 | |
| | | | | | | | | |
| | | | | | | | | |
| TOTAL COMMON STOCKS (Cost $26,963,090) | | | | | | | 36,453,271 | |
| | | | | | | | | |
| CLOSED-END FUNDS - 4.78% | | | | | | | | |
| Aberdeen Emerging Markets Equity, Income Fund, Inc. (b) | | | 3,363 | | | | 22,532 | |
| Aberdeen Total Dynamic Dividend Fund (b) | | | 30,000 | | | | 243,300 | |
| Boulder Growth & Income Fund, Inc. (b) | | | 97,000 | | | | 1,075,730 | |
| Special Opportunities Fund, Inc. (b) | | | 22,185 | | | | 313,474 | |
| | | | | | | | | |
| TOTAL CLOSED-END FUNDS (Cost $1,343,780) | | | | | | | 1,655,036 | |
| | | | | | | | | |
| EXCHANGE-TRADED FUNDS - 3.63% | | | | | | | | |
| | | | | | | | | |
| Equity Funds - 3.63% | | | | | | | | |
| iShares MSCI EAFE ETF (b) | | | 10,200 | | | | 640,254 | |
| iShares U.S. Financial Services ETF (b) | | | 4,800 | | | | 617,040 | |
| | | | | | | | 1,257,294 | |
| | | | | | | | | |
| TOTAL EXCHANGE-TRADED FUNDS (Cost $1,041,345) | | | | | | | 1,257,294 | |
WP TRUST
WP LARGE CAP INCOME PLUS FUND
SCHEDULE OF INVESTMENTS
| November 30, 2018 | ANNUAL REPORT |
| | | Shares | | | Fair Value | |
| | | | | | | |
| OPTIONS PURCHASED (Cost $242,106) - 0.35% (c) | | | | | | $ | 120,625 | |
| | | | | | | | | |
| SHORT-TERM INVESTMENT - 1.09% | | | | | | | | |
| Federated Government Obligations Fund - Institutional Shares, 2.08% (d) | | | 376,615 | | | | 376,615 | |
| TOTAL SHORT-TERM INVESTMENT (Cost $376,615) | | | | | | | 376,615 | |
| | | | | | | | | |
| TOTAL INVESTMENTS (Cost $29,966,936) – 115.13% | | | | | | $ | 39,862,841 | |
| | | | | | | | | |
| OPTIONS WRITTEN (Proceeds $5,194,224) - (16.67)% (e) | | | | | | | (5,771,340 | ) |
| | | | | | | | | |
| OTHER ASSETS IN EXCESS OF LIABILITIES, NET - 1.54% | | | | | | | 534,391 | |
| | | | | | | | | |
| NET ASSETS - 100% | | | | | | $ | 34,625,892 | |
| (a) | Non-income producing security. |
| (b) | All or a portion of the security is segregated as collateral for options written. |
| (c) | Please refer to the Schedule of Options Purchased for details of options purchased. |
| (d) | Rate shown represents the 7-day effective yield at November 30, 2018, is subject to change and resets daily. |
| (e) | Please refer to the Schedule of Options Written for details of options written. |
ADR - American Depositary Receipt.
ETF - Exchange-Traded Fund
PLC - Public Limited Company
The accompanying notes are an integral part of these financial statements.
WP TRUST
WP LARGE CAP INCOME PLUS FUND
SCHEDULE OF OPTIONS PURCHASED
| November 30, 2018 | ANNUAL REPORT |
| OPTIONS PURCHASED - 0.35% | | | | | | | | | | | | | | | |
| | | | | | | | | | | | | | | | |
| PUT OPTIONS PURCHASED - 0.35% | | | | | Notional | | | Exercise | | | | | | | |
| | | Contracts 1 | | | Amount | | | Price | | | Expiration | | | Fair Value | |
| | | | | | | | | | | | | | | | |
| CBOE S&P 500 Index | | | 386 | | | $ | 86,850,000 | | | $ | 2,250.00 | | | | 12/28/2018 | | | $ | 38,600 | |
| CBOE S&P 500 Index | | | 386 | | | $ | 82,025,000 | | | $ | 2,125.00 | | | | 1/25/2019 | | | | 82,025 | |
| TOTAL PUT OPTIONS PURCHASED (Cost $242,106) | | | | | | | | | | | | | | | | | | | 120,625 | |
| | | | | | | | | | | | | | | | | | | | | |
| TOTAL OPTIONS PURCHASED (Cost $242,106) | | | | | | | | | | | | | | | | | | $ | 120,625 | |
| 1 | Each option contract is equivalent to 100 units of the underlying index. |
All options are non-income producing.
The accompanying notes are an integral part of these financial statements.
WP TRUST
WP LARGE CAP INCOME PLUS FUND
SCHEDULE OF OPTIONS WRITTEN
| November 30, 2018 | ANNUAL REPORT |
| OPTIONS WRITTEN - (16.67)% | | | | | | | | | | | | | | | |
| | | | | | | | | | | | | | | | |
| CALL OPTIONS WRITTEN - (4.67)% | | | | | Notional | | | Exercise | | | | | | | |
| | | Contracts 1 | | | Amount | | | Price | | | Expiration | | | Fair Value | |
| | | | | | | | | | | | | | | | |
| CBOE S&P 500 Index | | | 1 | | | $ | 307,500 | | | $ | 3,075.00 | | | | 12/18/2020 | | | $ | 14,880 | |
| CBOE S&P 500 Index | | | 115 | | | $ | 35,650,000 | | | $ | 3,100.00 | | | | 12/18/2020 | | | | 1,603,100 | |
| | | | | | | | | | | | | | | | | | | | | |
| TOTAL CALL OPTIONS WRITTEN (Proceeds $2,501,020) | | | | | | | | | | | | | | �� | | | | | 1,617,980 | |
| PUT OPTIONS WRITTEN - (12.00%) | | | | | | | | | | | | | | | |
| | | | | | | | | | | | | | | | |
| CBOE S&P 500 Index | | | 386 | | | $ | 96,500,000 | | | $ | 2,500.00 | | | | 12/20/2019 | | | | 4,153,360 | |
| | | | | | | | | | | | | | | | | | | | | |
| TOTAL PUT OPTIONS WRITTEN (Proceeds $2,693,204) | | | | | | | | | | | | | | | | | | | 4,153,360 | |
| | | | | | | | | | | | | | | | | | | | | |
| TOTAL OPTIONS WRITTEN (Proceeds $5,194,224) | | | | | | | | | | | | | | | | | | $ | 5,771,340 | |
| 1 | Each option contract is equivalent to 100 units of the underlying index. |
All options are non-income producing.
The accompanying notes are an integral part of these financial statements.
| WP TRUST | |
| | |
| STATEMENTS OF ASSETS AND LIABILITIES | |
| | |
| November 30, 2018 | ANNUAL REPORT |
| | | WP Smaller Companies
Income Plus Fund | | | WP International Companies
Income Plus Fund | | | WP Income Plus Fund | | | WP Large Cap
Income Plus Fund | |
| Assets: | | | | | | | | | | | | |
| Investments, at cost | | $ | 7,551,594 | | | $ | 10,012,288 | | | $ | 18,557,832 | | | $ | 29,966,936 | |
| Investments, at value | | | 9,113,075 | | | | 10,311,198 | | | | 17,979,176 | | | | 39,862,841 | |
| Deposits at broker for written options | | | 107,690 | | | | 161,872 | | | | 79 | | | | 491,400 | |
| Expense reimbursement due from administrator | | | — | | | | — | | | | 4,792 | | | | — | |
| Receivables: | | | | | | | | | | | | | | | | |
| Interest | | | 457 | | | | 257 | | | | 552 | | | | 570 | |
| Dividends | | | — | | | | — | | | | — | | | | 129,132 | |
| Prepaid expenses | | | 3,153 | | | | 3,509 | | | | 3,153 | | | | 7,393 | |
| Total assets | | | 9,224,375 | | | | 10,476,836 | | | | 17,987,752 | | | | 40,491,336 | |
| | | | | | | | | | | | | | | | | |
| Liabilities: | | | | | | | | | | | | | | | | |
| Options written, at proceeds | | $ | 881,453 | | | $ | 1,150,192 | | | $ | 2,027,601 | | | $ | 5,194,224 | |
| Options written, at value | | | 1,175,120 | | | | 1,451,440 | | | | 2,492,900 | | | | 5,771,340 | |
| Payables: | | | | | | | | | | | | | | | | |
| Fund shares redeemed | | | — | | | | — | | | | 8,300 | | | | 8,000 | |
| Due to adviser, net | | | 6,428 | | | | 7,113 | | | | 17,365 | | | | 37,953 | |
| Accrued distribution (12b-1) fees | | | 4,704 | | | | 3,631 | | | | 7,756 | | | | 15,453 | |
| Due to administrator | | | 5,284 | | | | 5,610 | | | | — | | | | 10,574 | |
| Accrued expenses | | | 21,002 | | | | 21,553 | | | | 24,455 | | | | 22,124 | |
| Total liabilities | | | 1,212,538 | | | | 1,489,347 | | | | 2,550,776 | | | | 5,865,444 | |
| Net Assets | | $ | 8,011,837 | | | $ | 8,987,489 | | | $ | 15,436,976 | | | $ | 34,625,892 | |
| | | | | | | | | | | | | | | | | |
| Sources of Net Assets: | | | | | | | | | | | | | | | | |
| Paid-in capital | | $ | 6,984,977 | | | | 8,970,090 | | | $ | 16,519,777 | | | $ | 26,016,053 | |
| Total distributable earnings | | | 1,026,860 | | | | 17,399 | | | | (1,082,801 | ) | | | 8,609,839 | |
Total Net Assets (Unlimited shares of beneficial
interest authorized) | | $ | 8,011,837 | | | $ | 8,987,489 | | | $ | 15,436,976 | | | $ | 34,625,892 | |
| | | | | | | | | | | | | | | | | |
| | | | | | | | | | | | | | | | | |
| Institutional Class Shares: | | | | | | | | | | | | | | | | |
| Net assets | | $ | 8,011,837 | | | $ | 8,987,489 | | | $ | 15,436,976 | | | $ | 34,625,892 | |
Shares Outstanding (Unlimited shares of beneficial
interest authorized) | | | 601,757 | | | | 822,506 | | | | 1,535,192 | | | | 2,515,002 | |
| Net Asset Value, Offering and Redemption Price Per Share | | $ | 13.31 | | | $ | 10.93 | | | $ | 10.06 | | | $ | 13.77 | |
The accompanying notes are an integral part of these financial statements.
| WP TRUST | |
| | |
| STATEMENTS OF OPERATIONS | |
| | |
| November 30, 2018 | ANNUAL REPORT |
| | | | | | | | | | | | | |
| | | WP Smaller Companies
Income Plus Fund | | | WP International Companies
Income Plus Fund | | | WP Income
Plus Fund | | | WP Large Cap
Income Plus Fund | |
| | | For the | | | For the | | | For the | | | For the | | | For the | |
| | | Year Ended | | | Year Ended | | | Year Ended | | | Period Ended | | | Year Ended | |
| | | November 30, 2018 | | | November 30, 2018 | | | November 30, 2018 | | | November 30, 2018(a) | | | August 31, 2018 | |
| | | | | | | | | | | | | | | | | | | | | |
| Investment income: | | | | | | | | | | | | | | | | | | | | |
| Dividends (net of foreign withholding taxes of $0, $0, $0, $328 and $6,283, respectively) | | $ | 84,722 | | | $ | 298,029 | | | $ | 911,385 | | | $ | 258,399 | | | $ | 929,751 | |
| Interest | | | 6,159 | | | | 5,000 | | | | 4,306 | | | | 3,582 | | | | 7,470 | |
| Total investment income | | | 90,881 | | | | 303,029 | | | | 915,691 | | | | 261,981 | | | | 937,221 | |
| | | | | | | | | | | | | | | | | | | | | |
| Expenses: | | | | | | | | | | | | | | | | | | | | |
| Management fees (Note 5) | | | 96,470 | | | | 126,705 | | | | 206,174 | | | | 119,560 | | | | 450,919 | |
| Distribution (12b-1) fees - Institutional Class | | | 17,865 | | | | 23,464 | | | | 38,180 | | | | 22,141 | | | | 83,504 | |
| Accounting and transfer agent fees and expenses | | | 35,970 | | | | 42,415 | | | | 57,746 | | | | 32,926 | | | | 130,235 | |
| Audit fees | | | 15,250 | | | | 15,250 | | | | 15,250 | | | | 7,700 | | | | 16,440 | |
| Legal fees | | | 16,272 | | | | 16,789 | | | | 15,758 | | | | 2,910 | | | | 58,507 | |
| Interest expense (b) | | | 28,690 | | | | 38,910 | | | | 68,030 | | | | 42,114 | | | | 110,886 | |
| Trustee fees and expenses | | | 14,199 | | | | 14,199 | | | | 14,199 | | | | 2,561 | | | | 17,065 | |
| Custodian fees | | | 10,348 | | | | 10,349 | | | | 10,349 | | | | 3,235 | | | | 15,780 | |
| Miscellaneous | | | 6,968 | | | | 6,999 | | | | 7,090 | | | | 6,603 | | | | 13,203 | |
| Registration and filing fees | | | 2,767 | | | | 3,208 | | | | 3,252 | | | | 635 | | | | 3,940 | |
| Pricing fees | | | 872 | | | | 876 | | | | 769 | | | | 2,134 | | | | 7,627 | |
| Insurance | | | 1,928 | | | | 1,928 | | | | 1,928 | | | | 584 | | | | 2,046 | |
| Reports to shareholders | | | — | | | | — | | | | — | | | | 67 | | | | 304 | |
| Compliance officer fees | | | 22,000 | | | | 22,000 | | | | 15,228 | | | | — | | | | — | |
| Total expenses | | | 269,599 | | | | 323,092 | | | | 453,953 | | | | 243,170 | | | | 910,456 | |
| Less: fees waived | | | (44,420 | ) | | | (27,465 | ) | | | — | | | | — | | | | — | |
| Net expenses | | | 225,179 | | | | 295,627 | | | | 453,953 | | | | 243,170 | | | | 910,456 | |
| | | | | | | | | | | | | | | | | | | | | |
| Net investment income (loss) | | | (134,298 | ) | | | 7,402 | | | | 461,738 | | | | 18,811 | | | | 26,765 | |
| | | | | | | | | | | | | | | | | | | | | |
| Realized and unrealized gain (loss): | | | | | | | | | | | | | | | | | | | | |
| Net realized gain (loss) on: | | | | | | | | | | | | | | | | | | | | |
| Investments | | | — | | | | — | | | | (11,597 | ) | | | (18,325 | ) | | | (591,554 | ) |
| Long-term capital gains distributions from other investment companies | | | — | | | | — | | | | — | | | | 16,730 | | | | 49,590 | |
| Options purchased | | | (126,993 | ) | | | (163,979 | ) | | | (336,362 | ) | | | (235,488 | ) | | | (472,364 | ) |
| Options written | | | 199,179 | | | | 226,129 | | | | 318,788 | | | | 282,542 | | | | 318,566 | |
| Net realized gain (loss) on investments and options | | | 72,186 | | | | 62,150 | | | | (29,171 | ) | | | 45,459 | | | | (695,762 | ) |
| | | | | | | | | | | | | | | | | | | | | |
| Net change in unrealized appreciation (depreciation) on: | | | | | | | | | | | | | | | | | | | | |
| Investments | | | 306,718 | | | | (1,139,208 | ) | | | (955,585 | ) | | | (1,682,321 | ) | | | 5,860,047 | |
| Options purchased | | | (30,247 | ) | | | (35,705 | ) | | | (71,460 | ) | | | (13,023 | ) | | | (68,586 | ) |
| Options written | | | (187,480 | ) | | | (130,440 | ) | | | (165,144 | ) | | | (688,251 | ) | | | 85,533 | |
| Net change in unrealized appreciation (depreciation) on investments and options | | | 88,991 | | | | (1,305,353 | ) | | | (1,192,189 | ) | | | (2,383,595 | ) | | | 5,876,994 | |
| | | | | | | | | | | | | | | | | | | | | |
| Net gain (loss) on investments and options | | | 161,177 | | | | (1,243,203 | ) | | | (1,221,360 | ) | | | (2,338,136 | ) | | | 5,181,232 | |
| | | | | | | | | | | | | | | | | | | | | |
| Net increase (decrease) in net assets resulting from operations | | $ | 26,879 | | | $ | (1,235,801 | ) | | $ | (759,622 | ) | | $ | (2,319,325 | ) | | $ | 5,207,997 | |
| (a) | Represents the period from September 1, 2018 through November 30, 2018. The WP Large Cap Income Plus Fund changed its fiscal year end from August 31 to November 30. |
| (b) | Interest expense is incurred with respect to the Funds’ options investment strategy. |
The accompanying notes are an integral part of these financial statements.
| WP TRUST | |
| | |
| STATEMENTS OF CASH FLOWS | |
| | |
| November 30, 2018 | ANNUAL REPORT |
| | | WP Smaller Companies
Income Plus Fund | | WP International Companies
Income Plus Fund | | WP Income
Plus Fund | | WP Large Cap
Income Plus Fund | |
| | | For the | | For the | | For the | | For the | | For the | |
| | | Year Ended | | Year Ended | | Year Ended | | Period Ended | | Year Ended | |
| | | November 30, 2018 | | November 30, 2018 | | November 30, 2018 | | November 30, 2018(a) | | August 31, 2018 | |
| | | | | | | | | | | | | | | | | |
| Increase (decrease) in cash: | | | | | | | | | | | | | | | | |
| Cash flows from operating activities: | | | | | | | | | | | | | | | | |
| Net increase (decrease) in net assets from operations | | $ | 26,879 | | $ | (1,235,801 | ) | $ | (759,622 | ) | $ | (2,319,325 | ) | $ | 5,207,997 | |
| Adjustments to reconcile net increase (decrease) in net assets from operations to net cash used in operating activities: | | | | | | | | | | | | | | | | |
| Purchase of investments and options | | | (3,368,935 | ) | | (2,800,392 | ) | | (4,900,117 | ) | | (2,366,582 | ) | | (7,309,489 | ) |
| Proceeds from disposition of investments and options | | | 598,246 | | | 871,837 | | | 1,837,879 | | | 1,047,744 | | | 3,709,280 | |
| Purchases/sales of short-term investment securities, net | | | 29,797 | | | 202,299 | | | (39,257 | ) | | (180,057 | ) | | 186,607 | |
| Increase (decrease) in deposits with brokers for options written | | | (5,219 | ) | | 26,563 | | | 166,872 | | | (187,602 | ) | | (303,798 | ) |
| Increase (decrease) in dividends and interest receivable | | | (262 | ) | | (14 | ) | | (325 | ) | | (1,276 | ) | | 27,417 | |
| Increase in prepaid expenses | | | 574 | | | 217 | | | 602 | | | (2,659 | ) | | 64 | |
| Premiums received from options written | | | 6,601,093 | | | 9,600,103 | | | 16,184,055 | | | 8,048,831 | | | 39,538,126 | |
| Payments to cover options written | | | (6,090,803 | ) | | (9,169,034 | ) | | (15,436,800 | ) | | (6,877,370 | ) | | (37,282,722 | ) |
| Increase in accrued distribution (12b-1) fees | | | 2,724 | | | 1,502 | | | 3,064 | | | 949 | | | 6,536 | |
| Increase in expense reimbursement due from administrator | | | — | | | — | | | (4,792 | ) | | — | | | — | |
| Decrease in accrued expenses | | | 10,864 | | | 5,583 | | | 9,279 | | | (12,581 | ) | | 13,743 | |
| Increase in due to broker | | | — | | | — | | | — | | | — | | | (47,034 | ) |
| Net unrealized appreciation (depreciation) on investments and options | | | (88,991 | ) | | 1,305,353 | | | 1,192,189 | | | 2,383,595 | | | (5,876,994 | ) |
| Net realized gain (loss) on investments and options | | | (72,186 | ) | | (62,150 | ) | | 29,171 | | | (28,746 | ) | | 741,176 | |
| Net cash used in operating activities | | | (2,356,219 | ) | | (1,253,934 | ) | | (1,717,802 | ) | | (495,079 | ) | | (1,389,091 | ) |
| | | | | | | | | | | | | | | | | |
| Cash flows from financing activities: | | | | | | | | | | | | | | | | |
| Proceeds from Fund shares sold | | | 2,489,576 | | | 1,714,335 | | | 2,942,676 | | | 911,050 | | | 4,093,289 | |
| Payment on Fund shares redeemed | | | (132,272 | )(b) | | (459,290 | )(c) | | (1,162,599 | )(d) | | (415,971 | ) | | (2,695,904 | )(e) |
| Cash distributions paid | | | (1,085 | ) | | (1,111 | ) | | (62,275 | ) | | — | | | (8,294 | ) |
| Net cash provided from financing activities | | | 2,356,219 | | | 1,253,934 | | | 1,717,802 | | | 495,079 | | | 1,389,091 | |
| | | | | | | | | | | | | | | | | |
| Net increase in cash | | | — | | | — | | | — | | | — | | | — | |
| | | | | | | | | | | | | | | | | |
| Cash: | | | | | | | | | | | | | | | | |
| Beginning of year/period | | | — | | | — | | | — | | | — | | | — | |
| End of year/period | | $ | — | | $ | — | | $ | — | | $ | — | | $ | — | |
Supplemental disclosure of cash flow information:
| (a) | Represents the period from September 1, 2018 through November 30, 2018. The WP Large Cap Income Plus Fund changed its fiscal year end from August 31 to November 30. |
| (b) | Noncash financing activities not included herein consist of reinvestment of distributions of $125,808 and a decrease in payable for Fund shares redeemed of $300. |
| (c) | Noncash financing activities not included herein consist of reinvestment of distributions of $229,459 and a decrease in payable for Fund shares redeemed of $300. |
| (d) | Noncash financing activities not included herein consist of reinvestment of distributions of $1,133,995 and an increase in payable for Fund shares redeemed of $8,000. |
| (e) | Noncash financing activities not included herein consist of reinvestment of distributions of $823,099. |
Interest paid by the Funds was $28,690, $38,910, $68,030, $42,114 and $110,886, respectively.
The accompanying notes are an integral part of these financial statements.
| WP TRUST | |
| | |
| STATEMENTS OF CHANGES IN NET ASSETS | |
| | |
| November 30, 2018 | ANNUAL REPORT |
| | | WP Smaller Companies | |
| | | Income Plus Fund | |
| | | For the | | | For the | |
| | | Year Ended | | | Year Ended | |
| | | November 30, 2018 | | | November 30, 2017 | |
| Increase (decrease) in net assets from: | | | | | | | | |
| Operations: | | | | | | | | |
| Net investment loss | | $ | (134,298 | ) | | $ | (78,294 | ) |
| Net realized gain (loss) on investments and options | | | 72,186 | | | | 156,890 | |
| Net change in unrealized appreciation on investments and options | | | 88,991 | | | | 565,735 | |
| Net increase in net assets resulting from operations | | | 26,879 | | | | 644,331 | |
| | | | | | | | | |
| Distributions to shareholders from: | | | | | | | | |
| Total distributable earnings - Institutional Class | | | (126,893 | ) | | | — | |
| Total distributions | | | (126,893 | ) | | | — | |
| | | | | | | | | |
| Capital transactions: | | | | | | | | |
| Net proceeds from shares sold | | | 2,489,576 | | | | 1,889,387 | |
| Reinvestment of distributions | | | 125,808 | | | | — | |
| Cost of shares redeemed | | | (131,972 | ) | | | (237,647 | ) |
| Net increase in net assets from capital transactions | | | 2,483,412 | | | | 1,651,740 | |
| | | | | | | | | |
| Increase in net assets | | | 2,383,398 | | | | 2,296,071 | |
| | | | | | | | | |
| Net Assets: | | | | | | | | |
| Beginning of year | | | 5,628,439 | | | | 3,332,368 | |
| | | | | | | | | |
| End of year (a) | | $ | 8,011,837 | | | $ | 5,628,439 | |
| | | | | | | | | |
| Capital share transactions: | | | | | | | | |
| Shares sold | | | 179,447 | | | | 152,594 | |
| Shares reinvested | | | 9,700 | | | | — | |
| Shares redeemed | | | (9,824 | ) | | | (19,250 | ) |
| Net increase from capital share transactions | | | 179,323 | | | | 133,344 | |
| (a) | Includes $81,318 of net investment loss for the year ended November 30, 2017. The SEC eliminated the requirement to disclose net investment income in 2018. |
The accompanying notes are an integral part of these financial statements.
| WP TRUST | |
| | |
| STATEMENTS OF CHANGES IN NET ASSETS | |
| | |
| November 30, 2018 | ANNUAL REPORT |
| | | WP International Companies | |
| | | Income Plus Fund | |
| | | For the | | | For the | |
| | | Year Ended | | | Year Ended | |
| | | November 30, 2018 | | | November 30, 2017 | |
| Increase (decrease) in net assets from: | | | | | | | | |
| Operations: | | | | | | | | |
| Net investment income (loss) | | $ | 7,402 | | | $ | (44,227 | ) |
| Net realized gain (loss) on investments and options | | | 62,150 | | | | 264,219 | |
| Net change in unrealized appreciation (depreciation) on investments and options | | | (1,305,353 | ) | | | 1,233,211 | |
| Net increase (decrease) in net assets resulting from operations | | | (1,235,801 | ) | | | 1,453,203 | |
| | | | | | | | | |
| Distributions to shareholders from: | | | | | | | | |
| Total distributable earnings - Institutional Class | | | (230,570 | ) | | | — | |
| Total distributions | | | (230,570 | ) | | | — | |
| | | | | | | | | |
| Capital transactions: | | | | | | | | |
| Net proceeds from shares sold | | | 1,714,335 | | | | 4,626,993 | |
| Reinvestment of distributions | | | 229,459 | | | | — | |
| Cost of shares redeemed | | | (458,990 | ) | | | (336,449 | ) |
| Net increase in net assets from capital transactions | | | 1,484,804 | | | | 4,290,544 | |
| | | | | | | | | |
| Increase in net assets | | | 18,433 | | | | 5,743,747 | |
| | | | | | | | | |
| Net Assets: | | | | | | | | |
| Beginning of year | | | 8,969,056 | | | | 3,225,309 | |
| | | | | | | | | |
| End of year (a) | | $ | 8,987,489 | | | $ | 8,969,056 | |
| | | | | | | | | |
| Capital share transactions: | | | | | | | | |
| Shares sold | | | 137,779 | | | | 415,049 | |
| Shares reinvested | | | 18,327 | | | | — | |
| Shares redeemed | | | (37,537 | ) | | | (28,597 | ) |
| Net increase from capital share transactions | | | 118,569 | | | | 386,452 | |
| (a) | Includes $63,746 of net investment loss for the year ended November 30, 2017. The SEC eliminated the requirement to disclose net investment income in 2018. |
The accompanying notes are an integral part of these financial statements.
| WP TRUST | |
| | |
| STATEMENTS OF CHANGES IN NET ASSETS | |
| | |
| November 30, 2018 | ANNUAL REPORT |
| | | WP Income Plus Fund | |
| | | For the | | | For the | |
| | | Year Ended | | | Year Ended | |
| | | November 30, 2018 | | | November 30, 2017 | |
| Increase (decrease) in net assets from: | | | | | | | | |
| Operations: | | | | | | | | |
| Net investment income | | $ | 461,738 | | | $ | 272,105 | |
| Net realized gain (loss) on investments and options | | | (29,171 | ) | | | 766,976 | |
| Net change in unrealized appreciation (depreciation) on investments and options | | | (1,192,189 | ) | | | (140,334 | ) |
| Net increase (decrease) in net assets resulting from operations | | | (759,622 | ) | | | 898,747 | |
| | | | | | | | | |
| Distributions to shareholders from: | | | | | | | | |
| Total distributable earnings - Institutional Class (a) | | | (1,196,270 | ) | | | (343,327 | ) |
| Total distributions | | | (1,196,270 | ) | | | (343,327 | ) |
| | | | | | | | | |
| Capital transactions: | | | | | | | | |
| Net proceeds from shares sold | | | 2,942,676 | | | | 5,369,289 | |
| Reinvestment of distributions | | | 1,133,995 | | | | 326,648 | |
| Cost of shares redeemed | | | (1,170,599 | ) | | | (369,837 | ) |
| Net increase in net assets from capital transactions | | | 2,906,072 | | | | 5,326,100 | |
| | | | | | | | | |
| Increase in net assets | | | 950,180 | | | | 5,881,520 | |
| | | | | | | | | |
| Net Assets: | | | | | | | | |
| Beginning of year | | | 14,486,796 | | | | 8,605,276 | |
| | | | | | | | | |
| End of year (b) | | $ | 15,436,976 | | | $ | 14,486,796 | |
| | | | | | | | | |
| Capital share transactions: | | | | | | | | |
| Shares sold | | | 276,985 | | | | 468,807 | |
| Shares reinvested | | | 105,867 | | | | 28,570 | |
| Shares redeemed | | | (111,726 | ) | | | (31,835 | ) |
| Net increase from capital share transactions | | | 271,126 | | | | 465,542 | |
| (a) | Current year presentation of distributions conforms with S-X Disclosure Simplification. Prior year distributions were $259,737 from net investment income and $83,590 from realized capital gains and have been consolidated to conform with S-X Disclosure Simplification. See Note 8 in the Notes to the Financial Statements. |
| (b) | Includes $20,427 of net investment income for the year ended November 30, 2017. The SEC eliminated the requirement to disclose net investment income in 2018. |
The accompanying notes are an integral part of these financial statements.
| WP TRUST | |
| | |
| STATEMENTS OF CHANGES IN NET ASSETS | |
| | |
| November 30, 2018 | ANNUAL REPORT |
| | | WP Large Cap Income Plus Fund | |
| | | For the | | | For the | | | For the | |
| | | Period Ended | | | Year Ended | | | Year Ended | |
| | | November 30, 2018(a) | | | August 31, 2018 | | | August 31, 2017 | |
| Increase (decrease) in net assets from: | | | | | | | | | | | | |
| Operations: | | | | | | | | | | | | |
| Net investment income | | $ | 18,811 | | | $ | 26,765 | | | $ | 177,607 | |
| Net realized gain (loss) on investments and options | | | 45,459 | | | | (695,762 | ) | | | 2,040,391 | |
| Net change in unrealized appreciation (depreciation) on investments and options | | | (2,383,595 | ) | | | 5,876,994 | | | | 3,721,085 | |
| Net increase (decrease) in net assets resulting from operations | | | (2,319,325 | ) | | | 5,207,997 | | | | 5,939,083 | |
| | | | | | | | | | | | | |
| Distributions to shareholders from: | | | | | | | | | | | | |
| Total distributable earnings - Institutional Class (b) | | | — | | | | (831,393 | ) | | | (46,285 | ) |
| Total distributions | | | — | | | | (831,393 | ) | | | (46,285 | ) |
| | | | | | | | | | | | | |
| Capital transactions: | | | | | | | | | | | | |
| Net proceeds from shares sold | | | 911,050 | | | | 4,093,289 | | | | 3,152,335 | |
| Reinvestment of distributions | | | — | | | | 823,099 | | | | 46,163 | |
| Cost of shares redeemed | | | (423,971 | ) | | | (2,695,904 | ) | | | (3,226,309 | ) |
| Net increase (decrease) in net assets from capital transactions | | | 487,079 | | | | 2,220,484 | | | | (27,811 | ) |
| | | | | | | | | | | | | |
| Increase (decrease) in net assets | | | (1,832,246 | ) | | | 6,597,088 | | | | 5,864,987 | |
| | | | | | | | | | | | | |
| Net Assets: | | | | | | | | | | | | |
| Beginning of year/period | | | 36,458,138 | | | | 29,861,050 | | | | 23,996,063 | |
| | | | | | | | | | | | | |
| End of year/period (c) | | $ | 34,625,892 | | | $ | 36,458,138 | | | $ | 29,861,050 | |
| | | | | | | | | | | | | |
| Capital share transactions: | | | | | | | | | | | | |
| Shares sold | | | 64,140 | | | | 296,471 | | | | 265,483 | |
| Shares reinvested | | | — | | | | 59,558 | | | | 3,987 | |
| Shares redeemed | | | (30,384 | ) | | | (196,281 | ) | | | (274,689 | ) |
| Net increase (decrease) from capital share transactions | | | 33,756 | | | | 159,748 | | | | (5,219 | ) |
| (a) | Represents the period from September 1, 2018 through November 30, 2018. The WP Large Cap Income Plus Fund changed its fiscal year end from August 31 to November 30. |
| (b) | Current year presentation of distributions conforms with S-X Disclosure Simplification. Distributions were $148,390 from net investment income and $683,003 from realized capital gains for the year ended August 31, 2018 and $46,285 from net investment income for the year ended August 31, 2017 and have been consolidated to conform with S-X Disclosure Simplification. See Note 8 in the Notes to the Financial Statements. |
| (c) | Includes $0 and $124,900 of net investment income for the years ended August 31, 2018 and August 31, 2017, respectively. The SEC eliminated the requirement to disclose net investment income in 2018. |
The accompanying notes are an integral part of these financial statements.
| WP TRUST | |
| | |
| FINANCIAL HIGHLIGHTS | |
| | |
| November 30, 2018 | ANNUAL REPORT |
The following tables set forth the per share operating performance data for a share of capital stock outstanding, total return ratios to average net assets and other supplemental data for the period indicated.
| | | WP Smaller Companies | |
| | | Income Plus Fund | |
| | | For the | | | For the | | | For the | |
| | | Year Ended | | | Year Ended | | | Period Ended | |
| | | November 30, 2018 | | | November 30, 2017 | | | November 30, 2016(a) | |
| | | | | | | | | | | | | |
| Net Asset Value, Beginning of Year/Period | | $ | 13.32 | | | $ | 11.53 | | | $ | 10.00 | |
| | | | | | | | | | | | | |
| Investment Operations: | | | | | | | | | | | | |
| Net investment loss (b) | | | (0.26 | ) | | | (0.21 | ) | | | (0.42 | ) |
| Net realized and unrealized gain on investments and options | | | 0.55 | | | | 2.00 | | | | 1.95 | |
| Total from investment operations | | | 0.29 | | | | 1.79 | | | | 1.53 | |
| | | | | | | | | | | | | |
| Distributions: | | | | | | | | | | | | |
| From net realized capital gains | | | (0.30 | ) | | | — | | | | — | |
| Total distributions | | | (0.30 | ) | | | — | | | | — | |
| | | | | | | | | | | | | |
| Net Asset Value, End of Year/Period | | $ | 13.31 | | | $ | 13.32 | | | $ | 11.53 | |
| | | | | | | | | | | | | |
| Total Return (c) | | | 2.23 | % | | | 15.52 | % | | | 15.30 | %(d) |
| | | | | | | | | | | | | |
| Ratios/Supplemental Data | | | | | | | | | | | | |
| Net assets, end of year/period (in 000’s) | | $ | 8,012 | | | $ | 5,628 | | | $ | 3,332 | |
| | | | | | | | | | | | | |
| Ratios of expenses to average net assets (g) (i): | | | | | | | | | | | | |
| Before fees waived and expenses absorbed | | | 3.77 | % | | | 3.82 | % | | | 5.63 | %(e)(f) |
| After fees waived and expenses absorbed | | | 3.15 | % | | | 3.12 | % | | | 5.63 | %(e)(f) |
| | | | | | | | | | | | | |
| Ratios of net investment loss (h) (i): | | | | | | | | | | | | |
| Before fees waived and expenses absorbed | | | (2.50 | )% | | | (2.42 | )% | | | (4.40 | )%(e)(f) |
| After fees waived and expenses absorbed | | | (1.88 | )% | | | (1.72 | )% | | | (4.40 | )%(e)(f) |
| | | | | | | | | | | | | |
| Portfolio turnover rate | | | 0.00 | % | | | 0.00 | % | | | 0.00 | %(d) |
| (a) | The WP Smaller Companies Income Plus Fund commenced operations on January 4, 2016. |
| (b) | Net investment loss per share is based on average shares outstanding. |
| (c) | Total Return represents the rate that the investor would have earned or lost on an investment in the Fund, assuming reinvestment of dividends. |
| (e) | Ratios are for the period from January 16, 2016, the date of initial expense accruals, through November 30, 2016. |
| (g) | Ratios do not include expenses of the investment companies in which the Fund invests. |
| (h) | Recoginition of net investment income by the Fund is affected by the timing of the declaration of the dividends by the underlying companies in which the Fund invests. |
| (i) | The ratios include 0.40%, 0.29% and 0.16% of interest expense during the year ended November 30, 2018, the year ended November 30, 2017 and the period ended November 30, 2016, respectively. |
The accompanying notes are an integral part of these financial statements.
| WP TRUST | |
| | |
| FINANCIAL HIGHLIGHTS | |
| | |
| November 30, 2018 | ANNUAL REPORT |
The following tables set forth the per share operating performance data for a share of capital stock outstanding, total return ratios to average net assets and other supplemental data for the period indicated.
| | | | | | | | | | |
| | | WP International Companies | |
| | | Income Plus Fund | |
| | | For the | | | For the | | | For the | |
| | | Year Ended | | | Year Ended | | | Period Ended | |
| | | November 30, 2018 | | | November 30, 2017 | | | November 30, 2016(a) | |
| | | | | | | | | | | | | |
| Net Asset Value, Beginning of Year/Period | | $ | 12.74 | | | $ | 10.16 | | | $ | 10.00 | |
| | | | | | | | | | | | | |
| Investment Operations: | | | | | | | | | | | | |
| Net investment income (loss) (b) | | | 0.01 | | | | (0.07 | ) | | | (0.36 | ) |
| Net realized and unrealized gain (loss) on investments and options | | | (1.49 | ) | | | 2.65 | | | | 0.52 | |
| Total from investment operations | | | (1.48 | ) | | | 2.58 | | | | 0.16 | |
| | | | | | | | | | | | | |
| Distributions: | | | | | | | | | | | | |
| From net realized capital gains | | | (0.33 | ) | | | — | | | | — | |
| Total distributions | | | (0.33 | ) | | | — | | | | — | |
| | | | | | | | | | | | | |
| Net Asset Value, End of Year/Period | | $ | 10.93 | | | $ | 12.74 | | | $ | 10.16 | |
| | | | | | | | | | | | | |
| Total Return (c) | | | (11.97 | )% | | | 25.39 | % | | | 1.60 | %(d) |
| | | | | | | | | | | | | |
| Ratios/Supplemental Data | | | | | | | | | | | | |
| Net assets, end of year/period (in 000’s) | | $ | 8,987 | | | $ | 8,969 | | | $ | 3,225 | |
| | | | | | | | | | | | | |
| Ratios of expenses to average net assets (g) (i): | | | | | | | | | | | | |
| Before fees waived and expenses absorbed | | | 3.44 | % | | | 3.18 | % | | | 5.97 | %(e)(f) |
| After fees waived and expenses absorbed | | | 3.15 | % | | | 3.03 | % | | | 5.97 | %(e)(f) |
| | | | | | | | | | | | | |
| Ratios of net investment income (loss) (h) (i): | | | | | | | | | | | | |
| Before fees waived and expenses absorbed | | | (0.21 | )% | | | (0.77 | )% | | | (4.06 | )%(e)(f) |
| After fees waived and expenses absorbed | | | 0.08 | % | | | (0.62 | )% | | | (4.06 | )%(e)(f) |
| | | | | | | | | | | | | |
| Portfolio turnover rate | | | 0.00 | % | | | 0.00 | % | | | 0.00 | %(d) |
| (a) | The WP International Companies Income Plus Fund commenced operations on January 4, 2016. |
| (b) | Net investment loss per share is based on average shares outstanding. |
| (c) | Total Return represents the rate that the investor would have earned or lost on an investment in the Fund, assuming reinvestment of dividends. |
| (e) | Ratios are for the period from January 16, 2016, the date of initial expense accruals, through November 30, 2016. |
| (g) | Ratios do not include expenses of the investment companies in which the Fund invests. |
| (h) | Recoginition of net investment income by the Fund is affected by the timing of the declaration of the dividends by the underlying companies in which the Fund invests. |
| (i) | The ratios include 0.41%, 0.23% and 0.14% of interest expense during the year ended November 30, 2018, the year ended November 30, 2017 and the period ended November 30, 2016, respectively. |
The accompanying notes are an integral part of these financial statements.
| WP TRUST | |
| | |
| FINANCIAL HIGHLIGHTS | |
| | |
| November 30, 2018 | ANNUAL REPORT |
The following tables set forth the per share operating performance data for a share of capital stock outstanding, total return ratios to average net assets and other supplemental data for the period indicated.
| | | | | | | | | | |
| | | WP Income Plus Fund | |
| | | For the | | | For the | | | For the | |
| | | Year Ended | | | Year Ended | | | Period Ended | |
| | | November 30, 2018 | | | November 30, 2017 | | | November 30, 2016(a) | |
| | | | | | | | | | | | | |
| Net Asset Value, Beginning of Year/Period | | $ | 11.46 | | | $ | 10.78 | | | $ | 10.00 | |
| | | | | | | | | | | | | |
| Investment Operations: | | | | | | | | | | | | |
| Net investment income(b) | | | 0.33 | | | | 0.26 | | | | 0.09 | |
| Net realized and unrealized gain (loss) on investments and options | | | (0.83 | ) | | | 0.76 | | | | 0.76 | |
| Total from investment operations | | | (0.50 | ) | | | 1.02 | | | | 0.85 | |
| | | | | | | | | | | | | |
| Distributions: | | | | | | | | | | | | |
| From net investment income | | | (0.32 | ) | | | (0.25 | ) | | | (0.07 | ) |
| From net realized capital gains | | | (0.58 | ) | | | (0.09 | ) | | | — | |
| Total distributions | | | (0.90 | ) | | | (0.34 | ) | | | (0.07 | ) |
| | | | | | | | | | | | | |
| Net Asset Value, End of Year/Period | | $ | 10.06 | | | $ | 11.46 | | | $ | 10.78 | |
| | | | | | | | | | | | | |
| Total Return (c) | | | (4.69 | )% | | | 9.44 | % | | | 8.50 | %(d) |
| | | | | | | | | | | | | |
| Ratios/Supplemental Data | | | | | | | | | | | | |
| Net assets, end of year/period (in 000’s) | | $ | 15,437 | | | $ | 14,487 | | | $ | 8,605 | |
| | | | | | | | | | | | | |
| Ratios of expenses to average net assets (g) (i): | | | 2.97 | % | | | 2.87 | % | | | 3.73 | %(e)(f) |
| | | | | | | | | | | | | |
| Ratios of net investment income (h) (i): | | | 3.02 | % | | | 2.20 | % | | | 1.22 | %(e)(f) |
| | | | | | | | | | | | | |
| Portfolio turnover rate | | | 0.34 | % | | | 49.17 | % | | | 37.52 | %(d) |
| (a) | The WP Income Plus Fund commenced operations on January 4, 2016. |
| (b) | Net investment income per share is based on average shares outstanding. |
| (c) | Total Return represents the rate that the investor would have earned or lost on an investment in the Fund, assuming reinvestment of dividends. |
| (e) | Ratios are for the period from January 16, 2016, the date of initial expense accruals, through November 30, 2016. |
| (g) | Ratios do not include expenses of the investment companies in which the Fund invests. |
| (h) | Recoginition of net investment income by the Fund is affected by the timing of the declaration of the dividends by the underlying companies in which the Fund invests. |
| (i) | The ratios include 0.45%, 0.33% and 0.27% of interest expense during the year ended November 30, 2018, the year ended November 30, 2017 and the period ended November 30, 2016, respectively. |
The accompanying notes are an integral part of these financial statements.
| WP TRUST | |
| | |
| FINANCIAL HIGHLIGHTS | |
| | |
| November 30, 2018 | ANNUAL REPORT |
The following tables set forth the per share operating performance data for a share of capital stock outstanding, total return ratios to average net assets and other supplemental data for the period indicated.
| | | | | | | | | | | | | | |
| | | WP Large Cap Income Plus Fund | |
| | | | | | | | | | | | | | | | | | | | |
| | | For the | | For the | | For the | | For the | | For the | | For the | |
| | | Period Ended | | Year Ended | | Year Ended | | Year Ended | | Year Ended | | Period Ended | |
| | | November 30,
2018 (j) | | August 31,
2018 | | August 31,
2017 | | August 31,
2016 | | August 31,
2015 | | August 31,
2014(a) | |
| | | | | | | | | | | | | | | | | | | | |
| Net Asset Value, Beginning of Year/Period | | $ | 14.69 | | $ | 12.86 | | $ | 10.31 | | $ | 8.96 | | $ | 10.56 | | $ | 10.00 | |
| | | | | | | | | | | | | | | | | | | | |
| Investment Operations: | | | | | | | | | | | | | | | | | | | |
| Net investment income (loss) | | | 0.01 | (b) | | 0.01 | | | 0.08 | | | — | | | 0.03 | | | (0.06 | ) |
| Net realized and unrealized gain (loss) on investments | | | (0.93 | ) | | 2.17 | | | 2.49 | | | 1.37 | | | (1.63 | ) | | 0.62 | |
| Total from investment operations | | | (0.92 | ) | | 2.18 | | | 2.57 | | | 1.37 | | | (1.60 | ) | | 0.56 | |
| | | | | | | | | | | | | | | | | | | | |
| Distributions: | | | | | | | | | | | | | | | | | | | |
| From net investment income | | | — | | | (0.06 | ) | | (0.02 | ) | | — | | | — | | | — | |
| From return of capital | | | — | | | — | | | — | | | (0.02 | ) | | — | | | — | |
| From net realized capital gains | | | — | | | (0.29 | ) | | — | | | — | | | — | | | — | |
| Total distributions | | | — | | | (0.35 | ) | | (0.02 | ) | | (0.02 | ) | | — | | | — | |
| | | | | | | | | | | | | | | | | | | | |
| Net Asset Value, End of Year/Period | | $ | 13.77 | | $ | 14.69 | | $ | 12.86 | | $ | 10.31 | | $ | 8.96 | | $ | 10.56 | |
| | | | | | | | | | | | | | | | | | | | |
| Total Return (c) | | | (6.26 | )%(d) | | 17.14 | % | | 24.95 | % | | 15.28 | % | | (15.15 | )% | | 5.60 | %(d)(e) |
| | | | | | | | | | | | | | | | | | | | |
| Ratios/Supplemental Data | | | | | | | | | | | | | | | | | | | |
| Net assets, end of year/period (in 000’s) | | $ | 34,626 | | $ | 36,458 | | $ | 29,861 | | $ | 23,996 | | $ | 20,846 | | $ | 19,107 | |
| | | | | | | | | | | | | | | | | | | | |
| Ratios of expenses to average net assets (i): | | | 2.75 | %(f)(h) | | 2.73 | %(f) | | 2.47 | %(f) | | 2.93 | %(f) | | 2.92 | %(f) | | 3.32 | %(g)(h) |
| | | | | | | | | | | | | | | | | | | | |
| Ratios of net investment income (loss): | | | 0.21 | %(h) | | 0.08 | % | | 0.65 | % | | 0.04 | % | | 0.32 | % | | (1.00 | )%(g)(h) |
| | | | | | | | | | | | | | | | | | | | |
| Portfolio turnover rate | | | 0.26 | %(d) | | 4.01 | % | | 3.11 | % | | 5.30 | % | | 6.88 | % | | 1.78 | %(d) |
| (a) | The WP Large Cap Income Plus Fund commenced operations on October 10, 2013. |
| (b) | Net investment income per share is based on average shares outstanding. |
| (c) | Total Return represents the rate that the investor would have earned or lost on an investment in the Fund, assuming reinvestment of dividends. |
| (e) | Total Return is for the period from December 4, 2013, the date of initial portfolio trades, through August 31, 2014. |
| (f) | The ratios include 0.48% of interest expense during the period ended November 30, 2018, 0.33% of interest expense during the year ended August 31, 2018, 0.19% of interest expense during the fiscal year ended August 31, 2017, 0.20% of interest expense during the fiscal year ended August 31, 2016 and 0.03% of interest expense during the year ended August 31, 2015. |
| (g) | Ratios are for the period from December 4, 2013, the date of initial expense accruals, through August 31, 2014. |
| (i) | Ratios do not include expenses of the investment companies in which the Fund invests. |
| (j) | Represents the period from September 1, 2018 through November 30, 2018. The WP Large Cap Income Plus Fund changed its fiscal year end from August 31 to November 30. |
The accompanying notes are an integral part of these financial statements.
WP Family of Funds
NOTES TO THE FINANCIAL STATEMENTS
November 30, 2018
| 1. | ORGANIZATION AND SIGNIFICANT ACCOUNTING PO LICIES |
The WP Family of Funds (the “Funds”) are series of WP Trust (the “Trust”). The Trust was organized on June 4, 2015, as a Delaware statutory trust. The Trust is registered as an open-end management investment company under the Investment Company Act of 1940 (the “1940 Act”). The following series of the WP Family of Funds: (i) WP Smaller Companies Income Plus Fund (“Smaller Companies Fund”), (ii) WP International Companies Income Plus Fund (“International Companies Fund”), (iii) WP Income Plus Fund (“Income Fund”) and (iv) WP Large Cap Income Plus Fund (“Large Cap Fund”) (each a “Fund” and collectively, the “Funds”) are each an open-end management investment company and separate series of the Trust. The Smaller Companies Fund, International Companies Fund and Income Fund are non-diversified Funds. As non-diversified Funds, the Smaller Companies Fund, International Companies Fund and Income Fund may invest a significant portion of their assets in a small number of companies. The Large Cap Fund is a diversified Fund.
The investment objective of each Fund is total return. The Funds’ investment adviser is Winning Points Advisers, LLC (the “Adviser”). The Funds offer one class of shares, Institutional Class shares. The Smaller Companies Fund, the International Companies Fund and the Income Fund commenced operations on January 4, 2016. The Large Cap Fund commenced operations on October 10, 2013.
The following is a summary of the significant accounting policies followed by the Funds in the preparation of their financial statements. The Funds are investment companies that follow the accounting and reporting guidance of Accounting Standards Codification Topic 946 applicable to investment companies.
a) Security Valuation – All investments in securities are recorded at their estimated fair value, as described in note 2.
b) Options – The Funds’ option strategies consist of selling and purchasing put and call options on equity indexes, bond indexes and exchange-traded funds (“ETFs”). The sale of put options generates income for the Funds, but exposes them to the risk of declines in the value of the underlying assets. The risk in purchasing options is limited to the premiums paid by the Funds for the options. The sale of call options generates income for the Funds, but may limit the Funds’ participation in equity market gains. The Funds’ investment adviser seeks to reduce the overall volatility of returns for the Funds by managing a portfolio of options. When the Funds write or purchase an option, an amount equal to the premium received or paid by the Funds is recorded as a liability or an asset and is subsequently adjusted to the current market value of the option written or purchased. Premiums received or paid from writing or purchasing options which expire unexercised are treated by the Funds on the expiration date as realized gains or losses. The difference between the premium and the amount paid or received on effecting a closing purchase or sale transaction, including brokerage commissions, is also treated as a realized gain or loss. If an option is exercised, the premium paid or received is added to the cost of the purchase or proceeds from the sale in determining whether the Funds have realized a gain or a loss on investment transactions.
Purchasing and selling put and call options are highly specialized activities and entail greater than ordinary investment risks. The successful use of options depends in part on the ability of the investment adviser to manage future price fluctuations and the degree of correlation between the options and securities (or currency) markets. By selling put options on equity securities, the Funds give up the opportunity to benefit from potential increases in the value of the underlying securities above the strike prices of the sold put options, but continue to bear the risk of declines in the value of underlying securities held by the Funds. The Funds will receive a premium from the purchaser of a covered call option sold, which they retain whether or not the option is exercised. The premium received from the sold options may not be sufficient to offset any losses sustained from the volatility of the underlying equity securities over time.
c) Exchange-Traded and Closed-End Funds – The Funds may invest in Exchange-Traded Funds (“ETFs”) and Closed-End Funds (“CEFs”). ETFs and CEFs are registered investment companies and incur fees and expenses such as operating expenses, licensing fees, registration fees, trustees fees, and marketing expenses, and ETF and CEF shareholders, such as a Fund, pay their proportionate share of these expenses. Your cost of investing in a Fund will generally be higher than the cost of investing directly in ETFs and CEFs. By investing in a Fund, you will indirectly bear fees and expenses charged by the underlying ETFs and CEFs in which a Fund invests in addition to a Fund’s direct fees and expenses. Also, with respect to dividends paid by the ETFs and CEFs, it is possible for these dividends to exceed the underlying investments’ taxable earnings and profits resulting in the excess portion of such dividends being designated as a return of capital. Distributions received from investments in securities that represent a return of capital or capital gains are recorded as a reduction of the cost of investments or as a realized gain, respectively.
WP Family of Funds
NOTES TO THE FINANCIAL STATEMENTS
November 30, 2018
| 1. | ORGANIZATION AND SIGNIFICANT ACCOUNTING POLICIES (continued) |
The Funds may invest a significant portion of their assets in shares of one or more Investment Companies (i.e., ETFs). From time to time, the Funds may invest greater than 25% of their net assets in one security. As of November 30, 2018, the iShares Russell 2000 ETF represented 100.01% of the Smaller Companies Fund’s net assets, the iShares MSCI EAFE ETF represented 103.71% of the International Companies Fund’s net assets and the iShares iBoxx $ High Yield Corporate Bond ETF and the SPDR Bloomberg Barclays High Yield Bond ETF represented 69.05% and 40.75% of the Income Fund’s net assets, respectively. Additional information for these securities, including their financial statements, is available from the Securities and Exchange Commission’s website at www.sec.gov.
d) Federal Income Taxes – The Funds have qualified and intend to continue to qualify as regulated investment companies under Subchapter M of the Internal Revenue Code of 1986, as amended (the “Code”). It is the policy of the Funds to comply with the requirements of the Code applicable to regulated investment companies and to distribute substantially all of their net investment company taxable income and net capital gains. Therefore, no provision for federal income taxes is required.
As of and for the year ended November 30, 2018 and for the year ended November 30, 2017 and for the period from January 4, 2016, commencement of operations, through November 30, 2016, the Smaller Companies Fund, International Companies Fund and the Income Fund did not have a liability for any unrecognized tax benefits. As of and for the three month period ended November 30, 2018 (the “period”) and for the years ended August 31, 2018, August 31, 2017, August 31, 2016 and August 31, 2015, the Large Cap Fund did not have a liability for any unrecognized tax benefits. The Funds recognize interest and penalties, if any, related to unrecognized tax benefits as income tax expense in the statements of operations. During the year/period ended November 30, 2018, the Funds did not incur any interest or penalties. The Funds identify their major tax jurisdictions as U.S. Federal and Delaware state.
In addition, accounting principles generally accepted in the United States of America (“GAAP”) requires management of the Funds to analyze all open tax years, as defined by IRS statute of limitations, including federal tax authorities and certain state tax authorities. The Funds have no examinations in progress and are not aware of any tax positions for which it is reasonably possible that the total tax amounts of unrecognized tax benefits will significantly change in the next twelve months.
e) Distributions to Shareholders – Dividends from net investment income and distributions of net realized capital gains, if any, will be declared and paid at least annually. Income and capital gain distributions, which are determined in accordance with income tax regulations, are recorded on the ex-dividend date. GAAP requires that permanent financial reporting differences relating to shareholder distributions be reclassified to paid-in capital.
f) Use of Estimates – The preparation of financial statements in conformity with GAAP requires management to make estimates and assumptions that affect the reported amounts of assets and liabilities and disclosure of contingent assets and liabilities at the date of the financial statements and the reported amounts of revenues and expenses during the reporting period. Actual results could differ from those estimates.
g) Common Expenses – Common expenses of the Trust are allocated among the Funds within the Trust either based on relative net assets of each Fund, divided equally among the Funds or allocated to specific Funds. The allocations are dependent upon the nature of the services performed and the relative applicability to each Fund. Other allocations may also be approved from time to time by the Trustees.
h) Other – Investment and shareholder transactions are recorded on trade date. The Funds determine the gain or loss realized from the investment transactions by comparing the original cost of the security lot sold with the net sales proceeds. Dividend income is recognized on the ex-dividend date or as soon as information is available to the Funds and interest income and expenses are recognized on an accrual basis. Withholding taxes on foreign dividends have been provided for in accordance with the Funds’ understanding of the applicable country’s tax rules and rates.
Processes and Structure
The Funds’ Board of Trustees have adopted guidelines for valuing securities and other derivative instruments including in circumstances in which market quotes are not readily available, and has delegated authority to the Adviser to apply those guidelines in determining fair value prices, subject to review by the Board of Trustees.
WP Family of Funds
NOTES TO THE FINANCIAL STATEMENTS
November 30, 2018
| 2. | SECURITIES VALUATIONS (continued) |
Hierarchy of Fair Value Inputs
The Funds utilize various methods to measure the fair value of all investments on a recurring basis. GAAP establishes a hierarchy that prioritizes inputs to valuation techniques used to measure fair value. The three levels of inputs are as follows:
| ● | Level 1 – Unadjusted quoted prices in active markets for identical assets or liabilities that the Funds have the ability to access. |
| ● | Level 2 – Observable inputs other than quoted prices included in Level 1 that are observable for the asset or liability either directly or indirectly. These inputs may include quoted prices for the identical instrument on an inactive market, prices for similar instruments, interest rates, prepayment speeds, credit risk, yield curves, default rates, and similar data. |
| ● | Level 3 – Unobservable inputs for the asset or liability to the extent that relevant observable inputs are not available, representing the Funds’ own assumptions about the assumptions that a market participant would use in valuing the asset or liability, and that would be based on the best information available. |
The availability of observable inputs can vary from security to security and is affected by a wide variety of factors, including, for example, the type of security, whether the security is new and not yet established in the marketplace, the liquidity of markets, and other characteristics particular to the security. To the extent that valuation is based on models or inputs that are less observable or unobservable in the market, the determination of fair value requires more judgment. Accordingly, the degree of judgment exercised in determining fair value is greatest for instruments categorized in Level 3.
The inputs used to measure fair value may fall into different levels of the fair value hierarchy. In such cases, for disclosure purposes, the level in the fair value hierarchy within which the fair value measurement falls in its entirety is determined based on the lowest level input that is significant to the fair value measurement in its entirety.
Fair Value Measurements
A description of the valuation techniques applied to the Funds’ major categories of assets and liabilities measured at fair value on a recurring basis follows.
Equity securities (common stock, CEFs and ETFs) – Securities traded on a national securities exchange (or reported on the NASDAQ national market) are stated at the last reported sales price on the day of valuation. To the extent these securities are actively traded, and valuation adjustments are not applied, they are categorized in Level 1 of the fair value hierarchy. Certain foreign securities may be fair valued using a pricing service that considers the correlation of the trading patterns of the foreign security to the intraday trading in the U.S. markets for investments such as American Depositary Receipts, financial futures, ETFs, and the movement of certain indexes of securities based on a statistical analysis of the historical relationship and they are categorized in Level 2. Preferred stock and other equities traded on inactive markets or valued by reference to similar instruments are also categorized in Level 2.
Money market funds – Money market funds are valued at their net asset value and are categorized as Level 1.
Derivative instruments – Listed derivatives, including options, that are actively traded, are valued based on quoted prices from the exchange and categorized in Level 1 of the fair value hierarchy. Options held by the Funds for which no current quotations are readily available and which are not traded on the valuation date are valued at the mean price and are categorized within Level 2 of the fair value hierarchy. Over-the-counter (OTC) derivative contracts include forward, swap, and option contracts related to interest rates; foreign currencies; credit standing of reference entities; equity prices; or commodity prices, and warrants on exchange-traded securities. Depending on the product and terms of the transaction, the fair value of the OTC derivative products can be modeled taking into account the counterparties’ creditworthiness and using a series of techniques, including simulation models. Many pricing models do not entail material subjectivity because the methodologies employed do not necessitate significant judgments, and the pricing inputs are observed from actively quoted markets, as is the case of interest rate swap and option contracts. OTC derivative products valued using pricing models are categorized within Level 2 of the fair value hierarchy.
If the Adviser decides that a price provided by the pricing service does not accurately reflect the fair value of the securities, when prices are not readily available from a pricing service, or when certain restricted or illiquid securities are being valued, these securities are valued at fair value as determined in good faith by the Adviser, in conformity with guidelines adopted by and subject to review of the Board and the Fair Valuation Committee. These securities will be categorized as Level 3 securities.
WP Family of Funds
NOTES TO THE FINANCIAL STATEMENTS
November 30, 2018
| 2. | SECURITIES VALUATIONS (continued) |
The following tables summarize the inputs used to value the Funds’ assets and liabilities measured at fair value as of November 30, 2018.
| Smaller Companies Fund | | | | | | | | |
| Financial Instruments – Assets | | | | | | | | | | | | | | | | |
| | | | | | | | | | | | | | | | | |
| Security Classification (1) | | | Level 1 | | | | Level 2 | | | | Level 3 | | | | Totals | |
| Common Stocks (2) | | $ | 820,116 | | | $ | — | | | $ | — | | | $ | 820,116 | |
| Exchange-Traded Funds (2) | | | 8,012,550 | | | | — | | | | — | | | | 8,012,550 | |
| Put Options Purchased | | | 29,375 | | | | — | | | | — | | | | 29,375 | |
| Short-Term Investment | | | 251,034 | | | | — | | | | — | | | | 251,034 | |
| Total Assets | | $ | 9,113,075 | | | $ | — | | | $ | — | | | $ | 9,113,075 | |
| Smaller Companies Fund | | | | | | | | |
| Derivative Instruments – Liabilities | | | | | | | | | | | | | | | | |
| | | | | | | | | | | | | | | | | |
| Security Classification (1) | | | Level 1 | | | | Level 2 | | | | Level 3 | | | | Totals | |
| Call Options Written | | $ | 163,680 | | | $ | — | | | $ | — | | | $ | 163,680 | |
| Put Options Written | | | 1,011,440 | | | | — | | | | — | | | | 1,011,440 | |
| Total Liabilities | | $ | 1,175,120 | | | $ | — | | | $ | — | | | $ | 1,175,120 | |
| International Companies Fund | | | | | | | | |
| Financial Instruments – Assets | | | | | | | | | | | | | | | | |
| | | | | | | | | | | | | | | | | |
| Security Classification (1) | | | Level 1 | | | | Level 2 | | | | Level 3 | | | | Totals | |
| Exchange-Traded Funds (2) | | $ | 10,152,625 | | | $ | — | | | $ | — | | | $ | 10,152,625 | |
| Put Options Purchased | | | 34,375 | | | | — | | | | — | | | | 34,375 | |
| Short-Term Investment | | | 124,198 | | | | — | | | | — | | | | 124,198 | |
| Total Assets | | $ | 10,311,198 | | | $ | — | | | $ | — | | | $ | 10,311,198 | |
| International Companies Fund | | | | | | | | |
| Derivative Instruments – Liabilities | | | | | | | | | | | | | | | | |
| | | | | | | | | | | | | | | | | |
| Security Classification (1) | | | Level 1 | | | | Level 2 | | | | Level 3 | | | | Totals | |
| Call Options Written | | $ | 267,840 | | | $ | — | | | $ | — | | | $ | 267,840 | |
| Put Options Written | | | 1,183,600 | | | | — | | | | — | | | | 1,183,600 | |
| Total Liabilities | | $ | 1,451,440 | | | $ | — | | | $ | — | | | $ | 1,451,440 | |
WP Family of Funds
NOTES TO THE FINANCIAL STATEMENTS
November 30, 2018
2. SECURITIES VALUATIONS (continued)
| Income Fund | | | | | | | | |
| Financial Instruments – Assets | | | | | | | | | | | | | | | | |
| | | | | | | | | | | | | | | | | |
| Security Classification (1) | | | Level 1 | | | | Level 2 | | | | Level 3 | | | | Totals | |
| Closed-End Fund (2) | | $ | 619,604 | | | $ | — | | | $ | — | | | $ | 619,604 | |
| Exchange-Traded Funds (2) | | | 16,936,770 | | | | — | | | | — | | | | 16,936,770 | |
| Put Options Purchased | | | 68,750 | | | | — | | | | — | | | | 68,750 | |
| Short-Term Investment | | | 354,052 | | | | — | | | | — | | | | 354,052 | |
| Total Assets | | $ | 17,979,176 | | | $ | — | | | $ | — | | | $ | 17,979,176 | |
| Income Fund | | | | | | | | |
| Derivative Instruments – Liabilities | | | | | | | | | | | | | | | | |
| | | | | | | | | | | | | | | | | |
| Security Classification (1) | | | Level 1 | | | | Level 2 | | | | Level 3 | | | | Totals | |
| Call Options Written | | $ | 513,060 | | | $ | — | | | $ | — | | | $ | 513,060 | |
| Put Options Written | | | 1,979,840 | | | | — | | | | — | | | | 1,979,840 | |
| Total Liabilities | | $ | 2,492,900 | | | $ | — | | | $ | — | | | $ | 2,492,900 | |
| Large Cap Fund | | | | | | | | |
| Financial Instruments – Assets | | | | | | | | | | | | | | | | |
| | | | | | | | | | | | | | | | | |
| Security Classification (1) | | | Level 1 | | | | Level 2 | | | | Level 3 | | | | Totals | |
| Common Stocks (2) | | $ | 36,453,271 | | | $ | — | | | $ | — | | | $ | 36,453,271 | |
| Closed-End Funds (2) | | | 1,655,036 | | | | — | | | | — | | | | 1,655,036 | |
| Exchange-Traded Funds (2) | | | 1,257,294 | | | | | | | | | | | | 1,257,294 | |
| Put Options Purchased | | | 120,625 | | | | — | | | | — | | | | 120,625 | |
| Short-Term Investment | | | 376,615 | | | | — | | | | — | | | | 376,615 | |
| Total Assets | | $ | 39,862,841 | | | $ | — | | | $ | — | | | $ | 39,862,841 | |
WP Family of Funds
NOTES TO THE FINANCIAL STATEMENTS
November 30, 2018
| 2. | SECURITIES VALUATIONS (continued) |
| Large Cap Fund | | | | | | | | |
| Financial Instruments – Liabilities | | | | | | | | | | | | | | | | |
| | | | | | | | | | | | | | | | | |
| Security Classification (1) | | | Level 1 | | | | Level 2 | | | | Level 3 | | | | Totals | |
| Call Options Written | | $ | 1,617,980 | | | $ | — | | | $ | — | | | $ | 1,617,980 | |
| Put Options Written | | | 4,153,360 | | | | — | | | | — | | | | 4,153,360 | |
| Total Liabilities | | $ | 5,771,340 | | | $ | — | | | $ | — | | | $ | 5,771,340 | |
(1) As of and for the year/period ended November 30, 2018, the Funds held no securities that were considered to be “Level 3” securities (those valued using significant unobservable inputs). Therefore, a reconciliation of assets in which significant unobservable inputs (Level 3) were used in determining fair value is not applicable.
(2) All common stock, CEFs and ETFs held in the Fund are Level 1 securities. For a detailed break-out of common stock by industry and CEFs and ETFs by investment type, please refer to the Schedules of Investments.
There were no transfers into and out of any Level for the year/period ended November 30, 2018. It is each Fund’s policy to recognize transfers between Levels at the end of the reporting period.
| 3. | DERIVATIVES TRANSACTIONS |
As of November 30, 2018, portfolio securities valued at $8,832,666, $10,152,625, 17,556,374 and $39,365,581 were held in segregated accounts by the custodian as collateral for options written by the Smaller Companies Fund, International Companies Fund, Income Fund and Large Cap Fund, respectively.
The average monthly notional value of options contracts purchased and written by each Fund for the year/period ended November 30, 2018, were as follows:
| Smaller Companies Fund | | Average Notional Value |
| | | | | |
| Put Options Purchased | | $ | 32,075,385 | |
| Call Options Written | | | 3,931,538 | |
| Put Options Written | | | 18,299,423 | |
| International Companies Fund | | Average Notional Value |
| | | | | |
| Put Options Purchased | | $ | 44,145,654 | |
| Call Options Written | | | 6,419,231 | |
| Put Options Written | | | 25,030,192 | |
| Income Plus Fund | | Average Notional Value |
| | | | | |
| Put Options Purchased | | $ | 89,981,577 | |
| Call Options Written | | | 12,496,154 | |
| Put Options Written | | | 42,212,692 | |
WP Family of Funds
NOTES TO THE FINANCIAL STATEMENTS
November 30, 2018
| 3. | DERIVATIVES TRANSACTIONS (continued) |
Large Cap Fund | | Average Notional Value |
| | | | | |
| Put Options Purchased | | $ | 164,657,625 | |
| Call Options Written | | | 34,930,625 | |
| Put Options Written | | | 91,625,000 | |
As of November 30, 2018, the location on the Statements of Assets and Liabilities for financial derivative instrument fair values is as follows:
| Smaller Companies Fund: | | | | | | |
| Assets | | Location | | Equity Contracts | | | Total | |
| Put options purchased | | Investments, at value | | $ | 29,375 | | | $ | 29,375 | |
| Total Assets | | | | $ | 29,375 | | | $ | 29,375 | |
| Liabilities | | Location | | | Equity Contracts | | | | Total | |
| Call options written | | Options written, at value | | $ | 163,680 | | | $ | 163,680 | |
| Put options written | | Options written, at value | | | 1,011,440 | | | | 1,011,440 | |
| Total Liabilities | | | | $ | 1,175,120 | | | $ | 1,175,120 | |
| International Companies Fund: | | | | | | |
| Assets | | Location | | Equity Contracts | | | Total | |
| Put options purchased | | Investments, at value | | $ | 34,375 | | | $ | 34,375 | |
| Total Assets | | | | $ | 34,375 | | | $ | 34,375 | |
| | | | | | | | | | | |
| Liabilities | | Location | | | Equity Contracts | | | | Total | |
| Call options written | | Options written, at value | | $ | 267,840 | | | $ | 267,840 | |
| Put options written | | Options written, at value | | | 1,183,600 | | | | 1,183,600 | |
| Total Liabilities | | | | $ | 1,451,440 | | | $ | 1,451,440 | |
| Income Fund: | | | | | | |
| Assets | | Location | | Equity Contracts | | | Total | |
| Put options purchased | | Investments, at value | | $ | 68,750 | | | $ | 68,750 | |
| Total Assets | | | | $ | 68,750 | | | $ | 68,750 | |
| | | | | | | | | | | |
| Liabilities | | Location | | | Equity Contracts | | | | Total | |
| Call options written | | Options written, at value | | $ | 513,060 | | | $ | 513,060 | |
| Put options written | | Options written, at value | | | 1,979,840 | | | | 1,979,840 | |
| Total Liabilities | | | | $ | 2,492,900 | | | $ | 2,492,900 | |
| Large Cap Fund: | | | | | | |
| Assets | | Location | | Equity Contracts | | | Total | |
| Put options purchased | | Investments, at value | | $ | 120,625 | | | $ | 120,625 | |
| Total Assets | | | | $ | 120,625 | | | $ | 120,625 | |
WP Family of Funds
NOTES TO THE FINANCIAL STATEMENTS
November 30, 2018
| 3. | DERIVATIVES TRANSACTIONS (continued) |
| Large Cap Fund: | | | | | | |
| Liabilities | | Location | | Equity Contracts | | | Total | |
| Call options written | | Options written, at value | | $ | 1,617,980 | | | $ | 1,617,980 | |
| Put options written | | Options written, at value | | | 4,153,360 | | | | 4,153,360 | |
| Total Liabilities | | | | $ | 5,771,340 | | | $ | 5,771,340 | |
Realized and unrealized gains and losses on derivatives contracts entered into by the Funds during the year/period ended November 30, 2018, are recorded in the following locations in the Statements of Operations:
| Smaller Companies Fund: | | | | | | | | |
Net change in unrealized appreciation/(depreciation) on: | | Location | | Equity Contracts | | | Total | |
| Put options purchased | | Options purchased | | $ | (30,247 | ) | | $ | (30,247 | ) |
| Call options written | | Options written | | | 225,950 | | | | 225,950 | |
| Put option written | | Options written | | | (413,430 | ) | | | (413,430 | ) |
| | | | | $ | (217,727 | ) | | $ | (217,727 | ) |
| | | | | | | | | | | |
| Net realized gain (loss) on: | | Location | | | Equity Contracts | | | | Total | |
| Put options purchased | | Options purchased | | $ | (126,993 | ) | | $ | (126,993 | ) |
| Call options written | | Options written | | | (333,704 | ) | | | (333,704 | ) |
| Put option written | | Options written | | | 532,883 | | | | 532,883 | |
| | | | | $ | 72,186 | | | $ | 72,186 | |
| International Companies Fund: | | | | | | | | |
Net change in unrealized appreciation/(depreciation) on: | | Location | | Equity Contracts | | | Total | |
| Put options purchased | | Options purchased | | $ | (35,705 | ) | | $ | (35,705 | ) |
| Call options written | | Options written | | | 367,884 | | | | 367,884 | |
| Put option written | | Options written | | | (498,324 | ) | | | (498,324 | ) |
| | | | | $ | (166,145 | ) | | $ | (166,145 | ) |
| Net realized gain (loss) on: | | Location | | Equity Contracts | | | Total | |
| Put options purchased | | Options purchased | | $ | (163,979 | ) | | $ | (163,979 | ) |
| Call options written | | Options written | | | (521,261 | ) | | | (521,261 | ) |
| Put option written | | Options written | | | 747,390 | | | | 747,390 | |
| | | | | $ | 62,150 | | | $ | 62,150 | |
| Income Fund: | | | | | | | | |
Net change in unrealized appreciation/(depreciation) on: | | Location | | Equity Contracts | | | Total | |
| Put options purchased | | Options purchased | | $ | (71,460 | ) | | $ | (71,460 | ) |
| Call options written | | Options written | | | 668,628 | | | | 668,628 | |
| Put option written | | Options written | | | (833,772 | ) | | | (833,772 | ) |
| | | | | $ | (236,604 | ) | | $ | (236,604 | ) |
WP Family of Funds
NOTES TO THE FINANCIAL STATEMENTS
November 30, 2018
| 3. | DERIVATIVES TRANSACTIONS (continued) |
| Net realized gain (loss) on: | | Location | | Equity Contracts | | | Total | |
| Put options purchased | | Options purchased | | $ | (336,362 | ) | | $ | (336,362 | ) |
| Call options written | | Options written | | | (948,473 | ) | | | (948,473 | ) |
| Put option written | | Options written | | | 1,267,262 | | | | 1,267,262 | |
| | | | | $ | (17,573 | ) | | $ | (17,573 | ) |
| Large Cap Fund: | | | | | | | | |
Net change in unrealized appreciation/(depreciation) on: | | Location | | Equity Contracts | | | Total | |
| Put options purchased | | Options purchased | | $ | (13,023 | ) | | $ | (13,023 | ) |
| Call options written | | Options written | | | 752,129 | | | | 752,129 | |
| Put option written | | Options written | | | (1,440,380 | ) | | | (1,440,380 | ) |
| | | | | $ | (701,274 | ) | | $ | (701,274 | ) |
| Net realized gain (loss) on: | | Location | | Equity Contracts | | | Total | |
| Put options purchased | | Options purchased | | $ | (235,488 | ) | | $ | (235,488 | ) |
| Call options written | | Options written | | | (88,094 | ) | | | (88,094 | ) |
| Put option written | | Options written | | | 370,636 | | | | 370,636 | |
| | | | | $ | 47,054 | | | $ | 47,054 | |
The following tables present the Funds’ derivatives available for offset under a master netting arrangement net of collateral pledged as of November 30, 2018.
| Smaller Companies Fund: | | | | | |
| Liabilities: | | Gross Amounts of Liabilities Presented in the Statements of Assets & Liabilities |
| | | | | | | | | | Gross Amounts Not Offset in
the Statements of Assets and
Liabilities | | | |
| | | Gross
Amounts of Recognized
Liabilities | | | Gross
Amounts
Offset in the
Statements of
Assets and
Liabilities | | | Net Amounts
of Liabilities
Presented in
the Statements
of Assets and
Liabilities | | | Financial
Instruments Pledged | | | Cash Collateral Pledged | | | Net Amount of Liabilities | |
| Options Written Contracts | | $ | 1,175,120 | (1) | | $ | — | | | $ | 1,175,120 | (1) | | $ | 1,067,430 | (2) | | $ | 107,690 | | | $ | — | |
| Total | | $ | 1,175,120 | (1) | | $ | — | | | $ | 1,175,120 | (1) | | $ | 1,067,430 | (2) | | $ | 107,690 | | | $ | — | |
(1) Written options at value as presented in the Funds’ Schedules of Options Written.
(2) The amounts are limited to the derivative liability balances and accordingly do not include excess collateral pledged.
WP Family of Funds
NOTES TO THE FINANCIAL STATEMENTS
November 30, 2018
| 3. | DERIVATIVES TRANSACTIONS (continued) |
| International Companies Fund: | | | | | |
| Liabilities: | | Gross Amounts of Liabilities Presented in the Statements of Assets & Liabilities |
| | | | | | | | | | Gross Amounts Not Offset in
the Statements of Assets and
Liabilities | | | |
| | | Gross
Amounts of Recognized
Liabilities | | | Gross
Amounts
Offset in the
Statements of
Assets and
Liabilities | | | Net Amounts
of Liabilities
Presented in
the Statements
of Assets and
Liabilities | | | Financial
Instruments Pledged | | | Cash Collateral Pledged | | | Net Amount of Liabilities | |
| Options Written Contracts | | $ | 1,451,440 | (1) | | $ | — | | | $ | 1,451,440 | (1) | | $ | 1,289,568 | (2) | | $ | 161,872 | | | $ | — | |
| Total | | $ | 1,451,440 | (1) | | $ | — | | | $ | 1,451,440 | (1) | | $ | 1,289,568 | (2) | | $ | 161,872 | | | $ | — | |
| Income Fund: | | | | | |
| Liabilities: | | Gross Amounts of Liabilities Presented in the Statements of Assets & Liabilities |
| | | | | | | | | | Gross Amounts Not Offset in
the Statements of Assets and
Liabilities | | | |
| | | Gross
Amounts of Recognized
Liabilities | | | Gross
Amounts
Offset in the
Statements of
Assets and
Liabilities | | | Net Amounts
of Liabilities
Presented in
the Statements
of Assets and
Liabilities | | | Financial
Instruments Pledged | | | Cash Collateral Pledged | | | Net Amount of Liabilities | |
| Options Written Contracts | | $ | 2,492,900 | (1) | | $ | — | | | $ | 2,492,900 | (1) | | $ | 2,492,821 | (2) | | $ | 79 | | | $ | — | |
| Total | | $ | 2,492,900 | (1) | | $ | — | | | $ | 2,492,900 | (1) | | $ | 2,492,821 | (2) | | $ | 79 | | | $ | — | |
(1) Written options at value as presented in the Funds’ Schedules of Options Written.
(2) The amounts are limited to the derivative liability balances and accordingly do not include excess collateral pledged.
WP Family of Funds
NOTES TO THE FINANCIAL STATEMENTS
November 30, 2018
| 3. | | DERIVATIVES TRANSACTIONS (continued) |
| Large Cap Fund: | | | | | | | | | | | | | | | |
| Liabilities: | | Gross Amounts of Liabilities Presented in the Statements of Assets & Liabilities | |
| | | | | | | | | | | | Gross Amounts Not Offset in
the Statements of Assets and
Liabilities | | | | |
| | | Gross
Amounts of Recognized
Liabilities | | | Gross
Amounts
Offset in the
Statements of
Assets and
Liabilities | | | Net Amounts
of Liabilities
Presented in
the Statements
of Assets and
Liabilities | | | Financial
Instruments Pledged | | | Cash Collateral Pledged | | | Net Amount of Liabilities | |
| Options Written Contracts | | $ | 5,771,340 | (1) | | $ | — | | | $ | 5,771,340 | (1) | | $ | 5,279,940 | (2) | | $ | 491,400 | | | $ | — | |
| Total | | $ | 5,771,340 | (1) | | $ | — | | | $ | 5,771,340 | (1) | | $ | 5,279,940 | (2) | | $ | 491,400 | | | $ | — | |
(1) Written options at value as presented in the Funds’ Schedules of Options Written.
(2) The amounts are limited to the derivative liability balances and accordingly do not include excess collateral pledged.
| 4. | | INVESTMENT TRANSACTIONS |
For the year/period ended November 30, 2018, aggregate purchases and sales of investment securities (excluding short-term investments) for the Funds were as follows:
| | | | Purchases | | | | Sales | |
| Smaller Companies Fund | | | $ | 2,591,872 | | | $ | — | |
| International Companies Fund | | | | 1,707,546 | | | | — | |
| Income Fund | | | | 2,670,210 | | | | 57,844 | |
| Large Cap Fund | | | | 1,124,002 | | | | 104,299 | |
There were no U.S. Government securities purchased or sold during the year/period ended November 30, 2018.
| 5. | | ADVISORY FEES AND OTHER RELATED PARTY TRANSACTIONS |
The Funds have entered into an Investment Advisory Agreement (the “Advisory Agreement”) with the Adviser. Pursuant to the Advisory Agreement, the Adviser manages the operations of the Funds and manages the Funds’ investments in accordance with the stated policies of the Funds. As compensation for the investment advisory services provided to the Funds, the Adviser receives a monthly management fee equal to an annual rate of 1.35% of each Fund’s net assets. For the year/period ended November 30, 2018, the Adviser earned management fees as follows:
| | | Management Fees |
| Smaller Companies Fund | | | $ | 96,470 | |
| International Companies Fund | | | | 126,705 | |
| Income Fund | | | | 206,175 | |
| Large Cap Fund | | | | 119,560 | |
For the year ended August 31, 2018, the Adviser earned $450,919 of management fees from the Large Cap Fund.
WP Family of Funds
NOTES TO THE FINANCIAL STATEMENTS
November 30, 2018
| 5. | | ADVISORY FEES AND OTHER RELATED PARTY TRANSACTIONS (continued) |
The Adviser has entered into a contractual agreement with the Trust under which it has agreed to waive or reduce its fees and to assume other expenses of the Smaller Companies Fund, International Companies Fund and Income Fund, if necessary, in an amount that limits “Total Annual Fund Operating Expenses” (exclusive of interest, taxes, brokerage fees and commissions, other expenditures that are capitalized in accordance with generally accepted accounting principles, acquired fund fees and expenses, other extraordinary expenses not incurred in the ordinary course of the Funds’ business, interest and dividend expense on securities sold short and amounts, if any, payable pursuant to a plan adopted in accordance with Rule 12b-1 under the Investment Company Act of 1940, as amended) to not more than 2.50%. The contractual agreement cannot be terminated prior to March 30, 2019 without the Funds’ Board of Trustees’ approval. The Adviser has also entered into a contractual agreement with the Trust with respect to the Large Cap Fund under which it has agreed to waive or reduce its fees and to assume other expenses of the Fund, if necessary, in an amount that limits “Total Annual Fund Operating Expenses” (exclusive of interest, expenses incurred under a plan of distribution adopted pursuant to Rule 12b-1 under the 1940 Act, taxes, acquired fund fees and expenses, brokerage commissions, dividend expenses on short sales, other expenditures which are capitalized in accordance with generally accepted accounting principles, expenses associated with any proxies, mergers, reorganizations and other shareholder solicitation activities, litigation-related expenses and other extraordinary expenses not incurred in the ordinary course of the Fund’s business) to not more than 2.50%. The contractual agreement cannot be terminated prior to December 31, 2019 without the Board of Trustees’ approval. For the year/period ended November 30, 2018, the Adviser waived management fees as follows:
| | | Management Fees Waived | |
| Smaller Companies Fund | | | $ | 44,420 | |
| International Companies Fund | | | | 27,465 | |
| Income Fund | | | | — | |
| Large Cap Fund | | | | — | |
The Adviser did not waive any management fees during the year ended August 31, 2018 for the Large Cap Fund.
The Funds may, at a later date, reimburse the Adviser the management fees waived or limited and other expenses assumed and paid by the Adviser pursuant to the Expense Limitation Agreements during any of the previous three fiscal years, if the total annual fund operating expenses for the applicable following year, after giving effect to the repayment, do not exceed the operating expense limits with respect to the average daily net assets of the Funds (or any lower expense limitation or limitations to which the parties may otherwise agree). The amounts subject to repayment by the Funds, pursuant to the aforementioned conditions, are as follows:
| | | | November 30, 2021 | | | November 30, 2020 | |
| Smaller Companies Fund | | | $ | 44,420 | | | $ | 31,903 | |
| International Companies Fund | | | | 27,465 | | | | 10,825 | |
| Income Fund | | | | — | | | | — | |
| Large Cap Fund | | | | — | | | | — | |
An Interested Trustee is also a managing member of the Adviser.
The Funds have entered into an Investment Company Services Agreement (“ICSA”) with M3Sixty Administration, LLC (“M3Sixty”). Pursuant to the ICSA, M3Sixty will provide day-to-day operational services to the Funds including, but not limited to: (a) Fund accounting services; (b) financial statement preparation; (c) valuation of the Funds’ portfolio securities; (d) pricing the Funds’ shares; (e) assistance in preparing tax returns; (f) preparation and filing of required regulatory reports; (g) communications with shareholders; (h) coordination of Board and shareholder meetings; (i) monitoring the Funds’ legal compliance; (j) maintaining shareholder account records.
WP Family of Funds
NOTES TO THE FINANCIAL STATEMENTS
November 30, 2018
| 5. | | ADVISORY FEES AND OTHER RELATED PARTY TRANSACTIONS (continued) |
For the year/period ended November 30, 2018, amounts paid to M3Sixty, including compliance officer fees and out of pocket expenses, were as follows:
| | | ICSA Fees | |
| Smaller Companies Fund | | | $ | 57,970 | |
| International Companies Fund | | | | 64,415 | |
| Income Fund | | | | 85,172 | |
| Large Cap Fund | | | | 32,926 | |
For the year ended August 31, 2018, the Large Cap Fund paid $130,235 to M3Sixty.
Certain officers of the Trust are also employees and/or officers of M3Sixty.
The Funds have entered into a Distribution Agreement with Matrix 360 Distributors, LLC (“M3SixtyD”). Pursuant to the Distribution Agreement, M3SixtyD provides distribution services to the Funds. M3SixtyD serves as underwriter/distributor of the Funds.
The Distributor is an affiliate of M3Sixty.
The Funds have adopted a Distribution Plan (“Plan”) pursuant to Rule 12b-1 under the Investment Company Act of 1940. The Funds may expend up to 0.25% for Institutional Class shares of the Funds’ average daily net assets annually to pay for any activity primarily intended to result in the sale of shares of the Funds and the servicing of shareholder accounts, provided that the Trustees have approved the category of expenses for which payment is being made.
For the year/period ended November 30, 2018, the Funds accrued 12b-1 expenses attributable to Institutional Class shares as follows:
| | | 12b-1 Fees | |
| Smaller Companies Fund | | | $ | 17,865 | |
| International Companies Fund | | | | 23,464 | |
| Income Fund | | | | 38,180 | |
| Large Cap Fund | | | | 22,141 | |
For the year ended August 31, 2018, the Large Cap Fund accrued $83,504 of 12b-1 expenses attributable to Institutional Class shares.
For U.S. Federal income tax purposes, the cost of investments owned, gross appreciation, gross depreciation, and net unrealized appreciation/(depreciation) of investments at November 30, 2018, were as follows:
| | | | Cost | | | Gross
Appreciation | | | Gross
Depreciation | | | Net Appreciation/
(Depreciation) | |
| Smaller Companies Fund | | | $ | 7,521,961 | | | $ | 1,772,142 | | | $ | (181,028 | ) | | $ | 1,591,114 | |
| International Companies Fund | | | 9,977,612 | | | | 522,269 | | | | (188,683 | ) | | | 333,586 | |
| Income Fund | | | | 18,496,880 | | | | 148,857 | | | | (666,561 | ) | | | (517,704 | ) |
| Large Cap Fund | | | | 29,845,788 | | | | 11,232,053 | | | | (1,215,000 | ) | | | 10,017,053 | |
| | | | | | | | | | | | | | | | | | | |
The difference between book basis and tax basis unrealized appreciation (depreciation) is primarily attributable to the tax treatment of derivatives and the tax deferral of losses on wash sales.
WP Family of Funds
NOTES TO THE FINANCIAL STATEMENTS
November 30, 2018
| 6. | | TAX MATTERS (continued) |
The Funds’ tax basis distributable earnings are determined only at the end of each fiscal year. The tax character of distributable earnings (deficit) at November 30, 2018, the Funds’ most recent fiscal year end, were as follows:
| | | Unrealized
Appreciation
(Depreciation) | | Undistributed Ordinary Income | | Undistributed Long-Term Capital Gains | | Capital Loss Carry Forwards | | Post-October Loss, Late Year
Loss and Other
Losses | | Total Distributable Earnings |
| Smaller Companies Fund | | | $ | 1,591,114 | | | $ | — | | | $ | — | | | $ | (199,808 | ) | | $ | (364,446 | ) | | $ | 1,026,860 | |
| International Companies Fund | | | | 333,586 | | | | — | | | | — | | | | (197,007 | ) | | | (119,180 | ) | | | 17,399 | |
| Income Fund | | | | (517,704 | ) | | | — | | | | — | | | | (396,383 | ) | | | (168,714 | ) | | | (1,082,801 | ) |
| Large Cap Fund | | | | 10,017,053 | | | | 18,811 | | | | — | | | | (1,234,780 | ) | | | (191,245 | ) | | | 8,609,839 | |
The difference between book basis and tax basis unrealized appreciation (depreciation) and accumulated net realized losses from investments is primarily attributable to the tax deferral of losses on tax straddles and wash sales and the tax treatment of derivatives.
At November 30, 2018, the Funds had capital loss carry forwards for federal income tax purposes available to offset future capital gains as follows:
| | | Non-Expiring Short-Term | | | Non-Expiring Long-Term | | | Total | |
| Smaller Companies Fund | | | $ | 79,922 | | | $ | 119,886 | | | $ | 199,808 | |
| International Companies Fund | | | | 78,803 | | | | 118,204 | | | | 197,007 | |
| Income Fund | | | | 157,624 | | | | 238,759 | | | | 396,383 | |
| Large Cap Fund | | | | 553,937 | | | | 680,843 | | | | 1,234,780 | |
Under current tax law, net capital losses realized after October 31st and net ordinary losses incurred after December 31st may be deferred and treated as occurring on the first day of the following fiscal year. As of November 30, 2018, the Funds elected to defer losses as indicated in the chart below.
| | | Post-October Losses | | | Post-December Losses | |
| | | Deferred | | | Deferred | |
| Smaller Companies Fund | | | $ | 35,325 | | | $ | 141,583 | |
| International Companies Fund | | | | 51,438 | | | | 67,742 | |
| Income Fund | | | | 130,303 | | | | — | |
| Large Cap Fund | | | | 191,245 | | | | — | |
In accordance with GAAP, the Funds have recorded reclassifications in the capital accounts. The reclassifications listed below have no impact on the net asset value of the Funds and are as a result of net operating losses and return of capital distributions. As of November 30, 2018, the Funds recorded reclassifications to increase (decrease) the capital accounts as follows:
| | | Total Distributable Earnings | | Paid-in Capital |
| Smaller Companies Fund | | | $ | 74,033 | | | $ | (74,033 | ) |
| International Companies Fund | | | | 21,155 | | | | (21,155 | ) |
| Income Fund | | | | 4,371 | | | | (4,371 | ) |
| Large Cap Fund | | | | — | | | | — | |
WP Family of Funds
NOTES TO THE FINANCIAL STATEMENTS
November 30, 2018
| 6. | | TAX MATTERS (continued) |
During the year/period ended November 30, 2018, the Funds made the following distributions:
| | | Long-Term Capital Gains | | | Ordinary Income | | | Return of Capital | |
| Smaller Companies Fund | | | $ | 126,893 | | | $ | — | | | $ | — | |
| International Companies Fund | | | | 160,915 | | | | 48,500 | | | | 21,155 | |
| Income Fund | | | | 317,904 | | | | 876,366 | | | | — | |
| Large Cap Fund | | | | — | | | | — | | | | — | |
During the year ended November 30, 2017, the Income Fund distributed $343,327 of ordinary income. There were no distributions paid by the Smaller Companies Fund or the International Companies Fund during the year ended November 30, 2017.
During the year ended August 31, 2018, the Large Cap Fund distributed $752,847 of ordinary income, $70,838 of long-term capital gains and $7,708 of return of capital distributions. During the year ended August 31, 2017, the Large Cap Fund distributed $46,285 of ordinary income.
| 7. | | COMMITMENTS AND CONTINGENCIES |
In the normal course of business, the Trust may enter into contracts that may contain a variety of representations and warranties and provide general indemnifications. The Funds’ maximum exposure under these arrangements is dependent on future claims that may be made against the Funds and, therefore, cannot be estimated; however, management considers the risk of loss from such claims to be remote.
| 8. | | RECENT ACCOUNTING PRONOUNCEMENTS |
In August 2018, the Financial Accounting Standards Board (“FASB”) issued Accounting Standards Update (ASU) No. 2018-13 “Fair Value Measurement (Topic 820): Disclosure Framework – Changes to the Disclosure Requirements for Fair Value Measurement” (“ASU 2018-13”) which includes amendments intended to improve the effectiveness of disclosures in the notes to financial statements. For example, ASU 2018-13 includes additional disclosures regarding the range and weighted average of significant unobservable inputs used to develop Level 3 fair value measurements, and clarifications to the narrative description of measurement uncertainty disclosures. ASU 2018-13 is effective for interim and annual periods beginning after December 15, 2019. Management is currently evaluating the impact that ASU 2018-13 will have on the Funds’ financial statements and related disclosures.
In March 2017, the FASB issued ASU No. 2017-08, Receivables—Nonrefundable Fees and Other Costs (Subtopic 310-20): Premium Amortization on Purchased Callable Debt Securities. The amendments in the ASU shorten the amortization period for certain callable debt securities, held at a premium, to be amortized to the earliest call date. The ASU does not require an accounting change for securities held at a discount; which continue to be amortized to maturity. The ASU is effective for fiscal years and interim periods within those fiscal years beginning after December 15, 2018. Management is currently evaluating the impact, if any, of applying this provision.
The SEC has adopted changes to Regulation S-X to simplify the reporting of information by registered investment companies on financial statements. The amendments to Rule 6-04 remove the requirement to breakout the components of distributable earnings on the Statement of Assets and Liabilities. The amendments to Rule 6-09 remove the requirement for parenthetical disclosure of undistributed net investment income and separate disclosure of distributions paid to shareholders on the Statement of Changes in Net Assets. These Regulation S-X amendments became effective on November 5, 2018 and are reflected in the Funds’ financial statements for the year ended November 30, 2018.
On December 21, 2018, the Income Fund declared an ordinary income distribution of $101,364 and the Large Cap Fund declared an ordinary income distribution of $31,799, which were payable on December 21, 2018. On January 15, 2019, the Income Fund declared an ordinary income distribution of $17,152, which was payable on January 15, 2019.
In accordance with GAAP, Management has evaluated the impact of all subsequent events on the Funds through the date the financial statements were issued, and has determined that there were no other subsequent events requiring recognition or disclosure in the financial statements.
REPORT OF INDEPENDENT REGISTERED PUBLIC ACCOUNTING FIRM
To the Shareholders of WP Smaller Companies Income Plus Fund, WP International Companies Income Plus Fund, WP Income Plus Fund, and WP Large Cap Income Plus Fund and Board of Trustees of WP Trust
Opinion on the Financial Statements
We have audited the accompanying statements of assets and liabilities, including the schedules of investments, options purchased and options written of WP Smaller Companies Income Plus Fund, WP International Companies Income Plus Fund, WP Income Plus Fund, and WP Large Cap Income Plus Fund, (the "Funds"), each a series of WP Trust as of November 30, 2018, and the related statements of operations and cash flows for the year then ended, the statements of changes in net assets for each of the two years in the period then ended, including the related notes, and the financial highlights for each of the three periods in the period then ended for WP Smaller Companies Income Plus Fund, WP International Companies Income Plus Fund, and WP Income Plus Fund, and the related statements of operations and cash flows for the three months ended November 30, 2018 and for the year ended August 31, 2018, the statements of changes in net assets for the three months ended November 30, 2018 and for the years ended August 31, 2018 and August 31, 2017, including the related notes, and the financial highlights for each of the periods ended November 30, 2018, August 31, 2018, August 31, 2017, and August 31, 2016 for WP Large Cap Income Plus Fund (collectively referred to as the "financial statements"). In our opinion, the financial statements present fairly, in all material respects, the financial position of each of the Funds as of November 30, 2018, the results of their operations, the changes in their net assets, and the financial highlights for each of the periods indicated, in conformity with accounting principles generally accepted in the United States of America.
The WP Large Cap Income Plus Fund's financial highlights for the periods ended August 31, 2015 and prior, were audited by other auditors whose report dated October 27, 2015, expressed an unqualified opinion on those financial highlights.
Basis for Opinion
These financial statements are the responsibility of the Funds' management. Our responsibility is to express an opinion on the Funds' financial statements based on our audits. We are a public accounting firm registered with the Public Company Accounting Oversight Board (United States) ("PCAOB") and are required to be independent with respect to the Funds in accordance with the U.S. federal securities laws and the applicable rules and regulations of the Securities and Exchange Commission and the PCAOB.
We conducted our audits in accordance with the standards of the PCAOB. Those standards require that we plan and perform the audit to obtain reasonable assurance about whether the financial statements are free of material misstatement, whether due to error or fraud.
Our audits included performing procedures to assess the risks of material misstatement of the financial statements, whether due to error or fraud, and performing procedures that respond to those risks. Such procedures included examining, on a test basis, evidence regarding the amounts and disclosures in the financial statements. Our procedures included confirmation of securities owned as of November 30, 2018, by correspondence with the custodian and brokers. Our audits also included evaluating the accounting principles used and significant estimates made by management, as well as evaluating the overall presentation of the financial statements. We believe that our audits provide a reasonable basis for our opinion.
We have served as the auditor of one or more investment companies advised by Winning Points Advisors, LLC since 2015.

COHEN & COMPANY, LTD.
Cleveland, Ohio
January 29, 2019
ADDITIONAL INFORMATION
November 30, 2018 (Unaudited)
The Funds file their complete schedules of portfolio holdings with the Securities and Exchange Commission (the “Commission”) for the first and third quarters of each fiscal year on Form N-Q. The Funds’ Forms N-Q are available on the Commission’s website at http://www.sec.gov. The Funds’ Forms N-Q may be reviewed and copied at the Commission’s Public Reference Room in Washington, DC. Information on the operation of the Commission’s Public Reference Room may be obtained by calling 1-800-SEC-0330.
A description of the policies and procedures that the Funds use to determine how to vote proxies relating to portfolio securities is available without charge, upon request, by calling 1-877-244-6235; and on the Commission’s website at http://www.sec.gov.
Information regarding how the Funds voted proxies relating to portfolio securities during the most recent 12-month period ended June 30th is available without charge, upon request, by calling 1-877-244-6235; and on the Commission’s website at http://www.sec.gov.
Shareholder Tax Information - The Funds are required to advise you within 60 days of the Funds’ fiscal year end regarding the federal tax status of distributions received by shareholders during the fiscal year. During the year/ period ended November 30, 2018, the Funds paid the following distributions:
| | | Long-Term Capital Gains | | | Ordinary Income |
| Smaller Companies Fund | | $ | 126,893 | | | $ | — |
| International Companies Fund | | | 135,800 | | | 94,770 |
| Income Fund | | | 315,582 | | | 880,688 |
| Large Cap Fund | | | — | | | — |
Tax information is reported from the Funds’ fiscal year and not calendar year, therefore, shareholders should refer to their Form 1099-DIV or other tax information which will be mailed in 2019 to determine the calendar year amounts to be included on their 2018 tax returns. Shareholders should consult their own tax advisors.
ADDITIONAL INFORMATION
November 30, 2018 (Unaudited)
BOARD OF TRUSTEES, OFFICERS AND PRINCIPAL SHAREHOLDERS
The Trustees are responsible for the management and supervision of the Funds. The Trustees approve all significant agreements between the Trust, on behalf of the Funds, and those companies that furnish services to the Funds; review performance of the Funds; and oversee activities of the Funds. This section of the annual report provides information about the persons who serve as Trustees and Officers to the Trust and Funds, respectively, as well as the entities that provide services to the Funds. The Statement of Additional Information of the Trust includes additional information about the Funds’ Trustees and is available upon request, without charge, by calling (877) 244-6235.
Trustees and Officers – Following are the Trustees and Officers of the Trust, their age and address, their present position with the Trust or the Funds, and their principal occupation during the past five years. As described above under “Description of the Trust”, each of the Trustees of the Trust will generally hold office indefinitely. The Officers of the Trust will hold office indefinitely, except that: (1) any Officer may resign or retire and (2) any Officer may be removed any time by written instrument signed by at least two-thirds of the number of Trustees prior to such removal. In case a vacancy or an anticipated vacancy on the Board of Trustees shall for any reason exist, the vacancy shall be filled by the affirmative vote of a majority of the remaining Trustees, subject to certain restrictions under the 1940 Act. Those Trustees, who are “interested persons” (as defined in the 1940 Act) by virtue of their affiliation with either the Trust or the Advisor, are indicated in the table. The address of each trustee and officer is 4300 Shawnee Mission Parkway, Suite 100, Fairway, Kansas 66205.
Name, Address and Year of
Birth (“YOB”) | Position(s)
Held with
Trust | Length of
Service | Principal Occupation(s) During Past 5 Years | Number
of Series
Overseen | Other Directorships
During Past 5 Years |
| Independent Trustees |
Donald H. Baxter YOB : 1942 | Trustee | Since 2015 | President and Treasurer, Baxter Financial Corporation (investment advisor) (1989 to present). | Five | Director, Philadelphia Fund (1989-2010) Eagle Growth Shares, Inc. (1989-2009). |
Ronald F. Rohe YOB : 1943 | Trustee | Since 2015 | Secretary and Chief Compliance Officer, Baxter Financial Corporation (investment advisor) (1990 to present). | Five | None |
Michael G. Rogan YOB : 1963 | Trustee | | Since 2015 | | President, Rogan & Associates, Inc. (investment advisor) (1997 to present). | Five | None |
| Interested Trustees* | | | | | |
Charles S. Stoll YOB : 1955 | President, Trustee | | Since 2015 | | Managing Member and Chief Compliance Officer, Winning Points Advisors, LLC (1989 to present). | Five | None |
Bradley J. Alden YOB: 1974 | Trustee | | Since 2015 | | Program Lead, Cooperative Threat Reduction Support Center, Culmen International, LLC (government services) (2010 to present). | Five | None |
| Officers | | | | | |
Stephen R. Roberts YOB : 1953 | Chief Compliance Officer | | Since 2018 | | Chief Compliance Officer, Matrix360 Distributors, LLC (2017 – present); Business Unit Compliance Consultant, State Street (2015 -2016); Chief Compliance Officer/Senior Compliance Principal, VSR Financial Services, Inc. (2005 – 2014). | N/A | N/A |
| | | | | | | | |
* Mr. Stoll is an Interested Trustee because he is a managing member of Winning Points Advisors, LLC, the investment adviser to three funds in the Trust. Mr. Alden is an Interested Trustee because he has a familial relationship with a member of Winning Points Advisors, LLC, the investment adviser to four funds in the Trust.
ADDITIONAL INFORMATION
November 30, 2018 (Unaudited)
BOARD OF TRUSTEES, OFFICERS AND PRINCIPAL SHAREHOLDERS (continued)
Name, Address and Year of
Birth (“YOB”) | Position(s)
Held with
Trust | Length of
Service | Principal Occupation(s) During Past 5 Years | Number
of Series
Overseen | Other Directorships
During Past 5 Years |
| Officers (continued) | | | | | |
Andràs P. Teleki YOB : 1971 | Secretary | Since 2016 | Chief Legal Officer, M3Sixty Administration, LLC, M3Sixty Holdings, LLC, M3Sixty Distributors, LLC and M3Sixty Advisors, LLC (2015-present); Chief Compliance Officer and Secretary, 360 Funds (2015- present); Chief Compliance Officer and Secretary, M3Sixty Funds (2016-present); Secretary and Assistant Treasurer, Capital Management Investment Trust (2015); Partner, K&L Gates, (2009-2015). | N/A | N/A |
Justin J. Thompson** YOB: 1983 | Treasurer | 2017-2018 | Director of Fund Accounting & Administration, M3Sixty Administration, LLC (2017-2018); Treasurer, WP Trust (2017-present); Treasurer, Capital Management Investment Trust (2017-present); Treasurer, 360 Funds (2017-present); Officer of Fund Accounting – State Street Bank & Trust (2009-2016). | N/A | N/A |
Larry E. Beaver, Jr. YOB: 1969 | Assistant Treasurer | Since 2017 | Fund Accounting, Administration and Tax Officer, M3Sixty Administration, LLC (2017-Present); Director of Fund Accounting & Administration, M3Sixty Administration, LLC (2005-2017); Chief Accounting Officer, Amidex Funds, Inc. (2003-Present); Assistant Treasurer, Capital Management Investment Trust (July 2017-Present); Assistant Treasurer, M3Sixty Funds Trust (July 2017-Present; Assistant Treasurer, WP Funds Trust (July 2017-Present); Treasurer and Assistant Secretary, Capital Management Investment Trust (2008-July 2017); Treasurer, M3Sixty Funds Trust (2015-July 2017); Treasurer, WP Trust (2015-July 2017); Treasurer and Chief Financial Officer, Monteagle Funds (2008-2016). | N/A | N/A |
Brandon J. Byrd YOB: 1981 | Assistant Secretary and Anti-Money Laundering Officer | Since 2015 | Chief Operating Officer, M3Sixty Administration LLC (2013-present); Anti-Money Laundering Compliance Officer, Monteagle Funds (2015-2016); Division Manager – Client Service Officer, Boston Financial Data Services (mutual fund service provider) (2010-2012). | N/A | N/A |
Ted L. Akins YOB: 1974 | Assistant Secretary | Since 2018 | Vice President, Operations, M3Sixty Administration, LLC (2018-present); Director, Transfer Agency and Mutual Fund Operations, M3Sixty Administration, LLC (2012-2018); Senior Client Service Advisor, Boston Financial Data Services (1999-2012). | N/A | N/A |
John H. Lively YOB: 1969 | Assistant Secretary | Since 2017 | Attorney, Practus, LLP (law firm) (May 2018–present); The Law Offices of John H. Lively & Associates, Inc. (law firm) (2010-May 2018). | N/A | N/A |
** Justin J. Thompson resigned as Treasurer effective December 28, 2018. Larry E. Beaver, Jr. was assigned as Interim Treasurer until a new Treasurer is appointed by the Board.
ADDITIONAL INFORMATION
November 30, 2018 (Unaudited)
BOARD OF TRUSTEES, OFFICERS AND PRINCIPAL SHAREHOLDERS (continued)
Remuneration Paid to Trustees and Officers – Officers of the Trust and Trustees who are “interested persons” of the Trust or the Advisor will receive no salary or fees from the Trust. Officers of the Trust and interested Trustees do receive compensation directly from certain service providers to the Trust, including Matrix 360 Distributors, LLC (the Funds’ principal underwriter) and M3Sixty Administration LLC. Each Trustee who is not an “interested person” receives a fee of $2,500 each year plus $200 per Board or committee meeting attended. The Trust reimburses each Trustee and officer for his or her travel and other expenses relating to attendance at such meetings. Trustee compensation for the Fund’s fiscal year ended August 31, 2018 was as follows:
| Name of Trustee1/Officer | | Aggregate
Compensation From the Funds2 | | | Pension or Retirement
Benefits Accrued As Part
of Portfolio Expenses | | Estimated
Annual Benefits
Upon
Retirement | | Total Compensation From the Funds Paid to Trustees2 |
| Independent Trustees |
| Donald H. Baxter | | $ | 10,725 | | | None | | None | | $ | 10,725 |
| Ronald F. Rohe | | $ | 10,725 | | | None | | None | | $ | 10,725 |
| Michael G. Rogan | | $ | 10,725 | | | None | | None | | $ | 10,725 |
| |
| Interested Trustees and Officers |
| Charles S. Stoll | | | None | | | Not Applicable | | Not Applicable | | | None |
| Bradley J. Alden | | | None | | | Not Applicable | | Not Applicable | | | None |
1 Each of the Trustees serves as a Trustee to each Series of the Trust. The Trust currently offers five (5) series of shares.
2 Figures are for the year/period ended November 30, 2018. Each Trustee received $3,300 from the Smaller Companies Fund, International Companies Fund and Income Fund and $825 from the Large Cap Fund.
Information About Your Funds’ Expenses (Unaudited)
As a shareholder of the Funds, you incur ongoing costs, including management fees, distribution and/or service (12b-1) fees; and other Fund expenses. The example below is intended to help you understand your ongoing costs (in dollars) of investing in the Funds and to compare these costs with the ongoing costs of investing in other mutual funds.
The example is based on an investment of $1,000 invested at the beginning of the period and held for the entire period as indicated below.
Actual Expenses – The first section of the table provides information about actual account values and actual expenses (relating to the example $1,000 investment made at the beginning of the period). You may use the information in this section, together with the amount you invested, to estimate the expenses that you paid over the period. Simply divide your account value by $1,000 (for example, an $8,600 account value divided by $1,000 = 8.6), then multiply the result by the number in the first section under the heading entitled “Expenses Paid During Period” to estimate the expenses you paid on your account during this period.
Hypothetical Example for Comparison Purposes – The second section of the table provides information about the hypothetical account values and hypothetical expenses based on the Funds’ actual expense ratios and an assumed rate of return of 5% per year before expenses, which is not the Funds’ actual return. The hypothetical account values and expenses may not be used to estimate the actual ending account balance or expenses you paid for the period. You may use this information to compare the ongoing costs of investing in the Funds to other funds. To do so, compare this 5% hypothetical example with the 5% hypothetical examples that appear in the shareholder reports of the other funds.
Please note that the expenses shown in the table are meant to highlight your ongoing costs only and do not reflect any transactional costs. Therefore, the second section of the table is useful in comparing ongoing costs only, and will not help you determine the relative total costs of owning different funds. For more information on transactional costs, please refer to the Funds’ prospectus.
| Expenses and Value of a $1,000 Investment for the six month period ended November 30, 2018 |
| | | Beginning Account
Value (06/01/2018) | | | Annualized Expense
Ratio for the Period | | | Ending Account
Value (11/30/2018) | | | Expenses Paid
During Period (a) | |
| Actual Fund Return (in parentheses) | | | | | | | | | |
| Smaller Companies Fund (-5.20%) | | $ | 1,000.00 | | | | 3.15 | % | | $ | 948.01 | | | $ | 15.38 | |
| International Companies Fund (-11.71%) | | $ | 1,000.00 | | | | 3.16 | % | | $ | 882.88 | | | $ | 14.92 | |
| Income Fund (-3.40%) | | $ | 1,000.00 | | | | 3.14 | % | | $ | 966.00 | | | $ | 15.48 | |
| Large Cap Fund (-1.43%) | | $ | 1,000.00 | | | | 2.94 | % | | $ | 985.68 | | | $ | 14.63 | |
| | | | | | | | | | | | | | | | | |
| Hypothetical 5% Return | | | | | | | | | | | | | | | | |
| Smaller Companies Fund | | $ | 1,000.00 | | | | 3.15 | % | | $ | 1,009.30 | | | $ | 15.87 | |
| International Companies Fund | | $ | 1,000.00 | | | | 3.16 | % | | $ | 1,009.20 | | | $ | 15.92 | |
| Income Fund | | $ | 1,000.00 | | | | 3.14 | % | | $ | 1,009.30 | | | $ | 15.82 | |
| Large Cap Fund | | $ | 1,000.00 | | | | 2.94 | % | | $ | 1,010.30 | | | $ | 14.82 | |
| (a) | Expenses are equal to the Funds’ annualized expense ratios, multiplied by the average account value over the period, multiplied by 182/365 to reflect the one-half year period. |
For more information on Fund expenses, please refer to the Funds’ prospectuses, which can be obtained from your investment representative or by calling 1-877-244-6235. Please read them carefully before you invest or send money.
Information About Your Fund’s Expenses (Unaudited) (continued)
| Total Fund operating expense ratios as stated in the current Fund prospectus dated March 30, 2018 for the Smaller Companies Fund, International Companies Fund and Income Fund were as follows: |
| |
| Smaller Companies Fund, gross of fee waivers or expense reimbursements | | | 4.03 | % |
| Smaller Companies Fund, after fee waivers or expense reimbursements* | | | 3.25 | % |
| International Companies Fund, gross of fee waivers or expense reimbursements | | | 3.53 | % |
| International Companies Fund, after fee waivers or expense reimbursements* | | | 3.33 | % |
| Income Fund, gross of fee waivers or expense reimbursements | | | 3.43 | % |
| Income Fund, after fee waivers or expense reimbursements* | | | 3.43 | % |
| | | | | |
| * The Adviser has entered into a contractual agreement with Funds under which it has agreed to waive or reduce its fees and to assume other expenses of the Funds, if necessary, in an amount that limits “Total Annual Fund Operating Expenses” (exclusive of interest, taxes, brokerage fees and commissions, other expenditures that are capitalized in accordance with generally accepted accounting principles, acquired fund fees and expenses, other extraordinary expenses not incurred in the ordinary course of the Fund’s business, interest and dividend expense on securities sold short and amounts, if any, payable pursuant to a plan adopted in accordance with Rule 12b-1 under the Investment Company Act of 1940, as amended) to not more than 2.50%. The contractual agreement cannot be terminated prior to March 30, 2019 without the Fund’s Board of Trustees’ approval. Total Gross Operating Expenses for the year ended November 30, 2018, were 3.77%, 3.44% and 3.05% for the Smaller Companies Fund, International Companies Fund and Income Fund, respectively. Please see the Information About Your Funds’ Expenses, the Financial Highlights and Notes to Financial Statements (Note 5) sections of this report for expense related disclosures during the year ended November 30, 2018. |
| Total Fund operating expense ratios as stated in the Large Cap Fund’s current prospectus dated December 28, 2018 for the Funds were as follows: |
| |
| Large Cap Fund, gross of fee waivers or expense reimbursements | | | 2.82 | % |
| Large Cap Fund, after fee waivers or expense reimbursements* | | | 2.82 | % |
| | | | | |
| * The Adviser has entered into a contractual agreement with the Trust with respect to the Fund under which it has agreed to waive or reduce its fees and to assume other expenses of the Fund, if necessary, in an amount that limits “Total Annual Fund Operating Expenses” (exclusive of interest, expenses incurred under a plan of distribution adopted pursuant to Rule 12b-1 under the 1940 Act, taxes, acquired fund fees and expenses, brokerage commissions, dividend expenses on short sales, other expenditures which are capitalized in accordance with generally accepted accounting principles, expenses associated with any proxies, mergers, reorganizations and other shareholder solicitation activities, litigation-related expenses and other extraordinary expenses not incurred in the ordinary course of the Fund’s business) to not more than 2.50%. The Fund may, at a later date, reimburse the Adviser the management fees waived or limited and other expenses assumed and paid by the Adviser pursuant to the Expense Limitation Agreement during any of the previous three fiscal years, if the total annual fund operating expenses for the applicable following year, after giving effect to the repayment, do not exceed the operating expense limit with respect to the average daily net assets of the Fund (or any lower expense limitation or limitations to which the parties may otherwise agree). The contractual agreement cannot be terminated prior to December 31, 2019 without the Board of Trustees’ approval. Total Gross Operating Expenses for the period ended November 30, 2018, were 2.75% for the Large Fund. Please see the Information About Your Fund’s Expenses, the Financial Highlights and Notes to Financial Statements (Note 5) sections of this report for expense related disclosures during the period ended November 30, 2018. |
| WP Trust | ANNUAL REPORT |
| | |
| Approval of the Advisory Agreement Renewal for the WP Smaller Companies Income Plus Fund, the WP International Companies Income Plus Fund and the WP Income Plus Fund (Unaudited) |
At a meeting held on July 10, 2018, the Board of Trustees (the “Board”) considered the approval of the renewal of the Investment Advisory Agreement (the “Agreement”) between the Trust and Winning Points Advisors, LLC (the “Adviser”) in regard to the WP Smaller Companies Income Plus Fund (the “Smaller Companies Fund”), the WP International Companies Income Plus Fund (the “International Companies Fund”) and the WP Income Plus Fund (the “Income Fund,” together with the Smaller Companies Fund and the International Companies Fund, the “WP Funds”).
Independent Counsel (“Counsel”) reviewed his memorandum to the Trustees that summarized, among other things, the fiduciary duties and responsibilities of the Board in reviewing and approving the renewal of the Investment Advisory Agreement (the “Advisory Agreement”) between the Trust, on behalf of the WP Funds, and the Adviser. A copy of this memorandum was circulated to the Trustees in advance of the Meeting. Counsel discussed with the Trustees the types of information and factors that should be considered by the Board to make an informed decision regarding the approval of the continuation of the Advisory Agreement, including the following material factors: (i) the nature, extent, and quality of the services provided by the Adviser; (ii) the investment performance of the WP Funds; (iii) the costs of the services provided and profits to be realized by the Adviser from its relationship with the WP Funds; (iv) the extent to which economies of scale would be realized if the WP Funds grow and whether advisory fee levels reflect those economies of scale for the benefit of the WP Funds’ investors; and (v) the Adviser’s practices regarding possible conflicts of interest and other benefits derived by the Adviser.
In assessing these factors and reaching its decisions, the Board took into consideration information furnished for the Board’s review and consideration throughout the year at regular Board meetings, as well as information specifically prepared and/or presented in connection with the annual renewal process, including information presented to the Board in the Adviser’s presentation earlier in the Meeting. The Board requested and was provided with information and reports relevant to the annual renewal of the Advisory Agreement, including: (i) reports regarding the services and support provided to each WP Fund and its shareholders by the Adviser; (ii) quarterly assessments of the investment performance of each WP Fund from the Adviser; (iii) periodic commentary on the reasons for the performance; (iv) presentations by the WP Funds’ management addressing the Adviser’s investment philosophy, investment strategy, personnel, and operations; (v) compliance and audit reports concerning each WP Fund and the Adviser; (vi) disclosure information contained in the registration statement of the Trust and the Form ADV of the Adviser; and (vii) a memorandum from Counsel, that summarized the fiduciary duties and responsibilities of the Board in reviewing and approving the renewal of the Advisory Agreement, including the material factors set forth above and the types of information included in each factor that should be considered by the Board in order to make an informed decision.
The Board also requested and received various informational materials including, without limitation: (i) documents containing information about the Adviser, including financial information, a description of personnel and the services provided to the WP Funds, information on investment advice, performance, summaries of each WP Fund’s expenses, compliance program, current legal matters and other general information; (ii) comparative expense and performance information for other mutual funds with strategies similar to the WP Funds; (iii) the anticipated effect of size on each WP Fund’s performance and expenses; and (iv) benefits to be realized by the Adviser from its relationship with the WP Funds. The Board did not identify any information that was most relevant to its consideration to approve the Advisory Agreement, and each Trustee may have afforded different weight to the various factors.
(1) The nature, extent, and quality of the services provided by the Adviser.
In this regard, the Board considered the responsibilities that the Adviser has under the Advisory Agreement with respect to WP Funds. The Board reviewed the services provided by the Adviser to the WP Funds including, without limitation: the Adviser’s processes for formulating investment recommendations and assuring compliance with each WP Fund’s investment objectives and limitations; its coordination of services for each WP Fund among the WP Funds’ service providers, and the anticipated efforts to promote the WP Funds, grow assets, and assist in the distribution of WP Funds’ shares. The Board considered the Adviser’s staffing, personnel, and operations, the education and experience of the Adviser’s personnel, and the Adviser’s compliance program, policies, and procedures. After reviewing the foregoing and further information from the Adviser, the Board concluded that the quality, extent, and nature of the services provided by the Adviser was satisfactory and adequate for the WP Funds.
| WP Trust | ANNUAL REPORT |
| | |
| Approval of the Advisory Agreement Renewal for the WP Smaller Companies Income Plus Fund, the WP International Companies Income Plus Fund and the WP Income Plus Fund (Unaudited) (continued) |
(2) Investment Performance of the WP Funds and the Adviser.
In considering the investment performance of each WP Fund and the Adviser, the Trustees compared the short- and long-term performance of each WP Fund with the performance of comparable funds with similar objectives and size managed by other investment advisers (i.e., a selected peer group of funds and the respective Morningstar category averages). The Trustees also considered the consistency of the Adviser’s management of each WP Fund with its investment objective and policies. For the Smaller Companies Fund, the Board noted that the Smaller Companies Fund had outperformed the average and median fund in the Morningstar Small Blend Category for the one-year period ended June 30, 2018. For the International Companies Fund, the Board noted that the International Companies Fund had underperformed the average and median fund in the Morningstar Foreign Large Blend category for the one-year period ended June 30, 2018. For the Income Fund, the Board noted that the Income Fund had underperformed the average and median fund in the Morningstar High Yield Bond Category for the one-year period ended June 30, 2018. The Trustees noted that the Adviser does not manage any separate accounts that are substantially similar to the strategies employed for the WP Funds. The Trustees considered the impact the Adviser’s use of options has on Fund performance during the current market conditions, noting that any downside protection in place for the WP Funds will likely result in a drag on performance. They discussed the large percentage of shareholders in the WP Funds that are clients of the Adviser, noting that these investors are seeking the downside protection the WP Funds are designed to provide. Based on the foregoing, the Board concluded that the investment performance for each of the WP Funds was satisfactory.
(3) The costs of the services to be provided and profits to be realized by the Adviser from the relationship with the WP Funds.
In this regard, the Trustees considered: the Adviser’s staffing, personnel and methods of operating; the financial condition of the Adviser and its affiliates and the level of commitment to the Adviser’s operations by the Adviser and its principals; the expected asset level of the WP Funds; and the projected overall expenses of the WP Funds. The Trustees considered financial circumstances of the Adviser and discussed the financial stability and productivity of the firm. The Trustees considered the fees and expenses of each WP Fund (including the management fee) relative to its Morningstar category average.
The Trustees noted that the management fee and net expense ratio for the Smaller Companies Fund were above the average and median fund in the Morningstar Small Blend category and both tended towards the higher end of the category. The Trustees noted that the management fee for the International Companies Fund was the highest management fee for Morningstar Foreign Large Blend category and the net expense ratio was towards the higher end of the category. The Trustees noted that the management fee and net expense ratio for the Income Fund were above the average and median fund in the Morningstar High Yield Bond category and both tended towards the higher end of the category. Despite the higher management fee and expense ratio for the WP Funds, the Trustees noted that the WP Funds fee structures were within a reasonable range relative to the other funds in their respective categories. In considering the management fee for each of the WP Funds and the appropriateness thereof, the Board took into consideration the Adviser’s representations about the complexity of the investment strategies utilized for each WP Fund, including the use of options to generate additional return, while at the same time providing a degree of protection in the event of a major market decline. In this regard, the Board concluded that this “alternatives” strategy, as described by the Adviser at the Meeting, warranted the higher management fees. The Trustees considered the Adviser’s policy to not charge a management fee at the client account level for any assets invested in the WP Funds.
The Board also considered that the each of the WP Funds may invest in other investment companies. In this regard, the Board considered the nature of the services rendered and determined, based on the information provided by the Adviser in its response, as well as discussions with the Adviser, that the fees paid by each WP Fund to the underlying investment company were not based on services provided that are duplicative of the services provided by the investment advisers to the underlying investment companies. Upon further consideration and discussion of the foregoing, the Board concluded that the fees to be paid to the Adviser by each WP Fund were fair and reasonable.
| WP Trust | ANNUAL REPORT |
| | |
| Approval of the Advisory Agreement Renewal for the WP Smaller Companies Income Plus Fund, the WP International Companies Income Plus Fund and the WP Income Plus Fund (Unaudited) (continued) |
(4) The extent to which economies of scale would be realized as each WP Fund grows and whether advisory fee levels reflect these economies of scale for the benefit of the WP Funds’ investors.
In this regard, the Board considered each WP Fund’s fee arrangements with the Adviser. The Trustees determined that although the management fees would stay the same as asset levels increased, the shareholders of the WP Funds would benefit from the expense limitation agreement in place for each WP Fund. The Trustees considered that each WP Fund would benefit from economies of scale under its agreements with some of its service providers other than the Adviser, noting that the fee structures with those other service providers were either fixed or essentially semi-fixed. The Trustees discussed other accounts managed by the Adviser, noting that the Adviser does not manage any separately managed accounts with similar substantially strategies as the WP Funds. Following further discussion of the WP Funds’ expected asset levels, expectations for growth and levels of fees, the Board determined that each WP Fund’s fee arrangement, in light of all the facts and circumstances, was fair and reasonable.
(5) Possible conflicts of interest and benefits derived by the Adviser.
In considering the Adviser’s practices regarding conflicts of interest, the Trustees evaluated the potential for conflicts of interest and considered such matters as: the experience and ability of the advisory and compliance personnel assigned to the WP Funds; the fact that the Adviser does not utilize soft dollars; the basis of decisions to buy or sell securities for the WP Funds; and the substance and administration of the Adviser’s code of ethics. Based on the foregoing, the Board determined that the Adviser’s standards and practices relating to the identification and mitigation of possible conflicts of interest were satisfactory. The Trustees noted that there were no benefits identified by the Adviser to the Board, other than the receipt of advisory fees under the Advisory Agreement, in managing the assets of the WP Funds.
After additional consideration of the factors delineated in the memorandum provided by Counsel and further discussion among the Board, the Board determined that the compensation payable under the Advisory Agreement with respect to the WP Funds was fair, reasonable and within a range of what could have been negotiated at arms-length in light of all the surrounding circumstances, and they resolved to approve the Advisory Agreement with respect to the WP Funds.
WP TRUST
4300 Shawnee Mission Pkwy
Suite 100
Fairway, KS 66205
INVESTMENT ADVISER
Winning Points Advisers, LLC
129 NW 13th Street
Suite D-26
Boca Raton, FL 33431
ADMINISTRATOR & TRANSFER AGENT
M3Sixty Administration, LLC
4300 Shawnee Mission Pkwy
Suite 100
Fairway, KS 66205
DISTRIBUTOR
Matrix 360 Distributors, LLC
4300 Shawnee Mission Pkwy
Suite 100
Fairway, KS 66205
INDEPENDENT REGISTERED PUBLIC ACCOUNTING FIRM
Cohen & Company, Ltd.
1350 Euclid Avenue
Suite 800
Cleveland, OH 44115
LEGAL COUNSEL
Practus, LLP
11300 Tomahawk Creek Parkway
Suite 310
Leawood, KS 66211
CUSTODIAN BANK
Fifth Third Bank
Fifth Third Center
38 Fountain Square Plaza
Cincinnati, OH 45263
| (a) | The registrant has, as of the end of the year/period covered by this report, adopted a code of ethics that applies to the registrant's principal executive officer, principal financial officer, and principal accounting officer or controller, or persons performing similar functions, regardless of whether these individuals are employed by the registrant or a third party. |
| (b) | During the period covered by this report, there were no amendments to any provision of the code of ethics. |
| (c) | During the period covered by this report, there were no waivers or implicit waivers of a provision of the code of ethics. |
| (d) | The registrant’s Code of Ethics is filed herewith. |
| ITEM 3. | AUDIT COMMITTEE FINANCIAL EXPERT. |
| | The Registrant's Board of Trustees has determined that Ronald F. Rohe serves on its audit committee as the "audit committee financial expert" as defined in Item 3. |
| ITEM 4. | PRINCIPAL ACCOUNTANT FEES AND SERVICES. |
| (a) | Audit Fees. The aggregate fees billed for professional services rendered by the principal accountant for the audit of the registrant’s annual financial statements or for services that are normally provided by the accountant in connection with statutory and regulatory filings or engagements were as follows: |
| Fund | Fiscal Year/Period Ended
November 30, 2018 | Fiscal Year Ended
November 30, 2017 | Fiscal Year Ended
August 31, 2018 | Fiscal Year Ended
August 31, 2017 |
| WPSMX | $ 12,500 | $ 12,500 | $ — | $ — |
| WPITX | 12,500 | 12,500 | — | — |
| WPINX | 12,500 | 12,500 | — | — |
| WPLCX* | 5,200 | — | 13,000 | 13,000 |
* The WP Large Cap Income Plus Fund changed its fiscal year end from August 31st to November 30th after its August 31, 2018 fiscal year end.
(b) | Audit-Related Fees. There were no fees billed during the fiscal year/period for assurances and related services by the principal accountant that are reasonably related to the performance of the audit of the registrant’s financial statements and are not reported under paragraph (a) of this item. |
| (c) | Tax Fees. The aggregate fees billed for professional services rendered by the principal accountant for tax compliance, tax advice and tax planning were as follows: |
| Fund | Fiscal Year/Period Ended
November 30, 2018 | Fiscal Year Ended
November 30, 2017 | Fiscal Year Ended
August 31, 2018 | Fiscal Year Ended
August 31, 2017 |
| WPSMX | $ 2,500 | $ 2,500 | $ — | $ — |
| WPITX | 2,500 | 2,500 | — | — |
| WPINX | 2,500 | 2,500 | — | — |
| WPLCX* | 2,500 | — | 2,500 | 2,500 |
* The WP Large Cap Income Plus Fund changed its fiscal year end from August 31st to November 30th after its August 31, 2018 fiscal year end.
The services comprising these fees are the preparation of the registrant’s federal income and excise tax returns.
| (d) | All Other Fees. The aggregate fees billed for products and services provided by the registrant’s principal accountant, other than the services reported in paragraphs (a) through (c) of this item were as follows: |
| Fund | Fiscal Year/Period Ended
November 30, 2018 | Fiscal Year Ended
November 30, 2017 | Fiscal Year Ended
August 31, 2018 | Fiscal Year Ended
August 31, 2017 |
| WPSMX | $ 500 | $ 500 | $ — | $ — |
| WPITX | 500 | 500 | — | — |
| WPINX | 500 | 500 | — | — |
| WPLCX* | — | — | 940 | 850 |
* The WP Large Cap Income Plus Fund changed its fiscal year end from August 31st to November 30th after its August 31, 2018 fiscal year end.
The fees were for the review of the Funds’ semi-annual reports.
| (e)(1) | The audit committee does not have pre-approval policies and procedures. Instead, the audit committee or audit committee chairman approves on a case-by-case basis each audit or non-audit service before the principal accountant is engaged by the registrant. |
| (e)(2) | There were no services described in each of paragraphs (b) through (d) of this Item that were approved by the audit committee pursuant to paragraph (c)(7)(i)(C) of Rule 2-01 of Regulation S-X. |
| (f) | Not applicable. The percentage of hours expended on the principal accountant's engagement to audit the registrant's financial statements for the most recent fiscal year that were attributed to work performed by persons other than the principal accountant's full-time, permanent employees was zero percent (0%). |
| (g) | All non-audit fees billed by the registrant's principal accountant for services rendered to the registrant for the fiscal years/period are disclosed in (b)-(d) above. There were no audit or non-audit services performed by the registrant's principal accountant for the registrant's adviser. |
| (h) | There were no non-audit services rendered to the registrant’s investment adviser. |
| ITEM 5. | AUDIT COMMITTEE OF LISTED REGISTRANTS. |
Not applicable
| ITEM 6. | SCHEDULES OF INVESTMENTS |
Included in annual report to shareholders filed under item 1 of this form.
| ITEM 7. | DISCLOSURE OF PROXY VOTING POLICIES AND PROCEDURES FOR CLOSED-END MANAGEMENT INVESTMENT COMPANIES. |
Not applicable, Funds are open-end management investment companies.
| ITEM 8. | PORTFOLIO MANAGERS OF CLOSED-END MANAGEMENT INVESTMENT COMPANIES |
Not applicable, Funds are open-end management investment companies.
| ITEM 9. | PURCHASES OF EQUITY SECURITIES BY CLOSED-END MANAGEMENT INVESTMENT COMPANY AND AFFILIATED PURCHASERS. |
Not applicable, Funds are open-end management investment companies.
| ITEM 10. | SUBMISSION OF MATTERS TO A VOTE OF SECURITY HOLDERS. |
Not applicable at this time.
| ITEM 11. | CONTROLS AND PROCEDURES. |
| (a) | The registrant's principal executive and principal financial officers, or persons performing similar functions, have concluded that the registrant's disclosure controls and procedures (as defined in Rule 30a-3(c) under the 1940 Act, are effective, as of a date within 90 days of the filing date of this report, based on the evaluation of these controls and procedures required by Rule 30a-3(b) under the 1940 Act and Rule 15d-15(b) under the Securities Exchange Act of 1934, as amended. |
| (b) | There were no changes in the registrant's internal control over financial reporting (as defined in Rule 30a-3(d) under the 1940 Act) that occurred during the period covered by this report that have materially affected, or are reasonably likely to materially affect, the registrant's internal control over financial reporting. |
| ITEM 12. | DISCLOSURE OF SECURITIES LENDING ACTIVITIES FOR CLOSED-END MANAGEMENT INVESTMENT COMPANIES. |
Not applicable, Funds are open-end management investment companies.
(1)
Code of Ethics for Principal Executive and Senior Financial Officers is attached hereto.
(2)
Certifications pursuant to Section 302 of the Sarbanes-Oxley Act of 2002 are filed herewith.
(3)
Certifications pursuant to Section 906 of the Sarbanes-Oxley Act of 2002 are filed herewith.
SIGNATURES
Pursuant to the requirements of the Securities Exchange Act of 1934 and the Investment Company Act of 1940, the registrant has duly caused this report to be signed on its behalf by the undersigned, thereunto duly authorized.
| WP Trust | | |
| | | |
| By: | Charles S. Stoll | /s/ Charles S. Stoll | |
| Principal Executive Officer | |
| Date: February 8, 2019 | | |
Pursuant to the requirements of the Securities Exchange Act of 1934 and the Investment Company Act of 1940, this report has been signed below by the following person on behalf of the registrant and in the capacities and on the date indicated.
| By | Charles S. Stoll | /s/ Charles S. Stoll | |
| Principal Executive Officer | |
| Date: February 8, 2019 | | |
Pursuant to the requirements of the Securities Exchange Act of 1934 and the Investment Company Act of 1940, this report has been signed below by the following person on behalf of the registrant and in the capacities and on the date indicated.
| By | Larry E. Beaver, Jr. | /s/ Larry E. Beaver, Jr. | |
| Assistant Treasurer and Acting Principal Financial Officer | |
| Date: February 8, 2019 | | |